UNITED STATES
SECURITIES AND EXCHANGE COMMISSION
Washington, D.C. 20549 |
CERTIFIED SHAREHOLDER REPORT OF REGISTERED MANAGEMENT INVESTMENT COMPANIESInvestment Company Act file number: 811-5075
Thrivent Mutual Funds
(Exact name of registrant as specified in charter)
625 Fourth Avenue South
Minneapolis, Minnesota 55415
(Address of principal executive offices) (Zip code)
John C. Bjork, Assistant Secretary
625 Fourth Avenue South
Minneapolis, Minnesota 55415
(Name and address of agent for service) |
Registrant's telephone number, including area code: (612) 340-7005
Date of fiscal year end: October 31
Date of reporting period: October 31, 2005
| Item 1. Report to Stockholders |
Table of Contents
| President’s Letter | 2 | Thrivent Large Cap Stock Fund | 117 |
| |
| | | Thrivent Large Cap Index Fund | 121 |
| Economic and Market Review | 4 | | |
| | | Thrivent Large Cap Index Fund-I | 128 |
| |
| Portfolio Perspectives | | Thrivent Balanced Fund | 135 |
| |
| Thrivent Technology Fund | 6 | Thrivent High Yield Fund | 144 |
| |
| Thrivent Partner Small Cap Value Fund | 8 | Thrivent High Yield Fund II | 152 |
| |
| Thrivent Small Cap Stock Fund | 10 | Thrivent Municipal Bond Fund | 160 |
| |
| Thrivent Small Cap Index Fund | 12 | Thrivent Income Fund | 188 |
| |
| Thrivent Mid Cap Growth Fund | 14 | Thrivent Core Bond Fund | 195 |
| |
| Thrivent Mid Cap Stock Fund | 16 | Thrivent Limited Maturity Bond Fund | 200 |
| |
| Thrivent Mid Cap Index Fund | 18 | Thrivent Money Market Fund | 206 |
| |
| Thrivent Mid Cap Index Fund-I | 20 | | |
| | | Statement of Assets and Liabilities | 210 |
| Thrivent Partner International Stock Fund | 22 | | |
| |
| Thrivent Large Cap Growth Fund | 24 | Statement of Operations | 216 |
| |
| Thrivent Large Cap Value Fund | 26 | | |
| | | Statement of Changes in Net Assets | 222 |
| Thrivent Large Cap Stock Fund | 28 | | |
| |
| Thrivent Large Cap Index Fund | 30 | Notes to Financial Statements | 230 |
| |
| Thrivent Large Cap Index Fund-I | 32 | | |
| | | Financial Highlights | |
| Thrivent Balanced Fund | 34 | | |
| | | Thrivent Aggressive Allocation Fund | 258 |
| Thrivent High Yield Fund | 36 | | |
| | | Thrivent Moderately Aggressive Allocation Fund . | 258 |
| Thrivent High Yield Fund II | 38 | | |
| | | Thrivent Moderate Allocation Fund | 258 |
| Thrivent Municipal Bond Fund | 40 | | |
| | | Thrivent Moderately Conservative Allocation Fund | 258 |
| Thrivent Income Fund | 42 | | |
| | | Thrivent Technology Fund | 260 |
| Thrivent Core Bond Fund | 44 | | |
| | | Thrivent Partner Small Cap Growth Fund | 260 |
| Thrivent Limited Maturity Bond Fund | 46 | | |
| | | Thrivent Partner Small Cap Value Fund | 262 |
| Thrivent Money Market Fund | 48 | | |
| | | Thrivent Small Cap Stock Fund | 262 |
| |
| New Funds | 50 | Thrivent Small Cap Index Fund | 264 |
| |
| | | Thrivent Mid Cap Growth Fund | 264 |
| Shareholder Expense Example | 51 | | |
| | | Thrivent Partner Mid Cap Value Fund | 264 |
| |
| Report of Independent Registered | | Thrivent Mid Cap Stock Fund | 266 |
| |
| Public Accounting Firm | 56 | Thrivent Mid Cap Index Fund | 266 |
| |
| | | Thrivent Mid Cap Index Fund-I | 266 |
| Schedules of Investments | | | |
| | | Thrivent Partner International Stock Fund | 268 |
| Thrivent Aggressive Allocation Fund | 57 | | |
| | | Thrivent Large Cap Growth Fund | 268 |
| Thrivent Moderately Aggressive Allocation Fund | 58 | | |
| | | Thrivent Large Cap Value Fund | 270 |
| Thrivent Moderate Allocation Fund | 59 | | |
| | | Thrivent Large Cap Stock Fund | 270 |
| Thrivent Moderately Conservative Allocation Fund | 60 | | |
| | | Thrivent Large Cap Index Fund | 272 |
| Thrivent Technology Fund | 61 | | |
| | | Thrivent Large Cap Index Fund-I | 272 |
| Thrivent Partner Small Cap Growth Fund | 64 | | |
| | | Thrivent Balanced Fund | 272 |
| Thrivent Partner Small Cap Value Fund | 67 | | |
| | | Thrivent High Yield Fund | 274 |
| Thrivent Small Cap Stock Fund | 70 | | |
| | | Thrivent High Yield Fund II | 274 |
| Thrivent Small Cap Index Fund | 74 | | |
| | | Thrivent Municipal Bond Fund | 276 |
| Thrivent Mid Cap Growth Fund | 82 | | |
| | | Thrivent Income Fund | 276 |
| Thrivent Partner Mid Cap Value Fund | 88 | | |
| | | Thrivent Core Bond Fund | 278 |
| Thrivent Mid Cap Stock Fund | 90 | | |
| | | Thrivent Limited Maturity Bond Fund | 278 |
| Thrivent Mid Cap Index Fund | 94 | | |
| | | Thrivent Money Market Fund | 280 |
| Thrivent Mid Cap Index Fund-I | 100 | | |
| |
| Thrivent Partner International Stock Fund | 106 | Additional Information | 282 |
| |
| Thrivent Large Cap Growth Fund | 110 | | |
| | | Supplements to the Prospectus | 288 |
| Thrivent Large Cap Value Fund | 114 | | |

Dear Member:
We are pleased to provide you with the Thrivent Mutual Funds annual report for the twelve-month period ended October 31, 2005. In this report, you will find detailed information about the Thrivent Mutual Funds, including summaries prepared by each portfolio manager on his or her performance and management strategies for the applicable fund and period. In addition, Russell Swansen, Thrivent Investment Management’s chief investment officer, summarizes the overall market and economic environment over the twelve-month period.
In previous letters I have often highlighted integrity and commitment to you, our member, as a common thread running through our organization -- from our customer service areas to our portfolio managers. On the investment management side, we seek to align our investment discipline with our shareholders’ best interests by striving for consistent, long-term performance and taking risk management seriously in our pursuit of potential market rewards. One of our less understood, but still critical, core investment management beliefs centers on the concept of investment style consistency.
What is Investment Style Consistency?
Simply put, being style consistent means sticking to a Fund’s investment objective and investment style regardless of market conditions. For example, high-yield bond funds invest predominately in high-yield bonds and small-cap stock funds always hold a large percentage of small-cap stocks. Seem obvious? Yes, but the temptation to stray is ever present and can prove damaging to an investor’s portfolio. Consider the following example.
Avoiding the Danger of Style Drift
Stocks are commonly divided into two investment style categories -- growth and value. Growth stocks typically offer higher potential to rise (and fall) in share price and are focused on more aggressive areas of the market such as software firms, biotechnology companies and other fast-growing industries. Value-oriented companies, on the other hand, are usually slower growing and focus on banks, energy companies and industrial companies. Often, the two investment styles take turns leading the market and have historically offered greater diversification potential when held together. A “blended” style holds both types of stocks.
In the mid 1990s, large-cap growth stocks -- bolstered by the now infamous technology and internet stock run up --began an astounding period of outperformance over which they greatly outpaced other asset classes until 2000 when the NASDAQ “bubble” finally burst. Over the course, investors and investment professionals were all too often guilty of abandoning long-term investment plans in favor of chasing hot performing technology stocks that primarily drove strong large-cap growth fund returns. Many investors came to regret this short-term mindset when growth stocks came crashing back to earth in 2000 and struggled over the next several years, while at the same time cast-off value and bond funds performed well.
Unfortunately, chasing past performance is not limited to the inexperienced investor -- many sophisticated asset management firms and portfolio managers succumb to the same temptation. Large cap value stock funds performed well in the late-1990s but lagged their more growth-oriented colleagues by a wide margin. Many firms allowed their value managers to drift into traditional growth stock markets in order to “chase” the hot technology sector. The end result? While these firms may have succeeded in attracting short-term assets, their clients were often far less successful in achieving their long-term investment goals.
Our Commitment
At Thrivent Investment Management, we understand the importance of each of our portfolio management teams sticking to their fund’s specific investment objective. We have built a process to monitor style consistency on all of our funds that utilizes leading-edge software and a team of professionals specifically skilled in portfolio analytics. Additionally, our portfolio managers are compensated relative to their particular asset class and only to their particular asset class. In other words, the goal for our large-cap value manager is to outperform other large-cap value stock funds -- not to outperform large-cap growth or mid-cap stock funds that are entirely different asset classes. They are judged solely on how they perform in their specific investment category -- even when other related asset classes may be faring better. Finally, we adhere to a fund naming process that underlies our belief in “truth-in-advertising.” Each Thrivent Mutual Fund is named after the asset class it invests in for the utmost in transparency and clarity.
2
Style Consistent Funds Support Sound Asset Allocation
Why is style consistency so important? The best-laid asset allocation plans could become disrupted if the underlying funds are not true to their investment style and objective. If your large-cap stock fund periodically invests heavily in small company stocks, how can you be sure that your overall portfolio has adequate exposure to large company stocks at any point in time? The key is to construct your portfolio with mutual funds that stick to their style and objective, regardless of near-term market moves. Only this commitment to investment management discipline fully supports your personal asset allocation plan and a well-balanced portfolio. If you like the idea of style consistent mutual funds and personalized asset allocation but find investing time-consuming and complex, consider our new suite of four asset allocation mutual funds designed to provide a simple one-step investment solution. We’re excited about offering what we call A Simple Choice for Smart Investing!™ Talk with your Thrivent Investment Management registered representative for more information.
Financial Markets Everchanging
Our financial markets appear to be approaching a pivot point where proper portfolio allocation and balance is crucial. International stocks have done very well and large-company stocks are posting better performance after years of trailing their smaller-company counterparts. Bonds continue to fight upstream against rising interest rates. How comfortable are you with your current portfolio make up? Your Thrivent Investment Management registered representative has the tools and knowledge to provide a current portfolio assessment and make recommendations that could better position you for success in 2006.
As always, thank you for continuing to turn to us for your financial solutions. We very much value your business and look forward to serving you better than ever in 2006.

Pamela J. Moret
President and Trustee
Thrivent Mutual Funds
|
Investing in a mutual fund involves risks, including the possible loss of principal. The prospectus contains more complete information on the investment objectives, risks, charges and expenses of the investment company which investors should read and consider carefully before investing. To obtain a prospectus contact a registered representative or visit www.thrivent.com.
3

| Russell W. Swansen | October 31, 2005 |
| Senior Vice President, and | |
| Chief Investment Officer | |
Economic and Market Review
Stocks and bonds generally provided positive returns during the one-year period ended Oct. 31, 2005, despite skyrocketing energy prices, devastating hurricanes, and rising interest rates. U.S. and foreign stocks benefited from strong economic growth and rising corporate profits. Despite repeated interest rate hikes by the Federal Reserve, bonds generally managed modest positive returns.
U.S. Economy
Gross domestic product growth accelerated from a 3.3% annual pace in the fourth quarter of 2004 to 3.8% in the first quarter of this year, then slowed to 3.3% in the second quarter. Economic growth advanced again to 3.8% (according to early estimates) in the third quarter, surprising many economists who expected a slowdown due to the Gulf Coast storms.
The cost of energy remained a major concern throughout the period, with worries that climbing prices of gasoline, diesel fuel and natural gas would erode the spending power of consumers and businesses. While energy prices did not appear to slow economic growth, they did affect which sectors of the stock market prospered and which sectors lagged.
The labor market improved as the unemployment rate declined to 5% over the period, and the housing market continued to enjoy robust sales activity and rising prices.
Reflecting rising interest rates, the dollar gained against foreign currencies during the period, after falling to a five-year low against both the euro and the Japanese yen in the fourth quarter last year. But while the greenback’s reversal boosted Americans’ spending power abroad, it moderated U.S. investors’ dollar returns from foreign securities and made U.S. goods less competitive overseas.
Inflation & Monetary Policy
Inflation accelerated during the period, due mainly to rising energy prices. The Consumer Price Index rose at a 4.3% rate for the 12 months ended Oct. 31, 2005, compared with an increase of 3.3% for all of 2004. “Core” inflation -- which excludes prices of food and energy -- rose at a more modest 2.1% for the period.
While core inflation remained relatively tame during the period, the Federal Reserve continued its program of increasing short-term interest rates, indicating that prior levels of interest rates were too low given the robust growth in the economy. The policymakers’ expressed objective is to establish a level of interest rates such that they exert neither stimulus nor restrictions on the economy, believing the current economic recovery is self-sustaining. On Nov. 1, the Federal Reserve raised its target for the federal funds rate by a quarter point to 4.00% . It was the Federal Reserve’s 11th consecutive increase since June 2004. While some market watchers had expected a break from the increases, Federal Reserve pol-icymakers noted that any economic slowdown due to the hurricanes would likely be temporary, and that inflationary pressures required further action.
Equity Performance
Stocks experienced up and down moves en route to this period’s gains. The market started the period with a post-presidential election rally that lasted through December. A resurgence in oil prices early in the new year turned stock prices downward until the end of April.
Strong corporate profits and confidence that the Fed would succeed against inflation inspired a summer-long rally that, surprisingly, continued even after Hurricane Katrina. But as fall began, investors refocused on worries about higher infla-tion and interest rates (spurred by energy prices and expected Gulf reconstruction spending) and a slowdown in corporate profits, pushing the market lower.
Small-cap stocks outperformed large-cap issues during the period. The Russell 2000 Index of small-cap stocks posted a 12.08% total return, while the S&P 500 Index of large-cap stocks recorded an 8.72% return. Sectors that performed best during the period included energy, utilities, and technology, while auto/transportation, materials/processing, and consumer discretionary did worst. It should not be surprising that energy has been the strongest sector in the S&P 500 since the start of 2004.
4
Foreign stocks generally outperformed domestic issues, measured in both local currency and dollar returns. The Morgan Stanley Capital International Europe, Australasia, Far East (EAFE) Index posted an 18.59% total return in U.S. dollars during the period.
Fixed Income Performance
With the headwind of ongoing hikes in short-term benchmark rates by the Federal Reserve, most bond sectors offered modest total returns during the period. Yields on short-term securities rose more than yields on intermediate- and longer-term bonds, continuing the flattening of the yield curve that began in early 2004.
The Lehman Brothers Aggregate Bond Index of the broad U.S. bond market posted a 1.13% total return for the 12 months ended Oct. 31, 2005. During the period, the credit ratings of General Motors and Ford, which are two of the largest corporate bond issuers, were downgraded to below investment grade. Municipal bonds fared better than other types of securities in this environment, with the Lehman Brothers Municipal Bond Index posting a total return of 2.54% .
Although high yield bonds were hurt by a flight to quality earlier in the period, the sector outperformed many other bonds sectors for the entire 12 months. The Lehman U.S. High Yield Bond Index registered a 4.09% total return.
Outlook
We believe the U.S. economy will grow at a somewhat slower pace of 3.3% over the next year. Several potential factors threaten the growth outlook, however, including further spikes in energy prices, more rate hikes by the Federal Reserve, and a dramatic slowdown in the housing market.
We think oil prices have likely peaked in the near term and will stabilize or even decline somewhat during the next year. Inflation overall will likely moderate, with prices rising between 3% and 4%. Nevertheless, this will encourage the Federal Reserve to continue its measured interest rate hikes, which we expect will result in a fed funds rate of 4.50% next year.
Our outlook for U.S. stocks is moderately positive. We are mindful, however, that equity valuations remain higher than historical averages, and expect that price volatility will continue as investors sort through positive and negative economic news.
Bond returns will continue to feel the drag of rising interest rates until the Federal Reserve has completed its tightening campaign. Investors will remain sensitive to signs of rising inflation or a slowing economy. With the yield curve relatively flat (short- and long-term yields nearly the same), short and intermediate maturities provide the best risk and return tradeoff for the period ahead.
As always, your best strategy is to work with your Thrivent Investment Management registered representative to create an investment plan based on your goals, diversify your portfolio, and remain focused on the long term.
5

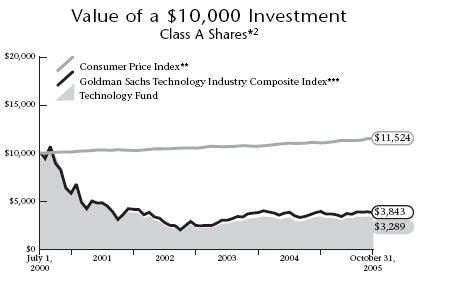
How did the Fund perform during the one-year period ended Oct. 31, 2005?
Thrivent Technology Fund earned a 6.10% total return, while its peer group of Lipper Science & Technology Funds produced a 7.96% median return. The Fund’s market benchmark, the Goldman Sachs Technology Industry Composite Index, returned 6.19% during the period.
What market conditions were present during the period?
Stocks advanced over the 12 months ended Oct. 31, 2005, although returns across different market segments were uneven. The technology segment did not participate as fully as other segments in the market advanced, with the sector showing particular weakness early in the reporting period. However, the technology segment did rally smartly and suf-ficiently in the second half of the period to achieve a reasonable level of return over the fiscal year. Energy stocks provided the richest returns in the U.S. equity markets with particular strength noted in companies focused on domestic production as well as exploration and development.
A number of cross-currents, including rising energy prices, steady increases in short-term interest rates and renewed fears of heightened inflation diminished the constructive
impact of continued good economic growth and positive earnings advances over the period. Additionally, the end of the period was characterized by unusual increases in energy prices and distorted economic activity related to the effects of the hurricanes that lashed the gulf coast area in September. These events contributed to investors’ increasing aversion to the more volatile segments of the markets.
What factors affected the Fund’s performance?
The Fund maintained a bias over the period to larger-capitalization companies with strong business models. This had a negative impact on our performance versus the peer group over the period as small- and mid-capitalization companies provided higher levels of returns than did these types of companies.
The Fund earned strong returns throughout the period from its technology hardware equipment holdings in Apple Computer, but this advantage was more than offset by below-average returns to our position in other large companies like
Dell Computer and Microsoft.
An underweighted stance in Google was a meaningful factor in the Fund’s underperformance versus its Lipper peer group. In addition, the Fund’s below average performance in the
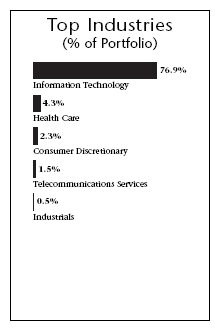

| Top 10 Holdings | |
| (% of Portfolio) | |
| |
| Apple Computer, Inc. | 3.6% |
| Microsoft Corporation | 3.1% |
| Intel Corporation | 3.1% |
| Cisco Systems, Inc. | 2.7% |
| International Business Machines Corporation | 2.6% |
| EMC Corporation | 2.4% |
| Google, Inc. | 2.4% |
| Dell, Inc. | 2.3% |
| Yahoo!, Inc. | 2.2% |
| QUALCOMM, Inc. | 2.0% |
| |
| |
| |
| |
| These common stocks represent 26.4% of the total | |
| investment portfolio. | |
Quoted Fund performance is for Class A shares and does not reflect a sales charge.
The returns shown do not reflect taxes a shareholder would pay on distributions or redemptions.
Quoted Top Industries and Top 10 Holdings are subject to change.
The list of Top 10 Holdings excludes short term investments and collateral held for securities loaned.
6
consumer, health care, and telecomm services segments --other areas of the market that provide opportunity for participation in new technologies -- also proved detrimental, relative to our peers.
What is your outlook?
In 2006, economic conditions at the macro level are expected to moderate from those seen in 2005. Business investment at this point is still robust, employment growth is moderating but positive, and policy makers are achieving some success in their endeavor to mitigate inflation risks in the economy. Productivity growth is critical to maintaining the competitiveness of the U.S. economy, and worker and technology investment is the catalyst of productivity growth.
We expect business investment will be a more significant component of technology spending growth than the consumer in the coming year and have positioned the Fund to benefit from that trend. The technology market continues to evolve, and we continue to cast a broad net to identify not only successful investments within the traditional technology segment but also new and emerging technologies in other fields such as medicine and energy.
| | Portfolio Facts | |
| | As of October 31, 2005 | |
| | A Share | | B Share | Institutional Share |
| | ------------------ | ------------------ | ------------------ |
| Ticker | AATSX | | BBTSX | THTIX |
| Transfer Agent ID | 028 | | 078 | 098 |
| Net Assets | $42,680,429 | | $3,510,591 | $2,574,319 |
| NAV | $3.48 | | $3.34 | $3.65 |
| NAV -- High† | 12/6/2004 -- $3.61 | | 12/6/2004 -- $3.48 | 9/13/2005 -- $3.76 |
| NAV -- Low† | 4/15/2005 -- $3.06 | | 4/15/2005 -- $2.94 | 4/15/2005 -- $3.19 |
| Number of Holdings: 145 | † For the year ended October 31, 2005 |
| Average Annual Total Returns2 |
| As of October 31, 2005 | |
| |
| | | | From |
| | | | Inception |
| Class A1 | 1-Year | 5 Years | 7/1/2000 |
|
| without sales charge | 6.10% | (17.12%) | (17.96%) |
| with sales charge | 0.29% | (18.06%) | (18.82%) |
| |
| | | | From |
| | | | Inception |
| Class B1 | 1-Year | 5 Years | 7/1/2000 |
|
| without sales charge | 5.70% | (17.78%) | (18.59%) |
| with sales charge | 1.70% | (17.78%) | (18.59%) |
| |
| | | | From |
| | | | Inception |
| Institutional Class1 | 1-Year | 5 Years | 7/1/2000 |
|
| total return | 6.73% | (16.42%) | (17.22%) |
1 Class A performance has been restated to reflect the maximum sales charge of 5.5% . Class B performance reflects the maximum contingent deferred sales charge (CDSC) of 5%, declining 1% each year during the first five years and then converting to Class A shares after the fifth year. Institutional Class shares have no sales load and are for institutional shareholders only.
2 Past performance is not an indication of future results. Annualized total returns represent past performance and reflect changes in share prices, the reinvestment of all dividends and capital gains, and the effects of compounding.
Investing in a mutual fund involves risks, including the possible loss of principal. The prospectus contains more complete information on the investment objectives, risks, charges and expenses of the investment company which investors should read and consider carefully before investing. To obtain a prospectus, contact a registered representative or visit www.thrivent.com. The Fund primarily invests in technology-related industries; as a consequence, the Fund may be subject to greater price volatility than a fund investing in a broad range of industries. At various times, the Fund’s adviser waived its management fee and/or reimbursed Fund expenses. Had the adviser not done so, the Fund’s total returns would have been lower. The returns shown do not reflect taxes a shareholder would pay on distributions or redemptions. Please read your prospectus carefully.
* As you compare performance, please note that the Fund’s performance reflects the maximum 5.5% sales charge, while the Consumer Price Index and Goldman Sachs Technology Industry Composite Index do not reflect any such charges. If you were to purchase any of the above individual stocks or funds represented in these Indexes, any charges you would pay would reduce your total return as well.
** The Consumer Price Index is an inflationary indicator that measures the change in the cost of a fixed basket of products and services, including housing, electricity, food and transportation. It is not possible to invest directly in the Index.
*** The Goldman Sachs Technology Industry Composite Index is a modified capitalization-weighted index of selected technology stocks. It is not possible to invest directly in the Index. The performance of the Index does not reflect deductions for fees, expenses or taxes.
7
Thrivent Partner Small Cap Value Fund

Subadvised by T. Rowe Price Associates, Inc.
The Thrivent Partner Small Cap Value Fund seeks long-term capital appreciation
by investing primarily in a diversified portfolio of small company common
stock and securities convertible into small company common stocks.
|
How did the Fund perform during the one-year period ended Oct. 31, 2005?
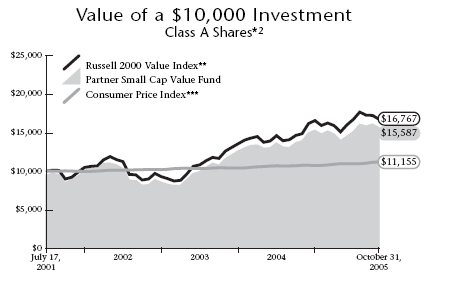
Thrivent Partner Small Cap Value Fund gained 12.13% for the year, underperforming the median return of 13.80% for its peer group, as represented by the Lipper Small Cap Value Funds Category. The Fund also fell short of its benchmark, the Russell 2000 Value Index, which advanced 13.04% over the 12-month period.
What market conditions were present during the period?
Overall, stocks achieved solid results for the 12 months. However, market returns were punctuated with abrupt periods of sharp advances and corrections as investors grappled with a number of issues. These included an increasingly uncertain interest rate environment, ongoing geopolitical instability, the highest energy prices since the early 1980s and a period of unusual weather patterns that ravaged parts of the country. Despite all of these setbacks, U.S. economic growth continued on a reasonably robust path and corporate profit growth was strong. Small- and mid-capitalization stocks repeated their pattern of outperforming the large-cap segments of the markets; however, the advantage was not as significant as in the past few years.
During the fiscal year, the energy sector was a particularly rewarding spot for stock performance. Companies within this sector achieved extraordinary operating and financial results because of high prices for crude oil and unusually strong profits in refined products and natural gas. In particular, refined products and natural gas were impacted by the devastating hurricanes that hit the Gulf region over the summer, severely restricting refining capacity and production of natural gas from the Gulf of Mexico.
What factors affected the Fund’s performance?
The Fund’s results fell slightly below the Russell 2000 Value Index due to sub-par stock selection in the technology sector of its portfolio. Two stocks in particular, SBS Technologies, a specialty computer products company, and Littelfuse, a circuit protection product provider, achieved poor results. Also, a below-average weighting in the financial segment, particularly real estate, limited the Fund’s returns.
On the other hand, stocks from the materials and health care segments aided the Fund’s results during the period. Additionally, utilities enhanced our returns with good stock performance from Black Hills Corp., a diversified energy and telecommunications company, and El Paso Electric, an electric
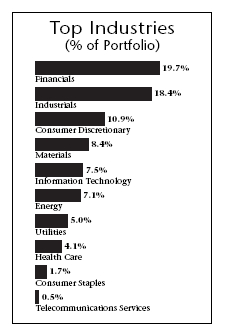
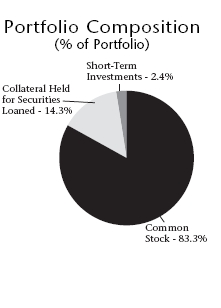
| Top 10 Holdings | |
| (% of Portfolio) | |
| |
| Texas Regional Bancshares, Inc. | 1.6% |
| First Republic Bank | 1.5% |
| Forest Oil Corporation | 1.2% |
| East West Bancorp, Inc. | 1.2% |
| Owens & Minor, Inc. | 1.2% |
| Whiting Petroleum Corporation | 1.2% |
| Kirby Corporation | 1.2% |
| Genesee & Wyoming, Inc. | 1.2% |
| ProAssurance Corporation | 1.1% |
| LSI Industries, Inc. | 1.1% |
| |
| These common stocks represent 12.5% of the total | |
| investment portfolio. | |
Quoted Fund performance is for Class A shares and does not reflect a sales charge.
The returns shown do not reflect taxes a shareholder would pay on distributions or redemptions.
Quoted Top Industries and Top 10 Holdings are subject to change.
The list of Top 10 Holdings excludes short term investments and collateral held for securities loaned.
8
utility company. An above-average weighting in the energy sector also contributed positively to the Fund’s returns for the period. Finally, our stock holdings in the energy segment significantly outpaced the index and peer group returns in that sector.
What is your outlook?
Although we do not see a recession on the horizon, we expect economic growth to slow over the next six to 12 months. A combination of higher short-term interest rates and record-high oil prices will likely restrain economic activity. Given this challenging economic backdrop, we believe the stock market will be choppy in the coming months, which may present some potentially attractive investment opportunities. However, after five years of outperformance in the small-cap value segment of the market, attractively valued small-cap stocks are growing increasingly difficult to find for the Fund.
| | Portfolio Facts | |
| | As of October 31, 2005 | |
| | A Share | | B Share | Institutional Share |
| | ------------------ | | ------------------ | ------------------ |
| Ticker | AALVX | | BBSVX | TPSIX |
| Transfer Agent ID | 032 | | 082 | 099 |
| Net Assets | $74,449,941 | | $5,490,860 | $16,378,913 |
| NAV | $14.06 | | $13.50 | $14.57 |
| NAV -- High† | 12/15/2004 -- $15.53 | | 12/15/2004 -- $15.09 | 12/15/2004 -- $15.97 |
| NAV -- Low† | 5/13/2005 -- $12.47 | | 5/13/2005 -- $12.03 | 5/13/2005 -- $12.88 |
| Number of Holdings: 136 | † For the year ended October 31, 2005 |
| Average Annual Total Returns2 |
| As of October 31, 2005 | |
| |
| | | Inception |
| Class A1 | 1-Year | 7/17/2001 |
|
| without sales charge | 12.13% | 12.36% |
| with sales charge | 5.97% | 10.90% |
| |
| | | From |
| | | Inception |
| Class B1 | 1-Year | 7/17/2001 |
|
| without sales charge | 11.03% | 11.40% |
| with sales charge | 7.14% | 11.24% |
| |
| | | From |
| | | Inception |
| Institutional Class1 | 1-Year | 7/17/2001 |
|
| total return | 12.92% | 13.26% |
1 Class A performance has been restated to reflect the maximum sales charge of 5.5% . Class B performance reflects the maximum contingent deferred sales charge (CDSC) of 5%, declining 1% each year during the first five years and then converting to Class A shares after the fifth year. Institutional Class shares have no sales load and are for institutional shareholders only.
2 Past performance is not an indication of future results. Annualized total returns represent past performance and reflect changes in share prices, the reinvestment of all dividends and capital gains, and the effects of compounding.
Investing in a mutual fund involves risks, including the possible loss of principal. The prospectus contains more complete information on the investment objectives, risks, charges and expenses of the investment company which investors should read and consider carefully before investing. To obtain a prospectus, contact a registered representative or visit www.thrivent.com. At various times, the Fund’s adviser waived its management fee and/or reimbursed Fund expenses. Had the adviser not done so, the Fund’s total returns would have been lower. The returns shown do not reflect taxes a shareholder would pay on distributions or redemptions. Please read your prospectus carefully.
* As you compare performance, please note that the Fund’s performance reflects the maximum 5.5% sales charge, while the Russell 2000 Value Index and the Consumer Price Index do not reflect any such charges. If you were to purchase any of the above individual stocks or funds represented in these Indexes, any charges you would pay would reduce your total return as well.
** The Russell 2000 Value Index is an index comprised of companies with a greater than average value orientation within the Russell 2000 Index. It is not possible to invest directly in these Indexes. The performance of these Indexes does not reflect deductions for fees, expenses or taxes.
*** The Consumer Price Index is an inflationary indicator that measures the change in the cost of a fixed basket of products and services, including housing, electricity, food and transportation. It is not possible to invest directly in the Index.
9
Thrivent Small Cap Stock Fund

Christopher J. Serra, Portfolio Manager
The Thrivent Small Cap Stock Fund seeks long-term capital growth by investing primarily in small
company common stocks and securities convertible into small company common stocks.
|
How did the Fund perform during the one-year period ended Oct. 31, 2005?
Thrivent Small Cap Stock Fund produced a 13.81% return, while its Lipper Inc. Small Cap Core Funds peer group produced a 13.41% median return. The Fund’s market benchmark, the Russell 2000 Index, returned 12.08% during the period.
What market conditions were present during the period?
Despite decelerating throughout much of the period, the economy produced generally solid numbers. With gross domestic product growth at more than 3 percent and with stable inflation figures, the environment was generally constructive for investing in small-capitalization stocks. This was welcome news to many investors who sought growth in small-caps after struggling to identify similar opportunities in the large-cap segment of the market.
Leading the strong small-cap performance during the period were higher-quality companies with visible earnings growth and good returns on capital. Although there were pockets of performance in lower-quality, emerging-growth companies, they generally underperformed their higher quality counterparts during the period.
What factors affected the Fund’s performance?
The Fund’s bias toward higher-quality segments of the market was a significant contributing factor to its performance during the past 12 months. Investors generally preferred better balance sheets and higher financial quality as the maturing economic cycle, systematic short-term interest-rate increases, an unstable energy market, and ongoing geopolitical uncertainty limited investors’ desire for risk.
The Fund’s holdings in the health care sector, especially in the pharmaceuticals and biotechnology areas, also aided its performance. Intuitive Surgical was one such health care stock that posted especially outstanding returns during the period. Basic materials was another segment of strong performance with holdings in companies like Florida Rock providing excellent returns. The Fund also benefited from good returns in its real estate investment trust holdings and from an underweighted position in some of the more interest-rate-sensitive areas of the market.
What is your outlook?
We remain generally optimistic about the prospects for the market and the economy as we prepare to move into 2006. If anything has the potential to derail our optimism, it’s an acceleration in inflation. But at the moment, there is little

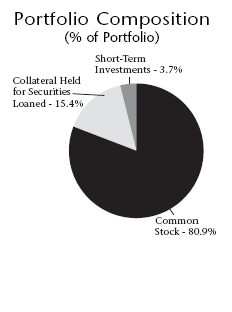
| Top 10 Holdings | |
| (% of Portfolio) | |
| |
| HCC Insurance Holdings, Inc. | 0.9% |
| Ohio Casualty Corporation | 0.8% |
| Affiliated Managers Group, Inc. | 0.7% |
| URS Corporation | 0.7% |
| Oshkosh Truck Corporation | 0.7% |
| Energen Corporation | 0.7% |
| Sybron Dental Specialties, Inc. | 0.6% |
| Sierra Health Services, Inc. | 0.6% |
| Jacobs Engineering Group, Inc. | 0.6% |
| SkyWest, Inc. | 0.6% |
| |
| These common stocks represent 6.9% of the total | |
| investment portfolio. | |
Quoted Fund performance is for Class A shares and does not reflect a sales charge.
The returns shown do not reflect taxes a shareholder would pay on distributions or redemptions.
Quoted Top Industries and Top 10 Holdings are subject to change.
The list of Top 10 Holdings excludes short term investments and collateral held for securities loaned.
10
evidence of such a development. Oil and gas prices appear to be backing down. Job growth, while lagging, is stable. The market reacted well to the introduction of Ben Bernanke as the next Federal Reserve Board Chairman, and future interest rate hikes appear to be factored into the market.
With value becoming more and more difficult to identify in any market sector, growth is coming to the forefront. As a result, we will focus our attention on finding higher-quality companies with reasonably visible growth and outlooks. Because of its earnings growth strength, especially in the health care equipment space, the Fund will maintain an overweighted position in health care. We also continue to hold a positive bias toward the industrial space and will look for opportunities to add to the Fund’s holdings in that area. We hold a modestly overweighted stance in technology, a neutral position in the industrial space, and underweighted positions in the consumer and basic materials areas.
With substantial cash on corporate balance sheets, we anticipate that many companies will come to the realization that growth through reinvestment is vital to their long-term viability. In this environment, we believe small-cap stocks could offer an outstanding conduit to growth.
| | Portfolio Facts | |
| | As of October 31, 2005 | |
| | A Share | | B Share | Institutional Share |
| | ------------------ | ------------------ | ------------------ |
| Ticker | AASMX | | BBSMX | TSCSX |
| Transfer Agent ID | 024 | | 074 | 094 |
| Net Assets | $440,546,435 | | $20,540,889 | $21,115,108 |
| NAV | $17.79 | | $16.18 | $18.85 |
| NAV -- High† | 8/2/2005 -- $18.61 | | 8/2/2005 -- $16.96 | 8/2/2005 -- $19.69 |
| NAV -- Low† | 4/28/2005 -- $15.87 | | 4/28/2005 -- $14.51 | 4/28/2005 -- $16.77 |
| Number of Holdings: 238 | † For the year ended October 31, 2005 |
| Average Annual Total Returns2 |
| As of October 31, 2005 | |
| |
| | | | From |
| | | | Inception |
| Class A1 | 1-Year | 5 Years | 7/1/1996 |
|
| without sales charge | 13.81% | 8.02% | 10.72% |
| with sales charge | 7.58% | 6.81% | 10.06% |
| |
| | | | From |
| | | | Inception |
| Class B1 | 1-Year | 5 Years | 1/8/1997 |
|
| without sales charge | 12.75% | 6.94% | 9.09% |
| with sales charge | 8.75% | 6.94% | 9.09% |
| |
| | | | From |
| | | | Inception |
| Institutional Class1 | 1-Year | 5 Years | 12/29/1997 |
|
| total return | 14.58% | 8.75% | 9.91% |

1 Class A performance has been restated to reflect the maximum sales charge of 5.5% . Class B performance reflects the maximum contingent deferred sales charge (CDSC) of 5%, declining 1% each year during the first five years and then converting to Class A shares after the fifth year. Institutional Class shares have no sales load and are for institutional shareholders only.
2 Past performance is not an indication of future results. Annualized total returns represent past performance and reflect changes in share prices, the reinvestment of all dividends and capital gains, and the effects of compounding.
Investing in a mutual fund involves risks, including the possible loss of principal. The prospectus contains more complete information on the investment objectives, risks, charges and expenses of the investment company which investors should read and consider carefully before investing. To obtain a prospectus, contact a registered representative or visit www.thrivent.com. At various times, the Fund’s adviser waived its management fee and/or reimbursed Fund expenses. Had the adviser not done so, the Fund’s total returns would have been lower. The returns shown do not reflect taxes a shareholder would pay on distributions or redemptions. Please read your prospectus carefully.
* As you compare performance, please note that the Fund’s performance reflects the maximum 5.5% sales charge, while the Russell 2000 Index and the Consumer Price Index do not reflect any such charges. If you were to purchase any of the above individual stocks or funds represented in these Indexes, any charges you would pay would reduce your total return as well.
** The Russell 2000 Index is an index comprised of the 2,000 smaller companies in the Russell 3000 index. It is not possible to invest directly in these Indexes. The performance of these Indexes does not reflect deductions for fees, expenses or taxes.
*** The Consumer Price Index is an inflationary indicator that measures the change in the cost of a fixed basket of products and services, including housing, electricity, food and transportation. It is not possible to invest directly in the Index.
11
Thrivent Small Cap Index Fund

Kevin R. Brimmer, Portfolio Manager
The Thrivent Small Cap Index Fund seeks capital growth that tracks the performance of the S&P
Small Cap 600 Index by investing primarily in common stocks of the Index.
|
How did the Fund perform during the one-year period ended Oct. 31, 2005?
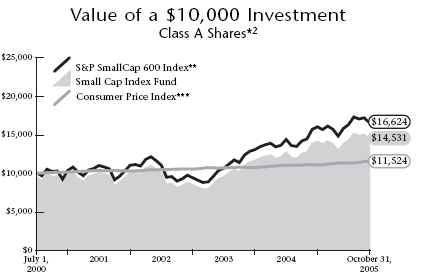
We are pleased to report that we achieved the Fund’s objective of providing results in line with the S&P SmallCap 600 Index, after fees and expenses. Thrivent Small Cap Index Fund returned 14.05% for the period, while the S&P SmallCap 600 gained 15.27% . By comparison, the Fund’s peer group, as represented by the Lipper Small Cap Core Funds Category, posted a median return of 13.41% over the same time frame.
What conditions were present during the period?
The stock market provided solid gains during the period. However, there was plenty of volatility as investors pondered key issues and events -- including skyrocketing energy prices, continued Fed interest rate hikes, the Gulf Coast hurricanes, and concerns about inflation and future economic growth.
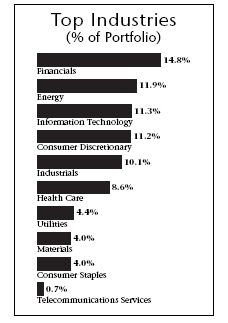
Small-cap stocks continued to outperform large-cap issues, surprising many analysts who expected the latter to take the lead as the economic expansion matured. Within the S&P SmallCap 600 Index, value stocks outperformed growth stocks. On a sector basis, energy, financials, health care and utilities did best. Energy companies reaped record profits as prices and demand for their products remained high. The health care sector benefited from strong performance of managed care companies (HMOs) and long-term care facilities. Sectors with the worst performance were telecom services, which had negative returns, and consumer discretionary. It’s not surprising that consumers reined in discretionary spending, considering the sharply higher costs of driving their cars and heating their homes.
What factors affected the Fund’s performance?
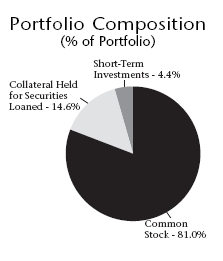
Because we use an indexing approach to manage the Fund, we have no active stock selection process. Our goal is to maintain a fully invested portfolio that replicates the composition and performance of the S&P SmallCap 600 Index, while keeping transaction costs to a minimum. The S&P SmallCap Index is the most widely used gauge of small-sized companies and covers all major market sectors. As is typically the case with index funds, variances in performance relative to the Index are a result of expenses, transaction costs and minor differences in portfolio composition.

| Top 10 Holdings | |
| (% of Portfolio) | |
| |
| Southwestern Energy Company | 0.9% |
| NVR, Inc. | 0.5% |
| Roper Industries, Inc. | 0.5% |
| Cimarex Energy Company | 0.5% |
| Oshkosh Truck Corporation | 0.5% |
| Cooper Companies, Inc. | 0.5% |
| Massey Energy Company | 0.5% |
| Pharmaceutical Product Development, Inc. | 0.4% |
| Vintage Petroleum, Inc. | 0.4% |
| Global Payments, Inc. | 0.4% |
| |
| These common stocks represent 5.1% of the total | |
| investment portfolio. | |
Quoted Fund performance is for Class A shares and does not reflect a sales charge.
The returns shown do not reflect taxes a shareholder would pay on distributions or redemptions.
Quoted Top Industries and Top 10 Holdings are subject to change.
The list of Top 10 Holdings excludes short term investments and collateral held for securities loaned.
12
What is your outlook?
We remain cautiously optimistic about the stock market’s near-term prospects. The economy should continue growing next year, though at a somewhat slower pace than during 2005. Inflation will likely increase slowly, allowing the Federal Reserve to continue measured interest rate hikes, which we expect to cease at a fed funds rate near 4.5% . Several factors could threaten this scenario; however, including further spikes in energy prices and inflation overall, or more aggressive rate hikes by the Fed.
As the economic cycle matures and there is more potential for a slowdown, we expect small-cap stocks to relinquish their lead to large-cap issues. Larger companies often are better positioned to succeed in such a setting, when investors may shift away from “riskier” asset classes. Stock price volatility will most likely continue as investors consider issues that could affect the economy and the market. However, the Thrivent Small Cap Index Fund should experience lower volatility due to its broad diversification and exposure to all market sectors.
| | Portfolio Facts |
| | As of October 31, 2005 |
| | A Share |
| | ------------------ |
| Ticker | AALSX |
| Transfer Agent ID | 029 |
| Net Assets | $46,932,578 |
| NAV | $14.28 |
| NAV -- High† | 8/2/2005 -- $15.06 |
| NAV -- Low† | 11/2/2004 -- $12.66 |
| Number of Holdings: 602 | | † For the year ended October 31, 2005 |
| Average Annual Total Returns2 |
| As of October 31, 2005 | |
| |
| | | | From |
| | | | Inception |
| Class A1 | 1-Year | 5 Years | 7/1/2000 |
|
| without sales charge | 14.05% | 8.60% | 8.40% |
| with sales charge | 7.74% | 7.38% | 7.26% |
1 Class A performance has been restated to reflect the maximum sales charge of 5.5%.
2 Past performance is not an indication of future results. Annualized total returns represent past performance and reflect changes in share prices, the reinvestment of all dividends and capital gains, and the effects of compounding.
Investing in a mutual fund involves risks, including the possible loss of principal. The prospectus contains more complete information on the investment objectives, risks, charges and expenses of the investment company which investors should read and consider carefully before investing. To obtain a prospectus, contact a registered representative or visit www.thrivent.com. At various times, the Fund’s adviser waived its management fee and/or reimbursed Fund expenses. Had the adviser not done so, the Fund’s total returns would have been lower. The returns shown do not reflect taxes a shareholder would pay on distributions or redemptions. Please read your prospectus carefully.
* As you compare performance, please note that the Fund’s performance reflects the maximum 5.5% sales charge, while the S&P SmallCap 600 Index and the Consumer Price Index do not reflect any such charges. If you were to purchase any of the above individual stocks or funds represented in these Indexes, any charges you would pay would reduce your total return as well.
** The S&P SmallCap 600 Index is an index that represents the average performance of a group of 600 small capitalization stocks. “S&P SmallCap 600 Index” is a trademark of The McGraw-Hill Companies, Inc. and has been licensed for use by Thrivent Financial for Lutherans. The product is not sponsored, endorsed or promoted by Standard & Poor’s and Standard & Poor’s makes no representation regarding the advisability of investing in the product. Index funds are subject to the same market risks associated with the stocks in their respective indexes. It is not possible to invest directly in the Index. The performance of the Index does not reflect deductions for fees, expenses or taxes.
*** The Consumer Price Index is an inflationary indicator that measures the change in the cost of a fixed basket of products and services, including housing, electricity, food and transportation. It is not possible to invest directly in the Index.
13

How did the Fund perform during the one-year period ended Oct. 31, 2005?
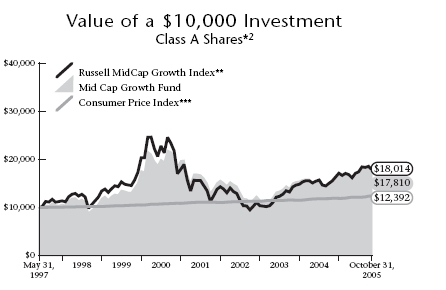
For the 12-month period under review, Thrivent Mid Cap Growth Fund returned 14.43%, while the Lipper Mid Cap Growth Funds Category returned 14.25% . The Fund’s benchmark index, the Russell Midcap Growth Index, posted 15.91% for the same time frame.
What market conditions were present during the period?
While U.S. large-cap equities managed to post high single-digit returns in line with long-term historical averages during the period, mid-cap stocks pulled away from the pack, outperforming both larger- and smaller-cap issues. In large part, investors’ disillusionment with growth prospects in the large-cap universe, coupled with trepidation regarding the perceived risk in smaller-cap stocks, made for healthy demand for mid-cap issues, where investors flocked for both growth and value. Not surprisingly, energy-related stocks, which were far and away the sector leaders this period, helped put mid-cap stocks in the forefront, given their relatively larger presence in the mid-cap universe. In addition, mid-cap stocks were less impacted from rising interest rates than their smaller-cap counterparts -- which are typically more interest-rate sensitive.
What factors affected the Fund’s performance?
Two factors stand out this period in terms of positive impacts to the Fund’s performance: individual stock selection and active management of the portfolio’s exposure to certain industry sectors. We attribute the Fund’s favorable standing versus its peers to active management of the Fund’s diversified portfolio of securities, while stock selection in technology marginally detracted from the Fund’s returns for the period.
First, our decision to overweight the portfolio’s exposure to energy-related stocks proved to be the most substantial ben-efit to performance. Stocks issued by companies in this sector led the markets as energy prices globally continued to rally, and our holdings in this area were up roughly 60% for the year, thereby significantly contributing to the Fund’s overall returns.
Similarly, both our exposure to and individual stock selection within health care and consumer discretionary stocks added to performance. Our health care holdings alone were up 20% for the portfolio this period, thanks to favorable product pricing and continued profit margin improvement. Our stock selection in the consumer area contributed positively during the Fund’s fiscal year, and our decision to reduce our exposure to this group during the year added even more relative performance as the sector declined.


| Top 10 Holdings | |
| (% of Portfolio) | |
| |
| Getty Images, Inc. | 0.8% |
| Broadcom Corporation | 0.8% |
| Corporate Executive Board Company | 0.8% |
| Chico’s FAS, Inc. | 0.7% |
| Marvell Technology Group, Ltd. | 0.7% |
| Comverse Technology, Inc. | 0.7% |
| Coach, Inc. | 0.7% |
| Chicago Mercantile Exchange | 0.6% |
| XTO Energy, Inc. | 0.6% |
| NII Holdings, Inc. | 0.6% |
| |
| These common stocks represent 7.0% of the total | |
| investment portfolio. | |
Quoted Fund performance is for Class A shares and does not reflect a sales charge.
The returns shown do not reflect taxes a shareholder would pay on distributions or redemptions.
Quoted Top Industries and Top 10 Holdings are subject to change.
The list of Top 10 Holdings excludes short term investments and collateral held for securities loaned.
14
On the negative side, stock selection within technology detracted somewhat from our absolute returns. Our growth expectations for mid-cap stocks in this industry sector were perhaps a bit too optimistic, and our individual stock selection in this area led us to a few underperformers.
What is your outlook?
We remain cautiously optimistic as we structure the portfolio for the months ahead. First, although we believe that energy prices and interest-rate conditions will remain the key drivers of the equity markets for the coming months, we are confident that the mid-cap segment of the market will continue to offer solid growth prospects. That said, we expect a somewhat choppy trading environment in which individual stock selection will be paramount in identifying outperformers.
In terms of the portfolio’s structure, we’ve adopted a more neutral-to-defensive position by paring back our exposure to the strongest-performing sectors, such as health care, while adding stocks that we believe represent good opportunity at current prices such as technology and select consumer-oriented stocks. This tactic has enabled us to harvest gains for the portfolio, while helping us position ourselves for generally favorable conditions for the mid-cap segment of the market in the months ahead.
| | Portfolio Facts | |
| | As of October 31, 2005 | |
| | A Share | | B Share | Institutional Share |
| | ------------------ | ------------------ | ------------------ |
| Ticker | LBMGX | | LUGBX | LBMIX |
| Transfer Agent ID | 58 | | 358 | 458 |
| Net Assets | $269,038,108 | | $36,130,648 | $11,707,796 |
| NAV | $14.59 | | $13.64 | $15.44 |
| NAV -- High† | 10/3/2005 -- $15.01 | | 10/3/2005 -- $14.05 | 10/3/2005 -- $15.88 |
| NAV -- Low† | 11/2/2004 -- $12.76 | | 11/2/2004 -- $12.05 | 11/2/2004 -- $13.40 |
| Number of Holdings: 368 | † For the year ended October 31, 2005 |
| Average Annual Total Returns2 |
| As of October 31, 2005 | |
| |
| | | | From |
| | | | Inception |
| Class A1 | 1-Year | 5 Years | 5/30/1997 |
|
| without sales charge | 14.43% | (2.84%) | 7.81% |
| with sales charge | 8.15% | (3.93%) | 7.09% |
| |
| | | | From |
| | | | Inception |
| Class B1 | 1-Year | 5 Years | 10/31/1997 |
|
| without sales charge | 13.20% | (3.65%) | 6.25% |
| with sales charge | 9.20% | (3.65%) | 6.25% |
| |
| | | | From |
| | | | Inception |
| Institutional Class1 | 1-Year | 5 Years | 10/31/1997 |
|
| total return | 15.31% | (1.97%) | 7.50% |
1 Class A performance has been restated to reflect the maximum sales charge of 5.5% . Class B performance reflects the maximum contingent deferred sales charge (CDSC) of 5%, declining 1% each year during the first five years and then converting to Class A shares after the fifth year. Institutional Class shares have no sales load and are for institutional shareholders only.
2 Past performance is not an indication of future results. Annualized total returns represent past performance and reflect changes in share prices, the reinvestment of all dividends and capital gains, and the effects of compounding.
Investing in a mutual fund involves risks, including the possible loss of principal. The prospectus contains more complete information on the investment objectives, risks, charges and expenses of the investment company which investors should read and consider carefully before investing. To obtain a prospectus, contact a registered representative or visit www.thrivent.com. At various times, the Fund’s adviser waived its management fee and/or reimbursed Fund expenses. Had the adviser not done so, the Fund’s total returns would have been lower. The returns shown do not reflect taxes a shareholder would pay on distributions or redemptions. Please read your prospectus carefully.
* As you compare performance, please note that the Fund’s performance reflects the maximum 5.5% sales charge, while the Russell MidCap Growth Index and the Consumer Price Index do not reflect any such charges. If you were to purchase any of the above individual stocks or funds represented in these Indexes, any charges you would pay would reduce your total return as well.
** The Russell MidCap Growth Index is an index comprised of companies with higher than average price-to-book ratios and higher forecasted growth values, within the Russell Midcap Index. It is not possible to invest directly in the Index.
*** The Consumer Price Index is an inflationary indicator that measures the change in the cost of a fixed basket of products and services, including housing, electricity, food and transportation. It is not possible to invest directly in these Indexes. The performance of these Indexes does not reflect deductions for fees, expenses, or taxes.
15

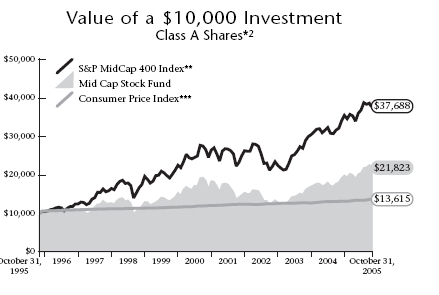
How did the Fund perform during the one-year period ended Oct. 31, 2005?
Thrivent Mid Cap Stock Fund gained 21.10% for the annual reporting period, outperforming its peer group and broad market benchmark. The Lipper mid-cap core peer group posted a median return of 15.77% . The benchmark S&P MidCap 400 Index returned 17.64% over the same one-year time frame.
What market conditions were present during the period?
The energy sector continued to see a significant supply and demand imbalance due to production disruptions from hurricanes Katrina and Rita, disappointing production growth from non-OPEC countries and ongoing strong demand from emerging countries. Oil prices moved up significantly during the period, but fell back somewhat from their peak of more than $70 a barrel in the summer. Likewise, natural gas prices nearly doubled during the Fund’s fiscal year. Although these energy costs caused concern about top-line inflation numbers, other factors kept core inflation (less food and energy) well maintained. These factors included increases in global competition, productivity gains from technology and the Federal Reserve’s moves to raise interest rates. For the most part, the markets took the Fed’s rate increases throughout the year in stride. Corporate earnings growth decelerated somewhat, but continued to be relatively strong.
The mid-capitalization segment provided outstanding returns during the year, outpacing both large- and small-cap stocks. All mid-cap market sectors achieved positive returns, with the biggest contributors being energy -- particularly industrial exploration and production companies -- followed by health care and telecommunications. Laggards in the mid-cap group included stocks from the consumer discretionary and information technology sectors.
What factors affected the Fund’s performance?
Strong stock selection was the primary reason for the Fund’s outperformance of its peer group and benchmark index. In fact, stock selection in every sector added value on a relative performance basis versus the index. The Fund also benefited from an above-average weighting in the top-performing energy sector and a below-average weighting in consumer discretionary stocks. Despite the fact that information technology was the worst-performing sector in the index and the Fund was equally weighted, strong technology stock selection generated solid results as well.
Some of the best performers in the Fund included energy companies Ultra Petroleum and Patterson-UTI Energy. Ultra Petroleum, a natural gas company with Wyoming assets, generated strong returns on investment with low costs. Patterson-UTI Energy, the second largest North American land driller, benefited from full utilization and improved pricing as demand surged from
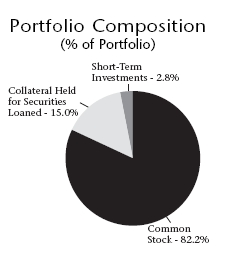
| Top 10 Holdings | |
| (% of Portfolio) | |
| |
| HCC Insurance Holdings, Inc. | 1.6% |
| Ultra Petroleum Corporation | 1.4% |
| Patterson-UTI Energy, Inc. | 1.3% |
| Questar Corporation | 1.3% |
| Nabors Industries, Ltd. | 1.2% |
| Freeport-McMoRan Copper & Gold, Inc. | 1.1% |
| PartnerRe, Ltd. | 1.0% |
| Fastenal Company | 0.9% |
| Grant Prideco, Inc. | 0.9% |
| ENSCO International, Inc. | 0.9% |
| |
| These common stocks represent 11.6% of the total | |
| investment portfolio. | |
Quoted Fund performance is for Class A shares and does not reflect a sales charge.
The returns shown do not reflect taxes a shareholder would pay on distributions or redemptions.
Quoted Top Industries and Top 10 Holdings are subject to change.
The list of Top 10 Holdings excludes short term investments and collateral held for securities loaned.
16
oil and gas producers. Also, Jacobs Engineering, an engineering and construction firm for large-scale projects, performed well as demand increased to build plants and facilities. In health care, Humana and PacifiCare Health Systems advanced as investors realized these companies will benefit significantly from the new Medicare Part D plan. Also, IVAX Corporation, a generic and branded pharmaceutical company, profited from its large number of new drugs in the pipeline.
What is your outlook?
Consumer spending faces a number of headwinds including high gas prices and heating costs, increasing health care costs, heavy debt burdens and tempered wage and employment growth. Therefore, we are continuing to keep a below-average position in consumer discretionary stocks. We will maintain our above-average weighting in the energy sector. After beginning the fiscal year with a below-average weighting in financial stocks, we moved to an above-average weighting. We believe financial stocks look compelling now that the Fed is close to the end of its tightening cycle. Valuations are attractive, and credit quality is strong for many of these companies.
| | Portfolio Facts | |
| | As of October 31, 2005 | |
| | A Share | | B Share | Institutional Share |
| | ------------------ | ------------------ | ------------------ |
| Ticker | AASCX | | BBSCX | TMSIX |
| Transfer Agent ID | 021 | | 083 | 051 |
| Net Assets | $928,017,268 | | $23,992,239 | $50,706,990 |
| NAV | $17.85 | | $16.08 | $18.63 |
| NAV -- High† | 10/3/2005 -- $18.49 | | 10/3/2005 -- $16.67 | 10/3/2005 -- $19.29 |
| NAV -- Low† | 11/2/2004 -- $14.68 | | 11/2/2004 -- $13.37 | 11/2/2004 -- $15.24 |
| Number of Holdings: 188 | † For the year ended October 31, 2005 |
| Average Annual Total Returns2 |
| As of October 31, 2005 | |
| |
| Class A1 | 1-Year | 5 Years | 10 Years |
|
| without sales charge | 21.10% | 3.44% | 8.73% |
| with sales charge | 14.42% | 2.28% | 8.12% |
| |
| | | | From |
| | | | Inception |
| Class B1 | 1-Year | 5 Years | 1/8/1997 |
|
| without sales charge | 19.82% | 2.28% | 7.63% |
| with sales charge | 15.82% | 2.28% | 7.63% |
| |
| | | | From |
| | | | Inception |
| Institutional Class1 | 1-Year | 5 Years | 12/29/1997 |
|
| total return | 21.76% | 4.02% | 8.19% |
1 Class A performance has been restated to reflect the maximum sales charge of 5.5%. Class B performance reflects the maximum contingent deferred sales charge (CDSC) of 5%, declining 1% each year during the first five years and then converting to Class A shares after the fifth year. Institutional Class shares have no sales load and are for institutional shareholders only.
2 Past performance is not an indication of future results. Annualized total returns represent past performance and reflect changes in share prices, the reinvestment of all dividends and capital gains, and the effects of compounding.
Investing in a mutual fund involves risks, including the possible loss of principal. The prospectus contains more complete information on the investment objectives, risks, charges and expenses of the investment company which investors should read and consider carefully before investing. To obtain a prospectus, contact a registered representative or visit www.thrivent.com. At various times, the Fund’s adviser waived its management fee and/or reimbursed Fund expenses. Had the adviser not done so, the Fund’s total returns would have been lower. The returns shown do not reflect taxes a shareholder would pay on distributions or redemptions. Please read your prospectus carefully.
* As you compare performance, please note that the Fund’s performance reflects the maximum 5.5% sales charge, while the S&P MidCap 400 Index and the Consumer Price Index do not reflect any such charges. If you were to purchase any of the above individual stocks or funds represented in these Indexes, any charges you would pay would reduce your total return as well.
** The S&P MidCap 400 Index is an index that represents the average performance of a group of 400 medium capitalization stocks. It is not possible to invest directly in the Index. The performance of the Index does not reflect deductions for fees, expenses or taxes.
*** The Consumer Price Index is an inflationary indicator that measures the change in the cost of a fixed basket of products and services, including housing, electricity, food and transportation. It is not possible to invest directly in the Index.
17
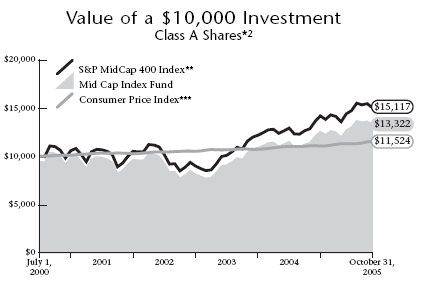
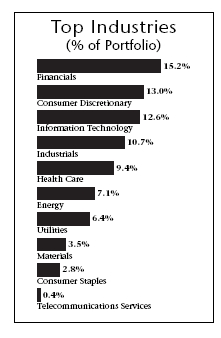
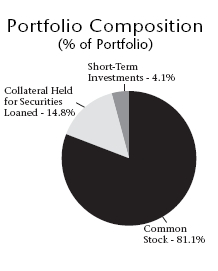
Thrivent Mid Cap Index Fund

Kevin R. Brimmer, Portfolio Manager
The Thrivent Mid Cap Index Fund seeks total returns that track the performance of the S&P MidCap 400 Index by investing primarily in common stocks comprising the Index.
How did the Fund perform during the one-year period ended Oct. 31, 2005?
We are pleased to report that we achieved the Fund’s objective of providing results in line with the S&P MidCap 400 Index, after fees and expenses. Thrivent Mid Cap Index Fund returned 16.80% for the period while the S&P MidCap 400 gained 17.64% . By comparison, the Fund’s peer group, as represented by the Lipper Mid Cap Core Funds Category, posted a median return of 15.77% over the same time frame.
What conditions were present during the period?
The stock market provided solid gains during the period. However, there was plenty of volatility as investors pondered key issues and events -- including skyrocketing energy prices, continued Fed interest rate hikes, the Gulf Coast hurricanes, and concerns about inflation and future economic growth.
Mid-cap stocks outperformed large- and small-cap issues, surprising many analysts who expected large-caps to take the lead as the economic expansion matured. Within the S&P MidCap 400 Index, value stocks continued to outperform growth stocks. On a sector basis, energy, financials, and health care did best. Energy companies reaped record profits as prices and demand for their products remained high. The health care sector benefited from strong performance of managed care companies (HMOs) and long-term care facilities. Sectors with the worst performance were materials and telecom services.
What factors affected the Fund’s performance?
Because we use an indexing approach to manage the Fund, we have no active stock selection process. Our goal is to maintain a fully invested portfolio that replicates the composition and performance of the S&P MidCap 400 Index, while keeping transaction costs to a minimum. The S&P MidCap Index is the most widely used gauge of medium-sized companies and covers all major market sectors. As is typically the case with index funds, variances in performance relative to the Index are a result of expenses, transaction costs and minor differences in portfolio composition.
What is your outlook?
We remain cautiously optimistic about the stock market’s near-term prospects. The economy should continue growing next year, though at a somewhat slower pace than during 2005. Inflation will likely increase slowly, allowing the Federal Reserve to continue measured interest rate hikes, which we expect to cease at a fed funds rate near 4.5% .
| Top 10 Holdings | |
| (% of Portfolio) | |
| |
| Legg Mason, Inc. | 1.0% |
| SanDisk Corporation | 0.8% |
| Peabody Energy Corporation | 0.8% |
| Whole Foods Market, Inc. | 0.7% |
| PacifiCare Health Systems, Inc. | 0.6% |
| Chico’s FAS, Inc. | 0.6% |
| Pioneer Natural Resources Company | 0.6% |
| Noble Energy, Inc. | 0.6% |
| ENSCO International, Inc. | 0.5% |
| Smith International, Inc. | 0.5% |
| |
| These common stocks represent 6.7% of the total | |
| investment portfolio. | |
Quoted Fund performance is for Class A shares and does not reflect a sales charge.
The returns shown do not reflect taxes a shareholder would pay on distributions or redemptions.
Quoted Top Industries and Top 10 Holdings are subject to change.
The list of Top 10 Holdings excludes short term investments and collateral held for securities loaned.
18
Several factors could threaten this scenario, however, including further spikes in energy prices and inflation overall, or more aggressive rate hikes by the Fed.
As the economic cycle matures and there is more potential for a slowdown, we expect mid-cap stocks to relinquish their lead to large-cap issues. Large companies often are better positioned to succeed in such a setting, when investors may shift away from “riskier” asset classes. Stock price volatility will most likely continue as investors consider issues that could affect the economy and the market. However, Thrivent Mid Cap Index Fund should experience lower volatility due to its broad diversification and exposure to all market sectors.
| | Portfolio Facts |
| | As of October 31, 2005 |
| | A Share |
| | ------------------ |
| Ticker | AAMIX |
| Transfer Agent ID | 030 |
| Net Assets | $62,446,093 |
| NAV | $13.77 |
| NAV -- High† | 8/2/2005 -- $14.24 |
| NAV -- Low† | 11/2/2004 -- $11.84 |
| Number of Holdings: 403 | † For the year ended October 31, 2005 |
| Average Annual Total Returns2 |
| As of October 31, 2005 | |
| |
| | | | From |
| | | | Inception |
| Class A1 | 1-Year | 5 Years | 7/1/2000 |
|
| without sales charge | 16.80% | 6.09% | 6.65% |
| with sales charge | 10.38% | 4.90% | 5.53% |
1 Class A performance has been restated to reflect the maximum sales charge of 5.5%.
2 Past performance is not an indication of future results. Annualized total returns represent past performance and reflect changes in share prices, the reinvestment of all dividends and capital gains, and the effects of compounding.
Investing in a mutual fund involves risks, including the possible loss of principal. The prospectus contains more complete information on the investment objectives, risks, charges and expenses of the investment company which investors should read and consider carefully before investing. To obtain a prospectus, contact a registered representative or visit www.thrivent.com. At various times, the Fund’s adviser waived its management fee and/or reimbursed Fund expenses. Had the adviser not done so, the Fund’s total returns would have been lower. The returns shown do not reflect taxes a shareholder would pay on distributions or redemptions. Please read your prospectus carefully.
* As you compare performance, please note that the Fund’s performance reflects the maximum 5.5% sales charge, while the S&P MidCap 400 Index and the Consumer Price Index do not reflect any such charges. If you were to purchase any of the above individual stocks or funds represented in these Indexes, any charges you would pay would reduce your total return as well.
** The S&P MidCap 400 Index is an index that represents the average performance of a group of 400 medium capitalization stocks. “S&P MidCap 400 Index” is a trademark of The McGraw-Hill Companies, Inc. and has been licensed for use by Thrivent Financial for Lutherans. The product is not sponsored, endorsed or promoted by Standard & Poor’s and Standard & Poor’s makes no representation regarding the advisability of investing in the product. Index funds are subject to the same market risks associated with the stocks in their respective indexes. It is not possible to invest directly in the Index. The performance of the Index does not reflect deductions for fees, expenses or taxes.
*** The Consumer Price Index is an inflationary indicator that measures the change in the cost of a fixed basket of products and services, including housing, electricity, food and transportation. It is not possible to invest directly in the Index.
19
Thrivent Mid Cap Index Fund-I

Kevin R. Brimmer, Portfolio Manager
The Thrivent Mid Cap Index Fund seeks total returns that track the performance of the S&P MidCap 400 Index by investing primarily in common stocks comprising the Index.
How did the Fund perform during the one-year period ended Oct. 31, 2005?
We are pleased to report that we achieved the Fund’s objective of providing results in line with the S&P MidCap 400 Index, after fees and expenses. Thrivent Mid Cap Index Fund-I returned 17.00% for the period while the S&P MidCap 400 gained 17.64% . By comparison, the Fund’s peer group, as represented by the Lipper Mid Cap Core Funds Category, posted a median return of 15.77% over the same time frame.
What conditions were present during the period?
The stock market provided solid gains during the period. However, there was plenty of volatility as investors pondered key issues and events -- including skyrocketing energy prices, continued Fed interest rate hikes, the Gulf Coast hurricanes, and concerns about inflation and future economic growth.
Mid-cap stocks outperformed large- and small-cap issues, surprising many analysts who expected large-caps to take the lead as the economic expansion matured. Within the S&P MidCap 400 Index, value stocks continued to outperform growth stocks. On a sector basis, energy, financials, and health care did best. Energy companies reaped record profits as prices and demand for their products remained high. The health care sector benefited from strong performance of managed care companies (HMOs) and long-term care facilities. Sectors with the worst performance were materials and telecom services.
What factors affected the Fund’s performance?
Because we use an indexing approach to manage the Fund, we have no active stock selection process. Our goal is to maintain a fully invested portfolio that replicates the composition and performance of the S&P MidCap 400 Index, while keeping transaction costs to a minimum. The S&P MidCap Index is the most widely used gauge of medium-sized companies and covers all major market sectors. As is typically the case with index funds, variances in performance relative to the Index are a result of expenses, transaction costs and minor differences in portfolio composition.
What is your outlook?
We remain cautiously optimistic about the stock market’s near-term prospects. The economy should continue growing next year, though at a somewhat slower pace than during 2005. Inflation will likely increase slowly, allowing the Federal Reserve to continue measured interest rate hikes, which we expect to cease at a fed funds rate near 4.5% .
| Top 10 Holdings | |
| (% of Portfolio) | |
| |
| Legg Mason, Inc. | 0.9% |
| SanDisk Corporation | 0.8% |
| Peabody Energy Corporation | 0.8% |
| Whole Foods Market, Inc. | 0.7% |
| PacifiCare Health Systems, Inc. | 0.6% |
| Chico’s FAS, Inc. | 0.6% |
| Smith International, Inc. | 0.5% |
| ENSCO International, Inc. | 0.5% |
| Noble Energy, Inc. | 0.5% |
| Pioneer Natural Resources Company | 0.5% |
| |
| These common stocks represent 6.4% of the total | |
| investment portfolio. | |
The returns shown do not reflect taxes a shareholder would pay on distributions or redemptions.
Quoted Top Industries and Top 10 Holdings are subject to change.
The list of Top 10 Holdings excludes short term investments and collateral held for securities loaned.
20
Several factors could threaten this scenario, however, including further spikes in energy prices and inflation overall, or more aggressive rate hikes by the Fed.
As the economic cycle matures and there is more potential for a slowdown, we expect mid-cap stocks to relinquish their lead to large-cap issues. Large companies often are better positioned to succeed in such a setting, when investors may shift away from “riskier” asset classes. Stock price volatility will most likely continue as investors consider issues that could affect the economy and the market. However, Thrivent Mid Cap Index Fund-I should experience lower volatility due to its broad diversification and exposure to all market sectors.
| | Portfolio Facts |
| | As of October 31, 2005 |
| | Institutional Share |
| | ------------------ |
| Ticker | AALMX |
| Transfer Agent ID | 097 |
| Net Assets | $23,081,999 |
| NAV | $13.34 |
| NAV -- High† | 8/2/2005 -- $13.78 |
| NAV -- Low† | 11/2/2004 -- $11.84 |
| Number of Holdings: 403 | † For the year ended October 31, 2005 |
| Average Annual Total Returns2 |
| As of October 31, 2005 | |
| |
| | | | From |
| | | | Inception |
| Institutional Class1 | 1-Year | 5 Years | 12/31/1999 |
|
| total return | 17.00% | 6.76% | 8.77% |
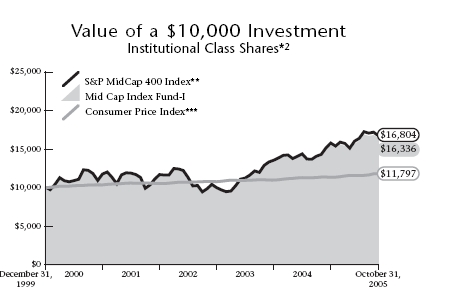
1 Institutional Class shares have no sales load and are for institutional shareholders only.
2 Past performance is not an indication of future results. Annualized total returns represent past performance and reflect changes in share prices, the reinvestment of all dividends and capital gains, and the effects of compounding.
Investing in a mutual fund involves risks, including the possible loss of principal. The prospectus contains more complete information on the investment objectives, risks, charges and expenses of the investment company which investors should read and consider carefully before investing. To obtain a prospectus, contact a registered representative or visit www.thrivent.com. At various times, the Fund’s adviser waived its management fee and/or reimbursed Fund expenses. Had the adviser not done so, the Fund’s total returns would have been lower. The returns shown do not reflect taxes a shareholder would pay on distributions or redemptions. Please read your prospectus carefully.
* As you compare performance, please note that the Fund’s performance reflects Fund expenses, net of any reimbursements, while the S&P MidCap 400 Index and the Consumer Price Index do not reflect such charges. If you were to purchase any of the above individual stocks or funds represented in these Indexes, any charges you would pay would reduce your total return as well.
** The S&P MidCap 400 Index is an index that represents the average performance of a group of 400 medium capitalization stocks. "S&P MidCap 400 Index" is a trademark of The McGraw-Hill Companies, Inc. and has been licensed for use by Thrivent Financial for Lutherans. The product is not sponsored, endorsed or promoted by Standard & Poor’s and Standard & Poor’s makes no representation regarding the advisability of investing in the product. Index funds are subject to the same market risks associated with the stocks in their respective indexes. It is not possible to invest directly in the Index. The performance of the Index does not reflect deductions for fees, expenses or taxes.
*** The Consumer Price Index is an inflationary indicator that measures the change in the cost of a fixed basket of products and services, including housing, electricity, food and transportation. It is not possible to invest directly in the Index.
21
| Thrivent Partner International |
| Stock Fund |
Subadvised by Mercator Asset Management, L.P. and T. Rowe Price International, Inc.

How did the Fund perform during the one-year period ended Oct. 31, 2005?
Thrivent Partner International Stock Fund advanced 16.18% during the annual reporting period, slightly below its peer group median return of 16.41%, as represented by the Lipper International Large Cap Core Funds Category. The Fund underperformed its benchmark, the MSCI Europe, Australia and Far East (EAFE) Index, which gained 18.59% for the year.
What market conditions were present during the period?
Returns for large-cap international equities exceeded those of the major U.S. equity indices during the past year. All of the major stock markets in the Far East, the United Kingdom and Europe realized double-digit returns in both local and U.S. currency terms. Among the major markets, Japan provided particularly attractive results. The performance in Japan was spurred by indications that the prolonged period of sub-par economic conditions may be drawing to a close. The Japanese economy is not only benefiting from better domestic policies, but also the contagious effects of Chinese economic strength.
European markets also enjoyed strong returns despite ongoing economic and political challenges. Companies in Europe appeared to be taking more aggressive actions to deal with cost and trade barriers that seemed increasingly out of date in today’s economic and global trade environment. In the Pacific Rim, Australia benefited from strength in the commodity markets. Many of Australia’s companies operate in raw materials, an area experiencing significant increases in volume and prices related to strong demand from China.
The dollar staged a rebound against most major foreign currencies, causing returns for U.S. shareholders to be generally lower than local currency results. Following the weakness of the dollar experienced in 2004, the U.S. currency became modestly oversold compared to foreign currencies and experienced a modest recovery in 2005. Additionally, U.S. interest rates were generally higher than those available on sovereign bonds of other countries. Finally, a global savings surplus provided an impetus to buy dollar-denominated securities, lifting the U.S. currency.
What factors affected the Fund’s performance?
A primary factor that caused the Fund’s performance to fall short of both the benchmarks was an underexposure to mid-and smaller-capitalization stocks and countries. An additional significant factor was a moderate underexposure to the Japanese market, which provided attractive returns. Likewise, an overexposure to the financials and consumer discretionary sectors, areas of sub-par performance during the period, also limited our results. In the latter category,
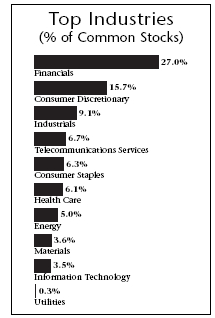
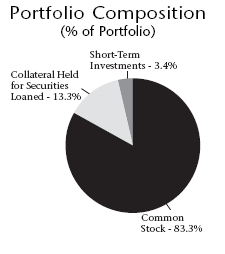
| Top 10 Countries | |
| (% of Portfolio) | |
| |
| Japan | 18.9% |
| United Kingdom | 14.2% |
| Switzerland | 7.9% |
| France | 5.8% |
| Spain | 4.7% |
| Germany | 4.4% |
| Italy | 4.0% |
| Netherlands | 3.3% |
| South Korea | 2.3% |
| Mexico | 2.1% |
| |
| |
| |
| |
| These common stocks represent 67.6% of the total |
| investment portfolio. | |
*International investing has special risks including currency fluctuation and political volatility.
Quoted Fund performance is for Class A shares and does not reflect a sales charge.
The returns shown do not reflect taxes a shareholder would pay on distributions or redemptions.
Quoted Top Industries and Top Countries are subject to change.
22
exposure to Kingfisher and Carnival in particular restrained the Fund’s relative performance.
The Fund achieved good results from its holdings in Japan, such as Sompo Japan Insurance, Sumitomo Mitsui Financial Group and Toyota Motor, and also Hong Kong. Additionally, it benefited from positive stock selection in the information technology, materials, health care (Sanofi-Aventis and Takeda Pharmaceutical) and telecommunications sectors.
What is your outlook?
Higher energy costs do not appear to have significantly impacted global economic growth, but earnings estimates have fallen in most regions. Nonetheless, corporate profitability is generally robust, and we continue to expect positive earnings growth overall. In the near term, a slowdown in the Chinese economy or a cutback in U.S. consumer spending remain the largest potential constraints for global growth. The performance of growth-oriented stocks has improved recently, as is often the case in a slower-growth environment. In addition, large-cap stocks are likely to hold up well as investors seek to reduce risk. Consequently, we believe the Fund’s large-cap orientation should serve it well going forward.
| | Portfolio Facts | |
| | As of October 31, 2005 | |
| | A Share | | B Share | Institutional Share |
| | ------------------ | ------------------ | ------------------ |
| Ticker | AAITX | | BBITX | TISFX |
| Transfer Agent ID | 023 | | 084 | 093 |
| Net Assets | $304,753,446 | | $16,084,488 | $61,118,318 |
| NAV | $10.57 | | $10.16 | $10.77 |
| NAV -- High† | 9/29/2005 -- $10.86 | | 9/29/2005 -- $10.46 | 9/29/2005 -- $11.06 |
| NAV -- Low† | 11/1/2004 -- $9.15 | | 11/1/2004 -- $8.90 | 11/1/2004 -- $9.27 |
| Number of Holdings: 175 | † For the year ended October 31, 2005 |
| Average Annual Total Returns2 |
| As of October 31, 2005 | |
| |
| Class A1 | 1-Year | 5 Years | 10 Years |
|
| without sales charge | 16.18% | (0.85%) | 4.14% |
| with sales charge | 9.78% | (1.97%) | 3.55% |
| |
| | | | From |
| | | | Inception |
| Class B1 | 1-Year | 5 Years | 10/31/97 |
|
| without sales charge | 14.67% | (1.70%) | 2.25% |
| with sales charge | 10.67% | (1.70%) | 2.25% |
| |
| | | | From |
| | | | Inception |
| Institutional Class1 | 1-Year | 5 Years | 10/31/97 |
|
| total return | 16.82% | 0.05% | 3.48% |
1 Class A performance has been restated to reflect the maximum sales charge of 5.5% . Class B performance reflects the maximum contingent deferred sales charge (CDSC) of 5%, declining 1% each year during the first five years and then converting to Class A shares after the fifth year. Institutional Class shares have no sales load and are for institutional shareholders only.
2 Past performance is not an indication of future results. Annualized total returns represent past performance and reflect changes in share prices, the reinvestment of all dividends and capital gains, and the effects of compounding.
Investing in a mutual fund involves risks, including the possible loss of principal. The prospectus contains more complete information on the investment objectives, risks, charges and expenses of the investment company which investors should read and consider carefully before investing. To obtain a prospectus, contact a registered representative or visit www.thrivent.com. At various times, the Fund’s adviser waived its management fee and/or reimbursed Fund expenses. Had the adviser not done so, the Fund’s total returns would have been lower. The returns shown do not reflect taxes a shareholder would pay on distributions or redemptions. Please read your prospectus carefully.
** As you compare performance, please note that the Fund’s performance reflects the maximum 5.5% sales charge, while the MSCI EAFE Index and the Consumer Price Index do not reflect any such charges. If you were to purchase any of the above individual stocks or funds represented in these Indexes, any charges you would pay would reduce your total return as well.
*** The Morgan Stanley Capital International Europe, Australasia, Far East Index (MSCI EAFE Index) is a stock index designed to measure the equity performance of developed countries outside of North America. It is not possible to invest directly in the Index. The performance of the Index does not reflect deductions for fees, expenses or taxes.
****The Consumer Price Index is an inflationary indicator that measures the change in the cost of a fixed basket of products and services, including housing, electricity, food and transportation. It is not possible to invest directly in the Index.
23
Thrivent Large Cap Growth Fund

Scott A. Vergin, Portfolio Manager
The Thrivent Large Cap Growth Fund seeks long-term capital appreciation by investing primarily in
a diversified portfolio of common stocks and securities convertible into common stocks.
|
How did the Fund perform for the one-year period ended Oct. 31, 2005?
We are quite pleased with the Fund’s performance for the 12-month period under review, during which the Fund outpaced both its peer group and benchmark amidst mildly challenging conditions for large-cap growth stocks. For the period under review, Thrivent Large Cap Growth Fund returned 10.16%, while the Fund’s peer group, the Lipper Large Cap Growth Funds Category, returned 9.74% . The Fund’s benchmark, the Russell 1000 Growth Index, posted 8.81% for the same time frame.
What market conditions were present during the period?
U.S. large-cap equities posted solid performance for the 12-month review period and delivered high single-digit returns in line with long-term historical averages. Investors’ expectations for growth in the large-cap arena diminished over the course of the review period, and investors found more opportunity down the capitalization spectrum for growth potential; most notably, among mid-cap stocks, which provided particularly attractive returns in the period. From a sector perspective, energy-related stocks continued to outperform most other industry sectors by a wide margin.
What factors affected the Fund’s performance?
Our decision to overweight energy stocks was the most sig-nificant contributor to performance, given the unusually robust returns generated from this sector. Additionally, our targeted stock selection within this group also substantially added to the Fund’s returns, as we concentrated our holdings in oil drilling and energy services companies, the two best performing sub-segments.
Similarly, our decision to overweight the financial services sector, as well as our specific concentration in brokerage and asset management firms, boosted performance. Holdings such as Goldman Sachs and Lehman Brothers posted strong performance after enjoying robust earnings reports, driven largely by healthy increases in trading fees. In addition, this segment of the financial services sector also benefited from heightened merger/acquisition activity, as well as a mild resurgence in the IPO market.
Moderating portfolio results in the period was our exposure to the large capitalization technology sector, particularly positions such as Dell Computer and Microsoft Corp. Large technology companies generally experienced a period of unexpected slowdown in earnings growth late in the reporting period, and this negatively impacted returns. However, we did own a position in Google that aided results for much of the period.
| Top 10 Holdings | |
| (% of Portfolio) | |
| |
| Microsoft Corporation | 2.3% |
| Procter & Gamble Company | 2.3% |
| UnitedHealth Group, Inc. | 2.2% |
| General Electric Company | 2.0% |
| Johnson & Johnson | 1.9% |
| Genentech, Inc. | 1.8% |
| Amgen, Inc. | 1.8% |
| Google, Inc. | 1.7% |
| Dell, Inc. | 1.6% |
| Yahoo!, Inc. | 1.5% |
| |
| These common stocks represent 19.1% of the total | |
| investment portfolio. | |
Quoted Fund performance is for Class A shares and does not reflect a sales charge.
The returns shown do not reflect taxes a shareholder would pay on distributions or redemptions.
Quoted Top Industries and Top 10 Holdings are subject to change.
The list of Top 10 Holdings excludes short term investments and collateral held for securities loaned.
24
What is your outlook?
As long as energy stocks continue to outperform virtually all other sectors, large-cap growth stocks are likely to face many of the same challenges they endured over the review period. When and if the Federal Reserve ceases to hike short-term interest rates will likely determine investors’ sentiments, as well as corporate earnings prospects for 2006. Another factor to watch is the consumer sector, which may or may not continue to sustain the robust levels of spending we’ve seen for the past several months.
Since the strength of the large-cap growth market seems to hinge on an array of factors currently, we hold a somewhat cautious outlook and believe stock selection will be more crucial than ever in generating performance, particularly in areas such as technology. We continue to watch energy stocks closely, but will maintain our overall overweighted exposure, with an emphasis on drilling and oil services. As always, we will continue to seek promising opportunities within the large-cap growth arena at what we consider to be good value, and regardless of macro conditions.
| | Portfolio Facts | |
| | As of October 31, 2005 | |
| | A Share | | B Share | Institutional Share |
| | ------------------ | ------------------ | ------------------ |
| Ticker | AAAGX | | BBAGX | THLCX |
| Transfer Agent ID | 027 | | 077 | 060 |
| Net Assets | $130,812,384 | | $15,771,621 | $31,338,126 |
| NAV | $4.90 | | $4.64 | $5.20 |
| NAV -- High† | 8/3/2005 -- $5.00 | | 8/3/2005 -- $4.74 | 8/3/2005 -- $5.30 |
| NAV -- Low† | 4/20/2005 -- $4.42 | | 4/20/2005 -- $4.20 | 4/20/2005 -- $4.67 |
| Number of Holdings: 224 | † For the year ended October 31, 2005 |
| Average Annual Total Returns2 |
| As of October 31, 2005 | |
| |
| | | | From |
| | | | Inception |
| Class A1 | 1-Year | 5 Years | 10/29/99 |
|
| without sales charge | 10.16% | (7.94%) | (4.76%) |
| with sales charge | 4.08% | (8.98%) | (5.66%) |
| |
| | | | From |
| | | | Inception |
| Class B1 | 1-Year | 5 Years | 10/29/99 |
|
| without sales charge | 9.18% | (8.71%) | (5.41%) |
| with sales charge | 5.18% | (8.71%) | (5.41%) |
| |
| | | | From |
| | | | Inception |
| Institutional Class1 | 1-Year | 5 Years | 10/29/99 |
|
| total return | 11.01% | (6.96%) | (3.80%) |
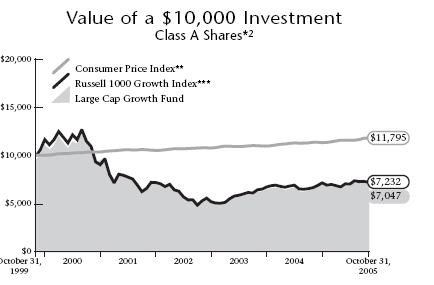
1 Class A performance has been restated to reflect the maximum sales charge of 5.5% . Class B performance reflects the maximum contingent deferred sales charge (CDSC) of 5%, declining 1% each year during the first five years and then converting to Class A shares after the fifth year. Institutional Class shares have no sales load and are for institutional shareholders only.
2 Past performance is not an indication of future results. Annualized total returns represent past performance and reflect changes in share prices, the reinvestment of all dividends and capital gains, and the effects of compounding.
Investing in a mutual fund involves risks, including the possible loss of principal. The prospectus contains more complete information on the investment objectives, risks, charges and expenses of the investment company which investors should read and consider carefully before investing. To obtain a prospectus, contact a registered representative or visit www.thrivent.com. At various times, the Fund’s adviser waived its management fee and/or reimbursed Fund expenses. Had the adviser not done so, the Fund’s total returns would have been lower. The returns shown do not reflect taxes a shareholder would pay on distributions or redemptions. Please read your prospectus carefully.
* As you compare performance, please note that the Fund’s performance reflects the maximum 5.5% sales charge, while the Consumer Price Index, and the Russell 1000 Growth Index do not reflect any such charges. If you were to purchase any of the above individual stocks or funds represented in these Indexes, any charges you would pay would reduce your total return as well.
** The Consumer Price Index is an inflationary indicator that measures the change in the cost of a fixed basket of products and services, including housing, electricity, food and transportation. It is not possible to invest directly in the Index.
*** The Russell 1000 Growth Index is an index comprised of those Russell 1000 Index companies with higher than average price-to-book ratios and higher forecasted growth values. It is not possible to invest directly in these Indexes. The performance of these Indexes does not reflect deductions for fees, expenses or taxes.
25
Thrivent Large Cap Value Fund

Matthew D. Finn, Portfolio Manager
The Thrivent Large Cap Value Fund seeks long-term growth of capital by investing primarily in
common stocks of large companies.
|
How did the Fund perform for the one-year period ended Oct. 31, 2005?
We are pleased with the Fund’s returns for the 12-month period ended Oct. 31, 2005, during which the Fund delivered positive performance that outpaced the median of its peer group while trailing its benchmark. For the period under review, Thrivent Large Cap Value Fund returned 10.64% versus the Lipper Large Cap Value Funds Category, which returned 9.31% . The Fund’s benchmark, the Russell 1000 Value Index, posted 11.86% for the same time frame. We characterize these results as quite favorable, as we believe they are in line with our objective to deliver competitive returns on a consistent basis, particularly vis-à-vis our peer group of similarly managed funds.
What market conditions were present during the period?
U.S. large-cap equities posted solid performance for the 12-month review period, delivering high single-digit and low double-digit returns in line with long-term historical averages. In terms of investment style, the period generally favored value-oriented stocks, which fared well compared to their growth-oriented counterparts, particularly among larger-cap issues. Large-cap value stocks in particular benefited from strength in energy and utilities stocks, which proved to be among the very best performing sectors of the period, and are well represented in the value-stock universe.
Growth stocks, on the other hand, suffered from the under-performance of large pharmaceutical companies in the health care sector and of large-capitalization technology stocks, two significant sectors within the growth universe.
What factors affected the Fund’s performance?
Active management of the Fund’s portfolio of securities was the most significant contributor to performance over the Fund’s fiscal year. For example, our decision to underweight our overall exposure to the consumer discretionary sector helped, as this area of the market underperformed. At the same time, individual stock selection drove the bulk of our outperformance relative to our peers, particularly in the consumer discretionary, financials and health care sectors. Specific names that contributed meaningfully to returns included consumer discretionary stocks like Johnson Controls, an auto-parts manufacturer and Barnes & Noble, a retailer; State Street Bank in the financial services sector; and finally, Medco Health, a pharmacy benefits management company.
Detracting from absolute performance this period was our overweighted exposure to industrial stocks. This area of the market underperformed as it struggled with continually rising energy costs. Also, much as it did within the first half of the review period, individual stock selection led us to a few underperformers within the technology sector, and thereby detracted from our absolute returns.

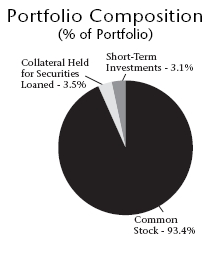
| Top 10 Holdings | |
| (% of Portfolio) | |
| |
| Exxon Mobil Corporation | 3.5% |
| Citigroup, Inc. | 2.6% |
| Bank of America Corporation | 2.1% |
| ConocoPhillips | 2.1% |
| Altria Group, Inc. | 2.0% |
| Merrill Lynch & Company, Inc. | 1.6% |
| Chevron Corporation | 1.6% |
| St. Paul Travelers Companies, Inc. | 1.5% |
| Time Warner, Inc. | 1.5% |
| International Business Machines Corporation | 1.4% |
| |
| |
| |
| |
| These common stocks represent 19.9% of the total | |
| investment portfolio. | |
Quoted Fund performance is for Class A shares and does not reflect a sales charge.
The returns shown do not reflect taxes a shareholder would pay on distributions or redemptions.
Quoted Top Industries and Top 10 Holdings are subject to change.
The list of Top 10 Holdings excludes short term investments and collateral held for securities loaned.
26
What is your outlook?
We remain optimistic in our outlook for large-cap value stocks. We are confident that eventually the Federal Reserve (the Fed) will determine that the U.S. economy has reached an acceptable equilibrium that will permit the central bank to end its series of short-term rate hikes. This should provide a sense of calm to the financial markets, which in our opinion, already reflect the expectation for a minor slowdown in economic growth as a result of all the Fed rate hikes we’ve seen since June 2004. This perception by the markets has created some buying opportunities in select areas, such as industrials and financials, where we’re selectively added to our holdings in the Fund’s portfolio.
As always, our focus remains on investing in quality companies that offer exceptional value. We believe recent fiscal year results support our bottom-up, fundamental approach to buying stocks, particularly given the fact that some of the portfolio’s outperformers originated in generally underperforming industry sectors this period, such as consumer discretionary stocks. Overall, we will continue to seek companies whose stocks offer the potential for improved operating performance that exceed the market’s expectations, regardless of economic conditions.
| | Portfolio Facts | |
| | As of October 31, 2005 | |
| | A Share | | B Share | Institutional Share |
| | ------------------ | ------------------ | ------------------ |
| Ticker | AAUTX | | BBEIX | TLVIX |
| Transfer Agent ID | 022 | | 072 | 092 |
| Net Assets | $321,182,708 | | $16,904,832 | $48,087,136 |
| NAV | $14.49 | | $14.25 | $14.60 |
| NAV -- High† | 9/16/2005 -- $14.82 | | 9/16/2005 -- $14.59 | 9/16/2005 -- $14.92 |
| NAV -- Low† | 11/2/2004 -- $13.15 | | 11/2/2004 -- $13.03 | 11/2/2004 -- $13.21 |
| Number of Holdings: 132 | † For the year ended October 31, 2005 |
| Average Annual Total Returns2 |
| As of October 31, 2005 | |
| |
| | | | From |
| | | | Inception |
| Class A1 | 1-Year | 5 Years | 10/29/99 |
|
| without sales charge | 10.64% | 0.04% | 1.44% |
| with sales charge | 4.52% | (1.09%) | 0.49% |
| |
| | | | From |
| | | | Inception |
| Class B1 | 1-Year | 5 Years | 10/29/99 |
|
| without sales charge | 9.36% | (0.82%) | 0.77% |
| with sales charge | 5.36% | (0.82%) | 0.77% |
| |
| | | | From |
| | | | Inception |
| Institutional Class1 | 1-Year | 5 Years | 10/29/99 |
|
| total return | 11.29% | 0.81% | 2.20% |

1 Class A performance has been restated to reflect the maximum sales charge of 5.5% . Class B performance reflects the maximum contingent deferred sales charge (CDSC) of 5%, declining 1% each year during the first five years and then converting to Class A shares after the fifth year. Institutional Class shares have no sales load and are for institutional shareholders only.
2 Past performance is not an indication of future results. Annualized total returns represent past performance and reflect changes in share prices, the reinvestment of all dividends and capital gains, and the effects of compounding.
Investing in a mutual fund involves risks, including the possible loss of principal. The prospectus contains more complete information on the investment objectives, risks, charges and expenses of the investment company which investors should read and consider carefully before investing. To obtain a prospectus, contact a registered representative or visit www.thrivent.com. At various times, the Fund’s adviser waived its management fee and/or reimbursed Fund expenses. Had the adviser not done so, the Fund’s total returns would have been lower. The returns shown do not reflect taxes a shareholder would pay on distributions or redemptions. Please read your prospectus carefully.
* As you compare performance, please note that the Fund’s performance reflects the maximum 5.5% sales charge, while the Russell 1000 Value Index and the Consumer Price Index do not reflect any such charges. If you were to purchase any of the above individual stocks or funds represented in these Indexes, any charges you would pay would reduce your total return as well.
** The Russell 1000 Value Index is an index comprised of companies with lower price-to-book ratios and lower forecasted growth rates within the Russell 1000 Index. It is not possible to invest directly in these Indexes. The performance of these Indexes does not reflect deductions for fees, expenses or taxes.
*** The Consumer Price Index is an inflationary indicator that measures the change in the cost of a fixed basket of products and services, including housing, electricity, food and transportation. It is not possible to invest directly in the Index.
27
Thrivent Large Cap Stock Fund

Frederick L. Plautz, Portfolio Manager
The Thrivent Large Cap Stock Fund seeks long-term capital growth by investing primarily in a diver-
sified portfolio of common stocks and securities convertible into common stocks.
|
How did the Fund perform for the one-year period ended Oct. 31, 2005?
The Fund delivered solid performance that outpaced both its peer group and its benchmark. For the 12-month period under review, Thrivent Large Cap Stock Fund returned 9.00%, while the Lipper Large Cap Core Funds Category returned 8.26% . The Fund’s benchmark, the S&P 500 Index, posted 8.72% for the same time frame.
What market conditions were present during the period?
U.S. large-cap equities posted solid performance for the 12-month review period, delivering high single-digit returns in line with long-term historical averages. Solid economic growth and generally favorable earnings advances supported a constructive environment for equity investors. As the period progressed, persistently high energy prices, an active agenda on the part of Federal Reserve policy makers to increase short-term interest rates to forestall inflation risks, and the significant damage Hurricane Katrina inflicted to important economic and social infrastructure along the Gulf Coast all effectively tempered investors’ appetite for riskier assets. Nonetheless, stocks provided attractive absolute and relative levels of returns during the 12-month review period.
What factors affected the Fund’s performance?
We are pleased to report that individual stock selection was again the most significant contributor to Fund performance, with 56% of the stocks we selected for inclusion in the Fund’s portfolio this period positively adding to returns.
While the majority of the portfolio’s stocks added to returns, two individual names stood out this period. TXU Corp., a utilities stock, benefited from elevated natural gas prices and performed well for us, while Peabody Energy, a coal-related company, experienced significant profit leverage from the upward trend in coal prices, and also fared well.
We attribute much of our positive relative performance to stock selection within fundamentally strong industry sectors, such as health care and gaming. Managed-care stocks such as WellPoint, UnitedHealth Group and Aetna posted strong performance based on continued profit margin improvement amidst good product pricing and falling costs. Likewise, our stock selection among casino and gaming stocks, particularly MGM Mirage, which benefited from strong market conditions as well as a well-timed merger, added to performance. In the same vein, our success in avoiding individual laggards within these industries also significantly benefited performance on a stock-by-stock basis.
Unsuccessful stock selection within technology, industrials and consumer staples stocks detracted from our returns, while our significant underweighted exposure to consumer staples stocks at large also cost us some performance, since many of these stocks fared well during the period thanks to an interest in less economically sensitive companies.

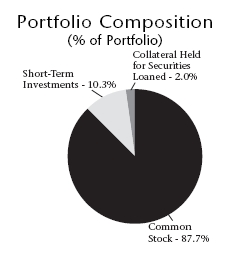
| Top 10 Holdings | |
| (% of Portfolio) | |
| |
| Exxon Mobil Corporation | 2.7% |
| General Electric Company | 2.5% |
| Microsoft Corporation | 2.3% |
| Citigroup, Inc. | 2.1% |
| Johnson & Johnson | 2.0% |
| Bank of America Corporation | 1.7% |
| Intel Corporation | 1.6% |
| Altria Group, Inc. | 1.5% |
| American International Group, Inc. | 1.4% |
| Wal-Mart Stores, Inc. | 1.2% |
| |
| |
| These common stocks represent 19.0% of the total | |
| investment portfolio. | |
Quoted Fund performance is for Class A shares and does not reflect a sales charge.
The returns shown do not reflect taxes a shareholder would pay on distributions or redemptions.
Quoted Top Industries and Top 10 Holdings are subject to change.
The list of Top 10 Holdings excludes short term investments and collateral held for securities loaned.
28
What is your outlook?
We remain cautiously optimistic as we structure the portfolio for the months ahead. While corporate earnings seemed to eclipse the effects of a rising interest-rate environment for much of 2005, we are concerned that this trend could falter in 2006. In addition, as the ripple effect of a protracted rally in energy prices begins to work its way to consumers, overall spending could slow. Hopefully, this will translate into merely a soft enough landing for the economy to stem inflation, halt the Federal Reserve’s short-term rate hikes and bring the markets closer to equilibrium. Should rates continue to rise, or if economic conditions weaken amidst high energy prices, investors could likely gravitate to larger-cap stocks as a perceived safe haven.
That said, our individual stock selection model seeks high price performance potential regardless of macro-economic or market conditions. We believe this disciplined approach to investing will continue to enable us to successfully identify companies with solid fundamentals at what we believe to be attractive prices in our pursuit of long-term, competitive performance for our valued shareholders.
| | Portfolio Facts | |
| | As of October 31, 2005 | |
| | A Share | | B Share | Institutional Share |
| | ------------------ | ------------------ | ------------------ |
| Ticker | AALGX | | BBLGX | IILGX |
| Transfer Agent ID | 017 | | 067 | 090 |
| Net Assets | $3,331,964,527 | | $91,877,447 | $145,948,777 |
| NAV | $25.93 | | $24.00 | $26.13 |
| NAV -- High† | 8/2/2005 -- $26.54 | | 8/3/2005 -- $24.62 | 9/9/2005 -- $26.73 |
| NAV -- Low† | 11/2/2004 -- $23.93 | | 11/2/2004 -- $22.22 | 11/2/2004 -- $24.06 |
| Number of Holdings: 213 | † For the year ended October 31, 2005 |
| Average Annual Total Returns2 |
| As of October 31, 2005 | |
| |
| Class A1 | 1-Year | 5 Years | 10 Years |
|
| without sales charge | 9.00% | (2.81%) | 8.93% |
| with sales charge | 3.02% | (3.90%) | 8.31% |
| |
| | | | From |
| | | | Inception |
| Class B1 | 1-Year | 5 Years | 1/8/1997 |
|
| without sales charge | 8.06% | (3.82%) | 6.39% |
| with sales charge | 4.06% | (3.82%) | 6.39% |
| |
| | | | From |
| | | | Inception |
| Institutional Class1 | 1-Year | 5 Years | 12/29/1997 |
|
| total return | 9.47% | (2.39%) | 4.84% |
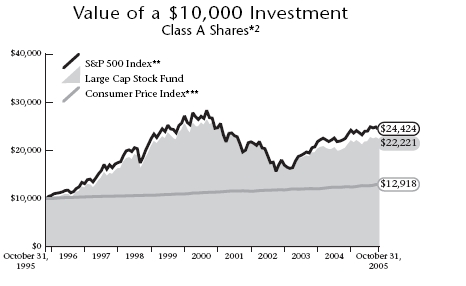
1 Class A performance has been restated to reflect the maximum sales charge of 5.5% . Class B performance reflects the maximum contingent deferred sales charge (CDSC) of 5%, declining 1% each year during the first five years and then converting to Class A shares after the fifth year. Institutional Class shares have no sales load and are for institutional shareholders only.
2 Past performance is not an indication of future results. Annualized total returns represent past performance and reflect changes in share prices, the reinvestment of all dividends and capital gains, and the effects of compounding.
Investing in a mutual fund involves risks, including the possible loss of principal. The prospectus contains more complete information on the investment objectives, risks, charges and expenses of the investment company which investors should read and consider carefully before investing. To obtain a prospectus, contact a registered representative or visit www.thrivent.com. At various times, the Fund’s adviser waived its management fee and/or reimbursed Fund expenses. Had the adviser not done so, the Fund’s total returns would have been lower. The returns shown do not reflect taxes a shareholder would pay on distributions or redemptions. Please read your prospectus carefully.
* As you compare performance, please note that the Fund’s performance reflects the maximum 5.5% sales charge, while the S&P 500 Index and the Consumer Price Index do not reflect any such charges. If you were to purchase any of the above individual stocks or funds represented in these Indexes, any charges you would pay would reduce your total return as well.
** The S&P 500 Index is an index that represents the average performance of a group of 500 large-capitalization stocks. It is not possible to invest directly in the Index. The performance of the Index does not reflect deductions for fees, expenses or taxes.
*** The Consumer Price Index is an inflationary indicator that measures the change in the cost of a fixed basket of products and services, including housing, electricity, food and transportation. It is not possible to invest directly in the Index.
29
Thrivent Large Cap Index Fund

Kevin R. Brimmer, Portfolio Manager
The Thrivent Large Cap Index Fund seeks total returns that track the performance of the S&P 500
Index by investing primarily in common stocks comprising the Index.
|
How did the Fund perform during the one-year period ended Oct. 31, 2005?
We are pleased to report that we achieved the Fund’s objective of providing results in line with the S&P 500 Index, after fees and expenses. Thrivent Large Cap Index Fund returned 8.33% for the period while the S&P 500 gained 8.72% . By comparison, the Fund’s peer group, as represented by the Lipper S&P 500 Index Objective Funds Category, posted a median return of 8.25% over the same time frame.
What conditions were present during the period?
The stock market provided solid gains during the period. However, there was plenty of volatility as investors pondered key issues and events -- including skyrocketing energy prices, continued Fed interest rate hikes, the Gulf Coast hurricanes, and concerns about inflation and future economic growth.
Large-cap stocks underperformed small- and mid-cap issues, surprising many analysts who expected large-caps to take the lead as the economic expansion matured. Within the S&P 500 Index, value stocks continued to outperform growth stocks. On a sector basis, energy, utilities, financials, and health care did best. Energy companies reaped record profits as prices and demand for their products remained high. The health care sector benefited from strong performance of managed care companies (HMOs) and long-term care facilities. Sectors with the worst performance were telecom services and consumer discretionary, which had negative returns. It’s not surprising that consumers reined in discretionary spending, considering the sharply higher costs of driving their cars and heating their homes.
What factors affected the Fund’s performance?
Because we use an indexing approach to manage the Fund, we have no active stock selection process. Our goal is to maintain a fully invested portfolio that replicates the composition and performance of the S&P 500 Index, while keeping transaction costs to a minimum. The S&P 500 Index is the most widely used gauge of the U.S. large-cap equities market and covers all major market sectors. As is typically the case with index funds, variances in performance relative to the Index are a result of expenses, transaction costs and minor differences in portfolio composition.
What is your outlook?
We remain cautiously optimistic about the stock market’s near-term prospects. The economy should continue growing next year, though at a somewhat slower pace than during
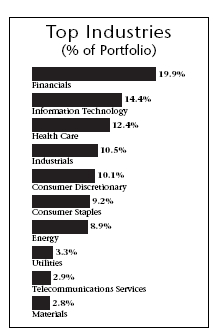
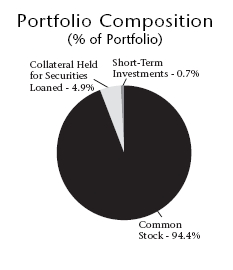
| Top 10 Holdings | |
| (% of Portfolio) | |
| |
| General Electric Company | 3.1% |
| Exxon Mobil Corporation | 3.1% |
| Microsoft Corporation | 2.1% |
| Citigroup, Inc. | 2.0% |
| Procter & Gamble Company | 1.6% |
| Johnson & Johnson | 1.6% |
| Bank of America Corporation | 1.5% |
| American International Group, Inc. | 1.4% |
| Pfizer, Inc. | 1.4% |
| Altria Group, Inc. | 1.3% |
| |
| These common stocks represent 19.1% of the total | |
| investment portfolio. | |
Quoted Fund performance is for Class A shares and does not reflect a sales charge.
The returns shown do not reflect taxes a shareholder would pay on distributions or redemptions.
Quoted Top Industries and Top 10 Holdings are subject to change.
The list of Top 10 Holdings excludes short term investments and collateral held for securities loaned.
30
2005. Inflation will likely increase slowly, allowing the Federal Reserve to continue measured interest rate hikes, which we expect to cease at a fed funds rate near 4.5% . Several factors could threaten this scenario, however, including further spikes in energy prices and inflation overall, or more aggressive rate hikes by the Fed.
As the economic cycle matures and there is more potential for a slowdown, we expect large-cap stocks to start outperforming small- and mid-cap issues. Large companies often are better positioned to succeed in such a setting, when investors may shift away from “riskier” asset classes. Stock price volatility will most likely continue as investors consider issues that could affect the economy and the market. However, Thrivent Large Cap Index Fund should experience lower volatility due to its broad diversification and exposure to all market sectors.
| | Portfolio Facts |
| | As of October 31, 2005 |
| | A Share |
| | ------------------ |
| Ticker | AALCX |
| Transfer Agent ID | 031 |
| Net Assets | $94,345,529 |
| NAV | $8.35 |
| NAV -- High† | 8/3/2005 -- $8.58 |
| NAV -- Low† | 11/2/2004 -- $7.78 |
| Number of Holdings: 502 | † For the year ended October 31, 2005 |
| Average Annual Total Returns2 |
| As of October 31, 2005 | |
| |
| | | | From |
| | | | Inception |
| Class A1 | 1-Year | 5 Years | 7/1/2000 |
|
| without sales charge | 8.33% | (2.53%) | (2.82%) |
| with sales charge | 2.41% | (3.63%) | (3.84%) |
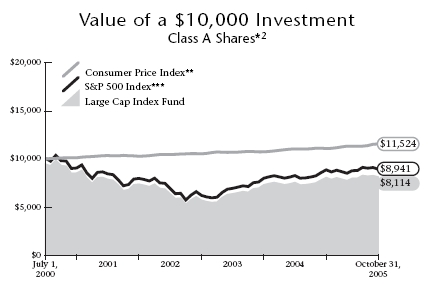
1 Class A performance has been restated to reflect the maximum sales charge of 5.5%.
2 Past performance is not an indication of future results. Annualized total returns represent past performance and reflect changes in share prices, the reinvestment of all dividends and capital gains, and the effects of compounding.
Investing in a mutual fund involves risks, including the possible loss of principal. The prospectus contains more complete information on the investment objectives, risks, charges and expenses of the investment company which investors should read and consider carefully before investing. To obtain a prospectus, contact a registered representative or visit www.thrivent.com. At various times, the Fund’s adviser waived its management fee and/or reimbursed Fund expenses. Had the adviser not done so, the Fund’s total returns would have been lower. The returns shown do not reflect taxes a shareholder would pay on distributions or redemptions. Please read your prospectus carefully.
* As you compare performance, please note that the Fund’s performance reflects the maximum 5.5% sales charge, while the Consumer Price Index and the S&P 500 Index do not reflect any such charges. If you were to purchase any of the above individual stocks or funds represented in these Indexes, any charges you would pay would reduce your total return as well.
** The Consumer Price Index is an inflationary indicator that measures the change in the cost of a fixed basket of products and services, including housing, electricity, food and transportation. It is not possible to invest directly in the Index.
*** The S&P 500 Index is an index that represents the average performance of a group of 500 large-capitalization stocks. “S&P 500®” is a trademark of The McGraw-Hill Companies, Inc. and has been licensed for use by Thrivent Financial for Lutherans. The product is not sponsored, endorsed or promoted by Standard & Poor’s and Standard & Poor’s makes no representation regarding the advisability of investing in the product. Index funds are subject to the same market risks associated with the stocks in their respective indexes. It is not possible to invest directly in the Index. The performance of the Index does not reflect deductions for fees, expenses or taxes.
31
Thrivent Large Cap Index Fund-I

Kevin R. Brimmer, Portfolio Manager
The Thrivent Large Cap Index Fund-I seeks total returns that track the performance of the S&P 500
Index by investing primarily in common stocks comprising the Index.
|
How did the Fund perform during the one-year period ended Oct. 31, 2005?
We are pleased to report that we achieved the Fund’s objective of providing results in line with the S&P 500 Index, after fees and expenses. Thrivent Large Cap Index Fund-I returned 8.39% for the period while the S&P 500 gained 8.72% . By comparison, the Fund’s peer group, as represented by the Lipper S&P 500 Index Objective Funds Category, posted a median return of 8.25% over the same time frame.
What conditions were present during the period?
The stock market provided solid gains during the period. However, there was plenty of volatility as investors pondered key issues and events -- including skyrocketing energy prices, continued Fed interest rate hikes, the Gulf Coast hurricanes, and concerns about inflation and future economic growth.
Large-cap stocks underperformed small- and mid-cap issues, surprising many analysts who expected large-caps to take the lead as the economic expansion matured. Within the S&P 500 Index, value stocks continued to outperform growth stocks. On a sector basis, energy, utilities, financials, and health care did best. Energy companies reaped record profits as prices and demand for their products remained high. The health care sector benefited from strong performance of managed care companies (HMOs) and long-term care facilities. Sectors with the worst performance were tele-com services and consumer discretionary, which had negative returns. It’s not surprising that consumers reined in discretionary spending, considering the sharply higher costs of driving their cars and heating their homes.
What factors affected the Fund’s performance?
Because we use an indexing approach to manage the Fund, we have no active stock selection process. Our goal is to maintain a fully invested portfolio that replicates the composition and performance of the S&P 500 Index, while keeping transaction costs to a minimum. The S&P 500 Index is the most widely used gauge of the U.S. large-cap equities market and covers all major market sectors. As is typically the case with index funds, variances in performance relative to the Index are a result of expenses, transaction costs and minor differences in portfolio composition.
What is your outlook?
We remain cautiously optimistic about the stock market’s near-term prospects. The economy should continue growing next year, though at a somewhat slower pace than during 2005. Inflation will likely increase slowly, allowing the

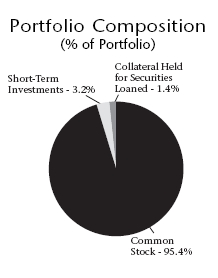
| Top 10 Holdings | |
| (% of Portfolio) | |
| |
| Exxon Mobil Corporation | 3.1% |
| General Electric Company | 3.1% |
| Citigroup, Inc. | 2.1% |
| Microsoft Corporation | 2.1% |
| Procter & Gamble Company | 1.7% |
| Johnson & Johnson | 1.6% |
| Bank of America Corporation | 1.5% |
| American International Group, Inc. | 1.4% |
| Pfizer, Inc. | 1.4% |
| Altria Group, Inc. | 1.3% |
| |
| These common stocks represent 19.3% of the total | |
| investment portfolio. | |
The returns shown do not reflect taxes a shareholder would pay on distributions or redemptions.
Quoted Top Industries and Top 10 Holdings are subject to change.
The list of Top 10 Holdings excludes short term investments and collateral held for securities loaned.
32
Federal Reserve to continue measured interest rate hikes, which we expect to cease at a fed funds rate near 4.5% . Several factors could threaten this scenario, however, including further spikes in energy prices and inflation overall, or more aggressive rate hikes by the Fed.
As the economic cycle matures and there is more potential for a slowdown, we expect large-cap stocks to start outperforming small- and mid-cap issues. Large companies often are better positioned to succeed in such a setting, when investors may shift away from “riskier” asset classes. Stock price volatility will most likely continue as investors consider issues that could affect the economy and the market. However, Thrivent Large Cap Index Fund-I should experience lower volatility due to its broad diversification and exposure to all market sectors.
| | Portfolio Facts |
| | As of October 31, 2005 |
| | Institutional Share |
| | ------------------ |
| Ticker | IILCX |
| Transfer Agent ID | 096 |
| Net Assets | $31,480,362 |
| NAV | $8.29 |
| NAV -- High† | 8/3/2005 -- $8.52 |
| NAV -- Low† | 4/20/2005 -- $7.75 |
| Number of Holdings: 502 | † For the year ended October 31, 2005 |
| Average Annual Total Returns2 |
| As of October 31, 2005 |
| |
| | | | From |
| | | | Inception |
| Institutional Class1 | 1-Year | 5 Years | 12/31/1999 |
|
| total return | 8.39% | (2.17%) | (2.11%) |
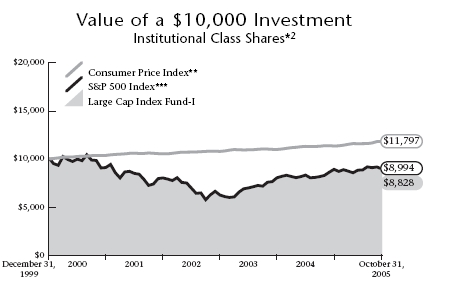
1 Institutional Class shares have no sales load and are for institutional shareholders only.
2 Past performance is not an indication of future results. Annualized total returns represent past performance and reflect changes in share prices, the reinvestment of all dividends and capital gains, and the effects of compounding.
Investing in a mutual fund involves risks, including the possible loss of principal. The prospectus contains more complete information on the investment objectives, risks, charges and expenses of the investment company which investors should read and consider carefully before investing. To obtain a prospectus, contact a registered representative or visit www.thrivent.com. At various times, the Fund’s adviser waived its management fee and/or reimbursed Fund expenses. Had the adviser not done so, the Fund’s total returns would have been lower. The returns shown do not reflect taxes a shareholder would pay on distributions or redemptions. Please read your prospectus carefully.
* As you compare performance, please note that the Fund’s performance reflects Fund expenses, net of any reimbursements, while the Consumer Price Index and the S&P 500 Index do not reflect such charges. If you were to purchase any of the above individual stocks or funds represented in these Indexes, any charges you would pay would reduce your total return as well.
** The Consumer Price Index is an inflationary indicator that measures the change in the cost of a fixed basket of products and services, including housing, electricity, food and transportation. It is not possible to invest directly in the Index.
*** The S&P 500 Index is an index that represents the average performance of a group of 500 large-capitalization stocks. “S&P 500®” is a trademark of The McGraw-Hill Companies, Inc. and has been licensed for use by Thrivent Financial for Lutherans. The product is not sponsored, endorsed or promoted by Standard & Poor’s and Standard & Poor’s makes no representation regarding the advisability of investing in the product. Index funds are subject to the same market risks associated with the stocks in their respective indexes. It is not possible to invest directly in the Index. The performance of the Index does not reflect deductions for fees, expenses or taxes.
33
Thrivent Balanced Fund
The Thrivent Balanced Fund seeks long-term total return through a balance between income and the potential for long-term capital growth by investing primarily in a diversified portfolio of common stocks, bonds and money market instruments.
How did the Fund perform during the one-year period ended Oct. 31, 2005?
Thrivent Balanced Fund advanced 6.56% for the annual reporting period, performing in line with its Lipper peer group. The Lipper Balanced Funds Category reported a median return of 6.79% over the same time frame. The Fund’s equity and fixed income benchmarks, the S&P Composite 1500 Index and the Lehman U.S. Aggregate Bond Index, returned 9.73% and 1.13% for the year, respectively.
What market conditions were present during the period?
The Federal Reserve Board (the Fed) continued to raise interest rates throughout the fiscal year, creating a challenging and rather weak bond market. In the Treasury market, the yield curve flattened substantially as the difference between shorter- and longer-term interest rates narrowed.
U.S. stock market performance was modestly below historical long-term averages and comfortably ahead of inflation. This was despite an environment of unusual increases in energy prices, a modest cyclical rise in inflation and an interest rate environment that could be characterized as fluid and moderately negative, at best. Returns in most market sectors were muted for the year except for the significant positive results achieved in the energy and utilities sectors.
What factors affected the Fund’s performance?
The Fund’s fixed-income portfolio performed in line with the benchmark during a period of anemic bond market returns. Our portfolio’s slightly shorter duration stance versus the index was helpful in the rising rate environment. Also, we benefited from a heavier weighting in corporate bonds and mortgage-backed securities than the index. During the period, we kept a consistent weighting in corporate bonds, but upgraded the credit quality of our holdings.
The equity portion of the Fund benefited from its greater emphasis on small- and mid-sized stocks. Our performance was also aided by our above-average weightings in energy and utilities and our below-average weighting in consumer discretionary, particularly media stocks. Several materials, energy and industrial stocks were outstanding performers for the Fund such as Freeport-McMoRan Copper & Gold, Peabody Energy, Ultra Petroleum and Fastenal Company. The Fund also significantly benefited from owning Apple Computer and the utility company PPL Corporation during the year.
On the negative side, poor stock selection in the information technology, health care and financial groups, along with an above-average weighting in the generally under-performing financial sector, hindered our results. Specifically, a lack of significant exposure to high-profile technology companies like Yahoo and Google and particularly poor results achieved by Doral Financial in the financial sector limited the Fund’s returns.
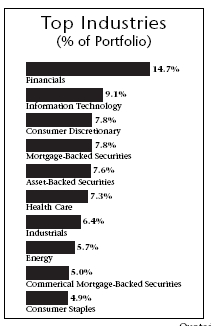
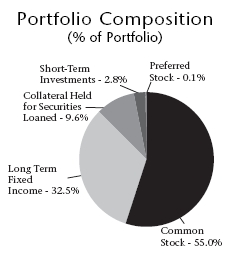
| Top 10 Holdings | |
| (% of Portfolio) | |
| |
| Federal National Mortgage Association | |
| Conventional 30-Yr. Pass Through | 3.3% |
| Federal National Mortgage Association | |
| Conventional 30-Yr. Pass Through | 2.7% |
| Federal National Mortgage Association | |
| Conventional 15-Yr. Pass Through | 1.9% |
| American International Group, Inc. | 1.1% |
| Residential Asset Securities Corporation | 1.1% |
| Johnson & Johnson | 1.1% |
| U.S. Treasury Notes | 1.0% |
| Bank of America Corporation | 0.9% |
| General Electric Company | 0.9% |
| Citigroup, Inc. | 0.8% |
| |
| These common stocks and long term fixed income securities |
| represent 14.5% of the total investment portfolio. | |
Quoted Fund performance is for Class A shares and does not reflect a sales charge.
The returns shown do not reflect taxes a shareholder would pay on distributions or redemptions.
Quoted Top Industries and Top 10 Holdings are subject to change. Top Industries represent long term non-government holdings.
The list of Top 10 Holdings excludes short term investments and collateral held for securities loaned.
34
What is your outlook?
We believe the U.S. economy will likely downshift somewhat from its 2005 growth rate while inflation worries will dissipate. The slower growth will result from higher energy costs, higher interest rates and a retrenchment by consumers, who are weighed down by debt and lack of income growth. We believe that businesses and international markets will drive the economy in 2006, not the U.S. consumer.
Our outlook calls for the Fed to stop raising rates in the first quarter of 2006. This should create a better backdrop for stocks going forward. We anticipate that larger-cap, more growth-oriented stocks will perform well after a recent period of underperformance. Our outlook for the bond market is sanguine. If our forecast plays out, the Treasury yield curve will steepen again and the most attractive segment would be intermediate maturity (five- to seven-year) bonds. We are cautious in our outlook for the corporate bond market. However, we will maintain an above-average weighting in mortgage-backed and commercial mortgage-backed securities. We intend to move to a more neutral duration stance versus the index in the fixed-income portfolio.
| | Portfolio Facts | |
| | As of October 31, 2005 | |
| | A Share | | B Share | Institutional Share |
| | ------------------ | ------------------ | ------------------ |
| Ticker | AABFX | | BBBFX | IBBFX |
| Transfer Agent ID | 026 | | 085 | 056 |
| Net Assets | $276,083,186 | | $13,320,658 | $98,416,224 |
| NAV | $12.18 | | $12.13 | $12.17 |
| NAV -- High† | 9/9/2005 -- $12.49 | | 9/9/2005 -- $12.42 | 9/9/2005 -- $12.48 |
| NAV -- Low† | 4/28/2005 -- $11.54 | | 4/28/2005 -- $11.49 | 4/28/2005 -- $11.53 |
| Number of Holdings: 415 | † For the year ended October 31, 2005 |
| Average Annual Total Returns2 |
| As of October 31, 2005 | |
| |
| | | | From |
| | | | Inception |
| Class A1 | 1-Year | 5 Years | 12/29/1997 |
|
| without sales charge | 6.56% | 1.51% | 4.88% |
| with sales charge | 0.68% | 0.36% | 4.13% |
| |
| | | | From |
| | | | Inception |
| Class B1 | 1-Year | 5 Years | 12/29/1997 |
|
| without sales charge | 5.54% | 0.59% | 4.28% |
| with sales charge | 1.54% | 0.59% | 4.28% |
| |
| | | | From |
| | | | Inception |
| Institutional Class1 | 1-Year | 5 Years | 12/29/1997 |
|
| total return | 7.07% | 1.96% | 5.28% |
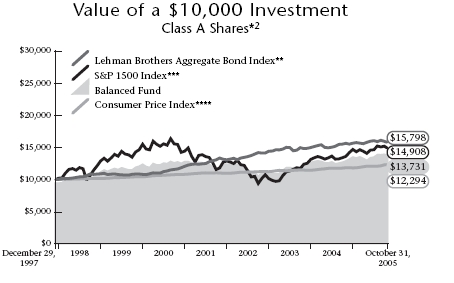
1 Class A performance has been restated to reflect the maximum sales charge of 5.5% . Class B performance reflects the maximum contingent deferred sales charge (CDSC) of 5%, declining 1% each year during the first five years and then converting to Class A shares after the fifth year. Institutional Class shares have no sales load and are for institutional shareholders only.
2 Past performance is not an indication of future results. Annualized total returns represent past performance and reflect changes in share prices, the reinvestment of all dividends and capital gains, and the effects of compounding.
Investing in a mutual fund involves risks, including the possible loss of principal. The prospectus contains more complete information on the investment objectives, risks, charges and expenses of the investment company which investors should read and consider carefully before investing. To obtain a prospectus, contact a registered representative or visit www.thrivent.com. At various times, the Fund’s adviser waived its management fee and/or reimbursed Fund expenses. Had the adviser not done so, the Fund’s total returns would have been lower. The returns shown do not reflect taxes a shareholder would pay on distributions or redemptions. Please read your prospectus carefully.
* As you compare performance, please note that the Fund’s performance reflects the maximum 5.5% sales charge, while the Lehman Brothers Aggregate Bond Index, the S&P 1500 Index and the Consumer Price Index do not reflect any such charges. If you were to purchase any of the above individual stocks or funds represented in these Indexes, any charges you would pay would reduce your total return as well.
** The Lehman Brothers Aggregate Bond Index is an index that measures the performance of U.S. investment grade bonds. It is not possible to invest directly in the Index. The performance of the Index does not reflect deductions for fees, expenses or taxes.
*** The S&P 1500 Index is an index that represents the performance of a group of 1500 publicly traded stocks. It is not possible to invest directly in the Index. The performance of the Index does not reflect deductions for fees, expenses or taxes.
**** The Consumer Price Index is an inflationary indicator that measures the change in the cost of a fixed basket of products and services, including housing, electricity, food and transportation. It is not possible to invest directly in the Index.
35
Thrivent High Yield Fund

Paul J. Ocenasek, Portfolio Manager
The Thrivent High Yield Fund seeks high current income and, secondarily, growth of capital by investing primarily in a diversified portfolio of high-yield (“junk”) corporate bonds.*
How did the Fund perform for the one-year period ended Oct. 31, 2005?
Thrivent High Yield Fund performed well for the 12-month period, in which it outpaced the median of its peer group but trailed its benchmark. For the period under review, the Fund returned 3.54%, while the Lipper High Current Yield Funds Category returned 3.00% . The Lehman Brothers High Yield Bond Index, the Fund’s benchmark, delivered a return of 4.09% . We find these results generally satisfactory, particularly in light of the considerable volatility the high-yield bond market overall experienced over the review period.
What market conditions were present during the period?
The high-yield bond market endured substantial volatility over the 12-month period, particularly in regard to the “spread,” or difference, between the yields of high-yield bonds versus their Treasury counterparts. When the period began, high-yield issues were offering roughly a 350 basis-point yield advantage (or 3.5%) over comparable Treasuries. In March 2005, that spread tightened. Because bond prices generally move in the opposite direction of their yields, as yields in the non-investment grade sector dropped, their prices rose. By May, this trend reversed, as investors’ concerns mounted regarding oil prices, economic growth and a persistent campaign by the Federal Reserve (the Fed) to raise short-term rates. As a result, yield spreads backed up significantly, only to tighten again as the high-yield market rallied once more in July. For the remainder of the period, yields on high-yield issues crept upward, ending the period roughly where they started relative to Treasuries.
What factors affected the Fund’s performance?
We attribute the Fund’s favorable performance versus its Lipper peer group primarily to our decision to significantly underweight our exposure to auto bonds. This sector generally suffered throughout the period as major names in this industry were relegated to “junk” status, and our relative underweight in this area helped support returns. Similarly, our decision to avoid exposure to the majority of troubled airline bonds, many of whose issuers fell into bankruptcy over the period, added to performance.
Another factor supporting Fund returns overall was our active management of the Fund’s credit-quality profile. While higher-rated credits and the lowest-rated bonds seemed to perform in a tight range this period, our decision to remain underweighted in our exposure to CCC-rated, or the riskiest credits, helped. Although this positioning detracted from returns slightly in the beginning of the period, it substantially benefited Fund performance versus our peers when the market engaged in a widespread sell-off of these bonds in March and April.
The most significant detractor to returns stemmed from a handful of select credits that suffered this period due to merger activity. This increased exposure to event risk hurt us slightly, as companies with otherwise sound fundamentals became more leveraged as a result of a merger, and their prices dropped.
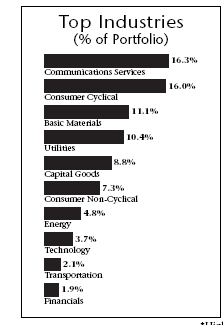
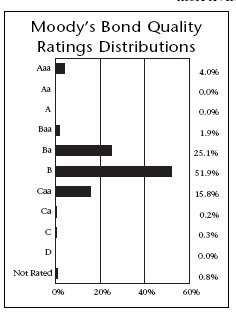
| Top 10 Holdings by Issuer |
| (% of Portfolio) | |
| |
| General Motors Acceptance Corporation | 1.4% |
| Williams Companies, Inc. | 1.4% |
| Qwest Services Corporation | 1.2% |
| Edison Mission Energy | 0.9% |
| MGM MIRAGE | 0.9% |
| Qwest Corporation | 0.8% |
| Roundy's, Inc. | 0.8% |
| Georgia-Pacific Corporation | 0.8% |
| Dynegy Holdings, Inc. | 0.7% |
| Nextel Communications | 0.7% |
| |
| These long term fixed income securities represent 9.6% of |
| the total investment portfolio. | |
*High-yield bonds carry greater volatility and risk than investment-grade bonds.
Quoted Fund performance is for Class A shares and does not reflect a sales charge.
The returns shown do not reflect taxes a shareholder would pay on distributions or redemptions.
Quoted Top Industries and Moody’s Bond Quality Ratings Distributions are subject to change.
36
What is your outlook?
We anticipate a high-yield market in which returns will stem from individual credits, rather than sector-related or credit-quality related trends. We believe fundamentals will remain neutral-to-positive, and believe the high-yield market is currently fairly valued. However, default levels could have bottomed out, thereby leading us to a continuation of our generally defensive positioning for the Fund’s portfolio.
In light of this, we’ve added more BB-rated exposure, while maintaining our underweight in the riskiest (CCC-rated) credits. We continue to remain cautious on consumer-related sectors, as well as those sectors most sensitive to increases in energy prices, such as paper, packaging and chemicals.
With merger-related activity on the rise, corporate leveraging levels could increase. This, coupled with shareholders’ pressure for stock buybacks and other equity-friendly corporate activity, could exert pressure on the high-yield bond market. We believe we’re appropriately positioned for the conditions we anticipate, and plan to capitalize on every appropriate opportunity to capture favorable price/yield performance potential at a good price.
| | Portfolio Facts | |
| | As of October 31, 2005 | |
| | A Share | | B Share | Institutional Share |
| | ------------------ | ------------------ | ------------------ |
| Ticker | LBHYX | | LUHBX | LBHIX |
| Transfer Agent ID | 73 | | 373 | 473 |
| Net Assets | $563,038,778 | | $23,394,241 | $15,199,424 |
| NAV | $5.03 | | $5.02 | $5.03 |
| NAV -- High† | 3/8/2005 -- $5.28 | | 3/8/2005 -- $5.28 | 3/8/2005 -- $5.29 |
| NAV -- Low† | 5/17/2005 -- $4.97 | | 5/17/2005 -- $4.97 | 5/17/2005 -- $4.97 |
| Number of Holdings: 257 | † For the year ended October 31, 2005 |
| Average Annual Total Returns2 |
| As of October 31, 2005 | |
| |
| Class A1 | 1-Year | 5 Years | 10 Years |
|
| without sales charge | 3.54% | 3.66% | 3.96% |
| with sales charge | (1.17%) | 2.70% | 3.48% |
| |
| | | | From |
| | | | Inception |
| Class B1 | 1-Year | 5 Years | 10/31/1997 |
|
| without sales charge | 2.45% | 2.82% | 1.33% |
| with sales charge | (1.39%) | 2.82% | 1.33% |
| |
| | | | From |
| | | | Inception |
| Institutional Class1 | 1-Year | 5 Years | 10/31/1997 |
|
| total return | 3.97% | 4.03% | 2.15% |
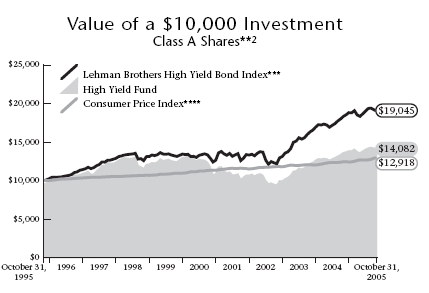
1 Class A performance has been restated to reflect the maximum sales charge of 4.5% . Class B performance reflects the maximum contingent deferred sales charge (CDSC) of 5%, declining 1% each year during the first five years and then converting to Class A shares after the fifth year. Institutional Class shares have no sales load and are for institutional shareholders only.
2 Past performance is not an indication of future results. Annualized total returns represent past performance and reflect changes in share prices, the reinvestment of all dividends and capital gains, and the effects of compounding.
Investing in a mutual fund involves risks, including the possible loss of principal. The prospectus contains more complete information on the investment objectives, risks, charges and expenses of the investment company which investors should read and consider carefully before investing. To obtain a prospectus, contact a registered representative or visit www.thrivent.com. At various times, the Fund’s adviser waived its management fee and/or reimbursed Fund expenses. Had the adviser not done so, the Fund’s total returns would have been lower. The returns shown do not reflect taxes a shareholder would pay on distributions or redemptions. Please read your prospectus carefully.
** As you compare performance, please note that the Fund’s performance reflects the maximum 4.5% sales charge, while the Lehman Brothers High Yield Bond Index and the Consumer Price Index do not reflect any such charges. If you were to purchase any of the above individual stocks or funds represented in these Indexes, any charges you would pay would reduce your total return as well.
*** The Lehman Brothers High Yield Bond Index is an index which measures the performance of fixed-rate non-investment grade bonds. It is not possible to invest directly in the Index. The performance of the Index does not reflect deductions for fees, expenses or taxes.
****The Consumer Price Index is an inflationary indicator that measures the change in the cost of a fixed basket of products and services, including housing, electricity, food and transportation. It is not possible to invest directly in the Index.
37
Thrivent High Yield Fund II

Paul J. Ocenasek, Portfolio Manager
The Thrivent High Yield Fund II seeks high current income and secondary capital growth by
investing primarily in a diversified portfolio of high-risk, high-yield bonds commonly referred to
as “junk bonds.”* The Fund actively seeks to achieve the secondary objective of capital growth to
the extent it is consistent with the primary objective of high current income.
|
How did the Fund perform for the one-year period ended Oct. 31, 2005?
Thrivent High Yield Fund II delivered generally satisfactory performance for the 12-month period under review, during which it fell short of its benchmark but only slightly trailed the median of its peer group. For the period under review, the Fund returned 2.91%, while the Lipper High Current Yield Funds Category returned 3.00% . The Lehman Brothers High Yield Bond Index delivered a return of 4.09% for the same period. Overall, we find these results to be adequate, particularly in light of the considerable volatility the high-yield bond market overall experienced over the review period.
What market conditions were present during the period?
The high-yield bond market endured substantial volatility over the 12-month period, particularly in regard to the “spread,” or difference, between the yields of high-yield bonds versus their Treasury counterparts. When the period began, high-yield issues were offering roughly a 350 basis-point yield advantage (or 3.5%) over comparable Treasuries. In March 2005, that spread tightened. Because bond prices generally move in the opposite direction of their yields, as yields in the non-investment grade sector dropped, their prices rose. By May, this trend reversed, as investors’ concerns mounted regarding oil prices, economic growth and a persistent campaign by the Federal Reserve (the Fed) to raise short-term rates. As a result, yield spreads backed up significantly, only to tighten again as the high-yield market rallied once more in July. For the remainder of the period, yields on high-yield issues crept upward, ending the period roughly where they started relative to Treasuries.
What factors affected Fund performance?
We attribute the Fund’s ability to perform in line with its Lipper peer group primarily to our decision to significantly underweight our exposure to auto bonds. This sector generally suffered throughout the period as major names in this industry were relegated to “junk” status, and our relative underweight in this area helped support returns. Similarly, our decision to avoid exposure to the majority of troubled airline bonds, many of whose issuers fell into bankruptcy over the period, added to performance.
The most significant detractor to returns stemmed from a handful of individual names that suffered this period, some due to merger activity. Our greater exposure to event risk hurt us, as companies with otherwise sound fundamentals became more leveraged as a result of a merger, and their prices dropped. In addition, while we continue to work to bring the risk and industry profile of the Fund closer to that of Thrivent High Yield Fund, this portfolio held a few, less liquid names that held returns back, relative to both the High Yield Fund and the Index.
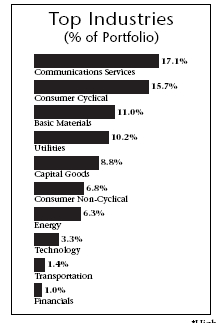
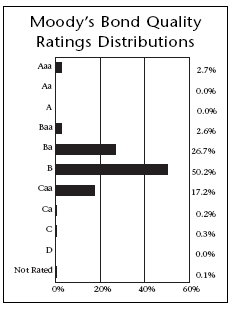
| Top 10 Holdings by Issuer |
| (% of Portfolio) | |
| |
| General Motors Acceptance Corporation | 1.4% |
| Qwest Services Corporation | 1.1% |
| DR Horton, Inc. | 1.1%�� |
| Williams Companies, Inc. | 1.1% |
| Edison Mission Energy | 1.1% |
| Georgia-Pacific Corporation | 0.9% |
| Sovereign REIT | 0.9% |
| Qwest Corporation | 0.8% |
| MGM MIRAGE | 0.8% |
| El Paso Corporation | 0.8% |
| |
| These long term fixed income securities represent 10.0% of |
| the total investment portfolio. | |
*High-yield bonds carry greater volatility and risk than investment-grade bonds.
Quoted Fund performance is for Class A shares and does not reflect a sales charge.
The returns shown do not reflect taxes a shareholder would pay on distributions or redemptions.
Quoted Top Industries and Moody’s Bond Quality Ratings Distributions are subject to change.
38
What is your outlook?
We anticipate a high-yield market in which returns will stem from individual credits, rather than sector-related or credit-quality related trends. We believe fundamentals will remain neutral-to-positive, and believe the high-yield market is currently fairly valued. However, default levels could have bottomed out, thereby leading us to a continuation of our generally defensive positioning for the Fund’s portfolio.
In light of this, we’ve added more BB-rated exposure, while maintaining our underweight in the riskiest (CCC-rated) credits. We continue to remain cautious on consumer-related sectors, as well as those sectors most sensitive to increases in energy prices, such as paper, packaging and chemicals.
With merger-related activity on the rise, corporate leveraging levels could increase. This, coupled with shareholders’ pressure for stock buybacks and other equity-friendly corporate activity, could exert pressure on the high-yield bond market. We believe we’re appropriately positioned for the conditions we anticipate, and plan to capitalize on every appropriate opportunity to capture favorable price/yield performance potential at a good price.
| | Portfolio Facts | |
| | As of October 31, 2005 | |
| | A Share | | B Share | Institutional Share |
| | ------------------ | ------------------ | ------------------ |
| Ticker | AAHYX | | BBHYX | THYFX |
| Transfer Agent ID | 025 | | 075 | 095 |
| Net Assets | $124,286,310 | | $4,093,631 | $4,258,667 |
| NAV | $6.41 | | $6.41 | $6.41 |
| NAV -- High† | 3/8/2005 -- $6.76 | | 3/8/2005 -- $6.76 | 3/8/2005 -- $6.76 |
| NAV -- Low† | 5/17/2005 -- $6.34 | | 5/17/2005 -- $6.34 | 5/17/2005 -- $6.34 |
| Number of Holdings: 252 | † For the year ended October 31, 2005 |
| Average Annual Total Returns2 |
| As of October 31, 2005 | |
| |
| | | | From |
| | | | Inception |
| Class A1 | 1-Year | 5 Years | 1/8/1997 |
|
| without sales charge | 2.91% | 6.75% | 3.89% |
| with sales charge | (1.78%) | 5.79% | 3.35% |
| |
| | | | From |
| | | | Inception |
| Class B1 | 1-Year | 5 Years | 1/8/1997 |
|
| without sales charge | 1.74% | 5.81% | 3.46% |
| with sales charge | (2.07%) | 5.81% | 3.46% |
| |
| | | | From |
| | | | Inception |
| Institutional Class1 | 1-Year | 5 Years | 12/29/1997 |
|
| total return | 3.36% | 7.17% | 3.09% |
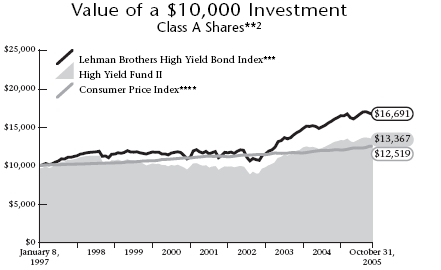
1 Class A performance has been restated to reflect the maximum sales charge of 4.5% . Class B performance reflects the maximum contingent deferred sales charge (CDSC) of 5%, declining 1% each year during the first five years and then converting to Class A shares after the fifth year. Institutional Class shares have no sales load and are for institutional shareholders only.
2 Past performance is not an indication of future results. Annualized total returns represent past performance and reflect changes in share prices, the reinvestment of all dividends and capital gains, and the effects of compounding.
Investing in a mutual fund involves risks, including the possible loss of principal. The prospectus contains more complete information on the investment objectives, risks, charges and expenses of the investment company which investors should read and consider carefully before investing. To obtain a prospectus, contact a registered representative or visit www.thrivent.com. At various times, the Fund’s adviser waived its management fee and/or reimbursed Fund expenses. Had the adviser not done so, the Fund’s total returns would have been lower. The returns shown do not reflect taxes a shareholder would pay on distributions or redemptions. Please read your prospectus carefully.
** As you compare performance, please note that the Fund’s performance reflects the maximum 4.5% sales charge, while the Lehman Brothers High Yield Bond Index and the Consumer Price Index do not reflect any such charges. If you were to purchase any of the above individual stocks or funds represented in these Indexes, any charges you would pay would reduce your total return as well.
*** The Lehman Brothers High Yield Bond Index is an index which measures the performance of fixed-rate non-investment grade bonds. It is not possible to invest directly in the Index. The performance of the Index does not reflect deductions for fees, expenses or taxes.
**** The Consumer Price Index is an inflationary indicator that measures the change in the cost of a fixed basket of products and services, including housing, electricity, food and transportation. It is not possible to invest directly in the Index.
39
Thrivent Municipal Bond Fund

Janet I. Grangaard, Portfolio Manager
The Thrivent Municipal Bond Fund seeks a high level of current income exempt from federal income
taxes consistent with capital preservation by investing primarily in a diversified portfolio of
municipal bonds.*
|
How did the Fund perform during the one-year period ended Oct. 31, 2005?
Thrivent Municipal Bond Fund gained 2.17% for the annual reporting period, outperforming its Lipper peer group. The Lipper General Municipal Debt Funds Category reported a median return of 2.01% over the same time frame. The Fund’s broad market benchmark, the Lehman Municipal Bond Index, returned 2.54% for the year.
What market conditions were present during the period?
Throughout the entire fiscal year, the Federal Reserve Board (the Fed) continued its campaign to raise interest rates that began in June 2004. This was the primary cause for an increase in rates for short- and intermediate-term municipal (muni) bonds. Surprisingly, rates for longer maturity muni bonds were mostly unchanged to slightly lower for the period. This resulted in a considerable flattening of the muni bond yield curve. Economic conditions continued to improve at the state and local levels as tax receipts increased, which in turn benefited credit quality.
The supply of new tax-exempt bonds was up dramatically and at period end was on pace to set a record for calendar year 2005. Demand for municipal bonds was also strong, particularly for higher-yielding securities. This caused spreads to tighten in the municipal market as there were not enough bonds available for investors to buy in the lower credit qualities. Mid-year, municipal bonds became very inexpensive in comparison to Treasury bonds. This encouraged a tremendous number of cross-over buyers as municipal bonds became more compelling for investors in lower tax brackets.
What factors affected the Fund’s performance?
The Fund’s results were aided by tightening credit spreads, which benefited A- and BBB-rated securities. We were more heavily invested in these lower-quality segments than our competition. In particular, our holdings in hospital bonds and bonds backed by the proceeds from the Master Settlement Agreement with tobacco manufacturers performed well. Our weighting in hospital bonds did decrease slightly after we took profits from some bonds we owned within that category. The Fund also benefited from a shorter duration stance than its peer group, causing the portfolio to be less sensitive to changes in interest rates. Additionally, a few of our holdings were pre-refunded during the year, which increased their value.
The Fund underperformed the Lehman benchmark due to the expenses incurred in running an actively managed portfolio. Also, the flattening of the municipal yield curve hurt the Fund’s returns for the period. That’s because our portfolio did not own many bonds at the longest (30-year) end of the yield curve.
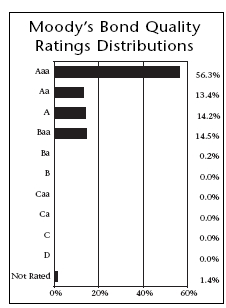
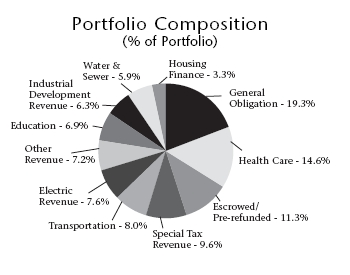
| Top 10 |
| States |
| (% of Portfolio) |
| |
| Texas | 11.0% |
| California | 10.5% |
| New York | 9.4% |
| Illinois | 9.0% |
| Washington | 5.0% |
| Colorado | 5.0% |
| Minnesota | 3.7% |
| Georgia | 3.0% |
| Michigan | 2.9% |
| Ohio | 2.4% |
| |
| These long term fixed |
| income securities represent |
| 61.9% of the total |
| investment portfolio. |
*Investors may be subject to state taxes and federal alternative minimum tax.
Quoted Fund performance is for Class A shares and does not reflect a sales charge.
The returns shown do not reflect taxes a shareholder would pay on distributions or redemptions.
Quoted Moody’s Bond Quality Ratings Distributions, Portfolio Composition and Top 10 States are subject to change.
40
Hurricanes Katrina and Rita had minimal impact on our portfolio because the Fund’s holdings in the affected areas carried bond insurance which guarantees the timely payment of principal and interest. In terms of geographic distribution, we made no major changes to the Fund. We continued to emphasize a well-diversified portfolio of bonds from almost every state, our top three being Texas, California and New York.
What is your outlook?
Our outlook calls for the U.S. economy to remain strong, although we are likely to see a slowdown from 2005’s pace in 2006. However, we still expect credit quality to remain favorable in the municipal bond market. We believe the Fed will continue to raise interest rates in the near future. Therefore, we will remain vigilant with respect to the Fund’s duration stance and keep our neutral position for the time being. Due to existing tight credit spreads, we believe bonds in the AAA- and AA-rated segments have more value than those in the A- and BBB-rated segments. Consequently, we are likely to prefer higher quality bonds over the next few months.
| | Portfolio Facts | |
| | As of October 31, 2005 | |
| | A Share | | B Share | Institutional Share |
| | ------------------ | | ------------------ | ------------------ |
| Ticker | AAMBX | | TMBBX | TMBIX |
| Transfer Agent ID | 015 | | 065 | 088 |
| Net Assets | $1,242,350,457 | | $28,915,326 | $8,379,875 |
| NAV | $11.31 | | $11.30 | $11.31 |
| NAV -- High† | 2/9/2005 -- $11.66 | | 2/9/2005 -- $11.66 | 2/9/2005 -- $11.66 |
| NAV -- Low† | 10/31/2005 -- $11.31 | | 10/31/2005 -- $11.30 | 10/31/2005 -- $11.31 |
| Number of Holdings: 493 | † For the year ended October 31, 2005 |
| Average Annual Total Returns2 |
| As of October 31, 2005 | |
| |
| Class A1 | 1-Year | 5 Years | 10 Years |
|
| without sales charge | 2.17% | 5.50% | 5.43% |
| with sales charge | (2.39%) | 4.53% | 4.95% |
| |
| | | | From |
| | | | Inception |
| Class B1 | 1-Year | 5 Years | 10/31/97 |
|
| without sales charge | 1.46% | 4.72% | 4.59% |
| with sales charge | (2.46%) | 4.72% | 4.59% |
| |
| | | | From |
| | | | Inception |
| Institutional Class1 | 1-Year | 5 Years | 10/31/97 |
|
| total return | 2.56% | 5.76% | 5.33% |
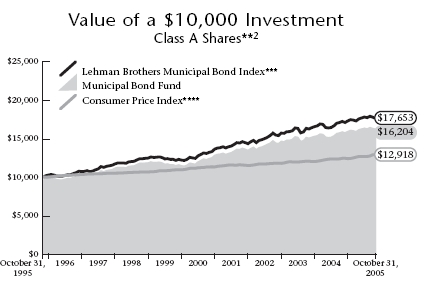
1 Class A performance has been restated to reflect the maximum sales charge of 4.5% . Class B performance reflects the maximum contingent deferred sales charge (CDSC) of 5%, declining 1% each year during the first five years and then converting to Class A shares after the fifth year. Institutional Class shares have no sales load and are for institutional shareholders only.
2 Past performance is not an indication of future results. Annualized total returns represent past performance and reflect changes in share prices, the reinvestment of all dividends and capital gains, and the effects of compounding.
Investing in a mutual fund involves risks, including the possible loss of principal. The prospectus contains more complete information on the investment objectives, risks, charges and expenses of the investment company which investors should read and consider carefully before investing. To obtain a prospectus, contact a registered representative or visit www.thrivent.com. At various times, the Fund’s adviser waived its management fee and/or reimbursed Fund expenses. Had the adviser not done so, the Fund’s total returns would have been lower. The returns shown do not reflect taxes a shareholder would pay on distributions or redemptions. Please read your prospectus carefully.
** As you compare performance, please note that the Fund’s performance reflects the maximum 4.5% sales charge, while the Lehman Brothers Municipal Bond Index and the Consumer Price Index do not reflect any such charges. If you were to purchase any of the above individual stocks or funds represented in these Indexes, any charges you would pay would reduce your total return as well.
*** The Lehman Brothers Municipal Bond Index is a market value-weighted index of investment grade municipal bonds with maturities of one year or more. It is not possible to invest directly in the Index. The performance of the Index does not reflect deductions for fees, expenses or taxes.
****The Consumer Price Index is an inflationary indicator that measures the change in the cost of a fixed basket of products and services, including housing, electricity, food and transportation. It is not possible to invest directly in the Index.
41

How did the Fund perform during the one-year period ended Oct. 31, 2005?
The Thrivent Income Portfolio produced a 0.82% return while its Lipper Inc. Corporate Debt Funds BBB-Rated Funds peer group realized a 1.09% median return. The Portfolio’s market benchmark, the Lehman Brothers Aggregate Bond Index, earned a 1.13% return during the period.
What market conditions were present during the period?
The Federal Reserve Board’s continued monetary policy tightening and a dramatic flattening of the yield curve set the backdrop for a 12-month period of modest returns in the bond market. Hurricane Katrina and increased demand from developing economies also contributed to a precipitous rise in oil prices during the period.
Despite the rising cost of energy, gross domestic product growth remained strong. In fact, GDP growth has topped 3 percent for 10 straight quarters -- the longest consecutive streak since the 1980s. Fueling this growth, in large part, has been the strong housing market, which has led to job creation and consumer access to home-equity capital.
What factors affected the Fund’s performance?
The Fund’s performance versus its peers was adversely affected by an underweighted stance in foreign government bonds, which posted outstanding returns for the period. Auto-sector troubles and corporate strategies to enhance shareholder values -- to the detriment of bondholders --hurt the performance of industrial BBB corporate bonds during the period. The Fund’s overweighted position in this sector, as well as in commercial mortgage-backed securities, also diminished its returns versus its peers.
Because of a dramatic yield-curve flattening, perhaps the most important strategy for success during the period was a barbelled maturity configuration. Thrivent Income Fund benefited modestly from such a structure, which calls for a heavier weighting of securities at the extreme ends of the yield curve and an underweighting of holdings in intermediate-maturity securities. In addition, the Fund also earned strong returns from its overweighted position in asset-backed and mortgage-backed securities, which both performed exceptionally well during the period.
What is your outlook?
We will continue to monitor the effect of high energy prices and the continued Federal Reserve Board rate tightening on economic activity. Overall, however, we believe the economy will continue to grow at a moderate pace while inflation remains in check.
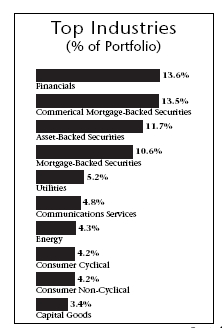
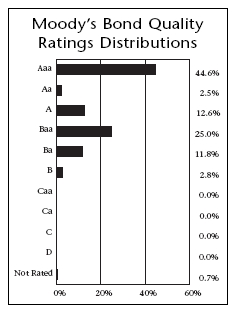
| Top 10 Holdings | |
| (% of Portfolio) | |
| |
| Federal National Mortgage Association | |
| Conventional 30-Yr. Pass Through | 5.2% |
| U.S. Treasury Bonds | 3.1% |
| Federal National Mortgage Association | |
| Conventional 15-Yr. Pass Through | 2.7% |
| Federal National Mortgage Association | |
| Conventional 30-Yr. Pass Through | 2.7% |
| Lehman Brothers, Inc. | 1.4% |
| Merrill Lynch Mortgage Trust | 1.3% |
| Banc of America Mortgage Securities, Inc. | 1.1% |
| U.S. Treasury Principal Strips | 1.0% |
| U.S. Treasury Strips | 1.0% |
| CPL Transition Funding, LLC | 1.0% |
| |
| These long term fixed income securities represent 20.4% |
| of the total investment portfolio. | |
Quoted Fund performance is for Class A shares and does not reflect a sales charge.
The returns shown do not reflect taxes a shareholder would pay on distributions or redemptions.
Quoted Moody’s Bond Quality Ratings Distributions and Top 10 Holdings are subject to change.
The list of Top 10 Holdings excludes short term investments and collateral held for securities loaned.
42
Some of our optimism stems from what is known as the core consumer price index (CPI) number. Unlike the “headline” CPI figure, which is most often reported, the core CPI excludes both energy and food prices, which have high volatility. This core CPI number has remained within the Fed’s comfort zone for quite some time.
In this environment, however, we will not adopt aggressive positioning in any direction but likely will maintain
overweighted positions in commercial mortgage-backed, mortgage-backed and asset-backed securities. The Fund will remain neutral to moderately underweighted in corporate securities with a neutral to modestly long duration to guard against any possible economic downturn. With corporate spreads still fairly tight, the Fund will likely maintain a neutral to modestly underweighted position in the BBB-rated sector of the corporate bond universe.
| | | Portfolio Facts | |
| | | As of October 31, 2005 | |
| | | A Share | | B Share | Institutional Share |
| | | ------------------ | ------------------ | ------------------ |
| Ticker | | LUBIX | | LUIBX | LBIIX |
| Transfer Agent ID | | 55 | | 355 | 455 |
| Net Assets | | $532,323,768 | | $19,166,943 | $46,685,287 |
| NAV | | $8.56 | | $8.54 | $8.55 |
| NAV -- High† | | 2/9/2005 -- $8.91 | | 2/9/2005 -- $8.89 | 2/9/2005 -- $8.90 |
| NAV -- Low† | | 10/31/2005 -- $8.56 | | 10/31/2005 -- $8.54 | 10/31/2005 -- $8.55 |
| Number of Holdings: 209 | † For the year ended October 31, 2005 |
| Average Annual Total Returns2 |
| As of October 31, 2005 | |
| |
| Class A1 | 1-Year | 5 Years | 10 Years |
|
| without sales charge | 0.82% | 5.69% | 5.45% |
| with sales charge | (3.74%) | 4.71% | 4.97% |
| |
| | | | From |
| | | | Inception |
| Class B1 | 1-Year | 5 Years | 10/31/1997 |
|
| without sales charge | (0.02%) | 4.89% | 4.73% |
| with sales charge | (3.89%) | 4.89% | 4.73% |
| |
| | | | From |
| | | | Inception |
| Institutional Class1 | 1-Year | 5 Years | 10/31/1997 |
|
| total return | 1.22% | 6.04% | 5.56% |
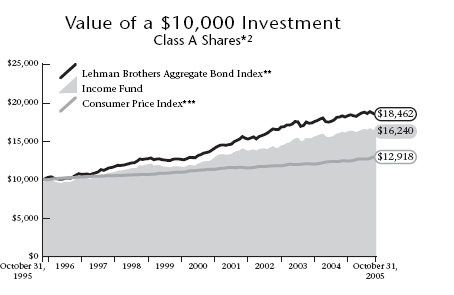
1 Class A performance has been restated to reflect the maximum sales charge of 4.5% . Class B performance reflects the maximum contingent deferred sales charge (CDSC) of 5%, declining 1% each year during the first five years and then converting to Class A shares after the fifth year. Institutional Class shares have no sales load and are for institutional shareholders only.
2 Past performance is not an indication of future results. Annualized total returns represent past performance and reflect changes in share prices, the reinvestment of all dividends and capital gains, and the effects of compounding.
Investing in a mutual fund involves risks, including the possible loss of principal. The prospectus contains more complete information on the investment objectives, risks, charges and expenses of the investment company which investors should read and consider carefully before investing. To obtain a prospectus, contact a registered representative or visit www.thrivent.com. At various times, the Fund’s adviser waived its management fee and/or reimbursed Fund expenses. Had the adviser not done so, the Fund’s total returns would have been lower. The returns shown do not reflect taxes a shareholder would pay on distributions or redemptions. Please read your prospectus carefully.
* As you compare performance, please note that the Fund’s performance reflects the maximum 4.5% sales charge, while the Lehman Brothers Aggregate Bond Index and the Consumer Price Index do not reflect any such charges. If you were to purchase any of the above individual stocks or funds represented in these Indexes, any charges you would pay would reduce your total return as well.
** The Lehman Brothers Aggregate Bond Index is an index that measures the performance of U.S. investment grade bonds. It is not possible to invest directly in the Index. The performance of the Index does not reflect deductions for fees, expenses or taxes.
*** The Consumer Price Index is an inflationary indicator that measures the change in the cost of a fixed basket of products and services, including housing, electricity, food and transportation. It is not possible to invest directly in the Index.
43

How did the Fund perform during the one-year period ended Oct. 31, 2005?
Thrivent Core Bond Fund produced a 0.31% return while its Lipper Inc. Intermediate Investment Grade Debt Funds peer group produced a 0.81% median return. During the same period, its market benchmark, the Lehman Brothers Aggregate Bond Index, delivered a 1.13% return.
What market conditions were present during the period?
The Federal Reserve Board’s continued monetary policy tightening and a dramatic flattening of the yield curve set the backdrop for a 12-month period of modest returns in the bond market. Hurricane Katrina and increased demand from developing economies also contributed to a precipitous rise in oil prices during the period.
Despite the rising cost of energy, gross domestic product growth remained strong. In fact, GDP growth has topped 3 percent for 10 straight quarters -- the longest consecutive streak since the 1980s. Fueling this growth, in large part, has been the strong housing market, which has led to job creation and consumer access to home-equity capital.
What factors affected the Fund’s performance?
The Fund’s performance was adversely affected by an overweighted stance in industrial BBB corporate bonds, which struggled amid auto-sector troubles during the period. The Fund’s overweighted position in commercial mortgage-backed securities, which modestly underperformed because of uncertainty in the real estate sector, also hurt its performance relative to its peers.
The Fund earned strong returns from its overweighted position in asset-backed and mortgage-backed securities, which both performed exceptionally well during the period. Because of a dramatic yield-curve flattening, the Fund ben-efited modestly from a barbelled maturity structure. This configuration calls for a heavier weighting of securities at the extreme ends of the yield curve and an underweighting of holdings in intermediate-maturity securities.
What is your outlook?
We will continue to monitor the effect of high energy prices and the continued Federal Reserve Board rate tightening on economic activity. Overall, however, we believe the economy will continue to grow at a moderate pace while inflation remains in check.
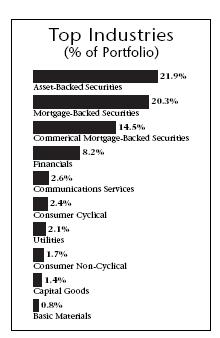

| Top 10 Holdings | |
| (% of Portfolio) | |
| |
| Federal National Mortgage Association | |
| Conventional 30-Yr. Pass Through | 8.5% |
| Federal National Mortgage Association | |
| Conventional 30-Yr. Pass Through | 6.8% |
| Federal National Mortgage Association | |
| Conventional 15-Yr. Pass Through | 5.0% |
| U.S. Treasury Notes | 2.3% |
| U.S. Treasury Notes | 2.2% |
| U.S. Treasury Bonds | 1.9% |
| GMAC Mortgage Corporation Loan Trust | 1.6% |
| LB-UBS Commercial Mortgage Trust | 1.1% |
| Chase Credit Card Master Trust | 1.1% |
| Countrywide Asset-Backed Certificates | 0.9% |
| |
| These long term fixed income securities represent 31.4% |
| of the total investment portfolio. | |
Quoted Fund performance is for Class A shares and does not reflect a sales charge.
The returns shown do not reflect taxes a shareholder would pay on distributions or redemptions.
Quoted Moody’s Bond Quality Ratings Distributions and Top 10 Holdings are subject to change.
The list of Top 10 Holdings excludes short term investments and collateral held for securities loaned.
44
Some of our optimism stems from what is known as the core consumer price index (CPI) number. Unlike the “headline” CPI figure, which is most often reported, the core CPI excludes both energy and food prices, which are highly volatile. This core CPI number has remained within the Fed’s comfort zone for quite some time.
In this environment, however, we will not adopt aggressive positioning in any direction but will likely maintain overweighted positions in commercial mortgage-backed, mortgage-backed and asset-backed securities. The Fund will remain neutral to moderately underweighted in corporate securities with a neutral to modestly long duration to guard against any possible economic downturn. With corporate spreads still fairly tight, the Fund likely will maintain a neutral to modestly underweighted position in BBB-rated bonds within the corporate sector.
| | | Portfolio Facts | |
| | | As of October 31, 2005 | |
| | | A Share | | B Share | Institutional Share |
| | | ------------------ | ------------------ | ------------------ |
| Ticker | | AAINX | | BBFBX | IIINX |
| Transfer Agent ID | | 016 | | 066 | 089 |
| Net Assets | | $421,204,680 | | $10,798,365 | $52,927,000 |
| NAV | | $9.89 | | $9.90 | $9.90 |
| NAV -- High† | | 2/9/2005 -- $10.28 | | 2/9/2005 -- $10.28 | 2/9/2005 -- $10.28 |
| NAV -- Low† | | 10/31/2005 -- $9.89 | | 10/26/2005 -- $9.89 | 10/26/2005 -- $9.89 |
| Number of Holdings: 151 | † For the year ended October 31, 2005 |
| Average Annual Total Returns2 |
| As of October 31, 2005 | |
| |
| Class A1 | 1-Year | 5 Years | 10 Years |
|
| without sales charge | 0.31% | 5.79% | 5.40% |
| with sales charge | (4.17%) | 4.81% | 4.92% |
| |
| | | | From |
| | | | Inception |
| Class B1 | 1-Year | 5 Years | 1/8/1997 |
|
| without sales charge | (0.58%) | 4.79% | 5.03% |
| with sales charge | (4.44%) | 4.79% | 5.03% |
| |
| | | | From |
| | | | Inception |
| Institutional Class1 | 1-Year | 5 Years | 12/29/1997 |
|
| total return | 0.84% | 6.21% | 5.53% |

1 Class A performance has been restated to reflect the maximum sales charge of 4.5% . Class B performance reflects the maximum contingent deferred sales charge (CDSC) of 5%, declining 1% each year during the first five years and then converting to Class A shares after the fifth year. Institutional Class shares have no sales load and are for institutional shareholders only.
2 Past performance is not an indication of future results. Annualized total returns represent past performance and reflect changes in share prices, the reinvestment of all dividends and capital gains, and the effects of compounding.
Investing in a mutual fund involves risks, including the possible loss of principal. The prospectus contains more complete information on the investment objectives, risks, charges and expenses of the investment company which investors should read and consider carefully before investing. To obtain a prospectus, contact a registered representative or visit www.thrivent.com. At various times, the Fund’s adviser waived its management fee and/or reimbursed Fund expenses. Had the adviser not done so, the Fund’s total returns would have been lower. The returns shown do not reflect taxes a shareholder would pay on distributions or redemptions. Please read your prospectus carefully.
* As you compare performance, please note that the Fund’s performance reflects the maximum 4.5% sales charge, while the Lehman Brothers Aggregate Bond Index and the Consumer Price Index do not reflect any such charges. If you were to purchase any of the above individual stocks or funds represented in these Indexes, any charges you would pay would reduce your total return as well.
** The Lehman Brothers Aggregate Bond Index is an index that measures the performance of U.S. investment grade bonds. It is not possible to invest directly in the Index. The performance of the Index does not reflect deductions for fees, expenses or taxes.
*** The Consumer Price Index is an inflationary indicator that measures the change in the cost of a fixed basket of products and services, including housing, electricity, food and transportation. It is not possible to invest directly in the Index.
45
Thrivent Limited Maturity Bond Fund
Michael G. Landreville (left) and Gregory R. Anderson (right), Portfolio Co-Managers
The Thrivent Limited Maturity Bond Fund seeks a high level of current income with stability of principal by investing primarily in high-quality intermediate and shorter-term-bonds.
How did the Fund perform during the one-year period ended Oct. 31, 2005?
Thrivent Limited Maturity Bond Fund produced a 0.89% return-matching the 0.89% median return of its Lipper Inc. Short Investment Grade Debt Funds peer group. During the same period, the Fund’s market benchmark, the Lehman Government/Credit 1-3 Year Index, realized a 0.80% return.
What market conditions were present during the period?
The Federal Reserve Board’s continued monetary policy tightening and a dramatic flattening of the yield curve set the backdrop for a 12-month period of modest returns in the bond market. Hurricane Katrina and increased demand from developing economies also contributed to a precipitous rise in oil prices during the period.
Despite the rising cost of energy, gross domestic product growth remained strong. In fact, GDP growth has topped 3 percent for 10 straight quarters -- the longest consecutive streak since the 1980s. Fueling this growth, in large part, has been the strong housing market, which has led to job creation and consumer access to home-equity capital.
What factors affected the Fund’s performance?
Because of a dramatic yield-curve flattening, perhaps the most important strategy for success during the period was a barbelled maturity configuration. Thrivent Limited Maturity Bond Fund benefited modestly from such a structure, which calls for a heavier weighting of securities at the extreme ends of the yield curve and an underweighting of holdings in intermediate-maturity securities. In addition, the Fund also earned strong returns from its overweighted position in asset-backed and mortgage-backed securities, which both performed exceptionally well during the period.
The Fund’s performance was adversely affected by an underweighted stance in foreign government bonds, which posted outstanding returns for the period. Auto-sector troubles, among other challenges, hurt the performance of industrial BBB corporate bonds during the period. The Fund’s overweighted position in this sector, as well as in commercial mortgage-backed securities, also diminished its returns versus its peers.
What is your outlook?
We will continue to monitor the effect of high energy prices and the continued Federal Reserve Board rate tightening on
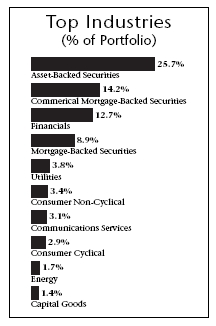
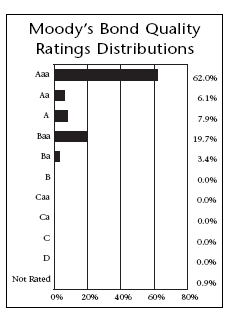
| Top 10 Holdings | |
| (% of Portfolio) | |
| |
| Federal National Mortgage Association | |
| Conventional 30-Yr. Pass Through | 4.6% |
| Federal National Mortgage Association | |
| Conventional 15-Yr. Pass Through | 4.3% |
| U.S. Treasury Notes | 1.7% |
| Federal Home Loan Bank | 1.5% |
| U.S. Treasury Notes | 1.0% |
| Washington Mutual Mortgage | |
| Pass-Through Certificates | 1.0% |
| Residential Accredit Loans, Inc. | 1.0% |
| Countrywide Asset-Backed Certificates | 1.0% |
| Bear Stearns Adjustable Rate Mortgage Trust | 1.0% |
| CPS Auto Trust | 1.0% |
| |
| These long term fixed income securities represent 18.1% |
| of the total investment portfolio. | |
Quoted Fund performance is for Class A shares.
The returns shown do not reflect taxes a shareholder would pay on distributions or redemptions.
Quoted Moody’s Bond Quality Ratings Distributions and Top 10 Holdings are subject to change.
The list of Top 10 Holdings excludes short term investments and collateral held for securities loaned.
46
economic activity. Overall, however, we believe the economy will continue to grow at a moderate pace while inflation remains in check.
Some of our optimism stems from what is known as the core consumer price index (CPI) number. Unlike the “headline” CPI figure, which is most often reported, the core CPI excludes both energy and food prices, which have high volatility. This core CPI number has remained within the Fed’s comfort zone for quite some time.
In this environment, however, we will not adopt aggressive positioning in any direction but likely will maintain overweighted positions in commercial mortgage-backed, mortgage-backed and asset-backed securities. The Fund will remain neutral to moderately underweighted in corporate securities with a neutral to modestly long duration to guard against any possible economic downturn. With corporate spreads still fairly tight, the Fund will likely maintain a neutral to modestly underweighted position in the BBB-rated sector of the corporate bond universes.
| | | Portfolio Facts | |
| | | As of October 31, 2005 | |
| | | A Share | | B Share | Institutional Share |
| | | ------------------ | | ------------------ | ------------------ |
| Ticker | | LBLAX | | TLMBX | THLIX |
| Transfer Agent ID | 76 | | 376 | 476 |
| Net Assets | | $131,333,379 | | $2,024,356 | $37,390,081 |
| NAV | | $12.58 | | $12.59 | $12.58 |
| NAV -- High† | | 11/4/2004 -- $12.91 | | 11/4/2004 -- $12.92 | 11/3/2004 -- $12.91 |
| NAV -- Low† | | 10/31/2005 -- $12.58 | | 10/31/2005 -- $12.59 | 10/31/2005 -- $12.58 |
| Number of Holdings: 186 | † For the year ended October 31, 2005 |
| Average Annual Total Returns2 |
| As of October 31, 2005 | |
| |
| | | | From |
| | | | Inception |
| Class A1 | 1-Year | 5 Years | 10/29/1999 |
|
| total return | 0.89% | 4.54% | 4.64% |
| |
| | | | From |
| | | | Inception |
| Class B1 | 1-Year | 5 Years | 10/29/1999 |
|
| total return | 0.87% | 4.49% | 4.60% |
| |
| | | | From |
| | | | Inception |
| Institutional Class1 | 1-Year | 5 Years | 10/29/1999 |
|
| total return | 1.36% | 4.89% | 4.97% |
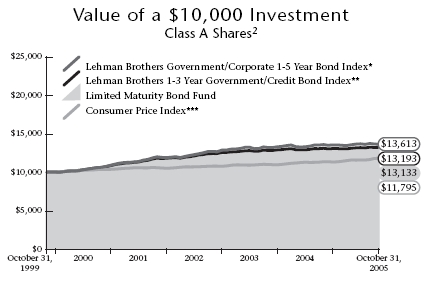
1 Class A, Class B, and Institutional Class shares have no sales loads.
2 Past performance is not an indication of future results. Annualized total returns represent past performance and reflect changes in share prices, the reinvestment of all dividends and capital gains, and the effects of compounding.
Investing in a mutual fund involves risks, including the possible loss of principal. The prospectus contains more complete information on the investment objectives, risks, charges and expenses of the investment company which investors should read and consider carefully before investing. To obtain a prospectus, contact a registered representative or visit www.thrivent.com. At various times, the Fund’s adviser waived its management fee and/or reimbursed Fund expenses. Had the adviser not done so, the Fund’s total returns would have been lower. The returns shown do not reflect taxes a shareholder would pay on distributions or redemptions. Please read your prospectus carefully.
* The Lehman Brothers Government/Corporate 1-5 Year Bond Index is an index which measures the performance of corporate and government U.S. bonds with maturities of one to five years. It is not possible to invest directly in the Index. The performance of the Index does not reflect deductions for fees, expenses or taxes.
** The Lehman Brothers 1-3 Year Government/Credit Bond Index is an unmanaged market value weighted performance benchmark for government and corporate fixed-rate debt issues with maturities between one and three years. It is not possible to invest directly in the Index. The performance of the Index does not reflect deductions for fees, expenses or taxes. The composition of the Lehman Brothers 1-3 Year Government/Credit Bond Index serves as a better reflection of the Portfolio’s current strategy than does the Lehman Brothers 1-5 Year Government/Credit Bond Index.
*** The Consumer Price Index is an inflationary indicator that measures the change in the cost of a fixed basket of products and services, including housing, electricity, food and transportation. It is not possible to invest directly in the Index.
47
Thrivent Money Market Fund

William D. Stouten, Portfolio Manager
The Thrivent Money Market Fund seeks a high level of current income while maintaining liquidity and a constant net asset value of $1.00 per share, by investing in a diversified portfolio of high quality, short-term money market instruments.*
How did the Fund perform during the one-year period ended Oct. 31, 2005?
We are pleased with the performance of Thrivent Money Market Fund, which produced a 2.12% return during the period. By comparison, the Fund’s peer group as represented by the Lipper Money Market Funds Category reported a median net return of 2.12% over the same time frame.
What conditions were present during the period?
Without a doubt, Hurricane Katrina was the most significant event. While the storm devastated wealth in the region, there was little economic reason for the Federal Reserve to pause in raising interest rates at a measured pace during the period. The economy remained healthy, with gross domestic product (GDP) growth of over 3%. And while the consumer price index (CPI), excluding food and energy, remained relatively stable, the gross CPI revealed rising infla-tion pressures. Economists generally predicted that the effects of Katrina would likely add to inflation, and rebuilding and investment would add to GDP. Therefore, it wasn’t surprising that the Fed continued to raise interest rates at .25% increments during the period, as it has since this tightening cycle began in June of 2004. On September 20 the Fed raised its target for the federal funds rate to 3.75%, up from 2.75% at the start of the period. Yields of money market funds reached their highest levels since 2001, and those yields began attracting assets for the first time in years.
What factors affected the Fund’s performance?
While many factors helped the Fund’s performance during the period, the most significant one was proper structuring of the portfolio to best capitalize on changes in short-term interest rates. Since market expectations generally trailed actual adjustments to the federal funds rate during the period, portfolios with floating rate securities and short-duration assets performed better. We maintained a slightly lower weighted-average maturity than our peer group. We also maintained a high exposure to floating rate securities, and kept our fixed-rate investments primarily to time periods of 90 days or less.
Detracting from performance was our primary objectives of safety and liquidity. While there is generally some sacrifice in yield for increased safety and liquidity, it remains a small cost compared with the benefits of providing a conservative fund that meets investors’ objectives of safety and liquidity in all types of market conditions.
What is your outlook?
The year ahead will include many interesting transitions for bond holders, including replacement of Alan Greenspan as head of the Federal Reserve and the transition to a more stable federal funds rate. Inflation overall will likely increase slowly in the short term, due to Gulf Coast rebuilding and higher energy costs. That will allow to the Fed to continue its
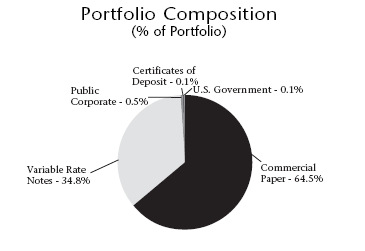
*To the extent practicable, the Fund intends to maintain a stable net asset value of $1.00 per share. An investment in Thrivent Money Market Fund is not insured or guaranteed by the FDIC or any other government agency. Although the Fund seeks to preserve the value of your investment at $1.00 per share, it is possible to lose money by investing in the Fund.
Quoted Fund performance is for Class A shares.
The returns shown do not reflect taxes a shareholder would pay on distributions or redemptions.
Quoted Portfolio Composition is subject to change.
48
measured interest rate hikes, which we expect will cease in the first calendar quarter of 2006 at a fed funds rate near 4.5% . In December of 2005 and throughout the first calendar quarter of 2006, we will gradually ladder in longer-dated securities for the
Fund, which will extend the portfolio’s average-weighted maturity. As in all interest rate environments, we will continue to maximize the safety and liquidity of the Fund while pursuing a competitive yield.
| | Portfolio Facts | |
| | As of October 31, 2005 | |
| | A Share | B Share | Institutional Share |
| | ------------------ | ------------------ | ------------------ |
| Ticker | AMMXX | TMBXX | AALXX |
| Transfer Agent ID | 018 | 068 | 091 |
| Net Assets | $661,318,948 | $1,747,877 | $283,124,801 |
| NAV | $1.00 | $1.00 | $1.00 |
| Number of Holdings: 89 | | |
| Average Annual Total Returns2 |
| As of October 31, 2005 | | |
| |
| Class A1 | 1-Year | 5 Years | | 10 Years |
|
| total return | 2.12% | 1.69% | | 3.39% |
| |
| | | | | From |
| | | | | Inception |
| Class B1 | 1-Year | 5 Years | | 1/8/1997 |
|
| without sales charge | 1.94% | 1.21% | | 2.60% |
| with sales charge | (2.06%) | 1.21% | | 2.60% |
| |
| | | | | From |
| | | | | Inception |
| Institutional Class1 | 1-Year | 5 Years | | 12/29/1997 |
|
| total return | 2.56% | 2.02% | | 3.22% |
| | Yields | | | |
| | As of October 31, 2005** | | |
| |
| | Class A | Class B | | Institutional |
|
| 7-Day | 3.26% | 2.95% | | 3.58% |
| 7-Day Effective | 3.32% | 3.00% | | 3.65% |
1 Class B performance reflects the maximum contingent deferred sales charge (CDSC) of 5%, declining 1% each year during the first five years and then converting to Class A shares after the fifth year. Class A shares have no sales load. Institutional Class shares have no sales load and are for institutional shareholders only.
2 Past performance is not an indication of future results. Annualized total returns represent past performance and reflect changes in share prices, the reinvestment of all dividends and capital gains, and the effects of compounding.
Investing in a mutual fund involves risks, including the possible loss of principal. The prospectus contains more complete information on the investment objectives, risks, charges and expenses of the investment company which investors should read and consider carefully before investing. To obtain a prospectus, contact a registered representative or visit www.thrivent.com. At various times, the Fund’s adviser waived its management fee and/or reimbursed Fund expenses. Had the adviser not done so, the Fund’s total returns would have been lower. The returns shown do not reflect taxes a shareholder would pay on distributions or redemptions. Please read your prospectus carefully.
** Seven-day yields of The Thrivent Money Market Fund refer to the income generated by an investment in the Fund over a specified seven-day period. Effective yields reflect the reinvestment of income. Yields are subject to daily fluctuation and should not be considered an indication of future results.
49
New Funds
Thrivent Mutual Funds introduced seven new Funds on June 30, 2005. Thrivent Real Estate Securities Fund is presented under a separate shareholder report with a fiscal year ended December 31, 2005. Management Discussion of Fund Performance is not included for these Funds since they have been in operation for less then six months. The tables below summarize the portfolio composition of the Fund.
| Aggressive Allocation Fund | | Moderately Aggressive Allocation Fund |
| |
| Equity Funds | 92.0% | Equity Funds | 78.2% |
| Real Estate Securities Fund | 4.0% | Debt Funds | 14.9% |
| Debt Funds | 2.0% | Real Estate Securities Fund | 3.9% |
| Money Market Fund | 2.0% | Money Market Fund | 3.0% |
| |
| |
| |
| Moderate Allocation Fund | | Moderately Conservative Allocation Fund |
| |
| Equity Funds | 65.1% | Equity Funds | 45.1% |
| Debt Funds | 25.0% | Debt Funds | 41.9% |
| Money Market Fund | 5.0% | Money Market Fund | 10.0% |
| Real Estate Securities Fund | 4.9% | Real Estate Securities Fund | 3.0% |
| |
| |
| |
| Partner Small Cap Growth Fund | | Partner Mid Cap Value Fund | |
| |
| Common Stock | 80.7% | Common Stock | 87.9% |
| Collateral Held for Securities Loaned | 15.1% | Short Term Investments | 6.5% |
| Short Term Investments | 4.2% | Collateral Held for Securities Loaned | 5.6% |
50
Shareholder Expense Example
(Unaudited)
As a shareholder of the Fund, you incur two types of costs: (1) transaction costs, including sales charges (loads) on purchase payments, reinvested dividends, or other distributions; redemption fees; and exchange fees; and (2) ongoing costs, including management fees; distribution (12b-1) fees and other Fund expenses. This Example is intended to help you understand your ongoing costs (in dollars) of investing in the Fund and to compare these costs with the ongoing costs of investing in other mutual funds. The Example is based on an investment of $1,000 invested at the beginning of the period and held for the entire period from May 1, 2005 through October 31, 2005.
Actual Expenses
The first line of the table below provides information about actual account values and actual expenses. You may use the information in this line, together with the amount you invested, to estimate the expenses that you paid over the period. Simply divide your account value by $1,000 (for example, an $8,600 account value divided by $1,000 = 8.6), then multiply the result by the number in the first line under the heading entitled “Expenses Paid During Period” to estimate the expenses you paid. A small account fee of $12 is charged to Class A and Class B shareholder accounts if the value falls below stated account minimums ( $2,500 for Thrivent Limited Maturity Bond Fund, $1,500 for Thrivent Money Market Fund and $1,000 for all other Funds.) This fee is not included in the table below. If it were, the expenses you paid during the period would have been higher and the ending account value would have been lower.
Hypothetical Example for Comparison Purposes
The second line of the table below provides information about hypothetical account values and hypothetical expenses based on the Fund’s actual expense ratio and an assumed rate of return of 5% per year before expenses, which is not the Fund’s actual return. The hypothetical account values and expenses may not be used to estimate the actual ending account balance or expenses you paid for the period. You may use this information to compare the ongoing costs of investing in the Fund and other funds. To do so, compare this 5% hypothetical example with the 5% hypothetical examples that appear in the shareholder reports of the other funds. A small account fee of $12 is charged to Class A and Class B shareholder accounts if the value falls below stated account minimums ($2,500 for Thrivent Limited Maturity Bond Fund, $1,500 for Thrivent Money Market Fund and $1,000 for all other Funds.) This fee is not included in the table below. If it were, the expenses you paid during the period would have been higher and the ending account value would have been lower.
Please note that the expenses shown in the table are meant to highlight your ongoing costs only and do not reflect any transactional costs, such as sales charges (loads), redemption fees, or exchange fees. Therefore, the second line of the table is useful in comparing ongoing costs only, and will not help you determine the relative total costs of owning different funds. In addition, if these transactional costs were included, your costs would have been higher.
| | | Beginning | Ending | Expenses | |
| | | Account | Account | Paid During | Annualized |
| | | Value | Value | Period * | Expense |
| | | 5/1/05 | 10/31/05 | 5/1/2005 -- 10/31/2005 | Ratio |
|
| Thrivent Technology Fund | | | | | |
| Actual | | | | | |
| Class A | | $1,000 | $1,115 | $7.46 | 1.40% |
| Class B | | $1,000 | $1,113 | $10.17 | 1.91% |
| Institutional Class | | $1,000 | $1,120 | $5.02 | 0.94% |
| Hypothetical ** | | | | | |
| Class A | | $1,000 | $1,018 | $7.12 | 1.40% |
| Class B | | $1,000 | $1,016 | $9.70 | 1.91% |
| Institutional Class | | $1,000 | $1,020 | $4.79 | 0.94% |
| |
| Thrivent Partner Small Cap Value Fund | | | |
| Actual | | | | | |
| Class A | | $1,000 | $1,119 | $5.34 | 1.00% |
| Class B | | $1,000 | $1,114 | $10.44 | 1.96% |
| Institutional Class | | $1,000 | $1,123 | $1.77 | 0.33% |
| Hypothetical ** | | | | | |
| Class A | | $1,000 | $1,020 | $5.09 | 1.00% |
| Class B | | $1,000 | $1,015 | $9.96 | 1.96% |
| Institutional Class | | $1,000 | $1,024 | $1.68 | 0.33% |
51
| | Beginning | Ending | Expenses | |
| | Account | Account | Paid During | Annualized |
| | Value | Value | Period * | Expense |
| | 5/1/05 | 10/31/05 | 5/1/2005 -- 10/31/2005 | Ratio |
|
| Thrivent Small Cap Stock Fund | | | | |
| Actual | | | | |
| Class A | $1,000 | $1,112 | $6.76 | 1.27% |
| Class B | $1,000 | $1,107 | $12.16 | 2.29% |
| Institutional Class | $1,000 | $1,115 | $3.84 | 0.72% |
| Hypothetical ** | | | | |
| Class A | $1,000 | $1,019 | $6.46 | 1.27% |
| Class B | $1,000 | $1,014 | $11.62 | 2.29% |
| Institutional Class | $1,000 | $1,022 | $3.67 | 0.72% |
| |
| Thrivent Small Cap Index Fund | | | | |
| Actual | | | | |
| Class A | $1,000 | $1,119 | $5.07 | 0.95% |
| Hypothetical ** | | | | |
| Class A | $1,000 | $1,020 | $4.84 | 0.95% |
| |
| Thrivent Mid Cap Growth Fund | | | | |
| Actual | | | | |
| Class A | $1,000 | $1,127 | $6.27 | 1.17% |
| Class B | $1,000 | $1,121 | $12.40 | 2.32% |
| Institutional Class | $1,000 | $1,131 | $2.58 | 0.48% |
| Hypothetical ** | | | | |
| Class A | $1,000 | $1,019 | $5.96 | 1.17% |
| Class B | $1,000 | $1,014 | $11.77 | 2.32% |
| Institutional Class | $1,000 | $1,023 | $2.45 | 0.48% |
| |
| Thrivent Mid Cap Stock Fund | | | | |
| Actual | | | | |
| Class A | $1,000 | $1,148 | $6.33 | 1.17% |
| Class B | $1,000 | $1,142 | $12.20 | 2.26% |
| Institutional Class | $1,000 | $1,151 | $3.79 | 0.70% |
| Hypothetical ** | | | | |
| Class A | $1,000 | $1,019 | $5.96 | 1.17% |
| Class B | $1,000 | $1,014 | $11.47 | 2.26% |
| Institutional Class | $1,000 | $1,022 | $3.57 | 0.70% |
| |
| Thrivent Mid Cap Index Fund | | | | |
| Actual | | | | |
| Class A | $1,000 | $1,110 | $4.79 | 0.90% |
| Hypothetical ** | | | | |
| Class A | $1,000 | $1,021 | $4.58 | 0.90% |
| |
| Thrivent Mid Cap Index Fund-I | | | | |
| Actual | | | | |
| Institutional Class | $1,000 | $1,112 | $3.25 | 0.61% |
| Hypothetical ** | | | | |
| Institutional Class | $1,000 | $1,022 | $3.11 | 0.61% |
| |
| Thrivent Partner International Stock Fund | | | |
| Actual | | | | |
| Class A | $1,000 | $1,087 | $7.42 | 1.41% |
| Class B | $1,000 | $1,081 | $13.32 | 2.54% |
| Institutional Class | $1,000 | $1,091 | $4.01 | 0.76% |
| Hypothetical ** | | | | |
| Class A | $1,000 | $1,018 | $7.17 | 1.41% |
| Class B | $1,000 | $1,012 | $12.88 | 2.54% |
| Institutional Class | $1,000 | $1,021 | $3.87 | 0.76% |
52
| | Beginning | Ending | Expenses | |
| | Account | Account | Paid During | Annualized |
| | Value | Value | Period * | Expense |
| | 5/1/05 | 10/31/05 | 5/1/2005 -- 10/31/2005 | Ratio |
|
| Thrivent Large Cap Growth Fund | | | | |
| Actual | | | | |
| Class A | $1,000 | $1,096 | $4.23 | 0.80% |
| Class B | $1,000 | $1,092 | $10.18 | 1.93% |
| Institutional Class | $1,000 | $1,099 | $0.32 | 0.06% |
| Hypothetical ** | | | | |
| Class A | $1,000 | $1,021 | $4.08 | 0.80% |
| Class B | $1,000 | $1,015 | $9.80 | 1.93% |
| Institutional Class | $1,000 | $1,025 | $0.31 | 0.06% |
| |
| Thrivent Large Cap Value Fund | | | | |
| Actual | | | | |
| Class A | $1,000 | $1,047 | $5.21 | 1.01% |
| Class B | $1,000 | $1,040 | $11.42 | 2.22% |
| Institutional Class | $1,000 | $1,050 | $2.63 | 0.51% |
| Hypothetical ** | | | | |
| Class A | $1,000 | $1,020 | $5.14 | 1.01% |
| Class B | $1,000 | $1,014 | $11.27 | 2.22% |
| Institutional Class | $1,000 | $1,023 | $2.60 | 0.51% |
| |
| Thrivent Large Cap Stock Fund | | | | |
| Actual | | | | |
| Class A | $1,000 | $1,059 | $5.14 | 0.99% |
| Class B | $1,000 | $1,054 | $9.84 | 1.90% |
| Institutional Class | $1,000 | $1,061 | $2.91 | 0.56% |
| Hypothetical ** | | | | |
| Class A | $1,000 | $1,020 | $5.04 | 0.99% |
| Class B | $1,000 | $1,016 | $9.65 | 1.90% |
| Institutional Class | $1,000 | $1,022 | $2.85 | 0.56% |
| |
| Thrivent Large Cap Index Fund | | | | |
| Actual | | | | |
| Class A | $1,000 | $1,050 | $3.10 | 0.60% |
| Hypothetical ** | | | | |
| Class A | $1,000 | $1,022 | $3.06 | 0.60% |
| |
| Thrivent Large Cap Index Fund-I | | | | |
| Actual | | | | |
| Institutional Class | $1,000 | $1,051 | $2.38 | 0.46% |
| Hypothetical ** | | | | |
| Institutional Class | $1,000 | $1,023 | $2.35 | 0.46% |
| |
| Thrivent Balanced Fund | | | | |
| Actual | | | | |
| Class A | $1,000 | $1,059 | $5.45 | 1.05% |
| Class B | $1,000 | $1,054 | $10.46 | 2.02% |
| Institutional Class | $1,000 | $1,062 | $3.07 | 0.59% |
| Hypothetical ** | | | | |
| Class A | $1,000 | $1,020 | $5.35 | 1.05% |
| Class B | $1,000 | $1,015 | $10.26 | 2.02% |
| Institutional Class | $1,000 | $1,022 | $3.01 | 0.59% |
| |
| Thrivent High Yield Fund | | | | |
| Actual | | | | |
| Class A | $1,000 | $1,037 | $4.42 | 0.86% |
| Class B | $1,000 | $1,030 | $8.90 | 1.74% |
| Institutional Class | $1,000 | $1,039 | $2.36 | 0.46% |
| Hypothetical ** | | | | |
| Class A | $1,000 | $1,021 | $4.38 | 0.86% |
| Class B | $1,000 | $1,016 | $8.84 | 1.74% |
| Institutional Class | $1,000 | $1,023 | $2.35 | 0.46% |
53
| | Beginning | Ending | Expenses | |
| | Account | Account | Paid During | Annualized |
| | Value | Value | Period * | Expense |
| | 5/1/05 | 10/31/05 | 5/1/2005 -- 10/31/2005 | Ratio |
|
| Thrivent High Yield Fund II | | | | |
| Actual | | | | |
| Class A | $1,000 | $1,034 | $4.82 | 0.94% |
| Class B | $1,000 | $1,029 | $9.92 | 1.94% |
| Institutional Class | $1,000 | $1,037 | $2.52 | 0.49% |
| Hypothetical ** | | | | |
| Class A | $1,000 | $1,020 | $4.79 | 0.94% |
| Class B | $1,000 | $1,015 | $9.86 | 1.94% |
| Institutional Class | $1,000 | $1,023 | $2.50 | 0.49% |
| |
| Thrivent Municipal Bond Fund | | | | |
| Actual | | | | |
| Class A | $1,000 | $1,004 | $3.94 | 0.78% |
| Class B | $1,000 | $1,001 | $7.46 | 1.48% |
| Institutional Class | $1,000 | $1,007 | $2.43 | 0.48% |
| Hypothetical ** | | | | |
| Class A | $1,000 | $1,021 | $3.97 | 0.78% |
| Class B | $1,000 | $1,018 | $7.53 | 1.48% |
| Institutional Class | $1,000 | $1,023 | $2.45 | 0.48% |
| |
| Thrivent Income Fund | | | | |
| Actual | | | | |
| Class A | $1,000 | $1,002 | $3.99 | 0.79% |
| Class B | $1,000 | $998 | $8.26 | 1.64% |
| Institutional Class | $1,000 | $1,004 | $2.02 | 0.40% |
| Hypothetical ** | | | | |
| Class A | $1,000 | $1,021 | $4.02 | 0.79% |
| Class B | $1,000 | $1,017 | $8.34 | 1.64% |
| Institutional Class | $1,000 | $1,023 | $2.04 | 0.40% |
| |
| Thrivent Core Bond Fund | | | | |
| Actual | | | | |
| Class A | $1,000 | $999 | $4.58 | 0.91% |
| Class B | $1,000 | $994 | $9.65 | 1.92% |
| Institutional Class | $1,000 | $1,002 | $2.47 | 0.49% |
| Hypothetical ** | | | | |
| Class A | $1,000 | $1,021 | $4.63 | 0.91% |
| Class B | $1,000 | $1,016 | $9.75 | 1.92% |
| Institutional Class | $1,000 | $1,023 | $2.50 | 0.49% |
| |
| Thrivent Limited Maturity Bond Fund | | | |
| Actual | | | | |
| Class A | $1,000 | $1,009 | $4.30 | 0.85% |
| Class B | $1,000 | $1,007 | $4.60 | 0.91% |
| Institutional Class | $1,000 | $1,011 | $2.08 | 0.41% |
| Hypothetical ** | | | | |
| Class A | $1,000 | $1,021 | $4.33 | 0.85% |
| Class B | $1,000 | $1,021 | $4.63 | 0.91% |
| Institutional Class | $1,000 | $1,023 | $2.09 | 0.41% |
| |
| Thrivent Money Market Fund | | | | |
| Actual | | | | |
| Class A | $1,000 | $1,014 | $4.01 | 0.79% |
| Class B | $1,000 | $1,012 | $5.17 | 1.02% |
| Institutional Class | $1,000 | $1,016 | $1.98 | 0.39% |
| Hypothetical ** | | | | |
| Class A | $1,000 | $1,021 | $4.02 | 0.79% |
| Class B | $1,000 | $1,020 | $5.19 | 1.02% |
| Institutional Class | $1,000 | $1,023 | $1.99 | 0.39% |
54
| | Beginning | Ending | Expenses | |
| | Account | Account | Paid During | Annualized |
| | Value | Value | Period *** | Expense |
| | 6/30/05 | 10/31/05 | 6/30/2005 -- 10/31/2005 | Ratio |
|
| Thrivent Aggressive Allocation Fund | | | |
| Actual | | | | |
| Class A | $1,000 | $1,037 | $3.05 | 0.89% |
| Institutional Class | $1,000 | $1,039 | $0.34 | 0.10% |
| Hypothetical ** | | | | |
| Class A | $1,000 | $1,014 | $3.02 | 0.89% |
| Institutional Class | $1,000 | $1,017 | $0.34 | 0.10% |
| |
| Thrivent Moderately Aggressive Allocation Fund | | | |
| Actual | | | | |
| Class A | $1,000 | $1,031 | $1.51 | 0.44% |
| Institutional Class | $1,000 | $1,033 | $(0.14) | -0.04% |
| Hypothetical ** | | | | |
| Class A | $1,000 | $1,015 | $1.49 | 0.44% |
| Institutional Class | $1,000 | $1,017 | $(0.14) | -0.04% |
| |
| Thrivent Moderate Allocation Fund | | | |
| Actual | | | | |
| Class A | $1,000 | $1,024 | $0.92 | 0.27% |
| Institutional Class | $1,000 | $1,025 | $(0.44) | -0.13% |
| Hypothetical ** | | | | |
| Class A | $1,000 | $1,016 | $0.92 | 0.27% |
| Institutional Class | $1,000 | $1,017 | $(0.44) | -0.13% |
| |
| Thrivent Moderately Conservative Allocation Fund | | | |
| Actual | | | | |
| Class A | $1,000 | $1,015 | $1.15 | 0.34% |
| Institutional Class | $1,000 | $1,017 | $0.61 | 0.18% |
| Hypothetical ** | | | | |
| Class A | $1,000 | $1,016 | $1.15 | 0.34% |
| Institutional Class | $1,000 | $1,016 | $0.61 | 0.18% |
| |
| Thrivent Partner Small Cap Growth Fund | | | |
| Actual | | | | |
| Class A | $1,000 | $1,028 | $5.50 | 1.61% |
| Institutional Class | $1,000 | $1,028 | $4.75 | 1.39% |
| Hypothetical ** | | | | |
| Class A | $1,000 | $1,011 | $5.46 | 1.61% |
| Institutional Class | $1,000 | $1,012 | $4.71 | 1.39% |
| |
| Thrivent Partner Mid Cap Value Fund | | | |
| Actual | | | | |
| Class A | $1,000 | $1,013 | $5.46 | 1.61% |
| Institutional Class | $1,000 | $1,014 | $3.97 | 1.17% |
| Hypothetical ** | | | | |
| Class A | $1,000 | $1,011 | $5.46 | 1.61% |
| Institutional Class | $1,000 | $1,013 | $3.97 | 1.17% |
* Expenses are equal to the Fund’s annualized expense ratio, multiplied by the average account value over the period, multiplied by 184/365 to reflect the one-half year period.
** Assuming 5% total return before expenses
*** Expenses are equal to the Fund’s annualized expense ratio, multiplied by the average account value over the period, multiplied by 123/365 to reflect the period since inception.
55

Report of Independent Registered Public Accounting Firm
To the Shareholders and Trustees of
the Thrivent Mutual Funds:
|
In our opinion, the accompanying statements of assets and liabilities, including the schedules of investments, and the related statements of operations and of changes in net assets and the financial highlights present fairly, in all material respects, the financial position of the Thrivent Aggressive Allocation Fund, Moderately Aggressive Allocation Fund, Moderate Allocation Fund, Moderately Conservative Allocation Fund, Thrivent Technology Fund, Thrivent Partner Small Cap Growth Fund, Thrivent Partner Small Cap Value Fund, Thrivent Small Cap Stock Fund, Thrivent Small Cap Index Fund, Thrivent Mid Cap Growth Fund, Thrivent Partner Mid Cap Value Fund, Thrivent Mid Cap Stock Fund, Thrivent Mid Cap Index Fund, Thrivent Mid Cap Index Fund-I, Thrivent Partner International Stock Fund, Thrivent Large Cap Growth Fund, Thrivent Large Cap Value Fund, Thrivent Large Cap Stock Fund, Thrivent Large Cap Index Fund, Thrivent Large Cap Index Fund-I, Thrivent Balanced Fund, Thrivent High Yield Fund, Thrivent High Yield Fund II, Thrivent Municipal Bond Fund, Thrivent Income Fund, Thrivent Core Bond Fund, Thrivent Limited Maturity Bond Fund, and Thrivent Money Market Fund (the “Funds”) at October 31, 2005, the results of each of their operations, changes in each of their net assets and their financial highlights for each of the periods presented, in conformity with accounting principles generally accepted in the United States of America. These financial statements and financial highlights (hereafter referred to as “financial statements”) are the responsibility of the Funds’ management; our responsibility is to express an opinion on these financial statements based on our audits. We conducted our audits of these financial statements in accordance with the standards of the Public Company Accounting Oversight Board (United States). Those standards require that we plan and perform the audit to obtain reasonable assurance about whether the financial statements are free of material misstatement. An audit includes examining, on a test basis, evidence supporting the amounts and disclosures in the financial statements, assessing the accounting principles used and significant estimates made by management, and evaluating the overall financial statement presentation. We believe that our audits, which included confirmation of securities at October 31, 2005 by correspondence with the custodian and brokers, provide a reasonable basis for our opinion.

December 14, 2005
56
| | Aggressive Allocation Fund(a) | | |
| | Schedule of Investments as of October 31, 2005 | | |
| Shares | | Value | Percentage |
|
| Equity Funds (92.0%) | | |
| 113,526 | Thrivent Partner Small Cap Growth Fund | $1,167,043 | 4.0% |
| 80,116 | Thrivent Partner Small Cap Value Fund | 1,167,296 | 4.0 |
| 77,090 | Thrivent Small Cap Stock Fund | 1,453,138 | 4.9 |
| 75,969 | Thrivent Mid Cap Growth Fund | 1,172,955 | 4.0 |
| 114,520 | Thrivent Partner Mid Cap Value Fund | 1,161,236 | 3.9 |
| 95,026 | Thrivent Mid Cap Stock Fund | 1,770,335 | 6.0 |
| 689,418 | Thrivent Partner International Stock Fund | 7,425,036 | 25.3 |
| 904,968 | Thrivent Large Cap Growth Fund | 4,705,835 | 16.0 |
| 241,060 | Thrivent Large Cap Value Fund | 3,519,479 | 12.0 |
| 134,259 | Thrivent Large Cap Stock Fund | 3,508,198 | 11.9 |
|
|
| | Total Equity Funds | | |
| | (cost $26,843,482) | 27,050,551 | |
|
|
| |
| Real Estate Securities Fund (4.0%) | | |
| 115,803 | Thrivent Real Estate Securities Fund | 1,161,506 | 4.0 |
|
|
| | Total Real Estate Securities Fund | | |
| | (cost $1,167,515) | 1,161,506 | |
|
|
| |
| Debt Fund (2.0%) | | |
| 46,641 | Thrivent Limited Maturity Bond Fund | 586,750 | 2.0 |
|
|
| | Total Debt Fund | | |
| | (cost $589,373) | 586,750 | |
|
|
| |
| Short-Term Investments (2.0%) | | |
| 588,666 | Thrivent Money Market Fund | 588,666 | 2.0 |
|
|
| | Total Short-Term Investments | | |
| | (cost $588,666) | 588,666 | |
|
|
| | Total Fund Investments | | |
| | (cost $29,189,036) | $29,387,473 | 100.0 |
|
|
(a) Investments are in Institutional Class Shares.
The accompanying notes to the financial statements are an integral part of this schedule.
57
| | Moderately Aggressive Allocation Fund(a) | |
| | Schedule of Investments as of October 31, 2005 | | |
| Shares | | Value | Percentage |
|
| Equity Funds (78.2%) | | |
| 190,712 | Thrivent Partner Small Cap Growth Fund | $1,960,515 | 3.0% |
| 134,572 | Thrivent Partner Small Cap Value Fund | 1,960,714 | 3.0 |
| 103,541 | Thrivent Small Cap Stock Fund | 1,951,752 | 3.0 |
| 127,695 | Thrivent Mid Cap Growth Fund | 1,971,618 | 3.0 |
| 192,243 | Thrivent Partner Mid Cap Value Fund | 1,949,345 | 3.0 |
| 141,934 | Thrivent Mid Cap Stock Fund | 2,644,230 | 4.0 |
| 1,422,517 | Thrivent Partner International Stock Fund | 15,320,504 | 23.3 |
| 1,776,046 | Thrivent Large Cap Growth Fund | 9,235,440 | 14.0 |
| 495,167 | Thrivent Large Cap Value Fund | 7,229,438 | 11.0 |
| 275,863 | Thrivent Large Cap Stock Fund | 7,208,287 | 10.9 |
|
|
| | Total Equity Funds | | |
| | (cost $51,151,418) | 51,431,843 | |
|
|
| |
| Real Estate Securities Fund (3.9%) | | |
| 259,393 | Thrivent Real Estate Securities Fund | 2,601,709 | 3.9 |
|
|
| | Total Real Estate Securities Fund | | |
| | (cost $2,626,950) | 2,601,709 | |
|
|
| |
| Debt Funds (14.9%) | | |
| 381,509 | Thrivent Income Fund | 3,261,901 | 4.9 |
| 523,424 | Thrivent Limited Maturity Bond Fund | 6,584,673 | 10.0 |
|
|
| | Total Debt Funds | | |
| | (cost $9,927,565) | 9,846,574 | |
|
|
| |
| Short-Term Investments (3.0%) | | |
| 1,983,082 | Thrivent Money Market Fund | 1,983,082 | 3.0 |
|
|
| | Total Short-Term Investments | | |
| | (cost $1,983,082) | 1,983,082 | |
|
|
| | Total Fund Investments | | |
| | (cost $65,689,015) | $65,863,208 | 100.0 |
|
|
(a) Investments are in Institutional Class Shares.
The accompanying notes to the financial statements are an integral part of this schedule.
58
| | Moderate Allocation Fund(a) | | |
| | Schedule of Investments as of October 31, 2005 | | |
| Shares | | Value | Percentage |
|
| Equity Funds (65.1%) | | |
| 248,485 | Thrivent Small Cap Stock Fund | $4,683,937 | 5.9% |
| 298,037 | Thrivent Mid Cap Stock Fund | 5,552,422 | 7.0 |
| 1,336,345 | Thrivent Partner International Stock Fund | 14,392,438 | 18.2 |
| 1,978,517 | Thrivent Large Cap Growth Fund | 10,288,289 | 13.0 |
| 540,185 | Thrivent Large Cap Value Fund | 7,886,699 | 10.0 |
| 331,129 | Thrivent Large Cap Stock Fund | 8,652,406 | 11.0 |
|
|
| | Total Equity Funds | | |
| | (cost $51,191,779) | 51,456,191 | |
|
|
| |
| Real Estate Securities Fund (4.9%) | | |
| 389,118 | Thrivent Real Estate Securities Fund | 3,902,856 | 4.9 |
|
|
| | Total Real Estate Securities Fund | | |
| | (cost $3,946,590) | 3,902,856 | |
|
|
| |
| Debt Funds (25.0%) | | |
| 623,302 | Thrivent High Yield Fund | 3,135,211 | 4.0 |
| 549,690 | Thrivent Income Fund | 4,699,850 | 6.0 |
| 942,450 | Thrivent Limited Maturity Bond Fund | 11,856,027 | 15.0 |
|
|
| | Total Debt Funds | | |
| | (cost 19,876,513) | 19,691,088 | |
|
|
| |
| Short-Term Investments (5.0%) | | |
| 3,968,406 | Thrivent Money Market Fund | 3,968,406 | 5.0 |
|
|
| | Total Short-Term Investments | | |
| | (cost $3,968,406) | 3,968,406 | |
|
|
| | Total Fund Investments | | |
| | (cost $78,983,288) | $79,018,541 | 100.0 |
|
|
(a) Investments are in Institutional Class Shares.
The accompanying notes to the financial statements are an integral part of this schedule.
59
| | Moderately Conservative Allocation Fund(a) | |
| | Schedule of Investments as of October 31, 2005 | | |
| Shares | | Value | Percentage |
|
| Equity Funds (45.1%) | | |
| 70,575 | Thrivent Small Cap Stock Fund | $1,330,342 | 4.0% |
| 72,607 | Thrivent Mid Cap Stock Fund | 1,352,667 | 4.0 |
| 379,764 | Thrivent Partner International Stock Fund | 4,090,053 | 12.1 |
| 648,382 | Thrivent Large Cap Growth Fund | 3,371,589 | 10.0 |
| 161,037 | Thrivent Large Cap Value Fund | 2,351,138 | 7.0 |
| 102,535 | Thrivent Large Cap Stock Fund | 2,679,243 | 8.0 |
|
|
| | Total Equity Funds | | |
| | (cost $15,084,570) | 15,175,032 | |
|
|
| |
| Real Estate Securities Fund (3.0%) | | |
| 99,384 | Thrivent Real Estate Securities Fund | 996,818 | 3.0 |
|
|
| | Total Real Estate Securities Fund | | |
| | (cost $1,004,513) | 996,818 | |
|
|
| |
| Debt Funds (41.9%) | | |
| 265,595 | Thrivent High Yield Fund | 1,335,945 | 4.0 |
| 429,343 | Thrivent Income Fund | 3,670,879 | 10.9 |
| 722,863 | Thrivent Limited Maturity Bond Fund | 9,093,613 | 27.0 |
|
|
| | Total Debt Funds | | |
| | (cost $14,228,361) | 14,100,437 | |
|
|
| |
| Short-Term Investments (10.0%) | | |
| 3,382,293 | Thrivent Money Market Fund | 3,382,293 | 10.0 |
|
|
| | Total Short-Term Investments | | |
| | (cost $3,382,293) | 3,382,293 | |
|
|
| | Total Fund Investments | | |
| | (Cost $33,699,737) | $33,654,580 | 100.0 |
|
|
(a) Investments are in Institutional Class Shares.
The accompanying notes to the financial statements are an integral part of this schedule.
60
| | | Technology Fund | | |
| | Schedule of Investments as of October 31, 2005(a) | |
| Shares | Common Stock (85.5%) | Value | Shares | Common Stock (85.5%) | Value |
|
| |
| Consumer Discretionary (2.3%) | | 3,100 | Avid Technology, Inc.(b) | $152,613 |
| 9,200 | eBay, Inc.(b) | $364,320 | 11,300 | BEA Systems, Inc.(b) | 99,666 |
| 3,000 | Getty Images, Inc.(b) | 249,030 | 500 | Blue Coat Systems, Inc.(b,c) | 23,495 |
| 3,200 | Pixar, Inc.(b) | 162,336 | 3,200 | BMC Software, Inc.(b) | 62,688 |
| 9,900 | Time Warner, Inc. | 176,517 | 14,300 | Broadcom Corporation(b) | 607,178 |
| 7,500 | Walt Disney Company | 182,775 | 1,000 | Business Objects SA ADR(b,c) | 34,270 |
| 4,600 | XM Satellite Radio Holdings, Inc.(b) | 132,618 | 800 | CACI International, Inc.(b) | 43,632 |
|
| |
| | Total Consumer | | 3,600 | CDW Corporation | 202,860 |
| | Discretionary | 1,267,596 | 15,000 | Check Point Software | |
|
| |
| | | | | Technologies, Ltd.(b) | 335,400 |
| Health Care (4.3%) | | 4,500 | CheckFree Corporation(b) | 191,250 |
| 1,300 | Fisher Scientific International, Inc.(b) 73,450 | 83,200 | Cisco Systems, Inc.(b) | 1,451,840 |
| 9,000 | iShares Dow Jones US Healthcare | | 5,200 | Citrix Systems, Inc.(b) | 143,364 |
| | Sector Index Fund(c) | 544,140 | 4,000 | Cogent, Inc.(b) | 106,200 |
| 12,000 | iShares Nasdaq Biotechnology | | 6,200 | Cognizant Technology | |
| | Index Fund(b,c) | 886,920 | | Solutions Corporation(b) | 272,676 |
| 10,900 | iShares S&P Global Healthcare | | 4,200 | Cognos, Inc.(b) | 157,626 |
| | Sector Index Fund(c) | 556,009 | 1,100 | Computer Sciences Corporation(b) | 56,375 |
| 1,600 | Medtronic, Inc. | 90,656 | 6,800 | Compuware Corporation(b) | 55,012 |
| 2,500 | St. Jude Medical, Inc.(b) | 120,175 | 22,300 | Comverse Technology, Inc.(b) | 559,730 |
| 1,000 | Zimmer Holdings, Inc.(b) | 63,770 | 14,800 | Corning, Inc.(b) | 297,332 |
|
| |
| | Total Health Care | 2,335,120 | 15,100 | Cypress Semiconductor | |
|
| |
| | | | | Corporation(b,c) | 205,360 |
| Industrials (0.5%) | | 39,900 | Dell, Inc.(b) | 1,272,012 |
| 1,300 | Avery Dennison Corporation | 73,645 | 1,600 | Digital Insight Corporation(b) | 47,728 |
| 6,000 | Monster Worldwide, Inc.(b) | 196,860 | 2,700 | Digital River, Inc.(b,c) | 75,627 |
|
| |
| | Total Industrials | 270,505 | 2,700 | DST Systems, Inc.(b) | 151,524 |
|
| |
| | | | 4,700 | Electronic Arts, Inc.(b) | 267,336 |
| Information Technology (76.9%) | | 12,000 | Embarcadero Technologies, Inc.(b) | 93,360 |
| 9,200 | Accenture, Ltd. | 242,052 | 93,900 | EMC Corporation(b) | 1,310,844 |
| 1,467 | Activision, Inc.(b) | 23,129 | 9,000 | First Data Corporation | 364,050 |
| 8,500 | Advanced Micro Devices, Inc.(b) | 197,370 | 27,400 | Flextronics International, Ltd.(b) | 254,546 |
| 1,300 | Affiliated Computer Services, Inc.(b) | 70,343 | 5,600 | FormFactor, Inc.(b) | 137,872 |
| 7,600 | Agilent Technologies, Inc.(b) | 243,276 | 6,107 | Freescale Semiconductor, Inc.(b) | 145,835 |
| 4,200 | Akamai Technologies, Inc.(b,c) | 72,828 | 2,000 | Global Payments, Inc. | 85,700 |
| 11,400 | Altera Corporation(b) | 189,810 | 3,500 | Google, Inc.(b) | 1,302,490 |
| 13,000 | Amdocs, Ltd.(b) | 344,110 | 15,600 | Hewlett-Packard Company | 437,424 |
| 4,200 | Amphenol Corporation | 167,874 | 5,132 | Homestore, Inc.(b) | 18,629 |
| 20,100 | Analog Devices, Inc. | 699,078 | 6,800 | Hyperion Solutions Corporation(b) | 328,848 |
| 400 | Anteon International Corporation(b) 18,080 | 33,800 | Informatica Corporation(b,c) | 402,220 |
| 33,900 | Apple Computer, Inc.(b) | 1,952,303 | 3,700 | Infosys Technologies, Ltd. ADR | 251,600 |
| 37,100 | Applied Materials, Inc. | 607,698 | 8,600 | Integrated Device | |
| 11,300 | ASML Holding NV ADR(b,c) | 191,874 | | Technology, Inc.(b) | 84,968 |
| 14,000 | ATI Technologies, Inc.(b) | 202,300 | 71,700 | Intel Corporation | 1,684,950 |
| 12,048 | AU Optronics Corporation | 153,615 | 17,500 | International Business | |
| 3,300 | Automatic Data Processing, Inc. | 153,978 | | Machines Corporation | 1,432,900 |
| 14,800 | Avaya, Inc.(b) | 170,496 | 9,400 | Jabil Circuit, Inc.(b) | 280,590 |
| |
| The accompanying notes to the financial statements are an integral part of this schedule. | |
|
61
| Technology Fund | | | | |
| Schedule of Investments as of October 31, 2005(a) | | | | |
| |
| Shares | Common Stock (85.5%) | Value | Shares | Common Stock (85.5%) | Value |
|
| |
| Information Technology -- continued | | 1,400 | Shanda Interactive | |
| 33,000 | JDS Uniphase Corporation(b) | $69,300 | | Entertainment, Ltd.(b,c) | $34,678 |
| 27,400 | Juniper Networks, Inc.(b) | 639,242 | 14,400 | Stellent, Inc.(b,c) | 132,048 |
| 12,700 | KLA-Tencor Corporation | 587,883 | 7,400 | STMicroelectronics NV(c) | 121,878 |
| 14,300 | Lam Research Corporation(b) | 482,482 | 36,800 | Sun Microsystems, Inc.(b) | 147,200 |
| 1,600 | Lexmark International, Inc.(b) | 66,432 | 25,571 | Symantec Corporation(b) | 609,868 |
| 14,700 | Linear Technology Corporation | 488,187 | 9,227 | Symbol Technologies, Inc. | 76,584 |
| 80,400 | Lucent Technologies, Inc.(b,c) | 229,140 | 32,927 | Taiwan Semiconductor | |
| 7,200 | Macromedia, Inc.(b) | 316,224 | | Manufacturing Company, Ltd. ADR 266,050 |
| 4,100 | Manhattan Associates, Inc.(b) | 91,061 | 1,000 | Take-Two Interactive | |
| 18,600 | Marvell Technology Group, Ltd.(b) | 863,226 | | Software, Inc.(b) | 20,650 |
| 12,000 | Maxim Integrated Products, Inc. | 416,160 | 10,400 | Telefonaktiebolaget LM Ericsson(c) | 341,224 |
| 6,500 | McAfee, Inc.(b) | 195,195 | 9,600 | Teradyne, Inc.(b) | 129,984 |
| 6,600 | Mercury Interactive Corporation(b) | 229,614 | 29,200 | Texas Instruments, Inc. | 833,660 |
| 11,800 | Microchip Technology, Inc. | 356,006 | 1,700 | THQ, Inc.(b) | 39,406 |
| 16,800 | Micromuse, Inc.(b) | 120,456 | 55,800 | TIBCO Software, Inc.(b) | 423,522 |
| 13,100 | Micron Technology, Inc.(b,c) | 170,169 | 3,300 | UNOVA, Inc.(b) | 102,300 |
| 66,400 | Microsoft Corporation | 1,706,480 | 2,600 | ValueClick, Inc.(b) | 45,500 |
| 45,500 | Motorola, Inc. | 1,008,280 | 29,200 | VeriSign, Inc.(b) | 689,996 |
| 20,700 | National Semiconductor | | 7,400 | Viisage Technology, Inc.(b,c) | 34,040 |
| | Corporation | 468,441 | 6,200 | Vishay Intertechnology, Inc.(b) | 70,308 |
| 1,700 | NAVTEQ Corporation(b) | 66,504 | 22,300 | Vitria Technology, Inc.(b,c) | 65,785 |
| 16,400 | NETGEAR, Inc.(b,c) | 320,620 | 16,500 | webMethods, Inc.(b,c) | 114,840 |
| 12,900 | Network Appliance, Inc.(b) | 352,944 | 800 | Websense, Inc.(b) | 47,264 |
| 33,800 | Nokia Oyj ADR | 568,516 | 5,500 | Western Digital Corporation(b,c) | 66,550 |
| 50,900 | Nortel Networks Corporation(b,c) | 165,425 | 15,900 | Wind River Systems, Inc.(b) | 208,290 |
| 18,200 | Novell, Inc.(b,c) | 138,684 | 11,300 | Xerox Corporation(b) | 153,341 |
| 4,900 | NVIDIA Corporation(b) | 164,395 | 19,700 | Xilinx, Inc. | 471,815 |
| 11,200 | ON Semiconductor Corporation(b,c) | 51,968 | 32,000 | Yahoo!, Inc.(b) | 1,183,040 |
| 3,100 | Openwave Systems, Inc.(b) | 55,397 | 2,200 | Zebra Technologies Corporation(b) | 94,842 |
|
|
| 78,200 | Oracle Corporation(b) | 991,576 | | Total Information | |
| 4,000 | Progress Software Corporation(b) | 124,560 | | Technology | 41,836,745 |
|
|
| 1,800 | QLogic Corporation(b) | 54,288 | | | |
| 27,200 | QUALCOMM, Inc. | 1,081,472 | Telecommunications Services (1.5%) | |
| 23,500 | RAE Systems, Inc.(b,c) | 82,720 | 27,014 | Sprint Nextel Corporation | 629,696 |
| 13,600 | Red Hat, Inc.(b,c) | 315,792 | 5,600 | Verizon Communications, Inc. | 176,456 |
|
|
| 4,500 | Salesforce.com, Inc.(b,c) | 112,455 | | Total Telecommunications | |
| 4,900 | SanDisk Corporation(b) | 288,561 | | Services | 806,152 |
|
|
| 6,600 | SAP AG | 283,404 | | | |
|
|
| 7,300 | Sapient Corporation(b) | 37,887 | | Total Common Stock | |
| 7,000 | Scientific-Atlanta, Inc. | 248,080 | | (cost $50,287,083) | 46,516,118 |
|
|
| 7,800 | Seagate Technology(b) | 113,022 | | | |
The accompanying notes to the financial statements are an integral part of this schedule.
62
| Technology Fund | | | |
| Schedule of Investments as of October 31, 2005(a) | | | |
| | | Interest | Maturity | |
| Shares | Collateral Held for Securities Loaned (10.4%) | Rate(d) | Date | Value |
|
| 5,647,242 | Thrivent Financial Securities Lending Trust | 3.950% | N/A | $5,647,242 |
|
|
| | Total Collateral Held for Securities Loaned | |
| | (cost $5,647,242) | | | 5,647,242 |
|
|
| |
| | | Interest | Maturity | |
| Shares | Short-Term Investments (4.1%) | Rate(d) | Date | Value |
|
| 2,204,466 | Thrivent Money Market Fund | 3.600% | N/A | $2,204,466 |
|
|
| | Total Short-Term Investments (at amortized cost) | 2,204,466 |
|
|
| | Total Investments (cost $58,138,791) | | $54,367,826 |
|
|
(a) The categories of investments are shown as a percentage of total investments.
(b) Non-income producing security.
(c) All or a portion of the security is on loan as discussed in item 2(L) of the Notes to Financial Statements.
(d) The interest rate shown reflects the yield, coupon rate or, for securities purchased at a discount, the discount rate at the date of purchase.
(e) Miscellaneous footnote: ADR -- American Depository Receipts, which are certificates for shares of an underlying foreign security’s shares held by an issuing U.S. depository bank.
The accompanying notes to the financial statements are an integral part of this schedule.
63
| | Partner Small Cap Growth Fund | |
| | Schedule of Investments as of October 31, 2005(a) | |
| Shares | Common Stock (80.7%) | Value | Shares | Common Stock (80.7%) | Value |
|
| |
| Consumer Discretionary (11.5%) | | 1,449 | Cooper Cameron Corporation(b) | $106,835 |
| 300 | Building Materials | | 1,220 | Energy Partners, Ltd.(b) | 30,951 |
| | Holding Corporation | $25,503 | 2,074 | Forest Oil Corporation(b) | 90,592 |
| 1,030 | California Pizza Kitchen, Inc.(b) | 32,970 | 1,160 | Frontier Oil Corporation | 42,781 |
| 1,020 | Carters, Inc.(b) | 64,413 | 6,970 | Grey Wolf, Inc.(b,c) | 53,530 |
| 2,080 | Coldwater Creek, Inc.(b) | 56,139 | 990 | Hornbeck Offshore Services, Inc.(b) | 31,888 |
| 650 | Ctrip.com International, Ltd. ADR | 37,394 | 1,379 | Hydril Company(b) | 91,483 |
| 1,880 | Dress Barn, Inc.(b) | 49,952 | 1,290 | Oil States International, Inc.(b) | 42,699 |
| 4,010 | Education Management | | 2,900 | Parallel Petroleum Corporation(b) | 38,367 |
| | Corporation(b) | 123,668 | 2,010 | Superior Energy Services, Inc.(b) | 40,964 |
| 9,425 | Entravision Communications | | 1,540 | Todco | 68,915 |
| | Corporation(b) | 77,285 | 2,470 | Warren Resources, Inc.(b,c) | 38,211 |
| 5,143 | Fossil, Inc.(b,c) | 80,539 | 2,433 | Western Gas Resources, Inc. | 105,349 |
| 5,345 | Fred’s, Inc. | 79,640 | 1,420 | World Fuel Services Corporation | 45,298 |
|
|
| 1,450 | GameStop Corporation(b,c) | 51,446 | | Total Energy | 999,860 |
|
|
| 950 | Gaylord Entertainment Company(b) | 37,506 | | | |
| 1,560 | Genesco, Inc.(b) | 57,408 | Financials (6.2%) | |
| 4,586 | Gentex Corporation | 86,309 | 1,821 | Affiliated Managers Group, Inc.(b,c) | 139,762 |
| 2,170 | Guess ?, Inc.(b) | 58,850 | 1,560 | Boston Private Financial | |
| 2,260 | Gymboree Corporation(b) | 40,002 | | Holdings, Inc.(c) | 45,162 |
| 1,755 | Hibbett Sporting Goods, Inc.(b) | 46,034 | 1,070 | Calamos Asset Management, Inc. | 25,990 |
| 2,750 | Imax Corporation(b,c) | 24,942 | 1,760 | East West Bancorp, Inc. | 67,390 |
| 2,170 | Jackson Hewitt Tax Service, Inc. | 53,642 | 2,401 | Financial Federal Corporation | 91,670 |
| 1,500 | Jarden Corporation(b,c) | 50,685 | 530 | Greenhill & Company, Inc.(c) | 25,414 |
| 2,316 | Monaco Coach Corporation(c) | 28,417 | 2,430 | Investment Technology | |
| 5,831 | PETCO Animal Supplies, Inc.(b) | 110,847 | | Group, Inc.(b) | 78,999 |
| 2,914 | Ruby Tuesday, Inc.(c) | 63,846 | 2,327 | Investors Financial | |
| 804 | Strayer Education, Inc. | 71,966 | | Services Corporation(c) | 88,845 |
| 2,430 | Tractor Supply Company(b) | 117,855 | 2,015 | Jefferies Group, Inc. | 85,557 |
| 7,019 | ValueVision Media, Inc.(b) | 68,927 | 790 | Jones Lang LaSalle, Inc. | 39,721 |
| 2,060 | VistaPrint, Ltd.(b) | 34,876 | 760 | Kilroy Realty Corporation | 42,674 |
| 2,524 | Winnebago Industries, Inc.(c) | 74,004 | 1,860 | Nasdaq Stock Market, Inc.(b) | 57,455 |
| 1,180 | WMS Industries, Inc.(b,c) | 29,653 | 2,660 | Sunstone Hotel Investors, Inc. | 59,584 |
| 1,910 | Wolverine World Wide, Inc. | 40,014 | 1,996 | Wintrust Financial Corporation | 107,145 |
|
| |
|
| | Total Consumer | | | Total Financials | 955,368 |
|
|
| | Discretionary | 1,774,732 | | | |
|
| |
| | | | Health Care (14.8%) | |
| Consumer Staples (0.9%) | | 1,350 | American Healthways, Inc.(b) | 54,756 |
| 1,050 | Flowers Foods, Inc. | 30,765 | 7,031 | American Medical Systems | |
| 880 | Hansen Natural Corporation(b,c) | 44,458 | | Holdings, Inc.(b) | 114,957 |
| 12,700 | SunOpta, Inc.(b,c) | 62,738 | 4,233 | AmSurg Corporation(b) | 100,534 |
|
| |
| | Total Consumer Staples | 137,961 | 1,580 | Amylin Pharmaceuticals, Inc.(b,c) | 53,088 |
|
| |
| | | | 3,284 | Apria Healthcare Group, Inc.(b) | 75,762 |
| Energy (6.5%) | | 3,176 | Connetics Corporation(b,c) | 41,415 |
| 1,890 | Alpha Natural Resources, Inc.(b) | 44,888 | 1,950 | Cubist Pharmaceuticals, Inc.(b) | 39,410 |
| 1,521 | Cal Dive International, Inc.(b) | 93,602 | 1,580 | CV Therapeutics, Inc.(b,c) | 39,595 |
| 900 | Cheniere Energy, Inc.(b,c) | 33,507 | 4,314 | HealthExtras, Inc.(b) | 90,810 |
| |
| The accompanying notes to the financial statements are an integral part of this schedule. | |
|
64
| Partner Small Cap Growth Fund | | | | |
| Schedule of Investments as of October 31, 2005(a) | | | | |
| |
| Shares | Common Stock (80.7%) | Value | Shares | Common Stock (80.7%) | Value |
|
| |
| Health Care -- continued | | 1,730 | Stericycle, Inc.(b) | $99,579 |
| 1,345 | IDEXX Laboratories, Inc.(b) | $94,325 | 1,400 | Teledyne Technologies, Inc.(b) | 49,364 |
| 4,804 | Illumina, Inc.(b) | 74,798 | 240 | Tetra Tech, Inc.(b) | 3,706 |
| 1,588 | INAMED Corporation(b) | 112,907 | 1,540 | Wabtec Corporation | 41,888 |
| 530 | Intuitive Surgical, Inc.(b) | 47,027 | 800 | Washington Group | |
| 3,056 | Kensey Nash Corporation(b,c) | 70,074 | | International, Inc.(b) | 39,760 |
| 1,290 | Kyphon, Inc.(b) | 51,716 | 1,100 | Watsco, Inc. | 62,513 |
| 1,270 | LCA-Vision, Inc. | 53,353 | 2,018 | Watts Water Technologies, Inc.(c) | 56,020 |
| 1,720 | Momenta Pharmaceuticals, Inc.(b,c) | 37,032 | 2,110 | WESCO International, Inc.(b) | 83,872 |
|
|
| 10,123 | Nabi Biopharmaceuticals(b,c) | 130,081 | | Total Industrials | 1,609,771 |
|
|
| 1,140 | New River Pharmaceuticals, Inc(b,c) | 54,253 | | | |
| 6,719 | PSS World Medical, Inc.(b) | 93,596 | Information Technology (27.8%) | |
| 1,650 | Psychiatric Solutions, Inc.(b) | 90,255 | 2,810 | ADTRAN, Inc. | 85,002 |
| 1,830 | Senomyx, Inc.(b,c) | 26,078 | 2,000 | Advent Software, Inc.(b) | 61,440 |
| 4,370 | Serologicals Corporation(b,c) | 85,128 | 11,777 | Agile Software Corporation(b) | 83,617 |
| 1,430 | Sierra Health Services, Inc.(b) | 107,250 | 6,536 | Andrew Corporation(b) | 69,412 |
| 2,100 | Sunrise Senior Living, Inc.(b,c) | 67,914 | 3,470 | aQuantive, Inc.(b) | 75,126 |
| 1,990 | Sybron Dental Specialties, Inc.(b) | 85,371 | 4,791 | Avocent Corporation(b) | 146,892 |
| 1,440 | United Surgical Partners | | 3,407 | Benchmark Electronics, Inc.(b) | 95,703 |
| | International, Inc.(b) | 51,624 | 4,630 | CNET Networks, Inc.(b) | 62,922 |
| 1,130 | United Therapeutics Corporation(b) | 83,462 | 1,310 | Cogent, Inc.(b,c) | 34,780 |
| 1,695 | Varian, Inc.(b) | 62,325 | 3,269 | Coherent, Inc.(b) | 96,795 |
| 1,640 | VCA Antech, Inc.(b) | 42,312 | 6,629 | Digital Insight Corporation(b) | 197,743 |
| 1,770 | Vertex Pharmaceuticals, Inc.(b,c) | 40,268 | 4,201 | Entegris, Inc.(b) | 41,002 |
| 4,720 | ViroPharma, Inc.(b) | 90,435 | 1,030 | Euronet Worldwide, Inc.(b,c) | 28,943 |
| 1,100 | Wellcare Health Plans, Inc.(b,c) | 34,650 | 1,110 | F5 Networks, Inc.(b) | 57,753 |
|
| |
| | Total Health Care | 2,296,561 | 2,299 | FactSet Research Systems, Inc. | 80,626 |
|
| |
| | | | 2,411 | Fair Isaac Corporation | 100,683 |
| Industrials (10.4%) | | 3,971 | FileNet Corporation(b) | 111,784 |
| 1,300 | Administaff, Inc. | 55,016 | 3,380 | Foundry Networks, Inc.(b) | 40,323 |
| 1,040 | Astec Industries, Inc.(b) | 29,494 | 3,020 | Genesis Microchip, Inc.(b) | 58,105 |
| 830 | Aviall, Inc.(b) | 26,186 | 1,858 | Global Imaging Systems, Inc.(b) | 66,163 |
| 1,030 | Bucyrus International, Inc. | 42,796 | 1,280 | Heartland Payment Systems, Inc.(b) | 31,002 |
| 1,200 | Ceradyne, Inc.(b) | 47,040 | 8,160 | Homestore, Inc.(b) | 29,621 |
| 2,120 | Continental Airlines, Inc.(b) | 27,454 | 2,288 | Hyperion Solutions Corporation(b) | 110,648 |
| 2,224 | CRA International, Inc.(b) | 98,434 | 14,053 | Informatica Corporation(b) | 167,231 |
| 3,807 | Forward Air Corporation | 134,958 | 6,230 | Internet Capital Group, Inc.(b,c) | 53,204 |
| 5,912 | FTI Consulting, Inc.(b) | 161,811 | 1,760 | Internet Security Systems, Inc.(b) | 43,349 |
| 1,310 | Global Cash Access, Inc.(b) | 18,366 | 1,070 | Itron, Inc.(b) | 46,502 |
| 2,560 | Hexcel Corporation(b) | 40,499 | 6,225 | Jack Henry & Associates, Inc. | 111,926 |
| 3,119 | Jacobs Engineering Group, Inc.(b) | 198,836 | 2,235 | Kronos, Inc.(b) | 102,497 |
| 2,310 | JLG Industries, Inc. | 88,612 | 3,924 | Littelfuse, Inc.(b) | 96,177 |
| 780 | Kansas City Southern, Inc.(b,c) | 17,285 | 1,640 | M-Systems Flash Disk | |
| 1,910 | Labor Ready, Inc.(b) | 44,598 | | Pioneers, Ltd.(b) | 51,972 |
| 650 | Manitowoc Company, Inc. | 34,586 | 7,627 | Macrovision Corporation(b) | 143,693 |
| 1,890 | Pacer International, Inc. | 48,856 | 1,540 | MICROS Systems, Inc.(b) | 70,717 |
| 2,040 | Resources Global Professionals(b) | 58,242 | 3,970 | Microsemi Corporation(b) | 91,985 |
| |
| The accompanying notes to the financial statements are an integral part of this schedule. | |
|
65
| Partner Small Cap Growth Fund | | | | | | |
| Schedule of Investments as of October 31, 2005(a) | | | | | | |
| |
| Shares | Common Stock (80.7%) | Value | Shares | | Common Stock (80.7%) | | Value |
|
| |
| Information Technology -- continued | | 3,680 | | Witness Systems, Inc.(b) | | $72,128 |
| 2,000 | MoneyGram International, Inc. | $48,600 | 3,224 | | Zebra Technologies Corporation(b) | | 138,987 |
| |
|
| 2,560 | MPS Group, Inc.(b) | 31,872 | | | Total Information | | |
| 2,480 | NETGEAR, Inc.(b) | 48,484 | | | | | 4,307,070 |
| |
|
| 3,450 | Openwave Systems, Inc.(b,c) | 61,652 | | | | | |
| 6,660 | Parametric Technology | | Materials (1.2%) | | | | |
| | Corporation(b) | 43,357 | 640 | | Cleveland-Cliffs, Inc.(c) | | 52,186 |
| 5,674 | Photon Dynamics, Inc(b) | 98,784 | 540 | | Eagle Materials, Inc.(c) | | 57,505 |
| 2,640 | Powerwave Technologies, Inc.(b,c) | 29,594 | 1,530 | | Titanium Metals Corporation(b,c) | | 72,216 |
| |
|
| 2,630 | Progress Software Corporation(b) | 81,898 | | | Total Materials | | 181,907 |
| |
|
| 2,198 | Rogers Corporation(b) | 82,095 | | | | | |
| 2,542 | SafeNet, Inc.(b) | 84,318 | Telecommunications Services (1.4%) | | |
| 1,050 | Silicon Laboratories, Inc.(b) | 33,778 | 6,280 | | Dobson Communications | | |
| 1,470 | SINA Corporation(b) | 37,264 | | | | | 45,781 |
| 2,230 | Sirf Technology Holdings, Inc.(b) | 57,512 | 3,453 | | | | 105,662 |
| 6,950 | Sonus Networks, Inc.(b) | 30,302 | 4,530 | | SBA Communications | | |
| 2,840 | THQ, Inc.(b,c) | 65,831 | | | | | 66,908 |
| |
|
| 1,580 | Trident Microsystems, Inc.(b,c) | 47,811 | | | Total Telecommunications | | |
| 3,895 | UNOVA, Inc.(b) | 120,745 | | | | | 218,351 |
| |
|
| 15,620 | ValueClick, Inc.(b,c) | 273,349 | | | | | |
| |
|
| 1,940 | Varian Semiconductor | | | | Total Common Stock | | |
| | Equipment Associates, Inc. | 73,371 | | | (cost $11,998,852) | | 12,481,581 |
| |
|
| |
| |
| | | | Interest | | Maturity | | |
| Shares | Collateral Held for Securities Loaned (15.1%) | | Rate(d) | | Date | | Value |
|
| 2,334,945 | Thrivent Financial Securities Lending Trust | | 3.950% | | N/A | | $2,334,945 |
|
|
| | Total Collateral Held for Securities Loaned | | |
| | (cost $2,334,945) | | | | 2,334,945 |
|
|
| |
| |
| | | | Interest | | Maturity | | |
| Shares | Short-Term Investments (4.2%) | | Rate(d) | | Date | | Value |
|
| 647,938 | Thrivent Money Market Fund | | 3.600% | | N/A | | $647,938 |
|
|
| | Total Short-Term Investments (at amortized cost) | | 647,938 |
|
|
| | Total Investments (cost $14,981,735) | | | | $15,464,464 |
|
|
| (a) | The categories of investments are shown as a percentage of total investments. |
| |
| (b) | Non-income producing security. |
| |
| (c) | All or a portion of the security is on loan as discussed in item 2(L) of the Notes to Financial Statements. |
| |
| (d) | The interest rate shown reflects the yield, coupon rate or, for securities purchased at a discount, the discount rate at the date of purchase. |
| |
| (e) | Miscellaneous footnote: |
| |
| | ADR -- American Depository Receipts, which are certificates for shares of an underlying foreign security’s shares held by an issuing U.S. depository bank. |
| |
The accompanying notes to the financial statements are an integral part of this schedule.
66
| | Partner Small Cap Value Fund | | |
| | Schedule of Investments as of October 31, 2005(a) | | |
| Shares | Common Stock (83.3%) | Value | Shares | Common Stock (83.3%) | | Value |
|
| |
| Consumer Discretionary (10.9%) | | Financials (19.7%) | | |
| 54,000 | Aaron Rents, Inc.(b) | $1,063,800 | 31,000 | Allied Capital Corporation(b) | | $837,620 |
| 21,500 | CSS Industries, Inc. | 733,795 | 14,800 | American Capital Strategies, Ltd.(b) | 555,888 |
| 40,000 | Cutter & Buck, Inc. | 492,800 | 40,000 | Bedford Property Investors, Inc.(b) | 898,000 |
| 51,000 | Dixie Group, Inc.(c) | 699,720 | 18,900 | Boston Private Financial | | |
| 24,200 | Fred’s, Inc.(b) | 360,580 | | Holdings, Inc.(b) | | 547,155 |
| 44,000 | Hancock Fabrics, Inc.(b) | 286,000 | 36,000 | Bristol West Holdings, Inc. | | 694,080 |
| 71,100 | Haverty Furniture | | 35,000 | East West Bancorp, Inc. | | 1,340,150 |
| | Companies, Inc.(b) | 870,264 | 34,500 | First Financial Fund, Inc.(b) | | 685,515 |
| 118,400 | IMPCO Technologies, Inc.(b,c) | 614,496 | 11,000 | First Potomac Realty Trust | | 278,740 |
| 39,500 | Journal Register Company | 633,185 | 43,400 | First Republic Bank | | 1,645,294 |
| 18,600 | Matthews International | | 26,000 | GB&T Bancshares, Inc.(b) | | 571,740 |
| | Corporation | 668,484 | 53,500 | Glenborough Realty Trust, Inc. | 1,023,455 |
| 20,300 | Orient Express Hotels, Ltd. | 572,460 | 13,500 | Innkeepers USA Trust | | 210,600 |
| 32,100 | RARE Hospitality | | 8,600 | Kilroy Realty Corporation | | 482,890 |
| | International, Inc.(c) | 980,976 | 21,500 | Kite Realty Group Trust | | 317,770 |
| 14,600 | Ruby Tuesday, Inc.(b) | 319,886 | 2,400 | Markel Corporation(c) | | 763,200 |
| 30,400 | Saga Communications, Inc.(c) | 382,736 | 41,000 | Max Re Capital, Ltd.(b) | | 980,310 |
| 6,000 | SCP Pool Corporation | 215,820 | 22,600 | Midland Company(b) | | 853,602 |
| 30,500 | Stanley Furniture Company, Inc.(b) | 652,700 | 7,500 | National Health Realty, Inc. | | 143,325 |
| 18,100 | Steak n Shake Company(c) | 333,402 | 39,000 | Net Bank, Inc. | | 304,980 |
| 35,000 | Stein Mart, Inc. | 642,250 | 30,600 | Ohio Casualty Corporation | | 834,768 |
| 34,000 | TBC Corporation(c) | 1,176,060 | 19,300 | Piper Jaffray Companies(c) | | 662,955 |
| 22,000 | WCI Communities, Inc.(b,c) | 550,440 | 27,200 | ProAssurance Corporation(c) | | 1,272,960 |
|
| |
| | Total Consumer | | 66,000 | Strategic Hotel Capital, Inc. | | 1,121,340 |
| | Discretionary | 12,249,854 | 22,100 | SVB Financial Group(c) | | 1,098,591 |
|
| |
| | | | 61,000 | Texas Regional Bancshares, Inc. | 1,789,130 |
| Consumer Staples (1.7%) | | 24,300 | Trammell Crow Company(c) | | 621,351 |
| 81,400 | Alliance One International, Inc. | 202,686 | 22,000 | Triad Guaranty, Inc.(c) | | 925,320 |
| 28,300 | Casey’s General Stores, Inc. | 610,714 | 24,300 | Washington Real Estate | | |
| 27,700 | Nash Finch Company(b) | 860,362 | | Investment Trust | | 725,355 |
|
|
| 20,000 | Wild Oats Markets, Inc.(b,c) | 222,400 | | Total Financials | 22,186,084 |
|
| |
|
| | Total Consumer Staples | 1,896,162 | | | | |
|
| |
| | | | Health Care (4.1%) | | |
| Energy (7.1%) | | 12,000 | Arrow International, Inc. | | 347,280 |
| 14,000 | Atwood Oceanics, Inc.(c) | 985,880 | 58,500 | Diversa Corporation(b,c) | | 312,975 |
| 11,799 | Cimarex Energy Company(c) | 463,229 | 42,500 | Myriad Genetics, Inc.(b,c) | | 823,650 |
| 27,500 | Encore Acquisition Company(c) | 943,525 | 10,200 | National Healthcare Corporation(b) | 367,200 |
| 31,000 | Forest Oil Corporation(c) | 1,354,080 | 28,800 | Odyssey Healthcare, Inc.(b,c) | | 497,664 |
| 22,000 | Lone Star Technologies, Inc.(c) | 1,006,500 | 45,000 | Owens & Minor, Inc. | | 1,325,250 |
| 34,800 | TETRA Technologies, Inc.(c) | 973,356 | 12,200 | Pharmion Corporation(c) | | 230,458 |
| 30,000 | W-H Energy Services, Inc.(c) | 909,000 | 28,000 | West Pharmaceutical | | |
| 32,500 | Whiting Petroleum Corporation(c) | 1,317,875 | | Services, Inc.(b) | | 671,440 |
|
| |
|
| | Total Energy | 7,953,445 | | Total Health Care | | 4,575,917 |
|
| |
|
The accompanying notes to the financial statements are an integral part of this schedule.
67
| Partner Small Cap Value Fund | | | | |
| Schedule of Investments as of October 31, 2005(a) | | | |
| |
| Shares | Common Stock (83.3%) | Value | Shares | Common Stock (83.3%) | Value |
|
| |
| Industrials (18.4%) | | 49,000 | Methode Electronics, Inc. | $502,740 |
| 29,000 | Accuride Corporation(c) | $368,300 | 92,000 | MPS Group, Inc.(c) | 1,145,400 |
| 11,800 | Ameron International | | 12,600 | Progress Software Corporation(c) | 392,364 |
| | Corporation(b) | 504,450 | 59,000 | RSA Security, Inc.(c) | 672,600 |
| 29,400 | C&D Technologies, Inc. | 268,422 | 24,900 | S1 Corporation(c) | 109,311 |
| 34,000 | Casella Waste Systems, Inc.(c) | 432,480 | 61,300 | SBS Technologies, Inc.(c) | 598,288 |
| 32,100 | Dollar Thrifty Automotive | | 19,000 | StarTek, Inc.(b) | 241,680 |
|
|
| | Group, Inc.(c) | 1,210,170 | | Total Information | |
| 29,000 | Duratek, Inc.(c) | 413,830 | | Technology | 8,499,699 |
|
|
| 14,000 | EDO Corporation | 404,600 | | | |
| 43,200 | Electro Rent Corporation(c) | 554,688 | Materials (8.4%) | |
| 11,200 | ElkCorp | 354,256 | 37,000 | Airgas, Inc. | 1,045,990 |
| 20,000 | Franklin Electric Company, Inc.(b) | 868,200 | 19,000 | AptarGroup, Inc. | 972,610 |
| 18,800 | FTI Consulting, Inc.(c) | 514,556 | 24,800 | Arch Chemicals, Inc. | 651,496 |
| 24,800 | G & K Services, Inc. | 939,672 | 17,700 | Carpenter Technology | |
| 40,800 | Genesee & Wyoming, Inc.(c) | 1,307,640 | | Corporation | 1,067,310 |
| 17,800 | Genlyte Group, Inc.(c) | 907,266 | 15,000 | Chesapeake Corporation | 302,100 |
| 32,900 | Hub Group, Inc.(c) | 1,196,573 | 7,000 | Deltic Timber Corporation(b) | 322,000 |
| 25,000 | IDEX Corporation | 1,000,500 | 18,500 | Florida Rock Industries, Inc.(b) | 1,052,650 |
| 44,900 | Insituform Technologies, Inc.(c) | 806,404 | 46,800 | Gibraltar Industries, Inc. | 947,700 |
| 11,000 | JLG Industries, Inc. | 421,960 | 19,500 | MacDermid, Inc. | 546,000 |
| 25,500 | Kirby Corporation(c) | 1,317,585 | 15,000 | Meridian Gold, Inc.(c) | 281,700 |
| 68,500 | LSI Industries, Inc.(b) | 1,232,315 | 27,900 | Metal Management, Inc. | 675,459 |
| 22,700 | Macquarie Infrastructure | | 8,400 | Minerals Technologies, Inc. | 449,064 |
| | Company Trust(b) | 681,000 | 41,000 | Myers Industries, Inc.(b) | 468,220 |
| 43,000 | McGrath Rentcorp | 1,227,650 | 39,000 | Stillwater Mining Company(b,c) | 393,900 |
| 26,000 | Nordson Corporation | 966,420 | 29,600 | Wausau-Mosinee Paper Corporation 324,120 |
|
|
| 19,000 | Pike Electric Corporation(c) | 359,100 | | Total Materials | 9,500,319 |
|
|
| 36,300 | RemedyTemp, Inc.(c) | 263,175 | | | |
| 50,000 | Vitran Corporation, Inc.(c) | 865,500 | Telecommunications Services (0.5%) | |
| 19,400 | Waste Connections, Inc.(c) | 647,378 | 68,400 | Premiere Global Services, Inc.(c) | 580,032 |
|
|
| 9,300 | Woodward Governor Company | 743,070 | | Total Telecommunications | |
|
| |
| | Total Industrials | 20,777,160 | | Services | 580,032 |
|
| |
|
| |
| Information Technology (7.5%) | | Utilities (5.0%) | |
| 62,000 | Agile Software Corporation(c) | 440,200 | 22,000 | Black Hills Corporation(b) | 914,540 |
| 21,000 | Applied Films Corporation(c) | 407,820 | 43,400 | Cleco Corporation | 920,080 |
| 12,000 | ATMI, Inc.(b,c) | 327,720 | 30,000 | El Paso Electric Company(c) | 649,500 |
| 33,600 | Belden CDT, Inc. | 669,648 | 12,100 | Otter Tail Power Company | 361,185 |
| 80,540 | Brooks Automation, Inc.(c) | 943,123 | 35,000 | Southwest Gas Corporation | 954,100 |
| 33,700 | Catapult Communications | | 27,000 | UniSource Energy Corporation | 863,190 |
| | Corporation(c) | 616,373 | 36,000 | Vectren Corporation | 977,400 |
|
|
| 55,000 | Entegris, Inc.(c) | 536,800 | | Total Utilities | 5,639,995 |
|
|
| 153,000 | Lattice Semiconductor | | | | |
|
|
| | Corporation(c) | 670,140 | | Total Common Stock | |
| 9,200 | Littelfuse, Inc.(c) | 225,492 | | (cost $83,128,853) | 93,858,667 |
|
|
| |
| |
| The accompanying notes to the financial statements are an integral part of this schedule. | |
|
68
| Partner Small Cap Value Fund | | | |
| Schedule of Investments as of October 31, 2005(a) | | | |
| | | Interest | Maturity | |
| Shares | Collateral Held for Securities Loaned (14.3%) | Rate(d) | Date | Value |
|
| 16,170,830 | Thrivent Financial Securities Lending Trust | 3.950% | N/A | $16,170,830 |
|
|
| | Total Collateral Held for Securities Loaned | |
| | (cost $16,170,830) | | | 16,170,830 |
|
|
| |
| | | Interest | Maturity | |
| Shares | Short-Term Investments (2.4%) | Rate(d) | Date | Value |
|
| 2,680,241 | Thrivent Money Market Fund | 3.600% | N/A | $2,680,241 |
|
|
| | Total Short-Term Investments (at amortized cost) | 2,680,241 |
|
|
| | Total Investments (cost $101,979,924) | | $112,709,738 |
|
|
(a) The categories of investments are shown as a percentage of total investments.
(b) All or a portion of the security is on loan as discussed in item 2(L) of the Notes to Financial Statements.
(c) Non-income producing security.
(d) The interest rate shown reflects the yield, coupon rate or, for securities purchased at a discount, the discount rate at the date of purchase.
The accompanying notes to the financial statements are an integral part of this schedule.
69
| | Small Cap Stock Fund | | |
| | Schedule of Investments as of October 31, 2005(a) | | |
| Shares | Common Stock (80.9%) | Value | Shares | Common Stock (80.9%) | | Value |
|
| |
| Consumer Discretionary (10.1%) | | Energy (7.0%) | | |
| 49,300 | AnnTaylor Stores Corporation(b) | $1,196,511 | 68,600 | Cimarex Energy Company(b) | | $2,693,236 |
| 54,900 | Autoliv, Inc. | 2,358,504 | 62,500 | Comstock Resources, Inc.(b) | | 1,881,875 |
| 38,100 | Boyd Gaming Corporation | 1,571,625 | 73,200 | Dawson Geophysical Company(b,c) | 1,978,596 |
| 66,300 | California Pizza Kitchen, Inc.(b,c) | 2,122,263 | 38,400 | Dril-Quip, Inc.(b,c) | | 1,570,560 |
| 66,400 | Cheesecake Factory, Inc.(b) | 2,278,848 | 74,300 | FMC Technologies, Inc.(b) | | 2,708,978 |
| 35,000 | Children’s Place Retail | | 32,300 | Frontier Oil Corporation | | 1,191,224 |
| | Stores, Inc.(b,c) | 1,502,550 | 38,300 | Helmerich & Payne, Inc. | | 2,121,820 |
| 54,300 | DSW, Inc.(b,c) | 1,130,526 | 40,500 | Massey Energy Company | | 1,622,835 |
| 65,550 | Golf Galaxy, Inc.(b,c) | 1,012,748 | 89,800 | Oil States International, Inc.(b) | | 2,972,380 |
| 48,300 | Guitar Center, Inc.(b) | 2,516,913 | 64,800 | Patterson-UTI Energy, Inc. | | 2,211,624 |
| 99,700 | Insight Enterprises, Inc.(b) | 2,045,844 | 20,200 | Peabody Energy Corporation | | 1,578,832 |
| 181,900 | Interface, Inc.(b) | 1,404,268 | 113,500 | Pioneer Drilling Company(b,c) | | 1,944,255 |
| 44,600 | International Speedway | | 87,500 | Pride International, Inc.(b) | | 2,456,125 |
| | Corporation | 2,304,928 | 88,100 | Range Resources Corporation | | 3,144,289 |
| 50,700 | Joseph A. Bank Clothiers, Inc.(b,c) | 2,069,067 | 102,200 | Superior Energy Services, Inc.(b) | 2,082,836 |
| 117,900 | Lions Gate Entertainment | | 27,100 | Tesoro Petroleum Corporation | | 1,657,165 |
| | Corporation(b,c) | 1,131,840 | 75,400 | Todco | | 3,374,150 |
| 23,368 | M.D.C. Holdings, Inc. | 1,603,045 | 29,100 | Ultra Petroleum Corporation(b,c) | 1,527,459 |
| 82,000 | MarineMax, Inc.(b,c) | 2,025,400 | 52,400 | World Fuel Services Corporation | 1,671,560 |
|
|
| 65,700 | Men’s Wearhouse, Inc.(b) | 1,622,790 | | Total Energy | 40,389,799 |
|
|
| 62,200 | New York & Company, Inc.(b,c) | 839,700 | | | | |
| 57,300 | Nordstrom, Inc. | 1,985,445 | Financials (16.2%) | | |
| 182,200 | Quiksilver, Inc.(b) | 2,100,766 | 53,350 | Affiliated Managers Group, Inc.(b,c) | 4,094,612 |
| 41,800 | R.H. Donnelley Corporation(b,c) | 2,580,314 | 27,800 | Alexandria Real Estate | | |
| 33,000 | Red Robin Gourmet | | | Equities, Inc. | | 2,247,630 |
| | Burgers, Inc.(b,c) | 1,591,590 | 75,800 | American Capital Strategies, Ltd.(c) | 2,847,048 |
| 38,400 | Regis Corporation(c) | 1,473,024 | 100,000 | Argonaut Group, Inc.(b,c) | | 2,916,000 |
| 83,925 | SCP Pool Corporation | 3,018,782 | 66,700 | Asset Acceptance | | |
| 113,550 | Shuffle Master, Inc.(b,c) | 2,879,628 | | Capital Corporation(b,c) | | 1,766,883 |
| 52,200 | Steiner Leisure, Ltd.(b) | 1,779,498 | 87,300 | BioMed Realty Trust, Inc. | | 2,183,373 |
| 104,800 | Texas Roadhouse, Inc.(b,c) | 1,649,552 | 50,111 | BOK Financial Corporation | | 2,205,886 |
| 33,600 | Tractor Supply Company(b) | 1,629,600 | 235,600 | Cardinal Financial Corporation(c) | 2,381,916 |
| 118,600 | Warnaco Group, Inc.(b,c) | 2,689,848 | 95,800 | Center Financial Corporation(c) | 2,427,572 |
| 59,700 | WCI Communities, Inc.(b,c) | 1,493,694 | 117,400 | Colonial BancGroup, Inc. | | 2,858,690 |
| 114,700 | Wolverine World Wide, Inc. | 2,402,965 | 52,400 | EastGroup Properties, Inc.(c) | | 2,289,880 |
|
| |
| | Total Consumer | | 152,600 | Equity Inns, Inc. | | 1,989,904 |
| | Discretionary | 58,012,076 | 131,800 | FelCor Lodging Trust, Inc.(b,c) | | 1,966,456 |
|
| |
| | | | 50,100 | First Community Bancorp, Inc. | 2,521,032 |
| Consumer Staples (1.6%) | | 65,900 | First Indiana Corporation(c) | | 2,303,864 |
| 129,500 | Casey’s General Stores, Inc. | 2,794,610 | 54,500 | Greenhill & Company, Inc.(c) | | 2,613,275 |
| 64,400 | Central Garden & Pet Company(b) | 2,760,828 | 167,750 | HCC Insurance Holdings, Inc. | | 5,032,501 |
| 59,400 | Dean Foods Company(b) | 2,147,310 | 132,400 | HRPT Properties Trust | | 1,444,484 |
| 63,900 | Reddy Ice Holdings, Inc. | 1,391,742 | 29,900 | iShares Russell 2000 Index Fund(c) | 1,910,909 |
|
| |
| | Total Consumer Staples | 9,094,490 | 29,300 | iShares Russell Microcap | | |
|
| |
| | | | | Index Fund | | 1,432,770 |
| |
| |
| The accompanying notes to the financial statements are an integral part of this schedule. | | |
|
70
| Small Cap Stock Fund | | | | | |
| Schedule of Investments as of October 31, 2005(a) | | | | |
| |
| Shares | Common Stock (80.9%) | | Value | Shares | Common Stock (80.9%) | Value |
|
| |
| Financials -- continued | | | 39,900 | Integra LifeSciences Holdings | |
| 34,300 | iShares S&P SmallCap 600 | | | | Corporation(b,c) | $1,376,550 |
| | Index Fund(c) | | $1,909,824 | 22,700 | InterMune, Inc.(b,c) | 308,720 |
| 71,000 | LaSalle Hotel Properties | | 2,512,690 | 34,100 | Intuitive Surgical, Inc.(b) | 3,025,693 |
| 46,100 | MB Financial, Inc.(c) | | 1,718,147 | 37,200 | Kyphon, Inc.(b,c) | 1,491,348 |
| 55,961 | Mercantile Bank Corporation | | 2,134,912 | 45,900 | LCA-Vision, Inc. | 1,928,259 |
| 110,800 | Nexity Financial Corporation(b) | 1,422,672 | 28,200 | Mentor Corporation(c) | 1,269,000 |
| 159,000 | Ohio Casualty Corporation | | 4,337,520 | 44,500 | MGI Pharma, Inc.(b) | 834,820 |
| 27,300 | Philadelphia Consolidated | | | 114,700 | NeoPharm, Inc.(b,c) | 1,102,267 |
| | Holding Corporation(b) | | 2,627,898 | 25,600 | Neurocrine Biosciences, Inc.(b,c) | 1,352,192 |
| 30,400 | Pinnacle Financial Partners, Inc.(b,c) | 687,952 | 213,300 | NovaMed, Inc.(b) | 1,493,313 |
| 55,400 | Piper Jaffray Companies(b,c) | | 1,902,990 | 140,800 | OraSure Technologies, Inc.(b,c) | 1,550,208 |
| 95,600 | Platinum Underwriters | | | 63,600 | Protein Design Labs, Inc.(b) | 1,782,072 |
| | Holdings, Ltd. | | 2,723,644 | 47,700 | Psychiatric Solutions, Inc.(b,c) | 2,609,190 |
| 103,000 | PowerShares Zacks Micro | | | 81,000 | ResMed, Inc.(b,c) | 3,088,530 |
| | Cap Portfolio(b) | | 1,488,350 | 365,500 | Savient Pharmaceuticals, Inc.(b,c) | 1,370,625 |
| 58,800 | RLI Corporation | | 3,160,500 | 46,300 | Sierra Health Services, Inc.(b) | 3,472,500 |
| 36,100 | SL Green Realty Corporation | | 2,455,883 | 84,200 | Sybron Dental Specialties, Inc.(b) | 3,612,180 |
| 40,400 | Sovran Self Storage, Inc. | | 1,879,812 | 70,500 | Symbion, Inc.(b) | 1,595,415 |
| 116,700 | Strategic Hotel Capital, Inc. | | 1,982,733 | 55,100 | Tanox, Inc.(b,c) | 769,196 |
| 48,000 | Taylor Capital Group, Inc.(c) | | 1,974,720 | 93,200 | United Surgical Partners | |
| 62,600 | Virginia Commerce | | | | International, Inc.(b,c) | 3,341,220 |
| | Bancorp, Inc.(b,c) | | 1,721,500 | 62,000 | Vertex Pharmaceuticals, Inc.(b,c) | 1,410,500 |
| 80,777 | Washington Federal, Inc. | | 1,857,063 | 20,050 | Wellcare Health Plans, Inc.(b,c) | 631,575 |
|
|
| 46,700 | Westamerica Bancorporation | | 2,489,577 | | Total Health Care | 64,354,277 |
|
|
| 44,500 | Wintrust Financial Corporation(c) | 2,388,760 | | | |
|
| |
| | Total Financials | | 92,811,832 | | Industrials (14.8%) | |
|
| |
| | | | | 89,000 | Adesa, Inc. | 1,904,600 |
| Health Care (11.2%) | | | 42,200 | ARGON ST, Inc.(b,c) | 1,118,300 |
| 47,300 | Amedisys, Inc.(b,c) | | 1,807,333 | 110,300 | Baldor Electric Company | 2,680,290 |
| 51,700 | ArthroCare Corporation(b,c) | | 1,898,941 | 116,700 | Beacon Roofing Supply, Inc.(b,c) | 3,181,242 |
| 35,700 | Centene Corporation(b,c) | | 719,355 | 53,500 | Consolidated Graphics, Inc.(b) | 2,085,965 |
| 64,300 | Community Health | | | 45,700 | DRS Technologies, Inc. | 2,251,182 |
| | Systems, Inc.(b) | | 2,386,173 | 48,500 | Gardner Denver, Inc.(b) | 2,357,100 |
| 38,700 | Covance, Inc.(b) | | 1,882,755 | 93,900 | Genesee & Wyoming, Inc.(b,c) | 3,009,495 |
| 66,000 | Dade Behring Holdings, Inc. | | 2,376,660 | 62,500 | Genlyte Group, Inc.(b) | 3,185,625 |
| 115,400 | Dexcom, Inc.(b,c) | | 1,501,354 | 28,737 | Graco, Inc. | 984,817 |
| 41,900 | Digene Corporation(b,c) | | 1,265,380 | 49,500 | Hub Group, Inc.(b) | 1,800,315 |
| 83,800 | Endo Pharmaceutical | | | 61,800 | Huron Consulting Group, Inc.(b,c) | 1,640,790 |
| | Holdings, Inc.(b) | | 2,255,896 | 72,650 | IDEX Corporation | 2,907,453 |
| 144,100 | Exelixis, Inc.(b,c) | | 1,113,893 | 128,900 | Interline Brands, Inc.(b,c) | 2,517,417 |
| 63,400 | Haemonetics Corporation(b) | | 3,071,730 | 54,400 | Jacobs Engineering Group, Inc.(b) | 3,468,000 |
| 116,200 | HealthTronics, Inc.(b) | | 1,056,258 | 96,700 | JB Hunt Transport Services, Inc. | 1,876,947 |
| 43,800 | Henry Schein, Inc.(b) | | 1,736,232 | 32,900 | Joy Global, Inc. | 1,509,123 |
| 94,100 | Horizon Health Corporation(b) | | 1,866,944 | 93,600 | Labor Ready, Inc.(b,c) | 2,185,560 |
| | | | | 82,800 | Landstar System, Inc. | 3,189,456 |
| |
| |
| The accompanying notes to the financial statements are an integral part of this schedule. | |
|
71
| Small Cap Stock Fund | | | | |
| Schedule of Investments as of October 31, 2005(a) | | | |
| |
| Shares | Common Stock (80.9%) | Value | Shares | Common Stock (80.9%) | Value |
|
| |
| Industrials -- continued | | 139,300 | Integrated Device | |
| 60,600 | Manitowoc Company, Inc. | $3,224,526 | | Technology, Inc.(b) | $1,376,284 |
| 57,200 | McGrath Rentcorp(c) | 1,633,060 | 62,500 | Inter-Tel, Inc.(c) | 1,156,875 |
| 103,400 | Mercury Computer | | 22,700 | International Rectifier | |
| | Systems, Inc.(b,c) | 1,963,566 | | Corporation(b) | 671,693 |
| 79,200 | MSC Industrial Direct | | 200,400 | iVillage, Inc.(b,c) | 1,472,940 |
| | Company, Inc. | 3,023,856 | 40,650 | Kronos, Inc.(b) | 1,864,209 |
| 89,900 | Oshkosh Truck Corporation | 3,916,044 | 62,900 | Manhattan Associates, Inc.(b) | 1,397,009 |
| 94,800 | Pacer International, Inc. | 2,450,580 | 69,800 | Micrel, Inc.(b) | 698,000 |
| 27,900 | Pall Corporation | 729,864 | 233,800 | Micromuse, Inc.(b) | 1,676,346 |
| 41,900 | Precision Castparts Corporation | 1,984,384 | 43,200 | Microsemi Corporation(b) | 1,000,944 |
| 87,200 | Roper Industries, Inc. | 3,287,440 | 227,600 | MPS Group, Inc.(b) | 2,833,620 |
| 116,500 | SkyWest, Inc. | 3,414,615 | 404,400 | NMS Communications | |
| 174,450 | Standard Parking Corporation(b,c) | 3,359,907 | | Corporation(b,c) | 1,415,400 |
| 77,000 | Stewart & Stevenson Services, Inc. | 1,837,220 | 226,600 | Parametric Technology | |
| 47,200 | Terex Corporation(b) | 2,594,584 | | Corporation(b) | 1,475,166 |
| 97,800 | URS Corporation(b) | 3,954,054 | 162,200 | Phoenix Technologies, Ltd.(b,c) | 963,468 |
| 53,150 | Waste Connections, Inc.(b) | 1,773,616 | 76,100 | Photronics, Inc.(b,c) | 1,369,800 |
| 68,900 | Watson Wyatt & | | 152,100 | Plexus Corporation(b) | 2,687,607 |
| | Company Holdings | 1,825,850 | 150,300 | Powerwave Technologies, Inc.(b,c) | 1,684,863 |
|
| |
| | Total Industrials | 84,826,843 | 51,100 | Progress Software Corporation(b,c) | 1,591,254 |
|
| |
| | | | 52,200 | QLogic Corporation(b) | 1,574,352 |
| Information Technology (13.4%) | | 36,300 | ScanSource, Inc.(b,c) | 2,056,032 |
| 34,800 | ADTRAN, Inc. | 1,052,700 | 122,100 | Stellent, Inc.(b,c) | 1,119,657 |
| 50,700 | Anteon International | | 48,500 | Tech Data Corporation(b) | 1,680,040 |
| | Corporation(b) | 2,291,640 | 149,500 | TIBCO Software, Inc.(b) | 1,134,705 |
| 130,800 | Axcelis Technologies, Inc.(b) | 568,980 | 144,300 | TNS, Inc.(b) | 2,536,794 |
| 80,700 | Benchmark Electronics, Inc.(b) | 2,266,863 | 71,200 | Tollgrade Communications, Inc.(b) | 690,640 |
| 26,500 | Cabot Microelectronics | | 79,100 | Trimble Navigation, Ltd.(b) | 2,283,617 |
| | Corporation(b,c) | 779,100 | 36,600 | Varian Semiconductor | |
| 33,000 | CACI International, Inc.(b) | 1,799,820 | | Equipment Associates, Inc. | 1,384,212 |
| 273,000 | Carrier Access Corporation(b,c) | 1,176,630 | 55,400 | ViaSat, Inc.(b,c) | 1,373,366 |
| 37,300 | Citrix Systems, Inc.(b) | 1,028,361 | 254,900 | Vitria Technology, Inc.(b,c) | 751,955 |
| 126,200 | CNET Networks, Inc.(b,c) | 1,715,058 | 190,700 | webMethods, Inc.(b) | 1,327,272 |
| 38,300 | Cymer, Inc.(b) | 1,334,755 | 149,700 | Wind River Systems, Inc.(b,c) | 1,961,070 |
| 88,600 | Cypress Semiconductor | | 32,100 | Zebra Technologies Corporation(b) | 1,383,831 |
|
|
| | Corporation(b,c) | 1,204,960 | | Total Information | |
| 172,900 | Digitas, Inc.(b) | 1,867,320 | | Technology | 76,754,298 |
|
|
| 27,100 | Diodes, Inc.(b,c) | 982,646 | | | |
| 38,600 | Fairchild Semiconductor | | Materials (3.5%) | |
| | International, Inc.(b) | 594,440 | 87,900 | Airgas, Inc. | 2,484,933 |
| 26,600 | FileNet Corporation(b) | 748,790 | 44,100 | Albemarle Corporation(c) | 1,547,469 |
| 105,000 | FLIR Systems, Inc.(b) | 2,200,800 | 96,100 | Crown Holdings, Inc.(b) | 1,558,742 |
| 75,200 | Global Payments, Inc. | 3,222,320 | 57,350 | Florida Rock Industries, Inc. | 3,263,215 |
| 39,400 | Hyperion Solutions Corporation(b) | 1,905,384 | 40,800 | FMC Corporation(b) | 2,221,152 |
| 102,500 | Informatica Corporation(b) | 1,219,750 | 52,100 | Lubrizol Corporation | 2,166,839 |
| 121,600 | Ingram Micro, Inc.(b) | 2,200,960 | 32,700 | NOVA Chemicals Corporation(c) | 1,170,987 |
| |
| The accompanying notes to the financial statements are an integral part of this schedule. | |
|
72
| Small Cap Stock Fund | | | | |
| Schedule of Investments as of October 31, 2005(a) | | | |
| |
| Shares | Common Stock (80.9%) | Value | Shares | Common Stock (80.9%) | Value |
|
| |
| Materials -- continued | | Utilities (2.4%) | | |
| 115,500 | RPM International, Inc.(c) | $2,150,610 | 55,700 | AGL Resources, Inc. | $1,960,083 |
| 52,100 | Silgan Holdings, Inc. | 1,676,057 | 55,700 | Alliant Energy Corporation | 1,473,265 |
| 50,300 | Steel Dynamics, Inc.(c) | 1,557,791 | 51,046 | Aqua America, Inc.(c) | 1,729,438 |
|
| |
| | Total Materials | 19,797,795 | 101,000 | Energen Corporation | 3,797,600 |
|
| |
| | | | 37,600 | OGE Energy Corporation | 968,576 |
| Telecommunications Services (0.7%) | | 82,400 | Piedmont Natural Gas | |
| 52,300 | FairPoint Communications, Inc.(c) | 714,941 | | | 1,949,584 |
| 96,050 | Iowa Telecommunications | | 37,600 | PNM Resources, Inc. | 953,160 |
| | Services, Inc. | 1,584,825 | 46,600 | Westar Energy, Inc. | 1,029,860 |
|
|
| 125,950 | Valor Communications | | | | 13,861,566 |
|
|
| | Group, Inc.(c) | 1,603,344 | | | |
|
| |
|
| | Total Telecommunications | | | Total Common Stock | |
| | Services | 3,903,110 | | (cost $381,572,907) | 463,806,086 |
|
| |
|
| |
| |
| | | | Interest | Maturity | |
| Shares | Collateral Held for Securities Loaned (15.4%) | Rate(d) | Date | Value |
|
| 88,413,094 | Thrivent Financial Securities Lending Trust | 3.950% | N/A | $88,413,094 |
|
|
| | Total Collateral Held for Securities Loaned | |
| | (cost $88,413,094) | | 88,413,094 |
|
|
| |
| |
| | | | Interest | Maturity | |
| Shares | Short-Term Investments (3.7%) | Rate(d) | Date | Value |
|
| 21,200,500 | Thrivent Money Market Fund | | 3.600% | N/A | $21,200,500 |
|
|
| | Total Short-Term Investments (at amortized cost) | 21,200,500 |
|
|
| | Total Investments (cost $491,186,501) | | $573,419,680 |
|
|
| (a) | The categories of investments are shown as a percentage of total investments. |
| |
| (b) | Non-income producing security. |
| |
| (c) | All or a portion of the security is on loan as discussed in item 2(L) of the Notes to Financial Statements. |
| |
| (d) | The interest rate shown reflects the yield, coupon rate or, for securities purchased at a discount, the discount rate at the date of purchase. |
| |
The accompanying notes to the financial statements are an integral part of this schedule.
73
| | Small Cap Index Fund | |
| | Schedule of Investments as of October 31, 2005(a) | |
| Shares | Common Stock (77.5%) | Value | Shares | Common Stock (77.5%) | Value |
|
| |
| Consumer Discretionary (11.9%) | | 4,075 | Hot Topic, Inc.(b,c) | $60,677 |
| 1,300 | 4Kids Entertainment, Inc.(b,c) | $22,178 | 1,700 | IHOP Corporation(c) | 80,274 |
| 3,875 | Aaron Rents, Inc. | 76,338 | 4,250 | Insight Enterprises, Inc.(b) | 87,210 |
| 1,600 | Action Performance | | 4,200 | Interface, Inc.(b) | 32,424 |
| | Companies, Inc.(c) | 19,616 | 1,800 | J. Jill Group, Inc.(b) | 22,860 |
| 2,850 | ADVO, Inc. | 70,395 | 3,000 | Jack in the Box, Inc.(b) | 89,100 |
| 2,800 | Arbitron, Inc. | 104,748 | 2,400 | JAKKS Pacific, Inc.(b,c) | 44,112 |
| 1,300 | Arctic Cat, Inc. | 24,349 | 2,110 | Jo-Ann Stores, Inc.(b) | 30,827 |
| 1,400 | Ashworth, Inc.(b,c) | 9,842 | 1,000 | Joseph A. Bank Clothiers, Inc.(b,c) | 40,810 |
| 1,700 | Audiovox Corporation(b) | 24,157 | 2,300 | K-Swiss, Inc. | 70,035 |
| 3,100 | Aztar Corporation(b) | 93,217 | 4,100 | K2, Inc.(b,c) | 41,123 |
| 3,200 | Bally Total Fitness | | 2,500 | Kellwood Company(c) | 54,775 |
| | Holding Corporation(b,c) | 18,336 | 4,600 | La-Z-Boy, Inc.(c) | 54,464 |
| 1,100 | Bassett Furniture Industries, Inc. | 20,592 | 1,500 | Landry’s Restaurants, Inc.(c) | 41,250 |
| 1,600 | Brown Shoe Company, Inc. | 51,952 | 1,200 | Libbey, Inc. | 13,500 |
| 1,200 | Building Materials | | 4,000 | Linens ‘n Things, Inc.(b,c) | 100,560 |
| | Holding Corporation(c) | 102,012 | 1,600 | Lone Star Steakhouse & Saloon, Inc. | 41,296 |
| 1,400 | Burlington Coat Factory | | 2,901 | M.D.C. Holdings, Inc. | 199,009 |
| | Warehouse Corporation | 53,984 | 1,100 | M/I Homes, Inc.(c) | 49,390 |
| 2,650 | Cato Corporation | 52,947 | 1,900 | Marcus Corporation(c) | 41,724 |
| 3,050 | CEC Entertainment, Inc.(b) | 103,120 | 1,500 | Meade Instruments Corporation(b,c) | 3,960 |
| 6,200 | Champion Enterprises, Inc.(b,c) | 86,056 | 4,900 | Men’s Wearhouse, Inc.(b) | 121,030 |
| 1,800 | Children’s Place Retail | | 2,000 | Meritage Homes Corporation | 124,540 |
| | Stores, Inc.(b,c) | 77,274 | 1,100 | Midas, Inc.(b,c) | 21,516 |
| 3,200 | Christopher & Banks Corporation(c) | 42,784 | 2,200 | Monaco Coach Corporation(c) | 26,994 |
| 1,400 | Coachmen Industries, Inc. | 16,674 | 2,200 | Movie Gallery, Inc.(c) | 15,312 |
| 1,900 | Cost Plus, Inc.(b) | 29,184 | 2,400 | Multimedia Games, Inc.(b,c) | 23,808 |
| 600 | CPI Corporation | 10,800 | 500 | National Presto Industries, Inc. | 21,915 |
| 1,300 | Department 56, Inc.(b,c) | 14,170 | 2,900 | Nautilus Group, Inc.(c) | 52,577 |
| 2,000 | Dress Barn, Inc.(b,c) | 53,140 | 420 | NVR, Inc.(b) | 287,910 |
| 1,300 | Drew Industries, Inc.(b) | 37,505 | 2,100 | O’Charley’s, Inc.(b) | 28,791 |
| 3,100 | Ethan Allen Interiors, Inc.(c) | 104,842 | 1,200 | Oxford Industries, Inc.(c) | 59,100 |
| 2,270 | Fedders Corporation(c) | 5,221 | 2,300 | P.F. Chang’s China Bistro, Inc.(b,c) | 105,202 |
| 3,900 | Finish Line, Inc. | 60,996 | 2,800 | Panera Bread Company(b) | 165,732 |
| 4,700 | Fleetwood Enterprises, Inc.(b,c) | 51,935 | 1,000 | Papa John’s International, Inc.(b,c) | 51,930 |
| 4,300 | Fossil, Inc.(b,c) | 67,338 | 4,600 | Pep Boys - Manny, Moe & Jack(c) | 63,480 |
| 3,500 | Fred’s, Inc.(c) | 52,150 | 3,200 | Phillips-Van Heusen Corporation | 91,040 |
| 2,000 | Genesco, Inc.(b,c) | 73,600 | 3,600 | Pinnacle Entertainment, Inc.(b,c) | 68,220 |
| 1,900 | Goody’s Family Clothing, Inc.(c) | 18,050 | 3,800 | Polaris Industries, Inc.(c) | 171,342 |
| 1,800 | Group 1 Automotive, Inc.(b) | 49,752 | 900 | Pre-Paid Legal Services, Inc.(c) | 38,520 |
| 2,300 | Guitar Center, Inc.(b) | 119,853 | 10,400 | Quiksilver, Inc.(b) | 119,912 |
| 2,800 | Gymboree Corporation(b) | 49,560 | 3,000 | RARE Hospitality | |
| 600 | Haggar Corporation | 17,100 | | International, Inc.(b) | 91,680 |
| 1,700 | Hancock Fabrics, Inc.(c) | 11,050 | 1,300 | Red Robin Gourmet | |
| 2,100 | Haverty Furniture | | | Burgers, Inc.(b,c) | 62,699 |
| | Companies, Inc.(c) | 25,704 | 1,100 | Russ Berrie and Company, Inc.(c) | 14,839 |
| 3,150 | Hibbett Sporting Goods, Inc.(b) | 82,624 | 2,900 | Russell Corporation | 39,237 |
| |
| The accompanying notes to the financial statements are an integral part of this schedule. | |
|
74
| Small Cap Index Fund | | | | |
| Schedule of Investments as of October 31, 2005(a) | | | | |
| |
| Shares | Common Stock (77.5%) | Value | Shares | Common Stock (77.5%) | Value |
|
| |
| Consumer Discretionary -- continued | | 4,900 | NBTY, Inc.(b,c) | $98,049 |
| 3,600 | Ryan’s Restaurant Group, Inc.(b) | $38,376 | 1,200 | Peet’s Coffee & Tea, Inc.(b,c) | 39,924 |
| 4,675 | SCP Pool Corporation | 168,160 | 3,200 | Performance Food | |
| 3,100 | Select Comfort Corporation(b,c) | 67,890 | | Group Company(b,c) | 88,288 |
| 2,700 | ShopKo Stores, Inc.(b,c) | 77,409 | 2,600 | Ralcorp Holdings, Inc.(b) | 101,140 |
| 2,975 | Shuffle Master, Inc.(b,c) | 75,446 | 1,200 | Sanderson Farms, Inc. | 41,412 |
| 600 | Skyline Corporation(c) | 23,850 | 3,200 | Spectrum Brands, Inc.(b) | 66,240 |
| 2,600 | Sonic Automotive, Inc. | 57,486 | 2,700 | TreeHouse Foods, Inc.(b) | 69,768 |
| 5,250 | Sonic Corporation(b) | 151,935 | 3,600 | United Natural Foods, Inc.(b) | 101,196 |
| 2,400 | Stage Stores, Inc. | 66,528 | 900 | USANA Health Sciences, Inc.(b,c) | 39,618 |
| 1,200 | Standard Motor Products, Inc.(c) | 10,032 | 1,500 | WD-40 Company(c) | 41,295 |
|
|
| 5,800 | Standard Pacific Corporation | 223,764 | | Total Consumer Staples | 1,562,962 |
|
|
| 2,400 | Steak n Shake Company(b) | 44,208 | | | |
| 2,300 | Stein Mart, Inc. | 42,205 | Energy (7.0%) | |
| 3,200 | Stride Rite Corporation | 41,664 | 1,100 | Atwood Oceanics, Inc.(b) | 77,462 |
| 2,000 | Sturm, Ruger & Company, Inc.(c) | 14,660 | 4,300 | Cabot Oil & Gas Corporation | 196,897 |
| 2,000 | Superior Industries | | 3,400 | Cal Dive International, Inc.(b,c) | 209,236 |
| | International, Inc.(c) | 40,700 | 1,800 | Carbo Ceramics, Inc. | 106,488 |
| 2,000 | TBC Corporation(b) | 69,180 | 7,200 | Cimarex Energy Company(b) | 282,672 |
| 1,000 | Thomas Nelson, Inc. | 21,410 | 700 | Dril-Quip, Inc.(b) | 28,630 |
| 2,900 | Too, Inc.(b) | 82,389 | 5,000 | Frontier Oil Corporation | 184,400 |
| 2,900 | Tractor Supply Company(b) | 140,650 | 1,800 | Hydril Company(b) | 119,412 |
| 4,700 | Triarc Companies, Inc.(c) | 69,889 | 6,100 | Input/Output, Inc.(b,c) | 46,848 |
| 900 | Vertrue, Inc.(b,c) | 33,885 | 2,600 | Lone Star Technologies, Inc.(b) | 118,950 |
| 2,900 | Winnebago Industries, Inc.(c) | 85,028 | 6,600 | Massey Energy Company(c) | 264,462 |
| 2,000 | WMS Industries, Inc.(b,c) | 50,260 | 3,800 | Maverick Tube Corporation(b,c) | 117,648 |
| 5,150 | Wolverine World Wide, Inc. | 107,892 | 2,300 | Oceaneering International, Inc.(b) | 110,676 |
| 4,500 | Zale Corporation(b) | 126,135 | 2,100 | Offshore Logistics, Inc.(b) | 71,400 |
|
| |
| | Total Consumer | | 1,600 | Penn Virginia Corporation | 86,976 |
| | Discretionary | 7,002,882 | 1,400 | Petroleum Development | |
|
| |
| | | | | Corporation(b,c) | 47,012 |
| Consumer Staples (2.7%) | | 2,000 | Remington Oil and | |
| 7,800 | Alliance One International, Inc.(c) | 19,422 | | Gas Corporation(b) | 70,000 |
| 1,600 | American Italian Pasta Company | 10,320 | 1,800 | SEACOR Holdings, Inc.(b,c) | 128,934 |
| 4,400 | Casey’s General Stores, Inc. | 94,952 | 7,100 | Southwestern Energy Company(b) | 515,034 |
| 6,400 | Corn Products International, Inc. | 152,384 | 2,200 | Spinnaker Exploration Company(b) | 135,476 |
| 3,100 | Delta & Pine Land Company | 77,345 | 5,100 | St. Mary Land & Exploration | |
| 4,475 | Flowers Foods, Inc. | 131,118 | | Company(c) | 173,451 |
| 1,500 | Great Atlantic & Pacific Tea | | 2,300 | Stone Energy Corporation(b) | 105,570 |
| | Company, Inc.(b,c) | 42,135 | 2,500 | Swift Energy Company(b) | 109,150 |
| 2,700 | Hain Celestial Group, Inc.(b) | 52,164 | 3,000 | TETRA Technologies, Inc.(b) | 83,910 |
| 1,100 | Hansen Natural Corporation(b,c) | 55,572 | 4,000 | Unit Corporation(b) | 209,600 |
| 700 | J & J Snack Foods Corporation | 39,487 | 3,000 | Veritas DGC, Inc.(b,c) | 96,630 |
| 2,600 | Lance, Inc. | 45,578 | 4,800 | Vintage Petroleum, Inc. | 249,072 |
| 2,400 | Longs Drug Stores Corporation | 100,104 | 2,400 | W-H Energy Services, Inc.(b) | 72,720 |
| 1,100 | Nash Finch Company(c) | 34,166 | 2,300 | World Fuel Services Corporation | 73,370 |
|
|
| 1,100 | Nature’s Sunshine Products, Inc. | 21,285 | | Total Energy | 4,092,086 |
|
|
| |
| The accompanying notes to the financial statements are an integral part of this schedule. | |
|
75
| Small Cap Index Fund | | | | |
| Schedule of Investments as of October 31, 2005(a) | | | | |
| |
| Shares | Common Stock (77.5%) | Value | Shares | Common Stock (77.5%) | Value |
|
| |
| Financials (11.9%) | | 2,400 | MAF Bancorp, Inc. | $99,696 |
| 2,800 | Acadia Realty Trust | $53,200 | 1,700 | Nara Bancorp, Inc. | 30,651 |
| 6,200 | Amegy Bancorp, Inc.(c) | 143,406 | 4,950 | New Century Financial Corporation | 152,806 |
| 1,700 | Anchor BanCorp Wisconsin, Inc.(c) | 53,822 | 1,400 | Parkway Properties, Inc. | 65,814 |
| 3,900 | BankAtlantic Bancorp, Inc. | 54,171 | 1,600 | Philadelphia Consolidated | |
| 2,300 | BankUnited Financial Corporation | 54,556 | | Holding Corporation(b) | 154,016 |
| 2,700 | Boston Private Financial | | 1,800 | Piper Jaffray Companies(b) | 61,830 |
| | Holdings, Inc.(c) | 78,165 | 1,900 | Presidential Life Corporation | 35,948 |
| 5,400 | Brookline Bancorp, Inc.(c) | 75,870 | 1,600 | PrivateBancorp, Inc.(c) | 54,352 |
| 3,700 | Capital Automotive REIT | 142,894 | 2,600 | ProAssurance Corporation(b) | 121,680 |
| 2,600 | Cash America International, Inc.(c) | 56,836 | 1,700 | Prosperity Bancshares, Inc.(c) | 51,833 |
| 2,700 | Central Pacific Financial | | 3,055 | Provident Bankshares Corporation | 106,497 |
| | Corporation | 97,470 | 6,114 | Republic Bancorp, Inc. | 83,456 |
| 4,175 | Chittenden Corporation(c) | 120,115 | 1,900 | Rewards Network, Inc.(b,c) | 10,241 |
| 3,800 | Colonial Properties Trust | 166,098 | 1,900 | RLI Corporation | 102,125 |
| 3,400 | Commercial Federal Corporation | 116,280 | 900 | SCPIE Holdings, Inc.(b,c) | 13,590 |
| 4,800 | Commercial Net Lease Realty, Inc. | 93,024 | 2,400 | Selective Insurance Group, Inc. | 131,784 |
| 2,700 | Community Bank System, Inc.(c) | 64,125 | 4,200 | Shurgard Storage Centers, Inc. | 237,006 |
| 2,400 | Delphi Financial Group, Inc. | 112,416 | 6,600 | South Financial Group, Inc. | 181,962 |
| 2,450 | Dime Community Bancshares | 35,280 | 1,600 | Sovran Self Storage, Inc. | 74,448 |
| 1,800 | Downey Financial Corporation | 109,710 | 4,050 | Sterling Bancshares, Inc. | 59,900 |
| 5,000 | East West Bancorp, Inc. | 191,450 | 3,120 | Sterling Financial Corporation | 78,125 |
| 2,000 | EastGroup Properties, Inc. | 87,400 | 1,500 | Stewart Information | |
| 2,400 | Entertainment Properties Trust | 96,240 | | Services Corporation | 76,395 |
| 2,000 | Essex Property Trust, Inc. | 179,760 | 4,100 | Susquehanna Bancshares, Inc.(c) | 94,669 |
| 1,600 | Financial Federal Corporation(c) | 61,088 | 1,493 | SWS Group, Inc. | 26,441 |
| 7,000 | First BanCorp | 79,940 | 6,633 | TrustCo Bank Corporation NY(c) | 85,566 |
| 4,100 | First Midwest Bancorp, Inc. | 155,882 | 8,100 | UCBH Holdings, Inc.(c) | 140,940 |
| 2,000 | First Republic Bank | 75,820 | 2,600 | UICI(c) | 93,912 |
| 1,400 | FirstFed Financial Corporation(b,c) | 74,886 | 3,900 | Umpqua Holdings Corporation(c) | 103,740 |
| 3,100 | Flagstar Bancorp, Inc.(c) | 41,602 | 3,200 | United Bankshares, Inc.(c) | 116,800 |
| 2,000 | Franklin Bank Corporation(b,c) | 34,500 | 1,400 | United Fire & Casual Company(c) | 63,028 |
| 5,600 | Fremont General Corporation(c) | 121,464 | 5,675 | Whitney Holding Corporation | 153,225 |
| 3,300 | Glenborough Realty Trust, Inc.(c) | 63,129 | 2,000 | Wintrust Financial Corporation | 107,360 |
| 3,500 | Gold Banc Corporation, Inc.(c) | 51,870 | 1,694 | World Acceptance Corporation(b) | 47,669 |
| 3,200 | Hilb, Rogal and Hobbs Company(c) | 119,840 | 3,000 | Zenith National Insurance | |
| 3,850 | Hudson United Bancorp(c) | 159,660 | | Corporation | 135,060 |
|
|
| 1,900 | Infinity Property & | | | Total Financials | 6,948,252 |
|
|
| | Casualty Corporation | 70,718 | | | |
| 3,700 | Investment Technology | | Health Care (9.9%) | |
| | Group, Inc.(b) | 120,287 | 1,800 | Advanced Neuromodulation | |
| 1,700 | Irwin Financial Corporation(c) | 35,479 | | Systems, Inc.(b) | 109,782 |
| 2,600 | Kilroy Realty Corporation | 145,990 | 3,600 | Alpharma, Inc. | 89,604 |
| 1,600 | LandAmerica Financial | | 1,300 | Amedisys, Inc.(b,c) | 49,673 |
| | Group, Inc.(c) | 101,056 | 2,900 | American Healthways, Inc.(b) | 117,624 |
| 4,600 | Lexington Corporate | | 6,200 | American Medical Systems | |
| | Properties Trust(c) | 100,188 | | Holdings, Inc.(b) | 101,370 |
| |
| The accompanying notes to the financial statements are an integral part of this schedule. | |
|
76
| Small Cap Index Fund | | | | |
| Schedule of Investments as of October 31, 2005(a) | | | | |
| |
| Shares | Common Stock (77.5%) | Value | Shares | Common Stock (77.5%) | Value |
|
| |
| Health Care -- continued | | 3,200 | NDCHealth Corporation | $60,288 |
| 4,400 | AMERIGROUP Corporation(b) | $73,568 | 2,100 | Noven Pharmaceuticals, Inc.(b) | 29,589 |
| 2,700 | AmSurg Corporation(b) | 64,125 | 3,050 | Odyssey Healthcare, Inc.(b,c) | 52,704 |
| 1,200 | Analogic Corporation | 56,160 | 1,700 | Osteotech, Inc.(b,c) | 5,780 |
| 3,100 | ArQule, Inc.(b) | 22,134 | 3,500 | Owens & Minor, Inc. | 103,075 |
| 2,100 | ArthroCare Corporation(b,c) | 77,133 | 2,300 | PAREXEL International | |
| 2,000 | BioLase Technology, Inc.(c) | 13,360 | | Corporation(b) | 50,324 |
| 1,500 | Biosite, Inc.(b,c) | 82,845 | 2,000 | Pediatrix Medical Group, Inc.(b) | 154,120 |
| 1,300 | Bradley Pharmaceuticals, Inc.(b,c) | 15,652 | 4,400 | Pharmaceutical Product | |
| 2,300 | Cambrex Corporation | 43,884 | | Development, Inc. | 252,868 |
| 3,700 | Centene Corporation(b) | 74,555 | 2,100 | PolyMedica Corporation | 69,321 |
| 2,700 | Cerner Corporation(b,c) | 228,015 | 1,600 | Possis Medical, Inc.(b,c) | 18,976 |
| 2,200 | Chemed Corporation | 105,776 | 3,900 | Regeneron Pharmaceuticals, Inc.(b,c) | 48,789 |
| 1,200 | CNS, Inc.(c) | 31,284 | 1,500 | RehabCare Group, Inc.(b) | 31,935 |
| 2,600 | CONMED Corporation(b) | 62,348 | 6,200 | ResMed, Inc.(b,c) | 236,406 |
| 3,000 | Connetics Corporation(b,c) | 39,120 | 6,400 | Respironics, Inc.(b) | 229,568 |
| 3,900 | Cooper Companies, Inc. | 268,476 | 5,400 | Savient Pharmaceuticals, Inc.(b,c) | 20,250 |
| 1,900 | Cross Country Healthcare, Inc.(b) | 34,523 | 1,500 | SFBC International, Inc.(b,c) | 63,960 |
| 2,050 | CryoLife, Inc.(b,c) | 13,366 | 2,200 | Sierra Health Services, Inc.(b) | 165,000 |
| 1,900 | Cyberonics, Inc.(b) | 57,038 | 3,000 | Sunrise Senior Living, Inc.(b,c) | 97,020 |
| 1,100 | Datascope Corporation | 34,947 | 1,300 | SurModics, Inc.(b,c) | 51,376 |
| 3,800 | Dendrite International, Inc.(b) | 66,690 | 3,600 | Sybron Dental Specialties, Inc.(b) | 154,440 |
| 2,000 | Diagnostic Products Corporation | 84,200 | 3,000 | Theragenics Corporation(b) | 9,030 |
| 1,800 | Dionex Corporation(b) | 87,174 | 3,900 | United Surgical Partners | |
| 1,800 | DJ Orthopedics, Inc.(b) | 52,344 | | International, Inc.(b) | 139,815 |
| 2,422 | Enzo Biochem, Inc.(b,c) | 33,036 | 2,800 | Viasys Healthcare, Inc.(b) | 66,892 |
| 2,000 | Gentiva Health Services, Inc.(b) | 29,380 | 700 | Vital Signs, Inc. | 32,886 |
|
|
| 1,800 | Greatbatch Technologies, Inc.(b) | 46,908 | | Total Health Care | 5,786,113 |
|
|
| 2,300 | Haemonetics Corporation(b) | 111,435 | | | |
| 1,900 | Hologic, Inc.(b) | 105,374 | Industrials (14.3%) | |
| 5,700 | Hooper Holmes, Inc. | 16,473 | 1,800 | A.O. Smith Corporation(c) | 58,284 |
| 1,200 | ICU Medical, Inc.(b,c) | 41,892 | 1,600 | A.S.V., Inc.(b,c) | 37,344 |
| 2,800 | IDEXX Laboratories, Inc.(b) | 196,364 | 2,900 | AAR Corporation(b) | 46,197 |
| 3,975 | Immucor, Inc.(b) | 103,032 | 3,500 | ABM Industries, Inc. | 69,230 |
| 1,600 | Integra LifeSciences | | 3,900 | Acuity Brands, Inc. | 108,459 |
| | Holdings Corporation(b,c) | 55,200 | 1,900 | Administaff, Inc. | 80,408 |
| 2,284 | Intermagnetics General | | 2,800 | Albany International Corporation | 108,164 |
| | Corporation(b) | 65,437 | 1,000 | Angelica Corporation | 14,190 |
| 2,800 | Invacare Corporation | 94,612 | 2,600 | Apogee Enterprises, Inc. | 42,588 |
| 800 | Kensey Nash Corporation(b,c) | 18,344 | 2,250 | Applied Industrial | |
| 1,800 | Laserscope(b,c) | 48,618 | | Technologies, Inc. | 74,138 |
| 1,800 | LCA-Vision, Inc.(c) | 75,618 | 1,100 | Applied Signal Technology, Inc.(c) | 18,876 |
| 4,800 | Medicis Pharmaceutical | | 2,200 | Arkansas Best Corporation | 85,272 |
| | Corporation | 141,600 | 2,500 | Armor Holdings, Inc.(b) | 111,775 |
| 3,300 | Mentor Corporation(c) | 148,500 | 3,600 | Artesyn Technologies, Inc.(b,c) | 31,644 |
| 2,300 | Merit Medical Systems, Inc.(b) | 27,416 | 1,500 | Astec Industries, Inc.(b) | 42,540 |
| 6,700 | MGI Pharma, Inc.(b,c) | 125,692 | 2,700 | Baldor Electric Company | 65,610 |
| |
| The accompanying notes to the financial statements are an integral part of this schedule. | |
|
77
| Small Cap Index Fund | | | | |
| Schedule of Investments as of October 31, 2005(a) | | | | |
| |
| Shares | Common Stock (77.5%) | Value | Shares | Common Stock (77.5%) | Value |
|
| |
| Industrials -- continued | | 5,000 | Lennox International, Inc. | $139,450 |
| 1,600 | Barnes Group, Inc.(c) | $56,000 | 1,100 | Lindsay Manufacturing Company | 22,605 |
| 2,900 | Bowne & Company, Inc.(c) | 41,238 | 1,600 | Lydall, Inc.(b) | 14,336 |
| 4,300 | Brady Corporation | 123,711 | 2,700 | MagneTek, Inc.(b) | 8,559 |
| 4,600 | Briggs & Stratton Corporation | 147,108 | 2,600 | Manitowoc Company, Inc. | 138,346 |
| 2,300 | C&D Technologies, Inc. | 20,999 | 1,800 | Mercury Computer Systems, Inc.(b) | 34,182 |
| 1,200 | CDI Corporation | 33,084 | 2,600 | Mesa Air Group, Inc.(b,c) | 29,328 |
| 1,600 | Central Parking Corporation(c) | 23,968 | 1,300 | Mobile Mini, Inc.(b,c) | 60,684 |
| 2,150 | Ceradyne, Inc.(b,c) | 84,280 | 2,925 | Moog, Inc.(b) | 86,726 |
| 4,000 | CLARCOR, Inc. | 110,000 | 3,200 | Mueller Industries, Inc. | 88,128 |
| 2,200 | Coinstar, Inc.(b,c) | 55,836 | 1,800 | NCI Building Systems, Inc.(b,c) | 74,034 |
| 1,000 | Consolidated Graphics, Inc.(b) | 38,990 | 2,800 | NCO Group, Inc.(b) | 50,316 |
| 1,600 | Cubic Corporation(c) | 26,256 | 1,600 | Old Dominion Freight Line(b) | 56,624 |
| 1,900 | Curtiss-Wright Corporation | 108,965 | 2,300 | On Assignment, Inc.(b) | 19,573 |
| 2,500 | DRS Technologies, Inc. | 123,150 | 6,300 | Oshkosh Truck Corporation | 274,428 |
| 1,500 | EDO Corporation | 43,350 | 3,800 | PRG-Schultz International, Inc.(b,c) | 3,344 |
| 2,800 | EGL, Inc.(b) | 78,484 | 2,500 | Regal-Beloit Corporation(c) | 79,575 |
| 1,600 | ElkCorp | 50,608 | 1,200 | Robbins & Myers, Inc.(c) | 25,908 |
| 1,400 | EMCOR Group, Inc.(b) | 85,400 | 7,600 | Roper Industries, Inc. | 286,519 |
| 3,687 | Engineered Support Systems, Inc. | 149,139 | 2,100 | School Specialty, Inc.(b) | 71,190 |
| 1,900 | EnPro Industries, Inc.(b) | 53,010 | 7,000 | Shaw Group, Inc.(b) | 187,600 |
| 2,300 | Esterline Technologies | | 3,200 | Simpson Manufacturing | |
| | Corporation(b) | 86,595 | | Company, Inc.(c) | 126,272 |
| 2,700 | Forward Air Corporation | 95,715 | 5,100 | SkyWest, Inc. | 149,481 |
| 3,200 | Frontier Airlines, Inc.(b,c) | 30,240 | 1,300 | SOURCECORP, Inc.(b) | 29,575 |
| 1,800 | G & K Services, Inc. | 68,202 | 5,500 | Spherion Corporation(b) | 48,950 |
| 2,200 | Gardner Denver, Inc.(b) | 106,920 | 1,100 | Standard Register Company | 16,720 |
| 4,800 | GenCorp, Inc.(b,c) | 88,032 | 1,000 | Standex International Corporation | 27,020 |
| 2,220 | Griffon Corporation(b,c) | 48,840 | 2,600 | Stewart & Stevenson | |
| 2,450 | Healthcare Services Group, Inc(c) | 45,668 | | Services, Inc.(c) | 62,036 |
| 4,001 | Heartland Express, Inc. | 79,020 | 2,900 | Teledyne Technologies, Inc.(b) | 102,254 |
| 1,700 | Heidrick & Struggles | | 5,000 | Tetra Tech, Inc.(b) | 77,200 |
| | International, Inc.(b) | 54,876 | 3,800 | Toro Company | 138,738 |
| 1,800 | Hub Group, Inc.(b) | 65,466 | 2,500 | Tredegar Corporation | 31,475 |
| 5,900 | Hughes Supply, Inc. | 197,355 | 1,500 | Triumph Group, Inc.(b) | 52,260 |
| 4,550 | IDEX Corporation | 182,091 | 3,000 | United Stationers, Inc.(b) | 136,110 |
| 2,300 | Insituform Technologies, Inc.(b) | 41,308 | 1,400 | Universal Forest Products, Inc. | 77,476 |
| 4,500 | JLG Industries, Inc. | 172,620 | 3,700 | URS Corporation(b) | 149,591 |
| 2,500 | John H. Harland Company | 103,975 | 1,500 | Valmont Industries, Inc. | 48,855 |
| 2,000 | Kaman Corporation | 46,860 | 2,000 | Viad Corporation | 57,620 |
| 7,300 | Kansas City Southern, Inc.(b,c) | 161,768 | 1,600 | Vicor Corporation(c) | 26,960 |
| 2,400 | Kaydon Corporation(c) | 70,920 | 800 | Volt Information Sciences, Inc.(b) | 15,040 |
| 2,100 | Kirby Corporation(b) | 108,507 | 2,700 | Wabash National Corporation(c) | 49,707 |
| 3,350 | Knight Transportation, Inc. | 91,154 | 4,050 | Waste Connections, Inc.(b) | 135,148 |
| 4,700 | Labor Ready, Inc.(b) | 109,745 | 2,100 | Watsco, Inc. | 119,343 |
| 4,800 | Landstar System, Inc. | 184,896 | 3,600 | Watson Wyatt & Company | |
| 500 | Lawson Products, Inc.(c) | 17,075 | | Holdings | 95,400 |
| |
| The accompanying notes to the financial statements are an integral part of this schedule. | |
|
78
| Small Cap Index Fund | | | | |
| Schedule of Investments as of October 31, 2005(a) | | | | |
| |
| Shares | Common Stock (77.5%) | Value | Shares | Common Stock (77.5%) | Value |
|
| |
| Industrials -- continued | | 1,100 | EPIQ Systems, Inc.(b,c) | $20,955 |
| 2,300 | Watts Water Technologies, Inc. | $63,848 | 3,200 | ESS Technology, Inc.(b,c) | 9,248 |
| 1,500 | Wolverine Tube, Inc.(b) | 9,570 | 3,200 | Exar Corporation(b) | 40,288 |
| 900 | Woodward Governor Company | 71,910 | 2,900 | FactSet Research Systems, Inc.(c) | 101,703 |
|
| |
| | Total Industrials | 8,376,157 | 2,200 | FEI Company(b,c) | 41,580 |
|
| |
| | | | 3,700 | FileNet Corporation(b) | 104,155 |
| Information Technology (11.8%) | | 6,200 | FLIR Systems, Inc.(b) | 129,952 |
| 2,400 | Actel Corporation(b) | 33,480 | 2,000 | Gerber Scientific, Inc.(b) | 15,820 |
| 9,800 | Adaptec, Inc.(b) | 40,278 | 2,500 | Gevity HR, Inc. | 64,350 |
| 2,500 | Advanced Energy Industries, Inc.(b) | 26,875 | 2,100 | Global Imaging Systems, Inc.(b) | 74,781 |
| 6,600 | Aeroflex, Inc.(b) | 59,796 | 5,680 | Global Payments, Inc. | 243,388 |
| 2,800 | Agilysys, Inc.(c) | 41,832 | 6,500 | Harmonic, Inc.(b,c) | 29,965 |
| 2,000 | Altiris, Inc.(b) | 33,800 | 2,200 | Hutchinson Technology, Inc.(b) | 54,560 |
| 2,800 | Anixter International, Inc. | 103,824 | 3,600 | Hyperion Solutions Corporation(b) | 174,096 |
| 2,800 | ANSYS, Inc.(b) | 104,328 | 1,800 | Inter-Tel, Inc. | 33,318 |
| 3,300 | ATMI, Inc.(b) | 90,123 | 3,400 | Internet Security Systems, Inc.(b) | 83,742 |
| 3,647 | Avid Technology, Inc.(b) | 179,542 | 1,544 | Intrado, Inc.(b,c) | 29,861 |
| 8,900 | Axcelis Technologies, Inc.(b) | 38,715 | 1,000 | iPayment Holdings, Inc.(b) | 35,960 |
| 1,100 | Bel Fuse, Inc.(c) | 33,110 | 2,100 | Itron, Inc.(b) | 91,266 |
| 4,025 | Belden CDT, Inc. | 80,218 | 2,100 | J2 Global Communication, Inc.(b,c) | 92,841 |
| 2,600 | Bell Microproducts, Inc.(b,c) | 17,914 | 2,400 | JDA Software Group, Inc.(b) | 38,808 |
| 3,600 | Benchmark Electronics, Inc.(b) | 101,124 | 3,900 | Keane, Inc.(b,c) | 44,070 |
| 1,400 | Black Box Corporation | 56,168 | 1,400 | Keithley Instruments, Inc. | 22,470 |
| 6,553 | Brooks Automation, Inc.(b) | 76,736 | 6,000 | Kopin Corporation(b) | 33,900 |
| 4,200 | C-COR, Inc.(b,c) | 22,386 | 2,850 | Kronos, Inc.(b) | 130,701 |
| 2,600 | CACI International, Inc.(b) | 141,804 | 4,700 | Kulicke and Soffa Industries, Inc.(b,c) | 29,469 |
| 2,600 | Captaris, Inc.(b) | 9,360 | 2,000 | Littelfuse, Inc.(b) | 49,020 |
| 2,000 | Carreker Corporation(b,c) | 10,980 | 2,500 | Manhattan Associates, Inc.(b) | 55,525 |
| 900 | Catapult Communications | | 1,600 | ManTech International | |
| | Corporation(b) | 16,461 | | Corporation(b) | 44,320 |
| 3,300 | Checkpoint Systems, Inc.(b) | 79,200 | 1,900 | MapInfo Corporation(b) | 23,351 |
| 4,900 | CIBER, Inc.(b) | 31,262 | 1,700 | MAXIMUS, Inc. | 61,625 |
| 4,000 | Cognex Corporation | 114,320 | 3,300 | Methode Electronics, Inc. | 33,858 |
| 2,700 | Coherent, Inc.(b) | 79,947 | 3,400 | MICROS Systems, Inc.(b) | 156,128 |
| 1,800 | Cohu, Inc. | 41,688 | 5,600 | Microsemi Corporation(b) | 129,752 |
| 1,700 | Comtech Telecommunications | | 2,400 | MIVA, Inc.(b,c) | 13,368 |
| | Corporation(b) | 65,212 | 1,900 | MRO Software, Inc.(b,c) | 31,122 |
| 3,300 | CTS Corporation(c) | 38,874 | 1,700 | MTS Systems Corporation | 67,932 |
| 3,100 | Cymer, Inc.(b) | 108,035 | 3,800 | Napster, Inc.(b,c) | 13,756 |
| 1,300 | Daktronics, Inc. | 28,093 | 2,800 | NETGEAR, Inc.(b,c) | 54,740 |
| 1,800 | Digi International, Inc.(b) | 19,098 | 2,200 | Network Equipment | |
| 3,100 | Digital Insight Corporation(b) | 92,473 | | Technologies, Inc.(b,c) | 10,978 |
| 2,900 | Ditech Communications | | 1,900 | Open Solutions, Inc.(b) | 40,679 |
| | Corporation(b,c) | 18,473 | 1,700 | Park Electrochemical Corporation | 42,670 |
| 2,500 | DSP Group, Inc.(b) | 61,450 | 3,200 | Paxar Corporation(b) | 54,944 |
| 3,900 | eFunds Corporation(b) | 80,457 | 1,900 | PC TEL, Inc.(b) | 17,575 |
| 2,500 | Electro Scientific Industries, Inc.(b) | 54,925 | 1,600 | Pegasus Solutions, Inc.(b,c) | 13,568 |
The accompanying notes to the financial statements are an integral part of this schedule.
79
| Small Cap Index Fund | | | | |
| Schedule of Investments as of October 31, 2005(a) | | | | |
| |
| Shares | Common Stock (77.5%) | Value | Shares | Common Stock (77.5%) | Value |
|
| |
| Information Technology -- continued | | Materials (4.3%) | |
| 2,300 | Pericom Semiconductor | | 2,700 | A. Schulman, Inc. | $55,107 |
| | Corporation(b) | $18,262 | 900 | A.M. Castle & Company(b) | 17,937 |
| 2,200 | Phoenix Technologies, Ltd.(b) | 13,068 | 2,696 | Aleris International, Inc.(b,c) | 69,988 |
| 1,500 | Photon Dynamics, Inc(b,c) | 26,115 | 2,000 | AMCOL International Corporation | 40,640 |
| 3,600 | Photronics, Inc.(b,c) | 64,800 | 3,100 | AptarGroup, Inc. | 158,689 |
| 1,500 | Planar Systems, Inc.(b,c) | 13,380 | 2,100 | Arch Chemicals, Inc. | 55,167 |
| 2,600 | Power Integrations, Inc.(b) | 54,886 | 1,700 | Brush Engineered | |
| 3,500 | Progress Software Corporation(b) | 108,990 | | Materials, Inc.(b,c) | 25,636 |
| 2,000 | Radiant Systems, Inc.(b) | 22,720 | 2,800 | Buckeye Technologies, Inc.(b) | 21,000 |
| 1,700 | RadiSys Corporation(b) | 27,319 | 2,500 | Caraustar Industries, Inc.(b,c) | 21,825 |
| 1,500 | Rogers Corporation(b) | 56,025 | 1,900 | Carpenter Technology Corporation | 114,570 |
| 1,400 | Rudolph Technologies, Inc.(b) | 17,052 | 2,000 | Century Aluminum Company(b,c) | 36,360 |
| 1,500 | SBS Technologies, Inc.(b) | 14,640 | 2,000 | Chaparral Steel Company(b,c) | 49,960 |
| 1,100 | ScanSource, Inc.(b,c) | 62,304 | 1,900 | Chesapeake Corporation | 38,266 |
| 3,100 | Secure Computing Corporation(b) | 37,138 | 1,900 | Cleveland-Cliffs, Inc.(c) | 154,926 |
| 2,400 | SERENA Software, Inc.(b,c) | 52,536 | 5,000 | Commercial Metals Company | 158,950 |
| 13,700 | Skyworks Solutions, Inc.(b,c) | 73,432 | 1,100 | Deltic Timber Corporation(c) | 50,600 |
| 2,100 | Sonic Solutions, Inc.(b,c) | 40,194 | 4,086 | Florida Rock Industries, Inc. | 232,493 |
| 1,400 | SPSS, Inc.(b) | 31,920 | 3,100 | Georgia Gulf Corporation(c) | 90,210 |
| 1,500 | SS&C Technologies, Inc. | 53,760 | 2,500 | H.B. Fuller Company | 74,925 |
| 1,800 | Standard Microsystems | | 3,700 | Headwaters, Inc.(b,c) | 117,808 |
| | Corporation(b) | 50,886 | 2,200 | MacDermid, Inc. | 61,600 |
| 1,100 | StarTek, Inc.(c) | 13,992 | 1,200 | Material Sciences Corporation(b) | 18,240 |
| 1,000 | Supertex, Inc.(b,c) | 36,640 | 2,698 | Myers Industries, Inc. | 30,811 |
| 4,050 | Symmetricom, Inc.(b,c) | 32,278 | 1,500 | Neenah Paper, Inc.(c) | 43,575 |
| 2,100 | Synaptics, Inc.(b,c) | 48,783 | 2,500 | OM Group, Inc.(b) | 39,950 |
| 6,150 | Take-Two Interactive | | 3,700 | OMNOVA Solutions, Inc.(b) | 16,650 |
| | Software, Inc.(b,c) | 126,998 | 900 | Penford Corporation | 11,736 |
| 1,900 | TALX Corporation | 75,107 | 8,200 | PolyOne Corporation(b) | 47,314 |
| 3,600 | Technitrol, Inc. | 60,552 | 1,600 | Pope & Talbot, Inc. | 13,984 |
| 5,500 | THQ, Inc.(b,c) | 127,490 | 900 | Quaker Chemical Corporation | 14,301 |
| 1,200 | Tollgrade Communications, Inc.(b) | 11,640 | 2,250 | Quanex Corporation | 130,298 |
| 4,750 | Trimble Navigation, Ltd.(b) | 137,132 | 2,400 | Reliance Steel & Aluminum | |
| 2,100 | Ultratech, Inc.(b,c) | 28,938 | | Company | 136,848 |
| 3,300 | Varian Semiconductor | | 2,800 | Rock-Tenn Company | 38,836 |
| | Equipment Associates, Inc. | 124,806 | 2,000 | RTI International Metals, Inc.(b) | 67,040 |
| 2,500 | Veeco Instruments, Inc.(b,c) | 39,725 | 2,200 | Ryerson Tull, Inc.(c) | 44,418 |
| 3,300 | Verity, Inc.(b) | 32,835 | 1,500 | Schweitzer-Mauduit | |
| 1,900 | ViaSat, Inc.(b,c) | 47,101 | | International, Inc. | 36,330 |
| 3,000 | WebEx Communications, Inc.(b,c) | 68,730 | 900 | Steel Technologies, Inc.(c) | 23,589 |
| 2,000 | Websense, Inc.(b) | 118,160 | 2,000 | Texas Industries, Inc. | 99,200 |
| 1,800 | X-Rite, Inc.(c) | 18,522 | 4,400 | Wausau-Mosinee Paper | |
| 2,600 | Zix Corporation(b,c) | 4,784 | | Corporation | 48,180 |
|
| |
| | Total Information | | 1,600 | Wellman, Inc. | 10,464 |
|
|
| | Technology | 6,912,159 | | Total Materials | 2,518,421 |
|
| |
|
| |
| |
| The accompanying notes to the financial statements are an integral part of this schedule. | |
|
80
| Small Cap Index Fund | | | | | | | |
| Schedule of Investments as of October 31, 2005(a) | | | | | | | |
| |
| Shares | Common Stock (77.5%) | Value | Shares | Common Stock (77.5%) | | Value |
|
| |
| Telecommunications Services (0.2%) | | | 6,300 | Energen Corporation | | $236,880 |
| 1,900 | Commonwealth Telephone | | | 500 | Green Mountain Power | | |
| | Enterprises, Inc. | $68,191 | | | Corporation | | | 16,350 |
| 4,100 | General Communication, Inc.(b) | 39,401 | | 2,000 | Laclede Group, Inc. | | 59,800 |
|
| |
| | Total Telecommunications | | | 2,400 | New Jersey Resources Corporation | 103,584 |
| | Services | 107,592 | | 2,500 | Northwest Natural Gas Company(c) | 86,500 |
|
| |
| | | | | 6,800 | Piedmont Natural Gas | | |
| Utilities (3.5%) | | | | Company, Inc.(c) | | | 160,888 |
| 2,600 | ALLETE, Inc. | 114,426 | | 8,556 | Southern Union Company | | 201,237 |
| 1,600 | American States Water Company(c) | 50,144 | | 3,500 | Southwest Gas Corporation | | 95,410 |
| 7,000 | Atmos Energy Corporation | 184,100 | | 9,200 | UGI Corporation | | | 217,120 |
| 4,100 | Avista Corporation | 71,832 | | 1,300 | UIL Holdings Corporation | | 64,350 |
| 1,000 | Cascade Natural Gas Corporation(c) | 20,600 | | 3,100 | UniSource Energy Corporation(c) | | 99,107 |
|
|
| 1,200 | Central Vermont Public | | | | Total Utilities | | | 2,043,787 |
|
|
| | Service Corporation(c) | 19,224 | | | | | | |
|
|
| 1,200 | CH Energy Group, Inc.(c) | 55,860 | | | Total Common Stock | | |
| 4,400 | Cleco Corporation(c) | 93,280 | | | (cost $33,309,312) | 45,350,411 |
|
|
| 4,300 | El Paso Electric Company(b) | 93,095 | | | | | | |
| |
| | | | | | Interest | Maturity | | |
| Shares | Collateral Held for Securities Loaned (19.8%) | | Rate(e) | Date | | Value |
|
| 11,615,792 | Thrivent Financial Securities Lending Trust | | | 3.950% | N/A | $11,615,792 |
|
|
| | Total Collateral Held for Securities Loaned | | |
| | (cost $11,615,792) | | | | 11,615,792 |
|
|
| |
| |
| | | | | | Interest | Maturity | | |
| Shares | Short-Term Investments (2.7%) | | | | Rate(e) | Date | | Value |
|
| 1,552,137 | Thrivent Money Market Fund(d) | | | | 3.600% | N/A | | $1,552,137 |
|
|
| | Total Short-Term Investments (at amortized cost) | | 1,552,137 |
|
|
| | Total Investments (cost $46,477,241) | | $58,518,340 |
|
|
| (a) | The categories of investments are shown as a percentage of total investments. |
| |
| (b) | Non-income producing security. |
| |
| (c) | All or a portion of the security is on loan as discussed in item 2(L) of the Notes to Financial Statements. |
| |
| (d) | At October 31, 2005, $67,500 in cash was pledged as the initial margin deposit for open financial futures contracts. In addition, $1,552,137 of Short-Term Investments were earmarked as collateral to cover open financial futures contracts as follows: |
| |
| | | | | | Notional | |
| | Number of | Expiration | | | Principal | Unrealized |
| Type | Contracts | Date | Position | Value | Amount | Loss |
|
| Russell Mini Futures | 24 | December 2005 | Long | $1,558,080 | $1,595,028 | $36,948 |
(e) The interest rate shown reflects the yield, coupon rate or, for securities purchased at a discount, the discount rate at the date of purchase.
The accompanying notes to the financial statements are an integral part of this schedule.
81
| | Mid Cap Growth Fund | |
| | Schedule of Investments as of October 31, 2005(a) | |
| Shares | Common Stock (82.4%) | Value | Shares | Common Stock (82.4%) | Value |
|
| |
| Consumer Discretionary (16.7%) | | 9,000 | Marriott International, Inc. | $536,580 |
| 11,400 | Abercrombie & Fitch Company | $592,686 | 23,750 | Marvel Entertainment, Inc.(b,c) | 418,000 |
| 25,750 | Advance Auto Parts, Inc.(b) | 965,625 | 30,200 | MGM MIRAGE(b) | 1,128,574 |
| 26,800 | Amazon.com, Inc.(b) | 1,068,784 | 26,400 | Michaels Stores, Inc. | 873,312 |
| 5,841 | Apollo Group, Inc.(b) | 368,100 | 4,200 | Mohawk Industries, Inc.(b) | 327,810 |
| 17,400 | Applebee’s International, Inc. | 381,234 | 50,100 | Nordstrom, Inc. | 1,735,965 |
| 30,360 | Bed Bath & Beyond, Inc.(b) | 1,230,187 | 21,900 | O’Reilly Automotive, Inc.(b) | 617,580 |
| 9,300 | Black & Decker Corporation | 763,809 | 43,900 | Office Depot, Inc.(b) | 1,208,567 |
| 11,200 | Brunswick Corporation | 427,056 | 8,600 | Outback Steakhouse, Inc. | 323,876 |
| 12,600 | Career Education Corporation(b) | 448,434 | 12,100 | P.F. Chang’s China Bistro, Inc.(b,c) | 553,454 |
| 5,500 | Centex Corporation | 353,925 | 15,000 | Panera Bread Company(b,c) | 887,850 |
| 32,900 | Charlotte Russe Holding, Inc.(b,c) | 579,698 | 16,600 | Penn National Gaming, Inc.(b) | 490,530 |
| 41,800 | Cheesecake Factory, Inc.(b,c) | 1,434,576 | 20,000 | PETCO Animal Supplies, Inc.(b) | 380,200 |
| 68,600 | Chico’s FAS, Inc.(b) | 2,712,444 | 27,000 | PETsMART, Inc. | 634,500 |
| 10,200 | Claire’s Stores, Inc. | 265,710 | 23,100 | Pixar, Inc.(b) | 1,171,863 |
| 76,300 | Coach, Inc.(b) | 2,455,334 | 22,200 | Polo Ralph Lauren Corporation | 1,092,240 |
| 25,000 | Coldwater Creek, Inc.(b,c) | 674,750 | 8,900 | Pulte Homes, Inc. | 336,331 |
| 11,600 | D.R. Horton, Inc. | 356,004 | 15,100 | Ross Stores, Inc. | 408,304 |
| 19,000 | Darden Restaurants, Inc. | 615,980 | 19,100 | Royal Caribbean Cruises, Ltd.(c) | 791,504 |
| 24,200 | Dollar General Corporation | 470,448 | 23,200 | Scientific Games Corporation(b,c) | 695,072 |
| 28,800 | Domino’s Pizza, Inc.(c) | 688,896 | 12,900 | SCP Pool Corporation | 464,013 |
| 12,700 | Education Management | | 4,300 | Sears Holdings Corporation(b) | 517,075 |
| | Corporation(b) | 391,668 | 49,800 | Staples, Inc. | 1,131,954 |
| 1 | Expedia, Inc.(b) | 12 | 15,800 | Starbucks Corporation(b) | 446,824 |
| 8,600 | Fortune Brands, Inc. | 653,342 | 25,600 | Starwood Hotels & Resorts | |
| 10,900 | GameStop Corporation(b,c) | 386,732 | | Worldwide, Inc. | 1,495,808 |
| 24,100 | Gaylord Entertainment | | 25,100 | Station Casinos, Inc. | 1,608,910 |
| | Company(b,c) | 951,468 | 4,600 | Strayer Education, Inc. | 411,746 |
| 30,300 | Gentex Corporation(c) | 570,246 | 25,700 | Tiffany & Company | 1,012,580 |
| 38,000 | Getty Images, Inc.(b,c) | 3,154,380 | 9,500 | Toll Brothers, Inc.(b) | 350,645 |
| 4,300 | Grupo Televisia SA ADR | 314,330 | 9,700 | Tractor Supply Company(b,c) | 470,450 |
| 34,000 | GTECH Holdings Corporation | 1,082,560 | 26,135 | Univision Communications, Inc.(b) | 683,169 |
| 12,600 | Guess ?, Inc.(b,c) | 341,712 | 49,200 | Urban Outfitters, Inc.(b,c) | 1,393,836 |
| 13,900 | Harman International | | 11,850 | Volcom, Inc.(b,c) | 362,373 |
| | Industries, Inc. | 1,388,054 | 11,000 | Weight Watchers | |
| 11,900 | Harrah’s Entertainment, Inc. | 719,712 | | International, Inc.(b,c) | 578,270 |
| 53,800 | Hilton Hotels Corporation | 1,046,410 | 36,000 | Williams-Sonoma, Inc.(b) | 1,407,960 |
| 13,400 | IAC InterActiveCorp(b) | 343,040 | 11,900 | WMS Industries, Inc.(b,c) | 299,047 |
| 23,000 | International Game Technology | 609,270 | 12,300 | Wynn Resorts, Ltd.(b,c) | 574,164 |
| 8,600 | ITT Educational Services, Inc.(b) | 475,408 | 47,900 | XM Satellite Radio | |
| 10,000 | Jarden Corporation(b,c) | 337,900 | | Holdings, Inc.(b,c) | 1,380,957 |
| 6,500 | Kohl’s Corporation(b) | 312,845 | 14,900 | Yum! Brands, Inc. | 757,963 |
|
|
| 20,200 | Lamar Advertising Company(b) | 901,324 | | Total Consumer | |
| 11,700 | Laureate Education, Inc.(b,c) | 577,980 | | Discretionary | 62,011,099 |
|
|
| 11,500 | Lennar Corporation | 639,170 | | | |
The accompanying notes to the financial statements are an integral part of this schedule.
82
| Mid Cap Growth Fund | | | | |
| Schedule of Investments as of October 31, 2005(a) | | | | |
| |
| Shares | Common Stock (82.4%) | Value | Shares | Common Stock (82.4%) | Value |
|
| |
| Consumer Staples (1.3%) | | 11,500 | Archipelago Holdings, Inc.(b) | $552,000 |
| 31,200 | Church & Dwight | | 22,700 | Astoria Financial Corporation | 634,465 |
| | Company, Inc.(c) | $1,093,560 | 8,800 | Bear Stearns Companies, Inc. | 931,040 |
| 19,400 | Constellation Brands, Inc.(b) | 456,676 | 14,000 | Calamos Asset Management, Inc. | 340,060 |
| 10,000 | Dean Foods Company(b) | 361,500 | 15,000 | CapitalSource, Inc.(b) | 330,000 |
| 12,100 | Estee Lauder Companies, Inc. | 401,357 | 12,000 | CB Richard Ellis Group, Inc.(b) | 586,200 |
| 34,200 | Gold Kist, Inc.(b,c) | 587,898 | 64,500 | Charles Schwab Corporation | 980,400 |
| 13,550 | Whole Foods Market, Inc. | 1,952,962 | 6,600 | Chicago Mercantile Exchange | 2,409,990 |
|
| |
| | Total Consumer Staples | 4,853,953 | 12,300 | CIT Group, Inc. | 562,479 |
|
| |
| | | | 5,500 | City National Corporation | 403,590 |
| Energy (7.0%) | | 12,800 | Commerce Bancorp, Inc.(c) | 390,016 |
| 20,100 | Bill Barrett Corporation(b,c) | 639,783 | 37,600 | E*TRADE Financial Corporation(b) | 697,480 |
| 37,440 | BJ Services Company | 1,301,040 | 8,400 | East West Bancorp, Inc. | 321,636 |
| 18,800 | Chesapeake Energy Corporation | 603,480 | 10,700 | Eaton Vance Corporation | 266,323 |
| 23,700 | Cimarex Energy Company(b) | 930,462 | 7,100 | Everest Re Group, Ltd. | 706,095 |
| 6,000 | CONSOL Energy, Inc. | 365,400 | 10,900 | First Marblehead Corporation(c) | 322,531 |
| 33,900 | ENSCO International, Inc. | 1,545,501 | 20,700 | Investors Financial Services | |
| 17,700 | EOG Resources, Inc. | 1,199,706 | | Corporation(c) | 790,326 |
| 16,100 | GlobalSantaFe Corporation | 717,255 | 16,550 | Legg Mason, Inc. | 1,775,980 |
| 28,400 | Grant Prideco, Inc.(b) | 1,104,476 | 24,600 | MB Financial, Inc.(c) | 916,842 |
| 12,600 | Murphy Oil Corporation | 590,310 | 8,800 | Moody’s Corporation | 468,688 |
| 24,000 | Nabors Industries, Ltd.(b) | 1,647,120 | 14,500 | North Fork Bancorporation, Inc. | 367,430 |
| 28,500 | National Oilwell Varco, Inc.(b) | 1,780,395 | 13,900 | Nuveen Investments | 562,533 |
| 31,400 | Newfield Exploration Company(b) | 1,423,362 | 6,300 | St. Joe Company | 415,485 |
| 11,600 | Noble Corporation | 746,808 | 27,600 | T. Rowe Price Group, Inc. | 1,808,352 |
| 9,200 | Noble Energy, Inc. | 368,460 | 18,800 | UCBH Holdings, Inc.(c) | 327,120 |
| 35,100 | Patterson-UTI Energy, Inc. | 1,197,963 | 19,200 | Willis Group Holdings, Ltd.(c) | 713,088 |
| 13,800 | Peabody Energy Corporation | 1,078,608 | 18,800 | Zions Bancorporation | 1,381,236 |
|
|
| 12,900 | Rowan Companies, Inc. | 425,571 | | Total Financials | 24,841,523 |
|
|
| 35,840 | Smith International, Inc. | 1,161,216 | | | |
| 7,400 | Southwestern Energy Company(b) | 536,796 | Health Care (16.6%) | |
| 7,800 | Tesoro Petroleum Corporation | 476,970 | 7,000 | Aetna, Inc. | 619,920 |
| 5,700 | Transocean, Inc.(b) | 327,693 | 10,500 | Affymetrix, Inc.(b,c) | 477,015 |
| 38,600 | Ultra Petroleum Corporation(b,c) | 2,026,114 | 4,300 | Allergan, Inc. | 383,990 |
| 4,800 | Valero Energy Corporation | 505,152 | 44,300 | Amylin Pharmaceuticals, Inc.(b,c) | 1,488,480 |
| 7,300 | Weatherford International, Ltd.(b) | 456,980 | 21,650 | Barr Pharmaceuticals, Inc.(b) | 1,243,792 |
| 22,300 | Williams Companies, Inc. | 497,290 | 5,300 | Beckman Coulter, Inc. | 261,078 |
| 54,442 | XTO Energy, Inc. | 2,366,049 | 23,957 | Biomet, Inc. | 834,422 |
|
| |
| | Total Energy | 26,019,960 | 2,900 | Biosite, Inc.(b,c) | 160,167 |
|
| | |
| | | | 42,900 | Biovail Corporation(b) | 934,791 |
| Financials (6.7%) | | 22,100 | C.R. Bard, Inc. | 1,378,598 |
| 19,600 | A.G. Edwards, Inc. | 829,472 | 82,100 | Caliper Life Sciences, Inc.(b,c) | 535,292 |
| 23,399 | Affiliated Managers Group, Inc.(b,c) | 1,795,873 | 28,494 | Caremark Rx, Inc.(b) | 1,493,086 |
| 10,500 | Alliance Capital Management | | 16,000 | Celgene Corporation(b,c) | 897,600 |
| | Holding, LP(b) | 555,765 | 8,400 | Cerner Corporation(b,c) | 709,380 |
| 36,600 | Ameritrade Holding Corporation(b,c) | 769,698 | 20,100 | Charles River Laboratories | |
| 49,750 | Apollo Investment Corporation | 929,330 | | International, Inc.(b) | 879,576 |
| |
| The accompanying notes to the financial statements are an integral part of this schedule. | |
|
83
| Mid Cap Growth Fund | | | | | |
| Schedule of Investments as of October 31, 2005(a) | | | | | |
| |
| Shares | Common Stock (82.4%) | Value | Shares | Common Stock (82.4%) | | Value |
|
| |
| Health Care -- continued | | 6,300 | Pharmaceutical Product | | |
| 33,600 | Community Health | | | Development, Inc. | | $362,061 |
| | Systems, Inc.(b) | $1,246,896 | 21,100 | Protein Design Labs, Inc.(b,c) | | 591,222 |
| 7,700 | Cooper Companies, Inc. | 530,068 | 20,100 | Psychiatric Solutions, Inc.(b,c) | | 1,099,470 |
| 16,400 | Covance, Inc.(b) | 797,860 | 13,900 | Quest Diagnostics, Inc. | | 649,269 |
| 25,875 | Coventry Health Care, Inc.(b) | 1,396,991 | 10,900 | Radiation Therapy Services, Inc.(b,c) | 327,436 |
| 60,700 | Cytyc Corporation(b) | 1,538,745 | 23,000 | ResMed, Inc.(b,c) | | 876,990 |
| 32,400 | Dade Behring Holdings, Inc. | 1,166,724 | 25,500 | Respironics, Inc.(b) | | 914,685 |
| 36,050 | DaVita, Inc.(b) | 1,772,939 | 13,300 | Sepracor, Inc.(b) | | 748,125 |
| 9,500 | Dentsply International, Inc. | 523,830 | 9,600 | Shire Pharmaceuticals Group plc(c) | 344,064 |
| 21,400 | Digene Corporation(b,c) | 646,280 | 37,100 | St. Jude Medical, Inc.(b) | | 1,783,397 |
| 15,500 | Endo Pharmaceutical | | 31,500 | Teva Pharmaceutical | | |
| | Holdings, Inc.(b) | 417,260 | | Industries, Ltd. | | 1,200,780 |
| 14,600 | Express Scripts, Inc.(b) | 1,100,986 | 41,300 | Thermo Electron Corporation(b) | 1,246,847 |
| 32,000 | Fisher Scientific | | 8,400 | Triad Hospitals, Inc.(b) | | 345,492 |
| | International, Inc.(b) | 1,808,000 | 15,950 | United Surgical Partners | | |
| 6,700 | Forest Laboratories, Inc.(b) | 253,997 | | International, Inc.(b,c) | | 571,808 |
| 21,500 | Gen-Probe, Inc.(b) | 878,060 | 29,200 | Varian Medical Systems, Inc.(b) | | 1,330,352 |
| 24,600 | Genzyme Corporation(b) | 1,778,580 | 17,900 | VCA Antech, Inc.(b) | | 461,820 |
| 39,600 | Gilead Sciences, Inc.(b) | 1,871,100 | 20,100 | Waters Corporation(b) | | 727,620 |
| 19,750 | Health Management | | 5,100 | WellChoice, Inc.(b) | | 385,815 |
| | Associates, Inc. | 422,848 | 9,306 | WellPoint, Inc.(b) | | 694,972 |
|
|
| 22,900 | Health Net, Inc.(b) | 1,072,636 | | Total Health Care | 61,817,649 |
|
|
| 12,400 | Henry Schein, Inc.(b) | 491,536 | | | | |
| 14,800 | Hospira, Inc.(b) | 589,780 | Industrials (10.9%) | | |
| 20,000 | ICOS Corporation(b,c) | 539,600 | 73,000 | AirTran Holdings, Inc.(b,c) | | 1,092,080 |
| 5,800 | INAMED Corporation(b,c) | 412,380 | 6,450 | Alliant Techsystems, Inc.(b) | | 452,919 |
| 9,500 | Intuitive Surgical, Inc.(b) | 842,935 | 15,500 | American Standard | | |
| 12,900 | Invitrogen Corporation(b) | 820,311 | | Companies, Inc. | | 589,620 |
| 15,725 | IVAX Corporation(b,c) | 448,949 | 10,300 | AMETEK, Inc. | | 419,519 |
| 20,700 | Kinetic Concepts, Inc.(b) | 743,130 | 43,300 | ARAMARK Corporation | | 1,100,686 |
| 8,000 | Kyphon, Inc.(b,c) | 320,720 | 40,800 | C.H. Robinson Worldwide, Inc. | 1,438,608 |
| 20,000 | Laboratory Corporation of | | 23,600 | ChoicePoint, Inc.(b) | | 997,336 |
| | America Holdings(b) | 965,000 | 8,900 | Cintas Corporation | | 361,073 |
| 9,800 | Lincare Holdings, Inc.(b) | 400,330 | 12,000 | CNF, Inc. | | 675,240 |
| 11,300 | Manor Care, Inc. | 420,925 | 34,200 | Corporate Executive | | |
| 10,800 | Martek Biosciences Corporation(b,c) | 333,396 | | Board Company | | 2,826,288 |
| 25,300 | Medco Health Solutions, Inc.(b) | 1,429,450 | 7,600 | Cummins, Inc. | | 648,812 |
| 27,900 | Medicis Pharmaceutical | | 10,200 | Danaher Corporation | | 531,420 |
| | Corporation(c) | 823,050 | 19,800 | DRS Technologies, Inc. | | 975,348 |
| 41,300 | MedImmune, Inc.(b) | 1,444,674 | 5,900 | Dun & Bradstreet Corporation(b) | 373,588 |
| 18,200 | Neurocrine Biosciences, Inc.(b,c) | 961,324 | 25,720 | Expeditors International of | | |
| 18,500 | Omnicare, Inc. | 1,000,850 | | Washington, Inc. | | 1,560,432 |
| 13,900 | PacifiCare Health Systems, Inc.(b) | 1,144,804 | 14,400 | Fastenal Company(c) | | 1,009,872 |
| 15,000 | Patterson Companies, Inc.(b,c) | 620,700 | 16,300 | Gardner Denver, Inc.(b,c) | | 792,180 |
| 39,900 | PerkinElmer, Inc. | 880,593 | 13,100 | Goodrich Corporation | | 472,517 |
| | | | 11,400 | Graco, Inc. | | 390,678 |
| |
| The accompanying notes to the financial statements are an integral part of this schedule. | | |
|
84
| Mid Cap Growth Fund | | | | | |
| Schedule of Investments as of October 31, 2005(a) | | | | |
| |
| Shares | Common Stock (82.4%) | | Value | Shares | Common Stock (82.4%) | Value |
|
| |
| Industrials -- continued | | | 60,800 | ASML Holding NV ADR(b,c) | $1,032,384 |
| 19,100 | Herman Miller, Inc. | | $523,531 | 24,100 | ATI Technologies, Inc.(b) | 348,245 |
| 20,300 | IDEX Corporation | | 812,406 | 31,200 | Autodesk, Inc. | 1,408,056 |
| 9,200 | Ingersoll-Rand Company | | 347,668 | 12,500 | Avid Technology, Inc.(b) | 615,375 |
| 9,500 | ITT Industries, Inc. | | 965,200 | 66,600 | Broadcom Corporation(b) | 2,827,836 |
| 22,300 | Jacobs Engineering Group, Inc.(b) | 1,421,625 | 6,700 | CACI International, Inc.(b,c) | 365,418 |
| 23,100 | JB Hunt Transport Services, Inc. | 448,371 | 11,500 | CDW Corporation | 648,025 |
| 13,500 | Joy Global, Inc. | | 619,245 | 18,900 | Check Point Software | |
| 19,100 | L-3 Communications | | | | Technologies, Ltd.(b) | 422,604 |
| | Holdings, Inc. | | 1,486,362 | 19,600 | CheckFree Corporation(b) | 833,000 |
| 22,000 | Labor Ready, Inc.(b,c) | | 513,700 | 56,300 | Citrix Systems, Inc.(b) | 1,552,191 |
| 17,900 | Manitowoc Company, Inc.(c) | | 952,459 | 44,900 | CNET Networks, Inc.(b,c) | 610,191 |
| 7,300 | Manpower, Inc. | | 330,544 | 51,900 | Cogent, Inc.(b,c) | 1,377,945 |
| 22,300 | Mobile Mini, Inc.(b,c) | | 1,040,964 | 35,376 | Cognizant Technology | |
| 46,300 | Monster Worldwide, Inc.(b) | | 1,519,103 | | Solutions Corporation(b) | 1,555,836 |
| 16,300 | MSC Industrial Direct | | | 16,700 | Cognos, Inc.(b) | 626,751 |
| | Company, Inc. | | 622,334 | 19,800 | Comtech Telecommunications | |
| 14,800 | Oshkosh Truck Corporation | | 644,688 | | Corporation(b,c) | 759,528 |
| 14,200 | Pentair, Inc. | | 461,358 | 99,200 | Comverse Technology, Inc.(b) | 2,489,920 |
| 43,600 | Precision Castparts Corporation | 2,064,896 | 18,300 | Corning, Inc.(b) | 367,647 |
| 18,500 | Resources Global Professionals(b,c) | 528,175 | 7,400 | DST Systems, Inc.(b) | 415,288 |
| 32,800 | Robert Half International, Inc. | | 1,209,664 | 6,600 | Electronic Arts, Inc.(b) | 375,408 |
| 17,600 | Rockwell Automation, Inc. | | 935,440 | 6,600 | F5 Networks, Inc.(b) | 343,398 |
| 17,600 | Rockwell Collins, Inc. | | 806,432 | 19,300 | FileNet Corporation(b,c) | 543,295 |
| 23,000 | Roper Industries, Inc. | | 867,100 | 19,850 | Fiserv, Inc.(b) | 867,048 |
| 15,700 | Stericycle, Inc.(b) | | 903,692 | 15,500 | FLIR Systems, Inc.(b) | 324,880 |
| 17,200 | Terex Corporation(b) | | 945,484 | 21,400 | Global Payments, Inc. | 916,990 |
| 15,800 | Thomas & Betts Corporation(b) | | 614,936 | 3,400 | Google, Inc.(b) | 1,265,276 |
| 2 | Timco Aviation Services, Inc.(b) | 0 | 21,500 | Harris Corporation | 883,650 |
| 25,500 | URS Corporation(b) | | 1,030,965 | 10,700 | Hittite Microwave Corporation(b,c) | 247,170 |
| 9,800 | UTI Worldwide, Inc.(c) | | 838,292 | 9,600 | Hyperion Solutions Corporation(b) | 464,256 |
| 6,400 | W.W. Grainger, Inc. | | 428,672 | 71,200 | Informatica Corporation(b,c) | 847,280 |
|
| |
| | Total Industrials | 40,591,522 | 3,900 | Intergraph Corporation(b,c) | 188,682 |
|
| | |
| | | | | 11,600 | International Rectifier | |
| Information Technology (19.3%) | | | | Corporation(b) | 343,244 |
| 39,200 | Activision, Inc.(b) | | 618,184 | 27,900 | Internet Security Systems, Inc.(b) | 687,177 |
| 53,600 | Adobe Systems, Inc. | | 1,728,600 | 52,200 | Intersil Corporation | 1,188,072 |
| 12,300 | ADTRAN, Inc. | | 372,075 | 25,950 | Iron Mountain, Inc.(b) | 1,012,050 |
| 8,300 | Affiliated Computer Services, Inc.(b) | 449,113 | 35,200 | Jabil Circuit, Inc.(b) | 1,050,720 |
| 83,900 | Akamai Technologies, Inc.(b,c) | | 1,454,826 | 37,436 | Juniper Networks, Inc.(b) | 873,382 |
| 40,700 | Alliance Data Systems | | | 20,480 | KLA-Tencor Corporation | 948,019 |
| | Corporation(b) | | 1,447,292 | 37,200 | Lam Research Corporation(b) | 1,255,128 |
| 35,300 | Altera Corporation(b) | | 587,745 | 83,100 | Lawson Software, Inc.(b,c) | 636,546 |
| 39,000 | Amdocs, Ltd.(b) | | 1,032,330 | 26,400 | Linear Technology Corporation | 876,744 |
| 22,200 | Amphenol Corporation | | 887,334 | 75,600 | LSI Logic Corporation(b) | 613,116 |
| 17,200 | Analog Devices, Inc. | | 598,216 | 211,200 | Lucent Technologies, Inc.(b,c) | 601,920 |
| 24,400 | Apple Computer, Inc.(b) | | 1,405,196 | 14,300 | Macromedia, Inc.(b) | 628,056 |
| |
| The accompanying notes to the financial statements are an integral part of this schedule. | |
|
85
| Mid Cap Growth Fund | | | | |
| Schedule of Investments as of October 31, 2005(a) | | | | |
| |
| Shares | Common Stock (82.4%) | Value | Shares | Common Stock (82.4%) | Value |
|
| |
| Information Technology -- continued | | Materials (1.8%) | |
| 54,900 | Marvell Technology Group, Ltd.(b) | $2,547,909 | 37,400 | Crown Holdings, Inc.(b) | $606,628 |
| 19,700 | McAfee, Inc.(b) | 591,591 | 15,800 | FMC Corporation(b) | 860,152 |
| 46,500 | MEMC Electronic Materials(b) | 834,210 | 22,800 | Freeport-McMoRan | |
| 31,200 | Mercury Interactive Corporation(b) | 1,085,448 | | Copper & Gold, Inc.(c) | 1,126,776 |
| 10,500 | Mettler-Toledo International, Inc.(b) | 541,800 | 48,600 | Goldcorp, Inc. | 970,056 |
| 49,510 | Microchip Technology, Inc. | 1,493,717 | 7,600 | IPSCO, Inc. | 538,612 |
| 17,400 | MICROS Systems, Inc.(b) | 799,008 | 14,700 | Martin Marietta Materials, Inc. | 1,159,977 |
| 25,700 | National Semiconductor | | 7,400 | Minerals Technologies, Inc. | 395,604 |
| | Corporation | 581,591 | 7,400 | Monsanto Company | 466,274 |
| 32,400 | NAVTEQ Corporation(b) | 1,267,488 | 15,500 | Owens-Illinois, Inc.(b) | 295,120 |
| 23,700 | NCR Corporation(b) | 716,214 | 7,400 | Praxair, Inc. | 365,634 |
|
|
| 4,000 | NetEase.com, Inc.(b,c) | 305,080 | | Total Materials | 6,784,833 |
|
|
| 35,900 | Network Appliance, Inc.(b) | 982,224 | | | |
| 15,830 | Novellus Systems, Inc.(b) | 346,044 | Telecommunications Services (1.9%) | |
| 18,700 | NVIDIA Corporation(b) | 627,385 | 77,710 | American Tower Corporation(b) | 1,853,384 |
| 16,900 | Paychex, Inc. | 655,044 | 34,900 | Crown Castle International | |
| 11,400 | QLogic Corporation(b) | 343,824 | | Corporation(b) | 855,748 |
| 37,600 | Red Hat, Inc.(b,c) | 873,072 | 42,200 | Nextel Partners, Inc.(b) | 1,061,330 |
| 38,400 | Salesforce.com, Inc.(b,c) | 959,616 | 28,200 | NII Holdings, Inc.(b,c) | 2,338,344 |
| 9,200 | SanDisk Corporation(b) | 541,788 | 58,600 | SBA Communications | |
| 16,100 | Satyam Computer | | | Corporation(b,c) | 865,522 |
|
|
| | Services, Ltd. ADR(b) | 550,298 | | Total Telecommunications | |
| 9,200 | SRA International, Inc.(b) | 301,944 | | Services | 6,974,328 |
|
|
| 28,400 | Sybase, Inc.(b,c) | 631,900 | | | |
| 60,933 | Symantec Corporation(b) | 1,453,252 | Utilities (0.2%) | |
| 98,200 | Tellabs, Inc.(b) | 938,792 | 70,200 | Reliant Energy, Inc.(b) | 891,540 |
|
|
| 14,300 | Tessera Technologies, Inc.(b,c) | 398,970 | | Total Utilities | 891,540 |
|
|
| 91,800 | TIBCO Software, Inc.(b) | 696,762 | | | |
|
|
| 17,600 | Varian Semiconductor | | | Total Common Stock | |
| | Equipment Associates, Inc.(b,c) | 665,632 | | (cost $272,126,682) | 306,745,322 |
|
|
| 51,400 | VeriSign, Inc.(b) | 1,214,582 | | | |
| 16,200 | Websense, Inc.(b,c) | 957,096 | | | |
| 33,600 | Xilinx, Inc. | 804,720 | | | |
| 10,050 | Zebra Technologies Corporation(b,c) | 433,256 | | | |
|
| |
| | Total Information | | | | |
| | Technology | 71,958,915 | | |
|
| | |
The accompanying notes to the financial statements are an integral part of this schedule.
86
| Mid Cap Growth Fund | | | |
| Schedule of Investments as of October 31, 2005(a) | | | |
| | | Interest | Maturity | |
| Shares | Collateral Held for Securities Loaned (14.3%) | Rate(d) | Date | Value |
|
| 53,154,317 | Thrivent Financial Securities Lending Trust | 3.950% | N/A | $53,154,317 |
|
|
| | Total Collateral Held for Securities Loaned | |
| | (cost $53,154,317) | | | 53,154,317 |
|
|
| |
| | | Interest | Maturity | |
| Shares | Short-Term Investments (3.3%) | Rate(d) | Date | Value |
|
| 12,261,602 | Thrivent Money Market Fund | 3.600% | N/A | $12,261,602 |
|
|
| | Total Short-Term Investments (at amortized cost) | 12,261,602 |
|
|
| | Total Investments (cost $337,542,601) | | $372,161,241 |
|
|
| (a) | The categories of investments are shown as a percentage of total investments. |
| |
| (b) | Non-income producing security. |
| |
| (c) | All or a portion of the security is on loan as discussed in item 2(L) of the Notes to Financial Statements. |
| |
| (d) | The interest rate shown reflects the yield, coupon rate or, for securities purchased at a discount, the discount rate at the date of purchase. |
| |
| (e) | Miscellaneous footnote: |
| |
| | ADR -- American Depository Receipts, which are certificates for shares of an underlying foreign security’s shares held by an issuing U.S. depository bank. |
| |
The accompanying notes to the financial statements are an integral part of this schedule.
87
| | Partner Mid Cap Value Fund | |
| | Schedule of Investments as of October 31, 2005(a) | |
| Shares | Common Stock (87.9%) | Value | Shares | Common Stock (87.9%) | Value |
|
| |
| Consumer Discretionary (13.6%) | | 1,166 | Equity Residential REIT | $45,766 |
| 1,046 | Autoliv, Inc. | $44,936 | 1,281 | Everest Re Group, Ltd. | 127,395 |
| 3,272 | Dow Jones & Company, Inc.(b) | 110,954 | 3,070 | FirstMerit Corporation | 80,956 |
| 1,455 | Federated Department Stores, Inc. | 89,293 | 562 | Healthcare Realty Trust, Inc. | 21,266 |
| 2,681 | Harrah’s Entertainment, Inc. | 162,147 | 3,505 | iStar Financial, Inc. | 129,229 |
| 4,358 | J.C. Penney Company, Inc. | | 3,449 | KeyCorp | 111,196 |
| | (Holding Company) | 223,130 | 732 | Liberty Property Trust | 30,517 |
| 2,580 | Lamar Advertising Company(c) | 115,120 | 1,624 | M&T Bank Corporation | 174,710 |
| 2,349 | Lennar Corporation | 130,557 | 1,815 | Northern Trust Corporation | 97,284 |
| 1,547 | Mohawk Industries, Inc.(c) | 120,743 | 1,254 | PartnerRe, Ltd. | 79,905 |
| 4,748 | Newell Rubbermaid, Inc. | 109,157 | 3,368 | Plum Creek Timber Company, Inc. | 131,015 |
| 3,247 | Ross Stores, Inc. | 87,799 | 1,720 | PMI Group, Inc. | 68,594 |
| 1,528 | Stanley Works | 73,237 | 976 | Prentiss Properties Trust | 38,513 |
| 598 | Talbots, Inc. | 15,602 | 2,043 | RenaissanceRe Holdings, Ltd.(b) | 77,328 |
|
| |
| | Total Consumer | | 2,065 | Torchmark Corporation | 109,094 |
| | Discretionary | 1,282,675 | 1,761 | Willis Group Holdings, Ltd. | 65,404 |
|
| |
| | | | 2,373 | Zions Bancorporation | 174,344 |
|
|
| Consumer Staples (4.4%) | | | Total Financials | 2,376,022 |
|
|
| 3,881 | Archer-Daniels-Midland Company | 94,580 | | | |
| 1,877 | Clorox Company | 101,583 | Health Care (4.8%) | |
| 1,512 | Pepsi Bottling Group, Inc. | 42,986 | 2,609 | Apria Healthcare Group, Inc.(c) | 60,190 |
| 970 | Reynolds American, Inc.(b) | 82,450 | 2,706 | Charles River Laboratories | |
| 3,175 | Smithfield Foods, Inc.(c) | 93,916 | | International, Inc.(c) | 118,415 |
|
| |
| | Total Consumer Staples | 415,515 | 3,483 | Emdeon Corporation(c) | 32,044 |
|
| |
| | | | 2,406 | Health Net, Inc.(c) | 112,697 |
| Energy (10.3%) | | 3,653 | MedImmune, Inc.(c) | 127,782 |
|
|
| 4,685 | BJ Services Company | 162,804 | | Total Health Care | 451,128 |
|
|
| 3,547 | EOG Resources, Inc. | 240,411 | | | |
| 465 | Frontier Oil Corporation | 17,149 | Industrials (7.7%) | |
| 3,771 | Noble Energy, Inc. | 151,029 | 1,437 | Alliant Techsystems, Inc.(c) | 100,906 |
| 3,401 | Range Resources Corporation | 121,382 | 4,010 | American Standard Companies, Inc. | 152,540 |
| 1,788 | Teekay Shipping Corporation(b) | 70,519 | 950 | Carlisle Companies, Inc. | 63,356 |
| 1,302 | Western Gas Resources, Inc. | 56,377 | 1,624 | Cooper Industries, Ltd. | 115,125 |
| 6,969 | Williams Companies, Inc. | 155,409 | 2,164 | Norfolk Southern Corporation | 86,993 |
|
| |
| | Total Energy | 975,080 | 2,920 | Republic Services, Inc. | 103,222 |
|
| |
| | | | 2,376 | Rockwell Collins, Inc. | 108,868 |
|
|
| Financials (25.2%) | | | Total Industrials | 731,010 |
|
|
| 2,716 | Ambac Financial Group, Inc. | 192,537 | | | |
| 1,065 | American Capital Strategies, Ltd.(b) | 40,001 | Information Technology (8.3%) | |
| 2,827 | Apartment Investment & | | 6,470 | Activision, Inc.(c) | 102,032 |
| | Management Company | 108,557 | 2,189 | ADC Telecommunications, Inc.(c) | 38,198 |
| 1,085 | Assurant, Inc. | 41,447 | 1,711 | Amphenol Corporation | 68,389 |
| 1,400 | Bear Stearns Companies, Inc. | 148,120 | 1,219 | Avocent Corporation(c) | 37,375 |
| 3,130 | CIT Group, Inc. | 143,135 | 11,454 | BearingPoint, Inc.(b,c) | 80,407 |
| 774 | Commerce Bancshares, Inc.(b) | 41,123 | 1,465 | CDW Corporation | 82,553 |
| 2,257 | Developers Diversified Realty | | 1,669 | Freescale Semiconductor, Inc.(c) | 39,539 |
| | Corporation | 98,586 | 3,882 | Ingram Micro, Inc.(c) | 70,264 |
| |
| The accompanying notes to the financial statements are an integral part of this schedule. | |
|
88
| Partner Mid Cap Value Fund | | | | | |
| Schedule of Investments as of October 31, 2005(a) | | | | | |
| |
| Shares | Common Stock (87.9%) | Value | Shares | Common Stock (87.9%) | Value |
|
| |
| Information Technology -- continued | | Utilities (10.7%) | | |
| 547 | Tech Data Corporation(c) | $18,948 | 3,096 | AGL Resources, Inc. | $108,948 |
| 1,878 | Tessera Technologies, Inc.(c) | 52,396 | 1,224 | CMS Energy Corporation(c) | 18,250 |
| 4,959 | Xerox Corporation(c) | 67,294 | 3,349 | Edison International, Inc. | 146,552 |
| 2,923 | Zebra Technologies Corporation(c) | 126,011 | 561 | Energen Corporation | 21,094 |
|
| |
| | Total Information | | 2,457 | Entergy Corporation | 173,759 |
| | Technology | 783,406 | 1,130 | FirstEnergy Corporation | 53,675 |
|
| |
| | | | 87 | Northeast Utilities Service | |
| Materials (2.9%) | | | Company | | 1,583 |
| 2,900 | Agrium, Inc. | 61,509 | 4,848 | PG&E Corporation | 176,370 |
| 1,525 | Allegheny Technologies, Inc. | 43,783 | 1,220 | PNM Resources, Inc. | 30,927 |
| 355 | Carpenter Technology Corporation | 21,406 | 5,972 | PPL Corporation | 187,162 |
| 2,495 | Chemtura Corporation | 26,696 | 353 | Public Service Enterprise | |
| 2,726 | Packaging Corporation of America(b) | 55,311 | | Group, Inc. | | 22,200 |
| 1,534 | Rohm and Haas Company | 66,775 | 1,811 | Wisconsin Energy Corporation | 68,510 |
|
| |
|
| | Total Materials | 275,480 | | Total Utilities | | 1,009,030 |
|
| |
|
| |
| | | | | Total Common Stock | |
| | | | | (cost $8,242,584) | 8,299,346 |
|
|
| |
| |
| | | | | Interest | Maturity | |
| Shares | Collateral Held for Securities Loaned (5.6%) | Rate(d) | Date | Value |
|
| 529,547 | Thrivent Financial Securities Lending Trust | | 3.950% | N/A | $529,547 |
|
|
| | Total Collateral Held for Securities Loaned | |
| | (cost $529,547) | | | | 529,547 |
|
|
| |
| |
| Shares or | | | | | | |
| Principal | | | | Interest | Maturity | |
| Amount | Short-Term Investments (6.5%) | | | Rate(d) | Date | Value |
|
| $600,000 | Federal National Mortgage Association | | 3.720% | 11/1/2005 | $600,000 |
| 9,051 | Thrivent Money Market Fund | | | 3.600 | N/A | 9,051 |
|
|
| | Total Short-Term Investments (at amortized cost) | 609,051 |
|
|
| | Total Investments (cost $9,381,182) | | $9,437,944 |
|
|
| (a) | The categories of investments are shown as a percentage of total investments. |
| |
| (b) | All or a portion of the security is on loan as discussed in item 2(L) of the Notes to Financial Statements. |
| |
| (c) | Non-income producing security. |
| |
| (d) | The interest rate shown reflects the yield, coupon rate or, for securities purchased at a discount, the discount rate at the date of purchase. |
| |
The accompanying notes to the financial statements are an integral part of this schedule.
89
| | Mid Cap Stock Fund | |
| | Schedule of Investments as of October 31, 2005(a) | |
| Shares | Common Stock (81.0%) | Value | Shares | Common Stock (81.0%) | Value |
|
| |
| Consumer Discretionary (11.2%) | | Energy (11.9%) | |
| 199,900 | Alliance Gaming Corporation(b,c) | $2,160,919 | 62,600 | Amerada Hess Corporation | $7,831,260 |
| 157,800 | American Eagle Outfitters, Inc. | 3,716,190 | 75,400 | Baker Hughes, Inc. | 4,143,984 |
| 220,600 | Autoliv, Inc. | 9,476,976 | 115,800 | BJ Services Company | 4,024,050 |
| 72,900 | Barnes & Noble, Inc. | 2,636,064 | 250,800 | Chesapeake Energy Corporation | 8,050,680 |
| 129,900 | Boyd Gaming Corporation | 5,358,375 | 233,500 | ENSCO International, Inc. | 10,645,265 |
| 162,900 | Circuit City Stores, Inc. | 2,897,991 | 280,600 | Grant Prideco, Inc.(b) | 10,912,534 |
| 66,200 | D.R. Horton, Inc. | 2,031,678 | 205,325 | Nabors Industries, Ltd.(b) | 14,091,455 |
| 191,200 | Finish Line, Inc.(c) | 2,990,368 | 77,300 | Newfield Exploration Company(b) | 3,504,009 |
| 284,400 | Foot Locker, Inc. | 5,528,736 | 93,100 | Noble Corporation | 5,993,778 |
| 264,900 | Goodyear Tire & | | 444,100 | Patterson-UTI Energy, Inc. | 15,157,133 |
| | Rubber Company(b,c) | 4,143,036 | 96,700 | Range Resources Corporation(c) | 3,451,223 |
| 120,500 | Harrah’s Entertainment, Inc. | 7,287,840 | 316,700 | Ultra Petroleum Corporation(b,c) | 16,623,583 |
| 355,900 | Hilton Hotels Corporation | 6,922,255 | 83,100 | Valero Energy Corporation | 8,745,444 |
| 90,500 | Life Time Fitness, Inc.(b,c) | 3,361,170 | 80,700 | Weatherford International, Ltd.(b,c) | 5,051,820 |
| 213,000 | MGM MIRAGE(b) | 7,959,810 | 153,700 | Western Gas Resources, Inc.(c) | 6,655,210 |
| 100,300 | Michaels Stores, Inc. | 3,317,924 | 331,600 | Williams Companies, Inc. | 7,394,680 |
| 62,000 | Mohawk Industries, Inc.(b) | 4,839,100 | 176,000 | XTO Energy, Inc. | 7,648,960 |
|
|
| 56,300 | NIKE, Inc. | 4,732,015 | | Total Energy | 139,925,068 |
|
|
| 83,500 | Nordstrom, Inc. | 2,893,275 | | | |
| 131,400 | PETsMART, Inc. | 3,087,900 | Financials (14.8%) | |
| 70,100 | Pixar, Inc.(b,c) | 3,556,173 | 121,400 | A.G. Edwards, Inc. | 5,137,648 |
| 93,400 | Pulte Homes, Inc. | 3,529,586 | 101,450 | Affiliated Managers Group, Inc.(b,c) | 7,786,288 |
| 262,300 | Quiksilver, Inc.(b,c) | 3,024,319 | 41,500 | Bear Stearns Companies, Inc. | 4,390,700 |
| 201,900 | Ruby Tuesday, Inc.(c) | 4,423,629 | 83,800 | Brown & Brown, Inc.(c) | 4,552,854 |
| 125,500 | Saks, Inc.(b) | 2,277,825 | 204,900 | CapitalSource, Inc.(b,c) | 4,507,800 |
| 225,600 | ServiceMaster Company | 2,838,048 | 81,200 | City National Corporation | 5,958,456 |
| 408,050 | Staples, Inc. | 9,274,976 | 427,500 | Colonial BancGroup, Inc. | 10,409,625 |
| 128,200 | Tupperware Corporation(c) | 2,939,626 | 79,800 | Everest Re Group, Ltd. | 7,936,110 |
| 347,500 | Warnaco Group, Inc.(b,c) | 7,881,300 | 184,482 | Fidelity National Financial, Inc. | 6,910,696 |
| 138,400 | Yum! Brands, Inc. | 7,040,408 | 32,284 | Fidelity National Title | |
|
| |
| | Total Consumer | | | Group, Inc.(b) | 702,185 |
| | Discretionary | 132,127,512 | 78,100 | First Horizon National | |
|
| |
| | | | | Corporation(c) | 3,020,908 |
| Consumer Staples (4.0%) | | 162,600 | General Growth Properties, Inc. | 6,907,248 |
| 176,600 | Campbell Soup Company | 5,139,060 | 139,800 | Global Signal, Inc.(c) | 5,794,710 |
| 132,200 | Chiquita Brands | | 636,450 | HCC Insurance Holdings, Inc. | 19,093,498 |
| | International, Inc.(c) | 3,650,042 | 89,100 | Home Properties, Inc. | 3,461,535 |
| 47,400 | Clorox Company | 2,565,288 | 392,700 | HRPT Properties Trust | 4,284,357 |
| 181,900 | Dean Foods Company(b) | 6,575,685 | 9,600 | Jefferies Group, Inc. | 407,616 |
| 454,800 | Del Monte Foods Company(b,c) | 4,811,784 | 47,800 | Legg Mason, Inc. | 5,129,418 |
| 112,700 | Flowers Foods, Inc.(c) | 3,302,110 | 174,200 | Mercantile Bankshares | |
| 163,200 | Hormel Foods Corporation | 5,189,760 | | Corporation | 9,817,912 |
| 293,100 | Smithfield Foods, Inc.(b) | 8,669,898 | 265,600 | New York Community | |
| 30,020 | TreeHouse Foods, Inc.(b,c) | 775,717 | | Bancorp, Inc.(c) | 4,294,752 |
| 339,400 | Tyson Foods, Inc. | 6,041,320 | 147,850 | North Fork Bancorporation, Inc. | 3,746,519 |
|
| |
| | Total Consumer Staples | 46,720,664 | | | |
|
| |
| |
| The accompanying notes to the financial statements are an integral part of this schedule. | |
|
90
| Mid Cap Stock Fund | | | | |
| Schedule of Investments as of October 31, 2005(a) | | | | |
| |
| Shares | Common Stock (81.0%) | Value | Shares | Common Stock (81.0%) | Value |
|
| |
| Financials -- continued | | Industrials (10.1%) | |
| 116,600 | Odyssey Re Holdings | | 333,700 | Adesa, Inc. | $7,141,180 |
| | Corporation(c) | $2,994,288 | 92,900 | Brady Corporation | 2,672,733 |
| 119,100 | Ohio Casualty Corporation | 3,249,048 | 151,700 | Burlington Northern | |
| 188,400 | PartnerRe, Ltd. | 12,004,848 | | Santa Fe Corporation | 9,414,502 |
| 60,700 | PMI Group, Inc. | 2,420,716 | 105,100 | Canadian National | |
| 66,000 | ProLogis Trust | 2,838,000 | | Railway Company | 7,617,648 |
| 237,100 | Sovereign Bancorp, Inc.(c) | 5,114,247 | 51,100 | Deere & Company | 3,100,748 |
| 228,600 | TCF Financial Corporation(c) | 6,195,060 | 157,200 | Fastenal Company(c) | 11,024,436 |
| 390,100 | Trizec Properties, Inc. | 8,679,725 | 120,900 | Graco, Inc. | 4,143,243 |
| 72,000 | Westamerica Bancorporation(c) | 3,838,320 | 169,600 | IDEX Corporation | 6,787,392 |
| 61,400 | Wintrust Financial Corporation(c) | 3,295,952 | 191,600 | Ingersoll-Rand Company | 7,240,564 |
|
| |
| | Total Financials | 174,881,039 | 161,700 | Jacobs Engineering Group, Inc.(b) | 10,308,375 |
|
| |
| | | | 397,700 | JB Hunt Transport Services, Inc. | 7,719,357 |
| Health Care (8.6%) | | 132,500 | Joy Global, Inc. | 6,077,775 |
| 109,100 | Amylin Pharmaceuticals, Inc.(b,c) | 3,665,760 | 183,400 | Manitowoc Company, Inc.(c) | 9,758,714 |
| 136,300 | Beckman Coulter, Inc. | 6,714,138 | 212,200 | Oshkosh Truck Corporation(c) | 9,243,432 |
| 76,800 | C.R. Bard, Inc. | 4,790,784 | 57,400 | Republic Services, Inc. | 2,029,090 |
| 85,500 | Coventry Health Care, Inc.(b) | 4,616,145 | 246,800 | Roper Industries, Inc. | 9,304,360 |
| 83,500 | Cyberonics, Inc.(b) | 2,506,670 | 106,600 | Swift Transportation | |
| 49,600 | Dentsply International, Inc. | 2,734,944 | | Company, Inc.(b,c) | 1,945,450 |
| 56,300 | Edwards Lifesciences | | 91,900 | URS Corporation(b) | 3,715,517 |
|
|
| | Corporation(b,c) | 2,329,694 | | Total Industrials | 119,244,516 |
|
|
| 116,900 | Endo Pharmaceutical | | | | |
| | Holdings, Inc.(b) | 3,146,948 | Information Technology (11.3%) | |
| 214,600 | Henry Schein, Inc.(b) | 8,506,744 | 113,900 | Acxiom Corporation(c) | 2,430,626 |
| 76,200 | Hospira, Inc.(b) | 3,036,570 | 135,800 | Amphenol Corporation | 5,427,926 |
| 36,200 | Intuitive Surgical, Inc.(b,c) | 3,212,026 | 71,800 | Analog Devices, Inc. | 2,497,204 |
| 32,900 | Invitrogen Corporation(b) | 2,092,111 | 359,300 | Andrew Corporation(b) | 3,815,766 |
| 207,293 | IVAX Corporation(b,c) | 5,918,215 | 79,700 | Cabot Microelectronics | |
| 99,300 | Medco Health Solutions, Inc.(b) | 5,610,450 | | Corporation(b,c) | 2,343,180 |
| 93,700 | Mentor Corporation(c) | 4,216,500 | 82,200 | CDW Corporation | 4,631,970 |
| 92,400 | Omnicare, Inc. | 4,998,840 | 90,600 | CheckFree Corporation(b) | 3,850,500 |
| 79,000 | PacifiCare Health Systems, Inc.(b) | 6,506,440 | 56,100 | Cognizant Technology | |
| 91,000 | Par Pharmaceutical | | | Solutions Corporation(b) | 2,467,278 |
| | Companies, Inc.(b,c) | 2,355,080 | 449,300 | Compuware Corporation(b) | 3,634,837 |
| 129,200 | Quest Diagnostics, Inc. | 6,034,932 | 109,900 | Comverse Technology, Inc.(b) | 2,758,490 |
| 69,300 | United Surgical Partners | | 176,600 | Convergys Corporation(b) | 2,869,750 |
| | International, Inc.(b,c) | 2,484,405 | 55,000 | Diebold, Inc.(c) | 1,987,700 |
| 50,000 | Universal Health Services, Inc. | 2,357,000 | 70,100 | DST Systems, Inc.(b) | 3,934,012 |
| 75,300 | Varian Medical Systems, Inc.(b) | 3,430,668 | 340,800 | EarthLink, Inc.(b,c) | 3,752,208 |
| 101,400 | Varian, Inc.(b,c) | 3,728,478 | 358,800 | Electronic Data | |
| 176,400 | Vertex Pharmaceuticals, Inc.(b,c) | 4,013,100 | | Systems Corporation | 8,363,628 |
| 81,200 | Watson Pharmaceuticals, Inc.(b) | 2,806,272 | 45,700 | F5 Networks, Inc.(b,c) | 2,377,771 |
|
| |
| | Total Health Care | 101,812,914 | 176,400 | Fairchild Semiconductor | |
|
| |
| | | | | International, Inc.(b) | 2,716,560 |
| | | | 9,969 | Homestore, Inc.(b) | 36,187 |
| |
| The accompanying notes to the financial statements are an integral part of this schedule. | |
|
91
| Mid Cap Stock Fund | | | | | |
| Schedule of Investments as of October 31, 2005(a) | | | | |
| |
| Shares | Common Stock (81.0%) | Value | Shares | Common Stock (81.0%) | Value |
|
| |
| Information Technology -- continued | | 302,000 | Lyondell Chemical Company | $8,093,600 |
| 93,000 | International Rectifier | | 105,400 | Newmont Mining Corporation | 4,490,040 |
| | Corporation(b) | $2,751,870 | 52,300 | Nucor Corporation | 3,130,155 |
| 226,500 | Intersil Corporation | 5,155,140 | 86,700 | Owens-Illinois, Inc.(b) | 1,650,768 |
|
|
| 145,600 | Lam Research Corporation(b) | 4,912,544 | | Total Materials | 47,572,426 |
|
|
| 83,100 | McAfee, Inc.(b) | 2,495,493 | | | | |
| 86,800 | Microchip Technology, Inc. | 2,618,756 | Telecommunications Services (0.7%) | |
| 895,200 | Novell, Inc.(b,c) | 6,821,424 | 912,900 | Cincinnati Bell, Inc.(b) | 3,615,084 |
| 104,000 | QLogic Corporation(b) | 3,136,640 | 62,000 | NII Holdings, Inc.(b,c) | 5,141,040 |
|
|
| 177,300 | Salesforce.com, Inc.(b,c) | 4,430,727 | | Total Telecommunications | |
| 97,200 | SanDisk Corporation(b,c) | 5,724,108 | | Services | | 8,756,124 |
|
|
| 184,200 | Scientific-Atlanta, Inc.(c) | 6,528,048 | | | | |
| 392,000 | Silicon Image, Inc.(b) | 3,598,560 | Utilities (4.4%) | | |
| 141,100 | Sybase, Inc.(b) | 3,139,475 | 174,700 | CMS Energy Corporation(b) | 2,604,777 |
| 139,400 | Synopsys, Inc.(b) | 2,641,630 | 146,100 | MDU Resources Group, Inc. | 4,816,917 |
| 272,600 | Tekelec, Inc.(b,c) | 3,740,072 | 166,200 | Pepco Holdings, Inc. | 3,571,638 |
| 232,700 | Vishay Intertechnology, Inc.(b,c) | 2,638,818 | 103,300 | Piedmont Natural Gas | |
| 564,100 | Wind River Systems, Inc.(b,c) | 7,389,710 | | Company, Inc.(c) | | 2,444,078 |
| 69,600 | Zebra Technologies Corporation(b) | 3,000,456 | 190,500 | Questar Corporation | 15,001,875 |
|
| |
| | Total Information | | 385,200 | Reliant Energy, Inc.(b,c) | 4,892,040 |
| | Technology | 133,731,650 | 79,100 | SCANA Corporation | 3,137,897 |
|
| |
| | | | 178,100 | Sempra Energy | | 7,889,830 |
| Materials (4.0%) | | 319,630 | Southern Union Company | 7,517,698 |
|
|
| 234,500 | Airgas, Inc. | 6,629,315 | | Total Utilities | | 51,876,750 |
|
|
| 63,700 | Cleveland-Cliffs, Inc.(c) | 5,194,098 | | | | |
|
|
| 251,800 | Freeport-McMoRan | | | Total Common Stock | |
| | Copper & Gold, Inc. | 12,443,956 | | (cost $810,601,135) | 956,648,663 |
|
|
| 147,700 | Inco, Ltd. | 5,940,494 | | | | |
| |
| | | | | Interest | Maturity | |
| Shares | Collateral Held for Securities Loaned (14.6%) | Rate(d) | Date | Value |
|
| 172,111,641 | Thrivent Financial Securities Lending Trust | | 3.950% | N/A | $172,111,641 |
|
|
| | | Total Collateral Held for Securities Loaned | |
| | | (cost $172,111,641) | | | 172,111,641 |
|
|
The accompanying notes to the financial statements are an integral part of this schedule.
92
| Mid Cap Stock Fund | | | |
| Schedule of Investments as of October 31, 2005(a) | | | |
| |
| Shares or | | | | |
| Principal | | | Interest | Maturity | |
| Amount | Short-Term Investments (4.4%) | | Rate(d) | Date | Value |
|
| $13,740,000 | BP Capital Markets plc | | 4.020% | 11/1/2005 | $13,740,000 |
| 10,000,000 | Novartis Finance Corporation | | 4.030 | 11/1/2005 | 10,000,000 |
| 27,998,103 | Thrivent Money Market Fund | | 3.600 | N/A | 27,998,103 |
|
|
| | Total Short-Term Investments (at amortized cost) | 51,738,103 |
|
|
| | Total Investments (cost $1,034,450,879) | | $1,180,498,407 |
|
|
| (a) | The categories of investments are shown as a percentage of total investments. |
| |
| (b) | Non-income producing security. |
| |
| (c) | All or a portion of the security is on loan as discussed in item 2(L) of the Notes to Financial Statements. |
| |
| (d) | The interest rate shown reflects the yield, coupon rate or, for securities purchased at a discount, the discount rate at the date of purchase. |
| |
The accompanying notes to the financial statements are an integral part of this schedule.
93
| | Mid Cap Index Fund | | |
| | Schedule of Investments as of October 31, 2005(a) | | |
| Shares | Common Stock (82.2%) | Value | Shares | Common Stock (82.2%) | | Value |
|
| |
| Consumer Discretionary (13.4%) | | 2,100 | Hovnanian Enterprises, Inc.(b,c) | | $94,479 |
| 2,700 | 99 Cents Only Stores(b,c) | $26,055 | 1,950 | International Speedway | | |
| 5,170 | Abercrombie & Fitch Company | 268,788 | | Corporation | | 100,776 |
| 6,300 | Advance Auto Parts, Inc.(b) | 236,250 | 2,100 | ITT Educational Services, Inc.(b) | | 116,088 |
| 3,200 | Aeropostale, Inc.(b) | 62,528 | 2,900 | Laureate Education, Inc.(b,c) | | 143,260 |
| 8,100 | American Eagle Outfitters, Inc. | 190,755 | 4,060 | Lear Corporation(c) | | 123,668 |
| 3,800 | American Greetings Corporation | 95,950 | 2,670 | Lee Enterprises, Inc.(c) | | 104,691 |
| 4,300 | AnnTaylor Stores Corporation(b) | 104,361 | 1,610 | Media General, Inc. | | 84,928 |
| 4,550 | Applebee’s International, Inc. | 99,690 | 7,900 | Michaels Stores, Inc. | | 261,332 |
| 4,217 | ArvinMeritor, Inc.(c) | 67,599 | 1,950 | Modine Manufacturing Company | 64,467 |
| 680 | Bandag, Inc.(c) | 28,900 | 3,060 | Mohawk Industries, Inc.(b) | | 238,833 |
| 3,260 | Barnes & Noble, Inc. | 117,882 | 6,500 | O’Reilly Automotive, Inc.(b) | | 183,300 |
| 2,400 | Beazer Homes USA, Inc.(c) | 139,080 | 3,760 | Outback Steakhouse, Inc. | | 141,602 |
| 5,610 | Belo Corporation | 121,176 | 4,400 | Pacific Sunwear of California, Inc.(b) | 110,088 |
| 1,610 | Blyth, Inc.(c) | 29,366 | 3,970 | Payless ShoeSource, Inc.(b,c) | | 72,929 |
| 2,210 | Bob Evans Farms, Inc. | 49,526 | 8,400 | PETsMART, Inc. | | 197,400 |
| 4,060 | Borders Group, Inc. | 79,698 | 4,700 | Pier 1 Imports, Inc.(c) | | 48,504 |
| 3,240 | BorgWarner, Inc. | 187,888 | 3,500 | Polo Ralph Lauren Corporation | | 172,200 |
| 2,500 | Boyd Gaming Corporation | 103,125 | 5,690 | Reader’s Digest Association, Inc.(c) | 87,171 |
| 5,175 | Brinker International, Inc.(b) | 197,271 | 2,600 | Regis Corporation(c) | | 99,736 |
| 3,850 | Callaway Golf Company | 54,862 | 4,100 | Rent-A-Center, Inc.(b) | | 73,882 |
| 6,000 | Career Education Corporation(b,c) | 213,540 | 8,400 | Ross Stores, Inc. | | 227,136 |
| 6,100 | CarMax, Inc.(b,c) | 163,907 | 3,600 | Ruby Tuesday, Inc.(c) | | 78,876 |
| 2,400 | Catalina Marketing Corporation(c) | 62,544 | 2,700 | Ryland Group, Inc.(c) | | 181,710 |
| 2,800 | CBRL Group, Inc. | 97,160 | 8,210 | Saks, Inc.(b) | | 149,012 |
| 4,400 | Cheesecake Factory, Inc.(b) | 151,008 | 2,180 | Scholastic Corporation(b) | | 70,959 |
| 10,600 | Chico’s FAS, Inc.(b) | 419,124 | 2,600 | Sotheby’s Holdings, Inc.(b) | | 40,482 |
| 5,760 | Claire’s Stores, Inc. | 150,048 | 2,000 | Thor Industries, Inc. | | 65,260 |
| 5,100 | Corinthian Colleges, Inc.(b,c) | 63,444 | 3,200 | Timberland Company(b) | | 90,080 |
| 3,390 | DeVry, Inc.(b,c) | 76,614 | 6,800 | Toll Brothers, Inc.(b) | | 250,988 |
| 6,170 | Dollar Tree Stores, Inc.(b) | 133,025 | 3,000 | Tupperware Corporation | | 68,790 |
| 3,800 | Education Management | | 6,200 | Urban Outfitters, Inc.(b,c) | | 175,646 |
| | Corporation(b) | 117,192 | 2,860 | Valassis Communications, Inc.(b) | 89,375 |
| 2,100 | Emmis Communications | | 340 | Washington Post Company | | 253,300 |
| | Corporation(b,c) | 41,097 | 3,850 | Westwood One, Inc. | | 71,225 |
| 2,200 | Entercom Communications | | 6,760 | Williams-Sonoma, Inc.(b) | | 264,384 |
|
|
| | Corporation(b) | 63,514 | | Total Consumer | | |
| 9,000 | Foot Locker, Inc. | 174,960 | | Discretionary | | 9,828,977 |
|
|
| 3,020 | Furniture Brands | | | | | |
| | International, Inc.(c) | 54,813 | Consumer Staples (2.8%) | | |
| 3,300 | GameStop Corporation(b,c) | 117,084 | 4,020 | BJ’s Wholesale Club, Inc.(b) | | 114,490 |
| 9,200 | Gentex Corporation(c) | 173,144 | 3,680 | Church & Dwight Company, Inc.(c) | 128,984 |
| 7,300 | GTECH Holdings Corporation | 232,432 | 8,513 | Dean Foods Company(b) | | 307,745 |
| 3,800 | Harman International | | 4,150 | Energizer Holdings, Inc.(b) | | 209,534 |
| | Industries, Inc. | 379,468 | 4,200 | Hormel Foods Corporation | | 133,560 |
| 3,420 | Harte-Hanks, Inc. | 87,552 | 3,388 | J.M. Smucker Company | | 154,865 |
| |
| The accompanying notes to the financial statements are an integral part of this schedule. | | |
|
94
| Mid Cap Index Fund | | | | |
| Schedule of Investments as of October 31, 2005(a) | | | | |
| |
| Shares | Common Stock (82.2%) | Value | Shares | Common Stock (82.2%) | Value |
|
| |
| Consumer Staples -- continued | | 3,070 | Bank of Hawaii Corporation | $157,737 |
| 1,530 | Lancaster Colony Corporation(c) | $61,338 | 3,200 | Brown & Brown, Inc.(c) | 173,856 |
| 3,560 | PepsiAmericas, Inc. | 83,019 | 3,000 | Cathay General Bancorp | 116,970 |
| 1,990 | Ruddick Corporation | 43,800 | 2,600 | City National Corporation | 190,788 |
| 5,600 | Smithfield Foods, Inc.(b) | 165,648 | 8,900 | Colonial BancGroup, Inc. | 216,715 |
| 1,461 | Tootsie Roll Industries, Inc.(c) | 44,268 | 9,600 | Commerce Bancorp, Inc.(c) | 292,512 |
| 1,540 | Universal Corporation(c) | 57,658 | 2,800 | Cullen/Frost Bankers, Inc. | 147,896 |
| 3,800 | Whole Foods Market, Inc. | 547,694 | 6,300 | Developers Diversified | |
|
| |
| | Total Consumer Staples | 2,052,603 | | Realty Corporation | 275,184 |
|
| |
| | | | 7,500 | Eaton Vance Corporation | 186,675 |
| Energy (7.2%) | | 3,590 | Everest Re Group, Ltd. | 357,026 |
| 3,700 | Arch Coal, Inc.(c) | 285,159 | 9,227 | Fidelity National Financial, Inc. | 345,643 |
| 3,300 | Cooper Cameron Corporation(b) | 243,309 | 1 | Fidelity National Title | |
| 3,300 | Denbury Resources, Inc.(b) | 143,979 | | Group, Inc.(b) | 16 |
| 8,670 | ENSCO International, Inc. | 395,265 | 5,300 | First American Corporation | 232,246 |
| 3,900 | FMC Technologies, Inc.(b) | 142,194 | 4,850 | FirstMerit Corporation | 127,894 |
| 3,100 | Forest Oil Corporation(b) | 135,408 | 3,000 | Greater Bay Bancorp(c) | 75,270 |
| 7,320 | Grant Prideco, Inc.(b) | 284,675 | 6,100 | HCC Insurance Holdings, Inc. | 183,000 |
| 4,690 | Hanover Compressor Company(b,c) | 60,313 | 3,100 | Highwoods Properties, Inc. | 87,451 |
| 3,020 | Helmerich & Payne, Inc. | 167,308 | 2,650 | Horace Mann Educators | |
| 7,200 | Newfield Exploration Company(b) | 326,376 | | Corporation | 51,436 |
| 10,140 | Noble Energy, Inc. | 406,107 | 4,200 | Hospitality Properties Trust | 166,740 |
| 1,690 | Overseas Shipholding Group, Inc. | 80,444 | 4,300 | Independence Community | |
| 9,900 | Patterson-UTI Energy, Inc. | 337,887 | | Bank Corporation | 170,065 |
| 7,500 | Peabody Energy Corporation | 586,200 | 3,600 | IndyMac Bancorp, Inc.(c) | 134,388 |
| 8,150 | Pioneer Natural Resources | | 3,900 | Investors Financial Services | |
| | Company | 407,908 | | Corporation(c) | 148,902 |
| 4,500 | Plains Exploration & | | 2,800 | Jefferies Group, Inc. | 118,888 |
| | Production Company(b) | 175,500 | 3,400 | LaBranche & Company, Inc.(b,c) | 32,436 |
| 3,500 | Pogo Producing Company(c) | 176,750 | 6,545 | Legg Mason, Inc. | 702,340 |
| 9,100 | Pride International, Inc.(b) | 255,437 | 4,750 | Leucadia National Corporation(c) | 204,060 |
| 12,120 | Smith International, Inc. | 392,688 | 5,100 | Liberty Property Trust | 212,619 |
| 3,410 | Tidewater, Inc. | 156,724 | 3,400 | Macerich Company | 218,518 |
| 3,200 | Western Gas Resources, Inc. | 138,560 | 3,600 | Mack-Cali Realty Corporation | 153,540 |
|
| |
| | Total Energy | 5,298,191 | 4,780 | Mercantile Bankshares Corporation | 269,401 |
|
| |
| | | | 2,200 | Mercury General Corporation(c) | 132,990 |
| Financials (15.2%) | | 6,100 | New Plan Excel Realty Trust, Inc.(c) | 140,239 |
| 4,560 | A.G. Edwards, Inc. | 192,979 | 13,610 | New York Community | |
| 3,060 | Allmerica Financial Corporation(b) | 116,586 | | Bancorp, Inc.(c) | 220,074 |
| 4,800 | AMB Property Corporation | 212,064 | 3,710 | Ohio Casualty Corporation | 101,209 |
| 2,700 | American Financial Group, Inc. | 92,286 | 10,565 | Old Republic International | |
| 8,000 | AmeriCredit Corporation(b) | 178,800 | | Corporation | 273,739 |
| 2,200 | AmerUs Group Company(c) | 130,064 | 5,240 | PMI Group, Inc. | 208,971 |
| 5,500 | Arthur J. Gallagher & Company(c) | 161,810 | 3,950 | Protective Life Corporation | 173,168 |
| 7,878 | Associated Banc-Corp | 245,872 | 4,800 | Radian Group, Inc. | 250,080 |
| 4,920 | Astoria Financial Corporation | 137,514 | 3,350 | Raymond James Financial, Inc. | 114,000 |
| |
| |
| The accompanying notes to the financial statements are an integral part of this schedule. | |
|
95
| Mid Cap Index Fund | | | | | |
| Schedule of Investments as of October 31, 2005(a) | | | | |
| |
| Shares | Common Stock (82.2%) | | Value | Shares | Common Stock (82.2%) | Value |
|
| |
| Financials -- continued | | | 2,000 | Par Pharmaceutical | |
| 4,728 | Rayonier, Inc. REIT | | $180,751 | | Companies, Inc.(b,c) | $51,760 |
| 3,600 | Regency Centers Corporation | | 200,412 | 4,920 | Perrigo Company(c) | 65,780 |
| 3,800 | SEI Investments Company | | 147,440 | 6,200 | Protein Design Labs, Inc.(b,c) | 173,724 |
| 1,500 | StanCorp Financial Group, Inc. | 138,150 | 4,000 | Renal Care Group, Inc.(b) | 187,400 |
| 1,900 | SVB Financial Group(b,c) | | 94,449 | 6,120 | Sepracor, Inc.(b) | 344,250 |
| 6,680 | TCF Financial Corporation(c) | | 181,028 | 3,870 | STERIS Corporation | 88,275 |
| 2,400 | Texas Regional Bancshares, Inc.(c) | 70,392 | 2,300 | Techne Corporation(b) | 124,706 |
| 7,900 | United Dominion Realty Trust, Inc. | 174,827 | 4,900 | Triad Hospitals, Inc.(b) | 201,537 |
| 2,590 | Unitrin, Inc. | | 119,140 | 3,100 | Universal Health Services, Inc. | 146,134 |
| 6,500 | W.R. Berkley Corporation | | 284,050 | 5,370 | Valeant Pharmaceuticals | |
| 4,800 | Waddell & Reed Financial, Inc. | 92,064 | | International | 92,149 |
| 5,096 | Washington Federal, Inc. | | 117,157 | 7,500 | Varian Medical Systems, Inc.(b) | 341,700 |
| 3,150 | Webster Financial Corporation | 145,436 | 1,900 | Varian, Inc.(b) | 69,863 |
| 4,600 | Weingarten Realty Investors | | 163,576 | 4,700 | VCA Antech, Inc.(b) | 121,260 |
| 1,910 | Westamerica Bancorporation | | 101,822 | 5,400 | Vertex Pharmaceuticals, Inc.(b,c) | 122,850 |
|
|
| 3,940 | Wilmington Trust Corporation(c) | 149,365 | | Total Health Care | 7,093,181 |
|
| |
|
| | Total Financials | | 11,192,716 | | | |
|
| |
| | | | | Industrials (10.8%) | |
| Health Care (9.6%) | | | 5,230 | Adesa, Inc. | 111,922 |
| 3,756 | Advanced Medical Optics, Inc.(b) | 134,014 | 5,310 | AGCO Corporation(b) | 84,907 |
| 2,840 | Apria Healthcare Group, Inc.(b) | 65,519 | 5,100 | AirTran Holdings, Inc.(b,c) | 76,296 |
| 6,025 | Barr Pharmaceuticals, Inc.(b) | | 346,136 | 1,520 | Alaska Air Group, Inc.(b,c) | 47,926 |
| 3,600 | Beckman Coulter, Inc. | | 177,336 | 2,550 | Alexander & Baldwin, Inc. | 124,797 |
| 3,200 | Cephalon, Inc.(b,c) | | 145,888 | 2,200 | Alliant Techsystems, Inc.(b) | 154,484 |
| 4,200 | Charles River Laboratories | | | 4,040 | AMETEK, Inc. | 164,549 |
| | International, Inc.(b) | | 183,792 | 1,410 | Banta Corporation | 70,979 |
| 5,000 | Community Health Systems, Inc.(b) | 185,550 | 3,340 | Brink’s Company(c) | 131,162 |
| 3,690 | Covance, Inc.(b) | | 179,518 | 10,040 | C.H. Robinson Worldwide, Inc. | 354,010 |
| 6,300 | Cytyc Corporation(b) | | 159,705 | 1,760 | Carlisle Companies, Inc. | 117,374 |
| 4,560 | Dentsply International, Inc. | | 251,438 | 5,233 | ChoicePoint, Inc.(b) | 221,147 |
| 3,490 | Edwards Lifesciences Corporation(b) | 144,416 | 3,010 | CNF, Inc. | 169,373 |
| 2,900 | Gen-Probe, Inc.(b) | | 118,436 | 4,000 | Copart, Inc.(b,c) | 93,560 |
| 6,540 | Health Net, Inc.(b) | | 306,334 | 2,400 | Corporate Executive | |
| 4,900 | Henry Schein, Inc.(b) | | 194,236 | | Board Company | 198,336 |
| 3,430 | Hillenbrand Industries, Inc. | | 158,020 | 2,800 | Crane Company | 86,688 |
| 2,100 | INAMED Corporation(b) | | 149,310 | 3,100 | Deluxe Corporation | 103,323 |
| 2,000 | Intuitive Surgical, Inc.(b) | | 177,460 | 3,880 | Donaldson Company, Inc.(c) | 121,250 |
| 3,100 | Invitrogen Corporation(b) | | 197,129 | 3,800 | Dun & Bradstreet Corporation(b) | 240,616 |
| 12,456 | IVAX Corporation(b,c) | | 355,619 | 6,200 | Expeditors International of | |
| 3,200 | LifePoint Hospitals, Inc.(b) | | 125,120 | | Washington, Inc. | 376,154 |
| 5,800 | Lincare Holdings, Inc.(b) | | 236,930 | 3,540 | Fastenal Company(c) | 248,260 |
| 1,800 | Martek Biosciences Corporation(b,c) | 55,566 | 2,880 | Federal Signal Corporation(c) | 46,714 |
| 17,538 | Millennium Pharmaceuticals, Inc.(b) | 159,947 | 3,220 | Flowserve Corporation(b) | 112,700 |
| 6,180 | Omnicare, Inc. | | 334,338 | 3,000 | GATX Corporation(c) | 112,110 |
| 5,100 | PacifiCare Health Systems, Inc.(b) | 420,036 | 4,050 | Graco, Inc. | 138,794 |
| |
| The accompanying notes to the financial statements are an integral part of this schedule. | |
|
96
| Mid Cap Index Fund | | | | |
| Schedule of Investments as of October 31, 2005(a) | | | | |
| |
| Shares | Common Stock (82.2%) | Value | Shares | Common Stock (82.2%) | Value |
|
| |
| Industrials -- continued | | 4,000 | Alliance Data Systems | |
| 1,945 | Granite Construction, Inc.(c) | $66,344 | | Corporation(b) | $142,240 |
| 2,440 | Harsco Corporation | 156,770 | 5,200 | Amphenol Corporation | 207,844 |
| 4,070 | Herman Miller, Inc. | 111,559 | 1,800 | Anteon International | |
| 3,210 | HNI Corporation | 156,969 | | Corporation(b,c) | 81,360 |
| 3,430 | Hubbell, Inc. | 165,189 | 6,920 | Arrow Electronics, Inc.(b) | 204,209 |
| 3,340 | Jacobs Engineering Group, Inc.(b) | 212,925 | 25,060 | Atmel Corporation(b,c) | 61,648 |
| 7,300 | JB Hunt Transport Services, Inc. | 141,693 | 8,340 | Avnet, Inc.(b) | 192,237 |
| 5,400 | JetBlue Airways Corporation(b,c) | 100,494 | 2,860 | Avocent Corporation(b,c) | 87,688 |
| 4,700 | Joy Global, Inc. | 215,589 | 6,900 | BISYS Group, Inc.(b) | 87,492 |
| 1,100 | Kelly Services, Inc. | 30,448 | 1,615 | Cabot Microelectronics | |
| 2,160 | Kennametal, Inc. | 110,398 | | Corporation(b,c) | 47,481 |
| 2,500 | Korn/Ferry International(b,c) | 43,050 | 16,080 | Cadence Design Systems, Inc.(b) | 256,958 |
| 5,040 | Manpower, Inc. | 228,211 | 3,540 | CDW Corporation | 199,479 |
| 1,500 | Mine Safety Appliances Company | 62,835 | 8,400 | Ceridian Corporation(b) | 184,044 |
| 2,900 | MSC Industrial Direct | | 3,100 | Certegy, Inc. | 116,126 |
| | Company, Inc. | 110,722 | 5,290 | CheckFree Corporation(b) | 224,825 |
| 1,880 | Nordson Corporation | 69,880 | 8,000 | Cognizant Technology | |
| 5,920 | Pentair, Inc. | 192,341 | | Solutions Corporation(b) | 351,840 |
| 7,640 | Precision Castparts Corporation | 361,830 | 3,130 | CommScope, Inc.(b,c) | 61,098 |
| 6,790 | Quanta Services, Inc.(b,c) | 78,017 | 5,800 | Credence Systems Corporation(b,c) | 44,660 |
| 7,100 | Republic Services, Inc. | 250,985 | 4,400 | Cree, Inc.(b,c) | 105,776 |
| 1,762 | Rollins, Inc.(c) | 33,513 | 2,740 | CSG Systems International, Inc.(b) | 64,417 |
| 390 | Sequa Corporation(b,c) | 24,063 | 7,910 | Cypress Semiconductor | |
| 4,140 | SPX Corporation | 178,103 | | Corporation(b,c) | 107,576 |
| 2,600 | Stericycle, Inc.(b) | 149,656 | 4,000 | Diebold, Inc. | 144,560 |
| 2,930 | Swift Transportation | | 4,060 | DST Systems, Inc.(b) | 227,847 |
| | Company, Inc.(b,c) | 53,472 | 2,300 | Dycom Industries, Inc.(b,c) | 45,839 |
| 1,260 | Tecumseh Products Company(c) | 25,364 | 2,200 | F5 Networks, Inc.(b) | 114,466 |
| 2,320 | Teleflex, Inc.(c) | 153,561 | 3,750 | Fair Isaac Corporation | 156,600 |
| 3,000 | Thomas & Betts Corporation(b) | 116,760 | 7,000 | Fairchild Semiconductor | |
| 4,800 | Timken Company | 136,128 | | International, Inc.(b) | 107,800 |
| 2,430 | Trinity Industries, Inc.(c) | 92,462 | 3,300 | Gartner Group, Inc.(b,c) | 39,732 |
| 3,900 | United Rentals, Inc.(b,c) | 76,323 | 7,580 | Harris Corporation | 311,538 |
| 3,100 | Werner Enterprises, Inc.(c) | 55,552 | 1,900 | Imation Corporation | 81,339 |
| 3,300 | Yellow Roadway Corporation(b,c) | 149,985 | 6,700 | Ingram Micro, Inc.(b) | 121,270 |
| 2,520 | York International Corporation | 141,397 | 11,390 | Integrated Device | |
|
| |
| | Total Industrials | 7,960,019 | | Technology, Inc.(b) | 112,533 |
|
| |
| | | | 4,100 | International Rectifier | |
| Information Technology (12.8%) | | | Corporation(b) | 121,319 |
| 22,400 | 3Com Corporation(b) | 86,240 | 8,800 | Intersil Corporation | 200,288 |
| 16,000 | Activision, Inc.(b) | 252,320 | 4,400 | Jack Henry & Associates, Inc.(c) | 79,112 |
| 4,430 | Acxiom Corporation | 94,536 | 5,000 | KEMET Corporation(b,c) | 34,600 |
| 3,760 | ADTRAN, Inc. | 113,740 | 7,900 | Lam Research Corporation(b) | 266,546 |
| 900 | Advent Software, Inc.(b,c) | 27,648 | 6,700 | Lattice Semiconductor | |
| | | | | Corporation(b) | 29,346 |
| |
| The accompanying notes to the financial statements are an integral part of this schedule. | |
|
97
| Mid Cap Index Fund | | | | |
| Schedule of Investments as of October 31, 2005(a) | | | | |
| |
| Shares | Common Stock (82.2%) | Value | Shares | Common Stock (82.2%) | Value |
|
| |
| Information Technology -- continued | | 2,490 | Ferro Corporation(c) | $44,422 |
| 4,420 | Macromedia, Inc.(b) | $194,126 | 2,200 | FMC Corporation(b) | 119,768 |
| 2,900 | Macrovision Corporation(b) | 54,636 | 2,560 | Glatfelter Company(c) | 34,790 |
| 10,180 | McAfee, Inc.(b) | 305,705 | 3,040 | Longview Fibre Company | 57,152 |
| 9,300 | McDATA Corporation(b,c) | 44,733 | 3,960 | Lubrizol Corporation | 164,696 |
| 9,100 | MEMC Electronic Materials, Inc.(b) | 163,254 | 12,300 | Lyondell Chemical Company | 329,640 |
| 4,540 | Mentor Graphics Corporation(b) | 37,546 | 2,700 | Martin Marietta Materials, Inc. | 213,057 |
| 3,910 | Micrel, Inc.(b,c) | 39,100 | 1,270 | Minerals Technologies, Inc. | 67,894 |
| 12,235 | Microchip Technology, Inc. | 369,130 | 4,080 | Olin Corporation(c) | 72,950 |
| 5,000 | MoneyGram International, Inc. | 121,500 | 3,600 | Packaging Corporation | |
| 5,720 | MPS Group, Inc.(b) | 71,214 | | of America(c) | 73,044 |
| 3,250 | National Instruments | | 1,600 | Potlatch Corporation(c) | 71,568 |
| | Corporation(c) | 77,675 | 6,890 | RPM International, Inc. | 128,292 |
| 2,200 | Newport Corporation(b) | 28,688 | 1,400 | Scotts Company | 122,906 |
| 2,800 | Plantronics, Inc.(c) | 83,580 | 2,920 | Sensient Technologies | |
| 2,600 | Plexus Corporation(b) | 45,942 | | Corporation(c) | 51,655 |
| 5,500 | Polycom, Inc.(b) | 84,150 | 5,740 | Sonoco Products Company | 162,442 |
| 6,320 | Powerwave Technologies, Inc.(b,c) | 70,847 | 2,100 | Steel Dynamics, Inc.(c) | 65,037 |
| 3,050 | Reynolds and Reynolds Company | 80,947 | 5,920 | Valspar Corporation | 130,536 |
| 11,400 | RF Micro Devices, Inc.(b,c) | 59,736 | 4,000 | Worthington Industries, Inc.(c) | 80,480 |
|
|
| 4,100 | RSA Security, Inc.(b,c) | 46,740 | | Total Materials | 2,629,723 |
|
|
| 10,300 | SanDisk Corporation(b) | 606,567 | | | |
| 4,360 | Semtech Corporation(b,c) | 65,749 | Telecommunications Services (0.4%) | |
| 2,600 | Silicon Laboratories, Inc.(b,c) | 83,642 | 14,110 | Cincinnati Bell, Inc.(b) | 55,876 |
| 1,900 | SRA International, Inc.(b) | 62,358 | 6,010 | Telephone and Data Systems, Inc. | 227,298 |
|
|
| 5,260 | Sybase, Inc.(b) | 117,035 | | Total Telecommunications | |
| 8,380 | Synopsys, Inc.(b) | 158,801 | | Services | 283,174 |
|
|
| 3,440 | Tech Data Corporation(b) | 119,162 | | | |
| 2,080 | Transaction Systems | | Utilities (6.4%) | |
| | Architects, Inc.(b) | 56,181 | 4,660 | AGL Resources, Inc. | 163,985 |
| 8,379 | TriQuint Semiconductor, Inc.(b,c) | 35,192 | 6,670 | Alliant Energy Corporation | 176,422 |
| 5,900 | UTStarcom, Inc.(b,c) | 32,568 | 5,675 | Aqua America, Inc. | 192,269 |
| 10,670 | Vishay Intertechnology, Inc.(b) | 120,998 | 21,490 | Aquila, Inc.(b) | 76,075 |
| 12,600 | Western Digital Corporation(b,c) | 152,460 | 1,980 | Black Hills Corporation(c) | 82,309 |
| 4,300 | Wind River Systems, Inc.(b,c) | 56,330 | 7,220 | DPL, Inc. | 186,059 |
| 4,200 | Zebra Technologies Corporation(b) | 181,062 | 4,570 | Duquesne Light Holdings, Inc.(c) | 76,273 |
|
| |
| | Total Information | | 8,550 | Energy East Corporation | 203,918 |
| | Technology | 9,425,571 | 7,000 | Equitable Resources, Inc. | 270,550 |
|
| |
| | | | 4,330 | Great Plains Energy, Inc.(c) | 124,314 |
| Materials (3.6%) | | 4,640 | Hawaiian Electric Industries, Inc.(c) | 122,264 |
| 3,890 | Airgas, Inc. | 109,970 | 2,620 | IDACORP, Inc.(c) | 75,639 |
| 2,290 | Albemarle Corporation(c) | 80,356 | 6,950 | MDU Resources Group, Inc. | 229,142 |
| 3,040 | Bowater, Inc.(c) | 80,560 | 4,960 | National Fuel Gas Company | 149,494 |
| 3,670 | Cabot Corporation(c) | 125,184 | 7,660 | Northeast Utilities | |
| 13,670 | Chemtura Corporation | 146,269 | | Service Company | 139,335 |
| 2,350 | Cytec Industries, Inc.(c) | 97,055 | 6,140 | NSTAR | 167,008 |
| |
| The accompanying notes to the financial statements are an integral part of this schedule. | |
|
98
| Mid Cap Index Fund | | | | | | |
| Schedule of Investments as of October 31, 2005(a) | | | | | |
| |
| Shares | Common Stock (82.2%) | Value | Shares | Common Stock (82.2%) | Value |
|
| |
| Utilities -- continued | | | 4,420 | Vectren Corporation | $120,003 |
| 5,160 | OGE Energy Corporation | $132,922 | | 4,900 | Westar Energy, Inc. | 108,290 |
| 5,800 | ONEOK, Inc.(c) | 166,692 | | 2,990 | WGL Holdings, Inc.(c) | 92,929 |
| 10,855 | Pepco Holdings, Inc. | 233,274 | | 6,720 | Wisconsin Energy Corporation | 254,218 |
| 3,960 | PNM Resources, Inc. | 100,386 | | 2,200 | WPS Resources Corporation(c) | 120,032 |
|
|
| 6,720 | Puget Energy, Inc.(c) | 144,077 | | | Total Utilities | | 4,691,804 |
|
|
| 4,980 | Questar Corporation | 392,175 | | | | | |
|
|
| 6,490 | SCANA Corporation | 257,458 | | | Total Common Stock | |
| 10,370 | Sierra Pacific Resources(b,c) | 134,292 | | | (cost $49,468,642) | 60,455,959 |
|
|
| |
| |
| | | | | | Interest | Maturity | |
| Shares | Collateral Held for Securities Loaned (15.0%) | | Rate(d) | Date | Value |
|
| 11,062,822 | Thrivent Financial Securities Lending Trust | | | 3.950% | N/A | $11,062,822 |
|
|
| | | Total Collateral Held for Securities Loaned | |
| | | (cost $11,062,822) | | | | 11,062,822 |
|
|
| |
| |
| | | | | | Interest | Maturity | |
| Shares | Short-Term Investments (2.8%) | | | Rate(d) | Date | Value |
|
| 2,054,082 | Thrivent Money Market Fund(e) | | | | 3.600% | N/A | $2,054,082 |
|
|
| | | Total Short-Term Investments (at amortized cost) | 2,054,082 |
|
|
| | | Total Investments (cost $62,585,546) | | $73,572,863 |
|
|
| (a) | The categories of investments are shown as a percentage of total investments. |
| |
| (b) | Non-income producing security. |
| |
| (c) | All or a portion of the security is on loan as discussed in item 2(L) of the Notes to Financial Statements. |
| |
| (d) | The interest rate shown reflects the yield, coupon rate or, for securities purchased at a discount, the discount rate at the date of purchase. |
| |
| (e) | At October 31, 2005, $70,200 in cash was pledged as the initial margin deposit for the open financial futures contracts. In addition $2,054,082 of Short-Term Investments were earmarked as collateral to cover open financial futures contracts as follow: |
| |
| | | | | | Notional | |
| | Number of | Expiration | | | Principal | Unrealized |
| Type | Contracts | Date | Position | Value | Amount | Loss |
|
| S&P 400 Mini Futures | 27 | December 2005 | Long | $1,898,100 | $1,926,646 | $28,546 |
The accompanying notes to the financial statements are an integral part of this schedule.
99
| | Mid Cap Index Fund-I | |
| | Schedule of Investments as of October 31, 2005(a) | |
| Shares | Common Stock (81.1%) | Value | Shares | Common Stock (81.1%) | Value |
|
| |
| Consumer Discretionary (13.0%) | | 700 | Hovnanian Enterprises, Inc.(b,c) | $31,493 |
| 966 | 99 Cents Only Stores(b,c) | $9,322 | 755 | International Speedway | |
| 1,875 | Abercrombie & Fitch Company | 97,481 | | Corporation | 39,018 |
| 2,250 | Advance Auto Parts, Inc.(b) | 84,375 | 700 | ITT Educational Services, Inc.(b) | 38,696 |
| 1,100 | Aeropostale, Inc.(b) | 21,494 | 1,000 | Laureate Education, Inc.(b,c) | 49,400 |
| 2,914 | American Eagle Outfitters, Inc. | 68,625 | 1,475 | Lear Corporation(c) | 44,928 |
| 1,500 | American Greetings Corporation | 37,875 | 960 | Lee Enterprises, Inc.(c) | 37,642 |
| 1,500 | AnnTaylor Stores Corporation(b) | 36,405 | 635 | Media General, Inc. | 33,496 |
| 1,600 | Applebee’s International, Inc. | 35,056 | 2,900 | Michaels Stores, Inc. | 95,932 |
| 1,486 | ArvinMeritor, Inc.(c) | 23,821 | 740 | Modine Manufacturing Company | 24,464 |
| 380 | Bandag, Inc.(c) | 16,150 | 1,020 | Mohawk Industries, Inc.(b) | 79,611 |
| 1,195 | Barnes & Noble, Inc. | 43,211 | 2,300 | O’Reilly Automotive, Inc.(b) | 64,860 |
| 900 | Beazer Homes USA, Inc.(c) | 52,155 | 1,345 | Outback Steakhouse, Inc. | 50,653 |
| 2,015 | Belo Corporation | 43,524 | 1,600 | Pacific Sunwear of California, Inc.(b) | 40,032 |
| 615 | Blyth, Inc.(c) | 11,218 | 1,425 | Payless ShoeSource, Inc.(b,c) | 26,177 |
| 820 | Bob Evans Farms, Inc.(c) | 18,376 | 3,000 | PETsMART, Inc. | 70,500 |
| 1,565 | Borders Group, Inc. | 30,721 | 1,800 | Pier 1 Imports, Inc.(c) | 18,576 |
| 1,140 | BorgWarner, Inc. | 66,109 | 1,200 | Polo Ralph Lauren Corporation | 59,040 |
| 900 | Boyd Gaming Corporation | 37,125 | 2,115 | Reader’s Digest Association, Inc.(c) | 32,402 |
| 1,890 | Brinker International, Inc.(b) | 72,047 | 900 | Regis Corporation(c) | 34,524 |
| 1,450 | Callaway Golf Company | 20,662 | 1,500 | Rent-A-Center, Inc.(b) | 27,030 |
| 2,100 | Career Education Corporation(b,c) | 74,739 | 3,120 | Ross Stores, Inc. | 84,365 |
| 2,200 | CarMax, Inc.(b,c) | 59,114 | 1,400 | Ruby Tuesday, Inc.(c) | 30,674 |
| 900 | Catalina Marketing Corporation(c) | 23,454 | 1,000 | Ryland Group, Inc.(c) | 67,300 |
| 1,080 | CBRL Group, Inc. | 37,476 | 2,935 | Saks, Inc.(b) | 53,270 |
| 1,650 | Cheesecake Factory, Inc.(b) | 56,628 | 810 | Scholastic Corporation(b) | 26,366 |
| 3,800 | Chico’s FAS, Inc.(b) | 150,252 | 905 | Sotheby’s Holdings, Inc.(b) | 14,091 |
| 2,080 | Claire’s Stores, Inc. | 54,184 | 700 | Thor Industries, Inc. | 22,841 |
| 1,900 | Corinthian Colleges, Inc.(b,c) | 23,636 | 1,100 | Timberland Company(b) | 30,965 |
| 1,195 | DeVry, Inc.(b,c) | 27,007 | 2,400 | Toll Brothers, Inc.(b) | 88,584 |
| 2,302 | Dollar Tree Stores, Inc.(b) | 49,631 | 1,200 | Tupperware Corporation | 27,516 |
| 1,400 | Education Management | | 2,200 | Urban Outfitters, Inc.(b,c) | 62,326 |
| | Corporation(b) | 43,176 | 975 | Valassis Communications, Inc.(b) | 30,469 |
| 800 | Emmis Communications | | 80 | Washington Post Company | 59,600 |
| | Corporation(b,c) | 15,656 | 1,460 | Westwood One, Inc. | 27,010 |
| 800 | Entercom Communications | | 2,470 | Williams-Sonoma, Inc.(b) | 96,602 |
|
|
| | Corporation(b) | 23,096 | | Total Consumer | |
| 3,300 | Foot Locker, Inc. | 64,152 | | Discretionary | 3,519,723 |
|
|
| 1,200 | Furniture Brands | | | | |
| | International, Inc.(c) | 21,780 | Consumer Staples (2.8%) | |
| 1,200 | GameStop Corporation(b,c) | 42,576 | 1,430 | BJ’s Wholesale Club, Inc.(b) | 40,726 |
| 3,300 | Gentex Corporation | 62,106 | 1,265 | Church & Dwight Company, Inc.(c) | 44,338 |
| 2,620 | GTECH Holdings Corporation | 83,421 | 3,157 | Dean Foods Company(b) | 114,126 |
| 1,300 | Harman International | | 1,500 | Energizer Holdings, Inc.(b) | 75,735 |
| | Industries, Inc. | 129,818 | 1,625 | Hormel Foods Corporation | 51,675 |
| 1,235 | Harte-Hanks, Inc. | 31,616 | 1,295 | J.M. Smucker Company(c) | 59,194 |
The accompanying notes to the financial statements are an integral part of this schedule.
100
| Mid Cap Index Fund-I | | | | |
| Schedule of Investments as of October 31, 2005(a) | | | | |
| | | | | |
Shares | Common Stock (81.1%) | Value | Shares | Common Stock (81.1%) | Value |
|
| |
| Consumer Staples -- continued | | 1,285 | Bank of Hawaii Corporation | $66,023 |
| 545 | Lancaster Colony Corporation(c) | $21,849 | 1,100 | Brown & Brown, Inc.(c) | 59,763 |
| 1,210 | PepsiAmericas, Inc. | 28,217 | 1,100 | Cathay General Bancorp | 42,889 |
| 780 | Ruddick Corporation | 17,168 | 910 | City National Corporation | 66,776 |
| 2,000 | Smithfield Foods, Inc.(b) | 59,160 | 3,200 | Colonial BancGroup, Inc. | 77,920 |
| 570 | Tootsie Roll Industries, Inc.(c) | 17,271 | 3,500 | Commerce Bancorp, Inc.(c) | 106,645 |
| 450 | Universal Corporation | 16,848 | 1,000 | Cullen/Frost Bankers, Inc. | 52,820 |
| 1,400 | Whole Foods Market, Inc. | 201,782 | 2,300 | Developers Diversified | |
|
| |
| | Total Consumer Staples | 748,089 | | Realty Corporation | 100,464 |
|
| |
| | | | 2,800 | Eaton Vance Corporation | 69,692 |
| Energy (7.1%) | | 1,205 | Everest Re Group, Ltd. | 119,837 |
| 1,300 | Arch Coal, Inc.(c) | 100,191 | 3,318 | Fidelity National Financial, Inc. | 124,292 |
| 1,200 | Cooper Cameron Corporation(b) | 88,476 | 1 | Fidelity National Title Group, Inc.(b) | 14 |
| 1,200 | Denbury Resources, Inc.(b) | 52,356 | 1,900 | First American Corporation | 83,258 |
| 3,180 | ENSCO International, Inc. | 144,976 | 1,770 | FirstMerit Corporation | 46,675 |
| 1,500 | FMC Technologies, Inc.(b) | 54,690 | 1,100 | Greater Bay Bancorp(c) | 27,599 |
| 1,100 | Forest Oil Corporation(b) | 48,048 | 2,150 | HCC Insurance Holdings, Inc. | 64,500 |
| 2,630 | Grant Prideco, Inc.(b) | 102,281 | 1,300 | Highwoods Properties, Inc. | 36,673 |
| 1,710 | Hanover Compressor Company(b,c) | 21,991 | 1,030 | Horace Mann Educators | |
| 1,125 | Helmerich & Payne, Inc. | 62,325 | | Corporation | 19,992 |
| 2,700 | Newfield Exploration Company(b) | 122,391 | 1,600 | Hospitality Properties Trust | 63,520 |
| 3,580 | Noble Energy, Inc. | 143,379 | 1,500 | Independence Community | |
| 670 | Overseas Shipholding Group, Inc. | 31,892 | | Bank Corporation | 59,325 |
| 3,600 | Patterson-UTI Energy, Inc. | 122,868 | 1,300 | IndyMac Bancorp, Inc.(c) | 48,529 |
| 2,700 | Peabody Energy Corporation | 211,032 | 1,400 | Investors Financial Services | |
| 2,860 | Pioneer Natural Resources | | | Corporation(c) | 53,452 |
| | Company | 143,143 | 1,100 | Jefferies Group, Inc. | 46,706 |
| 1,600 | Plains Exploration & | | 1,300 | LaBranche & Company, Inc.(b,c) | 12,402 |
| | Production Company(b) | 62,400 | 2,342 | Legg Mason, Inc. | 251,320 |
| 1,300 | Pogo Producing Company(c) | 65,650 | 1,700 | Leucadia National Corporation(c) | 73,032 |
| 3,300 | Pride International, Inc.(b) | 92,631 | 1,900 | Liberty Property Trust | 79,211 |
| 4,500 | Smith International, Inc. | 145,800 | 1,200 | Macerich Company | 77,124 |
| 1,180 | Tidewater, Inc. | 54,233 | 1,400 | Mack-Cali Realty Corporation | 59,710 |
| 1,200 | Western Gas Resources, Inc. | 51,960 | 1,790 | Mercantile Bankshares Corporation | 100,884 |
|
| |
| | Total Energy | 1,922,713 | 900 | Mercury General Corporation(c) | 54,405 |
|
| |
| | | | 2,100 | New Plan Excel Realty Trust, Inc.(c) | 48,279 |
| Financials (15.2%) | | 4,900 | New York Community | |
| 1,675 | A.G. Edwards, Inc. | 70,886 | | Bancorp, Inc.(c) | 79,233 |
| 1,065 | Allmerica Financial Corporation(b) | 40,576 | 1,315 | Ohio Casualty Corporation | 35,873 |
| 1,800 | AMB Property Corporation | 79,524 | 3,877 | Old Republic International | |
| 1,100 | American Financial Group, Inc. | 37,598 | | Corporation | 100,453 |
| 2,900 | AmeriCredit Corporation(b) | 64,815 | 1,970 | PMI Group, Inc. | 78,564 |
| 800 | AmerUs Group Company(c) | 47,296 | 1,555 | Protective Life Corporation | 68,171 |
| 1,900 | Arthur J. Gallagher & Company(c) | 55,898 | 1,800 | Radian Group, Inc. | 93,780 |
| 2,844 | Associated Banc-Corp | 88,761 | 1,200 | Raymond James Financial, Inc. | 40,836 |
| 1,745 | Astoria Financial Corporation | 48,773 | 1,683 | Rayonier, Inc. REIT | 64,341 |
The accompanying notes to the financial statements are an integral part of this schedule.
101
Mid Cap Index Fund-I
Schedule of Investments as of October 31, 2005(a)
|
| Shares | Common Stock (81.1%) | | Value | Shares | Common Stock (81.1%) | Value |
|
| |
| Financials -- continued | | | 700 | Par Pharmaceutical | |
| 1,300 | Regency Centers Corporation | | $72,371 | | Companies, Inc.(b,c) | $18,116 |
| 1,400 | SEI Investments Company | | 54,320 | 1,730 | Perrigo Company(c) | 23,130 |
| 600 | StanCorp Financial Group, Inc. | | 55,260 | 2,200 | Protein Design Labs, Inc.(b) | 61,644 |
| 700 | SVB Financial Group(b,c) | | 34,797 | 1,400 | Renal Care Group, Inc.(b) | 65,590 |
| 2,520 | TCF Financial Corporation(c) | | 68,292 | 2,170 | Sepracor, Inc.(b) | 122,062 |
| 1,000 | Texas Regional Bancshares, Inc.(c) | 29,330 | 1,480 | STERIS Corporation | 33,759 |
| 2,800 | United Dominion Realty Trust, Inc. | 61,964 | 800 | Techne Corporation(b) | 43,376 |
| 1,015 | Unitrin, Inc. | | 46,690 | 1,800 | Triad Hospitals, Inc.(b) | 74,034 |
| 2,300 | W.R. Berkley Corporation | | 100,510 | 1,200 | Universal Health Services, Inc. | 56,568 |
| 1,700 | Waddell & Reed Financial, Inc. | | 32,606 | 1,970 | Valeant Pharmaceuticals | |
| 1,973 | Washington Federal, Inc. | | 45,359 | | International | 33,805 |
| 1,270 | Webster Financial Corporation | | 58,636 | 2,800 | Varian Medical Systems, Inc.(b) | 127,568 |
| 1,700 | Weingarten Realty Investors | | 60,452 | 700 | Varian, Inc.(b) | 25,739 |
| 825 | Westamerica Bancorporation | | 43,981 | 1,700 | VCA Antech, Inc.(b) | 43,860 |
| 1,470 | Wilmington Trust Corporation(c) | 55,728 | 1,900 | Vertex Pharmaceuticals, Inc.(b,c) | 43,225 |
|
| |
|
| | Total Financials | 4,109,405 | | Total Health Care | 2,551,383 |
|
| |
|
| |
| Health Care (9.4%) | | | Industrials (10.7%) | |
| 1,324 | Advanced Medical Optics, Inc.(b) | 47,240 | 1,830 | Adesa, Inc. | 39,162 |
| 1,045 | Apria Healthcare Group, Inc.(b) | | 24,108 | 1,910 | AGCO Corporation(b) | 30,541 |
| 2,175 | Barr Pharmaceuticals, Inc.(b) | | 124,954 | 1,900 | AirTran Holdings, Inc.(b,c) | 28,424 |
| 1,310 | Beckman Coulter, Inc. | | 64,531 | 635 | Alaska Air Group, Inc.(b,c) | 20,022 |
| 1,200 | Cephalon, Inc.(b,c) | | 54,708 | 950 | Alexander & Baldwin, Inc. | 46,493 |
| 1,500 | Charles River Laboratories | | | 800 | Alliant Techsystems, Inc.(b) | 56,176 |
| | International, Inc.(b) | | 65,640 | 1,420 | AMETEK, Inc. | 57,837 |
| 1,800 | Community Health Systems, Inc.(b) | 66,798 | 510 | Banta Corporation | 25,673 |
| 1,270 | Covance, Inc.(b) | | 61,786 | 1,205 | Brink’s Company(c) | 47,320 |
| 2,400 | Cytyc Corporation(b) | | 60,840 | 3,620 | C.H. Robinson Worldwide, Inc. | 127,641 |
| 1,632 | Dentsply International, Inc. | | 89,988 | 665 | Carlisle Companies, Inc. | 44,349 |
| 1,200 | Edwards Lifesciences Corporation(b) | 49,656 | 1,900 | ChoicePoint, Inc.(b) | 80,294 |
| 1,000 | Gen-Probe, Inc.(b) | | 40,840 | 1,115 | CNF, Inc. | 62,741 |
| 2,350 | Health Net, Inc.(b) | | 110,074 | 1,400 | Copart, Inc.(b,c) | 32,746 |
| 1,800 | Henry Schein, Inc.(b) | | 71,352 | 800 | Corporate Executive | |
| 1,230 | Hillenbrand Industries, Inc. | | 56,666 | | Board Company | 66,112 |
| 700 | INAMED Corporation(b) | | 49,770 | 1,000 | Crane Company | 30,960 |
| 800 | Intuitive Surgical, Inc.(b) | | 70,984 | 1,100 | Deluxe Corporation | 36,663 |
| 1,100 | Invitrogen Corporation(b) | | 69,949 | 1,490 | Donaldson Company, Inc. | 46,562 |
| 4,425 | IVAX Corporation(b,c) | | 126,334 | 1,400 | Dun & Bradstreet Corporation(b) | 88,648 |
| 1,100 | LifePoint Hospitals, Inc.(b) | | 43,010 | 2,200 | Expeditors International of | |
| 2,030 | Lincare Holdings, Inc.(b) | | 82,926 | | Washington, Inc. | 133,474 |
| 600 | Martek Biosciences Corporation(b,c) | 18,522 | 1,270 | Fastenal Company(c) | 89,065 |
| 6,322 | Millennium Pharmaceuticals, Inc.(b) | 57,657 | 1,095 | Federal Signal Corporation(c) | 17,761 |
| 2,185 | Omnicare, Inc. | | 118,208 | 1,100 | Flowserve Corporation(b) | 38,500 |
| 1,850 | PacifiCare Health Systems, Inc.(b) | 152,366 | 1,125 | GATX Corporation(c) | 42,041 |
| |
| |
| |
| The accompanying notes to the financial statements are an integral part of this schedule. | |
|
102
Mid Cap Index Fund-I
Schedule of Investments as of October 31, 2005(a)
|
| Shares | Common Stock (81.1%) | Value | Shares | Common Stock (81.1%) | Value |
|
| |
| Industrials -- continued | | 1,400 | Alliance Data Systems | |
| 1,500 | Graco, Inc. | $51,405 | | Corporation(b) | $49,784 |
| 730 | Granite Construction, Inc. | 24,900 | 1,800 | Amphenol Corporation | 71,946 |
| 830 | Harsco Corporation | 53,328 | 700 | Anteon International | |
| 1,480 | Herman Miller, Inc. | 40,567 | | Corporation(b) | 31,640 |
| 1,115 | HNI Corporation | 54,524 | 2,425 | Arrow Electronics, Inc.(b) | 71,562 |
| 1,355 | Hubbell, Inc. | 65,257 | 9,090 | Atmel Corporation(b,c) | 22,361 |
| 1,220 | Jacobs Engineering Group, Inc.(b) | 77,775 | 3,060 | Avnet, Inc.(b) | 70,533 |
| 2,560 | JB Hunt Transport Services, Inc. | 49,690 | 1,000 | Avocent Corporation(b) | 30,660 |
| 1,900 | JetBlue Airways Corporation(b,c) | 35,359 | 2,500 | BISYS Group, Inc.(b) | 31,700 |
| 1,700 | Joy Global, Inc. | 77,979 | 617 | Cabot Microelectronics | |
| 490 | Kelly Services, Inc. | 13,563 | | Corporation(b,c) | 18,140 |
| 865 | Kennametal, Inc. | 44,210 | 5,780 | Cadence Design Systems, Inc.(b) | 92,364 |
| 900 | Korn/Ferry International(b,c) | 15,498 | 1,350 | CDW Corporation | 76,072 |
| 1,850 | Manpower, Inc. | 83,768 | 3,000 | Ceridian Corporation(b) | 65,730 |
| 600 | Mine Safety Appliances Company | 25,134 | 1,100 | Certegy, Inc. | 41,206 |
| 1,100 | MSC Industrial Direct | | 1,870 | CheckFree Corporation(b) | 79,475 |
| | Company, Inc. | 41,998 | 2,900 | Cognizant Technology | |
| 760 | Nordson Corporation | 28,249 | | Solutions Corporation(b) | 127,542 |
| 2,130 | Pentair, Inc. | 69,204 | 1,100 | CommScope, Inc.(b,c) | 21,472 |
| 2,800 | Precision Castparts Corporation | 132,608 | 2,100 | Credence Systems Corporation(b,c) | 16,170 |
| 2,400 | Quanta Services, Inc.(b,c) | 27,576 | 1,600 | Cree, Inc.(b,c) | 38,464 |
| 2,600 | Republic Services, Inc. | 91,910 | 1,045 | CSG Systems International, Inc.(b) | 24,568 |
| 740 | Rollins, Inc.(c) | 14,075 | 2,840 | Cypress Semiconductor | |
| 275 | Sequa Corporation(b,c) | 16,968 | | Corporation(b,c) | 38,624 |
| 1,540 | SPX Corporation | 66,251 | 1,490 | Diebold, Inc. | 53,849 |
| 900 | Stericycle, Inc.(b) | 51,804 | 1,390 | DST Systems, Inc.(b) | 78,007 |
| 1,150 | Swift Transportation | | 800 | Dycom Industries, Inc.(b,c) | 15,944 |
| | Company, Inc.(b,c) | 20,988 | 800 | F5 Networks, Inc.(b) | 41,624 |
| 485 | Tecumseh Products Company(c) | 9,763 | 1,400 | Fair Isaac Corporation | 58,464 |
| 835 | Teleflex, Inc.(c) | 55,269 | 2,500 | Fairchild Semiconductor | |
| 1,200 | Thomas & Betts Corporation(b) | 46,704 | | International, Inc.(b) | 38,500 |
| 1,700 | Timken Company | 48,212 | 1,300 | Gartner Group, Inc.(b,c) | 15,652 |
| 820 | Trinity Industries, Inc.(c) | 31,201 | 2,790 | Harris Corporation | 114,669 |
| 1,400 | United Rentals, Inc.(b,c) | 27,398 | 700 | Imation Corporation | 29,967 |
| 1,175 | Werner Enterprises, Inc. | 21,056 | 2,400 | Ingram Micro, Inc.(b) | 43,440 |
| 1,200 | Yellow Roadway Corporation(b,c) | 54,540 | 4,155 | Integrated Device | |
| 820 | York International Corporation | 46,010 | | Technology, Inc.(b) | 41,051 |
|
| |
| | Total Industrials | 2,903,946 | 1,500 | International Rectifier | |
|
| |
| | | | | Corporation(b) | 44,385 |
| Information Technology (12.6%) | | 3,200 | Intersil Corporation(c) | 72,832 |
| 8,200 | 3Com Corporation(b) | 31,570 | 1,600 | Jack Henry & Associates, Inc.(c) | 28,768 |
| 5,777 | Activision, Inc.(b) | 91,109 | 1,900 | KEMET Corporation(b,c) | 13,148 |
| 1,545 | Acxiom Corporation | 32,970 | 2,900 | Lam Research Corporation(b) | 97,846 |
| 1,290 | ADTRAN, Inc. | 39,022 | 2,500 | Lattice Semiconductor | |
| 400 | Advent Software, Inc.(b,c) | 12,288 | | Corporation(b) | 10,950 |
| |
| |
| The accompanying notes to the financial statements are an integral part of this schedule. | |
|
103
| Mid Cap Index Fund-I | | | | |
| Schedule of Investments as of October 31, 2005(a) | | | | |
| |
| Shares | Common Stock (81.1%) | Value | Shares | Common Stock (81.1%) | Value |
|
| |
| Information Technology -- continued | | 800 | FMC Corporation(b) | $43,552 |
| 1,600 | Macromedia, Inc.(b) | $70,272 | 940 | Glatfelter Company(c) | 12,775 |
| 1,100 | Macrovision Corporation(b) | 20,724 | 1,120 | Longview Fibre Company | 21,056 |
| 3,695 | McAfee, Inc.(b) | 110,961 | 1,370 | Lubrizol Corporation | 56,978 |
| 3,300 | McDATA Corporation(b,c) | 15,873 | 4,410 | Lyondell Chemical Company | 118,188 |
| 3,300 | MEMC Electronic Materials, Inc.(b) | 59,202 | 905 | Martin Marietta Materials, Inc. | 71,414 |
| 1,650 | Mentor Graphics Corporation(b) | 13,646 | 570 | Minerals Technologies, Inc. | 30,472 |
| 1,400 | Micrel, Inc.(b,c) | 14,000 | 1,585 | Olin Corporation(c) | 28,340 |
| 4,460 | Microchip Technology, Inc. | 134,558 | 1,300 | Packaging Corporation | |
| 1,800 | MoneyGram International, Inc. | 43,740 | | of America(c) | 26,377 |
| 2,125 | MPS Group, Inc.(b) | 26,456 | 700 | Potlatch Corporation(c) | 31,311 |
| 1,150 | National Instruments Corporation(c) | 27,485 | 2,515 | RPM International, Inc. | 46,829 |
| 900 | Newport Corporation(b) | 11,736 | 400 | Scotts Company | 35,116 |
| 1,000 | Plantronics, Inc.(c) | 29,850 | 1,010 | Sensient Technologies | |
| 900 | Plexus Corporation(b) | 15,903 | | Corporation(c) | 17,867 |
| 2,090 | Polycom, Inc.(b) | 31,977 | 2,075 | Sonoco Products Company | 58,722 |
| 2,400 | Powerwave Technologies, Inc.(b,c) | 26,904 | 700 | Steel Dynamics, Inc.(c) | 21,679 |
| 1,155 | Reynolds and Reynolds Company | 30,654 | 2,200 | Valspar Corporation | 48,510 |
| 4,100 | RF Micro Devices, Inc.(b,c) | 21,484 | 1,500 | Worthington Industries, Inc.(c) | 30,180 |
|
|
| 1,500 | RSA Security, Inc.(b) | 17,100 | | Total Materials | 940,980 |
|
|
| 3,800 | SanDisk Corporation(b) | 223,782 | | | |
| 1,600 | Semtech Corporation(b) | 24,128 | Telecommunications Services (0.4%) | |
| 900 | Silicon Laboratories, Inc.(b) | 28,953 | 5,060 | Cincinnati Bell, Inc.(b) | 20,038 |
| 700 | SRA International, Inc.(b) | 22,974 | 2,135 | Telephone and Data Systems, Inc. | 80,746 |
|
|
| 1,900 | Sybase, Inc.(b) | 42,275 | | Total Telecommunications | |
| 3,000 | Synopsys, Inc.(b) | 56,850 | | Services | 100,784 |
|
|
| 1,245 | Tech Data Corporation(b) | 43,127 | | | |
| 885 | Transaction Systems | | Utilities (6.4%) | |
| | Architects, Inc.(b) | 23,904 | 1,685 | AGL Resources, Inc. | 59,295 |
| 3,115 | TriQuint Semiconductor, Inc.(b,c) | 13,083 | 2,375 | Alliant Energy Corporation | 62,819 |
| 2,100 | UTStarcom, Inc.(b,c) | 11,592 | 2,025 | Aqua America, Inc.(c) | 68,607 |
| 3,795 | Vishay Intertechnology, Inc.(b) | 43,035 | 7,895 | Aquila, Inc.(b) | 27,948 |
| 4,600 | Western Digital Corporation(b,c) | 55,660 | 670 | Black Hills Corporation(c) | 27,852 |
| 1,500 | Wind River Systems, Inc.(b) | 19,650 | 2,645 | DPL, Inc. | 68,162 |
| 1,500 | Zebra Technologies Corporation(b) | 64,665 | 1,550 | Duquesne Light Holdings, Inc.(c) | 25,870 |
|
| |
| | Total Information | | 3,065 | Energy East Corporation | 73,100 |
| | Technology | 3,422,271 | 2,600 | Equitable Resources, Inc. | 100,490 |
|
| |
| | | | 1,730 | Great Plains Energy, Inc.(c) | 49,668 |
| Materials (3.5%) | | 1,870 | Hawaiian Electric Industries, Inc.(c) | 49,274 |
| 1,395 | Airgas, Inc. | 39,437 | 1,025 | IDACORP, Inc.(c) | 29,592 |
| 880 | Albemarle Corporation(c) | 30,879 | 2,500 | MDU Resources Group, Inc. | 82,425 |
| 1,045 | Bowater, Inc.(c) | 27,692 | 1,870 | National Fuel Gas Company | 56,362 |
| 1,275 | Cabot Corporation(c) | 43,490 | 2,725 | Northeast Utilities | |
| 4,920 | Chemtura Corporation | 52,644 | | Service Company | 49,568 |
| 765 | Cytec Industries, Inc. | 31,594 | 2,330 | NSTAR | 63,376 |
| 890 | Ferro Corporation(c) | 15,878 | 1,965 | OGE Energy Corporation | 50,618 |
| | | | | |
| |
The accompanying notes to the financial statements are an integral part of this schedule.
| |
|
|
104
| Mid Cap Index Fund-I | | | | | |
| Schedule of Investments as of October 31, 2005(a) | | | | | |
| |
| Shares | Common Stock (81.1%) | Value | Shares | Common Stock (81.1%) | Value |
|
| |
| Utilities -- continued | | 1,700 | Westar Energy, Inc. | $37,570 |
| 2,100 | ONEOK, Inc.(c) | $60,354 | 1,080 | WGL Holdings, Inc.(c) | 33,566 |
| 4,032 | Pepco Holdings, Inc. | 86,648 | 2,410 | Wisconsin Energy Corporation | 91,170 |
| 1,495 | PNM Resources, Inc. | 37,898 | 800 | WPS Resources Corporation(c) | 43,648 |
|
|
| 2,425 | Puget Energy, Inc.(c) | 51,992 | | Total Utilities | | 1,718,175 |
|
|
| 1,805 | Questar Corporation(d) | 142,144 | | | | |
|
|
| 2,390 | SCANA Corporation | 94,811 | | Total Common Stock | |
| 3,770 | Sierra Pacific Resources(b,c) | 48,822 | | (cost $16,681,686) | 21,937,469 |
|
|
| 1,640 | Vectren Corporation | 44,526 | | | | |
| |
| | | | | Interest | Maturity | |
| Shares | Collateral Held for Securities Loaned (14.8%) | Rate(e) | Date | Value |
|
| 3,998,252 | Thrivent Financial Securities Lending Trust | | 3.950% | N/A | $3,998,252 |
|
|
| | Total Collateral Held for Securities Loaned | |
| | (cost $3,998,252) | | | | 3,998,252 |
|
|
| |
| |
| | | | | Interest | Maturity | |
| Shares | Short-Term Investments (4.1%) | | | Rate(e) | Date | Value |
|
| 1,116,858 | Thrivent Money Market Fund(d) | | | 3.600% | N/A | $1,116,858 |
|
|
| | Total Short-Term Investments (at amortized cost) | 1,116,858 |
|
|
| | Total Investments (cost $21,796,796) | | $27,052,579 |
|
|
| (a) | The categories of investments are shown as a percentage of total investments. |
| |
| (b) | Non-income producing security. |
| |
| (c) | All or a portion of the security is on loan as discussed in item 2(L) of the Notes to Financial Statements. |
| |
| (d) | At October 31, 2005, $43,200 in cash was pledged as the initial margin deposit for the open financial futures contracts. In addition 1,805 shares in Questar Corporation common stock valued at $142,144 and $1,116,858 of Short-Term Investments were earmarked as collateral to cover open financial futures contracts as follow: |
| |
| | | | | | Notional | |
| | Number of | Expiration | | | Principal | Unrealized |
| Type | Contracts | Date | Position | Value | Amount | Gain |
|
| S&P 400 Mini Futures | 17 | December 2005 | Long | $1,195,100 | $1,191,963 | $3,137 |
(e) The interest rate shown reflects the yield, coupon rate or, for securities purchased at a discount, the discount rate at the date of purchase.
The accompanying notes to the financial statements are an integral part of this schedule.
105
| | Partner International Stock Fund | |
| | Schedule of Investments as of October 31, 2005(a) | |
| Shares | Common Stock (83.3%) | Value | Shares | Common Stock (83.3%) | Value |
|
| |
| Australia (1.7%) | | France (5.8%) | |
| 191,100 | AMP, Ltd.(b) | $1,045,920 | 243,804 | Axa SA(b,c) | $7,062,076 |
| 49,021 | BHP Billiton, Ltd.(b) | 760,313 | 76,700 | Carrefour SA(b,c) | 3,411,302 |
| 114,300 | Brambles Industries, Ltd.(b,c) | 724,951 | 15,195 | France Telecom SA(b,c) | 395,048 |
| 334,500 | Lend Lease Corporation, Ltd.(b) | 3,418,783 | 5,588 | Hermes International(b,c) | 1,253,833 |
| 318,400 | Macquarie Infrastructure Group(b) | 819,188 | 29,615 | LVMH Moet Hennessy | |
| 171,900 | Transurban Group(b,c) | 825,015 | | Louis Vuitton SA(b,c) | 2,398,677 |
|
| |
| | Total Australia | 7,594,170 | 18,613 | Sanofi-Aventis(b,c) | 1,491,244 |
|
| |
| | | | 48,000 | Schneider Electric SA(b,c) | 3,944,790 |
| Austria (0.1%) | | 17,809 | Societe Generale(b,c) | 2,034,166 |
| 23,300 | Telekom Austria AG(b) | 482,255 | 14,683 | Total SA(b,c) | 3,695,191 |
|
| |
|
| | Total Austria | 482,255 | | Total France | 25,686,327 |
|
| |
|
| |
| Belgium (0.5%) | | Germany (4.4%) | |
| 63,800 | Fortis(b) | 1,816,289 | 22,800 | Adidas-Salomon AG(b,c) | 3,826,861 |
| 9,487 | UCB SA(b) | 469,106 | 4,314 | Allianz AG(b) | 610,356 |
|
| |
| | Total Belgium | 2,285,395 | 82,300 | Commerzbank AG(b) | 2,155,789 |
|
| |
| | | | 156,500 | Deutsche Post AG-REG(b) | 3,490,528 |
| Bermuda (0.3%) | | 44,089 | Hypo Real Estate Holding AG(b) | 2,132,805 |
| 94,500 | Esprit Holdings, Ltd.(b) | 669,472 | 78,600 | Metro AG(b,c) | 3,575,254 |
| 785,000 | Johnson Electric Holdings, Ltd.(b,c) | 710,997 | 48,400 | Siemens AG(b) | 3,605,261 |
|
| |
|
| | Total Bermuda | 1,380,469 | | Total Germany | 19,396,854 |
|
| |
|
| |
| Brazil (1.9%) | | Greece (1.9%) | |
| 31,400 | Companhia Vale do Rio | | 298,100 | Agricultural Bank of Greece(b,d) | 1,757,661 |
| | Doce SP ADR | 1,158,660 | 28,002 | Cosmote Mobile | |
| 104,490 | Petroleo Brasileiro SA ADR | 6,357,006 | | Telecommunications SA(b) | 576,974 |
| 57,400 | Tele Norte Leste Participacoes SA(c) | 1,015,980 | 62,400 | Greek Organization of | |
|
| |
| | Total Brazil | 8,531,646 | | Football Prognostics SA(b) | 1,806,309 |
|
| |
| | | | 107,200 | Hellenic Telecommunication | |
| Canada (0.2%) | | | Organization SA(b,d) | 2,212,413 |
| 25,400 | Telus Corporation | 957,580 | 55,170 | National Bank of Greece SA(b) | 2,152,820 |
|
| |
|
| | Total Canada | 957,580 | | Total Greece | 8,506,177 |
|
| |
|
| |
| China (0.2%) | | Hong Kong (1.0%) | |
| 986,000 | PetroChina Company, Ltd.(b) | 756,140 | 538,000 | China Unicom, Ltd.(b) | 414,120 |
|
| |
| | Total China | 756,140 | 316,000 | Li & Fung, Ltd.(b) | 678,095 |
|
| |
| | | | 363,700 | Swire Pacific, Ltd.(b) | 3,272,305 |
|
|
| Denmark (0.4%) | | | Total Hong Kong | 4,364,520 |
|
|
| 31,022 | Novo Nordisk AS(b) | 1,592,358 | | | |
|
| |
| | Total Denmark | 1,592,358 | Ireland (0.5%) | |
|
| |
| | | | 132,500 | Anglo Irish Bank | |
| Finland (1.2%) | | | Corporation plc(b) | 1,796,658 |
| 113,550 | Nokia Oyj(b) | 1,902,738 | 20,700 | CRH plc(b) | 517,302 |
|
|
| 263,000 | Stora Enso Oyj(b) | 3,364,597 | | Total Ireland | 2,313,960 |
|
| |
|
| | Total Finland | 5,267,335 | | | |
|
| |
| |
| |
| The accompanying notes to the financial statements are an integral part of this schedule. | |
|
| |
| 106 | | |
| Partner International Stock Fund | | | | |
| Schedule of Investments as of October 31, 2005(a) | | | |
| |
| Shares | Common Stock (83.3%) | Value | Shares | Common Stock (83.3%) | Value |
|
| |
| Italy (4.0%) | | 890 | Rakuten, Inc.(b,c) | $578,871 |
| 65,807 | Assicurazioni Generali SPA(b,c) | $1,957,072 | 530 | Resona Holdings, Inc.(b,c) | 1,536,609 |
| 339,200 | Banca Intesa SPA(b) | 1,469,284 | 36,500 | Secom Company, Ltd.(b) | 1,821,165 |
| 57,500 | Banca Popolare di Milano Scarl(b) | 548,021 | 21,400 | Sega Sammy Holdings, Inc.(b) | 770,153 |
| 78,302 | Eni SPA(b,c) | 2,096,033 | 25,250 | Shin-Etsu Chemical | |
| 26,500 | Lottomatica SPA(b,c) | 962,518 | | Company, Ltd.(b) | 1,210,594 |
| 59,100 | Mediobanca SPA(b,c) | 1,046,532 | 3,800 | SMC Corporation(b) | 505,697 |
| 247,500 | Saipem SPA(b,c) | 3,542,329 | 198,000 | Sompo Japan Insurance, Inc.(b) | 2,975,790 |
| 2,797,300 | Seat Pagine Gialle SPA(b,d) | 1,299,417 | 43,500 | Sony Corporation(b,c) | 1,421,138 |
| 74,700 | Toro Assicurazioni SPA(b) | 1,184,582 | 418 | Sumitomo Mitsui Financial | |
| 645,260 | UniCredito Italiano SPA(b,c) | 3,603,372 | | Group, Inc.(b,c) | 3,860,416 |
|
| |
| | Total Italy | 17,709,160 | 771,000 | Sumitomo Trust and Banking | |
|
| |
| | | | | Company, Ltd.(b) | 6,563,778 |
| Japan (18.9%) | | 39,900 | Suzuki Motor Corporation(b) | 686,064 |
| 17,050 | Aiful Corporation(b) | 1,275,302 | 11,500 | T&D Holdings, Inc.(b) | 723,168 |
| 46,500 | Astellas Pharmaceutical, Inc.(b) | 1,660,955 | 126,600 | Takeda Pharmaceutical | |
| 14,400 | Benesse Corporation(b) | 510,662 | | Company, Ltd.(b) | 6,939,338 |
| 213,000 | Bridgestone Corporation(b) | 4,350,654 | 156,000 | Toray Industries, Inc.(b) | 865,553 |
| 15,500 | Canon, Inc.(b) | 820,402 | 145,400 | Toyota Motor Corporation(b) | 6,742,267 |
| 27,500 | Credit Saison Company, Ltd.(b,c) | 1,247,692 | 7,820 | USS Company, Ltd.(b) | 535,439 |
|
|
| 63,000 | Dai Nippon Printing | | | Total Japan | 82,918,587 |
|
|
| | Company, Ltd.(b) | 1,030,949 | | | |
| 21,100 | Daikin Industries, Ltd.(b) | 550,513 | Luxembourg (0.6%) | |
| 15,500 | Fanuc, Ltd.(b) | 1,221,478 | 166,900 | SES Global SA(b) | 2,639,516 |
|
|
| 99,300 | Fuji Photo Film Company, Ltd.(b) | 3,159,633 | | Total Luxembourg | 2,639,516 |
|
|
| 25,600 | Hoya Corporation(b,c) | 888,841 | | | |
| 34,000 | JSR Corporation(b,c) | 801,474 | Mexico (2.1%) | |
| 325 | KDDI Corporation(b) | 1,862,544 | 59,000 | America Movil SA de CV ADR | 1,548,750 |
| 3,500 | Keyence Corporation(b) | 805,356 | 165,500 | Corporacion GEO SA de CV(d) | 510,978 |
| 63,900 | Kyocera Corporation(b) | 4,144,331 | 88,300 | Grupo Financiero | |
| 39,600 | Leopalace21 Corporation(b) | 1,027,139 | | Banorte SA de CV | 752,787 |
| 54,400 | MARUI Company, Ltd.(b) | 902,445 | 29,000 | Grupo Modelo SA | 89,026 |
| 59,000 | Matsushita Electric Industrial | | 12,400 | Grupo Televisia SA ADR | 906,440 |
| | Company, Ltd.(b) | 1,081,202 | 225,000 | Telefonos de Mexico SA | |
| 147,400 | Mitsubishi Corporation(b) | 2,866,382 | | de CV ADR | 4,540,500 |
| 50,000 | Mitsubishi Estate | | 209,111 | Wal-Mart de Mexico SA de CV | 1,017,878 |
|
|
| | Company, Ltd.(b,c) | 739,132 | | Total Mexico | 9,366,359 |
|
|
| 577 | Mitsubishi UFJ Financial | | | | |
| | Group, Inc.(b) | 7,251,996 | Netherlands (3.3%) | |
| 133,000 | Mitsui Fudosan Company, Ltd.(b,c) | 2,177,226 | 134,800 | ABN AMRO Holding NV(b) | 3,188,576 |
| 72,000 | Mitsui Trust Holdings, Inc.(b,c) | 867,412 | 168,900 | ING Groep NV(b) | 4,871,482 |
| 14,000 | Nidec Corporation(b,c) | 798,545 | 21,000 | Pyaterochka Holding NV GDR(b,d) | 412,423 |
| 87,300 | Nissan Motor Company, Ltd.(b,c) | 915,222 | 29,164 | Royal Numico NV(b,d) | 1,181,247 |
| 16,000 | Nitto Denko Corporation(b) | 968,757 | 147,400 | VNU NV(b,c) | 4,690,744 |
|
|
| 6,700 | ORIX Corporation(b) | 1,256,303 | | Total Netherlands | 14,344,472 |
|
|
| |
| |
| |
| The accompanying notes to the financial statements are an integral part of this schedule. | |
|
107
| Partner International Stock Fund | | | | |
| Schedule of Investments as of October 31, 2005(a) | | | | |
| |
| Shares | Common Stock (83.3%) | Value | Shares | Common Stock (83.3%) | Value |
|
| |
| Norway (0.4%) | | 77,300 | Enagas(b,c) | $1,367,082 |
| 8,564 | Norsk Hydro ASA(b) | $849,680 | 130,300 | Iberdrola SA(b,c) | 3,489,179 |
| 40,800 | Statoil ASA(b) | 905,427 | 27,400 | Indra Sistemas SA(b) | 561,424 |
|
| |
| | Total Norway | 1,755,107 | 101,500 | Repsol YPF SA(b,c) | 3,023,445 |
|
| |
| | | | 35,590 | Sacyr Vallehermoso SA(b,c) | 943,293 |
| Panama (0.3%) | | 56,858 | Telefonica SA(b) | 907,595 |
| 22,000 | Carnival Corporation | 1,092,740 | 10,616 | Telefonica SA ADR | 509,037 |
|
| |
|
| | Total Panama | 1,092,740 | | Total Spain | 20,858,567 |
|
| |
|
| |
| Portugal (0.8%) | | Sweden (0.7%) | |
| 386,000 | Portugal Telecom SGPS SA(b) | 3,490,284 | 168,600 | Atlas Copco AB(b) | 3,081,661 |
|
| |
|
| | Total Portugal | 3,490,284 | | Total Sweden | 3,081,661 |
|
| |
|
| |
| Russia (0.1%) | | Switzerland (7.9%) | |
| 18,200 | NovaTek OAO GDR(d) | 400,400 | 37,600 | Compagnie Financiere | |
|
| |
| | Total Russia | 400,400 | | Richemont AG(b) | 1,430,351 |
|
| |
| | | | 54,020 | Credit Suisse Group(b) | 2,389,285 |
| Singapore (1.8%) | | 31,600 | EFG International(b,d) | 908,004 |
| 77,000 | DBS Group Holdings, Ltd.(b) | 697,060 | 6,850 | Givaudan SA(b) | 4,414,184 |
| 244,100 | Keppel Corporation, Ltd.(b,c) | 1,674,747 | 74,500 | Holcim, Ltd.(b) | 4,638,408 |
| 605,000 | Singapore Telecommunications, | | 27,097 | Nestle SA(b,c) | 8,068,019 |
| | Ltd.(b) | 833,527 | 4,283 | Nobel Biocare Holding AG(b) | 987,348 |
| 482,500 | United Overseas Bank, Ltd.(b) | 3,939,021 | 46,779 | Novartis AG(b) | 2,515,868 |
| 79,000 | Venture Corporation, Ltd.(b) | 584,706 | 8,354 | Roche Holding AG(b) | 1,248,071 |
|
| |
| | Total Singapore | 7,729,061 | 30,900 | Swatch Group AG(b,c) | 4,286,231 |
|
| |
| | | | 43,739 | UBS AG(b,c) | 3,728,802 |
|
|
| South Africa (0.2%) | | | Total Switzerland | 34,614,571 |
|
|
| 70,800 | Naspers, Ltd.(b) | 1,022,282 | | | |
|
| |
| | Total South Africa | 1,022,282 | Taiwan (0.3%) | |
|
| |
| | | | 463,000 | Acer, Inc.(b) | 941,269 |
| South Korea (2.3%) | | 34,200 | Far EasTone Telecommunications | |
| 12,300 | Hyundai Motor Company, Ltd.(b,d) | 909,074 | | Company, | 596,308 |
|
|
| 11,100 | Kookmin Bank(b) | 631,527 | | Total Taiwan | 1,537,577 |
|
|
| 76,000 | Kookmin Bank ADR(c) | 4,439,920 | | | |
| 39,000 | LG Electronics, Inc.(b) | 2,543,143 | Turkey (0.5%) | |
| 2,730 | Samsung Electronics | | 286,550 | Turkiye Garanti Bankasi AS(b,d) | 856,872 |
| | Company, Ltd.(b) | 1,453,524 | 168,320 | Turkiye Is Bankasi (Isbank)(b) | 1,174,516 |
|
| |
|
| | Total South Korea | 9,977,188 | | Total Turkey | 2,031,388 |
|
| |
|
| |
| Spain (4.8%) | | United Kingdom (14.2%) | |
| 463,207 | Banco Bilbao Vizcaya | | 176,225 | Barclays plc(b) | 1,746,312 |
| | Argentaria SA(b) | 8,168,409 | 213,035 | BP Amoco plc(b) | 2,359,825 |
| 40,000 | Cintra Concesiones de | | 274,600 | Capita Group plc(b) | 1,895,761 |
| | Infraestructuras de Transporte SA(b,c) 474,425 | 15,332 | Carnival plc(b) | 777,471 |
| 26,700 | Compania de Distribucion | | 381,281 | GlaxoSmithKline plc(b) | 9,916,479 |
| | Integral Logista SA(b,c) | 1,414,678 | 734,700 | Group 4 Securicor plc(b) | 1,958,593 |
| |
| |
| The accompanying notes to the financial statements are an integral part of this schedule. | |
|
108
| Partner International Stock Fund | | | | | |
| Schedule of Investments as of October 31, 2005(a) | | | | |
| |
| Shares | Common Stock (83.3%) | Value | Shares | Common Stock (83.3%) | Value |
|
| |
| United Kingdom -- continued | | 99,299 | Royal Dutch Shell plc(b) | $3,239,081 |
| 103,100 | GUS plc(b) | $1,537,759 | 640,300 | Signet Group plc(b) | 1,152,653 |
| 84,000 | iSOFT Group plc(b) | 593,174 | 3,494,548 | Vodafone Group plc(b,e) | 9,174,271 |
| 67,100 | Johnson Matthey plc(b) | 1,390,181 | 129,100 | William Hill plc(b) | 1,221,652 |
| 1,041,191 | Kingfisher plc(b) | 3,907,875 | 500,860 | WPP Group plc(b) | 4,919,952 |
|
|
| 442,700 | Lloyds TSB Group plc(b) | 3,620,111 | | Total United Kingdom | 62,246,172 |
|
|
| 607,400 | Marks and Spencer Group plc(b) | 4,490,137 | | | | |
|
|
| 325,000 | Pearson plc(b) | 3,614,173 | | Total Common Stock | |
| 43,020 | Reckitt Benckiser plc(b) | 1,299,844 | | (cost $321,960,089) | $365,930,278 |
|
|
| 123,900 | Royal Bank of Scotland | | | | | |
| | Group plc(b) | 3,430,868 | | | | |
| |
| | | | | Interest | Maturity | |
| Shares | Collateral Held for Securities Loaned (13.3%) | Rate(f) | Date | Value |
|
| 58,619,277 | Thrivent Financial Securities Lending Trust | | 3.950% | N/A | $58,619,277 |
|
|
| | | Total Collateral Held for Securities Loaned | |
| | | (cost $58,619,277) | | | 58,619,277 |
|
|
| |
| |
| Shares or | | | | | | |
| Principal | | | | Interest | Maturity | |
| Amount | Short-Term Investments (3.4%) | | Rate(f) | Date | Value |
|
| $9,810,000 | New Center Asset Trust | | 4.020% | 11/1/2005 | $9,810,000 |
| 5,011,720 | Thrivent Money Market Fund | | 3.600 | N/A | 5,011,720 |
|
|
| | | Total Short-Term Investments (at amortized cost) | 14,821,720 |
|
|
| | | Total Investments (cost $395,401,086) | | $439,371,275 |
|
|
| (a) | The categories of investments are shown as a percentage of total investments. |
| |
| (b) | Security is fair valued as discussed in the notes to the financial statements. |
| |
| (c) | All or a portion of the security is on loan as discussed in item 2(L) of the Notes to Financial Statements. |
| |
| (d) | Non-income producing security. |
| |
| (e) | Designated as cover for long settling trades as discussed in the notes to the financial statements. |
| |
| (f) | The interest rate shown reflects the yield, coupon rate or, for securities purchased at a discount, the discount rate at the date of purchase. |
| |
| (g) | Miscellaneous footnotes: |
| |
| | ADR -- American Depository Receipts, which are certificates for shares of an underlying foreign security’s shares held by an issuing U.S. depository bank. |
| |
| | GDR -- Global Depository Receipts, which are certificates for shares of an underlying foreigh security’s shares held by an issuing depository bank from more than one country. |
| |
| The accompanying notes to the financial statements are an integral part of this schedule. |
| |
|
109
| | Large Cap Growth Fund | |
| | Schedule of Investments as of October 31, 2005(a) | |
| Shares | Common Stock (94.1%) | Value | Shares | Common Stock (94.1%) | Value |
|
| |
| Consumer Discretionary (14.9%) | | 24,350 | Walt Disney Company | $593,410 |
| 8,500 | Abercrombie & Fitch Company | $441,915 | 18,450 | XM Satellite Radio | |
| 8,950 | Amazon.com, Inc.(b) | 356,926 | | Holdings, Inc.(b,c) | 531,914 |
| 5,550 | Apollo Group, Inc.(b) | 349,761 | 4,500 | Yum! Brands, Inc. | 228,915 |
|
|
| 1,100 | AutoZone, Inc.(b) | 88,990 | | Total Consumer | |
| 17,650 | Bed Bath & Beyond, Inc.(b) | 715,178 | | Discretionary | 28,007,593 |
|
|
| 18,062 | Best Buy Company, Inc. | 799,424 | | | |
| 13,200 | Cablevision Systems | | Consumer Staples (7.1%) | |
| | New York Group(b) | 327,360 | 10,350 | Altria Group, Inc. | 776,768 |
| 28,150 | Carnival Corporation | 1,398,210 | 8,950 | Avon Products, Inc. | 241,560 |
| 6,900 | Cheesecake Factory, Inc.(b,c) | 236,808 | 19,200 | Coca-Cola Company | 821,376 |
| 3,800 | Chico’s FAS, Inc.(b) | 150,252 | 12,600 | Colgate-Palmolive Company | 667,296 |
| 23,900 | Coach, Inc.(b) | 769,102 | 45,300 | CVS Corporation | 1,105,773 |
| 15,385 | Comcast Corporation(b) | 421,703 | 5,000 | Hershey Company | 284,150 |
| 59,500 | eBay, Inc.(b) | 2,356,200 | 34,800 | PepsiCo, Inc. | 2,055,984 |
| 3,250 | Getty Images, Inc.(b,c) | 269,782 | 76,789 | Procter & Gamble Company | 4,299,416 |
| 3,150 | Grupo Televisia SA ADR(c) | 230,265 | 9,200 | SYSCO Corporation | 293,572 |
| 5,100 | Harley-Davidson, Inc. | 252,603 | 33,000 | Wal-Mart Stores, Inc. | 1,561,230 |
| 5,700 | Harman International | | 17,690 | Walgreen Company | 803,657 |
| | Industries, Inc. | 569,202 | 6,900 | William Wrigley Jr. Company | 479,550 |
|
|
| 7,950 | Harrah’s Entertainment, Inc. | 480,816 | | Total Consumer Staples | 13,390,332 |
|
|
| 37,920 | Home Depot, Inc. | 1,556,237 | | | |
| 9,050 | IAC InterActiveCorp(b) | 231,680 | Energy (6.9%) | |
| 8,200 | International Game Technology | 217,218 | 11,188 | Apache Corporation | 714,130 |
| 8,550 | J.C. Penney Company, Inc. | | 3,250 | Arch Coal, Inc.(c) | 250,478 |
| | (Holding Company) | 437,760 | 7,750 | Baker Hughes, Inc. | 425,940 |
| 3,800 | KB Home | 248,330 | 15,550 | BJ Services Company | 540,362 |
| 14,550 | Kohl’s Corporation(b) | 700,292 | 4,300 | Bronco Drilling Company, Inc.(b) | 104,232 |
| 4,550 | Lennar Corporation(c) | 252,889 | 6,350 | Burlington Resources, Inc. | 458,597 |
| 29,550 | Lowe’s Companies, Inc. | 1,795,754 | 15,700 | ConocoPhillips | 1,026,466 |
| 9,450 | Marriott International, Inc. | 563,409 | 21,650 | El Paso Corporation | 256,769 |
| 14,250 | McDonald’s Corporation | 450,300 | 11,150 | ENSCO International, Inc. | 508,328 |
| 13,250 | McGraw-Hill Companies, Inc. | 648,455 | 5,250 | EOG Resources, Inc. | 355,845 |
| 12,800 | MGM MIRAGE(b,c) | 478,336 | 23,470 | Exxon Mobil Corporation | 1,317,606 |
| 20,050 | News Corporation ADR(c) | 301,953 | 21,350 | Global Industries, Ltd.(b) | 271,358 |
| 13,050 | NIKE, Inc. | 1,096,852 | 10,400 | Halliburton Company | 614,640 |
| 14,650 | Nordstrom, Inc. | 507,622 | 3,100 | Hercules Offshore, Inc.(b) | 67,487 |
| 6,900 | PETsMART, Inc. | 162,150 | 7,550 | Nabors Industries, Ltd.(b) | 518,156 |
| 8,200 | Pixar, Inc.(b) | 415,986 | 7,000 | National Oilwell Varco, Inc.(b) | 437,290 |
| 6,500 | Pulte Homes, Inc. | 245,635 | 4,000 | Patterson-UTI Energy, Inc. | 136,520 |
| 52,075 | Staples, Inc. | 1,183,665 | 8,500 | Peabody Energy Corporation | 664,360 |
| 30,400 | Starbucks Corporation(b) | 859,712 | 11,700 | Range Resources Corporation(c) | 417,573 |
| 13,100 | Starwood Hotels & Resorts | | 5,350 | Rowan Companies, Inc. | 176,496 |
| | Worldwide, Inc. | 765,433 | 15,830 | Schlumberger, Ltd. | 1,436,889 |
| 38,250 | Target Corporation | 2,130,142 | 4,250 | Todco | 190,188 |
| 48,740 | Time Warner, Inc. | 869,034 | 14,100 | Transocean, Inc.(b) | 810,609 |
| 10,333 | Viacom, Inc. | 320,013 | 1,750 | Valero Energy Corporation | 184,170 |
| |
| The accompanying notes to the financial statements are an integral part of this schedule. | |
|
110
| Large Cap Growth Fund | | | | | |
| Schedule of Investments as of October 31, 2005(a) | | | | |
| |
| Shares | Common Stock (94.1%) | | Value | Shares | Common Stock (94.1%) | Value |
|
| |
| Energy -- continued | | | 13,200 | Community Health | |
| 5,150 | Weatherford International, Ltd.(b) | $322,390 | | Systems, Inc.(b) | $489,852 |
| 16,700 | XTO Energy, Inc. | | 725,782 | 14,400 | Eli Lilly and Company | 716,976 |
|
| |
| | Total Energy | | 12,932,661 | 4,600 | Fisher Scientific | |
|
| |
| | | | | | International, Inc.(b) | 259,900 |
| Financials (10.2%) | | | 7,850 | Forest Laboratories, Inc.(b) | 297,594 |
| 9,100 | AFLAC, Inc. | | 434,798 | 37,950 | Genentech, Inc.(b) | 3,438,270 |
| 22,350 | American Express Company | | 1,112,360 | 16,450 | Genzyme Corporation(b) | 1,189,335 |
| 21,000 | American International | | | 30,950 | Gilead Sciences, Inc.(b) | 1,462,388 |
| | Group, Inc. | | 1,360,800 | 55,458 | Johnson & Johnson | 3,472,780 |
| 4,950 | Bear Stearns Companies, Inc. | | 523,710 | 13,300 | Medco Health Solutions, Inc.(b) | 751,450 |
| 5,800 | Capital One Financial Corporation | 442,830 | 46,230 | Medtronic, Inc. | 2,619,392 |
| 36,850 | Charles Schwab Corporation | | 560,120 | 12,050 | Novartis AG ADR | 648,531 |
| 2,650 | Chicago Mercantile Exchange | | 967,648 | 37,355 | Pfizer, Inc. | 812,098 |
| 33,396 | Citigroup, Inc. | | 1,528,869 | 4,100 | Sanofi-Aventis ADR | 164,492 |
| 17,600 | Countrywide Financial Corporation | 559,152 | 26,700 | Schering-Plough Corporation | 543,078 |
| 3,650 | Federal Home Loan | | | 4,900 | Sepracor, Inc.(b,c) | 275,625 |
| | Mortgage Corporation | | 223,928 | 28,050 | St. Jude Medical, Inc.(b) | 1,348,364 |
| 11,000 | Franklin Resources, Inc. | | 972,070 | 13,950 | Stryker Corporation | 572,926 |
| 4,500 | Golden West Financial Corporation | 264,285 | 26,950 | Teva Pharmaceutical | |
| 13,400 | Goldman Sachs Group, Inc. | | 1,693,358 | | Industries, Ltd.(c) | 1,027,334 |
| 5,600 | Legg Mason, Inc. | | 600,936 | 72,750 | UnitedHealth Group, Inc. | 4,211,498 |
| 6,980 | Lehman Brothers Holdings, Inc. | 835,297 | 11,550 | Varian Medical Systems, Inc.(b) | 526,218 |
| 25,200 | MBNA Corporation | | 644,364 | 21,950 | WellPoint, Inc.(b) | 1,639,226 |
| 16,300 | Merrill Lynch & Company, Inc. | 1,055,262 | 27,210 | Wyeth | 1,212,478 |
| 11,300 | Moody’s Corporation | | 601,838 | 16,050 | Zimmer Holdings, Inc.(b) | 1,023,508 |
|
|
| 5,600 | Morgan Stanley | | 304,696 | | Total Health Care | 37,770,788 |
|
|
| 6,450 | Northern Trust Corporation | | 345,720 | | | |
| 5,750 | PNC Financial Services Group, Inc. | 349,082 | Industrials (7.1%) | |
| 8,600 | Prudential Financial, Inc. | | 625,994 | 6,250 | 3M Company | 474,875 |
| 19,600 | SLM Corporation | | 1,088,388 | 24,450 | AMR Corporation(b,c) | 330,320 |
| 6,200 | State Street Corporation | | 342,426 | 8,550 | Boeing Company | 552,672 |
| 6,550 | T. Rowe Price Group, Inc. | | 429,156 | 9,250 | Burlington Northern | |
| 4,350 | UBS AG | | 372,664 | | Santa Fe Corporation | 574,055 |
| 6,850 | Wells Fargo & Company | | 412,370 | 13,350 | Caterpillar, Inc. | 702,076 |
| 10,500 | Willis Group Holdings, Ltd.(c) | | 389,970 | 3,550 | Chicago Bridge and | |
|
| |
| | Total Financials | 19,042,091 | | Iron Company(c) | 79,165 |
|
| |
| | | | | 10,250 | Danaher Corporation | 534,025 |
| Health Care (20.1%) | | | 2,500 | Deere & Company | 151,700 |
| 18,710 | Abbott Laboratories | | 805,466 | 5,950 | Emerson Electric Company | 413,822 |
| 11,800 | Aetna, Inc. | | 1,045,008 | 9,700 | FedEx Corporation | 891,721 |
| 10,400 | Alcon, Inc. | | 1,382,160 | 5,300 | General Dynamics Corporation | 616,390 |
| 43,900 | Amgen, Inc.(b) | | 3,325,864 | 110,220 | General Electric Company | 3,737,560 |
| 5,250 | Biogen Idec, Inc.(b) | | 213,308 | 4,400 | Illinois Tool Works, Inc. | 372,944 |
| 4,400 | Cardinal Health, Inc. | | 275,044 | 6,300 | L-3 Communications Holdings, Inc. 490,266 |
| 29,729 | Caremark Rx, Inc.(b) | | 1,557,800 | 4,350 | Monster Worldwide, Inc.(b) | 142,724 |
| 8,250 | Celgene Corporation(b,c) | | 462,825 | 3,850 | Precision Castparts Corporation | 182,336 |
| |
| The accompanying notes to the financial statements are an integral part of this schedule. | |
|
111
| Large Cap Growth Fund | | | | |
| Schedule of Investments as of October 31, 2005(a) | | | |
| |
| Shares | Common Stock (94.1%) | Value | Shares | Common Stock (94.1%) | Value |
|
| |
| Industrials -- continued | | 55,550 | Motorola, Inc. | $1,230,988 |
| 6,350 | Robert Half International, Inc. | $234,188 | 42,500 | Nasdaq (100) Trust(c) | 1,651,975 |
| 5,650 | Rockwell Automation, Inc. | 300,298 | 23,650 | Network Appliance, Inc.(b) | 647,064 |
| 4,400 | Textron, Inc. | 316,976 | 21,015 | Nokia Oyj ADR | 353,472 |
| 14,500 | Tyco International, Ltd. | 382,655 | 78,095 | Oracle Corporation(b) | 990,245 |
| 10,300 | United Parcel Service, Inc. | 751,282 | 40,800 | Parametric Technology | |
| 20,030 | United Technologies Corporation | 1,027,138 | | Corporation(b,c) | 265,608 |
|
| |
| | Total Industrials | 13,259,188 | 12,450 | Paychex, Inc. | 482,562 |
|
| |
| | | | 72,850 | QUALCOMM, Inc.(d) | 2,896,516 |
| Information Technology (24.7%) | | 6,800 | Red Hat, Inc.(b,c) | 157,896 |
| 24,250 | Accenture, Ltd. | 638,018 | 10,150 | SAP AG(c) | 435,841 |
| 30,050 | Adobe Systems, Inc. | 969,112 | 6,400 | Stellent, Inc.(b,c) | 58,688 |
| 10,000 | Advanced Micro Devices, Inc.(b) | 232,200 | 38,350 | Symantec Corporation(b) | 914,648 |
| 11,650 | Altera Corporation(b) | 193,972 | 17,050 | Tekelec, Inc.(b,c) | 233,926 |
| 19,750 | Amdocs, Ltd.(b) | 522,782 | 45,200 | Texas Instruments, Inc. | 1,290,460 |
| 7,260 | Analog Devices, Inc. | 252,503 | 26,200 | webMethods, Inc.(b,c) | 182,352 |
| 21,500 | Apple Computer, Inc.(b) | 1,238,185 | 7,850 | Xilinx, Inc. | 188,008 |
| 31,650 | Applied Materials, Inc. | 518,427 | 78,350 | Yahoo!, Inc.(b) | 2,896,600 |
|
|
| 12,700 | Automatic Data Processing, Inc. | 592,582 | | Total Information | |
| 29,150 | Avaya, Inc.(b) | 335,808 | | Technology | 46,335,711 |
|
|
| 16,750 | Broadcom Corporation(b) | 711,205 | | | |
| 119,350 | Cisco Systems, Inc.(b) | 2,082,658 | Materials (0.9%) | |
| 14,650 | Citrix Systems, Inc.(b) | 403,900 | 6,200 | Freeport-McMoRan Copper & | |
| 7,250 | Cognizant Technology | | | Gold, Inc. | 306,404 |
| | Solutions Corporation(b) | 318,855 | 11,900 | Monsanto Company | 749,819 |
| 1,900 | Computer Sciences Corporation(b) | 97,375 | 11,700 | Praxair, Inc. | 578,097 |
|
|
| 16,650 | Comverse Technology, Inc.(b) | 417,915 | | Total Materials | 1,634,320 |
|
|
| 52,100 | Corning, Inc.(b) | 1,046,689 | | | |
| 93,000 | Dell, Inc.(b) | 2,964,840 | Miscellaneous (0.8%) | |
| 25,220 | Electronic Arts, Inc.(b) | 1,434,514 | 11,000 | Midcap SPDR Trust(c) | 1,402,500 |
|
|
| 116,480 | EMC Corporation(b) | 1,626,061 | | Total Miscellaneous | 1,402,500 |
|
|
| 16,950 | First Data Corporation | 685,628 | | | |
| 8,550 | Google, Inc.(b) | 3,181,797 | Telecommunications Services (1.4%) | |
| 4,400 | Infosys Technologies, Ltd. ADR(c) | 299,200 | 5,900 | ALLTEL Corporation | 364,974 |
| 97,800 | Intel Corporation | 2,298,300 | 28,650 | America Movil SA de CV ADR | 752,062 |
| 10,100 | International Business | | 11,950 | American Tower Corporation(b) | 285,008 |
| | Machines Corporation | 826,988 | 5,750 | NII Holdings, Inc.(b,c) | 476,790 |
| 33,600 | Juniper Networks, Inc.(b) | 783,888 | 32,429 | Sprint Nextel Corporation | 755,920 |
|
|
| 19,000 | Linear Technology Corporation | 630,990 | | Total Telecommunications | |
| 59,300 | Lucent Technologies, Inc.(b,c) | 169,005 | | Services | 2,634,754 |
|
|
| 17,000 | Marvell Technology Group, Ltd.(b) | 788,970 | | | |
|
|
| 20,400 | Maxim Integrated Products, Inc. | 707,472 | | Total Common Stock | |
| 21,400 | Micromuse, Inc.(b,c) | 153,438 | | (cost $170,094,109) | 176,409,938 |
|
|
| 168,700 | Microsoft Corporation | 4,335,585 | | | |
|
The accompanying notes to the financial statements are an integral part of this schedule. |
|
|
112
| Large Cap Growth Fund | | | |
| Schedule of Investments as of October 31, 2005(a) | | | |
| | | Interest | Maturity | |
| Shares | Collateral Held for Securities Loaned (3.9%) | Rate(e) | Date | Value |
|
| 7,339,698 | Thrivent Financial Securities Lending Trust | 3.950% | N/A | $7,339,698 |
|
|
| | Total Collateral Held for Securities Loaned | |
| | (cost $7,339,698) | | | 7,339,698 |
|
|
| |
| | | Interest | Maturity | |
| Shares | Short-Term Investments (2.0%) | Rate(e) | Date | Value |
|
| 3,842,301 | Thrivent Money Market Fund | 3.600% | N/A | $3,842,301 |
|
|
| | Total Short-Term Investments (at amortized cost) | 3,842,301 |
|
|
| | Total Investments (cost $181,276,108) | | $187,591,937 |
|
|
| (a) | The categories of investments are shown as a percentage of total investments. |
| |
| (b) | Non-income producing security. |
| |
| (c) | All or a portion of the security is on loan as discussed in item 2(L) of the Notes to Financial Statements. |
| |
| (d) | At October 31, 2005, 1,900 shares of QUALCOMM, Inc. common stock valued at $75,544 were earmarked as collateral to cover call options written as follows: |
| |
| | Number of | Exercise | Expiration | | Unrealized |
| Call Options Written | Contracts | Price | Date | Value | Gain |
|
| QUALCOMM, Inc. | 19 | $40 | November 2005 | $(2,755) | $1,499 |
| (e) | The interest rate shown reflects the yield, coupon rate or, for securities purchased at a discount, the discount rate at the date of purchase. |
| |
| (f) | Miscellaneous footnote: |
| |
| | ADR -- American Depository Receipts, which are certificates for shares of an underlying foreign security’s shares held by an issuing U.S. depository bank. |
| |
The accompanying notes to the financial statements are an integral part of this schedule. |
|
|
113
| | Large Cap Value Fund | | |
| | Schedule of Investments as of October 31, 2005(a) | | |
| Shares | Common Stock (93.4%) | Value | Shares | Common Stock (93.4%) | | Value |
|
| |
| Consumer Discretionary (9.0%) | | Financials (27.0%) | | |
| 49,300 | Barnes & Noble, Inc. | $1,782,688 | 43,900 | ACE, Ltd.(c) | | $2,287,190 |
| 47,800 | Clear Channel | | 34,900 | Allstate Corporation | | 1,842,371 |
| | Communications, Inc. | 1,454,076 | 56,000 | American International | | |
| 60,600 | Comcast Corporation(b) | 1,686,498 | | Group, Inc. | | 3,628,800 |
| 20,430 | Discovery Holding Company(b,c) | 287,859 | 59,600 | Aon Corporation | | 2,017,460 |
| 27,100 | Federated Department Stores, Inc. | 1,663,127 | 192,180 | Bank of America Corporation | 8,405,953 |
| 44,200 | Home Depot, Inc. | 1,813,968 | 36,000 | Capital One Financial Corporation | 2,748,600 |
| 50,400 | J.C. Penney Company, Inc. | | 25,600 | Chubb Corporation | | 2,380,032 |
| | (Holding Company) | 2,580,480 | 50,100 | CIT Group, Inc. | | 2,291,073 |
| 38,300 | Johnson Controls, Inc.(c) | 2,606,315 | 221,732 | Citigroup, Inc. | | 10,150,891 |
| 207,700 | Liberty Media Corporation(b) | 1,655,369 | 27,800 | City National Corporation(c) | | 2,039,964 |
| 126,000 | McDonald’s Corporation | 3,981,600 | 31,800 | Equity Office Properties Trust | | 979,440 |
| 46,400 | McGraw-Hill Companies, Inc. | 2,270,816 | 10,000 | Everest Re Group, Ltd. | | 994,500 |
| 36,300 | Office Depot, Inc.(b) | 999,339 | 52,140 | Federal Home Loan | | |
| 74,000 | Sherwin-Williams Company | 3,148,700 | | Mortgage Corporation | | 3,198,789 |
| 327,500 | Time Warner, Inc. | 5,839,325 | 27,600 | Goldman Sachs Group, Inc. | | 3,487,812 |
| 22,700 | Viacom, Inc. | 703,019 | 26,680 | Hartford Financial Services | | |
| 135,400 | Walt Disney Company | 3,299,698 | | Group, Inc. | | 2,127,730 |
|
| |
| | Total Consumer | | 155,200 | J.P. Morgan Chase & Company | 5,683,424 |
| | Discretionary | 35,772,877 | 21,100 | Lehman Brothers Holdings, Inc. | 2,525,037 |
|
| |
| | | | 68,100 | Mellon Financial Corporation | 2,158,089 |
| Consumer Staples (6.5%) | | 100,800 | Merrill Lynch & Company, Inc. | 6,525,792 |
| 105,700 | Altria Group, Inc. | 7,932,785 | 57,100 | Morgan Stanley | | 3,106,811 |
| 77,000 | Archer-Daniels-Midland Company 1,876,490 | 43,000 | Northern Trust Corporation | | 2,304,800 |
| 89,400 | Kellogg Company | 3,948,798 | 30,800 | Piper Jaffray Companies(b,c) | | 1,057,980 |
| 83,010 | Kimberly-Clark Corporation | 4,718,288 | 18,200 | PMI Group, Inc.(c) | | 725,816 |
| 143,200 | Kroger Company(b) | 2,849,680 | 67,800 | PNC Financial Services Group, Inc. | 4,116,138 |
| 36,800 | PepsiCo, Inc. | 2,174,144 | 77,900 | Principal Financial Group, Inc. | 3,866,177 |
| 28,600 | Reynolds American, Inc.(c) | 2,431,000 | 58,200 | Prudential Financial, Inc. | | 4,236,378 |
|
| |
| | Total Consumer Staples | 25,931,185 | 10,000 | Simon Property Group, Inc. | | 716,200 |
|
| |
| | | | 134,400 | St. Paul Travelers Companies, Inc. | 6,052,032 |
| Energy (11.8%) | | 60,300 | State Street Corporation | | 3,330,369 |
| 36,050 | Apache Corporation | 2,301,072 | 69,000 | U.S. Bancorp | | 2,041,020 |
| 56,800 | BP plc | 3,771,520 | 55,040 | Wachovia Corporation | | 2,780,621 |
| 110,414 | Chevron Corporation | 6,301,327 | 73,762 | Washington Mutual, Inc. | | 2,920,975 |
| 125,812 | ConocoPhillips | 8,225,589 | 76,100 | Wells Fargo & Company | | 4,581,220 |
|
|
| 50,500 | Devon Energy Corporation | 3,049,190 | | Total Financials | 107,309,484 |
|
|
| 46,900 | ENSCO International, Inc.(c) | 2,138,171 | | | | |
| 244,900 | Exxon Mobil Corporation | 13,748,684 | Health Care (8.3%) | | |
| 36,000 | Marathon Oil Corporation | 2,165,760 | 28,300 | Aetna, Inc. | | 2,506,248 |
| 28,800 | Nabors Industries, Ltd.(b) | 1,976,544 | 51,300 | Baxter International, Inc. | | 1,961,199 |
| 16,800 | National Oilwell Varco, Inc.(b) | 1,049,496 | 6,000 | Biotech HOLDRS Trust(c) | | 1,159,380 |
| 21,500 | Transocean, Inc.(b) | 1,236,035 | 18,800 | CIGNA Corporation | | 2,178,356 |
| 16,800 | Weatherford International, Ltd.(b,c) 1,051,680 | 21,600 | Eli Lilly and Company | | 1,075,464 |
|
| |
| | Total Energy | 47,015,068 | 43,000 | Forest Laboratories, Inc.(b) | | 1,630,130 |
|
| |
| | | | 24,200 | GlaxoSmithKline plc(c) | | 1,258,158 |
| |
| The accompanying notes to the financial statements are an integral part of this schedule. | |
|
114
| Large Cap Value Fund | | | | |
| Schedule of Investments as of October 31, 2005(a) | | | |
| |
| Shares | Common Stock (93.4%) | Value | Shares | Common Stock (93.4%) | Value |
|
| |
| Health Care -- continued | | 69,550 | International Business | |
| 54,600 | HCA, Inc. | $2,631,174 | | Machines Corporation | $5,694,754 |
| 54,560 | Johnson & Johnson | 3,416,547 | 187,300 | Microsoft Corporation | 4,813,610 |
| 47,108 | Medco Health Solutions, Inc.(b) | 2,661,602 | 91,500 | Motorola, Inc. | 2,027,640 |
| 24,300 | Novartis AG ADR | 1,307,826 | 90,800 | National Semiconductor | |
| 227,500 | Pfizer, Inc. | 4,945,850 | | Corporation | 2,054,804 |
| 81,700 | Sanofi-Aventis ADR | 3,277,804 | 120,950 | Nokia Oyj ADR | 2,034,379 |
| 56,000 | Schering-Plough Corporation | 1,139,040 | 193,700 | Tellabs, Inc.(b) | 1,851,772 |
|
|
| 44,400 | Wyeth | 1,978,464 | | Total Information | |
|
| |
| | Total Health Care | 33,127,242 | | Technology | 31,766,968 |
|
| |
|
| |
| Industrials (12.7%) | | Materials (3.1%) | |
| 72,200 | AMR Corporation(b,c) | 975,422 | 69,450 | Alcoa, Inc. | 1,686,940 |
| 34,400 | Canadian National | | 84,400 | E.I. du Pont de Nemours | |
| | Railway Company | 2,493,312 | | and Company | 3,518,636 |
| 48,700 | Caterpillar, Inc. | 2,561,133 | 51,140 | International Paper Company | 1,492,265 |
| 14,400 | Deere & Company | 873,792 | 62,500 | MeadWestvaco Corporation | 1,638,750 |
| 72,900 | Emerson Electric Company | 5,070,195 | 9,200 | Phelps Dodge Corporation | 1,108,324 |
| 10,900 | General Dynamics Corporation | 1,267,670 | 53,100 | Praxair, Inc. | 2,623,671 |
|
|
| 160,300 | General Electric Company | 5,435,773 | | Total Materials | 12,068,586 |
|
|
| 108,158 | Honeywell International, Inc. | 3,699,004 | | | |
| 20,200 | Lockheed Martin Corporation | 1,223,312 | Telecommunications Services (4.1%) | |
| 33,100 | Northrop Grumman Corporation | 1,775,815 | 29,300 | ALLTEL Corporation | 1,812,498 |
| 66,500 | Parker-Hannifin Corporation | 4,168,220 | 79,120 | BellSouth Corporation | 2,058,702 |
| 100,500 | Republic Services, Inc.(c) | 3,552,675 | 158,687 | SBC Communications, Inc. | 3,784,685 |
| 144,000 | Steelcase, Inc.(c) | 2,062,080 | 187,092 | Sprint Nextel Corporation | 4,361,115 |
| 17,900 | Terex Corporation(b) | 983,963 | 107,264 | Verizon Communications, Inc. | 3,379,889 |
| 33,700 | Textron, Inc. | 2,427,748 | 39,200 | Vodafone Group plc ADR | 1,029,392 |
|
|
| 191,200 | Tyco International, Ltd. | 5,045,768 | | Total Telecommunications | |
| 49,100 | Union Pacific Corporation | 3,396,738 | | Services | 16,426,281 |
|
|
| 69,200 | United Technologies Corporation | 3,548,576 | | | |
|
| |
| | Total Industrials | 50,561,196 | Utilities (2.9%) | |
|
| |
| | | | 27,670 | Dominion Resources, Inc. | 2,105,134 |
| Information Technology (8.0%) | | 29,000 | Entergy Corporation | 2,050,880 |
| 77,900 | Accenture, Ltd. | 2,049,549 | 67,100 | Exelon Corporation | 3,491,213 |
| 133,000 | Amdocs, Ltd.(b) | 3,520,510 | 52,200 | FirstEnergy Corporation | 2,479,500 |
| 62,220 | Applied Materials, Inc. | 1,019,164 | 37,000 | PPL Corporation | 1,159,580 |
|
|
| 36,400 | Comverse Technology, Inc.(b) | 913,640 | | Total Utilities | 11,286,307 |
|
|
| 103,000 | Hewlett-Packard Company | 2,888,120 | | | |
|
|
| 39,100 | Hyperion Solutions | | | Total Common Stock | |
| | Corporation(b,c) | 1,890,876 | | (cost $324,591,213) | 371,265,194 |
|
|
| 42,900 | Intel Corporation | 1,008,150 | | | |
| |
| |
| The accompanying notes to the financial statements are an integral part of this schedule. | |
|
115
| Large Cap Value Fund | | | |
| Schedule of Investments as of October 31, 2005(a) | | | |
| | | Interest | Maturity | |
| Shares | Collateral Held for Securities Loaned (3.5%) | Rate(d) | Date | Value |
|
| 14,008,574 | Thrivent Financial Securities Lending Trust | 3.950% | N/A | $14,008,574 |
|
|
| | Total Collateral Held for Securities Loaned | |
| | (cost $14,008,574) | | | 14,008,574 |
|
|
| |
| | | Interest | Maturity | |
| Shares | Short-Term Investments (3.1%) | Rate(d) | Date | Value |
|
| 12,242,985 | Thrivent Money Market Fund | 3.600% | N/A | $12,242,985 |
|
|
| | Total Short-Term Investments (at amortized cost) | 12,242,985 |
|
|
| | Total Investments (cost $350,842,772) | | $397,516,753 |
|
|
| (a) | The categories of investments are shown as a percentage of total investments. |
| |
| (b) | Non-income producing security. |
| |
| (c) | All or a portion of the security is on loan as discussed in item 2(L) of the Notes to Financial Statements. |
| |
| (d) | The interest rate shown reflects the yield, coupon rate or, for securities purchased at a discount, the discount rate at the date of purchase. |
| |
| (e) | Miscellaneous footnote: |
| |
| | ADR -- American Depository Receipts, which are certificates for shares of an underlying foreign security’s shares held by an issuing U.S. depository bank. |
|
The accompanying notes to the financial statements are an integral part of this schedule.
|
|
|
116
| | Large Cap Stock Fund | |
| | Schedule of Investments as of October 31, 2005(a) | |
| Shares | Common Stock (87.7%) | | Value | Shares | Common Stock (87.7%) | Value |
|
| |
| Consumer Discretionary (11.7%) | | | 700,500 | PepsiCo, Inc. | $41,385,540 |
| 157,400 | American Eagle Outfitters, Inc.(b) | $3,706,770 | 671,900 | Procter & Gamble Company | 37,619,681 |
| 239,900 | Best Buy Company, Inc. | | 10,617,974 | 949,000 | Wal-Mart Stores, Inc. | 44,897,190 |
| 114,600 | Black & Decker Corporation | | 9,412,098 | 208,100 | Walgreen Company(b) | 9,453,983 |
|
|
| 132,300 | Brunswick Corporation(b) | | 5,044,599 | | Total Consumer Staples | 252,942,790 |
|
|
| 1,173,100 | Comcast Corporation(c) | | 32,154,671 | | | |
| 479,266 | D.R. Horton, Inc. | | 14,708,674 | Energy (8.5%) | |
| 324,700 | eBay, Inc.(c) | | 12,858,120 | 131,700 | Apache Corporation | 8,406,411 |
| 99,200 | Federated Department Stores, Inc. | 6,087,904 | 396,600 | BJ Services Company | 13,781,850 |
| 146,300 | Fortune Brands, Inc. | | 11,114,411 | 216,800 | BP plc | 14,395,520 |
| 324,600 | H&R Block, Inc. | | 8,069,556 | 281,200 | Burlington Resources, Inc. | 20,308,264 |
| 149,100 | Harley-Davidson, Inc.(b) | | 7,384,923 | 737,551 | Chevron Corporation | 42,092,036 |
| 369,500 | Hilton Hotels Corporation | | 7,186,775 | 529,800 | ConocoPhillips | 34,638,324 |
| 864,600 | Home Depot, Inc. | | 35,483,184 | 73,300 | ENSCO International, Inc. | 3,341,747 |
| 262,200 | J.C. Penney Company, Inc. | | | 1,766,146 | Exxon Mobil Corporation | 99,151,438 |
| | (Holding Company) | | 13,424,640 | 133,800 | Nabors Industries, Ltd.(b,c) | 9,182,694 |
| 194,100 | Kohl’s Corporation(c) | | 9,342,033 | 173,800 | National Oilwell Varco, Inc.(c) | 10,857,286 |
| 242,100 | Lowe’s Companies, Inc. | | 14,712,417 | 202,000 | Patterson-UTI Energy, Inc.(b) | 6,894,260 |
| 934,100 | McDonald’s Corporation | | 29,517,560 | 154,300 | Peabody Energy Corporation | 12,060,088 |
| 306,800 | McGraw-Hill Companies, Inc. | 15,014,792 | 92,100 | Rowan Companies, Inc.(b) | 3,038,379 |
| 149,700 | MGM MIRAGE(b,c) | | 5,594,289 | 129,500 | Schlumberger, Ltd. | 11,754,715 |
| 119,200 | NIKE, Inc. | | 10,018,760 | 121,700 | Smith International, Inc. | 3,943,080 |
| 679,600 | Nordstrom, Inc. | | 23,548,140 | 92,300 | Valero Energy Corporation | 9,713,652 |
| 146,200 | PETsMART, Inc. | | 3,435,700 | 182,100 | XTO Energy, Inc. | 7,914,066 |
|
|
| 366,800 | Pulte Homes, Inc. | | 13,861,372 | | Total Energy | 311,473,810 |
|
|
| 497,700 | Staples, Inc. | | 11,312,721 | | | |
| 306,240 | Starwood Hotels & Resorts | | | Financials (16.3%) | |
| | Worldwide, Inc. | | 17,893,603 | 388,300 | Allstate Corporation | 20,498,357 |
| 476,000 | Target Corporation | | 26,508,440 | 197,300 | American Capital | |
| 1,547,000 | Time Warner, Inc. | | 27,583,010 | | Strategies, Ltd.(b) | 7,410,588 |
| 115,400 | Viacom, Inc. | | 3,573,938 | 776,100 | American Express Company | 38,626,497 |
| 928,000 | Walt Disney Company | | 22,615,360 | 789,652 | American International | |
| 290,000 | Yum! Brands, Inc. | | 14,752,300 | | Group, Inc. | 51,169,450 |
|
| |
| | Total Consumer | | | 155,280 | Ameriprise Financial, Inc.(c) | 5,779,522 |
| | Discretionary | | 426,538,734 | 1,423,182 | Bank of America Corporation | 62,249,981 |
|
| | |
| | | | | 120,700 | Bear Stearns Companies, Inc. | 12,770,060 |
| Consumer Staples (6.9%) | | | 159,600 | Capital One Financial | |
| 707,800 | Altria Group, Inc. | | 53,120,390 | | Corporation | 12,185,460 |
| 174,700 | Anheuser-Busch Companies, Inc. | 7,208,122 | 154,700 | Chubb Corporation | 14,382,459 |
| 132,800 | Bunge Limited Finance | | | 250,700 | CIT Group, Inc. | 11,464,511 |
| | Corporation(b) | | 6,897,632 | 1,667,848 | Citigroup, Inc. | 76,354,081 |
| 318,100 | Coca-Cola Company | | 13,608,318 | 236,100 | Federal Home Loan | |
| 297,200 | Constellation Brands, Inc.(b,c) | | 6,996,088 | | Mortgage Corporation(b) | 14,484,735 |
| 622,300 | CVS Corporation | | 15,190,343 | 221,900 | Federal National Mortgage | |
| 80,500 | Kellogg Company | | 3,555,685 | | Association | 10,544,688 |
| 119,200 | Kimberly-Clark Corporation | | 6,775,328 | 293,600 | Goldman Sachs Group, Inc. | 37,102,232 |
| 220,300 | Kraft Foods, Inc.(b) | | 6,234,490 | | | |
| |
| The accompanying notes to the financial statements are an integral part of this schedule. | |
|
117
| Large Cap Stock Fund | | | | | |
| Schedule of Investments as of October 31, 2005(a) | | | | |
| |
| Shares | Common Stock (87.7%) | Value | Shares | Common Stock (87.7%) | | Value |
|
| |
| Financials -- continued | | 337,900 | WellPoint, Inc.(c) | | $25,234,372 |
| 138,400 | Hartford Financial Services | | 683,900 | Wyeth | | 30,474,584 |
| | Group, Inc. | $11,037,400 | 123,000 | Zimmer Holdings, Inc.(c) | | 7,843,710 |
|
|
| 903,984 | J.P. Morgan Chase & Company | 33,103,894 | | Total Health Care | 485,278,787 |
|
|
| 184,200 | Lehman Brothers Holdings, Inc. | 22,043,214 | | | | |
| 109,000 | Loews Corporation | 10,134,820 | Industrials (10.2%) | | |
| 399,600 | Merrill Lynch & Company, Inc. | 25,870,104 | 104,800 | 3M Company | | 7,962,704 |
| 426,600 | MetLife, Inc. | 21,078,306 | 247,900 | Burlington Northern | | |
| 75,250 | Morgan Stanley | 4,094,352 | | Santa Fe Corporation | | 15,384,674 |
| 90,900 | Progressive Corporation | 10,527,129 | 226,000 | C.H. Robinson Worldwide, Inc. | 7,968,760 |
| 365,600 | Prudential Financial, Inc. | 26,612,024 | 101,200 | Canadian National | | |
| 120,900 | SAFECO Corporation | 6,734,130 | | Railway Company | | 7,334,976 |
| 191,900 | Wachovia Corporation | 9,694,788 | 204,400 | Caterpillar, Inc. | | 10,749,396 |
| 499,800 | Wells Fargo & Company | 30,087,960 | 102,700 | Danaher Corporation | | 5,350,670 |
| 113,100 | Zions Bancorporation | 8,309,457 | 84,400 | Deere & Company | | 5,121,392 |
|
| |
| | Total Financials | 594,350,199 | 281,000 | Emerson Electric Company | | 19,543,550 |
|
| |
| | | | 118,200 | Fastenal Company(b) | | 8,289,366 |
| Health Care (13.3%) | | 141,500 | General Dynamics Corporation | 16,456,450 |
| 432,500 | Abbott Laboratories | 18,619,125 | 2,679,000 | General Electric Company | | 90,844,890 |
| 184,400 | Aetna, Inc. | 16,330,464 | 464,800 | Honeywell International, Inc. | 15,896,160 |
| 475,200 | Amgen, Inc.(c) | 36,001,152 | 188,000 | Illinois Tool Works, Inc. | | 15,934,880 |
| 97,500 | Bausch & Lomb, Inc. | 7,233,525 | 424,500 | Ingersoll-Rand Company | | 16,041,855 |
| 327,600 | Baxter International, Inc. | 12,524,148 | 366,300 | JB Hunt Transport Services, Inc.(b) | 7,109,883 |
| 188,000 | C.R. Bard, Inc. | 11,727,440 | 124,500 | Lockheed Martin Corporation | 7,539,720 |
| 420,200 | Caremark Rx, Inc.(c) | 22,018,480 | 147,200 | Manpower, Inc.(b) | | 6,665,216 |
| 123,400 | Eli Lilly and Company | 6,144,086 | 540,800 | Norfolk Southern Corporation | 21,740,160 |
| 145,900 | Fisher Scientific | | 187,900 | Northrop Grumman Corporation | 10,080,835 |
| | International, Inc.(b,c) | 8,243,350 | 120,600 | PACCAR, Inc. | | 8,444,412 |
| 126,000 | Genentech, Inc.(c) | 11,415,600 | 974,000 | Tyco International, Ltd. | | 25,703,860 |
| 147,100 | Gilead Sciences, Inc.(c) | 6,950,475 | 226,400 | United Parcel Service, Inc. | | 16,513,616 |
| 145,800 | Guidant Corporation | 9,185,400 | 455,300 | United Technologies Corporation | 23,347,784 |
|
|
| 186,000 | Henry Schein, Inc.(c) | 7,373,040 | | Total Industrials | 370,025,209 |
|
|
| 181,300 | Humana, Inc.(b,c) | 8,047,907 | | | | |
| 85,800 | Invitrogen Corporation(b,c) | 5,456,022 | Information Technology (14.8%) | | |
| 1,173,600 | Johnson & Johnson | 73,490,832 | 700,100 | Adobe Systems, Inc. | | 22,578,225 |
| 137,000 | Laboratory Corporation of | | 83,400 | Affiliated Computer | | |
| | America Holdings(c) | 6,610,250 | | Services, Inc.(b,c) | | 4,512,774 |
| 137,200 | LifePoint Hospitals, Inc.(c) | 5,364,520 | 223,300 | Altera Corporation(c) | | 3,717,945 |
| 209,500 | Medco Health Solutions, Inc.(c) | 11,836,750 | 174,900 | Analog Devices, Inc. | | 6,083,022 |
| 616,000 | Medtronic, Inc. | 34,902,560 | 468,800 | Apple Computer, Inc.(c) | | 26,998,192 |
| 1,797,775 | Pfizer, Inc. | 39,083,628 | 393,000 | Applied Materials, Inc. | | 6,437,340 |
| 185,500 | Sanofi-Aventis ADR | 7,442,260 | 277,300 | Automatic Data Processing, Inc. | 12,938,818 |
| 302,200 | St. Jude Medical, Inc.(c) | 14,526,754 | 2,336,900 | Cisco Systems, Inc.(c) | | 40,778,905 |
| 256,900 | Teva Pharmaceutical | | 154,700 | Cognizant Technology | | |
| | Industries, Ltd.(b) | 9,793,028 | | Solutions Corporation(c) | | 6,803,706 |
| 542,500 | UnitedHealth Group, Inc. | 31,405,325 | 445,400 | Corning, Inc.(c) | | 8,948,086 |
| |
| |
| The accompanying notes to the financial statements are an integral part of this schedule. | |
|
118
| Large Cap Stock Fund | | | | | |
| Schedule of Investments as of October 31, 2005(a) | | | | |
| |
| Shares | Common Stock (87.7%) | Value | Shares | Common Stock (87.7%) | Value |
|
| |
| Information Technology -- continued | | 124,700 | PPG Industries, Inc. | $7,478,259 |
| 1,079,000 | Dell, Inc.(c) | $34,398,520 | 336,100 | Praxair, Inc. | | 16,606,701 |
| 1,296,400 | EMC Corporation(c) | 18,097,744 | 96,400 | Weyerhaeuser Company | 6,105,976 |
|
|
| 211,592 | First Data Corporation | 8,558,896 | | Total Materials | 83,422,007 |
|
|
| 188,500 | Fiserv, Inc.(c) | 8,233,680 | | | | |
| 496,000 | Hewlett-Packard Company | 13,907,840 | Miscellaneous (0.4%) | | |
| 2,422,800 | Intel Corporation | 56,935,800 | 114,900 | S&P 500 Large Index | |
| 371,300 | International Business | | | Depository Receipts(b) | 13,816,725 |
|
|
| | Machines Corporation | 30,402,044 | | Total Miscellaneous | 13,816,725 |
|
|
| 151,000 | KLA-Tencor Corporation(b) | 6,989,790 | | | | |
| 266,300 | Linear Technology Corporation | 8,843,823 | Telecommunications Services (1.5%) | |
| 121,000 | Marvell Technology Group, Ltd.(c) 5,615,610 | 581,571 | SBC Communications, Inc. | 13,870,468 |
| 166,600 | Microchip Technology, Inc.(b) | 5,026,322 | 1,253,285 | Sprint Nextel Corporation | 29,214,073 |
| 3,301,700 | Microsoft Corporation | 84,853,690 | 362,600 | Verizon Communications, Inc. | 11,425,526 |
|
|
| 1,377,200 | Motorola, Inc. | 30,518,752 | | Total Telecommunications |
| 217,500 | Network Appliance, Inc.(c) | 5,950,800 | | Services | | 54,510,067 |
|
|
| 301,700 | Nokia Oyj ADR | 5,074,594 | | | | |
| 1,340,200 | Oracle Corporation(c) | 16,993,736 | Utilities (1.8%) | | |
| 403,000 | QUALCOMM, Inc. | 16,023,280 | 101,800 | American Electric Power | |
| 504,200 | Symantec Corporation(c) | 12,025,170 | | Company, Inc. | | 3,864,328 |
| 815,900 | Texas Instruments, Inc. | 23,293,945 | 109,100 | Edison International, Inc. | 4,774,216 |
| 373,300 | VeriSign, Inc.(b,c) | 8,821,079 | 173,700 | Entergy Corporation | 12,284,064 |
|
| |
| | Total Information | | 189,300 | Exelon Corporation(b) | 9,849,279 |
| | Technology | 540,362,128 | 166,100 | PG&E Corporation | 6,042,718 |
|
| |
| | | | 129,700 | PPL Corporation | | 4,064,798 |
| Materials (2.3%) | | 93,600 | Sempra Energy | | 4,146,480 |
| 146,700 | Ball Corporation | 5,775,579 | 214,300 | TXU Corporation | | 21,590,725 |
|
|
| 449,900 | Dow Chemical Company | 20,632,414 | | Total Utilities | | 66,616,608 |
|
|
| 105,500 | Eastman Chemical Company | 5,566,180 | | | | |
|
|
| 183,500 | Georgia-Pacific Corporation | 5,969,255 | | Total Common Stock | |
| 126,900 | Phelps Dodge Corporation | 15,287,643 | | (cost $2,447,267,479) | 3,199,337,064 |
|
|
| |
| | | | | Interest | Maturity | |
| Shares | Collateral Held for Securities Loaned (2.0%) | Rate(d) | Date | Value |
|
| 74,365,656 | Thrivent Financial Securities Lending Trust | | 3.950% | N/A | $74,365,656 |
| |
|
| | | Total Collateral Held for Securities Loaned | |
| | | (cost $74,365,656) | | | 74,365,656 |
|
|
| |
| |
The accompanying notes to the financial statements are an integral part of this schedule. |
|
119
| Large Cap Stock Fund | | | | |
| Schedule of Investments as of October 31, 2005(a) | | | | |
| |
| Shares or | | | | | |
| Principal | | Interest | Maturity | | |
| Amount | Short-Term Investments (10.3%) | Rate(d) | Date | | Value |
|
| $10,180,000 | Air Products and Chemicals, Inc. | 4.030% | 11/1/2005 | | $10,180,000 |
| 12,700,000 | Air Products and Chemicals, Inc. | 3.940 | 11/3/2005 | | 12,697,220 |
| 1,500,000 | Aquinas Funding, LLC | 4.020 | 11/14/2005 | | 1,497,822 |
| 37,530,000 | Blue Spice, LLC | 4.040 | 11/1/2005 | | 37,530,000 |
| 15,980,000 | BP Capital Markets plc | 4.020 | 11/1/2005 | | 15,980,000 |
| 10,000,000 | Cargill, Inc. | 4.020 | 11/15/2005 | | 9,984,367 |
| 3,225,000 | Ciesco, LLC | 4.030 | 11/1/2005 | | 3,225,000 |
| 2,800,000 | Dexia Delaware, LLC | 4.000 | 11/1/2005 | | 2,800,000 |
| 3,600,000 | Dexia Delaware, LLC | 3.940 | 11/4/2005 | | 3,598,818 |
| 4,001,000 | Falcon Asset Securitization Corporation | 4.000 | 11/2/2005 | | 4,000,555 |
| 20,000,000 | First Data Corporation | 3.960 | 11/4/2005 | | 19,993,400 |
| 25,000,000 | First Data Corporation | 4.000 | 11/10/2005 | | 24,975,000 |
| 17,185,000 | Jupiter Securitization Corporation | 4.050 | 11/9/2005 | | 17,169,534 |
| 10,000,000 | Kitty Hawk Funding Corporation | 3.940 | 11/1/2005 | | 10,000,000 |
| 8,800,000 | Kitty Hawk Funding Corporation | 3.790 | 11/2/2005 | | 8,799,073 |
| 17,329,000 | Nestle Capital Corporation | 4.020 | 11/8/2005 | | 17,315,454 |
| 27,211,000 | Novartis Finance Corporation | 4.030 | 11/1/2005 | | 27,211,000 |
| 15,000,000 | Old Line Funding Corporation | 4.050 | 11/1/2005 | | 15,000,000 |
| 22,620,000 | Paccar Financial Corporation | 3.975 | 11/8/2005 | | 22,602,517 |
| 20,000,000 | Steamboat Funding Corporation | 4.020 | 11/7/2005 | | 19,986,633 |
| 20,000,000 | Steamboat Funding Corporation | 4.050 | 11/10/2005 | | 19,979,750 |
| 27,657,596 | Thrivent Money Market Fund | 3.600 | N/A | | 27,657,596 |
| 8,011,000 | Thunder Bay Funding, Inc. | 3.970 | 11/4/2005 | | 8,008,350 |
| 25,000,000 | Toyota Motor Credit Corporation | 3.850 | 11/4/2005 | | 24,991,979 |
| 9,396,000 | Triple A-1 Funding | 3.950 | 11/16/2005 | | 9,380,536 |
|
|
| | Total Short-Term Investments (at amortized cost) | | 374,564,604 |
|
|
| | Total Investments (cost $2,896,197,739) | | | $3,648,267,324 |
|
|
| (a) | The categories of investments are shown as a percentage of total investments. |
| |
| (b) | All or a portion of the security is on loan as discussed in item 2(L) of the Notes to Financial Statements. |
| |
| (c) | Non-income producing security. |
| |
| (d) | The interest rate shown reflects the yield, coupon rate or, for securities purchased at a discount, the discount rate at the date of purchase. |
| |
| (e) | Miscellaneous footnote: |
| |
| | ADR -- American Depository Receipts, which are certificates for shares of an underlying foreign security’s shares held by an issuing U.S. depository bank. |
| |
|
The accompanying notes to the financial statements are an integral part of this schedule. |
|
|
120
| | Large Cap Index Fund | |
| | Schedule of Investments as of October 31, 2005(a) | |
| Shares | Common Stock (94.4%) | Value | Shares | Common Stock (94.4%) | Value |
|
| |
| Consumer Discretionary (10.1%) | | 1,700 | Johnson Controls, Inc. | $115,685 |
| 1,200 | Apollo Group, Inc.(b,c) | $75,624 | 1,200 | Jones Apparel Group, Inc. | 32,736 |
| 1,600 | AutoNation, Inc.(b) | 31,808 | 600 | KB Home | 39,210 |
| 500 | AutoZone, Inc.(b) | 40,450 | 700 | Knight-Ridder, Inc.(c) | 37,366 |
| 2,500 | Bed Bath & Beyond, Inc.(b) | 101,300 | 2,900 | Kohl’s Corporation(b) | 139,577 |
| 3,475 | Best Buy Company, Inc. | 153,804 | 1,800 | Leggett & Platt, Inc. | 36,072 |
| 1,100 | Big Lots, Inc.(b,c) | 12,727 | 1,100 | Lennar Corporation(c) | 61,138 |
| 700 | Black & Decker Corporation | 57,491 | 3,000 | Limited Brands, Inc. | 60,030 |
| 900 | Brunswick Corporation(c) | 34,317 | 1,000 | Liz Claiborne, Inc. | 35,200 |
| 3,700 | Carnival Corporation | 183,779 | 6,600 | Lowe’s Companies, Inc. | 401,082 |
| 1,100 | Centex Corporation(c) | 70,785 | 1,400 | Marriott International, Inc. | 83,468 |
| 1,400 | Circuit City Stores, Inc. | 24,906 | 3,500 | Mattel, Inc. | 51,625 |
| 4,500 | Clear Channel | | 800 | Maytag Corporation(c) | 13,776 |
| | Communications, Inc. | 136,890 | 10,300 | McDonald’s Corporation | 325,480 |
| 3,200 | Coach, Inc.(b) | 102,976 | 3,200 | McGraw-Hill Companies, Inc. | 156,608 |
| 18,787 | Comcast Corporation(b) | 522,842 | 500 | Meredith Corporation | 24,950 |
| 700 | Cooper Tire & Rubber Company(c) | 9,562 | 1,400 | New York Times Company(c) | 38,136 |
| 2,300 | D.R. Horton, Inc. | 70,587 | 2,300 | Newell Rubbermaid, Inc.(c) | 52,877 |
| 1,700 | Dana Corporation(c) | 12,767 | 21,100 | News Corporation | 300,675 |
| 1,200 | Darden Restaurants, Inc. | 38,904 | 1,600 | NIKE, Inc. | 134,480 |
| 600 | Dillard’s, Inc.(c) | 12,426 | 1,800 | Nordstrom, Inc. | 62,370 |
| 2,700 | Dollar General Corporation | 52,488 | 2,700 | Office Depot, Inc.(b) | 74,331 |
| 600 | Dow Jones & Company, Inc.(c) | 20,346 | 700 | OfficeMax, Inc. | 19,614 |
| 2,400 | Eastman Kodak Company(c) | 52,560 | 1,500 | Omnicom Group, Inc. | 124,440 |
| 9,600 | eBay, Inc.(b) | 380,160 | 1,800 | Pulte Homes, Inc. | 68,022 |
| 1,300 | Family Dollar Stores, Inc.(c) | 28,782 | 1,200 | RadioShack Corporation(c) | 26,520 |
| 2,278 | Federated Department Stores, Inc. | 139,801 | 500 | Reebok International, Ltd. | 28,525 |
| 16,000 | Ford Motor Company(c) | 133,120 | 872 | Sears Holdings Corporation(b,c) | 104,858 |
| 1,200 | Fortune Brands, Inc. | 91,164 | 1,100 | Sherwin-Williams Company | 46,805 |
| 2,100 | Gannett Company, Inc. | 131,586 | 600 | Snap-On, Inc.(c) | 21,612 |
| 5,000 | Gap, Inc. | 86,400 | 700 | Stanley Works | 33,551 |
| 4,900 | General Motors Corporation(c) | 134,260 | 6,350 | Staples, Inc. | 144,336 |
| 1,600 | Genuine Parts Company | 70,992 | 6,400 | Starbucks Corporation(b) | 180,992 |
| 1,500 | Goodyear Tire & | | 1,800 | Starwood Hotels & Resorts | |
| | Rubber Company(b,c) | 23,460 | | Worldwide, Inc. | 105,174 |
| 2,800 | H&R Block, Inc. | 69,608 | 7,600 | Target Corporation | 423,244 |
| 2,400 | Harley-Davidson, Inc.(c) | 118,872 | 1,200 | Tiffany & Company | 47,280 |
| 1,500 | Harrah’s Entertainment, Inc. | 90,720 | 38,950 | Time Warner, Inc. | 694,478 |
| 1,600 | Hasbro, Inc.(c) | 30,144 | 4,100 | TJX Companies, Inc. | 88,273 |
| 2,800 | Hilton Hotels Corporation | 54,460 | 2,300 | Tribune Company | 72,473 |
| 18,300 | Home Depot, Inc. | 751,032 | 1,900 | Univision Communications, Inc.(b) | 49,666 |
| 2,900 | International Game Technology | 76,821 | 900 | VF Corporation | 47,025 |
| 3,600 | Interpublic Group of | | 13,600 | Viacom, Inc. | 421,192 |
| | Companies, Inc.(b) | 37,188 | 1,100 | Visteon Corporation(c) | 9,163 |
| 2,100 | J.C. Penney Company, Inc. | | 17,400 | Walt Disney Company | 424,038 |
| | (Holding Company) | 107,520 | 1,000 | Wendy’s International, Inc. | 46,720 |
| |
| |
| The accompanying notes to the financial statements are an integral part of this schedule. | |
|
121
| Large Cap Index Fund | | | | | |
| Schedule of Investments as of October 31, 2005(a) | | | | |
| |
| Shares | Common Stock (94.4%) | | Value | Shares | Common Stock (94.4%) | Value |
|
| |
| Consumer Discretionary -- continued | | Energy (8.9%) | |
| 600 | Whirlpool Corporation | | $47,100 | 600 | Amerada Hess Corporation | $75,060 |
| 2,400 | Yum! Brands, Inc. | | 122,088 | 1,945 | Anadarko Petroleum Corporation | 176,431 |
|
| |
| | Total Consumer | | | 2,722 | Apache Corporation | 173,745 |
| | Discretionary | 10,049,490 | 2,900 | Baker Hughes, Inc. | 159,384 |
|
| | |
| | | | | 2,800 | BJ Services Company | 97,300 |
| Consumer Staples (9.2%) | | | 3,300 | Burlington Resources, Inc. | 238,326 |
| 650 | Alberto-Culver Company | | 28,216 | 19,303 | Chevron Corporation | 1,101,622 |
| 3,000 | Albertson’s, Inc. | | 75,330 | 11,896 | ConocoPhillips | 777,760 |
| 17,700 | Altria Group, Inc. | | 1,328,385 | 4,000 | Devon Energy Corporation | 241,520 |
| 6,600 | Anheuser-Busch Companies, Inc. | 272,316 | 5,592 | El Paso Corporation | 66,321 |
| 5,496 | Archer-Daniels-Midland Company | 133,938 | 2,000 | EOG Resources, Inc. | 135,560 |
| 4,000 | Avon Products, Inc. | | 107,960 | 54,100 | Exxon Mobil Corporation | 3,037,174 |
| 800 | Brown-Forman Corporation | | 50,672 | 4,300 | Halliburton Company | 254,130 |
| 1,600 | Campbell Soup Company(c) | | 46,560 | 900 | Kerr-McGee Corporation | 76,536 |
| 1,300 | Clorox Company | | 70,356 | 900 | Kinder Morgan, Inc.(c) | 81,810 |
| 17,700 | Coca-Cola Company | | 757,206 | 3,065 | Marathon Oil Corporation | 184,390 |
| 2,500 | Coca-Cola Enterprises, Inc. | | 47,250 | 1,400 | Murphy Oil Corporation | 65,590 |
| 4,500 | Colgate-Palmolive Company | | 238,320 | 1,300 | Nabors Industries, Ltd.(b) | 89,219 |
| 4,400 | ConAgra Foods, Inc.(c) | | 102,388 | 1,400 | National Oilwell Varco, Inc.(b) | 87,458 |
| 1,700 | Constellation Brands, Inc.(b,c) | | 40,018 | 1,300 | Noble Corporation | 83,694 |
| 4,100 | Costco Wholesale Corporation | 198,276 | 3,400 | Occidental Petroleum Corporation | 268,192 |
| 6,900 | CVS Corporation | | 168,429 | 1,000 | Rowan Companies, Inc.(c) | 32,990 |
| 3,100 | General Mills, Inc. | | 149,606 | 5,000 | Schlumberger, Ltd. | 453,850 |
| 3,000 | H.J. Heinz Company | | 106,500 | 1,200 | Sunoco, Inc. | 89,400 |
| 1,600 | Hershey Company | | 90,928 | 2,800 | Transocean, Inc.(b) | 160,972 |
| 2,200 | Kellogg Company | | 97,174 | 2,600 | Valero Energy Corporation | 273,624 |
| 4,100 | Kimberly-Clark Corporation | | 233,044 | 1,200 | Weatherford International, Ltd.(b,c) | 75,120 |
| 6,200 | Kroger Company(b) | | 123,380 | 4,900 | Williams Companies, Inc. | 109,270 |
| 1,300 | McCormick & Company, Inc.(c) | 39,377 | 3,100 | XTO Energy, Inc. | 134,726 |
|
|
| 500 | Molson Coors Brewing Company(c) | 30,850 | | Total Energy | 8,801,174 |
|
|
| 1,200 | Pepsi Bottling Group, Inc. | | 34,116 | | | |
| 14,290 | PepsiCo, Inc. | | 844,253 | Financials (19.9%) | |
| 28,710 | Procter & Gamble Company | | 1,607,473 | 2,700 | ACE, Ltd. | 140,670 |
| 800 | Reynolds American, Inc.(c) | | 68,000 | 4,300 | AFLAC, Inc. | 205,454 |
| 3,800 | Safeway, Inc. | | 88,388 | 5,500 | Allstate Corporation | 290,345 |
| 6,700 | Sara Lee Corporation | | 119,595 | 950 | Ambac Financial Group, Inc. | 67,346 |
| 1,200 | SUPERVALU, Inc. | | 37,716 | 10,500 | American Express Company | 522,585 |
| 5,400 | SYSCO Corporation | | 172,314 | 22,144 | American International | |
| 2,300 | Tyson Foods, Inc. | | 40,940 | | Group, Inc. | 1,434,931 |
| 1,400 | UST, Inc.(c) | | 57,946 | 2,100 | Ameriprise Financial, Inc.(b) | 78,162 |
| 21,600 | Wal-Mart Stores, Inc. | | 1,021,896 | 3,000 | AmSouth Bancorporation | 75,690 |
| 8,800 | Walgreen Company | | 399,784 | 2,700 | Aon Corporation | 91,395 |
| 1,500 | William Wrigley Jr. Company | | 104,250 | 900 | Apartment Investment & | |
|
| |
| | Total Consumer Staples | | 9,133,150 | | Management Company | 34,560 |
|
| |
| | | | | 1,900 | Archstone-Smith Trust | 77,083 |
| | | | | 34,394 | Bank of America Corporation | 1,504,394 |
| |
| The accompanying notes to the financial statements are an integral part of this schedule. | |
|
122
| Large Cap Index Fund | | | | |
| Schedule of Investments as of October 31, 2005(a) | | | | |
| |
| Shares | Common Stock (94.4%) | Value | Shares | Common Stock (94.4%) | Value |
|
| |
| Financials -- continued | | 2,100 | Moody’s Corporation | $111,846 |
| 6,700 | Bank of New York Company, Inc. | $209,643 | 9,400 | Morgan Stanley | 511,454 |
| 4,700 | BB&T Corporation(c) | 198,998 | 4,800 | National City Corporation | 154,704 |
| 900 | Bear Stearns Companies, Inc. | 95,220 | 4,100 | North Fork Bancorporation, Inc. | 103,894 |
| 2,500 | Capital One Financial Corporation | 190,875 | 1,700 | Northern Trust Corporation | 91,120 |
| 9,000 | Charles Schwab Corporation | 136,800 | 1,600 | Plum Creek Timber | |
| 1,600 | Chubb Corporation | 148,752 | | Company, Inc.(c) | 62,240 |
| 1,607 | Cincinnati Financial Corporation | 68,378 | 2,500 | PNC Financial Services Group, Inc. | 151,775 |
| 1,800 | CIT Group, Inc. | 82,314 | 2,600 | Principal Financial Group, Inc. | 129,038 |
| 44,306 | Citigroup, Inc. | 2,028,329 | 1,700 | Progressive Corporation | 196,877 |
| 1,500 | Comerica, Inc. | 86,670 | 2,000 | ProLogis Trust | 86,000 |
| 1,200 | Compass Bancshares, Inc.(c) | 58,512 | 4,400 | Prudential Financial, Inc. | 320,276 |
| 5,000 | Countrywide Financial Corporation | 158,850 | 800 | Public Storage, Inc. | 52,960 |
| 3,100 | E*TRADE Financial Corporation(b) | 57,505 | 4,001 | Regions Financial Corporation(c) | 130,233 |
| 3,600 | Equity Office Properties Trust | 110,880 | 1,200 | SAFECO Corporation | 66,840 |
| 2,600 | Equity Residential REIT | 102,050 | 1,600 | Simon Property Group, Inc. | 114,592 |
| 6,000 | Federal Home Loan | | 3,600 | SLM Corporation | 199,908 |
| | Mortgage Corporation | 368,100 | 3,000 | Sovereign Bancorp, Inc.(c) | 64,710 |
| 8,300 | Federal National Mortgage | | 5,764 | St. Paul Travelers Companies, Inc. | 259,553 |
| | Association | 394,416 | 2,800 | State Street Corporation | 154,644 |
| 800 | Federated Investors, Inc.(c) | 28,008 | 3,000 | SunTrust Banks, Inc. | 217,440 |
| 5,022 | Fifth Third Bancorp | 201,734 | 2,800 | Synovus Financial Corporation | 76,916 |
| 1,100 | First Horizon National | | 1,300 | T. Rowe Price Group, Inc. | 85,176 |
| | Corporation(c) | 42,548 | 900 | Torchmark Corporation(c) | 47,547 |
| 1,300 | Franklin Resources, Inc. | 114,881 | 15,618 | U.S. Bancorp | 461,980 |
| 2,100 | Golden West Financial Corporation | 123,333 | 2,600 | UnumProvident Corporation(c) | 52,754 |
| 3,900 | Goldman Sachs Group, Inc. | 492,843 | 1,200 | Vornado Realty Trust | 97,200 |
| 2,500 | Hartford Financial Services | | 13,536 | Wachovia Corporation | 683,839 |
| | Group, Inc. | 199,375 | 8,501 | Washington Mutual, Inc. | 336,650 |
| 2,010 | Huntington Bancshares, Inc.(c) | 46,753 | 14,600 | Wells Fargo & Company | 878,920 |
| 30,158 | J.P. Morgan Chase & Company | 1,104,386 | 1,300 | XL Capital, Ltd. | 83,278 |
| 2,000 | Janus Capital Group, Inc. | 35,100 | 900 | Zions Bancorporation | 66,123 |
|
|
| 1,150 | Jefferson-Pilot Corporation | 63,112 | | Total Financials | 19,720,014 |
|
|
| 3,500 | KeyCorp | 112,840 | | | |
| 2,300 | Lehman Brothers Holdings, Inc. | 275,241 | Health Care (12.4%) | |
| 1,600 | Lincoln National Corporation | 80,976 | 13,300 | Abbott Laboratories | 572,565 |
| 1,100 | Loews Corporation | 102,278 | 2,500 | Aetna, Inc. | 221,400 |
| 700 | M&T Bank Corporation(c) | 75,306 | 1,100 | Allergan, Inc. | 98,230 |
| 4,500 | Marsh & McLennan | | 900 | AmerisourceBergen Corporation | 68,643 |
| | Companies, Inc. | 131,175 | 10,336 | Amgen, Inc.(b) | 783,055 |
| 1,900 | Marshall & Ilsley Corporation(c) | 81,624 | 1,700 | Applera Corporation | |
| 1,200 | MBIA, Inc. | 69,888 | | (Applied Biosystems Group)(c) | 41,259 |
| 10,700 | MBNA Corporation | 273,599 | 500 | Bausch & Lomb, Inc.(c) | 37,095 |
| 3,600 | Mellon Financial Corporation | 114,084 | 5,300 | Baxter International, Inc. | 202,619 |
| 8,000 | Merrill Lynch & Company, Inc. | 517,920 | 2,100 | Becton, Dickinson and Company | 106,575 |
| 6,400 | MetLife, Inc. | 316,224 | 2,890 | Biogen Idec, Inc.(b) | 117,421 |
| 800 | MGIC Investment Corporation | 47,392 | 2,175 | Biomet, Inc.(c) | 75,755 |
| |
| The accompanying notes to the financial statements are an integral part of this schedule. | |
|
123
| Large Cap Index Fund | | | | | |
| Schedule of Investments as of October 31, 2005(a) | | | | | |
| |
| Shares | Common Stock (94.4%) | Value | Shares | Common Stock (94.4%) | | Value |
|
| |
| Health Care -- continued | | 5,300 | WellPoint, Inc.(b) | | $395,804 |
| 5,100 | Boston Scientific Corporation(b) | $128,112 | 11,500 | Wyeth | | 512,440 |
| 16,800 | Bristol-Myers Squibb Company | 355,656 | 2,040 | Zimmer Holdings, Inc.(b) | | 130,091 |
|
|
| 900 | C.R. Bard, Inc. | 56,142 | | Total Health Care | | 12,261,138 |
|
|
| 3,500 | Cardinal Health, Inc. | 218,785 | | | | |
| 3,700 | Caremark Rx, Inc.(b) | 193,880 | Industrials (10.5%) | | |
| 1,000 | Chiron Corporation(b,c) | 44,140 | 6,600 | 3M Company | | 501,468 |
| 1,100 | CIGNA Corporation | 127,457 | 2,000 | Allied Waste Industries, Inc.(b,c) | 16,280 |
| 1,350 | Coventry Health Care, Inc.(b) | 72,886 | 1,400 | American Power Conversion | | |
| 9,800 | Eli Lilly and Company | 487,942 | | Corporation | | 29,946 |
| 1,200 | Express Scripts, Inc.(b) | 90,492 | 1,500 | American Standard Companies, Inc. | 57,060 |
| 1,000 | Fisher Scientific | | 1,000 | Avery Dennison Corporation(c) | 56,650 |
| | International, Inc.(b) | 56,500 | 6,900 | Boeing Company | | 446,016 |
| 3,000 | Forest Laboratories, Inc.(b) | 113,730 | 3,200 | Burlington Northern | | |
| 2,200 | Genzyme Corporation(b) | 159,060 | | Santa Fe Corporation | | 198,592 |
| 3,800 | Gilead Sciences, Inc.(b) | 179,550 | 5,800 | Caterpillar, Inc. | | 305,022 |
| 2,800 | Guidant Corporation | 176,400 | 9,000 | Cendant Corporation | | 156,780 |
| 3,800 | HCA, Inc. | 183,122 | 1,100 | Cintas Corporation | | 44,627 |
| 2,100 | Health Management | | 900 | Cooper Industries, Ltd. | | 63,801 |
| | Associates, Inc.(c) | 44,961 | 1,800 | CSX Corporation | | 82,458 |
| 1,350 | Hospira, Inc.(b) | 53,798 | 400 | Cummins, Inc. | | 34,148 |
| 1,300 | Humana, Inc.(b) | 57,707 | 2,000 | Danaher Corporation | | 104,200 |
| 2,000 | IMS Health, Inc. | 46,460 | 2,100 | Deere & Company | | 127,428 |
| 25,490 | Johnson & Johnson | 1,596,184 | 1,900 | Dover Corporation | | 74,062 |
| 2,033 | King Pharmaceuticals, Inc.(b) | 31,369 | 1,200 | Eaton Corporation | | 70,596 |
| 1,100 | Laboratory Corporation of | | 3,500 | Emerson Electric Company | | 243,425 |
| | America Holdings(b) | 53,075 | 1,200 | Equifax, Inc. | | 41,364 |
| 800 | Manor Care, Inc. | 29,800 | 2,600 | FedEx Corporation | | 239,018 |
| 2,600 | McKesson Corporation | 118,118 | 800 | Fluor Corporation | | 50,880 |
| 2,625 | Medco Health Solutions, Inc.(b) | 148,312 | 1,700 | General Dynamics Corporation | 197,710 |
| 2,100 | MedImmune, Inc.(b) | 73,458 | 90,000 | General Electric Company | | 3,051,900 |
| 10,400 | Medtronic, Inc. | 589,264 | 1,000 | Goodrich Corporation(c) | | 36,070 |
| 18,800 | Merck & Company, Inc. | 530,536 | 7,300 | Honeywell International, Inc. | | 249,660 |
| 600 | Millipore Corporation(b) | 36,732 | 1,700 | Illinois Tool Works, Inc. | | 144,092 |
| 1,900 | Mylan Laboratories, Inc. | 36,499 | 2,900 | Ingersoll-Rand Company | | 109,591 |
| 1,100 | Patterson Companies, Inc.(b,c) | 45,518 | 900 | ITT Industries, Inc. | | 91,440 |
| 1,200 | PerkinElmer, Inc. | 26,484 | 1,000 | L-3 Communications Holdings, Inc. | 77,820 |
| 64,040 | Pfizer, Inc. | 1,392,230 | 3,100 | Lockheed Martin Corporation | | 187,736 |
| 1,400 | Quest Diagnostics, Inc. | 65,394 | 3,700 | Masco Corporation | | 105,450 |
| 12,900 | Schering-Plough Corporation | 262,386 | 1,000 | Monster Worldwide, Inc.(b) | | 32,810 |
| 3,100 | St. Jude Medical, Inc.(b) | 149,017 | 700 | Navistar International | | |
| 2,400 | Stryker Corporation | 98,568 | | Corporation(b,c) | | 19,264 |
| 4,000 | Tenet Healthcare Corporation(b) | 33,680 | 3,400 | Norfolk Southern Corporation | | 136,680 |
| 1,400 | Thermo Electron Corporation(b) | 42,266 | 3,034 | Northrop Grumman Corporation | 162,774 |
| 10,800 | UnitedHealth Group, Inc. | 625,212 | 1,425 | PACCAR, Inc. | | 99,778 |
| 1,000 | Waters Corporation(b) | 36,200 | 1,200 | Pall Corporation(c) | | 31,392 |
| 900 | Watson Pharmaceuticals, Inc.(b) | 31,104 | 1,000 | Parker-Hannifin Corporation | | 62,680 |
| |
| The accompanying notes to the financial statements are an integral part of this schedule. | | |
|
124
| Large Cap Index Fund | | | | |
| Schedule of Investments as of October 31, 2005(a) | | | |
| |
| Shares | Common Stock (94.4%) | Value | Shares | Common Stock (94.4%) | Value |
|
| |
| Industrials -- continued | | 20,500 | Dell, Inc.(b) | $653,540 |
| 2,000 | Pitney Bowes, Inc. | $84,160 | 2,700 | Electronic Arts, Inc.(b) | 153,576 |
| 1,900 | R.R. Donnelley & Sons Company | 66,538 | 4,400 | Electronic Data | |
| 3,800 | Raytheon Company | 140,410 | | Systems Corporation | 102,564 |
| 1,400 | Robert Half International, Inc. | 51,632 | 21,100 | EMC Corporation(b) | 294,556 |
| 1,500 | Rockwell Automation, Inc. | 79,725 | 6,703 | First Data Corporation | 271,136 |
| 1,500 | Rockwell Collins, Inc. | 68,730 | 1,650 | Fiserv, Inc.(b) | 72,072 |
| 700 | Ryder System, Inc. | 27,769 | 3,499 | Freescale Semiconductor, Inc.(b) | 83,556 |
| 5,800 | Southwest Airlines Company | 92,858 | 2,400 | Gateway, Inc.(b,c) | 6,840 |
| 1,100 | Textron, Inc. | 79,244 | 24,241 | Hewlett-Packard Company | 679,718 |
| 17,238 | Tyco International, Ltd. | 454,911 | 52,100 | Intel Corporation | 1,224,350 |
| 2,200 | Union Pacific Corporation | 152,196 | 13,800 | International Business | |
| 9,500 | United Parcel Service, Inc. | 692,930 | | Machines Corporation | 1,129,944 |
| 8,800 | United Technologies Corporation | 451,264 | 1,500 | Intuit, Inc.(b) | 68,895 |
| 800 | W.W. Grainger, Inc. | 53,584 | 1,400 | Jabil Circuit, Inc.(b) | 41,790 |
| 4,800 | Waste Management, Inc. | 141,648 | 14,500 | JDS Uniphase Corporation(b,c) | 30,450 |
|
| |
| | Total Industrials | 10,378,267 | 1,600 | KLA-Tencor Corporation | 74,064 |
|
| |
| | | | 1,000 | Lexmark International, Inc.(b) | 41,520 |
| Information Technology (14.4%) | | 2,700 | Linear Technology Corporation | 89,667 |
| 1,014 | ADC Telecommunications, Inc.(b,c) | 17,694 | 3,400 | LSI Logic Corporation(b,c) | 27,574 |
| 4,200 | Adobe Systems, Inc. | 135,450 | 38,700 | Lucent Technologies, Inc.(b,c) | 110,295 |
| 3,400 | Advanced Micro Devices, Inc.(b,c) | 78,948 | 2,800 | Maxim Integrated Products, Inc. | 97,104 |
| 1,000 | Affiliated Computer | | 700 | Mercury Interactive | |
| | Services, Inc.(b,c) | 54,110 | | Corporation(b,c) | 24,353 |
| 4,100 | Agilent Technologies, Inc.(b) | 131,241 | 5,400 | Micron Technology, Inc.(b,c) | 70,146 |
| 3,200 | Altera Corporation(b) | 53,280 | 79,100 | Microsoft Corporation | 2,032,870 |
| 3,200 | Analog Devices, Inc. | 111,296 | 1,400 | Molex, Inc.(c) | 35,434 |
| 1,500 | Andrew Corporation(b) | 15,930 | 21,300 | Motorola, Inc. | 472,008 |
| 7,000 | Apple Computer, Inc.(b) | 403,130 | 3,000 | National Semiconductor | |
| 13,700 | Applied Materials, Inc. | 224,406 | | Corporation | 67,890 |
| 2,800 | Applied Micro Circuits | | 1,600 | NCR Corporation(b) | 48,352 |
| | Corporation(b) | 6,832 | 3,100 | Network Appliance, Inc.(b) | 84,816 |
| 1,900 | Autodesk, Inc. | 85,747 | 3,300 | Novell, Inc.(b,c) | 25,146 |
| 4,900 | Automatic Data Processing, Inc. | 228,634 | 1,300 | Novellus Systems, Inc.(b) | 28,418 |
| 3,625 | Avaya, Inc.(b,c) | 41,760 | 1,400 | NVIDIA Corporation(b,c) | 46,970 |
| 1,900 | BMC Software, Inc.(b) | 37,221 | 32,500 | Oracle Corporation(b) | 412,100 |
| 2,400 | Broadcom Corporation(b) | 101,904 | 2,500 | Parametric Technology | |
| 5,100 | CIENA Corporation(b,c) | 12,087 | | Corporation(b,c) | 16,275 |
| 54,200 | Cisco Systems, Inc.(b) | 945,790 | 2,800 | Paychex, Inc. | 108,528 |
| 1,400 | Citrix Systems, Inc.(b) | 38,598 | 1,700 | PMC-Sierra, Inc.(b,c) | 12,070 |
| 4,000 | Computer Associates | | 700 | QLogic Corporation(b) | 21,112 |
| | International, Inc. | 111,880 | 14,000 | QUALCOMM, Inc. | 556,640 |
| 1,600 | Computer Sciences Corporation(b) | 82,000 | 1,200 | Sabre Holdings Corporation(c) | 23,436 |
| 3,300 | Compuware Corporation(b) | 26,697 | 4,800 | Sanmina-SCI Corporation(b,c) | 17,520 |
| 1,700 | Comverse Technology, Inc.(b) | 42,670 | 1,300 | Scientific-Atlanta, Inc. | 46,072 |
| 1,300 | Convergys Corporation(b) | 21,125 | 4,400 | Siebel Systems, Inc.(c) | 45,540 |
| 13,400 | Corning, Inc.(b) | 269,206 | 8,400 | Solectron Corporation(b) | 29,652 |
| |
| The accompanying notes to the financial statements are an integral part of this schedule. | |
|
125
| Large Cap Index Fund | | | | |
| Schedule of Investments as of October 31, 2005(a) | | | |
| |
| Shares | Common Stock (94.4%) | Value | Shares | Common Stock (94.4%) | Value |
|
| |
| Information Technology -- continued | | 1,100 | Temple-Inland, Inc. | $40,513 |
| 30,200 | Sun Microsystems, Inc.(b) | $120,800 | 900 | United States Steel Corporation | 32,877 |
| 10,347 | Symantec Corporation(b) | 246,776 | 900 | Vulcan Materials Company | 58,500 |
| 2,084 | Symbol Technologies, Inc. | 17,297 | 2,000 | Weyerhaeuser Company | 126,680 |
|
|
| 900 | Tektronix, Inc.(c) | 20,682 | | Total Materials | 2,784,271 |
|
|
| 3,900 | Tellabs, Inc.(b) | 37,284 | | �� | |
| 1,800 | Teradyne, Inc.(b,c) | 24,372 | Telecommunications Services (2.9%) | |
| 14,200 | Texas Instruments, Inc. | 405,410 | 3,200 | ALLTEL Corporation | 197,952 |
| 3,000 | Unisys Corporation(b) | 15,330 | 6,860 | AT&T Corporation | 135,691 |
| 8,200 | Xerox Corporation(b) | 111,274 | 15,700 | BellSouth Corporation | 408,514 |
| 3,000 | Xilinx, Inc. | 71,850 | 1,200 | CenturyTel, Inc. | 39,276 |
| 10,800 | Yahoo!, Inc.(b) | 399,276 | 3,000 | Citizens Communications | |
|
| |
| | Total Information | | | Company(c) | 36,720 |
| | Technology | 14,226,546 | 13,200 | Qwest Communications | |
|
| |
| | | | | International, Inc.(b,c) | 57,552 |
| Materials (2.8%) | | 28,000 | SBC Communications, Inc. | 667,800 |
| 1,900 | Air Products and Chemicals, Inc. | 108,756 | 25,068 | Sprint Nextel Corporation | 584,335 |
| 7,500 | Alcoa, Inc. | 182,175 | 23,800 | Verizon Communications, Inc. | 749,938 |
|
|
| 700 | Allegheny Technologies, Inc.(c) | 20,097 | | Total Telecommunications | |
| 800 | Ashland, Inc. | 42,808 | | Services | 2,877,778 |
|
|
| 1,000 | Ball Corporation | 39,370 | | | |
| 1,000 | Bemis Company, Inc. | 26,420 | Utilities (3.3%) | |
| 8,383 | Dow Chemical Company | 384,444 | 5,500 | AES Corporation(b) | 87,395 |
| 8,500 | E.I. du Pont de Nemours | | 1,300 | Allegheny Energy, Inc.(b) | 36,738 |
| | and Company | 354,365 | 1,900 | Ameren Corporation(c) | 99,940 |
| 800 | Eastman Chemical Company | 42,208 | 3,300 | American Electric Power | |
| 1,600 | Ecolab, Inc.(c) | 52,928 | | Company, Inc. | 125,268 |
| 1,100 | Engelhard Corporation | 29,920 | 4,800 | Calpine Corporation(b,c) | 11,424 |
| 1,500 | Freeport-McMoRan | | 2,700 | CenterPoint Energy, Inc.(c) | 35,748 |
| | Copper & Gold, Inc. | 74,130 | 1,800 | Cinergy Corporation(c) | 71,820 |
| 2,152 | Georgia-Pacific Corporation | 70,005 | 1,900 | CMS Energy Corporation(b,c) | 28,329 |
| 1,000 | Hercules, Inc.(b,c) | 11,140 | 2,100 | Consolidated Edison, Inc.(c) | 95,550 |
| 800 | International Flavors & | | 1,500 | Constellation Energy Group, Inc. | 82,200 |
| | Fragrances, Inc. | 26,392 | 2,900 | Dominion Resources, Inc. | 220,632 |
| 4,200 | International Paper Company | 122,556 | 1,600 | DTE Energy Company | 69,120 |
| 1,000 | Louisiana-Pacific Corporation(c) | 24,930 | 8,000 | Duke Energy Corporation | 211,840 |
| 1,591 | MeadWestvaco Corporation | 41,716 | 2,400 | Dynegy, Inc.(b,c) | 10,656 |
| 2,284 | Monsanto Company | 143,915 | 2,700 | Edison International, Inc. | 118,152 |
| 3,800 | Newmont Mining Corporation | 161,880 | 1,700 | Entergy Corporation | 120,224 |
| 1,300 | Nucor Corporation | 77,805 | 5,750 | Exelon Corporation | 299,172 |
| 1,300 | Pactiv Corporation(b) | 25,610 | 2,800 | FirstEnergy Corporation | 133,000 |
| 800 | Phelps Dodge Corporation | 96,376 | 3,300 | FPL Group, Inc. | 142,098 |
| 1,600 | PPG Industries, Inc. | 95,952 | 1,500 | KeySpan Corporation(c) | 51,855 |
| 2,700 | Praxair, Inc. | 133,407 | 500 | Nicor, Inc.(c) | 19,600 |
| 1,300 | Rohm and Haas Company | 56,589 | 2,437 | NiSource, Inc.(c) | 57,635 |
| 700 | Sealed Air Corporation(b) | 35,217 | 500 | Peoples Energy Corporation(c) | 18,600 |
| 700 | Sigma-Aldrich Corporation(c) | 44,590 | 3,100 | PG&E Corporation | 112,778 |
| |
| The accompanying notes to the financial statements are an integral part of this schedule. | |
| |
126
| Large Cap Index Fund | | | | | |
| Schedule of Investments as of October 31, 2005(a) | | | | |
| |
| Shares | Common Stock (94.4%) | Value | Shares | Common Stock (94.4%) | Value |
|
| |
| Utilities -- continued | | 6,300 | Southern Company(c) | $220,437 |
| 900 | Pinnacle West Capital | | 1,900 | TECO Energy, Inc.(c) | 32,870 |
| | Corporation(c) | $37,584 | 2,000 | TXU Corporation | | 201,500 |
| 3,200 | PPL Corporation | 100,288 | 3,455 | Xcel Energy, Inc.(c) | 63,330 |
|
|
| 2,327 | Progress Energy, Inc. | 101,434 | | Total Utilities | | 3,240,457 |
|
|
| 2,000 | Public Service Enterprise | | | | | |
|
|
| | Group, Inc. | 125,780 | | Total Common Stock | |
| 2,200 | Sempra Energy | 97,460 | | (cost $91,417,984) | 93,472,285 |
|
|
| |
| |
| | | | | Interest | Maturity | |
| Shares | Collateral Held for Securities Loaned (4.9%) | | Rate | Date | Value |
|
| 4,844,539 | Thrivent Financial Securities Lending Trust | | 3.950% | N/A | $4,844,539 |
| |
|
| | | Total Collateral Held for Securities Loaned | |
| | | (cost $4,844,539) | | | | 4,844,539 |
|
|
| |
| |
| | | | | Interest | Maturity | |
| Shares | Short-Term Investments (0.7%) | | Rate(d) | Date | Value |
|
| 742,456 | Thrivent Money Market Fund(e) | | | 3.600% | N/A | $742,456 |
|
|
| | | Total Short-Term Investments (at amortized cost) | 742,456 |
|
|
| | | Total Investments (cost $97,004,979) | | $99,059,280 |
|
|
| (a) | The categories of investments are shown as a percentage of total investments. |
| |
| (b) | Non-income producing security. |
| |
| (c) | All or a portion of the security is on loan as discussed in item 2(L) of the Notes to Financial Statements. |
| |
| (d) | The interest rate shown reflects the yield, coupon rate or, for securities purchased at a discount, the discount rate at the date of purchase. |
| |
| (e) | At October 31, 2005, $34,650 in cash was pledged as the initial margin deposit for open financial contacts. In addition, $742,456 of Short-Term Investments were earmarked as collateral to cover open financial futures contract as follows: |
| |
| | | | | | Notional | |
| | Number of | Expiration | | | Principal | Unrealized |
| Type | Contracts | Date | Position | Value | Amount | Loss |
|
| S&P 500 Mini Futures | 12 | December 2005 | Long | $725,880 | $738,204 | $12,324 |
The accompanying notes to the financial statements are an integral part of this schedule. | |
|
127
| | Large Cap Index Fund-I | |
| | Schedule of Investments as of October 31, 2005(a) | |
| Shares | Common Stock (95.4%) | Value | Shares | Common Stock (95.4%) | Value |
|
| |
| Consumer Discretionary (10.3%) | | 504 | Johnson Controls, Inc. | $34,297 |
| 355 | Apollo Group, Inc.(b) | $22,372 | 354 | Jones Apparel Group, Inc. | 9,657 |
| 508 | AutoNation, Inc.(b) | 10,099 | 200 | KB Home | 13,070 |
| 152 | AutoZone, Inc.(b) | 12,297 | 101 | Knight-Ridder, Inc. | 5,391 |
| 857 | Bed Bath & Beyond, Inc.(b) | 34,726 | 958 | Kohl’s Corporation(b) | 46,109 |
| 1,141 | Best Buy Company, Inc. | 50,501 | 504 | Leggett & Platt, Inc. | 10,100 |
| 302 | Big Lots, Inc.(b) | 3,494 | 400 | Lennar Corporation | 22,232 |
| 201 | Black & Decker Corporation | 16,508 | 1,064 | Limited Brands, Inc. | 21,291 |
| 302 | Brunswick Corporation | 11,515 | 303 | Liz Claiborne, Inc. | 10,666 |
| 1,165 | Carnival Corporation | 57,866 | 2,174 | Lowe’s Companies, Inc. | 132,114 |
| 402 | Centex Corporation(c) | 25,869 | 555 | Marriott International, Inc. | 33,089 |
| 554 | Circuit City Stores, Inc. | 9,856 | 1,162 | Mattel, Inc. | 17,140 |
| 1,415 | Clear Channel | | 250 | Maytag Corporation(c) | 4,305 |
| | Communications, Inc. | 43,044 | 3,285 | McDonald’s Corporation | 103,806 |
| 1,100 | Coach, Inc.(b) | 35,398 | 1,008 | McGraw-Hill Companies, Inc. | 49,332 |
| 6,116 | Comcast Corporation(b) | 170,208 | 100 | Meredith Corporation | 4,990 |
| 251 | Cooper Tire & Rubber Company | 3,429 | 454 | New York Times Company(c) | 12,367 |
| 800 | D.R. Horton, Inc. | 24,552 | 756 | Newell Rubbermaid, Inc. | 17,380 |
| 504 | Dana Corporation(c) | 3,785 | 6,900 | News Corporation | 98,325 |
| 380 | Darden Restaurants, Inc. | 12,320 | 557 | NIKE, Inc. | 46,816 |
| 201 | Dillard’s, Inc. | 4,163 | 604 | Nordstrom, Inc. | 20,929 |
| 871 | Dollar General Corporation | 16,932 | 907 | Office Depot, Inc.(b) | 24,970 |
| 200 | Dow Jones & Company, Inc.(c) | 6,782 | 201 | OfficeMax, Inc. | 5,632 |
| 858 | Eastman Kodak Company(c) | 18,790 | 503 | Omnicom Group, Inc. | 41,729 |
| 3,032 | eBay, Inc.(b) | 120,067 | 604 | Pulte Homes, Inc. | 22,825 |
| 505 | Family Dollar Stores, Inc. | 11,181 | 403 | RadioShack Corporation(c) | 8,906 |
| 769 | Federated Department Stores, Inc. | 47,194 | 200 | Reebok International, Ltd. | 11,410 |
| 5,154 | Ford Motor Company(c) | 42,881 | 275 | Sears Holdings Corporation(b) | 33,069 |
| 454 | Fortune Brands, Inc. | 34,490 | 353 | Sherwin-Williams Company | 15,020 |
| 704 | Gannett Company, Inc. | 44,113 | 100 | Snap-On, Inc. | 3,602 |
| 1,574 | Gap, Inc. | 27,199 | 201 | Stanley Works | 9,634 |
| 1,665 | General Motors Corporation(c) | 45,621 | 2,118 | Staples, Inc. | 48,142 |
| 554 | Genuine Parts Company | 24,581 | 2,220 | Starbucks Corporation(b) | 62,782 |
| 503 | Goodyear Tire & | | 606 | Starwood Hotels & Resorts | |
| | Rubber Company(b,c) | 7,867 | | Worldwide, Inc. | 35,409 |
| 910 | H&R Block, Inc. | 22,623 | 2,428 | Target Corporation | 135,215 |
| 808 | Harley-Davidson, Inc. | 40,020 | 404 | Tiffany & Company | 15,918 |
| 502 | Harrah’s Entertainment, Inc. | 30,361 | 12,686 | Time Warner, Inc. | 226,191 |
| 404 | Hasbro, Inc. | 7,611 | 1,316 | TJX Companies, Inc. | 28,333 |
| 861 | Hilton Hotels Corporation | 16,746 | 806 | Tribune Company | 25,397 |
| 5,967 | Home Depot, Inc. | 244,886 | 706 | Univision Communications, Inc.(b) | 18,455 |
| 1,008 | International Game Technology | 26,702 | 202 | VF Corporation | 10,554 |
| 1,260 | Interpublic Group of | | 4,423 | Viacom, Inc. | 136,980 |
| | Companies, Inc.(b) | 13,016 | 429 | Visteon Corporation(c) | 3,574 |
| 756 | J.C. Penney Company, Inc. | | 5,611 | Walt Disney Company | 136,740 |
| | (Holding Company) | 38,707 | 302 | Wendy’s International, Inc. | 14,109 |
| |
| |
| The accompanying notes to the financial statements are an integral part of this schedule. | |
|
128
| Large Cap Index Fund-I | | | | |
| Schedule of Investments as of October 31, 2005(a) | | | | |
| |
| Shares | Common Stock (95.4%) | Value | Shares | Common Stock (95.4%) | Value |
|
| |
| Consumer Discretionary -- continued | | Energy (9.0%) | |
| 151 | Whirlpool Corporation | $11,854 | 151 | Amerada Hess Corporation | $18,890 |
| 859 | Yum! Brands, Inc. | 43,697 | 620 | Anadarko Petroleum Corporation | 56,240 |
|
| |
| | Total Consumer | | 846 | Apache Corporation | 54,000 |
| | Discretionary | 3,283,925 | 1,008 | Baker Hughes, Inc. | 55,400 |
|
| |
| | | | 910 | BJ Services Company | 31,622 |
| Consumer Staples (9.3%) | | 1,110 | Burlington Resources, Inc. | 80,164 |
| 201 | Alberto-Culver Company | 8,725 | 6,314 | Chevron Corporation | 360,340 |
| 959 | Albertson’s, Inc. | 24,080 | 3,824 | ConocoPhillips | 250,013 |
| 5,709 | Altria Group, Inc. | 428,460 | 1,212 | Devon Energy Corporation | 73,181 |
| 2,125 | Anheuser-Busch Companies, Inc. | 87,678 | 1,875 | El Paso Corporation(c) | 22,238 |
| 1,738 | Archer-Daniels-Midland Company | 42,355 | 606 | EOG Resources, Inc. | 41,075 |
| 1,412 | Avon Products, Inc. | 38,110 | 17,705 | Exxon Mobil Corporation | 993,953 |
| 200 | Brown-Forman Corporation | 12,668 | 1,462 | Halliburton Company | 86,404 |
| 460 | Campbell Soup Company | 13,386 | 251 | Kerr-McGee Corporation | 21,345 |
| 405 | Clorox Company | 21,919 | 253 | Kinder Morgan, Inc. | 22,998 |
| 5,823 | Coca-Cola Company | 249,108 | 1,066 | Marathon Oil Corporation | 64,131 |
| 811 | Coca-Cola Enterprises, Inc. | 15,328 | 500 | Murphy Oil Corporation | 23,425 |
| 1,365 | Colgate-Palmolive Company | 72,290 | 353 | Nabors Industries, Ltd.(b) | 24,226 |
| 1,512 | ConAgra Foods, Inc. | 35,184 | 500 | National Oilwell Varco, Inc.(b) | 31,235 |
| 600 | Constellation Brands, Inc.(b) | 14,124 | 404 | Noble Corporation | 26,010 |
| 1,361 | Costco Wholesale Corporation | 65,818 | 1,161 | Occidental Petroleum Corporation | 91,580 |
| 2,320 | CVS Corporation | 56,631 | 401 | Rowan Companies, Inc. | 13,229 |
| 1,060 | General Mills, Inc. | 51,156 | 1,715 | Schlumberger, Ltd. | 155,671 |
| 859 | H.J. Heinz Company | 30,494 | 402 | Sunoco, Inc. | 29,949 |
| 504 | Hershey Company | 28,642 | 957 | Transocean, Inc.(b) | 55,018 |
| 660 | Kellogg Company | 29,152 | 900 | Valero Energy Corporation | 94,716 |
| 1,364 | Kimberly-Clark Corporation | 77,530 | 300 | Weatherford International, Ltd.(b) | 18,780 |
| 2,072 | Kroger Company(b) | 41,233 | 1,563 | Williams Companies, Inc. | 34,855 |
| 404 | McCormick & Company, Inc. | 12,237 | 1,033 | XTO Energy, Inc. | 44,894 |
|
|
| 250 | Molson Coors Brewing Company | 15,425 | | Total Energy | 2,875,582 |
|
|
| 308 | Pepsi Bottling Group, Inc. | 8,756 | | | |
| 4,597 | PepsiCo, Inc. | 271,591 | Financials (20.1%) | |
| 9,492 | Procter & Gamble Company | 531,457 | 857 | ACE, Ltd. | 44,650 |
| 202 | Reynolds American, Inc.(c) | 17,170 | 1,263 | AFLAC, Inc. | 60,346 |
| 1,261 | Safeway, Inc. | 29,331 | 1,770 | Allstate Corporation | 93,438 |
| 2,222 | Sara Lee Corporation | 39,663 | 203 | Ambac Financial Group, Inc. | 14,391 |
| 352 | SUPERVALU, Inc. | 11,063 | 3,388 | American Express Company | 168,621 |
| 1,768 | SYSCO Corporation | 56,417 | 7,127 | American International Group, Inc. 461,830 |
| 700 | Tyson Foods, Inc. | 12,460 | 677 | Ameriprise Financial, Inc.(b) | 25,198 |
| 503 | UST, Inc. | 20,819 | 959 | AmSouth Bancorporation | 24,196 |
| 6,982 | Wal-Mart Stores, Inc. | 330,318 | 807 | Aon Corporation | 27,317 |
| 2,929 | Walgreen Company | 133,064 | 253 | Apartment Investment & | |
| 505 | William Wrigley Jr. Company | 35,098 | | Management Company | 9,715 |
|
| |
| | Total Consumer Staples | 2,968,940 | 500 | Archstone-Smith Trust | 20,285 |
|
| |
| | | | 11,134 | Bank of America Corporation | 487,001 |
| |
| |
| The accompanying notes to the financial statements are an integral part of this schedule. | |
|
129
| Large Cap Index Fund-I | | | | |
| Schedule of Investments as of October 31, 2005(a) | | | | |
| |
| Shares | Common Stock (95.4%) | Value | Shares | Common Stock (95.4%) | Value |
|
| |
| Financials -- continued | | 3,131 | Morgan Stanley | $170,358 |
| 2,272 | Bank of New York Company, Inc. | $71,091 | 1,516 | National City Corporation | 48,861 |
| 1,612 | BB&T Corporation | 68,252 | 1,357 | North Fork Bancorporation, Inc. | 34,386 |
| 252 | Bear Stearns Companies, Inc. | 26,662 | 504 | Northern Trust Corporation | 27,014 |
| 805 | Capital One Financial Corporation | 61,462 | 556 | Plum Creek Timber Company, Inc. | 21,628 |
| 2,887 | Charles Schwab Corporation | 43,882 | 855 | PNC Financial Services Group, Inc. | 51,907 |
| 553 | Chubb Corporation | 51,412 | 860 | Principal Financial Group, Inc. | 42,682 |
| 450 | Cincinnati Financial Corporation | 19,148 | 606 | Progressive Corporation | 70,181 |
| 600 | CIT Group, Inc. | 27,438 | 700 | ProLogis Trust | 30,100 |
| 14,460 | Citigroup, Inc. | 661,979 | 1,467 | Prudential Financial, Inc. | 106,783 |
| 453 | Comerica, Inc. | 26,174 | 300 | Public Storage, Inc. | 19,860 |
| 400 | Compass Bancshares, Inc. | 19,504 | 1,323 | Regions Financial Corporation | 43,064 |
| 1,706 | Countrywide Financial Corporation | 54,200 | 402 | SAFECO Corporation | 22,391 |
| 1,100 | E*TRADE Financial Corporation(b) | 20,405 | 455 | Simon Property Group, Inc. | 32,587 |
| 1,212 | Equity Office Properties Trust | 37,330 | 1,262 | SLM Corporation | 70,079 |
| 858 | Equity Residential REIT | 33,676 | 1,000 | Sovereign Bancorp, Inc. | 21,570 |
| 2,019 | Federal Home Loan | | 1,953 | St. Paul Travelers Companies, Inc. | 87,944 |
| | Mortgage Corporation | 123,866 | 1,008 | State Street Corporation | 55,672 |
| 2,728 | Federal National | | 956 | SunTrust Banks, Inc. | 69,291 |
| | Mortgage Association | 129,635 | 908 | Synovus Financial Corporation | 24,943 |
| 203 | Federated Investors, Inc. | 7,107 | 351 | T. Rowe Price Group, Inc. | 22,998 |
| 1,607 | Fifth Third Bancorp | 64,553 | 352 | Torchmark Corporation | 18,596 |
| 254 | First Horizon National Corporation | 9,825 | 5,069 | U.S. Bancorp | 149,941 |
| 455 | Franklin Resources, Inc. | 40,208 | 857 | UnumProvident Corporation(c) | 17,389 |
| 706 | Golden West Financial Corporation | 41,463 | 400 | Vornado Realty Trust | 32,400 |
| 1,213 | Goldman Sachs Group, Inc. | 153,287 | 4,391 | Wachovia Corporation | 221,833 |
| 856 | Hartford Financial Services | | 2,800 | Washington Mutual, Inc. | 110,880 |
| | Group, Inc. | 68,266 | 4,748 | Wells Fargo & Company | 285,830 |
| 726 | Huntington Bancshares, Inc. | 16,887 | 404 | XL Capital, Ltd. | 25,880 |
| 9,778 | J.P. Morgan Chase & Company | 358,070 | 152 | Zions Bancorporation | 11,167 |
|
|
| 706 | Janus Capital Group, Inc. | 12,390 | | Total Financials | 6,425,071 |
|
|
| 430 | Jefferson-Pilot Corporation | 23,598 | | | |
| 1,210 | KeyCorp | 39,010 | Health Care (12.5%) | |
| 805 | Lehman Brothers Holdings, Inc. | 96,334 | 4,196 | Abbott Laboratories | 180,638 |
| 553 | Lincoln National Corporation | 27,987 | 806 | Aetna, Inc. | 71,379 |
| 354 | Loews Corporation | 32,915 | 303 | Allergan, Inc. | 27,058 |
| 200 | M&T Bank Corporation | 21,516 | 202 | AmerisourceBergen Corporation | 15,407 |
| 1,566 | Marsh & McLennan | | 3,307 | Amgen, Inc.(b) | 250,538 |
| | Companies, Inc. | 45,649 | 454 | Applera Corporation (Applied | |
| 506 | Marshall & Ilsley Corporation | 21,738 | | Biosystems Group) | 11,019 |
| 429 | MBIA, Inc. | 24,985 | 201 | Bausch & Lomb, Inc. | 14,912 |
| 3,515 | MBNA Corporation | 89,879 | 1,769 | Baxter International, Inc. | 67,629 |
| 1,261 | Mellon Financial Corporation | 39,961 | 706 | Becton, Dickinson and Company | 35,830 |
| 2,678 | Merrill Lynch & Company, Inc. | 173,374 | 1,005 | Biogen Idec, Inc.(b) | 40,833 |
| 2,070 | MetLife, Inc. | 102,279 | 744 | Biomet, Inc. | 25,914 |
| 251 | MGIC Investment Corporation | 14,869 | 1,622 | Boston Scientific Corporation(b) | 40,745 |
| 706 | Moody’s Corporation | 37,602 | 5,456 | Bristol-Myers Squibb Company | 115,504 |
| |
| The accompanying notes to the financial statements are an integral part of this schedule. | |
|
130
| Large Cap Index Fund-I | | | | | |
| Schedule of Investments as of October 31, 2005(a) | | | | |
| |
| Shares | Common Stock (95.4%) | | Value | Shares | Common Stock (95.4%) | Value |
|
| |
| Health Care -- continued | | | Industrials (10.7%) | |
| 302 | C.R. Bard, Inc. | | $18,839 | 2,224 | 3M Company | $168,980 |
| 1,237 | Cardinal Health, Inc. | | 77,325 | 554 | Allied Waste Industries, Inc.(b,c) | 4,510 |
| 1,300 | Caremark Rx, Inc.(b) | | 68,120 | 405 | American Power | |
| 304 | Chiron Corporation(b,c) | | 13,419 | | Conversion Corporation | 8,663 |
| 404 | CIGNA Corporation | | 46,811 | 456 | American Standard Companies, Inc. | 17,346 |
| 450 | Coventry Health Care, Inc.(b) | | 24,296 | 302 | Avery Dennison Corporation | 17,108 |
| 3,183 | Eli Lilly and Company | | 158,482 | 2,274 | Boeing Company | 146,991 |
| 400 | Express Scripts, Inc.(b) | | 30,164 | 1,058 | Burlington Northern | |
| 300 | Fisher Scientific International, Inc.(b) | 16,950 | | Santa Fe Corporation | 65,659 |
| 912 | Forest Laboratories, Inc.(b) | | 34,574 | 1,918 | Caterpillar, Inc. | 100,868 |
| 706 | Genzyme Corporation(b) | | 51,044 | 3,029 | Cendant Corporation | 52,765 |
| 1,300 | Gilead Sciences, Inc.(b) | | 61,425 | 405 | Cintas Corporation | 16,431 |
| 906 | Guidant Corporation | | 57,078 | 252 | Cooper Industries, Ltd. | 17,864 |
| 1,263 | HCA, Inc. | | 60,864 | 654 | CSX Corporation | 29,960 |
| 657 | Health Management Associates, Inc. | 14,066 | 150 | Cummins, Inc. | 12,806 |
| 409 | Hospira, Inc.(b) | | 16,299 | 704 | Danaher Corporation | 36,678 |
| 454 | Humana, Inc.(b) | | 20,153 | 755 | Deere & Company | 45,813 |
| 654 | IMS Health, Inc. | | 15,192 | 554 | Dover Corporation | 21,595 |
| 8,235 | Johnson & Johnson | | 515,676 | 404 | Eaton Corporation | 23,767 |
| 673 | King Pharmaceuticals, Inc.(b) | | 10,384 | 1,261 | Emerson Electric Company | 87,703 |
| 400 | Laboratory Corporation of | | | 403 | Equifax, Inc. | 13,891 |
| | America Holdings(b) | | 19,300 | 907 | FedEx Corporation | 83,381 |
| 251 | Manor Care, Inc. | | 9,350 | 202 | Fluor Corporation | 12,847 |
| 856 | McKesson Corporation | | 38,888 | 554 | General Dynamics Corporation | 64,430 |
| 841 | Medco Health Solutions, Inc.(b) | | 47,516 | 29,250 | General Electric Company | 991,868 |
| 707 | MedImmune, Inc.(b) | | 24,731 | 301 | Goodrich Corporation | 10,857 |
| 3,334 | Medtronic, Inc. | | 188,904 | 2,324 | Honeywell International, Inc. | 79,481 |
| 6,117 | Merck & Company, Inc. | | 172,622 | 507 | Illinois Tool Works, Inc. | 42,973 |
| 150 | Millipore Corporation(b) | | 9,183 | 1,008 | Ingersoll-Rand Company | 38,092 |
| 600 | Mylan Laboratories, Inc. | | 11,526 | 252 | ITT Industries, Inc. | 25,603 |
| 400 | Patterson Companies, Inc.(b,c) | | 16,552 | 300 | L-3 Communications Holdings, Inc. | 23,346 |
| 352 | PerkinElmer, Inc. | | 7,769 | 1,062 | Lockheed Martin Corporation | 64,315 |
| 20,781 | Pfizer, Inc. | | 451,779 | 1,261 | Masco Corporation | 35,938 |
| 406 | Quest Diagnostics, Inc. | | 18,964 | 301 | Monster Worldwide, Inc.(b) | 9,876 |
| 4,143 | Schering-Plough Corporation | | 84,269 | 150 | Navistar International | |
| 1,012 | St. Jude Medical, Inc.(b) | | 48,647 | | Corporation(b) | 4,128 |
| 808 | Stryker Corporation | | 33,185 | 1,110 | Norfolk Southern Corporation | 44,622 |
| 1,390 | Tenet Healthcare Corporation(b) | | 11,704 | 1,046 | Northrop Grumman Corporation | 56,118 |
| 454 | Thermo Electron Corporation(b) | | 13,706 | 543 | PACCAR, Inc. | 38,021 |
| 3,432 | UnitedHealth Group, Inc. | | 198,678 | 251 | Pall Corporation | 6,566 |
| 354 | Waters Corporation(b) | | 12,815 | 352 | Parker-Hannifin Corporation | 22,063 |
| 301 | Watson Pharmaceuticals, Inc.(b) | | 10,403 | 655 | Pitney Bowes, Inc. | 27,562 |
| 1,720 | WellPoint, Inc.(b) | | 128,450 | 601 | R.R. Donnelley & Sons Company | 21,047 |
| 3,739 | Wyeth | | 166,610 | 1,259 | Raytheon Company | 46,520 |
| 739 | Zimmer Holdings, Inc.(b) | | 47,126 | 405 | Robert Half International, Inc. | 14,936 |
|
| |
| | Total Health Care | 3,981,244 | 454 | Rockwell Automation, Inc. | 24,130 |
|
| |
| |
| The accompanying notes to the financial statements are an integral part of this schedule. | |
|
131
| Large Cap Index Fund-I | | | | |
| Schedule of Investments as of October 31, 2005(a) | | | | |
| |
| Shares | Common Stock (95.4%) | Value | Shares | Common Stock (95.4%) | Value |
|
| |
| Industrials -- continued | | 580 | Fiserv, Inc.(b) | $25,334 |
| 554 | Rockwell Collins, Inc. | $25,384 | 1,123 | Freescale Semiconductor, Inc.(b) | 26,817 |
| 200 | Ryder System, Inc. | 7,934 | 757 | Gateway, Inc.(b,c) | 2,157 |
| 1,995 | Southwest Airlines Company | 31,940 | 7,807 | Hewlett-Packard Company | 218,908 |
| 402 | Textron, Inc. | 28,960 | 16,949 | Intel Corporation | 398,302 |
| 5,561 | Tyco International, Ltd. | 146,755 | 4,448 | International Business | |
| 756 | Union Pacific Corporation | 52,300 | | Machines Corporation | 364,202 |
| 3,084 | United Parcel Service, Inc. | 224,947 | 555 | Intuit, Inc.(b) | 25,491 |
| 2,822 | United Technologies Corporation | 144,712 | 505 | Jabil Circuit, Inc.(b) | 15,074 |
| 252 | W.W. Grainger, Inc. | 16,879 | 4,741 | JDS Uniphase Corporation(b,c) | 9,956 |
| 1,664 | Waste Management, Inc. | 49,105 | 604 | KLA-Tencor Corporation | 27,959 |
|
| |
| | Total Industrials | 3,407,034 | 351 | Lexmark International, Inc.(b) | 14,574 |
|
| |
| | | | 857 | Linear Technology Corporation | 28,461 |
| Information Technology (14.5%) | | 1,108 | LSI Logic Corporation(b) | 8,986 |
| 238 | ADC Telecommunications, Inc.(b,c) | 4,153 | 12,516 | Lucent Technologies, Inc.(b,c) | 35,671 |
| 1,310 | Adobe Systems, Inc. | 42,248 | 959 | Maxim Integrated Products, Inc. | 33,258 |
| 1,107 | Advanced Micro Devices, Inc.(b) | 25,705 | 201 | Mercury Interactive Corporation(b) | 6,993 |
| 300 | Affiliated Computer Services, Inc.(b) | 16,233 | 1,766 | Micron Technology, Inc.(b,c) | 22,940 |
| 1,351 | Agilent Technologies, Inc.(b) | 43,246 | 25,725 | Microsoft Corporation | 661,132 |
| 1,059 | Altera Corporation(b) | 17,632 | 467 | Molex, Inc. | 11,820 |
| 1,010 | Analog Devices, Inc. | 35,128 | 6,951 | Motorola, Inc. | 154,034 |
| 451 | Andrew Corporation(b) | 4,790 | 1,008 | National Semiconductor | |
| 2,220 | Apple Computer, Inc.(b) | 127,850 | | Corporation | 22,811 |
| 4,402 | Applied Materials, Inc. | 72,105 | 502 | NCR Corporation(b) | 15,170 |
| 858 | Applied Micro Circuits | | 1,008 | Network Appliance, Inc.(b) | 27,579 |
| | Corporation(b) | 2,094 | 1,109 | Novell, Inc.(b,c) | 8,451 |
| 604 | Autodesk, Inc. | 27,259 | 453 | Novellus Systems, Inc.(b) | 9,903 |
| 1,565 | Automatic Data Processing, Inc. | 73,023 | 455 | NVIDIA Corporation(b) | 15,265 |
| 1,218 | Avaya, Inc.(b) | 14,031 | 10,557 | Oracle Corporation(b) | 133,863 |
| 607 | BMC Software, Inc.(b) | 11,891 | 806 | Parametric Technology | |
| 755 | Broadcom Corporation(b) | 32,057 | | Corporation(b) | 5,247 |
| 1,660 | CIENA Corporation(b) | 3,934 | 985 | Paychex, Inc. | 38,179 |
| 17,614 | Cisco Systems, Inc.(b) | 307,364 | 504 | PMC-Sierra, Inc.(b) | 3,578 |
| 503 | Citrix Systems, Inc.(b) | 13,868 | 251 | QLogic Corporation(b) | 7,570 |
| 1,365 | Computer Associates | | 4,442 | QUALCOMM, Inc. | 176,614 |
| | International, Inc. | 38,179 | 389 | Sabre Holdings Corporation | 7,597 |
| 504 | Computer Sciences Corporation(b) | 25,830 | 1,513 | Sanmina-SCI Corporation(b) | 5,522 |
| 1,159 | Compuware Corporation(b) | 9,376 | 453 | Scientific-Atlanta, Inc. | 16,054 |
| 554 | Comverse Technology, Inc.(b) | 13,905 | 1,462 | Siebel Systems, Inc. | 15,132 |
| 304 | Convergys Corporation(b) | 4,940 | 2,772 | Solectron Corporation(b) | 9,785 |
| 4,333 | Corning, Inc.(b) | 87,050 | 9,796 | Sun Microsystems, Inc.(b) | 39,184 |
| 6,676 | Dell, Inc.(b) | 212,831 | 3,336 | Symantec Corporation(b) | 79,564 |
| 908 | Electronic Arts, Inc.(b) | 51,647 | 586 | Symbol Technologies, Inc. | 4,864 |
| 1,512 | Electronic Data Systems | | 301 | Tektronix, Inc. | 6,917 |
| | Corporation | 35,245 | 1,160 | Tellabs, Inc.(b) | 11,090 |
| 6,815 | EMC Corporation(b) | 95,137 | 554 | Teradyne, Inc.(b) | 7,501 |
| 2,165 | First Data Corporation | 87,574 | 4,598 | Texas Instruments, Inc. | 131,273 |
| |
| The accompanying notes to the financial statements are an integral part of this schedule. | |
|
132
| Large Cap Index Fund-I | | | | |
| Schedule of Investments as of October 31, 2005(a) | | | | |
| |
| Shares | Common Stock (95.4%) | Value | Shares | Common Stock (95.4%) | Value |
|
| |
| Information Technology -- continued | | Telecommunications Services (2.9%) | |
| 957 | Unisys Corporation(b) | $4,890 | 1,057 | ALLTEL Corporation | $65,386 |
| 2,571 | Xerox Corporation(b) | 34,888 | 2,087 | AT&T Corporation | 41,281 |
| 1,006 | Xilinx, Inc. | 24,094 | 5,054 | BellSouth Corporation | 131,505 |
| 3,428 | Yahoo!, Inc.(b) | 126,733 | 404 | CenturyTel, Inc. | 13,223 |
|
| |
| | Total Information | | 1,007 | Citizens Communications | |
| | Technology | 4,617,712 | | Company | 12,326 |
|
| |
| | | | 4,236 | Qwest Communications | |
| Materials (2.9%) | | | International, Inc.(b,c) | 18,469 |
| 556 | Air Products and Chemicals, Inc. | 31,825 | 9,198 | SBC Communications, Inc. | 219,372 |
| 2,386 | Alcoa, Inc. | 57,956 | 8,141 | Sprint Nextel Corporation | 189,767 |
| 151 | Allegheny Technologies, Inc. | 4,335 | 7,674 | Verizon Communications, Inc. | 241,808 |
|
|
| 151 | Ashland, Inc. | 8,080 | | Total Telecommunications | |
| 302 | Ball Corporation | 11,890 | | Services | 933,137 |
|
|
| 202 | Bemis Company, Inc. | 5,337 | | | |
| 2,718 | Dow Chemical Company | 124,647 | Utilities (3.2%) | |
| 2,829 | E.I. du Pont de Nemours | | 1,664 | AES Corporation(b) | 26,441 |
| | and Company | 117,941 | 452 | Allegheny Energy, Inc.(b,c) | 12,774 |
| 201 | Eastman Chemical Company | 10,605 | 503 | Ameren Corporation | 26,458 |
| 504 | Ecolab, Inc. | 16,672 | 1,029 | American Electric Power | |
| 352 | Engelhard Corporation | 9,574 | | Company, Inc. | 39,061 |
| 503 | Freeport-McMoRan Copper & | | 1,559 | Calpine Corporation(b,c) | 3,710 |
| | Gold, Inc. | 24,858 | 806 | CenterPoint Energy, Inc.(c) | 10,671 |
| 708 | Georgia-Pacific Corporation | 23,031 | 603 | Cinergy Corporation | 24,060 |
| 352 | Hercules, Inc.(b) | 3,921 | 602 | CMS Energy Corporation(b) | 8,976 |
| 251 | International Flavors & | | 657 | Consolidated Edison, Inc.(c) | 29,894 |
| | Fragrances, Inc. | 8,280 | 503 | Constellation Energy Group, Inc. | 27,564 |
| 1,419 | International Paper Company | 41,406 | 929 | Dominion Resources, Inc. | 70,678 |
| 351 | Louisiana-Pacific Corporation | 8,750 | 403 | DTE Energy Company | 17,410 |
| 596 | MeadWestvaco Corporation | 15,627 | 2,524 | Duke Energy Corporation | 66,836 |
| 823 | Monsanto Company | 51,857 | 809 | Dynegy, Inc.(b,c) | 3,592 |
| 1,260 | Newmont Mining Corporation | 53,676 | 958 | Edison International, Inc. | 41,922 |
| 502 | Nucor Corporation | 30,045 | 606 | Entergy Corporation | 42,856 |
| 454 | Pactiv Corporation(b) | 8,944 | 1,764 | Exelon Corporation | 91,781 |
| 301 | Phelps Dodge Corporation | 36,261 | 958 | FirstEnergy Corporation | 45,505 |
| 504 | PPG Industries, Inc. | 30,225 | 1,106 | FPL Group, Inc. | 47,624 |
| 908 | Praxair, Inc. | 44,864 | 454 | KeySpan Corporation | 15,695 |
| 506 | Rohm and Haas Company | 22,026 | 150 | Nicor, Inc.(c) | 5,880 |
| 201 | Sealed Air Corporation(b) | 10,112 | 675 | NiSource, Inc. | 15,964 |
| 251 | Sigma-Aldrich Corporation | 15,989 | 150 | Peoples Energy Corporation | 5,580 |
| 402 | Temple-Inland, Inc. | 14,806 | 1,060 | PG&E Corporation | 38,563 |
| 351 | United States Steel Corporation | 12,822 | 201 | Pinnacle West Capital Corporation | 8,394 |
| 251 | Vulcan Materials Company | 16,315 | 1,006 | PPL Corporation | 31,528 |
| 705 | Weyerhaeuser Company | 44,655 | 682 | Progress Energy, Inc. | 29,728 |
|
| |
| | Total Materials | 917,332 | | | |
|
| |
| |
| |
| |
| The accompanying notes to the financial statements are an integral part of this schedule. | |
|
133
| Large Cap Index Fund-I | | | | | |
| Schedule of Investments as of October 31, 2005(a) | | | | |
| |
| Shares | Common Stock (95.4%) | Value | Shares | Common Stock (95.4%) | Value |
|
| |
| Utilities -- continued | | 657 | TXU Corporation | | $66,193 |
| 706 | Public Service Enterprise | | 1,114 | Xcel Energy, Inc. | | 20,420 |
|
|
| | Group, Inc. | $44,400 | | Total Utilities | | 1,028,731 |
|
|
| 659 | Sempra Energy | 29,194 | | | | |
|
|
| 1,970 | Southern Company | 68,930 | | Total Common Stock | |
| 604 | TECO Energy, Inc. | 10,449 | | (cost $29,435,973) | 30,438,708 |
|
|
| |
| |
| | | | | Interest | Maturity | |
| Shares | Collateral Held for Securities Loaned (1.4%) | | Rate(d) | Date | Value |
|
| 438,476 | Thrivent Financial Securities Lending Trust | | 3.950% | N/A | $438,476 |
| |
|
| | | Total Collateral Held for Securities Loaned | |
| | | (cost $438,476) | | | | 438,476 |
|
|
| |
| |
| | | | | Interest | Maturity | |
| Shares | Short-Term Investments (3.2%) | | Rate(d) | Date | Value |
|
| 1,012,152 | Thrivent Money Market Fund(e) | | | 3.600% | N/A | $1,012,152 |
|
|
| | | Total Short-Term Investments (at amortized cost) | 1,012,152 |
|
|
| | | Total Investments (cost $30,886,601) | | $31,889,336 |
|
|
| (a) | The categories of investments are shown as a percentage of total investments. |
| |
| (b) | Non-income producing security. |
| |
| (c) | All or a portion of the security is on loan as discussed in item 2(L) of the Notes to Financial Statements. |
| |
| (d) | The interest rate shown reflects the yield, coupon rate or, for securities purchased at a discount, the discount rate at the date of purchase. |
| |
| (e) | At October 31, 2005, $50,400 in cash was pledged as the initial margin deposit for open financial contacts. In addition, $1,012,152 of Short-Term Investments were earmarked as collateral to cover open financial futures contract as follows: |
| |
| | | | | | Notional | |
| | Number of | Expiration | | | Principal | Unrealized |
| Type | Contracts | Date | Position | Value | Amount | Loss |
|
| S&P 500 Mini Futures | 17 | December 2005 | Long | $1,028,330 | $1,030,143 | $1,813 |
The accompanying notes to the financial statements are an integral part of this schedule. | |
|
|
134
| | Balanced Fund | | |
| | Schedule of Investments as of October 31, 2005(a) | |
| Shares | Common Stock (55.0%) | Value | Shares | Common Stock (55.0%) | Value |
|
| |
| Consumer Discretionary (6.9%) | | 6,200 | Dean Foods Company(b) | $224,130 |
| 20,450 | Aeropostale, Inc.(b,c) | $399,593 | 11,500 | Del Monte Foods Company(b) | 121,670 |
| 23,700 | Best Buy Company, Inc. | 1,048,962 | 2,100 | Diageo plc(d) | 124,803 |
| 24,000 | Brunswick Corporation | 915,120 | 4,000 | Energizer Holdings, Inc.(b) | 201,960 |
| 32,000 | Carnival Corporation | 1,589,440 | 9,900 | Estee Lauder Companies, Inc. | 328,383 |
| 17,000 | Cheesecake Factory, Inc.(b,c) | 583,440 | 200 | Flowers Foods, Inc. | 5,860 |
| 19,300 | Children’s Place Retail | | 12,300 | General Mills, Inc. | 593,598 |
| | Stores, Inc.(b,d) | 828,549 | 6,500 | H.J. Heinz Company | 230,750 |
| 20,200 | DSW, Inc.(b,d) | 420,564 | 6,100 | Hershey Company | 346,663 |
| 29,400 | eBay, Inc.(b) | 1,164,240 | 1,600 | Hormel Foods Corporation | 50,880 |
| 7,300 | Fortune Brands, Inc. | 554,581 | 5,200 | J.M. Smucker Company | 237,692 |
| 11,900 | GameStop Corporation(b,d) | 422,212 | 5,300 | Kellogg Company | 234,101 |
| 34,400 | Gaylord Entertainment | | 5,500 | Kimberly-Clark Corporation | 312,620 |
| | Company(b,d) | 1,358,112 | 8,500 | Kraft Foods, Inc.(d) | 240,550 |
| 13,000 | Getty Images, Inc.(b) | 1,079,130 | 3,300 | Loews Corporation – | |
| 25,950 | Golf Galaxy, Inc.(b,d) | 400,928 | | Carolina Group(c) | 135,795 |
| 32,000 | Harrah’s Entertainment, Inc. | 1,935,360 | 10,700 | McCormick & Company, Inc. | 324,103 |
| 59,000 | Home Depot, Inc. | 2,421,360 | 400 | Molson Coors Brewing Company(d) | 24,680 |
| 29,900 | Kohl’s Corporation(b,c) | 1,439,087 | 17,800 | Pepsi Bottling Group, Inc. | 506,054 |
| 31,300 | Nordstrom, Inc.(e) | 1,084,545 | 28,600 | PepsiCo, Inc.(c,e) | 1,689,688 |
| 25,400 | PETsMART, Inc. | 596,900 | 3,800 | Pilgrim’s Pride Corporation | 119,624 |
| 32,000 | Pixar, Inc.(b) | 1,623,360 | 56,012 | Procter & Gamble Company | 3,136,112 |
| 46,500 | Shuffle Master, Inc.(b,d) | 1,179,240 | 2,400 | Reynolds American, Inc.(d) | 204,000 |
| 27,800 | Sonic Corporation(b) | 804,532 | 17,700 | Sara Lee Corporation | 315,945 |
| 54,600 | Staples, Inc. | 1,241,058 | 1,120 | TreeHouse Foods, Inc(b) | 28,941 |
| 54,800 | Starbucks Corporation(b) | 1,549,744 | 7,300 | Tyson Foods, Inc. | 129,940 |
| 34,200 | Target Corporation | 1,904,598 | 9,600 | Unilever plc ADR | 389,760 |
| 122,100 | Time Warner, Inc. | 2,177,043 | 5,300 | UST, Inc. | 219,367 |
| 41,600 | ValueVision Media, Inc.(b,d) | 408,512 | 42,600 | Wal-Mart Stores, Inc. | 2,015,406 |
| 123,100 | Walt Disney Company(e) | 2,999,947 | 7,100 | William Wrigley Jr. Company | 493,450 |
|
|
| 18,000 | Warnaco Group, Inc.(b,d) | 408,240 | | Total Consumer Staples | 20,540,066 |
|
| |
|
| | Total Consumer | | | | |
| | Discretionary | 32,538,397 | Energy (5.6%) | |
|
| |
| | | | 12,800 | BP plc | 849,920 |
| Consumer Staples (4.4%) | | 33,900 | Chevron Corporation(e) | 1,934,673 |
| 5,600 | Alberto-Culver Company(c) | 243,096 | 21,900 | Comstock Resources, Inc.(b) | 659,409 |
| 27,600 | Altria Group, Inc.(c,e) | 2,071,380 | 32,900 | ConocoPhillips | 2,151,002 |
| 9,400 | Anheuser-Busch Companies, Inc. | 387,844 | 17,200 | Dril-Quip, Inc.(b,d) | 703,480 |
| 22,200 | Archer-Daniels-Midland Company | 541,014 | 32,300 | ENSCO International, Inc. | 1,472,557 |
| 10,800 | Avon Products, Inc.(e) | 291,492 | 57,686 | Exxon Mobil Corporation | 3,238,492 |
| 3,100 | Cadbury Schweppes plc | 123,039 | 28,600 | Nabors Industries, Ltd.(b) | 1,962,818 |
| 4,200 | Campbell Soup Company | 122,220 | 18,900 | National Oilwell Varco, Inc.(b) | 1,180,683 |
| 6,500 | Clorox Company | 351,780 | 14,200 | Noble Corporation | 914,196 |
| 27,900 | Coca-Cola Company | 1,193,562 | 56,400 | Patterson-UTI Energy, Inc. | 1,924,932 |
| 12,400 | Colgate-Palmolive Company | 656,704 | 13,100 | Peabody Energy Corporation(e) | 1,023,896 |
| 9,100 | Constellation Brands, Inc.(b) | 214,214 | 34,000 | Pioneer Drilling Company(b,d) | 582,420 |
| 55,600 | CVS Corporation(c) | 1,357,196 | 25,900 | Range Resources Corporation | 924,371 |
| |
| The accompanying notes to the financial statements are an integral part of this schedule. | |
|
135
| Balanced Fund | | | | | | |
| Schedule of Investments as of October 31, 2005(a) | | | | | |
| |
| Shares | Common Stock (55.0%) | | Value | Shares | Common Stock (55.0%) | | Value |
|
| |
| Energy -- continued | | | 28,500 | Investors Financial | | |
| 16,500 | Smith International, Inc. | | $534,600 | | Services Corporation(d) | | $1,088,130 |
| 31,700 | Todco(c) | | 1,418,575 | 26,850 | James River Group, Inc.(b) | | 507,465 |
| 13,800 | Transocean, Inc.(b) | | 793,362 | 400 | Kilroy Realty Corporation | | 22,460 |
| 13,000 | Valero Energy Corporation | | 1,368,120 | 2,800 | Mack-Cali Realty Corporation | | 119,420 |
| 17,600 | Weatherford International, Ltd.(b) | 1,101,760 | 12,379 | Mercantile Bank Corporation(d) | 472,249 |
| 37,100 | XTO Energy, Inc. | | 1,612,366 | 32,600 | Merrill Lynch & Company, Inc. | 2,110,524 |
|
| |
| | Total Energy | | 26,351,632 | 2,500 | Mills Corporation(d) | | 133,750 |
|
| |
| | | | | 3,200 | New Century Financial | | |
| Financials (11.2%) | | | | Corporation(d) | | 98,784 |
| 19,950 | Affiliated Managers Group, Inc.(b,d) | 1,531,162 | 5,400 | New Plan Excel Realty Trust, Inc.(d) | 124,146 |
| 2,700 | AMB Property Corporation | | 119,286 | 44,300 | North Fork Bancorporation, Inc.(c,e) | 1,122,562 |
| 39,400 | American Capital Strategies, Ltd.(c) | 1,479,864 | 42,100 | Odyssey Re Holdings | | |
| 8,300 | American Financial Realty Trust | 102,173 | | Corporation(d) | | 1,081,128 |
| 77,462 | American International | | | 100 | Parkway Properties, Inc. | | 4,701 |
| | Group, Inc.(c) | | 5,019,537 | 17,600 | Pinnacle Financial Partners, Inc.(b,d) | 398,288 |
| 23,100 | AmeriCredit Corporation(b) | | 516,285 | 3,700 | Plum Creek Timber Company, Inc. | 143,930 |
| 3,000 | Apartment Investment & | | | 17,300 | PNC Financial Services Group, Inc. | 1,050,283 |
| | Management Company | | 115,200 | 3,700 | ProLogis Trust | | 159,100 |
| 3,100 | Archstone-Smith Trust | | 125,767 | 2,000 | Public Storage, Inc. | | 132,400 |
| 96,600 | Bank of America Corporation | | 4,225,284 | 3,600 | Rayonier, Inc. REIT | | 137,628 |
| 15,700 | Bear Stearns Companies, Inc.(c) | 1,661,060 | 2,300 | Shurgard Storage Centers, Inc. | | 129,789 |
| 900 | Capital Automotive REIT | | 34,758 | 1,400 | Simon Property Group, Inc. | | 100,268 |
| 29,600 | Capital One Financial | | | 100 | Sovran Self Storage, Inc. | | 4,653 |
| | Corporation(c) | | 2,259,960 | 5,700 | United Dominion Realty Trust, Inc. 126,141 |
| 60,600 | CapitalSource, Inc.(b,d) | | 1,333,200 | 28,000 | Vineyard National | | |
| 56,300 | Cardinal Financial Corporation(d) | 569,193 | | Bancorp Company(d) | | 819,840 |
| 48,700 | Center Financial Corporation(e) | 1,234,058 | 3,100 | Weingarten Realty Investors | | 110,236 |
| 33,500 | CIT Group, Inc. | | 1,531,955 | 44,400 | Wells Fargo & Company(e) | | 2,672,880 |
| 78,945 | Citigroup, Inc. | | 3,614,102 | 24,300 | Willis Group Holdings, Ltd. | | 902,502 |
| 18,700 | City National Corporation | | 1,372,206 | 9,500 | Wintrust Financial Corporation | 509,960 |
| 2,100 | Developers Diversified | | | 16,900 | Zions Bancorporation | | 1,241,643 |
|
|
| | Realty Corporation | | 91,728 | | Total Financials | | 52,680,205 |
|
|
| 400 | Entertainment Properties Trust | 16,040 | | | | |
| 4,100 | Equity Office Properties Trust | | 126,280 | Health Care (7.3%) | | |
| 5,500 | Equity Residential REIT | | 215,875 | 77,900 | Abgenix, Inc.(b,d) | | 810,160 |
| 1,400 | Essex Property Trust, Inc. | | 125,832 | 7,300 | Aetna, Inc. | | 646,488 |
| 11,300 | Everest Re Group, Ltd. | | 1,123,785 | 3,000 | Amedisys, Inc.(b,d) | | 114,630 |
| 500 | Glenborough Realty Trust, Inc.(d) | 9,565 | 2,200 | AmerisourceBergen Corporation | 167,794 |
| 15,200 | Golden West Financial Corporation | 892,696 | 6,400 | Cardinal Health, Inc. | | 400,064 |
| 23,200 | Goldman Sachs Group, Inc. | | 2,931,784 | 8,900 | Caremark Rx, Inc.(b,c) | | 466,360 |
| 26,100 | Greenhill & Company, Inc.(d) | | 1,251,495 | 3,400 | CIGNA Corporation | | 393,958 |
| 15,300 | Hartford Financial | | | 3,700 | Covance, Inc.(b) | | 180,005 |
| | Services Group, Inc. | | 1,220,175 | 30,800 | Cyberonics, Inc.(b) | | 924,616 |
| 72,600 | HCC Insurance Holdings, Inc. | | 2,178,000 | 33,000 | Dexcom, Inc.(b,d) | | 429,330 |
| 3,200 | Hospitality Properties Trust | | 127,040 | 43,100 | Endo Pharmaceutical | | |
| | | | | | Holdings, Inc.(b) | | 1,160,252 |
| |
| The accompanying notes to the financial statements are an integral part of this schedule. | | |
|
136
| Balanced Fund | | | | |
| Schedule of Investments as of October 31, 2005(a) | | | |
| |
| Shares | Common Stock (55.0%) | Value | Shares | Common Stock (55.0%) | Value |
|
| |
| Health Care -- continued | | 30,200 | Korn/Ferry International(b) | $520,044 |
| 3,800 | Express Scripts, Inc.(b) | $286,558 | 18,100 | Labor Ready, Inc.(b) | 422,635 |
| 46,000 | Forest Laboratories, Inc.(b) | 1,743,860 | 13,000 | Landstar System, Inc. | 500,760 |
| 9,700 | Gen-Probe, Inc.(b) | 396,148 | 13,800 | Lockheed Martin Corporation | 835,728 |
| 42,400 | Gilead Sciences, Inc.(b) | 2,003,400 | 17,100 | Manitowoc Company, Inc. | 909,891 |
| 3,200 | Henry Schein, Inc.(b) | 126,848 | 14,800 | Norfolk Southern Corporation | 594,960 |
| 8,100 | Humana, Inc.(b) | 359,559 | 21,000 | Oshkosh Truck Corporation | 914,760 |
| 79,200 | Johnson & Johnson(c) | 4,959,504 | 21,100 | Pall Corporation | 551,976 |
| 8,278 | Medco Health Solutions, Inc.(b) | 467,707 | 13,300 | Resources Global | |
| 30,700 | Medtronic, Inc. | 1,739,462 | | Professionals(b,d) | 379,715 |
| 25,500 | MGI Pharma, Inc.(b,d) | 478,380 | 18,900 | Robert Half International, Inc. | 697,032 |
| 66,500 | NeoPharm, Inc.(b,d) | 639,065 | 18,500 | Rockwell Automation, Inc. | 983,275 |
| 15,300 | Neurocrine Biosciences, Inc.(b,d) | 808,146 | 16,400 | Roper Industries, Inc. | 618,280 |
| 7,800 | PacifiCare Health Systems, Inc.(b) | 642,408 | 67,400 | Tyco International, Ltd. | 1,778,686 |
| 2,700 | Patterson Companies, Inc.(b,d) | 111,726 | 36,300 | United Technologies Corporation | 1,861,464 |
| 132,625 | Pfizer, Inc.(c,e) | 2,883,268 | 26,700 | URS Corporation(b) | 1,079,481 |
| 4,400 | Psychiatric Solutions, Inc.(b,d) | 240,680 | 6,400 | UTI Worldwide, Inc.(d) | 547,456 |
|
|
| 6,500 | Quest Diagnostics, Inc. | 303,615 | | Total Industrials | 30,260,332 |
|
|
| 6,000 | Renal Care Group, Inc.(b) | 281,100 | | | |
| 31,400 | St. Jude Medical, Inc.(b) | 1,509,398 | Information Technology (8.9%) | |
| 30,100 | Tanox, Inc.(b,d) | 420,196 | 26,900 | Advanced Micro Devices, Inc.(b) | 624,618 |
| 58,200 | Teva Pharmaceutical | | 38,400 | Altera Corporation(b) | 639,360 |
| | Industries, Ltd.(d) | 2,218,584 | 18,500 | Analog Devices, Inc. | 643,430 |
| 42,100 | UnitedHealth Group, Inc. | 2,437,169 | 9,300 | Anteon International | |
| 17,900 | WellPoint, Inc.(b) | 1,336,772 | | Corporation(b,e) | 420,360 |
| 37,200 | Zimmer Holdings, Inc.(b) | 2,372,244 | 53,700 | Apple Computer, Inc.(b,c) | 3,092,583 |
|
| |
| | Total Health Care | 34,459,454 | 57,400 | Applied Materials, Inc.(c) | 940,212 |
|
| |
| | | | 72,600 | Avaya, Inc.(b) | 836,352 |
| Industrials (6.4%) | | 6,500 | CACI International, Inc.(b) | 354,510 |
| 26,000 | Adesa, Inc.(c) | 556,400 | 175,600 | Carrier Access Corporation(b,d) | 756,836 |
| 34,600 | AirTran Holdings, Inc.(b,d) | 517,616 | 21,100 | Check Point Software | |
| 18,100 | Burlington Northern | | | Technologies, Ltd.(b) | 471,796 |
| | Santa Fe Corporation | 1,123,286 | 165,000 | Cisco Systems, Inc.(b,c) | 2,879,250 |
| 17,600 | C.H. Robinson Worldwide, Inc. | 620,576 | 22,400 | Citrix Systems, Inc.(b,c) | 617,568 |
| 13,500 | Deere & Company | 819,180 | 9,000 | Cognizant Technology | |
| 18,900 | Emerson Electric Company | 1,314,495 | | Solutions Corporation(b) | 395,820 |
| 13,700 | Fastenal Company(d) | 960,781 | 36,200 | Comverse Technology, Inc.(b,c) | 908,620 |
| 124,000 | General Electric Company | 4,204,834 | 600 | Cypress Semiconductor | |
| 15,400 | Genlyte Group, Inc.(b) | 784,938 | | Corporation(b,d) | 8,160 |
| 17,600 | Graco, Inc. | 603,152 | 69,800 | Dell, Inc.(b) | 2,225,224 |
| 13,800 | Herman Miller, Inc. | 378,258 | 62,600 | Embarcadero Technologies, Inc.(b) | 487,028 |
| 20,800 | Honeywell International, Inc. | 711,360 | 86,900 | EMC Corporation(b) | 1,213,124 |
| 14,600 | Hub Group, Inc.(b) | 531,002 | 33,700 | First Data Corporation | 1,363,165 |
| 18,400 | Illinois Tool Works, Inc. | 1,559,584 | 69,200 | Flextronics International, Ltd.(b) | 642,868 |
| 24,900 | Ingersoll-Rand Company | 940,971 | 11,000 | Hyperion Solutions Corporation(b) | 531,960 |
| 14,600 | Jacobs Engineering Group, Inc.(b) | 930,750 | 37,100 | Informatica Corporation(b,d) | 441,490 |
| 68,700 | Jacuzzi Brands, Inc.(b,d) | 507,006 | 7,900 | Infosys Technologies, Ltd. ADR | 537,200 |
| |
| The accompanying notes to the financial statements are an integral part of this schedule. | |
|
137
| Balanced Fund | | | | |
| Schedule of Investments as of October 31, 2005(a) | | | |
| |
| Shares | Common Stock (55.0%) | Value | Shares | Common Stock (55.0%) | Value |
|
| |
| Information Technology -- continued | | 35,300 | Freeport-McMoRan Copper & | |
| 41,800 | Integrated Device | | | Gold, Inc. | $1,744,526 |
| | Technology, Inc.(b) | $412,984 | 31,800 | Georgia-Pacific Corporation | 1,034,454 |
| 144,700 | Intel Corporation | 3,400,450 | 30,000 | Praxair, Inc. | 1,482,300 |
| 31,600 | Inter-Tel, Inc.(d) | 584,916 | 19,800 | Silgan Holdings, Inc. | 636,966 |
|
|
| 22,600 | International Business | | | Total Materials | 7,760,296 |
|
|
| | Machines Corporation(c) | 1,850,488 | | | |
| 18,900 | Manhattan Associates, Inc.(b) | 419,769 | Telecommunications Services (0.6%) | |
| 64,700 | Micromuse, Inc.(b) | 463,899 | 25,000 | Nextel Partners, Inc.(b) | 628,750 |
| 110,500 | Microsoft Corporation(c) | 2,839,850 | 72,549 | Sprint Nextel Corporation | 1,691,117 |
| 194,400 | NMS Communications | | 51,450 | Valor Communications | |
| | Corporation(b,d) | 680,400 | | Group, Inc.(d) | 654,958 |
|
|
| 90,200 | Nokia Oyj ADR | 1,517,164 | | Total Telecommunications | |
| 66,900 | Novell, Inc.(b,d) | 509,778 | | Services | 2,974,825 |
|
|
| 13,100 | Progress Software Corporation(b) | 407,934 | | | |
| 32,400 | QUALCOMM, Inc.(e) | 1,288,224 | Utilities (2.1%) | |
| 59,600 | Sapient Corporation(b) | 309,324 | 21,600 | Dominion Resources, Inc. | 1,643,328 |
| 18,200 | Scientific-Atlanta, Inc. | 645,008 | 22,100 | Entergy Corporation | 1,562,912 |
| 42,500 | Stellent, Inc.(b,d) | 389,725 | 33,300 | Exelon Corporation | 1,732,599 |
| 76,900 | Tellabs, Inc.(b) | 735,164 | 64,700 | PPL Corporation | 2,027,698 |
| 65,200 | Texas Instruments, Inc. | 1,861,460 | 12,700 | TXU Corporation | 1,279,525 |
| 119,600 | TIBCO Software, Inc.(b) | 907,764 | 36,600 | Wisconsin Energy Corporation(c) | 1,384,578 |
|
|
| 22,200 | VeriSign, Inc.(b) | 524,586 | | Total Utilities | 9,630,640 |
|
|
| 120,900 | Vitria Technology, Inc.(b,d) | 356,655 | | | |
|
|
| 48,600 | webMethods, Inc.(b,d) | 338,256 | | Total Common Stock | |
| 30,200 | Wind River Systems, Inc.(b) | 395,620 | | (cost $242,821,036) | 259,066,799 |
|
| |
|
| | Total Information | | | | |
| | Technology | 41,870,952 | | | |
|
| |
| | | | Shares | Preferred Stock (0.1%) | Value |
|
|
| Materials (1.6%) | | 4 | Federal National Mortgage | |
| 24,700 | Dow Chemical Company | 1,132,742 | | Association, Convertible | $364,581 |
|
|
| 16,800 | E.I. du Pont de Nemours | | | Total Financials | 364,581 |
|
|
| | and Company | 700,392 | | | |
|
|
| 18,900 | FMC Corporation(b) | 1,028,916 | | Total Preferred Stock | |
| | | | | (cost $365,500) | 364,581 |
|
|
| |
| |
| |
| |
| The accompanying notes to the financial statements are an integral part of this schedule. | |
|
138
| Balanced Fund | | | |
| Schedule of Investments as of October 31, 2005(a) | | | |
| |
| Principal | | Interest | Maturity | |
| Amount | Long-Term Fixed Income (32.5%) | Rate | Date | Value |
|
| Asset-Backed Securities (7.6%) | | | |
| $1,000,000 | Americredit Automobile Receivables Trust(c,f) | 3.970% | 11/6/2005 | $1,000,221 |
| 1,500,000 | ARG Funding Corporation | 4.290 | 4/20/2010 | 1,458,399 |
| 1,500,000 | Bear Stearns Asset-Backed Securities, Inc.(f) | 4.277 | 11/25/2005 | 1,499,940 |
| 1,800,000 | Citibank Credit Card Master Trust I | 6.050 | 1/15/2010 | 1,851,610 |
| 1,000,000 | Countrywide Asset-Backed Certificates(c) | 3.903 | 1/25/2031 | 994,400 |
| 1,500,000 | Countrywide Asset-Backed Certificates(c) | 4.905 | 8/25/2032 | 1,496,324 |
| 500,000 | Credit Based Asset Servicing and Securitization | 3.887 | 10/25/2034 | 493,474 |
| 1,000,000 | DaimlerChrysler Master Owner Trust(f) | 4.020 | 11/15/2005 | 999,444 |
| 1,377,986 | Encore Credit Receivables Trust(f) | 4.180 | 11/25/2005 | 1,378,056 |
| 916,504 | First Franklin Mortgage Loan | | | |
| | Asset-Backed Certificates(f) | 4.137 | 11/25/2005 | 916,547 |
| 1,000,000 | Fremont Home Loan Trust(f) | 4.197 | 11/25/2005 | 999,962 |
| 1,000,000 | GE Dealer Floorplan Master Note Trust(f) | 4.040 | 11/20/2005 | 1,000,311 |
| 1,100,000 | GMAC Mortgage Corporation Loan Trust(f) | 4.127 | 11/25/2005 | 1,098,434 |
| 776,623 | Green Tree Financial Corporation | 6.330 | 11/1/2029 | 773,740 |
| 500,000 | Harley Davidson Motorcycle Trust | 3.200 | 5/15/2012 | 485,952 |
| 720,596 | Long Beach Mortgage Loan Trust(f) | 4.147 | 11/25/2005 | 720,667 |
| 990,144 | National Collegiate Student Loan Trust(f) | 4.097 | 11/25/2005 | 990,075 |
| 1,000,000 | Option One Mortgage Loan Trust(f) | 4.197 | 11/25/2005 | 999,962 |
| 1,401,666 | Popular ABS Mortgage Pass-Through Trust(f) | 4.147 | 11/25/2005 | 1,401,325 |
| 1,500,000 | Popular ABS Mortgage Pass-Through Trust(f) | 4.167 | 11/25/2005 | 1,500,000 |
| 500,000 | Popular ABS Mortgage Pass-Through Trust | 4.000 | 12/25/2034 | 489,632 |
| 1,430,686 | Residential Asset Securities Corporation(f) | 4.147 | 11/25/2005 | 1,430,741 |
| 5,000,000 | Residential Asset Securities Corporation(c) | 3.250 | 5/25/2029 | 4,971,545 |
| 1,500,000 | Residential Asset Securities Corporation | 4.040 | 7/25/2030 | 1,478,120 |
| 923,671 | SLM Student Loan Trust(e,f) | 4.210 | 1/25/2006 | 922,847 |
| 1,400,433 | Specialty Underwriting and Residential Finance Trust(f) | 4.157 | 11/25/2005 | 1,400,380 |
| 610,231 | Structured Asset Investment Loan Trust(f) | 4.117 | 11/25/2005 | 610,245 |
| 1,000,000 | Textron Financial Floorplan Master Note Trust(f) | 4.061 | 11/13/2005 | 1,000,000 |
| 1,466,171 | Wachovia Mortgage Loan Trust, LLC(f) | 4.147 | 11/25/2005 | 1,466,115 |
|
|
| | Total Asset-Backed Securities | | 35,828,468 |
|
|
| |
| Basic Materials (0.2%) | | | |
| 250,000 | Packaging Corporation of America | 4.375 | 8/1/2008 | 242,106 |
| 500,000 | Precision Castparts Corporation | 5.600 | 12/15/2013 | 500,934 |
|
|
| | Total Basic Materials | | | 743,040 |
|
|
| |
| Capital Goods (0.5%) | | | |
| 500,000 | Boeing Capital Corporation(d) | 6.500 | 2/15/2012 | 537,702 |
| 750,000 | Oakmont Asset Trust | 4.514 | 12/22/2008 | 731,529 |
| 500,000 | Textron Financial Corporation | 4.600 | 5/3/2010 | 490,350 |
| 750,000 | Tyco International Group SA | 6.375 | 10/15/2011 | 788,000 |
|
|
| | Total Capital Goods | | | 2,547,581 |
|
|
| |
| |
| |
| |
| The accompanying notes to the financial statements are an integral part of this schedule. | |
|
139
| Balanced Fund | | | |
| Schedule of Investments as of October 31, 2005(a) | | | |
| |
| Principal | | Interest | Maturity | |
| Amount | Long-Term Fixed Income (32.5%) | Rate | Date | Value |
|
| Commercial Mortgage-Backed Securities (5.0%) | | | |
| $1,300,000 | Banc of America Commercial Mortgage, Inc. | 4.894% | 9/10/2010 | $1,290,214 |
| 750,000 | Banc of America Commercial Mortgage, Inc. | 4.037 | 11/10/2039 | 718,774 |
| 750,000 | Banc of America Commercial Mortgage, Inc.(c) | 4.561 | 11/10/2041 | 725,109 |
| 500,000 | Banc of America Commercial Mortgage, Inc. | 5.118 | 7/11/2043 | 498,164 |
| 1,475,589 | Banc of America Mortgage Securities, Inc. | 4.830 | 9/25/2035 | 1,454,402 |
| 1,000,000 | Bear Stearns Commercial Mortgage Securities, Inc. | 3.869 | 2/11/2041 | 958,063 |
| 1,000,000 | Bear Stearns Commercial Mortgage Securities, Inc. | 4.487 | 2/11/2041 | 959,455 |
| 237,660 | CAM Commercial Mortgage Corporation(c) | 4.834 | 11/14/2036 | 237,883 |
| 966,532 | Commercial Mortgage Pass-Through Certificates(f) | 4.070 | 11/15/2005 | 966,373 |
| 969,132 | Credit Suisse First Boston Mortgage | | | |
| | Securities Corporation(f) | 4.120 | 11/15/2005 | 969,129 |
| 1,000,000 | First Union National Bank Commercial Mortgage | 7.390 | 12/15/2031 | 1,077,034 |
| 2,000,000 | LB-UBS Commercial Mortgage Trust(c) | 3.086 | 5/15/2027 | 1,915,784 |
| 1,000,000 | LB-UBS Commercial Mortgage Trust(c) | 6.653 | 11/15/2027 | 1,067,681 |
| 1,374,149 | Merrill Lynch Mortgage Investors, Inc. | 4.906 | 6/25/2035 | 1,359,175 |
| 1,250,000 | Merrill Lynch Mortgage Trust | 4.099 | 11/15/2010 | 1,231,906 |
| 1,498,398 | Morgan Stanley Capital I, Inc.(c) | 6.210 | 11/15/2031 | 1,539,487 |
| 1,500,000 | National Collegiate Student Loan Trust(f) | 4.107 | 12/25/2005 | 1,499,970 |
| 997,458 | Wachovia Bank Commercial Mortgage Trust(f) | 4.070 | 11/15/2005 | 997,157 |
| 1,500,000 | Wachovia Bank Commercial Mortgage Trust(f) | 4.170 | 11/15/2005 | 1,500,000 |
| 1,000,000 | Wachovia Bank Commercial Mortgage Trust(c) | 4.390 | 2/15/2036 | 958,042 |
| 1,500,000 | Wachovia Bank Commercial Mortgage Trust | 4.516 | 5/15/2044 | 1,458,974 |
|
|
| | Total Commercial Mortgage-Backed Securities | 23,382,776 |
|
|
| |
| Communications Services (0.9%) | | | |
| 375,000 | AT&T Broadband Corporation | 8.375 | 3/15/2013 | 431,965 |
| 350,000 | AT&T Wireless Services, Inc.(c) | 8.125 | 5/1/2012 | 402,510 |
| 600,000 | British Sky Broadcasting Finance UK plc(d) | 5.625 | 10/15/2015 | 590,835 |
| 500,000 | British Telecom plc | 8.175 | 12/15/2010 | 570,065 |
| 500,000 | Interpublic Group of Companies, Inc. | 6.250 | 11/15/2014 | 441,875 |
| 500,000 | Nextel Communications, Inc. | 5.950 | 3/15/2014 | 501,558 |
| 250,000 | Sprint Capital Corporation | 6.900 | 5/1/2019 | 271,360 |
| 500,000 | Telecom Italia Capital SA | 4.000 | 1/15/2010 | 475,291 |
| 250,000 | Telefonos de Mexico SA de CV | 4.750 | 1/27/2010 | 244,346 |
| 250,000 | Verizon Global Funding Corporation(d) | 7.750 | 12/1/2030 | 289,940 |
|
|
| | Total Communications Services | | 4,219,745 |
|
|
| |
| Consumer Cyclical (0.9%) | | | |
| 750,000 | Caesars Entertainment, Inc. | 8.500 | 11/15/2006 | 774,438 |
| 750,000 | Centex Corporation | 5.450 | 8/15/2012 | 729,914 |
| 500,000 | D.R. Horton, Inc. | 5.000 | 1/15/2009 | 489,894 |
| 500,000 | D.R. Horton, Inc.(d) | 4.875 | 1/15/2010 | 480,292 |
| 500,000 | DaimlerChrysler North American Holdings Corporation(d) | 4.875 | 6/15/2010 | 484,806 |
| 750,000 | Ford Motor Credit Company(d) | 6.625 | 6/16/2008 | 719,216 |
| 375,000 | General Motors Acceptance Corporation | 6.875 | 9/15/2011 | 363,607 |
|
|
| | Total Consumer Cyclical | | | 4,042,167 |
|
|
| |
| The accompanying notes to the financial statements are an integral part of this schedule. | |
|
| |
| 140 | | | |
| Balanced Fund | | | |
| Schedule of Investments as of October 31, 2005(a) | | | |
| |
| Principal | | Interest | Maturity | |
| Amount | Long-Term Fixed Income (32.5%) | Rate | Date | Value |
|
| Consumer Non-Cyclical (0.5%) | | | |
| $575,000 | Bunge Limited Finance Corporation(c) | 7.800% | 10/15/2012 | $654,840 |
| 500,000 | Kraft Foods, Inc.(d) | 4.125 | 11/12/2009 | 482,984 |
| 300,000 | Quest Diagnostic, Inc. | 5.450 | 11/1/2015 | 299,085 |
| 500,000 | Safeway, Inc.(d) | 4.800 | 7/16/2007 | 497,277 |
| 450,000 | Tyson Foods, Inc.(d) | 8.250 | 10/1/2011 | 507,389 |
|
|
| | Total Consumer Non-Cyclical | | 2,441,575 |
|
|
| |
| Energy (0.1%) | | | |
| 500,000 | Ras Laffan Liquefied Natural Gas Company, Ltd. II | 5.298 | 9/30/2020 | 488,780 |
|
|
| | Total Energy | | | 488,780 |
|
|
| |
| Financials (3.5%) | | | |
| 700,000 | American International Group, Inc. | 5.050 | 10/1/2015 | 684,236 |
| 500,000 | ANZ Capital Trust I(c) | 4.484 | 1/15/2010 | 484,313 |
| 375,000 | Barnett Capital I | 8.060 | 12/1/2026 | 399,815 |
| 750,000 | BNP Paribas SA | 5.186 | 6/29/2015 | 721,132 |
| 375,000 | Corestates Capital Trust I | 8.000 | 12/15/2026 | 399,214 |
| 500,000 | Countrywide Home Loans, Inc. | 4.000 | 3/22/2011 | 469,211 |
| 300,000 | CTI Group, Inc.(g) | 5.200 | 11/3/2010 | 299,602 |
| 750,000 | Goldman Sachs Group, Inc.(d) | 5.125 | 1/15/2015 | 731,497 |
| 600,000 | HSBC Capital Funding, LP/Jersey Channel Islands | 9.547 | 6/30/2010 | 703,436 |
| 500,000 | International Lease Finance Corporation | 4.875 | 9/1/2010 | 492,000 |
| 500,000 | J.P. Morgan Chase & Company | 4.891 | 9/1/2015 | 493,506 |
| 500,000 | J.P. Morgan Chase & Company | 5.150 | 10/1/2015 | 487,148 |
| 500,000 | KeyCorp | 4.700 | 5/21/2009 | 495,448 |
| 750,000 | Lehman Brothers Holdings, Inc.(d) | 4.500 | 7/26/2010 | 731,676 |
| 1,848,792 | Lehman Brothers, Inc.(c) | 6.539 | 8/15/2008 | 1,873,307 |
| 1,000,000 | Merrill Lynch & Company, Inc.(d) | 4.831 | 10/27/2008 | 995,929 |
| 350,000 | Metropolitan Life Global Funding | 4.500 | 5/5/2010 | 342,939 |
| 750,000 | Montpelier Re Holdings, Ltd. | 6.125 | 8/15/2013 | 735,106 |
| 500,000 | Monumental Global Funding II | 4.625 | 3/15/2010 | 494,756 |
| 300,000 | ProLogis(g) | 5.250 | 11/15/2010 | 298,818 |
| 250,000 | Prudential Financial, Inc. | 4.750 | 6/13/2015 | 239,065 |
| 750,000 | Residential Capital Corporation | 6.375 | 6/30/2010 | 761,808 |
| 450,000 | Sanwa Bank, Ltd.(d) | 7.400 | 6/15/2011 | 492,879 |
| 500,000 | Simon Property Group, LP | 4.600 | 6/15/2010 | 488,296 |
| 500,000 | Sovereign Bancorp, Inc. | 4.800 | 9/1/2010 | 491,168 |
| 750,000 | Wachovia Bank NA | 4.875 | 2/1/2015 | 726,746 |
| 750,000 | Washington Mutual Bank FA(d) | 5.125 | 1/15/2015 | 727,212 |
| 400,000 | Westfield Capital(c) | 4.375 | 11/15/2010 | 386,109 |
|
|
| | Total Financials | | | 16,646,372 |
|
|
| |
| Foreign (0.1%) | | | |
| 500,000 | Republic of Italy | 5.375 | 6/15/2033 | 494,294 |
|
|
| | Total Foreign | | | 494,294 |
|
|
| |
| |
| The accompanying notes to the financial statements are an integral part of this schedule. | |
|
141
| Balanced Fund | | | |
| Schedule of Investments as of October 31, 2005(a) | | | |
| |
| Principal | | Interest | Maturity | |
| Amount | Long-Term Fixed Income (32.5%) | Rate | Date | Value |
|
| Mortgage-Backed Securities (7.8%) | | | |
| $9,000,000 | Federal National Mortgage Association Conventional | | | |
| | 15-Yr. Pass Through(g) | 5.500% | 11/1/2020 | $9,059,058 |
| 15,500,000 | Federal National Mortgage Association Conventional | | | |
| | 30-Yr. Pass Through(g) | 5.500 | 11/1/2035 | 15,286,875 |
| 12,500,000 | Federal National Mortgage Association Conventional | | | |
| | 30-Yr. Pass Through(g) | 6.000 | 11/1/2035 | 12,605,475 |
| |
|
| | | Total Mortgage-Backed Securities | | | 36,951,408 |
| |
|
| |
| Technology (0.2%) | | | |
| 750,000 | Deluxe Corporation(d) | 3.500 | 10/1/2007 | 721,190 |
| | |
|
| | | | Total Technology | | | 721,190 |
| |
|
| | |
| | |
| U.S. Government (4.3%) | | | | |
| | | |
| 3,000,000 | Federal Home Loan Bank | | | 4.250 | 4/16/2007 | 2,984,511 |
| 1,000,000 | Federal Home Loan Bank | | | 4.250 | 10/14/2008 | 994,790 |
| 2,000,000 | Federal National Mortgage Association(d) | | | 5.500 | 3/15/2011 | 2,061,316 |
| 2,250,000 | U.S. Treasury Bonds(d) | | | 7.625 | 2/15/2025 | 3,030,908 |
| 525,000 | U.S. Treasury Bonds(d) | | | 6.125 | 8/15/2029 | 622,289 |
| 1,950,000 | U.S. Treasury Notes(d) | | | 5.000 | 2/15/2011 | 1,998,294 |
| 2,770,000 | U.S. Treasury Notes(d) | | | 4.000 | 2/15/2015 | 2,648,704 |
| 4,650,000 | U.S. Treasury Notes(d) | | | 4.125 | 5/15/2015 | 4,487,250 |
| 1,312,415 | U.S. Treasury Notes | | | 1.875 | 7/15/2015 | 1,299,086 |
| 100,000 | U.S. Treasury Notes(d) | | | 4.250 | 8/15/2015 | 97,578 |
|
|
| | | Total U.S. Government | | | 20,224,726 |
| |
|
| Utilities (0.9%) | | | | |
| 300,000 | CenterPoint Energy, Inc. | 5.875 | 6/1/2008 | 304,386 |
| 750,000 | Duke Capital, LLC | 5.668 | 8/15/2014 | 746,781 |
| 150,000 | Enterprise Products Operating, LP | 4.625 | 10/15/2009 | 145,496 |
| 300,000 | Exelon Corporation | 6.750 | 5/1/2011 | 317,153 |
| 675,000 | FirstEnergy Corporation | 6.450 | 11/15/2011 | 710,038 |
| 286,649 | Power Contract Financing, LLC | 5.200 | 2/1/2006 | 286,984 |
| 650,565 | Power Receivables Finance, LLC | 6.290 | 1/1/2012 | 660,902 |
| 600,000 | Public Service Company of New Mexico | 4.400 | 9/15/2008 | 587,101 |
| 200,000 | Texas-New Mexico Power Company | 6.125 | 6/1/2008 | 202,434 |
| 250,000 | Westar Energy, Inc. | 5.150 | 1/1/2017 | 242,572 |
|
|
| | | Total Utilities | | | 4,203,847 |
| |
|
| | | Total Long-Term Fixed Income (cost $155,147,504) | | | 152,935,969 |
| |
|
| |
| |
| |
| |
| The accompanying notes to the financial statements are an integral part of this schedule. | |
|
142
| Balanced Fund | | | |
| Schedule of Investments as of October 31, 2005(a) | | | |
| | | Interest | Maturity | |
| Shares | Collateral Held for Securities Loaned (9.6%) | Rate(h) | Date | Value |
|
| 45,238,731 | Thrivent Financial Securities Lending Trust | 3.950% | N/A | $45,238,731 |
|
|
| | Total Collateral Held for Securities Loaned | |
| | (cost $45,238,731) | | | 45,238,731 |
|
|
| |
| | | Interest | Maturity | |
| Shares | Short-Term Investments (2.8%) | Rate(h) | Date | Value |
|
| 13,185,640 | Thrivent Money Market Fund | 3.600% | N/A | $13,185,640 |
|
|
| | Total Short-Term Investments (at amortized cost) | 13,185,640 |
|
|
| | Total Investments (cost $456,758,411) | | $470,791,720 |
|
|
| (a) | The categories of investments are shown as a percentage of total investments. |
| |
| (b) | Non-income producing security. |
| |
| (c) | Designated as cover for long settling trades as discussed in the notes to the financial statements. |
| |
| (d) | All or a portion of the security is on loan as discussed in item 2(L) of the Notes to Financial Statements. |
| |
| (e) | At October 31, 2005, all or a portion of the denoted securities, valued at $8,858,782 were pledged as the initial margin deposit or earmarked as collateral to cover open financial futures contracts as follows: |
| |
| | | | | | Notional | |
| | Number of | Expiration | | | Principal | Unrealized |
| Type | Contracts | Date | Position | Value | Amount | Gain/(Loss) |
|
| U.S. Treasury Bond Futures 5 yr. | 35 | December 2005 | Short | $(3,706,172) | $(3,798,489) | $92,317 |
| U.S. Treasury Bond Futures 10 yr. | 5 | December 2005 | Short | (542,266) | (561,316) | 19,050 |
| U.S. Treasury Bond Futures 20 yr. | 37 | December 2005 | Long | 4,142,844 | 4,223,892 | (81,048) |
| (f) | Denotes variable rate obligations for which the current yield and next scheduled reset date are shown. |
| |
| (g) | Denotes investments purchased on a when-issued basis. |
| |
| (h) | The interest rate shown reflects the yield, coupon rate or, for securities purchased at a discount, the discount rate at the date of purchase. |
| |
| (i) | Miscellaneous footnote: |
| |
| | ADR -- American Depository Receipts, which are certificates for shares of an underlying foreign security’s shares held by an issuing U.S. depository bank. |
| |
| The accompanying notes to the financial statements are an integral part of this schedule. |
|
143
| | High Yield Fund | | |
| | Schedule of Investments as of October 31, 2005(a) | | |
| Principal | | Interest | Maturity | |
| Amount | Long-Term Fixed Income (82.6%) | Rate | Date | Value |
|
| Basic Materials (11.1%) | | | |
| $2,990,000 | Abitibi-Consolidated, Inc.(b) | 6.000% | 6/20/2013 | $2,474,225 |
| 1,100,000 | Ainsworth Lumber Company, Ltd.(c) | 7.674 | 12/30/2005 | 1,094,500 |
| 2,440,000 | Ainsworth Lumber Company, Ltd. | 6.750 | 3/15/2014 | 2,074,000 |
| 1,720,000 | Appleton Papers, Inc. | 8.125 | 6/15/2011 | 1,638,300 |
| 1,840,000 | Appleton Papers, Inc. | 9.750 | 6/15/2014 | 1,729,600 |
| 2,560,000 | Arch Western Finance, LLC | 6.750 | 7/1/2013 | 2,572,800 |
| 1,655,000 | BCP Caylux Holdings Luxembourg SCA(b) | 9.625 | 6/15/2014 | 1,820,500 |
| 1,750,000 | Buckeye Technologies, Inc.(b) | 8.000 | 10/15/2010 | 1,653,750 |
| 1,100,000 | Buckeye Technologies, Inc. | 8.500 | 10/1/2013 | 1,091,750 |
| 2,600,000 | Cellu Tissue Holdings, Inc. | 9.750 | 3/15/2010 | 2,522,000 |
| 2,560,000 | Chaparral Steel Company | 10.000 | 7/15/2013 | 2,649,600 |
| 2,570,000 | Crystal US Holdings 3, LLC/Crystal | | | |
| | US Sub 3 Corporation(d) | 10.000 | 10/1/2009 | 1,805,425 |
| 2,200,000 | Domtar, Inc. | 7.125 | 8/1/2015 | 1,859,000 |
| 1,830,000 | Equistar Chemicals, LP | 10.125 | 9/1/2008 | 1,971,825 |
| 1,800,000 | Equistar Chemicals, LP | 10.625 | 5/1/2011 | 1,962,000 |
| 2,600,000 | Georgia-Pacific Corporation | 8.125 | 5/15/2011 | 2,821,000 |
| 2,250,000 | Georgia-Pacific Corporation | 9.375 | 2/1/2013 | 2,480,625 |
| 2,350,000 | Graphic Packaging International Corporation(b) | 9.500 | 8/15/2013 | 2,109,125 |
| 2,146,000 | Huntsman International, LLC(b) | 10.125 | 7/1/2009 | 2,207,698 |
| 1,221,000 | Huntsman, LLC | 11.500 | 7/15/2012 | 1,381,256 |
| 2,150,000 | IMCO Recycling, Inc. | 10.375 | 10/15/2010 | 2,348,875 |
| 1,200,000 | ISP Chemco, Inc. | 10.250 | 7/1/2011 | 1,276,500 |
| 2,600,000 | ISP Holdings, Inc. | 10.625 | 12/15/2009 | 2,730,000 |
| 1,300,000 | Ispat Inland ULC(c) | 10.804 | 1/3/2006 | 1,352,000 |
| 904,000 | Ispat Inland ULC | 9.750 | 4/1/2014 | 1,021,520 |
| 3,550,000 | Lyondell Chemical Company | 10.500 | 6/1/2013 | 4,024,812 |
| 3,050,000 | MacDermid, Inc. | 9.125 | 7/15/2011 | 3,236,812 |
| 2,230,000 | Nalco Company | 7.750 | 11/15/2011 | 2,277,388 |
| 2,930,000 | Nell AF SARL(b) | 8.375 | 8/15/2015 | 2,812,800 |
| 2,380,000 | Novelis, Inc. | 7.250 | 2/15/2015 | 2,171,750 |
| 1,567,000 | Rockwood Specialties, Inc. | 10.625 | 5/15/2011 | 1,676,690 |
| 2,560,000 | Ryerson Tull, Inc.(b) | 8.250 | 12/15/2011 | 2,476,800 |
| 2,560,000 | Southern Peru Copper Corporation | 7.500 | 7/27/2035 | 2,451,026 |
| 1,200,000 | Steel Dynamics, Inc. | 9.500 | 3/15/2009 | 1,266,000 |
| 1,400,000 | Steel Dynamics, Inc. | 9.500 | 3/15/2009 | 1,477,000 |
| 850,000 | Stone Container Corporation(b) | 8.375 | 7/1/2012 | 811,750 |
| 1,720,000 | Stone Container Finance | 7.375 | 7/15/2014 | 1,526,500 |
|
|
| | Total Basic Materials | | | 74,857,202 |
|
|
| |
| Capital Goods (8.8%) | | | |
| 1,460,000 | Ahern Rentals, Inc. | 9.250 | 8/15/2013 | 1,481,900 |
| 370,000 | Aleris International, Inc. | 9.000 | 11/15/2014 | 377,400 |
| 3,610,000 | Allied Waste North America, Inc.(b) | 7.875 | 4/15/2013 | 3,700,250 |
| 3,450,000 | Amsted Industries, Inc. | 10.250 | 10/15/2011 | 3,691,500 |
| 1,460,000 | Builders Firstsource, Inc.(c) | 8.040 | 11/15/2005 | 1,467,300 |
| |
| The accompanying notes to the financial statements are an integral part of this schedule. | |
|
144
| High Yield Fund | | | |
| Schedule of Investments as of October 31, 2005(a) | | | |
| |
| Principal | | Interest | Maturity | |
| Amount | Long-Term Fixed Income (82.6%) | Rate | Date | Value |
|
| Capital Goods -- continued | | | |
| $3,900,000 | Case New Holland, Inc. | 9.250% | 8/1/2011 | $4,104,750 |
| 2,920,000 | Consolidated Container Company, LLC(d) | 10.750 | 6/15/2007 | 2,306,800 |
| 3,000,000 | Crown Cork & Seal Finance plc | 7.000 | 12/15/2006 | 3,045,000 |
| 1,700,000 | Crown Euro Holdings SA | 10.875 | 3/1/2013 | 2,001,750 |
| 2,600,000 | Da-Lite Screen Company, Inc. | 9.500 | 5/15/2011 | 2,743,000 |
| 2,150,000 | Erico International Corporation | 8.875 | 3/1/2012 | 2,214,500 |
| 2,150,000 | Fastentech, Inc. | 11.500 | 5/1/2011 | 2,225,250 |
| 1,825,000 | Graham Packaging Company, Inc.(b) | 9.875 | 10/15/2014 | 1,706,375 |
| 1,100,000 | K&F Acquisition, Inc.(b) | 7.750 | 11/15/2014 | 1,100,000 |
| 1,280,000 | L-3 Communication Corporation, Convertible | 3.000 | 8/1/2035 | 1,286,400 |
| 2,150,000 | Legrand SA | 10.500 | 2/15/2013 | 2,434,875 |
| 850,000 | Legrand SA | 8.500 | 2/15/2025 | 1,011,500 |
| 1,300,000 | Mueller Group, Inc. | 10.000 | 5/1/2012 | 1,365,000 |
| 2,550,000 | Mueller Holdings, Inc.(d) | 14.750 | 4/15/2009 | 1,861,500 |
| 2,550,000 | NationsRent, Inc.(b) | 9.500 | 10/15/2010 | 2,773,125 |
| 3,000,000 | Norcraft Companies, LP/Norcraft Finance | 9.000 | 11/1/2011 | 3,060,000 |
| 1,960,000 | Owens-Brockway Glass Container, Inc. | 8.875 | 2/15/2009 | 2,048,200 |
| 1,100,000 | Owens-Brockway Glass Container, Inc.(b) | 8.250 | 5/15/2013 | 1,122,000 |
| 2,320,000 | Owens-Illinois, Inc.(b) | 7.500 | 5/15/2010 | 2,296,800 |
| 2,800,000 | Plastipak Holdings, Inc. | 10.750 | 9/1/2011 | 3,066,000 |
| 2,450,000 | TransDigm, Inc. | 8.375 | 7/15/2011 | 2,548,000 |
| 2,250,000 | United Rentals North America, Inc. | 6.500 | 2/15/2012 | 2,157,188 |
|
|
| | Total Capital Goods | | | 59,196,363 |
|
|
| |
| Communications Services (16.3%) | | | |
| 3,000,000 | Alamosa Delaware, Inc. | 8.500 | 1/31/2012 | 3,112,500 |
| 1,830,000 | American Cellular Corporation | 10.000 | 8/1/2011 | 1,976,400 |
| 2,920,000 | American Tower Corporation | 7.125 | 10/15/2012 | 3,011,250 |
| 1,700,000 | American Towers, Inc. | 7.250 | 12/1/2011 | 1,776,500 |
| 1,460,000 | AT&T Corporation | 9.050 | 11/15/2011 | 1,613,300 |
| 2,923,000 | Block Communications, Inc. | 9.250 | 4/15/2009 | 3,083,765 |
| 3,334,027 | CCH I, LLC | 11.000 | 10/1/2015 | 3,017,294 |
| 2,200,000 | Centennial Communications Corporation | 8.125 | 2/1/2014 | 2,277,000 |
| 1,470,000 | Charter Communications Holdings, LLC | 8.625 | 4/1/2009 | 1,205,400 |
| 1,930,000 | Charter Communications Holdings, LLC(b) | 8.750 | 11/15/2013 | 1,857,625 |
| 2,200,000 | Charter Communications Operating, LLC | 8.000 | 4/30/2012 | 2,208,250 |
| 2,920,000 | Citizens Communications Company | 9.250 | 5/15/2011 | 3,160,900 |
| 2,690,000 | CSC Holdings, Inc. | 7.625 | 4/1/2011 | 2,696,725 |
| 1,270,000 | Dex Media West, LLC/Dex Media West Finance Company | 9.875 | 8/15/2013 | 1,400,175 |
| 1,300,000 | Dex Media, Inc.(b,d) | 9.000 | 11/15/2008 | 1,007,500 |
| 2,600,000 | Dex Media, Inc. | 8.000 | 11/15/2013 | 2,645,500 |
| 2,920,000 | Dobson Cellular Systems | 9.875 | 11/1/2012 | 3,153,600 |
| 730,000 | Dobson Communications Corporation, Convertible | 1.500 | 10/1/2025 | 677,988 |
| 2,550,000 | EchoStar DBS Corporation | 6.375 | 10/1/2011 | 2,479,875 |
| 1,950,000 | Eircom Funding | 8.250 | 8/15/2013 | 2,101,125 |
| 730,000 | Houghton Mifflin Company(b) | 8.250 | 2/1/2011 | 746,425 |
| |
| The accompanying notes to the financial statements are an integral part of this schedule. | |
|
145
| High Yield Fund | | | |
| Schedule of Investments as of October 31, 2005(a) | | | |
| |
| Principal | | Interest | Maturity | |
| Amount | Long-Term Fixed Income (82.6%) | Rate | Date | Value |
|
| Communications Services -- continued | | | |
| $1,459,000 | Houghton Mifflin Company | 9.875% | 2/1/2013 | $1,506,418 |
| 2,190,000 | Intelsat Bermuda, Ltd. | 8.625 | 1/15/2015 | 2,217,375 |
| 2,100,000 | IPCS Escrow Company | 11.500 | 5/1/2012 | 2,352,000 |
| 3,100,000 | Kabel Deutschland GmbH | 10.625 | 7/1/2014 | 3,336,375 |
| 3,000,000 | Nextel Communications, Inc. | 6.875 | 10/31/2013 | 3,138,213 |
| 1,820,000 | Nextel Communications, Inc. | 5.950 | 3/15/2014 | 1,825,671 |
| 3,000,000 | Nextel Partners, Inc. | 8.125 | 7/1/2011 | 3,202,500 |
| 1,183,000 | PanAmSat Corporation | 9.000 | 8/15/2014 | 1,245,108 |
| 1,712,000 | PanAmSat Holding Corporation(b,d) | 10.375 | 11/1/2009 | 1,168,440 |
| 2,100,000 | PRIMEDIA, Inc.(b,c) | 9.165 | 11/15/2005 | 2,105,250 |
| 1,830,000 | Qwest Communications International, Inc.(b,c) | 7.297 | 11/15/2005 | 1,834,575 |
| 1,460,000 | Qwest Communications International, Inc.(b) | 7.250 | 2/15/2011 | 1,419,850 |
| 730,000 | Qwest Corporation(c) | 7.120 | 12/15/2005 | 770,150 |
| 3,640,000 | Qwest Corporation | 7.875 | 9/1/2011 | 3,812,900 |
| 1,090,000 | Qwest Corporation | 7.625 | 6/15/2015 | 1,117,250 |
| 5,530,000 | Qwest Services Corporation | 13.500 | 12/15/2010 | 6,318,025 |
| 1,290,000 | Qwest Services Corporation | 14.000 | 12/15/2014 | 1,562,512 |
| 1,100,000 | Rainbow National Services, LLC | 8.750 | 9/1/2012 | 1,155,000 |
| 2,560,000 | Rainbow National Services, LLC | 10.375 | 9/1/2014 | 2,816,000 |
| 1,100,000 | Rogers Wireless Communications, Inc. | 7.250 | 12/15/2012 | 1,155,000 |
| 2,560,000 | Rogers Wireless Communications, Inc. | 7.500 | 3/15/2015 | 2,745,600 |
| 861,000 | SBA Telecommunications, Inc.(d) | 9.750 | 12/15/2007 | 777,052 |
| 2,190,000 | UbiquiTel Operating Company | 9.875 | 3/1/2011 | 2,392,575 |
| 2,210,000 | US Unwired, Inc. | 10.000 | 6/15/2012 | 2,513,875 |
| 2,930,000 | Valor Telecommunications Enterprises, LLC | 7.750 | 2/15/2015 | 2,867,738 |
| 2,920,000 | Videotron Ltee | 6.875 | 1/15/2014 | 2,949,200 |
| 2,360,000 | WDAC Subsidiary Corporation(b) | 8.375 | 12/1/2014 | 2,224,300 |
| 2,500,000 | XM Satellite Radio, Inc.(c) | 9.193 | 2/1/2006 | 2,518,750 |
| 2,920,000 | Zeus Special Subsidiary, Ltd.(d) | 9.250 | 2/1/2010 | 1,919,900 |
|
|
| | Total Communications Services | | 110,176,699 |
|
|
| |
| Consumer Cyclical (16.0%) | | | |
| 1,470,000 | Allied Security Escrow Corporation | 11.375 | 7/15/2011 | 1,402,862 |
| 3,200,000 | American Casino & Entertainment Properties, LLC | 7.850 | 2/1/2012 | 3,280,000 |
| 2,930,000 | ArvinMeritor, Inc.(b) | 8.750 | 3/1/2012 | 2,746,875 |
| 3,250,000 | Beazer Homes USA, Inc. | 8.625 | 5/15/2011 | 3,347,500 |
| 2,520,000 | Blockbuster, Inc.(b) | 9.000 | 9/1/2012 | 2,079,000 |
| 3,350,000 | Boyd Gaming Corporation | 7.750 | 12/15/2012 | 3,484,000 |
| 2,940,000 | Buffets, Inc.(b) | 11.250 | 7/15/2010 | 2,940,000 |
| 2,190,000 | Buhrmann U.S., Inc. | 7.875 | 3/1/2015 | 2,162,625 |
| 2,150,000 | Caesars Entertainment, Inc. | 8.125 | 5/15/2011 | 2,348,875 |
| 1,490,000 | Circus & Eldorado Joint Venture/Silver | | | |
| | Legacy Capital Corporation | 10.125 | 3/1/2012 | 1,557,050 |
| 3,650,000 | D.R. Horton, Inc. | 4.875 | 1/15/2010 | 3,506,135 |
| 2,200,000 | Delphi Corporation(b,e) | 6.500 | 8/15/2013 | 1,523,500 |
| 2,930,000 | Dollarama Group, LP | 8.875 | 8/15/2012 | 2,827,450 |
| |
| The accompanying notes to the financial statements are an integral part of this schedule. | |
|
146
| High Yield Fund | | | |
| Schedule of Investments as of October 31, 2005(a) | | | |
| |
| Principal | | Interest | Maturity | |
| Amount | Long-Term Fixed Income (82.6%) | Rate | Date | Value |
|
| Consumer Cyclical -- continued | | | |
| $2,570,000 | Gaylord Entertainment Company | 6.750% | 11/15/2014 | $2,480,050 |
| 8,050,000 | General Motors Acceptance Corporation | 6.875 | 9/15/2011 | 7,805,432 |
| 1,830,000 | General Motors Acceptance Corporation(b) | 6.750 | 12/1/2014 | 1,749,910 |
| 2,720,000 | Group 1 Automotive, Inc. | 8.250 | 8/15/2013 | 2,618,000 |
| 2,970,000 | Host Marriott, LP | 6.375 | 3/15/2015 | 2,880,900 |
| 3,660,000 | IAAI Finance Corporation | 11.000 | 4/1/2013 | 3,817,278 |
| 2,920,000 | Jean Coutu Group (PJC), Inc.(b) | 8.500 | 8/1/2014 | 2,708,300 |
| 2,930,000 | KB Home(b) | 6.250 | 6/15/2015 | 2,756,518 |
| 3,680,000 | Kerzner International, Ltd. | 6.750 | 10/1/2015 | 3,496,000 |
| 2,910,000 | Lear Corporation(b) | 5.750 | 8/1/2014 | 2,342,550 |
| 6,400,000 | MGM MIRAGE(b) | 5.875 | 2/27/2014 | 5,984,000 |
| 3,450,000 | Mohegan Tribal Gaming Authority(b) | 6.375 | 7/15/2009 | 3,450,000 |
| 3,850,000 | NCL Corporation | 10.625 | 7/15/2014 | 3,955,875 |
| 2,400,000 | Nebraska Book Company, Inc. | 8.625 | 3/15/2012 | 2,244,000 |
| 1,750,000 | Penn National Gaming, Inc. | 6.875 | 12/1/2011 | 1,725,938 |
| 2,200,000 | Perry Ellis International, Inc. | 8.875 | 9/15/2013 | 2,216,500 |
| 3,190,000 | Poster Financial Group, Inc.(b) | 8.750 | 12/1/2011 | 3,253,800 |
| 4,050,000 | Rent-Way, Inc.(b) | 11.875 | 6/15/2010 | 4,353,750 |
| 2,830,000 | TRW Automotive, Inc. | 9.375 | 2/15/2013 | 3,042,250 |
| 1,825,000 | Universal City Florida Holding Company I/II(c) | 8.443 | 2/1/2006 | 1,868,344 |
| 1,120,000 | Universal City Florida Holding Company I/II | 8.375 | 5/1/2010 | 1,148,000 |
| 2,600,000 | VICORP Restaurants, Inc. | 10.500 | 4/15/2011 | 2,405,000 |
| 1,280,000 | Walt Disney Company, Convertible | 2.125 | 4/15/2023 | 1,297,600 |
| 2,650,000 | Warnaco, Inc. | 8.875 | 6/15/2013 | 2,855,375 |
| 3,705,000 | WMG Holdings Corporation(d) | 9.500 | 12/15/2009 | 2,547,188 |
|
|
| | Total Consumer Cyclical | | 108,208,430 |
|
|
| |
| Consumer Non-Cyclical (7.3%) | | | |
| 1,830,000 | ACCO Brands Corporation | 7.625 | 8/15/2015 | 1,738,500 |
| 1,290,000 | Athena Neurosciences Finance, LLC(b) | 7.250 | 2/21/2008 | 1,244,850 |
| 2,220,000 | Beverly Enterprises, Inc. | 7.875 | 6/15/2014 | 2,430,900 |
| 1,840,000 | DaVita, Inc.(b) | 6.625 | 3/15/2013 | 1,863,000 |
| 1,830,000 | DaVita, Inc.(b) | 7.250 | 3/15/2015 | 1,848,300 |
| 1,460,000 | Elan Finance Corporation, Ltd. | 7.750 | 11/15/2011 | 1,284,800 |
| 2,190,000 | Fisher Scientific International, Inc. | 6.125 | 7/1/2015 | 2,173,575 |
| 2,940,000 | IASIS Healthcare, LLC (IASIS Capital Corporation) | 8.750 | 6/15/2014 | 3,013,500 |
| 1,596,000 | Jafra Cosmetics | 10.750 | 5/15/2011 | 1,751,610 |
| 4,450,000 | Jostens Holding Corporation(d) | 10.250 | 12/1/2008 | 3,215,125 |
| 2,190,000 | Lifecare Holdings, Inc. | 9.250 | 8/15/2013 | 1,620,600 |
| 3,050,000 | Michael Foods, Inc. | 8.000 | 11/15/2013 | 3,095,750 |
| 5,130,000 | Roundy’s, Inc. | 8.875 | 6/15/2012 | 5,655,209 |
| 2,570,000 | Select Medical Corporation | 7.625 | 2/1/2015 | 2,383,675 |
| 1,830,000 | Smithfield Foods, Inc.(b) | 8.000 | 10/15/2009 | 1,932,938 |
| 730,000 | Smithfield Foods, Inc. | 7.000 | 8/1/2011 | 740,950 |
| 3,325,000 | Stater Brothers Holdings, Inc. | 8.125 | 6/15/2012 | 3,250,188 |
| 2,750,000 | Triad Hospitals, Inc. | 7.000 | 5/15/2012 | 2,791,250 |
| |
| The accompanying notes to the financial statements are an integral part of this schedule. | |
|
147
| High Yield Fund | | | |
| Schedule of Investments as of October 31, 2005(a) | | | |
| |
| Principal | | Interest | Maturity | |
| Amount | Long-Term Fixed Income (82.6%) | Rate | Date | Value |
|
| Consumer Non-Cyclical -- continued | | | |
| $2,740,000 | US Oncology Holdings, Inc.(c) | 9.264% | 3/15/2006 | $2,685,200 |
| 1,640,000 | US Oncology, Inc. | 9.000 | 8/15/2012 | 1,730,200 |
| 910,000 | Vanguard Health Holding Company I, LLC(d) | 11.250 | 10/1/2009 | 637,000 |
| 730,000 | Ventas Realty, LP/Ventas Capital Corporation | 7.125 | 6/1/2015 | 753,725 |
| 1,550,000 | Warner Chilcott Corporation | 8.750 | 2/1/2015 | 1,426,000 |
|
|
| | Total Consumer Non-Cyclical | | 49,266,845 |
|
|
| |
| Energy (4.8%) | | | |
| 1,460,000 | Chesapeake Energy Corporation | 6.375 | 6/15/2015 | 1,434,450 |
| 2,550,000 | Chesapeake Energy Corporation | 6.250 | 1/15/2018 | 2,473,500 |
| 2,000,000 | Compton Petroleum Corporation | 9.900 | 5/15/2009 | 2,125,000 |
| 1,700,000 | EXCO Resources, Inc. | 7.250 | 1/15/2011 | 1,717,000 |
| 2,560,000 | Harvest Operations Corporation(b) | 7.875 | 10/15/2011 | 2,483,200 |
| 2,860,000 | Hornbeck Offshore Services, Inc. | 6.125 | 12/1/2014 | 2,788,500 |
| 1,332,000 | Magnum Hunter Resources, Inc. | 9.600 | 3/15/2012 | 1,438,560 |
| 2,555,000 | Ocean Rig Norway AS | 8.375 | 7/1/2013 | 2,743,431 |
| 2,620,000 | Petroleum Geo-Services ASA | 10.000 | 11/5/2010 | 2,895,100 |
| 2,210,000 | Pioneer Natural Resources Company | 5.875 | 7/15/2016 | 2,112,623 |
| 1,835,000 | Pogo Producing Company | 6.875 | 10/1/2017 | 1,816,650 |
| 2,580,000 | Pride International, Inc.(b) | 7.375 | 7/15/2014 | 2,779,950 |
| 2,700,000 | Western Oil Sands, Inc. | 8.375 | 5/1/2012 | 3,057,750 |
| 1,830,000 | Whiting Petroleum Corporation | 7.250 | 5/1/2012 | 1,843,725 |
| 735,000 | Whiting Petroleum Corporation | 7.000 | 2/1/2014 | 736,838 |
|
|
| | Total Energy | | | 32,446,277 |
|
|
| |
| Financials (1.9%) | | | |
| 2,558,000 | American Financial Group, Inc., Convertible(d) | Zero Coupon | 6/2/2008 | 1,106,335 |
| 2,150,000 | Dollar Financial Group, Inc. | 9.750 | 11/15/2011 | 2,193,000 |
| 3,960,000 | Dow Jones CDX(b) | 8.750 | 12/29/2010 | 3,905,550 |
| 1,820,000 | Fairfax Financial Holdings, Ltd.(b) | 7.750 | 4/26/2012 | 1,674,484 |
| 1,830,000 | FTI Consulting, Inc. | 7.625 | 6/15/2013 | 1,866,600 |
| 1,830,000 | Residential Capital Corporation | 6.375 | 6/30/2010 | 1,858,812 |
| 5,000,000 | SIG Capital Trust I(f,g) | 9.500 | 8/15/2027 | 5 |
|
|
| | Total Financials | | | 12,604,786 |
| |
| |
| Foreign (0.2%) | | | |
| 1,350,000 | Federal Republic of Brazil(b) | 11.000 | 1/11/2012 | 1,606,500 |
|
|
| | Total Foreign | | | 1,606,500 |
|
|
| |
| Technology (3.7%) | | | |
| 1,285,000 | Electronic Data Systems Corporation, Convertible | 3.875 | 7/15/2023 | 1,257,694 |
| 740,000 | Flextronics International, Ltd., Convertible | 1.000 | 8/1/2010 | 641,950 |
| 1,470,000 | Freescale Semiconductor, Inc. | 6.875 | 7/15/2011 | 1,517,775 |
| 1,470,000 | Freescale Semiconductor, Inc. | 7.125 | 7/15/2014 | 1,541,662 |
| 2,120,000 | Itron, Inc. | 7.750 | 5/15/2012 | 2,162,400 |
| |
| |
| The accompanying notes to the financial statements are an integral part of this schedule. | |
|
148
| High Yield Fund | | | |
| Schedule of Investments as of October 31, 2005(a) | | | |
| |
| Principal | | Interest | Maturity | |
| Amount | Long-Term Fixed Income (82.6%) | Rate | Date | Value |
|
| Technology -- continued | | | |
| $1,830,000 | MagnaChip Semiconductor SA/MagnaChip | | | |
| | Semiconductor Finance | 6.875% | 12/15/2011 | $1,720,200 |
| 2,000,000 | Sanmina-SCI Corporation | 10.375 | 1/15/2010 | 2,190,000 |
| 470,000 | Sanmina-SCI Corporation(b) | 6.750 | 3/1/2013 | 439,450 |
| 1,470,000 | SunGard Data Systems, Inc. | 9.125 | 8/15/2013 | 1,492,050 |
| 2,930,000 | SunGard Data Systems, Inc. | 10.250 | 8/15/2015 | 2,904,362 |
| 1,300,000 | Thomas & Betts Corporation | 7.250 | 6/1/2013 | 1,370,391 |
| 3,400,000 | UGS Corporation | 10.000 | 6/1/2012 | 3,714,500 |
| 550,000 | Unisys Corporation(b) | 7.875 | 4/1/2008 | 522,500 |
| 1,300,000 | Unisys Corporation(b) | 8.000 | 10/15/2012 | 1,144,000 |
| 2,590,000 | Xerox Corporation | 7.625 | 6/15/2013 | 2,719,500 |
|
|
| | Total Technology | | | 25,338,434 |
|
|
| |
| Transportation (2.1%) | | | |
| 1,460,000 | H-Lines Finance Holding Corporation(d) | 11.000 | 4/1/2008 | 1,200,850 |
| 2,300,000 | Horizon Lines, LLC | 9.000 | 11/1/2012 | 2,440,875 |
| 2,560,000 | Progress Rail Services Corporation | 7.750 | 4/1/2012 | 2,617,600 |
| 3,707,162 | United Air Lines, Inc.(e) | 7.730 | 7/1/2010 | 3,578,067 |
| 4,050,000 | Windsor Petroleum Transport Corporation | 7.840 | 1/15/2021 | 4,264,411 |
|
|
| | Total Transportation | | | 14,101,803 |
|
|
| |
| Utilities (10.4%) | | | |
| 1,300,000 | AES Corporation(b) | 8.875 | 2/15/2011 | 1,391,000 |
| 3,100,000 | AES Corporation | 8.750 | 5/15/2013 | 3,348,000 |
| 2,920,000 | AmeriGas Partners, LP | 7.250 | 5/20/2015 | 3,022,200 |
| 2,600,000 | Calpine Generating Company, LLC(c) | 9.804 | 12/1/2005 | 2,626,000 |
| 4,010,370 | CE Generation, LLC | 7.416 | 12/15/2018 | 4,256,302 |
| 2,210,000 | Colorado Interstate Gas Company | 6.800 | 11/15/2015 | 2,221,050 |
| 1,820,000 | Consumers Energy Company(b) | 6.300 | 2/1/2012 | 1,806,350 |
| 730,000 | Dominion Resources, Inc., Convertible | 2.125 | 12/15/2023 | 795,700 |
| 3,000,000 | Dynegy Holdings, Inc. | 9.875 | 7/15/2010 | 3,225,000 |
| 1,830,000 | Dynegy Holdings, Inc.(b) | 6.875 | 4/1/2011 | 1,752,225 |
| 5,500,000 | Edison Mission Energy | 9.875 | 4/15/2011 | 6,407,500 |
| 4,150,000 | El Paso Corporation(b) | 7.000 | 5/15/2011 | 4,087,750 |
| 1,280,000 | El Paso Corporation | 7.800 | 8/1/2031 | 1,270,400 |
| 3,250,000 | El Paso Production Holding Company | 7.750 | 6/1/2013 | 3,347,500 |
| 2,621,024 | Midland Funding Corporation II | 13.250 | 7/23/2006 | 2,747,202 |
| 1,650,000 | Midwest Generation, LLC | 8.750 | 5/1/2034 | 1,806,750 |
| 3,130,000 | Mission Energy Holding Company | 13.500 | 7/15/2008 | 3,622,975 |
| 2,036,000 | NRG Energy, Inc. | 8.000 | 12/15/2013 | 2,219,240 |
| 1,470,000 | Pacific Energy Partners, LP/Pacific | | | |
| | Energy Finance Corporation | 7.125 | 6/15/2014 | 1,528,800 |
| 1,500,000 | Southern Natural Gas Company | 8.875 | 3/15/2010 | 1,609,840 |
| 1,840,000 | Southern Natural Gas Company | 7.350 | 2/15/2031 | 1,838,651 |
| 2,710,000 | Southern Star Central Corporation | 8.500 | 8/1/2010 | 2,879,375 |
| 1,100,000 | Targa Resources, Inc. | 8.500 | 11/1/2013 | 1,116,500 |
| |
| The accompanying notes to the financial statements are an integral part of this schedule. | |
|
149
| High Yield Fund | | | |
| Schedule of Investments as of October 31, 2005(a) | | | |
| |
| Principal | | Interest | Maturity | |
| Amount | Long-Term Fixed Income (82.6%) | Rate | Date | Value |
|
| Utilities -- continued | | | |
| $2,000,000 | Texas Genco, LLC/Texas Genco Financing Corporation | 6.875% | 12/15/2014 | $2,140,000 |
| 6,500,000 | Williams Companies, Inc. | 8.125 | 3/15/2012 | 7,020,000 |
| 1,830,000 | Williams Companies, Inc. | 8.750 | 3/15/2032 | 2,111,362 |
|
|
| | Total Utilities | | | 70,197,672 |
|
|
| | Total Long-Term Fixed Income (cost $555,508,466) | 558,001,011 |
|
|
| |
| |
| Shares | Preferred Stock (1.3%) | | | Value |
|
| 43,000 | CenterPoint Energy, Inc., Convertible(h) | | | $1,485,908 |
| 65,000 | Chevy Chase Preferred Capital Corporation, Convertible | | | 3,461,250 |
| 2,600 | Sovereign Real Estate Investment Corporation | | | 3,744,000 |
|
|
| | Total Preferred Stock (cost $7,020,593) | | 8,691,158 |
|
|
| |
| |
| Shares | Common Stock (0.1%) | | | Value |
|
| 2,900 | ASAT Finance, LLC, Stock Warrants (f,h,i) | | | $0 |
| 5,578 | ICO Global Communication (Holdings), Ltd.(b,h) | | | 22,451 |
| 928 | ICO Global Communication (Holdings), Ltd. Warrants(h) | | | 28 |
| 3,000 | Pliant Corporation, Stock Warrants (h,i) | | | 30 |
| 3,000 | RailAmerica, Inc., Stock Warrants (h,i) | | | 174,000 |
| 4,500 | TravelCenters of America, Inc., Stock Warrants (f,h,i) | | | 74,655 |
| 13,500 | TravelCenters of America, Inc., Stock Warrants(f,h) | | | 223,965 |
| 36,330 | TVMAX Holdings, Inc.(h) | | | 36,330 |
|
|
| | Total Common Stock (cost $2,733,966) | | 531,459 |
|
|
| |
| |
| | | Interest | Maturity | |
| Shares | Collateral Held for Securities Loaned (12.2%) | Rate(j) | Date | Value |
|
| 82,460,818 | Thrivent Financial Securities Lending Trust | 3.950% | N/A | $82,460,818 |
|
|
| | Total Collateral Held for Securities Loaned | |
| | (cost $82,460,818) | | | 82,460,818 |
|
|
| |
| |
| |
| |
| The accompanying notes to the financial statements are an integral part of this schedule. | |
|
150
| High Yield Fund | | | |
| Schedule of Investments as of October 31, 2005(a) | | | |
| | | Interest | Maturity | |
| Shares | Short-Term Investments (3.8%) | Rate(j) | Date | Value |
|
| 25,764,469 | Thrivent Money Market Fund | 3.600% | N/A | $25,764,469 |
|
|
| | Total Short-Term Investments (at amortized cost) | 25,764,469 |
|
|
| | Total Investments (cost $673,488,312) | | $675,448,915 |
|
|
| (a) | The categories of investments are shown as a percentage of total investments. |
| |
| (b) | All or a portion of the security is on loan as discussed in item 2(L) of the Notes to Financial Statements. |
| |
| (c) | Denotes variable rate obligations for which the current yield and next scheduled reset date are shown. |
| |
| (d) | Denotes step coupon bonds for which the current interest rate and next scheduled reset date are shown. |
| |
| (e) | In bankruptcy. |
| |
| (f) | Security is fair valued as discussed in the notes to the financial statements. |
| |
| (g) | In default. |
| |
| (h) | Non-income producing security. |
| |
| (i) | Denotes restricted securities. Restricted securities are investment securities which cannot be offered for public sale without first being registered under the Securities Act of 1933. These securities have been valued from the date of acquisition through October 31, 2005, by obtaining quotations from brokers active with these securities. The following table indicates the acquisition date and cost of restricted securities the Fund owned as of October 31, 2005. |
| |
| | | Acquisition | |
| | Security | Date | Cost |
|
|
| | ASAT Finance, LLC, Stock Warrants | 10/20/1999 | $64,123 |
| | Pliant Corporation, Stock Warrants | 8/22/2000 | 99,578 |
| | RailAmerica, Inc., Stock Warrants | 8/9/2000 | 117,000 |
| | TravelCenters of America, Inc., Stock Warrants | 11/9/2000 | 156,200 |
| |
| (j) | The interest rate shown reflects the yield, coupon rate or, for securities purchased at a discount, the discount rate at the date of purchase. |
The accompanying notes to the financial statements are an integral part of this schedule. |
|
| |
| 151 | |
| | High Yield Fund II | | |
| | Schedule of Investments as of October 31, 2005(a) | | |
| Principal | | Interest | Maturity | |
| Amount | Long-Term Fixed Income (81.6%) | Rate | Date | Value |
|
| Basic Materials (11.0%) | | | |
| $650,000 | Abitibi-Consolidated, Inc.(b) | 8.550% | 8/1/2010 | $635,375 |
| 250,000 | Ainsworth Lumber Company, Ltd.(c) | 7.674 | 12/30/2005 | 248,750 |
| 560,000 | Ainsworth Lumber Company, Ltd. | 6.750 | 3/15/2014 | 476,000 |
| 370,000 | Appleton Papers, Inc. | 8.125 | 6/15/2011 | 352,425 |
| 210,000 | Appleton Papers, Inc.(b) | 9.750 | 6/15/2014 | 197,400 |
| 580,000 | Arch Western Finance, LLC | 6.750 | 7/1/2013 | 582,900 |
| 373,000 | BCP Caylux Holdings Luxembourg SCA | 9.625 | 6/15/2014 | 410,300 |
| 310,000 | Buckeye Technologies, Inc.(b) | 8.000 | 10/15/2010 | 292,950 |
| 310,000 | Buckeye Technologies, Inc. | 8.500 | 10/1/2013 | 307,675 |
| 560,000 | Cellu Tissue Holdings, Inc. | 9.750 | 3/15/2010 | 543,200 |
| 570,000 | Chaparral Steel Company | 10.000 | 7/15/2013 | 589,950 |
| 580,000 | Crystal US Holdings 3, LLC/Crystal | | | |
| | US Sub 3 Corporation(d) | 10.000 | 10/1/2009 | 407,450 |
| 490,000 | Domtar, Inc.(b) | 7.125 | 8/1/2015 | 414,050 |
| 410,000 | Equistar Chemicals, LP | 10.125 | 9/1/2008 | 441,775 |
| 425,000 | Equistar Chemicals, LP | 10.625 | 5/1/2011 | 463,250 |
| 520,000 | Georgia-Pacific Corporation | 8.125 | 5/15/2011 | 564,200 |
| 520,000 | Georgia-Pacific Corporation | 9.375 | 2/1/2013 | 573,300 |
| 200,000 | Georgia-Pacific Corporation(b) | 8.000 | 1/15/2024 | 213,000 |
| 560,000 | Huntsman International, LLC(b) | 10.125 | 7/1/2009 | 576,100 |
| 264,000 | Huntsman, LLC | 11.500 | 7/15/2012 | 298,650 |
| 700,000 | ISP Holdings, Inc. | 10.625 | 12/15/2009 | 735,000 |
| 600,000 | Ispat Inland ULC(c) | 10.804 | 1/3/2006 | 624,000 |
| 104,000 | Ispat Inland ULC | 9.750 | 4/1/2014 | 117,520 |
| 700,000 | Kappa Beheer BV | 10.625 | 7/15/2009 | 726,250 |
| 910,000 | Lyondell Chemical Company | 10.500 | 6/1/2013 | 1,031,712 |
| 200,000 | MacDermid, Inc. | 9.125 | 7/15/2011 | 212,250 |
| 490,000 | Nalco Company(b) | 7.750 | 11/15/2011 | 500,412 |
| 650,000 | Nell AF SARL(b) | 8.375 | 8/15/2015 | 624,000 |
| 540,000 | Novelis, Inc. | 7.250 | 2/15/2015 | 492,750 |
| 925,000 | Peabody Energy Corporation | 6.875 | 3/15/2013 | 955,062 |
| 580,000 | Ryerson Tull, Inc.(b) | 8.250 | 12/15/2011 | 561,150 |
| 575,000 | Southern Peru Copper Corporation | 7.500 | 7/27/2035 | 550,523 |
| 580,000 | Steel Dynamics, Inc. | 9.500 | 3/15/2009 | 611,900 |
| 625,000 | Stone Container Corporation(b) | 8.375 | 7/1/2012 | 596,875 |
|
|
| | Total Basic Materials | | | 16,928,104 |
|
|
| |
| Capital Goods (8.8%) | | | |
| 320,000 | Ahern Rentals, Inc. | 9.250 | 8/15/2013 | 324,800 |
| 80,000 | Aleris International, Inc. | 9.000 | 11/15/2014 | 81,600 |
| 800,000 | Allied Waste North America, Inc. | 8.500 | 12/1/2008 | 832,000 |
| 340,000 | Allied Waste North America, Inc.(b) | 7.875 | 4/15/2013 | 348,500 |
| 610,000 | Amsted Industries, Inc. | 10.250 | 10/15/2011 | 652,700 |
| 330,000 | Builders Firstsource, Inc.(c) | 8.040 | 11/15/2005 | 331,650 |
| 810,000 | Case New Holland, Inc. | 9.250 | 8/1/2011 | 852,525 |
| 580,000 | Consolidated Container Company, LLC(d) | 10.750 | 6/15/2007 | 458,200 |
| |
| The accompanying notes to the financial statements are an integral part of this schedule. | |
|
152
| High Yield Fund II | | | |
| Schedule of Investments as of October 31, 2005(a) | | | |
| |
| Principal | | Interest | Maturity | |
| Amount | Long-Term Fixed Income (81.6%) | Rate | Date | Value |
|
| Capital Goods -- continued | | | |
| $600,000 | Crown Euro Holdings SA | 9.500% | 3/1/2011 | $660,000 |
| 400,000 | Crown Euro Holdings SA | 10.875 | 3/1/2013 | 471,000 |
| 520,000 | Da-Lite Screen Company, Inc. | 9.500 | 5/15/2011 | 548,600 |
| 610,000 | Fastentech, Inc. | 11.500 | 5/1/2011 | 631,350 |
| 380,000 | Graham Packaging Company, Inc.(b) | 9.875 | 10/15/2014 | 355,300 |
| 425,000 | Invensys plc(b) | 9.875 | 3/15/2011 | 408,000 |
| 250,000 | K&F Acquisition, Inc.(b) | 7.750 | 11/15/2014 | 250,000 |
| 290,000 | L-3 Communication Corporation, Convertible | 3.000 | 8/1/2035 | 291,450 |
| 760,000 | Legrand SA | 10.500 | 2/15/2013 | 860,700 |
| 460,000 | Mueller Group, Inc. | 10.000 | 5/1/2012 | 483,000 |
| 610,000 | NationsRent, Inc.(b) | 9.500 | 10/15/2010 | 663,375 |
| 125,000 | Owens-Brockway Glass Container, Inc. | 7.750 | 5/15/2011 | 128,125 |
| 700,000 | Owens-Brockway Glass Container, Inc. | 8.750 | 11/15/2012 | 750,750 |
| 350,000 | Owens-Brockway Glass Container, Inc. | 8.250 | 5/15/2013 | 357,000 |
| 320,000 | Owens-Illinois, Inc.(b) | 7.500 | 5/15/2010 | 316,800 |
| 610,000 | Plastipak Holdings, Inc. | 10.750 | 9/1/2011 | 667,950 |
| 550,000 | TransDigm, Inc. | 8.375 | 7/15/2011 | 572,000 |
| 600,000 | Trinity Industries, Inc.(b) | 6.500 | 3/15/2014 | 585,000 |
| 610,000 | United Rentals North America, Inc. | 6.500 | 2/15/2012 | 584,838 |
|
|
| | Total Capital Goods | | | 13,467,213 |
|
|
| |
| Communications Services (17.1%) | | | |
| 610,000 | Alamosa Delaware, Inc. | 8.500 | 1/31/2012 | 632,875 |
| 400,000 | American Cellular Corporation | 10.000 | 8/1/2011 | 432,000 |
| 660,000 | American Tower Corporation | 7.125 | 10/15/2012 | 680,625 |
| 380,000 | American Towers, Inc. | 7.250 | 12/1/2011 | 397,100 |
| 340,000 | AT&T Corporation | 9.050 | 11/15/2011 | 375,700 |
| 657,000 | Block Communications, Inc. | 9.250 | 4/15/2009 | 693,135 |
| 665,051 | Calpoint Receivable Structured Trust 2001 | 7.440 | 12/10/2006 | 666,714 |
| 339,788 | CCH I, LLC | 11.000 | 10/1/2015 | 307,508 |
| 490,000 | Centennial Communications Corporation | 8.125 | 2/1/2014 | 507,150 |
| 330,000 | Charter Communications Holdings, LLC | 8.625 | 4/1/2009 | 270,600 |
| 730,000 | Charter Communications Holdings, LLC(b) | 8.750 | 11/15/2013 | 702,625 |
| 175,000 | Charter Communications Operating, LLC | 8.000 | 4/30/2012 | 175,656 |
| 275,000 | Charter Communications Operating, LLC | 8.375 | 4/30/2014 | 275,688 |
| 660,000 | Citizens Communications Company(b) | 9.250 | 5/15/2011 | 714,450 |
| 600,000 | CSC Holdings, Inc. | 7.625 | 4/1/2011 | 601,500 |
| 679,000 | Dex Media West, LLC/Dex Media West Finance Company | 9.875 | 8/15/2013 | 748,598 |
| 610,000 | Dex Media, Inc. | 8.000 | 11/15/2013 | 620,675 |
| 617,000 | DIRECTV Holdings, LLC | 8.375 | 3/15/2013 | 667,902 |
| 650,000 | Dobson Cellular Systems(b) | 9.875 | 11/1/2012 | 702,000 |
| 160,000 | Dobson Communications Corporation, Convertible | 1.500 | 10/1/2025 | 148,600 |
| 150,000 | EchoStar DBS Corporation | 5.750 | 10/1/2008 | 146,625 |
| 450,000 | Eircom Funding | 8.250 | 8/15/2013 | 484,875 |
| 160,000 | Houghton Mifflin Company | 8.250 | 2/1/2011 | 163,600 |
| 338,000 | Houghton Mifflin Company(b) | 9.875 | 2/1/2013 | 348,985 |
| |
| The accompanying notes to the financial statements are an integral part of this schedule. | |
|
153
| High Yield Fund II | | | |
| Schedule of Investments as of October 31, 2005(a) | | | |
| |
| Principal | | Interest | Maturity | |
| Amount | Long-Term Fixed Income (81.6%) | Rate | Date | Value |
|
| Communications Services -- continued | | | |
| $500,000 | Intelsat Bermuda, Ltd. | 8.625% | 1/15/2015 | $506,250 |
| 610,000 | IPCS Escrow Company | 11.500 | 5/1/2012 | 683,200 |
| 700,000 | Kabel Deutschland GmbH | 10.625 | 7/1/2014 | 753,375 |
| 690,000 | Nextel Communications, Inc. | 6.875 | 10/31/2013 | 721,789 |
| 420,000 | Nextel Communications, Inc. | 5.950 | 3/15/2014 | 421,309 |
| 610,000 | Nextel Partners, Inc. | 8.125 | 7/1/2011 | 651,175 |
| 279,000 | PanAmSat Corporation | 9.000 | 8/15/2014 | 293,648 |
| 376,000 | PanAmSat Holding Corporation(b,d) | 10.375 | 11/1/2009 | 256,620 |
| 100,000 | PRIMEDIA, Inc.(c) | 9.165 | 11/15/2005 | 100,250 |
| 650,000 | PRIMEDIA, Inc.(b) | 8.000 | 5/15/2013 | 593,125 |
| 420,000 | Qwest Communications International, Inc.(c) | 7.297 | 11/15/2005 | 421,050 |
| 330,000 | Qwest Communications International, Inc.(b) | 7.250 | 2/15/2011 | 320,925 |
| 160,000 | Qwest Corporation(c) | 7.120 | 12/15/2005 | 168,800 |
| 840,000 | Qwest Corporation | 7.875 | 9/1/2011 | 879,900 |
| 240,000 | Qwest Corporation | 7.625 | 6/15/2015 | 246,000 |
| 1,250,000 | Qwest Services Corporation | 13.500 | 12/15/2010 | 1,428,125 |
| 280,000 | Qwest Services Corporation | 14.000 | 12/15/2014 | 339,150 |
| 250,000 | Rainbow National Services, LLC | 8.750 | 9/1/2012 | 262,500 |
| 590,000 | Rainbow National Services, LLC | 10.375 | 9/1/2014 | 649,000 |
| 240,000 | Rogers Wireless Communications, Inc. | 7.250 | 12/15/2012 | 252,000 |
| 575,000 | Rogers Wireless Communications, Inc. | 7.500 | 3/15/2015 | 616,688 |
| 188,000 | SBA Telecommunications, Inc.(d) | 9.750 | 12/15/2007 | 169,670 |
| 300,000 | Sheridan Group, Inc.(b) | 10.250 | 8/15/2011 | 312,000 |
| 495,000 | UbiquiTel Operating Company | 9.875 | 3/1/2011 | 540,788 |
| 390,000 | US Unwired, Inc. | 10.000 | 6/15/2012 | 443,625 |
| 650,000 | Valor Telecommunications Enterprises, LLC | 7.750 | 2/15/2015 | 636,188 |
| 670,000 | Videotron Ltee | 6.875 | 1/15/2014 | 676,700 |
| 540,000 | WDAC Subsidiary Corporation(b) | 8.375 | 12/1/2014 | 508,950 |
| 610,000 | XM Satellite Radio, Inc.(c) | 9.193 | 2/1/2006 | 614,575 |
| 660,000 | Zeus Special Subsidiary, Ltd.(d) | 9.250 | 2/1/2010 | 433,950 |
|
|
| | Total Communications Services | | 26,366,511 |
|
|
| |
| Consumer Cyclical (15.7%) | | | |
| 330,000 | Allied Security Escrow Corporation | 11.375 | 7/15/2011 | 314,928 |
| 400,000 | AmeriGas Partners, LP/AmeriGas | | | |
| | Eagle Finance Corporation | 10.000 | 4/15/2006 | 408,500 |
| 660,000 | ArvinMeritor, Inc.(b) | 8.750 | 3/1/2012 | 618,750 |
| 800,000 | Beazer Homes USA, Inc. | 8.625 | 5/15/2011 | 824,000 |
| 570,000 | Blockbuster, Inc.(b) | 9.000 | 9/1/2012 | 470,250 |
| 1,100,000 | Boyd Gaming Corporation(b) | 7.750 | 12/15/2012 | 1,144,000 |
| 730,000 | Buffets, Inc.(b) | 11.250 | 7/15/2010 | 730,000 |
| 490,000 | Buhrmann U.S., Inc. | 7.875 | 3/1/2015 | 483,875 |
| 975,000 | Caesars Entertainment, Inc. | 7.875 | 3/15/2010 | 1,039,594 |
| 500,000 | Circus & Eldorado Joint Venture/Silver | | | |
| | Legacy Capital Corporation(b) | 10.125 | 3/1/2012 | 522,500 |
| 830,000 | D.R. Horton, Inc. | 4.875 | 1/15/2010 | 797,286 |
| |
| The accompanying notes to the financial statements are an integral part of this schedule. | |
|
154
| High Yield Fund II | | | |
| Schedule of Investments as of October 31, 2005(a) | | | |
| |
| Principal | | Interest | Maturity | |
| Amount | Long-Term Fixed Income (81.6%) | Rate | Date | Value |
|
| Consumer Cyclical -- continued | | | |
| $1,000,000 | D.R. Horton, Inc. | 5.625% | 9/15/2014 | $945,568 |
| 480,000 | Delphi Corporation(b,e) | 6.500 | 8/15/2013 | 332,400 |
| 650,000 | Dollarama Group, LP | 8.875 | 8/15/2012 | 627,250 |
| 570,000 | Gaylord Entertainment Company | 6.750 | 11/15/2014 | 550,050 |
| 1,780,000 | General Motors Acceptance Corporation | 6.875 | 9/15/2011 | 1,725,919 |
| 410,000 | General Motors Acceptance Corporation(b) | 6.750 | 12/1/2014 | 392,056 |
| 440,000 | Group 1 Automotive, Inc. | 8.250 | 8/15/2013 | 423,500 |
| 75,000 | Host Marriott, LP(b) | 7.125 | 11/1/2013 | 76,031 |
| 820,000 | IAAI Finance Corporation | 11.000 | 4/1/2013 | 855,237 |
| 660,000 | Jean Coutu Group (PJC), Inc.(b) | 8.500 | 8/1/2014 | 612,150 |
| 660,000 | KB Home | 6.250 | 6/15/2015 | 620,922 |
| 810,000 | Kerzner International, Ltd. | 6.750 | 10/1/2015 | 769,500 |
| 660,000 | Lear Corporation(b) | 5.750 | 8/1/2014 | 531,300 |
| 1,380,000 | MGM MIRAGE(b) | 5.875 | 2/27/2014 | 1,290,300 |
| 840,000 | NCL Corporation | 10.625 | 7/15/2014 | 863,100 |
| 530,000 | Nebraska Book Company, Inc. | 8.625 | 3/15/2012 | 495,550 |
| 390,000 | Penn National Gaming, Inc. | 6.875 | 12/1/2011 | 384,638 |
| 710,000 | Poster Financial Group, Inc. | 8.750 | 12/1/2011 | 724,200 |
| 770,000 | Rent-Way, Inc. | 11.875 | 6/15/2010 | 827,750 |
| 635,000 | TRW Automotive, Inc. | 9.375 | 2/15/2013 | 682,625 |
| 350,000 | Universal City Development Services | 11.750 | 4/1/2010 | 392,438 |
| 410,000 | Universal City Florida Holding Company I/II(c) | 8.443 | 2/1/2006 | 419,738 |
| 230,000 | Universal City Florida Holding Company I/II | 8.375 | 5/1/2010 | 235,750 |
| 600,000 | VICORP Restaurants, Inc. | 10.500 | 4/15/2011 | 555,000 |
| 280,000 | Walt Disney Company, Convertible | 2.125 | 4/15/2023 | 283,850 |
| 600,000 | Warnaco, Inc. | 8.875 | 6/15/2013 | 646,500 |
| 843,000 | WMG Holdings Corporation(d) | 9.500 | 12/15/2009 | 579,562 |
|
|
| | Total Consumer Cyclical | | 24,196,567 |
|
|
| |
| Consumer Non-Cyclical (6.8%) | | | |
| 410,000 | ACCO Brands Corporation | 7.625 | 8/15/2015 | 389,500 |
| 280,000 | Athena Neurosciences Finance, LLC(b) | 7.250 | 2/21/2008 | 270,200 |
| 480,000 | Beverly Enterprises, Inc. | 7.875 | 6/15/2014 | 525,600 |
| 400,000 | DaVita, Inc. | 6.625 | 3/15/2013 | 405,000 |
| 410,000 | DaVita, Inc.(b) | 7.250 | 3/15/2015 | 414,100 |
| 330,000 | Elan Finance Corporation, Ltd. | 7.750 | 11/15/2011 | 290,400 |
| 490,000 | Fisher Scientific International, Inc. | 6.125 | 7/1/2015 | 486,325 |
| 650,000 | IASIS Healthcare, LLC (IASIS Capital Corporation) | 8.750 | 6/15/2014 | 666,250 |
| 855,000 | Jostens Holding Corporation(d) | 10.250 | 12/1/2008 | 617,738 |
| 500,000 | Lifecare Holdings, Inc. | 9.250 | 8/15/2013 | 370,000 |
| 600,000 | Michael Foods, Inc. | 8.000 | 11/15/2013 | 609,000 |
| 1,160,000 | Roundy’s, Inc. | 8.875 | 6/15/2012 | 1,278,761 |
| 560,000 | Select Medical Corporation | 7.625 | 2/1/2015 | 519,400 |
| 410,000 | Smithfield Foods, Inc. | 8.000 | 10/15/2009 | 433,062 |
| 160,000 | Smithfield Foods, Inc. | 7.000 | 8/1/2011 | 162,400 |
| 720,000 | Stater Brothers Holdings, Inc. | 8.125 | 6/15/2012 | 703,800 |
| |
| The accompanying notes to the financial statements are an integral part of this schedule. | |
|
155
| High Yield Fund II | | | |
| Schedule of Investments as of October 31, 2005(a) | | | |
| |
| Principal | | Interest | Maturity | |
| Amount | Long-Term Fixed Income (81.6%) | Rate | Date | Value |
|
| Consumer Non-Cyclical -- continued | | | |
| $610,000 | Triad Hospitals, Inc. | 7.000% | 5/15/2012 | $619,150 |
| 620,000 | US Oncology Holdings, Inc.(c) | 9.264 | 3/15/2006 | 607,600 |
| 380,000 | US Oncology, Inc. | 9.000 | 8/15/2012 | 400,900 |
| 210,000 | Vanguard Health Holding Company I, LLC(d) | 11.250 | 10/1/2009 | 147,000 |
| 160,000 | Ventas Realty, LP/Ventas Capital Corporation | 7.125 | 6/1/2015 | 165,200 |
| 350,000 | Warner Chilcott Corporation | 8.750 | 2/1/2015 | 322,000 |
|
|
| | Total Consumer Non-Cyclical | | 10,403,386 |
|
|
| |
| Energy (6.3%) | | | |
| 330,000 | Chesapeake Energy Corporation | 6.375 | 6/15/2015 | 324,225 |
| 580,000 | Chesapeake Energy Corporation | 6.250 | 1/15/2018 | 562,600 |
| 375,000 | EXCO Resources, Inc. | 7.250 | 1/15/2011 | 378,750 |
| 466,000 | Hanover Equipment Trust | 8.500 | 9/1/2008 | 484,640 |
| 580,000 | Harvest Operations Corporation | 7.875 | 10/15/2011 | 562,600 |
| 650,000 | Hornbeck Offshore Services, Inc. | 6.125 | 12/1/2014 | 633,750 |
| 560,000 | Ocean Rig Norway AS | 8.375 | 7/1/2013 | 601,300 |
| 670,000 | Petroleum Geo-Services ASA | 10.000 | 11/5/2010 | 740,350 |
| 490,000 | Pioneer Natural Resources Company | 5.875 | 7/15/2016 | 468,410 |
| 405,000 | Pogo Producing Company | 6.875 | 10/1/2017 | 400,950 |
| 1,190,000 | Premcor Refining Group, Inc. | 6.750 | 5/1/2014 | 1,243,550 |
| 570,000 | Pride International, Inc.(b) | 7.375 | 7/15/2014 | 614,175 |
| 600,000 | SESI, LLC | 8.875 | 5/15/2011 | 628,500 |
| 450,000 | Vintage Petroleum, Inc. | 7.875 | 5/15/2011 | 471,375 |
| 350,000 | Vintage Petroleum, Inc. | 8.250 | 5/1/2012 | 377,125 |
| 610,000 | Western Oil Sands, Inc. | 8.375 | 5/1/2012 | 690,825 |
| 400,000 | Whiting Petroleum Corporation | 7.250 | 5/1/2012 | 403,000 |
| 160,000 | Whiting Petroleum Corporation | 7.000 | 2/1/2014 | 160,400 |
|
|
| | Total Energy | | | 9,746,525 |
|
|
| |
| Financials (1.0%) | | | |
| 591,000 | American Financial Group, Inc., Convertible(d) | Zero Coupon | 6/2/2008 | 255,608 |
| 410,000 | Fairfax Financial Holdings, Ltd.(b) | 7.750 | 4/26/2012 | 377,219 |
| 400,000 | FTI Consulting, Inc. | 7.625 | 6/15/2013 | 408,000 |
| 410,000 | Residential Capital Corporation | 6.375 | 6/30/2010 | 416,455 |
|
|
| | Total Financials | | | 1,457,282 |
|
|
| |
| Technology (3.3%) | | | |
| 280,000 | Electronic Data Systems Corporation, Convertible | 3.875 | 7/15/2023 | 274,050 |
| 160,000 | Flextronics International, Ltd., Convertible | 1.000 | 8/1/2010 | 138,800 |
| 330,000 | Freescale Semiconductor, Inc. | 6.875 | 7/15/2011 | 340,725 |
| 330,000 | Freescale Semiconductor, Inc. | 7.125 | 7/15/2014 | 346,088 |
| 420,000 | MagnaChip Semiconductor SA/MagnaChip | | | |
| | Semiconductor Finance | 6.875 | 12/15/2011 | 394,800 |
| 600,000 | Sanmina-SCI Corporation | 10.375 | 1/15/2010 | 657,000 |
| 100,000 | Sanmina-SCI Corporation(b) | 6.750 | 3/1/2013 | 93,500 |
| 320,000 | SunGard Data Systems, Inc. | 9.125 | 8/15/2013 | 324,800 |
| |
| The accompanying notes to the financial statements are an integral part of this schedule. | |
|
156
| High Yield Fund II | | | |
| Schedule of Investments as of October 31, 2005(a) | | | |
| |
| Principal | | Interest | Maturity | |
| Amount | Long-Term Fixed Income (81.6%) | Rate | Date | Value |
|
| Technology -- continued | | | |
| $650,000 | SunGard Data Systems, Inc. | 10.250% | 8/15/2015 | $644,312 |
| 760,000 | UGS Corporation | 10.000 | 6/1/2012 | 830,300 |
| 120,000 | Unisys Corporation(b) | 7.875 | 4/1/2008 | 114,000 |
| 280,000 | Unisys Corporation(b) | 8.000 | 10/15/2012 | 246,400 |
| 600,000 | Xerox Corporation | 7.625 | 6/15/2013 | 630,000 |
|
|
| | Total Technology | | | 5,034,775 |
|
|
| |
| Transportation (1.4%) | | | |
| 330,000 | H-Lines Finance Holding Corporation(d) | 11.000 | 4/1/2008 | 271,425 |
| 520,000 | Horizon Lines, LLC | 9.000 | 11/1/2012 | 551,850 |
| 580,000 | Progress Rail Services Corporation | 7.750 | 4/1/2012 | 593,050 |
| 829,365 | United Air Lines, Inc.(e) | 7.730 | 7/1/2010 | 800,484 |
|
|
| | Total Transportation | | | 2,216,809 |
|
|
| |
| Utilities (10.2%) | | | |
| 475,000 | AES Corporation(b) | 8.875 | 2/15/2011 | 508,250 |
| 700,000 | AES Corporation | 8.750 | 5/15/2013 | 756,000 |
| 660,000 | AmeriGas Partners, LP | 7.250 | 5/20/2015 | 683,100 |
| 580,000 | Calpine Generating Company, LLC(c) | 9.804 | 12/1/2005 | 585,800 |
| 601,160 | CE Generation, LLC | 7.416 | 12/15/2018 | 638,026 |
| 488,700 | Cedar Brakes II, LLC | 9.875 | 9/1/2013 | 560,905 |
| 490,000 | Colorado Interstate Gas Company | 6.800 | 11/15/2015 | 492,450 |
| 410,000 | Consumers Energy Company | 6.300 | 2/1/2012 | 406,925 |
| 160,000 | Dominion Resources, Inc., Convertible | 2.125 | 12/15/2023 | 174,400 |
| 710,000 | Dynegy Holdings, Inc. | 9.875 | 7/15/2010 | 763,250 |
| 420,000 | Dynegy Holdings, Inc.(b) | 6.875 | 4/1/2011 | 402,150 |
| 1,400,000 | Edison Mission Energy | 9.875 | 4/15/2011 | 1,631,000 |
| 1,005,000 | El Paso Corporation(b) | 7.375 | 12/15/2012 | 999,975 |
| 290,000 | El Paso Corporation | 7.800 | 8/1/2031 | 287,825 |
| 75,000 | El Paso Natural Gas Corporation | 7.625 | 8/1/2010 | 78,707 |
| 150,000 | Ipalco Enterprises, Inc. | 8.375 | 11/14/2008 | 156,000 |
| 500,000 | Ipalco Enterprises, Inc.(b) | 8.625 | 11/14/2011 | 541,250 |
| 500,000 | Midwest Generation, LLC | 8.750 | 5/1/2034 | 547,500 |
| 260,000 | Mission Energy Holding Company | 13.500 | 7/15/2008 | 300,950 |
| 825,000 | NRG Energy, Inc. | 8.000 | 12/15/2013 | 899,250 |
| 170,000 | Pacific Energy Partners, LP/Pacific | | | |
| | Energy Finance Corporation | 7.125 | 6/15/2014 | 176,800 |
| 200,000 | Pacific Energy Partners, LP/Pacific | | | |
| | Energy Finance Corporation | 6.250 | 9/15/2015 | 197,500 |
| 550,000 | Sonat, Inc. | 7.625 | 7/15/2011 | 552,750 |
| 410,000 | Southern Natural Gas Company | 7.350 | 2/15/2031 | 409,699 |
| 610,000 | Southern Star Central Corporation | 8.500 | 8/1/2010 | 648,125 |
| 240,000 | Targa Resources, Inc. | 8.500 | 11/1/2013 | 243,600 |
| 460,000 | Texas Genco, LLC/Texas Genco Financing Corporation | 6.875 | 12/15/2014 | 492,200 |
| | | | |
The accompanying notes to the financial statements are an integral part of this schedule. | | | |
|
157
| High Yield Fund II | | | |
| Schedule of Investments as of October 31, 2005(a) | | | |
| |
| Principal | | Interest | Maturity | |
| Amount | Long-Term Fixed Income (81.6%) | Rate | Date | Value |
|
| Utilities -- continued | | | |
| $610,000 | Williams Companies, Inc.(b) | 7.625% | 7/15/2019 | $646,600 |
| 475,000 | Williams Companies, Inc. | 7.875 | 9/1/2021 | 512,406 |
| 410,000 | Williams Companies, Inc. | 8.750 | 3/15/2032 | 473,038 |
|
|
| | Total Utilities | | | 15,766,431 |
|
|
| | Total Long-Term Fixed Income (cost $125,008,830) | 125,583,603 |
|
|
| |
| |
| Shares | Preferred Stock (1.0%) | | | Value |
|
| 7,000 | CenterPoint Energy, Inc., Convertible(f) | | | $241,892 |
| 918 | Sovereign Real Estate Investment Corporation | | | 1,321,920 |
|
|
| | Total Preferred Stock (cost $1,600,800) | | 1,563,812 |
|
|
| |
| |
| Shares | Common Stock(g) | | | Value |
|
| 750 | Arcadia Financial, Ltd., Stock Warrants(f,h) | | | $0 |
| 735 | ICG Communications, Inc., Stock Rights(f,h) | | | 0 |
| 3 | Orion Refining Corporation (f,h,i) | | | 0 |
| 500 | Unifi Communications, Inc., Stock Warrants(f,h,i) | | | 0 |
|
|
| | Total Common Stock (cost $27,847) | | 0 |
|
|
| |
| |
| | | Interest | Maturity | |
| Shares | Collateral Held for Securities Loaned (14.5%) | Rate(j) | Date | Value |
|
| 22,348,675 | Thrivent Financial Securities Lending Trust | 3.950% | N/A | $22,348,675 |
|
|
| | Total Collateral Held for Securities Loaned | |
| | (cost $22,348,675) | | | 22,348,675 |
|
|
| |
| |
| |
| |
| The accompanying notes to the financial statements are an integral part of this schedule. | |
|
158
| High Yield Fund II | | | |
| Schedule of Investments as of October 31, 2005(a) | | | |
| | | Interest | Maturity | |
| Shares | Short-Term Investments (2.9%) | Rate(j) | Date | Value |
|
| 4,387,353 | Thrivent Money Market Fund | 3.600% | N/A | $4,387,353 |
|
|
| | Total Short-Term Investments (at amortized cost) | 4,387,353 |
|
|
| | Total Investments (cost $153,373,505) | | $153,883,443 |
|
|
| (a) | The categories of investments are shown as a percentage of total investments. |
| |
| (b) | All or a portion of the security is on loan as discussed in item 2(L) of the Notes to Financial Statements. |
| |
| (c) | Denotes variable rate obligations for which the current yield and next scheduled reset date are shown. |
| |
| (d) | Denotes step coupon bonds for which the current interest rate and next scheduled reset date are shown. |
| |
| (e) | In bankruptcy. |
| |
| (f) | Non-income producing security. |
| |
| (g) | The market value of the denoted categories of investments represents less than 0.1% of the total investments of the Thrivent High Yield Fund II. |
| |
| (h) | Security is fair valued as discussed in the notes to the financial statements. |
| |
| (i) | Denotes restricted securities. Restricted securities are investment securities which cannot be offered for public sale without first being registered under the Securities Act of 1933. These securities have been valued from the date of acquisition through October 31, 2005, by obtaining quotations from brokers active with these securities. The following table indicates the acquisition date and cost of restricted securities the Fund owned as of October 31, 2005. |
| |
| | | Acquisition | |
| | Security | Date | Cost |
|
|
| | Orion Refining Corporation | 8/3/2001 | $0 |
| | Unifi Communications, Inc., Stock Warrants | 2/14/1997 | 6,525 |
| |
| (j) | The interest rate shown reflects the yield, coupon rate or, for securities purchased at a discount, the discount rate at the date of purchase. |
The accompanying notes to the financial statements are an integral part of this schedule. |
|
| 159 | |
| | Municipal Bond Fund | | |
| | Schedule of Investments as of October 31, 2005(a) | | |
| Principal | | Interest | Maturity | |
| Amount | Long-Term Fixed Income (99.0%) | Rate | Date | Value |
|
| Alabama (0.1%) | | | |
| $1,000,000 | Alabama 21st Century Authority Tobacco Settlement | | | |
| | Revenue Bonds | 5.750% | 12/1/2020 | $1,041,450 |
|
|
| | Total Alabama | | | 1,041,450 |
|
|
| |
| Alaska (0.5%) | | | |
| 3,155,000 | Alaska Energy Authority Power Revenue Refunding Bonds | | | |
| | (Bradley Lake) (Series 5) (FSA Insured) | 5.000 | 7/1/2021 | 3,240,784 |
| 3,110,000 | Northern Tobacco Securitization Corporation, Alaska | | | |
| | Tobacco Settlement Revenue Bonds | 6.200 | 6/1/2022 | 3,241,491 |
|
|
| | Total Alaska | | | 6,482,275 |
|
|
| |
| Arizona (2.0%) | | | |
| 780,000 | Arizona Health Facilities Authority Revenue Bonds | | | |
| | (Arizona Healthcare Pooled Financing) (FGIC Insured) | 4.250 | 6/1/2006 | 785,351 |
| 815,000 | Arizona Health Facilities Authority Revenue Bonds | | | |
| | (Arizona Healthcare Pooled Financing) (FGIC Insured) | 4.500 | 6/1/2007 | 831,031 |
| 975,000 | Arizona Health Facilities Authority Revenue Bonds | | | |
| | (Arizona Healthcare Pooled Financing) (FGIC Insured) | 5.000 | 6/1/2011 | 1,037,312 |
| 1,020,000 | Arizona Health Facilities Authority Revenue Bonds | | | |
| | (Arizona Healthcare Pooled Financing) (FGIC Insured) | 5.000 | 6/1/2012 | 1,083,903 |
| 1,000,000 | Arizona Health Facilities Authority Revenue Bonds | | | |
| | (Blood Systems, Inc.) | 5.000 | 4/1/2017 | 1,044,200 |
| 1,200,000 | Arizona Health Facilities Authority Revenue Bonds | | | |
| | (Blood Systems, Inc.) | 5.000 | 4/1/2018 | 1,235,652 |
| 500,000 | Glendale, Arizona Industrial Development Authority | | | |
| | (Midwestern University) (Series A) | 5.750 | 5/15/2021 | 541,360 |
| 13,000,000 | Phoenix, Arizona Civic Improvement Corporation Transit | | | |
| | Excise Tax Revenue Bonds (Light Rail Project) | 5.000 | 7/1/2016 | 13,864,630 |
| 2,000,000 | Phoenix, Arizona Industrial Development Authority | | | |
| | Government Office Lease Revenue Bonds (Capital Mall | | | |
| | Project) (AMBAC Insured)(b) | 5.375 | 9/15/2020 | 2,167,320 |
| 50,000 | Phoenix, Arizona Industrial Development Authority | | | |
| | Single Family Mortgage Revenue Bonds (Series 1A) | | | |
| | (GNMA/FNMA/FHLMC Insured) | 5.875 | 6/1/2016 | 50,718 |
| 1,285,000 | Pima County, Arizona Industrial Development Authority | | | |
| | Multifamily Bonds (La Hacienda Project) | | | |
| | (GNMA/FHA Insured) | 7.000 | 12/20/2031 | 1,377,661 |
| 1,000,000 | Pinal County, Arizona Unified School District #43 | | | |
| | Apache Junction Bonds (Series A) (FGIC Insured)(b) | 5.800 | 7/1/2011 | 1,027,950 |
| 500,000 | Yavapai County, Arizona Hospital Revenue Bonds | | | |
| | (Yavapai Regional Medical Center) (Series A) | 6.000 | 8/1/2033 | 527,140 |
|
|
| | Total Arizona | | | 25,574,228 |
|
|
The accompanying notes to the financial statements are an integral part of this schedule. |
| |
|
160
| Municipal Bond Fund | | | | |
| Schedule of Investments as of October 31, 2005(a) | | | | |
| |
| Principal | | | Interest | Maturity | |
| Amount | Long-Term Fixed Income (99.0%) | | Rate | Date | Value |
|
| Arkansas (0.6%) | | | | |
| $560,000 | Arkansas Housing Development Agency Single Family | | | |
| | Mortgage Revenue Bonds (FHA Insured)(b) | | 8.375% | 7/1/2010 | $626,886 |
| 2,400,000 | Arkansas State Community Water System Public Water | | | |
| | Authority Revenue Bonds (Series B) (MBIA Insured) | 5.000 | 10/1/2023 | 2,474,808 |
| 3,000,000 | Jonesboro, Arkansas Residential Housing and Health Care | | | |
| | Facilities Revenue Bonds (St. Bernards Regional Medical | | | |
| | Center) (AMBAC Insured) | | 5.800 | 7/1/2011 | 3,107,400 |
| 875,000 | Pope County, Arkansas Pollution Control Revenue Bonds | | | |
| | (Arkansas Power and Light Company Project) (FSA Insured) | 6.300 | 12/1/2016 | 886,270 |
|
|
| | Total Arkansas | | | | 7,095,364 |
|
|
| |
| California (10.5%) | | | | |
| 3,950,000 | Anaheim, California Public Financing Authority Lease | | | |
| | Revenue Bonds (Public Improvements Project) (Series A) | | | |
| | (FSA Insured) | | 6.000 | 9/1/2024 | 4,637,656 |
| 5,000,000 | California Infrastructure & Economic Bank Revenue Bonds | | | |
| | (Bay Area Toll Bridges) (1st Lien-A) | | 5.000 | 7/1/2025 | 5,196,300 |
| 145,000 | California Rural Home Mortgage Finance Authority Single | | | |
| | Family Mortgage Revenue Bonds (Series D) | | | | |
| | (GNMA/FNMA Insured)(Subject to ‘AMT’) | | 7.100 | 6/1/2031 | 146,341 |
| 5,000,000 | California State Department of Water Resources Supply | | | |
| | Revenue Bonds (Series A) (AMBAC Insured) | | 5.375 | 5/1/2018 | 5,422,500 |
| 10,000,000 | California State General Obligation Bonds | | 5.000 | 2/1/2020 | 10,318,300 |
| 2,000,000 | California State General Obligation Bonds | | | | |
| | (AMBAC Insured) | | 6.300 | 9/1/2010 | 2,257,060 |
| 3,000,000 | California State Public Works Board Lease Revenue Bonds | | | |
| | (Department of Corrections State Prison) | | 7.400 | 9/1/2010 | 3,496,530 |
| 4,000,000 | California State Public Works Board Lease Revenue Bonds | | | |
| | (UCLA Replacement Hospital) (Series A) (FSA Insured) | 5.375 | 10/1/2015 | 4,341,680 |
| 1,500,000 | California State Revenue General Obligation Bonds | 7.000 | 8/1/2006 | 1,544,085 |
| 2,000,000 | California State Revenue General Obligation Bonds | 5.250 | 11/1/2021 | 2,117,680 |
| 10,000,000 | California State Revenue General Obligation Bonds | 5.250 | 4/1/2029 | 10,441,600 |
| 1,000,000 | California State Unrefunded Balance General | | | | |
| | Obligation Bonds | | 5.250 | 12/1/2019 | 1,058,310 |
| 300,000 | California State Unrefunded General Obligation Bonds | | | |
| | (MBIA Insured) | | 6.000 | 8/1/2016 | 305,181 |
| 2,000,000 | California State Veterans General Obligation Revenue | | | |
| | Bonds (FGIC) (Series AT) | | 9.500 | 2/1/2010 | 2,447,160 |
| 105,000 | Central Valley Financing Authority, California | | | | |
| | Cogeneration Project Revenue Bonds | | | | |
| | (Carson Ice-Gen Project) | | 6.000 | 7/1/2009 | 105,581 |
| 4,030,000 | Contra Costa County, California Home Mortgage Revenue | | | |
| | Bonds (GNMA Insured) (Escrowed to Maturity)(b) | | 7.500 | 5/1/2014 | 5,020,896 |
| 5,000,000 | Foothill/Eastern Transportation Corridor Agency, | | | | |
| | California Toll Road Revenue Bonds (Series A)(b) | Zero Coupon | 1/1/2009 | 5,582,050 |
| |
| |
| The accompanying notes to the financial statements are an integral part of this schedule. | |
|
|
161
| Municipal Bond Fund | | | |
| Schedule of Investments as of October 31, 2005(a) | | | |
| |
| Principal | | Interest | Maturity | |
| Amount | Long-Term Fixed Income (99.0%) | Rate | Date | Value |
|
| California -- continued | | | |
| $5,000,000 | Foothill/Eastern Transportation Corridor Agency, | | | |
| | California Toll Road Revenue Bonds (Series A)(b) | Zero Coupon | 1/1/2011 | $5,824,300 |
| 6,000,000 | Foothill/Eastern Transportation Corridor Agency, | | | |
| | California Toll Road Revenue Bonds (Series A)(b) | Zero Coupon | 1/1/2013 | 7,000,740 |
| 7,145,000 | Foothill/Eastern Transportation Corridor Agency, | | | |
| | California Toll Road Revenue Bonds (Series A)(b) | Zero Coupon | 1/1/2014 | 8,336,715 |
| 420,000 | Golden West Schools Financing Authority, California | | | |
| | Revenue Bonds (Series A) (MBIA Insured) | 5.800% | 2/1/2022 | 489,842 |
| 3,015,000 | Los Angeles, California Department of Water & Power | | |
| | Waterworks Revenue Bonds | 5.000 | 7/1/2025 | 3,135,118 |
| 2,385,000 | Orange County, California Recovery Certificates Of | | | |
| | Participation Bonds (Series A)(MBIA Insured)(b) | 5.800 | 7/1/2016 | 2,476,989 |
| 5,000,000 | Pittsburg, California Redevelopment Agency Tax | | | |
| | Allocation Bonds (Los Medanos Community | | | |
| | Development Project) (AMBAC Insured) | Zero Coupon | 8/1/2024 | 1,992,150 |
| 4,200,000 | Pomona, California Single Family Mortgage | | | |
| | Revenue Bonds (Series A) (GNMA/FNMA Insured)(b) | 7.600 | 5/1/2023 | 5,377,428 |
| 1,500,000 | San Bernardino County, California Single Family | | | |
| | Mortgage Revenue Bonds (Series A) (GNMA Insured) | 7.500 | 5/1/2023 | 1,906,965 |
| 1,500,000 | San Francisco, California Bay Area Rapid Transit | | | |
| | District Sales Tax Revenue Bonds (AMBAC Insured) | 6.750 | 7/1/2010 | 1,717,620 |
| 15,000,000 | San Joaquin Hills Transportation Corridor Agency, | | | |
| | California Toll Road Revenue Bonds(b) | 7.650 | 1/1/2013 | 16,705,800 |
| 2,760,000 | San Jose, California Redevelopment Agency Tax | | | |
| | Allocation Bonds (Series A) (MBIA Insured) | 5.000 | 8/1/2025 | 2,858,891 |
| 10,000,000 | Southern California Public Power Authority Power | | | |
| | Project Revenue Bonds (Magnolia Power Project) | | | |
| | (Series A) (2003-1) (AMBAC Insured) | 5.000 | 7/1/2036 | 10,261,700 |
|
|
| | Total California | | | 132,523,168 |
|
|
| |
| Colorado (5.0%) | | | |
| 2,000,000 | Colorado Educational and Cultural Facilities Authority | | |
| | Revenue Bonds (Bromley East Project) (Series A)(b) | 7.250 | 9/15/2030 | 2,374,700 |
| 570,000 | Colorado Educational and Cultural Facilities Authority | | |
| | Revenue Bonds (Cherry Creek Academy Facility, Inc.) | 6.000 | 4/1/2021 | 577,729 |
| 1,280,000 | Colorado Educational and Cultural Facilities Authority | | |
| | Revenue Bonds (Cherry Creek Academy Facility, Inc.) | 6.000 | 4/1/2030 | 1,296,768 |
| 2,825,000 | Colorado Educational and Cultural Facilities Authority | | |
| | Revenue Bonds (Classical Academy)(b) | 7.250 | 12/1/2030 | 3,378,163 |
| 750,000 | Colorado Educational and Cultural Facilities Authority | | |
| | Revenue Bonds (Pinnacle Charter School Project)(b) | 5.250 | 12/1/2011 | 783,675 |
| 1,000,000 | Colorado Educational and Cultural Facilities Authority | | |
| | Revenue Bonds (University Lab School Project)(b) | 5.750 | 6/1/2016 | 1,106,680 |
| 750,000 | Colorado Educational and Cultural Facilities Authority | | |
| | Revenue Bonds (University Lab School Project)(b) | 6.125 | 6/1/2021 | 844,095 |
| |
| |
| The accompanying notes to the financial statements are an integral part of this schedule. | |
|
162
| Municipal Bond Fund | | | | |
| Schedule of Investments as of October 31, 2005(a) | | | | |
| |
| Principal | | | Interest | Maturity | |
| Amount | Long-Term Fixed Income (99.0%) | | Rate | Date | Value |
|
| Colorado -- continued | | | | |
| $6,250,000 | Colorado Educational and Cultural Facilities Authority | | | |
| | Revenue Bonds (University Lab School Project)(b) | | 6.250% | 6/1/2031 | $7,073,250 |
| 1,000,000 | Colorado Health Facilities Authority Revenue Bonds | | | | |
| | (Evangelical Lutheran Good Samaritan) | | 6.250 | 12/1/2010 | 1,094,260 |
| 5,000,000 | Colorado Health Facilities Authority Revenue Bonds | | | | |
| | (Evangelical Lutheran Good Samaritan) | | 6.800 | 12/1/2020 | 5,684,450 |
| 1,000,000 | Colorado Health Facilities Authority Revenue Bonds | | | | |
| | (Parkview Medical Center Project) | | 6.500 | 9/1/2020 | 1,099,300 |
| 500,000 | Colorado Health Facilities Authority Revenue Bonds | | | | |
| | (Parkview Medical Center Project) | | 6.600 | 9/1/2025 | 547,900 |
| 210,000 | Colorado Housing and Finance Authority Revenue Bonds | | | |
| | (Single Family Program) (Series A-2) (Subject to ‘AMT’) | 7.450 | 10/1/2016 | 214,276 |
| 130,000 | Colorado Housing and Finance Authority Revenue Bonds | | | |
| | (Single Family Program) (Series A-3) | | 7.250 | 4/1/2010 | 133,125 |
| 840,000 | Colorado Housing and Finance Authority Revenue Bonds | | | |
| | (Single Family Program) (Series B-3) | | 6.700 | 8/1/2017 | 859,891 |
| 105,000 | Colorado Housing and Finance Authority Revenue Bonds | | | |
| | (Single Family Program) (Series C-3) (FHA/VA Insured) | 7.150 | 10/1/2030 | 107,102 |
| 80,000 | Colorado Housing and Finance Authority Single Family | | | |
| | Revenue Bonds (Series A-3) | | 7.000 | 11/1/2016 | 80,732 |
| 935,000 | Colorado Housing and Finance Authority Single Family | | | |
| | Revenue Bonds (Series D-2) (Subject to ‘AMT’) | | 6.350 | 11/1/2029 | 964,004 |
| 70,000 | Colorado Water Resources and Power Development | | | | |
| | Authority Clean Water Revenue Unrefunded Bonds | | | | |
| | (Series A) (FSA Insured) | | 6.250 | 9/1/2013 | 70,303 |
| 3,525,000 | Colorado Water Resources and Power Development | | | | |
| | Authority Small Water Resources Revenue Bonds | | | | |
| | (Series A) (FGIC Insured) | | 5.250 | 11/1/2021 | 3,751,693 |
| 5,000,000 | Denver, Colorado City and County Airport Revenue | | | | |
| | Bonds (Series A) | | 5.000 | 11/15/2022 | 5,187,700 |
| 6,000,000 | Denver, Colorado City and County Bonds | | 5.600 | 10/1/2029 | 6,584,340 |
| 200,000 | Denver, Colorado Health and Hospital Authority | | | | |
| | Healthcare Revenue Bonds (Series A) | | 5.250 | 12/1/2010 | 206,550 |
| 200,000 | Denver, Colorado Health and Hospital Authority | | | | |
| | Healthcare Revenue Bonds (Series A) | | 5.250 | 12/1/2011 | 206,496 |
| 2,000,000 | Denver, Colorado Health and Hospital Authority | | | | |
| | Healthcare Revenue Bonds (Series A) (ACA/ CBI Insured) | 6.250 | 12/1/2016 | 2,116,660 |
| 1,890,000 | Goldsmith, Colorado Metropolitan District Capital | | | | |
| | Appreciation General Obligation Bonds | | | | |
| | (MBIA Insured) | | Zero Coupon | 6/1/2007 | 1,795,708 |
| 1,890,000 | Goldsmith, Colorado Metropolitan District Capital | | Zero Coupon | 6/1/2008 | 1,722,622 |
| 1,885,000 | Goldsmith, Colorado Metropolitan District Capital | | | | |
| | Appreciation General Obligation Bonds | | | | |
| | (MBIA Insured) | | Zero Coupon | 12/1/2008 | 1,684,888 |
| 3,000,000 | Larimer County, Colorado School District # R 1 | | | | |
| | Poudre Valley (MBIA/IBC Insured) | | 7.000 | 12/15/2016 | 3,755,040 |
| |
| The accompanying notes to the financial statements are an integral part of this schedule. | |
|
163
| Municipal Bond Fund | | | | |
| Schedule of Investments as of October 31, 2005(a) | | | | |
| |
| Principal | | | Interest | Maturity | |
| Amount | Long-Term Fixed Income (99.0%) | | Rate | Date | Value |
|
| Colorado -- continued | | | | |
| $4,000,000 | Northwest Parkway Public Highway Authority, | | | | |
| | Colorado Capital Appreciation Revenue Bonds | | | | |
| | (Series C) (AMBAC Insured)(c) | | Zero Coupon | 6/15/2011 | $3,333,160 |
| 3,500,000 | Regional Transportation District, Colorado, Sales | | | | |
| | Tax Revenue Bonds (Series B) (AMBAC Insured)(b) | | 5.500% | 11/1/2021 | 3,887,415 |
|
|
| | Total Colorado | | | | 62,522,675 |
|
|
| |
| Connecticut (0.5%) | | | | |
| 2,000,000 | Connecticut State Health and Educational Facilities | | | |
| | Authority Revenue Bonds (Yale University) (Series W) | 5.125 | 7/1/2027 | 2,082,740 |
| 4,000,000 | Connecticut State Special Tax Obligation Revenue Bonds | | | |
| | (Transportation Infrastructure) (Series B) | | 6.500 | 10/1/2010 | 4,510,080 |
|
|
| | Total Connecticut | | | 6,592,820 |
|
|
| |
| District of Columbia (0.7%) | | | | |
| 7,570,000 | District of Columbia Tobacco Settlement Financing | | | |
| | Corporation Revenue Bonds | | 6.250 | 5/15/2024 | 8,051,603 |
|
|
| | Total District of Columbia | | 8,051,603 |
|
|
| |
| Florida (1.5%) | | | | |
| 588,000 | Brevard County, Florida Housing Finance Authority | | | |
| | Homeowner Mortgage Revenue Bonds (Series B) | | | | |
| | (GNMA Insured) | | 6.500 | 9/1/2022 | 595,191 |
| 1,350,000 | Clay County, Florida Housing Finance Authority Single | | | |
| | Family Mortgage Revenue Bonds (GNMA/FNMA Insured) | | | |
| | (Subject to ‘AMT’) | | 6.000 | 4/1/2029 | 1,371,762 |
| 750,000 | Florida Intergovernmental Finance Commission Capital | | | |
| | Revenue Bonds(b) | | 5.125 | 5/1/2021 | 809,272 |
| 620,000 | Florida State Board of Education Capital Outlay | | | | |
| | Unrefunded General Obligation Bonds (MBIA Insured) | 9.125 | 6/1/2014 | 787,288 |
| 1,520,000 | Florida State Revenue Bonds (Jacksonville Transportation) | 5.000 | 7/1/2019 | 1,570,266 |
| 2,000,000 | Highlands County, Florida Health Facilities Authority | | | |
| | Revenue Bonds (Adventist Health System/Sunbelt, Inc.) | | | |
| | (Series A) | | 6.000 | 11/15/2031 | 2,155,740 |
| 1,500,000 | Jacksonville, Florida Health Facilities Authority | | | | |
| | Revenue Bonds (Series C)(b) | | 5.750 | 8/15/2015 | 1,643,430 |
| 1,145,000 | Leon County, Florida Educational Facilities Authority | | | |
| | Certificates of Participation(b) | | 8.500 | 9/1/2017 | 1,589,695 |
| 225,000 | Manatee County, Florida Housing Finance Authority | 7.200 | 5/1/2028 | 228,920 |
| 1,320,000 | Orange County, Florida Health Facilities Authority | | | |
| | Revenue Bonds (Adventist Health Systems)(b) | | 5.750 | 11/15/2008 | 1,413,390 |
| 1,000,000 | Orange County, Florida Health Facilities Authority | | | |
| | Revenue Bonds (Adventist Health Systems)(b) | | 5.850 | 11/15/2010 | 1,108,060 |
| 2,000,000 | Orange County, Florida Health Facilities Authority | | | |
| | Revenue Bonds (Orlando Regional Healthcare System) | | | |
| | (Series A) (MBIA Insured) | | 6.250 | 10/1/2018 | 2,365,740 |
| |
| The accompanying notes to the financial statements are an integral part of this schedule. | |
|
164
| Municipal Bond Fund | | | |
| Schedule of Investments as of October 31, 2005(a) | | | |
| |
| Principal | | Interest | Maturity | |
| Amount | Long-Term Fixed Income (99.0%) | Rate | Date | Value |
|
| Florida -- continued | | | |
| $765,000 | Orange County, Florida Housing Finance Authority | | | |
| | Homeowner Revenue Bonds (Series B-1) | | | |
| | (GNMA/FNMA Insured) (Subject to ‘AMT’) | 5.900% | 9/1/2028 | $776,720 |
| 2,500,000 | Orlando, Florida Utilities Community Water & Electric | | | |
| | Revenue Bonds | 5.250 | 10/1/2019 | 2,689,600 |
| 220,000 | Palm Beach County, Florida Housing Finance Authority | | | |
| | Single Family Homeowner Revenue Bonds (Series A-1) | | | |
| | (GNMA/FNMA Insured) (Subject to ‘AMT’) | 5.900 | 10/1/2027 | 223,370 |
|
|
| | Total Florida | | | 19,328,444 |
|
|
| |
| Georgia (3.0%) | | | |
| 6,900,000 | Bibb County, Georgia Authority Environmental Imput | | | |
| | Revenue Bonds | 4.850 | 12/1/2009 | 7,048,281 |
| 2,000,000 | Brunswick, Georgia Water and Sewer Revenue Refunding | | | |
| | Bonds (MBIA Insured) | 6.000 | 10/1/2011 | 2,164,920 |
| 1,500,000 | Brunswick, Georgia Water and Sewer Revenue Refunding | | | |
| | Bonds (MBIA Insured) | 6.100 | 10/1/2019 | 1,766,340 |
| 1,560,000 | Chatham County, Georgia Hospital Authority Revenue | | | |
| | Bonds (C/O Memorial Medical Center) | 5.750 | 1/1/2029 | 1,664,411 |
| 1,000,000 | Chatham County, Georgia Hospital Authority Revenue | | | |
| | Bonds (Memorial Health University Medical Center) | 6.125 | 1/1/2024 | 1,082,390 |
| 5,000,000 | Cherokee County, Georgia Water and Sewer Authority | | | |
| | Revenue Refunding Bonds (MBIA Insured) | 5.500 | 8/1/2018 | 5,607,000 |
| 1,000,000 | Georgia State General Obligation Bonds (Series B) | 6.300 | 3/1/2009 | 1,094,090 |
| 1,000,000 | Georgia State General Obligation Bonds (Series B) | 6.300 | 3/1/2010 | 1,115,740 |
| 2,000,000 | Georgia State General Obligation Bonds (Series B) | 5.650 | 3/1/2012 | 2,222,880 |
| 3,500,000 | Georgia State General Obligation Bonds (Series D) | 5.000 | 8/1/2012 | 3,767,015 |
| 1,000,000 | McDuffie County, Georgia Development Authority | | | |
| | Waste Disposal Revenue Bonds (Adj-Temple-Inland | | | |
| | Forest Products) | 6.950 | 12/1/2023 | 1,107,140 |
| 2,500,000 | Milledgeville-Balswin County, Georgia Development | | | |
| | Authority Revenue Bonds | 5.500 | 9/1/2024 | 2,567,550 |
| 5,000,000 | Rockdale County, Georgia Water and Sewer Authority | | | |
| | Revenue Bonds (Series A) (MBIA Insured)(b) | 5.500 | 7/1/2025 | 5,447,450 |
| 1,500,000 | Savannah, Georgia Economic Development Authority | | | |
| | Student Housing Revenue Bonds (State University | | | |
| | Project) (Series A)(ACA Insured) | 6.750 | 11/15/2020 | 1,650,180 |
|
|
| | Total Georgia | | | 38,305,387 |
|
|
The accompanying notes to the financial statements are an integral part of this schedule.
165
| Municipal Bond Fund | | | | |
| Schedule of Investments as of October 31, 2005(a) | | | | |
| |
| Principal | | | Interest | Maturity | |
| Amount | Long-Term Fixed Income (99.0%) | | Rate | Date | Value |
|
| Hawaii (1.8%) | | | | |
| $7,330,000 | Hawaii State Highway Revenue Bonds | | 5.500% | 7/1/2018 | $8,280,994 |
| 1,000,000 | Honolulu, Hawaii City & County Revenue Bonds | | | | |
| | (Series A) (FSA Insured)(b) | | 5.250 | 9/1/2024 | 1,087,640 |
| 10,000,000 | Honolulu, Hawaii City & County Revenue Bonds | | | | |
| | (Series A) (FSA Insured) | | 5.250 | 3/1/2027 | 10,558,900 |
| 2,555,000 | Honolulu, Hawaii City & County Revenue Bonds | | | | |
| | (Unrefunded Balance) (Series A) (FGIC Insured) | | 6.250 | 4/1/2014 | 2,971,976 |
|
|
| | Total Hawaii | | | | 22,899,510 |
|
|
| |
| Idaho (0.4%) | | | | |
| 1,000,000 | Idaho Falls, Idaho General Obligation Bonds | | | | |
| | (FGIC Insured) | | Zero Coupon | 4/1/2007 | 954,070 |
| 3,115,000 | Idaho Falls, Idaho General Obligation Bonds | | | | |
| | (FGIC Insured) | | Zero Coupon | 4/1/2010 | 2,619,092 |
| 2,000,000 | Idaho Falls, Idaho General Obligation Bonds | | | | |
| | (FGIC Insured) | | Zero Coupon | 4/1/2011 | 1,604,800 |
|
|
| | Total Idaho | | | | 5,177,962 |
|
|
| |
| Illinois (9.0%) | | | | |
| 2,000,000 | Broadview, Illinois Tax Increment Tax Allocation Bonds | 5.250 | 7/1/2012 | 2,063,600 |
| 1,000,000 | Broadview, Illinois Tax Increment Tax Allocation | | | | |
| | Revenue Bonds | | 5.375 | 7/1/2015 | 1,028,490 |
| 10,000,000 | Chicago, Illinois Capital Appreciation City Colleges | | | | |
| | General Obligation Bonds (FGIC Insured) | | Zero Coupon | 1/1/2024 | 4,203,100 |
| 3,000,000 | Chicago, Illinois Lakefront Millennium Project | | | | |
| | General Obligation Bonds (MBIA Insured) | | Zero Coupon | 1/1/2029 | 3,130,950 |
| 60,000 | Chicago, Illinois Single Family Mortgage Revenue | | | | |
| | Bonds (Series A) (GNMA/FNMA/FHLMC Insured) | | | | |
| | (Subject to ‘AMT’) | | 7.250 | 9/1/2028 | 60,701 |
| 375,000 | Chicago, Illinois Single Family Mortgage Revenue | | | | |
| | Bonds (Series C) (GNMA/FNMA/FHLMC Insured) | | | | |
| | (Subject to ‘AMT’) | | 7.050 | 10/1/2030 | 374,332 |
| 200,000 | Chicago, Illinois Single Family Mortgage Revenue | | | | |
| | Bonds (Series C) (GNMA/FNMA/FHLMC Insured) | | | | |
| | (Subject to ‘AMT’) | | 7.000 | 3/1/2032 | 206,512 |
| 7,200,000 | Chicago, Illinois Tax Increment Capital Appreciation | | | | |
| | Tax Allocation Bonds (Series A) (ACA Insured) | | Zero Coupon | 11/15/2014 | 4,476,816 |
| 1,000,000 | Cook County, Illinois Community Consolidated | | | | |
| | School District #15 Palatine Capital Appreciation | | | | |
| | General Obligation Bonds (FGIC Insured) | | Zero Coupon | 12/1/2014 | 672,420 |
| 2,500,000 | Cook County, Illinois General Obligation Bonds | | | | |
| | (Series A) (MBIA Insured) | | 6.250 | 11/15/2011 | 2,841,850 |
| 1,250,000 | Cook County, Illinois School District #99 Cicero | | | | |
| | General Obligation Bonds (FGIC Insured) | | 8.500 | 12/1/2011 | 1,560,725 |
| 1,565,000 | Cook County, Illinois School District #99 Cicero | | | | |
| | General Obligation Bonds (FGIC Insured) | | 8.500 | 12/1/2014 | 2,083,907 |
| |
| The accompanying notes to the financial statements are an integral part of this schedule. | |
|
166
| Municipal Bond Fund | | | | |
| Schedule of Investments as of October 31, 2005(a) | | | | |
| |
| Principal | | | Interest | Maturity | |
| Amount | Long-Term Fixed Income (99.0%) | | Rate | Date | Value |
|
| Illinois -- continued | | | | |
| $1,815,000 | Cook County, Illinois School District #99 Cicero | | | | |
| | General Obligation Bonds (FGIC Insured) | | 8.500% | 12/1/2016 | $2,494,718 |
| 1,000,000 | Du Page County, Illinois General Obligation Bonds | | | | |
| | (Stormwater Project) | | 5.600 | 1/1/2021 | 1,121,160 |
| 1,710,000 | Du Page, Cook & Will Counties, Illinois Community | | | | |
| | College District Number 502 | | 5.000 | 1/1/2017 | 1,808,924 |
| 1,000,000 | Illinois Development Finance Authority Revenue | | | | |
| | Bonds (Midwestern University) (Series B) | | 6.000 | 5/15/2021 | 1,092,360 |
| 1,000,000 | Illinois Development Finance Authority Revenue | | | | |
| | Bonds (Midwestern University) (Series B) | | 6.000 | 5/15/2026 | 1,084,640 |
| 2,365,000 | Illinois Development Finance Authority Revenue | | | | |
| | Bonds (School District #304) (Series A) | | | | |
| | (FSA Insured) | | Zero Coupon | 1/1/2021 | 1,159,016 |
| 4,900,000 | Illinois Educational Facilities Authority Revenue | | | | |
| | Bonds (Northwestern University) | | 5.250 | 11/1/2032 | 5,279,064 |
| 1,000,000 | Illinois Educational Facilities Authority Student | | | | |
| | Housing Revenue Bonds (University Center Project) | | 6.625 | 5/1/2017 | 1,099,930 |
| 380,000 | Illinois Health Facilities Authority Prerefunded | | | | |
| | Revenue Bonds (Series B) (MBIA/IBC Insured) | | 5.250 | 8/15/2018 | 403,731 |
| 1,600,000 | Illinois Health Facilities Authority Revenue Bonds | | | | |
| | (Bethesda Home and Retirement)(Series A) | | 6.250 | 9/1/2014 | 1,686,000 |
| 2,000,000 | Illinois Health Facilities Authority Revenue Bonds | | | | |
| | (Centegra Health Systems) | | 5.250 | 9/1/2018 | 2,027,920 |
| 2,000,000 | Illinois Health Facilities Authority Revenue Bonds | | | | |
| | (Lutheran General Health Care Facilities) (FSA Insured) | 6.000 | 4/1/2018 | 2,280,200 |
| 2,500,000 | Illinois Health Facilities Authority Revenue Bonds | | | | |
| | (Passavant Memorial Area Hospital Association) | | 6.000 | 10/1/2024 | 2,700,775 |
| 1,000,000 | Illinois Health Facilities Authority Revenue Bonds | | | | |
| | (Riverside Health System)(b) | | 6.850 | 11/15/2029 | 1,157,240 |
| 4,180,000 | Illinois Health Facilities Authority Revenue Bonds | | | | |
| | (Rush-Presbyterian-St. Lukes) (Series A) (MBIA Insured) | 5.250 | 11/15/2014 | 4,399,157 |
| 3,985,000 | Illinois Health Facilities Authority Revenue Bonds | | | | |
| | (Swedish American Hospital)(b) | | 6.875 | 11/15/2030 | 4,519,309 |
| 4,655,000 | Illinois Health Facilities Authority Revenue Bonds | | | | |
| | (Thorek Hospital and Medical Center) | | 5.250 | 8/15/2018 | 4,741,257 |
| 2,120,000 | Illinois Health Facilities Authority Unrefunded | | | | |
| | Revenue Bonds (Series B) (MBIA/IBC Insured) | | 5.250 | 8/15/2018 | 2,220,573 |
| 2,000,000 | Illinois Sports Facilities Authority State Tax | | | | |
| | Supported Capital Appreciation Revenue Bonds | | | | |
| | (AMBAC Insured) | | Zero Coupon | 6/15/2017 | 1,181,880 |
| 1,500,000 | Illinois Sports Facilities Authority State Tax | | | | |
| | Supported Capital Appreciation Revenue Bonds | | | | |
| | (AMBAC Insured) | | Zero Coupon | 6/15/2018 | 840,915 |
| 1,500,000 | Illinois Sports Facilities Authority State Tax | | | | |
| | Supported Capital Appreciation Revenue Bonds | | | | |
| | (AMBAC Insured) | | Zero Coupon | 6/15/2019 | 798,960 |
| |
| The accompanying notes to the financial statements are an integral part of this schedule. | |
|
167
| Municipal Bond Fund | | | |
| Schedule of Investments as of October 31, 2005(a) | | | |
| |
| Principal | | Interest | Maturity | |
| Amount | Long-Term Fixed Income (99.0%) | Rate | Date | Value |
|
| Illinois -- continued | | | |
| $7,900,000 | Illinois State Sales Tax Revenue Bonds (Second Series) | 5.750% | 6/15/2018 | $9,080,971 |
| 3,065,000 | Illinois State Sales Tax Revenue Bonds (Series L) | 7.450 | 6/15/2012 | 3,699,945 |
| 4,000,000 | Lake & McHenry Counties, Illinois Community | | | |
| | Unit School District No. 118 (Series B) | Zero Coupon | 1/1/2024 | 1,517,160 |
| 3,035,000 | McHenry County, Illinois Community High School | | | |
| | District #157 General Obligation Bonds (FSA Insured) | 9.000 | 12/1/2017 | 4,396,562 |
| 4,000,000 | McLean County, Illinois Bloomington -- Normal | | | |
| | Airport Central Illinois Regional Authority Revenue | | | |
| | Bonds (Subject to ‘AMT’) | 6.050 | 12/15/2019 | 3,999,800 |
| 1,410,000 | Metropolitan Pier and Exposition Authority, Illinois | | | |
| | State Tax Revenue Bonds (McCormick Place | | | |
| | Exposition Project) (FGIC Insured) | 5.250 | 12/15/2028 | 1,462,085 |
| 1,115,000 | Metropolitan Pier and Exposition Authority, Illinois | | | |
| | State Tax Revenue Bonds (McCormick Place | | | |
| | Exposition Project) (Series A)(b) | 5.500 | 6/15/2015 | 1,249,268 |
| 885,000 | Metropolitan Pier and Exposition Authority, Illinois | | | |
| | State Tax Revenue Bonds (McCormick Place | | | |
| | Exposition Project) (Series A) (FGIC Insured) | 5.500 | 6/15/2015 | 984,837 |
| 17,505,000 | Metropolitan Pier and Exposition Authority, Illinois | | | |
| | State Tax Revenue Bonds (McCormick Place | | | |
| | Exposition Project) (Series A) (FGIC Insured) | Zero Coupon | 6/15/2020 | 8,940,504 |
| 3,100,000 | Metropolitan Pier and Exposition Authority, Illinois | | | |
| | State Tax Revenue Bonds (McCormick Place | | | |
| | Exposition Project) (Series A) (MBIA Insured) | Zero Coupon | 6/15/2024 | 1,286,593 |
| 2,000,000 | Metropolitan Pier and Exposition Authority, Illinois | | | |
| | State Tax Revenue Bonds (McCormick Place | | | |
| | Exposition Project) (Series A) (MBIA Insured) | Zero Coupon | 12/15/2024 | 810,680 |
| 7,000,000 | Metropolitan Pier and Exposition Authority, Illinois | | | |
| | State Tax Revenue Bonds (McCormick Place | | | |
| | Exposition Project) (Series B) (MBIA Insured)(c) | Zero Coupon | 6/15/2012 | 5,369,980 |
| 3,000,000 | Regional Transportation Authority, Illinois Revenue | | | |
| | Bonds (Series A) (FGIC Insured) | 6.700 | 11/1/2021 | 3,669,900 |
|
|
| | Total Illinois | | | 113,269,417 |
|
|
| |
| Indiana (1.1%) | | | |
| 2,665,000 | Avon, Indiana Community School Building Corporation | | |
| | Revenue Bonds Unrefunded Balance (First Mortgage) | | | |
| | (AMBAC Insured)(b) | 5.250 | 1/1/2022 | 2,747,722 |
| 700,000 | Ball State University, Indiana University Student Fee | | | |
| | Revenue Bonds (Series K) (FGIC Insured) | 5.750 | 7/1/2020 | 758,716 |
| 1,250,000 | East Chicago, Indiana Elementary School Building | | | |
| | Corporation Revenue Bonds | 6.250 | 1/5/2016 | 1,409,625 |
| 200,000 | Indiana State Housing Authority Single Family Mortgage | | |
| | Revenue Bonds (Series C-2) (GNMA Insured) | 5.250 | 7/1/2017 | 202,622 |
| 510,000 | Indiana Transportation Finance Authority Airport | | | |
| | Facilities Lease Revenue Bonds (Series A) | 5.400 | 11/1/2006 | 520,200 |
| |
| The accompanying notes to the financial statements are an integral part of this schedule. | |
|
168
| Municipal Bond Fund | | | |
| Schedule of Investments as of October 31, 2005(a) | | | |
| |
| Principal | | Interest | Maturity | |
| Amount | Long-Term Fixed Income (99.0%) | Rate | Date | Value |
|
| Indiana -- continued | | | |
| $250,000 | Indiana Transportation Finance Authority Highway | | | |
| | Revenue Bonds (Series A) | 6.800% | 12/1/2016 | $294,615 |
| 570,000 | Indiana Transportation Finance Authority Highway | | | |
| | Revenue Bonds (Series A) (AMBAC Insured)(b) | 5.750 | 6/1/2012 | 632,324 |
| 985,000 | Indiana Transportation Finance Authority Highway | | | |
| | Revenue Bonds (Series A) (MBIA/IBC Insured)(b) | 7.250 | 6/1/2015 | 1,132,425 |
| 3,565,000 | Indiana Transportation Finance Authority Highway | | | |
| | Unrefunded Revenue Bonds (Series A) (MBIA/IBC Insured) | 7.250 | 6/1/2015 | 4,297,429 |
| 2,120,000 | Purdue University, Indiana Revenue Bonds | | | |
| | (Student Fees) (Series L) | 5.000 | 7/1/2020 | 2,200,624 |
|
|
| | Total Indiana | | | 14,196,302 |
|
|
| |
| Iowa (0.8%) | | | |
| 2,085,000 | Coralville, Iowa Urban Renewal Revenue Bonds Annual | | |
| | Appropriation (Tax Increment-H2) | 5.000 | 6/1/2011 | 2,145,173 |
| 3,125,000 | Coralville, Iowa Urban Renewal Revenue Bonds Annual | | |
| | Appropriation (Tax Increment-H2) | 5.000 | 6/1/2021 | 3,178,094 |
| 4,500,000 | Iowa Finance Authority Health Care Facilities Revenue | | |
| | Bonds (Genesis Medical Center) | 6.250 | 7/1/2025 | 4,835,295 |
|
|
| | Total Iowa | | | 10,158,562 |
|
|
| |
| Kansas (1.0%) | | | |
| 1,255,000 | Kansas City, Kansas Utility System Capital | | | |
| | Appreciation Revenue Bonds (AMBAC Insured)(b) | Zero Coupon | 3/1/2007 | 1,201,788 |
| 920,000 | Kansas City, Kansas Utility System Capital | | | |
| | Appreciation Unrefunded Revenue Bonds | | | |
| | (AMBAC Insured) | Zero Coupon | 3/1/2007 | 881,682 |
| 1,000,000 | Kansas State Development Finance Authority | | | |
| | Health Facilities Revenue Bonds (Stormont Vail | | | |
| | Healthcare) (Series K) | 5.375 | 11/15/2024 | 1,054,950 |
| 2,000,000 | Olathe, Kansas Health Facilities Revenue Bonds | | | |
| | (Olathe Medical Center Project) (Series A) | | | |
| | (AMBAC Insured) | 5.500 | 9/1/2025 | 2,099,060 |
| 475,000 | Sedgwick and Shawnee Counties, Kansas Single | | | |
| | Family Mortgage Revenue Bonds (Series A-2) | | | |
| | (GNMA Insured) | 6.700 | 6/1/2029 | 490,912 |
| 2,300,000 | University of Kansas Hospital Authority Health | | | |
| | Facilities Revenue Bonds | 5.500 | 9/1/2022 | 2,426,845 |
| 4,350,000 | Wyandotte County/Kansas City, Kansas Unified | | | |
| | Government Special Obligation Revenue Bonds | | | |
| | (2nd Lien-B) | 5.000 | 12/1/2020 | 4,425,255 |
|
|
| | Total Kansas | | | 12,580,492 |
|
|
| |
| |
| The accompanying notes to the financial statements are an integral part of this schedule. | |
|
169 |
| Municipal Bond Fund | | | |
| Schedule of Investments as of October 31, 2005(a) | | | |
| |
| Principal | | Interest | Maturity | |
| Amount | Long-Term Fixed Income (99.0%) | Rate | Date | Value |
|
| Kentucky (0.6%) | | | |
| $5,345,000 | Kentucky State Turnpike Authority Economic | | | |
| | Development Revenue Bonds (Revitalization Project) | | | |
| | (FGIC Insured) | Zero Coupon | 1/1/2010 | $4,562,599 |
| 3,000,000 | Maysville, Kentucky Solid Waste Disposal | | | |
| | Facility Revenue Bonds (Adj-Inland Container | | | |
| | Corporation Project) | 6.900% | 9/1/2022 | 3,313,890 |
|
|
| | Total Kentucky | | | 7,876,489 |
|
|
| |
| Louisiana (1.7%) | | | |
| 890,000 | Jefferson Parish, Louisiana Home Mortgage Authority | | | |
| | Single Family Mortgage Revenue Bonds (Series A-2) | | | |
| | (GNMA/FNMA Insured) (Subject to ‘AMT’) | 7.500 | 12/1/2030 | 915,445 |
| 410,000 | Jefferson Parish, Louisiana Home Mortgage Authority | | | |
| | Single Family Mortgage Revenue Bonds (Series D-1) | | | |
| | (GNMA/FNMA Insured) (Subject to ‘AMT’) | 7.500 | 6/1/2026 | 421,537 |
| 525,000 | Louisiana Housing Finance Agency Single Family | | | |
| | Mortgage Revenue Bonds (Series A-2) | | | |
| | (GNMA/FNMA/FHLMC Insured) (Subject to ‘AMT’) | 7.800 | 12/1/2026 | 546,966 |
| 480,000 | Louisiana Housing Finance Agency Single Family | | | |
| | Mortgage Revenue Bonds (Series D-2) | | | |
| | (GNMA/FNMA Insured) (Subject to ‘AMT’) | 7.050 | 6/1/2031 | 501,998 |
| 3,000,000 | Louisiana Public Facilities Authority Hospital | | | |
| | Revenue Bonds (Lake Charles Memorial) | | | |
| | (AMBAC/TCRS Insured) | 8.625 | 12/1/2030 | 3,701,160 |
| 6,500,000 | New Orleans, Louisiana General Obligation Bonds | | | |
| | (AMBAC Insured) | Zero Coupon | 9/1/2012 | 4,854,850 |
| 3,000,000 | Orleans Parish, Louisiana School Board | | | |
| | Administration Offices Revenue Bonds | | | |
| | (MBIA Insured)(b) | 8.950 | 2/1/2008 | 3,364,230 |
| 2,605,000 | Regional Transportation Authority, Louisiana Sales | | | |
| | Tax Revenue Bonds (Series A) (FGIC Insured) | 8.000 | 12/1/2012 | 3,243,486 |
| 4,200,000 | Tobacco Settlement Financing Corporation, | | | |
| | Louisiana Revenue Bonds (Series 2001-B) | 5.500 | 5/15/2030 | 4,345,992 |
|
|
| | Total Louisiana | | | 21,895,664 |
|
|
| |
| Maryland (0.9%) | | | |
| 1,250,000 | Frederick County, Maryland Educational Facilities | | | |
| | Revenue Bonds (Mount Saint Mary’s College) | | | |
| | (Series A) | 5.750 | 9/1/2025 | 1,304,550 |
| 1,890,000 | Maryland State Economic Development Corporation | | | |
| | Revenue Bonds (Lutheran World Relief) | 7.200 | 4/1/2025 | 2,057,114 |
| 1,550,000 | Maryland State Economic Development Corporation | | | |
| | Student Housing Revenue Bonds (Sheppard Pratt) | | | |
| | (ACA Insured) | 6.000 | 7/1/2033 | 1,628,600 |
| | | | |
The accompanying notes to the financial statements are an integral part of this schedule. | | | |
|
170
| Municipal Bond Fund | | | | |
| Schedule of Investments as of October 31, 2005(a) | | | | |
| |
| Principal | | | Interest | Maturity | |
| Amount | Long-Term Fixed Income (99.0%) | | Rate | Date | Value |
|
| Maryland -- continued | | | | |
| $1,000,000 | Maryland State Health and Higher Educational Facilities | | | |
| | Authority Revenue Bonds (University of Maryland | | | | |
| | Medical System) | | 6.000% | 7/1/2022 | $1,089,040 |
| 4,500,000 | Morgan State University, Maryland Academic and | | | | |
| | Auxiliary Facilities Fees Revenue Bonds (MBIA Insured) | 6.050 | 7/1/2015 | 5,095,800 |
| 60,000 | Prince George’s County, Maryland Housing Authority | | | | |
| | Single Family Mortgage Revenue Bonds (Series A) | | | | |
| | (GNMA/FNMA/FHLMC Insured) (Subject to ‘AMT’) | | 7.400 | 8/1/2032 | 60,623 |
| 425,000 | Westminster, Maryland Education Facilities Revenue | | | | |
| | Bonds (McDaniel College) | | 5.500 | 4/1/2027 | 441,796 |
|
|
| | Total Maryland | | | | 11,677,523 |
|
|
| |
| Massachusetts (1.3%) | | | | |
| 4,935,000 | Massachusetts State Construction Lien General | | | | |
| | Obligation Bonds (Series A) (FGIC-TCRS) | | 5.250 | 1/1/2013 | 5,366,812 |
| 725,000 | Massachusetts State Development Finance Agency | | | | |
| | Revenue Bonds (Devens Electric Systems) | | 5.625 | 12/1/2016 | 769,602 |
| 2,000,000 | Massachusetts State General Obligation Bonds | | | | |
| | (Series B)(b) | | 6.500 | 8/1/2008 | 2,150,300 |
| 2,500,000 | Massachusetts State Health and Educational Facilities | | | | |
| | Authority Revenue Bonds (Daughters of Charity) | | | | |
| | (Series D)(b) | | 6.100 | 7/1/2014 | 2,544,950 |
| 1,000,000 | Massachusetts State Health and Educational Facilities | | | | |
| | Authority Revenue Bonds (Partners Healthcare System) | | | |
| | (Series C) | | 6.000 | 7/1/2016 | 1,111,040 |
| 3,000,000 | Massachusetts State School Building Authority Dedicated | | |
| | Sales Tax Revenue Bonds (Series A) (MBIA Insured) | | 5.000 | 8/15/2027 | 3,117,450 |
| 1,170,000 | Westfield, Massachusetts General Obligation Bonds | | | | |
| | (FGIC Insured)(b) | | 6.500 | 5/1/2014 | 1,330,044 |
|
|
| | Total Massachusetts | | | 16,390,198 |
|
|
| |
| Michigan (2.9%) | | | | |
| 545,000 | Chelsea, Michigan Economic Development | | | | |
| | Corporation Obligation Revenue Bonds (United | | | | |
| | Methodist Retirement) | | 4.900 | 11/15/2006 | 541,261 |
| 2,000,000 | East Lansing, Michigan Building Authority General | | | | |
| | Obligation Bonds | | 5.700 | 4/1/2020 | 2,310,040 |
| 1,500,000 | Livonia, Michigan Public Schools School District | | | | |
| | General Obligation Bonds (FGIC Insured)(b) | Zero Coupon | 5/1/2009 | 1,318,725 |
| 2,460,000 | Michigan Municipal Board Authority Revenue | | | | |
| | Bonds (Local Government Loan Program) | | | | |
| | (FGIC Insured) | Zero Coupon | 12/1/2005 | 2,437,201 |
| 1,380,000 | Michigan Public Power Agency Revenue Bonds | | | | |
| | (Combustion Turbine #1 Project) (Series A) | | | | |
| | (AMBAC Insured) | | 5.250 | 1/1/2016 | 1,477,966 |
| |
| |
| The accompanying notes to the financial statements are an integral part of this schedule. | |
|
171
| Municipal Bond Fund | | | |
| Schedule of Investments as of October 31, 2005(a) | | | |
| |
| Principal | | Interest | Maturity | |
| Amount | Long-Term Fixed Income (99.0%) | Rate | Date | Value |
|
| Michigan -- continued | | | |
| $45,000 | Michigan State Hospital Finance Authority Revenue | | | |
| | Bonds (Detroit Medical Center) | 8.125% | 8/15/2012 | $45,277 |
| 2,825,000 | Michigan State Hospital Finance Authority Revenue | | | |
| | Bonds (MBIA Insured)(b) | 5.375 | 8/15/2014 | 3,103,545 |
| 175,000 | Michigan State Hospital Finance Authority Revenue | | | |
| | Bonds (Series P) (MBIA Insured)(b) | 5.375 | 8/15/2014 | 183,172 |
| 2,750,000 | Michigan State Hospital Finance Authority Revenue | | | |
| | Refunding Bonds (Crittenton Hospital) (Series A) | 5.500 | 3/1/2022 | 2,881,395 |
| 5,000,000 | Michigan State Trunk Line Fund Revenue Bonds | | | |
| | (FSA Insured) | 5.000 | 11/1/2022 | 5,265,300 |
| 4,500,000 | Rochester, Michigan Community School District | | | |
| | (MBIA Insured) | 5.000 | 5/1/2019 | 4,848,705 |
| 3,320,000 | Sault Ste. Marie, Michigan Chippewa Indians Housing | | | |
| | Authority (Tribal Health and Human Services Center) | 7.750 | 9/1/2012 | 3,336,534 |
| 2,000,000 | St. Clair County, Michigan Economic Development | | | |
| | Corporation Revenue Bonds (Detroit Edison) (Series AA) | | | |
| | (AMBAC Insured) | 6.400 | 8/1/2024 | 2,185,640 |
| 990,000 | Summit Academy North, Michigan Public School | | | |
| | Academy Certificates of Participation(b) | 6.550 | 7/1/2014 | 1,116,948 |
| 690,000 | Summit Academy North, Michigan Public School | | | |
| | Academy Certificates of Participation(b) | 8.375 | 7/1/2030 | 830,498 |
| 1,000,000 | Trenton, Michigan Building Authority General | | | |
| | Obligation Bonds (AMBAC Insured)(b) | 5.600 | 10/1/2019 | 1,105,260 |
| 3,560,000 | Wayne State University, Michigan University Revenue | | | |
| | Bonds (FGIC Insured) | 5.125 | 11/15/2029 | 3,693,536 |
|
|
| | Total Michigan | | | 36,681,003 |
|
|
| |
| Minnesota (3.7%) | | | |
| 375,000 | Chaska, Minnesota Economic Development Authority | | | |
| | School Facilities Lease Revenue Bonds (Independent | | | |
| | School District #112) (Series A) | 5.125 | 12/1/2010 | 390,574 |
| 750,000 | Chaska, Minnesota Electric Revenue Bonds (Refining | | | |
| | Generating Facilities) (Series A) | 5.250 | 10/1/2025 | 793,320 |
| 800,000 | Minneapolis and St. Paul, Minnesota Housing & | | | |
| | Redevelopment Authority Healthcare System | | | |
| | (Healthpartners Obligation Group Project) | 6.000 | 12/1/2021 | 874,824 |
| 2,030,000 | Minneapolis and St. Paul, Minnesota Metropolitan | | | |
| | Airports Commission Airport Revenue Bonds | 5.000 | 1/1/2022 | 2,080,872 |
| 1,000,000 | Minneapolis and St. Paul, Minnesota Metropolitan | | | |
| | Airports Commission Airport Revenue Bonds (Series C) | | | |
| | (FGIC Insured) | 5.125 | 1/1/2020 | 1,048,610 |
| 5,000,000 | Minneapolis and St. Paul, Minnesota Metropolitan | | | |
| | Airports Common Airport Revenue Bonds (Series C) | | | |
| | (FGIC Insured) | 5.000 | 1/1/2031 | 5,129,050 |
| | | | |
The accompanying notes to the financial statements are an integral part of this schedule. | | | |
| | | | |
|
172
| Municipal Bond Fund | | | | |
| Schedule of Investments as of October 31, 2005(a) | | | | |
| |
| Principal | | | Interest | Maturity | |
| Amount | Long-Term Fixed Income (99.0%) | | Rate | Date | Value |
|
| Minnesota -- continued | | | | |
| $7,685,000 | Minneapolis, Minnesota Community Development | | | |
| | Agency Tax Increment Revenue Bonds | | | | |
| | (MBIA Insured) | | Zero Coupon | 3/1/2009 | $6,802,378 |
| 4,915,000 | Minnesota Agricultural and Economic Development | | | |
| | Board Health Care System Revenue Bonds Pre-refunded | | | |
| | (Fairview Hospital) (Series A) (MBIA Insured)(b) | | 5.750% | 11/15/2026 | 5,255,954 |
| 85,000 | Minnesota Agricultural and Economic Development | | | |
| | Board Health Care System Revenue Bonds Unrefunded | | | |
| | Balance (Fairview Hospital) (Series A) (MBIA Insured) | 5.750 | 11/15/2026 | 90,323 |
| 3,750,000 | Minnesota Higher Education Facilities Authority | | | | |
| | Revenue Bonds (Augsburg College) (Series 4-F1)(b) | | 6.250 | 5/1/2023 | 3,883,275 |
| 1,000,000 | Minnesota Higher Education Facilities Authority | | | | |
| | Revenue Bonds (College of Art and Design) (Series 5-D) | 6.625 | 5/1/2020 | 1,078,010 |
| 530,000 | Minnesota Higher Education Facilities Authority | | | | |
| | Revenue Bonds (University of St. Thomas) (Series 5-Y) | 5.250 | 10/1/2019 | 565,711 |
| 3,620,000 | Minnesota State General Obligation Bonds | | 5.250 | 8/1/2017 | 3,856,024 |
| 1,000,000 | Northfield, Minnesota Hospital Revenue Bonds | | | | |
| | (Series C) | | 6.000 | 11/1/2021 | 1,069,580 |
| 1,300,000 | Northfield, Minnesota Hospital Revenue Bonds | | | | |
| | (Series C) | | 6.000 | 11/1/2026 | 1,377,038 |
| 2,040,000 | Northfield, Minnesota Hospital Revenue Bonds | | | | |
| | (Series C) | | 6.000 | 11/1/2031 | 2,156,749 |
| 300,000 | Scott County, Minnesota Housing and Redevelopment | | | |
| | Authority Facilities Lease Revenue Bonds (Workforce | | | |
| | Center Project) | | 5.000 | 2/1/2017 | 306,168 |
| 525,000 | Scott County, Minnesota Housing and Redevelopment | | | |
| | Authority Facilities Lease Revenue Bonds (Workforce | | | |
| | Center Project) | | 5.000 | 2/1/2018 | 535,227 |
| 2,000,000 | St. Louis Park, Minnesota Health Care Facilities | | | | |
| | Revenue Bonds | | 5.250 | 7/1/2030 | 2,060,180 |
| 1,690,000 | St. Paul, Minnesota Housing and Redevelopment | | | | |
| | Authority Lease Parking Facilities Revenue Bonds | | | | |
| | (Rivercentre Parking Ramp) | | 6.000 | 5/1/2013 | 1,805,461 |
| 5,000,000 | White Earth Band of Chippewa Indians, Minnesota Revenue | | | |
| | Bonds (Series A) (ACA Insured) | | 7.000 | 12/1/2011 | 5,353,450 |
|
|
| | Total Minnesota | | | 46,512,778 |
|
|
| |
| Missouri (1.3%) | | | | |
| 785,000 | Missouri State Development Finance Board Infrastructure | | | |
| | Facilities Revenue Bonds (Eastland Center Project | | | | |
| | Phase II) (Series B) | | 5.875 | 4/1/2017 | 822,790 |
| 500,000 | Missouri State Development Finance Board Infrastructure | | | |
| | Facilities Revenue Bonds (Eastland Center Project | | | | |
| | Phase II) (Series B) | | 6.000 | 4/1/2021 | 528,955 |
| | | | | |
The accompanying notes to the financial statements are an integral part of this schedule. | | | | |
| | | | | |
|
173
| Municipal Bond Fund | | | |
| Schedule of Investments as of October 31, 2005(a) | | | |
| |
| Principal | | Interest | Maturity | |
| Amount | Long-Term Fixed Income (99.0%) | Rate | Date | Value |
|
| Missouri -- continued | | | |
| $1,000,000 | Missouri State Environmental Improvement and | | | |
| | Energy Resources Authority Water Pollution Revenue | | | |
| | Bonds (Series A) | 5.250% | 1/1/2018 | $1,071,330 |
| 2,500,000 | Missouri State Health and Educational Facilities | | | |
| | Authority Health Facilities Revenue Bonds | 5.000 | 5/15/2020 | 2,605,850 |
| 3,000,000 | Missouri State Health and Educational Facilities | | | |
| | Authority Health Facilities Revenue Bonds (Barnes | | | |
| | Jewish, Inc. Christian) (Series A) | 5.250 | 5/15/2014 | 3,244,320 |
| 1,500,000 | Missouri State Health and Educational Facilities | | | |
| | Authority Health Facilities Revenue Bonds (Lake | | | |
| | Regional Health Securities Project) | 5.600 | 2/15/2025 | 1,558,245 |
| 1,000,000 | Missouri State Health and Educational Facilities | | | |
| | Authority Health Facilities Revenue Bonds (Saint | | | |
| | Anthony’s Medical Center) | 6.250 | 12/1/2030 | 1,084,690 |
| 1,345,000 | Missouri State Health and Educational Facilities | | | |
| | Authority Revenue Bonds (Lake of the Ozarks)(b) | 6.500 | 2/15/2021 | 1,384,933 |
| 655,000 | Missouri State Health and Educational Facilities | | | |
| | Authority Revenue Bonds (Lake of the Ozarks) | 6.500 | 2/15/2021 | 670,137 |
| 230,000 | Missouri State Housing Development Commission | | | |
| | Single Family Mortgage Revenue Bonds (Series B-1) | | | |
| | (GNMA/FNMA Insured) (Subject to ‘AMT’) | 7.450 | 9/1/2031 | 236,990 |
| 265,000 | Missouri State Housing Development Commission | | | |
| | Single Family Mortgage Revenue Bonds (Series C-1) | | | |
| | (GNMA/FNMA Insured) | 6.550 | 9/1/2028 | 276,424 |
| 375,000 | Missouri State Housing Development Commission | | | |
| | Single Family Mortgage Revenue Bonds (Series C-1) | | | |
| | (GNMA/FNMA Insured) (Subject to ‘AMT’) | 7.150 | 3/1/2032 | 393,791 |
| 2,000,000 | St. Charles County, Missouri Francis Howell School | | | |
| | District General Obligation Bonds (Series A) | 5.250 | 3/1/2018 | 2,198,320 |
|
|
| | Total Missouri | | | 16,076,775 |
|
|
| |
| Montana (1.1%) | | | |
| 55,000 | Montana State Board of Housing Single Family | | | |
| | Mortgage Revenue Bonds (Series A-1) | 6.000 | 6/1/2016 | 55,804 |
| 200,000 | Montana State Board of Housing Single Family | | | |
| | Mortgage Revenue Bonds (Series A-2) (Subject to ‘AMT’) | 6.250 | 6/1/2019 | 203,464 |
| 2,385,000 | Montana State Board of Investment Refunded Balance | | | |
| | 1996 Payroll Tax Revenue Bonds (MBIA Insured)(b) | 6.875 | 6/1/2020 | 2,593,354 |
| 775,000 | Montana State Board of Investment Refunded Revenue | | | |
| | Bonds (1996 Payroll Tax) (MBIA Insured)(b) | 6.875 | 6/1/2020 | 842,704 |
| 1,240,000 | Montana State Board of Investment Refunded Revenue | | | |
| | Bonds (Payroll Tax) (MBIA Insured)(b) | 6.875 | 6/1/2020 | 1,348,326 |
| 175,000 | Montana State Board of Regents Revenue Bonds | | | |
| | (Higher Education-University of Montana) (Series F) | | | |
| | (MBIA insured)(b) | 5.750 | 5/15/2016 | 195,144 |
| |
| |
| The accompanying notes to the financial statements are an integral part of this schedule. | |
|
174
| Municipal Bond Fund | | | |
| Schedule of Investments as of October 31, 2005(a) | | | |
| |
| Principal | | Interest | Maturity | |
| Amount | Long-Term Fixed Income (99.0%) | Rate | Date | Value |
|
| Montana -- continued | | | |
| $1,165,000 | Montana State Board of Regents Revenue Bonds | | | |
| | (Higher Education-University of Montana) (Series F) | | | |
| | (MBIA insured) | 5.750% | 5/15/2016 | $1,279,520 |
| 3,000,000 | Montana State Health Facilities Authority Revenue | | | |
| | Bonds (Hillcrest Senior Living Project)(b) | 7.375 | 6/1/2030 | 3,507,720 |
| 3,860,000 | Montana State Hospital Finance Authority Revenue | | | |
| | Refunding Bonds | 5.250 | 6/1/2018 | 4,083,687 |
|
|
| | Total Montana | | | 14,109,723 |
|
|
| |
| Nebraska (1.2%) | | | |
| 2,500,000 | Nebraska Public Power District Revenue Bonds (Series B) | | | |
| | (AMBAC Insured) | 5.000 | 1/1/2013 | 2,681,550 |
| 3,455,000 | Omaha, Nebraska Public Power District Revenue Bonds | | | |
| | (Series B)(b) | 6.150 | 2/1/2012 | 3,814,285 |
| 1,675,000 | Omaha, Nebraska Special Assessment Bonds (Riverfront | | | |
| | Redevelopment Project) (Series A) | 5.500 | 2/1/2015 | 1,833,371 |
| 6,000,000 | University of Nebraska Revenue Bonds (Lincoln Student | | | |
| | Fees & Facilities) (Series B) | 5.000 | 7/1/2023 | 6,250,200 |
|
|
| | Total Nebraska | | | 14,579,406 |
|
|
| |
| Nevada (0.2%) | | | |
| 2,500,000 | Washoe County, Nevada General Obligation Bonds | | | |
| | (Reno-Sparks Convention) (Series A) (FSA Insured)(b) | 6.400 | 7/1/2029 | 2,783,450 |
|
|
| | Total Nevada | | | 2,783,450 |
|
|
| |
| New Hampshire (0.1%) | | | |
| 1,100,000 | New Hampshire State Turnpike System Revenue | | | |
| | Bonds (Series C) (FGIC Insured)(d) | 11.096 | 11/3/2005 | 1,223,024 |
|
|
| | Total New Hampshire | | | 1,223,024 |
|
|
| |
| New Jersey (2.0%) | | | |
| 1,250,000 | East Orange, New Jersey General Obligation Bonds | | | |
| | (FSA Insured) | 8.400 | 8/1/2006 | 1,298,762 |
| 2,000,000 | Hudson County, New Jersey Certificate Of Participation | | | |
| | Department of Finance and Administration | | | |
| | (MBIA Insured) | 6.250 | 12/1/2015 | 2,314,380 |
| 4,000,000 | New Jersey State Highway Authority Revenue Bonds | | | |
| | (Series L) | 5.250 | 7/15/2017 | 4,404,320 |
| 1,000,000 | New Jersey State Highway Authority Revenue Bonds | | | |
| | (Series L) | 5.250 | 7/15/2018 | 1,102,470 |
| 820,000 | New Jersey State Transit Corporation Certificate of | | | |
| | Participation Bonds (FSA Insured)(b) | 6.375 | 10/1/2006 | 844,666 |
| 745,000 | New Jersey State Turnpike Authority Revenue Bonds | | | |
| | (Series C) (AMBAC-TCRS Insured) | 6.500 | 1/1/2016 | 867,515 |
| 3,955,000 | New Jersey State Turnpike Authority Revenue Bonds | | | |
| | (Series C) (AMBAC-TCRS Insured)(b) | 6.500 | 1/1/2016 | 4,620,154 |
| |
|
| | The accompanying notes to the financial statements are an integral part of this schedule. | |
|
175
| Municipal Bond Fund | | | |
| Schedule of Investments as of October 31, 2005(a) | | | |
| |
| Principal | | Interest | Maturity | |
| Amount | Long-Term Fixed Income (99.0%) | Rate | Date | Value |
|
| New Jersey -- continued | | | |
| $5,000,000 | New Jersey Transportation Trust Fund Authority | | | |
| | Revenue Bonds (Transportation System) (Series A) | | | |
| | (FSA Insured) | 5.500% | 12/15/2016 | $5,563,000 |
| 2,195,000 | West New York, New Jersey Municipal Utilities | | | |
| | Authority Revenue Bonds (FGIC Insured)(b) | Zero Coupon | 12/15/2007 | 2,044,664 |
| 2,595,000 | West New York, New Jersey Municipal Utilities | | | |
| | Authority Revenue Bonds (FGIC Insured)(b) | Zero Coupon | 12/15/2009 | 2,238,706 |
|
|
| | Total New Jersey | | | 25,298,637 |
|
|
| |
| New Mexico (1.6%) | | | |
| 3,315,000 | Alamogordo, New Mexico Hospital Revenue Bonds | | | |
| | (Gerald Champion Memorial Hospital Project) | 5.300 | 1/1/2013 | 3,403,875 |
| 2,080,000 | Farmington, New Mexico Utility System Revenue | | | |
| | Bonds (AMBAC Insured)(b) | 9.875 | 1/1/2008 | 2,207,712 |
| 3,500,000 | Jicarilla, New Mexico Apache Nation Revenue Bonds | | | |
| | (Series A) | 5.500 | 9/1/2023 | 3,734,045 |
| 1,590,000 | New Mexico Mortgage Finance Authority Revenue | | | |
| | Bonds (Series F) (GNMA/FNMA Insured) | 7.000 | 1/1/2026 | 1,632,723 |
| 260,000 | New Mexico Mortgage Finance Authority Single | | | |
| | Family Mortgage Capital Appreciation Revenue | | | |
| | Bonds (Series D-2) (Subject to ‘AMT’) | Zero Coupon | 9/1/2019 | 213,616 |
| 910,000 | New Mexico Mortgage Finance Authority Single | | | |
| | Family Mortgage Revenue Bonds (Series C-2) | | | |
| | (GNMA/FNMA Insured) (Subject to ‘AMT’) | 6.950 | 9/1/2031 | 938,346 |
| 7,500,000 | Sandoval County, New Mexico Incentive Payment | | | |
| | Revenue Bonds | 5.000 | 6/1/2020 | 7,782,975 |
|
|
| | Total New Mexico | | | 19,913,292 |
|
|
| |
| New York (9.4%) | | | |
| 6,500,000 | Metropolitan Transportation Authority, New York | | | |
| | Revenue Bonds (Series A) (FGIC Insured) | 5.000 | 11/15/2025 | 6,749,535 |
| 5,000,000 | Metropolitan Transportation Authority, New York | | | |
| | Transportation Facilities Revenue Bonds (Series A) | 5.500 | 7/1/2017 | 5,555,100 |
| 4,225,000 | Metropolitan Transportation Authority, New York | | | |
| | Transportation Facilities Revenue Bonds (Series O)(b) | 5.750 | 7/1/2013 | 4,630,389 |
| 13,000,000 | New York City Transitional Finance Authority | | | |
| | Revenue Bonds (Future Tax Secured) (Series B) | 5.250 | 2/1/2029 | 13,894,270 |
| 535,000 | New York Counties Tobacco Trust Settlement | | | |
| | Revenue Bonds(b) | 5.800 | 6/1/2023 | 542,934 |
| 4,000,000 | New York State Dormitory Authority Revenue Bonds | | | |
| | (Series B) | 5.250 | 5/15/2012 | 4,273,080 |
| 2,000,000 | New York State Dormitory Authority Revenue Bonds | | | |
| | (State University Educational Facilities) (Series A) | 7.500 | 5/15/2013 | 2,436,860 |
| 5,000,000 | New York State Dormitory Authority Revenue Bonds | | | |
| | (State University Educational Facilities) (Series A) | 5.875 | 5/15/2017 | 5,719,900 |
| |
| |
| The accompanying notes to the financial statements are an integral part of this schedule. | |
|
176
| Municipal Bond Fund | | | |
| Schedule of Investments as of October 31, 2005(a) | | | |
| |
| Principal | | Interest | Maturity | |
| Amount | Long-Term Fixed Income (99.0%) | Rate | Date | Value |
|
| New York -- continued | | | |
| $2,000,000 | New York State Local Government Assistance Corporation | | | |
| | Revenue Bonds (Series E) (MBIA/IBC Insured) | 5.250% | 4/1/2016 | $2,180,840 |
| 1,330,000 | New York State Mortgage Agency Revenue Bonds | | | |
| | (Series 26) | 5.350 | 10/1/2016 | 1,370,711 |
| 395,000 | New York State Thruway Authority General Revenue | | | |
| | Bonds Prerefunded (Series E)(b) | 5.000 | 1/1/2016 | 413,913 |
| 2,605,000 | New York State Thruway Authority General Revenue | | | |
| | Bonds Unrefunded Balance (Series E) | 5.000 | 1/1/2016 | 2,714,123 |
| 2,500,000 | New York State Thruway Authority Revenue Bonds | | | |
| | (Series B) (FSA Insured) | 5.000 | 4/1/2015 | 2,696,400 |
| 20,000,000 | New York State Urban Development Corporation | | | |
| | Revenue Bonds (Correctional and Youth Facilities) | | | |
| | (Series A) | 5.000 | 1/1/2017 | 21,018,398 |
| 1,620,000 | New York State Urban Development Corporation | | | |
| | Revenue Bonds (Syracuse University Center) | 6.000 | 1/1/2009 | 1,740,107 |
| 1,720,000 | New York State Urban Development Corporation | | | |
| | Revenue Bonds (Syracuse University Center) | 6.000 | 1/1/2010 | 1,873,252 |
| 8,940,000 | New York, New York City Municipal Transitional | | | |
| | Finance Authority Revenue Bonds (Series A)(c) | 5.500 | 11/1/2011 | 9,703,029 |
| 3,000,000 | New York, New York City Municipal Transitional | | | |
| | Finance Authority Revenue Bonds (Series A)(b) | 5.375 | 11/15/2021 | 3,241,140 |
| 2,000,000 | New York, New York City Municipal Water and Sewer | | | |
| | System Revenue Bonds (Series A) (AMBAC Insured) | 5.875 | 6/15/2012 | 2,260,660 |
| 1,750,000 | New York, New York General Obligation Bonds (Series A) | 5.500 | 8/1/2022 | 1,880,988 |
| 12,000,000 | New York, New York General Obligation Bonds (Series B) | 5.250 | 8/1/2017 | 12,795,720 |
| 1,000,000 | New York, New York General Obligation Bonds (Series G) | 5.000 | 12/1/2026 | 1,024,150 |
| 3,000,000 | New York, New York General Obligation Bonds (Series H) | | | |
| | (FSA/CR Insured)(b) | 5.250 | 3/15/2016 | 3,180,150 |
| 5,000,000 | New York, New York General Obligation Bonds (Series I) | 5.000 | 8/1/2016 | 5,245,100 |
| 1,000,000 | Triborough, New York Bridge and Tunnel Authority | | | |
| | Revenue Bonds (Series Q)(b) | 6.750 | 1/1/2009 | 1,057,030 |
|
|
| | Total New York | | | 118,197,779 |
|
|
| |
| North Carolina (1.9%) | | | |
| 1,475,000 | North Carolina Eastern Municipal Power Agency Power | | | |
| | System Prerefunded Revenue Bonds (Series A) | 6.000 | 1/1/2026 | 1,749,645 |
| 4,000,000 | North Carolina Eastern Municipal Power Agency Power | | | |
| | System Revenue Bonds | 5.375 | 1/1/2017 | 4,189,560 |
| 175,000 | North Carolina Eastern Municipal Power Agency Power | | | |
| | System Revenue Bonds (Series B) | 6.000 | 1/1/2006 | 175,676 |
| 2,375,000 | North Carolina Eastern Municipal Power Agency Power | | | |
| | System Revenue Bonds (Series B) | 5.500 | 1/1/2021 | 2,394,665 |
| 5,000,000 | North Carolina Eastern Municipal Power Agency Power | | | |
| | System Revenue Bonds (Series D) | 5.500 | 1/1/2014 | 5,387,600 |
| 2,000,000 | North Carolina Eastern Municipal Power Agency Power | | | |
| | System Revenue Bonds (Series D) | 6.750 | 1/1/2026 | 2,204,700 |
| |
| The accompanying notes to the financial statements are an integral part of this schedule. | |
|
177
| Municipal Bond Fund | | | |
| Schedule of Investments as of October 31, 2005(a) | | | |
| |
| Principal | | Interest | Maturity | |
| Amount | Long-Term Fixed Income (99.0%) | Rate | Date | Value |
|
| North Carolina -- continued | | | |
| $1,250,000 | North Carolina Municipal Power Agency #1 Catawba | | | |
| | Electric Revenue Bonds (Series B) | 6.250% | 1/1/2007 | $1,286,688 |
| 250,000 | North Carolina Municipal Power Agency #1 Catawba | | | |
| | Electric Revenue Bonds (Series B) | 6.500 | 1/1/2009 | 269,912 |
| 610,000 | North Carolina Municipal Power Agency #1 Catawba | | | |
| | Electric Revenue Bonds (Series B) | 6.375 | 1/1/2013 | 669,914 |
| 4,000,000 | North Carolina Municipal Power Agency #1 Catawba | | | |
| | Electric Revenue Bonds (Series B) (MBIA Insured) | 6.000 | 1/1/2011 | 4,442,280 |
| 1,000,000 | Wake County, North Carolina Industrial, Facilities, and | | | |
| | Pollution Control Revenue Bonds (Carolina Power and | | | |
| | Light Company Project) | 5.375 | 2/1/2017 | 1,056,910 |
|
|
| | Total North Carolina | | | 23,827,550 |
|
|
| |
| North Dakota (0.9%) | | | |
| 3,500,000 | Grand Forks, North Dakota Health Care System | | | |
| | Revenue Bonds (Altru Health Systems Group) | 7.125 | 8/15/2024 | 3,892,280 |
| 1,340,000 | North Dakota State Water Commission Revenue | | | |
| | Bonds (Southwest Pipeline) (Series A) (AMBAC Insured) | 5.750 | 7/1/2027 | 1,389,486 |
| 2,945,000 | South Central Regional Water District, North Dakota | | | |
| | Utility System Revenue Bonds (Northern Burleigh | | | |
| | County) (Series A) | 5.650 | 10/1/2029 | 3,029,934 |
| 3,250,000 | Ward County, North Dakota Health Care Facilities | | | |
| | Revenue Bonds (Trinity Medical Center) (Series B) | 6.250 | 7/1/2021 | 3,334,955 |
|
|
| | Total North Dakota | | | 11,646,655 |
|
|
| |
| Ohio (2.4%) | | | |
| 2,500,000 | Akron, Ohio Certificates of Participation (Akron | | | |
| | Municipal Baseball Stadium Project)(b) | 6.900 | 12/1/2016 | 2,649,600 |
| 875,000 | Akron, Ohio Economic Development Revenue | | | |
| | Bonds (MBIA Insured) | 6.000 | 12/1/2012 | 990,552 |
| 1,700,000 | Cincinnati, Ohio General Obligation Bonds | 5.375 | 12/1/2019 | 1,829,846 |
| 2,000,000 | Lorain County, Ohio Hospital Revenue Bonds | | | |
| | (Catholic Healthcare Partners) | 5.400 | 10/1/2021 | 2,112,080 |
| 2,000,000 | Lucas County, Ohio Health Care Facilities Revenue | | | |
| | Bonds (Sunset Retirement) (Series A) | 6.550 | 8/15/2024 | 2,105,080 |
| 2,000,000 | Montgomery County, Ohio Hospital Revenue Bonds | | | |
| | (Kettering Medical Center) | 6.750 | 4/1/2018 | 2,178,640 |
| 2,500,000 | Montgomery County, Ohio Hospital Revenue Bonds | | | |
| | (Kettering Medical Center) | 6.750 | 4/1/2022 | 2,698,450 |
| 420,000 | Ohio Housing Finance Agency Mortgage Residential | | | |
| | Revenue Bonds (Series A-1) (GNMA Insured) | | | |
| | (Subject to ‘AMT’) | 5.750 | 9/1/2026 | 424,733 |
| 2,000,000 | Ohio State Higher Education Faculty Revenue Bonds | | | |
| | (Case Western Reserve University) | 6.500 | 10/1/2020 | 2,422,660 |
| 4,000,000 | Ohio State Infrastructure Improvement (Series B)(b) | 5.250 | 3/1/2014 | 4,346,720 |
| |
| |
| The accompanying notes to the financial statements are an integral part of this schedule. | |
|
178
| Municipal Bond Fund | | | | |
| Schedule of Investments as of October 31, 2005(a) | | | | |
| |
| Principal | | | Interest | Maturity | |
| Amount | Long-Term Fixed Income (99.0%) | | Rate | Date | Value |
|
| Ohio -- continued | | | | |
| $2,000,000 | Ohio State Turnpike Commission Turnpike Revenue | | | |
| | Bonds (Series A) (FGIC Insured) | | 5.500% | 2/15/2024 | $2,285,540 |
| 1,610,000 | Reynoldsburg, Ohio City School District (FSA Insured) | 5.000 | 12/1/2028 | 1,668,185 |
| 2,115,000 | University of Akron, Ohio General Receipts Revenue | | | |
| | Bonds (FGIC Insured)(b) | | 5.500 | 1/1/2020 | 2,304,271 |
| 2,545,000 | University of Cincinnati, Ohio General Receipts | | | | |
| | Revenue Bonds (Series D) (AMBAC insured) | | 5.000 | 6/1/2016 | 2,694,061 |
|
|
| | Total Ohio | | | | 30,710,418 |
|
|
| |
| Oklahoma (0.7%) | | | | |
| 2,595,000 | Bass, Oklahoma Memorial Baptist Hospital | | | | |
| | Authority Hospital Revenue Bonds (Bass Memorial | | | |
| | Hospital Project)(b) | | 8.350 | 5/1/2009 | 2,831,197 |
| 1,040,000 | Oklahoma Development Finance Authority Hospital | | | |
| | Revenue Bonds (Unity Health Center Project) | | 5.000 | 10/1/2011 | 1,075,963 |
| 170,000 | Oklahoma Housing Finance Agency Single Family | | | | |
| | Mortgage Revenue Bonds (Series C-2) (Subject to ‘AMT’) | 7.550 | 9/1/2028 | 178,111 |
| 250,000 | Oklahoma Housing Finance Agency Single Family | | | | |
| | Mortgage Revenue Bonds (Series D-2) (GNMA/FNMA | | | |
| | Insured) (Subject to ‘AMT’) | | 7.100 | 9/1/2028 | 260,058 |
| 1,500,000 | Oklahoma State Municipal Power Authority (Series B) | | | |
| | (MBIA Insured) | | 5.875 | 1/1/2012 | 1,643,565 |
| 2,900,000 | Payne County, Oklahoma Economic Development | | | |
| | Authority Student Housing Revenue Bonds | | | | |
| | (Collegiate Housing Foundation) (Series A)(b) | | 6.375 | 6/1/2030 | 3,276,710 |
|
|
| | Total Oklahoma | | | 9,265,604 |
|
|
| |
| Oregon (0.1%) | | | | |
| 550,000 | Forest Grove, Oregon Revenue Bonds (Campus | | | | |
| | Improvement -- Pacific University)(b) | | 6.000 | 5/1/2015 | 609,136 |
|
|
| | Total Oregon | | | | 609,136 |
|
|
| |
| Pennsylvania (2.1%) | | | | |
| 1,600,000 | Allegheny County, Pennsylvania Hospital | | | | |
| | Development Authority Revenue Bonds (Allegheny | | | |
| | General Hospital Project) (Series A) (MBIA Insured)(b) | 6.200 | 9/1/2015 | 1,685,648 |
| 2,480,000 | Allegheny County, Pennsylvania Redevelopment | | | | |
| | Authority Tax Increment Tax Allocation Bonds | | | | |
| | (Waterfront Project) (Series B) | | 6.000 | 12/15/2010 | 2,626,122 |
| 2,240,000 | Allegheny County, Pennsylvania Redevelopment | | | | |
| | Authority Tax Increment Tax Allocation Bonds | | | | |
| | (Waterfront Project) (Series C) | | 6.550 | 12/15/2017 | 2,463,328 |
| 2,575,000 | Allegheny County, Pennsylvania Sanitation Authority | | | |
| | Sewer Revenue Bonds Interest Compensatory | | | | |
| | (Series A) (FGIC Insured) | | Zero Coupon | 6/1/2008 | 2,346,958 |
| |
| |
| The accompanying notes to the financial statements are an integral part of this schedule. | |
|
179
| Municipal Bond Fund | | | |
| Schedule of Investments as of October 31, 2005(a) | | | |
| |
| Principal | | Interest | Maturity | |
| Amount | Long-Term Fixed Income (99.0%) | Rate | Date | Value |
|
| Pennsylvania -- continued | | | |
| $3,200,000 | Carbon County, Pennsylvania Industrial Development | | |
| | Authority Revenue Bonds (Panther Creek Partners | | | |
| | Project) (Subject to ‘AMT’) | 6.650% | 5/1/2010 | $3,392,768 |
| 2,000,000 | Cornwall Lebanon, Pennsylvania School District | | | |
| | Capital Appreciation General Obligation Bonds | | | |
| | (FSA Insured) | Zero Coupon | 3/15/2016 | 1,266,020 |
| 1,520,000 | Cornwall Lebanon, Pennsylvania School District | | | |
| | Capital Appreciation General Obligation Bonds | | | |
| | (FSA Insured) | Zero Coupon | 3/15/2017 | 912,502 |
| 2,000,000 | Lancaster County, Pennsylvania Hospital Authority | | | |
| | Revenue Bonds | 5.500 | 3/15/2026 | 2,090,700 |
| 3,170,000 | Millcreek Township, Pennsylvania School District | | | |
| | General Obligation Bonds (FGIC Insured)(b) | Zero Coupon | 8/15/2009 | 2,771,785 |
| 435,000 | Montgomery County, Pennsylvania Higher | | | |
| | Education and Health Authority Revenue Bonds | | | |
| | (Foulkeways at Gwynedd Project) | 6.750 | 11/15/2024 | 459,691 |
| 1,880,000 | Montgomery County, Pennsylvania Higher | | | |
| | Education and Health Authority Revenue Bonds | | | |
| | (Foulkeways at Gwynedd Project) | 6.750 | 11/15/2030 | 1,985,994 |
| 3,000,000 | Pennsylvania State General Obligation Bonds | | | |
| | (Second Series) (AMBAC Insured) | Zero Coupon | 7/1/2006 | 2,939,610 |
| 1,000,000 | York County, Pennsylvania Solid Waste & Refuse | | | |
| | Authority Solid Waste System Revenue Bonds | | | |
| | (FGIC Insured) | 5.500 | 12/1/2012 | 1,104,600 |
|
|
| | Total Pennsylvania | | 26,045,726 |
|
|
| |
| Puerto Rico (0.4%) | | | |
| 4,955,000 | Puerto Rico Industrial Tourist Educational Medical | | | |
| | and Environmental Central Facilities Revenue Bonds | | | |
| | (AES Cogen Facilities Project) (Subject to ‘AMT’) | 6.625 | 6/1/2026 | 5,315,922 |
|
|
| | Total Puerto Rico | | | 5,315,922 |
|
|
| |
| South Carolina (2.0%) | | | |
| 735,000 | Beaufort-Jasper, South Carolina Water and Sewer | | | |
| | Authority Waterworks and Sewer Systems Refunding | | | |
| | Revenue Bonds (FSA Insured) | 5.000 | 3/1/2021 | 768,582 |
| 1,000,000 | Greenwood County, South Carolina Hospital Revenue | | |
| | Bonds (Self Memorial Hospital) | 5.500 | 10/1/2026 | 1,036,130 |
| 4,000,000 | Piedmont, South Carolina Municipal Power Agency | | | |
| | Electric Revenue Bonds (FGIC Insured) | 6.250 | 1/1/2021 | 4,832,000 |
| 5,000,000 | Piedmont, South Carolina Municipal Power Agency | | | |
| | Electric Revenue Bonds (FGIC Insured) | 5.000 | 1/1/2022 | 5,012,600 |
| 5,500,000 | South Carolina Jobs Economic Development Authority | | |
| | Hospital Facilities Revenue Bonds (Palmetto Health | | | |
| | Alliance) (Series C) | 6.875 | 8/1/2027 | 6,365,150 |
| |
| |
| The accompanying notes to the financial statements are an integral part of this schedule. | |
|
180
| Municipal Bond Fund | | | |
| Schedule of Investments as of October 31, 2005(a) | | | |
| |
| Principal | | Interest | Maturity | |
| Amount | Long-Term Fixed Income (99.0%) | Rate | Date | Value |
|
| South Carolina -- continued | | | |
| $5,000,000 | South Carolina State Public Service Authority Revenue | | | |
| | Bonds Referendum (Series D) (FSA Insured) | 5.000% | 1/1/2020 | $5,219,750 |
| 500,000 | South Carolina Transportation Infrastructure Bank | | | |
| | Revenue Bonds (Series A) (MBIA Insured) | 5.500 | 10/1/2007 | 522,180 |
| 2,000,000 | Spartanburg, South Carolina Waterworks Revenue | | | |
| | Bonds (FGIC Insured) | 5.250 | 6/1/2028 | 2,118,840 |
|
|
| | Total South Carolina | | | 25,875,232 |
|
|
| |
| South Dakota (0.7%) | | | |
| 5,000,000 | South Dakota Educational Enhancement Funding | | | |
| | Corporation Tobacco Settlement Revenue Bonds | | | |
| | (Series B) | 6.500 | 6/1/2032 | 5,372,900 |
| 1,170,000 | South Dakota State Health and Educational Facilities | | | |
| | Authority Revenue Bonds (Prairie Lakes Health | | | |
| | Care System, Inc.) | 5.625 | 4/1/2032 | 1,200,198 |
| 2,000,000 | South Dakota State Health and Educational Facilities | | | |
| | Authority Revenue Bonds (Prairie Lakes Health Care | | | |
| | System, Inc.) (ACA/CBI Insured) | 5.650 | 4/1/2022 | 2,056,360 |
|
|
| | Total South Dakota | | | 8,629,458 |
|
|
| |
| Tennessee (1.6%) | | | |
| 2,000,000 | Carter County, Tennessee Industrial Development | | | |
| | Board Revenue Bonds | 4.150 | 10/1/2007 | 2,020,080 |
| 965,000 | Dickson County, Tennessee General Obligation Bonds | | | |
| | (FGIC Insured) | 5.000 | 3/1/2020 | 1,021,144 |
| 2,000,000 | Memphis-Shelby County, Tennessee Airport Authority | | | |
| | Special Facilities and Project Revenue Bonds (Federal | | | |
| | Express Corporation) | 5.350 | 9/1/2012 | 2,148,680 |
| 4,500,000 | Memphis-Shelby County, Tennessee Airport Authority | | | |
| | Special Facilities Revenue Bonds (Federal Express | | | |
| | Corporation) | 5.050 | 9/1/2012 | 4,754,835 |
| 4,155,000 | Metropolitan Government, Nashville and Davidson | | | |
| | County, Tennessee Industrial Development Board | | | |
| | Revenue Bonds (Series A) (GNMA Insured) | 6.625 | 3/20/2036 | 4,561,193 |
| 5,000,000 | Shelby County, Tennessee Health Educational and | | | |
| | Housing Facilities Board Revenue Bonds (St. Jude | | | |
| | Children’s Research Project) | 5.375 | 7/1/2024 | 5,195,950 |
| 640,000 | Tennergy Corporation, Tennessee Gas Revenue | | | |
| | Bonds (MBIA Insured) | 4.125 | 6/1/2009 | 653,978 |
| 150,000 | Tennessee Energy Acquisition Corporation Gas | | | |
| | Revenue Bonds (Series A) (AMBAC Insured) | 5.000 | 9/1/2007 | 154,724 |
|
|
| | Total Tennessee | | | 20,510,584 |
|
|
| |
The accompanying notes to the financial statements are an integral part of this schedule.
|
|
181
| Municipal Bond Fund | | | |
| Schedule of Investments as of October 31, 2005(a) | | | |
| |
| Principal | | Interest | Maturity | |
| Amount | Long-Term Fixed Income (99.0%) | Rate | Date | Value |
|
| Texas (11.0%) | | | |
| $11,000,000 | Alliance Airport, Texas Income Authority Special | | | |
| | Facilities Revenue Bonds (Federal Express Corporation | | |
| | Project) (Subject to ‘AMT’) | 6.375% | 4/1/2021 | $11,348,370 |
| 2,000,000 | Amarillo, Texas Health Facilities Corporation Revenue | | |
| | Bonds (Baptist St. Anthony’s Hospital Corporation) | | | |
| | (FSA Insured) | 5.500 | 1/1/2017 | 2,212,720 |
| 750,000 | Arlington, Texas General Obligation Bonds(b) | 5.375 | 8/15/2016 | 811,748 |
| 1,055,000 | Arlington, Texas General Obligation Bonds(b) | 5.500 | 8/15/2019 | 1,147,618 |
| 2,165,000 | Arlington, Texas Independent School District Capital | | | |
| | Appreciation Refunding General Obligation Bonds | | | |
| | (PSF/GTD Insured) | Zero Coupon | 2/15/2009 | 1,918,840 |
| 2,500,000 | Austin, Texas Higher Education Authority, Inc. | | | |
| | University Revenue Bonds (St. Edwards | | | |
| | University Project) | 5.750 | 8/1/2031 | 2,578,100 |
| 2,250,000 | Austin, Texas Utility System Revenue Bonds | | | |
| | (FGIC Insured) | 6.000 | 11/15/2013 | 2,531,700 |
| 7,000,000 | Austin, Texas Utility System Revenue Capital | | | |
| | Appreciation Refunding Bonds (Financial Services | | | |
| | Department) (Series A) (MBIA Insured) | Zero Coupon | 11/15/2008 | 6,274,450 |
| 8,100,000 | Austin, Texas Utility System Revenue Capital | | | |
| | Appreciation Refunding Bonds (Financial Services | | | |
| | Department) (Series A) (MBIA Insured) | Zero Coupon | 11/15/2009 | 6,972,804 |
| 2,265,000 | Bexar County, Texas Housing Finance Corporation | | | |
| | Multi-Family Housing Revenue Bonds (American | | | |
| | Opty-Waterford Apartments) (Series A1) | 7.000 | 12/1/2036 | 2,278,681 |
| 1,930,000 | Bexar County, Texas Housing Finance Corporation | | | |
| | Multi-Family Housing Revenue Bonds (Dymaxion and | | |
| | Marrach Park Apartments) (Series A) (MBIA Insured) | 6.000 | 8/1/2023 | 2,036,903 |
| 1,720,000 | Bexar County, Texas Housing Finance Corporation | | | |
| | Multi-Family Housing Revenue Bonds (Pan American | | | |
| | Apartments) (Series A-1) (GNMA Insured) | 7.000 | 3/20/2031 | 1,929,668 |
| 1,000,000 | Bluebonnet Trails Community Mental Health and | | | |
| | Mental Retardation Revenue Bonds | 6.125 | 12/1/2016 | 1,047,630 |
| 3,950,000 | Colorado River, Texas Municipal Water District | | | |
| | Revenue Bonds (MBIA Insured) | 5.000 | 1/1/2014 | 4,025,722 |
| 500,000 | Corpus Christi, Texas General Obligation Bonds | | | |
| | (Series A) (FSA Insured) | 5.000 | 3/1/2012 | 534,020 |
| 1,000,000 | Dallas-Fort Worth, Texas International Airport Revenue | | |
| | Bonds (Series A) (MBIA Insured) (Subject to ‘AMT’) | 5.500 | 11/1/2016 | 1,067,470 |
| 500,000 | Dallas-Fort Worth, Texas International Airport Revenue | | |
| | Bonds (Series A) (MBIA Insured) (Subject to ‘AMT’) | 5.500 | 11/1/2017 | 532,805 |
| 4,000,000 | Dallas-Fort Worth, Texas Regional Airport Revenue | | | |
| | Refunding Bonds (Series A) (MBIA Insured) | 6.000 | 11/1/2012 | 4,007,560 |
| 1,375,000 | Deer Park, Texas Independent School District General | | | |
| | Obligation Bonds (PSF/GTD Insured) | 5.000 | 2/15/2013 | 1,470,920 |
| |
| |
| The accompanying notes to the financial statements are an integral part of this schedule. | |
|
182
| Municipal Bond Fund | | | | |
| Schedule of Investments as of October 31, 2005(a) | | | | |
| |
| Principal | | | Interest | Maturity | |
| Amount | Long-Term Fixed Income (99.0%) | | Rate | Date | Value |
|
| Texas -- continued | | | | |
| $2,285,000 | Denton, Texas Independent School District General | | | | |
| | Obligation Bonds (PSF/GTD Insured) | | 6.250% | 2/15/2009 | $2,486,308 |
| 3,210,000 | Denton, Texas Utility System Revenue Bonds (Series A) | | | |
| | (FSA Insured) | | 5.250 | 12/1/2015 | 3,463,333 |
| 1,445,000 | Frisco, Texas Independent School District General | | | | |
| | Obligation Bonds (PSF/GTD Insured) | | 6.250 | 8/15/2017 | 1,605,092 |
| 7,000,000 | Harris County, Houston, Texas General Obligation | | | | |
| | Bonds (MBIA Insured) | | Zero Coupon | 8/15/2024 | 2,830,030 |
| 2,000,000 | Harris County, Texas Health Facilities Development | | | | |
| | Authority Hospital Revenue Bonds (Memorial | | | | |
| | Hermann Healthcare Project) (Series A)(b) | | 6.375 | 6/1/2029 | 2,194,540 |
| 8,470,000 | Houston, Texas Airport System Revenue Bonds | | | | |
| | (FSA Insured) | | 5.000 | 7/1/2027 | 8,657,102 |
| 2,000,000 | Houston, Texas Airport System Revenue Bonds | | | | |
| | (Series A) (FSA Insured) (Subject to ‘AMT’) | | 5.625 | 7/1/2030 | 2,099,520 |
| 5,000,000 | Houston, Texas Water and Sewer System Revenue | | | | |
| | Bonds (Series A)(b) | | 5.250 | 12/1/2022 | 5,248,050 |
| 5,000,000 | Houston, Texas Water and Sewer System Revenue | | | | |
| | Bonds (Series A) (FSA Insured)(b) | | 5.750 | 12/1/2032 | 5,876,300 |
| 5,315,000 | Lewisville, Texas Independent School District | | | | |
| | General Obligation Bonds (PSF/GTD Insured) | | Zero Coupon | 8/15/2019 | 2,809,190 |
| 1,000,000 | Lower Colorado River Authority, Texas Revenue | | | | |
| | Bonds (Series A) | | 5.875 | 5/15/2015 | 1,085,040�� |
| 370,000 | Mesquite, Texas Independent School District General | | | | |
| | Obligation Bonds (Series A) (PSF/GTD Insured) | | 6.000 | 2/15/2020 | 390,106 |
| 3,400,000 | Mesquite, Texas Independent School District General | | | | |
| | Obligation Bonds (Series A) (PSF/GTD Insured)(b) | | 6.000 | 2/15/2020 | 3,604,748 |
| 2,600,000 | North Texas Health Facilities Development Corporation | | | |
| | Hospital Revenue Bonds (United Regional Healthcare | | | | |
| | System, Inc.) | | 6.000 | 9/1/2023 | 2,790,866 |
| 575,000 | Nueces County, Texas Housing Finance Corporation | | | | |
| | Multi-Family Housing Revenue Bonds (Dolphins | | | | |
| | Landing Apartments Project) (Series A) | | 6.250 | 7/1/2010 | 588,323 |
| 1,000,000 | Ridge Parc Development Corporation, Texas | | | | |
| | Multifamily Revenue Bonds (GNMA Insured) | | 6.100 | 6/20/2033 | 1,097,720 |
| 2,795,000 | Ridge Parc Development Corporation, Texas | | | | |
| | Multifamily Revenue Bonds (GNMA Insured) | | 6.150 | 11/20/2041 | 3,011,640 |
| 1,365,000 | San Antonio, Texas General Obligation Bonds | | | | |
| | (General Improvement) | | 5.250 | 2/1/2014 | 1,449,562 |
| 1,000,000 | San Antonio, Texas Water Revenue Bonds (FSA Insured) | 5.500 | 5/15/2018 | 1,087,870 |
| 1,000,000 | San Antonio, Texas Water Revenue Bonds (FSA Insured) | 5.500 | 5/15/2019 | 1,088,470 |
| 1,000,000 | San Antonio, Texas Water Revenue Bonds (FSA Insured) | 5.500 | 5/15/2020 | 1,081,300 |
| 85,000 | South San Antonio, Texas Independent School District | | | |
| | General Obligation Bonds (PSF/GTD Insured) | | 6.000 | 8/15/2017 | 92,212 |
| 1,095,000 | South San Antonio, Texas Independent School District | | | |
| | General Obligation Bonds (PSF/GTD Insured)(b) | | 6.000 | 8/15/2017 | 1,196,025 |
| |
| The accompanying notes to the financial statements are an integral part of this schedule. | |
|
183
| Municipal Bond Fund | | | |
| Schedule of Investments as of October 31, 2005(a) | | | |
| |
| Principal | | Interest | Maturity | |
| Amount | Long-Term Fixed Income (99.0%) | Rate | Date | Value |
|
| Texas -- continued | | | |
| $1,160,000 | South San Antonio, Texas Independent School District | | |
| | General Obligation Bonds (PSF/GTD Insured)(b) | 6.000% | 8/15/2018 | $1,267,022 |
| 90,000 | South San Antonio, Texas Independent School District | | |
| | General Obligation Bonds (PSF/GTD Insured) | 6.000 | 8/15/2018 | 97,604 |
| 95,000 | South San Antonio, Texas Independent School District | | |
| | General Obligation Bonds (PSF/GTD Insured) | 6.000 | 8/15/2019 | 102,991 |
| 1,180,000 | South San Antonio, Texas Independent School District | | |
| | General Obligation Bonds (PSF/GTD Insured)(b) | 6.000 | 8/15/2019 | 1,288,867 |
| 11,615,000 | Southeast Texas Housing Finance Corporation | | | |
| | (MBIA Insured)(b) | Zero Coupon | 9/1/2017 | 6,604,870 |
| 1,410,000 | Tarrant County, Texas College District General | | | |
| | Obligation Bonds | 5.375 | 2/15/2013 | 1,543,485 |
| 4,315,000 | Texas State Veterans Land Board General | | | |
| | Obligation Bonds(b) | 0.050 | 7/1/2010 | 3,623,090 |
| 1,000,000 | Texas State Water Development Board Revenue Bonds | | |
| | (State Revolving) (Series A) | 5.250 | 7/15/2017 | 1,014,240 |
| 2,000,000 | Travis County, Texas Health Facilities Development | | | |
| | Corporation Revenue Bonds (Ascension Health Credit) | | |
| | (Series A) (MBIA Insured)(b) | 6.250 | 11/15/2017 | 2,228,160 |
| 315,000 | Westlake, Texas General Obligation Bonds | 6.500 | 5/1/2013 | 353,213 |
| 350,000 | Westlake, Texas General Obligation Bonds | 6.500 | 5/1/2015 | 389,816 |
| 335,000 | Westlake, Texas General Obligation Bonds | 6.500 | 5/1/2017 | 374,842 |
| 1,650,000 | Westlake, Texas General Obligation Bonds | 5.750 | 5/1/2024 | 1,760,666 |
| 2,000,000 | Westlake, Texas General Obligation Bonds | 5.800 | 5/1/2032 | 2,109,640 |
| 430,000 | Wylie, Texas Independent School District General | | | |
| | Obligation Bonds (PSF/GTD Insured) | 6.875 | 8/15/2014 | 498,280 |
| 745,000 | Wylie, Texas Independent School District General | | | |
| | Obligation Bonds (PSF/GTD Insured)(b) | 6.875 | 8/15/2014 | 866,241 |
| 3,280,000 | Wylie, Texas Independent School District Unrefunded | | |
| | General Obligation Bonds (PSF/GTD Insured) | 7.000 | 8/15/2024 | 3,803,488 |
|
|
| | Total Texas | | | 138,487,591 |
|
|
| |
| Utah (0.7%) | | | |
| 3,345,000 | Intermountain Power Agency, Utah Power Supply | | | |
| | Revenue Bonds (Series B) (MBIA insured) | 5.750 | 7/1/2019 | 3,534,561 |
| 1,655,000 | Intermountain Power Agency, Utah Power Supply | | | |
| | Revenue Bonds (Series B) (MBIA insured)(b) | 5.750 | 7/1/2019 | 1,755,177 |
| 3,405,000 | Timpanogos, Utah Special Service District Sewer | | | |
| | Revenue Bonds (Series A) (AMBAC Insured)(b) | 6.100 | 6/1/2019 | 3,498,399 |
|
|
| | Total Utah | | | 8,788,137 |
|
|
| |
| Vermont (0.3%) | | | |
| 3,500,000 | Vermont Educational and Health Buildings Financing | | | |
| | Agency Revenue Bonds (Norwich University Project) | 5.500 | 7/1/2021 | 3,631,985 |
|
|
| | Total Vermont | | | 3,631,985 |
|
|
| |
| |
| The accompanying notes to the financial statements are an integral part of this schedule. | |
|
| |
| 184 | | | |
| Municipal Bond Fund | | | |
| Schedule of Investments as of October 31, 2005(a) | | | |
| |
| Principal | | Interest | Maturity | |
| Amount | Long-Term Fixed Income (99.0%) | Rate | Date | Value |
|
| Virginia (0.8%) | | | |
| $3,000,000 | Fairfax County, Virginia Industrial Development | | | |
| | Authority Revenue Bonds (Inova Health | | | |
| | Systems Project)(b) | 5.875% | 8/15/2016 | $3,123,540 |
| 2,500,000 | Fairfax County, Virginia Industrial Development | | | |
| | Authority Revenue Bonds (Inova Health Systems Project) | 5.250 | 8/15/2019 | 2,646,025 |
| 3,625,000 | Fairfax County, Virginia Water Authority Water | | | |
| | Revenue Bonds | 5.000 | 4/1/2021 | 3,942,840 |
| 500,000 | Tobacco Settlement Authority, Virginia Tobacco | | | |
| | Settlement Revenue Bonds | 5.250 | 6/1/2019 | 508,485 |
|
|
| | Total Virginia | | | 10,220,890 |
|
|
| |
| Washington (5.0%) | | | |
| 2,060,000 | Clark and Skamania Counties, Washington School | | | |
| | District #112-6 Washougal General Obligation Bonds | | | |
| | (FGIC Insured)(b) | 6.000 | 12/1/2019 | 2,298,630 |
| 1,655,000 | Douglas County, Washington Public Utility | | | |
| | District # 1 Wells Hydroelectric Bonds(b) | 8.750 | 9/1/2018 | 1,828,262 |
| 1,395,000 | Douglas County, Washington Public Utility | | | |
| | District # 1 Wells Hydroelectric Revenue Bonds | 8.750 | 9/1/2018 | 1,538,922 |
| 1,000,000 | Energy Northwest, Washington Electric Revenue Bonds | | | |
| | (Columbia Generating) (Series A) (MBIA Insured) | 5.750 | 7/1/2018 | 1,095,270 |
| 1,000,000 | Grant County, Washington Public Utilities District #2 | | | |
| | Priest Rapids Hydro Electric Revenue Bonds (Series A) | | | |
| | (MBIA Insured) | 5.250 | 1/1/2017 | 1,052,760 |
| 2,000,000 | Grant County, Washington Public Utilities District #2 | | | |
| | Revenue Bonds (Second Series A) (AMBAC Insured) | 5.000 | 1/1/2023 | 2,004,560 |
| 10,000,000 | King County, Washington Sewer Revenue Bonds | | | |
| | (Series B) (FSA Insured) | 5.500 | 1/1/2013 | 10,902,500 |
| 8,745,000 | Tobacco Settlement Authority, Washington Tobacco | | | |
| | Settlement Revenue Bonds | 6.500 | 6/1/2026 | 9,466,637 |
| 45,000 | Washington State Bonds (Series 93A)(b) | 5.750 | 10/1/2012 | 48,820 |
| 2,000,000 | Washington State General Obligation Bonds | | | |
| | (Motor Vehicle Fuel Tax) | 5.000 | 9/1/2007 | 2,063,340 |
| 2,955,000 | Washington State General Obligation Bonds | | | |
| | (Series 93A) | 5.750 | 10/1/2012 | 3,197,399 |
| 1,500,000 | Washington State General Obligation Bonds | | | |
| | (Series A and AT-6) | 6.250 | 2/1/2011 | 1,622,610 |
| 5,000,000 | Washington State General Obligation Bonds | | | |
| | (Series A) | 6.750 | 2/1/2015 | 5,828,650 |
| 2,500,000 | Washington State General Obligation Bonds | | | |
| | (Series B and AT-7) | 6.250 | 6/1/2010 | 2,778,350 |
| 2,000,000 | Washington State General Obligation Bonds | | | |
| | (Series B and AT-7) | 6.000 | 6/1/2012 | 2,248,940 |
| 1,000,000 | Washington State Health Care Facilities Authority | | | |
| | Revenue Bonds (Central Washington Health Services | | | |
| | Association) (AMBAC Insured) | 5.000 | 10/1/2018 | 1,029,840 |
| |
|
| The accompanying notes to the financial statements are an integral part of this schedule. | |
|
185
| Municipal Bond Fund | | | |
| Schedule of Investments as of October 31, 2005(a) | | | |
| |
| Principal | | Interest | Maturity | |
| Amount | Long-Term Fixed Income (99.0%) | Rate | Date | Value |
|
| Washington -- continued | | | |
| $1,700,000 | Washington State Health Care Facilities Authority | | | |
| | Revenue Bonds (Kadlec Medical Center) | 6.000% | 12/1/2030 | $1,812,948 |
| 2,000,000 | Washington State Health Care Facilities Authority | | | |
| | Revenue Bonds (Swedish Health Services) | | | |
| | (AMBAC Insured) | 5.125 | 11/15/2018 | 2,077,300 |
| 1,000,000 | Washington State Higher Education Facilities Authority | | | |
| | (Whitman College)(b) | 5.875 | 10/1/2029 | 1,092,570 |
| 2,975,000 | Washington State Housing Finance Commission | | | |
| | Multi-Family Mortgage Revenue Bonds (Pooled Loan | | | |
| | Program) (Subject to ‘AMT’) | 6.300 | 1/1/2021 | 3,127,380 |
| 1,000,000 | Washington State Housing Finance Commission | | | |
| | Nonprofit Housing Revenue Bonds (Crista Ministries | | | |
| | Projects) (Series A) | 5.350 | 7/1/2014 | 1,018,520 |
| 3,000,000 | Washington State Public Power Supply System | | | |
| | Refunding Revenue Bonds (Nuclear Project #1) | | | |
| | (Series A) (MBIA Insured) | 5.750 | 7/1/2012 | 3,108,870 |
| 2,000,000 | Washington State Public Power Supply System Revenue | | | |
| | Bonds (Nuclear Project) (Series A) (MBIA Insured) | 5.750 | 7/1/2011 | 2,072,580 |
|
|
| | Total Washington | | | 63,315,658 |
|
|
| |
| West Virginia (0.3%) | | | |
| 3,465,000 | West Virginia State Water Development Authority | | | |
| | Revenue Bonds (Series B-II) (FGIC Insured) | 5.000 | 11/1/2033 | 3,566,628 |
|
|
| | Total West Virginia | | | 3,566,628 |
|
|
| |
| Wisconsin (1.1%) | | | |
| 1,500,000 | Wisconsin State Health and Educational Facilities | | | |
| | Authority Revenue Bonds (Aurora Health Care) (Series B) | 5.500 | 2/15/2015 | 1,519,830 |
| 1,000,000 | Wisconsin State Health and Educational Facilities | | | |
| | Authority Revenue Bonds (Eagle River Memorial | | | |
| | Hospital, Inc. Project) | 5.750 | 8/15/2020 | 1,071,520 |
| 1,000,000 | Wisconsin State Health and Educational Facilities | | | |
| | Authority Revenue Bonds (Franciscan Sisters Christian) | | | |
| | (Series A) | 5.500 | 2/15/2018 | 1,019,370 |
| 2,000,000 | Wisconsin State Health and Educational Facilities | | | |
| | Authority Revenue Bonds (Marshfield Clinic) (Series B) | 6.000 | 2/15/2025 | 2,119,800 |
| 2,000,000 | Wisconsin State Health and Educational Facilities | | | |
| | Authority Revenue Bonds (Watertown Memorial | | | |
| | Hospital, Inc.) | 5.500 | 8/15/2029 | 2,097,780 |
| 6,000,000 | Wisconsin State Health and Educational Facilities | | | |
| | Authority Revenue Bonds (Wheaton Franciscan Services) | 5.750 | 8/15/2025 | 6,346,380 |
|
|
| | Total Wisconsin | | | 14,174,680 |
|
|
| |
The accompanying notes to the financial statements are an integral part of this schedule.
|
| |
|
186
| Municipal Bond Fund | | | |
| Schedule of Investments as of October 31, 2005(a) | | | |
| |
| Principal | | Interest | Maturity | |
| Amount | Long-Term Fixed Income (99.0%) | Rate | Date | Value |
|
| Wyoming (0.5%) | | | |
| $5,825,000 | Wyoming State Farm Loan Board Capital Facilities | | | |
| | Revenue Bonds | 5.750% | 10/1/2020 | $6,577,474 |
|
|
| | Total Wyoming | | | 6,577,474 |
|
|
| | Total Long-Term Fixed Income (cost $1,161,547,519) | 1,250,214,728 |
|
|
| |
| |
| Principal | | Interest | Maturity | |
| Amount | Short-Term Investments (1.0%) | Rate(e) | Date | Value |
|
| $515,000 | Chelsea, Michigan Economic Development Corporation | | | |
| | Obligation Revenue Bonds (United Methodist Retirement) | 4.800% | 11/15/2005 | $514,648 |
| 2,700,000 | Connecticut State Health and Educational Facilities | | | |
| | Authority Revenue Bonds (Yale University) | | | |
| | (Series T-1)(d) | 2.700 | 11/1/2005 | 2,700,000 |
| 2,600,000 | Connecticut State Health and Educational Facilities | | | |
| | Authority Revenue Bonds (Yale University) | | | |
| | (Series X-3)(d) | 2.700 | 11/1/2005 | 2,600,000 |
| 2,160,000 | Kansas State Department of Transportation Highway | | | |
| | Revenue Bonds (Series B-2)(d) | 2.730 | 11/1/2005 | 2,160,000 |
| 1,025,000 | Lincoln County, Wyoming Pollution Control | | | |
| | Revenue Bonds(d) | 2.730 | 11/1/2005 | 1,025,000 |
| 1,800,000 | Massachusetts State Health and Educational Facilities | | | |
| | Authority Revenue Bonds (Capital Asset Program) | | | |
| | (Series C)(d) | 2.700 | 11/1/2005 | 1,800,000 |
| 1,200,000 | North Central Texas Health Facility Development | | | |
| | Corporation Revenue Bonds(d) | 2.730 | 11/1/2005 | 1,200,000 |
|
|
| | Total Short-Term Investments (at amortized cost) | 11,999,648 |
|
|
| | Total Investments (cost $1,173,547,167) | | $1,262,214,376 |
|
|
| (a) | The categories of investments are shown as a percentage of total investments. |
| |
| (b) | Denotes securities that have been pre-refunded or escrowed to maturity. Under such an arrangement, money is deposited into an irrevocable escrow account and is used to purchase U.S. Treasury securities or government agency securities with maturing principals and interest earnings sufficient to pay all debt service requirements of the pre-refunded bonds. |
| |
| (c) | Denotes step coupon bonds for which the current interest rate and next scheduled reset date are shown. |
| |
| (d) | Denotes variable rate obligations for which the current yield and next scheduled reset date are shown. |
| |
| (e) | The interest rate shown reflects the yield, coupon rate or, for securities purchased at a discount, the discount rate at the date of purchase. |
| |
|
The accompanying notes to the financial statements are an integral part of this schedule. |
|
187
| | Income Fund | | | |
| | Schedule of Investments as of October 31, 2005(a) | | |
| Principal | | Interest | Maturity | |
| Amount | Long-Term Fixed Income (88.2%) | Rate | Date | Value |
|
| Asset-Backed Securities (11.7%) | | | |
| $5,000,000 | Banc of America Securities Auto Trust | 3.890% | 6/18/2008 | $4,974,875 |
| 3,042,630 | Chase Funding Mortgage Loan | | | |
| | Asset-Backed Certificates(b) | 2.734 | 9/25/2024 | 3,020,528 |
| 5,000,000 | Countrywide Asset-Backed Certificates(b) | 3.903 | 1/25/2031 | 4,972,000 |
| 6,933,744 | CPL Transition Funding, LLC(c) | 5.010 | 1/15/2010 | 6,937,155 |
| 6,000,000 | DaimlerChrysler Master Owner Trust(c,d) | 4.020 | 11/15/2005 | 5,996,664 |
| 5,000,000 | Ford Credit Floorplan Master Owner Trust(c,d) | 4.110 | 11/15/2005 | 5,005,005 |
| 4,000,000 | Fremont Home Loan Trust(b,d) | 4.197 | 11/25/2005 | 3,999,848 |
| 6,000,000 | GE Dealer Floorplan Master Note Trust(c,d) | 4.040 | 11/20/2005 | 6,001,866 |
| 6,000,000 | GMAC Mortgage Corporation Loan Trust(b,d) | 4.127 | 11/25/2005 | 5,991,456 |
| 2,750,000 | GMAC Mortgage Corporation Loan Trust(d) | 4.167 | 11/25/2005 | 2,752,439 |
| 5,250,000 | MBNA Credit Card Master Note Trust(c,d) | 4.080 | 11/15/2005 | 5,257,424 |
| 4,500,000 | Nissan Auto Lease Trust(c) | 3.180 | 6/15/2010 | 4,398,219 |
| 1,500,000 | Option One Mortgage Loan Trust(d) | 4.197 | 11/25/2005 | 1,499,943 |
| 5,000,000 | PG&E Energy Recovery Funding, LLC | 3.870 | 6/25/2011 | 4,914,765 |
| 3,737,775 | Popular ABS Mortgage Pass-Through Trust(d) | 4.147 | 11/25/2005 | 3,736,867 |
| 5,902,539 | Residential Asset Mortgage Products, Inc.(b,d) | 4.147 | 11/25/2005 | 5,902,757 |
| 2,250,000 | Residential Asset Securities Corporation(c) | 3.250 | 5/25/2029 | 2,237,195 |
| 5,218,646 | SLM Student Loan Trust(b,d) | 4.210 | 1/25/2006 | 5,218,584 |
| 3,051,154 | Structured Asset Investment Loan Trust(d) | 4.117 | 11/25/2005 | 3,051,225 |
|
|
| | Total Asset-Backed Securities | | 85,868,815 |
|
|
| |
| Basic Materials (1.6%) | | | |
| 1,250,000 | Dow Chemical Company(c) | 6.125 | 2/1/2011 | 1,304,098 |
| 3,500,000 | Georgia-Pacific Corporation | 8.875 | 2/1/2010 | 3,832,500 |
| 1,500,000 | Glencore Funding, LLC | 6.000 | 4/15/2014 | 1,381,696 |
| 2,980,000 | Lubrizol Corporation(e) | 5.500 | 10/1/2014 | 2,936,596 |
| 2,000,000 | Precision Castparts Corporation | 5.600 | 12/15/2013 | 2,003,738 |
|
|
| | Total Basic Materials | | | 11,458,628 |
|
|
| |
| Capital Goods (3.4%) | | | |
| 2,500,000 | Boeing Capital Corporation(e) | 6.500 | 2/15/2012 | 2,688,512 |
| 1,600,000 | Crown Euro Holdings SA | 9.500 | 3/1/2011 | 1,760,000 |
| 3,000,000 | Goodrich Corporation | 7.625 | 12/15/2012 | 3,390,789 |
| 2,000,000 | Hutchison Whampoa International, Ltd. | 6.500 | 2/13/2013 | 2,096,554 |
| 2,320,000 | L-3 Communications Corporation(e) | 5.875 | 1/15/2015 | 2,204,000 |
| 1,250,000 | Masco Corporation | 4.800 | 6/15/2015 | 1,187,934 |
| 3,250,000 | Oakmont Asset Trust(b) | 4.514 | 12/22/2008 | 3,169,959 |
| 385,000 | Sealed Air Corporation | 5.375 | 4/15/2008 | 384,618 |
| 2,802,115 | Systems 2001 Asset Trust, LLC | 6.664 | 9/15/2013 | 2,968,364 |
| 2,250,000 | Textron Financial Corporation | 4.600 | 5/3/2010 | 2,206,573 |
| 3,000,000 | Tyco International Group SA(b) | 6.375 | 10/15/2011 | 3,152,001 |
|
|
| | Total Capital Goods | | | 25,209,304 |
|
|
| |
| |
The accompanying notes to the financial statements are an integral part of this schedule. |
|
188
| Income Fund | | | | |
| Schedule of Investments as of October 31, 2005(a) | | | |
| |
| Principal | | Interest | Maturity | |
| Amount | Long-Term Fixed Income (88.2%) | Rate | Date | Value |
|
| Commercial Mortgage-Backed Securities (13.5%) | | | |
| $6,000,000 | Banc of America Commercial Mortgage, Inc. | 4.894% | 9/10/2010 | $5,954,832 |
| 3,250,000 | Banc of America Commercial Mortgage, Inc.(c) | 4.037 | 11/10/2039 | 3,114,686 |
| 3,250,000 | Banc of America Commercial Mortgage, Inc.(c) | 4.561 | 11/10/2041 | 3,142,139 |
| 562,820 | Banc of America Commercial Mortgage, Inc. | 3.366 | 7/11/2043 | 555,187 |
| 2,000,000 | Banc of America Commercial Mortgage, Inc.(c) | 5.118 | 7/11/2043 | 1,992,658 |
| 7,869,806 | Banc of America Mortgage Securities, Inc.(b) | 4.830 | 9/25/2035 | 7,756,811 |
| 5,799,189 | Commercial Mortgage Pass-Through Certificates(d) | 4.070 | 11/15/2005 | 5,798,238 |
| 5,814,790 | Credit Suisse First Boston Mortgage | | | |
| | Securities Corporation(c,d) | 4.120 | 11/15/2005 | 5,814,772 |
| 6,000,000 | Credit Suisse First Boston Mortgage | | | |
| | Securities Corporation(c) | 2.843 | 5/15/2038 | 5,721,642 |
| 6,000,000 | General Electric Commercial Mortgage Corporation(c) | 4.706 | 5/10/2043 | 5,903,502 |
| 2,750,000 | J.P. Morgan Chase Commercial Mortgage | | | |
| | Securities Corporation | 4.302 | 1/15/2038 | 2,632,008 |
| 4,000,000 | LB-UBS Commercial Mortgage Trust | 3.323 | 3/15/2027 | 3,864,216 |
| 2,000,000 | LB-UBS Commercial Mortgage Trust | 6.653 | 11/15/2027 | 2,135,362 |
| 3,768,160 | Lehman Brothers “CALSTRS” Mortgage Trust(c) | 3.988 | 11/20/2012 | 3,703,227 |
| 5,496,595 | Merrill Lynch Mortgage Investors, Inc. | 4.906 | 6/25/2035 | 5,436,699 |
| 10,000,000 | Merrill Lynch Mortgage Trust | 4.747 | 5/12/2043 | 9,595,710 |
| 5,984,745 | Wachovia Bank Commercial Mortgage Trust(d) | 4.070 | 11/15/2005 | 5,982,944 |
| 6,000,000 | Wachovia Bank Commercial Mortgage Trust(d) | 4.170 | 11/15/2005 | 6,000,000 |
| 3,500,000 | Wachovia Bank Commercial Mortgage Trust(b) | 4.516 | 5/15/2044 | 3,404,272 |
| 5,500,000 | Washington Mutual Mortgage Pass-Through Certificates(d) | 4.327 | 11/25/2005 | 5,503,008 |
| 4,771,643 | Washington Mutual Mortgage Pass-Through Certificates | 4.850 | 9/25/2035 | 4,732,449 |
|
|
| | Total Commercial Mortgage-Backed Securities | 98,744,362 |
|
|
| |
| Communications Services (4.8%) | | | |
| 2,500,000 | AT&T Wireless Services, Inc.(b,c) | 8.125 | 5/1/2012 | 2,875,072 |
| 1,600,000 | British Sky Broadcasting Finance UK plc | 6.500 | 10/15/2035 | 1,571,978 |
| 2,500,000 | Citizens Communications Company(e) | 9.250 | 5/15/2011 | 2,706,250 |
| 1,500,000 | Clear Channel Communications, Inc. | 4.500 | 1/15/2010 | 1,424,522 |
| 2,000,000 | Clear Channel Communications, Inc.(e) | 5.500 | 9/15/2014 | 1,878,304 |
| 1,500,000 | EchoStar DBS Corporation | 5.750 | 10/1/2008 | 1,466,250 |
| 3,000,000 | Interpublic Group of Companies, Inc. | 6.250 | 11/15/2014 | 2,651,250 |
| 250,000 | New York Times Company(e) | 5.000 | 3/15/2015 | 242,350 |
| 3,250,000 | Nextel Communications, Inc. | 5.950 | 3/15/2014 | 3,260,127 |
| 3,200,000 | Qwest Corporation | 8.875 | 3/15/2012 | 3,512,000 |
| 2,000,000 | Rogers Wireless Communications, Inc. | 6.375 | 3/1/2014 | 1,995,000 |
| 1,000,000 | Sprint Capital Corporation(c) | 6.900 | 5/1/2019 | 1,085,441 |
| 3,000,000 | TCI Communications, Inc. | 8.750 | 8/1/2015 | 3,620,154 |
| 1,750,000 | Telecom Italia Capital SA | 4.000 | 1/15/2010 | 1,663,518 |
| 2,250,000 | Telecom Italia Capital SA | 5.250 | 10/1/2015 | 2,165,942 |
| 1,500,000 | Telefonos de Mexico SA de CV | 4.750 | 1/27/2010 | 1,466,079 |
| 1,500,000 | Verizon Global Funding Corporation | 7.750 | 12/1/2030 | 1,739,637 |
|
|
| | Total Communications Services | | 35,323,874 |
|
|
| |
| |
| The accompanying notes to the financial statements are an integral part of this schedule. | |
|
189
| Income Fund | | | | |
| Schedule of Investments as of October 31, 2005(a) | | | |
| |
| Principal | | Interest | Maturity | |
| Amount | Long-Term Fixed Income (88.2%) | Rate | Date | Value |
|
| Consumer Cyclical (4.2%) | | | |
| $2,000,000 | AOL Time Warner, Inc. | 6.875% | 5/1/2012 | $2,140,716 |
| 2,130,000 | Caesars Entertainment, Inc.(e) | 8.125 | 5/15/2011 | 2,327,025 |
| 3,000,000 | Centex Corporation(b) | 5.450 | 8/15/2012 | 2,919,657 |
| 4,180,000 | D.R. Horton, Inc.(e) | 4.875 | 1/15/2010 | 4,015,245 |
| 2,250,000 | DaimlerChrysler North American Holdings Corporation | 4.875 | 6/15/2010 | 2,181,627 |
| 3,250,000 | Ford Motor Credit Company | 6.625 | 6/16/2008 | 3,116,600 |
| 1,110,000 | Gap, Inc. | 10.550 | 12/15/2008 | 1,238,480 |
| 4,500,000 | General Motors Acceptance Corporation | 6.875 | 9/15/2011 | 4,363,286 |
| 750,000 | General Motors Acceptance Corporation(e) | 6.875 | 8/28/2012 | 722,476 |
| 1,500,000 | Harrah’s Operating Company, Inc. | 5.750 | 10/1/2017 | 1,419,474 |
| 1,200,000 | Host Marriott, LP | 6.375 | 3/15/2015 | 1,164,000 |
| 3,100,000 | Royal Caribbean Cruises, Ltd.(e) | 6.875 | 12/1/2013 | 3,208,500 |
| 2,000,000 | Starwood Hotels & Resorts Worldwide, Inc. | 7.875 | 5/1/2012 | 2,155,000 |
|
|
| | Total Consumer Cyclical | | 30,972,086 |
|
|
| |
| Consumer Non-Cyclical (4.2%) | | | |
| 800,000 | AmerisourceBergen Corporation | 5.625 | 9/15/2012 | 770,000 |
| 800,000 | AmerisourceBergen Corporation | 5.875 | 9/15/2015 | 770,000 |
| 2,000,000 | Archer-Daniels-Midland Company | 5.375 | 9/15/2035 | 1,874,536 |
| 2,750,000 | Bunge Limited Finance Corporation | 7.800 | 10/15/2012 | 3,131,843 |
| 2,800,000 | Coventry Health Care, Inc. | 5.875 | 1/15/2012 | 2,786,000 |
| 2,900,000 | Delhaize America, Inc. | 8.125 | 4/15/2011 | 3,097,090 |
| 1,100,000 | HCA, Inc. | 6.300 | 10/1/2012 | 1,082,496 |
| 1,500,000 | HCA, Inc. | 6.250 | 2/15/2013 | 1,470,770 |
| 1,000,000 | Hospira, Inc. | 4.950 | 6/15/2009 | 991,797 |
| 2,000,000 | Kraft Foods, Inc. | 4.125 | 11/12/2009 | 1,931,936 |
| 2,000,000 | Miller Brewing Company | 5.500 | 8/15/2013 | 2,015,986 |
| 2,075,000 | Quest Diagnostic, Inc. | 5.450 | 11/1/2015 | 2,068,671 |
| 2,200,000 | Safeway, Inc.(e) | 4.800 | 7/16/2007 | 2,188,019 |
| 2,800,000 | Tyson Foods, Inc. | 8.250 | 10/1/2011 | 3,157,087 |
| 3,000,000 | Wyeth | 6.950 | 3/15/2011 | 3,233,448 |
|
|
| | Total Consumer Non-Cyclical | | 30,569,679 |
|
|
| |
| Energy (4.3%) | | | |
| 750,000 | Boardwalk Pipelines, LLC | 5.500 | 2/1/2017 | 733,950 |
| 2,250,000 | Chesapeake Energy Corporation(b) | 7.000 | 8/15/2014 | 2,340,000 |
| 1,200,000 | Colorado Interstate Gas Company | 6.800 | 11/15/2015 | 1,206,000 |
| 1,750,000 | Consolidated Natural Gas Company | 5.000 | 12/1/2014 | 1,694,238 |
| 2,250,000 | Enterprise Products Operating, LP | 4.625 | 10/15/2009 | 2,182,435 |
| 750,000 | Enterprise Products Operating, LP | 4.950 | 6/1/2010 | 730,518 |
| 2,000,000 | LG-Caltex Oil Corporation | 5.500 | 8/25/2014 | 1,986,198 |
| 1,800,000 | Magellan Midstream Partners, LP | 6.450 | 6/1/2014 | 1,889,242 |
| 700,000 | Magellan Midstream Partners, LP | 5.650 | 10/15/2016 | 690,994 |
| 1,750,000 | Newfield Exploration Company | 6.625 | 9/1/2014 | 1,780,625 |
| 2,000,000 | Plains All American Pipeline, LP/PAA | | | |
| | Finance Corporation | 5.625 | 12/15/2013 | 2,001,796 |
| |
|
| The accompanying notes to the financial statements are an integral part of this schedule. | |
|
190
| Income Fund | | | | |
| Schedule of Investments as of October 31, 2005(a) | | | |
| |
| Principal | | Interest | Maturity | |
| Amount | Long-Term Fixed Income (88.2%) | Rate | Date | Value |
|
| Energy -- continued | | | |
| $1,500,000 | Premcor Refining Group, Inc. | 6.125% | 5/1/2011 | $1,539,375 |
| 4,250,000 | Ras Laffan Liquefied Natural Gas Company, Ltd. II | 5.298 | 9/30/2020 | 4,154,630 |
| 1,150,000 | Southern Natural Gas Company | 8.875 | 3/15/2010 | 1,234,211 |
| 2,000,000 | Transcontinental Gas Pipe Corporation | 8.875 | 7/15/2012 | 2,290,000 |
| 3,600,000 | Whiting Petroleum Corporation | 7.000 | 2/1/2014 | 3,609,000 |
| 1,500,000 | XTO Energy, Inc.(e) | 5.000 | 1/31/2015 | 1,450,316 |
|
|
| | Total Energy | | | 31,513,528 |
|
|
| |
| Financials (13.6%) | | | |
| 3,000,000 | American International Group, Inc. | 5.050 | 10/1/2015 | 2,932,440 |
| 1,500,000 | Archstone-Smith Trust | 5.250 | 5/1/2015 | 1,466,096 |
| 1,500,000 | Barnett Capital I | 8.060 | 12/1/2026 | 1,599,260 |
| 2,000,000 | BB&T Corporation | 4.900 | 6/30/2017 | 1,911,978 |
| 3,000,000 | BNP Paribas SA | 5.186 | 6/29/2015 | 2,884,530 |
| 1,500,000 | Capital One Financial Corporation(b,c,e) | 6.250 | 11/15/2013 | 1,552,264 |
| 2,250,000 | CIT Group Company of Canada(b,c) | 4.650 | 7/1/2010 | 2,201,882 |
| 1,750,000 | Citigroup, Inc.(e) | 4.700 | 5/29/2015 | 1,676,754 |
| 1,000,000 | Corestates Capital Trust I | 8.000 | 12/15/2026 | 1,064,570 |
| 2,755,000 | Countrywide Home Loans, Inc.(b,c) | 4.000 | 3/22/2011 | 2,585,353 |
| 3,000,000 | Credit Suisse First Boston USA, Inc. | 5.125 | 8/15/2015 | 2,923,218 |
| 1,600,000 | EOP Operating, LP | 4.650 | 10/1/2010 | 1,556,816 |
| 1,500,000 | ERP Operating, LP | 5.125 | 3/15/2016 | 1,454,814 |
| 3,000,000 | Goldman Sachs Group, Inc.(e) | 5.125 | 1/15/2015 | 2,925,987 |
| 1,600,000 | Health Care Property Investors, Inc. | 5.625 | 5/1/2017 | 1,535,315 |
| 1,600,000 | HRPT Properties Trust | 6.400 | 2/15/2015 | 1,669,587 |
| 4,500,000 | HSBC Capital Funding, LP/Jersey Channel Islands(c) | 9.547 | 6/30/2010 | 5,275,768 |
| 2,750,000 | International Lease Finance Corporation | 4.875 | 9/1/2010 | 2,706,003 |
| 2,500,000 | J.P. Morgan Chase & Company | 5.125 | 9/15/2014 | 2,446,732 |
| 1,500,000 | J.P. Morgan Chase & Company | 5.150 | 10/1/2015 | 1,461,444 |
| 10,271,066 | Lehman Brothers, Inc. | 6.539 | 8/15/2008 | 10,407,260 |
| 1,000,000 | Merrill Lynch & Company, Inc. | 4.831 | 10/27/2008 | 995,929 |
| 1,500,000 | Metropolitan Life Global Funding | 4.500 | 5/5/2010 | 1,469,738 |
| 5,000,000 | Montpelier Re Holdings, Ltd.(b) | 6.125 | 8/15/2013 | 4,900,710 |
| 2,000,000 | Monumental Global Funding II | 4.625 | 3/15/2010 | 1,979,024 |
| 2,250,000 | Morgan Stanley | 5.375 | 10/15/2015 | 2,220,865 |
| 1,250,000 | Nuveen Investment, Inc. | 5.000 | 9/15/2010 | 1,224,579 |
| 1,400,000 | ProLogis(f) | 5.625 | 11/15/2015�� | 1,396,244 |
| 2,000,000 | Protective Life Secured Trust | 4.850 | 8/16/2010 | 1,986,338 |
| 1,500,000 | Prudential Financial, Inc. | 4.750 | 6/13/2015 | 1,434,392 |
| 3,000,000 | Residential Capital Corporation | 6.375 | 6/30/2010 | 3,047,232 |
| 2,000,000 | Resona Bank, Ltd. | 5.850 | 4/15/2016 | 1,930,442 |
| 2,300,000 | Sanwa Bank, Ltd.(c) | 7.400 | 6/15/2011 | 2,519,160 |
| 2,250,000 | Simon Property Group, LP(c) | 4.600 | 6/15/2010 | 2,197,330 |
| 750,000 | Sovereign Bancorp, Inc. | 4.800 | 9/1/2010 | 736,751 |
| 1,000,000 | Stingray Pass-Through Trust | 5.902 | 1/12/2015 | 964,610 |
| 2,000,000 | Student Loan Marketing Corporation | 4.500 | 7/26/2010 | 1,951,488 |
| |
| The accompanying notes to the financial statements are an integral part of this schedule. | |
|
191
| Income Fund | | | | |
| Schedule of Investments as of October 31, 2005(a) | | | |
| |
| Principal | | Interest | Maturity | |
| Amount | Long-Term Fixed Income (88.2%) | Rate | Date | Value |
|
| Financials -- continued | | | |
| $3,500,000 | Wachovia Bank NA(b,c) | 4.875% | 2/1/2015 | $3,391,479 |
| 2,500,000 | Washington Mutual Bank FA | 5.125 | 1/15/2015 | 2,424,040 |
| 4,500,000 | Wells Fargo Capital(b) | 7.730 | 12/1/2026 | 4,778,442 |
| 1,700,000 | Westfield Capital(b) | 4.375 | 11/15/2010 | 1,640,962 |
| 2,200,000 | Willis Group North America, Inc.(b) | 5.625 | 7/15/2015 | 2,158,704 |
|
|
| | Total Financials | | | 99,586,530 |
|
|
| |
| Foreign (1.1%) | | | |
| 500,000 | Pemex Finance, Ltd. | 8.450 | 2/15/2007 | 508,290 |
| 4,000,000 | Pemex Finance, Ltd. | 9.030 | 2/15/2011 | 4,414,640 |
| 2,200,000 | Republic of Italy | 5.375 | 6/15/2033 | 2,174,891 |
| 1,000,000 | United Mexican States | 6.375 | 1/16/2013 | 1,047,500 |
|
|
| | Total Foreign | | | 8,145,321 |
|
|
| |
| Mortgage-Backed Securities (10.6%) | | | |
| 19,750,000 | Federal National Mortgage Association Conventional | | | |
| | 15-Yr. Pass Through(f) | 5.500 | 11/1/2020 | 19,879,600 |
| 38,500,000 | Federal National Mortgage Association Conventional | | | |
| | 30-Yr. Pass Through(f) | 5.500 | 11/1/2035 | 37,970,624 |
| 19,250,000 | Federal National Mortgage Association Conventional | | | |
| | 30-Yr. Pass Through(f) | 6.000 | 11/1/2035 | 19,412,432 |
|
|
| | Total Mortgage-Backed Securities | | 77,262,656 |
|
|
| |
| Technology (0.3%) | | | |
| 2,000,000 | Anixter International, Inc. | 5.950 | 3/1/2015 | 1,906,422 |
|
|
| | Total Technology | | | 1,906,422 |
|
|
| |
| Transportation (1.9%) | | | |
| 1,000,000 | FedEx Corporation | 3.500 | 4/1/2009 | 954,815 |
| 3,296,794 | FedEx Corporation | 6.720 | 1/15/2022 | 3,558,493 |
| 1,500,000 | Northwest Airlines, Inc.(g) | 6.841 | 4/1/2011 | 1,437,794 |
| 4,000,000 | Southwest Airlines Company(c) | 5.496 | 11/1/2006 | 4,027,248 |
| 2,500,000 | Union Pacific Corporation | 4.875 | 1/15/2015 | 2,416,168 |
| 1,485,526 | United Air Lines, Inc.(g) | 7.186 | 4/1/2011 | 1,463,243 |
|
|
| | Total Transportation | | 13,857,761 |
|
|
| |
| U.S. Government (7.4%) | | | |
| |
| 17,000,000 | U.S. Treasury Bonds(e) | 7.625 | 2/15/2025 | 22,900,190 |
| 1,350,000 | U.S. Treasury Bonds(e) | 6.125 | 8/15/2029 | 1,600,171 |
| 970,000 | U.S. Treasury Bonds(e) | 5.375 | 2/15/2031 | 1,057,906 |
| 2,500,000 | U.S. Treasury Notes(e) | 4.250 | 10/15/2010 | 2,478,222 |
| 6,259,210 | U.S. Treasury Notes | 1.875 | 7/15/2015 | 6,195,641 |
| 5,650,000 | U.S. Treasury Notes(e) | 4.250 | 8/15/2015 | 5,513,163 |
| 17,000,000 | U.S. Treasury Principal Strips(e) | Zero Coupon | 11/15/2022 | 7,426,433 |
| 10,250,000 | U.S. Treasury Strips(e) | Zero Coupon | 2/15/2013 | 7,363,231 |
|
|
| | Total U.S. Government | | 54,534,957 |
|
|
| |
| The accompanying notes to the financial statements are an integral part of this schedule. | |
|
| |
| 192 | | | |
| Income Fund | | | | |
| Schedule of Investments as of October 31, 2005(a) | | | |
| |
| Principal | | Interest | Maturity | |
| Amount | Long-Term Fixed Income (88.2%) | Rate | Date | Value |
|
| U.S. Municipals (0.4%) | | | |
| $2,500,000 | Massachusetts State School Building Authority | | | |
| | Dedicated Sales Tax Revenue Bonds | 5.000% | 8/15/2030 | $2,581,875 |
|
|
| | Total U.S. Municipals | | | 2,581,875 |
|
|
| |
| Utilities (5.2%) | | | |
| 1,250,000 | Carolina Power & Light, Inc.(b) | 5.150 | 4/1/2015 | 1,227,206 |
| 2,000,000 | CenterPoint Energy, Inc.(c) | 7.250 | 9/1/2010 | 2,142,318 |
| 2,000,000 | CenterPoint Energy, Inc.(c) | 6.850 | 6/1/2015 | 2,143,584 |
| 3,000,000 | Duke Capital, LLC | 5.668 | 8/15/2014 | 2,987,124 |
| 1,000,000 | Exelon Corporation(c) | 6.750 | 5/1/2011 | 1,057,177 |
| 2,000,000 | Exelon Corporation(c) | 5.625 | 6/15/2035 | 1,813,504 |
| 4,500,000 | FirstEnergy Corporation(b) | 6.450 | 11/15/2011 | 4,733,586 |
| 1,000,000 | MidAmerican Energy Holdings Company | 7.630 | 10/15/2007 | 1,046,622 |
| 1,475,000 | MidAmerican Energy Holdings Company | 3.500 | 5/15/2008 | 1,418,235 |
| 2,500,000 | NiSource Finance Corporation | 7.875 | 11/15/2010 | 2,779,120 |
| 286,649 | Power Contract Financing, LLC | 5.200 | 2/1/2006 | 286,984 |
| 2,000,000 | Power Contract Financing, LLC | 6.256 | 2/1/2010 | 2,032,160 |
| 2,602,260 | Power Receivables Finance, LLC | 6.290 | 1/1/2012 | 2,643,609 |
| 2,000,000 | Public Service Company of New Mexico | 4.400 | 9/15/2008 | 1,957,002 |
| 2,500,000 | Reliant Energy Resources Corporation | 6.750 | 12/15/2014 | 2,325,000 |
| 1,900,000 | TECO Energy, Inc.(e) | 7.200 | 5/1/2011 | 1,985,500 |
| 3,450,000 | Texas-New Mexico Power Company | 6.125 | 6/1/2008 | 3,491,980 |
| 1,200,000 | TXU Corporation | 4.800 | 11/15/2009 | 1,137,181 |
| 1,000,000 | Westar Energy, Inc.(c) | 5.150 | 1/1/2017 | 970,288 |
|
|
| | Total Utilities | | | 38,178,180 |
|
|
| | Total Long-Term Fixed Income (cost $653,722,334) | 645,713,978 |
|
|
| |
| |
| Shares | Preferred Stock (0.2%) | | | Value |
|
| 17 | Federal National Mortgage Association, Convertible | | | $1,549,467 |
|
|
| | Total Preferred Stock (cost $1,553,375) | | 1,549,467 |
|
|
| |
| |
| | | Interest | Maturity | |
| Shares | Collateral Held for Securities Loaned (8.3%) | Rate(h) | Date | Value |
|
| 60,887,414 | Thrivent Financial Securities Lending Trust | 3.950% | N/A | $60,887,414 |
|
|
| | Total Collateral Held for Securities Loaned | |
| | (cost $60,887,414) | | | 60,887,414 |
|
|
| |
| |
| |
| |
| The accompanying notes to the financial statements are an integral part of this schedule. | |
|
193
| Income Fund | | | | |
| Schedule of Investments as of October 31, 2005(a) | | | |
| | | Interest | Maturity | |
| Shares | Short-Term Investments (3.3%) | Rate(h) | Date | Value |
|
|
| 24,298,415 | Thrivent Money Market Fund | 3.600% | N/A | $24,298,415 |
|
|
| | Total Short-Term Investments (at amortized cost) | 24,298,415 |
|
|
| | Total Investments (cost $740,461,538) | | $732,449,274 |
|
|
| (a) | The categories of investments are shown as a percentage of total investments. |
| |
| (b) | At October 31, 2005, all or a portion of the denoted securities, valued at $65,709,885, were pledged as the initial margin deposit or earmarked as collateral to cover open financial futures contracts as follows: |
| |
| | | | | | Notional | |
| | Number of | Expiration | | | Principal | Unrealized |
| Type | Contracts | Date | Position | Value | Amount | Gain/(Loss) |
|
| | U.S. Treasury Bond Futures 5 yr. 240 December 2005 Long $25,413,751 $25,899,430 $(485,679) |
| |
| | U.S. Treasury Bond Futures 10 yr. 235 December 2005 Short (25,486,485) $(26,381,834) 895,349 |
| |
| | U.S. Treasury Bond Futures 20 yr. 105 December 2005 Long 11,756,719 $11,885,003 (128,284) |
| |
| (c) | Designated as cover for long settling trades as discussed in the notes to the financial statements. |
| |
| (d) | Denotes variable rate obligations for which the current yield and next scheduled reset date are shown. |
| |
| (e) | All or a portion of the security is on loan as discussed in item 2(L) of the Notes to Financial Statements. |
| |
| (f) | Denotes investments purchased on a when-issued basis. |
| |
| (g) | In bankruptcy. |
| |
| (h) | The interest rate shown reflects the yield, coupon rate or, for securities purchased at a discount, the discount rate at the date of purchase. |
| |
|
The accompanying notes to the financial statements are an integral part of this schedule. |
|
|
|
194
| | Core Bond Fund | | |
| | Schedule of Investments as of October 31, 2005(a) | | |
| Principal | | Interest | Maturity | |
| Amount | Long-Term Fixed Income (87.8%) | Rate | Date | Value |
|
| Asset-Backed Securities (21.9%) | | | |
| $5,000,000 | Americredit Automobile Receivables Trust(b,c) | 3.970% | 11/6/2005 | $5,001,105 |
| 5,000,000 | ARG Funding Corporation(b) | 4.290 | 4/20/2010 | 4,861,330 |
| 3,000,000 | Associates Manufactured Housing Contract | | | |
| | Pass-Through Certificates | 7.900 | 3/15/2027 | 3,136,863 |
| 4,000,000 | Banc of America Securities Auto Trust | 3.890 | 6/18/2008 | 3,979,900 |
| 5,000,000 | Bear Stearns Asset-Backed Securities, Inc.(c) | 4.277 | 11/25/2005 | 4,999,800 |
| 7,500,000 | Chase Credit Card Master Trust(b,c) | 4.100 | 11/15/2005 | 7,509,570 |
| 3,000,000 | CIT Equipment Collateral | 4.420 | 5/20/2009 | 2,977,779 |
| 4,000,000 | Countrywide Asset-Backed Certificates(b) | 3.903 | 1/25/2031 | 3,977,600 |
| 6,000,000 | Countrywide Asset-Backed Certificates(b) | 4.905 | 8/25/2032 | 5,985,294 |
| 1,157,000 | Credit Based Asset Servicing and Securitization(d) | 3.887 | 10/25/2034 | 1,141,899 |
| 5,000,000 | DaimlerChrysler Master Owner Trust(b,c) | 4.020 | 11/15/2005 | 4,997,220 |
| 4,593,285 | Encore Credit Receivables Trust(c) | 4.180 | 11/25/2005 | 4,593,520 |
| 4,582,521 | First Franklin Mortgage Loan Asset-Backed Certificates(c) | 4.137 | 11/25/2005 | 4,582,736 |
| 5,000,000 | Fremont Home Loan Trust(c) | 4.197 | 11/25/2005 | 4,999,810 |
| 5,000,000 | GE Dealer Floorplan Master Note Trust(b,c) | 4.040 | 11/20/2005 | 5,001,555 |
| 5,000,000 | GMAC Mortgage Corporation Loan Trust(c) | 4.127 | 11/25/2005 | 4,992,880 |
| 11,000,000 | GMAC Mortgage Corporation Loan Trust(b,c) | 4.167 | 11/25/2005 | 11,009,757 |
| 1,958,968 | Green Tree Financial Corporation | 7.650 | 10/15/2027 | 2,053,094 |
| 5,000,000 | Harley Davidson Motorcycle Trust(d) | 3.200 | 5/15/2012 | 4,859,515 |
| 3,242,681 | Long Beach Mortgage Loan Trust(c) | 4.147 | 11/25/2005 | 3,243,002 |
| 4,950,719 | National Collegiate Student Loan Trust(b,c) | 4.097 | 11/25/2005 | 4,950,377 |
| 5,000,000 | Option One Mortgage Loan Trust(c) | 4.197 | 11/25/2005 | 4,999,810 |
| 1,125,000 | PG&E Energy Recovery Funding, LLC | 3.870 | 6/25/2011 | 1,105,822 |
| 4,672,219 | Popular ABS Mortgage Pass-Through Trust(c) | 4.147 | 11/25/2005 | 4,671,084 |
| 5,000,000 | Popular ABS Mortgage Pass-Through Trust(c) | 4.167 | 11/25/2005 | 5,000,000 |
| 2,000,000 | Popular ABS Mortgage Pass-Through Trust | 4.000 | 12/25/2034 | 1,958,526 |
| 4,768,952 | Residential Asset Securities Corporation(c,d) | 4.147 | 11/25/2005 | 4,769,138 |
| 1,000,000 | Residential Asset Securities Corporation(b) | 3.250 | 5/25/2029 | 994,309 |
| 2,000,000 | Residential Asset Securities Corporation(b) | 4.040 | 7/25/2030 | 1,970,826 |
| 4,618,355 | SLM Student Loan Trust(b,c) | 4.210 | 1/25/2006 | 4,614,235 |
| 4,668,110 | Specialty Underwriting and Residential Finance Trust(c) | 4.157 | 11/25/2005 | 4,667,932 |
| 3,051,154 | Structured Asset Investment Loan Trust(b,c) | 4.117 | 11/25/2005 | 3,051,225 |
| 5,000,000 | Textron Financial Floorplan Master Note Trust(b,c) | 4.061 | 11/13/2005 | 5,000,000 |
| 4,887,235 | Wachovia Mortgage Loan Trust, LLC(c) | 4.147 | 11/25/2005 | 4,887,049 |
|
|
| | Total Asset-Backed Securities | | 146,544,562 |
|
|
| |
| Basic Materials (0.8%) | | | |
| 1,250,000 | Dow Chemical Company(d) | 6.125 | 2/1/2011 | 1,304,098 |
| 750,000 | Glencore Funding, LLC(b) | 6.000 | 4/15/2014 | 690,848 |
| 1,500,000 | Packaging Corporation of America | 4.375 | 8/1/2008 | 1,452,634 |
| 2,000,000 | Precision Castparts Corporation(b) | 5.600 | 12/15/2013 | 2,003,738 |
|
|
| | Total Basic Materials | | | 5,451,318 |
|
|
The accompanying notes to the financial statements are an integral part of this schedule.
195
| Core Bond Fund | | | |
| Schedule of Investments as of October 31, 2005(a) | | | |
| |
| Principal | | Interest | Maturity | |
| Amount | Long-Term Fixed Income (87.8%) | Rate | Date | Value |
|
| Capital Goods (1.4%) | | | |
| $2,000,000 | Boeing Capital Corporation(e) | 6.500% | 2/15/2012 | $2,150,810 |
| 2,750,000 | Oakmont Asset Trust(b) | 4.514 | 12/22/2008 | 2,682,273 |
| 1,750,000 | Textron Financial Corporation | 4.600 | 5/3/2010 | 1,716,223 |
| 2,500,000 | Tyco International Group SA(b) | 6.375 | 10/15/2011 | 2,626,668 |
|
|
| | Total Capital Goods | | | 9,175,974 |
|
|
| |
| Commercial Mortgage-Backed Securities (14.5%) | | | |
| 4,000,000 | Banc of America Commercial Mortgage, Inc. | 4.894 | 9/10/2010 | 3,969,888 |
| 5,000,000 | Banc of America Commercial Mortgage, Inc.(d) | 6.085 | 6/11/2035 | 5,171,180 |
| 2,750,000 | Banc of America Commercial Mortgage, Inc.(b) | 4.037 | 11/10/2039 | 2,635,504 |
| 2,750,000 | Banc of America Commercial Mortgage, Inc.(b) | 4.561 | 11/10/2041 | 2,658,733 |
| 3,000,000 | Banc of America Commercial Mortgage, Inc.(b) | 5.118 | 7/11/2043 | 2,988,987 |
| 4,918,629 | Banc of America Mortgage Securities, Inc.(b,d) | 4.830 | 9/25/2035 | 4,848,007 |
| 3,000,000 | Bear Stearns Commercial Mortgage Securities, Inc.(b) | 3.869 | 2/11/2041 | 2,874,189 |
| 184,847 | CAM Commercial Mortgage Corporation(d) | 4.834 | 11/14/2036 | 185,020 |
| 4,832,658 | Commercial Mortgage Pass-Through Certificates(c) | 4.070 | 11/15/2005 | 4,831,865 |
| 4,845,658 | Credit Suisse First Boston Mortgage | | | |
| | Securities Corporation(b,c) | 4.120 | 11/15/2005 | 4,845,643 |
| 4,100,000 | First Union National Bank Commercial Mortgage | 7.390 | 12/15/2031 | 4,415,839 |
| 8,000,000 | LB-UBS Commercial Mortgage Trust(b) | 3.086 | 5/15/2027 | 7,663,136 |
| 3,250,000 | LB-UBS Commercial Mortgage Trust | 6.653 | 11/15/2027 | 3,469,963 |
| 5,500,000 | LB-UBS Commercial Mortgage Trust(b) | 4.187 | 8/15/2029 | 5,337,288 |
| 4,580,496 | Merrill Lynch Mortgage Investors, Inc. | 4.906 | 6/25/2035 | 4,530,582 |
| 5,604,008 | Morgan Stanley Capital I, Inc.(b) | 6.210 | 11/15/2031 | 5,757,681 |
| 5,000,000 | National Collegiate Student Loan Trust(c) | 4.107 | 12/25/2005 | 4,999,900 |
| 4,987,288 | Wachovia Bank Commercial Mortgage Trust(c,d) | 4.070 | 11/15/2005 | 4,985,786 |
| 4,500,000 | Wachovia Bank Commercial Mortgage Trust(c) | 4.170 | 11/15/2005 | 4,500,000 |
| 3,000,000 | Wachovia Bank Commercial Mortgage Trust | 4.390 | 2/15/2036 | 2,874,126 |
| 4,500,000 | Wachovia Bank Commercial Mortgage Trust | 4.516 | 5/15/2044 | 4,376,920 |
| 4,881,597 | Washington Mutual Mortgage Pass-Through Certificates(c) | 4.357 | 11/25/2005 | 4,877,692 |
| 4,771,643 | Washington Mutual Mortgage Pass-Through Certificates | 4.850 | 9/25/2035 | 4,732,449 |
|
|
| | Total Commercial Mortgage-Backed Securities | 97,530,378 |
|
|
| |
| Communications Services (2.6%) | | | |
| 1,750,000 | AT&T Broadband Corporation(b,d) | 8.375 | 3/15/2013 | 2,015,837 |
| 2,150,000 | AT&T Wireless Services, Inc.(b,d) | 8.125 | 5/1/2012 | 2,472,562 |
| 2,000,000 | British Sky Broadcasting Finance UK plc | 5.625 | 10/15/2015 | 1,969,450 |
| 2,000,000 | British Telecom plc(b,d) | 8.175 | 12/15/2010 | 2,280,260 |
| 2,000,000 | Interpublic Group of Companies, Inc. | 6.250 | 11/15/2014 | 1,767,500 |
| 2,000,000 | Nextel Communications, Inc. | 5.950 | 3/15/2014 | 2,006,232 |
| 1,000,000 | Sprint Capital Corporation(b) | 6.900 | 5/1/2019 | 1,085,441 |
| 1,500,000 | Telecom Italia Capital SA | 4.000 | 1/15/2010 | 1,425,873 |
| 1,500,000 | Telecom Italia Capital SA | 5.250 | 10/1/2015 | 1,443,962 |
| 1,000,000 | Verizon Global Funding Corporation | 7.750 | 12/1/2030 | 1,159,758 |
|
|
| | Total Communications Services | | 17,626,875 |
|
|
| |
| |
| The accompanying notes to the financial statements are an integral part of this schedule. | |
|
| |
| 196 | | | |
| Core Bond Fund | | | |
| Schedule of Investments as of October 31, 2005(a) | | | |
| |
| Principal | | Interest | Maturity | |
| Amount | Long-Term Fixed Income (87.8%) | Rate | Date | Value |
|
| Consumer Cyclical (2.4%) | | | |
| $1,500,000 | Caesars Entertainment, Inc. | 8.500% | 11/15/2006 | $1,548,876 |
| 2,500,000 | Centex Corporation(b) | 5.450 | 8/15/2012 | 2,433,048 |
| 1,750,000 | D.R. Horton, Inc. | 5.000 | 1/15/2009 | 1,714,627 |
| 2,000,000 | D.R. Horton, Inc. | 4.875 | 1/15/2010 | 1,921,170 |
| 2,000,000 | DaimlerChrysler North American Holdings Corporation | 4.875 | 6/15/2010 | 1,939,224 |
| 2,500,000 | Ford Motor Credit Company | 6.625 | 6/16/2008 | 2,397,385 |
| 1,200,000 | General Motors Acceptance Corporation | 6.875 | 9/15/2011 | 1,163,543 |
| 1,000,000 | Ryland Group, Inc.(b) | 8.000 | 8/15/2006 | 1,022,329 |
| 2,000,000 | Yum! Brands, Inc.(b) | 8.500 | 4/15/2006 | 2,033,210 |
|
|
| | Total Consumer Cyclical | | | 16,173,412 |
|
|
| |
| Consumer Non-Cyclical (1.7%) | | | |
| 2,400,000 | Bunge Limited Finance Corporation(b,d) | 7.800 | 10/15/2012 | 2,733,245 |
| 2,000,000 | Kraft Foods, Inc. | 4.125 | 11/12/2009 | 1,931,936 |
| 1,125,000 | Quest Diagnostic, Inc. | 5.450 | 11/1/2015 | 1,121,569 |
| 1,786,000 | Safeway, Inc. | 4.800 | 7/16/2007 | 1,776,273 |
| 1,700,000 | Tyson Foods, Inc. | 8.250 | 10/1/2011 | 1,916,803 |
| 2,000,000 | Wyeth | 6.950 | 3/15/2011 | 2,155,632 |
|
|
| | Total Consumer Non-Cyclical | | 11,635,458 |
|
|
| |
| Energy (0.8%) | | | |
| 750,000 | Boardwalk Pipelines, LLC(e) | 5.500 | 2/1/2017 | 733,950 |
| 2,750,000 | Enterprise Products Operating, LP(d) | 4.625 | 10/15/2009 | 2,667,420 |
| 2,000,000 | Ras Laffan Liquefied Natural Gas Company, Ltd. II | 5.298 | 9/30/2020 | 1,955,120 |
|
|
| | Total Energy | | | 5,356,490 |
|
|
| |
| Financials (8.2%) | | | |
| 2,500,000 | American International Group, Inc.(d) | 5.050 | 10/1/2015 | 2,443,700 |
| 3,000,000 | ANZ Capital Trust I(b) | 4.484 | 1/15/2010 | 2,905,878 |
| 1,250,000 | Barnett Capital I | 8.060 | 12/1/2026 | 1,332,716 |
| 2,500,000 | BNP Paribas SA | 5.186 | 6/29/2015 | 2,403,775 |
| 1,250,000 | Corestates Capital Trust I(b) | 8.000 | 12/15/2026 | 1,330,712 |
| 2,000,000 | Countrywide Home Loans, Inc.(b) | 4.000 | 3/22/2011 | 1,876,844 |
| 1,725,000 | CTI Group, Inc.(f) | 5.200 | 11/3/2010 | 1,722,714 |
| 2,500,000 | Goldman Sachs Group, Inc.(d) | 5.125 | 1/15/2015 | 2,438,322 |
| 1,400,000 | Health Care Property Investors, Inc. | 4.875 | 9/15/2010 | 1,365,272 |
| 2,000,000 | HSBC Capital Funding, LP/Jersey Channel Islands | 9.547 | 6/30/2010 | 2,344,786 |
| 2,000,000 | International Lease Finance Corporation | 4.875 | 9/1/2010 | 1,968,002 |
| 2,000,000 | J.P. Morgan Chase & Company | 4.891 | 9/1/2015 | 1,974,022 |
| 1,500,000 | J.P. Morgan Chase & Company | 5.150 | 10/1/2015 | 1,461,444 |
| 2,000,000 | KeyCorp(b) | 4.700 | 5/21/2009 | 1,981,792 |
| 2,500,000 | Lehman Brothers Holdings, Inc.(e) | 4.500 | 7/26/2010 | 2,438,920 |
| 2,000,000 | Merrill Lynch & Company, Inc. | 4.831 | 10/27/2008 | 1,991,858 |
| 1,250,000 | Metropolitan Life Global Funding(b) | 4.500 | 5/5/2010 | 1,224,781 |
| 3,000,000 | Montpelier Re Holdings, Ltd. | 6.125 | 8/15/2013 | 2,940,426 |
| 1,500,000 | Monumental Global Funding II | 4.625 | 3/15/2010 | 1,484,268 |
| |
| The accompanying notes to the financial statements are an integral part of this schedule. | |
|
197
| Core Bond Fund | | | |
| Schedule of Investments as of October 31, 2005(a) | | | |
| |
| Principal | | Interest | Maturity | |
| Amount | Long-Term Fixed Income (87.8%) | Rate | Date | Value |
|
| Financials -- continued | | | |
| $1,250,000 | Nuveen Investment, Inc.(b) | 5.000% | 9/15/2010 | $1,224,579 |
| 2,000,000 | ProLogis(f) | 5.250 | 11/15/2010 | 1,992,118 |
| 2,500,000 | Residential Capital Corporation | 6.375 | 6/30/2010 | 2,539,360 |
| 1,300,000 | Sanwa Bank, Ltd.(e) | 7.400 | 6/15/2011 | 1,423,873 |
| 1,750,000 | Simon Property Group, LP(b) | 4.600 | 6/15/2010 | 1,709,034 |
| 2,500,000 | Sovereign Bancorp, Inc. | 4.800 | 9/1/2010 | 2,455,838 |
| 2,500,000 | Wachovia Bank NA(b) | 4.875 | 2/1/2015 | 2,422,485 |
| 2,500,000 | Washington Mutual Bank FA | 5.125 | 1/15/2015 | 2,424,040 |
| 1,200,000 | Westfield Capital | 4.375 | 11/15/2010 | 1,158,326 |
|
|
| | Total Financials | | | 54,979,885 |
|
|
| |
| Foreign (0.3%) | | | |
| 1,800,000 | Republic of Italy | 5.375 | 6/15/2033 | 1,779,457 |
|
|
| | Total Foreign | | | 1,779,457 |
|
|
| |
| Mortgage-Backed Securities (20.3%) | | | |
| 33,000,000 | Federal National Mortgage Association Conventional | | | |
| | 15-Yr. Pass Through(f) | 5.500 | 11/1/2020 | 33,216,546 |
| 58,000,000 | Federal National Mortgage Association Conventional | | | |
| | 30-Yr. Pass Through(f) | 5.500 | 11/1/2035 | 57,202,503 |
| 45,500,000 | Federal National Mortgage Association Conventional | | | |
| | 30-Yr. Pass Through(f) | 6.000 | 11/1/2035 | 45,883,929 |
|
|
| | Total Mortgage-Backed Securities | | 136,302,978 |
|
|
| |
| Technology (0.4%) | | | |
| 2,500,000 | Deluxe Corporation(b) | 3.500 | 10/1/2007 | 2,403,965 |
|
|
| | Total Technology | | | 2,403,965 |
|
|
| |
| U.S. Government (10.4%) | | | |
| 500,000 | Federal Home Loan Bank | 4.250 | 4/16/2007 | 497,418 |
| 5,000,000 | Federal Home Loan Bank | 4.250 | 10/14/2008 | 4,973,950 |
| 5,000,000 | Federal National Mortgage Association | 4.375 | 9/7/2007 | 4,966,590 |
| 5,000,000 | Federal National Mortgage Association(b) | 5.500 | 3/15/2011 | 5,153,290 |
| 9,250,000 | U.S. Treasury Bonds(e) | 7.625 | 2/15/2025 | 12,460,398 |
| 1,875,000 | U.S. Treasury Bonds(e) | 6.125 | 8/15/2029 | 2,222,460 |
| 4,375,000 | U.S. Treasury Notes(e) | 5.000 | 2/15/2011 | 4,483,351 |
| 15,230,000 | U.S. Treasury Notes(e) | 4.000 | 2/15/2015 | 14,563,094 |
| 16,000,000 | U.S. Treasury Notes(e) | 4.125 | 5/15/2015 | 15,440,000 |
| 5,047,750 | U.S. Treasury Notes(e) | 1.875 | 7/15/2015 | 4,996,485 |
|
|
| | Total U.S. Government | | | 69,757,036 |
|
|
| |
| The accompanying notes to the financial statements are an integral part of this schedule. |
| |
|
| |
198
| Core Bond Fund | | | |
| Schedule of Investments as of October 31, 2005(a) | | | |
| |
| Principal | | Interest | Maturity | |
| Amount | Long-Term Fixed Income (87.8%) | Rate | Date | Value |
|
| Utilities (2.1%) | | | |
| $1,250,000 | Carolina Power & Light, Inc.(b) | 5.150% | 4/1/2015 | $1,227,206 |
| 2,500,000 | Duke Capital, LLC(b) | 5.668 | 8/15/2014 | 2,489,270 |
| 1,500,000 | Exelon Corporation(d) | 6.750 | 5/1/2011 | 1,585,766 |
| 1,000,000 | Exelon Corporation(b) | 5.625 | 6/15/2035 | 906,752 |
| 2,900,000 | FirstEnergy Corporation(b) | 6.450 | 11/15/2011 | 3,050,533 |
| 802,617 | Power Contract Financing, LLC | 5.200 | 2/1/2006 | 803,556 |
| 1,301,130 | Power Receivables Finance, LLC | 6.290 | 1/1/2012 | 1,321,805 |
| 2,500,000 | Texas-New Mexico Power Company | 6.125 | 6/1/2008 | 2,530,420 |
|
|
| | Total Utilities | | | 13,915,308 |
|
|
| | Total Long-Term Fixed Income (cost $596,419,576) | 588,633,096 |
|
|
| |
| |
| Shares | Preferred Stock (0.2%) | | | Value |
|
| 15 | Federal National Mortgage Association, Convertible | | | $1,367,177 |
|
|
| | Total Preferred Stock (cost $1,370,625) | | 1,367,177 |
|
|
| |
| |
| | | Interest | Maturity | |
| Shares | Collateral Held for Securities Loaned (7.3%) | Rate(g) | Date | Value |
|
| 48,712,809 | Thrivent Financial Securities Lending Trust | 3.950% | N/A | $48,712,809 |
|
|
| | Total Collateral Held for Securities Loaned | |
| | (cost $48,712,809) | | | 48,712,809 |
|
|
| |
| |
| Shares or | | | | |
| Principal | | Interest | Maturity | |
| Amount | Short-Term Investments (4.7%) | Rate(g) | Date | Value |
|
| $7,700,000 | BP Capital Markets plc | 4.020% | 11/1/2005 | $7,700,000 |
| 24,144,850 | Thrivent Money Market Fund | 3.600 | N/A | 24,144,850 |
|
|
| | Total Short-Term Investments (at amortized cost) | 31,844,850 |
|
|
| | Total Investments (cost $678,347,860) | | $670,557,932 |
|
|
| (a) | The categories of investments are shown as a percentage of total investments. |
| |
| (b) | Designated as cover for long settling trades as discussed in the notes to the financial statements. |
| |
| (c) | Denotes variable rate obligations for which the current yield and next scheduled reset date are shown. |
| |
| (d) | At October 31, 2005, all or a portion of the denoted securities, valued at $28,104,663, were pledged as the initial margin deposit or ear- marked as collateral to cover open financial futures contracts as follows: |
| |
| | | | | | Notional | |
| | Number of | Expiration | | | Principal | Unrealized |
| Type | Contracts | Date | Position | Value | Amount | Gain/(Loss) |
|
| U.S. Treasury Bond Futures 5 yr. | 160 | December 2005 | Long | $16,942,501 | $17,257,791 | $(315,290) |
| U.S. Treasury Bond Futures 10 yr. | 10 | December 2005 | Short | (1,084,531) | $(1,122,631) | 38,100 |
| U.S. Treasury Bond Futures 20 yr. | 73 | December 2005 | Long | 8,173,719 | $8,252,032 | (78,313) |
| (e) | All or a portion of the security is on loan as discussed in item 2(L) of the Notes to Financial Statements. |
| |
| (f) | Denotes investments purchased on a when-issued basis. |
| |
| (g) | The interest rate shown reflects the yield, coupon rate or, for securities purchased at a discount, the discount rate at the date of purchase. |
| |
|
| The accompanying notes to the financial statements are an integral part of this schedule. |
|
|
|
199
| | Limited Maturity Bond Fund | | |
| | Schedule of Investments as of October 31, 2005(a) | | |
| Principal | | Interest | Maturity | |
| Amount | Long-Term Fixed Income (92.1%) | Rate | Date | Value |
|
| Asset-Backed Securities (25.7%) | | | |
| $1,000,000 | American Express Credit Account Master Trust(b) | 4.090% | 11/15/2005 | $1,000,860 |
| 1,500,000 | Americredit Automobile Receivables Trust(b,c) | 3.970 | 11/6/2005 | 1,500,332 |
| 1,000,000 | Americredit Automobile Receivables Trust | 3.430 | 7/6/2011 | 966,967 |
| 1,500,000 | ARG Funding Corporation(c) | 4.290 | 4/20/2010 | 1,458,399 |
| 1,500,000 | Banc of America Securities Auto Trust | 3.890 | 6/18/2008 | 1,492,462 |
| 1,000,000 | Capital Auto Receivables Asset Trust(d) | 3.350 | 2/15/2008 | 984,743 |
| 1,500,000 | Caterpillar Financial Asset Trust(d) | 3.900 | 2/25/2009 | 1,480,894 |
| 829,808 | Chase Funding Mortgage Loan Asset-Backed Certificates(d) | 2.734 | 9/25/2024 | 823,780 |
| 1,500,000 | CIT Equipment Collateral | 4.420 | 5/20/2009 | 1,488,890 |
| 1,500,000 | Countrywide Asset-Backed Certificates(c) | 3.683 | 8/25/2024 | 1,476,706 |
| 2,000,000 | Countrywide Asset-Backed Certificates(c) | 3.903 | 1/25/2031 | 1,988,800 |
| 433,359 | CPL Transition Funding, LLC | 5.010 | 1/15/2010 | 433,572 |
| 1,953,211 | CPS Auto Trust | 4.520 | 3/15/2010 | 1,943,445 |
| 1,000,000 | Credit Based Asset Servicing and Securitization | 3.887 | 10/25/2034 | 986,948 |
| 1,500,000 | DaimlerChrysler Master Owner Trust(b,d) | 4.020 | 11/15/2005 | 1,499,166 |
| 918,657 | Encore Credit Receivables Trust(b) | 4.180 | 11/25/2005 | 918,704 |
| 750,000 | First National Master Note Trust(b) | 4.070 | 11/15/2005 | 750,293 |
| 500,000 | Ford Credit Floorplan Master Owner Trust(b) | 4.110 | 11/15/2005 | 500,500 |
| 1,000,000 | Fremont Home Loan Trust(b) | 4.197 | 11/25/2005 | 999,962 |
| 1,500,000 | GE Dealer Floorplan Master Note Trust(b) | 4.040 | 11/20/2005 | 1,500,466 |
| 1,500,000 | GE Equipment Small Ticket, LLC | 4.380 | 7/22/2009 | 1,488,009 |
| 1,500,000 | GMAC Mortgage Corporation Loan Trust(b,d) | 4.127 | 11/25/2005 | 1,497,864 |
| 1,000,000 | GMAC Mortgage Corporation Loan Trust(b) | 4.167 | 11/25/2005 | 1,000,887 |
| 1,000,000 | Harley Davidson Motorcycle Trust | 3.200 | 5/15/2012 | 971,903 |
| 1,000,000 | Honda Auto Receivables Owner Trust(c) | 2.910 | 10/20/2008 | 978,585 |
| 1,000,000 | Honda Auto Receivables Owner Trust(c) | 2.790 | 3/16/2009 | 976,472 |
| 1,000,000 | Honda Auto Receivables Owner Trust(c) | 2.960 | 4/20/2009 | 973,594 |
| 1,500,000 | Hyundai Auto Receivables Trust | 3.880 | 6/16/2008 | 1,491,682 |
| 1,000,000 | John Deere Owner Trust | 3.980 | 6/15/2009 | 987,044 |
| 720,596 | Long Beach Mortgage Loan Trust(b,d) | 4.147 | 11/25/2005 | 720,667 |
| 500,000 | MBNA Credit Card Master Note Trust(b,c) | 4.080 | 11/15/2005 | 500,707 |
| 750,000 | MBNA Credit Card Master Note Trust | 4.950 | 6/15/2009 | 753,014 |
| 1,500,000 | Navistar Financial Corporation | 4.010 | 7/15/2008 | 1,494,434 |
| 1,500,000 | Nissan Auto Lease Trust(c) | 3.180 | 6/15/2010 | 1,466,073 |
| 1,250,000 | PG&E Energy Recovery Funding, LLC | 3.870 | 6/25/2011 | 1,228,691 |
| 500,000 | Popular ABS Mortgage Pass-Through Trust | 4.000 | 12/25/2034 | 489,632 |
| 1,500,000 | Renaissance Home Equity Loan Trust(c) | 3.856 | 1/25/2035 | 1,478,520 |
| 1,000,000 | Residential Asset Securities Corporation(c) | 3.250 | 5/25/2029 | 994,309 |
| 1,000,000 | Residential Asset Securities Corporation | 5.010 | 4/25/2033 | 986,962 |
| 1,385,506 | SLM Student Loan Trust(b,c) | 4.210 | 1/25/2006 | 1,384,271 |
| 869,774 | SLM Student Loan Trust(b) | 4.210 | 1/25/2006 | 869,764 |
| 915,346 | Structured Asset Investment Loan Trust(b,c) | 4.117 | 11/25/2005 | 915,367 |
| 1,500,000 | Textron Financial Floorplan Master Note Trust(b,c) | 4.061 | 11/13/2005 | 1,500,000 |
| 1,500,000 | World Omni Auto Receivables Trust | 4.300 | 3/20/2008 | 1,495,455 |
|
|
| | Total Asset-Backed Securities | | 50,839,795 |
|
|
| |
| |
| The accompanying notes to the financial statements are an integral part of this schedule. | |
|
200
| Limited Maturity Bond Fund | | | |
| Schedule of Investments as of October 31, 2005(a) | | | |
| |
| Principal | | Interest | Maturity | |
| Amount | Long-Term Fixed Income (92.1%) | Rate | Date | Value |
|
| Basic Materials (1.1%) | | | |
| $500,000 | ICI North America | 8.875% | 11/15/2006 | $518,614 |
| 400,000 | Lubrizol Corporation | 4.625 | 10/1/2009 | 389,869 |
| 500,000 | Monsanto Company(e) | 4.000 | 5/15/2008 | 488,749 |
| 750,000 | Weyerhaeuser Company(e) | 5.250 | 12/15/2009 | 747,934 |
|
|
| | Total Basic Materials | | | 2,145,166 |
|
|
| |
| Capital Goods (1.4%) | | | |
| 500,000 | Goodrich Corporation | 6.600 | 5/15/2009 | 523,138 |
| 500,000 | John Deere Capital Corporation | 4.400 | 7/15/2009 | 491,676 |
| 750,000 | Oakmont Asset Trust | 4.514 | 12/22/2008 | 731,529 |
| 500,000 | Raytheon Company(d) | 6.750 | 8/15/2007 | 514,488 |
| 500,000 | Tyco International Group SA Participation | | | |
| | Certificate Trust | 4.436 | 6/15/2007 | 496,180 |
|
|
| | Total Capital Goods | | | 2,757,011 |
|
|
| |
| Commercial Mortgage-Backed Securities (14.2%) | | | |
| 600,000 | Banc of America Commercial Mortgage, Inc. | 4.894 | 9/10/2010 | 595,483 |
| 750,000 | Banc of America Commercial Mortgage, Inc. | 4.037 | 11/10/2039 | 718,774 |
| 150,085 | Banc of America Commercial Mortgage, Inc. | 3.366 | 7/11/2043 | 148,050 |
| 1,475,589 | Banc of America Mortgage Securities, Inc.(d) | 4.830 | 9/25/2035 | 1,454,402 |
| 1,986,648 | Bear Stearns Adjustable Rate Mortgage Trust | 4.625 | 10/25/2035 | 1,948,157 |
| 700,000 | Bear Stearns Commercial Mortgage Securities, Inc. | 3.869 | 2/11/2041 | 670,644 |
| 1,422,285 | Citigroup Mortgage Loan Trust, Inc. | 4.922 | 8/25/2035 | 1,415,164 |
| 1,449,797 | Commercial Mortgage Pass-Through Certificates(b) | 4.070 | 11/15/2005 | 1,449,560 |
| 1,453,697 | Credit Suisse First Boston Mortgage | | | |
| | Securities Corporation(b) | 4.120 | 11/15/2005 | 1,453,693 |
| 1,476,957 | General Electric Commercial Mortgage Corporation(d) | 4.792 | 7/10/2045 | 1,461,468 |
| 1,361,637 | Impac CMB Trust(b) | 4.317 | 11/25/2005 | 1,362,257 |
| 1,262,169 | J.P. Morgan Chase Commercial Mortgage | | | |
| | Securities Corporation | 2.790 | 1/12/2039 | 1,204,651 |
| 250,000 | LB-UBS Commercial Mortgage Trust(c) | 3.323 | 3/15/2027 | 241,514 |
| 750,000 | LB-UBS Commercial Mortgage Trust | 4.187 | 8/15/2029 | 727,812 |
| 1,471,779 | LB-UBS Commercial Mortgage Trust | 4.747 | 9/15/2040 | 1,465,316 |
| 565,224 | Lehman Brothers “CALSTRS” Mortgage Trust | 3.988 | 11/20/2012 | 555,484 |
| 1,374,149 | Merrill Lynch Mortgage Investors, Inc. | 4.906 | 6/25/2035 | 1,359,175 |
| 1,989,240 | Residential Accredit Loans, Inc. | 5.640 | 9/25/2035 | 1,996,622 |
| 1,496,186 | Wachovia Bank Commercial Mortgage Trust(b) | 4.070 | 11/15/2005 | 1,495,736 |
| 1,500,000 | Wachovia Bank Commercial Mortgage Trust(b) | 4.170 | 11/15/2005 | 1,500,000 |
| 2,000,000 | Washington Mutual Mortgage Pass-Through Certificates(b) | 4.327 | 11/25/2005 | 2,001,094 |
| 1,464,479 | Washington Mutual Mortgage Pass-Through Certificates(b) | 4.357 | 11/25/2005 | 1,463,307 |
| 1,431,493 | Washington Mutual Mortgage Pass-Through Certificates | 4.850 | 9/25/2035 | 1,419,735 |
|
|
| | Total Commercial Mortgage-Backed Securities | 28,108,098 |
|
|
| |
| |
| |
The accompanying notes to the financial statements are an integral part of this schedule. |
|
201
| Limited Maturity Bond Fund | | | |
| Schedule of Investments as of October 31, 2005(a) | | | |
| |
| Principal | | Interest | Maturity | |
| Amount | Long-Term Fixed Income (92.1%) | Rate | Date | Value |
|
| Communications Services (3.1%) | | | |
| $600,000 | ALLTEL Corporation | 4.656% | 5/17/2007 | $597,079 |
| 900,000 | British Sky Broadcasting Group plc | 6.875 | 2/23/2009 | 945,236 |
| 600,000 | CenturyTel, Inc. | 4.628 | 5/15/2007 | 594,959 |
| 900,000 | Cingular Wireless, LLC(d) | 5.625 | 12/15/2006 | 908,063 |
| 1,000,000 | Comcast Cable Communications, Inc. | 6.200 | 11/15/2008 | 1,029,428 |
| 500,000 | Qwest Corporation | 5.625 | 11/15/2008 | 495,000 |
| 500,000 | Sprint Capital Corporation | 6.125 | 11/15/2008 | 514,945 |
| 500,000 | Telecom Italia Capital SA | 4.000 | 11/15/2008 | 483,775 |
| 500,000 | Telefonos de Mexico SA de CV | 4.500 | 11/19/2008 | 489,178 |
|
|
| | Total Communications Services | | 6,057,663 |
|
|
| |
| Consumer Cyclical (2.9%) | | | |
| 750,000 | Carnival Corporation(e) | 3.750 | 11/15/2007 | 733,455 |
| 1,000,000 | DaimlerChrysler North American Holdings Corporation(b) | 4.223 | 2/1/2006 | 999,442 |
| 750,000 | Ford Motor Credit Company | 6.625 | 6/16/2008 | 719,216 |
| 500,000 | Gap, Inc.(f) | 10.550 | 12/15/2008 | 557,874 |
| 1,000,000 | General Motors Acceptance Corporation(e) | 4.500 | 7/15/2006 | 988,401 |
| 250,000 | Starwood Hotels & Resorts Worldwide, Inc.(f) | 7.875 | 5/1/2007 | 255,938 |
| 500,000 | Viacom, Inc.(e) | 5.625 | 5/1/2007 | 504,370 |
| 1,000,000 | Yum! Brands, Inc. | 8.500 | 4/15/2006 | 1,016,605 |
|
|
| | Total Consumer Cyclical | | 5,775,301 |
|
|
| |
| Consumer Non-Cyclical (3.4%) | | | |
| 600,000 | Beckman Coulter, Inc. | 7.450 | 3/4/2008 | 631,157 |
| 400,000 | Bunge Limited Finance Corporation | 7.800 | 10/15/2012 | 455,541 |
| 500,000 | Cadbury Schweppes plc | 3.875 | 10/1/2008 | 484,920 |
| 250,000 | Gillette Company | 3.500 | 10/15/2007 | 244,292 |
| 750,000 | Harvard University | 8.125 | 4/15/2007 | 786,862 |
| 700,000 | HCA, Inc. | 5.250 | 11/6/2008 | 686,510 |
| 825,000 | Kroger Company | 6.375 | 3/1/2008 | 844,832 |
| 775,000 | Miller Brewing Company | 4.250 | 8/15/2008 | 759,524 |
| 400,000 | Safeway, Inc. | 6.500 | 11/15/2008 | 413,890 |
| 750,000 | Tyson Foods, Inc. | 7.250 | 10/1/2006 | 765,403 |
| 700,000 | Wyeth | 4.375 | 3/1/2008 | 692,117 |
|
|
| | Total Consumer Non-Cyclical | | 6,765,048 |
|
|
| |
| Energy (1.7%) | | | |
| 500,000 | Enterprise Products Operating, LP | 4.000 | 10/15/2007 | 488,964 |
| 500,000 | Enterprise Products Operating, LP | 4.625 | 10/15/2009 | 484,986 |
| 1,000,000 | KeySpan Corporation | 4.900 | 5/16/2008 | 998,593 |
| 750,000 | Marathon Oil Corporation | 5.375 | 6/1/2007 | 755,506 |
| 600,000 | Plains All American Pipeline, LP/PAA Finance Corporation | 4.750 | 8/15/2009 | 586,568 |
|
|
| | Total Energy | | | 3,314,617 |
|
|
| |
The accompanying notes to the financial statements are an integral part of this schedule. |
|
202
| Limited Maturity Bond Fund | | | |
| Schedule of Investments as of October 31, 2005(a) | | | |
| |
| Principal | | Interest | Maturity | |
| Amount | Long-Term Fixed Income (92.1%) | Rate | Date | Value |
|
| Financials (12.7%) | | | |
| $750,000 | Abbey National plc(f) | 7.570% | 6/15/2008 | $778,463 |
| 1,000,000 | American General Finance Corporation(b,c) | 4.279 | 1/18/2006 | 1,000,299 |
| 300,000 | Barnett Capital I | 8.060 | 12/1/2026 | 319,852 |
| 500,000 | Capital One Bank | 4.875 | 5/15/2008 | 496,952 |
| 250,000 | Capital One Financial Corporation | 4.738 | 5/17/2007 | 249,079 |
| 500,000 | Chubb Corporation | 4.934 | 11/16/2007 | 499,880 |
| 300,000 | Corestates Capital Trust I | 8.000 | 12/15/2026 | 319,371 |
| 500,000 | Countrywide Home Loans, Inc. | 4.125 | 9/15/2009 | 480,308 |
| 500,000 | EOP Operating, LP | 6.800 | 1/15/2009 | 523,689 |
| 500,000 | First Chicago Corporation | 6.375 | 1/30/2009 | 524,562 |
| 1,000,000 | Goldman Sachs Group, Inc.(e) | 3.875 | 1/15/2009 | 967,239 |
| 600,000 | International Lease Finance Corporation | 3.300 | 1/23/2008 | 580,292 |
| 750,000 | iSTAR Financial, Inc.(e) | 4.875 | 1/15/2009 | 736,981 |
| 600,000 | John Hancock Global Funding II | 3.750 | 9/30/2008 | 580,570 |
| 500,000 | KeyCorp | 4.700 | 5/21/2009 | 495,448 |
| 1,500,000 | Lehman Brothers Holdings E-Capital Trust I(b) | 4.590 | 11/21/2005 | 1,503,423 |
| 1,000,000 | Lehman Brothers Holdings, Inc. | 3.500 | 8/7/2008 | 964,252 |
| 800,000 | Marsh & McLennan Companies, Inc.(e) | 5.375 | 3/15/2007 | 801,914 |
| 1,000,000 | MBNA Europe Funding plc(b) | 3.861 | 12/7/2005 | 999,801 |
| 1,000,000 | Merrill Lynch & Company, Inc.(b,c) | 4.511 | 1/23/2006 | 1,005,025 |
| 500,000 | Merrill Lynch & Company, Inc. | 4.831 | 10/27/2008 | 497,964 |
| 500,000 | Monumental Global Funding II | 3.850 | 3/3/2008 | 488,838 |
| 700,000 | Pacific Life Global Funding | 3.750 | 1/15/2009 | 680,426 |
| 1,000,000 | Premium Asset Trust(b) | 4.300 | 1/17/2006 | 1,000,156 |
| 600,000 | Pricoa Global Funding I | 4.350 | 6/15/2008 | 591,121 |
| 1,000,000 | Protective Life Secured Trust(c) | 4.000 | 10/7/2009 | 969,179 |
| 600,000 | Residential Capital Corporation(b) | 5.385 | 12/29/2005 | 605,742 |
| 500,000 | Saint Paul Companies, Inc. | 5.750 | 3/15/2007 | 504,781 |
| 900,000 | Simon Property Group, LP | 6.375 | 11/15/2007 | 922,395 |
| 750,000 | SLM Corporation(c,e) | 4.000 | 1/15/2009 | 727,865 |
| 750,000 | Union Planters Bank | 5.125 | 6/15/2007 | 751,489 |
| 500,000 | Washington Mutual, Inc. | 4.000 | 1/15/2009 | 483,382 |
| 1,000,000 | Wells Fargo & Company(b,c) | 3.970 | 12/15/2005 | 1,001,458 |
| 1,000,000 | Westpac Banking Corporation(b,c) | 3.896 | 11/25/2005 | 1,001,150 |
| 1,000,000 | World Savings Bank FSB(b) | 3.930 | 12/1/2005 | 1,000,785 |
|
|
| | Total Financials | | | 25,054,131 |
|
|
| |
| Foreign (0.2%) | | | |
| 250,000 | Nordic Investment Bank | 2.750 | 1/11/2006 | 249,301 |
| 125,000 | Pemex Finance, Ltd. | 8.450 | 2/15/2007 | 127,073 |
|
|
| | Total Foreign | | | 376,374 |
|
|
| |
| |
The accompanying notes to the financial statements are an integral part of this schedule. |
|
203
| Limited Maturity Bond Fund | | | |
| Schedule of Investments as of October 31, 2005(a) | | | |
| |
| Principal | | Interest | Maturity | |
| Amount | Long-Term Fixed Income (92.1%) | Rate | Date | Value |
|
| Mortgage-Backed Securities (8.9%) | | | |
| $8,500,000 | Federal National Mortgage Association Conventional | | | |
| | 15-Yr. Pass Through(g) | 5.500% | 11/1/2020 | $8,555,777 |
| 9,000,000 | Federal National Mortgage Association Conventional | | | |
| | 30-Yr. Pass Through(g) | 6.000 | 11/1/2035 | 9,075,942 |
|
|
| | Total Mortgage-Backed Securities | | 17,631,719 |
|
|
| |
| Municipals (0.6%) | | | |
| 500,000 | Minneapolis & St. Paul Metropolitan | | | |
| | Airports Commission | 4.850 | 1/1/2006 | 500,195 |
| 750,000 | Washington State Office of the State Treasurer(c) | 4.500 | 7/1/2007 | 747,825 |
|
|
| | Total Municipals | | | 1,248,020 |
|
|
| |
| Technology (0.5%) | | | |
| 1,000,000 | Deluxe Corporation(c) | 3.500 | 10/1/2007 | 961,586 |
|
|
| | Total Technology | | | 961,586 |
|
|
| |
| Transportation (0.6%) | | | |
| 700,000 | FedEx Corporation | 3.500 | 4/1/2009 | 668,370 |
| 500,000 | Southwest Airlines Company | 5.496 | 11/1/2006 | 503,406 |
|
|
| | Total Transportation | | | 1,171,776 |
|
|
| |
| U.S. Government (11.3%) | | | |
| 1,000,000 | Federal Home Loan Bank | 4.250 | 4/16/2007 | 994,837 |
| 1,500,000 | Federal Home Loan Bank | 4.625 | 10/24/2007 | 1,495,341 |
| 3,000,000 | Federal Home Loan Bank | 4.100 | 6/13/2008 | 2,941,944 |
| 1,400,000 | Federal Home Loan Bank | 4.400 | 7/28/2008 | 1,381,449 |
| 1,500,000 | Federal Home Loan Bank | 4.250 | 10/14/2008 | 1,492,185 |
| 1,500,000 | Federal Home Loan Mortgage Corporation | 4.125 | 4/2/2007 | 1,490,522 |
| 1,000,000 | Federal Home Loan Mortgage Corporation | 4.625 | 8/15/2008 | 992,982 |
| 1,500,000 | Federal National Mortgage Association | 4.375 | 9/7/2007 | 1,489,977 |
| 900,000 | Federal National Mortgage Association | 4.400 | 7/28/2008 | 888,167 |
| 1,500,000 | Federal National Mortgage Association | 4.000 | 9/2/2008 | 1,469,356 |
| 1,000,000 | U.S. Department of Housing and Urban Development | 3.450 | 8/1/2006 | 992,365 |
| 2,050,000 | U.S. Treasury Notes(e) | 3.750 | 5/15/2008 | 2,017,569 |
| 500,000 | U.S. Treasury Notes(e) | 4.125 | 8/15/2008 | 496,289 |
| 3,250,000 | U.S. Treasury Notes(e) | 5.000 | 2/15/2011 | 3,330,490 |
| 908,595 | U.S. Treasury Notes | 1.875 | 7/15/2015 | 899,367 |
|
|
| | Total U.S. Government | | | 22,372,840 |
|
|
| |
| Utilities (3.8%) | | | |
| 1,000,000 | Carolina Power & Light, Inc.(d) | 5.950 | 3/1/2009 | 1,026,647 |
| 900,000 | CenterPoint Energy, Inc.(d) | 5.875 | 6/1/2008 | 913,158 |
| 750,000 | Dominion Resources, Inc.(b,e) | 4.300 | 12/28/2005 | 750,040 |
| 325,000 | DPL, Inc. | 6.250 | 5/15/2008 | 332,312 |
| 500,000 | DTE Energy Company | 5.630 | 8/16/2007 | 504,354 |
| 700,000 | FirstEnergy Corporation | 5.500 | 11/15/2006 | 704,056 |
| |
| The accompanying notes to the financial statements are an integral part of this schedule. | |
|
204
| Limited Maturity Bond Fund | | | |
| Schedule of Investments as of October 31, 2005(a) | | | |
| |
| Principal | | Interest | Maturity | |
| Amount | Long-Term Fixed Income (92.1%) | Rate | Date | Value |
|
| Utilities -- continued | | | |
| $500,000 | Indiana Michigan Power Company | 6.125% | 12/15/2006 | $506,078 |
| 250,000 | MidAmerican Energy Holdings Company | 3.500 | 5/15/2008 | 240,379 |
| 500,000 | Pacific Gas & Electric Company | 3.600 | 3/1/2009 | 478,064 |
| 103,194 | Power Contract Financing, LLC | 5.200 | 2/1/2006 | 103,314 |
| 433,710 | Power Receivables Finance, LLC | 6.290 | 1/1/2012 | 440,602 |
| 1,000,000 | PSEG Funding Trust | 5.381 | 11/16/2007 | 1,003,699 |
| 400,000 | Texas-New Mexico Power Company | 6.125 | 6/1/2008 | 404,867 |
|
|
| | Total Utilities | | | 7,407,570 |
|
|
| | Total Long-Term Fixed Income (cost $183,848,884) | 181,986,715 |
|
|
| |
| |
| | | Interest | Maturity | |
| Shares | Collateral Held for Securities Loaned (5.5%) | Rate(h) | Date | Value |
|
| 10,863,600 | Thrivent Financial Securities Lending Trust | 3.95% | N/A | $10,863,600 |
|
|
| | Total Collateral Held for Securities Loaned | |
| | (cost $10,863,600) | | | 10,863,600 |
|
|
| |
| |
| Shares or | | | | |
| Principal | | Interest | Maturity | |
| Amount | Short-Term Investments (2.4%) | Rate(h) | Date | Value |
|
| $125,000 | Export Development Canada | 2.750% | 12/12/2005 | $124,849 |
| 4,569,514 | Thrivent Money Market Fund | 3.600 | N/A | 4,569,514 |
| |
| | Total Short-Term Investments (at amortized cost) | 4,694,363 |
|
|
| | Total Investments (cost $199,406,847) | | $197,544,678 |
|
|
| (a) | The categories of investments are shown as a percentage of total investments. |
| |
| (b) | Denotes variable rate obligations for which the current yield and next scheduled reset date are shown. |
| |
| (c) | Designated as cover for long settling trades as discussed in the notes to the financial statements. |
| |
| (d) | At October 31, 2005, all or a portion of the denoted securities, valued at $13,085,622, were pledged as the initial margin deposit or earmarked as collateral to cover open financial futures contracts as follows: |
| |
| | | | | | Notional | |
| | Number of | Expiration | | | Principal | Unrealized |
| Type | Contracts | Date | Position | Value | Amount | Gain |
|
| U.S. Treasury Bond Futures 5 yr. | 35 | December 2005 | Short | $(3,706,172) | $(3,798,489) | $92,317 |
| U.S. Treasury Bond Futures 10 yr. | 70 | December 2005 | Short | (7,591,718) | (7,793,954) | 202,234 |
| (e) | All or a portion of the security is on loan as discussed in item 2(L) of the Notes to Financial Statements. |
| |
| (f) | Denotes step coupon bonds for which the current interest rate and next scheduled reset date are shown. |
| |
| (g) | Denotes investments purchased on a when-issued basis. |
| |
| (h) | The interest rate shown reflects the yield, coupon rate or, for securities purchased at a discount, the discount rate at the date of purchase. |
| |
|
|
| The accompanying notes to the financial statements are an integral part of this schedule. |
|
|
205
| | Money Market Fund | | |
| | Schedule of Investments as of October 31, 2005(a) | | |
| Principal | | Interest | Maturity | |
| Amount | Certificates of Deposit (0.1%) | Rate(b) | Date | Value |
|
| $1,300,000 | Depfa Bank plc NY | 4.515% | 10/17/2006 | $1,300,000 |
|
|
| | Total Certificates of Deposit | | 1,300,000 |
|
|
| |
| |
| Principal | | Interest | Maturity | |
| Amount | Commercial Paper (64.5%) | Rate(b) | Date | Value |
|
| Asset-Backed Commercial Paper (2.5%) | | | |
| $18,500,000 | GOVCO, Inc. | 3.760% | 11/23/2005 | $18,457,491 |
| 5,400,000 | GOVCO, Inc. | 4.150 | 1/23/2006 | 5,348,332 |
|
|
| | Total Asset-Backed Commercial Paper | | 23,805,823 |
|
|
| |
| Banking – Domestic (7.4%) | | | |
| 6,700,000 | Barclays U.S. Funding, LLC | 3.730 | 11/28/2005 | 6,681,256 |
| 1,700,000 | BNP Paribas North America | 4.060 | 12/2/2005 | 1,694,437 |
| 2,750,000 | Dexia Bank NY | 4.525 | 11/17/2006 | 2,746,190 |
| 18,300,000 | Louis Dreyfus Corporation | 4.020 | 11/30/2005 | 18,240,738 |
| 14,800,000 | New York Hospital Fund | 3.730 | 11/2/2005 | 14,798,466 |
| 5,800,000 | UBS Finance Corporation | 3.900 | 11/14/2005 | 5,791,832 |
| 9,050,000 | UBS Finance Corporation | 3.900 | 12/7/2005 | 9,014,705 |
| 1,600,000 | UBS Finance Corporation | 3.920 | 12/9/2005 | 1,593,439 |
| 9,160,000 | UBS Finance Corporation | 4.050 | 12/23/2005 | 9,106,414 |
|
|
| | Total Banking – Domestic | | 69,667,477 |
|
|
| |
| Banking – Foreign (0.3%) | | | |
| 2,516,000 | HBOS Treasury Services plc | 3.750 | 11/14/2005 | 2,512,593 |
|
|
| | Total Banking – Foreign | | | 2,512,593 |
|
|
| |
| Brokerage (1.0%) | | | |
| 9,300,000 | Morgan Stanley | 3.890 | 11/16/2005 | 9,284,926 |
|
|
| | Total Brokerage | | | 9,284,926 |
|
|
| |
| Capital Goods (2.3%) | | | |
| 21,880,000 | General Electric Company | 4.000 | 12/27/2005 | 21,743,859 |
|
|
| | Total Capital Goods | | | 21,743,859 |
|
|
| |
| Communications (1.6%) | | | |
| 14,700,000 | Gannett Company, Inc. | 3.950 | 11/18/2005 | 14,672,580 |
|
|
| | Total Communications | | | 14,672,580 |
|
|
| |
| Consumer Cyclical (3.8%) | | | |
| 13,395,000 | Golden Funding Corporation | 3.970 | 12/13/2005 | 13,332,959 |
| 2,950,000 | Golden Funding Corporation | 3.725 | 12/14/2005 | 2,936,874 |
| 20,055,000 | Golden Funding Corporation | 3.775 | 12/30/2005 | 19,930,924 |
|
|
| | Total Consumer Cyclical | | | 36,200,757 |
|
|
| |
| |
The accompanying notes to the financial statements are an integral part of this schedule. |
|
206
| Money Market Fund | | | |
| Schedule of Investments as of October 31, 2005(a) | | | |
| |
| Principal | | Interest | Maturity | |
| Amount | Commercial Paper (64.5%) | Rate(b) | Date | Value |
|
| Education (7.7%) | | | |
| $7,241,000 | Duke University | 3.750% | 12/1/2005 | $7,218,372 |
| 14,800,000 | Northwestern University | 3.630 | 11/1/2005 | 14,800,000 |
| 3,700,000 | Northwestern University | 3.630 | 11/7/2005 | 3,697,761 |
| 13,875,000 | Northwestern University | 3.800 | 12/1/2005 | 13,831,062 |
| 3,700,000 | Northwestern University | 3.700 | 12/2/2005 | 3,688,212 |
| 7,300,000 | Northwestern University | 3.920 | 12/8/2005 | 7,270,589 |
| 21,900,000 | Yale University | 3.700 | 11/1/2005 | 21,900,000 |
|
|
| | Total Education | | | 72,405,996 |
|
|
| |
| Finance (28.9%) | | | |
| 3,300,000 | ABN Amro NA Finance | 3.635 | 11/15/2005 | 3,295,335 |
| 8,600,000 | Alaska Housing Finance Corporation | 3.920 | 12/2/2005 | 8,570,970 |
| 14,700,000 | Bryant Park Fund | 3.720 | 11/15/2005 | 14,678,734 |
| 14,800,000 | Bryant Park Fund | 4.040 | 1/6/2006 | 14,690,381 |
| 13,200,000 | Bryant Park Fund | 4.135 | 1/25/2006 | 13,071,126 |
| 10,950,000 | Corporate Asset Finance Company, LLC | 4.140 | 1/9/2006 | 10,863,112 |
| 15,450,000 | Corporate Asset Finance Company, LLC | 4.160 | 1/18/2006 | 15,310,744 |
| 6,640,000 | Corporate Receivables Corporation Funding, LLC | 3.840 | 11/15/2005 | 6,630,084 |
| 4,570,000 | Falcon Asset Securitization Corporation | 4.000 | 11/21/2005 | 4,560,225 |
| 2,085,000 | Fountain Square Commercial Funding Corporation | 3.970 | 12/12/2005 | 2,075,573 |
| 21,900,000 | Galaxy Funding, Inc. | 3.900 | 12/16/2005 | 21,793,238 |
| 18,300,000 | Galaxy Funding, Inc. | 4.180 | 1/30/2006 | 18,108,765 |
| 10,360,000 | Grampian Funding, LLC | 3.600 | 11/7/2005 | 10,353,784 |
| 14,800,000 | Grampian Funding, LLC | 3.710 | 12/5/2005 | 14,748,142 |
| 2,119,000 | Grampian Funding, LLC | 4.120 | 1/19/2006 | 2,099,842 |
| 2,588,000 | Jupiter Securitization Corporation | 3.940 | 12/5/2005 | 2,578,370 |
| 14,700,000 | NATC California, LLC | 4.110 | 1/12/2006 | 14,579,166 |
| 8,000,000 | Nieuw Amsterdam Receivables | 4.050 | 11/22/2005 | 7,981,473 |
| 6,282,000 | Nieuw Amsterdam Receivables | 3.750 | 12/14/2005 | 6,253,862 |
| 6,310,000 | Nieuw Amsterdam Receivables | 4.000 | 1/3/2006 | 6,265,830 |
| 16,000,000 | Old Line Funding Corporation | 4.000 | 11/21/2005 | 15,964,444 |
| 14,600,000 | Solitaire Funding, LLC | 3.920 | 12/13/2005 | 14,533,229 |
| 2,500,000 | Thames Asset Global Securitization, Inc. | 3.880 | 11/8/2005 | 2,498,114 |
| 17,400,000 | Thames Asset Global Securitization, Inc. | 3.930 | 12/7/2005 | 17,331,618 |
| 7,300,000 | Thunder Bay Funding, Inc. | 3.860 | 11/7/2005 | 7,295,304 |
| 10,650,000 | Thunder Bay Funding, Inc. | 3.970 | 11/21/2005 | 10,626,511 |
| 5,000,000 | Windmill Funding Company | 4.030 | 11/22/2005 | 4,988,246 |
|
|
| | Total Finance | | | 271,746,222 |
|
|
| |
The accompanying notes to the financial statements are an integral part of this schedule. |
|
207
| Money Market Fund | | | |
| Schedule of Investments as of October 31, 2005(a) | | | |
| |
| Principal | | Interest | Maturity | |
| Amount | Commercial Paper (64.5%) | Rate(b) | Date | Value |
|
| Insurance (9.0%) | | | |
| $11,000,000 | Aquinas Funding, LLC | 4.055% | 1/10/2006 | $10,913,268 |
| 22,200,000 | Curzon Funding, LLC | 3.690 | 11/8/2005 | 22,184,072 |
| 6,600,000 | Curzon Funding, LLC | 4.140 | 2/17/2006 | 6,518,028 |
| 18,400,000 | Nyala Funding, LLC | 4.090 | 1/17/2006 | 18,239,036 |
| 4,400,000 | Torchmark Corporation | 3.910 | 11/9/2005 | 4,396,177 |
| 11,000,000 | Torchmark Corporation | 3.970 | 11/10/2005 | 10,989,083 |
| 7,300,000 | Torchmark Corporation | 3.980 | 11/17/2005 | 7,287,087 |
| 3,700,000 | Torchmark Corporation | 4.030 | 11/23/2005 | 3,690,888 |
|
|
| | Total Insurance | | | 84,217,639 |
|
|
| | Total Commercial Paper | | | 606,257,871 |
|
|
| |
| |
| | | Interest | Maturity | |
| Shares | Other(c) | Rate(b) | Date | Value |
|
| 8,000 | Barclays Prime Money Market Fund | 3.900% | N/A | $8,000 |
|
|
| | Total Other | | | 8,000 |
|
|
| |
| |
| Principal | | Interest | Maturity | |
| Amount | Public Corporate (0.5%) | Rate(b) | Date | Value |
|
| $3,000,000 | General Electric Capital Corporation | 6.800% | 11/1/2005 | $3,000,000 |
| 1,340,000 | Household Finance Corporation | 7.200 | 7/15/2006 | 1,365,957 |
|
|
| | Total Public Corporate | | | 4,365,957 |
|
|
| |
| |
| Principal | | Interest | Maturity | |
| Amount | U.S. Government (0.1%) | Rate(b) | Date | Value |
|
| $1,280,000 | Federal National Mortgage Association | 4.050% | 8/14/2006 | $1,280,000 |
|
|
| | Total U.S. Government | | | 1,280,000 |
|
|
| |
| |
| Principal | | Interest | Maturity | |
| Amount | Variable Rate Notes (34.8%)(d) | Rate(b) | Date | Value |
|
| |
| Banking – Domestic (10.3%) | | | |
| $14,800,000 | Bank of America Corporation | 4.130% | 12/1/2005 | $14,803,313 |
| 9,250,000 | Bank of New York Company, Inc. | 3.910 | 11/10/2005 | 9,250,000 |
| 7,400,000 | Bank of New York Company, Inc. | 4.080 | 11/28/2005 | 7,402,945 |
| 18,500,000 | Fifth Third Bancorp | 3.991 | 11/23/2005 | 18,500,000 |
| 9,250,000 | Royal Bank of Scotland NY | 3.890 | 11/15/2005 | 9,248,427 |
| 19,225,000 | Wells Fargo & Company | 3.960 | 11/15/2005 | 19,225,000 |
| 18,500,000 | Wells Fargo & Company | 3.955 | 12/5/2005 | 18,509,689 |
|
|
| | Total Banking – Domestic | | 96,939,374 |
|
|
| |
| |
| The accompanying notes to the financial statements are an integral part of this schedule. | |
|
208
| Money Market Fund | | | |
| Schedule of Investments as of October 31, 2005(a) | | | |
| |
| Principal | | Interest | Maturity | |
| Amount | Variable Rate Notes (34.8%)(d) | Rate(b) | Date | Value |
|
| Banking – Foreign (5.4%) | | | |
| $9,600,000 | Bank of Ireland | 3.970% | 11/21/2005 | $9,600,000 |
| 10,950,000 | BNP Paribas SA | 4.021 | 11/26/2005 | 10,950,000 |
| 18,500,000 | HBOS Treasury Services plc | 4.236 | 1/27/2006 | 18,502,468 |
| 11,500,000 | Royal Bank of Scotland plc | 3.973 | 11/21/2005 | 11,500,000 |
|
|
| | Total Banking – Foreign | | | 50,552,468 |
|
|
| |
| Brokerage (3.3%) | | | |
| 22,200,000 | Goldman Sachs Group, Inc. | 4.120 | 12/21/2005 | 22,220,401 |
| 8,650,000 | Merrill Lynch & Company, Inc. | 4.590 | 1/13/2006 | 8,658,710 |
|
|
| | Total Brokerage | | | 30,879,111 |
|
|
| |
| Consumer Cyclical (3.5%) | | | |
| 14,800,000 | American Honda Finance Corporation | 3.960 | 11/15/2005 | 14,824,183 |
| 18,500,000 | American Honda Finance Corporation | 3.981 | 12/7/2005 | 18,517,655 |
|
|
| | Total Consumer Cyclical | | | 33,341,838 |
|
|
| |
| Consumer Non-Cyclical (1.6%) | | | |
| 15,460,000 | Procter & Gamble Company | 3.788 | 12/9/2005 | 15,460,000 |
|
|
| | Total Consumer Non-Cyclical | | 15,460,000 |
|
|
| |
| Finance (3.1%) | | | |
| 6,800,000 | General Electric Capital Corporation | 3.947 | 11/7/2005 | 6,804,346 |
| 21,900,000 | Union Hamilton Special Funding, LLC | 4.000 | 12/28/2005 | 21,900,000 |
|
|
| | Total Finance | | | 28,704,346 |
|
|
| |
| Insurance (4.7%) | | | |
| 6,000,000 | Allstate Financial Global Funding | 4.010 | 12/20/2005 | 6,001,311 |
| 19,325,000 | Allstate Life Global Funding II | 3.955 | 11/8/2005 | 19,325,000 |
| 19,225,000 | Allstate Life Global Funding II | 3.990 | 11/15/2005 | 19,225,000 |
|
|
| | Total Insurance | | | 44,551,311 |
|
|
| |
| U.S. Municipal (2.9%) | | | |
| |
| 9,135,000 | Alaska Housing Finance Corporation Variable-Taxable | | | |
| | Governmental Purpose Bonds (Series D) (MBIA Insured) | 4.030 | 11/3/2005 | 9,135,000 |
| 8,000,000 | Illinois Student Assistance Commission | 3.910 | 11/2/2005 | 8,000,000 |
| 10,000,000 | Ohio State Air Quality Development Authority Revenue | | | |
| | Bonds (Columbus and Southern) (Series B) | 4.000 | 11/2/2005 | 10,000,000 |
|
|
| | Total U.S. Municipal | | | 27,135,000 |
|
|
| | Total Variable Rate Notes | | 327,563,448 |
|
|
| | Total Investments (at amortized cost) | | $940,775,277 |
|
|
| (a) | The categories of investments are shown as a percentage of total investments. |
| |
| (b) | The interest rate shown reflects the yield, coupon rate or, for securities purchased at a discount, the discount rate at the date of purchase. |
| |
| (c) | The market value of the denoted categories of investments represents less than 0.1% of the total investments of the Thrivent Money Market Fund. |
| |
| (d) | Denotes variable rate obligations for which the current yield and next scheduled reset date are shown. |
| |
|
| The accompanying notes to the financial statements are an integral part of this schedule. |
|
|
209
| Thrivent Mutual Funds | | |
| Statement of Assets and Liabilities | | |
| |
| | Aggressive | Moderately | Moderate | Moderately |
| | Allocation | Aggressive | Allocation | Conservative |
| As of October 31, 2005 | Fund | Allocation Fund | Fund | Allocation Fund |
|
| Assets | | | | |
| Investments at cost | $29,189,036 | $65,689,015 | $78,983,288 | $33,699,737 |
| Investments at value | 29,387,473(a) | 65,863,208(a) | 79,018,541(a) | 33,654,580(a) |
|
| Cash | -- | -- | -- | -- |
| Initial margin deposit on open futures contracts | -- | -- | -- | -- |
| Dividends and interest receivable | -- | -- | -- | -- |
| Prepaid expenses | 25,422 | 24,275 | 24,406 | 22,505 |
| Receivable for investments sold | -- | -- | -- | -- |
| Receivable for fund shares sold | 810,209 | 1,153,626 | 2,040,385 | 523,194 |
| Receivable for variation margin | -- | -- | -- | -- |
| Receivable from affiliate | 2,433 | 1,239 | 5,976 | 8,798 |
| Total Assets | 30,225,537 | 67,042,348 | 81,089,308 | 34,209,077 |
|
| Liabilities | | | | |
| Accrued expenses | 10,601 | 11,916 | 11,360 | 9,711 |
| Payable for investments purchased | 809,308 | 1,126,600 | 2,006,370 | 491,562 |
| Payable upon return of collateral for securities loaned | -- | -- | -- | -- |
| Payable for fund shares redeemed | 1,000 | 11,445 | 33,796 | 32,772 |
| Payable to affiliate | -- | -- | -- | -- |
| Total Liabilities | 820,909 | 1,149,961 | 2,051,526 | 534,045 |
|
| Net Assets | | | | |
| Capital stock (beneficial interest) | 29,207,542 | 65,667,011 | 78,930,160 | 33,659,512 |
| Accumulated undistributed net investment income/(loss) | (299) | 54,530 | 76,657 | 61,532 |
| Accumulated undistributed net realized gain/(loss) on | | | | |
| investments and foreign currency transactions | (1,052) | (3,347) | (4,288) | (855) |
| Net unrealized appreciation/(depreciation) on: | | | | |
| Investments | 198,437 | 174,193 | 35,253 | (45,157) |
| Futures contracts | -- | -- | -- | -- |
| Total Net Assets | $29,404,628 | $65,892,387 | $79,037,782 | $33,675,032 |
|
| Class A Share Capital | $25,241,280 | $63,162,237 | $76,159,075 | $32,909,891 |
| Shares of beneficial interest outstanding (class A) | 2,433,425 | 6,124,089 | 7,451,711 | 3,247,607 |
| Net asset value per share | $10.37 | $10.31 | $10.22 | $10.13 |
| Maximum public offering price | $10.97 | $10.91 | $10.81 | $10.72 |
| Class B Share Capital | N/A | N/A | N/A | N/A |
| Shares of beneficial interest outstanding (class B) | N/A | N/A | N/A | N/A |
| Net asset value per share | N/A | N/A | N/A | N/A |
| Class I Share Capital | $4,163,348 | $2,730,150 | $2,878,707 | $765,141 |
| Shares of beneficial interest outstanding (class I) | 400,861 | 264,359 | 281,464 | 75,428 |
| Net asset value per share | $10.39 | $10.33 | $10.23 | $10.14 |
| | | | |
| (a) All amounts are in affiliated funds | | | | |
| | | | |
| | | | |
| | | | |
The accompanying notes to the financial statements are an integral part of this statement. |
|
210
| Thrivent Mutual Funds | | |
| Statement of Assets and Liabilities – continued | |
| |
| | Partner | Partner | | | | Partner |
| Technology | Small Cap | Small Cap | Small Cap | Small Cap | Mid Cap | Mid Cap |
| Fund | Growth Fund | Value Fund | Stock Fund | Index Fund | Growth Fund | Value Fund |
|
| |
| $58,138,791 | $14,981,735 | $101,979,924 | $491,186,501 | $46,477,241 | $337,542,601 | $9,381,182 |
| 54,367,826(b) | 15,464,464(b) | 112,709,738(b) | 573,419,680(b) | 58,518,340(b) | 372,161,241(b) | 9,437,944(b) |
|
| -- | 510,296 | -- | -- | -- | -- | 62 |
| -- | -- | -- | -- | 67,500 | -- | -- |
| 13,885 | 2,551 | 103,900 | 183,763 | 30,553 | 80,850 | 3,046 |
| 3,243 | 22,885 | 3,599 | 6,537 | 3,228 | 5,265 | 22,628 |
| 548,973 | 111,393 | 703,808 | 6,457,169 | 73,403 | 3,993,316 | 7,634 |
| 46,858 | 65,712 | 137,550 | 583,100 | 51,070 | 218,574 | 79,575 |
| -- | -- | -- | -- | 33,757 | -- | -- |
| -- | -- | -- | -- | -- | -- | 5,054 |
| 54,980,785 | 16,177,301 | 113,658,595 | 580,650,249 | 58,777,851 | 376,459,246 | 9,555,943 |
|
| 45,654 | 11,644 | 40,928 | 168,767 | 28,354 | 148,621 | 12,455 |
| 413,629 | 177,910 | 825,012 | 9,031,727 | 72,961 | 5,667,153 | 266,566 |
| 5,647,242 | 2,334,945 | 16,170,830 | 88,413,094 | 11,615,792 | 53,154,317 | 529,547 |
| 63,797 | -- | 244,781 | 367,758 | 98,762 | 329,607 | -- |
| 45,124 | 3,252 | 57,330 | 466,471 | 29,404 | 282,996 | -- |
| 6,215,446 | 2,527,751 | 17,338,881 | 98,447,817 | 11,845,273 | 59,582,694 | 808,568 |
|
| 80,948,713 | 13,334,427 | 79,503,418 | 352,649,111 | 34,186,753 | 316,848,251 | 8,701,126 |
| (6,022) | (299) | 92,925 | (273,665) | 68,364 | (12,702) | 14,227 |
| |
| (28,406,387) | (167,307) | 5,993,557 | 47,593,807 | 673,310 | (34,577,637) | (24,740) |
| |
| (3,770,965) | 482,729 | 10,729,814 | 82,233,179 | 12,041,099 | 34,618,640 | 56,762 |
| -- | -- | -- | -- | (36,948) | -- | -- |
| $48,765,339 | $13,649,550 | $96,319,714 | $482,202,432 | $46,932,578 | $316,876,552 | $8,747,375 |
|
| $42,680,429 | $9,492,328 | $74,449,941 | $440,546,435 | $46,932,578 | $269,038,108 | $5,103,309 |
| 12,247,181 | 923,788 | 5,295,060 | 24,760,374 | 3,287,430 | 18,442,109 | 503,543 |
| $3.48 | $10.28 | $14.06 | $17.79 | $14.28 | $14.59 | $10.13 |
| $3.68 | $10.88 | $14.88 | $18.83 | $15.11 | $15.44 | $10.72 |
| $3,510,591 | N/A | $5,490,860 | $20,540,889 | N/A | $36,130,648 | N/A |
| 1,050,590 | N/A | 406,624 | 1,269,667 | N/A | 2,648,935 | N/A |
| $3.34 | N/A | $13.50 | $16.18 | N/A | $13.64 | N/A |
| $2,574,319 | $4,157,222 | $16,378,913 | $21,115,108 | N/A | $11,707,796 | $3,644,066 |
| 705,024 | 404,237 | 1,124,380 | 1,120,411 | N/A | 758,312 | 359,202 |
| $3.65 | $10.28 | $14.57 | $18.85 | N/A | $15.44 | $10.14 |
| |
| (b) Amount includes affiliated funds as discussed in the notes to the financial statements | | |
| |
| |
| The accompanying notes to the financial statements are an integral part of this statement. | |
|
211
| Thrivent Mutual Funds | | |
| Statement of Assets and Liabilities – continued | |
| |
| | | | | Partner |
| | Mid Cap | Mid Cap | Mid Cap | International |
| As of October 31, 2005 | Stock Fund | Index Fund | Index Fund-I | Stock Fund |
|
| Assets | | | | |
| Investments at cost | $1,034,450,879 | $62,585,546 | $21,796,796 | $395,401,086 |
| Investments at value | 1,180,498,407(a) | 73,572,863(a) | 27,052,579(a) | 439,371,275(a) |
|
| Cash | 2,732 | -- | 110,801 | 183,427(b) |
| Initial margin deposit on open futures contracts | -- | 72,900 | 45,900 | -- |
| Dividends and interest receivable | 583,526 | 38,478 | 13,388 | 570,350 |
| Prepaid expenses | 10,330 | 3,341 | 3,040 | 5,549 |
| Receivable for investments sold | 14,289,688 | 27,277 | 10,469 | 596,942 |
| Receivable for fund shares sold | 977,722 | 71,792 | 30,000 | 1,146,526 |
| Receivable for forward contracts | -- | -- | -- | 482,376 |
| Receivable for variation margin | -- | 33,617 | 21,017 | -- |
| Total Assets | 1,196,362,405 | 73,820,268 | 27,287,194 | 442,356,445 |
|
| Liabilities | | | | |
| Distributions payable | -- | -- | -- | -- |
| Accrued expenses | 219,737 | 28,460 | 14,335 | 139,903 |
| Payable for investments purchased | 19,530,775 | 195,804 | 73,249 | 685,592 |
| Payable upon return of collateral for securities loaned | 172,111,641 | 11,062,822 | 3,998,252 | 58,619,277 |
| Payable for fund shares redeemed | 878,439 | 47,809 | 111,506 | 125,760 |
| Payable for forward contracts | -- | -- | -- | 482,807 |
| Open options written, at value | -- | -- | -- | -- |
| Payable to affiliate | 905,316 | 36,580 | 5,153 | 346,854 |
| Payable for initial margin | -- | 2,700 | 2,700 | -- |
| Mortgage dollar roll deferred revenue | -- | -- | -- | -- |
| Total Liabilities | 193,645,908 | 11,374,175 | 4,205,195 | 60,400,193 |
|
| Net Assets | | | | |
| Capital stock (beneficial interest) | 756,378,107 | 47,781,451 | 16,727,615 | 402,407,513 |
| Accumulated undistributed net investment income/(loss) | (456,254) | 284,444 | 122,503 | 2,916,014 |
| Accumulated undistributed net realized gain/(loss) on | | | | |
| investments and foreign currency transactions | 100,747,116 | 3,421,427 | 972,961 | (67,322,345) |
| Net unrealized appreciation/(depreciation) on: | | | | |
| Investments | 146,047,528 | 10,987,317 | 5,255,783 | 43,970,189 |
| Written option contracts | -- | -- | -- | -- |
| Futures contracts | -- | (28,546) | 3,137 | -- |
| Foreign currency forward contracts | -- | -- | -- | (431) |
| Foreign currency transactions | -- | -- | -- | (14,688) |
| Total Net Assets | $1,002,716,497 | $62,446,093 | $23,081,999 | $381,956,252 |
|
| Class A Share Capital | $928,017,268 | $62,446,093 | N/A | $304,753,446 |
| Shares of beneficial interest outstanding (class A) | 51,989,216 | 4,534,547 | N/A | 28,844,955 |
| Net asset value per share | $17.85 | $13.77 | N/A | $10.57 |
| Maximum public offering price | $18.89 | $14.57 | N/A | $11.19 |
| Class B Share Capital | $23,992,239 | N/A | N/A | $16,084,488 |
| Shares of beneficial interest outstanding (class B) | 1,492,108 | N/A | N/A | 1,582,621 |
| Net asset value per share | $16.08 | N/A | N/A | $10.16 |
| Class I Share Capital | $50,706,990 | N/A | $23,081,999 | $61,118,318 |
| Shares of beneficial interest outstanding (class I) | 2,722,404 | N/A | 1,729,967 | 5,675,322 |
| Net asset value per share | $18.63 | N/A | $13.34 | $10.77 |
| | |
| (a) Amount includes affiliated funds as discussed in the notes to the financial statements | | |
The accompanying notes to the financial statements are an integral part of this statement. | |
|
212
| Thrivent Mutual Funds | | |
| Statement of Assets and Liabilities – continued | |
| |
| |
| Large Cap | Large Cap | Large Cap | Large Cap | Large Cap | Balanced | High Yield |
| Growth Fund | Value Fund | Stock Fund | Index Fund | Index Fund-I | Fund | Fund |
|
| |
| $181,276,108 | $350,842,772 | $2,896,197,739 | $97,004,979 | $30,886,601 | $456,758,411 | $673,488,312 |
| 187,591,937(a) | 397,516,753(a) | 3,648,267,324(a) | 99,059,280(a) | 31,889,336(a) | 470,791,720(a) | 675,448,915(a) |
|
| -- | -- | 17,704 | -- | -- | -- | -- |
| -- | -- | -- | 37,800 | 53,550 | -- | -- |
| 78,924 | 343,807 | 1,573,230 | 90,019 | 31,355 | 1,068,263 | 12,228,685 |
| 4,073 | 5,700 | 29,940 | 3,585 | 3,115 | 5,858 | 7,478 |
| 3,035,553 | 3,289,122 | -- | -- | -- | 3,336,387 | 4,067,477 |
| 831,153 | 761,660 | 968,732 | 184,901 | 44,300 | 131,882 | 341,402 |
| -- | -- | -- | -- | -- | -- | -- |
| -- | -- | -- | 5,817 | 8,342 | 5,078 | -- |
| 191,541,640 | 401,917,042 | 3,650,856,930 | 99,381,402 | 32,029,998 | 475,339,188 | 692,093,957 |
|
| -- | -- | -- | -- | -- | -- | 1,105,748 |
| 63,172 | 90,567 | 798,465 | 30,869 | 13,920 | 85,951 | 110,110 |
| 5,912,622 | 945,983 | -- | -- | -- | 41,609,370 | 5,864,567 |
| 7,339,698 | 14,008,574 | 74,365,656 | 4,844,539 | 438,476 | 45,238,731 | 82,460,818 |
| 128,537 | 408,664 | 3,185,459 | 119,630 | 87,114 | 280,593 | 515,016 |
| -- | -- | -- | -- | -- | -- | -- |
| 2,755 | -- | -- | -- | -- | -- | -- |
| 72,725 | 288,578 | 2,716,599 | 37,685 | 6,976 | 290,622 | 405,255 |
| -- | -- | -- | 3,150 | 3,150 | -- | -- |
| -- | -- | -- | -- | -- | 13,853 | -- |
| 13,519,509 | 15,742,366 | 81,066,179 | 5,035,873 | 549,636 | 87,519,120 | 90,461,514 |
|
| 194,181,835 | 334,688,625 | 2,928,311,861 | 91,688,084 | 34,495,124 | 365,258,652 | 1,090,390,617 |
| 353,707 | 3,577,395 | 14,115,689 | 911,839 | 333,818 | 288,577 | (208,006) |
| |
| (22,830,739) | 1,234,675 | (124,706,384) | (296,371) | (4,349,502) | 8,209,212 | (490,510,771) |
| |
| 6,315,829 | 46,673,981 | 752,069,585 | 2,054,301 | 1,002,735 | 14,033,309 | 1,960,603 |
| 1,499 | -- | -- | -- | -- | -- | -- |
| -- | -- | -- | (12,324) | (1,813) | 30,318 | -- |
| -- | -- | -- | -- | -- | -- | -- |
| -- | -- | -- | -- | -- | -- | -- |
| $178,022,131 | $386,174,676 | $3,569,790,751 | $94,345,529 | $31,480,362 | $387,820,068 | $601,632,443 |
|
| $130,912,384 | $321,182,708 | $3,331,964,527 | $94,345,529 | N/A | $276,083,186 | $563,038,778 |
| 26,707,443 | 22,170,429 | 128,501,685 | 11,303,162 | N/A | 22,663,162 | 112,033,906 |
| $4.90 | $14.49 | $25.93 | $8.35 | N/A | $12.18 | $5.03 |
| $5.19 | $15.33 | $27.44 | $8.84 | N/A | $12.89 | $5.27 |
| $15,771,621 | $16,904,832 | $91,877,447 | N/A | N/A | $13,320,658 | $23,394,241 |
| 3,402,336 | 1,186,630 | 3,827,936 | N/A | N/A | 1,098,218 | 4,656,818 |
| $4.64 | $14.25 | $24.00 | N/A | N/A | $12.13 | $5.02 |
| $31,338,126 | $48,087,136 | $145,948,777 | N/A | $31,480,362 | $98,416,224 | $15,199,424 |
| 6,023,040 | 3,294,347 | 5,584,696 | N/A | 3,799,325 | 8,085,765 | 3,022,061 |
| $5.20 | $14.60 | $26.13 | N/A | $8.29 | $12.17 | $5.03 |
(b) Includes foreign currency holdings of $180,467 | | | | |
213
| Thrivent Mutual Funds | | |
| Statement of Assets and Liabilities – continued | |
| |
| |
| | High Yield | Municipal | Income | Core Bond |
| As of October 31, 2005 | Fund II | Bond Fund | Fund | Fund |
|
| Assets | | | | |
| Investments at cost | $153,373,505 | $1,173,547,167 | $740,461,538 | $678,347,860 |
| Investments at value | 153,883,443(a) | 1,262,214,376 | 732,449,274(a) | 670,557,932(a) |
|
| Cash | -- | 47,190 | -- | 860 |
| Dividends and interest receivable | 2,760,796 | 19,244,230 | 6,350,992 | 3,401,019 |
| Prepaid expenses | 3,895 | 12,486 | 7,413 | 6,606 |
| Receivable for investments sold | 788,847 | -- | 2,424,430 | 3,206,629 |
| Receivable for fund shares sold | 26,552 | 796,245 | 575,386 | 184,421 |
| Receivable for variation margin | -- | -- | 12,814 | 13,595 |
| Receivable from affiliate | -- | -- | -- | -- |
| Total Assets | 157,463,533 | 1,282,314,527 | 741,820,309 | 677,371,062 |
|
| Liabilities | | | | |
| Distributions payable | 260,711 | 949,040 | 381,429 | 213,014 |
| Accrued expenses | 42,763 | 149,472 | 95,312 | 96,703 |
| Payable for investments purchased | 1,824,920 | -- | 81,381,810 | 142,326,322 |
| Payable upon return of collateral for securities loaned | 22,348,675 | -- | 60,887,414 | 48,712,809 |
| Payable for fund shares redeemed | 255,260 | 766,050 | 503,552 | 703,458 |
| Payable for variation margin | -- | -- | -- | -- |
| Payable to affiliate | 92,596 | 804,307 | 365,319 | 337,535 |
| Mortgage dollar roll deferred revenue | -- | -- | 29,475 | 51,176 |
| Total Liabilities | 24,824,925 | 2,668,869 | 143,644,311 | 192,441,017 |
|
| Net Assets | | | | |
| Capital stock (beneficial interest) | 197,381,442 | 1,201,716,222 | 631,351,086 | 496,083,400 |
| Accumulated undistributed net investment income/(loss) | 313,879 | (14,026) | (20,328) | 96,335 |
| Accumulated undistributed net realized gain/(loss) on | | | | |
| investments and foreign currency transactions | (65,566,651) | (10,723,747) | (25,423,882) | (3,104,259) |
| Net unrealized appreciation/(depreciation) on: | | | | |
| Investments | 509,938 | 88,667,209 | (8,012,264) | (7,789,928) |
| Futures contracts | -- | -- | 281,386 | (355,503) |
| Total Net Assets | $132,638,608 | $1,279,645,658 | $598,175,998 | $484,930,045 |
|
| Class A Share Capital | $124,286,310 | $1,242,350,457 | $532,323,768 | $421,204,680 |
| Shares of beneficial interest outstanding (class A) | 19,394,596 | 109,880,621 | 62,201,158 | 42,580,280 |
| Net asset value per share | $6.41 | $11.31 | $8.56 | $9.89 |
| Maximum public offering price | $6.71 | $11.84 | $8.96 | $10.36 |
| Class B Share Capital | $4,093,631 | $28,915,326 | $19,166,943 | $10,798,365 |
| Shares of beneficial interest outstanding (class B) | 638,797 | 2,558,329 | 2,244,627 | 1,091,054 |
| Net asset value per share | $6.41 | $11.30 | $8.54 | $9.90 |
| Class I Share Capital | $4,258,667 | $8,379,875 | $46,685,287 | $52,927,000 |
| Shares of beneficial interest outstanding (class I) | 664,767 | 741,174 | 5,459,555 | 5,348,517 |
| Net asset value per share | $6.41 | $11.31 | $8.55 | $9.90 |
| |
| (a) Amount includes affiliated funds as discussed in the notes to the financial statements | | |
| |
| |
| |
The accompanying notes to the financial statements are an integral part of this statement. | |
|
214
Thrivent Mutual Funds
Statement of Assets and Liabilities – continued
| Limited | Money |
| Maturity | Market |
| Bond Fund | Fund |
|
| |
| $199,406,847 | $940,775,277 |
| 197,544,678(a) | 940,775,277 |
|
| -- | 119 |
| 1,229,228 | 1,291,572 |
| 4,032 | 9,719 |
| 2,728,868 | -- |
| 1,357,540 | 10,830,397 |
| -- | -- |
| -- | -- |
| 202,864,346 | 952,907,084 |
|
| 28,452 | 51,635 |
| 30,078 | 188,436 |
| 20,788,438 | -- |
| 10,863,600 | -- |
| 306,615 | 6,013,402 |
| 2,735 | -- |
| 90,096 | 461,985 |
| 6,516 | -- |
| 32,116,530 | 6,715,458 |
|
| 173,092,693 | 946,200,615 |
| 14,434 | (8,989) |
| |
| (791,693) | -- |
| |
| (1,862,169) | -- |
| 294,551 | -- |
| $170,747,816 | $946,191,626 |
|
| $131,333,379 | $661,318,948 |
| 10,438,681 | 661,318,949 |
| $12.58 | $1.00 |
| $12.58 | $1.00 |
| $2,024,356 | $1,747,877 |
| 160,767 | 1,747,877 |
| $12.59 | $1.00 |
| $37,390,081 | $283,124,801 |
| 2,972,494 | 283,124,801 |
| $12.58 | $1.00 |
| |
| |
| |
| |
The accompanying notes to the financial statements are an integral part of this statement.
215
| Thrivent Mutual Funds | | |
| Statement of Operations | | |
| |
| | | Aggressive | Moderately | Moderate | Moderately |
| | | Allocation | Aggressive | Allocation | Conservative |
| For the Year Ended October 31, 2005 | | Fund(a) | Allocation Fund(a) | Fund(a) | Allocation Fund(a) |
|
| Investment Income | | | | | |
| Dividends | | $11,578 | $85,877 | $181,628 | $124,012 |
| Taxable interest | | -- | -- | -- | -- |
| Income from securities loaned | | -- | -- | -- | -- |
| Foreign dividend tax withholding | | -- | -- | -- | -- |
| Total Investment Income | | 11,578 | 85,877 | 181,628 | 124,012 |
|
| Expenses | | | | | |
| Adviser fees | | 6,128 | 14,542 | 17,379 | 7,826 |
| Sub-Adviser fees | | -- | -- | -- | -- |
| Accounting and pricing fees | | 5,332 | 5,332 | 5,332 | 5,332 |
| Administrative service fees | | 817 | 1,939 | 2,317 | 1,043 |
| Amortization of offering costs | | 11,236 | 10,596 | 10,639 | 9,764 |
| Custody fees | | 1,000 | 1,000 | 1,000 | 1,000 |
| Distribution expenses Class A | | 9,746 | 23,812 | 28,509 | 12,684 |
| Distribution expenses Class B | | -- | -- | -- | -- |
| Insurance expenses | | 1,209 | 1,236 | 1,245 | 1,215 |
| Printing and postage expenses Class A | | 2,906 | 4,844 | 4,036 | 1,613 |
| Printing and postage expenses Class B | | -- | -- | -- | -- |
| Printing and postage expenses Class I | | 22 | 22 | 23 | 26 |
| Transfer agent fees Class A | | 9,769 | 16,694 | 14,016 | 4,969 |
| Transfer agent fees Class B | | -- | -- | -- | -- |
| Transfer agent fees Class I | | 13 | 18 | 34 | 19 |
| Audit and legal fees | | 14,495 | 14,495 | 14,495 | 14,495 |
| SEC and state registration expenses | | 534 | 2,885 | 2,751 | 1,113 |
| Trustees’ fees | | 905 | 905 | 905 | 905 |
| Other expenses | | 825 | 822 | 824 | 824 |
| Total Expenses Before Reimbursement | | 64,937 | 99,142 | 103,505 | 62,828 |
|
| Less: | | | | | |
| Reimbursement from adviser | | (30,230) | (57,199) | (72,992) | (45,392) |
| Custody earnings credit | | -- | -- | -- | -- |
| Total Net Expenses | | 34,707 | 41,943 | 30,513 | 17,436 |
|
| Net Investment Income/(Loss) | | (23,129) | 43,934 | 151,115 | 106,576 |
|
| Realized and Unrealized Gains/(Losses) on | | | | | |
| Investments and Foreign Currency Transactions | | | | | |
| Net realized gains/(losses) on: | | | | | |
| Investments | | (843) | (3,347) | (4,288) | (855) |
| Futures contracts | | -- | -- | -- | -- |
| Change in net unrealized appreciation/(depreciation) on: | | | | | |
| Investments | | 198,437 | 174,193 | 35,253 | (45,157) |
| Futures contracts | | -- | -- | -- | -- |
| Net Realized and Unrealized Gains/(Losses) on | | | | | |
| Investments and Foreign Currency Transactions | | 197,594 | 170,846 | 30,965 | (46,012) |
| Net Increase/(Decrease) in Net Assets Resulting | | | | | |
| From Operations | | $174,465 | $214,780 | $182,080 | $60,564 |
|
(a) For the period from June 30, 2005 (inception) to October 31, 2005 | | | |
| |
| |
| The accompanying notes to the financial statements are an integral part of this statement. | |
|
| |
| 216 | | | |
| Thrivent Mutual Funds | | |
| Statement of Operations | | |
| |
| | Partner | Partner | | | | Partner |
| Technology | Small Cap | Small Cap | Small Cap | Small Cap | Mid Cap | Mid Cap |
| Fund | Growth Fund(a) | Value Fund | Stock Fund | Index Fund | Growth Fund | Value Fund(a) |
|
| $559,812 | $12,010 | $1,188,066 | $3,900,129 | $487,973 | $1,666,435 | $34,779 |
| 3,623 | 4,586 | 225 | 13,008 | 867 | 457 | 3,195 |
| 12,146 | 888 | 37,457 | 165,438 | 19,498 | 94,984 | 48 |
| (8,780) | -- | -- | (6,305) | (169) | (1,544) | -- |
| 566,801 | 17,484 | 1,225,748 | 4,072,270 | 508,169 | 1,760,332 | 38,022 |
|
| 377,620 | 12,817 | 94,509 | 3,174,941 | 109,710 | 1,286,376 | 5,714 |
| -- | 22,696 | 567,052 | -- | -- | -- | 11,428 |
| 18,292 | 7,287 | 20,083 | 43,677 | 21,063 | 45,717 | 6,995 |
| 10,070 | 789 | 18,902 | 94,613 | 8,777 | 63,507 | 457 |
| -- | 9,971 | -- | -- | -- | -- | 9,860 |
| 6,038 | 13,031 | 13,299 | 34,776 | 21,029 | 21,945 | 11,610 |
| 109,197 | 7,886 | 182,780 | 1,089,771 | 109,710 | 664,836 | 4,156 |
| 38,675 | -- | 55,980 | 235,419 | -- | 410,278 | -- |
| 4,933 | 1,208 | 5,235 | 8,855 | 4,808 | 7,541 | 1,200 |
| 111,588 | 225 | 100,160 | 453,546 | 54,123 | 416,839 | 315 |
| 12,695 | -- | 10,959 | 35,253 | -- | 99,573 | -- |
| 56 | 53 | 185 | 464 | -- | 430 | 53 |
| 255,542 | 294 | 237,025 | 1,089,273 | 144,665 | 1,029,598 | 725 |
| 31,252 | -- | 27,874 | 108,230 | -- | 293,765 | -- |
| 88 | 26 | 166 | 604 | -- | 1,196 | 26 |
| 17,752 | 15,687 | 17,777 | 23,106 | 17,752 | 37,922 | 14,495 |
| 30,320 | 13 | 40,246 | 50,302 | 16,225 | 46,122 | 8 |
| 3,001 | 905 | 4,213 | 16,244 | 2,670 | 9,945 | 905 |
| 8,339 | 1,053 | 8,190 | 11,105 | 7,274 | 10,025 | 1,051 |
| 1,035,458 | 93,941 | 1,404,635 | 6,470,179 | 517,806 | 4,445,615 | 68,998 |
|
| (264,505) | (32,024) | (482,939) | (91,661) | (100,903) | (84,663) | (34,975) |
| (10) | (1,826) | (178) | (204) | (208) | (149) | (368) |
| 770,943 | 60,091 | 921,518 | 6,378,314 | 416,695 | 4,360,803 | 33,655 |
|
| (204,142) | (42,607) | 304,230 | (2,306,044) | 91,474 | (2,600,471) | 4,367 |
|
| |
| |
| 3,037,134 | (167,307) | 5,903,646 | 57,043,987 | 672,186 | 31,965,595 | (24,740) |
| -- | -- | -- | -- | 192,869 | -- | -- |
| |
| 220,131 | 482,729 | 3,886,120 | 5,093,689 | 4,472,524 | 12,770,569 | 56,762 |
| -- | -- | -- | -- | (48,603) | -- | -- |
| 3,257,265 | 315,422 | 9,789,766 | 62,137,676 | 5,288,976 | 44,736,164 | 32,022 |
| |
| $3,053,123 | $272,815 | $10,093,996 | $59,831,632 | $5,380,450 | $42,135,693 | $36,389 |
|
| | | | | | |
The accompanying notes to the financial statements are an integral part of this statement. |
|
217
| Thrivent Mutual Funds | | |
| Statement of Operations – continued | | |
| |
| |
| | | | | Partner |
| | Mid Cap | Mid Cap | Mid Cap | International |
| For the Year Ended October 31, 2005 | Stock Fund | Index Fund | Index Fund-I | Stock Fund |
|
| Investment Income | | | | |
| Dividends | $10,708,109 | $856,940 | $288,688 | $8,490,328 |
| Taxable interest | 348,242 | 471 | 4,245 | 172,195 |
| Income from mortgage dollar rolls | -- | -- | -- | -- |
| Income from securities loaned | 245,050 | 26,356 | 2,759 | 255,607 |
| Foreign dividend tax withholding | (20,168) | -- | -- | (713,936) |
| Total Investment Income | 11,281,233 | 883,767 | 295,692 | 8,204,194 |
|
| Expenses | | | | |
| Adviser fees | 6,275,088 | 145,884 | 49,243 | 464,916 |
| Sub-Adviser fees | -- | -- | -- | 1,516,232 |
| Accounting and pricing fees | 84,184 | 19,448 | 15,580 | 93,965 |
| Administrative service fees | 190,034 | 11,671 | 3,939 | 65,205 |
| Custody fees | 26,235 | 17,741 | 23,141 | 204,118 |
| Distribution expenses Class A | 2,218,927 | 145,884 | -- | 713,151 |
| Distribution expenses Class B | 261,371 | -- | -- | 181,937 |
| Insurance expenses | 13,416 | 4,958 | 4,629 | 7,356 |
| Printing and postage expenses Class A | 600,986 | 50,749 | -- | 268,588 |
| Printing and postage expenses Class B | 33,818 | -- | -- | 33,110 |
| Printing and postage expenses Class I | 464 | -- | 307 | 447 |
| Transfer agent fees Class A | 1,705,361 | 180,491 | -- | 1,002,760 |
| Transfer agent fees Class B | 119,603 | -- | -- | 126,348 |
| Transfer agent fees Class I | 710 | -- | 459 | 761 |
| Audit and legal fees | 28,422 | 17,752 | 17,763 | 37,535 |
| SEC and state registration expenses | 68,636 | 17,229 | 14,673 | 49,499 |
| Trustees’ fees | 30,712 | 2,920 | 2,000 | 11,915 |
| Other expenses | 14,013 | 7,336 | 7,201 | 9,008 |
| Total Expenses Before Reimbursement | 11,671,980 | 622,063 | 138,935 | 4,786,851 |
|
| Less: | | | | |
| Reimbursement from adviser | (116,321) | (98,558) | (1,608) | (21,810) |
| Custody earnings credit | (70) | (194) | (81) | (836) |
| Total Net Expenses | 11,555,589 | 523,311 | 137,246 | 4,764,205 |
|
| Net Investment Income/(Loss) | (274,356) | 360,456 | 158,446 | 3,439,989 |
|
| Realized and Unrealized Gains/(Losses) on | | | | |
| Investments and Foreign Currency Transactions | | | | |
| Net realized gains/(losses) on: | | | | |
| Investments | 134,136,943 | 3,732,411 | 1,338,176 | 13,023,132 |
| Written option contracts | -- | -- | -- | -- |
| Futures contracts | -- | 232,117 | 120,758 | -- |
| Foreign currency transactions | -- | -- | -- | (193,395) |
| Change in net unrealized appreciation/(depreciation) on: | | | | |
| Investments | 45,435,232 | 4,391,973 | 1,360,348 | 30,276,003 |
| Written option contracts | -- | -- | -- | -- |
| Futures contracts | -- | (42,681) | (12,031) | -- |
| Foreign currency forward contracts | -- | -- | -- | (463) |
| Foreign currency transactions | -- | -- | -- | (37,928) |
| Net Realized and Unrealized Gains/(Losses) on | | | | |
| Investments and Foreign Currency Transactions | 179,572,175 | 8,313,820 | 2,807,251 | 43,067,349 |
| |
| Net Increase/(Decrease) in Net Assets Resulting | | | | |
| From Operations | $179,297,819 | $8,674,276 | $2,965,697 | $46,507,338 |
|
| The accompanying notes to the financial statements are an integral part of this statement. | |
|
| |
| 218 | | | |
| Thrivent Mutual Funds | | |
| Statement of Operations – continued | | |
| |
| |
| |
| Large Cap | Large Cap | Large Cap | Large Cap | Large Cap | Balanced | High Yield |
| Growth Fund | Value Fund | Stock Fund | Index Fund | Index Fund-I | Fund | Fund |
|
| |
| $1,744,556 | $8,031,959 | $68,193,990 | $1,885,113 | $670,542 | $4,850,011 | $1,496,153 |
| 4 | 12,372 | 3,615,021 | 377 | -- | 5,397,948 | 50,763,341 |
| -- | -- | -- | -- | -- | 595,273 | -- |
| 16,086 | 25,307 | 103,738 | 6,247 | 1,576 | 122,334 | 221,446 |
| (6,075) | (73,329) | (32,612) | -- | -- | (7,160) | -- |
| 1,754,571 | 7,996,309 | 71,880,137 | 1,891,737 | 672,118 | 10,958,406 | 52,480,940 |
|
| 1,045,753 | 1,653,233 | 18,985,434 | 226,679 | 79,352 | 2,232,960 | 2,459,162 |
| -- | -- | -- | -- | -- | -- | -- |
| 33,242 | 47,089 | 299,699 | 25,674 | 19,132 | 50,930 | 87,383 |
| 27,887 | 73,477 | 743,797 | 18,134 | 6,348 | 81,199 | 126,238 |
| 31,157 | 15,260 | 62,482 | 20,816 | 8,929 | 26,112 | 13,217 |
| 282,368 | 798,366 | 8,716,455 | 226,679 | -- | 713,425 | 1,480,250 |
| 170,490 | 184,655 | 1,078,569 | -- | -- | 154,142 | 281,040 |
| 5,611 | 7,888 | 42,775 | 5,238 | 4,760 | 8,658 | 11,078 |
| 129,738 | 199,317 | 1,924,377 | 58,820 | -- | 151,965 | 266,692 |
| 37,106 | 29,190 | 157,144 | -- | -- | 14,961 | 28,083 |
| 270 | 471 | 1,471 | -- | 226 | 166 | 1,176 |
| 485,747 | 673,801 | 5,275,209 | 215,929 | -- | 486,995 | 844,856 |
| 128,463 | 101,393 | 563,105 | -- | -- | 50,730 | 103,018 |
| 447 | 668 | 2,415 | -- | 389 | 216 | 1,707 |
| 32,701 | 36,480 | 78,577 | 17,752 | 17,763 | 23,063 | 28,148 |
| 44,651 | 48,955 | 141,206 | 22,766 | 15,228 | 49,822 | 57,671 |
| 5,674 | 13,462 | 116,039 | 3,889 | 2,591 | 15,079 | 18,178 |
| 8,773 | 10,533 | 35,045 | 7,442 | 7,232 | 10,957 | 10,009 |
| 2,470,078 | 3,894,238 | 38,223,799 | 849,818 | 161,950 | 4,071,380 | 5,817,906 |
|
| (1,129,074) | (42,410) | (471,237) | (305,910) | (1,850) | (85,374) | (130,636) |
| (18) | (80) | (1,606) | (76) | (20) | (682) | (5,080) |
| 1,340,986 | 3,851,748 | 37,750,956 | 543,832 | 160,080 | 3,985,324 | 5,682,190 |
|
| 413,585 | 4,144,561 | 34,129,181 | 1,347,905 | 512,038 | 6,973,082 | 46,798,750 |
|
|
|
| 9,003,137 | 22,216,587 | 123,150,939 | 877,706 | 911,105 | 8,810,635 | 7,625,983 |
| 24,309 | -- | -- | -- | -- | 64,682 | -- |
| -- | -- | -- | 89,515 | 11,100 | 317,695 | -- |
| -- | -- | -- | -- | -- | -- | -- |
| |
| 3,510,871 | 9,200,693 | 165,489,675 | 4,418,451 | 1,069,786 | 10,223,472 | (32,637,681) |
| 1,717 | -- | -- | -- | -- | -- | -- |
| -- | -- | -- | (41,943) | (7,996) | 30,318 | -- |
| -- | -- | -- | -- | -- | -- | -- |
| -- | -- | -- | -- | -- | -- | -- |
| | | | | | |
| 12,540,034 | 31,417,280 | 288,640,614 | 5,343,729 | 1,983,995 | 19,446,802 | (25,011,698) |
| |
| $12,953,619 | $35,561,841 | $322,769,795 | $6,691,634 | $2,496,033 | $26,419,884 | $21,787,052 |
|
| The accompanying notes to the financial statements are an integral part of this statement. | |
|
| |
| 219 | | | |
| Thrivent Mutual Funds | | |
| Statement of Operations – continued | | |
| |
| | High Yield | Municipal | Income | Core Bond |
| For the Year Ended October 31, 2005 | Fund II | Bond Fund | Fund | Fund |
|
| Investment Income | | | | |
| Dividends | $218,002 | $-- | $713,034 | $612,726 |
| Taxable interest | 11,029,787 | 433,663 | 28,923,044 | 20,598,806 |
| Tax exempt interest | -- | 65,474,470 | 25,694 | -- |
| Income from mortgage dollar rolls | -- | -- | 1,083,252 | 2,168,273 |
| Income from securities loaned | 58,811 | -- | 86,249 | 116,375 |
| Total Investment Income | 11,306,600 | 65,908,133 | 30,831,273 | 23,496,180 |
|
| Expenses | | | | |
| Adviser fees | 782,416 | 5,284,435 | 2,123,019 | 2,225,839 |
| Accounting and pricing fees | 38,485 | 186,873 | 77,926 | 63,129 |
| Administrative service fees | 28,451 | 259,111 | 122,955 | 98,939 |
| Custody fees | 8,676 | 17,954 | 17,975 | 19,320 |
| Distribution expenses Class A | 333,119 | 3,147,634 | 1,395,129 | 1,112,955 |
| Distribution expenses Class B | 48,685 | 313,445 | 221,328 | 120,108 |
| Insurance expenses | 5,965 | 18,106 | 11,070 | 9,769 |
| Printing and postage expenses Class A | 59,401 | 220,164 | 212,096 | 155,135 |
| Printing and postage expenses Class B | 4,748 | 11,943 | 23,790 | 9,952 |
| Printing and postage expenses Class I | 250 | 289 | 1,410 | 644 |
| Transfer agent fees Class A | 229,434 | 622,910 | 696,275 | 633,504 |
| Transfer agent fees Class B | 17,617 | 32,468 | 94,759 | 40,543 |
| Transfer agent fees Class I | 272 | 575 | 2,011 | 1,281 |
| Audit and legal fees | 18,331 | 49,313 | 27,520 | 24,669 |
| SEC and state registration expenses | 40,802 | 75,715 | 53,461 | 51,181 |
| Trustees’ fees | 7,133 | 39,633 | 17,830 | 18,210 |
| Other expenses | 6,951 | 15,449 | 10,320 | 9,306 |
| Total Expenses Before Reimbursement | 1,630,736 | 10,296,017 | 5,108,874 | 4,594,484 |
|
| Less: | | | | |
| Reimbursement from adviser | (243,756) | (40,826) | (155,689) | (108,200) |
| Custody earnings credit | (1,209) | (1,775) | (1,385) | (976) |
| Total Net Expenses | 1,385,771 | 10,253,416 | 4,951,800 | 4,485,308 |
|
| Net Investment Income/(Loss) | 9,920,829 | 55,654,717 | 25,879,473 | 19,010,872 |
|
| Realized and Unrealized Gains/(Losses) on | | | | |
| Investments and Foreign Currency Transactions | | | | |
| Net realized gains/(losses) on: | | | | |
| Investments | 1,009,632 | 1,725,755 | 4,958,463 | 36,223 |
| Written option contracts | -- | -- | 193,543 | 237,429 |
| Futures contracts | -- | 187,077 | 459,013 | 1,318,169 |
| Change in net unrealized appreciation/(depreciation) on: | | | | |
| Investments | (6,912,651) | (30,369,797) | (26,850,225) | (18,539,668) |
| Futures contracts | -- | 602,136 | 281,386 | (355,503) |
Net Realized and Unrealized Gains/(Losses) on | | | | |
| Investments and Foreign Currency Transactions | (5,903,019) | (27,854,829) | (20,957,820) | (17,303,350) |
| |
| Net Increase/(Decrease) in Net Assets Resulting | | | | |
| From Operations | $4,017,810 | $27,799,888 | $4,921,653 | $1,707,522 |
|
| |
| The accompanying notes to the financial statements are an integral part of this statement. | |
|
| |
| 220 | | | |
Thrivent Mutual Funds
Statement of Operations – continued
| Limited | |
| Maturity | Money Market |
| Bond Fund | Fund |
|
| |
| $178,595 | $180,167 |
| 5,287,920 | 26,277,689 |
| 60,162 | 692,965 |
| 405,754 | -- |
| 17,158 | -- |
| 5,949,589 | 27,150,821 |
|
| 433,361 | 4,110,828 |
| 27,781 | 88,590 |
| 28,891 | 184,905 |
| 13,132 | 23,685 |
| 323,728 | 827,854 |
| 5,141 | 18,808 |
| 5,806 | 13,523 |
| 59,927 | 508,966 |
| 1,184 | 2,384 |
| 496 | 2,361 |
| 226,214 | 1,583,498 |
| 4,404 | 9,626 |
| 811 | 2,060 |
| 19,691 | 43,672 |
| 45,901 | 115,419 |
| 5,349 | 30,715 |
| 6,700 | 12,339 |
| 1,208,517 | 7,579,233 |
|
| (21,035) | (942,265) |
| (304) | (472) |
| 1,187,178 | 6,636,496 |
|
| 4,762,411 | 20,514,325 |
|
| |
| |
| (919,586) | -- |
| 28,995 | -- |
| 144,455 | -- |
| |
| (2,998,476) | -- |
| 294,551 | -- |
(3,450,061) | -- |
| |
| $1,312,350 | $20,514,325 |
|
|
| The accompanying notes to the financial statements are an integral part of this statement. |
|
|
221
| Thrivent Mutual Funds | | | |
| Statement of Changes in Net Assets | | |
| |
| |
| | | Aggressive Allocation | | Moderately Aggressive | |
| | | Fund | | Allocation Fund | |
| | | ------------------------------------ | | ---------------------------------------- | |
| For the periods ended | | 10/31/2005(a) | | 10/31/2005(a) | |
|
| Operations | | | | | |
| Net investment income/(loss) | | $(23,129) | | $43,934 | |
| Net realized gains/(losses) on: | | | | | |
| Investments | | (843) | | (3,347) | |
| Change in net unrealized appreciation/(depreciation) on: | | | |
| Investments | | 198,437 | | 174,193 | |
| Net Change in Net Assets Resulting | | | | | |
| From Operations | | 174,465 | | 214,780 | |
|
| Distributions to Shareholders | | | | | |
| From net investment income | | -- | | -- | |
| Total Distributions to Shareholders | | -- | | -- | |
| Capital Stock Transactions | | 29,230,163 | | 65,677,607 | |
|
| Net Increase/(Decrease) in Net Assets | | 29,404,628 | | 65,892,387 | |
| Net Assets, Beginning of Period | | -- | | -- | |
| Net Assets, End of Period | | $29,404,628 | | $65,892,387 | |
|
| | | Partner Small Cap | | Partner Small Cap | |
| | | Growth Fund | | Value Fund | |
| | | ---------------------------------- | ---------------------------------------------------------------------------------------------------------------------- |
| For the periods ended | | 10/31/2005(a) | 10/31/2005 | 10/31/2004 | 4/30/2004 |
|
| Operations | | | | | |
| Net investment income/(loss) | | $(42,607) | $304,230 | $46,021 | $(217,571) |
| Net realized gains/(losses) on: | | | | | |
| Investments | | (167,307) | 5,903,646 | 11,568,791 | 6,913,295 |
| Futures contracts | | -- | -- | -- | -- |
| Change in net unrealized appreciation/(depreciation) on: | | | |
| Investments | | 482,729 | 3,886,120 | (6,157,476) | 10,278,285 |
| Futures contracts | | -- | -- | -- | -- |
| |
| Net Change in Net Assets Resulting | | | | | |
| From Operations | | 272,815 | 10,093,996 | 5,457,336 | 16,974,009 |
|
| Distributions to Shareholders | | | | | |
| From net investment income | | -- | (121,714) | -- | -- |
| From net realized gains | | -- | (10,871,080) | (1,649,048) | -- |
| | | | | |
| Distributions to Shareholders | | -- | (10,992,794) | (1,649,048) | -- |
| Capital Stock Transactions | | 13,376,735 | 17,168,894 | 9,599,488 | 15,224,395 |
|
| Net Increase/(Decrease) in Net Assets | | 13,649,550 | 16,270,096 | 13,407,776 | 32,198,404 |
| Net Assets, Beginning of Period | | -- | 80,049,618 | 66,641,842 | 34,443,438 |
| Net Assets, End of Period | | $13,649,550 | $96,319,714 | $80,049,618 | $66,641,842 |
|
| (a) Since fund inception, June 30, 2005 | | | | | |
| |
| |
| |
| The accompanying notes to the financial statements are an integral part of this statement. | |
|
| |
| 222 | | | |
| Thrivent Mutual Funds | | |
| Statement of Changes in Net Assets – continued | |
| |
| Moderate Allocation | | Moderately Conservative | | Technology | |
| Fund | | | Allocation Fund | | Fund | |
| ---------------------------------------- | | ---------------------------------------- | ------------------------------------------------------------------------------------------------------------------------------ |
| 10/31/2005(a) | | | 10/31/2005(a) | 10/31/2005 | 10/31/2004 | 4/30/2004 |
|
| $151,115 | | | $106,576 | $(204,142) | $(321,149) | $(473,618) |
| (4,288) | | | (855) | 3,037,134 | (700,853) | (122,595) |
| 35,253 | | | (45,157) | 220,131 | 2,256,689 | 10,037,498 |
|
| |
| 182,080 | | | 60,564 | 3,053,123 | 1,234,687 | 9,441,285 |
|
| (85,097) | | | (54,808) | -- | -- | -- |
| (85,097) | | | (54,808) | -- | -- | -- |
| 78,940,799 | | | 33,669,276 | (3,765,081) | 2,667 | 4,685,272 |
|
| 79,037,782 | | | 33,675,032 | (711,958) | 1,237,354 | 14,126,557 |
| -- | | | -- | 49,477,297 | 48,239,943 | 34,113,386 |
| $79,037,782 | | | $33,675,032 | $48,765,339 | $49,477,297 | $48,239,943 |
|
| | | | | |
| | Small Cap | | | Small Cap | |
| | Stock Fund | | | Index Fund | |
| -------------------------------------------------------------------------------------------------------------------------------- | ------------------------------------------------------------------------------------------------------------------------------- |
| 10/31/2005 | 10/31/2004 | 4/30/2004 | 10/31/2005 | 10/31/2004 | 4/30/2004 |
|
| |
| $(2,306,044) | $(1,139,098) | $(2,878,050) | $91,474 | $69,417 | $(70,412) |
| 57,043,987 | 18,480,995 | 57,134,227 | 672,186 | 180,649 | 1,339,184 |
| -- | -- | -- | 192,869 | (28,682) | 275,314 |
| 5,093,689 | 6,630,233 | 68,283,187 | 4,472,524 | 2,155,228 | 7,581,438 |
| -- | -- | -- | (48,603) | 83,020 | (71,365) |
| |
| 59,831,632 | 23,972,130 | 122,539,364 | 5,380,450 | 2,459,632 | 9,054,159 |
|
| -- | -- | -- | (69,683) | -- | -- |
| (21,956,221) | (24,140,171) | -- | (276,597) | (1,238,820) | (116,288) |
| (21,956,221) | (24,140,171) | -- | (346,280) | (1,238,820) | (116,288) |
| 10,272,248 | 18,416,279 | (1,267,655) | 6,517,175 | (4,657,134) | 7,157,605 |
|
| 48,147,659 | 18,248,238 | 121,271,709 | 11,551,345 | (3,436,322) | 16,095,476 |
| 434,054,773 | 415,806,535 | 294,534,826 | 35,381,233 | 38,817,555 | 22,722,079 |
| $482,202,432 | $434,054,773 | $415,806,535 | $46,932,578 | $35,381,233 | $38,817,555 |
|
The accompanying notes to the financial statements are an integral part of this statement. |
223
| Thrivent Mutual Funds | | | |
| Statement of Changes in Net Assets – continued | | |
| |
| |
| | Mid Cap | | Partner Mid Cap |
| | Growth Fund | | Value Fund |
| | ------------------------------------------------------------------------------- | | ---------------------------------------- |
| For the periods ended | 10/31/2005 | 10/31/2004 | | 10/31/2005(a) |
|
| Operations | | | | |
| Net investment income/(loss) | $(2,600,471) | $(2,236,814) | | $4,367 |
| Net realized gains/(losses) on: | | | | |
| Investments | 31,965,595 | 19,790,800 | | (24,740) |
| Futures contracts | -- | -- | | -- |
| Change in net unrealized appreciation/(depreciation) on: | | | | |
| Investments | 12,770,569 | (4,373,665) | | 56,762 |
| Futures contracts | -- | -- | | -- |
| |
| Net Change in Net Assets Resulting | | | | |
| From Operations | 42,135,693 | 13,180,321 | | 36,389 |
|
| Distributions to Shareholders | | | | |
| From net investment income | -- | -- | | --- |
| From net realized gains | -- | -- | | --- |
| | | | |
| Total Distributions to Shareholders | -- | -- | | -- |
| Capital Stock Transactions | (31,100,335) | 135,052,295 | | 8,710,986 |
|
| Net Increase/(Decrease) in Net Assets | 11,035,358 | 148,232,616 | | 8,747,375 |
| Net Assets, Beginning of Period | 305,841,194 | 157,608,578 | | -- |
| Net Assets, End of Period | $316,876,552 | $305,841,194 | | $8,747,375 |
|
| | | Mid Cap | | |
| | | Index Fund-I | | |
| | -------------------------------------------------------------------------------------------------------------------------------- |
| For the periods ended | 10/31/2005 | 10/31/2004 | 4/30/2004 |
|
| Operations | | | | |
| Net investment income/(loss) | $158,446 | $44,578 | $187,304 |
| Net realized gains/(losses) on: | | | | |
| Investments | 1,338,176 | 677,677 | 506,682 |
| Written option contracts | -- | -- | -- |
| Futures contracts | 120,758 | (84,037) | 331,186 |
| Foreign currency transactions | -- | -- | -- |
| Change in net unrealized appreciation/(depreciation) on: | | | | |
| Investments | 1,360,348 | (102,653) | 6,378,198 |
| Written option contracts | -- | -- | -- |
| Futures contracts | (12,031) | 62,055 | (79,901) |
| Foreign currency forward contracts | -- | -- | -- |
| Foreign currency transactions | -- | -- | -- |
| |
| Net Change in Net Assets Resulting | | | | |
| From Operations | 2,965,697 | 597,620 | 7,323,469 |
|
| Distributions to Shareholders | | | | |
| From net investment income | (141,843) | -- | (154,805) |
| From net realized gains | (571,863) | (467,289) | (157,900) |
| Distributions to Shareholders | (713,706) | (467,289) | (312,705) |
|
| Capital Stock Transactions | 3,525,917 | (14,551,273) | 3,952,019 |
|
| Net Increase/(Decrease) in Net Assets | 5,777,908 | (14,420,942) | 10,962,783 |
| Net Assets, Beginning of Period | 17,304,091 | 31,725,033 | 20,762,250 |
| Net Assets, End of Period | $23,081,999 | $17,304,091 | $31,725,033 |
|
(a) Since fund inception, June 30, 2005
The accompanying notes to the financial statements are an integral part of this statement.
224
| Thrivent Mutual Funds | | |
| Statement of Changes in Net Assets – continued | |
| |
| | Mid Cap | | | | Mid Cap | |
| | Stock Fund | | | | Index Fund | |
| ---------------------------------------------------------------------------------------------------------------------------- | | ----------------------------------------------------------------------------------------------------------------------------- |
| 10/31/2005 | 10/31/2004 | 4/30/2004 | | 10/31/2005 | 10/31/2004 | 4/30/2004 |
|
| |
| $(274,356) | $(1,363,418) | $(3,091,481) | | $360,456 | $54,385 | $10,879 |
| 134,136,943 | 21,612,698 | 101,122,677 | | 3,732,411 | 1,353,353 | (1,285,672) |
| -- | -- | -- | | 232,117 | (58,153) | 340,280 |
| 45,435,232 | 25,354,479 | 103,766,562 | | 4,391,973 | 156,219 | 10,510,433 |
| -- | -- | -- | | (42,681) | 91,365 | (117,845) |
| |
| 179,297,819 | 45,603,759 | 201,797,758 | | 8,674,276 | 1,597,169 | 9,458,075 |
|
| -- | -- | -- | | (108,546) | (6,127) | -- |
| -- | -- | -- | | (213,705) | -- | -- |
|
| -- | -- | -- | | (322,251) | (6,127) | -- |
| | | | | | |
| (42,263,790) | (25,032,465) | (43,982,250) | | 4,892,420 | 3,710,149 | 2,482,345 |
|
| 137,034,029 | 20,571,294 | 157,815,508 | | 13,244,445 | 5,301,191 | 11,940,420 |
| 865,682,468 | 845,111,174 | 687,295,666 | | 49,201,648 | 43,900,457 | 31,960,037 |
| $1,002,716,497 | $865,682,468 | $845,111,174 | | $62,446,093 | $49,201,648 | $43,900,457 |
|
| | | |
| Partner International | | Large Cap | Large Cap |
| Stock Fund | | Growth Fund | Value Fund |
| ------------------------------------------------------------------- | | ---------------------------------------------------------------------- | ---------------------------------------------------------------------- |
| 10/31/2005 | 10/31/2004 | | 10/31/2005 | 10/31/2004 | 10/31/2005 | 10/31/2004 |
|
| |
| $3,439,989 | $372,965 | | $413,585 | $160,019 | $4,144,561 | $1,251,638 |
| 13,023,132 | 13,990,559 | | 9,003,137 | 5,125,171 | 22,216,587 | 9,791,413 |
| -- | -- | | 24,309 | (1,234) | -- | -- |
| -- | -- | | -- | -- | -- | -- |
| (193,395) | (301,535) | | -- | -- | -- | -- |
| 30,276,003 | 15,758,984 | | 3,510,871 | 915,659 | 9,200,693 | 34,221,215 |
| -- | -- | | 1,717 | (254) | -- | -- |
| -- | -- | | -- | -- | -- | -- |
| (463) | 32 | | -- | -- | -- | -- |
| (37,928) | 24,368 | | -- | -- | -- | -- |
| |
| 46,507,338 | 29,845,373 | | 12,953,619 | 6,199,361 | 35,561,841 | 45,264,266 |
|
| (70,182) | (443,729) | | (48,823) | (174,138) | (1,412,596) | (593,663) |
| -- | -- | | -- | -- | -- | -- |
|
| (70,182) | (443,729) | | (48,823) | (174,138) | (1,412,596) | (593,663) |
| 59,168,144 | 166,050,634 | | 54,917,459 | 62,352,317 | 22,956,913 | 243,757,165 |
|
| 105,605,300 | 195,452,278 | | 67,822,255 | 68,377,540 | 57,106,158 | 288,427,768 |
| 276,350,952 | 80,898,674 | | 110,199,876 | 41,822,336 | 329,068,518 | 40,640,750 |
| $381,956,252 | $276,350,952 | | $178,022,131 | $110,199,876 | $386,174,676 | $329,068,518 |
|
The accompanying notes to the financial statements are an integral part of this statement.
225
| Thrivent Mutual Funds | | |
| Statement of Changes in Net Assets – continued | |
| |
| |
| | | Large Cap | |
| | | Stock Fund | |
| | -------------------------------------------------------------------------------------------------------------------------------------------------- |
| For the periods ended | 10/31/2005 | 10/31/2004 | 4/30/2004 |
|
| Operations | | | |
| Net investment income/(loss) | $34,129,181 | $6,573,127 | $10,386,310 |
| Net realized gains/(losses) on: | | | |
| Investments | 123,150,939 | 286,553,358 | 219,961,752 |
| Futures contracts | -- | -- | -- |
| Change in net unrealized appreciation/(depreciation) on: | | | |
| Investments | 165,489,675 | (236,804,674) | 180,157,821 |
| Futures contracts | -- | -- | -- |
|
| |
| Net Change in Net Assets Resulting | | | |
| From Operations | 322,769,795 | 56,321,811 | 410,505,883 |
|
| Distributions to Shareholders | | | |
| From net investment income | (22,365,685) | (3,389,488) | (10,819,813) |
| From net realized gains | -- | (542,690,797) | -- |
|
| Total Distributions to Shareholders | (22,365,685) | (546,080,285) | (10,819,813) |
| Capital Stock Transactions | (400,968,665) | 1,192,614,013 | (179,757,383) |
|
| Net Increase/(Decrease) in Net Assets | (100,564,555) | 702,855,539 | 219,928,687 |
| Net Assets, Beginning of Period | 3,670,355,306 | 2,967,499,767 | 2,747,571,080 |
| Net Assets, End of Period | $3,569,790,751 | $3,670,355,306 | $2,967,499,767 |
|
| | | Balanced | |
| | | Fund | |
| | --------------------------------------------------------------------------------------------------------------------------------------- |
| For the periods ended | 10/31/2005 | 10/31/2004 | 4/30/2004 |
|
| Operations | | | |
| Net investment income/(loss) | $6,973,082 | $3,188,375 | $6,411,193 |
| Net realized gains/(losses) on: | | | |
| Investments | 8,810,635 | 15,642,140 | 8,335,406 |
| Written option contracts | 64,682 | -- | -- |
| Futures contracts | 317,695 | -- | -- |
| Foreign currency transactions | -- | -- | -- |
| Change in net unrealized appreciation/(depreciation) on: | | | |
| Investments | 10,223,472 | (9,983,878) | 24,974,274 |
| Futures contracts | 30,318 | -- | -- |
|
| |
| Net Change in Net Assets Resulting | | | |
| From Operations | 26,419,884 | 8,846,637 | 39,720,873 |
| |
| Distributions to Shareholders | | | |
| From net investment income | (7,582,902) | (3,487,872) | (7,235,059) |
| From net realized gains | (6,139,893) | -- | -- |
|
| Distributions to Shareholders | (13,722,795) | (3,487,872) | (7,235,059) |
| Capital Stock Transactions | (29,421,278) | (8,558,260) | (12,720,369) |
|
| Net Increase/(Decrease) in Net Assets | (16,724,189) | (3,199,495) | 19,765,445 |
| Net Assets, Beginning of Period | 404,544,257 | 407,743,752 | 387,978,307 |
| Net Assets, End of Period | $387,820,068 | $404,544,257 | $407,743,752 |
|
The accompanying notes to the financial statements are an integral part of this statement.
226
| Thrivent Mutual Funds | | |
| Statement of Changes in Net Assets – continued | |
| |
| | Large Cap | | | Large Cap | |
| | Index Fund | | | Index Fund-I | |
| --------------------------------------------------------------------------------------------------------------------------- | ------------------------------------------------------------------------------------------------------------------------------------------------------------ |
| 10/31/2005 | 10/31/2004 | 4/30/2004 | 10/31/2005 | 10/31/2004 | 4/30/2004 |
|
| $1,347,905 | $389,002 | $503,434 | $512,038 | $176,641 | $345,673 |
| 877,706 | 492,596 | 246,671 | 911,105 | 245,771 | (6,745,287) |
| 89,515 | 19,391 | 286,596 | 11,100 | (29,293) | 349,276 |
| 4,418,451 | 904,766 | 6,407,598 | 1,069,786 | 358,709 | 12,547,918 |
| (41,943) | 54,931 | (109,107) | (7,996) | 20,698 | (158,007) |
| |
| 6,691,634 | 1,860,686 | 7,335,192 | 2,496,033 | 772,526 | 6,339,573 |
|
| (794,013) | (188,833) | (450,406) | (457,553) | -- | (515,759) |
| -- | -- | -- | -- | -- | -- |
|
| (794,013) | (188,833) | (450,406) | (457,553) | -- | (515,759) |
| 12,105,671 | 17,156,773 | 19,470,000 | 10,348 | (60,297) | (39,171,034) |
|
| 18,003,292 | 18,828,626 | 26,354,786 | 2,048,828 | 712,229 | (33,347,220) |
| 76,342,237 | 57,513,611 | 31,158,825 | 29,431,534 | 28,719,305 | 62,066,525 |
| $94,345,529 | $76,342,237 | $57,513,611 | $31,480,362 | $29,431,534 | $28,719,305 |
|
| | | | | |
| High Yield | | | High Yield | |
| Fund | | | Fund II | |
| --------------------------------------------------------------------------- | | ------------------------------------------------------------------------------------------------------------------------------------------------------------------- |
| 10/31/2005 | 10/31/2004 | | 10/31/2005 | 10/31/2004 | 4/30/2004 |
|
| $46,798,750 | $49,088,055 | | $9,920,829 | $4,942,828 | $9,535,903 |
| 7,625,983 | (11,835,388) | | 1,009,632 | (149,174) | 6,892,386 |
| -- | -- | | -- | -- | -- |
| -- | -- | | -- | -- | -- |
| -- | 191 | | -- | -- | -- |
| (32,637,681) | 31,248,076 | | (6,912,651) | 4,209,626 | (1,159,062) |
| -- | -- | | -- | -- | -- |
| |
| 21,787,052 | 68,500,934 | | 4,017,810 | 9,003,280 | 15,269,227 |
|
| (47,618,361) | (48,131,067) | | (10,545,623) | (5,153,432) | (9,847,328) |
| -- | -- | | -- | -- | -- |
| | | | | |
| (47,618,361) | (48,131,067) | | (10,545,623) | (5,153,432) | (9,847,328) |
| (18,775,270) | (989,129) | | (9,880,322) | 163,613 | 13,020,493 |
|
| (44,606,579) | 19,380,738 | | (16,408,135) | 4,013,461 | 18,442,392 |
| 646,239,022 | 626,858,284 | | 149,046,743 | 145,033,282 | 126,590,890 |
| $601,632,443 | $646,239,022 | | $132,638,608 | $149,046,743 | $145,033,282 |
|
The accompanying notes to the financial statements are an integral part of this statement.
227
Thrivent Mutual Funds
Statement of Changes in Net Assets – continued
| | Municipal |
| | Bond Fund |
| | ----------------------------------------------------------------------------------------------------- |
| For the periods ended | 10/31/2005 | 10/31/2004 |
|
| Operations | | |
| Net investment income/(loss) | $55,654,717 | $38,240,406 |
| Net realized gains/(losses) on: | | |
| Investments | 1,725,755 | 2,623,814 |
| Written option contracts | -- | -- |
| Futures contracts | 187,077 | (1,917,486) |
| Change in net unrealized appreciation/(depreciation) on: | | |
| Investments | (30,369,797) | 54,200,778 |
| Futures contracts | 602,136 | (602,136) |
| |
| Net Change in Net Assets Resulting | | |
| From Operations | 27,799,888 | 92,545,376 |
|
| Distributions to Shareholders | | |
| From net investment income | (55,956,597) | (38,169,175) |
| From net realized gains | -- | (3,391,003) |
| | |
| Total Distributions to Shareholders | (55,956,597) | (41,560,178) |
| Capital Stock Transactions | 4,526,315 | 583,808,626 |
|
| Net Increase/(Decrease) in Net Assets | (23,630,394) | 634,793,824 |
| Net Assets, Beginning of Period | 1,303,276,052 | 668,482,228 |
| Net Assets, End of Period | $1,279,645,658 | $1,303,276,052 |
|
| | Limited Maturity |
| | Bond Fund |
| | ------------------------------------------------------------------------------------------------ |
| For the periods ended | 10/31/2005 | 10/31/2004 |
|
| Operations | | |
| Net investment income/(loss) | $4,762,411 | $3,350,998 |
| Net realized gains/(losses) on: | | |
| Investments | (919,586) | 637,481 |
| Written option contracts | 28,995 | (8,955) |
| Futures contracts | 144,455 | (396,237) |
| Change in net unrealized appreciation/(depreciation) on: | | |
| Investments | (2,998,476) | (602,983) |
| Futures contracts | 294,551 | -- |
| |
| Net Change in Net Assets Resulting | | |
| From Operations | 1,312,350 | 2,980,304 |
|
| Distributions to Shareholders | | |
| From net investment income | (4,768,571) | (3,321,608) |
| From net realized gains | (309,277) | (1,091,859) |
|
| Distributions to Shareholders | (5,077,848) | (4,413,467) |
| Capital Stock Transactions | 43,175,754 | 21,455,995 |
| Net Increase/(Decrease) in Net Assets | 39,410,256 | 20,022,832 |
|
| Net Assets, Beginning of Period | 131,337,560 | 111,314,728 |
|
| Net Assets, End of Period | $170,747,816 | $131,337,560 |
The accompanying notes to the financial statements are an integral part of this statement.
228
| Thrivent Mutual Funds | | | |
| Statement of Changes in Net Assets – continued | |
| |
| Income | | | Core Bond | |
| Fund | | | Fund | |
| ------------------------------------------ | | ---------------------------------------------------------------------------------------------------------------- |
| 10/31/2005 | 10/31/2004 | | 10/31/2005 | 10/31/2004 | 4/30/2004 |
|
| $25,879,473 | $25,898,825 | | $19,010,872 | $9,725,493 | $20,621,761 |
| 4,958,463 | 12,124,623 | | 36,223 | (356,071) | 10,761,715 |
| 193,543 | 21,701 | | 237,429 | -- | -- |
| 459,013 | (3,338,468) | | 1,318,169 | -- | -- |
| (26,850,225) | (670,321) | | (18,539,668) | 7,999,604 | (16,685,506) |
| 281,386 | 941,051 | | (355,503) | -- | -- |
| |
| 4,921,653 | 34,977,411 | | 1,707,522 | 17,369,026 | 14,697,970 |
|
| (26,177,235) | (25,789,927) | | (20,255,052) | (10,815,460) | (23,322,039) |
| -- | -- | | -- | (493,832) | -- |
| (26,177,235) | (25,789,927) | | (20,255,052) | (11,309,292) | (23,322,039) |
| (10,180,362) | (43,759,117) | | (3,241,410) | (7,810,442) | (51,820,503) |
|
| (31,435,944) | (34,571,633) | | (21,788,940) | (1,750,708) | (60,444,572) |
| 629,611,942 | 664,183,575 | | 506,718,985 | 508,469,693 | 568,914,265 |
| $598,175,998 | $629,611,942 | | $484,930,045 | $506,718,985 | $508,469,693 |
|
| | | | | |
| | Money Market | | | | |
| | Fund | | | | |
| ------------------------------------------------------------------ | | | |
| 10/31/2005 | 10/31/2004 | 4/30/2004 | | | |
| |
| $20,514,325 | $2,376,657 | $1,596,921 | | | |
| -- | -- | -- | | | |
| -- | -- | -- | | | |
| -- | -- | -- | | | |
| -- | -- | -- | | | |
| -- | -- | -- | | | |
| |
| 20,514,325 | 2,376,657 | 1,596,921 | | | |
|
| (20,563,557) | (2,327,425) | (1,596,919) | | | |
| -- | -- | -- | | | |
| (20,563,557) | (2,327,425) | (1,596,919) | | | |
| 10,868,079 | 556,713,345 | (65,252,943) | | | |
|
| 10,818,847 | 556,762,577 | (65,252,941) | | | |
| 935,372,779 | 378,610,202 | 443,863,143 | | | |
| $946,191,626 | $935,372,779 | $378,610,202 | | | |
| |
| |
| The accompanying notes to the financial statements are an integral part of this statement. | |
|
229
THRIVENT MUTUAL FUNDS
NOTES TO FINANCIAL STATEMENTS
October 31, 2005
|
(1) ORGANIZATION
Thrivent Mutual Funds (the “Trust”) was organized as a Massachusetts Business Trust on March 10, 1987, and is registered as an open-end management investment company under the Investment Company Act of 1940. The Trust is divided into thirty separate series (the “Fund(s)”), each with its own investment objective and policies. The Trust currently consists of four allocation funds, eighteen equity funds, seven fixed-income funds, and one money market fund. The Trust commenced operations on July 16, 1987.
Thrivent Real Estate Securities Fund and Thrivent U.S. Government Zero Coupon Target Fund, Series 2006 of the Trust are presented under separate annual reports.
Prior to July 17, 2004, the Trust operated as The AAL Mutual Funds (AAL MF). Pursuant to a Reorganization Agreement and Plan of Reorganization (“Reorganization Agreement”) between The Lutheran Brotherhood Family of Funds (LB FOF) and AAL MF, several Funds of LB FOF merged with and into Funds of AAL MF at the close of business on July 16, 2004. Pursuant to a separate Reorganization Agreement between AAL MF and LB FOF, each of the other Funds of LB FOF merged with and into corresponding newly-created series of AAL MF at the close of business on July 16, 2004. Effective October 31, 2004, the Trust changed its fiscal year end from April 30 to October 31. Below is a table showing the new Thrivent Fund and the legacy fund.
| Thrivent Technology Fund |
| Thrivent Partner Small Cap Value Fund |
| Thrivent Small Cap Stock Fund |
| Thrivent Small Cap Index Fund |
| Thrivent Mid Cap Growth Fund |
| Thrivent Mid Cap Stock Fund |
| Thrivent Mid Cap Index Fund-I |
| Thrivent Mid Cap Index Fund |
| Thrivent Partner International Stock Fund |
| Thrivent Large Cap Growth Fund |
| Thrivent Large Cap Value Fund |
| Thrivent Large Cap Stock Fund |
| Thrivent Large Cap Index Fund-I |
| Thrivent Large Cap Index Fund |
| Thrivent Balanced Fund |
| Thrivent High Yield Fund |
| Thrivent Partner High Yield Fund |
| Thrivent Municipal Bond Fund |
| Thrivent Income Fund |
| Thrivent Core Bond Fund |
| Thrivent Limited Maturity Bond Fund |
| Thrivent Money Market Fund |
| The AAL Technology Stock Fund |
| The AAL Small Cap Value Fund |
| The AAL Small Cap Stock Fund |
| The AAL Small Cap Index Fund II |
| Lutheran Brotherhood Mid Cap Growth Fund1 |
| The AAL Mid Cap Stock Fund |
| The AAL Mid Cap Index Fund |
| The AAL Mid Cap Index Fund II |
| The AAL International Fund2 |
| The AAL Aggressive Growth Fund3 |
| The AAL Equity Income Fund4 |
| The AAL Capital Growth Fund5 |
| The AAL Large Company Index Fund |
| The AAL Large Company Index Fund II |
| The AAL Balanced Fund |
| Lutheran Brotherhood High Yield Fund |
| The AAL High Yield Bond Fund |
| The AAL Municipal Bond Fund6 |
| Lutheran Brotherhood Income Fund |
| The AAL Bond Fund |
| Lutheran Brotherhood Limited Maturity Bond Fund |
| The AAL Money Market Fund7 |
| 1 | Merged with Lutheran Brotherhood Opportunity Growth Fund |
| 2 | Merged with Lutheran Brotherhood World Growth Fund |
| 3 | Merged with Lutheran Brotherhood Growth Fund |
| 4 | Merged with Lutheran Brotherhood Value Fund |
| 5 | Merged with Lutheran Brotherhood Fund |
| 6 | Merged with Lutheran Brotherhood Municipal Bond Fund |
| 7 | Merged with Lutheran Brotherhood Money Market Fund |
230
THRIVENT MUTUAL FUNDS
NOTES TO FINANCIAL STATEMENTS
|
On July 17, 2004 the following Funds acquired through tax free exchanges all of the net assets and net unrealized appreciation or depreciation of the acquired Fund:
| | | Outstanding | | Shares | Unrealized Appreciation/ |
| | | Shares of | Net Assets of | Issued by | (Depreciation) of |
| Acquiring Fund | Acquired Fund | Acquired Fund | Acquired Fund | Acquiring Fund | Acquired Fund |
|
| Mid Cap | LB Opportunity | | | | |
| Growth Fund* | Growth Fund | 15,916,199 | $140,117,176 | 11,545,001 | $2,295,095 |
| Partner International | | | | | |
| Stock Fund Fund | LB World Growth Fund* | 9,576,975 | 86,295,366 | 9,811,582 | 2,683,665 |
| Large Cap Growth Fund | LB Growth Fund* | 4,928,868 | 53,282,955 | 12,348,341 | (893,310) |
| Large Cap Value Fund | LB Value Fund* | 3,752,553 | 50,104,348 | 3,968,919 | 4,555,512 |
| Large Cap Stock Fund* | LB Fund | 44,071,679 | 814,761,994 | 35,283,353 | (1,853,975) |
| Municipal Bond Fund | LB Municipal Bond Fund* | 72,413,184 | 646,617,936 | 57,069,575 | 54,408,935 |
| Money Market Fund* | LB Money Market Fund | 457,969,043 | 457,969,041 | 457,969,043 | N/A |
*Denotes Accounting Survivor
The Trust offers three classes of shares: Class A, Class B and Institutional Class. The three classes of shares differ principally in their respective distribution expenses and arrangements. Class A shares have a 0.25% annual 12b-1 fee (0.125% for the Money Market Fund) and a maximum front-end sales load of 5.50% for equity funds and 4.50% for fixed-income funds, excluding the Limited Maturity Bond Fund and the Money Market Fund. Class B shares were offered at net asset value and a 1.00% annual 12b-1 fee (0.25% for the Limited Maturity Bond Fund and 0.875% for the Money Market Fund). In addition, Class B shares have a maximum contingent deferred sales charge of 5.00% . The contingent deferred sales charge declines by 1.00% per year through the fifth year. Class B shares convert to Class A shares at the end of the fifth year. Institutional Class shares are offered at net asset value and have no annual 12b-1 fees. All three classes of shares have identical rights to earnings, assets and voting privileges, except for class specific expenses and exclusive rights to vote on matters affecting only individual classes. Effective October 16, 2004, the Trust no longer offers Class B shares for sale.
The following Funds have all three classes of shares: Technology Fund, Partner Small Cap Value Fund, Small Cap Stock Fund, Mid Cap Growth Fund, Mid Cap Stock Fund, Partner International Stock Fund, Large Cap Growth Fund, Large Cap Value Fund, Large Cap Stock Fund, Balanced Fund, High Yield Fund, High Yield Fund II, Municipal Bond Fund, Income Fund, Core Bond Fund, Limited Maturity Bond Fund and Money Market Fund. Aggressive Allocation Fund, Moderately Aggressive Allocation Fund, Moderate Allocation Fund, Moderately Conservative Allocation Fund, Partner Small Cap Growth Fund and Partner Mid Cap Value Fund offer Class A and Class I shares. Small Cap Index Fund,
Mid Cap Index Fund and Large Cap Index Fund offer Class A shares only. Mid Cap Index Fund-I and Large Cap Index Fund-I offer only Institutional Class shares.
At a meeting held on May 23, 2005, the Board of Trustees of Thrivent Mutual Funds voted to liquidate Thrivent Bond Index Fund-I effective August 31, 2005. As a result, the Fund was liquidated on August 31, 2005.
Under the Trust’s organizational documents, its officers and trustees are indemnified against certain liabilities arising out of the performance of their duties to the Trust. In addition, in the normal course of business, the Trust enters into contracts with vendors and others that provide general damage clauses. The Trust’s maximum exposure under these contracts is unknown, as this would involve future claims that may be made against the Trust. However, based on experience, the Trust expects the risk of loss to be remote.
(2) SIGNIFICANT ACCOUNTING POLICIES
(A) Valuation of Investments -- Securities traded on U.S. or foreign securities exchanges or included in a national market system are valued at the official closing price at the close of each business day. Over-the-counter securities and listed securities for which no price is readily available are valued at the current bid price considered best to represent the value at that time. Security prices are based on quotes that are obtained from an independent pricing service approved by the Board of Trustees. The pricing service, in determining values of fixed-income securities, takes into consideration such factors as current quotations by broker/dealers, coupon, maturity, quality, type of issue, trading characteristics, and other yield and risk factors it deems relevant in determining valuations. Securities which cannot be valued
231
THRIVENT MUTUAL FUNDS NOTES TO FINANCIAL STATEMENTS
As of October 31, 2005
(2) SIGNIFICANT ACCOUNTING POLICIES -- continued
by the approved pricing service are valued using valuations obtained from dealers that make markets in the securities. Exchange listed options and futures contracts are valued at the last quoted sales price. Mutual Funds are valued at the Net Asset Value at the close of each business day.
For all Funds other than the Money Market Fund, short-term securities with maturities of 60 days or less are valued at amortized cost. Securities held by the Money Market Fund are valued on the basis of amortized cost (which approximates market value), whereby a portfolio security is valued at its cost initially, and thereafter valued to reflect a constant amortization to maturity of any discount or premium. The Money Market Fund and advisor follow procedures necessary to maintain a constant net asset value of $1.00 per share.
All securities for which market values are not readily available are appraised at fair value as determined in good faith under the direction of the Board of Trustees. As of October 31, 2005, three securities in the High Yield Fund and four securities in the High Yield Fund II were valued at fair value, which represented 0.05% and 0.00%, respectively, of each Fund’s net assets.
Fair Valuation of International Securities -- Because many foreign markets close before the U.S. markets, events may occur between the close of the foreign market and the close of the U.S. markets that could have a material impact on the valuation of foreign securities. The Fund, under the supervision of the Board of Trustees, evaluates the impacts of these events and may adjust the valuation of foreign securities to reflect the fair value as of the close of the U.S. markets. The Board of Trustees has authorized the investment adviser to make fair valuation determinations pursuant to policies approved by the Board of Trustees.
(B) Foreign Currency Translation -- The accounting records of each Fund are maintained in U.S. dollars. Securities and other assets and liabilities that are denominated in foreign currencies are translated into U.S. dollars at the daily closing rates of exchange.
Foreign currency amounts related to the purchase or sale of securities and income and expenses are translated at the exchange rate on the transaction date. Net realized and unrealized currency gains and losses are recorded from sales of foreign currency, exchange gains or losses between the trade date and settlement dates on securities transactions, and other translation gains or losses on dividends, interest income and foreign withholding taxes. The Funds do not separately report the effect of changes in foreign exchange rates from changes in market prices on securities held. Such changes are included in net realized and unrealized gain or loss from investments.
For federal income tax purposes, the Trust treats the effect of changes in foreign exchange rates arising from actual foreign currency transactions and the changes in foreign exchange rates between the trade date and settlement date as ordinary income.
(C) Foreign Currency Contracts -- In connection with purchases and sales of securities denominated in foreign currencies, all Funds except the Money Market Fund may enter into forward currency contracts. Additionally, the Funds may enter into such contracts to hedge certain other foreign currency denominated investments. These contracts are recorded at market value and the related realized and unrealized foreign exchange gains and losses are included in the Statement of Operations. In the event that counterpar-ties fail to settle these forward contracts, the Funds could be exposed to foreign currency fluctuations. Foreign currency contracts are valued daily and unrealized appreciation or depreciation is recorded daily as the difference between the contract exchange rate and the closing forward rate applied to the face amount of the contract. A realized gain or loss is recorded at the time a forward contract is closed. During the year ended October 31, 2005, the Partner International Stock Fund engaged in this type of investment.
(D) Foreign Denominated Investments -- Foreign denominated assets and currency contracts may involve more risks than domestic transactions, including currency risk, political and economic risk, regulatory risk, and market risk. Certain Funds may also invest in securities of companies located in emerging markets. Future economic or political developments could adversely affect the liquidity or value, or both, of such securities.
(E) Federal Income Taxes -- No provision has been made for income taxes because the Funds’ policy is to qualify as regulated investment companies under the Internal Revenue Code and distribute substantially all taxable income on a timely basis. It is also the intention of the Funds to distribute an amount sufficient to avoid imposition of any federal excise tax. The Funds, accordingly, anticipate paying no federal taxes and no federal tax provision was recorded. Each Fund is treated as a separate taxable entity for federal income tax purposes. Certain Funds may utilize earnings and profits distributed to shareholders on the redemption of shares as part of the dividend paid deduction.
232
THRIVENT MUTUAL FUNDS NOTES TO FINANCIAL STATEMENTS
As of October 31, 2005
(F) Income and Expenses -- Estimated expenses are accrued daily. The Funds are charged for those expenses that are directly attributable to them. Expenses that are not directly attributable to a Fund are allocated among all appropriate Funds in proportion to their respective net assets, number of shareholder accounts or other reasonable basis. Net investment income, expenses which are not class-spe-cific and realized and unrealized gains and losses are allocated directly to each class based upon the relative net asset value of outstanding shares.
Interest income is accrued daily and is determined on the basis of interest or discount earned on all debt securities, including accretion of market discount and original issue discount and amortization of premium. Dividend income is recorded on the ex-dividend date. For preferred stock payment-in-kind securities, income is recorded on the ex-dividend date in the amount of the value received.
(G) Custody Earnings Credit -- The Funds have a deposit arrangement with the custodian whereby interest earned on uninvested cash balances is used to pay a portion of custodian fees. This deposit arrangement is an alternative to overnight investments.
(H) Distributions to Shareholders -- Dividend and capital gain distributions are recorded on the ex-dividend date. With the exception of the Money Market Fund, net realized gains from securities transactions, if any, are paid at least annually after the close of the fiscal year.
Dividends from the High Yield, High Yield Fund II, Municipal Bond Fund, Income Fund, Core Bond Fund, Limited Maturity Bond Fund and Money Market Fund are declared daily and paid monthly. Dividends from the Money Market Fund also include any short-term net realized gains or losses on the sale of securities. Dividends from the Moderate Allocation Fund, Moderately Conservative Allocation Fund and Balanced Fund are declared and paid quarterly. Dividends from the following funds are declared and paid annually: Aggressive Allocation Fund, Moderately Aggressive Allocation Fund, Technology Fund, Partner Small Cap Growth Fund, Partner Small Cap Value Fund, Small Cap Stock Fund, Small Cap Index Fund, Mid Cap Growth Fund, Partner Mid Cap Value Fund, Mid Cap Stock Fund, Mid Cap Index Fund, Mid Cap Index Fund-I, Partner International Stock Fund, Large Cap Growth Fund, Large Cap Value Fund, Large Cap Stock Fund, Large Cap Index Fund and Large Cap Index Fund-I.
(I) Options -- All Funds except the Money Market Fund may buy put and call options and write covered put and call options. The Funds intend to use such derivative instruments as hedges to facilitate buying or selling securities or to provide protection against adverse movements in security prices or interest rates. The Funds may also enter into options contracts to protect against adverse foreign exchange rate fluctuations.
Option contracts are valued daily and unrealized appreciation or depreciation is recorded. A Fund will realize a gain or loss upon expiration or closing of the option transaction. When an option is exercised, the proceeds upon sale for a written call option or the cost of a security for purchased put and call options is adjusted by the amount of premium received or paid. During the year ended October 31, 2005, the Large Cap Growth, Balanced, Income, Core Bond, and Limited Maturity Bond Funds engaged in this type of investment.
(J) Financial Futures Contracts -- Certain Funds may use futures contracts to manage the exposure to interest rate and market fluctuations. Gains or losses on futures contracts can offset changes in the yield of securities. When a futures contract is opened, cash or other investments equal to the required “initial margin deposit” are pledged to the broker. Additional securities held by the Funds may be earmarked as collateral for open futures contracts. The futures contract’s daily change in value (“variation margin”) is either paid to or received from the broker, and is recorded as an unrealized gain or loss. When the contract is closed, the realized gain or loss is recorded equal to the difference between the value of the contract when opened and the value of the contract when closed. During the year ended October 31, 2005, the Small Cap Index Fund, Mid Cap Index Fund, Mid Cap Index Fund-I, Large Cap Index Fund, Large Cap Index Fund-I, Balanced, Municipal Bond, Income Fund, Core Bond and Limited Maturity Bond Fund engaged in this type of investment.
(K) Mortgage Dollar Roll Transactions -- Certain Funds enter into dollar roll transactions on securities issued or to be issued by the Government National Mortgage Association, Federal National Mortgage Association and Federal Home Loan Mortgage Corporation, in which the Funds sell mortgage securities and simultaneously agree to repurchase similar (same type, coupon and maturity) securities at a later date at an agreed upon price. During the period between the sale and repurchase, the Funds forgo principal and interest paid on the mortgage securities sold. The Funds are compensated from negotiated fees paid by
233
THRIVENT MUTUAL FUNDS
NOTES TO FINANCIAL STATEMENTS
As of October 31, 2005
(2) SIGNIFICANT ACCOUNTING POLICIES -- continued
brokers offered as an inducement to the Funds to “roll over” their purchase commitments. The Balanced Fund, Income Fund, Core Bond Fund and Limited Maturity Bond Fund earned $595,273, $1,083,252, $2,168,273 and $405,754, respectively, from such fees for the year ended October 31, 2005.
(L) Securities Lending -- The Trust has entered into Securities Lending Agreement (the “Agreement”) with State Street Bank and Trust Company (“State Street Bank”). The Agreement authorizes State Street Bank to lend securities to authorized borrowers on behalf of the Funds. Pursuant to the Agreement, all loaned securities are collateralized by cash equal to at least 102% of the value of the loaned securities. All cash collateral received is invested in Thrivent Financial Securities Lending Trust. Amounts earned on investments in Thrivent Financial Securities Lending Trust, net of rebates and other securities lending expenses, are included in Income from Securities Loaned on the Statement of Operations. As payment for its services, State Street Bank receives a portion of the fee income and earnings on the collateral. By investing any cash collateral it receives in these transactions, a Fund could realize additional gains or losses. If the borrower fails to return the securities and the invested collateral has declined in value, the Fund could lose money. The Agreement grants and transfers to State Street Bank a lien upon collateralized assets in the possession of State Street Bank. As of October 31, 2005, all Funds except the Aggressive Allocation Fund, the Moderately Aggressive Allocation Fund, the Moderate Allocation Fund, the Moderately Conservative Allocation Fund, the Municipal Bond Fund and the Money Market Fund had securities on loan. The value of securities on loan is as follows:
| | Securities |
| Fund | on Loan |
|
| Technology Fund | $ 5,564,785 |
| Partner Small Cap Growth Fund | 2,148,096 |
| Partner Small Cap Value Fund | 13,762,163 |
| Small Cap Stock Fund | 73,707,600 |
| Small Cap Index Fund | 10,669,342 |
| Mid Cap Growth Fund | 49,952,259 |
| Partner Mid Cap Value Fund | 405,085 |
| Mid Cap Stock Fund | 149,668,102 |
| Mid Cap Index Fund | 10,470,361 |
| Mid Cap Index Fund-I | 3,630,189 |
| | Securities |
| Fund | on Loan |
|
| Partner International Stock Fund | $56,560,269 |
| Large Cap Growth Fund | 6,514,513 |
| Large Cap Value Fund | 13,501,682 |
| Large Cap Stock Fund | 57,923,009 |
| Large Cap Index Fund | 3,888,190 |
| Large Cap Index Fund-I | 407,345 |
| Balanced Fund | 41,939,179 |
| High Yield Fund | 78,093,660 |
| High Yield Fund II | 21,419,166 |
| Income Fund | 59,043,102 |
| Core Bond Fund | 45,750,437 |
| Limited Maturity Bond Fund | 10,490,317 |
(M) When-Issued and Delayed Delivery Transactions
-- Certain Funds may purchase or sell securities on a when-issued or delayed-delivery basis. These transactions involve a commitment by a Fund to purchase or sell securities for a predetermined price or yield, with payment and delivery taking place beyond the customary settlement period. When delayed delivery purchases are outstanding, a Fund will designate liquid assets in an amount sufficient to meet the purchase price. When purchasing a security on a delayed delivery basis, a Fund assumes the rights and risks of ownership of the security, including the risk of price and yield fluctuations, and takes such fluctuations into account when determining its net asset value. A Fund may dispose of a delayed delivery transaction after it is entered into, and may sell when-issued securities before they are delivered, which may result in a capital gain or loss. When a Fund has sold a security on a delayed delivery basis, a Fund does not participate in future gains and losses with respect to the security.
(N) Credit Risk -- The Funds may be susceptible to credit risk to the extent an issuer defaults on its payment obligation. The Funds’ policy is to monitor the creditworthiness of issuers. Interest receivables on defaulted securities are monitored for ability to collect payments in default and are adjusted accordingly.
(O) Accounting Estimates -- The preparation of finan-cial statements in conformity with accounting principles generally accepted in the United States of America require management to make estimates and assumptions that affect the reported amounts of assets and liabilities and disclosure of contingent assets and liabilities at the date of the finan-cial statements and the reported amounts of income and expenses during the reporting period. Actual results could differ from those estimates.
234
THRIVENT MUTUAL FUNDS NOTES TO FINANCIAL STATEMENTS
As of October 31, 2005
(P) Loss Contingencies -- Thrivent High Yield Fund received a dividend in the amount of $37,188 from Global Crossings within 90 days of Global Crossings’ filing for bankruptcy. A preference action has been filed and it is possible that the Fund will be required to surrender the dividend back to the bankruptcy estate. This loss contingency has not been accrued as a liability because the amount to be surrendered can not be reasonably estimated.
(Q) Other -- For financial statement purposes, investment security transactions are accounted for on the trade date. Realized gains and losses from investment transactions are determined on a specific cost identification basis, which is the same basis used for federal income tax purposes.
(3) FEES AND COMPENSATION PAID TO AFFILIATES
(A) Investment Advisory Fees -- The Trust has entered into an Investment Advisory Agreement with Thrivent Investment Management Inc. (Thrivent Investment Mgt.), (“the Adviser”). Thrivent Investment Mgt. is a wholly owned subsidiary of Thrivent Financial for Lutherans (Thrivent Financial). Under the Advisory Agreement, each of the Funds pays a fee for investment advisory services. The fees are accrued daily and paid monthly. The annual rates of fees as a percent of average daily net assets under the investment advisory agreement were as follows:
| (M - Millions) | $0 to | $50 to | $100 to | $200 to | $250 to | $500 to | $750 to | $1,000 to | $2,000 to | $2,500 to | Over |
| Fund | $50M | $100M | $200M | $250M | $500M | $750M | $1,000M | $2,000M x | $5,000M | $5,000M | $5,000M |
|
| Aggressive Allocation | | | | | | | | | | | |
| Fund | 0.15% | 0.15% | 0.15% | 0.15% | 0.15% | 0.125% | 0.125% | 0.125% | 0.125% | 0.125% | 0.125% |
| Moderately Aggressive | | | | | | | | | | | |
| Allocation Fund | 0.15% | 0.15% | 0.15% | 0.15% | 0.15% | 0.125% | 0.125% | 0.125% | 0.125% | 0.125% | 0.125% |
| Moderate Allocation | | | | | | | | | | | |
| Fund | 0.15% | 0.15% | 0.15% | 0.15% | 0.15% | 0.125% | 0.125% | 0.125% | 0.125% | 0.125% | 0.125% |
| Moderately Conservative | | | | | | | | | | |
| Allocation Fund | 0.15% | 0.15% | 0.15% | 0.15% | 0.15% | 0.125% | 0.125% | 0.125% | 0.125% | 0.125% | 0.125% |
| Technology Fund | 0.75% | 0.75% | 0.75% | 0.75% | 0.75% | 0.75% | 0.75% | 0.75% | 0.75% | 0.75% | 0.75% |
| Partner Small Cap | | | | | | | | | | | |
| Growth Fund | 0.90% | 0.90% | 0.90% | 0.90% | 0.90% | 0.80% | 0.80% | 0.80% | 0.80% | 0.80% | 0.80% |
| Partner Small Cap | | | | | | | | | | | |
| Value Fund | 0.70% | 0.70% | 0.70% | 0.70% | 0.70% | 0.70% | 0.70% | 0.70% | 0.70% | 0.70% | 0.70% |
| Small Cap Stock Fund | 0.70% | 0.70% | 0.70% | 0.65% | 0.65% | 0.65% | 0.65% | 0.60% | 0.60% | 0.55% | 0.525% |
| Small Cap Index Fund | 0.25% | 0.25% | 0.25% | 0.25% | 0.25% | 0.25% | 0.25% | 0.25% | 0.25% | 0.25% | 0.25% |
| Mid Cap Growth Fund | 0.45% | 0.45% | 0.40% | 0.40% | 0.35% | 0.30% | 0.30% | 0.25% | 0.25% | 0.25% | 0.25% |
| Partner Mid Cap | | | | | | | | | | | |
| Value Fund | 0.75% | 0.75% | 0.75% | 0.75% | 0.70% | 0.70% | 0.70% | 0.70% | 0.70% | 0.70% | 0.70% |
| Mid Cap Stock Fund | 0.70% | 0.70% | 0.70% | 0.65% | 0.65% | 0.65% | 0.65% | 0.60% | 0.60% | 0.55% | 0.525% |
| Mid Cap Index Fund | 0.25% | 0.25% | 0.25% | 0.25% | 0.25% | 0.25% | 0.25% | 0.25% | 0.25% | 0.25% | 0.25% |
| Mid Cap Index Fund-I | 0.25% | 0.20% | 0.20% | 0.20% | 0.20% | 0.20% | 0.20% | 0.20% | 0.20% | 0.20% | 0.20% |
| Partner International | | | | | | | | | | | |
| Stock Fund | 0.65% | 0.60% | 0.60% | 0.60% | 0.60% | 0.60% | 0.60% | 0.60% | 0.60% | 0.60% | 0.60% |
| Large Cap Growth Fund | 0.75% | 0.75% | 0.75% | 0.75% | 0.75% | 0.70% | 0.70% | 0.65% | 0.65% | 0.60% | 0.575% |
| Large Cap Value Fund | 0.45% | 0.45% | 0.45% | 0.45% | 0.45% | 0.45% | 0.45% | 0.45% | 0.45% | 0.45% | 0.45% |
| Large Cap Stock Fund | 0.65% | 0.65% | 0.65% | 0.65% | 0.65% | 0.575% | 0.575% | 0.50% | 0.475% | 0.45% | 0.425% |
| Large Cap Index Fund | 0.25% | 0.25% | 0.25% | 0.25% | 0.25% | 0.25% | 0.25% | 0.25% | 0.25% | 0.25% | 0.25% |
| Large Cap Index Fund-I | 0.25% | 0.175% | 0.175% | 0.175% | 0.175% | 0.175% | 0.175% | 0.175% | 0.175% | 0.175% | 0.175% |
| Balanced Fund | 0.55% | 0.55% | 0.55% | 0.55% | 0.55% | 0.50% | 0.50% | 0.475% | 0.475% | 0.45% | 0.425% |
| High Yield Fund | 0.40% | 0.40% | 0.40% | 0.40% | 0.40% | 0.35% | 0.35% | 0.30% | 0.30% | 0.30% | 0.30% |
| High Yield Fund II | 0.55% | 0.55% | 0.55% | 0.55% | 0.55% | 0.55% | 0.55% | 0.55% | 0.55% | 0.55% | 0.55% |
| Municipal Bond Fund | 0.45% | 0.45% | 0.45% | 0.45% | 0.45% | 0.40% | 0.40% | 0.35% | 0.35% | 0.325% | 0.30% |
| Income Fund | 0.35% | 0.35% | 0.35% | 0.35% | 0.35% | 0.325% | 0.325% | 0.30% | 0.30% | 0.30% | 0.30% |
| Core Bond Fund | 0.45% | 0.45% | 0.45% | 0.45% | 0.45% | 0.40% | 0.40% | 0.375% | 0.375% | 0.35% | 0.325% |
| Limited Maturity | | | | | | | | | | | |
| Bond Fund | 0.30% | 0.30% | 0.30% | 0.30% | 0.30% | 0.275% | 0.275% | 0.25% | 0.25% | 0.25% | 0.25% |
| Money Market Fund | 0.50% | 0.50% | 0.50% | 0.50% | 0.50% | 0.40% | 0.35% | 0.325% | 0.325% | 0.30% | 0.275% |
235
THRIVENT MUTUAL FUNDS
NOTES TO FINANCIAL STATEMENTS
As of October 31, 2005
|
(3) FEES AND COMPENSATION PAID TO AFFILIATES -- continued
The Fund has entered into subadvisory agreements with Turner Investment Partners, Inc. (“Turner”) and Transamerica Investment Management LLC (“Transamerica”) for the performance of subadvisory services for the Partner Small Cap Growth Fund. Effective August 4, 2005, Transamerica acquired Westcap Investors LLC. The fee payable is equal to 0.65% and 0.50% of average daily net assets subadvised by Turner and Transamerica, respectively.
The Adviser has entered into a subadvisory agreement with T. Rowe Price Associates, Inc. for performance of sub-advisory services for the Partner Small Cap Value Fund. The subadvisory fee, which is paid by the Adviser from its advisory fee, is 0.60% of average daily net assets.
The Fund has entered into a subadvisory agreement with Goldman Sachs Asset Management, LP (“Goldman Sachs”) for the performance of subadvisory services for the Partner Mid Cap Value Fund. The fee payable is equal to 0.50% of average daily net assets for the first $250 million and 0.45% for assets over $250 million. For purposes of determining breakpoints for the assets managed by Goldman Sachs, assets managed by Goldman Sachs in the Partner Mid Cap Value Portfolio of Thrivent Series Fund, Inc. will be included in determining average daily net assets.
The adviser has entered into a subadvisory agreement with Mercator Asset Management, LP (“Mercator”) and T. Rowe Price International, Inc. (“Price International”) for the performance of subadvisory services for the Partner International Stock Fund. The fee payable is equal to 0.47% of average daily net assets subadvised by Mercator. For assets subadvised by Price International, the fee payable is equal to 0.75% of the first $20 million, 0.60% of the next $30 million, and 0.50% of the next $150 million of average daily net assets, with the fee for all of the assets subadvised by Price International 0.50% and 0.45% when assets exceed $200 million and $500 million, respectively. For purposes of determining breakpoints for the assets managed by Price International, assets managed by Price International in the Partner International Stock Portfolio of Thrivent Series Fund, Inc. will be included in determining average daily net assets.
As of October 31, 2005, the following voluntary and contractual expense reimbursements were in effect:
| | Voluntary/ | | | Institutional | Expiration |
| Fund | Contractual | Class A | Class B | Class | Date |
|
| Aggressive Allocation | Contractual | 0.74% | N/A | 0.74% | 6/30/06 |
| Moderately Aggressive Allocation | Contractual | 0.59% | N/A | 0.59% | 6/30/06 |
| Moderate Allocation | Contractual | 0.63% | N/A | 0.63% | 6/30/06 |
| Moderately Conservative Allocation | Contractual | 0.87% | N/A | 0.87% | 6/30/06 |
| Technology | Voluntary | 0.50% | 1.00% | -- | N/A |
| Partner Small Cap Growth | Contractual | 0.80% | N/A | 0.80% | 6/30/06 |
| Partner Small Cap Value | Voluntary | 0.50% | 0.50% | 0.50% | N/A |
| Small Cap Index | Contractual | 0.95% | N/A | N/A | 2/28/06 |
| Partner Mid Cap Value | Contractual | 0.90% | N/A | 0.90% | 6/30/06 |
| Partner Mid Cap Value | Voluntary | 0.80% | N/A | 0.80% | N/A |
| Mid Cap Index | Contractual | 0.90% | N/A | N/A | 2/28/06 |
| Large Cap Growth | Contractual | 0.80% | 0.80% | 0.80% | 12/31/05 |
| Large Cap Index | Contractual | 0.60% | N/A | N/A | 2/28/06 |
| High Yield II | Contractual | 0.16% | 0.16% | 0.16% | 12/31/05 |
| Money Market | Contractual | 0.10% | 0.10% | 0.10% | 12/31/05 |
As of October 15, 2004 all Class B shares net operating expenses are limited to the following percentage of daily net assets of Class B shares: Technology Fund, 3.34%; Partner Small Cap Value Fund, 2.63%; Small Cap Stock Fund, 2.43%; Mid Cap Growth Fund, 2.31%; Mid Cap Stock Fund, 2.39%; Partner International Stock Fund, 2.79%; Large Cap Growth Fund, 2.55%; Large Cap Value Fund, 2.21%; Large Cap Stock Fund, 2.24%; Balanced Fund, 2.06%; High Yield Fund, 1.73%; High Yield Fund II, 2.30%; Municipal Bond Fund, 1.50%; Income Fund, 1.67%; Core Bond Fund, 1.95%; Limited Maturity Bond Fund, 0.89%; and Money Market Fund, 1.95% . These reimbursements will be in effect as long as assets remain in the B shares.
Class B share expenses were voluntarily reimbursed to limit expenses to 2.75% of average daily net assets for Technology Fund and Partner International Stock Fund. These voluntary expense reimbursements may be discontinued at any time. Additionally, Small Cap Index Fund, Mid Cap Index Fund and Large Cap Index Fund’s net operating expenses are contractually reimbursed to limit expenses to 0.95%, 0.90% and 0.60%, respectively. This contractual agreement expires February 28, 2006.
236
THRIVENT MUTUAL FUNDS
NOTES TO FINANCIAL STATEMENTS
As of October 31, 2005
Each non-money market Fund may invest cash in the Money Market Fund, subject to certain limitations. During the year ended October 31, 2005 all funds with the exception of the Municipal Bond Fund invested in the Money Market Fund. These related-party transactions are subject to the same terms as non-related party transactions except that, to avoid duplicate investment advisory fees, Thrivent Investment Mgt. reimburses an amount equal to the smaller of the amount of the advisory fee for that Fund or the amount of the advisory fee which is charged to the Fund for its investment in Thrivent Money Market Fund.
(B) Distribution Plan -- Thrivent Investment Mgt. is also the Trust’s distributor. The Trust has adopted a Distribution Plan (“the Plan”) pursuant to Rule 12b-1 under the Investment Company Act of 1940. Class A shares have a Rule 12b-1 fee of 0.25% (0.125% for the Money Market Fund) of average net assets. Class B Shares have a Rule 12b-1 fee of 1.0% (0.25% for the Limited Maturity Bond Fund and 0.875% for the Money Market Fund) of average net assets.
(C) Sales Charges and Other Fees -- For the year ended October 31, 2005, Thrivent Investment Mgt. received $12,465,022 of aggregate underwriting concessions from the sales of the Trust’s Class A and B shares and aggregate contingent deferred sales charges of $684,559 from redemptions of Class A and Class B shares. Sales charges are not an expense of the Trust and are not reflected in the financial statement of any of the Funds.
The Trust has entered into an accounting services agreement with Thrivent Financial pursuant to which Thrivent Financial provides certain accounting personnel and services. For the year ended October 31, 2005, Thrivent Financial received aggregate fees for accounting personnel and services of $1,266,412 from the Trust.
The Trust has entered into an agreement with Thrivent Investment Mgt. to provide certain administrative personnel and services to the Funds. For the year ended October 31, 2005, Thrivent Investment Mgt. received aggregate fees for administrative personnel and services of $2,278,239 from the Trust.
The Trust has entered into an agreement with Thrivent Financial Investor Services Inc. (Thrivent Investor Services) to provide the Funds with transfer agent services. For the year ended October 31, 2005, Thrivent Investor Services received $19,781,171 for transfer agent services from the Trust.
Each Trustee is eligible to participate in a deferred compensation plan with respect to these fees. Participants in the plan may designate their deferred Trustee’s fees as if invested in any one of the Funds. The value of each Trustee’s deferred compensation account will increase or decrease as if it were invested in shares of the selected Funds. The deferred fees remain in the appropriate Fund until distribution in accordance with the plan. The deferred fee liability is an unsecured liability.
Those Trustees not participating in the above plan received $211,709 in fees from the Trust for the year ended October 31, 2005. No remuneration has been paid by the Trust to any of the officers or affiliated Trustees of the Trust. In addition, the Trust reimbursed unaffiliated Trustees for reasonable expenses incurred in relation to attendance at the meetings and industry conferences.
Certain officers and non-independent trustees of the Funds are officers and directors of Thrivent Investment Mgt. and Thrivent Investor Services; however, they receive no compensation from the Funds.
Distributions are based on amounts calculated in accordance with the applicable federal income tax regulations, which may differ from accounting principles generally accepted in the United States of America. To the extent that these differences are permanent in nature, such amounts are reclassified within the capital accounts based on their federal tax-basis treatment; temporary differences do not require reclassifications.
On the Statement of Assets and Liabilities, as a result of permanent book-to-tax differences, reclassification adjustments were made as follows [Increase/(Decrease)]:
| | Accumulated | Accumulated | |
| | Net Investment | Net Realized | |
| Fund | Income/(Loss) | Gain/(Loss) | Trust Capital |
|
| Aggressive Allocation | $22,830 | $(209) | $ (22,621) |
| Moderately Aggressive | | | |
| Allocation | 10,596 | -- | (10,596) |
| Moderate Allocation | 10,639 | -- | (10,639) |
| Moderately Conservative | | | |
| Allocation | 9,764 | -- | (9,764) |
| Technology | 202,682 | -- | (202,682) |
| Partner Small Cap Growth | 42,308 | -- | (42,308) |
| Partner Small Cap Value | (134,175) | 134,175 | -- |
| Small Cap Stock | 2,053,487 | (4,353,487) | 2,300,000 |
| Small Cap Index | (19,794) | 19,672 | 122 |
| Mid Cap Growth | 2,597,170 | 16,777 | (2,613,947) |
| Partner Mid Cap Value | 9,860 | -- | (9,860) |
| Mid Cap Stock | (140,122) | (3,859,878) | 4,000,000 |
237
THRIVENT MUTUAL FUNDS
NOTES TO FINANCIAL STATEMENTS
As of October 31, 2005
| (4) TAX INFORMATION -- continued | |
| | Accumulated Accumulated | |
| | Net Investment | Net Realized | |
| Fund | Income/(Loss) Gain/(Loss) | Trust Capital |
|
| Mid Cap Index | $ (18,407) | $ 18,407 | $-- |
| Mid Cap Index-I | (9,824) | 9,824 | -- |
| Partner International | | | |
| Stock | (86,339) | 81,046 | 5,293 |
| Large Cap Growth | (5,017) | (272) | 5,289 |
| Large Cap Value | (18,819) | 18,819 | -- |
| Large Cap Stock | (237,657) | 237,657 | -- |
| Large Cap Index | (9,126) | 9,126 | -- |
| Large Cap Index-I | (4,393) | 4,393 | -- |
| Balanced | 338,842 | (338,842) | -- |
| High Yield | (15,357) | 15,357 | -- |
| High Yield II | 578,706 | (578,706) | -- |
| Income | 105,491 | (105,491) | -- |
| Core Bond | 1,132,300 | (1,132,300) | -- |
| Limited Maturity Bond | (16,667) | 16,667 | -- |
At October 31, 2005, the components of distributable earnings on a tax basis were as follows:
| | Undistributed | Undistributed |
| | Ordinary | Long-Term |
| Fund | Income | Capital Gain |
|
| Moderately Aggressive | | |
| Allocation | $56,187 | $-- |
| Moderate Allocation | 76,956 | -- |
| Moderately Conservative | | |
| Allocation | 64,108 | -- |
| Partner Small Cap Value | 4,348,173 | 2,019,596 |
| Small Cap Stock | 1,465,120 | 47,107,147 |
| Small Cap Index | 243,244 | 709,177 |
| Partner Mid Cap Value | 14,526 | -- |
| Mid Cap Stock | 26,921,159 | 74,603,326 |
| Mid Cap Index | 625,239 | 3,626,758 |
| Mid Cap Index - I | 242,810 | 1,424,649 |
| Partner International Stock | 4,469,314 | -- |
| Large Cap Growth | 362,247 | -- |
| Large Cap Value | 3,603,876 | 5,697,791 |
| Large Cap Stock | 28,604,295 | 22,386,737 |
| Large Cap Index | 917,510 | 88,425 |
| Large Cap Index-I | 338,547 | -- |
| Balanced | 8,884,341 | 1,409,462 |
| High Yield | 168,212 | -- |
| High Yield II | 347,861 | -- |
| Municipal Bond | 1,687 | -- |
| Core Bond | 136,945 | -- |
| Limited Maturity Bond | 18,073 | -- |
| Money Market | 38,451 | -- |
*Municipal Bond Fund undistributed ordinary income is primarily exempt from federal income taxes.
At October 31, 2005, the following Funds had accumulated net realized capital loss carryovers expiring as follows:
| | Capital Loss | Expiration |
| Fund | Carryover | Year |
|
| Technology | $11,583,446 | 2009 |
| | 13,695,973 | 2010 |
| | 1,279,762 | 2011 |
| | 1,471,537 | 2012 |
| | ------------------ | |
| | $28,030,718 | |
| | =========== | |
| Partner Small Cap Growth | $152,835 | 2013 |
| | =========== | |
| Mid Cap Growth | $1,054,796 | 2008 |
| | 25,424,814 | 2009 |
| | 6,613,531 | 2010 |
| | 816,607 | 2011 |
| | ------------------ | |
| | $33,909,748 | |
| | =========== | |
| Partner Mid Cap Value | $ 16,433 | 2013 |
| | =========== | |
| Partner International Stock | $11,487,548 | 2009 |
| | 55,324,117 | 2010 |
| | ------------------ | |
| | $66,811,665 | |
| | =========== | |
| Large Cap Growth | $13,967,185 | 2009 |
| | 7,054,293 | 2010 |
| | ------------------ | |
| | $21,021,478 | |
| | =========== | |
| Large Cap Value | $ 371 | 2009 |
| | 4,140,620 | 2010 |
| | ------------------ | |
| | $4,140,991 | |
| | =========== | |
| Large Cap Stock | $101,905,599 | 2009 |
| | 45,072,180 | 2010 |
| | ------------------ | |
| | $146,977,779 | |
| | =========== | |
| Large Cap Index-I | $ 2,317,791 | 2010 |
| | 1,730,425 | 2011 |
| | ------------------ | |
| | $4,048,216 | |
| | =========== | |
| High Yield | $18,998,975 | 2007 |
| | 15,133,980 | 2008 |
| | 125,418,013 | 2009 |
| | 223,628,596 | 2010 |
| | 90,973,334 | 2011 |
| | 11,792,481 | 2012 |
| | 1,037,644 | 2013 |
| | ------------------ | |
| | $486,983,023 | |
| | =========== | |
| High Yield II | $ 37,943,618 | 2008 |
| | 14,003,544 | 2009 |
| | 12,668,032 | 2010 |
| | 324,797 | 2012 |
| | ------------------ | |
| | $64,939,991 | |
| | =========== | |
238
THRIVENT MUTUAL FUNDS
NOTES TO FINANCIAL STATEMENTS
As of October 31, 2005
|
| | Capital Loss | | Expiration |
| Fund | Carryover | | Year |
|
| |
| Municipal Bond | $7,491,802 | | 2007 |
| |
| | 328,490 | | 2009 |
| |
| | 545,473 | | 2012 |
| | ------------------ | | |
| | $8,365,765 | | |
| | ================ | | |
| |
| Income | $7,036,690 | | 2008 |
| |
| | 17,362,752 | | 2010 |
| | ------------------ | | |
| | $ 24,399,442 | | |
| | ================ | | |
| |
| Core Bond | $1,246,299 | | 2012 |
| |
| | 1,300,054 | | 2013 |
| | ------------------ | | |
| | $2,546,353 | | |
| | ================ | | |
| |
| Limited Maturity Bond | $691,482 | | 2013 |
| | ================ | | |
To the extent that these Funds realize future net capital gains, taxable distributions will be reduced by any unused capital loss carryovers as permitted by the Internal Revenue Code.
Of the capital loss carryovers attributable to Mid Cap Growth Fund, Partner International Stock Fund, Large Cap Growth Fund, Large Cap Value Fund, and Large Cap Stock Fund, the following amounts were obtained as a result of the reorganization, as described in Note 1, with LB Opportunity Growth Fund, LB World Growth Fund, LB Growth Fund, LB Value Fund, and LB Fund, respectively:
| | Capital Loss | | Expiration |
| Fund | Carryover | | Year |
|
| |
| Mid Cap Growth | $1,054,796 | | 2008 |
| |
| | 25,424,814 | | 2009 |
| |
| | 6,613,531 | | 2010 |
| | ------------------ | | |
| | $33,093,141 | | |
| | ============== | | |
| |
| Partner International Stock | $ 10,283,536 | | 2009 |
| |
| | 8,815,509 | | 2010 |
| | ------------------ | | |
| | $ 19,099,045 | | |
| | ============== | | |
| |
| Large Cap Growth | $5,251,123 | | 2009 |
| |
| | 4,875,278 | | 2010 |
| | ------------------ | | |
| | $10,126,401 | | |
| | ============== | | |
| |
| Large Cap Value | $371 | | 2009 |
| |
| | | | 2010 |
| | ------------------ | | |
| | $4,140,991 | | |
| | ============== | | |
| |
| Large Cap Stock | $101,905,599 | | 2009 |
| |
| | 45,072,180 | | 2010 |
| | ------------------ | | |
| | $146,977,779 | | |
| | ============== | | |
Capital loss carryovers of $2,574,494, $31,301,966, $29,154,968, $12,253,806, $8,527,006, $16,707,799, $40,663,321, $925,276, $823,378, $620,017, $2,099,433, and $5,048,728 were utilized by Technology Fund, Mid Cap Growth Fund, Mid Cap Stock Fund, Partner International Stock Fund, Large Cap Growth Fund, Large Cap Value Fund, Large Cap Stock Fund, Large Cap Index Fund, Large Cap Index Fund-I, High Yield Fund II, Municipal Bond Fund, and Income Fund.
The tax character of distributions paid during the year ended October 31, 2005, period ended October 31, 2004, and year ended April 30, 2004 was as follows:
| | | Ordinary Income | | | | Long-Term Capital Gain | |
| Fund | 10/31/05 | 10/31/04 | 04/30/04 | | 10/31/05 | 10/31/04 | 04/30/04 |
|
| Moderate Allocation | $85,097 | N/A | N/A | | $-- | N/A | N/A |
| Moderately Conservative | | | | | | | |
| Allocation | 54,808 | N/A | N/A | | -- | N/A | N/A |
| Partner Small Cap Value | 2,449,833 | $ 294,930 | $-- | | 8,542,961 | $ 1,354,118 | $ -- |
| Small Cap Stock | 4,506,150 | 12,732,466 | -- | | 17,450,071 | 11,407,705 | -- |
| Small Cap Index | 69,683 | -- | -- | | 276,597 | 1,238,820 | 116,288 |
| Mid Cap Index | 108,546 | 6,127 | -- | | 213,705 | -- | -- |
| Mid Cap Index-I | 141,843 | 72,377 | 212,516 | | 571,863 | 394,912 | 100,189 |
| Large Cap Stock | 22,365,685 | 5,698,855 | 10,819,813 | | -- | 540,381,430 | -- |
| Large Cap Index | 794,013 | 188,833 | 450,406 | | -- | -- | -- |
| Large Cap Index-I | 457,553 | -- | 515,759 | | -- | -- | -- |
| Balanced | 7,582,902 | 3,487,872 | 7,235,059 | | 6,139,893 | -- | -- |
| High Yield II | 10,545,623 | 5,153,432 | 9,847,328 | | -- | -- | -- |
| Core Bond | 20,255,052 | 10,815,460 | 23,322,039 | | -- | 493,832 | -- |
| Money Market | 20,563,557 | 2,327,425 | 1,596,919 | | -- | -- | -- |
|
| |
| 239 | | | | |
THRIVENT MUTUAL FUNDS
NOTES TO FINANCIAL STATEMENTS
As of October 31, 2005
|
(4) TAX INFORMATION -- continued
The tax character of distributions paid during the years ended October 31, 2005 and 2004 was as follows:
| | Tax-Exempt Income | | Ordinary Income | Long-Term Capital Gain |
| Fund | 10/31/05 | | 10/31/04 | | 10/31/05 | 10/31/04 | 10/31/05 | 10/31/04 |
|
| Partner International Stock | $-- | | $-- | | $70,182 | $443,729 | $-- | $-- |
| Large Cap Growth | -- | | -- | | 48,823 | 174,138 | -- | -- |
| Large Cap Value | -- | | -- | | 1,412,596 | 593,663 | -- | -- |
| High Yield | -- | | -- | | 47,618,361 | 48,131,067 | -- | -- |
| Municipal Bond | 55,585,203 | 38,117,266 | 371,394 | 51,909 | | 3,391,003 |
| Income | -- | | -- | | 26,177,235 | 25,789,927 | -- | -- |
| Limited Maturity Bond | -- | | -- | | 4,768,519 | 4,036,301 | 309,329 | 377,166 |
At October 31, 2005, the gross unrealized appreciation and depreciation of investments, based on cost for federal income tax purposes, were as follows:
| | | | | Net Unrealized |
| | Federal | Unrealized | Unrealized | Appreciation |
| Fund | Tax Cost | Appreciation | (Depreciation) | (Depreciation) |
|
| Aggressive Allocation | $ 29,190,088 | $ 218,536 | $ (21,151) | $ 197,385 |
| Moderately Aggressive Allocation | 65,693,720 | 319,741 | (150,253) | 169,488 |
| Moderate Allocation | 78,987,576 | 310,921 | (279,956) | 30,965 |
| Moderately Conservative Allocation | 33,702,869 | 98,877 | (147,166) | (48,289) |
| Technology | 58,514,460 | 5,568,532 | (9,715,166) | (4,146,634) |
| Partner Small Cap Growth | 14,996,207 | 978,244 | (509,987) | 468,257 |
| Partner Small Cap Value | 102,257,769 | 14,805,776 | (4,353,807) | 10,451,969 |
| Small Cap Stock | 492,409,961 | 92,788,527 | (11,778,808) | 81,009,719 |
| Small Cap Index | 46,720,308 | 14,369,423 | (2,571,391) | 11,798,032 |
| Mid Cap Growth | 338,210,490 | 43,639,179 | (9,688,428) | 33,950,751 |
| Partner Mid Cap Value | 9,389,489 | 314,417 | (265,962) | 48,455 |
| Mid Cap Stock | 1,035,628,250 | 168,584,562 | (23,714,405) | 144,870,157 |
| Mid Cap Index | 63,155,021 | 13,901,638 | (3,483,796) | 10,417,842 |
| Mid Cap Index-I | 22,362,311 | 5,571,176 | (880,908) | 4,690,268 |
| Partner International Stock | 397,441,201 | 49,879,094 | (7,949,020) | 41,930,074 |
| Large Cap Growth | 183,071,347 | 12,441,671 | (7,921,081) | 4,520,590 |
| Large Cap Value | 351,164,897 | 57,170,949 | (10,819,093) | 46,351,856 |
| Large Cap Stock | 2,910,588,607 | 802,252,984 | (64,574,267) | 737,678,717 |
| Large Cap Index | 97,402,099 | 11,523,252 | (9,866,071) | 1,657,181 |
| Large Cap Index-I | 31,189,700 | 4,881,785 | (4,182,149) | 699,636 |
| Balanced | 458,586,710 | 25,643,604 | (13,438,594) | 12,205,010 |
| High Yield | 677,373,073 | 16,955,650 | (18,879,808) | (1,924,158) |
| High Yield II | 154,017,799 | 2,448,119 | (2,582,475) | (134,356) |
| Municipal Bond | 1,173,577,050 | 91,113,031 | (2,475,705) | 88,637,326 |
| Income | 740,552,441 | 4,458,508 | (12,561,675) | (8,103,167) |
| Core Bond | 679,261,269 | 493,651 | (9,196,988) | (8,703,337) |
| Limited Maturity Bond | 199,411,808 | 403,032 | (2,270,162) | (1,867,130) |
| Money Market | 940,775,277 | -- | -- | -- |
240
THRIVENT MUTUAL FUNDS
NOTES TO FINANCIAL STATEMENTS
As of October 31, 2005
|
(5) DISTRIBUTIONS BY CLASS
Distributions to shareholder, by class, for the year ended October 31, 2005, the period or year ended October 31, 2004 and the year ended April 30, 2004, were as follows:
| | | | Net Investment Income | | |
| | ----------------------------------------------------------------------------------------------------------------------------------------------------------------------------------------------------------------------------- |
| | For the year ended, | For the year ended, | |
| | October 31, 2005 | | | October 31, 2004 | |
| | ------------------------------------------------------------ | ------------------------------------------------------------ |
| | | | Institutional | | | Institutional |
| Fund | Class A | Class B | Class | Class A | Class B | Class |
| -------------------------------------------------- | ---------------- | ---------------- | ---------------- | ---------------- | ---------------- | ---------------- |
| Moderate Allocation Fund | $ 84,047 | $ N/A | $ 1,050 | $ N/A | $ N/A | $ N/A |
| Moderately Conservative Allocation Fund | 53,752 | N/A | 1,056 | N/A | N/A | N/A |
| Partner International Stock Fund | 52,742 | -- | 17,440 | 303,032 | -- | 140,697 |
| Large Cap Growth Fund | 41,063 | -- | 7,760 | 141,682 | -- | 32,456 |
| Large Cap Value Fund | 1,266,086 | -- | 146,510 | 476,584 | 33,419 | 83,660 |
| High Yield Fund | 44,855,146 | 1,884,350 | 878,865 | 44,927,119 | 2,384,261 | 819,687 |
| Municipal Bond Fund | 54,576,418 | 1,139,478 | 240,701 | 36,988,547 | 1,019,225 | 161,403 |
| Income Fund | 23,801,098 | 757,982 | 1,618,155 | 23,668,888 | 892,216 | 1,228,823 |
| Limited Maturity Bond Fund | 4,214,827 | 66,216 | 487,528 | 2,809,251 | 118,669 | 393,688 |
| |
| | For the year ended, | For the six months ended, |
| | October 31, 2005 | | October 31, 2004 | |
| | ----------------------------------------------------------------------------------------------- | ----------------------------------------------------------------------------------------------- |
| | | | Institutional | | | Institutional |
| Fund | Class A | Class B | Class | Class A | Class B | Class |
| -------------------------------------------------- | ---------------- | ---------------- | ---------------- | ---------------- | ---------------- | ---------------- |
| Partner Small Cap Value Fund | $60,956 | -- | $60,758 | $-- | $-- | $-- |
| Small Cap Index Fund | 69,683 | N/A | N/A | -- | -- | N/A |
| Mid Cap Index Fund | 108,546 | N/A | N/A | 6,127 | -- | N/A |
| Mid Cap Index Fund-I | N/A | N/A | 141,843 | N/A | N/A | -- |
| Large Cap Stock Fund | 21,399,610 | -- | 966,075 | 3,233,249 | -- | 156,199 |
| Large Cap Index Fund | 794,013 | N/A | N/A | 188,833 | -- | N/A |
| Large Cap Index Fund-I | N/A | N/A | 457,553 | N/A | N/A | -- |
| Balanced Fund | 5,092,320 | 126,181 | 2,364,401 | 2,267,009 | 59,233 | 1,161,630 |
| High Yield Fund II | 9,905,335 | 313,008 | 327,280 | 4,825,734 | 180,843 | 146,855 |
| Core Bond Fund | 18,189,070 | 370,854 | 1,695,128 | 9,763,845 | 220,552 | 831,063 |
| Money Market Fund | 13,834,725 | 39,585 | 6,689,247 | 1,569,788 | 4,887 | 752,750 |
| |
| | For the year ended, | | | |
| | April 30, 2004 | | | | |
| | ------------------------------------------------------------------------------------------------------ | | | |
| | | | Institutional | | | |
| Fund | Class A | Class B | Class | | | |
| -------------------------------------------------- | ---------------- | ---------------- | ---------------- | | | |
| Large Cap Stock Fund | $10,195,390 | -- | $ 624,423 | | | |
| Large Cap Index Fund | 450,406 | -- | N/A | | | |
| Balanced Fund | 4,643,481 | 143,357 | 2,448,221 | | | |
| High Yield Fund II | 9,192,442 | 384,178 | 270,708 | | | |
| Core Bond Fund | 21,399,539 | 454,489 | 1,468,011 | | | |
| Money Market Fund | 976,431 | 1,593 | 618,895 | | | |
|
| 241 | | | | |
THRIVENT MUTUAL FUNDS
NOTES TO FINANCIAL STATEMENTS
As of October 31, 2005
|
(5) DISTRIBUTIONS BY CLASS -- continued
| | | | | Net Realized Gains | | |
| | | ------------------------------------------------------------------------------------------------------------------------------------------------------------------------------------------------------------------------------------------------------------------------------------------------------------------ |
| | | For the year ended, | | For the year ended, |
| | | October 31, 2005 | | October 31, 2004 | |
| | | ----------------------------------------------------------------------------------------------------------------------------- | ---------------------------------------------------------------------------------------------------------------------------------------------------------------------------- |
| | | | | Institutional | | | Institutional |
| Fund | | Class A | Class B | Class | Class A | Class B | Class |
| -------------------------------------------------- | | ---------------- | ---------------- | ---------------- | ---------------- | ---------------- | ---------------- |
| |
| Municipal Bond Fund | | $-- | $-- | $-- | $3,259,485 | $118,588 | $12,930 |
| |
| Limited Maturity Bond | | 282,527 | 4,817 | 21,933 | 891,977 | 58,322 | 141,560 |
| |
| |
| | | For the year ended, | | For the six months ended, |
| | | October 31, 2005 | | October 31, 2004 | |
| | | ------------------------------------------------------------------------------------------------------------------------------------ | ------------------------------------------------------------------------------------------------------------------------------------ |
| | | | | Institutional | | | Institutional |
| Fund | | Class A | Class B | Class | Class A | Class B | Class |
| -------------------------------------------------- | | ---------------- | ---------------- | ---------------- | ---------------- | ---------------- | ---------------- |
| |
| Partner Small Cap Value Fund | | $8,343,475 | $713,424 | $1,814,181 | $1,273,313 | $115,143 | $260,592 |
| |
| Small Cap Stock Fund | | 20,078,791 | 1,326,981 | 550,449 | 21,984,118 | 1,544,318 | 611,735 |
| |
| Small Cap Index Fund | | 276,597 | N/A | N/A | 1,238,820 | -- | N/A |
| |
| Mid Cap Index Fund | | 213,705 | N/A | N/A | -- | -- | N/A |
| |
| Mid Cap Index Fund-I | | N/A | N/A | 571,863 | N/A | N/A | 467,289 |
| |
| Large Cap Stock Fund | | -- | -- | -- | 513,070,734 | 14,025,778 | 15,594,285 |
| |
| Balanced Fund | | 4,255,139 | 257,863 | 1,626,891 | -- | -- | -- |
| |
| Core Bond Fund | | -- | -- | -- | 446,614 | 13,140 | 34,078 |
| |
| |
| | | For the year ended, | | | | |
| | | April 30, 2004 | | | | |
| | | ------------------------------------------------------------------------------------------------------------------ | | | |
| | | | | Institutional | | | |
| Fund | | Class A | Class B | Class | | | |
| -------------------------------------------------- | | ---------------- | ---------------- | ---------------- | | | |
| |
| Small Cap Index Fund | | $103,953 | $12,335 | $-- | | | |
| |
| |
| (6) SECURITY TRANSACTIONS | | | | | In thousands |
|
|
| |
| | | | Fund | | Purchases | Sales | |
|
|
| |
| (A) Purchases and Sales of Investment Securities -- | Mid Cap Growth Fund | $450,779 | $483,648 | |
| For the year ended October 31, 2005, the cost of purchases and | Partner Mid Cap Value Fund | 9,234 | 967 | |
| the proceeds from sales of investment securities other than | Mid Cap Stock Fund | 875,887 | 923,601 | |
| U.S. Government and short-term securities were as follows: | Mid Cap Index Fund | | 13,108 | |
| | 17,166 |
| |
| | | | Mid Cap Index Fund-I | 10,628 | 7,859 | |
| | In thousands | | | | | |
|
| |
| | | | Partner International Stock Fund | 191,380 | 135,123 | |
| Fund | Purchases | Sales | | | | | |
| |
| | | | Large Cap Growth Fund | 202,436 | 146,176 | |
| Aggressive Allocation Fund | $ 28,953 | $351 | | | | | |
| | | | Large Cap Value Fund | 203,077 | 186,955 | |
| Moderately Aggressive | | | | | | | |
| | | | Large Cap Stock Fund | 1,628,291 | 2,221,456 | |
| Allocation Fund | 64,996 | 1,287 | | | | | |
| | | | Large Cap Index Fund | 22,310 | 8,104 | |
| Moderate Allocation Fund | 76,042 | 1,023 | | | | | |
| | | | Large Cap Index Fund-I | 3,244 | 3,854 | |
| Moderately Conservative | | | | | | | |
| | | | Balanced Fund | 511,678 | 520,701 | |
| Allocation Fund | 30,872 | 553 | | | | | |
| | | | High Yield Fund | 325,701 | 349,154 | |
| Technology Fund | 18,050 | 21,628 | | | | | |
| | | | High Yield Fund II | 78,278 | 87,049 | |
| Partner Small Cap Growth Fund | 16,334 | 4,168 | | | | | |
| | | | Municipal Bond Fund | 96,086 | 99,036 | |
| Partner Small Cap Value Fund | 56,840 | 48,520 | | | | | |
| | | | Income Fund | 594,369 | 549,717 | |
| Small Cap Stock Fund | 518,088 | 528,583 | | | | | |
| | | | Core Bond Fund | 446,326 | 381,384 | |
| Small Cap Index Fund | 12,852 | 7,196 | | | | | |
| | | | Limited Maturity Bond Fund | 144,382 | 93,479 | |
|
| |
| 242 | | | | |
THRIVENT MUTUAL FUNDS
NOTES TO FINANCIAL STATEMENTS
As of October 31, 2005
Purchases and sales of U.S. Government securities were:
| | In thousands |
|
|
| Fund | Purchases | Sales |
|
| Balanced Fund | $440,438 | $434,880 |
| Income Fund | 999,127 | 997,601 |
| Core Bond Fund | 1,610,790 | 1,579,709 |
| Limited Maturity Bond Fund | 345,870 | 340,184 |
(B) Investments in Restricted Securities -- The High Yield Fund and High Yield Fund II own restricted securities that were purchased in private placement transactions without registration under the Securities Act of 1933. Unless such securities subsequently become registered, they generally may be resold only in privately negotiated transactions with a limited number of purchasers. The aggregate value of restricted securities was $248,685 and $0 at October 31, 2005, which represented 0.04% and 0.00% of the net assets of the High Yield Fund and High Yield Fund II, respectively. The Funds have no right to require registration of unregistered securities.
(C) Investments in High-Yielding Securities -- The High Yield Fund and the High Yield Fund II invest primarily in high-yielding fixed-income securities. Each of the other Funds except the Municipal Bond Fund and the Money Market Fund may also invest in high-yielding securities. These securities will typically be in the lower rating categories or will be non-rated and generally will involve more risk than securities in the higher rating categories. Lower rated or unrated securities are more likely to react to developments affecting market risk and credit risk than are more highly rated securities, which react primarily to movements in the general level of interest rates.
(D) Investments in Options and Futures Contracts -- The movement in the price of the security underlying an option or futures contract may not correlate perfectly with the movement in the prices of the portfolio securities being hedged. A lack of correlation could render the Fund’s hedging strategy unsuccessful and could result in a loss to the Fund. In the event that a liquid secondary market would not exist, the Fund could be prevented from entering into a closing transaction, which could result in additional losses to the Fund.
(E) Written Option Contracts -- The number of contracts and premium amounts associated with call option contracts written during the year ended October 31, 2005, were as follows:
| | Large Cap Growth Fund |
|
|
| | Number of | Premium |
| | Contracts | Amount |
|
| Balance at October 31, 2004 | 14 | $ 629 |
| Opened | 820 | 94,919 |
| Closed | (606) | (69,410) |
| Expired | (153) | (14,837) |
| Exercised | (56) | (7,048) |
| | -------------- | ------------ |
| Balance at October 31, 2005 | 19 | $ 4,253 |
| | ======= | ======= |
| | Balanced Fund |
|
|
| | Number of | Premium |
| | Contracts | Amount |
|
| Balance at October 31, 2004 | -- | $ -- |
| Opened | 357 | 148,302 |
| Closed | (325) | (138,382) |
| Expired | (32) | (9,920) |
| Exercised | -- | -- |
| | -------------- | ------------ |
| Balance at October 31, 2005 | -- | $ -- |
| | ======= | ======= |
| | Income Fund |
|
|
| | Number of | Premium |
| | Contracts | Amount |
|
| Balance at October 31, 2004 | -- | $ -- |
| Opened | 1,107 | 460,176 |
| Closed | (1,020) | (433,206) |
| Expired | (87) | (26,970) |
| Exercised | -- | -- |
| | -------------- | ------------ |
| Balance at October 31, 2005 | -- | $ -- |
| | ======= | ======= |
| | Core Bond Fund |
|
|
| | Number of | Premium |
| | Contracts | Amount |
|
| Balance at October 31, 2004 | -- | $ -- |
| Opened | 1,344 | 558,828 |
| Closed | (1,234) | (524,728) |
| Expired | (110) | (34,100) |
| Exercised | -- | -- |
| | -------------- | ------------ |
| Balance at October 31, 2005 | -- | $ -- |
| | ======= | ======= |
| | Limited Maturity |
| | Bond Fund |
|
|
| | Number of | Premium |
| | Contracts | Amount |
|
| Balance at October 31, 2004 | -- | $ -- |
| Opened | 157 | 65,136 |
| Closed | (142) | (60,486) |
| Expired | (15) | (4,650) |
| Exercised | -- | -- |
| | -------------- | ------------ |
| Balance at October 31, 2005 | -- | $ -- |
| | ======= | ======= |
243
THRIVENT MUTUAL FUNDS
NOTES TO FINANCIAL STATEMENTS
As of October 31, 2005
|
(7) INVESTMENTS IN AFFILIATES
Affiliated issuers, as defined under the Investment Company Act of 1940, include those in which the Fund’s holdings of an issuer represent 5% or more of the outstanding voting securities of an issuer, or any affiliated mutual fund. A summary of transactions for the year ended October 31, 2005, in the Money Market Fund, is as follows:
| | Gross | Gross | Balance of Shares | | Dividend Income |
| | Purchases and | Sales and | Held October 31, | Value | Period Ending |
| | Additions | Reductions | 2005 | October 31, 2005 | October 31, 2005 |
|
| Aggressive Allocation Fund | $ 588,666 | $-- | | 588,666 | $ 588,666 | $ 2,686 |
| Moderately Aggressive Allocation Fund | 1,983,082 | -- | | 1,983,082 | 1,983,082 | 9,714 |
| Moderate Allocation Fund | 4,601,743 | 633,338 | | 3,968,406 | 3,968,406 | 20,631 |
| Moderately Conservative Allocation Fund | 3,677,528 | 295,235 | | 3,382,293 | 3,382,293 | 18,306 |
| Technology Fund | 17,774,741 | 17,296,165 | 2,204,466 | 2,204,466 | 40,398 |
| Partner Small Cap Growth Fund | 2,256,984 | 1,609,047 | 647,938 | 647,938 | 3,455 |
| Partner Small Cap Value Fund | 22,196,846 | 23,456,954 | 2,680,241 | 2,680,241 | 57,272 |
| Small Cap Stock Fund | 95,306,130 | 95,010,141 | 21,200,500 | 21,200,500 | 520,988 |
| Small Cap Index Fund | 8,900,015 | 8,145,831 | 1,552,137 | 1,552,137 | 36,211 |
| Mid Cap Growth Fund | 111,758,503 | 111,314,660 | 12,261,602 | 12,261,602 | 226,872 |
| Partner Mid Cap Value Fund | 1,538,619 | 1,529,569 | 9,051 | 9,051 | 2,718 |
| Mid Cap Stock Fund | 46,323,546 | 43,912,804 | 27,998,103 | 27,998,103 | 659,135 |
| Mid Cap Index Fund | 11,038,495 | 9,972,384 | 2,054,082 | 2,054,082 | 42,631 |
| Mid Cap Index Fund-I | 13,284,479 | 12,942,822 | 1,116,858 | 1,116,858 | 16,308 |
| Partner International Stock Fund | 41,182,822 | 40,370,743 | 5,011,720 | 5,011,720 | 131,372 |
| Large Cap Growth Fund | 43,141,088 | 41,255,229 | 3,842,301 | 3,842,301 | 79,589 |
| Large Cap Value Fund | 89,697,232 | 80,957,214 | 12,242,985 | 12,242,985 | 254,683 |
| Large Cap Stock Fund | 2,974,000 | 1,742,978 | 27,657,596 | 27,657,596 | 685,629 |
| Large Cap Index Fund | 15,670,805 | 17,184,249 | 742,456 | 742,456 | 62,126 |
| Large Cap Index Fund-I | 8,121,012 | 7,430,935 | 1,012,152 | 1,012,152 | 19,660 |
| Balanced Fund | 12,212,543 | 18,740,692 | 13,185,640 | 13,185,640 | 479,047 |
| High Yield Fund | 164,822,855 | 159,815,254 | 25,764,469 | 25,764,469 | 549,327 |
| High Yield Fund II | 47,863,548 | 49,306,964 | 4,387,353 | 4,387,353 | 105,278 |
| Income Fund | 35,131,092 | 37,710,821 | 24,298,415 | 24,298,415 | 666,612 |
| Core Bond Fund | 3,548,109 | 4,139,885 | 24,144,850 | 24,144,850 | 612,726 |
| Limited Maturity Bond Fund | 4,564,992 | 5,708,695 | 4,569,514 | 4,569,514 | 174,876 |
|
| |
| |
| 244 | | | | |
THRIVENT MUTUAL FUNDS
NOTES TO FINANCIAL STATEMENTS
As of October 31, 2005
|
A summary of transactions for the year ended October 31, 2005, in the Thrivent Financial Securities Lending Trust, is as follows:
| | | Gross | | Gross | Balance of Shares | |
| | | Purchases and | | Sales and | Held October 31, | Value |
| | | Additions | | Reductions | 2005 | October 31, 2005 |
|
| Technology Fund | | $22,312,389 | | $19,925,653 | 5,647,242 | $5,647,242 |
| Partner Small Cap Growth Fund | | 3,700,530 | | 1,365,585 | 2,334,945 | 2,334,945 |
| Partner Small Cap Value Fund | | 74,799,033 | | 70,048,330 | 16,170,830 | 16,170,830 |
| Small Cap Stock Fund | | 505,101,584 | | 484,415,628 | 88,413,094 | 88,413,094 |
| Small Cap Index Fund | | 34,594,305 | | 30,233,990 | 11,615,792 | 11,615,792 |
| Mid Cap Growth Fund | | 259,523,092 | | 239,420,965 | 53,154,317 | 53,154,317 |
| Partner Mid Cap Value | | 862,265 | | 332,718 | 529,547 | 529,547 |
| Mid Cap Stock Fund | | 950,091,043 | | 918,846,495 | 172,111,641 | 172,111,641 |
| Mid Cap Index Fund | | 38,025,682 | | 32,964,716 | 11,062,822 | 11,062,822 |
| Mid Cap Index Fund-I | | 11,149,576 | | 8,447,938 | 3,998,252 | 3,998,252 |
| Partner International Stock Fund | | 300,079,067 | | 289,438,878 | 58,619,277 | 58,619,277 |
| Large Cap Growth Fund | | 66,369,408 | | 60,683,844 | 7,339,698 | 7,339,698 |
| Large Cap Value Fund | | 162,420,573 | | 154,248,230 | 14,008,574 | 14,008,574 |
| Large Cap Stock Fund | | 2,144,045,505 | | 2,108,568,367 | 74,365,656 | 74,365,656 |
| Large Cap Index Fund | | 23,659,429 | | 19,636,652 | 4,844,539 | 4,844,539 |
| Large Cap Index Fund-I | | 4,202,593 | | 4,087,091 | 438,476 | 438,476 |
| Balanced Fund | | 236,977,056 | | 226,918,583 | 45,238,731 | 45,238,731 |
| High Yield Fund | | 328,539,248 | | 343,139,514 | 82,460,818 | 82,460,818 |
| High Yield Fund II | | 97,794,130 | | 100,196,619 | 22,348,675 | 22,348,675 |
| Income Fund | | 471,725,927 | | 528,892,662 | 60,887,414 | 60,887,414 |
| Core Bond Fund | | 384,782,358 | | 385,037,947 | 48,712,809 | 48,712,809 |
| Limited Maturity Bond Fund | | 132,972,601 | | 140,061,472 | 10,863,600 | 10,863,600 |
A summary of transactions for the Thrivent Allocation Funds for the period ended October 31, 2005, in the following Thrivent Mutual Funds, is as follows:
| | | Gross | Gross | Balance of | | Dividend Income |
| | | Purchases and | Sales and | Shares Held at | Value | June 30, 2005 – |
| Fund | | Additions | Reductions | October 31, 2005 | October 31, 2005 | October 31, 2005 |
|
| Aggressive Allocation | | | | | | |
| Partner Small Cap Growth | | $1,165,281 | $-- | $113,526 | $1,167,043 | $ -- |
| Partner Small Cap Value | | 1,164,946 | -- | 80,116 | 1,167,296 | -- |
| Small Cap Stock | | 1,459,167 | -- | 77,090 | 1,453,138 | -- |
| Mid Cap Growth | | 1,165,959 | -- | 75,969 | 1,172,955 | -- |
| Partner Mid Cap Value | | 1,167,726 | -- | 114,520 | 1,161,236 | -- |
| Mid Cap Stock | | 1,750,496 | -- | 95,026 | 1,770,335 | -- |
| Partner International Stock | | 7,300,789 | -- | 689,418 | 7,425,036 | -- |
| Large Cap Growth | | 4,668,405 | -- | 904,968 | 4,705,835 | -- |
| Large Cap Value | | 3,517,900 | 14,745 | 241,060 | 3,519,479 | -- |
| Large Cap Stock | | 3,568,927 | 71,369 | 134,259 | 3,508,198 | -- |
| Real Estate Securities | | 1,194,911 | 27,396 | 115,803 | 1,161,506 | 5,269 |
| Limited Maturity Bond | | 828,057 | 238,684 | 46,641 | 586,750 | 3,624 |
| Money Market | | 588,666 | -- | 588,666 | 588,666 | 2,685 |
|
| |
| 245 | | | |
THRIVENT MUTUAL FUNDS
NOTES TO FINANCIAL STATEMENTS
As of October 31, 2005
|
(7) INVESTMENTS IN AFFILIATES -- continued
| | Gross | | Gross | Balance of | | Dividend Income |
| | Purchases and | | Sales and | Shares Held at | Value | June 30, 2005 – |
| Fund | Additions | | Reductions | October 31, 2005 | October 31, 2005 | October 31, 2005 |
|
| Moderately Aggressive Allocation | | | | | | |
| Partner Small Cap Growth | $1,967,319 | | $-- | 190,712 | $1,960,515 | $-- |
| Partner Small Cap Value | 1,967,198 | | -- | 134,572 | 1,960,714 | -- |
| Small Cap Stock | 2,075,017 | | 111,281 | 103,541 | 1,951,752 | -- |
| Mid Cap Growth | 1,965,705 | | -- | 127,695 | 1,971,618 | -- |
| Partner Mid Cap Value | 1,968,096 | | -- | 192,243 | 1,949,345 | -- |
| Mid Cap Stock | 2,623,604 | | -- | 141,934 | 2,644,230 | -- |
| Partner International Stock | 15,085,443 | | -- | 1,422,517 | 15,320,504 | -- |
| Large Cap Growth | 9,183,559 | | -- | 1,776,046 | 9,235,440 | -- |
| Large Cap Value | 7,218,674 | | -- | 495,167 | 7,229,438 | -- |
| Large Cap Stock | 7,416,074 | | 207,989 | 275,863 | 7,208,287 | -- |
| Real Estate Securities | 2,741,505 | | 114,555 | 259,393 | 2,601,709 | 13,280 |
| Income | 3,867,012 | | 556,336 | 381,509 | 3,261,901 | 24,010 |
| Limited Maturity Bond | 6,917,130 | | 300,241 | 523,424 | 6,584,673 | 38,872 |
| Money Market | 1,983,082 | | -- | 1,983,082 | 1,983,082 | 9,715 |
| |
| Moderate Allocation | | | | | | |
| Small Cap Stock | 4,723,122 | | -- | 248,485 | 4,683,937 | -- |
| Mid Cap Stock | 5,509,677 | | -- | 298,037 | 5,552,422 | -- |
| Partner International Stock | 14,175,125 | | -- | 1,336,345 | 14,392,438 | -- |
| Large Cap Growth | 10,240,054 | | -- | 1,978,517 | 10,288,289 | -- |
| Large Cap Value | 7,879,783 | | -- | 540,185 | 7,886,699 | -- |
| Large Cap Stock | 8,664,018 | | -- | 331,129 | 8,652,406 | -- |
| Real Estate Securities | 3,946,590 | | -- | 389,118 | 3,902,856 | 19,806 |
| High Yield | 3,194,452 | | -- | 623,302 | 3,135,211 | 37,612 |
| Income | 5,795,305 | | 1,026,835 | 549,690 | 4,699,850 | 34,803 |
| Limited Maturity Bond | 11,913,591 | | -- | 942,450 | 11,856,027 | 68,776 |
| Money Market | 4,601,743 | | 633,338 | 3,968,406 | 3,968,406 | 20,631 |
| |
| Moderately Conservative | | | | | | |
| Small Cap Stock | 1,340,294 | | -- | 70,575 | 1,330,342 | -- |
| Mid Cap Stock | 1,340,190 | | -- | 72,607 | 1,352,667 | -- |
| Partner International Stock | 4,021,429 | | -- | 379,764 | 4,090,053 | -- |
| Large Cap Growth | 3,353,625 | | -- | 648,382 | 3,371,589 | -- |
| Large Cap Value | 2,348,194 | | -- | 161,037 | 2,351,138 | -- |
| Large Cap Stock | 2,680,836 | | -- | 102,535 | 2,679,243 | -- |
| Real Estate Securities | 1,135,342 | | 130,829 | 99,384 | 996,818 | 5,269 |
| High Yield | 1,361,559 | | -- | 265,595 | 1,335,945 | 16,915 |
| Income | 4,150,259 | | 423,268 | 429,343 | 3,670,879 | 28,196 |
| Limited Maturity Bond | 9,139,812 | | -- | 722,863 | 9,093,613 | 55,327 |
| Money Market | 3,677,528 | | 295,235 | 3,382,293 | 3,382,293 | 18,305 |
|
| |
| 246 | | | | |
THRIVENT MUTUAL FUNDS
NOTES TO FINANCIAL STATEMENTS
As of October 31, 2005
|
(8) SECURITY TRANSACTIONS WITH AFFILIATED FUNDS
The Funds are permitted to purchase or sell securities from or to certain other Funds under specified conditions outlined in procedures adopted by the Board of Trustees of the Trust. The procedures have been designed to ensure that any purchase or sale of securities by the Fund from or to another fund or portfolio that is or could be considered an affiliate by virtue of having a common investment advisor (or affiliated investment advisors), common Trustees and/or common officers complies with Rule 17a-7 of the 1940 Act. Further, as defined under the procedures, each transaction is effected at the current market price. Pursuant to these procedures, during the year ended October 31, 2005, the Funds engaged in purchases and sales of securities of $3,645,723 and $5,157,556, respectively.
(9) RELATED PARTY TRANSACTIONS
As of October 31, 2005, related parties held 1,000,000 shares or 75.3% of Partner Small Cap Growth Fund’s outstanding shares, 500,000 shares or 57.9% of Partner Mid Cap Value Fund’s outstanding shares, and 422,473 shares or 24.4% of Mid Cap Index Fund-I’s outstanding shares.
As of October 31, 2005, retirement plans sponsored by Thrivent Financial for Lutherans held 359,604 shares or 12.7% of Aggressive Allocation Fund’s outstanding shares, 856,961 shares or 12.6% of Partner Small Cap Value Fund’s outstanding shares, 989,833 shares or 57.2% of Mid Cap Index Fund-I’s outstanding shares, 1,408,870 shares or 5.3% of Large Cap Value Fund’s outstanding shares, 3,240,556 shares or 85.3% of Large Cap Index Fund-I’s outstanding shares, and 7,702,218 shares or 24.2% of Balanced Fund’s outstanding shares.
(10) SHARES OF BENEFICIAL INTEREST
The Declaration of Trust permits the Trust to issue an unlimited number of full and fractional shares of beneficial interest of all of the Funds. Automated conversions of Class B shares to Class A shares are included in the shares redeemed and sold amount. Transactions in Fund shares were as follows:
| | | Aggressive Allocation Fund | |
| | ------------------------------------------------------------------------------------------------------------------------------------------------------------------------------------ |
| | Class A | Institutional Class |
| | ----------------------------------------------------------------------------------------- | --------------------------------------------------------------------------------------- |
| Period Ended October 31, 2005* | Shares | Amount | Shares | Amount |
| -------------------------------------------------- | ---------------- | ------------------ | ---------------- | ---------------- |
| Sold | 2,539,432 | $26,218,740 | 400,862 | $4,121,513 |
| |
| Dividends and distributions reinvested | -- | -- | -- | -- |
| |
| Redeemed | (106,007) | (1,110,080) | (1) | (10) |
| | ---------------- | ------------------ | ---------------- | ---------------- |
| Net change | 2,433,425 | $25,108,660 | 400,861 | $4,121,503 |
| | ======== | ======== | ======== | ======== |
| |
| |
| |
| | Moderately Aggressive Allocation Fund |
| | ------------------------------------------------------------------------------------------------------------------------------------------------------------------------------------ |
| | Class A | Institutional Class |
| | ----------------------------------------------------------------------------------------- | --------------------------------------------------------------------------------------- |
| Period Ended October 31, 2005* | Shares | Amount | Shares | Amount |
| -------------------------------------------------- | ---------------- | ------------------ | ---------------- | ---------------- |
| Sold | 6,318,180 | $64,978,054 | 264,360 | $2,705,003 |
| |
| Dividends and distributions reinvested | -- | -- | -- | -- |
| |
| Redeemed | (194,091) | (2,005,440) | (1) | (10) |
| | ---------------- | ------------------ | ---------------- | ---------------- |
| Net change | 6,124,089 | $62,972,614 | 264,359 | $2,704,993 |
| | ======== | ======== | ======== | ======== |
| |
| | Moderate Allocation Fund | |
| | ------------------------------------------------------------------------------------------------------------------------------------------------------------------------------------ |
| | Class A | Institutional Class |
| | ----------------------------------------------------------------------------------------- | --------------------------------------------------------------------------------------- |
| Period Ended October 31, 2005* | Shares | Amount | Shares | Amount |
| -------------------------------------------------- | ---------------- | ------------------ | ---------------- | ---------------- |
| Sold | 7,597,586 | $77,579,096 | 281,371 | $2,860,982 |
| |
| Dividends and distributions reinvested | 8,054 | 83,525 | 101 | 1,050 |
| |
| Redeemed | (153,929) | (1,583,773) | (8) | (81) |
| | ---------------- | ------------------ | ---------------- | ---------------- |
| Net change | 7,451,711 | $76,078,848 | 281,464 | $2,861,951 |
| | ======== | ======== | ======== | ======== |
| |
| *For the period from June 30, 2005 (Inception) to October 31, 2005. | | |
|
| |
| |
| 247 | | |
THRIVENT MUTUAL FUNDS
NOTES TO FINANCIAL STATEMENTS
As of October 31, 2005
|
(10) SHARES OF BENEFICIAL INTEREST -- continued
| | Moderately Conservative Allocation Fund | | |
| | ---------------------------------------------------------------------------------------------------------------------------------------------- | | |
| | Class A | Institutional Class | | |
| | ------------------------------------------------------------ | ---------------------------------------------------------- | | |
| Period Ended October 31, 2005* | Shares | Amount | Shares | Amount | | |
| -------------------------------------------------- | ---------------- | ------------------ | ---------------- | ---------------- | | |
| Sold | 3,376,617 | $34,227,042 | 75,332 | $755,613 | | |
| |
| Dividends and distributions reinvested | 5,184 | 53,085 | 103 | 1,056 | | |
| |
| Redeemed | (134,194) | (1,367,449) | (7) | (71) | | |
| | ---------------- | ------------------ | ---------------- | ---------------- | | |
| Net change | 3,247,607 | $32,912,678 | 75,428 | $756,598 | | |
| | ======== | ======== | ======== | ======== | | |
| |
| | | | Technology Fund | | |
| | ------------------------------------------------------------------------------------------------------------------------------------------------------------------------------------------------------------------------------ |
| | Class A | Class B | Institutional Class |
| | ------------------------------------------------------------ | ---------------------------------------------------------- | ---------------------------------------------------------- |
| Year Ended April 30, 2004 | Shares | Amount | Shares | Amount | Shares | Amount |
| -------------------------------------------------- | ---------------- | ------------------ | ---------------- | ---------------- | ---------------- | ---------------- |
| Sold | 4,806,864 | $15,567,018 | 478,699 | $1,515,638 | 15,237 | $52,999 |
| |
| Dividends and distributions reinvested | -- | -- | -- | -- | -- | -- |
| |
| Redeemed | (3,544,283) | (11,544,431) | (290,521) | (892,403) | (3,779) | (13,549) |
| | ---------------- | ------------------ | ---------------- | ---------------- | ---------------- | ---------------- |
| Net change | 1,262,581 | $4,022,587 | 188,178 | $623,235 | 11,458 | $39,450 |
| | ======== | ======== | ======== | ======== | ======== | ======== |
| |
| Period Ended October 31, 2004 | | | | | | |
| -------------------------------------------------- | | | | | | |
| Sold | 1,101,807 | $3,480,815 | 122,735 | $372,864 | -- | $-- |
| |
| Dividends and distributions reinvested | -- | -- | -- | -- | -- | -- |
| |
| Redeemed | (1,107,219) | (3,504,722) | (111,412) | (338,348) | (2,434) | (7,942) |
| | ---------------- | ------------------ | ---------------- | ---------------- | ---------------- | ---------------- |
| Net change | (5,412) | $(23,907) | 11,323 | $34,516 | (2,434) | $(7,942) |
| | ======== | ======== | ======== | ======== | ======== | ======== |
| |
| Year Ended October 31, 2005 | | | | | | |
| -------------------------------------------------- | | | | | | |
| Sold | 2,413,463 | $8,199,817 | 61,398 | $199,867 | 3,449 | $12,581 |
| |
| Dividends and distributions reinvested | -- | -- | -- | -- | -- | -- |
| |
| Redeemed | (3,128,503) | (10,679,889) | (279,898) | (923,848) | (164,088) | (573,609) |
| | ---------------- | ------------------ | ---------------- | ---------------- | ---------------- | ---------------- |
| Net change | (715,040) | $(2,480,072) | (218,500) | $(723,981) | (160,639) | $(561,028) |
| | ======== | ======== | ======== | ======== | ======== | ======== |
| |
| | | Partner Small Cap Growth Fund | | | |
| | ---------------------------------------------------------------------------------------------------------------------------------------------- | | |
| | Class A | Institutional Class | | |
| | ------------------------------------------------------------ | ---------------------------------------------------------- | | |
| Period Ended October 31, 2005* | Shares | Amount | Shares | Amount | | |
| -------------------------------------------------- | ---------------- | ------------------ | ---------------- | ---------------- | | |
| Sold | 923,858 | $9,244,828 | 404,238 | $4,132,659 | | |
| |
| Dividends and distributions reinvested | -- | -- | -- | -- | | |
| |
| Redeemed | (70) | (742) | (1) | (10) | | |
| | ---------------- | ------------------ | ---------------- | ---------------- | | |
| Net change | 923,788 | $9,244,086 | 404,237 | $4,132,649 | | |
| | ======== | ======== | ======== | ======== | | |
| |
| *For the period from June 30, 2005 (Inception) to October 31, 2005. | | | | |
|
| |
| 248 | | | | |
THRIVENT MUTUAL FUNDS
NOTES TO FINANCIAL STATEMENTS
As of October 31, 2005
|
| | | | Partner Small Cap Value Fund | | |
| | ---------------------------------------------------------------------------------------------------------------------------------------------------------------------------------------------------------------------------------------------- |
| | Class A | Class B | Institutional Class |
| | ----------------------------------------------------------------------- | --------------------------------------------------------------------- | --------------------------------------------------------------------- |
| Year Ended April 30, 2004 | Shares | Amount | Shares | Amount | Shares | Amount |
| -------------------------------------------------- | ---------------- | ------------------ | ---------------- | ---------------- | ---------------- | ---------------- |
| Sold | 1,231,692 | $15,453,286 | 133,641 | $1,636,852 | 401,305 | $4,993,888 |
| |
| Dividends and distributions reinvested | -- | -- | -- | -- | -- | -- |
| |
| Redeemed | (472,176) | (5,830,858) | (22,832) | (280,334) | (62,832) | (748,439) |
| | ---------------- | ------------------ | ---------------- | ---------------- | ---------------- | ---------------- |
| Net change | 759,516 | $9,622,428 | 110,809 | $1,356,518 | 338,473 | $4,245,449 |
| | ======== | ======== | ======== | ======== | ======== | ======== |
| |
| Period Ended October 31, 2004 | | | | | | |
| -------------------------------------------------- | | | | | | |
| Sold | 742,406 | $10,112,865 | 65,575 | $871,219 | 195,176 | $2,747,242 |
| |
| Dividends and distributions reinvested | 90,752 | 1,266,898 | 8,403 | 114,535 | 18,210 | 260,592 |
| |
| Redeemed | (259,660) | (3,526,731) | (115,284) | (1,578,984) | (48,458) | (668,148) |
| | ---------------- | ------------------ | ---------------- | ---------------- | ---------------- | ---------------- |
| Net change | 573,498 | $7,853,032 | (41,306) | $(593,230) | 164,928 | $2,339,686 |
| | ======== | ======== | ======== | ======== | ======== | ======== |
| |
| Year Ended October 31, 2005 | | | | | | |
| -------------------------------------------------- | | | | | | |
| Sold | 1,517,333 | $20,881,363 | 24,491 | $330,888 | 687,886 | $9,913,887 |
| |
| Dividends and distributions reinvested | 619,617 | 8,353,675 | 54,502 | 711,264 | 134,623 | 1,874,939 |
| |
| Redeemed | (1,142,359) | (15,657,893) | (58,263) | (774,977) | (606,729) | (8,464,252) |
| | ---------------- | ------------------ | ---------------- | ---------------- | ---------------- | ---------------- |
| |
| Net change | 994,591 | $13,577,145 | 20,730 | $267,175 | 215,780 | $3,324,574 |
| | ======== | ======== | ======== | ======== | ======== | ======== |
| |
| | | | Small Cap Stock Fund | | |
| | ------------------------------------------------------------------------------------------------------------------------------------------------------------------------------------------------------------------------------------------------------ |
| | Class A | Class B | Institutional Class |
| | ----------------------------------------------------------------------- | --------------------------------------------------------------------- | --------------------------------------------------------------------- |
| Year Ended April 30, 2004 | Shares | Amount | Shares | Amount | Shares | Amount |
| -------------------------------------------------- | ---------------- | ------------------ | ---------------- | ---------------- | ---------------- | ---------------- |
| Sold | 3,342,207 | $50,108,302 | 342,789 | $4,814,140 | 104,729 | $1,652,803 |
| |
| Dividends and distributions reinvested | -- | -- | -- | -- | -- | -- |
| |
| Redeemed | (3,279,853) | (48,832,120) | (621,536) | (8,523,200) | (29,772) | (487,580) |
| | ---------------- | ------------------ | ---------------- | ---------------- | ---------------- | ---------------- |
| Net change | 62,354 | $1,276,182 | (278,747) | $(3,709,060) | 74,957 | $1,165,223 |
| | ======== | ======== | ======== | ======== | ======== | ======== |
| |
| Period Ended October 31, 2004 | | | | | | |
| -------------------------------------------------- | | | | | | |
| Sold | 1,260,434 | $19,945,439 | 126,878 | $1,847,151 | 5,319 | $88,882 |
| |
| Dividends and distributions reinvested | 1,347,313 | 21,853,599 | 102,365 | 1,536,504 | 31,839 | 541,258 |
| |
| Redeemed | (1,512,435) | (23,934,542) | (227,849) | (3,338,952) | (7,213) | (123,060) |
| | ---------------- | ------------------ | ---------------- | ---------------- | ---------------- | ---------------- |
| Net change | 1,095,312 | $17,864,496 | 1,394 | $44,703 | 29,945 | $507,080 |
| | ======== | ======== | ======== | ======== | ======== | ======== |
| |
| Year Ended October 31, 2005 | | | | | | |
| -------------------------------------------------- | | | | | | |
| Sold | 3,177,885 | $54,691,472 | 41,762 | $655,185 | 576,981 | $10,908,320 |
| |
| Dividends and distributions reinvested | 1,169,439 | 19,952,382 | 84,625 | 1,324,943 | 27,428 | 493,053 |
| |
| Redeemed | (3,837,097) | (66,584,361) | (518,871) | (8,208,131) | (157,397) | (2,960,615) |
| | ---------------- | ------------------ | ---------------- | ---------------- | ---------------- | ---------------- |
| Net change | 510,227 | $8,059,493 | (392,484) | $ (6,228,003) | 447,012 | $8,440,758 |
| | ======== | ======== | ======== | ======== | ======== | ======== |
|
| |
| 249 | | | | |
THRIVENT MUTUAL FUNDS
NOTES TO FINANCIAL STATEMENTS
As of October 31, 2005
|
(10) SHARES OF BENEFICIAL INTEREST -- continued
| | | Small Cap Index Fund | | | |
| | -------------------------------------------------------------------------------------------------------------------------------------------------------------- | | |
| | Class A | Class B | | |
| | ------------------------------------------------------------------------------ | ---------------------------------------------------------------------------- | | |
| Year Ended April 30, 2004 | Shares | Amount | Shares | Amount | | |
| -------------------------------------------------- | ---------------- | ------------------ | ---------------- | ---------------- | | |
| Sold | 759,328 | $8,765,026 | 125,231 | $1,438,820 | | |
| |
| Dividends and distributions reinvested | 8,435 | 102,742 | 1,040 | 12,300 | | |
| |
| Redeemed | (264,570) | (3,014,785) | (13,264) | (146,498) | | |
| | ---------------- | ------------------ | ---------------- | ---------------- | | |
| Net change | 503,193 | $5,852,983 | 113,007 | $1,304,622 | | |
| | ======== | ======== | ======== | ======== | | |
| |
| Period Ended October 31, 2004 | | | | | | |
| -------------------------------------------------- | | | | | | |
| Sold | 1,404,271 | $17,285,116 | (5,828) | $(70,292) | | |
| |
| Dividends and distributions reinvested | 97,161 | 1,225,204 | -- | -- | | |
| |
| Redeemed | (1,504,389) | (18,810,175) | (366,594) | (4,286,987) | | |
| | ---------------- | ------------------ | ---------------- | ---------------- | | |
| Net change | (2,957) | $(299,855) | (372,422) | $(4,357,279) | | |
| | ======== | ======== | ======== | ======== | | |
| |
| Year Ended October 31, 2005 | | | | | | |
| -------------------------------------------------- | | | | | | |
| Sold | 1,016,689 | $13,900,371 | -- | $-- | | |
| |
| Dividends and distributions reinvested | 25,112 | 342,666 | -- | -- | | |
| |
| Redeemed | (555,929) | (7,725,862) | -- | -- | | |
| | ---------------- | ------------------ | ---------------- | ---------------- | | |
| Net change | 485,872 | $6,517,175 | -- | $-- | | |
| | ======== | ======== | ======== | ======== | | |
| |
| | | | Mid Cap Growth Fund | | |
| | -------------------------------------------------------------------------------------------------------------------------------------------------------------------------------------------------------------------------------------------- |
| | Class A | Class B | Institutional Class |
| | ------------------------------------------------------------------------------ | ---------------------------------------------------------------------------- | ---------------------------------------------------------------------------- |
| Year Ended April 30, 2004 | Shares | Amount | Shares | Amount | Shares | Amount |
| -------------------------------------------------- | ---------------- | ------------------ | ---------------- | ---------------- | ---------------- | ---------------- |
| Sold | 2,055,600 | $24,128,164 | 571,582 | $6,410,188 | 278,617 | $3,428,236 |
| |
| Issued in connection with merger | 10,611,233 | 129,278,193 | 892,327 | 10,310,007 | 41,441 | 528,975 |
| |
| Dividends and distributions reinvested | -- | -- | -- | -- | -- | -- |
| |
| Redeemed | (2,161,125) | (26,804,122) | (889,797) | (10,565,737) | (128,402) | (1,661,609) |
| | ---------------- | ------------------ | ---------------- | ---------------- | ---------------- | ---------------- |
| Net change | 10,505,708 | $126,602,235 | 574,112 | $6,154,458 | 191,656 | $2,295,602 |
| | ======== | ======== | ======== | ======== | ======== | ======== |
| |
| Year Ended October 31, 2005 | | | | | | |
| -------------------------------------------------- | | | | | | |
| Sold | 2,537,539 | $35,036,716 | 30,434 | $393,259 | 272,971 | $4,152,199 |
| Dividends and distributions reinvested | -- | -- | -- | -- | -- | -- |
| |
| Redeemed | (3,757,363) | (52,189,301) | (1,116,546) | (14,519,624) | (270,037) | (3,973,584) |
| | ---------------- | ------------------ | ---------------- | ---------------- | ---------------- | ---------------- |
| Net change | (1,219,824) | $(17,152,585) | (1,086,112) | $(14,126,365) | 2,934 | $178,615 |
| | ======== | ======== | ======== | ======== | ======== | ======== |
| |
| | | Partner Mid Cap Value Fund | | | |
| | -------------------------------------------------------------------------------------------------------------------------------------------------------------- | | |
| | Class A | Institutional Class | | |
| | ------------------------------------------------------------------------------ | ---------------------------------------------------------------------------- | | |
| Period Ended October 31, 2005* | Shares | Amount | Shares | Amount | | |
| -------------------------------------------------- | ---------------- | ------------------ | ---------------- | ---------------- | | |
| Sold | 503,544 | $5,050,647 | 359,203 | $3,660,359 | | |
| |
| Dividends and distributions reinvested | -- | -- | -- | -- | | |
| |
| Redeemed | (1) | (10) | (1) | (10) | | |
| | ---------------- | ------------------ | ---------------- | ---------------- | | |
| Net change | 503,543 | $5,050,637 | 359,202 | $3,660,349 | | |
| | ======== | ======== | ======== | ======== | | |
| |
| *For the period from June 30, 2005 (Inception) to October 31, 2005. | | | | |
|
| |
| 250 | | | | |
THRIVENT MUTUAL FUNDS
NOTES TO FINANCIAL STATEMENTS
As of October 31, 2005
|
| | | | Mid Cap Stock Fund | | |
| | ---------------------------------------------------------------------------------------------------------------------------------------------------------------------------------------------------------------------------------------------------------- |
| | Class A | Class B | Institutional Class |
| | ------------------------------------------------------------------------ | ---------------------------------------------------------------------- | ---------------------------------------------------------------------- |
| Year Ended April 30, 2004 | Shares | Amount | Shares | Amount | Shares | Amount |
| -------------------------------------------------- | ---------------- | ------------------ | ---------------- | ---------------- | ---------------- | ---------------- |
| Sold | 4,574,691 | $ 60,126,709 | 427,350 | $ 5,204,771 | 375,149 | $ 5,057,016 |
| |
| Dividends and distributions reinvested | -- | -- | -- | -- | -- | -- |
| |
| Redeemed | (7,956,658) | (103,176,578) | (620,611) | (7,370,345) | (280,523) | (3,823,823) |
| | ---------------- | ------------------ | ---------------- | ---------------- | ---------------- | ---------------- |
| Net change | (3,381,967) | $ (43,049,869) | (193,261) | $ (2,165,574) | 94,626 | $ 1,233,193 |
| | ========== | ========== | ========== | ========== | ========== | ========== |
| |
| Period Ended October 31, 2004 | | | | | | |
| -------------------------------------------------- | | | | | | |
| Sold | 1,633,396 | $ 23,020,155 | 145,769 | $ 1,877,243 | 145,257 | $ 2,131,966 |
| |
| Dividends and distributions reinvested | -- | -- | -- | -- | -- | -- |
| |
| Redeemed | (3,311,971) | (46,730,644) | (231,560) | (2,975,557) | (161,084) | (2,355,628) |
| | ---------------- | ------------------ | ---------------- | ---------------- | ---------------- | ---------------- |
| Net change | (1,678,575) | $ (23,710,489) | (85,791) | $ (1,098,314) | (15,827) | $ (223,662) |
| | ========== | ========== | ========== | ========== | ========== | ========== |
| |
| Year Ended October 31, 2005 | | | | | | |
| -------------------------------------------------- | | | | | | |
| Sold | 4,460,836 | $ 73,983,970 | 66,435 | $ 992,529 | 1,096,974 | $ 19,788,180 |
| |
| Dividends and distributions reinvested | -- | -- | -- | -- | -- | -- |
| |
| Redeemed | (7,360,779) | (122,554,586) | (586,322) | (8,805,799) | (325,759) | (5,668,084) |
| | ---------------- | ------------------ | ---------------- | ---------------- | ---------------- | ---------------- |
| Net change | (2,899,943) | $ (48,570,616) | (519,887) | $ (7,813,270) | 771,215 | $ 14,120,096 |
| | ========== | ========== | ========== | ========== | ========== | ========== |
| |
| | | Mid Cap Index Fund | | Mid Cap Index Fund - I |
| | -------------------------------------------------------------------------------------------------------------------------------------------------- | ------------------------------------------------------------------------ |
| | Class A | Class B | Institutional Class |
| | ---------------------------------------- | -------------------------------------- | -------------------------------------- |
| Year Ended April 30, 2004 | Shares | Amount | Shares | Amount | Shares | Amount |
| -------------------------------------------------- | ---------------- | ------------------ | ---------------- | ---------------- | ---------------- | ---------------- |
| Sold | 1,077,267 | $ 11,716,850 | 163,505 | $ 1,744,648 | 786,601 | $ 8,854,724 |
| |
| Dividends and distributions reinvested | -- | -- | -- | -- | 25,553 | 298,459 |
| |
| Redeemed | (1,079,523) | (10,697,111) | (26,853) | (282,042) | (449,628) | (5,201,164) |
| | ---------------- | ------------------ | ---------------- | ---------------- | ---------------- | ---------------- |
| Net change | (2,256) | $ 1,019,739 | 136,652 | $ 1,462,606 | 362,526 | $ 3,952,019 |
| | ========== | ========== | ========== | ========== | ========== | ========== |
| |
| Period Ended October 31, 2004 | | | | | | |
| -------------------------------------------------- | | | | | | |
| Sold | 1,021,029 | $11,631,612 | 289 | $3,191 | 2,151,007 | $25,620,513 |
| |
| Dividends and distributions reinvested | 546 | 6,053 | -- | -- | 36,279 | 433,175 |
| |
| Redeemed | (225,256) | (2,592,956) | (487,318) | (5,337,751) | (3,419,569) | (40,604,961) |
| | ---------------- | ------------------ | ---------------- | ---------------- | ---------------- | ---------------- |
| Net change | 796,319 | $9,044,709 | (487,029) | $(5,334,560) | (1,232,283) | $(14,551,273) |
| | ========== | ========== | ========== | ========== | ========== | ========== |
| |
| Year Ended October 31, 2005 | | | | | | |
| -------------------------------------------------- | | | | | | |
| Sold | 1,114,612 | $ 14,521,029 | -- | $ -- | 701,761 | $ 9,027,007 |
| |
| Dividends and distributions reinvested | 24,930 | 319,594 | -- | -- | 55,097 | 684,234 |
| |
| Redeemed | (754,081) | (9,948,203) | -- | -- | (486,586) | (6,185,324) |
| | ---------------- | ------------------ | ---------------- | ---------------- | ---------------- | ---------------- |
| Net change | 385,461 | $ 4,892,420 | -- | $ -- | 270,272 | $ 3,525,917 |
| | ========== | ========== | ========== | ========== | ========== | ========== |
|
| | | | | | |
| 251 | | | | |
THRIVENT MUTUAL FUNDS
NOTES TO FINANCIAL STATEMENTS
As of October 31, 2005
|
(10) SHARES OF BENEFICIAL INTEREST -- continued
| | | Partner International Stock Fund | | |
| | -------------------------------------------------------------------------------------------------------------------------------------------------------------------------------------------------------------------------- |
| | Class A | Class B | Institutional Class |
| | ------------------------------------------------------------------------ | ---------------------------------------------------------------------- | ---------------------------------------------------------------------- |
| Year Ended October 31, 2004 | Shares | Amount | Shares | Amount | Shares | Amount |
| -------------------------------------------------- | ---------------- | ------------------ | ---------------- | ---------------- | ---------------- | ---------------- |
| Sold | 2,364,771 | $ 21,071,170 | 313,189 | $ 2,714,013 | 65,475 | $ 623,973 |
| |
| Issued in connection with merger | 19,027,683 | 152,596,813 | 971,614 | 7,660,968 | 434,570 | 3,134,815 |
| |
| Dividends and distributions reinvested | 32,978 | 298,809 | -- | -- | 14,909 | 140,291 |
| |
| Redeemed | (1,782,300) | (15,887,045) | (427,424) | (3,701,765) | (275,228) | (2,601,408) |
| | ---------------- | ------------------ | ---------------- | ---------------- | ---------------- | ---------------- |
| Net change | 19,643,132 | $ 158,079,747 | 857,379 | $ 6,673,216 | 239,726 | $ 1,297,671 |
| | ======== | ======== | ======== | ======== | ======== | ======== |
| |
| Year Ended October 31, 2005 | | | | | | |
| -------------------------------------------------- | | | | | | |
| Sold | 6,327,274 | $ 63,200,783 | 83,665 | $ 808,246 | 4,287,992 | $ 45,266,449 |
| |
| Dividends and distributions reinvested | 5,184 | 52,212 | -- | -- | 1,557 | 15,897 |
| |
| Redeemed | (4,260,381) | (43,002,707) | (702,098) | (6,815,411) | (35,291) | (357,325) |
| | ---------------- | ------------------ | ---------------- | ---------------- | ---------------- | ---------------- |
| Net change | 2,072,077 | $ 20,250,288 | (618,433) | $ (6,007,165) | 4,254,258 | $ 44,925,021 |
| | ======== | ======== | ======== | ======== | ======== | ======== |
| |
| | | | Large Cap Growth Fund | | |
| | -------------------------------------------------------------------------------------------------------------------------------------------------------------------------------------------------------------------------- |
| | Class A | Class B | Institutional Class |
| | ------------------------------------------------------------------------ | ---------------------------------------------------------------------- | ---------------------------------------------------------------------- |
| Year Ended October 31, 2004 | Shares | Amount | Shares | Amount | Shares | Amount |
| -------------------------------------------------- | ---------------- | ------------------ | ---------------- | ---------------- | ---------------- | ---------------- |
| Sold | 3,550,500 | $ 21,959,403 | 553,914 | $ 4,118,996 | 391,031 | $ 4,562,413 |
| |
| Issued in connection with merger | 13,812,952 | 36,025,360 | 2,809,120 | 3,733,228 | 1,442,515 | 3,114,548 |
| |
| Dividends and distributions reinvested | 12,690 | 139,340 | -- | -- | 2,580 | 29,721 |
| |
| Redeemed | (1,191,736) | (7,461,718) | (231,562) | (1,497,423) | (208,611) | (2,371,551) |
| | ---------------- | ------------------ | ---------------- | ---------------- | ---------------- | ---------------- |
| Net change | 16,184,406 | $ 50,662,385 | 3,131,472 | $ 6,354,801 | 1,627,515 | $ 5,335,131 |
| | ======== | ======== | ======== | ======== | ======== | ======== |
| |
| Year Ended October 31, 2005 | | | | | | |
| -------------------------------------------------- | | | | | | |
| Sold | 12,171,994 | $ 57,010,739 | 180,129 | $ 800,578 | 5,501,581 | $ 28,433,153 |
| |
| Dividends and distributions reinvested | 8,451 | 40,650 | -- | -- | 1,389 | 7,042 |
| |
| Redeemed | (4,266,894) | (20,309,601) | (928,944) | (4,171,992) | (1,386,103) | (6,893,110) |
| | ---------------- | ------------------ | ---------------- | ---------------- | ---------------- | ---------------- |
| Net change | 7,913,551 | $ 36,741,788 | (748,815) | $ (3,371,414) | 4,116,867 | $ 21,547,085 |
| | ======== | ======== | ======== | ======== | ======== | ======== |
| |
| | | | Large Cap Value Fund | | |
| | -------------------------------------------------------------------------------------------------------------------------------------------------------------------------------------------------------------------------- |
| | Class A | Class B | Institutional Class |
| | ------------------------------------------------------------------------ | ---------------------------------------------------------------------- | ---------------------------------------------------------------------- |
| Year Ended October 31, 2004 | Shares | Amount | Shares | Amount | Shares | Amount |
| -------------------------------------------------- | ---------------- | ------------------ | ---------------- | ---------------- | ---------------- | ---------------- |
| Sold | 1,699,605 | $ 22,129,671 | 265,199 | $ 3,456,925 | 202,382 | $ 2,611,219 |
| |
| Issued in connection with merger | 19,232,539 | 214,351,706 | 620,825 | 6,447,542 | 1,147,248 | 12,769,293 |
| |
| Dividends and distributions reinvested | 34,922 | 467,277 | 2,498 | 33,179 | 653 | 8,762 |
| |
| Redeemed | (1,183,749) | (15,305,346) | (155,690) | (2,001,228) | (92,416) | (1,211,835) |
| | ---------------- | ------------------ | ---------------- | ---------------- | ---------------- | ---------------- |
| Net change | 19,783,317 | $ 221,643,308 | 732,832 | $ 7,936,418 | 1,257,867 | $ 14,177,439 |
| | ======== | ======== | ======== | ======== | ======== | ======== |
| |
| Year Ended October 31, 2005 | | | | | | |
| -------------------------------------------------- | | | | | | |
| Sold | 3,673,689 | $ 51,883,546 | 59,489 | $ 829,196 | 2,420,261 | $ 34,854,535 |
| |
| Dividends and distributions reinvested | 86,770 | 1,230,393 | -- | -- | 8,810 | 125,280 |
| |
| Redeemed | (3,651,149) | (51,917,884) | (350,803) | (4,904,147) | (634,417) | (9,144,006) |
| | ---------------- | ------------------ | ---------------- | ---------------- | ---------------- | ---------------- |
| Net change | 109,310 | $ 1,196,055 | (291,314) | $ (4,074,951) | 1,794,654 | $ 25,835,809 |
| | ======== | ======== | ======== | ======== | ======== | ======== |
|
| |
| 252 | | | | |
THRIVENT MUTUAL FUNDS
NOTES TO FINANCIAL STATEMENTS
As of October 31, 2005
|
| | | | Large Cap Stock Fund | | |
| | ----------------------------------------------------------------------------------------------------------------------------------------------------------------------------------------------------------------------------------- |
| | Class A | Class B | Institutional Class |
| | --------------------------------------------------------------------------- | ------------------------------------------------------------------------- | ------------------------------------------------------------------------- |
| Year Ended April 30, 2004 | Shares | Amount | Shares | Amount | Shares | Amount |
| -------------------------------------------------- | ---------------- | ------------------ | ---------------- | ---------------- | ---------------- | ---------------- |
| Sold | 6,751,343 | $ 191,018,783 | 562,079 | $ 15,122,456 | 633,557 | $ 17,877,502 |
| |
| Dividends and distributions reinvested | 359,246 | 10,051,966 | -- | -- | 20,616 | 577,002 |
| |
| Redeemed | (13,157,567) | (370,317,835) | (1,187,337) | (31,754,804) | (430,599) | (12,332,453) |
| | ---------------- | ------------------ | ---------------- | ---------------- | ---------------- | ---------------- |
| Net change | (6,046,978) | $(169,247,086) | (625,258) | $(16,632,348) | 223,574 | $ 6,122,051 |
| | ======== | ======== | ======== | ======== | ======== | ======== |
| |
| Period Ended October 31, 2004 | | | | | | |
| -------------------------------------------------- | | | | | | |
| Sold | 3,051,135 | $ 78,745,630 | 287,566 | $ 6,852,937 | 233,966 | $ 5,999,754 |
| |
| Issued in connection with merger | 31,412,345 | 729,068,165 | 2,655,938 | 57,377,788 | 1,215,070 | 28,316,042 |
| |
| Dividends and distributions reinvested | 21,708,014 | 508,624,786 | 641,473 | 13,990,530 | 631,690 | 14,863,662 |
| |
| Redeemed | (8,896,997) | (224,972,207) | (782,350) | (18,324,778) | (312,239) | (7,928,296) |
| | ---------------- | ------------------ | ---------------- | ---------------- | ---------------- | ---------------- |
| Net change | 47,274,497 | $1,091,466,374 | 2,802,627 | $ 59,896,477 | 1,768,487 | $ 41,251,162 |
| | ======== | ======== | ======== | ======== | ======== | ======== |
| |
| Year Ended October 31, 2005 | | | | | | |
| -------------------------------------------------- | | | | | | |
| Sold | 6,847,339 | $ 173,588,211 | 40,093 | $ 937,446 | 1,719,267 | $ 44,559,132 |
| |
| Dividends and distributions reinvested | 825,490 | 21,106,807 | 62 | 1,351 | 35,618 | 914,310 |
| |
| Redeemed | (22,742,851) | (579,282,313) | (1,746,412) | (41,233,194) | (840,455) | (21,560,415) |
| | ---------------- | ------------------ | ---------------- | ---------------- | ---------------- | ---------------- |
| Net change | (15,070,022) | $ (384,587,295) | (1,706,257) | $(40,294,397) | 914,430 | $ 23,913,027 |
| | ======== | ======== | ======== | ======== | ======== | ======== |
| |
| | | Large Cap Index Fund | | Large Cap Index Fund - I |
| | -------------------------------------------------------------------------------------------------------------------------------------------------------- | --------------------------------------------------------------------------- |
| | Class A | Class B | Institutional Class |
| | --------------------------------------------------------------------------- | ------------------------------------------------------------------------- | ------------------------------------------------------------------------- |
| Year Ended April 30, 2004 | Shares | Amount | Shares | Amount | Shares | Amount |
| -------------------------------------------------- | ---------------- | ------------------ | ---------------- | ---------------- | ---------------- | ---------------- |
| Sold | 1,392,569 | $ 9,982,529 | 2,957,536 | $ 21,872,449 | 454,015 | $ 3,314,531 |
| |
| Dividends and distributions reinvested | 66,171 | 498,930 | 58,659 | 445,806 | -- | -- |
| |
| Redeemed | (7,488,824) | (49,652,493) | (707,716) | (5,182,368) | (144,682) | (980,418) |
| | ---------------- | ------------------ | ---------------- | ---------------- | ---------------- | ---------------- |
| Net change | (6,030,084) | $ (39,171,034) | 2,308,479 | $ 17,135,887 | 309,333 | $ 2,334,113 |
| | ======== | ======== | ======== | ======== | ======== | ======== |
| |
| Period Ended October 31, 2004 | | | | | | |
| -------------------------------------------------- | | | | | | |
| Sold | 3,656,440 | $ 27,808,082 | (106) | $ 266 | 379,803 | $ 2,892,903 |
| |
| Dividends and distributions reinvested | 25,088 | 186,653 | -- | -- | -- | -- |
| |
| Redeemed | (595,096) | (4,545,027) | (855,054) | (6,293,202) | (387,829) | (2,953,200) |
| | ---------------- | ------------------ | ---------------- | ---------------- | ---------------- | ---------------- |
| Net change | 3,086,432 | $ 23,449,708 | (855,160) | $ (6,292,936) | (8,026) | $ (60,297) |
| | ======== | ======== | ======== | ======== | ======== | ======== |
| |
| Year Ended October 31, 2005 | | | | | | |
| -------------------------------------------------- | | | | | | |
| Sold | 3,307,347 | $ 27,090,444 | -- | $ -- | 884,376 | $ 7,236,775 |
| |
| Dividends and distributions reinvested | 95,005 | 788,538 | -- | -- | 54,311 | 446,980 |
| |
| Redeemed | (1,908,815) | (15,773,311) | -- | -- | (934,372) | (7,673,407) |
| | ---------------- | ------------------ | ---------------- | ---------------- | ---------------- | ---------------- |
| Net change | 1,493,537 | $ 12,105,671 | -- | $ -- | 4,315 | $ 10,348 |
| | ======== | ======== | ======== | ======== | ======== | ======== |
|
| |
| |
| |
| |
| 253 | | | | |
THRIVENT MUTUAL FUNDS
NOTES TO FINANCIAL STATEMENTS
As of October 31, 2005
|
(10) SHARES OF BENEFICIAL INTEREST -- continued
| | | | Balanced Fund | | |
| | ---------------------------------------------------------------------------------------------------------------------------------------------------------------------------------------------------------------------------------------------------------- |
| | Class A | Class B | Institutional Class |
| | ------------------------------------------------------------------------ | ---------------------------------------------------------------------- | ---------------------------------------------------------------------- |
| Year Ended April 30, 2004 | Shares | Amount | Shares | Amount | Shares | Amount |
| -------------------------------------------------- | ---------------- | ------------------ | ---------------- | ---------------- | ---------------- | ---------------- |
| Sold | 3,776,828 | $ 43,526,295 | 463,346 | $ 5,319,971 | 514,280 | $ 5,834,784 |
| |
| Dividends and distributions reinvested | 395,804 | 4,525,726 | 12,555 | 142,480 | 214,186 | 2,445,230 |
| |
| Redeemed | (4,583,294) | (52,689,198) | (677,332) | (7,751,445) | (1,219,918) | (14,074,212) |
| | ---------------- | ------------------ | ---------------- | ---------------- | ---------------- | ---------------- |
| Net change | (410,662) | $ (4,637,177) | (201,431) | $ (2,288,994) | (491,452) | $ (5,794,198) |
| | ========= | ========= | ========= | ========= | ========= | ========= |
| |
| Period Ended October 31, 2004 | | | | | | |
| -------------------------------------------------- | | | | | | |
| Sold | 1,816,992 | $ 21,021,555 | 161,973 | $ 1,865,064 | 131,304 | $ 1,518,211 |
| |
| Dividends and distributions reinvested | 189,492 | 2,213,531 | 5,064 | 58,887 | 99,438 | 1,160,233 |
| |
| Redeemed | (2,284,043) | (26,471,724) | (275,708) | (3,172,804) | (585,322) | (6,751,213) |
| | ---------------- | ------------------ | ---------------- | ---------------- | ---------------- | ---------------- |
| Net change | (277,559) | $ (3,236,638) | (108,671) | $ (1,248,853) | (354,580) | $ (4,072,769) |
| | ========= | ========= | ========= | ========= | ========= | ========= |
| |
| Year Ended October 31, 2005 | | | | | | |
| -------------------------------------------------- | | | | | | |
| Sold | 3,195,298 | $ 38,470,275 | 14,849 | $ 179,001 | 161,848 | $ 1,956,455 |
| |
| Dividends and distributions reinvested | 758,679 | 9,156,247 | 31,721 | 380,639 | 330,563 | 3,986,774 |
| |
| Redeemed | (4,871,001) | (58,885,348) | (446,249) | (5,356,650) | (1,600,278) | (19,308,671) |
| | ---------------- | ------------------ | ---------------- | ---------------- | ---------------- | ---------------- |
| Net change | (917,024) | $ (11,258,826) | (399,679) | $ (4,797,010) | (1,107,867) | $(13,365,442) |
| | ========= | ========= | ========= | ========= | ========= | ========= |
| |
| | | | High Yield Fund | | |
| | ---------------------------------------------------------------------------------------------------------------------------------------------------------------------------------------------------------------------------------------------------------- |
| | Class A | Class B | Institutional Class |
| | ------------------------------------------------------------------------ | ---------------------------------------------------------------------- | ---------------------------------------------------------------------- |
| Year Ended October 31, 2004 | Shares | Amount | Shares | Amount | Shares | Amount |
| -------------------------------------------------- | ---------------- | ------------------ | ---------------- | ---------------- | ---------------- | ---------------- |
| Sold | 12,967,036 | $ 66,613,441 | 1,277,916 | $ 6,562,757 | 193,689 | $ 996,646 |
| |
| Dividends and distributions reinvested | 6,162,299 | 31,656,410 | 346,863 | 1,781,502 | 87,153 | 447,945 |
| |
| Redeemed | (18,317,905) | (93,891,744) | (2,462,908) | (12,641,951) | (491,310) | (2,514,135) |
| | ---------------- | ------------------ | ---------------- | ---------------- | ---------------- | ---------------- |
| Net change | 811,430 | $ 4,378,107 | (838,129) | $ (4,297,692) | (210,468) | $ (1,069,544) |
| | ========= | ========= | ========= | ========= | ========= | ========= |
| |
| Year Ended October 31, 2005 | | | | | | |
| -------------------------------------------------- | | | | | | |
| Sold | 11,380,648 | $ 58,997,559 | 78,981 | $ 410,492 | 1,274,897 | $ 6,551,599 |
| |
| Dividends and distributions reinvested | 6,193,332 | 31,927,680 | 271,884 | 1,402,509 | 101,401 | 522,045 |
| |
| Redeemed | (20,693,498) | (106,752,495) | (2,012,945) | (10,408,639) | (275,736) | (1,426,020) |
| | ---------------- | ------------------ | ---------------- | ---------------- | ---------------- | ---------------- |
| Net change | (3,119,518) | $ (15,827,256) | (1,662,080) | $ (8,595,638) | 1,100,562 | $ 5,647,624 |
| | ========= | ========= | ========= | ========= | ========= | ========= |
|
| |
| 254 | | | | |
THRIVENT MUTUAL FUNDS
NOTES TO FINANCIAL STATEMENTS
As of October 31, 2005
|
| | | | High Yield Fund II | | |
| | -------------------------------------------------------------------------------------------------------------------------------------------------------------------------------------------------------------------------------------------------------------------------- |
| | Class A | Class B | Institutional Class |
| | ---------------------------------------------------------------------------- | -------------------------------------------------------------------------- | -------------------------------------------------------------------------- |
| Year Ended April 30, 2004 | Shares | Amount | Shares | Amount | Shares | Amount |
| -------------------------------------------------- | ---------------- | ------------------ | ---------------- | ---------------- | ---------------- | ---------------- |
| Sold | 5,669,568 | $ 37,096,535 | 367,922 | $ 2,408,588 | 90,909 | $ 601,573 |
| |
| Dividends and distributions reinvested | 944,456 | 6,171,574 | 37,212 | 243,215 | 30,328 | 198,104 |
| |
| Redeemed | (4,676,650) | (30,579,003) | (417,293) | (2,720,137) | (60,672) | (399,956) |
| | ---------------- | ------------------ | ---------------- | ---------------- | ---------------- | ---------------- |
| Net change | 1,937,374 | $ 12,689,106 | (12,159) | $ (68,334) | 60,565 | $ 399,721 |
| | ========= | ========= | ========= | ========= | ========= | ========= |
| |
| Period Ended October 31, 2004 | | | | | | |
| -------------------------------------------------- | | | | | | |
| Sold | 1,533,085 | $ 9,966,887 | 91,413 | $ 594,958 | 54,640 | $ 364,301 |
| |
| Dividends and distributions reinvested | 512,210 | 3,352,223 | 19,893 | 130,190 | 15,753 | 103,030 |
| |
| Redeemed | (2,016,152) | (13,123,612) | (175,041) | (1,138,997) | (13,071) | (85,367) |
| | ---------------- | ------------------ | ---------------- | ---------------- | ---------------- | ---------------- |
| Net change | 29,143 | $ 195,498 | (63,735) | $ (413,849) | 57,322 | $ 381,964 |
| | ========= | ========= | ========= | ========= | ========= | ========= |
| |
| Year Ended October 31, 2005 | | | | | | |
| -------------------------------------------------- | | | | | | |
| Sold | 1,645,098 | $ 10,909,037 | 13,662 | $ 89,576 | 59,725 | $ 397,171 |
| |
| Dividends and distributions reinvested | 1,057,002 | 6,959,351 | 35,298 | 232,596 | 35,874 | 235,946 |
| |
| Redeemed | (3,988,894) | (26,331,604) | (284,341) | (1,885,441) | (72,353) | (486,954) |
| | ---------------- | ------------------ | ---------------- | ---------------- | ---------------- | ---------------- |
| Net change | (1,286,794) | $ (8,463,216) | (235,381) | $ (1,563,269) | 23,246 | $ 146,163 |
| | ========= | ========= | ========= | ========= | ========= | ========= |
| |
| | | | Municipal Bond Fund | | |
| | -------------------------------------------------------------------------------------------------------------------------------------------------------------------------------------------------------------------------------------------------------------------------- |
| | Class A | Class B | Institutional Class |
| | ---------------------------------------------------------------------------- | -------------------------------------------------------------------------- | -------------------------------------------------------------------------- |
| Year Ended October 31, 2004 | Shares | Amount | Shares | Amount | Shares | Amount |
| -------------------------------------------------- | ---------------- | ------------------ | ---------------- | ---------------- | ---------------- | ---------------- |
| Sold | 5,283,299 | $ 52,498,243 | 373,718 | $ 3,555,759 | 45,330 | $ 469,448 |
| |
| Issued in connection with merger | 40,830,245 | 593,690,801 | 594,393 | 11,997,514 | 186,112 | 2,600,492 |
| |
| Dividends and distributions reinvested | 3,255,331 | 32,523,962 | 104,651 | 1,022,731 | 13,318 | 129,681 |
| |
| Redeemed | (10,602,532) | (106,080,699) | (793,867) | (7,713,169) | (87,338) | (886,137) |
| | ---------------- | ------------------ | ---------------- | ---------------- | ---------------- | ---------------- |
| Net change | 38,766,343 | $ 572,632,307 | 278,895 | $ 8,862,835 | 157,422 | $ 2,313,484 |
| | ========= | ========= | ========= | ========= | ========= | ========= |
| |
| Year Ended October 31, 2005 | | | | | | |
| -------------------------------------------------- | | | | | | |
| Sold | 9,170,851 | $ 105,337,442 | 17,696 | $ 203,078 | 433,972 | $ 4,973,247 |
| |
| Dividends and distributions reinvested | 3,790,971 | 43,498,716 | 85,950 | 986,057 | 12,542 | 143,719 |
| |
| Redeemed | (12,477,891) | (143,266,278) | (492,658) | (5,658,362) | (148,135) | (1,691,304) |
| | ---------------- | ------------------ | ---------------- | ---------------- | ---------------- | ---------------- |
| Net change | 483,931 | $ 5,569,880 | (389,012) | $ (4,469,227) | 298,379 | $ 3,425,662 |
| | ========= | ========= | ========= | ========= | ========= | ========= |
| |
| | | | Income Fund | | |
| | -------------------------------------------------------------------------------------------------------------------------------------------------------------------------------------------------------------------------------------------------------------------------- |
| | Class A | Class B | Institutional Class |
| | ---------------------------------------------------------------------------- | -------------------------------------------------------------------------- | -------------------------------------------------------------------------- |
| Year Ended October 31, 2004 | Shares | Amount | Shares | Amount | Shares | Amount |
| -------------------------------------------------- | ---------------- | ------------------ | ---------------- | ---------------- | ---------------- | ---------------- |
| Sold | 3,887,866 | $ 34,112,612 | 542,851 | $ 4,763,702 | 1,157,800 | $ 10,116,173 |
| |
| Dividends and distributions reinvested | 2,169,580 | 19,032,301 | 90,647 | 793,369 | 108,872 | 954,061 |
| |
| Redeemed | (10,849,302) | (95,065,549) | (1,234,123) | (10,800,307) | (874,855) | (7,665,479) |
| | ---------------- | ------------------ | ---------------- | ---------------- | ---------------- | ---------------- |
| Net change | (4,791,856) | $ (41,920,636) | (600,625) | $ (5,243,236) | 391,817 | $ 3,404,755 |
| | ========= | ========= | ========= | ========= | ========= | ========= |
| |
| Year Ended October 31, 2005 | | | | | | |
| -------------------------------------------------- | | | | | | |
| Sold | 4,570,109 | $ 40,024,825 | 33,360 | $ 292,484 | 2,812,041 | $ 24,523,996 |
| |
| Dividends and distributions reinvested | 2,212,878 | 19,346,299 | 78,094 | 681,374 | 156,192 | 1,363,273 |
| |
| Redeemed | (9,502,313) | (83,136,647) | (739,002) | (6,453,543) | (780,965) | (6,822,423) |
| | ---------------- | ------------------ | ---------------- | ---------------- | ---------------- | ---------------- |
| Net change | (2,719,326) | $ (23,765,523) | (627,548) | $ (5,479,685) | 2,187,268 | $ 19,064,846 |
| | ========= | ========= | ========= | ========= | ========= | ========= |
|
| |
| 255 | | | | |
THRIVENT MUTUAL FUNDS
NOTES TO FINANCIAL STATEMENTS
As of October 31, 2005
|
(10) SHARES OF BENEFICIAL INTEREST -- continued
| | | | Core Bond Fund | | |
| | -------------------------------------------------------------------------------------------------------------------------------------------------------------------------------------------------------------------------------------------------------------------------- |
| | Class A | Class B | Institutional Class |
| | ---------------------------------------------------------------------------- | -------------------------------------------------------------------------- | -------------------------------------------------------------------------- |
| Year Ended April 30, 2004 | Shares | Amount | Shares | Amount | Shares | Amount |
| -------------------------------------------------- | ---------------- | ------------------ | ---------------- | ---------------- | ---------------- | ---------------- |
| Sold | 5,653,487 | $ 58,308,498 | 383,777 | $ 3,959,757 | 1,378,445 | $ 14,193,753 |
| |
| Dividends and distributions reinvested | 1,812,181 | 18,654,274 | 39,732 | 409,278 | 113,584 | 1,169,915 |
| |
| Redeemed | (13,119,716) | (135,051,219) | (380,664) | (3,925,602) | (925,273) | (9,539,157) |
| | ---------------- | ------------------ | ---------------- | ---------------- | ---------------- | ---------------- |
| Net change | (5,654,048) | $ (58,088,447) | 42,845 | $ 443,433 | 566,756 | $ 5,824,511 |
| | ======== | ======== | ======== | ======== | ======== | ======== |
| |
| Period Ended October 31, 2004 | | | | | | |
| -------------------------------------------------- | | | | | | |
| Sold | 2,865,571 | $ 29,002,899 | 113,437 | $ 1,145,892 | 290,180 | $ 2,925,806 |
| |
| Dividends and distributions reinvested | 841,258 | 8,942,614 | 20,091 | 216,618 | 64,941 | 687,894 |
| |
| Redeemed | (4,633,806) | (46,858,735) | (162,999) | (1,648,832) | (220,235) | (2,224,598) |
| | ---------------- | ------------------ | ---------------- | ---------------- | ---------------- | ---------------- |
| Net change | (926,977) | $ (8,913,222) | (29,471) | $ (286,322) | 134,886 | $ 1,389,102 |
| | ======== | ======== | ======== | ======== | ======== | ======== |
| |
| Year Ended October 31, 2005 | | | | | | |
| -------------------------------------------------- | | | | | | |
| Sold | 5,126,034 | $ 51,935,614 | 24,978 | $ 253,247 | 2,424,776 | $ 24,573,803 |
| |
| Dividends and distributions reinvested | 1,580,139 | 15,973,123 | 34,282 | 346,831 | 133,347 | 1,346,119 |
| |
| Redeemed | (8,646,568) | (87,413,887) | (263,007) | (2,662,091) | (748,571) | (7,594,169) |
| | ---------------- | ------------------ | ---------------- | ---------------- | ---------------- | ---------------- |
| Net change | (1,940,395) | $ (19,505,150) | (203,747) | $ (2,062,013) | 1,809,552 | $ 18,325,753 |
| | ======== | ======== | ======== | ======== | ======== | ======== |
| |
| | | | Limited Maturity Bond Fund | | |
| | -------------------------------------------------------------------------------------------------------------------------------------------------------------------------------------------------------------------------------------------------------------------------- |
| | Class A | Class B | Institutional Class |
| | ---------------------------------------------------------------------------- | -------------------------------------------------------------------------- | -------------------------------------------------------------------------- |
| Year Ended October 31, 2004 | Shares | Amount | Shares | Amount | Shares | Amount |
| -------------------------------------------------- | ---------------- | ------------------ | ---------------- | ---------------- | ---------------- | ---------------- |
| Sold | 5,568,801 | $ 72,051,989 | 47,393 | $ 610,409 | 107,663 | $ 1,399,167 |
| |
| Dividends and distributions reinvested | 274,005 | 3,545,407 | 2,733 | 35,373 | 11,666 | 150,913 |
| |
| Redeemed | (3,518,146) | (45,476,073) | (358,634) | (4,579,334) | (490,310) | (6,281,856) |
| | ---------------- | ------------------ | ---------------- | ---------------- | ---------------- | ---------------- |
| Net change | 2,324,660 | $ 30,121,323 | (308,508) | $ (3,933,552) | (370,981) | $ (4,731,776) |
| | ======== | ======== | ======== | ======== | ======== | ======== |
| |
| Year Ended October 31, 2005 | | | | | | |
| -------------------------------------------------- | | | | | | |
| Sold | 4,788,604 | $ 60,965,787 | 19,048 | $ 240,851 | 2,562,863 | $ 32,414,317 |
| |
| Dividends and distributions reinvested | 337,414 | 4,287,517 | 3,022 | 38,414 | 26,630 | 337,062 |
| |
| Redeemed | (3,937,777) | (50,049,978) | (24,936) | (316,529) | (374,113) | (4,741,687) |
| | ---------------- | ------------------ | ---------------- | ---------------- | ---------------- | ---------------- |
| Net change | 1,188,241 | $ 15,203,326 | (2,866) | $ (37,264) | 2,215,380 | $ 28,009,692 |
| | ======== | ======== | ======== | ======== | ======== | ======== |
|
| |
| 256 | | | | |
THRIVENT MUTUAL FUNDS
NOTES TO FINANCIAL STATEMENTS
As of October 31, 2005
|
| | | | Money Market Fund | | |
| | ---------------------------------------------------------------------------------------------------------------------------------------------------------------------------------------------------------------------------------------------------------------------- |
| | Class A | Class B | Institutional Class |
| | --------------------------------------------------------------------------- | ------------------------------------------------------------------------- | ------------------------------------------------------------------------- |
| Year Ended April 30, 2004 | Shares | Amount | Shares | Amount | Shares | Amount |
| -------------------------------------------------- | ---------------- | ------------------ | ---------------- | ---------------- | ---------------- | ---------------- |
| Sold | 269,520,767 | $ 269,520,767 | 1,422,984 | $ 1,422,984 | 480,119,771 | $480,119,771 |
| |
| Dividends and distributions reinvested | 956,917 | 956,917 | 1,462 | 1,462 | 538,327 | 538,327 |
| |
| Redeemed | (357,898,855) | (357,898,855) | (2,453,006) | (2,453,006) | (457,461,310) | (457,461,310) |
| | ---------------- | ------------------ | ---------------- | ---------------- | ---------------- | ---------------- |
| Net change | (87,421,171) | $ (87,421,171) | (1,028,560) | $ (1,028,560) | 23,196,788 | $ 23,196,788 |
| | ========= | ========= | ========= | ========= | ========= | ========= |
| |
| Period Ended October 31, 2004 | | | | | | |
| -------------------------------------------------- | | | | | | |
| Sold | 273,485,180 | $ 273,485,177 | 1,426,695 | $ 1,426,696 | 332,158,782 | $332,158,782 |
| |
| Issued in connection with merger | 450,318,699 | 450,318,699 | 853,031 | 853,031 | 6,797,312 | 6,797,312 |
| |
| Dividends and distributions reinvested | 1,644,396 | 1,644,396 | 4,933 | 4,933 | 688,399 | 688,399 |
| |
| Redeemed | (300,865,031) | (300,865,031) | (1,220,775) | (1,220,775) | (208,578,274) | (208,578,274) |
| | ---------------- | ------------------ | ---------------- | ---------------- | ---------------- | ---------------- |
| Net change | 424,583,244 | $ 424,583,241 | 1,063,884 | $ 1,063,885 | 131,066,219 | $131,066,219 |
| | ========= | ========= | ========= | ========= | ========= | ========= |
| |
| Year Ended October 31, 2005 | | | | | | |
| -------------------------------------------------- | | | | | | |
| Sold | 795,205,175 | $ 795,205,174 | 684,330 | $ 684,330 | 939,281,015 | $939,281,015 |
| |
| Dividends and distributions reinvested | 13,622,558 | 13,622,558 | 38,863 | 38,863 | 6,325,425 | 6,325,425 |
| |
| Redeemed | (834,313,997) | (834,313,997) | (1,844,399) | (1,844,399) | (908,130,890) | (908,130,890) |
| | ---------------- | ------------------ | ---------------- | ---------------- | ---------------- | ---------------- |
| Net change | (25,486,264) | $ (25,486,265) | (1,121,206) | $ (1,121,206) | 37,475,550 | $ 37,475,550 |
| | ========= | ========= | ========= | ========= | ========= | ========= |
|
| |
| 257 | | | | |
Thrivent Mutual Funds
Financial Highlights
|
|
|
| | F O R A S H A R E O U T S T A N D I N G T H R O U G H O U T E A C H P E R I O D(a) |
| |
|
| |
| | | | | | Less Distributions | |
| | | Income from Investment Operations | from | |
| | |
|
| |
| | Net Asset | | Net Realized | | | Net | |
| | Value, | Net | and Unrealized | Total from | Net | Realized | |
| | Beginning | Investment | Gain/(Loss) on | Investment | Investment | Gain on | Total |
| | of Period | Income/(Loss) | Investments(b) | Operations | Income | Investments | Distributions |
|
| AGGRESSIVE ALLOCATION FUND | | | | | | |
| Class A Shares | | | | | | | |
| Year Ended 10/31/2005(e) | $10.00 | $(0.01) | $0.38 | $0.37 | $-- | $-- | $-- |
| Class I Shares | | | | | | | |
| Year Ended 10/31/2005(e) | 10.00 | -- | 0.39 | 0.39 | -- | -- | -- |
|
| MODERATELY AGGRESSIVE ALLOCATION FUND | | | | | |
| Class A Shares | | | | | | | |
| Year Ended 10/31/2005(e) | 10.00 | 0.01 | 0.30 | 0.31 | -- | -- | -- |
| Class I Shares | | | | | | | |
| Year Ended 10/31/2005(e) | 10.00 | 0.01 | 0.32 | 0.33 | -- | -- | -- |
|
| MODERATE ALLOCATION FUND | | | | | | | |
| Class A Shares | | | | | | | |
| Year Ended 10/31/2005(e) | 10.00 | 0.02 | 0.22 | 0.24 | (0.02) | -- | (0.02) |
| Class I Shares | | | | | | | |
| Year Ended 10/31/2005(e) | 10.00 | 0.03 | 0.22 | 0.25 | (0.02) | -- | (0.02) |
|
| MODERATELY CONSERVATIVE ALLOCATION FUND | | | | | |
| Class A Shares | | | | | | | |
| Year Ended 10/31/2005(e) | 10.00 | 0.04 | 0.11 | 0.15 | (0.02) | -- | (0.02) |
| Class I Shares | | | | | | | |
| Year Ended 10/31/2005(e) | 10.00 | 0.05 | 0.12 | 0.17 | (0.03) | -- | (0.03) |
|
| (a) | All per share amounts have been rounded to the nearest cent. |
| |
| (b) | The amount shown may not correlate with the change in aggregate gains and losses of portfolio securities due to the timing of sales and redemptions of fund shares. |
| |
| (c) | Total investment return assumes dividend reinvestment and does not reflect any deduction for sales charges. Not annualized for periods less than one year. |
| |
The accompanying notes to the financial statements are an integral part of this schedule.
258
Thrivent Mutual Funds
Financial Highlights – continued |
| | | | R A T I O S / S U P P L E M E N T A L D A T A | | |
|
|
| | | | | | Ratios to Average | |
| | | | | | Net Assets Before Expenses | |
| | | | Ratio to Average Net | Waived, Credited or Paid | |
| | | | Assets(d) | Indirectly(d) | |
| Net Asset | | |
|
| |
| Value, | | Net Assets | | Net | | Net | Portfolio |
| End of | Total | End of Period | | Investment | | Investment | Turnover |
| Period | Return(c) | (in millions) | Expenses | Income/(Loss) | Expenses | Income/(Loss) | Rate |
|
| $10.37 | 3.70% | $25.2 | 0.89% | (0.60)% | 1.62% | (1.34)% | 3% |
| |
| 10.39 | 3.90% | 4.2 | 0.10% | 0.08% | 0.87% | (0.69)% | 3% |
|
| 10.31 | 3.10% | 63.2 | 0.44% | 0.45% | 1.03% | (0.14)% | 4% |
| |
| 10.33 | 3.30% | 2.7 | (0.04)% | 0.88% | 0.57% | 0.28% | 4% |
|
| 10.22 | 2.36% | 76.2 | 0.27% | 1.30% | 0.90% | 0.67% | 3% |
| |
| 10.23 | 2.49% | 2.9 | (0.13)% | 1.67% | 0.51% | 1.03% | 3% |
|
| |
| 10.13 | 1.53% | 32.9 | 0.34% | 2.04% | 1.21% | 1.17% | 4% |
| |
| 10.14 | 1.66% | 0.8 | 0.18% | 2.14% | 1.03% | 1.29% | 4% |
|
(d) Computed on an annualized basis for periods less than one year.
(e) Since fund inception, June 30, 2005.
The accompanying notes to the financial statements are an integral part of this schedule.
259
Thrivent Mutual Funds
Financial Highlights – continued
|
| | F O R A S H A R E O U T S T A N D I N G T H R O U G H O U T E A C H P E R I O D(a) | |
| |
|
| |
| | | | | | Less Distributions | |
| | | Income from Investment Operations | from | | |
| |
|
| |
| | Net Asset | | Net Realized | | | Net | |
| | Value, | Net | and Unrealized | Total from | Net | Realized | |
| | Beginning | Investment | Gain/(Loss) on | Investment | Investment | Gain on | Total |
| | of Period | Income/(Loss) | Investments(b) | Operations | Income | Investments | Distributions |
|
| TECHNOLOGY FUND | | | | | | | |
| Class A Shares | | | | | | | |
| Year Ended 10/31/2005 | $3.28 | $(0.01) | $0.21 | $0.20 | $-- | $-- | $-- |
| Period Ended 10/31/2004(e) | 3.20 | (0.02) | 0.10 | 0.08 | -- | -- | -- |
| Year Ended 4/30/2004 | 2.50 | (0.03) | 0.73 | 0.70 | -- | -- | -- |
| Year Ended 4/30/2003 | 3.15 | (0.05) | (0.60) | (0.65) | -- | -- | -- |
| Year Ended 4/30/2002 | 5.13 | (0.06) | (1.92) | (1.98) | -- | -- | -- |
| Year Ended 4/30/2001(f) | 10.00 | (0.05) | (4.82) | (4.87) | -- | -- | -- |
| Class B Shares | | | | | | | |
| Year Ended 10/31/2005 | 3.16 | (0.03) | 0.21 | 0.18 | -- | -- | -- |
| Period Ended 10/31/2004(e) | 3.09 | (0.03) | 0.10 | 0.07 | -- | -- | -- |
| Year Ended 4/30/2004 | 2.43 | (0.04) | 0.70 | 0.66 | -- | -- | -- |
| Year Ended 4/30/2003 | 3.09 | (0.06) | (0.60) | (0.66) | -- | -- | -- |
| Year Ended 4/30/2002 | 5.10 | (0.09) | (1.92) | (2.01) | -- | -- | -- |
| Year Ended 4/30/2001(f) | 10.00 | (0.09) | (4.81) | (4.90) | -- | -- | -- |
| Class I Shares | | | | | | | |
| Year Ended 10/31/2005 | 3.42 | 0.01 | 0.22 | 0.23 | -- | -- | -- |
| Period Ended 10/31/2004(e) | 3.32 | (0.01) | 0.11 | 0.10 | -- | -- | -- |
| Year Ended 4/30/2004 | 2.59 | (0.02) | 0.75 | 0.73 | -- | -- | -- |
| Year Ended 4/30/2003 | 3.22 | (0.02) | (0.61) | (0.63) | -- | -- | -- |
| Year Ended 4/30/2002 | 5.19 | (0.03) | (1.94) | (1.97) | -- | -- | -- |
| Year Ended 4/30/2001(f) | 10.00 | (0.02) | (4.79) | (4.81) | -- | -- | -- |
|
| PARTNER SMALL CAP GROWTH FUND | | | | | | |
| Class A Shares | | | | | | | |
| Year Ended 10/31/2005(g) | 10.00 | (0.04) | 0.32 | 0.28 | -- | -- | -- |
| Class I Shares | | | | | | | |
| Year Ended 10/31/2005(g) | 10.00 | (0.02) | 0.30 | 0.28 | -- | -- | -- |
(a) All per share amounts have been rounded to the nearest cent.
(b) The amount shown may not correlate with the change in aggregate gains and losses of portfolio securities due to the timing of sales and redemptions of fund shares.
(c) Total investment return assumes dividend reinvestment and does not reflect any deduction for sales charges. Not annualized for periods less than one year.
The accompanying notes to the financial statements are an integral part of this schedule.
260
Thrivent Mutual Funds
Financial Highlights – continued
|
|
| | | | R A T I O S / S U P P L E M E N T A L D A T A | | |
|
|
| | | | | | Ratios to Average | |
| | | | | | Net Assets Before Expenses | |
| | | | Ratio to Average Net | Waived, Credited or Paid | |
| | | | Assets(d) | Indirectly(d)�� | |
| Net Asset | | |
|
| |
| Value, | | Net Assets | | Net | | Net | Portfolio |
| End of | Total | End of Period | | Investment | | Investment | Turnover |
| Period | Return(c) | (in millions) | Expenses | Income/(Loss) | Expenses | Income/(Loss) | Rate |
|
| $3.48 | 6.10% | $42.7 | 1.52% | (0.40)% | 2.04% | (0.92)% | 37% |
| 3.28 | 2.50% | 42.5 | 1.70% | (1.32)% | 2.22% | (1.84)% | 23% |
| 3.20 | 28.00% | 41.5 | 1.36% | (1.02)% | 2.19% | (1.85)% | 67% |
| 2.50 | (20.63)% | 29.3 | 2.39% | (2.09)% | 2.75% | (2.45)% | 67% |
| 3.15 | (38.60)% | 31.4 | 2.29% | (2.05)% | 2.33% | (2.09)% | 57% |
| 5.13 | (48.70)% | 27.8 | 2.40% | (1.70)% | 2.40% | (1.71)% | 44% |
| |
| 3.34 | 5.70% | 3.5 | 2.07% | (0.91)% | 3.08% | (1.93)% | 37% |
| 3.16 | 2.27% | 4.0 | 2.32% | (1.94)% | 3.34% | (2.96)% | 23% |
| 3.09 | 27.16% | 3.9 | 1.85% | (1.51)% | 3.36% | (3.02)% | 67% |
| 2.43 | (21.36)% | 2.6 | 3.50% | (3.20)% | 4.12% | (3.82)% | 67% |
| 3.09 | (39.41)% | 2.6 | 3.25% | (3.01)% | 3.29% | (3.05)% | 57% |
| 5.10 | (49.00)% | 2.6 | 3.40% | (2.68)% | 3.41% | (2.69)% | 44% |
| |
| 3.65 | 6.73% | 2.6 | 0.94% | 0.24% | 0.95% | 0.22% | 37% |
| 3.42 | 3.01% | 3.0 | 1.00% | (0.62)% | 1.02% | (0.64)% | 23% |
| 3.32 | 28.19% | 2.9 | 1.00% | (0.66)% | 1.02% | (0.68)% | 67% |
| 2.59 | (19.57)% | 2.2 | 1.06% | (0.76)% | 1.08% | (0.78)% | 67% |
| 3.22 | (37.96)% | 7.9 | 1.10% | (0.86)% | 1.14% | (0.90)% | 57% |
| 5.19 | (48.10)% | 9.3 | 1.32% | (0.59)% | 1.33% | (0.60)% | 44% |
|
| 10.28 | 2.80% | 9.5 | 1.61% | (1.16)% | 2.42% | (1.97)% | 37% |
| |
| 10.28 | 2.80% | 4.2 | 1.39% | (0.99)% | 2.21% | (1.81)% | 37% |
(d) Computed on an annualized basis for periods less than one year.
(e) For the period from May 1, 2004 to October 31, 2004.
(f) Since fund inception, July 1, 2000.
(g) Since fund inception, June 30, 2005.
The accompanying notes to the financial statements are an integral part of this schedule.
261
Thrivent Mutual Funds
Financial Highlights – continued |
|
| | F O R A S H A R E O U T S T A N D I N G T H R O U G H O U T E A C H P E R I O D(a) |
| |
|
| | | | | | Less Distributions | |
| | | Income from Investment Operations | | | from | | |
| | |
|
| |
| | Net Asset | | Net Realized | | | Net | |
| | Value, | Net | and Unrealized | Total from | Net | Realized | |
| | Beginning | Investment | Gain/(Loss) on | Investment | Investment | Gain on | Total |
| | of Period | Income/(Loss) | Investments(b) | Operations | Income | Investments | Distributions |
|
| PARTNER SMALL CAP VALUE FUND | | | | | | |
| Class A Shares | | | | | | | |
| Year Ended 10/31/2005 | $14.27 | $0.04 | $1.61 | $1.65 | $(0.01) | $(1.85) | $(1.86) |
| Period Ended 10/31/2004(e) | 13.58 | 0.01 | 1.02 | 1.03 | -- | (0.34) | (0.34) |
| Year Ended 4/30/2004 | 9.33 | (0.05) | 4.30 | 4.25 | -- | -- | -- |
| Year Ended 4/30/2003 | 11.65 | (0.07) | (2.18) | (2.25) | -- | (0.07) | (0.07) |
| Year Ended 4/30/2002 (f) | 10.00 | (0.05) | 1.70 | 1.65 | -- | -- | -- |
| Class B Shares | | | | | | | |
| Year Ended 10/31/2005 | 13.88 | (0.10) | 1.57 | 1.47 | -- | (1.85) | (1.85) |
| Period Ended 10/31/2004(e) | 13.29 | (0.06) | 0.99 | 0.93 | -- | (0.34) | (0.34) |
| Year Ended 4/30/2004 | 9.21 | (0.14) | 4.22 | 4.08 | -- | -- | -- |
| Year Ended 4/30/2003 | 11.59 | (0.12) | (2.19) | (2.31) | -- | (0.07) | (0.07) |
| Year Ended 4/30/2002 (f) | 10.00 | (0.11) | 1.70 | 1.59 | -- | -- | -- |
| Class I Shares | | | | | | | |
| Year Ended 10/31/2005 | 14.67 | 0.13 | 1.67 | 1.80 | (0.05) | (1.85) | (1.90) |
| Period Ended 10/31/2004(e) | 13.90 | 0.05 | 1.06 | 1.11 | -- | (0.34) | (0.34) |
| Year Ended 4/30/2004 | 9.47 | 0.03 | 4.40 | 4.43 | -- | -- | -- |
| Year Ended 4/30/2003 | 11.71 | -- | (2.17) | (2.17) | -- | (0.07) | (0.07) |
| Year Ended 4/30/2002 (f) | 10.00 | (0.05) | 1.76 | 1.71 | -- | -- | -- |
|
| SMALL CAP STOCK FUND | | | | | | | |
| Class A Shares | | | | | | | |
| Year Ended 10/31/2005 | 16.39 | (0.08) | 2.30 | 2.22 | -- | (0.82) | (0.82) |
| Period Ended 10/31/2004(e) | 16.39 | (0.04) | 0.99 | 0.95 | -- | (0.95) | (0.95) |
| Year Ended 4/30/2004 | 11.55 | (0.11) | 4.95 | 4.84 | -- | -- | -- |
| Year Ended 4/30/2003 | 14.82 | (0.09) | (3.18) | (3.27) | -- | -- | -- |
| Year Ended 4/30/2002 | 13.39 | (0.09) | 1.60 | 1.51 | -- | (0.08) | (0.08) |
| Year Ended 4/30/2001 | 14.60 | (0.06) | 1.05 | 0.99 | -- | (2.20) | (2.20) |
| Class B Shares | | | | | | | |
| Year Ended 10/31/2005 | 15.11 | (0.27) | 2.16 | 1.89 | -- | (0.82) | (0.82) |
| Period Ended 10/31/2004(e) | 15.26 | (0.11) | 0.91 | 0.80 | -- | (0.95) | (0.95) |
| Year Ended 4/30/2004 | 10.86 | (0.26) | 4.66 | 4.40 | -- | -- | -- |
| Year Ended 4/30/2003 | 14.08 | (0.26) | (2.96) | (3.22) | -- | -- | -- |
| Year Ended 4/30/2002 | 12.86 | (0.24) | 1.54 | 1.30 | -- | (0.08) | (0.08) |
| Year Ended 4/30/2001 | 14.24 | (0.18) | 1.00 | 0.82 | -- | (2.20) | (2.20) |
| Class I Shares | | | | | | | |
| Year Ended 10/31/2005 | 17.21 | 0.02 | 2.44 | 2.46 | -- | (0.82) | (0.82) |
| Period Ended 10/31/2004(e) | 17.12 | (0.02) | 1.06 | 1.04 | -- | (0.95) | (0.95) |
| Year Ended 4/30/2004 | 11.98 | (0.01) | 5.15 | 5.14 | -- | -- | -- |
| Year Ended 4/30/2003 | 15.26 | (0.06) | (3.22) | (3.28) | -- | -- | -- |
| Year Ended 4/30/2002 | 13.71 | (0.01) | 1.64 | 1.63 | -- | (0.08) | (0.08) |
| Year Ended 4/30/2001 | 14.80 | 0.01 | 1.10 | 1.11 | -- | (2.20) | (2.20) |
(a) All per share amounts have been rounded to the nearest cent.
(b) The amount shown may not correlate with the change in aggregate gains and losses of portfolio securities due to the timing of sales and redemptions of fund shares.
(c) Total investment return assumes dividend reinvestment and does not reflect any deduction for sales charges. Not annualized for periods less than one year.
The accompanying notes to the financial statements are an integral part of this schedule.
262
Thrivent Mutual Funds
Financial Highlights – continued
|
|
| | | | R A T I O S / S U P P L E M E N T A L D A T A | | |
|
|
| | | | | | Ratios to Average | |
| | | | | | Net Assets Before Expenses | |
| | | | Ratio to Average Net | Waived, Credited or Paid | |
| | | | Assets(d) | Indirectly(d) | |
| Net Asset | | |
|
| |
| Value, | | Net Assets | | Net | | Net | Portfolio |
| End of | Total | End of Period | | Investment | | Investment | Turnover |
| Period | Return(c) | (in millions) | Expenses | Income/(Loss) | Expenses | Income/(Loss) | Rate |
|
| |
| $14.06 | 12.13% | $74.5 | 1.04% | 0.26% | 1.55% | (0.25)% | 53% |
| 14.27 | 7.60% | 61.4 | 1.10% | 0.61% | 1.61% | 0.10% | 100% |
| 13.58 | 45.55% | 50.6 | 1.32% | (0.46)% | 1.84% | (0.98)% | 80% |
| 9.33 | (19.38)% | 27.7 | 1.86% | (0.88)% | 2.05% | (1.07)% | 147% |
| 11.65 | 16.50% | 22.3 | 2.12% | (1.19)% | 2.16% | (1.23)% | 50% |
| |
| 13.50 | 11.03% | 5.5 | 2.02% | (0.72)% | 2.53% | (1.23)% | 53% |
| 13.88 | 7.01% | 5.4 | 2.10% | (0.41)% | 2.61% | (0.92)% | 100% |
| 13.29 | 44.30% | 5.7 | 2.20% | (1.33)% | 2.73% | (1.86)% | 80% |
| 9.21 | (20.00)% | 2.9 | 2.71% | (1.73)% | 2.91% | (1.93)% | 147% |
| 11.59 | 15.90% | 2.3 | 2.86% | (1.93)% | 2.90% | (1.97)% | 50% |
| |
| 14.57 | 12.92% | 16.4 | 0.33% | 0.97% | 0.84% | 0.46% | 53% |
| 14.67 | 8.01% | 13.3 | 0.40% | 1.32% | 0.91% | 0.81% | 100% |
| 13.90 | 46.78% | 10.3 | 0.52% | 0.34% | 1.04% | (0.18)% | 80% |
| 9.47 | (18.59)% | 3.8 | 0.87% | 0.10% | 1.07% | (0.10)% | 147% |
| 11.71 | 17.10% | 3.5 | 1.59% | (0.66)% | 1.63% | (0.70)% | 50% |
|
| |
| 17.79 | 13.81% | 440.6 | 1.32% | (0.45)% | 1.33% | (0.47)% | 114% |
| 16.39 | 5.88% | 397.3 | 1.36% | (0.49)% | 1.38%(g) | (0.51)% | 52% |
| 16.39 | 41.90% | 379.5 | 1.38% | (0.71)% | 1.40% | (0.73)% | 106% |
| 11.55 | (22.06)% | 266.7 | 1.47% | (0.78)% | 1.49% | (0.80)% | 97% |
| 14.82 | 11.29% | 344.3 | 1.36% | (0.69)% | 1.37% | (0.70)% | 59% |
| 13.39 | 7.77% | 258.6 | 1.40% | (0.54)% | 1.41% | (0.54)% | 123% |
| |
| 16.18 | 12.75% | 20.5 | 2.32% | (1.47)% | 2.34% | (1.49)% | 114% |
| 15.11 | 5.31% | 25.1 | 2.39% | (1.52)% | 2.41% | (1.54)% | 52% |
| 15.26 | 40.52% | 25.3 | 2.42% | (1.75)% | 2.44% | (1.77)% | 106% |
| 10.86 | (22.87)% | 21.1 | 2.45% | (1.75)% | 2.47% | (1.77)% | 97% |
| 14.08 | 10.11% | 33.8 | 2.39% | (1.72)% | 2.41% | (1.74)% | 59% |
| 12.86 | 6.72% | 31.2 | 2.39% | (1.52)% | 2.40% | (1.53)% | 123% |
| |
| 18.85 | 14.58% | 21.1 | 0.72% | 0.15% | 0.74% | 0.13% | 114% |
| 17.21 | 6.17% | 11.6 | 0.73% | (0.24)% | 0.75%(g) | (0.26)% | 52% |
| 17.12 | 42.90% | 11.0 | 0.73% | (0.06)% | 0.75% | (0.08)% | 106% |
| 11.98 | (21.49)% | 6.8 | 0.73% | (0.03)% | 0.75% | (0.05)% | 97% |
| 15.26 | 11.90% | 5.3 | 0.74% | (0.07)% | 0.75% | (0.08)% | 59% |
| 13.71 | 8.53% | 3.8 | 0.78% | 0.11% | 0.78% | 0.10% | 123% |
(d) Computed on an annualized basis for periods less than one year.
(e) For the period from May 1, 2004 to October 31, 2004.
(f) Since fund inception, July 17, 2001.
(g) Amount has been revised to correct a typographical error in the prior year annual report.
The accompanying notes to the financial statements are an integral part of this schedule.
263
Thrivent Mutual Funds
Financial Highlights – continued
|
|
| | F O R A S H A R E O U T S T A N D I N G T H R O U G H O U T E A C H P E R I O D(a) |
| |
|
| | | | | | Less Distributions | |
| | | Income from Investment Operations | from | |
| | |
|
| |
| | Net Asset | | Net Realized | | | Net | |
| | Value, | Net | and Unrealized | Total from | Net | Realized | |
| | Beginning | Investment | Gain/(Loss) on | Investment | Investment | Gain on | Total |
| | of Period | Income/(Loss) | Investments(b) | Operations | Income | Investments | Distributions |
|
| SMALL CAP INDEX FUND | | | | | | | |
| Class A Shares | | | | | | | |
| Year Ended 10/31/2005 | $12.63 | $0.03 | $1.74 | $1.77 | $(0.02) | $(0.10) | $(0.12) |
| Period Ended 10/31/2004(e) | 12.26 | 0.02 | 0.85 | 0.87 | -- | (0.50) | (0.50) |
| Year Ended 4/30/2004 | 8.89 | (0.01) | 3.42 | 3.41 | -- | (0.04) | (0.04) |
| Year Ended 4/30/2003 | 11.42 | (0.04) | (2.43) | (2.47) | -- | (0.06) | (0.06) |
| Year Ended 4/30/2002 | 10.03 | (0.07) | 1.52 | 1.45 | -- | (0.06) | (0.06) |
| Year Ended 4/30/2001(f) | 10.00 | (0.07) | 0.21 | 0.14 | -- | (0.11) | (0.11) |
|
| MID CAP GROWTH FUND | | | | | | | |
| Class A Shares | | | | | | | |
| Year Ended 10/31/2005 | 12.75 | (0.10) | 1.94 | 1.84 | -- | -- | -- |
| Year Ended 10/31/2004 | 12.35 | (0.02) | 0.42 | 0.40 | -- | -- | -- |
| Year Ended 10/31/2003 | 9.50 | (0.15) | 3.00 | 2.85 | -- | -- | -- |
| Year Ended 10/31/2002 | 11.43 | (0.13) | (1.80) | (1.93) | -- | -- | -- |
| Year Ended 10/31/2001 | 18.29 | (0.11) | (5.40) | (5.51) | -- | (1.35) | (1.35) |
| Class B Shares | | | | | | | |
| Year Ended 10/31/2005 | 12.05 | (0.27) | 1.86 | 1.59 | -- | -- | -- |
| Year Ended 10/31/2004 | 11.78 | (0.19) | 0.46 | 0.27 | -- | -- | -- |
| Year Ended 10/31/2003 | 9.13 | (0.24) | 2.89 | 2.65 | -- | -- | -- |
| Year Ended 10/31/2002 | 11.06 | (0.13) | (1.80) | (1.93) | -- | -- | -- |
| Year Ended 10/31/2001 | 17.87 | (0.07) | (5.39) | (5.46) | -- | (1.35) | (1.35) |
| Class I Shares | | | | | | | |
| Year Ended 10/31/2005 | 13.39 | 0.01 | 2.04 | 2.05 | -- | -- | -- |
| Year Ended 10/31/2004 | 12.87 | (0.01) | 0.53 | 0.52 | -- | -- | -- |
| Year Ended 10/31/2003 | 9.79 | (0.04) | 3.12 | 3.08 | -- | -- | -- |
| Year Ended 10/31/2002 | 11.66 | (0.01) | (1.86) | (1.87) | -- | -- | -- |
| Year Ended 10/31/2001 | 18.49 | 0.04 | (5.52) | (5.48) | -- | (1.35) | (1.35) |
|
| PARTNER MID CAP VALUE FUND | | | | | | |
| Class A Shares | | | | | | | |
| Year Ended 10/31/2005(e) | 10.00 | -- | 0.13 | 0.13 | -- | -- | -- |
| Class I Shares | | | | | | | |
| Year Ended 10/31/2005(e) | 10.00 | 0.01 | 0.13 | 0.14 | -- | -- | -- |
(a) All per share amounts have been rounded to the nearest cent.
(b) The amount shown may not correlate with the change in aggregate gains and losses of portfolio securities due to the timing of sales and redemptions of fund shares.
(c) Total investment return assumes dividend reinvestment and does not reflect any deduction for sales charges. Not annualized for periods less than one year.
The accompanying notes to the financial statements are an integral part of this schedule.
264
Thrivent Mutual Funds
Financial Highlights – continued
|
|
| | | | R A T I O S / | S U P P L E M E N T A L | D A T A | | |
|
|
| | | | | | Ratios to Average | |
| | | | | | Net Assets Before Expenses | |
| | | | Ratio to Average Net | Waived, Credited or Paid | |
| | | | Assets(d) | Indirectly(d) | |
| Net Asset | | |
|
| |
| Value, | | Net Assets | | Net | | Net | Portfolio |
| End of | Total | End of Period | | Investment | | Investment | Turnover |
| Period | Return(c) | (in millions) | Expenses | Income/(Loss) | Expenses | Income/(Loss) | Rate |
|
| |
| $14.28 | 14.05% | $46.9 | 0.95% | 0.21% | 1.18% | (0.02)% | 17% |
| 12.63 | 7.11% | 35.4 | 0.95% | 0.43% | 1.37% | 0.01% | 17% |
| 12.26 | 38.37% | 34.4 | 1.04% | (0.13)% | 1.25% | (0.34)% | 18% |
| 8.89 | (21.69)% | 20.5 | 1.35% | (0.44)% | 1.40% | (0.49)% | 18% |
| 11.42 | 14.53% | 21.6 | 1.51% | (0.77)% | 1.51% | (0.77)% | 18% |
| 10.03 | 1.43% | 13.3 | 1.86% | (1.03)% | 1.86% | (1.03)% | 36% |
|
| |
| 14.59 | 14.43% | 269.0 | 1.26% | (0.71)% | 1.28% | (0.72)% | 146% |
| 12.75 | 3.24% | 250.7 | 1.36% | (0.95)% | 1.36% | (0.95)% | 154% |
| 12.35 | 29.86% | 113.1 | 1.88% | (1.51)% | 1.94% | (1.57)% | 76% |
| 9.50 | (16.80)% | 86.2 | 1.54% | (1.17)% | 1.89% | (1.52)% | 55% |
| 11.43 | (32.17)% | 107.7 | 1.41% | (0.73)% | 1.69% | (1.01)% | 137% |
| |
| 13.64 | 13.20% | 36.1 | 2.31% | (1.75)% | 2.44% | (1.88)% | 146% |
| 12.05 | 2.29% | 45.0 | 2.32% | (1.91)% | 2.32%(g) | (1.91)% | 154% |
| 11.78 | 29.03% | 37.2 | 2.63% | (2.27)% | 2.69% | (2.33)% | 76% |
| 9.13 | (17.45)% | 31.1 | 2.29% | (1.92)% | 2.64% | (2.27)% | 55% |
| 11.06 | (32.68)% | 31.8 | 2.16% | (1.48)% | 2.44% | (1.76)% | 137% |
| |
| 15.44 | 15.31% | 11.7 | 0.49% | 0.07% | 0.50% | 0.06% | 146% |
| 13.39 | 4.04% | 10.1 | 0.62% | (0.21)% | 0.73% | (0.32)% | 154% |
| 12.87 | 31.46% | 7.3 | 0.74% | (0.37)% | 0.95% | (0.58)% | 76% |
| 9.79 | (16.04)% | 12.6 | 0.58% | (0.21)% | 0.93% | (0.56)% | 55% |
| 11.66 | (31.62)% | 7.7 | 0.64% | 0.04% | 0.92% | (0.24)% | 137% |
|
| |
| 10.13 | 1.30% | 5.1 | 1.61% | 0.08% | 3.10% | (1.41)% | 15% |
| |
| |
| 10.14 | 1.40% | 3.7 | 1.17% | 0.43% | 2.81% | (1.21)% | 15% |
(d) Computed on an annualized basis for periods less than one year.
(e) Since fund inception, June 30, 2005.
(f) Since fund inception, July 1, 2000.
(g) Amount has been revised to correct a typographical error in the prior year annual report.
The accompanying notes to the financial statements are an integral part of this schedule.
265
Thrivent Mutual Funds
Financial Highlights – continued
|
|
| | F O R A S H A R E O U T S T A N D I N G T H R O U G H O U T E A C H P E R I O D(a) |
| |
|
| |
| | | | | | Less Distributions | |
| | | Income from Investment Operations | from | |
| | |
|
| |
| | Net Asset | | Net Realized | | | Net | |
| | Value, | Net | and Unrealized | Total from | Net | Realized | |
| | Beginning | Investment | Gain/(Loss) on | Investment | Investment | Gain on | Total |
| | of Period | Income/(Loss) | Investments(b) | Operations | Income | Investments | Distributions |
|
| MID CAP STOCK FUND | | | | | | | |
| Class A Shares | | | | | | | |
| Year Ended 10/31/2005 | $14.74 | $-- | $3.11 | $3.11 | $-- | $-- | $-- |
| Period Ended 10/31/2004(e) | 13.96 | (0.02) | 0.80 | 0.78 | -- | -- | -- |
| Year Ended 4/30/2004 | 10.74 | (0.05) | 3.27 | 3.22 | -- | -- | -- |
| Year Ended 4/30/2003 | 13.01 | (0.02) | (2.25) | (2.27) | -- | -- | -- |
| Year Ended 4/30/2002 | 14.73 | (0.03) | (1.31) | (1.34) | -- | (0.38) | (0.38) |
| Year Ended 4/30/2001 | 16.73 | -- | 1.19 | 1.19 | -- | (3.19) | (3.19) |
| Class B Shares | | | | | | | |
| Year Ended 10/31/2005 | 13.42 | (0.19) | 2.85 | 2.66 | -- | -- | -- |
| Period Ended 10/31/2004(e) | 12.78 | (0.09) | 0.73 | 0.64 | -- | -- | -- |
| Year Ended 4/30/2004 | 9.95 | (0.19) | 3.02 | 2.83 | -- | -- | -- |
| Year Ended 4/30/2003 | 12.20 | (0.18) | (2.07) | (2.25) | -- | -- | -- |
| Year Ended 4/30/2002 | 14.00 | (0.17) | (1.25) | (1.42) | -- | (0.38) | (0.38) |
| Year Ended 4/30/2001 | 16.20 | (0.12) | 1.11 | 0.99 | -- | (3.19) | (3.19) |
| Class I Shares | | | | | | | |
| Year Ended 10/31/2005 | 15.30 | 0.07 | 3.26 | 3.33 | -- | -- | -- |
| Period Ended 10/31/2004(e) | 14.46 | 0.02 | 0.82 | 0.84 | -- | -- | -- |
| Year Ended 4/30/2004 | 11.06 | 0.03 | 3.37 | 3.40 | -- | -- | -- |
| Year Ended 4/30/2003 | 13.31 | 0.05 | (2.30) | (2.25) | -- | -- | -- |
| Year Ended 4/30/2002 | 14.98 | 0.03 | (1.32) | (1.29) | -- | (0.38) | (0.38) |
| Year Ended 4/30/2001 | 16.89 | 0.07 | 1.21 | 1.28 | -- | (3.19) | (3.19) |
|
| MID CAP INDEX FUND | | | | | | | |
| Class A Shares | | | | | | | |
| Year Ended 10/31/2005 | 11.86 | 0.08 | 1.91 | 1.99 | (0.03) | (0.05) | (0.08) |
| Period Ended 10/31/2004(e) | 11.48 | 0.01 | 0.37 | 0.38 | -- | -- | -- |
| Year Ended 4/30/2004 | 8.65 | 0.01 | 2.82 | 2.83 | -- | -- | -- |
| Year Ended 4/30/2003 | 10.71 | -- | (1.97) | (1.97) | -- | (0.09) | (0.09) |
| Year Ended 4/30/2002 | 10.24 | (0.03) | 0.53 | 0.50 | -- | (0.03) | (0.03) |
| Year Ended 4/30/2001(f) | 10.00 | (0.04) | 0.31 | 0.27 | -- | (0.03) | (0.03) |
|
| MID CAP INDEX FUND - I | | | | | | | |
| Class I Shares | | | | | | | |
| Year Ended 10/31/2005 | 11.85 | 0.10 | 1.88 | 1.98 | (0.10) | (0.39) | (0.49) |
| Period Ended 10/31/2004(e) | 11.79 | 0.05 | 0.33 | 0.38 | -- | (0.32) | (0.32) |
| Year Ended 4/30/2004 | 8.91 | 0.07 | 2.93 | 3.00 | (0.06) | (0.06) | (0.12) |
| Year Ended 4/30/2003 | 11.23 | 0.08 | (2.07) | (1.99) | (0.08) | (0.25) | (0.33) |
| Year Ended 4/30/2002 | 10.80 | 0.06 | 0.60 | 0.66 | (0.07) | (0.16) | (0.23) |
| Year Ended 4/30/2001 | 10.90 | 0.08 | 0.57 | 0.65 | (0.09) | (0.66) | (0.75) |
(a) All per share amounts have been rounded to the nearest cent.
(b) The amount shown may not correlate with the change in aggregate gains and losses of portfolio securities due to the timing of sales and redemptions of fund shares.
(c) Total investment return assumes dividend reinvestment and does not reflect any deduction for sales charges. Not annualized for periods less than one year.
The accompanying notes to the financial statements are an integral part of this schedule.
266
Thrivent Mutual Funds
Financial Highlights – continued
|
|
| | | | R A T I O S / S U P P L E M E N T A L D A T A | | |
|
|
| | | | | | Ratios to Average | |
| | | | | | Net Assets Before Expenses | |
| | | | Ratio to Average Net | Waived, Credited or Paid | |
| | | | Assets(d) | Indirectly(d) | |
| Net Asset | | |
|
| |
| Value, | | Net Assets | | Net | | Net | Portfolio |
| End of | Total | End of Period | | Investment | | Investment | Turnover |
| Period | Return(c) | (in millions) | Expenses | Income/(Loss) | Expenses | Income/(Loss) | Rate |
|
| $17.85 | 21.10% | $928.0 | 1.21% | (0.02)% | 1.22% | (0.03)% | 96% |
| 14.74 | 5.59% | 808.8 | 1.24% | (0.30)% | 1.25% | (0.31)% | 46% |
| 13.96 | 29.98% | 789.9 | 1.26% | (0.36)% | 1.27% | (0.37)% | 123% |
| 10.74 | (17.45)% | 643.8 | 1.30% | (0.18)% | 1.31% | (0.19)% | 48% |
| 13.01 | (9.36)% | 836.5 | 1.22% | (0.25)% | 1.23% | (0.26)% | 97% |
| 14.73 | 7.26% | 883.2 | 1.16% | 0.02% | 1.17% | 0.01% | 144% |
| |
| 16.08 | 19.82% | 24.0 | 2.28% | (1.10)% | 2.29% | (1.12)% | 96% |
| 13.42 | 5.01% | 27.0 | 2.35% | (1.41)% | 2.36% | (1.42)% | 46% |
| 12.78 | 28.44% | 26.8 | 2.44% | (1.55)% | 2.45% | (1.56)% | 123% |
| 9.95 | (18.44)% | 22.8 | 2.50% | (1.38)% | 2.51% | (1.39)% | 48% |
| 12.20 | (10.44)% | 33.1 | 2.38% | (1.41)% | 2.39% | (1.42)% | 97% |
| 14.00 | 6.18% | 36.4 | 2.19% | (1.01)% | 2.20% | (1.01)% | 144% |
| |
| 18.63 | 21.76% | 50.7 | 0.70% | 0.51% | 0.71% | 0.49% | 96% |
| 15.30 | 5.81% | 29.8 | 0.71% | 0.23% | 0.72% | 0.22% | 46% |
| 14.46 | 30.74% | 28.4 | 0.70% | 0.20% | 0.71% | 0.19% | 123% |
| 11.06 | (16.90)% | 20.7 | 0.68% | 0.44% | 0.69% | 0.43% | 48% |
| 13.31 | (8.86)% | 24.8 | 0.69% | 0.28% | 0.70% | 0.27% | 97% |
| 14.98 | 7.68% | 24.3 | 0.68% | 0.50% | 0.69% | 0.50% | 144% |
|
| |
| 13.77 | 16.80% | 62.5 | 0.90% | 0.62% | 1.07% | 0.45% | 23% |
| 11.86 | 3.33% | 49.2 | 0.92% | (0.10)% | 1.23% | (0.41)% | 8% |
| 11.48 | 32.72% | 38.5 | 1.12% | 0.09% | 1.24% | (0.03)% | 30% |
| 8.65 | (18.36)% | 29.0 | 1.21% | (0.03)% | 1.21% | (0.03)% | 16% |
| 10.71 | 4.94% | 29.2 | 1.36% | (0.31)% | 1.36% | (0.31)% | 15% |
| 10.24 | 2.73% | 18.1 | 1.71% | (0.58)% | 1.71% | (0.58)% | 31% |
|
| 13.34 | 17.00% | 23.1 | 0.70% | 0.80% | 0.71% | 0.80% | 42% |
| 11.85 | 3.22% | 17.3 | 0.75% | 0.46% | 0.76% | 0.45% | 8% |
| 11.79 | 33.71% | 31.7 | 0.54% | 0.68% | 0.55% | 0.67% | 13% |
| 8.91 | (17.68)% | 20.8 | 0.28% | 0.89% | 0.57% | 0.60% | 22% |
| 11.23 | 6.23% | 24.3 | 0.20% | 0.84% | 0.88% | 0.16% | 21% |
| 10.80 | 6.13% | 13.0 | 0.20% | 0.90% | 1.31% | (0.21)% | 54% |
(d) Computed on an annualized basis for periods less than one year.
(e) For the period from May 1, 2004 to October 31, 2004.
(f) Since fund inception, July 1, 2000.
The accompanying notes to the financial statements are an integral part of this schedule.
267
Thrivent Mutual Funds
Financial Highlights – continued
|
|
| | F O R A S H A R E O U T S T A N D I N G T H R O U G H O U T E A C H P E R I O D(a) |
| |
|
| |
| | | | | | Less Distributions | |
| | | Income from Investment Operations | from | |
| | |
|
| |
| | Net Asset | | Net Realized | | | Net | |
| | Value, | Net | and Unrealized | Total from | Net | Realized | |
| | Beginning | Investment | Gain/(Loss) on | Investment | Investment | Gain on | Total |
| | of Period | Income/(Loss) | Investments(b) | Operations | Income | Investments | Distributions |
|
| PARTNER INTERNATIONAL STOCK FUND | | | | | | |
| Class A Shares | | | | | | | |
| Year Ended 10/31/2005 | $9.10 | $0.11 | $1.36 | $1.47 | $-- | $-- | $-- |
| Year Ended 10/31/2004 | 8.19 | 0.02 | 0.93 | 0.95 | (0.04) | -- | (0.04) |
| Year Ended 10/31/2003 | 6.84 | (0.02) | 1.37 | 1.35 | -- | -- | -- |
| Year Ended 10/31/2002 | 8.00 | (0.03) | (1.13) | (1.16) | -- | -- | -- |
| Year Ended 10/31/2001 | 12.08 | (0.04) | (3.06) | (3.10) | -- | (0.98) | (0.98) |
| Class B Shares | | | | | | | |
| Year Ended 10/31/2005 | 8.86 | (0.02) | 1.32 | 1.30 | -- | -- | -- |
| Year Ended 10/31/2004 | 8.00 | (0.11) | 0.97 | 0.86 | -- | -- | -- |
| Year Ended 10/31/2003 | 6.74 | (0.08) | 1.34 | 1.26 | -- | -- | -- |
| Year Ended 10/31/2002 | 7.94 | (0.05) | (1.15) | (1.20) | -- | -- | -- |
| Year Ended 10/31/2001 | 12.10 | (0.05) | (3.11) | (3.16) | -- | (1.00) | (1.00) |
| Class I Shares | | | | | | | |
| Year Ended 10/31/2005 | 9.23 | 0.07 | 1.48 | 1.55 | (0.01) | -- | (0.01) |
| Year Ended 10/31/2004 | 8.31 | (0.02) | 1.07 | 1.05 | (0.13) | -- | (0.13) |
| Year Ended 10/31/2003 | 6.85 | 0.09 | 1.37 | 1.46 | -- | -- | -- |
| Year Ended 10/31/2002 | 7.95 | 0.05 | (1.15) | (1.10) | -- | -- | -- |
| Year Ended 10/31/2001 | 11.88 | 0.06 | (3.04) | (2.98) | -- | (0.95) | (0.95) |
|
| LARGE CAP GROWTH FUND | | | | | | | |
| Class A Shares | | | | | | | |
| Year Ended 10/31/2005 | 4.45 | 0.02 | 0.43 | 0.45 | -- | -- | -- |
| Year Ended 10/31/2004 | 4.30 | 0.06 | 0.11 | 0.17 | (0.02) | -- | (0.02) |
| Year Ended 10/31/2003 | 3.58 | (0.02) | 0.74 | 0.72 | -- | -- | -- |
| Year Ended 10/31/2002 | 4.54 | -- | (0.96) | (0.96) | -- | -- | -- |
| Year Ended 10/31/2001 | 7.44 | (0.03) | (2.87) | (2.90) | -- | -- | -- |
| Class B Shares | | | | | | | |
| Year Ended 10/31/2005 | 4.25 | (0.04) | 0.43 | 0.39 | -- | -- | -- |
| Year Ended 10/31/2004 | 4.13 | -- | 0.12 | 0.12 | -- | -- | -- |
| Year Ended 10/31/2003 | 3.46 | (0.04) | 0.71 | 0.67 | -- | -- | -- |
| Year Ended 10/31/2002 | 4.43 | (0.04) | (0.93) | (0.97) | -- | -- | -- |
| Year Ended 10/31/2001 | 7.32 | (0.03) | (2.86) | (2.89) | -- | -- | -- |
| Class I Shares | | | | | | | |
| Year Ended 10/31/2005 | 4.69 | 0.02 | 0.50 | 0.52 | (0.01) | -- | (0.01) |
| Year Ended 10/31/2004 | 4.51 | 0.08 | 0.13 | 0.21 | (0.03) | -- | (0.03) |
| Year Ended 10/31/2003 | 3.69 | 0.04 | 0.78 | 0.82 | -- | -- | -- |
| Year Ended 10/31/2002 | 4.63 | (0.01) | (0.93) | (0.94) | -- | -- | -- |
| Year Ended 10/31/2001 | 7.51 | 0.02 | (2.90) | (2.88) | -- | -- | -- |
(a) All per share amounts have been rounded to the nearest cent.
(b) The amount shown may not correlate with the change in aggregate gains and losses of portfolio securities due to the timing of sales and redemptions of fund shares.
The accompanying notes to the financial statements are an integral part of this schedule.
268
Thrivent Mutual Funds
Financial Highlights – continued
|
|
| | | | R A T I O S / S U P P L E M E N T A L D A T A | | |
|
|
| | | | | | Ratios to Average | |
| | | | | | Net Assets Before Expenses | |
| | | | Ratio to Average Net | Waived, Credited or Paid | |
| | | | Assets(d) | Indirectly(d) | |
| Net Asset | | |
|
| |
| Value, | | Net Assets | | Net | | Net | Portfolio |
| End of | Total | End of Period | | Investment | | Investment | Turnover |
| Period | Return(c) | (in millions) | Expenses | Income/(Loss) | Expenses | Income/(Loss) | Rate |
|
| |
| |
| $10.57 | 16.18% | $304.8 | 1.44% | 1.10% | 1.45% | 1.09% | 43% |
| 9.10 | 11.65% | 243.7 | 1.70% | 0.33% | 1.70% | 0.33% | 126% |
| 8.19 | 19.69% | 59.8 | 2.46% | (0.27)% | 2.58% | (0.39)% | 27% |
| 6.84 | (14.51)% | 54.6 | 2.15% | (0.39)% | 2.38% | (0.62)% | 22% |
| 8.00 | (27.80)% | 72.6 | 1.93% | (0.38)% | 2.13% | (0.58)% | 30% |
| |
| |
| 10.16 | 14.67% | 16.1 | 2.62% | (0.13)% | 2.63% | (0.14)% | 43% |
| 8.86 | 10.72% | 19.5 | 2.79% | (0.76)% | 2.79% | (0.76)% | 126% |
| 8.00 | 18.81% | 10.8 | 3.21% | (1.01)% | 3.33% | (1.13)% | 27% |
| 6.74 | (15.20)% | 10.3 | 2.90% | (1.14)% | 3.23% | (1.37)% | 22% |
| 7.94 | (28.27)% | 10.8 | 2.68% | (1.13)% | 2.88% | (1.33)% | 30% |
| |
| |
| 10.77 | 16.82% | 61.1 | 0.76% | 1.48% | 0.77% | 1.47% | 43% |
| 9.23 | 12.69% | 13.1 | 1.08% | 0.95% | 1.18% | 0.85% | 126% |
| 8.31 | 21.22% | 10.3 | 1.24% | 0.96% | 1.49% | 0.71% | 27% |
| 6.85 | (13.76)% | 13.2 | 1.16% | 0.60% | 1.39% | 0.37% | 22% |
| 7.95 | (27.16)% | 15.1 | 1.12% | 0.43% | 1.32% | 0.23% | 30% |
|
| |
| 4.90 | 10.16% | 130.9 | 0.87% | 0.37% | 1.68% | (0.44)% | 106% |
| 4.45 | 3.90% | 83.6 | 0.51% | 0.35% | 1.68% | (0.82)% | 100% |
| 4.30 | 20.25% | 28.0 | 1.40% | (0.41)% | 2.56% | (1.57)% | 111% |
| 3.58 | (21.23)% | 21.6 | 1.89% | (1.02)% | 2.54% | (1.67)% | 59% |
| 4.54 | (39.01)% | 24.8 | 1.47% | (0.54)% | 2.11% | (1.18)% | 14% |
| |
| |
| 4.64 | 9.18% | 15.8 | 2.05% | (0.69)% | 2.86% | (1.50)% | 106% |
| 4.25 | 2.84% | 17.7 | 1.39% | (0.53)% | 2.60% | (1.74)% | 100% |
| 4.13 | 19.34% | 10.6 | 2.15% | (1.16)% | 3.31% | (2.32)% | 111% |
| 3.46 | (21.82)% | 7.9 | 2.64% | (1.77)% | 3.29% | (2.42)% | 59% |
| 4.43 | (39.47)% | 7.3 | 2.22% | (1.29)% | 2.86% | (1.93)% | 14% |
| |
| |
| 5.20 | 11.01% | 31.3 | 0.07% | 1.21% | 0.89% | 0.39% | 106% |
| 4.69 | 4.65% | 8.9 | (0.26)% | 1.12% | 0.90% | (0.04)% | 100% |
| 4.51 | 22.02% | 3.1 | 0.03% | 0.96% | 1.24% | (0.25)% | 111% |
| 3.69 | (20.17)% | 4.6 | 0.62% | 0.24% | 1.27% | (0.41)% | 59% |
| 4.63 | (38.40)% | 3.2 | 0.46% | 0.47% | 1.10% | (0.17)% | 14% |
(c) Total investment return assumes dividend reinvestment and does not reflect any deduction for sales charges. Not annualized for periods less than one year.
(d) Computed on an annualized basis for periods less than one year.
The accompanying notes to the financial statements are an integral part of this schedule.
269
Thrivent Mutual Funds
Financial Highlights – continued
|
|
| | F O R A S H A R E O U T S T A N D I N G T H R O U G H O U T E A C H P E R I O D(a) |
| |
|
| |
| | | | | | Less Distributions | |
| | | Income from Investment Operations | from | |
| | |
|
| |
| | Net Asset | | Net Realized | | | Net | |
| | Value, | Net | and Unrealized | Total from | Net | Realized | |
| | Beginning | Investment | Gain/(Loss) on | Investment | Investment | Gain on | Total |
| | of Period | Income/(Loss) | Investments(b) | Operations | Income | Investments | Distributions |
|
| LARGE CAP VALUE FUND | | | | | | | |
| Class A Shares | | | | | | | |
| Year Ended 10/31/2005 | $13.15 | $0.17 | $1.23 | $1.40 | $(0.06) | $-- | $(0.06) |
| Year Ended 10/31/2004 | 11.79 | 0.20 | 1.34 | 1.54 | (0.18) | -- | (0.18) |
| Year Ended 10/31/2003 | 10.07 | 0.08 | 1.69 | 1.77 | (0.05) | -- | (0.05) |
| Year Ended 10/31/2002 | 12.20 | 0.05 | (2.13) | (2.08) | (0.05) | -- | (0.05) |
| Year Ended 10/31/2001 | 14.89 | 0.06 | (2.71) | (2.65) | (0.04) | -- | (0.04) |
| Class B Shares | | | | | | | |
| Year Ended 10/31/2005 | 13.03 | -- | 1.22 | 1.22 | -- | -- | -- |
| Year Ended 10/31/2004 | 11.66 | (0.02) | 1.43 | 1.41 | (0.04) | -- | (0.04) |
| Year Ended 10/31/2003 | 9.98 | (0.01) | 1.69 | 1.68 | -- | -- | -- |
| Year Ended 10/31/2002 | 12.14 | -- | (2.16) | (2.16) | -- | -- | -- |
| Year Ended 10/31/2001 | 14.89 | (0.01) | (2.74) | (2.75) | -- | -- | -- |
| Class I Shares | | | | | | | |
| Year Ended 10/31/2005 | 13.20 | 0.17 | 1.32 | 1.49 | (0.09) | -- | (0.09) |
| Year Ended 10/31/2004 | 11.92 | 0.34 | 1.28 | 1.62 | (0.34) | -- | (0.34) |
| Year Ended 10/31/2003 | 10.15 | 0.16 | 1.74 | 1.90 | (0.13) | -- | (0.13) |
| Year Ended 10/31/2002 | 12.28 | 0.11 | (2.12) | (2.01) | (0.12) | -- | (0.12) |
| Year Ended 10/31/2001 | 14.93 | 0.15 | (2.71) | (2.56) | (0.09) | -- | (0.09) |
|
| LARGE CAP STOCK FUND | | | | | | | |
| Class A Shares | | | | | | | |
| Year Ended 10/31/2005 | 23.93 | 0.24 | 1.91 | 2.15 | (0.15) | -- | (0.15) |
| Period Ended 10/31/2004(e) | 29.15 | 0.04 | 0.21 | 0.25 | (0.03) | (5.44) | (5.47) |
| Year Ended 4/30/2004 | 25.39 | 0.11 | 3.75 | 3.86 | (0.10) | -- | (0.10) |
| Year Ended 4/30/2003 | 29.84 | 0.10 | (4.48) | (4.38) | (0.07) | -- | (0.07) |
| Year Ended 4/30/2002 | 34.82 | 0.05 | (4.86) | (4.81) | (0.09) | (0.08) | (0.17) |
| Year Ended 4/30/2001 | 38.67 | 0.19 | (1.74) | (1.55) | (0.16) | (2.14) | (2.30) |
| Class B Shares | | | | | | | |
| Year Ended 10/31/2005 | 22.21 | 0.03 | 1.76 | 1.79 | -- | -- | -- |
| Period Ended 10/31/2004(e) | 27.55 | (0.08) | 0.18 | 0.10 | -- | (5.44) | (5.44) |
| Year Ended 4/30/2004 | 24.19 | (0.23) | 3.59 | 3.36 | -- | -- | -- |
| Year Ended 4/30/2003 | 28.67 | (0.28) | (4.20) | (4.48) | -- | -- | -- |
| Year Ended 4/30/2002 | 33.71 | (0.27) | (4.69) | (4.96) | -- | (0.08) | (0.08) |
| Year Ended 4/30/2001 | 37.71 | (0.15) | (1.71) | (1.86) | -- | (2.14) | (2.14) |
| Class I Shares | | | | | | | |
| Year Ended 10/31/2005 | 24.06 | 0.33 | 1.95 | 2.28 | (0.21) | -- | (0.21) |
| Period Ended 10/31/2004(e) | 29.24 | 0.07 | 0.24 | 0.31 | (0.05) | (5.44) | (5.49) |
| Year Ended 4/30/2004 | 25.46 | 0.23 | 3.77 | 4.00 | (0.22) | -- | (0.22) |
| Year Ended 4/30/2003 | 29.90 | 0.21 | (4.47) | (4.26) | (0.18) | -- | (0.18) |
| Year Ended 4/30/2002 | 34.88 | 0.18 | (4.88) | (4.70) | (0.20) | (0.08) | (0.28) |
| Year Ended 4/30/2001 | 38.72 | 0.33 | (1.73) | (1.40) | (0.30) | (2.14) | (2.44) |
(a) All per share amounts have been rounded to the nearest cent.
(b) The amount shown may not correlate with the change in aggregate gains and losses of portfolio securities due to the timing of sales and redemptions of fund shares.
(c) Total investment return assumes dividend reinvestment and does not reflect any deduction for sales charges. Not annualized for periods less than one year.
The accompanying notes to the financial statements are an integral part of this schedule.
270
Thrivent Mutual Funds
Financial Highlights – continued
|
|
| | | | R A T I O S / S U P P L E M E N T A L D A T A | | |
|
|
| | | | | | Ratios to Average | |
| | | | | | Net Assets Before Expenses | |
| | | | Ratio to Average Net | Waived, Credited or Paid | |
| | | | Assets(d) | Indirectly(d) | |
| Net Asset | | |
|
| |
| Value, | | Net Assets | | Net | | Net | Portfolio |
| End of | Total | End of Period | | Investment | | Investment | Turnover |
| Period | Return(c) | (in millions) | Expenses | Income/(Loss) | Expenses | Income/(Loss) | Rate |
|
| |
| |
| $14.49 | 10.64% | $321.2 | 1.03% | 1.15% | 1.04% | 1.14% | 53% |
| 13.15 | 13.12% | 290.0 | 0.88% | 1.05% | 1.09% | 0.84% | 51% |
| 11.79 | 17.72% | 28.4 | 1.28% | 0.71% | 2.06% | (0.07)% | 64% |
| 10.07 | (17.22)% | 22.9 | 1.37% | 0.48% | 2.02% | (0.17)% | 109% |
| 12.20 | (17.86)% | 20.6 | 1.23% | 0.44% | 1.85% | (0.18)% | 35% |
| |
| |
| 14.25 | 9.36% | 16.9 | 2.21% | 0.00% | 2.23% | (0.02)% | 53% |
| 13.03 | 12.10% | 19.3 | 1.70% | 0.22%(f) | 2.23%(f) | (0.31)%(f) | 51% |
| 11.66 | 16.78% | 9.1 | 2.03% | (0.05)% | 2.81% | (0.83)% | 64% |
| 9.98 | (17.79)% | 7.0 | 2.12% | (0.27)% | 2.77% | (0.92)% | 109% |
| 12.14 | (18.47)% | 5.3 | 1.98% | (0.31)% | 2.60% | (0.93)% | 35% |
| |
| |
| 14.60 | 11.29% | 48.1 | 0.51% | 1.60% | 0.53% | 1.59% | 53% |
| 13.20 | 13.71% | 19.8 | 0.33% | 1.59%(f) | 0.61%(f) | 1.31%(f) | 51% |
| 11.92 | 18.99% | 3.1 | 0.21% | 1.77% | 1.09% | 0.89% | 64% |
| 10.15 | (16.51)% | 4.1 | 0.50% | 1.35% | 1.15% | 0.70% | 109% |
| 12.28 | (17.19)% | 3.4 | 0.49% | 1.18% | 1.11% | 0.56% | 35% |
|
| |
| |
| |
| 25.93 | 9.00% | 3,332.0 | 1.00% | 0.93% | 1.01% | 0.92% | 46% |
| 23.93 | 1.27% | 3,435.1 | 1.02% | 0.41% | 1.02%(f) | 0.41% | 43% |
| 29.15 | 15.23% | 2,807.4 | 1.01% | 0.37% | 1.01% | 0.37% | 22% |
| 25.39 | (14.66)% | 2,598.2 | 1.02% | 0.38% | 1.02% | 0.38% | 5% |
| 29.84 | (13.86)% | 3,385.5 | 0.95% | 0.16% | 0.95% | 0.16% | 3% |
| 34.82 | (4.19)% | 3,912.5 | 0.91% | 0.52% | 0.91% | 0.52% | 13% |
| |
| |
| 24.00 | 8.06% | 91.9 | 1.89% | 0.11% | 2.22% | (0.22)% | 46% |
| 22.21 | 0.72% | 122.9 | 2.00% | (0.57)% | 2.23%(f) | (0.80)% | 43% |
| 27.55 | 13.89% | 75.3 | 2.17% | (0.79)% | 2.17% | (0.79)% | 22% |
| 24.19 | (15.63)% | 81.2 | 2.16% | (0.75)% | 2.16% | (0.75)% | 5% |
| 28.67 | (14.73)% | 126.4 | 1.97% | (0.86)% | 1.97% | (0.86)% | 3% |
| 33.71 | (5.14)% | 154.1 | 1.88% | (0.44)% | 1.88% | (0.44)% | 13% |
| |
| |
| 26.13 | 9.47% | 146.0 | 0.55% | 1.33% | 0.56% | 1.33% | 46% |
| 24.06 | 1.50% | 112.3 | 0.57% | 0.65% | 0.57%(f) | 0.65% | 43% |
| 29.24 | 15.76% | 84.9 | 0.57% | 0.82% | 0.57% | 0.82% | 22% |
| 25.46 | (14.24)% | 68.2 | 0.55% | 0.85% | 0.55% | 0.85% | 5% |
| 29.90 | (13.53)% | 65.9 | 0.55% | 0.56% | 0.55% | 0.56% | 3% |
| 34.88 | (3.82)% | 91.8 | 0.54% | 0.90% | 0.54% | 0.90% | 13% |
(d) Computed on an annualized basis for periods less than one year.
(e) For the period from May 1, 2004 to October 31, 2004.
(f) Amount has been revised to correct a typographical error in the prior year annual report.
The accompanying notes to the financial statements are an integral part of this schedule.
271
Thrivent Mutual Funds
Financial Highlights – continued
|
|
| | F O R A S H A R E O U T S T A N D I N G T H R O U G H O U T E A C H P E R I O D(a) |
| |
|
| |
| | | | | | Less Distributions | |
| | | Income from Investment Operations | from | |
| | |
|
| |
| | Net Asset | | Net Realized | | | Net | |
| | Value, | Net | and Unrealized | Total from | Net | Realized | |
| | Beginning | Investment | Gain/(Loss) on | Investment | Investment | Gain on | Total |
| | of Period | Income/(Loss) | Investments(b) | Operations | Income | Investments | Distributions |
|
| LARGE CAP INDEX FUND | | | | | | | |
| Class A Shares | | | | | | | |
| Year Ended 10/31/2005 | $7.78 | $0.12 | $0.53 | $0.65 | $(0.08) | $-- | $(0.08) |
| Period Ended 10/31/2004(e) | 7.61 | 0.04 | 0.16 | 0.20 | (0.03) | -- | (0.03) |
| Year Ended 4/30/2004 | 6.30 | 0.08 | 1.31 | 1.39 | (0.08) | -- | (0.08) |
| Year Ended 10/31/2003 | 7.32 | 0.05 | (1.05) | (1.00) | (0.02) | -- | (0.02) |
| Year Ended 10/31/2002 | 8.49 | -- | (1.17) | (1.17) | -- | -- | -- |
| Year Ended 10/31/2001(f) | 10.00 | (0.01) | (1.50) | (1.51) | -- | -- | -- |
|
| LARGE CAP INDEX FUND - I | | | | | | | |
| Class I Shares | | | | | | | |
| Year Ended 10/31/2005 | 7.76 | 0.13 | 0.52 | 0.65 | (0.12) | -- | (0.12) |
| Period Ended 10/31/2004(e) | 7.55 | 0.05 | 0.16 | 0.21 | -- | -- | -- |
| Year Ended 4/30/2004 | 6.31 | 0.15 | 1.24 | 1.39 | (0.15) | -- | (0.15) |
| Year Ended 4/30/2003 | 7.38 | 0.08 | (1.07) | (0.99) | (0.08) | -- | (0.08) |
| Year Ended 4/30/2002 | 8.56 | 0.05 | (1.18) | (1.13) | (0.05) | -- | (0.05) |
| Year Ended 4/30/2001 | 9.95 | 0.09 | (1.40) | (1.31) | (0.08) | -- | (0.08) |
|
| BALANCED FUND | | | | | | | |
| Class A Shares | | | | | | | |
| Year Ended 10/31/2005 | 11.81 | 0.20 | 0.57 | 0.77 | (0.22) | (0.18) | (0.40) |
| Period Ended 10/31/2004(e) | 11.65 | 0.09 | 0.17 | 0.26 | (0.10) | -- | (0.10) |
| Year Ended 4/30/2004 | 10.75 | 0.17 | 0.92 | 1.09 | (0.19) | -- | (0.19) |
| Year Ended 4/30/2003 | 11.52 | 0.19 | (0.76) | (0.57) | (0.20) | -- | (0.20) |
| Year Ended 4/30/2002 | 12.41 | 0.26 | (0.88) | (0.62) | (0.27) | -- | (0.27) |
| Year Ended 4/30/2001 | 12.41 | 0.38 | -- | 0.38 | (0.38) | -- | (0.38) |
| | | | | | | |
| Class B Shares | | | | | | | |
| Year Ended 10/31/2005 | 11.76 | 0.09 | 0.56 | 0.65 | (0.10) | (0.18) | (0.28) |
| Period Ended 10/31/2004(e) | 11.60 | 0.03 | 0.17 | 0.20 | (0.04) | -- | (0.04) |
| Year Ended 4/30/2004 | 10.70 | 0.06 | 0.92 | 0.98 | (0.08) | -- | (0.08) |
| Year Ended 4/30/2003 | 11.47 | 0.11 | (0.76) | (0.65) | (0.12) | -- | (0.12) |
| Year Ended 4/30/2002 | 12.35 | 0.15 | (0.87) | (0.72) | (0.16) | -- | (0.16) |
| Year Ended 4/30/2001 | 12.35 | 0.26 | -- | 0.26 | (0.26) | -- | (0.26) |
| | | | | | | |
| Class I Shares | | | | | | | |
| Year Ended 10/31/2005 | 11.80 | 0.26 | 0.56 | 0.82 | (0.27) | (0.18) | (0.45) |
| Period Ended 10/31/2004(e) | 11.64 | 0.12 | 0.17 | 0.29 | (0.13) | -- | (0.13) |
| Year Ended 4/30/2004 | 10.74 | 0.22 | 0.93 | 1.15 | (0.25) | -- | (0.25) |
| Year Ended 4/30/2003 | 11.51 | 0.21 | (0.73) | (0.52) | (0.25) | -- | (0.25) |
| Year Ended 4/30/2002 | 12.39 | 0.30 | (0.86) | (0.56) | (0.32) | -- | (0.32) |
| Year Ended 4/30/2001 | 12.40 | 0.42 | -- | 0.42 | (0.43) | -- | (0.43) |
(a) All per share amounts have been rounded to the nearest cent.
(b) The amount shown may not correlate with the change in aggregate gains and losses of portfolio securities due to the timing of sales and redemptions of fund shares.
(c) Total investment return assumes dividend reinvestment and does not reflect any deduction for sales charges. Not annualized for periods less than one year.
The accompanying notes to the financial statements are an integral part of this schedule.
272
Thrivent Mutual Funds Financial Highlights – continued
|
| | | | R A T I O S / S U P P L E M E N T A L D A T A | | |
|
|
| | | | | | Ratios to Average | |
| | | | | | Net Assets Before Expenses | |
| | | | Ratio to Average Net | Waived, Credited or Paid | |
| | | | Assets(d) | Indirectly(d) | |
| Net Asset | | |
|
| |
| Value, | | Net Assets | | Net | | Net | Portfolio |
| End of | Total | End of Period | | Investment | | Investment | Turnover |
| Period | Return(c) | (in millions) | Expenses | Income/(Loss) | Expenses | Income/(Loss) | Rate |
|
| |
| |
| $8.35 | 8.33% | $94.3 | 0.60% | 1.49% | 0.94% | 1.15% | 9% |
| 7.78 | 2.62% | 76.3 | 0.57% | 0.64% | 1.08% | 0.13% | 5% |
| 7.61 | 22.09% | 51.2 | 0.41% | 1.28% | 1.17% | 0.52% | 6% |
| 6.30 | (13.58)% | 27.8 | 0.93% | 0.86% | 1.18% | 0.61% | 16% |
| 7.32 | (13.78)% | 30.2 | 1.29% | 0.08% | 1.29% | 0.08% | 4% |
| 8.49 | (15.10)% | 21.1 | 1.46% | (0.20)% | 1.46% | (0.20)% | 9% |
|
| |
| 8.29 | 8.39% | 31.5 | 0.50% | 1.61% | 0.51% | 1.61% | 11% |
| 7.76 | 2.78% | 29.4 | 0.54% | 1.19% | 0.55%(g) | 1.18% | 4% |
| 7.55 | 22.00% | 28.7 | 0.54% | 1.21% | 0.55% | 1.20% | 27% |
| 6.31 | (13.36)% | 62.1 | 0.24% | 1.55% | 0.36% | 1.43% | 23% |
| 7.38 | (13.22)% | 63.0 | 0.20% | 1.17% | 0.49% | 0.88% | 3% |
| 8.56 | (13.18)% | 26.6 | 0.20% | 0.97% | 0.69% | 0.49% | 9% |
|
| |
| 12.18 | 6.56% | 276.1 | 1.07% | 1.62% | 1.09% | 1.60% | 231% |
| 11.81 | 2.21% | 278.5 | 1.07% | 1.49% | 1.08% | 1.48% | 114% |
| 11.65 | 10.22% | 278.0 | 1.06% | 1.48% | 1.07% | 1.47% | 194% |
| 10.75 | (4.90)% | 260.8 | 1.05% | 1.77% | 1.07% | 1.75% | 69% |
| 11.52 | (5.02)% | 305.6 | 0.99% | 2.19% | 1.02% | 2.16% | 76% |
| 12.41 | 3.10% | 291.7 | 0.98% | 3.07% | 1.02% | 3.03% | 83% |
| |
| 12.13 | 5.54% | 13.3 | 2.02% | 0.72% | 2.04% | 0.70% | 231% |
| 11.76 | 1.71% | 17.6 | 2.03% | 0.53% | 2.04% | 0.52% | 114% |
| 11.60 | 9.22% | 18.6 | 2.02% | 0.52% | 2.03% | 0.51% | 194% |
| 10.70 | (5.68)% | 19.3 | 1.84% | 0.97% | 1.86% | 0.95% | 60% |
| 11.47 | (5.83)% | 22.3 | 1.89% | 1.29% | 1.92% | 1.26% | 76% |
| 12.35 | 2.13% | 21.1 | 1.94% | 2.11% | 1.98% | 2.07% | 83% |
| |
| 12.17 | 7.07% | 98.4 | 0.59% | 2.11% | 0.62% | 2.09% | 231% |
| 11.80 | 2.47% | 108.5 | 0.60% | 1.97% | 0.61% | 1.96% | 114% |
| 11.64 | 10.75% | 111.2 | 0.59% | 1.96% | 0.60% | 1.95% | 194% |
| 10.74 | (4.45)% | 107.8 | 0.56% | 2.26% | 0.57% | 2.25% | 69% |
| 11.51 | (4.65)% | 3.7 | 0.58% | 2.60% | 0.62% | 2.56% | 76% |
| 12.39 | 3.50% | 3.4 | 0.59% | 3.46% | 0.63% | 3.43% | 83% |
(d) Computed on an annualized basis for periods less than one year.
(e) For the period from May 1, 2004 to October 31, 2004.
(f) Since fund inception, July 1, 2000.
(g) Amount has been revised to correct a typographical error in the prior year annual report.
The accompanying notes to the financial statements are an integral part of this schedule.
273
Thrivent Mutual Funds
Financial Highlights – continued
|
|
| | F O R A S H A R E O U T S T A N D I N G T H R O U G H O U T E A C H P E R I O D(a) |
| |
|
| |
| | | | | | Less Distributions | |
| | | Income from Investment Operations | from | |
| | |
|
| |
| | Net Asset | | Net Realized | | | Net | |
| | Value, | Net | and Unrealized | Total from | Net | Realized | |
| | Beginning | Investment | Gain/(Loss) on | Investment | Investment | Gain on | Total |
| | of Period | Income/(Loss) | Investments(b) | Operations | Income | Investments | Distributions |
|
| HIGH YIELD FUND | | | | | | | |
| Class A Shares | | | | | | | |
| Year Ended 10/31/2005 | $5.24 | $0.38 | $(0.20) | $0.18 | $(0.39) | $-- | $(0.39) |
| Year Ended 10/31/2004 | 5.07 | 0.40 | 0.16 | 0.56 | (0.39) | -- | (0.39) |
| Year Ended 10/31/2003 | 4.23 | 0.41 | 0.82 | 1.23 | (0.39) | -- | (0.39) |
| Year Ended 10/31/2002 | 5.22 | 0.53 | (1.00) | (0.47) | (0.52) | -- | (0.52) |
| Year Ended 10/31/2001 | 6.72 | 0.69 | (1.42) | (0.73) | (0.77) | -- | (0.77) |
| Class B Shares | | | | | | | |
| Year Ended 10/31/2005 | 5.24 | 0.34 | (0.21) | 0.13 | (0.35) | -- | (0.35) |
| Year Ended 10/31/2004 | 5.07 | 0.36 | 0.16 | 0.52 | (0.35) | -- | (0.35) |
| Year Ended 10/31/2003 | 4.23 | 0.37 | 0.82 | 1.19 | (0.35) | -- | (0.35) |
| Year Ended 10/31/2002 | 5.22 | 0.50 | (1.01) | (0.51) | (0.48) | -- | (0.48) |
| Year Ended 10/31/2001 | 6.72 | 0.65 | (1.43) | (0.78) | (0.72) | -- | (0.72) |
| Class I Shares | | | | | | | |
| Year Ended 10/31/2005 | 5.24 | 0.41 | (0.21) | 0.20 | (0.41) | -- | (0.41) |
| Year Ended 10/31/2004 | 5.07 | 0.42 | 0.16 | 0.58 | (0.41) | -- | (0.41) |
| Year Ended 10/31/2003 | 4.23 | 0.42 | 0.83 | 1.25 | (0.41) | -- | (0.41) |
| Year Ended 10/31/2002 | 5.22 | 0.55 | (1.01) | (0.46) | (0.53) | -- | (0.53) |
| Year Ended 10/31/2001 | 6.73 | 0.72 | (1.45) | (0.73) | (0.78) | -- | (0.78) |
|
| HIGH YIELD FUND II | | | | | | | |
| Class A Shares | | | | | | | |
| Year Ended 10/31/2005 | 6.71 | 0.46 | (0.27) | 0.19 | (0.49) | -- | (0.49) |
| Period Ended 10/31/2004(e) | 6.54 | 0.22 | 0.18 | 0.40 | (0.23) | -- | (0.23) |
| Year Ended 4/30/2004 | 6.27 | 0.46 | 0.28 | 0.74 | (0.47) | -- | (0.47) |
| Year Ended 4/30/2003 | 6.19 | 0.50 | 0.08 | 0.58 | (0.50) | -- | (0.50) |
| Year Ended 4/30/2002 | 6.76 | 0.54 | (0.56) | (0.02) | (0.55) | -- | (0.55) |
| Year Ended 4/30/2001 | 7.44 | 0.63 | (0.68) | (0.05) | (0.63) | -- | (0.63) |
| Class B Shares | | | | | | | |
| Year Ended 10/31/2005 | 6.72 | 0.40 | (0.28) | 0.12 | (0.43) | -- | (0.43) |
| Period Ended 10/31/2004(e) | 6.54 | 0.19 | 0.19 | 0.38 | (0.20) | -- | (0.20) |
| Year Ended 4/30/2004 | 6.27 | 0.40 | 0.28 | 0.68 | (0.41) | -- | (0.41) |
| Year Ended 4/30/2003 | 6.19 | 0.45 | 0.08 | 0.53 | (0.45) | -- | (0.45) |
| Year Ended 4/30/2002 | 6.76 | 0.49 | (0.56) | (0.07) | (0.50) | -- | (0.50) |
| Year Ended 4/30/2001 | 7.44 | 0.58 | (0.68) | (0.10) | (0.58) | -- | (0.58) |
| Class I Shares | | | | | | | |
| Year Ended 10/31/2005 | 6.71 | 0.49 | (0.27) | 0.22 | (0.52) | -- | (0.52) |
| Period Ended 10/31/2004(e) | 6.54 | 0.24 | 0.18 | 0.42 | (0.25) | -- | (0.25) |
| Year Ended 4/30/2004 | 6.27 | 0.48 | 0.29 | 0.77 | (0.50) | -- | (0.50) |
| Year Ended 4/30/2003 | 6.19 | 0.51 | 0.09 | 0.60 | (0.52) | -- | (0.52) |
| Year Ended 4/30/2002 | 6.76 | 0.56 | (0.57) | (0.01) | (0.56) | -- | (0.56) |
| Year Ended 4/30/2001 | 7.43 | 0.65 | (0.67) | (0.02) | (0.65) | -- | (0.65) |
(a) All per share amounts have been rounded to the nearest cent.
(b) The amount shown may not correlate with the change in aggregate gains and losses of portfolio securities due to the timing of sales and redemptions of fund shares.
(c) Total investment return assumes dividend reinvestment and does not reflect any deduction for sales charges. Not annualized for periods less than one year.
The accompanying notes to the financial statements are an integral part of this schedule.
274
Thrivent Mutual Funds
Financial Highlights – continued
|
|
| | | | R A T I O S / S U P P L E M E N T A L D A T A | | |
|
|
| | | | | | Ratios to Average | |
| | | | | | Net Assets Before Expenses | |
| | | | Ratio to Average Net | Waived, Credited or Paid | |
| | | | Assets(d) | Indirectly(d) | |
| Net Asset | | |
|
| |
| Value, | | Net Assets | | Net | | Net | Portfolio |
| End of | Total | End of Period | | Investment | | Investment | Turnover |
| Period | Return(c) | (in millions) | Expenses | Income/(Loss) | Expenses | Income/(Loss) | Rate |
|
| |
| $5.03 | 3.54% | $563.0 | 0.87% | 7.45% | 0.88% | 7.43% | 54% |
| 5.24 | 11.53% | 603.1 | 0.89% | 7.80% | 0.89% | 7.80% | 73% |
| 5.07 | 30.00% | 579.8 | 1.02% | 8.70% | 1.02% | 8.70% | 96% |
| 4.23 | (9.91)% | 488.8 | 1.03% | 10.49% | 1.03% | 10.49% | 77% |
| 5.22 | (11.49)% | 607.9 | 0.99% | 11.62% | 1.00% | 11.61% | 65% |
| |
| 5.02 | 2.45% | 23.4 | 1.73% | 6.57% | 1.91% | 6.39% | 54% |
| 5.24 | 10.66% | 33.1 | 1.70% | 7.00% | 1.74%(f) | 6.96% | 73% |
| 5.07 | 29.03% | 36.3 | 1.77% | 7.95% | 1.77% | 7.95% | 96% |
| 4.23 | (10.58)% | 34.9 | 1.78% | 9.74% | 1.78% | 9.74% | 77% |
| 5.22 | (12.14)% | 37.8 | 1.74% | 10.87% | 1.75% | 10.86% | 65% |
| |
| 5.03 | 3.97% | 15.2 | 0.46% | 7.88% | 0.47% | 7.87% | 54% |
| 5.24 | 11.98% | 10.1 | 0.49% | 8.21% | 0.60%(f) | 8.10% | 73% |
| 5.07 | 30.57% | 10.8 | 0.57% | 9.15% | 0.69% | 9.03% | 96% |
| 4.23 | (9.60)% | 10.9 | 0.69% | 10.83% | 0.69% | 10.83% | 77% |
| 5.22 | (11.34)% | 12.5 | 0.67% | 11.95% | 0.68% | 11.94% | 65% |
|
| |
| 6.41 | 2.91% | 124.3 | 0.95% | 6.99% | 1.13% | 6.82% | 57% |
| 6.71 | 6.32% | 138.9 | 1.07% | 6.82% | 1.14% | 6.75% | 55% |
| 6.54 | 12.08% | 135.1 | 1.10% | 6.98% | 1.10% | 6.98% | 91% |
| 6.27 | 10.59% | 117.4 | 0.93% | 8.72% | 1.03% | 8.62% | 103% |
| 6.19 | (0.26)% | 118.6 | 1.00% | 8.41% | 1.17% | 8.24% | 72% |
| 6.76 | (0.81)% | 121.0 | 1.00% | 9.06% | 1.08% | 8.98% | 106% |
| |
| 6.41 | 1.74% | 4.1 | 1.95% | 6.02% | 2.12% | 5.85% | 57% |
| 6.72 | 5.95% | 5.9 | 2.05% | 5.84% | 2.11% | 5.78% | 55% |
| 6.54 | 11.06% | 6.1 | 2.01% | 6.07% | 2.01% | 6.07% | 91% |
| 6.27 | 9.61% | 6.0 | 1.84% | 7.81% | 2.01% | 7.64% | 103% |
| 6.19 | (1.02)% | 8.2 | 1.74% | 7.67% | 1.93% | 7.48% | 72% |
| 6.76 | (1.53)% | 9.7 | 1.73% | 8.33% | 1.99% | 8.08% | 106% |
| |
| 6.41 | 3.36% | 4.3 | 0.50% | 7.42% | 0.67% | 7.25% | 57% |
| 6.71 | 6.56% | 4.3 | 0.61% | 7.28% | 0.68% | 7.21% | 55% |
| 6.54 | 12.56% | 3.8 | 0.67% | 7.41% | 0.67% | 7.41% | 91% |
| 6.27 | 10.88% | 3.3 | 0.67% | 8.98% | 0.67% | 8.98% | 103% |
| 6.19 | 0.05% | 2.7 | 0.68% | 8.73% | 0.68% | 8.73% | 72% |
| 6.76 | (0.34)% | 2.2 | 0.67% | 9.34% | 0.67% | 9.34% | 106% |
(d) Computed on an annualized basis for periods less than one year.
(e) For the period from May 1, 2004 to October 31, 2004.
(f) Amount has been revised to correct a typographical error in the prior year annual report.
The accompanying notes to the financial statements are an integral part of this schedule.
275
Thrivent Mutual Funds
Financial Highlights – continued
|
|
| | F O R A S H A R E O U T S T A N D I N G T H R O U G H O U T E A C H P E R I O D(a) |
| |
|
| |
| | | | | | Less Distributions | |
| | | Income from Investment Operations | from | |
| | |
|
| |
| | Net Asset | | Net Realized | | | Net | |
| | Value, | Net | and Unrealized | Total from | Net | Realized | |
| | Beginning | Investment | Gain/(Loss) on | Investment | Investment | Gain on | Total |
| | of Period | Income/(Loss) | Investments(b) | Operations | Income | Investments | Distributions |
|
| MUNICIPAL BOND FUND | | | | | | | |
| Class A Shares | | | | | | | |
| Year Ended 10/31/2005 | $11.56 | $0.50 | $(0.25) | $0.25 | $(0.50) | $-- | $(0.50) |
| Year Ended 10/31/2004 | 11.53 | 0.50 | 0.12 | 0.62 | (0.53) | (0.06) | (0.59) |
| Year Ended 10/31/2003 | 11.61 | 0.54 | (0.05) | 0.49 | (0.56) | (0.01) | (0.57) |
| Year Ended 10/31/2002 | 11.58 | 0.54 | 0.01 | 0.55 | (0.52) | -- | (0.52) |
| Year Ended 10/31/2001 | 10.99 | 0.55 | 0.60 | 1.15 | (0.56) | -- | (0.56) |
| Class B Shares | | | | | | | |
| Year Ended 10/31/2005 | 11.55 | 0.42 | (0.25) | 0.17 | (0.42) | -- | (0.42) |
| Year Ended 10/31/2004 | 11.52 | 0.44 | 0.09 | 0.53 | (0.44) | (0.06) | (0.50) |
| Year Ended 10/31/2003 | 11.61 | 0.45 | (0.06) | 0.39 | (0.47) | (0.01) | (0.48) |
| Year Ended 10/31/2002 | 11.59 | 0.46 | 0.01 | 0.47 | (0.45) | -- | (0.45) |
| Year Ended 10/31/2001 | 10.99 | 0.48 | 0.60 | 1.08 | (0.48) | -- | (0.48) |
| Class I Shares | | | | | | | |
| Year Ended 10/31/2005 | 11.55 | 0.53 | (0.24) | 0.29 | (0.53) | -- | (0.53) |
| Year Ended 10/31/2004 | 11.53 | 0.53 | 0.11 | 0.64 | (0.56) | (0.06) | (0.62) |
| Year Ended 10/31/2003 | 11.61 | 0.58 | (0.05) | 0.53 | (0.60) | (0.01) | (0.61) |
| Year Ended 10/31/2002 | 11.58 | 0.57 | 0.01 | 0.58 | (0.55) | -- | (0.55) |
| Year Ended 10/31/2001 | 10.99 | 0.56 | 0.61 | 1.17 | (0.58) | -- | (0.58) |
|
| INCOME FUND | | | | | | | |
| Class A Shares | | | | | | | |
| Year Ended 10/31/2005 | 8.86 | 0.37 | (0.30) | 0.07 | (0.37) | -- | (0.37) |
| Year Ended 10/31/2004 | 8.73 | 0.35 | 0.13 | 0.48 | (0.35) | -- | (0.35) |
| Year Ended 10/31/2003 | 8.34 | 0.34 | 0.40 | 0.74 | (0.35) | -- | (0.35) |
| Year Ended 10/31/2002 | 8.71 | 0.41 | (0.38) | 0.03 | (0.40) | -- | (0.40) |
| Year Ended 10/31/2001 | 8.19 | 0.48 | 0.56 | 1.04 | (0.52) | -- | (0.52) |
| Class B Shares | | | | | | | |
| Year Ended 10/31/2005 | 8.84 | 0.30 | (0.30) | -- | (0.30) | -- | (0.30) |
| Year Ended 10/31/2004 | 8.71 | 0.29 | 0.12 | 0.41 | (0.28) | -- | (0.28) |
| Year Ended 10/31/2003 | 8.32 | 0.27 | 0.41 | 0.68 | (0.29) | -- | (0.29) |
| Year Ended 10/31/2002 | 8.70 | 0.35 | (0.40) | (0.05) | (0.33) | -- | (0.33) |
| Year Ended 10/31/2001 | 8.17 | 0.42 | 0.57 | 0.99 | (0.46) | -- | (0.46) |
| Class I Shares | | | | | | | |
| Year Ended 10/31/2005 | 8.85 | 0.40 | (0.29) | 0.11 | (0.41) | -- | (0.41) |
| Year Ended 10/31/2004 | 8.75 | 0.39 | 0.10 | 0.49 | (0.39) | -- | (0.39) |
| Year Ended 10/31/2003 | 8.34 | 0.37 | 0.43 | 0.80 | (0.39) | -- | (0.39) |
| Year Ended 10/31/2002 | 8.71 | 0.44 | (0.39) | 0.05 | (0.42) | -- | (0.42) |
| Year Ended 10/31/2001 | 8.19 | 0.50 | 0.57 | 1.07 | (0.55) | -- | (0.55) |
(a) All per share amounts have been rounded to the nearest cent.
(b) The amount shown may not correlate with the change in aggregate gains and losses of portfolio securities due to the timing of sales and redemptions of fund shares.
The accompanying notes to the financial statements are an integral part of this schedule.
276
Thrivent Mutual Funds
Financial Highlights – continued
|
|
| | | | R A T I O S / | S U P P L E M E N T A L | D A T A | | |
|
|
| | | | | | Ratios to Average | |
| | | | | | Net Assets Before Expenses | |
| | | | Ratio to Average Net | Waived, Credited or Paid | |
| | | | Assets(d) | Indirectly(d) | |
| Net Asset | | |
|
| |
| Value, | | Net Assets | | Net | | Net | Portfolio |
| End of | Total | End of Period | | Investment | | Investment | Turnover |
| Period | Return(c) | (in millions) | Expenses | Income/(Loss) | Expenses | Income/(Loss) | Rate |
|
| | | | | | | |
| 11.56 | 5.47% | 1,264.1 | 0.73% | 4.53% | 0.73% | 4.53% | 12% |
| 11.53 | 4.37% | 641.7 | 0.72% | 4.62% | 0.72% | 4.62% | 6% |
| 11.61 | 4.91% | 645.4 | 0.73% | 4.69% | 0.73% | 4.69% | 13% |
| 11.58 | 10.78% | 609.5 | 0.72% | 4.90% | 0.73% | 4.89% | 5% |
| |
| 11.30 | 1.46% | 28.9 | 1.47% | 3.61% | 1.60% | 3.48% | 8% |
| 11.55 | 4.72% | 34.0 | 1.46% | 3.81% | 1.51% | 3.76% | 12% |
| 11.52 | 3.48% | 24.2 | 1.47% | 3.88% | 1.47% | 3.88% | 6% |
| 11.61 | 4.15% | 22.3 | 1.48% | 3.94% | 1.48% | 3.94% | 13% |
| 11.59 | 9.99% | 15.3 | 1.47% | 4.15% | 1.48% | 4.14% | 5% |
| |
| 11.31 | 2.56% | 8.4 | 0.48% | 4.64% | 0.48% | 4.64% | 8% |
| 11.55 | 5.70% | 5.1 | 0.44% | 4.83% | 0.52% | 4.75% | 12% |
| 11.53 | 4.67% | 2.6 | 0.44% | 4.90% | 0.56% | 4.78% | 6% |
| 11.61 | 5.08% | 3.2 | 0.57% | 4.85% | 0.57% | 4.85% | 13% |
| 11.58 | 10.95% | 2.6 | 0.56% | 5.05% | 0.57% | 5.04% | 5% |
|
| |
| 8.56 | 0.82% | 532.3 | 0.80% | 4.22% | 0.81% | 4.20% | 245% |
| 8.86 | 5.64% | 575.2 | 0.82% | 4.04% | 0.82%(e) | 4.04% | 203% |
| 8.73 | 9.05% | 608.7 | 0.87% | 3.88% | 0.88% | 3.87% | 312% |
| 8.34 | 0.25% | 629.3 | 0.84% | 4.87% | 0.89% | 4.82% | 170% |
| 8.71 | 13.25% | 657.3 | 0.83% | 5.66% | 0.88% | 5.61% | 175% |
| |
| 8.54 | (0.02)% | 19.2 | 1.63% | 3.38% | 1.94% | 3.07% | 245% |
| 8.84 | 4.83% | 25.4 | 1.60% | 3.25% | 1.68% | 3.17% | 203% |
| 8.71 | 8.25% | 30.3 | 1.62% | 3.13% | 1.63% | 3.12% | 312% |
| 8.32 | (0.49)% | 31.7 | 1.59% | 4.12% | 1.64% | 4.07% | 170% |
| 8.70 | 12.45% | 25.3 | 1.58% | 4.91% | 1.63% | 4.86% | 175% |
| |
| 8.55 | 1.22% | 46.7 | 0.40% | 4.64% | 0.41% | 4.62% | 245% |
| 8.85 | 5.94% | 29.0 | 0.43% | 4.43% | 0.54% | 4.32% | 203% |
| 8.75 | 9.49% | 25.2 | 0.47% | 4.28% | 0.60% | 4.15% | 312% |
| 8.34 | 0.65% | 40.1 | 0.55% | 5.15% | 0.60% | 5.10% | 170% |
| 8.71 | 13.43% | 39.1 | 0.56% | 5.94% | 0.61% | 5.89% | 175% |
(c) Total investment return assumes dividend reinvestment and does not reflect any deduction for sales charges. Not annualized for periods less than one year.
(d) Computed on an annualized basis for periods less than one year.
(e) Amount has been revised to correct a typographical error in the prior year annual report.
The accompanying notes to the financial statements are an integral part of this schedule.
277
Thrivent Mutual Funds
Financial Highlights – continued
|
|
| | F O R A S H A R E O U T S T A N D I N G T H R O U G H O U T E A C H P E R I O D(a) |
| |
|
| | | | | | Less Distributions | |
| | | Income from Investment Operations | | from | |
| | |
|
| |
| | Net Asset | | Net Realized | | | Net | |
| | Value, | Net | and Unrealized | Total from | Net | Realized | |
| | Beginning | Investment | Gain/(Loss) on | Investment | Investment | Gain on | Total |
| | of Period | Income/(Loss) | Investments(b) | Operations | Income | Investments | Distributions |
|
| CORE BOND FUND | | | | | | | |
| Class A Shares | | | | | | | |
| Year Ended 10/31/2005 | $10.27 | $0.39 | $(0.36) | $0.03 | $(0.41) | $-- | $(0.41) |
| Period Ended 10/31/2004(e) | 10.14 | 0.20 | 0.16 | 0.36 | (0.22) | (0.01) | (0.23) |
| Year Ended 4/30/2004 | 10.31 | 0.40 | (0.12) | 0.28 | (0.45) | -- | (0.45) |
| Year Ended 4/30/2003 | 9.82 | 0.42 | 0.52 | 0.94 | (0.45) | -- | (0.45) |
| Year Ended 4/30/2002 | 9.80 | 0.56 | 0.02 | 0.58 | (0.56) | -- | (0.56) |
| Year Ended 4/30/2001 | 9.32 | 0.61 | 0.48 | 1.09 | (0.61) | -- | (0.61) |
| Class B Shares | | | | | | | |
| Year Ended 10/31/2005 | 10.27 | 0.29 | (0.35) | (0.06) | (0.31) | -- | (0.31) |
| Period Ended 10/31/2004(e) | 10.15 | 0.15 | 0.15 | 0.30 | (0.17) | (0.01) | (0.18) |
| Year Ended 4/30/2004 | 10.32 | 0.30 | (0.12) | 0.18 | (0.35) | -- | (0.35) |
| Year Ended 4/30/2003 | 9.82 | 0.33 | 0.53 | 0.86 | (0.36) | -- | (0.36) |
| Year Ended 4/30/2002 | 9.80 | 0.47 | 0.02 | 0.49 | (0.47) | -- | (0.47) |
| Year Ended 4/30/2001 | 9.32 | 0.52 | 0.48 | 1.00 | (0.52) | -- | (0.52) |
| Class I Shares | | | | | | | |
| Year Ended 10/31/2005 | 10.27 | 0.43 | (0.34) | 0.09 | (0.46) | -- | (0.46) |
| Period Ended 10/31/2004(e) | 10.15 | 0.22 | 0.15 | 0.37 | (0.24) | (0.01) | (0.25) |
| Year Ended 4/30/2004 | 10.31 | 0.44 | (0.11) | 0.33 | (0.49) | -- | (0.49) |
| Year Ended 4/30/2003 | 9.82 | 0.46 | 0.52 | 0.98 | (0.49) | -- | (0.49) |
| Year Ended 4/30/2002 | 9.80 | 0.60 | 0.02 | 0.62 | (0.60) | -- | (0.60) |
| Year Ended 4/30/2001 | 9.32 | 0.66 | 0.48 | 1.14 | (0.66) | -- | (0.66) |
|
| LIMITED MATURITY BOND FUND | | | | | | |
| Class A Shares | | | | | | | |
| Year Ended 10/31/2005 | 12.91 | 0.41 | (0.30) | 0.11 | (0.41) | (0.03) | (0.44) |
| Year Ended 10/31/2004 | 13.06 | 0.35 | (0.03) | 0.32 | (0.35) | (0.12) | (0.47) |
| Year Ended 10/31/2003 | 12.75 | 0.36 | 0.31 | 0.67 | (0.36) | -- | (0.36) |
| Year Ended 10/31/2002 | 13.14 | 0.46 | (0.14) | 0.32 | (0.46) | (0.25) | (0.71) |
| Year Ended 10/31/2001 | 12.41 | 0.65 | 0.78 | 1.43 | (0.65) | (0.05) | (0.70) |
| Class B Shares | | | | | | | |
| Year Ended 10/31/2005 | 12.92 | 0.41 | (0.30) | 0.11 | (0.41) | (0.03) | (0.44) |
| Year Ended 10/31/2004 | 13.06 | 0.33 | (0.02) | 0.31 | (0.33) | (0.12) | (0.45) |
| Year Ended 10/31/2003 | 12.75 | 0.34 | 0.31 | 0.65 | (0.34) | -- | (0.34) |
| Year Ended 10/31/2002 | 13.14 | 0.46 | (0.14) | 0.32 | (0.46) | (0.25) | (0.71) |
| Year Ended 10/31/2001 | 12.41 | 0.65 | 0.78 | 1.43 | (0.65) | (0.05) | (0.70) |
| Class I Shares | | | | | | | |
| Year Ended 10/31/2005 | 12.91 | 0.47 | (0.30) | 0.17 | (0.47) | (0.03) | (0.50) |
| Year Ended 10/31/2004 | 13.05 | 0.39 | (0.02) | 0.37 | (0.39) | (0.12) | (0.51) |
| Year Ended 10/31/2003 | 12.74 | 0.40 | 0.31 | 0.71 | (0.40) | -- | (0.40) |
| Year Ended 10/31/2002 | 13.14 | 0.50 | (0.15) | 0.35 | (0.50) | (0.25) | (0.75) |
| Year Ended 10/31/2001 | 12.41 | 0.69 | 0.78 | 1.47 | (0.69) | (0.05) | (0.74) |
(a) All per share amounts have been rounded to the nearest cent.
(b) The amount shown may not correlate with the change in aggregate gains and losses of portfolio securities due to the timing of sales and redemptions of fund shares.
(c) Total investment return assumes dividend reinvestment and does not reflect any deduction for sales charges. Not annualized for periods less than one year.
The accompanying notes to the financial statements are an integral part of this schedule.
278
Thrivent Mutual Funds
Financial Highlights – continued
|
|
| | | | R A T I O S / S U P P L E M E N T A L D A T A | | |
|
|
| | | | | | Ratios to Average | |
| | | | | | Net Assets Before Expenses | |
| | | | Ratio to Average Net | Waived, Credited or Paid | |
| | | | Assets(d) | Indirectly(d) | |
| Net Asset | | |
|
| |
| Value, | | Net Assets | | Net | | Net | Portfolio |
| End of | Total | End of Period | | Investment | | Investment | Turnover |
| Period | Return(c) | (in millions) | Expenses | Income/(Loss) | Expenses | Income/(Loss) | Rate |
|
| $9.89 | 0.31% | $421.2 | 0.91% | 3.84% | 0.94% | 3.82% | 368% |
| 10.27 | 3.58% | 457.1 | 0.92% | 3.84% | 0.93% | 3.83% | 167% |
| 10.14 | 2.74% | 460.5 | 0.88% | 3.86% | 0.89% | 3.85% | 463% |
| 10.31 | 9.79% | 526.5 | 0.85% | 4.19% | 0.86% | 4.18% | 149% |
| 9.82 | 6.01% | 451.5 | 0.81% | 5.54% | 0.88% | 5.47% | 160% |
| 9.80 | 12.08% | 353.5 | 0.81% | 6.38% | 0.91% | 6.27% | 172% |
| |
| 9.90 | (0.58)% | 10.8 | 1.91% | 2.86% | 1.93% | 2.84% | 368% |
| 10.27 | 2.97% | 13.3 | 1.91% | 2.84% | 1.92% | 2.83% | 167% |
| 10.15 | 1.75% | 13.4 | 1.86% | 2.89% | 1.87% | 2.88% | 463% |
| 10.32 | 8.91% | 13.2 | 1.77% | 3.28% | 1.78% | 3.27% | 149% |
| 9.82 | 5.03% | 7.9 | 1.73% | 4.64% | 1.80% | 4.57% | 160% |
| 9.80 | 11.04% | 4.6 | 1.73% | 5.45% | 1.83% | 5.35% | 172% |
| |
| 9.90 | 0.84% | 52.9 | 0.49% | 4.17% | 0.51% | 4.15% | 368% |
| 10.27 | 3.69% | 36.3 | 0.50% | 4.25% | 0.51% | 4.24% | 167% |
| 10.15 | 3.25% | 34.5 | 0.49% | 4.26% | 0.50% | 4.25% | 463% |
| 10.31 | 10.20% | 29.2 | 0.47% | 4.57% | 0.48% | 4.56% | 149% |
| 9.82 | 6.42% | 22.9 | 0.39% | 5.93% | 0.46% | 5.86% | 160% |
| 9.80 | 12.55% | 55.6 | 0.39% | 6.79% | 0.49% | 6.69% | 172% |
|
| | | | | | | |
| 12.58 | 0.89% | 131.3 | 0.86% | 3.25% | 0.88% | 3.24% | 295% |
| 12.91 | 2.52% | 119.4 | 0.75% | 2.71% | 0.89% | 2.57% | 230% |
| 13.06 | 5.30% | 90.4 | 0.74% | 2.78% | 0.96% | 2.56% | 297% |
| 12.75 | 2.51% | 73.9 | 0.75% | 3.56% | 1.05% | 3.26% | 288% |
| 13.14 | 11.89% | 39.1 | 0.81% | 5.02% | 1.08% | 4.75% | 290% |
| |
| |
| 12.59 | 0.87% | 2.0 | 0.89% | 3.21% | 0.93% | 3.17% | 295% |
| 12.92 | 2.45% | 2.1 | 0.88% | 2.59% | 0.88% | 2.59% | 230% |
| 13.06 | 5.14% | 6.2 | 0.91% | 2.61% | 0.96% | 2.56% | 297% |
| 12.75 | 2.51% | 5.8 | 0.75% | 3.56% | 1.05% | 3.26% | 288% |
| 13.14 | 11.89% | 5.4 | 0.81% | 5.02% | 1.08% | 4.75% | 290% |
| |
| 12.58 | 1.36% | 37.4 | 0.41% | 3.78% | 0.42% | 3.77% | 295% |
| 12.91 | 2.90% | 9.8 | 0.45% | 3.01% | 0.57% | 2.89% | 230% |
| 13.05 | 5.62% | 14.7 | 0.46% | 3.07% | 0.64% | 2.89% | 297% |
| 12.74 | 2.77% | 14.0 | 0.42% | 3.89% | 0.72% | 3.59% | 288% |
| 13.14 | 12.22% | 11.5 | 0.51% | 5.32% | 0.78% | 5.05% | 290% |
(d) Computed on an annualized basis for periods less than one year.
(e) For the period from May 1, 2004 to October 31, 2004.
The accompanying notes to the financial statements are an integral part of this schedule.
279
Thrivent Mutual Funds
Financial Highlights – continued
|
|
| | F O R A S H A R E O U T S T A N D I N G T H R O U G H O U T E A C H P E R I O D |
| |
|
| | | | | | Less Distributions | |
| | | Income from Investment Operations | from | |
| | |
|
| |
| | Net Asset | | Net Realized | | | Net | |
| | Value, | Net | and Unrealized | Total from | Net | Realized | |
| | Beginning | Investment | Gain/(Loss) on | Investment | Investment | Gain on | Total |
| | of Period | Income/(Loss) | Investments(a) | Operations | Income | Investments | Distributions |
|
| MONEY MARKET FUND | | | | | | | |
| Class A Shares | | | | | | | |
| Year Ended 10/31/2005 | $1.00 | $0.02 | $-- | $0.02 | $(0.02) | $-- | $(0.02) |
| Period Ended 10/31/2004(d) | 1.00 | (0.001) | 0.004 | 0.003 | (0.003) | -- | (0.003) |
| Year Ended 4/30/2004 | 1.00 | 0.003 | -- | 0.003 | (0.003) | -- | (0.003) |
| Year Ended 4/30/2003 | 1.00 | 0.01 | -- | 0.01 | (0.01) | -- | (0.01) |
| Year Ended 4/30/2002 | 1.00 | 0.02 | -- | 0.02 | (0.02) | -- | (0.02) |
| Year Ended 4/30/2001 | 1.00 | 0.05 | -- | 0.05 | (0.05) | -- | (0.05) |
| Class B Shares | | | | | | | |
| Year Ended 10/31/2005 | 1.00 | 0.02 | -- | 0.02 | (0.02) | -- | (0.02) |
| Period Ended 10/31/2004(d) | 1.00 | 0.002 | -- | 0.002 | (0.002) | -- | (0.002) |
| Year Ended 4/30/2004 | 1.00 | 0.001 | -- | 0.001 | (0.001) | -- | (0.001) |
| Year Ended 4/30/2003 | 1.00 | 0.003 | -- | 0.003 | (0.003) | -- | (0.003) |
| Year Ended 4/30/2002 | 1.00 | 0.01 | -- | 0.01 | (0.01) | -- | (0.01) |
| Year Ended 4/30/2001 | 1.00 | 0.04 | -- | 0.04 | (0.04) | -- | (0.04) |
| Class I Shares | | | | | | | |
| Year Ended 10/31/2005 | 1.00 | 0.03 | -- | 0.03 | (0.03) | -- | (0.03) |
| Period Ended 10/31/2004(d) | 1.00 | 0.005 | -- | 0.005 | (0.005) | -- | (0.005) |
| Year Ended 4/30/2004 | 1.00 | 0.01 | -- | 0.01 | (0.01) | -- | (0.01) |
| Year Ended 4/30/2003 | 1.00 | 0.01 | -- | 0.01 | (0.01) | -- | (0.01) |
| Year Ended 4/30/2002 | 1.00 | 0.03 | -- | 0.03 | (0.03) | -- | (0.03) |
| Year Ended 4/30/2001 | 1.00 | 0.06 | -- | 0.06 | (0.06) | -- | (0.06) |
(a) The amount shown may not correlate with the change in aggregate gains and losses of portfolio securities due to the timing of sales and redemptions of fund shares.
(b) Total investment return assumes dividend reinvestment and does not reflect any deduction for sales charges. Not annualized for periods less than one year.
The accompanying notes to the financial statements are an integral part of this schedule.
280
Thrivent Mutual Funds
Financial Highlights – continued
|
|
| | | | R A T I O S / S U P P L E M E N T A L D A T A | | |
|
|
| | | | | | Ratios to Average | |
| | | | | | Net Assets Before Expenses | |
| | | | Ratio to Average Net | Waived, Credited or Paid | |
| | | | Assets(c) | Indirectly(c) | |
| Net Asset | | |
|
| |
| Value, | | Net Assets | | Net | | Net | Portfolio |
| End of | Total | End of Period | | Investment | | Investment | Turnover |
| Period | Return(b) | (in millions) | Expenses | Income/(Loss) | Expenses | Income/(Loss) | Rate |
|
| $1.00 | 2.12% | $661.3 | 0.84% | 2.08% | 0.94% | 1.98% | N/A |
| 1.00 | 0.26% | 686.8 | 0.90% | 0.61% | 1.00% | 0.51% | N/A |
| 1.00 | 0.32% | 262.2 | 0.83% | 0.32% | 0.93% | 0.22% | N/A |
| 1.00 | 0.88% | 349.6 | 0.77% | 0.89% | 0.92% | 0.74% | N/A |
| 1.00 | 2.28% | 399.8 | 0.72% | 2.19% | 0.90% | 2.01% | N/A |
| 1.00 | 5.70% | 423.9 | 0.76% | 5.51% | 0.99% | 5.28% | N/A |
| |
| 1.00 | 1.94% | 1.7 | 1.01% | 1.84% | 1.93% | 0.91% | N/A |
| 1.00 | 0.18% | 2.9 | 1.04% | 0.47% | 1.95% | (0.44)% | N/A |
| 1.00 | 0.07% | 1.8 | 1.08% | 0.07% | 1.84% | (0.69)% | N/A |
| 1.00 | 0.42% | 2.8 | 1.38% | 0.27% | 1.62% | 0.03% | N/A |
| 1.00 | 1.34% | 2.8 | 1.52% | 1.39% | 1.70% | 1.21% | N/A |
| 1.00 | 4.67% | 3.3 | 1.81% | 4.45% | 2.04% | 4.22% | N/A |
| |
| 1.00 | 2.56% | 283.1 | 0.40% | 2.56% | 0.50% | 2.46% | N/A |
| 1.00 | 0.47% | 245.7 | 0.47% | 1.05% | 0.54% | 0.98% | N/A |
| 1.00 | 0.59% | 114.6 | 0.56% | 0.59% | 0.56% | 0.59% | N/A |
| 1.00 | 1.17% | 91.4 | 0.48% | 1.18% | 0.53% | 1.13% | N/A |
| 1.00 | 2.54% | 117.8 | 0.46% | 2.45% | 0.54% | 2.37% | N/A |
| 1.00 | 6.07% | 25.3 | 0.43% | 5.86% | 0.56% | 5.73% | N/A |
(c) Computed on an annualized basis for periods less than one year.
(d) For the period from May 1, 2004 to October 31, 2004.
The accompanying notes to the financial statements are an integral part of this schedule.
281
Additional Information
(unaudited)
Shareholder Notification of Federal Tax Information (unaudited)
The following information is provided solely to satisfy the requirements set forth by the Internal Revenue Code. Shareholders will be provided information regarding their distributions in January 2006.
The Funds designate the following percentages of dividends declared from net investment income as dividends qualifying for the 70% dividends received deduction for corporations or as qualified dividend income for individuals under the Jobs and Growth Tax Relief Reconciliation Act of 2003 for the tax period ending October 31, 2005:
| | Dividends | Qualified |
| | Received | Dividend |
| | Deduction for | Income for |
| Fund | Corporations | Individuals |
|
| Moderate Allocation | 1% | 1% |
| Moderately Conservative Allocation | 1% | 1% |
| Partner Small Cap Value | 10% | 10% |
| Small Cap Stock | 35% | 36% |
| Small Cap Index | 100% | 100% |
| Mid Cap Index | 86% | 86% |
| Mid Cap Index - I | 82% | 82% |
| Partner International Stock | 0% | 100% |
| Large Cap Growth | 100% | 100% |
| Large Cap Value | 100% | 100% |
| Large Cap Stock | 100% | 100% |
| Large Cap Index | 100% | 100% |
| Large Cap Index - I | 100% | 100% |
| Balanced | 25% | 26% |
| High Yield | 1% | 1% |
The Municipal Bond Fund designates 99.34% of the dividends declared from net investment income as exempt from federal income tax for the tax period ended October 31, 2005.
The Funds designate the following amounts as distributions of long-term capital gains: Partner Small Cap Value Fund, $8,542,961; Small Cap Stock Fund, $19,750,071; Small Cap Index Fund, $276,635; Mid Cap Stock Fund, $4,000,000; Mid Cap Index Fund, $213,705; Mid Cap Index Fund-I, $571,863; Balanced Fund, $6,139,893; and Limited Maturity Bond Fund, $309,329. These amounts may include earnings and profits distributed to shareholders on the redemption of shares as part of the dividend paid deduction.
Proxy Voting
The policies and procedures that the Trust uses to determine how to vote proxies relating to portfolio securities are attached to the Trust’s Statement of Additional Information. You may request a free copy of the Statement of Additional Information or the report of how the Trust voted proxies relating to portfolio securities during the most recent 12-month period ended June 30 by calling 800-947-4836. You also may review the Statement of Additional Information or the report of how the Trust voted proxies relating to portfolio securities during the most recent 12-month period ended June 30 at the Thrivent Financial web site (www.thrivent.com) or the SEC web site (www.sec.gov).
Quarterly Schedule of Portfolio Holdings
The Trust files its Schedule of Portfolio Holdings on Form N-Q with the SEC for the first and third quarters of each fiscal year. You may request a free copy of the Trust’s Forms N-Q by calling 1-800-947-4836. The Trust’s Forms N-Q also are available on the Thrivent Financial web site (www.thrivent.com) or the SEC web site (www.sec.gov). You also may review and copy the Forms N-Q for the Trust at the SEC’s Public Reference Room in Washington, DC. You may get information about the operation of the Public Reference Room by calling 1-800-SEC-0330.
Board Approval of Investment Advisory Agreement
At its meeting on July 12, 2005, the members of the Board, including the Independent Trustees, unanimously voted to approve the new investment subadvisory agreement (“Subadvisory Agreement”) between the Trust, Thrivent Investment Management and Transamerica Investment Management LLC (“Transamerica”). This was necessary because Westcap Investors LLC (“Westcap”), one of the subadvisers for the Partner Small Cap Growth Fund (the “Fund”), was acquired by Transamerica. The Fund was organized on June 30, 2005, and had no performance history. However, the Board had the benefit of experience with the investment performance of the Thrivent Partner Small Cap Growth Portfolio (the “Partner Small Cap Growth Portfolio”), a Portfolio of the Thrivent Series Fund, Inc., which has similar investment objectives and strategies as the Fund and which is managed by the same personnel as the Fund. In connection with its approval of the Subadvisory Agreement, the Board considered the following factors:
1. The nature, extent, and quality of the services provided by the Subadviser.
2. The investment performance of the Partner Small Cap Growth Portfolio.
3. The costs of the services to be provided and profits anticipated to be realized by Transamerica.
282
Additional Information
(unaudited)
4. The extent to which economies of scale may be realized as the Fund grows.
5. Whether fee breakpoint levels reflect these economies of scale for the benefit of the Fund’s shareholders.
In connection with the approval of the Subadvisory Agreement, the Contracts Committee of the Board (consisting of each of the Independent Trustees of the Board) reviewed information presented by Thrivent Investment Mgt. addressing the factors listed above. The Contracts Committee was represented by independent counsel throughout the meeting and during a private session of the Independent Trustees to consider approval of the Subadvisory Agreement. The Contracts Committee also considered a memorandum it previously received from independent counsel, which summarized the responsibilities of the Trustees under the Investment Company Act in reviewing advisory and subadvisory contracts. The Contracts Committee’s and the Board’s consideration of the factors listed above and information provided to them is discussed below.
Nature, Extent, and Quality of Services
Representatives of Thrivent Investment Mgt. reviewed the proposed transaction between Transamerica and Westcap and reported that Thrivent Investment Mgt.’s subadvisory due diligence committee met with representatives of Westcap. Thrivent Investment Mgt. staff noted that it was assured by Westcap that the investment management staff responsible for the portion of the Fund’s assets managed by Westcap would not change following the acquisition, although there will be a new chief investment officer and chief compliance officer. Thrivent Investment Mgt. reported that the Fund may benefit because Transamerica has a full-time compliance officer, while Westcap’s compliance officer also served in other capacities. Thrivent Investment Mgt. staff also reported that the scope and quality of services under the new investment subadvisory agreement with Transamerica should be at least equivalent to the scope and quality of services provided by Westcap.
Investment Performance
The Fund was newly organized and had no performance history. However, the Board reviewed the performance of the Partner Small Cap Growth Portfolio, a fund with similar investment objectives and strategies as the Fund and which has been managed by the same investment management staff that manages the Fund since May 28, 2004. Information regarding the performance of the Partner Small Cap Growth Portfolio is critically reviewed with management at each quarterly Board meeting. The Contracts Committee noted that the performance of Thrivent Partner Small Cap Growth Portfolio has compared favorably with its benchmarks since Westcap began serving as one of its subadvisers on May 28, 2004.
Cost of Services and Profitability to Subadviser
The Contracts Committee did not review specific information regarding the likely expenses to be incurred and the profit to be realized by Transamerica for the Subadvisory Agreement. It noted that the fee for the Subadvisory Agreement is the same as the fee that was charged by Westcap and that the fee payable to Westcap was negotiated at arms-length. As a result, the Contracts Committee concluded that the fee for the Subadvisory Agreement is reasonable.
Economies of Scale and Breakpoints
The Contracts Committee did not review specific information about breakpoints since the Subadvisory Agreement with Transamerica does not contain breakpoints. The Contracts Committee noted that it is difficult to anticipate the effect of economies of scale based on potential breakpoints because the Fund is new.
Based on the factors discussed above, the Contracts Committee recommended approval of the Subadvisory Agreement, and the Board, including all of the Independent Trustees, approved the Subadvisory Agreement with Transamerica.
283
Board of Trustees and Officers
|
The following table provides information about the Trustees and Officers of the Funds. Each Trustee oversees each of 30 series of the Trust and also serves as:
- Director of Thrivent Series Fund, Inc., a registered investment company consisting of 31 Portfolios that serve as underlying funds for variable contracts issued by Thrivent Financial for Lutherans (“Thrivent Financial”) and Thrivent Life Insurance Company (“TLIC”) and investment options in the retirement plan offered by Thrivent Financial
- Trustee of Thrivent Financial Securities Lending Trust, a registered investment company consisting of one Portfolio that serves as a cash collateral fund for a securities lending program sponsored by Thrivent Financial.
The 30 series of the Trust, 31 Portfolios of Thrivent Series Fund, Inc., and Thrivent Financial Securities Lending Trust are referred to herein as the “Fund Complex.” The Statement of Additional Information includes additional information about the Trustees and is available, without charge, by calling 1-800-847-4836.
| Interested Trustee1 | | | | |
| | | Number of | | |
| | Position | Portfolios in | Principal | |
| | with Trust | Fund Complex | Occupation | Other |
| Name, Address, | and Length | Overseen | During the | Directorships |
| and Age | of Service2 | by Trustee | Past 5 Years | Held by Trustee |
|
| Pamela J. Moret | President since 2002 | 62 | Executive Vice President, | Director, Lutheran World |
| 625 Fourth Avenue South | and Trustee since 2004 | Marketing and Products, | Relief; Director, Minnesota |
| Minneapolis, MN | | | Thrivent Financial since | Public Radio |
| Age 49 | | | 2002; Senior Vice | |
| | | | President, Products, | |
| | | | American Express | |
| | | | Financial Advisors from | |
| | | | 2000 to 2001; Vice | |
| | | | President, Variable Assets, | |
| | | | American Express | |
| | | | Financial Advisors | |
| | | | from 1996 to 2000 | |
| |
| Independent Trustees3 | | | | |
| | | Number of | | |
| | Position | Portfolios in | Principal | |
| | with Trust | Fund Complex | Occupation | Other |
| Name, Address, | and Length | Overseen | During the | Directorships |
| and Age | of Service2 | by Trustee | Past 5 Years | Held by Trustee |
|
| F. Gregory Campbell | Trustee since 1992 | 62 | President, Carthage | Director, National |
| 625 Fourth Avenue South | | | College | Association of Independent |
| Minneapolis, MN | | | | Colleges and Universities, |
| Age 65 | | | | Director, Johnson Family |
| | | | | Funds, Inc., an investment |
| | | | | company consisting of four |
| | | | | portfolios; Director, |
| | | | | Kenosha Hospital and |
| | | | | Medical Center Board; |
| | | | | Prairie School Board; United |
| | | | | Health Systems Board |
284
| | | Board of Trustees and Officers | |
| |
| |
| Independent Trustees3 -- continued | | | | |
| | | | | Number of | | |
| | | Position | | Portfolios in | Principal | |
| | | with Trust | Fund Complex | Occupation | Other |
| Name, Address, | and Length | | Overseen | During the | Directorships |
| and Age | of Service2 | | by Trustee | Past 5 Years | Held by Trustee |
|
| Herbert F. Eggerding, Jr. | Lead Trustee | | 62 | Management consultant | None |
| 625 | Fourth Avenue South | since 2003 | | | to several privately | |
| Minneapolis, MN | | | | owned companies | |
| Age | 68 | | | | | |
| |
| Noel K. Estenson | Trustee since 2004 | 62 | Retired | None |
| 625 | Fourth Avenue South | | | | | |
| Minneapolis, MN | | | | | |
| Age | 66 | | | | | |
| |
| Richard L. Gady | Trustee since 1987 | 62 | Retired; previously Vice | Director, International |
| 625 | Fourth Avenue South | | | | President, Public | Agricultural Marketing |
| Minneapolis, MN | | | | Affairs and Chief | Association |
| Age | 62 | | | | Economist, Conagra, | |
| | | | | | Inc. (agribusiness) | |
| |
| Richard A. Hauser | Trustee since 2004 | 62 | President, National Legal | Director, The Washington |
| 625 | Fourth Avenue South | | | | Center for the Public | Hospital Center |
| Minneapolis, MN | | | | Interest, since 2004; | |
| Age | 62 | | | | General Counsel, U.S. | |
| | | | | | Department of Housing | |
| | | | | | and Urban Development, | |
| | | | | | 2001 to 2004; Partner, | |
| | | | | | Baker & Hosteller, | |
| | | | | | 1986 to 2001 | |
| |
| Connie M. Levi | Trustee since 2004 | 62 | Retired | Director, Norstan, Inc. |
| 625 | Fourth Avenue South | | | | | |
| Minneapolis, MN | | | | | |
| Age | 66 | | | | | |
| |
| Edward W. Smeds | Chairman and Trustee | 62 | Retired | Chairman of Carthage |
| 625 | Fourth Avenue South | since 1999 | | | | College Board |
| Minneapolis, MN | | | | | |
| Age | 69 | | | | | |
| |
| | | | | |
| Executive Officers | | | | | |
| | | Position with Trust | | |
| Name, Address, | and Length | | | |
| and Age | of Service2 | Principal Occupation During the Past 5 Years |
|
| Pamela J. Moret | President since 2002 | Executive Vice President, Marketing and Products, Thrivent |
| 625 | Fourth Avenue South | | | Financial since 2002; Senior Vice President, Products, |
| Minneapolis, MN | | | American Express Financial Advisors from 2000 to 2001; Vice |
| Age | 49 | | | President, Variable Assets, American Express Financial Advisors |
| | | | | from 1996 to 2000 | |
285
| | | Board of Trustees and Officers |
| |
| |
| Executive Officers -- continued | |
| | | Position with Trust | |
| Name, Address, | and Length | |
| and Age | of Service2 | Principal Occupation(s) During the Past 5 Years |
|
| James M. Odland | Secretary and Chief Legal | Vice President, Office of the General Counsel, Thrivent |
| 625 | Fourth Avenue South | Officer since 2005 | Financial for Lutherans, since 2005; Senior Securities Counsel, |
| Minneapolis, MN | | Allianz Life Insurance Company from January 2005 to |
| Age | 54 | | August 2005; Vice President and Chief Legal Officer, |
| | | | Woodbury Financial Services, Inc., from September 2003 to |
| | | | January 2005; Vice President and Group Counsel, Corporate |
| | | | Practice Group, American Express Financial Advisors, Inc., |
| | | | from 2001 to 2003 |
| |
| Katie S. Kloster | Vice President and Chief | Vice President and Rule 38a-1 Chief Compliance Officer, |
| 625 | Fourth Avenue South | Compliance Officer | since 2004 previously Vice President and Comptroller of |
| Minneapolis, MN | since 2004 | Thrivent Financial. |
| Age | 40 | | |
| |
| Gerard V. Vaillancourt | Treasurer and Principal | Head of Mutual Fund Accounting, Thrivent Financial since |
| 625 | Fourth Avenue South | Financial Officer | 2005; Director, Fund Accounting Administration, Thrivent |
| Minneapolis, MN | since 2005 | Financial from 2002 to 2005; Manager, Portfolio Compliance, |
| Age | 38 | | Lutheran Brotherhood from 2001 to 2002; Manager, Fund |
| | | | Accounting, Minnesota Life from 2000 to 2001. |
| |
| Russell W. Swansen | Vice President since 2004 | Senior Vice President and Chief Investment Officer, Thrivent |
| 625 | Fourth Avenue South | | Financial, since 2004; Managing Director, Colonade Advisors, |
| Minneapolis, MN | | LLC, from 2001 to 2003, President and Chief Investment |
| Age | 48 | | Officer of PPM American from 1999 to 2000 |
| |
| Nikki L. Sorum | Vice President since 2004 | Senior Vice President, Business Development, Thrivent |
| 625 | Fourth Avenue South | | Financial, since 2002; previously Senior Vice President, |
| Minneapolis, MN | | RBC Dain Rauscher |
| Age | 44 | | |
| |
| Janice M. Guimond | Vice President since 2005 | Vice President, Investment Operations, Thrivent Financial |
| 625 | Fourth Avenue South | | since 2004; Manager of Portfolio Reporting, Thrivent Financial |
| Minneapolis, MN | | 2003 to 2004; Independent Consultant 2001 to 2003; Vice |
| Age | 42 | | President, Director of Technology, Investment Advisers, Inc. |
| | | | 1999 to 2000; Vice President, Investment Systems & Services, |
| | | | Investment Advisers, Inc. 1997 to 1999 |
| |
| Marnie L. Loomans-Thuecks | Vice President since 2004 | Vice President, Customer Interaction Department, |
| 4321 North Ballard Road | | Thrivent Financial |
| Appleton, WI | | |
| Age | 42 | | |
| |
| Thomas R Mischka | Vice President and | Vice President of Divisional Support Services, |
| 4321 North Ballard Road | Anti-Money Laundering | Thrivent Financial |
| Appleton, WI | Officer since 2003 | |
| Age | 46 | | |
|
286
| | Board of Trustees and Officers |
| |
| |
| Executive Officers -- continued | |
| | Position with Trust | |
| Name, Address, | and Length | |
| and Age | of Service2 | Principal Occupation(s) During the Past 5 Years |
|
| Kenneth L. Kirchner | Assistant Vice President | Director, Transfer Agency Operations, Thrivent Financial |
| 4321 North Ballard Road | and Assistant Secretary | |
| Appleton, WI | since 2004 | |
| Age 39 | | |
| |
| Sandra A. Diedrick | Assistant Vice President | Director, of Interaction Center, Thrivent Financial |
| 4321 North Ballard Road | and Assistant Secretary | |
| Appleton, WI | since 2004 | |
| Age 54 | | |
| |
| David R. Spangler | Assistant Vice President | Director, of Investment Product Management, Thrivent |
| 625 Fourth Avenue South | since 2004 | Financial since 2002; Vice President- Product Development, |
| Minneapolis, MN | | Wells Fargo Bank-Funds Management Group, from 2000 to |
| Age 38 | | 2002; Analyst, MCSI, Inc., 2000 |
| |
| John C. Bjork | Assistant Secretary | Senior Counsel, Thrivent Financial |
| 625 Fourth Avenue South | since 2003 | |
| Minneapolis, MN | | |
| Age 52 | | |
| |
| Marlene J. Nogle | Assistant Secretary | Senior Counsel, Thrivent Financial |
| 625 Fourth Avenue South | since 2003 | |
| Minneapolis, MN | | |
| Age 58 | | |
| |
| Todd J. Kelly | Assistant Treasurer | Director, Fund Accounting Operations, Thrivent Financial |
| 4321 North Ballard Road | since 1999 | |
| Appleton, WI | | |
| Age 36 | | |
1 “Interested person” of the Trust as defined in 1940 Act by virtue of positions with Thrivent Financial. Ms. Moret is considered an interested person because of her principal occupation with Thrivent Financial.
2 Each Trustee serves an indefinite term until her or his successor is duly elected and qualified. The bylaws of the Trust provide that each Trustee must retire at the end of the year in which the Trustee attains age 70. Officers serve at the discretion of the board until their successors are duly appointed and qualified.
3 The Trustees other than Ms. Moret are not “interested persons” of the Trust and are referred to as “Independent Trustees.”
287
Thrivent Mutual Funds
Supplement to Prospectus dated February 28, 2005
Regarding
Thrivent Income Fund
Thrivent Core Bond Fund
Thrivent Limited Maturity Bond Fund
The “Portfolio Management” section of the prospectus is amended with respect to the following Funds:
Thrivent Income Fund, Thrivent Core Bond Fund, and Thrivent Limited Maturity Bond Fund
Gregory R. Anderson and Michael G. Landreville serve as portfolio co-managers of Thrivent Income Fund, Thrivent Core Bond Fund, and Thrivent Limited Maturity Bond Fund.
Mr. Anderson has been a portfolio manager of the Funds since 2005. He has been with Thrivent Investment Mgt. since 1997 and has served as a portfolio manager since 2000.
Mr. Landreville has been a portfolio manager of Thrivent Income Fund since 1998, Thrivent Limited Maturity Bond Fund since 1999, and Thrivent Core Bond Fund since 2002. He has been with Thrivent Investment Mgt. since 1983.
The date of this Supplement is October 18, 2005.
Please include this Supplement with your Prospectus.
288
This page intentionally left blank.
289

THRIVENT U.S. GOVERNMENT ZERO
COUPON TARGET FUND, SERIES 2006
|

We are pleased to provide you with the Thrivent U.S. Government Zero Coupon Target Fund, Series 2006 annual report for the twelve-month period ended October 31, 2005.
In previous letters I have often highlighted integrity and commitment to you, our member, as a common thread running through our organization--from our customer service areas to our portfolio managers. On the investment management side, we seek to align our investment discipline with our shareholders’ best interests by striving for consistent, long-term performance and taking risk management seriously in our pursuit of potential market rewards. One of our less understood, but still critical, core investment management beliefs centers on the concept of investment style consistency.
WHAT IS INVESTMENT STYLE CONSISTENCY?
Simply put, being style consistent means sticking to a Fund’s investment objective and investment style regardless of market conditions. For example, high-yield bond funds invest predominately in high-yield bonds and small-cap stock funds always hold a large percentage of small-cap stocks. Seem obvious? Yes, but the temptation to stray is ever present and can prove damaging to an investor’s portfolio. Consider the following example.
AVOIDING THE DANGER OF STYLE DRIFT
Stocks are commonly divided into two investment style categories--growth and value. Growth stocks typically offer higher potential to rise (and fall) in share price and are focused on more aggressive areas of the market such as software firms, biotechnology companies and other fast-growing industries. Value-oriented companies, on the other hand, are usually slower growing and focus on banks, energy companies and industrial companies. Often, the two investment styles take turns leading the market and have historically offered greater diversification potential when held together. A “blended” style holds both types of stocks.
In the mid 1990s, large-cap growth stocks--bolstered by the now infamous technology and internet stock run up--began an astounding period of outperformance over which they greatly outpaced other asset classes until 2000 when the NASDAQ “bubble” finally burst. Over the course, investors and investment professionals were all too often guilty of abandoning long-term investment plans in favor of chasing hot performing technology stocks that primarily drove strong large-cap growth fund returns. Many investors came to regret this short-term mindset when growth stocks came crashing back to earth in 2000 and struggled over the next several years, while at the same time cast-off value and bond funds performed well.
Unfortunately, chasing past performance is not limited to the inexperienced investor--many sophisticated asset management firms and portfolio managers succumb to the same temptation. Large cap value stock funds performed well in the late-1990s but lagged their more growth-oriented colleagues by a wide margin. Many firms allowed their value managers to drift into traditional growth stock markets in order to “chase” the hot technology sector. The end result? While these firms may have succeeded in attracting short-term assets, their clients were often far less successful in achieving their long-term investment goals.
2
At Thrivent Investment Management, we understand the importance of each of our portfolio management teams sticking to their fund’s specific investment objective. We have built a process to monitor style consistency on all of our funds that utilizes leading-edge software and a team of professionals specifically skilled in portfolio analytics. Additionally, our portfolio managers are compensated relative to their particular asset class and only to their particular asset class. In other words, the goal for our large-cap value manager is to outperform other large-cap value stock funds--not to outperform large-cap growth or mid-cap stock funds that are entirely different asset classes. They are judged solely on how they perform in their specific investment category--even when other related asset classes may be faring better. Finally, we adhere to a fund naming process that underlies our belief in “truth-in-advertising.” Each Thrivent Mutual Fund is named after the asset class it invests in for the utmost in transparency and clarity.
STYLE CONSISTENT FUNDS SUPPORT SOUND ASSET
ALLOCATION
|
Why is style consistency so important? The best laid asset allocation plans could become disrupted if the underlying funds are not true to their investment style and objective. If your large-cap stock fund periodically invests heavily in small company stocks, how can you be sure that your overall portfolio has adequate exposure to large company stocks at any point in time? The key is to construct your portfolio with mutual funds that stick to their style and objective, regardless of near-term market moves. Only this commitment to investment management discipline fully supports your personal asset allocation plan and a well balanced portfolio. If you like the idea of style consistent mutual funds and personalized asset allocation but find investing time-consuming and complex, consider our new suite of four asset allocation mutual funds designed to provide a simple one-step investment solution. We’re excited about offering what we call A Simple Choice for Smart Investing!TM Talk with your Thrivent Investment Management registered representative for more information.FINANCIAL MARKETS EVERCHANGING
|
Our financial markets appear to be approaching a pivot point where proper portfolio allocation and balance is crucial. International stocks have done very well and large-company stocks are posting better performance after years of trailing their smaller-company counterparts. Bonds continue to fight upstream against rising interest rates. How comfortable are you with your current portfolio make up? Your Thrivent Investment Management registered representative has the tools and knowledge to provide a current portfolio assessment and make recommendations that could better position you for success in 2006.As always, thank you for continuing to turn to us for your financial solutions. We very much value your business and look forward to serving you better than ever in 2006.
Yours sincerely,

Pamela J. Moret
President and Trustee
Thrivent Mutual Funds
|
Investing in a mutual fund involves risks, including the possible loss of principal. The prospectus contains more complete information on the investment objectives, risks, charges and expenses of the Investment Company which investors should read and consider carefully before investing. To obtain a prospectus, contact a registered representative or visit www.thrivent.com.

THRIVENT U.S. GOVERNMENT ZERO COUPON
TARGET FUND, SERIES 2006
|
For the year ended October 31 2005, the Thrivent U.S. Government Zero Coupon Target Fund, Series 2006, produced a return of -0.19% . Returns have been muted due to the steady rise of the federal funds rate over the past year. A zero coupon security will typically perform better when interest rates are falling and will perform worse than coupon-paying securities when interest rates are rising. As we approach the maturity date of 2006, the return of this fund is approximating very short term money market returns.

Mark Simenstad, Portfolio Manager
$10,000 INVESTMENT
INCLUDING 4.75% SALES CHARGE*
|
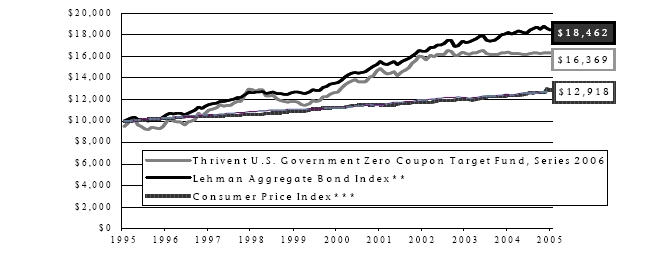
The Fund seeks high, relatively predictable investment returns from U.S. government securities over selected periods of time, assuming investors reinvest the dividends and capital gains distributed by the Fund.
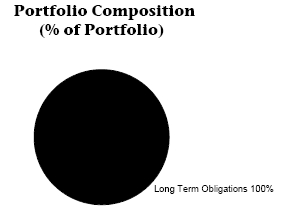
4
| | AVERAGE ANNUAL TOTAL RETURNS* | |
|
| | For the Period Ended October 31, 2005 | 1-Year | 5-Year | 10-Year |
|
| | Without sales charge | -0.19% | 5.27% | 5.65% |
| | With sales charge1 | -4.92% | 4.26% | 5.13% |
|
| |
| 1 | Performance has been restated to reflect the maximum sales charges of 4.75%. | |
| * | Past performance is not an indication of future results. Investment return and principal value will fluctuate, and shares, when redeemed, may be worth more or less than their original cost. Current performance may be lower or higher than the performance data quoted. Call 800-THRIVENT or visit www.thrivent.com for performance results current to the most recent month end. |
| |
| | Annualized total returns represent past performance and reflect changes in share prices, the reinvestment of all dividends and capital gains, and the effects of compounding. At various times, the Fund’s adviser waived its management fee and/or reimbursed Fund expenses. Had the adviser not done so, the Fund’s total returns would have been lower. The returns shown do not reflect taxes a shareholder would pay on distributions or redemptions. |
| |
| | Investing in a mutual fund involves risks, including the possible loss of principal. The prospectus contains more complete information on the investment objectives, risks, charges and expenses of the investment company which investors should read and consider carefully before investing. To obtain a prospectus, contact a registered representative or visit www.thrivent.com. Please read your prospectus carefully. |
| |
| ** | An unmanaged index that encompasses five major classes of U.S. fixed-income securities: U.S. Treasury and Government Agency securities, corporate debt obligations, mortgage-backed securities, asset-backed securities and commercial mortgage backed securities. It is not possible to invest directly in the Index. |
| |
| *** | The Consumer Price Index is an inflationary indicator that measures the change in the cost of a fixed basket of products and services, including housing, electricity, food and transportation. It is not possible to invest directly in the Index. |
| |
5
Shareholder Expense Example
|
As a shareholder of the Fund, you incur the following types of costs: (1) transaction costs, including sales charges (loads) on purchase payments, reinvested dividends, or other distributions; redemption fees; and exchange fees; (2) ongoing costs, including management fees; distributions [and/or service] (12b-1) fees; and other Fund expenses. This Example is intended to help you understand your ongoing costs (in dollars) of investing in the Fund and to compare these costs with the ongoing costs of investing in other mutual funds. The Example is based on an investment of $1,000 invested at the beginning of the period and held for the entire period from May 1, 2005 through October 31, 2005.
Actual Expenses
The first line of the table below provides information about actual account values and actual expenses. You may use the information in this line, together with the amount you invested, to estimate the expenses that you paid over the period. Simply divide your account value by $1,000 (for example, an $8,600 account value divided by $1,000 = 8.6), then multiply the result by the number in the first line under the heading entitled "Expenses Paid During Period" to estimate the expenses you paid on your account this period.
Hypothetical Example for Comparison Purposes
The second line of the table below provides information about hypothetical account values and hypothetical expenses based on the Fund's actual expense ratio and an assumed rate of return of 5% per year before expenses, which is not the Fund's actual return. The hypothetical account values and expenses may not be used to estimate the actual ending account balance or expenses you paid for the period. You may use this information to compare the ongoing costs of investing in the Fund and other funds. To do so, compare this 5% hypothetical example with the 5% hypothetical examples that appear in the shareholder reports of the other funds.
Please note that the expenses shown in the table are meant to highlight your ongoing costs only and do not reflect any transactional costs, such as sales charges (loads), redemption fees, or exchange fees. Therefore, the second line of the table is useful in comparing ongoing costs only, and will not help you determine the relative total costs of owning different funds. In addition, if these transactional costs were included, your costs would have been higher.
| | Beginning | Ending | Expenses | |
| | Account | Account | Paid During | Annualized |
| | Value | Value | Period * | Expense |
| | 5/1/2005 | 10/31/2005 | 5/1/2005 - | Ratio |
| | | | 10/31/2005 | |
| |
| Thrivent U.S. Government Zero Coupon Target Fund, Series 2006 | |
| |
| Actual | $ 1,000 | $ 1,005 | $ 5.05 | 1.00% |
| Hypothetical ** | $ 1,000 | $ 1,020 | $ 5.09 | 1.00% |
| * | Expenses are equal to the Fund's annualized expense ratio, multiplied by the average account value over the period, multiplied by 184/365 to reflect the one-half year period. |
| |
| ** | Assuming 5% total return before expenses. |
| |
6
REPORT OF INDEPENDENT REGISTERED PUBLIC ACCOUNTING FIRM

To the Shareholders and Trustees of Thrivent Mutual Funds:
|
In our opinion, the accompanying statement of assets and liabilities, including the schedule of investments, and the related statements of operations and of changes in net assets and the financial highlights present fairly, in all material respects, the financial position of Thrivent U.S. Government Zero Coupon Target Fund, Series 2006 (one of the portfolios constituting the Thrivent Mutual Funds, hereafter referred to as the “Fund”) at October 31, 2005, the results of its operations, changes in its net assets and financial highlights for each of the periods presented, in conformity with accounting principles generally accepted in the United States of America. These financial statements and financial highlights (hereafter referred to as “financial statements”) are the responsibility of the Fund's management; our responsibility is to express an opinion on these financial statements based on our audits. We conducted our audits of these financial statements in accordance with the standards of the Public Company Accounting Oversight Board (United States). Those standards require that we plan and perform the audit to obtain reasonable assurance about whether the financial statements are free of material misstatement. An audit includes examining, on a test basis, evidence supporting the amounts and disclosures in the financial statements, assessing the accounting principles used and significant estimates made by management, and evaluating the overall financial statement presentation. We believe that our audits, which included confirmation of securities at October 31, 2005 by correspondence with the custodian and brokers, provide a reasonable basis for our opinion.

December 14, 2005
7
SCHEDULE OF INVESTMENTS
AS OF OCTOBER 31, 2005
|
| Thrivent U.S. Government Zero Coupon Target Fund, Series 2006 (a) | |
|
| |
| Principal | | Yield to | Maturity | Market | |
| Amount | Long-Term Obligations (100.0%) | Maturity | Date | Value | |
|
| | U.S. Zero Coupon (100.0%) | | | | |
| $1,458,000 | U.S. Government Zero Coupon Bonds | 4.23% | 11/15/2006 | $1,395,245 | |
|
| | TOTAL INVESTMENTS (100.0%) | | |
| | (amortized cost basis $1,342,596) | $1,395,245 | |
|
|
| (a) | The categories of investments are shown as a percentage of total investments. |
| |
The accompanying notes to the financial statements are an integral part of this schedule.
|
8
STATEMENT OF ASSETS AND LIABILITIES
Thrivent U.S. Government Zero Coupon Target Fund, Series 2006
| Assets | |
| Investments at cost | $1,342,596 |
| Investments at value | 1,395,245 |
| Cash | 23,179 |
| Prepaid expenses | 2,884 |
| Receivable from affiliate | 482 |
|
| Total Assets | 1,421,790 |
|
| |
| Liabilities | |
| Income distributions payable | 75,667 |
| Accrued expenses | 9,342 |
|
| Total Liabilities | 85,009 |
|
| |
| Net Assets | |
| Trust Capital (beneficial interest) | 1,278,364 |
| Accumulated undistributed net investment income | 880 |
| Accumulated undistributed net realized gain on investments | 4,888 |
| Net unrealized appreciation on investments | 52,649 |
|
| Total Net Assets | $1,336,781 |
|
| |
| Net Assets | $1,336,781 |
| Shares of beneficial interest outstanding | 125,865 |
| Net asset value per share | $10.62 |
| |
| Maximum public offering price | $11.15 |
The accompanying notes to the financial statements are an integral part of this statement.
9
Thrivent U.S. Government Zero Coupon Target Fund, Series 2006
|
| | For the Year |
| | Ended |
| | 10/31/2005 |
|
| Investment Income | |
| Taxable interest | $105,387 |
|
| Total Investment Income | 105,387 |
|
| |
| Expenses | |
| Accounting and pricing fees | 1,014 |
| Audit and legal fees | 12,053 |
| Custody fees | 647 |
| Printing and postage expense | 4,261 |
| SEC and state registration expense | 975 |
| Insurance expense | 4,463 |
| Transfer agent fees | 2,966 |
| Trustees’ fees | 2,283 |
| Other expenses | 1,752 |
|
| Total Expenses Before Reimbursement | 30,414 |
|
| |
| Less: | |
| Reimbursement from adviser | (16,589) |
| Fees paid indirectly | (75) |
|
| Total Net Expenses | 13,750 |
|
| |
| Net Investment Income | 91,637 |
|
| |
| Realized and Unrealized Gains/(Losses) on Investments | |
| Net realized gains on investments | 4,889 |
| Change in net unrealized appreciation/(depreciation) on | |
| investments | (98,679) |
|
| Net Realized and Unrealized Gains/(Losses) on | |
| Investments | (93,790) |
|
| |
| Net Increase in Net Assets Resulting From Operations | $(2,153) |
|
The accompanying notes to the financial statements are an integral part of this statement.
|
10
STATEMENT OF CHANGES IN NET ASSETS
Thrivent U.S. Government Zero Coupon Target Fund, Series 2006
| | For the Year | For the Period | For the Year |
| | Ended | Ended | Ended |
| | 10/31/2005 | 10/31/2004 | 4/30/2004 |
|
| Operations | | | |
| Net investment income | $91,637 | $45,057 | $89,174 |
| Net realized gains on investments | 4,889 | 9,369 | 12,814 |
| Change in net unrealized appreciation/ | | | |
| (depreciation) on investments | (98,679) | (41,329) | (93,722) |
|
| Net Increase in Net Assets Resulting | | | |
| From Operations | (2,153) | 13,097 | 8,266 |
|
| |
| Distributions to Shareholders | | | |
| From net investment income | (92,042) | (44,577) | (89,174) |
| From net realized gains | (9,370) | (6,632) | (28,831) |
|
| Total Distributions to Shareholders | (101,412) | (51,209) | (118,005) |
|
| |
| Trust Share Transactions | | | |
| Income dividends reinvested | 86,495 | -- | 87,476 |
| Capital gains distributions reinvested | 9,357 | 6,578 | 28,587 |
| Redemption of trust shares | (43,789) | (86,563) | (79,054) |
|
| Net Increase/(Decrease) in Trust Capital | 52,063 | (79,985) | 37,009 |
|
| |
| Net Increase/(Decrease) in Net Assets | (51,502) | (118,097) | (72,730) |
|
| |
| Net Assets Beginning of Period | 1,388,283 | 1,506,380 | 1,579,110 |
|
| |
| Net Assets End of Period | $1,336,781 | $1,388,283 | $1,506,380 |
|
The accompanying notes to the financial statements are an integral part of this statement.
11
NOTES TO FINANCIAL STATEMENTS
AS OF OCTOBER 31, 2005
|
Thrivent U.S. Government Zero Coupon Target Fund, Series 2006
|
A. Organization
Thrivent Mutual Funds (the "Trust") was organized as a Massachusetts Business Trust on March 10, 1987 and is registered as an open-end management investment company under the Investment Company Act of 1940. The Trust commenced operations on July 16, 1987.
On November 14, 1990, Thrivent U.S. Government Zero Coupon Target Fund, Series 2006 (the “Fund”), commenced operations. Effective June 1, 1993, the Board of Trustees of Thrivent Mutual Funds closed the Fund to new shareholders and discontinued the sale of additional shares to existing shareholders. Effective October 31, 2004, the Trust changed its fiscal year end from April 30 to October 31.
Under the Trust's organizational documents, its officers and trustees are indemnified against certain liabilities arising out of the performance of their duties to the Trust. In addition, in the normal course of business, the Trust enters into contracts with vendors and others that provide general damage clauses. The Trust's maximum exposure under these contracts is unknown, as this would involve future claims that may be made against the Trust. However, based on experience, the Trust expects the risk of loss to be remote.
B. Significant Accounting Policies
Valuation - Securities traded on national securities exchanges are valued at the last reported sales prices. The pricing service, in determining values of fixed-income securities, takes into consideration such factors as current quotations by broker/dealers, coupon, maturity, quality, type of issue, trading characteristics, and other yield and risk factors it deems relevant in determining valuations. All other securities are valued at official closing price if such quotations are readily available. Otherwise, such securities are valued at a fair value as determined in good faith by the Adviser under supervision of the Board of Trustees.
Federal Income Taxes - The Fund intends to comply with the requirements of the Internal Revenue Code which are applicable to regulated investment companies and to distribute substantially all of its taxable income to its shareholders. The Fund accordingly anticipates paying no Federal income taxes and no Federal income tax provision was recorded.
Fees Paid Indirectly - The Fund has a deposit arrangement with the custodian whereby interest earned on uninvested cash balances is used to pay a portion of custodian fees. This deposit arrangement is an alternative to overnight investments.
Distributions to Shareholders - Net investment income is distributed to each shareholder as a dividend. Dividends from the Fund are declared daily and distributed annually. Net realized gains from securities transactions, if any, are distributed at least annually after the close of the fiscal year.
Use of Estimates - The preparation of financial statements in conformity with accounting principles generally accepted in the United States of America require management to make estimates and assumptions that affect the reported amounts of assets and liabilities and disclosure of contingent assets and liabilities at the date of the financial statements and the reported amounts of income and expenses during the reporting period. Actual results could differ from these estimates.
Other - For financial statement purposes, investment security transactions are accounted for on the trade date. Interest income is recognized on an accrual basis. Bond discount is amortized over the life of the respective bonds on the interest method. Realized gains or losses on sales are determined on a specific cost identification basis. Generally accepted accounting principles require permanent financial reporting and tax differences be reclassified to trust capital. No reclassifications were necessary at October 31, 2005.
12
C. Investment Advisory Management Fees and
Transactions with Related Parties
|
The Trust has entered into an Investment Advisory Agreement with Thrivent Investment Management Inc. (the "Adviser") under which the Fund pays a fee for investment advisory services. The annual rate of fees under the Investment Advisory Agreement are calculated at 0.50 of 1% of the average daily net assets of the Fund. Payments under the Investment Advisory Agreement were discontinued effective July 1, 1993.
Each Trustee who is not affiliated with Thrivent Financial for Lutherans or the Adviser receives an annual fee from the Fund for services as a Trustee and is eligible to participate in a deferred compensation plan with respect to these fees. Each participant's deferred compensation account will increase or decrease as if it were invested in shares of the Funds of their choice.
Trustees not participating in the above plan received $1,111 in fees for the year ended October 31, 2005, from the Fund. No remuneration has been paid by the Trust to any of the officers or affiliated Trustees of the Trust. In addition, the Trust reimbursed unaffiliated Trustees for reasonable expenses incurred in relation to attendance at the meetings.
The Fund is charged for those expenses that are directly attributable to it, such as advisory, custodian and certain shareholder service fees, while other expenses that cannot be directly attributable to the Fund are allocated to Thrivent Mutual Funds in proportion to the net assets, number of shareholder accounts, or other reasonable basis of the respective Fund.
The Adviser has voluntarily reimbursed the Fund for all expenses in excess of 1% of average daily net assets since inception.
Thrivent Financial for Lutherans is the ultimate parent company for Thrivent Investment Management Inc.
D. Security Transactions
During the year ended October 31, 2005, there were no purchases and $80,479 in sales. All sales were in U.S. Government obligations.
E. Federal Income Tax Information
The cost basis of the investments is the same for financial reporting purposes and Federal income tax purposes. The net unrealized appreciation on investments at October 31, 2005 was $52,649. There was no depreciation on investments as of October 31, 2005.
During the year ended October 31, 2005, period ended October 31, 2004 and year ended April 30, 2004, Thrivent U.S. Government Zero Coupon Target Fund, Series 2006 distributed $92,042, $44,577 and $89,174 from ordinary income, and $9,370, $6,632 and $28,831 from long-term capital gains, respectively.
At October 31, 2005, undistributed ordinary income and long-term capital gains for tax purposes were $4,877 and $4,888, respectively.
F. Trust Transactions
Transactions in trust shares for the year ended October 31, 2005, period ended 10/31/2004 and the year ended April 30, 2004 were as follows:
| | 10/31/2005 | 10/31/2004 | 4/30/2004 |
| Income dividends reinvested | 7,743 | -- | 7,278 |
| Capital gains reinvested | 837 | 571 | 2,380 |
| Shares redeemed | (4,008) | (7,489) | (6,428) |
| Net Change in Trust Shares | 4,572 | (6,918) | 3,230 |
13
FINANCIAL HIGHLIGHTS
For a share outstanding throughout each period (a)
|
| | | Income from Investment Operations | Less Distributions from |
|
|
| | | | Net Realized and | | | | |
| | Net Asset Value, | Net | Unrealized | Total | Net | Net Realized | |
| | Beginning of | Investment | Gain/(Loss) on | Investment | Investment | Gain on | Total |
| | Period | Income | Investments(b) | Operations | Income | Investments | Distributions |
|
| |
| |
| Class A Shares | | | | | | | |
| |
| Year Ended 10/31/2005 $ | 11.45 $ | 0.73 $ | (0.75) $ | (0.02) $ | (0.73) $ | (0.08) $ | (0.81) |
| Period Ended 10/31/2004 | 11.75 | 0.36 | (0.25) | 0.11 | (0.36) | (0.05) | (0.41) |
| Year Ended 4/30/2004 | 12.63 | 0.71 | (0.64) | 0.07 | (0.71) | (0.24) | (0.95) |
| Year Ended 4/30/2003 | 12.17 | 0.73 | 0.63 | 1.36 | (0.73) | (0.17) | (0.90) |
| Year Ended 4/30/2002 | 12.22 | 0.71 | 0.07 | 0.78 | (0.71) | (0.12) | (0.83) |
| Year Ended 4/30/2001 | 11.27 | 0.72 | 1.00 | 1.72 | (0.72) | (0.05) | (0.77) |
| (a) | All per share amounts have been rounded to the nearest cent. |
| |
| (b) | The amount shown may not correlate with the change in aggregate gains and losses of portfolio securities due to the timing of sales and redemptions of fund shares. |
| |
| (c) | Total investment return assumes dividend reinvestment and does not reflect any deduction for sales charges. |
| |
| (d) | Computed on an annualized basis for periods less then one year. |
| |
The accompanying notes to the financial statements are an integral part of this schedule.
14
FINANCIAL HIGHLIGHTS - CONTINUED
|
| | | | Ratios / Supplemental Data | | |
|
| | | | | | Ratios to Average Net Assets | |
| | | | | | Before Expenses Waived, | |
| | | | Ratios to Average Net Assets(d) | Credited or Paid Indirectly(d) | |
| |
| Net Asset | | Net Assets End | | Net | | Net | Portfolio |
| Value, End | Total | of Period | | Investment | | Investment | Turnover |
| of Period | Return(c) | (in thousands) | Expenses | Income/(Loss) | Expenses | Income/(Loss) | Rate |
|
| |
| |
| |
| |
| $10.62 | (0.19)% | $1,337 | 1.00% | 6.62% | 2.20% | 5.42% | 0.00% |
| 11.45 | 0.97% | 1,388 | 1.00% | 6.25% | 2.02% | 5.23% | 0.00% |
| 11.75 | 0.65% | 1,506 | 1.00% | 5.82% | 1.78% | 5.04% | 0.00% |
| 12.63 | 11.28% | 1,579 | 0.91% | 5.73% | 1.55% | 5.09% | 0.00% |
| 12.17 | 6.53% | 1,565 | 1.00% | 5.80% | 1.27% | 5.53% | 0.00% |
| 12.22 | 15.28% | 1,612 | 0.99% | 6.02% | 1.07% | 5.95% | 0.00% |
The accompanying notes to the financial statements are an integral part of this schedule.
|
15
ADDITIONAL INFORMATION
(unaudited)
|
PROXY VOTING
The policies and procedures that the Trust uses to determine how to vote proxies relating to portfolio securities are attached to the Trust’s Statement of Additional Information. You may request a free copy of the Statement of Additional Information or the report of how the Trust voted proxies relating to portfolio securities during the most recent 12-month period ended June 30 by calling 800-947-4836. You also may review the Statement of Additional Information or the report of how the Trust voted proxies relating to portfolio securities during the most recent 12-month period ended June 30 at the Thrivent Financial web site (www.thrivent.com) or the SEC web site (www.sec.gov).
QUARTERLY SCHEDULE OF PORTFOLIO HOLDINGS
|
The Trust files its Schedule of Portfolio Holdings on Form N-Q with the SEC for the first and third quarters of each fiscal year. You may request a free copy of the Trust’s Forms N-Q by calling 1-800-947-4836. The Trust’s Forms N-Q also are available on the Thrivent Financial web site (www.thrivent.com) or the SEC web site (www.sec.gov). You also may review and copy the Forms N-Q for the Trust at the SEC’s Public Reference Room in Washington, DC. You may get information about the operation of the Public Reference Room by calling 1-800-SEC-0330.
16
BOARD OF TRUSTEES AND OFFICERS
|
The following table provides information about the Trustees and Officers of the Funds.
EACH TRUSTEE OVERSEES EACH OF 30 SERIES OF THE TRUST AND ALSO SERVES AS:
• DIRECTOR OF THRIVENT SERIES FUND, INC., A REGISTERED INVESTMENT COMPANY CONSISTING OF 31 PORTFOLIOS |
| THAT SERVE AS UNDERLYING FUNDS FOR VARIABLE CONTRACTS ISSUED BY THRIVENT FINANCIAL FOR LUTHERANS |
| ("THRIVENT FINANCIAL") AND THRIVENT LIFE INSURANCE COMPANY ("TLIC") AND INVESTMENT OPTIONS IN THE |
| RETIREMENT PLAN OFFERED BY THRIVENT FINANCIAL. |
| |
• TRUSTEE OF THRIVENT FINANCIAL SECURITIES LENDING TRUST, A REGISTERED INVESTMENT COMPANY CONSISTING OF |
| ONE PORTFOLIO THAT SERVES AS A CASH COLLATERAL FUND FOR A SECURITIES LENDING PROGRAM SPONSORED BY |
| THRIVENT FINANCIAL. |
THE 30 SERIES OF THE TRUST, 31 PORTFOLIOS OF THRIVENT SERIES FUND, INC., AND THRIVENT FINANCIAL SECURITIES LENDING TRUST ARE REFERRED TO HEREIN AS THE "FUND COMPLEX." THE STATEMENT OF INFORMATION INCLUDES ADDITIONAL INFORMATION ABOUT THE TRUSTEES AND IS AVAILABLE, WITHOUT CHARGE, BY CALLING 1-800-847-4836.
| | | Number of | | |
| | | Portfolios | | |
| | Position | in Fund | | |
| | with Trust | Complex | | |
| Name, Address | and Length | Overseen by | Principal Occupation | Other Directorships |
| and Age | of Service(2) | Trustee | During the Past 5 Years | Held by Trustee |
|
| Pamela J. Moret | President since | 62 | Executive Vice President, | Director, Lutheran World Relief; |
| 625 Fourth | 2002 and Trustee | | Marketing and Products, | Director, Minnesota Public Radio |
| Avenue South | since 2004 | | Thrivent Financial since 2002; | |
| Minneapolis, MN | | | Senior Vice President, Products, | |
| Age 49 | | | American Express Financial | |
| | | | Advisors from 2000 to 2001; | |
| | | | Vice President, Variable Assets, | |
| | | | American Express Financial | |
| | | | Advisors from 1996 to 2000 | |
17
| INDEPENDENT TRUSTEES(3) | | | |
|
| |
| | | Number of | | |
| | Position with | Portfolios in | | |
| | Trust and | Fund Complex | | |
| Name, Address | Length of | Overseen by | Principal Occupation | Other Directorships Held |
| and Age | Service(2) | Trustee | During the Past 5 Years | by Trustee |
|
| F. Gregory | Trustee since | 62 | President, Carthage College | Director, National Association of |
| Campbell | 1992 | | | Independent Colleges and |
| 625 Fourth | | | | Universities, Director, Johnson |
| Avenue South | | | | Family Funds, Inc., an investment |
| Minneapolis, | | | | company consisting of four |
| MN | | | | portfolios; Director, Kenosha |
| Age 65 | | | | Hospital and Medical Center Board; |
| | | | | Prairie School Board; United Health |
| | | | | Systems Board |
|
| Herbert F. | Lead Trustee | 62 | Management consultant to | None |
| Eggerding, Jr. | since 2003 | | several privately owned | |
| 625 Fourth | | | companies | |
| Avenue South | | | | |
| Minneapolis, | | | | |
| MN | | | | |
| Age 68 | | | | |
|
| Noel K. Estenson | Trustee since | 62 | Retired | None |
| 625 Fourth | 2004 | | | |
| Avenue South | | | | |
| Minneapolis, | | | | |
| MN | | | | |
| Age 66 | | | | |
|
| Richard L. Gady | Trustee since | 62 | Retired; previously Vice | Director, International Agricultural |
| 625 Fourth | 1987 | | President, Public Affairs and | Marketing Association |
| Avenue South | | | Chief Economist, Conagra, | |
| Minneapolis, | | | Inc. (agribusiness) | |
| MN | | | | |
| Age 62 | | | | |
|
| |
| Richard A. | Trustee since | 62 | President, National Legal | Director, The Washington Hospital |
| Hauser | 2004 | | Center for the Public | Center |
| 625 Fourth | | | Interest, since 2004; General | |
| Avenue South | | | Counsel, U.S. Department of | |
| Minneapolis, | | | Housing and Urban | |
| MN | | | Development, 2001- | |
| Age 62 | | | 2004;Partner, Baker & | |
| | | | Hosteller, 1986-2001 | |
|
| Connie M. Levi | Trustee since | 62 | Retired | Director, Norstan, Inc. |
| 625 Fourth | 2004 | | | |
| Avenue South | | | | |
| Minneapolis, | | | | |
| MN | | | | |
| Age 66 | | | | |
|
| |
| Edward W. | Chairman and | 62 | Retired�� | Chairman of Carthage College |
| Smeds | Trustee since | | | Board |
| 625 Fourth | 1999 | | | |
| Avenue South | | | | |
| Minneapolis, | | | | |
| MN | | | | |
| Age 69 | | | | |
18
| EXECUTIVE OFFICERS | | |
|
| |
| | Position with Trust and Length | Principal Occupation |
| Name, Address and Age | of Service(2) | During the Past 5 Years |
|
| |
| Pamela J. Moret | President since 2002 | Executive Vice President, Marketing and Products, |
| 625 Fourth Avenue South | | Thrivent Financial since 2002; Senior Vice President, |
| Minneapolis, MN | | Products, American Express Financial Advisors from 2000 |
| Age 49 | | to 2001; Vice President, Variable Assets, American Express |
| | | Financial Advisors from 1996 to 2000 |
|
| |
| James M. Odland | Secretary and Chief Legal Officer since | Vice President, Office of the General Counsel, Thrivent |
| 625 Fourth Avenue South | 2005 | Financial for Lutherans, since 2005; Senior Securities |
| Minneapolis, MN | | Counsel, Allianz Life Insurance Company from January |
| Age 50 | | 2005 to August 2005; Vice President and Chief Legal |
| | | Officer, Woodbury Financial Services, Inc., from |
| | | September 2003 to January 2005; Vice President and |
| | | Group Counsel, Corporate Practice Group, American |
| | | Express Financial Advisors, Inc., from 2001 to 2003 |
|
| Katie S. Kloster | Vice President and Chief Compliance | Vice President and Rule 38a-1 Chief Compliance Officer, |
| 625 Fourth Avenue South | Officer since 2004 | since 2004; previously Vice President and Comptroller of |
| Minneapolis, MN | | Thrivent Financial |
| Age 40 | | |
|
| Gerard V. Vaillancourt | Treasurer and Principal Financial Officer | Head of Mutual Fund Accounting, Thrivent Financial |
| 625 Fourth Avenue South | since 2005 | since 2005; Director, Fund Accounting Administration, |
| Minneapolis, MN | | Thrivent Financial from 2002 to 2005; Manager, Portfolio |
| Age 38 | | Compliance, Lutheran Brotherhood from 2001 to 2002; |
| | | Manager Fund Accounting, Minnesota Life from 2000 to |
| | | 2001 |
|
| Russell W. Swansen | Vice President since 2004 | Senior Vice President and Chief Investment Officer, |
| 625 Fourth Avenue South | | Thrivent Financial, since 2004; Managing Director, |
| Minneapolis, MN | | Colonade Advisors, LLC, from 2001 to 2003, President |
| Age 48 | | and Chief Investment Officer of PPM American from |
| | | 1999 to 2000 |
|
| Nikki L. Sorum | Vice President since 2004 | Senior Vice President, Business Development, Thrivent |
| 625 Fourth Avenue South | | Financial, since 2002; previously Senior Vice President, |
| Minneapolis, MN | | RBC Dain Rauscher |
| Age 44 | | |
|
| Janice M. Guimond | Vice President since 2005 | Vice President, Investment Operations, Thrivent Financial |
| 625 Fourth Avenue South | | since 2004; Manager of Portfolio Reporting, Thrivent |
| Minneapolis, MN | | Financial 2003 to 2004; Independent Consultant 2001 to |
| Age 42 | | 2003; Vice President, Director of Technology, Investment |
| | | Advisers, Inc. 1999 to 2000; Vice President, Investment |
| | | Systems & Services, Investment Advisers, Inc. 1997 to |
| | | 1999 |
|
| Marnie L. Loomans-Thuecks | Vice President since 2004 | Vice President, Customer Interaction Department, |
| 4321 North Ballard Road | | Thrivent Financial |
| Appleton, WI | | |
| Age 42 | | |
|
| Thomas R Mischka | Vice President and Anti-Money | Vice President of Divisional Support Services, Thrivent |
| 4321 North Ballard Road | Laundering Officer since 2003 | Financial |
| Appleton, WI | | |
| Age 46 | | |
|
| Sandra A. Diedrick | Assistant Vice President and Assistant | Director, Interaction Center, Thrivent Financial |
| 4321 North Ballard Road | Secretary since 2004 | |
| Appleton, WI | | |
| Age 54 | | |
19
| Kenneth L. Kirchner | Assistant Vice President and Assistant | Director, Transfer Agency Operations, Thrivent Financial |
| 4321 North Ballard Road | Secretary since 2004 | |
| Appleton, WI | | |
| Age 39 | | |
|
| |
| David R. Spangler | Assistant Vice President since 2004 | Director, of Investment Product Management, Thrivent |
| 625 Fourth Avenue South | | Financial since 2002; Vice President- Product |
| Minneapolis, MN | | Development, Wells Fargo Bank-Funds Management |
| Age 38 | | Group, from 2000 to 2002; Analyst, MCSI, Inc., 2000 |
|
| John C. Bjork | Assistant Secretary since 2003 | Senior Counsel, Thrivent Financial |
| 625 Fourth Avenue South | | |
| Minneapolis, MN | | |
| Age 52 | | |
|
| |
| Marlene J. Nogle | Assistant Secretary since 2003 | Senior Counsel, Thrivent Financial |
| 625 Fourth Avenue South | | |
| Minneapolis, MN | | |
| Age 58 | | |
|
| |
| |
| Todd J. Kelly | Assistant Treasurer since 1999 | Director, Fund Accounting Operations, Thrivent |
| 4321 North Ballard Road | | Financial |
| Appleton, WI | | |
| Age 36 | | |
(1)"Interested person" of the Trust as defined in the Investment Company Act of 1940 by virtue of positions with Thrivent Financial. Ms. Moret is considered an interested person because of her principal occupation with Thrivent Financial.
(2)Each Trustee serves an indefinite term until her or his successor is duly elected and qualified. The bylaws of the Trust provide that each Trustee must retire at the end of the year in which the Trustee attains age 70. Officers serve at the discretion of the board until their successors are duly appointed and qualified.
(3)The Trustees other than Ms. Moret are not "interested persons" of the Trust and are referred to as "Independent Trustees."
20
THRIVENT MUTUAL FUNDS
| Supplement to Prospectus dated February 28, 2005 |
| Regarding |
| Thrivent U.S. Government Zero Coupon Target Fund, Series 2006 |
The “Portfolio Manager” section on page 4 of the prospectus is amended to read as follows: |
Mark L. Simenstad serves as portfolio manager of the Fund. Mr. Simenstad has been with Thrivent |
| Investment Mgt. since 1999. |
The date of this Supplement is November 2, 2005. |
| |
| Please include this Supplement with your Prospectus. |
21
This page intentionally left blank.
22
This page intentionally left blank.
23
We’re Listening to You!
In response to shareholder concerns regarding multiple mailings, we are sending one annual report and one prospectus for the Fund to each household. This consolidation helps reduce printing and postage costs, thereby saving shareholders’ money. If you wish to receive an additional copy of this report, call us toll free at (800) 847-4836.
This report is submitted for the information of shareholders of Thrivent Mutual Funds. It is not authorized for distribution to prospective investors unless preceded or accompanied by the current prospectus for Thrivent Mutual Funds, which contains more complete information about the Funds, including investment policies, charges and expenses.

23461AR N12-05
24
Item 2. Code of Ethics
As of the end of the period covered by this report, registrant has adopted a code of ethics (as defined in Item 2 of Form N-CSR) applicable to registrant's Principal Executive Officer, Principal Financial Officer, and Principal Accounting Officer. No waivers were granted to such code of ethics during the period covered by this report. However, during the period covered by this report, such code of ethics was amended to (a) reflect the new names of registrant and its affiliated investment company; (b) add the name of a newly-created affiliated investment company as being covered by such code: and (c) permit the Chief Legal Officer to keep copies of the records required to be kept under such code. A copy of this code of ethics is filed as an exhibit to this Form N-CSR.
Item 3. Audit Committee Financial Expert
Registrant's Board of Trustees has determined that Herbert F. Eggerding, Jr., an independent trustee, is the Audit Committee Financial Expert.
Item 4. Principal Accountant Fees and Services
(a) Audit Fees
The aggregate fees billed by registrant's independent public accountants, PricewaterhouseCoopers LLP ("PwC"), for the fiscal year ended April 30, 3004, the fiscal period ended October 31, 2004, and the fiscal year ended October 31, 2005, for professional services rendered in connection with the audit of registrant's annual financial statements or services that are normally provided by the accountant in connection with statutory and regulatory filings or engagements were $220,000, $308,600, and $417,660, respectively.
(b) Audit-Related Fees
The aggregate fees PwC billed to registrant for the fiscal year ended April 30, 3004, the fiscal period ended October 31, 2004, and the fiscal year ended October 31, 2005, for assurance and other services which are reasonably related to the performance of registrant's audit and are not reported under Item 4(a) were $0 each of the respective periods. The aggregate fees PwC billed to registrant's investment adviser and any entity controlling, controlled by, or under common control with registrant's investment adviser for the fiscal year ended April 30, 3004, the fiscal period ended October 31, 2004, and the fiscal year ended October 31, 2005, for assurance and other services directly related to the operations and financial reporting of registrant were $0 for each of the respective periods.
(c) Tax Fees
The aggregate tax fees PwC billed to registrant for the fiscal year ended April 30, 3004, the fiscal period ended October 31, 2004, and the fiscal year ended October 31, 2005, for tax compliance, tax advice, and tax planning services were $92,500, $60,700, and $135,325, respectively. The aggregate tax fees PwC billed to registrant's investment adviser and any entity controlling, controlled by, or under common control with registrant's investment adviser for the fiscal year ended April 30, 3004, the fiscal period ended October 31, 2004, and the fiscal year ended October 31, 2005, for services directly related to the operations and financial reporting of registrant were $0 for each of the respective periods.
(d) All Other Fees
The aggregate fees PwC billed to registrant for the fiscal year ended April 30, 3004, the fiscal period ended October 31, 2004, and the fiscal year ended October 31, 2005, for products and services provided other than the services reported in paragraphs (a) through (c) of this item were $0 for each of the respective periods. The aggregate fees PwC billed to registrant's investment adviser and any entity controlling, controlled by, or under common control with registrant's investment adviser for the fiscal year ended April 30, 3004, the fiscal period ended October 31, 2004, and the fiscal year ended October 31, 2005, for products and services provided other than the services reported in paragraphs (a) through (c) of this item were $0, $56,415, and $44,431, respectively.
(e) Registrant's audit and compliance committee charter, adopted in August 2004, provides that the audit and compliance committee (comprised of the independent directors of registrant) is responsible for pre-approval of all auditing services performed for the registrant. The audit and compliance committee reports to the Board of Directors ("Board") regarding its approval of the engagement of the auditor and the proposed fees for the engagement, and the majority of the Board (including the members of the Board who are independent directors) must approve the auditor at an in-person meeting. The audit and compliance committee also is responsible for pre-approval (subject to the de minimus exceptions for non-audit services described in
Section 10A(i)(1)(B) of the Securities Exchange Act of 1934, as amended) of all non-auditing services performed for the registrant or for any service affiliate of registrant. Registrant's audit and compliance committee charter also permits a designated member of the audit and compliance committee to pre-approve, between meetings, one or more non-audit service projects, subject to ratification by the audit and compliance committee at the next meeting of the audit and compliance committee. Registrant's audit and compliance committee pre-approved all fees described above which PwC billed to registrant.
(f) Less than 50% of the hours billed by PwC for auditing services to registrant for the fiscal year ended October 31, 2005, were for work performed by persons other than full-time, permanent employees of PwC.
(g) The aggregate non-audit fees billed by PwC to registrant and to registrant's investment adviser and any entity controlling, controlled by, or under common control with registrant's investment adviser for the fiscal year ended April 30, 3004, the fiscal period ended October 31, 2004, and the fiscal year ended October 31, 2005, were $0 for each of the respective periods.
(h) Registrant's audit and compliance committee has considered the non-audit services provided to the registrant and registrant's investment adviser and any entity controlling, controlled by, or under common control with registrant's investment adviser as described above and determined that these services do not compromise PwC's independence.
Item 5. Audit Committee of Listed Registrants
Not applicable.
Item 6. Schedule of Investments
Registrant's Schedule of Investments is included in the report to shareholders filed under Item 1.
Item 7. Disclosure of Proxy Voting Policies and Procedures for
Closed-End Management Investment Companies
Not applicable.
Item 8. Portfolio Managers of Closed-End Management Investment Companies
Not applicable.
Item 9. Purchases of Equity Securities by Closed-End Management Investment Company and Affiliated Purchasers.
Not applicable.
Item 10. Submission of Matters to a Vote of Security Holders
There have been no material changes to the procedures by which shareholders may recommend nominees to registrant's board of trustees.
Item 11. Controls and Procedures
(a)(i) Registrant's President and Treasurer have concluded that registrant's disclosure controls and procedures (as defined in Rule 30a-3(c) under the Investment Company Act) are effective, based on their evaluation of these controls and procedures as of a date within 90 days of the filing date of this report.
(a)(ii) There has been no change in registrant's internal controls over financial reporting (as defined in Rule 30a-3(d) under the Investment Company Act) that occurred during registrant’s most recent fiscal quarter that has materially affected, or is reasonably likely to materially affect, registrant's internal control over financial reporting.
Item 12. Exhibits
(a) The code of ethics pursuant to Item 2 is attached hereto.
(b) Certifications pursuant to Rules 30a-2(a) and 30a-2(b) under the Investment Company Act of 1940 are attached hereto.
SIGNATURES
Pursuant to the requirements of the Securities Exchange Act of 1934 and the Investment Company Act of 1940, the registrant has duly caused this report to be signed on its behalf by the undersigned, thereunto duly authorized.
Date: December 29, 2005
THRIVENT MUTUAL FUNDS
By: /s/ Pamela J. Moret
Pamela J. Moret
President
Pursuant to the requirements of the Securities Exchange Act of 1934 and the Investment Company Act of 1940, this report has been signed below by the following persons on behalf of the registrant and in the capacities and on the dates indicated.
Date: December 29, 2005
By: /s/ Pamela J. Moret
Pamela J. Moret
President
Date: December 29, 2005
By: /s/ Gerard V. Vaillancourt
Gerard V. Vaillancourt
Treasurer