UNITED STATES
SECURITIES AND EXCHANGE COMMISSION
Washington, D.C. 20549
FORM N-CSR
CERTIFIED SHAREHOLDER REPORT OF REGISTERED MANAGEMENT INVESTMENT
COMPANIES
Investment Company Act file number: 811-05075
Thrivent Mutual Funds
(Exact name of registrant as specified in charter)
625 Fourth Avenue South
Minneapolis, Minnesota 55415
(Address of principal executive offices) (Zip code)
Rebecca A. Paulzine
625 Fourth Avenue South
Minneapolis, Minnesota 55415
(Name and address of agent for service)
Registrant’s telephone number, including area code: (612) 844-5168
Date of fiscal year end: October 31
Date of reporting period: October 31, 2012
Item 1. Report to Stockholders

Table of Contents
The fiscal year ended October 31, 2012, was productive for investors, with virtually every major asset class generating positive returns. Markets performed well despite continued sluggish economic growth and some growing worries about federal tax and spending policies.
Economic Review
The U.S. economy continued to grow at a slow pace during the 12-month reporting period, backstopped by a Federal Reserve that kept interest rates at extraordinarily low levels to lower borrowing costs and stimulate spending. The economy advanced enough to encourage optimists, but never achieved the momentum that would be needed to put the 2007-2009 recession finally and fully in the rearview mirror.
U.S. gross domestic product—the total of all goods and services produced—grew at an estimated 2.7% annual rate in the third quarter of 2012, according to the Bureau of Labor Statistics, driven largely by personal consumption. That was about in line with the average rate of growth for the 12-month period ending that quarter, and marked the 13th consecutive quarter that the U.S. economy expanded. Still, 2.7% is less than the 4% rate that would be needed to close, over a three-year period, the gap between what the economy is producing today and what it could be producing if the recession had not occurred.
Economic growth has proved insufficient to replace all the jobs lost during the recession. The U.S. has created more than 3 million net new jobs since the downturn ended, and more than 4.5 million since March 2010, when the numbers first started turning positive again. But even that bigger number is only about half the number of jobs lost from 2008 through early 2010. Accordingly, unemployment remains high. It stood at 7.9% in October 2012, down from a peak of 10.1% in October 2009, but still well above its historical average. Persistent high unemployment is the reason many people continue to say they feel like the country remains in an economic downturn even though it is not.
One factor keeping unemployment high is the continued reluctance on the part of businesses to invest in their operations. Domestic investment, largely by businesses, is usually one of the main drivers of economic growth during a recovery, along with personal consumption. But domestic investment stagnated over the course of the reporting period. Business leaders blamed uncertainty about the direction of federal taxing and spending policies and about whether the health care mandates required by the Patient Protection and Affordable Care Act would actually be implemented. Governor Mitt Romney, the Republican candidate for president in 2012, had campaigned, in part, on a vow to repeal the health care law. On November 6, he lost the election to President Obama, the law’s architect.
Uncertainty in the business community was exacerbated by worries about the impending fiscal cliff—the $1.2 trillion in automatic spending cuts over the next decade that are scheduled to take effect beginning on January 1, 2013, along with a series of automatic tax increases. That uncertainty extended from CEOs of Fortune 500 companies to entrepreneurs running small businesses. An October survey of the latter by the National Federation of Independent Business found that only 7% considered it a good time to be expanding their operations.
Europe and China also are important to the U.S. economy, with the companies in the S&P 500 stock index generating about 40% of their profits internationally. Europe accounts for the largest share and Asia, mainly in the form of China, the next biggest share. Much of Europe slipped into a recession during the reporting period as several of its southernmost members continued to wrestle with crushing debt woes. China grew strongly by international standards—its gross domestic product expanded at a 7.4% rate in the third quarter—but slowly in comparison to the 10% gains it averaged over most of the past three decades.
Market Review
Stock and bond markets both performed well during the 12-month reporting period, bolstered by relatively strong corporate profits and the Federal Reserve’s continued accommodative monetary stance.
The S&P 500, an index of large-company stocks, posted a total return of 15.2%. The Russell 2000 index, which tracks small-company shares, generated a total return of 12.08%. Value stocks—those perceived to be trading below their intrinsic worth based on sales, profits, dividends and other fundamental factors—broadly outperformed growth stocks. Investors worried about the economy and the corporate-profit outlook apparently concluded that value stocks would be better-positioned to weather any coming storm.
International stocks lagged their U.S. counterparts, reflecting the weak economic environment in Europe and the slowing growth in China. The MSCI All Country World Index, excluding the U.S., generated a total return of 4.48%.
In the fixed-income markets, the Fed’s accommodative monetary policy was favorable for bonds across the credit spectrum. High-yield bonds were the standout performers, as strong corporate profits depressed default risk and emboldened investors attracted to the higher yields available on those securities relative to investment-grade bonds. While the broad-based Barclays U.S. Aggregate Bond Index generated a total return of 5.25%, the Barclays U.S. Corporate High Yield Bond Index posted a total return of 13.61%.
2
Municipal bonds also performed well as prior concerns about potential defaults in that sector eased against the backdrop of slow but steady economic growth. The Barclays Municipal Bond Index generated a total return of 9.03%.
Treasury bonds remained a safe haven for the most-cautious investors, but high valuations at the start of the reporting period left them with little room for additional price appreciation. The Barclays U.S. Treasury Index posted a total return of 3.66%.
Our Outlook
The U.S. economy may no longer be in a recession, but it remains in the shadow of one, and we expect that to present a challenge to financial markets heading into the new year—especially if, as is widely expected, corporate profits begin to soften.
While stock prices have recovered much of what they lost during the 2007-2009 downturn, they remain below their pre-crash peak and continue to exhibit high levels of volatility. Their performance in the year ahead—and to some extent the performance of the bond market—will depend to a large degree on how much success Congress and the president have in their efforts to reach agreement on new tax and spending policies.
Businesses and investors had been hoping the election would bring new accord to Washington and greater clarity on fiscal policy, but the outcome produced little change, at least on the surface. Democrats retained control of the White House and the Senate, while Republicans retained control of the House of Representatives.
In the weeks immediately following the election, policymakers on both sides of the political aisle were looking for agreement on policy that could keep the country from edging over the fiscal cliff, which government economists have warned would plunge the U.S. back into a recession.
It was not unreasonable to think policymakers might agree on a short-term plan to defer some, if not most, of the automatic spending cuts and tax increases, and then spend much of 2013 trying to come up with more permanent reforms.
Potentially complicating their efforts—or perhaps adding to their incentive to get something done—the federal government was scheduled to bump up against its debt ceiling around the end of 2012. The government would need approval from Congress to raise that ceiling and continue to meet its debt obligations. Credit-rating agencies had already warned that failure on either front—the deficit or the debt ceiling—could lead to another downgrade of the federal government’s debt rating, a rare event that happened for the first time in 2011 when Congress last wrangled over the debt ceiling.
If Congress and the White House can agree on a new tax-and-spend policy—one that begins to whittle away at the country’s debt—they could erase much of the uncertainty that has been constraining business investment. That could lead to a surge in stock prices. The challenge for investors will be to ride out the uncertainty and market volatility that is likely to persist until and if such a resolution materializes.
If you are uncertain about how your portfolio is positioned to weather the months ahead, we encourage you to meet with your Thrivent Financial representative. He or she can help you set an asset allocation policy and choose investments that are appropriate for your goals and your tolerance for risk.
As always, thank you for the trust you have placed with our entire team of Thrivent Financial investment professionals.
Sincerely,

Russell W. Swansen
President and Chief Investment Officer
Thrivent Mutual Funds
3
Thrivent Aggressive Allocation Fund
Russell W. Swansen, David C. Francis, CFA and Mark L. Simenstad, CFA, Portfolio Co-Managers
The Fund seeks long-term capital growth.
The Fund’s performance depends upon how its assets are allocated across broad asset categories and applicable sub-classes within such categories. Some broad asset categories and sub-classes may perform below expectations or below the securities markets generally over short or extended periods. Another risk of investing in the Fund is that its performance is dependent upon the performance of the underlying asset classes in which it invests. As a result, the Fund is subject to the same risks as those faced by the underlying asset classes. These and other risks are described in the Fund’s prospectus. Views expressed in this discussion of fund performance are the views of this particular Fund’s portfolio management team.
How did the Fund perform during the 12-month period ended October 31, 2012?
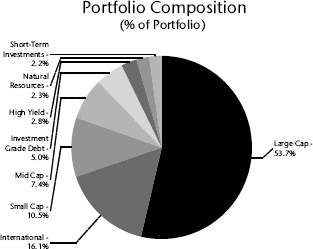
Thrivent Aggressive Allocation Fund earned a return of 8.42%, compared with the median return of its peer group, the Lipper Multi-Cap Core Funds category, of 10.98%. The Fund’s market benchmarks, the S&P 500 Index and the Barclays U.S. Aggregate Bond Index, earned returns of 15.21% and 5.25%, respectively.
What factors affected the Fund’s performance?
Performance in the Fund was limited by a combination of asset allocation decisions as well as security selection impacts in some of the equity portfolios. Fixed-income results were either in line with or ahead of their respective performance benchmarks.
A key factor in the relative performance versus our peers and the S&P 500 Index was our exposure to the international markets as reflected in our specific holdings of the Thrivent Partner Worldwide Allocation Fund. While that Fund outperformed both its benchmark and its peers, the category underperformed domestic indexes by a significant margin owing to particular weakness in the euro area and emerging markets.
Additionally, our small- and mid-cap stock managers generally did not perform in-line with their benchmarks, and their categories did not perform as well as the S&P 500 Index. Early in the period, we were underweighted in our target equity exposure as we were concerned that a lack of progress on fiscal and policy issues both in Europe and domestically would impair the recovery and negatively impact risk assets. While those uncertainties remain, monetary authorities have taken steps that, at least in the short term, have supported risk asset prices at levels that were unlikely to have been achieved otherwise.
A final factor is our exposure to fixed income, which averaged around 9% over the period. We are rated in an equity-only category, and while our fixed-income managers and assets performed well relative to their categories, the asset class did not keep pace with domestic equity markets.
What is your outlook?
Fiscal and policy risks remain high, but monetary authorities have expressed and interest or acted in unconventional ways to support the economic expansion and asset prices. In the absence of a severe policy mistake, risk asset prices are likely to see further advances but at reduced levels versus early in the recovery.
For domestic stocks, we believe that earnings will continue to be the key driver. Profit margins seem unusually high and further expansion is unlikely to be a driver of above-average earnings growth going forward. While equity valuations are not high, they are full and require continued progress in resolving fiscal issues both domestically and abroad without impairing what most would agree is a below-average recovery.
| | | | |
| Top 10 Holdings | |
| (% of Net Assets) | |
Thrivent Partner Worldwide Allocation Fund | | | 15.4 | % |
Thrivent Partner Small Cap Growth Fund | | | 8.0 | % |
Thrivent Large Cap Growth Fund | | | 6.8 | % |
Thrivent Mid Cap Growth Fund | | | 6.0 | % |
Thrivent Large Cap Value Fund | | | 5.8 | % |
Thrivent Mid Cap Stock Fund | | | 5.3 | % |
Thrivent Partner Mid Cap Value Fund | | | 3.6 | % |
Thrivent Large Cap Stock Fund | | | 3.4 | % |
Thrivent High Yield Fund | | | 2.8 | % |
Thrivent Small Cap Stock Fund | | | 2.8 | % |
These securities represent 59.9% of the total net assets of the Fund.
Quoted Fund performance is for Class A shares and does not reflect a sales charge.
The returns shown do not reflect taxes a shareholder would pay on distributions or redemptions.
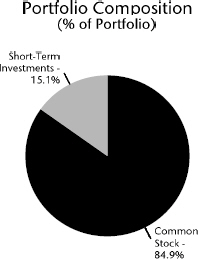
Portfolio Composition illustrates market exposure of all asset classes, including derivatives.
The list of Top 10 Holdings excludes short-term investments.
Quoted Portfolio Composition and Top 10 Holdings are subject to change.
4
The challenge for the markets will be to continue to perform well in an environment characterized by unusually active policy choices and uneven growth. We are modestly optimistic that will be the case but remain alert for changes in the environment.
Portfolio Facts
As of October 31, 2012
| | | | | | | | |
| | | Class A | | | Institutional Class | |
Ticker | | | TAAAX | | | | TAAIX | |
Transfer Agent ID | | | 038 | | | | 468 | |
Net Assets | | | $494,277,313 | | | | $81,205,588 | |
NAV | | | $11.54 | | | | $11.64 | |
NAV - High† | | | 9/14/2012 - $11.98 | | | | 9/14/2012 - $12.07 | |
NAV - Low† | | | 11/25/2011 - $9.84 | | | | 11/25/2011 - $9.91 | |
Number of Holdings: 249 | | | | | | | | |
† | For the year ended October 31, 2012 |
Average Annual Total Returns1
As of October 31, 2012
| | | | | | | | | | | | |
Class A2 | | 1-Year | | | 5 Years | | | From
Inception
6/30/2005 | |
without sales charge | | | 8.42 | % | | | -0.90 | % | | | 4.27 | % |
with sales charge | | | 2.48 | % | | | -2.02 | % | | | 3.47 | % |
| | | |
Institutional Class3 | | 1-Year | | | 5 Years | | | From
Inception
6/30/2005 | |
Net Asset Value | | | 8.94 | % | | | -0.54 | % | | | 4.66 | % |
1 | Past performance is not an indication of future results. Average annual total returns represent past performance and reflect changes in share prices, the reinvestment of all dividends and capital gains, and the effects of compounding. The prospectus contains more complete information on the investment objectives, risks, charges and expenses of the investment company, which investors should read and consider carefully before investing. To obtain a prospectus, contact a registered representative or visit www.thrivent.com. At various times, the Fund’s adviser waived its management fee and/or reimbursed Fund expenses. Had the adviser not done so, the Fund’s total returns would have been lower. The returns shown do not reflect taxes a shareholder would pay on distributions or redemptions. Total investment return and principal value of your investment will fluctuate, and your shares, when redeemed, may be worth more or less than their original cost. Current performance may be higher or lower than the performance data quoted. Call 800-THRIVENT or visit www.thrivent.com for performance results current to the most recent month-end. |
2 | Class A performance with sales charge reflects the maximum sales charge of 5.5%. |
3 | Institutional Class shares have no sales load and are for institutional shareholders only. |
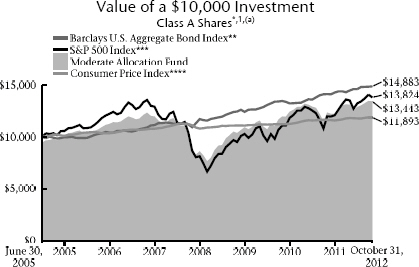
(a) | Performance of other classes will be greater or less than the line shown based on the differences in loads and fees paid by shareholders investing in the different classes. |
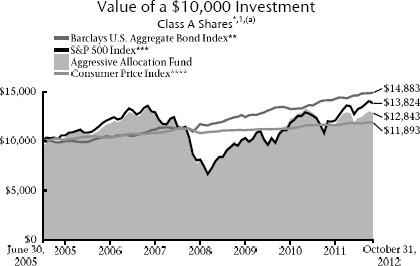
* | As you compare performance, please note that the Fund’s performance reflects the maximum 5.5% sales charge, while the Consumer Price Index, the S&P 500 Index and the Barclays U.S. Aggregate Bond Index do not reflect any such charges. If you were to purchase any of the above individual securities represented in those Indexes, any charges you would pay would reduce your total return as well. |
** | The Barclays U.S. Aggregate Bond Index is an index that measures the performance of U.S. investment grade bonds. It is not possible to invest directly in the Index. The performance of the Index does not reflect deductions for fees, expenses or taxes. |
*** | The S&P 500 Index is an index that represents the average performance of a group of 500 widely held, publicly traded stocks. “S&P 500®” is a trademark of The McGraw-Hill Companies, Inc. and has been licensed for use by Thrivent Financial for Lutherans. The product is not sponsored, endorsed or promoted by Standard & Poor’s and Standard & Poor’s makes no representation regarding the advisability of investing in the product. It is not possible to invest directly in the Index. The performance of the Index does not reflect deductions for fees, expenses or taxes. |
**** | The Consumer Price Index is an inflationary indicator that measures the change in the cost of a fixed basket of products and services, including housing, electricity, food and transportation. It is not possible to invest directly in the Index. |
5
Thrivent Moderately Aggressive Allocation Fund
Russell W. Swansen, David C. Francis, CFA and Mark L. Simenstad, CFA, Portfolio Co-Managers
The Fund seeks long-term capital growth.
The Fund’s performance depends upon how its assets are allocated across broad asset categories and applicable sub-classes within such categories. Some broad asset categories and sub-classes may perform below expectations or below the securities markets generally over short or extended periods. Another risk of investing in the Fund is that its performance is dependent upon the performance of the underlying asset classes in which it invests. As a result, the Fund is subject to the same risks as those faced by the underlying asset classes. These and other risks are described in the Fund’s prospectus. Views expressed in this discussion of fund performance are the views of this particular Fund’s portfolio management team.
How did the Fund perform during the 12-month period ended October 31, 2012?
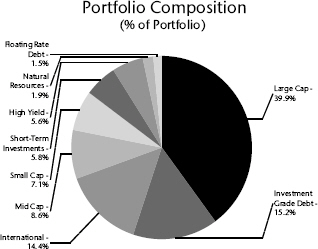
Thrivent Moderately Aggressive Allocation Fund earned a return of 8.92%, compared with the median return of its peer group, the Lipper Mixed-Asset Target Allocation Growth Funds category, of 9.67%. The Fund’s market benchmarks, the S&P 500 Index and the Barclays U.S. Aggregate Bond Index, earned returns of 15.21% and 5.25%, respectively.
What factors affected the Fund’s performance?
Performance in the Fund was limited by a combination of asset allocation decisions as well as security selection impacts in some of the equity portfolios. Fixed-income results were either in-line with or ahead of their respective performance benchmarks.
Our small- and mid-cap stock managers generally did not perform in-line with their benchmarks, and their categories did not perform as well as the S&P 500 Index. The former factor limited our returns while the latter was less of a factor owing to our reduction in exposure to mid and small caps in favor of more exposure to large-capitalization companies.
Another factor was that, early in the period, we were underweighted in our target equity exposure as we were concerned that a lack of progress on fiscal and policy issues both in Europe and domestically would impair the recovery and negatively impact risk assets. While those uncertainties remain, monetary authorities have taken steps that, at least in the short term, have supported risk asset prices at levels that were unlikely to have been achieved otherwise.
Our exposure to fixed income, which averaged around 24% over the period, was additive to results as our fixed-income managers and assets performed well relative to their categories. That said, the fixed-income asset class, while generally providing positive returns, did not keep pace with the returns seen in large-cap domestic equity markets.
What is your outlook?
Fiscal and policy risks remain high, but monetary authorities have expressed an interest or acted in unconventional ways to support the economic expansion and asset prices. In the absence of a severe policy mistake, risk asset prices are likely to see further advances but at reduced levels versus early in the recovery.
For domestic stocks, earnings will continue to be the key driver. We feel that profit margins seem unusually high and further expansion is unlikely to be a driver of above-average earnings growth going forward. While equity valuations are not high, they are full and require continued progress in resolving fiscal issues both domestically and abroad without impairing what most would agree is a below-average recovery. Emerging market growth has slowed to more sustainable levels as well.
| | | | |
| Top 10 Holdings | |
| (% of Net Assets) | |
Thrivent Partner Worldwide Allocation Fund | | | 12.6 | % |
Thrivent Large Cap Value Fund | | | 8.1 | % |
Thrivent Income Fund | | | 6.5 | % |
Thrivent Large Cap Growth Fund | | | 6.2 | % |
Thrivent Large Cap Stock Fund | | | 5.8 | % |
Thrivent Mid Cap Stock Fund | | | 4.9 | % |
Thrivent High Yield Fund | | | 4.0 | % |
Thrivent Partner Mid Cap Value Fund | | | 3.4 | % |
Thrivent Partner Small Cap Growth Fund | | | 3.0 | % |
Thrivent Mid Cap Growth Fund | | | 2.7 | % |
These securities represent 57.2% of the total net assets of the Fund.
Quoted Fund performance is for Class A shares and does not reflect a sales charge.
The returns shown do not reflect taxes a shareholder would pay on distributions or redemptions.
Portfolio Composition illustrates market exposure of all asset classes, including derivatives.
The list of Top 10 Holdings excludes short-term investments.
Quoted Portfolio Composition and Top 10 Holdings are subject to change.
6
The challenge for the markets will be to continue to perform well in an environment characterized by unusually active policy choices and uneven growth. We are modestly optimistic that will be the case but remain alert for changes in the environment.
Portfolio Facts
As of October 31, 2012
| | | | | | | | |
| | | Class A | | | Institutional Class | |
Ticker | | | TMAAX | | | | TMAFX | |
Transfer Agent ID | | | 037 | | | | 467 | |
Net Assets | | | $1,268,160,769 | | | | $90,168,810 | |
NAV | | | $11.64 | | | | $11.73 | |
NAV - High† | | | 9/14/2012 - $11.95 | | | | 9/14/2012 - $12.03 | |
NAV - Low† | | | 11/25/2011 - $10.06 | | | | 11/25/2011 - $10.14 | |
Number of Holdings: 609 | | | | | | | | |
† | For the year ended October 31, 2012 |
Average Annual Total Returns1
As of October 31, 2012
| | | | | | | | | | | | |
Class A2 | | 1-Year | | | 5 Years | | | From
Inception
6/30/2005 | |
without sales charge | | | 8.92 | % | | | 0.23 | % | | | 4.54 | % |
with sales charge | | | 2.94 | % | | | -0.90 | % | | | 3.74 | % |
| | | |
Institutional Class3 | | 1-Year | | | 5 Years | | | From
Inception
6/30/2005 | |
Net Asset Value | | | 9.29 | % | | | 0.58 | % | | | 4.91 | % |
1 | Past performance is not an indication of future results. Average annual total returns represent past performance and reflect changes in share prices, the reinvestment of all dividends and capital gains, and the effects of compounding. The prospectus contains more complete information on the investment objectives, risks, charges and expenses of the investment company, which investors should read and consider carefully before investing. To obtain a prospectus, contact a registered representative or visit www.thrivent.com. At various times, the Fund’s adviser waived its management fee and/or reimbursed Fund expenses. Had the adviser not done so, the Fund’s total returns would have been lower. The returns shown do not reflect taxes a shareholder would pay on distributions or redemptions. Total investment return and principal value of your investment will fluctuate, and your shares, when redeemed, may be worth more or less than their original cost. Current performance may be higher or lower than the performance data quoted. Call 800-THRIVENT or visit www.thrivent.com for performance results current to the most recent month-end. |
2 | Class A performance with sales charge reflects the maximum sales charge of 5.5%. |
3 | Institutional Class shares have no sales load and are for institutional shareholders only. |
(a) | Performance of other classes will be greater or less than the line shown based on the differences in loads and fees paid by shareholders investing in the different classes. |
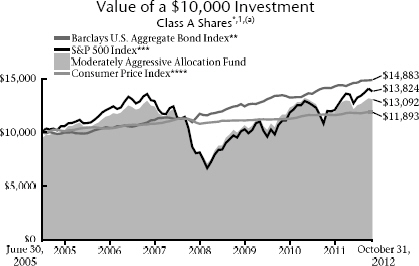
* | As you compare performance, please note that the Fund’s performance reflects the maximum 5.5% sales charge, while the Consumer Price Index, the S&P 500 Index and the Barclays U.S. Aggregate Bond Index do not reflect any such charges. If you were to purchase any of the above individual securities represented in those Indexes, any charges you would pay would reduce your total return as well. |
** | The Barclays U.S. Aggregate Bond Index is an index that measures the performance of U.S. investment grade bonds. It is not possible to invest directly in the Index. The performance of the Index does not reflect deductions for fees, expenses or taxes. |
*** | The S&P 500 Index is an index that represents the average performance of a group of 500 widely held, publicly traded stocks. “S&P 500®” is a trademark of The McGraw-Hill Companies, Inc. and has been licensed for use by Thrivent Financial for Lutherans. The product is not sponsored, endorsed or promoted by Standard & Poor’s and Standard & Poor’s makes no representation regarding the advisability of investing in the product. It is not possible to invest directly in the Index. The performance of the Index does not reflect deductions for fees, expenses or taxes. |
**** | The Consumer Price Index is an inflationary indicator that measures the change in the cost of a fixed basket of products and services, including housing, electricity, food and transportation. It is not possible to invest directly in the Index. |
7
Thrivent Moderate Allocation Fund
Russell W. Swansen, David C. Francis, CFA and Mark L. Simenstad, CFA, Portfolio Co-Managers
The Fund seeks long-term capital growth while providing reasonable stability of principal.
The Fund’s performance depends upon how its assets are allocated across broad asset categories and applicable sub-classes within such categories. Some broad asset categories and sub-classes may perform below expectations or below the securities markets generally over short or extended periods. Another risk of investing in the Fund is that its performance is dependent upon the performance of the underlying asset classes in which it invests. As a result, the Fund is subject to the same risks as those faced by the underlying asset classes. These and other risks are described in the Fund’s prospectus. Views expressed in this discussion of fund performance are the views of this particular Fund’s portfolio management team.
How did the Fund perform during the 12-month period ended October 31, 2012?
Thrivent Moderate Allocation Fund earned a return of 8.68%, compared with the median return of its peer group, the Lipper Mixed-Asset Target Allocation Moderate Funds category, of 8.78%. The Fund’s market benchmarks, the S&P 500 Index and the Barclays U.S. Aggregate Bond Index, earned returns of 15.21% and 5.25%, respectively.
What factors affected the Fund’s performance?
Performance in the Fund was limited by a combination of asset allocation decisions as well as security selection impacts in some of the equity portfolios. Fixed-income results were either in-line with or ahead of their respective performance benchmarks.
Our small- and mid-cap stock managers generally did not perform in-line with their benchmarks, and their categories did not perform as well as the S&P 500 Index. The former factor limited our returns while the latter was less of a factor owing to our reduction in exposure to mid and small caps in favor of more exposure to large-capitalization companies.
Another factor was that, early in the period, we were underweighted in our target equity exposure as we were concerned that a lack of progress on fiscal and policy issues both in Europe and domestically would impair the recovery and negatively impact risk assets. While those uncertainties remain, monetary authorities have taken steps that, at least in the short term, have supported risk asset prices at levels that were unlikely to have been achieved otherwise.
Our exposure to fixed income, which averaged around 45% over the period, was additive to results as our fixed-income managers and assets performed well relative to their categories. That said, the fixed-income asset class, while generally providing positive returns, did not keep pace with the returns seen in large-cap domestic equity markets.
What is your outlook?
Fiscal and policy risks remain high, but monetary authorities have expressed an interest or acted in unconventional ways to support the economic expansion and asset prices. In the absence of a severe policy mistake, risk asset prices are likely to see further advances but at reduced levels versus early in the recovery.
For domestic stocks, earnings will continue to be the key driver. We believe that profit margins seem unusually high and further expansion is unlikely to be a driver of above-average earnings growth going forward. While equity valuations are not high, they are full and require continued progress in resolving fiscal issues both domestically and abroad without impairing what most would agree is a below-average recovery. Emerging market growth has slowed to more sustainable levels as well.
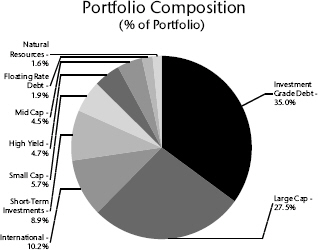
Top 10 Holdings
(% of Net Assets)
| | | | |
Thrivent Income Fund | | | 13.9 | % |
Thrivent Partner Worldwide Allocation Fund | | | 9.8 | % |
Thrivent Limited Maturity Bond Fund | | | 9.6 | % |
Thrivent Large Cap Value Fund | | | 7.2 | % |
Thrivent Large Cap Growth Fund | | | 4.8 | % |
Thrivent High Yield Fund | | | 3.3 | % |
Thrivent Mid Cap Stock Fund | | | 3.1 | % |
Thrivent Large Cap Stock Fund | | | 2.5 | % |
Thrivent Partner Mid Cap Value Fund | | | 2.0 | % |
Thrivent Partner Small Cap Growth Fund | | | 2.0 | % |
These securities represent 58.2% of the total net assets of the Fund.
Quoted Fund performance is for Class A shares and does not reflect a sales charge.
The returns shown do not reflect taxes a shareholder would pay on distributions or redemptions.
Portfolio Composition illustrates market exposure of all asset classes, including derivatives.
The list of Top 10 Holdings excludes short-term investments.
Quoted Portfolio Composition and Top 10 Holdings are subject to change.
8
The challenge for the markets will be to continue to perform well in an environment characterized by unusually active policy choices and uneven growth. We are modestly optimistic that will be the case but remain alert for changes in the environment.
Portfolio Facts
As of October 31, 2012
| | | | | | | | |
| | | Class A | | | Institutional Class | |
Ticker | | | THMAX | | | | TMAIX | |
Transfer Agent ID | | | 036 | | | | 466 | |
Net Assets | | | $1,316,468,921 | | | | $66,027,019 | |
NAV | | | $11.55 | | | | $11.57 | |
NAV - High† | | | 9/14/2012 - $11.76 | | | | 9/14/2012 - $11.79 | |
NAV - Low† | | | 11/25/2011 - $10.18 | | | | 11/25/2011 - $10.21 | |
Number of Holdings: 605 | | | | | | | | |
† | For the year ended October 31, 2012 |
Average Annual Total Returns1
As of October 31, 2012
| | | | | | | | | | | | |
Class A2 | | 1-Year | | | 5 Years | | | From
Inception
6/30/2005 | |
without sales charge | | | 8.68 | % | | | 1.71 | % | | | 4.92 | % |
with sales charge | | | 2.69 | % | | | 0.56 | % | | | 4.11 | % |
| | | |
Institutional Class3 | | 1-Year | | | 5 Years | | | From
Inception
6/30/2005 | |
Net Asset Value | | | 9.05 | % | | | 2.04 | % | | | 5.26 | % |
1 | Past performance is not an indication of future results. Average annual total returns represent past performance and reflect changes in share prices, the reinvestment of all dividends and capital gains, and the effects of compounding. The prospectus contains more complete information on the investment objectives, risks, charges and expenses of the investment company, which investors should read and consider carefully before investing. To obtain a prospectus, contact a registered representative or visit www.thrivent.com. At various times, the Fund’s adviser waived its management fee and/or reimbursed Fund expenses. Had the adviser not done so, the Fund’s total returns would have been lower. The returns shown do not reflect taxes a shareholder would pay on distributions or redemptions. Total investment return and principal value of your investment will fluctuate, and your shares, when redeemed, may be worth more or less than their original cost. Current performance may be higher or lower than the performance data quoted. Call 800-THRIVENT or visit www.thrivent.com for performance results current to the most recent month-end. |
2 | Class A performance with sales charge reflects the maximum sales charge of 5.5%. |
3 | Institutional Class shares have no sales load and are for institutional shareholders only. |
(a) | Performance of other classes will be greater or less than the line shown based on the differences in loads and fees paid by shareholders investing in the different classes. |
* | As you compare performance, please note that the Fund’s performance reflects the maximum 5.5% sales charge, while the Consumer Price Index, the S&P 500 Index and the Barclays U.S. Aggregate Bond Index do not reflect any such charges. If you were to purchase any of the above individual securities represented in those Indexes, any charges you would pay would reduce your total return as well. |
** | The Barclays U.S. Aggregate Bond Index is an index that measures the performance of U.S. investment grade bonds. It is not possible to invest directly in the Index. The performance of the Index does not reflect deductions for fees, expenses or taxes. |
*** | The S&P 500 Index is an index that represents the average performance of a group of 500 widely held, publicly traded stocks. “S&P 500®” is a trademark of The McGraw-Hill Companies, Inc. and has been licensed for use by Thrivent Financial for Lutherans. The product is not sponsored, endorsed or promoted by Standard & Poor’s and Standard & Poor’s makes no representation regarding the advisability of investing in the product. It is not possible to invest directly in the Index. The performance of the Index does not reflect deductions for fees, expenses or taxes. |
**** | The Consumer Price Index is an inflationary indicator that measures the change in the cost of a fixed basket of products and services, including housing, electricity, food and transportation. It is not possible to invest directly in the Index. |
9
Thrivent Moderately Conservative Allocation Fund
Russell W. Swansen, David C. Francis, CFA and Mark L. Simenstad, CFA, Portfolio Co-Managers
The Fund seeks long-term capital growth while providing reasonable stability of principal.
The Fund’s performance depends upon how its assets are allocated across broad asset categories and applicable sub-classes within such categories. Some broad asset categories and sub-classes may perform below expectations or below the securities markets generally over short or extended periods. Another risk of investing in the Fund is that its performance is dependent upon the performance of the underlying asset classes in which it invests. As a result, the Fund is subject to the same risks as those faced by the underlying asset classes. These and other risks are described in the Fund’s prospectus. Views expressed in this discussion of fund performance are the views of this particular Fund’s portfolio management team.
How did the Fund perform during the 12-month period ended October 31, 2012?
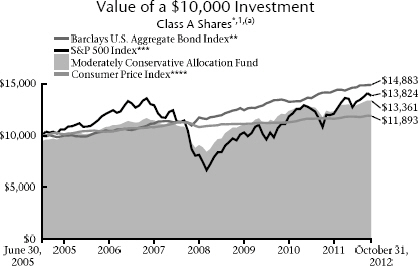
Thrivent Moderately Conservative Allocation Fund earned a return of 7.92%, compared with the median return of its peer group, the Lipper Mixed-Asset Target Allocation Conservative Funds category, of 7.87%. The Fund’s market benchmarks, the S&P 500 Index and the Barclays U.S. Aggregate Bond Index, earned returns of 15.21% and 5.25%, respectively.
What factors affected the Fund’s performance?
Performance in the Fund was limited by a combination of asset allocation decisions as well as security selection impacts in some of the equity portfolios. Fixed-income results were either in-line with or ahead of their respective performance benchmarks.
Our small- and mid-cap stock managers generally did not perform in-line with their benchmarks, and their categories did not perform as well as the S&P 500 Index. The former factor limited our returns while the latter was less of a factor owing to our reduction in exposure to mid and small caps in favor of more exposure to large-capitalization companies.
Another factor was that, early in the period, we were underweighted in our target equity exposure as we were concerned that a lack of progress on fiscal and policy issues both in Europe and domestically would impair the recovery and negatively impact risk assets. While those uncertainties remain, monetary authorities have taken steps that, at least in the short term, have supported risk asset prices at levels that were unlikely to have been achieved otherwise.
Our exposure to fixed income, which averaged around 65% over the period, was additive to results as our fixed-income managers and assets performed well relative to their categories. That said, the fixed-income asset class, while generally providing positive returns, did not keep pace with the returns seen in large-cap domestic equity markets.
What is your outlook?
Fiscal and policy risks remain high, but monetary authorities have expressed an interest or acted in unconventional ways to support the economic expansion and asset prices. In the absence of a severe policy mistake, risk asset prices are likely to see further advances but at reduced levels versus early in the recovery.
For domestic stocks, earnings will continue to be the key driver. We believe that profit margins are unusually high and further expansion is unlikely to be a driver of above- average earnings growth going forward. While equity valuations are not high, they are full and require continued progress in resolving fiscal issues both domestically and abroad without impairing what most would agree is a below-average recovery. Emerging market growth has slowed to more sustainable levels as well.
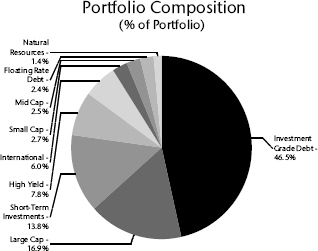
Top 10 Holdings
(% of Net Assets)
| | | | |
Thrivent Limited Maturity Bond Fund | | | 16.9 | % |
Thrivent Income Fund | | | 11.7 | % |
Thrivent Partner Worldwide Allocation Fund | | | 5.8 | % |
Thrivent Large Cap Value Fund | | | 5.3 | % |
Thrivent High Yield Fund | | | 3.8 | % |
Federal National Mortgage Association Conventional 30-Yr. Pass Through | | | 2.8 | % |
Federal National Mortgage Association Conventional 30-Yr. Pass Through | | | 2.3 | % |
Thrivent Large Cap Growth Fund | | | 2.2 | % |
Thrivent Partner Mid Cap Value Fund | | | 2.1 | % |
Thrivent Government Bond Fund | | | 1.9 | % |
These securities represent 54.8% of the total net assets of the Fund.
Quoted Fund performance is for Class A shares and does not reflect a sales charge.
The returns shown do not reflect taxes a shareholder would pay on distributions or redemptions.
Portfolio Composition illustrates market exposure of all asset classes, including derivatives.
The list of Top 10 Holdings excludes short-term investments.
Quoted Portfolio Composition and Top 10 Holdings are subject to change.
10
The challenge for the markets will be to continue to perform well in an environment characterized by unusually active policy choices and uneven growth. We are modestly optimistic that will be the case but remain alert for changes in the environment.
Portfolio Facts
As of October 31, 2012
| | | | | | | | |
| | | Class A | | | Institutional Class | |
Ticker | | | TCAAX | | | | TCAIX | |
Transfer Agent ID | | | 035 | | | | 465 | |
Net Assets | | | $632,934,529 | | | | $28,009,989 | |
NAV | | | $11.34 | | | | $11.37 | |
NAV - High† | | | 9/14/2012 - $11.46 | | | | 9/14/2012 - $11.49 | |
NAV - Low† | | | 11/25/2011 - $10.33 | | | | 11/25/2011 - $10.36 | |
Number of Holdings: 608 | | | | | | | | |
† | For the year ended October 31, 2012 |
Average Annual Total Returns1
As of October 31, 2012
| | | | | | | | | | | | |
Class A2 | | 1-Year | | | 5 Years | | | From
Inception
6/30/2005 | |
without sales charge | | | 7.92 | % | | | 2.73 | % | | | 4.83 | % |
with sales charge | | | 1.95 | % | | | 1.57 | % | | | 4.03 | % |
Institutional Class3 | | 1-Year | | | 5 Years | | | From
Inception
6/30/2005 | |
Net Asset Value | | | 8.26 | % | | | 3.02 | % | | | 5.13 | % |
1 | Past performance is not an indication of future results. Average annual total returns represent past performance and reflect changes in share prices, the reinvestment of all dividends and capital gains, and the effects of compounding. The prospectus contains more complete information on the investment objectives, risks, charges and expenses of the investment company, which investors should read and consider carefully before investing. To obtain a prospectus, contact a registered representative or visit www.thrivent.com. At various times, the Fund’s adviser waived its management fee and/or reimbursed Fund expenses. Had the adviser not done so, the Fund’s total returns would have been lower. The returns shown do not reflect taxes a shareholder would pay on distributions or redemptions. Total investment return and principal value of your investment will fluctuate, and your shares, when redeemed, may be worth more or less than their original cost. Current performance may be higher or lower than the performance data quoted. Call 800-THRIVENT or visit www.thrivent.com for performance results current to the most recent month-end. |
2 | Class A performance with sales charge reflects the maximum sales charge of 5.5%. |
3 | Institutional Class shares have no sales load and are for institutional shareholders only. |
(a) | Performance of other classes will be greater or less than the line shown based on the differences in loads and fees paid by shareholders investing in the different classes. |
* | As you compare performance, please note that the Fund’s performance reflects the maximum 5.5% sales charge, while the Consumer Price Index, the S&P 500 Index and the Barclays U.S. Aggregate Bond Index do not reflect any such charges. If you were to purchase any of the above individual securities represented in those Indexes, any charges you would pay would reduce your total return as well. |
** | The Barclays U.S. Aggregate Bond Index is an index that measures the performance of U.S. investment grade bonds. It is not possible to invest directly in the Index. The performance of the Index does not reflect deductions for fees, expenses or taxes. |
*** | The S&P 500 Index is an index that represents the average performance of a group of 500 widely held, publicly traded stocks. “S&P 500®” is a trademark of The McGraw-Hill Companies, Inc. and has been licensed for use by Thrivent Financial for Lutherans. The product is not sponsored, endorsed or promoted by Standard & Poor’s and Standard & Poor’s makes no representation regarding the advisability of investing in the product. It is not possible to invest directly in the Index. The performance of the Index does not reflect deductions for fees, expenses or taxes. |
**** | The Consumer Price Index is an inflationary indicator that measures the change in the cost of a fixed basket of products and services, including housing, electricity, food and transportation. It is not possible to invest directly in the Index. |
11
Thrivent Partner Small Cap Growth Fund
| | |

| | Subadvised by Turner Investments, L.P. The Fund seeks long-term growth of capital. The Fund is exposed to the risks of investing in equity securities of smaller companies, which may include, but are not limited to, lower trading volumes and less liquidity than larger, more established companies. Small company stock prices are generally more volatile than large company stock prices. These and other risks are described in the Fund’s prospectus. Views expressed in this discussion of fund performance are the views of this particular Fund’s portfolio management team. |
How did the Fund perform during the 12-month period ended October 31, 2012?
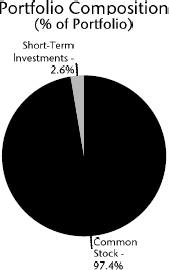
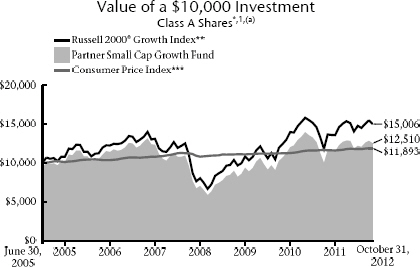
Thrivent Partner Small Cap Growth Fund earned a return of 7.85%, compared with the median return of its peer group, the Lipper Small Cap Growth Funds category, of 9.40%. The Fund’s market benchmark, the Russell 2000® Growth Index, earned a return of 9.70%.
What factors affected the Fund’s performance?
During the period, five of the Fund’s nine sectors beat their corresponding index sectors on a relative basis. The consumer discretionary sector detracted the most from results, while holdings in the consumer staples sector contributed the most.
The consumer discretionary sector was an area of underperformance for the Fund. Shares of Brightpoint Education, a for-profit provider of post-secondary education services, traded lower after it failed to obtain a widely expected accreditation from a key academic governing body. Premium denim maker True Religion Apparel also disappointed as the company reported lower sales for the third quarter and reduced its full-year guidance due to lackluster results within its spring and summer clothing lines.
The consumer staples sector was an area of strength for the Fund. Organic and natural food company Hain Celestial has been a direct beneficiary of the trends in the natural and organic food industry as sales at mainstream supermarkets have climbed due to healthier consumer lifestyles and exposure to the high-end consumer. Natural Foods, a distributor of more than 60,000 natural and organic food products found in specialty and grocery stores, also rode the wave of increased demand for organic food offerings. During the period, the company reported a 15.6% increase in year-over-year net sales for the fiscal year 2012.
What is your outlook?
As we see it, the market still has upward potential as we head into the final quarter of the year. In the U.S., the presidential election and the so-called “fiscal cliff” of tax increases and spending cuts could be nonissues for the market. We’ve come to expect displays of brinkmanship, but neither political party wants to slam the brakes on the economy, so a solution to the fiscal cliff is likely to materialize now that the election is over. Once the fiscal cliff and its associated uncertainty are resolved, investors still holding their money on the sidelines could enter the market, pushing stocks higher.
| | | | |
| Major Market Sectors | |
| (% of Net Assets) | |
Information Technology | | | 22.7 | % |
Consumer Discretionary | | | 17.5 | % |
Health Care | | | 17.1 | % |
Industrials | | | 16.0 | % |
Financials | | | 8.1 | % |
Energy | | | 5.7 | % |
Materials | | | 4.9 | % |
Consumer Staples | | | 4.0 | % |
Telecommunications Services | | | 0.7 | % |
Utilities | | | 0.1 | % |
Top 10 Holdings
(% of Net Assets)
| | | | |
Vitamin Shoppe, Inc. | | | 1.4 | % |
United Natural Foods, Inc. | | | 1.3 | % |
OSI Systems, Inc. | | | 1.2 | % |
Teleflex, Inc. | | | 1.2 | % |
Cirrus Logic, Inc. | | | 1.2 | % |
Copa Holdings SA | | | 1.1 | % |
Chart Industries, Inc. | | | 1.1 | % |
Integra LifeSciences Holdings Corporation | | | 1.1 | % |
MAXIMUS, Inc. | | | 1.1 | % |
Hexcel Corporation | | | 1.1 | % |
These securities represent 11.8% of the total net assets of the Fund.
Quoted Fund performance is for Class A shares and does not reflect a sales charge.
The returns shown do not reflect taxes a shareholder would pay on distributions or redemptions.
Quoted Major Market Sectors, Portfolio Composition and Top 10 Holdings are subject to change.
The lists of Major Market Sectors and Top 10 Holdings exclude short-term investments and collateral held for securities loaned.
The Portfolio Composition chart excludes collateral held for securities loaned.
12
Additionally, valuations for stocks remain reasonable. Despite the almost 30% move higher in the last year, the current price-to-forward earnings multiple for the S&P 500 Index is well below the 20-year average.
Portfolio Facts
As of October 31, 2012
| | | | | | | | |
| | | Class A | | | Institutional Class | |
Ticker | | | TPSAX | | | | TPGIX | |
Transfer Agent ID | | | 063 | | | | 463 | |
Net Assets | | | $17,247,327 | | | | $115,025,825 | |
NAV | | | $12.64 | | | | $12.98 | |
NAV - High† | | | 9/14/2012 - $13.52 | | | | 9/14/2012 - $13.87 | |
NAV - Low† | | | 11/25/2011 - $10.56 | | | | 11/25/2011 - $10.81 | |
Number of Holdings: 175 | | | | | | | | |
† | For the year ended October 31, 2012 |
Average Annual Total Returns1
As of October 31, 2012
| | | | | | | | | | | | |
Class A2 | | 1-Year | | | 5 Years | | | From
Inception
6/30/2005 | |
without sales charge | | | 7.85 | % | | | -1.01 | % | | | 3.89 | % |
with sales charge | | | 1.94 | % | | | -2.13 | % | | | 3.10 | % |
| | | |
Institutional Class3 | | 1-Year | | | 5 Years | | | From
Inception
6/30/2005 | |
Net Asset Value | | | 8.26 | % | | | -0.59 | % | | | 4.29 | % |
1 | Past performance is not an indication of future results. Average annual total returns represent past performance and reflect changes in share prices, the reinvestment of all dividends and capital gains, and the effects of compounding. The prospectus contains more complete information on the investment objectives, risks, charges and expenses of the investment company, which investors should read and consider carefully before investing. To obtain a prospectus, contact a registered representative or visit www.thrivent.com. At various times, the Fund’s adviser waived its management fee and/or reimbursed Fund expenses. Had the adviser not done so, the Fund’s total returns would have been lower. The returns shown do not reflect taxes a shareholder would pay on distributions or redemptions. Total investment return and principal value of your investment will fluctuate, and your shares, when redeemed, may be worth more or less than their original cost. Current performance may be higher or lower than the performance data quoted. Call 800-THRIVENT or visit www.thrivent.com for performance results current to the most recent month-end. |
2 | Class A performance with sales charge reflects the maximum sales charge of 5.5%. |
3 | Institutional Class shares have no sales load and are for institutional shareholders only. |
(a) | Performance of other classes will be greater or less than the line shown based on the differences in loads and fees paid by shareholders investing in the different classes. |
* | As you compare performance, please note that the Fund’s performance reflects the maximum 5.5% sales charge, while the Consumer Price Index and the Russell 2000® Growth Index do not reflect any such charges. If you were to purchase any of the above individual securities represented in the Index, any charges you would pay would reduce your total return as well. |
** | The Russell 2000® Growth Index is an index comprised of companies with a greater-than-average growth orientation. It is not possible to invest directly in the Index. The performance of the Index does not reflect deductions for fees, expenses or taxes. |
*** | The Consumer Price Index is an inflationary indicator that measures the change in the cost of a fixed basket of products and services, including housing, electricity, food and transportation. It is not possible to invest directly in the Index. |
13
Thrivent Partner Small Cap Value Fund
| | |

| | Subadvised by T. Rowe Price Associates, Inc. The Fund seeks long-term capital appreciation. The Fund is exposed to the risks of investing in equity securities of smaller companies, which may include, but are not limited to, lower trading volumes and less liquidity than larger, more established companies. Small company stock prices are generally more volatile than large company stock prices. These and other risks are described in the Fund’s prospectus. Views expressed in this discussion of fund performance are the views of this particular Fund’s portfolio management team. |
How did the Fund perform during the 12-month period ended October 31, 2012?
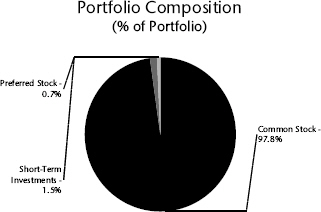
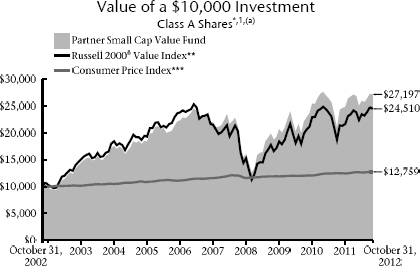
Thrivent Partner Small Cap Value Fund earned a return of 11.87%, compared with the median return of its peer group, the Lipper Small Cap Value Funds category, of 11.85%. The Fund’s market benchmark, the Russell 2000® Value Index, earned a return of 14.47%.
What factors affected the Fund’s performance?
Broadly speaking, negative sector allocation detracted from relative performance in the portfolio. Fundamentals are improving within the financials sector, and its returns were among the highest within the benchmark. Both our significant underweighting and stock selection weighed on relative results for the trailing one-year period.
Financials has been a tumultuous sector over the past several years, but recent performance has improved. Stock selection in energy also weighed on relative returns, driven by companies exposed to both falling crude oil and natural gas prices. Firms exposed to natural gas were punished during the period as prices for the commodity stayed within a range at historic lows before bouncing back more recently.
On the positive side, stock selection in consumer discretionary was extremely beneficial toward relative performance, particularly among auto components and household durables companies.
What is your outlook?
The market’s strong performance in the third quarter of 2012 came as a pleasant surprise to many investors. Stocks managed to climb an imposing wall of worry composed of domestic fiscal concerns, fears about the ongoing financial crisis in Europe, unease over the slowdown in China, and other uncertainties. We think the question now is whether the wall will come tumbling down around us in the coming months.
We are particularly worried about fiscal issues, given the possibility that taxes will rise and weigh on markets. As we have noted before, for example, a future rise in capital gains rates might encourage investors to act preemptively and sell now in order to avoid them. The outcome of the recent election should provide some clarity on the direction of fiscal policy, but for this reason alone we are more cautious than we have been in a number of months.
For most, monetary policy has been a reason to celebrate over recent months. The Federal Reserve’s stimulus announcements, including its latest quantitative easing program (QE3) of open-ended mortgage bond purchases, have been followed by solid rallies. We share the concerns of others, however, that the massive liquidity the Fed has inserted into the economy brings with it the risk of a spike in inflation over the longer term.
Major Market Sectors
(% of Net Assets)
| | | | |
Industrials | | | 25.6 | % |
Financials | | | 25.2 | % |
Consumer Discretionary | | | 15.4 | % |
Materials | | | 9.2 | % |
Information Technology | | | 8.5 | % |
Utilities | | | 5.4 | % |
Health Care | | | 4.3 | % |
Energy | | | 4.0 | % |
Consumer Staples | | | 0.5 | % |
Telecommunications Services | | | 0.3 | % |
Top 10 Holdings
(% of Net Assets)
| | | | |
Aaron’s, Inc. | | | 2.4 | % |
ProAssurance Corporation | | | 2.3 | % |
Genesee & Wyoming, Inc. | | | 2.2 | % |
Beacon Roofing Supply, Inc. | | | 1.8 | % |
Kirby Corporation | | | 1.7 | % |
Cleco Corporation | | | 1.6 | % |
CBL & Associates Properties, Inc. | | | 1.6 | % |
Meritage Homes Corporation | | | 1.4 | % |
A.O. Smith Corporation | | | 1.4 | % |
AptarGroup, Inc. | | | 1.4 | % |
These securities represent 17.8% of the total net assets of the Fund.
Quoted Fund performance is for Class A shares and does not reflect a sales charge.
The returns shown do not reflect taxes a shareholder would pay on distributions or redemptions.
Quoted Major Market Sectors, Portfolio Composition and Top 10 Holdings are subject to change.
The lists of Major Market Sectors and Top 10 Holdings exclude short-term investments and collateral held for securities loaned.
The Portfolio Composition chart excludes collateral held for securities loaned.
14
Fortunately, we believe we have some tools to help protect the portfolio from such an outcome. In particular, we have been investing in energy, materials, and precious metals firms that we believe stand to benefit from rising prices. More generally, with stocks still priced reasonably overall and especially attractive relative to bonds, the prospect of inflation is a good argument for us to remain fully invested in equities—even if outright bargains are harder to come by than in recent years.
Portfolio Facts
As of October 31, 2012
| | | | | | | | |
| | | Class A | | | Institutional Class | |
Ticker | | | AALVX | | | | TPSIX | |
Transfer Agent ID | | | 032 | | | | 099 | |
Net Assets | | | $71,986,174 | | | | $148,934,419 | |
NAV | | | $15.99 | | | | $16.80 | |
NAV - High† | | | 9/14/2012 - $16.55 | | | | 9/14/2012 - $17.36 | |
NAV - Low† | | | 11/25/2011 - $13.17 | | | | 11/25/2011 - $13.84 | |
Number of Holdings: 156 | | | | | | | | |
† | For the year ended October 31, 2012 |
Average Annual Total Returns1
As of October 31, 2012
| | | | | | | | | | | | |
Class A2 | | 1-Year | | | 5 Years | | | 10 Years | |
without sales charge | | | 11.87 | % | | | 3.01 | % | | | 11.15 | % |
with sales charge | | | 5.73 | % | | | 1.84 | % | | | 10.53 | % |
| | | |
Institutional Class3 | | 1-Year | | | 5 Years | | | 10 Years | |
Net Asset Value | | | 12.51 | % | | | 3.64 | % | | | 11.90 | % |
1 | Past performance is not an indication of future results. Average annual total returns represent past performance and reflect changes in share prices, the reinvestment of all dividends and capital gains, and the effects of compounding. The prospectus contains more complete information on the investment objectives, risks, charges and expenses of the investment company, which investors should read and consider carefully before investing. To obtain a prospectus, contact a registered representative or visit www.thrivent.com. At various times, the Fund’s adviser waived its management fee and/or reimbursed Fund expenses. Had the adviser not done so, the Fund’s total returns would have been lower. The returns shown do not reflect taxes a shareholder would pay on distributions or redemptions. Total investment return and principal value of your investment will fluctuate, and your shares, when redeemed, may be worth more or less than their original cost. Current performance may be higher or lower than the performance data quoted. Call 800-THRIVENT or visit www.thrivent.com for performance results current to the most recent month-end. |
2 | Class A performance with sales charge reflects the maximum sales charge of 5.5%. |
3 | Institutional Class shares have no sales load and are for institutional shareholders only. |
(a) | Performance of other classes will be greater or less than the line shown based on the differences in loads and fees paid by shareholders investing in the different classes. |
* | As you compare performance, please note that the Fund’s performance reflects the maximum 5.5% sales charge, while the Russell 2000® Value Index and the Consumer Price Index do not reflect any such charges. If you were to purchase any of the above individual securities represented in the Index, any charges you would pay would reduce your total return as well. |
** | The Russell 2000® Value Index measures the performance of small cap value stocks. It is not possible to invest directly in the Index. The performance of the Index does not reflect deductions for fees, expenses or taxes. |
*** | The Consumer Price Index is an inflationary indicator that measures the change in the cost of a fixed basket of products and services, including housing, electricity, food and transportation. It is not possible to invest directly in the Index. |
15
Thrivent Small Cap Stock Fund
Darren M. Bagwell, CFA, Portfolio Manager
The Fund seeks long-term capital growth.
The Fund is exposed to the risks of investing in equity securities of smaller companies, which may include, but are not limited to, lower trading volumes and less liquidity than larger, more established companies. Small company stock prices are generally more volatile than large company stock prices. These and other risks are described in the Fund’s prospectus. Views expressed in this discussion of fund performance are the views of this particular Fund’s portfolio management team.
How did the Fund perform during the 12-month period ended October 31, 2012?
Thrivent Small Cap Stock Fund earned a return of 6.97%, compared with the median return of its peer group, the Lipper Small Cap Core Funds category, of 10.50%. The Fund’s market benchmark, the Russell 2000® Index, earned a return of 12.08%.
What factors affected the Fund’s performance?
The pro-cyclical positioning of the Fund was out of step with the anemic global growth environment and resulting low-risk bias in equity markets. While sector-neutral by design, our intra-sector exposures to coal (within the energy sector), as well as networking and semiconductors (within IT), were mitigating. Along with poor security selection in health care, this offset solid performance from financial and industrial exposures.
Despite eliminating coal-leveraged investments in Arch Coal, Patriot Coal and Walter Energy early in 2012, we were slow to realize the magnitude of the pricing impact of slowing Chinese demand and growing domestic stockpiles. The negative effect of these investments overwhelmed the positive performance of our oil and gas holdings in Petroleum Geo and Oil States International. We similarly misread the strength of domestic enterprise demand for networking equipment, which slowed as economic uncertainty grew. Cautious spending by businesses hurt videoconferencing gear maker Polycom, while slower consumer and industrial demand negatively impacted chipmaker Atmel.
In health care, we simply did not anticipate adverse developments. Drug developer VIVUS suffered from delayed European approval of its obesity drug and worries about the pace of the domestic roll-out, while the earnings outlook of managed care provider Health Net was impacted by negative legislative and economic developments in its key markets.
Holdings in financials and industrials were significant sources of relative performance. Most notable was mortgage servicer Ocwen, which benefited from banks’ accelerated disposition of servicing operations and the availability of significant portfolios. Also noteworthy was our emphasis on construction and engineering, where Shaw Group was acquired and EMCOR reported strong operating and demand trends.
What is your outlook?
We remain cautious, believing domestic growth will not exceed 2% in real terms—in part due to fiscal and regulatory headwinds, recessionary conditions in Europe, and slower consumer spending. Exports to emerging markets and domestic housing are wildcards that could provide economic tailwinds, and prove our expectations too pessimistic. That said, we worry that demand and profitability expectations are too high for 2013, and that negative outlook adjustments will mute performance.
Major Market Sectors
(% of Net Assets)
| | | | |
Financials | | | 24.1 | % |
Industrials | | | 14.8 | % |
Information Technology | | | 12.2 | % |
Consumer Discretionary | | | 10.9 | % |
Health Care | | | 5.3 | % |
Materials | | | 5.0 | % |
Utilities | | | 4.8 | % |
Consumer Staples | | | 4.0 | % |
Energy | | | 3.9 | % |
Top 10 Holdings
(% of Net Assets)
| | | | |
EMCOR Group, Inc. | | | 3.1 | % |
Ingredion, Inc. | | | 3.1 | % |
Actuant Corporation | | | 2.7 | % |
Petroleum Geo-Services ASA | | | 2.7 | % |
GATX Corporation | | | 2.6 | % |
Teradyne, Inc. | | | 2.6 | % |
Southwest Gas Corporation | | | 2.5 | % |
Foot Locker, Inc. | | | 2.5 | % |
Plantronics, Inc. | | | 2.3 | % |
PNM Resources, Inc. | | | 2.3 | % |
These securities represent 26.4% of the total net assets of the Fund.
Quoted Fund performance is for Class A shares and does not reflect a sales charge.
The returns shown do not reflect taxes a shareholder would pay on distributions or redemptions.
Quoted Major Market Sectors, Portfolio Composition and Top 10 Holdings are subject to change.
The lists of Major Market Sectors and Top 10 Holdings exclude short-term investments and collateral held for securities loaned.
The Portfolio Composition chart excludes collateral held for securities loaned.
16
Given our general trepidation regarding economic growth in 2013, our exposures are emphasizing companies with strong new product cycles, productivity-enhancing value propositions and superior demand visibility.
Portfolio Facts
As of October 31, 2012
| | | | | | | | |
| | | Class A | | | Institutional Class | |
Ticker | | | AASMX | | | | TSCSX | |
Transfer Agent ID | | | 024 | | | | 094 | |
Net Assets | | | $216,595,123 | | | | $63,434,982 | |
NAV | | | $14.28 | | | | $16.09 | |
NAV - High† | | | 9/14/2012 - $15.18 | | | | 9/14/2012 - $17.09 | |
NAV - Low† | | | 11/25/2011 - $12.06 | | | | 11/25/2011 - $13.51 | |
Number of Holdings: 68 | | | | | | | | |
† | For the year ended October 31, 2012 |
Average Annual Total Returns1
As of October 31, 2012
| | | | | | | | | | | | |
Class A2 | | 1-Year | | | 5 Years | | | 10 Years | |
without sales charge | | | 6.97 | % | | | -2.78 | % | | | 7.38 | % |
with sales charge | | | 1.06 | % | | | -3.87 | % | | | 6.77 | % |
| | | |
Institutional Class3 | | 1-Year | | | 5 Years | | | 10 Years | |
Net Asset Value | | | 7.55 | % | | | -2.14 | % | | | 8.06 | % |

1 | Past performance is not an indication of future results. Average annual total returns represent past performance and reflect changes in share prices, the reinvestment of all dividends and capital gains, and the effects of compounding. The prospectus contains more complete information on the investment objectives, risks, charges and expenses of the investment company, which investors should read and consider carefully before investing. To obtain a prospectus, contact a registered representative or visit www.thrivent.com. At various times, the Fund’s adviser waived its management fee and/or reimbursed Fund expenses. Had the adviser not done so, the Fund’s total returns would have been lower. The returns shown do not reflect taxes a shareholder would pay on distributions or redemptions. Total investment return and principal value of your investment will fluctuate, and your shares, when redeemed, may be worth more or less than their original cost. Current performance may be higher or lower than the performance data quoted. Call 800-THRIVENT or visit www.thrivent.com for performance results current to the most recent month-end. |
2 | Class A performance with sales charge reflects the maximum sales charge of 5.5%. |
3 | Institutional Class shares have no sales load and are for institutional shareholders only. |
(a) | Performance of other classes will be greater or less than the line shown based on the differences in loads and fees paid by shareholders investing in the different classes. |
* | As you compare performance, please note that the Fund’s performance reflects the maximum 5.5% sales charge, while the Russell 2000® Index and the Consumer Price Index do not reflect any such charges. If you were to purchase any of the above individual securities represented in the Index, any charges you would pay would reduce your total return as well. |
** | The Russell 2000® Index measures the performance of small cap stocks. It is not possible to invest directly in the Index. The performance of the Index does not reflect deductions for fees, expenses or taxes. |
*** | The Consumer Price Index is an inflationary indicator that measures the change in the cost of a fixed basket of products and services, including housing, electricity, food and transportation. It is not possible to invest directly in the Index. |
17
Thrivent Mid Cap Growth Fund
Andrea J. Thomas, CFA, Portfolio Manager
The Fund seeks long-term growth of capital.
Mid-cap stocks offer the potential for long-term gains but can be subject to short-term price movements. Mid-sized company stock prices are generally more volatile than large company stock prices. These and other risks are described in the Fund’s prospectus. Views expressed in this discussion of fund performance are the views of this particular Fund’s portfolio management team.
How did the Fund perform during the 12-month period ended October 31, 2012?
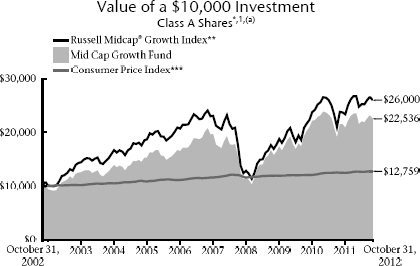
Thrivent Mid Cap Growth Fund earned a return of 4.72%, compared with the median return of its peer group, the Lipper Mid Cap Growth Funds category, of 7.03%. The Fund’s market benchmark, the Russell Midcap® Growth Index, earned a return of 9.09%.
What factors affected the Fund’s performance?
The Fund lagged its competitors and the benchmark over the period. Most of this underperformance occurred in the first six months of the fiscal period as we did not own enough high-multiple consumer names over the period that did very well. Investors continued to rush into these names and were willing to pay enormous premiums for them. Many of these companies have seen their values subsequently decline, and we have picked up relative ground in the second part of the fiscal period.
Our energy stock picks did not fare well over the period, particularly our coal stocks. The substantial expansion of domestic natural gas supply over the last few years has caused prices to decline significantly. While a positive for the overall economy, this trend has resulted in a dramatic shift from coal to natural gas for domestic electricity production. Additionally, coal exports declined due to reduced demand from China. In the technology sector, our holdings in Atmel Corporation and Marvell Technologies also did not perform well over the period.
In the financial sector, good results were achieved from our holdings in Discover Financial Services and Affiliated Managers Group. Catamaran Corporation in the health care providers industry also performed extremely well.
What is your outlook?
The U.S. economy remains in a state of subpar growth due primarily to the lackluster job market and uncertainty about government policies going forward. Continued turmoil in the European markets also remains a significant risk to the U.S. and world economies. A bright spot in the economy is the U.S. housing market, which is showing signs of stabilization.
We believe market volatility will increase over the near term as Congress debates a solution to the fiscal cliff, and the European Union continues to be disrupted over finding a solution to its banking and debt problems. These issues will moderate U.S. economic growth in the coming months.
The Fed announced its decision in September to extend its quantitative easing program. The value of the U.S. dollar continues to be at risk due to this policy because of the chance that inflation will increase as more liquidity is forced into the system.
| | | | |
| Major Market Sectors | |
| (% of Net Assets) | |
Information Technology | | | 21.1 | % |
Consumer Discretionary | | | 16.9 | % |
Industrials | | | 15.8 | % |
Health Care | | | 14.1 | % |
Energy | | | 10.6 | % |
Financials | | | 5.5 | % |
Materials | | | 4.9 | % |
Consumer Staples | | | 3.3 | % |
Telecommunications Services | | | 2.9 | % |

| | | | |
| Top 10 Holdings | |
| (% of Net Assets) | |
Discover Financial Services | | | 2.5 | % |
Discovery Communications, Inc. | | | 2.4 | % |
Watson Pharmaceuticals, Inc. | | | 2.3 | % |
Whole Foods Market, Inc. | | | 2.3 | % |
Affiliated Managers Group, Inc. | | | 2.2 | % |
F5 Networks, Inc. | | | 2.1 | % |
Dollar Tree, Inc. | | | 2.1 | % |
Tractor Supply Company | | | 2.0 | % |
ANSYS, Inc. | | | 2.0 | % |
JB Hunt Transport Services, Inc. | | | 2.0 | % |
These securities represent 21.9% of the total net assets of the Fund.
Quoted Fund performance is for Class A shares and does not reflect a sales charge.
The returns shown do not reflect taxes a shareholder would pay on distributions or redemptions.
Quoted Major Market Sectors, Portfolio Composition and Top 10 Holdings are subject to change.
The lists of Major Market Sectors and Top 10 Holdings exclude short-term investments and collateral held for securities loaned.
The Portfolio Composition chart excludes collateral held for securities loaned.
18
In this environment, we remain invested in companies that have definable product cycles that should grow despite economic cyclicality. We also remain invested in companies that have hard assets that may benefit from commodity inflation. Due to the mixed outlook for growth going forward, we will continue to follow a disciplined process and remain wary of the multiples we are willing to pay for stocks.
| | | | | | | | |
| Portfolio Facts | |
| As of October 31, 2012 | |
| | | Class A | | | Institutional Class | |
Ticker | | | LBMGX | | | | LBMIX | |
Transfer Agent ID | | | 058 | | | | 458 | |
Net Assets | | | $228,980,567 | | | | $150,728,838 | |
NAV | | | $18.34 | | | | $20.68 | |
NAV - High† | | | 4/27/2012 - $19.35 | | | | 4/27/2012 - $21.77 | |
NAV - Low† | | | 11/25/2011 - $16.30 | | | | 11/25/2011 - $18.27 | |
Number of Holdings: 83 | | | | | | | | |
† | For the year ended October 31, 2012 |
Average Annual Total Returns1
As of October 31, 2012
| | | | | | | | | | | | |
Class A2 | | 1-Year | | | 5 Years | | | 10 Years | |
without sales charge | | | 4.72 | % | | | 1.65 | % | | | 9.08 | % |
with sales charge | | | -1.04 | % | | | 0.51 | % | | | 8.47 | % |
| | | |
Institutional Class3 | | 1-Year | | | 5 Years | | | 10 Years | |
Net Asset Value | | | 5.23 | % | | | 2.32 | % | | | 9.90 | % |
1 | Past performance is not an indication of future results. Average annual total returns represent past performance and reflect changes in share prices, the reinvestment of all dividends and capital gains, and the effects of compounding. The prospectus contains more complete information on the investment objectives, risks, charges and expenses of the investment company, which investors should read and consider carefully before investing. To obtain a prospectus, contact a registered representative or visit www.thrivent.com. At various times, the Fund’s adviser waived its management fee and/or reimbursed Fund expenses. Had the adviser not done so, the Fund’s total returns would have been lower. The returns shown do not reflect taxes a shareholder would pay on distributions or redemptions. Total investment return and principal value of your investment will fluctuate, and your shares, when redeemed, may be worth more or less than their original cost. Current performance may be higher or lower than the performance data quoted. Call 800-THRIVENT or visit www.thrivent.com for performance results current to the most recent month-end. |
2 | Class A performance with sales charge reflects the maximum sales charge of 5.5%. |
3 | Institutional Class shares have no sales load and are for institutional shareholders only. |
(a) | Performance of other classes will be greater or less than the line shown based on the differences in loads and fees paid by shareholders investing in the different classes. |
* | As you compare performance, please note that the Fund’s performance reflects the maximum 5.5% sales charge, while the Russell Midcap® Growth Index and the Consumer Price Index do not reflect any such charges. If you were to purchase any of the above individual securities represented in the Index, any charges you would pay would reduce your total return as well. |
** | The Russell Midcap® Growth Index measures the performance of mid-cap growth stocks. It is not possible to invest directly in the Index. The performance of the Index does not reflect deductions for fees, expenses, or taxes. |
*** | The Consumer Price Index is an inflationary indicator that measures the change in the cost of a fixed basket of products and services, including housing, electricity, food and transportation. It is not possible to invest directly in the Index. |
19
| | |

| | Thrivent Partner Mid Cap Value Fund |
| | Subadvised by Goldman Sachs Asset Management, L.P. |
| | The Fund seeks to achieve long-term capital appreciation. Mid-cap stocks offer the potential for long-term gains but can be subject to short-term price movements. Mid-sized company stock prices are generally more volatile than large company stock prices. These and other risks are described in the Fund’s prospectus. Views expressed in this discussion of fund performance are the views of this particular Fund’s portfolio management team. |
How did the Fund perform during the 12-month period ended October 31, 2012?
Thrivent Partner Mid Cap Value Fund generated a return of 11.41%, compared with the median return of its peer group, the Lipper Mid Cap Value Funds category, of 12.59%. The Fund’s market benchmark, the Russell Midcap® Value Index, posted a return of 14.99%.
What factors affected the Fund’s performance?
Our investments within the information technology and consumer discretionary sectors detracted from results, whereas our investments in the telecommunication and utilities sectors contributed to performance.
Within information technology, Polycom, Inc. was a top detractor. The company underperformed after preannouncing that both revenue and earnings would miss expectations, primarily driven by shortfalls in Asia-Pacific and North America.
Within the consumer discretionary sector, MGM Resorts International was a top detractor. Its shares sold off as investors rotated out of perceived riskier names in preparation for a more challenging macroeconomic environment.
On the upside, Scripps Networks Interactive, Inc. was the top contributor to performance. Shares of the specialty media company rose due to strong quarterly earnings and revenues that exceeded analysts’ expectations, driven by higher-than-expected affiliate fee growth and accelerated subscriber growth.
Within the telecommunications sector, Sprint Nextel Corp was a top contributor. Its shares rose after the U.S. mobile device operator reported a large increase in average revenue per subscriber in the second quarter. It also benefited from Softbank’s recent deal for a 70% stake in Sprint, which many believe better positions Sprint in an increasingly competitive U.S. wireless market.
What is your outlook?
We maintain our constructive view on U.S. equities. While a number of risks remain, including the “fiscal cliff,” a significant slowing of China’s economy, and worsening of Europe’s debt crisis, we believe many of these uncertainties are being priced into U.S. equities.
Expectations for earnings growth and gross domestic product (GDP) growth may have modestly declined, but we feel this is balanced by equities trading below historical averages on a number of valuation measures, and bolstered by strong fundamentals at the company level.
| | | | |
| Major Market Sectors | |
| (% of Net Assets) | |
Financials | | | 29.9 | % |
Utilities | | | 11.0 | % |
Consumer Discretionary | | | 10.5 | % |
Information Technology | | | 10.1 | % |
Industrials | | | 8.8 | % |
Energy | | | 8.3 | % |
Health Care | | | 7.1 | % |
Materials | | | 6.2 | % |
Consumer Staples | | | 5.5 | % |
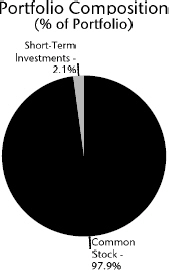
| | | | |
| Top 10 Holdings | |
| (% of Net Assets) | |
M&T Bank Corporation | | | 2.0 | % |
Principal Financial Group, Inc. | | | 1.7 | % |
Lam Research Corporation | | | 1.7 | % |
Xcel Energy, Inc. | | | 1.6 | % |
SLM Corporation | | | 1.5 | % |
Cameron International Corporation | | | 1.5 | % |
Ventas, Inc. | | | 1.5 | % |
Mylan, Inc. | | | 1.5 | % |
Invesco, Ltd. | | | 1.5 | % |
Everest Re Group, Ltd. | | | 1.5 | % |
These securities represent 16.0% of the total net assets of the Fund.
Quoted Fund performance is for Class A shares and does not reflect a sales charge.
The returns shown do not reflect taxes a shareholder would pay on distributions or redemptions.
Quoted Major Market Sectors, Portfolio Composition and Top 10 Holdings are subject to change.
The lists of Major Market Sectors and Top 10 Holdings exclude short-term investments and collateral held for securities loaned.
The Portfolio Composition chart excludes collateral held for securities loaned.
20
Portfolio Facts
As of October 31, 2012
| | | | | | | | |
| | | Class A | | | Institutional Class | |
Ticker | | | TPMAX | | | | TPMIX | |
Transfer Agent ID | | | 086 | | | | 486 | |
Net Assets | | | $19,448,623 | | | | $111,062,725 | |
NAV | | | $12.81 | | | | $12.86 | |
NAV - High† | | | 9/14/2012 - $13.27 | | | | 9/14/2012 - $13.31 | |
NAV - Low† | | | 11/25/2011 - $10.58 | | | | 11/25/2011 - $10.62 | |
Number of Holdings: 116 | | | | | | | | |
† | For the year ended October 31, 2012 |
Average Annual Total Returns1
As of October 31, 2012
| | | | | | | | | | | | |
Class A2 | | 1-Year | | | 5 Years | | | From Inception 6/30/2005 | |
without sales charge | | | 11.41 | % | | | 1.53 | % | | | 4.97 | % |
with sales charge | | | 5.30 | % | | | 0.39 | % | | | 4.16 | % |
| | | |
Institutional Class3 | | 1-Year | | | 5 Years | | | From Inception 6/30/2005 | |
Net Asset Value | | | 11.77 | % | | | 1.85 | % | | | 5.30 | % |

1 | Past performance is not an indication of future results. Average annual total returns represent past performance and reflect changes in share prices, the reinvestment of all dividends and capital gains, and the effects of compounding. The prospectus contains more complete information on the investment objectives, risks, charges and expenses of the investment company, which investors should read and consider carefully before investing. To obtain a prospectus, contact a registered representative or visit www.thrivent.com. At various times, the Fund’s adviser waived its management fee and/or reimbursed Fund expenses. Had the adviser not done so, the Fund’s total returns would have been lower. The returns shown do not reflect taxes a shareholder would pay on distributions or redemptions. Total investment return and principal value of your investment will fluctuate, and your shares, when redeemed, may be worth more or less than their original cost. Current performance may be higher or lower than the performance data quoted. Call 800-THRIVENT or visit www.thrivent.com for performance results current to the most recent month-end. |
2 | Class A performance with sales charge reflects the maximum sales charge of 5.5%. |
3 | Institutional Class shares have no sales load and are for institutional shareholders only. |
(a) | Performance of other classes will be greater or less than the line shown based on the differences in loads and fees paid by shareholders investing in the different classes. |
* | As you compare performance, please note that the Fund’s performance reflects the maximum 5.5% sales charge, while the Consumer Price Index and the Russell Midcap® Value Index do not reflect any such charges. If you were to purchase any of the above individual securities represented in the Index, any charges you would pay would reduce your total return as well. |
** | The Russell Midcap® Value Index is an index comprised of mid-cap companies with lower than average price-to-book ratios and lower forecasted growth values. It is not possible to invest directly in the Index. The performance of the Index does not reflect deductions for fees, expenses or taxes. |
*** | The Consumer Price Index is an inflationary indicator that measures the change in the cost of a fixed basket of products and services, including housing, electricity, food and transportation. It is not possible to invest directly in the Index. |
21
Thrivent Mid Cap Stock Fund
Brian J. Flanagan, CFA, Portfolio Manager
The Fund seeks long-term capital growth.
Mid-cap stocks offer the potential for long-term gains but can be subject to short-term price movements. Mid-sized company stock prices are generally more volatile than large company stock prices. These and other risks are described in the Fund’s prospectus. Views expressed in this discussion of fund performance are the views of this particular Fund’s portfolio management team.
How did the Fund perform during the 12-month period ended October 31, 2012?
Thrivent Mid Cap Stock Fund earned a return of 7.27%, compared with the median return of its peer group, the Lipper Mid Cap Core Funds category, of 10.94%. The Fund’s market benchmark, the Russell Midcap® Index, earned a return of 12.15%.
What factors affected the Fund’s performance?
Solid stock selection within the information technology sector was more than offset by poor performance from health care, energy and industrial investments.
Within the health care sector, rising medical costs resulted in reduced guidance and negative returns for Health Net Inc. The energy sector underperformance was led by Alpha Natural Resources Inc., which faced declining coal demand, increasing regulation, and competition from low-cost natural gas. Weatherford International Ltd. also declined as poor tax accounting required the firm to refile its financial statements.
FTI Consulting Inc. had the largest decline within the industrial sector holdings as falling demand hurt the firm’s performance. Declining global trade also hurt Expeditors International of Washington, Inc.
Another overriding theme that has negatively impacted performance has been the Fund’s focus on valuation versus growth, the latter factor being more important to investment returns in the preceding 12 months.
The information technology outperformance was broad- based and included IT services stocks Corelogic Inc. and Alliance Data Systems Corporation. Internet software companies eBay Inc. and Akamai Technologies Inc. also contributed to the strong technology performance.
What is your outlook?
The Fund’s risk profile is heavily weighted toward security selection, as the macro backdrop is decidedly mixed. In our opinion, declining economies across Europe, a slowdown in China, and the approaching U.S. fiscal cliff in 2013 are risks that are somewhat offset by easy monetary policy worldwide. Financial sector investments represent the largest weighting within the Fund. Improved pricing, attractive valuations and negative sentiment within the insurance industry is providing many opportunities.
The Fund is also well represented by the information technology sector driven by the Internet, services and semiconductor industries. Semiconductor fundamentals have been weak this year. In our opinion however, attractive valuations, low inventories, and units under shipping demand make this cyclical industry an attractive area. Weak growth, resulting in excess capacity and poor pricing power, has recently limited opportunities within the industrial and materials sectors. Within industrials, a declining defense budget combined with a shifting military focus seems to be creating a difficult backdrop for defense firms.
| | | | |
| Major Market Sectors | |
| (% of Net Assets) | |
Financials | | | 21.9 | % |
Information Technology | | | 18.4 | % |
Consumer Discretionary | | | 14.9 | % |
Industrials | | | 11.9 | % |
Health Care | | | 10.6 | % |
Energy | | | 6.8 | % |
Utilities | | | 5.0 | % |
Consumer Staples | | | 3.4 | % |
Materials | | | 2.7 | % |
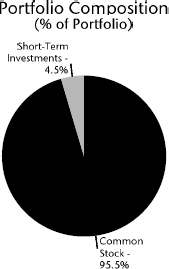
| | | | |
| Top 10 Holdings | |
| (% of Net Assets) | |
Alliance Data Systems Corporation | | | 3.6 | % |
HCC Insurance Holdings, Inc. | | | 2.9 | % |
Teradyne, Inc. | | | 2.3 | % |
Charter Communications, Inc. | | | 2.3 | % |
CoreLogic, Inc. | | | 2.1 | % |
Xilinx, Inc. | | | 2.0 | % |
Manitowoc Company, Inc. | | | 2.0 | % |
Oshkosh Corporation | | | 2.0 | % |
Ingredion, Inc. | | | 1.9 | % |
NV Energy, Inc. | | | 1.9 | % |
These securities represent 23.0% of the total net assets of the Fund.
Quoted Fund performance is for Class A shares and does not reflect a sales charge.
The returns shown do not reflect taxes a shareholder would pay on distributions or redemptions.
Quoted Major Market Sectors, Portfolio Composition and Top 10 Holdings are subject to change.
The lists of Major Market Sectors and Top 10 Holdings exclude short-term investments and collateral held for securities loaned.
The Portfolio Composition chart excludes collateral held for securities loaned.
22
The investing landscape remains challenging and fluid. Absolute and relative equity valuations are not stretched, yet domestic growth remains tepid and fiscal policy uncertain. Internationally, Europe struggles to navigate through a sovereign debt crisis and China continues a delicate balancing act between economic growth and inflation. Areas of emphasis within the Fund may change as opportunities present themselves, yet the focus will remain on fundamental, bottom-up stock picking.
Portfolio Facts
As of October 31, 2012
| | | | | | | | |
| | | Class A | | | Institutional Class | |
Ticker | | | AASCX | | | | TMSIX | |
Transfer Agent ID | | | 021 | | | | 051 | |
Net Assets | | | $517,523,970 | | | | $220,419,391 | |
NAV | | | $15.34 | | | | $16.63 | |
NAV - High† | | | 9/14/2012 - $16.03 | | | | 9/14/2012 - $17.36 | |
NAV - Low† | | | 11/25/2011 - $13.01 | | | | 11/25/2011 - $14.04 | |
Number of Holdings: 69 | | | | | | | | |
† | For the year ended October 31, 2012 |
Average Annual Total Returns1
As of October 31, 2012
| | | | | | | | | | | | |
Class A2 | | 1-Year | | | 5 Years | | | 10 Years | |
without sales charge | | | 7.27 | % | | | -0.04 | % | | | 8.54 | % |
with sales charge | | | 1.39 | % | | | -1.17 | % | | | 7.93 | % |
| | | |
Institutional Class3 | | 1-Year | | | 5 Years | | | 10 Years | |
Net Asset Value | | | 7.78 | % | | | 0.48 | % | | | 9.11 | % |
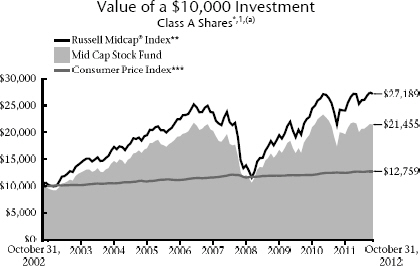
1 | Past performance is not an indication of future results. Average annual total returns represent past performance and reflect changes in share prices, the reinvestment of all dividends and capital gains, and the effects of compounding. The prospectus contains more complete information on the investment objectives, risks, charges and expenses of the investment company, which investors should read and consider carefully before investing. To obtain a prospectus, contact a registered representative or visit www.thrivent.com. At various times, the Fund’s adviser waived its management fee and/or reimbursed Fund expenses. Had the adviser not done so, the Fund’s total returns would have been lower. The returns shown do not reflect taxes a shareholder would pay on distributions or redemptions. Total investment return and principal value of your investment will fluctuate, and your shares, when redeemed, may be worth more or less than their original cost. Current performance may be higher or lower than the performance data quoted. Call 800-THRIVENT or visit www.thrivent.com for performance results current to the most recent month-end. |
2 | Class A performance with sales charge reflects the maximum sales charge of 5.5%. |
3 | Institutional Class shares have no sales load and are for institutional shareholders only. |
(a) | Performance of other classes will be greater or less than the line shown based on the differences in loads and fees paid by shareholders investing in the different classes. |
* | As you compare performance, please note that the Fund’s performance reflects the maximum 5.5% sales charge, while the Russell Midcap® Index and the Consumer Price Index do not reflect any such charges. If you were to purchase any of the above individual securities represented in the Index, any charges you would pay would reduce your total return as well. |
** | The Russell Midcap® Index is an index that measures the performance of the smallest 800 securities in the Russell 1000® Index, as ranked by total market capitalization. It is not possible to invest directly in these Indexes. The performance of these Indexes does not reflect deductions for fees, expenses or taxes. |
*** | The Consumer Price Index is an inflationary indicator that measures the change in the cost of a fixed basket of products and services, including housing, electricity, food and transportation. It is not possible to invest directly in the Index. |
23
| | |

| | Thrivent Partner Worldwide Allocation Fund |
| | Subadvised by Mercator Asset Management, LP, Principal Global Investors, LLC, Aberdeen Asset Managers Limited, DuPont Capital Management, Inc., Victory Capital Management, Inc. and Goldman Sachs Asset Management, L.P. |
| | The Fund seeks long-term capital growth. |
| | Foreign investments, as compared to domestic ones, involve additional risks, including currency fluctuations, different accounting standards, and greater political, economic and market instability. These risks are magnified when the portfolio invests in emerging markets, which may be of relatively small size and less liquid than domestic markets. These and other risks are described in the Fund’s prospectus. Views expressed in this discussion of fund performance are the views of this particular Fund’s portfolio management team. |
How did the Fund perform during the 12-month period ended October 31, 2012?
Thrivent Partner Worldwide Allocation Fund earned a return of 6.20%, compared with the median return of its peer group, the Lipper International Multi-Cap Core Funds category, of 5.47%. The Fund’s market benchmark, the Morgan Stanley Capital International (MSCI) All Country World Index ex-USA, earned a return of 4.48%.
What factors affected the Fund’s performance?
Asset allocation to areas outside of large capitalization and euro-centric markets was a key factor in portfolio performance. Secondarily, strong performance on the part of select segment managers was another contributing issue.
The Fund had approximately 10% of assets allocated to emerging market debt securities. Unlike in the U.S., that component of the Fund outperformed equity markets by a significant amount, lifting comparisons versus an equity-only benchmark. Additionally, our managers in that segment added value versus its benchmark, further enhancing the contribution from that segment of the portfolio. Also, we had approximately 15% of the Fund allocated to emerging market equities. Our manager in that segment significantly outperformed both its peer group and its index, adding meaningfully to the overall Fund return.
Mitigating some of that was subpar returns to our large-cap value allocation. That manager was exposed to the financial sector that for the entire period underperformed the overall market. This underperformance was concentrated in the early part of the year—and we did see a partial recovery later in the period—but for the full year, it limited returns. Our allocation to mid- and small-cap companies in EAFE-based markets was also a limiting factor for returns while our allocation to large-cap growth was largely a neutral.
What is your outlook?
Non-U.S. equity markets have undergone various levels of corrections related to area-specific uncertainties. The euro area continues to be negatively impacted by fiscal and budget challenges and a severe banking crisis. China’s growth has slowed due not only to slackening demand from its customers in Europe and the U.S. but also from challenging domestic issues. In both cases, their markets are discounting much of the bad news, and we believe opportunities exist to own good assets at relatively low valuations.
Major Market Sectors
(% of Net Assets)
| | | | |
Financials | | | 17.8 | % |
Industrials | | | 14.7 | % |
Consumer Discretionary | | | 12.3 | % |
Energy | | | 10.4 | % |
Materials | | | 9.6 | % |
Consumer Staples | | | 8.4 | % |
Health Care | | | 7.2 | % |
Foreign Government | | | 7.1 | % |
Information Technology | | | 6.1 | % |
Telecommunications Services | | | 3.4 | % |
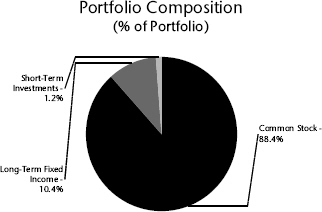
Top 10 Countries
(% of Net Assets)
| | | | |
Japan | | | 13.0 | % |
United Kingdom | | | 12.2 | % |
Germany | | | 7.1 | % |
Switzerland | | | 6.9 | % |
France | | | 6.1 | % |
Canada | | | 3.8 | % |
Hong Kong | | | 3.4 | % |
Brazil | | | 3.3 | % |
Australia | | | 3.3 | % |
Netherlands | | | 3.1 | % |
Investments in securities in these countries represent 62.2% of the total net assets of the Fund.
Quoted Fund performance is for Class A shares and does not reflect a sales charge.
The returns shown do not reflect taxes a shareholder would pay on distributions or redemptions.
Quoted Major Market Sectors, Portfolio Composition and Top 10 Countries are subject to change.
The lists of Major Market Sectors and Top 10 Countries exclude short-term investments and collateral held for securities loaned.
The Portfolio Composition chart excludes collateral held for securities loaned.
24
Portfolio Facts
As of October 31, 2012
| | | | |
| | | Class A | | Institutional Class |
Ticker | | TWAAX | | TWAIX |
Transfer Agent ID | | 034 | | 087 |
Net Assets | | $159,530,340 | | $544,637,569 |
NAV | | $8.73 | | $8.79 |
NAV - High† | | 9/14/2012 - $8.96 | | 9/14/2012 - $9.01 |
NAV - Low† | | 11/25/2011 - $7.46 | | 11/25/2011 - $7.50 |
Number of Holdings: 593 | | | | |
| | |
† For the year ended October 31, 2012 | | | | |
Average Annual Total Returns1
As of October 31, 2012
| | | | | | | | |
Class A2 | | 1-Year | | | From
Inception
2/29/2008 | |
without sales charge | | | 6.20 | % | | | -1.78 | % |
with sales charge | | | 0.39 | % | | | -2.95 | % |
| | |
Institutional Class3 | | 1-Year | | | From
Inception
2/29/2008 | |
Net Asset Value | | | 6.58 | % | | | -1.44 | % |
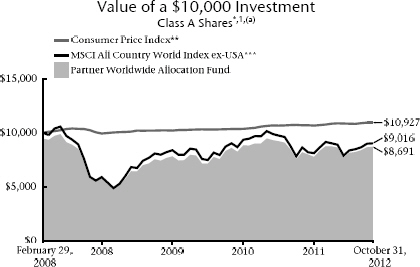
1 | Past performance is not an indication of future results. Average annual total returns represent past performance and reflect changes in share prices, the reinvestment of all dividends and capital gains, and the effects of compounding. The prospectus contains more complete information on the investment objectives, risks, charges and expenses of the investment company, which investors should read and consider carefully before investing. To obtain a prospectus, contact a registered representative or visit www.thrivent.com. At various times, the Fund’s adviser waived its management fee and/or reimbursed Fund expenses. Had the adviser not done so, the Fund’s total returns would have been lower. The returns shown do not reflect taxes a shareholder would pay on distributions or redemptions. Total investment return and principal value of your investment will fluctuate, and your shares, when redeemed, may be worth more or less than their original cost. Current performance may be higher or lower than the performance data quoted. Call 800-THRIVENT or visit www.thrivent.com for performance results current to the most recent month-end. |
2 | Class A performance with sales charge reflects the maximum sales charge of 5.5%. |
3 | Institutional Class shares have no sales load and are for institutional shareholders only. |
(a) | Performance of other classes will be greater or less than the line shown based on the differences in loads and fees paid by shareholders investing in the different classes. |
* | As you compare performance, please note that the Fund’s performance reflects the maximum 5.5% sales charge, while the MSCI All Country World Index ex-USA and the Consumer Price Index do not reflect any such charges. If you were to purchase any of the above individual securities represented in the Index, any charges you would pay would reduce your total return as well. |
** | The Consumer Price Index is an inflationary indicator that measures the change in the cost of a fixed basket of products and services, including housing, electricity, food and transportation. It is not possible to invest directly in the Index. |
*** | The MSCI All Country World Index ex-USA is an unmanaged market capitalization-weighted index that is designed to represent the performance of developed and emerging stock markets throughout the world. It is not possible to invest directly in the Index. The performance of the Index does not reflect deductions for fees, expenses or taxes. |
25
Thrivent Large Cap Growth Fund
David C. Francis, CFA, Portfolio Manager
The Fund seeks long-term capital appreciation.
Large-cap stocks are subject to the basic market risk that a particular security, or securities in general, may decrease in value over short or even extended time periods. These and other risks are described in the Fund’s prospectus. Views expressed in this discussion of fund performance are the views of this particular Fund’s portfolio management team.
How did the Fund perform during the 12-month period ended October 31, 2012?
Thrivent Large Cap Growth Fund earned a return of 11.38%, compared with the median return for its peer group, the Lipper Large Cap Growth Funds category, of 10.30%. The Fund’s market benchmark, the Russell 1000® Growth Index, earned a return of 13.02%.
What factors affected the Fund’s performance?
The Fund’s performance was favorably impacted by good selection results in the consumer and financial sectors. In the consumer group, holdings in Anheuser Busch InBev, the global brewing company, performed well. Tobacco company Altria also performed well over the period.
In the retail segment, our position in Wal-Mart Stores also performed well as the company’s effort to improve operating performance gained traction. In the financial sector, holdings in the diversified financial service companies JP Morgan Chase and Citigroup achieved improved results. Wells Fargo Company also did well, reflecting strong positioning in the market for mortgages and a well-managed loan portfolio.
Energy and information technology were sectors that underperformed their respective categories in the period. In energy, our holding in Weatherford International Inc. underperformed as the company failed to execute its business plan well and operating results did not meet expectations. Our holding in Apache Corp also did not perform well as natural gas prices were under severe pressure for the period. In technology, holdings in Cognizant Technology, Oracle Corp, Texas Instruments and Net App performed poorly over the period. A position in Apple Inc. mitigated some of that underperformance as its stock performed well but it was insufficient to totally offset that weakness.
In health care, our position in specialty pharmaceutical company Shire PLC underperformed both its group and the broader market owing to disappointing operating results in particular drug segments.
What is your outlook?
The economic recovery remains intact and growth is being sustained at a moderate pace in the U.S. Globally, much of Europe is either in or approaching a recession, while emerging market growth is being tempered by demand weakness from the developed world and imbalances within their respective economies, particularly in China. Monetary policy remains extremely accommodative, both domestically and abroad, with the expressed goal, at least in the U.S., of lifting asset prices. In the near term, this provides some support for markets even in the face of heightened policy and fiscal uncertainty.
| | | | |
| Major Market Sectors | |
| (% of Net Assets) | |
Information Technology | | | 32.5 | % |
Consumer Discretionary | | | 17.1 | % |
Health Care | | | 13.7 | % |
Industrials | | | 9.5 | % |
Energy | | | 8.3 | % |
Financials | | | 7.3 | % |
Consumer Staples | | | 5.6 | % |
Materials | | | 1.0 | % |
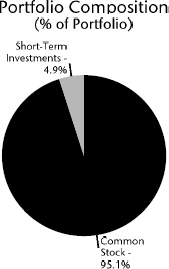
| | | | |
| Top 10 Holdings | |
| (% of Net Assets) | |
Apple, Inc. | | | 9.4 | % |
Google, Inc. | | | 4.6 | % |
QUALCOMM, Inc. | | | 3.5 | % |
Comcast Corporation | | | 3.3 | % |
Oracle Corporation | | | 3.3 | % |
UnitedHealth Group, Inc. | | | 3.1 | % |
eBay, Inc. | | | 3.0 | % |
Amazon.com, Inc. | | | 2.9 | % |
Home Depot, Inc. | | | 2.8 | % |
Biogen Idec, Inc. | | | 2.7 | % |
These securities represent 38.6% of the total net assets of the Fund.
Quoted Fund performance is for Class A shares and does not reflect a sales charge.
The returns shown do not reflect taxes a shareholder would pay on distributions or redemptions.
Quoted Major Market Sectors, Portfolio Composition and Top 10 Holdings are subject to change.
The lists of Major Market Sectors and Top 10 Holdings exclude short-term investments and collateral held for securities loaned.
The Portfolio Composition chart excludes collateral held for securities loaned.
26
We seem to be well into the stage of the economic and market cycle when risks become more elevated. As such, our emphasis remains on those companies with either strong organic and cyclical demand drivers or situations in which management actions suggest strong support for improved operating results and enhanced shareholder returns. We are finding some particularly attractive growth and valuation opportunities outside the U.S. markets, particularly in Europe, and are opportunistically taking advantage.
| | | | | | | | |
Portfolio Facts As of October 31, 2012 | |
| | | Class A | | | Institutional Class | |
Ticker | | | AAAGX | | | | THLCX | |
Transfer Agent ID | | | 027 | | | | 060 | |
Net Assets | | | $124,999,186 | | | | $224,885,555 | |
NAV | | | $5.48 | | | | $5.91 | |
NAV - High† | | | 9/14/2012 - $5.82 | | | | 9/14/2012 - $6.27 | |
NAV - Low† | | | 11/25/2011 - $4.48 | | | | 11/25/2011 - $4.81 | |
Number of Holdings: 49 | | | | | | | | |
| | |
† For the year ended October 31, 2012 | | | | | | | | |
Average Annual Total Returns1
As of October 31, 2012
| | | | | | | | | | | | |
Class A2 | | 1-Year | | | 5 Years | | | 10 Years | |
without sales charge | | | 11.38 | % | | | -1.94 | % | | | 5.22 | % |
with sales charge | | | 5.18 | % | | | -3.04 | % | | | 4.63 | % |
| | | |
Institutional Class3 | | 1-Year | | | 5 Years | | | 10 Years | |
Net Asset Value | | | 11.94 | % | | | -1.54 | % | | | 5.87 | % |
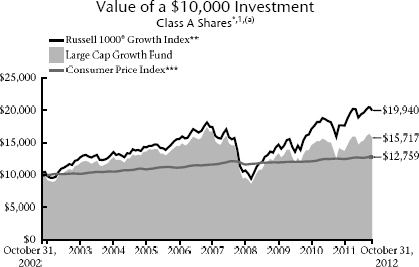
1 | Past performance is not an indication of future results. Average annual total returns represent past performance and reflect changes in share prices, the reinvestment of all dividends and capital gains, and the effects of compounding. The prospectus contains more complete information on the investment objectives, risks, charges and expenses of the investment company, which investors should read and consider carefully before investing. To obtain a prospectus, contact a registered representative or visit www.thrivent.com. At various times, the Fund’s adviser waived its management fee and/or reimbursed Fund expenses. Had the adviser not done so, the Fund’s total returns would have been lower. The returns shown do not reflect taxes a shareholder would pay on distributions or redemptions. Total investment return and principal value of your investment will fluctuate, and your shares, when redeemed, may be worth more or less than their original cost. Current performance may be higher or lower than the performance data quoted. Call 800-THRIVENT or visit www.thrivent.com for performance results current to the most recent month-end. |
2 | Class A performance with sales charge reflects the maximum sales charge of 5.5%. |
3 | Institutional Class shares have no sales load and are for institutional shareholders only. |
(a) | Performance of other classes will be greater or less than the line shown based on the differences in loads and fees paid by shareholders investing in the different classes. |
* | As you compare performance, please note that the Fund’s performance reflects the maximum 5.5% sales charge, while the Consumer Price Index and the Russell 1000® Growth Index do not reflect any such charges. If you were to purchase any of the above individual securities represented in the Index, any charges you would pay would reduce your total return as well. |
** | The Russell 1000® Growth Index measures the performance of large cap growth stocks. It is not possible to invest directly in the Index. The performance of the Index does not reflect deductions for fees, expenses or taxes. |
*** | The Consumer Price Index is an inflationary indicator that measures the change in the cost of a fixed basket of products and services, including housing, electricity, food and transportation. It is not possible to invest directly in the Index. |
27
Thrivent Large Cap Value Fund
Matthew D. Finn, CFA, Portfolio Manager
The Fund seeks to achieve long-term growth of capital.
Large-cap stocks are subject to the basic market risk that a particular security, or securities in general, may decrease in value over short or even extended time periods. These and other risks are described in the Fund’s prospectus. Views expressed in this discussion of fund performance are the views of this particular Fund’s portfolio management team.
How did the Fund perform during the 12-month period ended October 31, 2012?
Thrivent Large Cap Value Fund earned a return of 14.82%, compared with the median return of its peer group, the Lipper Large Cap Value Funds category, of 14.28%. The Fund’s market benchmark, the Russell 1000® Value Index, earned a return of 16.89%.
What factors affected the Fund’s performance?
Stock selection was strong in the energy and consumer staples sectors. In energy, EQT Corp, a natural gas exploration and production company, was the largest contributor to performance. The process involved in selecting the shares of EQT is a good illustration of the value investment approach.
As the price of natural gas declined due to the warm winter, the share prices of natural gas producers also declined. The long-run future of well-positioned natural gas production companies is bright as consumption is expected to grow due to the low cost of natural gas and its environmentally friendly use in electricity production. The decline in natural gas prices and energy and production company share prices was viewed as an opportunity rather than a problem. EQT was purchased as North American natural gas prices fell below the marginal cost of production, which eventually led to cuts in supply. Indeed, higher-cost producers had already reduced production as gas prices fell below a level that allowed them to achieve profitability. EQT is a low-cost producer in the Marcellus Shale (in Pennsylvania) and is internally able to finance production growth, which made it a high- quality choice in the industry. The portfolio continues to hold EQT.
In the consumer staples sector, Diageo PLC was the strongest performer. The alcoholic beverage company was purchased on the premise that emerging markets growth and a cyclical improvement in U.S. consumption would drive shares higher. This has proven to be the case, and the position has been reduced based upon valuation.
Financials were the weakest area of the portfolio. The portfolio position in UNUM Corporation, a group disability insurer, was expected to see operating performance improve as prior underwriting discipline benefited profitability. This did not happen and the shares have been sold.
What is your outlook?
As always, our focus is on stock selection. Buying good companies at good prices will be rewarding in the long run. As sentiment swings from optimism to pessimism about the economy or specific industries, these emotions are reflected in the valuation of company shares. We will continue to use valuation as our guide and take advantage of opportunities that present themselves.
Major Market Sectors
(% of Net Assets)
| | | | |
Financials | | | 21.6 | % |
Health Care | | | 14.8 | % |
Information Technology | | | 12.1 | % |
Energy | | | 11.8 | % |
Consumer Discretionary | | | 9.3 | % |
Industrials | | | 9.0 | % |
Consumer Staples | | | 8.8 | % |
Utilities | | | 5.0 | % |
Telecommunications Services | | | 1.8 | % |
Materials | | | 1.5 | % |
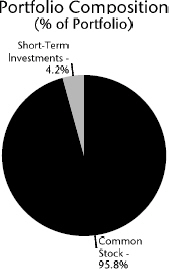
Top 10 Holdings
(% of Net Assets)
| | | | |
Oracle Corporation | | | 3.9 | % |
Pfizer, Inc. | | | 3.5 | % |
Microsoft Corporation | | | 3.4 | % |
United Technologies Corporation | | | 3.3 | % |
Merck & Company, Inc. | | | 3.2 | % |
PG&E Corporation | | | 3.0 | % |
MetLife, Inc. | | | 2.9 | % |
Lowe’s Companies, Inc. | | | 2.9 | % |
BP plc ADR | | | 2.7 | % |
EOG Resources, Inc. | | | 2.4 | % |
These securities represent 31.2% of the total net assets of the Fund.
Quoted Fund performance is for Class A shares and does not reflect a sales charge.
The returns shown do not reflect taxes a shareholder would pay on distributions or redemptions.
Quoted Major Market Sectors, Portfolio Composition and Top 10 Holdings are subject to change.
The lists of Major Market Sectors and Top 10 Holdings exclude short-term investments and collateral held for securities loaned.
The Portfolio Composition chart excludes collateral held for securities loaned.
28
The largest active weights in the portfolio include Oracle Corporation, enterprise software. Oracle sells at a low multiple of free cash flow, and the new version of its application software is expected to exceed growth expectations. United Technologies, diversified industrials, is expected to benefit from its recent acquisition of aerospace company Goodrich. Integrated oil company British Petroleum has shed lower return assets and refocused on areas of better growth and returns, which should be reflected in the share price once the cloud from the Macondo disaster lifts.
Portfolio Facts
As of October 31, 2012
| | | | | | | | |
| | | Class A | | | Institutional Class | |
Ticker | | | AAUTX | | | | TLVIX | |
Transfer Agent ID | | | 022 | | | | 092 | |
Net Assets | | | $171,145,528 | | | | $403,041,496 | |
NAV | | | $14.66 | | | | $14.76 | |
NAV - High† | | | 10/18/2012 - $15.04 | | | | 10/18/2012 - $15.15 | |
NAV - Low† | | | 11/25/2011 - $11.94 | | | | 11/25/2011 - $12.04 | |
Number of Holdings: 57 | | | | | | | | |
† | For the year ended October 31, 2012 |
Average Annual Total Returns1
As of October 31, 2012
| | | | | | | | | | | | |
Class A2 | | 1-Year | | | 5 Years | | | 10 Years | |
without sales charge | | | 14.82 | % | | | -1.64 | % | | | 6.28 | % |
with sales charge | | | 8.53 | % | | | -2.75 | % | | | 5.68 | % |
| | | |
Institutional Class3 | | 1-Year | | | 5 Years | | | 10 Years | |
Net Asset Value | | | 15.37 | % | | | -1.10 | % | | | 6.91 | % |
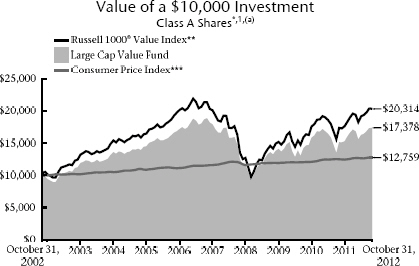
1 | Past performance is not an indication of future results. Average annual total returns represent past performance and reflect changes in share prices, the reinvestment of all dividends and capital gains, and the effects of compounding. The prospectus contains more complete information on the investment objectives, risks, charges and expenses of the investment company, which investors should read and consider carefully before investing. To obtain a prospectus, contact a registered representative or visit www.thrivent.com. At various times, the Fund’s adviser waived its management fee and/or reimbursed Fund expenses. Had the adviser not done so, the Fund’s total returns would have been lower. The returns shown do not reflect taxes a shareholder would pay on distributions or redemptions. Total investment return and principal value of your investment will fluctuate, and your shares, when redeemed, may be worth more or less than their original cost. Current performance may be higher or lower than the performance data quoted. Call 800-THRIVENT or visit www.thrivent.com for performance results current to the most recent month-end. |
2 | Class A performance with sales charge reflects the maximum sales charge of 5.5%. |
3 | Institutional Class shares have no sales load and are for institutional shareholders only. |
(a) | Performance of other classes will be greater or less than the line shown based on the differences in loads and fees paid by shareholders investing in the different classes. |
* | As you compare performance, please note that the Fund’s performance reflects the maximum 5.5% sales charge, while the Russell 1000® Value Index and the Consumer Price Index do not reflect any such charges. If you were to purchase any of the above individual securities represented in the Index, any charges you would pay would reduce your total return as well. |
** | The Russell 1000® Value Index measures the performance of large cap value stocks. It is not possible to invest directly in the Index. The performance of the Index does not reflect deductions for fees, expenses or taxes. |
*** | The Consumer Price Index is an inflationary indicator that measures the change in the cost of a fixed basket of products and services, including housing, electricity, food and transportation. It is not possible to invest directly in the Index. |
29
Thrivent Large Cap Stock Fund
David C. Francis, CFA, and Matthew D. Finn, CFA, Portfolio Co-Managers
The Fund seeks long-term capital growth.
Large-cap stocks are subject to the basic market risk that a particular security, or securities in general, may decrease in value over short or even extended time periods. These and other risks are described in the Fund’s prospectus. Views expressed in this discussion of fund performance are the views of this particular Fund’s portfolio management team.
How did the Fund perform during the 12-month period ended October 31, 2012?
Thrivent Large Cap Stock Fund earned a return of 11.75%, compared with the median return of its peer group, the Lipper Large Cap Core Funds category, of 13.32%. The Fund’s market benchmark, the S&P 500 Index, earned a return of 15.21%.
What factors affected the Fund’s performance?
The Fund’s performance was most negatively impacted compared to its respective benchmarks due to a combination of poor returns by some of our holdings in more specialized energy companies and a lack of exposure to large, integrated energy companies that performed relatively well in that segment. Specifically, our positions in equipment companies Weatherford International and Baker Hughes underperformed the sector as well as the broader market. Weatherford shares were impacted by failure to execute well on both an operating and financial basis.
In the exploration and production segment, our holding in Apache did not perform well as natural gas prices fell to extraordinarily low levels. Low gas prices put pressure on coal prices as well, a factor in the severe underperformance of our position in Peabody Coal. Both of these positions have been sold from the Fund.
Another area of subpar returns came from our information technology group holdings. A position in Citrix Systems Inc. did not perform well while an underexposure to the better-performing Microsoft Corp. limited returns. A holding in IT services provider Cognizant Systems also underperformed while an underweighting in IBM impaired our relative returns. As a theme, over the reporting period there was a decided preference for very large-capitalization companies with high-quality balance sheets. That bias reflected the rolling uncertainty that affected markets as China’s growth slowed and much of southern Europe entered into a recession.
Holdings in the financial and consumer sectors offset some of the underperformance of other groups. Bank holdings in JPMorgan Chase, Citigroup and Wells Fargo had a favorable impact. Wal-Mart Stores Inc. performed well in the retail sector, but poor returns by an early holding in J.C. Penney Company offset those gains. Altria in the tobacco group and Anheuser Busch InBev in the brewing segment also lifted returns.
What is your outlook?
As the economic and stock market cycles mature, one must become more cognizant of risks to the outlook, particularly given the nature of the recovery to date. While fiscal policy remains highly uncertain, monetary authorities have provided unprecedented levels of support for financial assets and are committed to doing so for an extended period. This activity doesn’t preclude an adjustment in asset prices should economic activity deteriorate, but we think it does mitigate some of the risk. Housing appears to have stabilized and bank lending is improving—both of which are critical factors in sustaining confidence.
| | | | |
| Major Market Sectors | |
| (% of Net Assets) | |
Information Technology | | | 17.7 | % |
Health Care | | | 14.0 | % |
Consumer Discretionary | | | 13.8 | % |
Financials | | | 13.6 | % |
Industrials | | | 11.1 | % |
Energy | | | 8.5 | % |
Consumer Staples | | | 5.2 | % |
Utilities | | | 3.1 | % |
Materials | | | 1.5 | % |
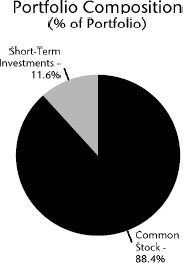
| | | | |
| Top 10 Holdings | |
| (% of Net Assets) | |
Apple, Inc. | | | 5.7 | % |
Pfizer, Inc. | | | 4.5 | % |
J.P. Morgan Chase & Company | | | 4.3 | % |
United Technologies Corporation | | | 3.8 | % |
Citigroup, Inc. | | | 3.6 | % |
Merck & Company, Inc. | | | 3.4 | % |
AutoZone, Inc. | | | 3.3 | % |
Kimberly-Clark Corporation | | | 3.1 | % |
NiSource, Inc. | | | 3.1 | % |
BP plc ADR | | | 2.6 | % |
These securities represent 37.4% of the total net assets of the Fund.
Quoted Fund performance is for Class A shares and does not reflect a sales charge.
The returns shown do not reflect taxes a shareholder would pay on distributions or redemptions.
Quoted Major Market Sectors, Portfolio Composition and Top 10 Holdings are subject to change.
The lists of Major Market Sectors and Top 10 Holdings exclude short-term investments and collateral held for securities loaned.
The Portfolio Composition chart excludes collateral held for securities loaned.
30
We remain focused on companies with good organic growth as well as strong operating models. We are finding some interesting opportunities outside of the U.S. as many foreign markets have experienced substantial declines relative to U.S. asset prices.
Portfolio Facts
As of October 31, 2012
| | | | | | | | |
| | | Class A | | | Institutional Class | |
Ticker | | | AALGX | | | | IILGX | |
Transfer Agent ID | | | 017 | | | | 090 | |
Net Assets | | | $1,382,461,581 | | | | $170,305,192 | |
NAV | | | $23.64 | | | | $23.82 | |
NAV - High† | | | 9/14/2012 - $24.47 | | | | 9/14/2012 - $24.64 | |
NAV - Low† | | | 11/25/2011 - $19.56 | | | | 11/25/2011 - $19.73 | |
Number of Holdings: 52 | | | | | | | | |
† | For the year ended October 31, 2012 |
Average Annual Total Returns1
As of October 31, 2012
| | | | | | | | | | | | |
Class A2 | | 1-Year | | | 5 Years | | | 10 Years | |
without sales charge | | | 11.75 | % | | | -2.36 | % | | | 4.20 | % |
with sales charge | | | 5.61 | % | | | -3.45 | % | | | 3.61 | % |
| | | |
Institutional Class3 | | 1-Year | | | 5 Years | | | 10 Years | |
Net Asset Value | | | 12.27 | % | | | -1.86 | % | | | 4.70 | % |
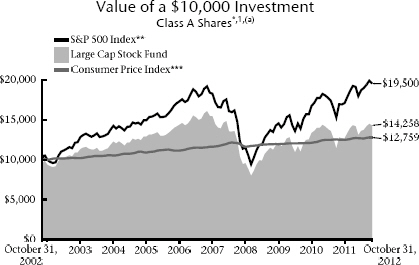
1 | Past performance is not an indication of future results. Average annual total returns represent past performance and reflect changes in share prices, the reinvestment of all dividends and capital gains, and the effects of compounding. The prospectus contains more complete information on the investment objectives, risks, charges and expenses of the investment company, which investors should read and consider carefully before investing. To obtain a prospectus, contact a registered representative or visit www.thrivent.com. At various times, the Fund’s adviser waived its management fee and/or reimbursed Fund expenses. Had the adviser not done so, the Fund’s total returns would have been lower. The returns shown do not reflect taxes a shareholder would pay on distributions or redemptions. Total investment return and principal value of your investment will fluctuate, and your shares, when redeemed, may be worth more or less than their original cost. Current performance may be higher or lower than the performance data quoted. Call 800-THRIVENT or visit www.thrivent.com for performance results current to the most recent month-end. |
2 | Class A performance with sales charge reflects the maximum sales charge of 5.5%. |
3 | Institutional Class shares have no sales load and are for institutional shareholders only. |
(a) | Performance of other classes will be greater or less than the line shown based on the differences in loads and fees paid by shareholders investing in the different classes. |
* | As you compare performance, please note that the Fund’s performance reflects the maximum 5.5% sales charge, while the S&P 500 Index and the Consumer Price Index do not reflect any such charges. If you were to purchase any of the above individual securities represented in the Index, any charges you would pay would reduce your total return as well. |
** | The S&P 500 Index is an index that represents the average performance of a group of 500 widely held, publicly traded stocks. “S&P 500®” is a trademark of The McGraw-Hill Companies, Inc. and has been licensed for use by Thrivent Financial for Lutherans. The product is not sponsored, endorsed or promoted by Standard & Poor’s and Standard & Poor’s makes no representation regarding the advisability of investing in the product. It is not possible to invest directly in the Index. The performance of the Index does not reflect deductions for fees, expenses or taxes. |
*** | The Consumer Price Index is an inflationary indicator that measures the change in the cost of a fixed basket of products and services, including housing, electricity, food and transportation. It is not possible to invest directly in the Index. |
31
Thrivent Balanced Fund
Gregory R. Anderson, CFA, Darren M. Bagwell, CFA, and Michael G. Landreville, CFA and CPA (inactive), Portfolio Co-Managers
The Fund seeks long-term total return through a balance between income and the potential for long-term capital growth.
The Fund is subject to interest rate risk, credit risk and volatility risk, which may result in overall price fluctuations over short or even extended time periods. Common stocks are subject to the basic market risk that a particular security, or securities in general, may decrease in value over short or even extended time periods. These and other risks are described in the Fund’s prospectus. Views expressed in this discussion of fund performance are the views of this particular Fund’s portfolio management team.
How did the Fund perform during the 12-month period ended October 31, 2012?
Thrivent Balanced Fund earned a return of 8.22%, compared with the median return of its peer group, the Lipper Mixed-Asset Target Allocation Growth Funds category, of 9.67%. The Fund’s market benchmarks, the S&P Composite 1500 Index and the Barclays U.S. Aggregate Bond Index (“Barclays Index”), earned returns of 14.94% and 5.25%, respectively.
What factors affected the Fund’s performance?
During the period, we maintained the Fund’s ongoing investment allocation of approximately two-thirds in equities with the remainder in fixed-income securities. Overall performance of the equity portion of the Fund was negatively impacted by the pro-cyclical bias of our holdings during a period in which sluggish worldwide economic growth favored more-defensive investments. While the equity portfolio is sector-neutral, our intra-sector holdings favored companies that were leveraged to an improvement in global demand conditions that did not develop. In particular, our investments within the technology, energy and industrial sectors were the most negative influences on relative performance. The consumer staples sector was the equity portfolio’s biggest contributor to relative performance, largely because it was one of the few areas where we were conservatively positioned.
The fixed-income portion of the Fund modestly underperformed its Lipper peers. An overweighting to risk assets such as corporate bonds, asset-backed securities (ABS), mortgage-backed securities (MBS) and commercial mortgage-backed securities (CMBS) hurt performance in the first fiscal quarter, but helped recoup some of our losses in the second. We subsequently reduced the portfolio’s risk profile a bit too soon in the second half of the fiscal year, and did not recapture all of the underperformance. However, we did benefit from owning strong-performing Treasury Inflation Protected Securities (TIPS) and a significant amount of MBS the Federal Reserve chose to purchase through its QE3 program. The fixed-income portfolio significantly outperformed the Barclays Index due to its greater exposure to corporate bonds, CMBS, TIPS and MBS.
What is your outlook?
Despite concerted efforts by the Fed and other central banks to flood economies with monetary liquidity, we believe sluggish growth will persist for the foreseeable future due to fiscal and regulatory headwinds, recessionary conditions in Europe and slower consumer spending. We are concerned that demand and profitability expectations are too high for 2013, and that negative outlook adjustments will mute equity market performance. Therefore, our equity portfolio will seek to emphasize companies with strong new product cycles, productivity-enhancing value propositions and superior demand visibility. As always, we will strive to outperform through stock selection, while keeping sector weights at benchmark levels.
| | | | |
| Major Market Sectors | |
| (% of Net Assets) | |
Financials | | | 15.9 | % |
Information Technology | | | 11.8 | % |
Mortgage-Backed Securities | | | 10.0 | % |
Consumer Discretionary | | | 10.0 | % |
U.S. Government and Agencies | | | 9.8 | % |
Industrials | | | 8.3 | % |
Health Care | | | 7.5 | % |
Consumer Staples | | | 7.0 | % |
Energy | | | 7.0 | % |
Utilities | | | 3.8 | % |
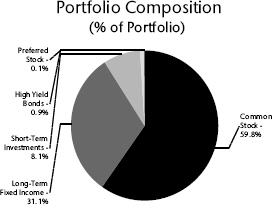
| | | | |
| Top 10 Holdings | |
| (% of Net Assets) | |
U.S. Treasury Notes | | | 2.7 | % |
Federal National Mortgage Association Conventional 30-Yr. Pass Through | | | 2.5 | % |
Federal National Mortgage Association Conventional 30-Yr. Pass Through | | | 2.2 | % |
Apple, Inc. | | | 2.1 | % |
Procter & Gamble Company | | | 2.0 | % |
Las Vegas Sands Corporation | | | 2.0 | % |
Comcast Corporation | | | 1.7 | % |
Materials Select Sector SPDR Fund | | | 1.6 | % |
Utilities Select Sector SPDR Fund | | | 1.6 | % |
Oracle Corporation | | | 1.5 | % |
These securities represent 19.9% of the total net assets of the Fund.
Quoted Fund performance is for Class A shares and does not reflect a sales charge.
The returns shown do not reflect taxes a shareholder would pay on distributions or redemptions.
Quoted Major Market Sectors, Portfolio Composition and Top 10 Holdings are subject to change.
The lists of Major Market Sectors and Top 10 Holdings exclude short-term investments and collateral held for securities loaned.
The Portfolio Composition chart excludes collateral held for securities loaned.
32
We also believe fixed-income market performance may have gotten ahead of actual economic performance and some correction in risk assets is likely. Therefore, the fixed-income portfolio is starting the new fiscal year in a more-defensive posture: underweight in corporate bonds, neutral in high-quality securitized assets and overweight in longer-maturity Treasuries, including TIPS.
Portfolio Facts
As of October 31, 2012
| | | | | | | | |
| | | Class A | | | Institutional Class | |
Ticker | | | AABFX | | | | IBBFX | |
Transfer Agent ID | | | 026 | | | | 056 | |
Net Assets | | | $141,015,387 | | | | $49,896,272 | |
NAV | | | $12.63 | | | | $12.61 | |
NAV - High† | | | 9/14/2012 - $13.02 | | | | 9/14/2012 - $13.01 | |
NAV - Low† | | | 12/19/2011 - $11.27 | | | | 12/19/2011 - $11.26 | |
Number of Holdings: 275 | | | | | | | | |
† | For the year ended October 31, 2012 |
Average Annual Total Returns1
As of October 31, 2012
| | | | | | | | | | | | |
Class A2 | | 1-Year | | | 5 Years | | | 10 Years | |
without sales charge | | | 8.22 | % | | | 1.80 | % | | | 5.45 | % |
with sales charge | | | 2.30 | % | | | 0.66 | % | | | 4.86 | % |
| | | |
Institutional Class3 | | 1-Year | | | 5 Years | | | 10 Years | |
Net Asset Valued | | | 8.72 | % | | | 2.30 | % | | | 5.97 | % |
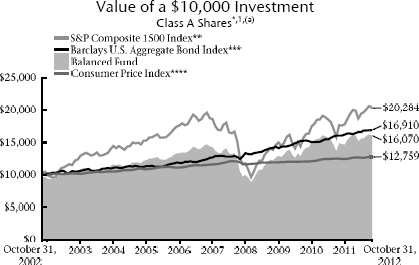
1 | Past performance is not an indication of future results. Average annual total returns represent past performance and reflect changes in share prices, the reinvestment of all dividends and capital gains, and the effects of compounding. The prospectus contains more complete information on the investment objectives, risks, charges and expenses of the investment company, which investors should read and consider carefully before investing. To obtain a prospectus, contact a registered representative or visit www.thrivent.com. At various times, the Fund’s adviser waived its management fee and/or reimbursed Fund expenses. Had the adviser not done so, the Fund’s total returns would have been lower. The returns shown do not reflect taxes a shareholder would pay on distributions or redemptions. Total investment return and principal value of your investment will fluctuate, and your shares, when redeemed, may be worth more or less than their original cost. Current performance may be higher or lower than the performance data quoted. Call 800-THRIVENT or visit www.thrivent.com for performance results current to the most recent month-end. |
2 | Class A performance with sales charge reflects the maximum sales charge of 5.5%. |
3 | Institutional Class shares have no sales load and are for institutional shareholders only. |
(a) | Performance of other classes will be greater or less than the line shown based on the differences in loads and fees paid by shareholders investing in the different classes. |
* | As you compare performance, please note that the Fund’s performance reflects the maximum 5.5% sales charge, while the Barclays U.S. Aggregate Bond Index, the S&P Supercomposite 1500 Index and the Consumer Price Index do not reflect any such charges. If you were to purchase any of the above individual securities represented in these Indexes, any charges you would pay would reduce your total return as well. |
** | The S&P Supercomposite 1500 Index measures the performance of a group of 1500 publicly traded stocks. It is not possible to invest directly in the Index. The performance of the Index does not reflect deductions for fees, expenses or taxes. |
*** | The Barclays U.S. Aggregate Bond Index is an index that measures the performance of U.S. investment grade bonds. It is not possible to invest directly in the Index. The performance of the Index does not reflect deductions for fees, expenses or taxes. |
**** | The Consumer Price Index is an inflationary indicator that measures the change in the cost of a fixed basket of products and services, including housing, electricity, food and transportation. It is not possible to invest directly in the Index. |
33
Thrivent High Yield Fund
Paul J. Ocenasek, CFA, Portfolio Manager
The Fund seeks high current income and, secondarily, growth of capital.
The Fund typically invests a majority of its assets in high-yield bonds (commonly referred to as junk bonds). Although high-yield bonds can have a higher current yield than investment-grade bonds, high-yield bonds are also subject to greater price fluctuations and increased risk of loss of principal than investment-grade bonds. These and other risks are described in the Fund’s prospectus. Views expressed in this discussion of fund performance are the views of this particular Fund’s portfolio management team.
How did the Fund perform during the 12-month period ended October 31, 2012?
Thrivent High Yield Fund earned a return of 13.96%, compared with the median return of its peer group, the Lipper U.S. High Current Yield Funds category, of 12.33%. The Fund’s market benchmark, the Barclays U.S. Corporate High Yield Bond Index, earned a return of 13.61%.
What factors affected the Fund’s performance?
The high-yield market produced very strong results overall for the fiscal year, despite a sell off midway through April and May due to concerns about the debt situation in Europe. As the year progressed, ongoing policy actions by the Federal Reserve and the European Central Bank emboldened investors’ risk appetites and bolstered high-yield markets. The market also benefited from near-record inflows due to insatiable investor demand for products that provide yield in the low-interest-rate environment. The yield spread between high-yield bonds and Treasuries narrowed for much of the fiscal year, falling from 6.77% at the beginning of the period to 5.43% by the end. In addition, the market continued to be supported by a relatively low default rate, which rose slightly to around 3.0% after bottoming out below 2.0% at the end of 2011.
The strongest-performing areas of the high-yield market included financial, housing and consumer-related industries as employment and housing showed slight improvements and U.S. economic growth remained positive, albeit slow. The weakest areas included metals and mining, energy and power production, due to Europe’s recession and slowing Chinese growth.
The Fund outpaced its peer group and benchmark almost exclusively because of strong security selection. In particular, the Fund experienced stellar relative results from its energy holdings, which more than offset the drag from its overweighted position in this underperforming sector. Gaming and transportation credits also performed well. Regarding other industry weights, the Fund benefited from underweighting positions in electric utilities and cash, but was hindered by an overweighting in metals and mining and an underweighting in European banks. The Fund’s ratings profile had little impact on performance, as returns among BB-, B- and CCC-rated securities were very similar over the fiscal year.
What is your outlook?
Although we expect economic growth to remain slow, our outlook for the high-yield market is still relatively positive. The market will continue to be buttressed by the Fed’s ongoing efforts to pump liquidity into the economy. Also, the financial health of issuing companies continues to improve, while default rates among high-yield bond issuers are projected to remain below historical averages. However, we are keeping an eye on several larger macro risks that still exist, including the approaching U.S. fiscal cliff and Europe’s ongoing debt crisis.
| | | | |
| Major Market Sectors | |
| (% of Net Assets) | |
Communications Services | | | 20.1 | % |
Consumer Cyclical | | | 13.6 | % |
Consumer Non-Cyclical | | | 12.7 | % |
Energy | | | 11.0 | % |
Financials | | | 8.6 | % |
Basic Materials | | | 7.8 | % |
Capital Goods | | | 7.6 | % |
Utilities | | | 5.0 | % |
Technology | | | 4.7 | % |
Transportation | | | 3.0 | % |
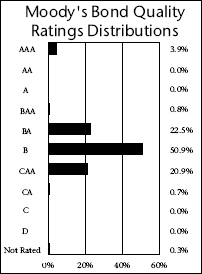
| | | | |
| Top 10 Holdings | |
| (% of Net Assets) | |
Sprint Nextel Corporation | | | 1.2 | % |
Clear Channel Worldwide Holdings, Inc. | | | 1.0 | % |
Sprint Nextel Corporation | | | 0.9 | % |
Intelsat Bermuda, Ltd. | | | 0.8 | % |
Intelsat Jackson Holdings SA | | | 0.8 | % |
Omega Healthcare Investors, Inc. | | | 0.8 | % |
Biomet, Inc. | | | 0.8 | % |
AES Corporation | | | 0.7 | % |
WideOpenWest Finance, LLC | | | 0.7 | % |
Crown Castle International Corporation | | | 0.7 | % |
These securities represent 8.4% of the total net assets of the Fund.
Quoted Fund performance is for Class A shares and does not reflect a sales charge.
The returns shown do not reflect taxes a shareholder would pay on distributions or redemptions.
Quoted Major Market Sectors, Moody’s Bond Quality Ratings Distributions and Top 10 Holdings are subject to change.
The lists of Major Market Sectors and Top 10 Holdings exclude short-term investments and collateral held for securities loaned.
34
All that being said, the capital appreciation potential for high-yield bonds will be somewhat limited as yields are at historic lows, prices are toward their highs and most bonds are call-constrained. Therefore, we are expecting to see more coupon-like returns in the high-yield market in the coming year.
Given these factors, we are maintaining a slightly more-defensive risk profile in the Fund. We intend to stay fully invested with a slight underweight in the lower quality (CCC-rated) tier of the market. We will continue to emphasize more-stable industries and those that will benefit from the improving housing market, such as health care, telecommunications, cable, building materials and consumer products.
Portfolio Facts
As of October 31, 2012
| | | | | | | | |
| | | Class A | | | Institutional Class | |
Ticker | | | LBHYX | | | | LBHIX | |
Transfer Agent ID | | | 073 | | | | 473 | |
Net Assets | | | $520,048,625 | | | | $285,690,708 | |
NAV | | | $5.01 | | | | $5.01 | |
NAV - High† | | | 9/18/2012 - $5.05 | | | | 9/18/2012 - $5.05 | |
NAV - Low† | | | 11/25/2011 - $4.54 | | | | 11/25/2011 - $4.54 | |
Number of Holdings: 272 | | | | | | | | |
† | For the year ended October 31, 2012 |
Average Annual Total Returns1
As of October 31, 2012
| | | | | | | | | | | | |
Class A2 | | 1-Year | | | 5 Years | | | 10 Years | |
without sales charge | | | 13.96 | % | | | 8.08 | % | | | 9.92 | % |
with sales charge | | | 8.87 | % | | | 7.07 | % | | | 9.41 | % |
| | | |
Institutional Class3 | | 1-Year | | | 5 Years | | | 10 Years | |
Net Asset Value | | | 14.12 | % | | | 8.47 | % | | | 10.37 | % |

1 | Past performance is not an indication of future results. Average annual total returns represent past performance and reflect changes in share prices, the reinvestment of all dividends and capital gains, and the effects of compounding. The prospectus contains more complete information on the investment objectives, risks, charges and expenses of the investment company, which investors should read and consider carefully before investing. To obtain a prospectus, contact a registered representative or visit www.thrivent.com. At various times, the Fund’s adviser waived its management fee and/or reimbursed Fund expenses. Had the adviser not done so, the Fund’s total returns would have been lower. The returns shown do not reflect taxes a shareholder would pay on distributions or redemptions. Total investment return and principal value of your investment will fluctuate, and your shares, when redeemed, may be worth more or less than their original cost. Current performance may be higher or lower than the performance data quoted. Call 800-THRIVENT or visit www.thrivent.com for performance results current to the most recent month-end. |
2 | Class A performance with sales charge reflects the maximum sales charge of 4.5%. |
3 | Institutional Class shares have no sales load and are for institutional shareholders only. |
(a) | Performance of other classes will be greater or less than the line shown based on the differences in loads and fees paid by shareholders investing in the different classes. |
* | As you compare performance, please note that the Fund’s performance reflects the maximum 4.5% sales charge, while the Barclays U.S. Corporate High Yield Bond Index and the Consumer Price Index do not reflect any such charges. If you were to purchase any of the above individual securities represented in the Index, any charges you would pay would reduce your total return as well. |
** | The Barclays U.S. Corporate High Yield Bond Index is an index which measures the performance of fixed-rate non-investment grade bonds. It is not possible to invest directly in the Index. The performance of the Index does not reflect deductions for fees, expenses or taxes. |
*** | The Consumer Price Index is an inflationary indicator that measures the change in the cost of a fixed basket of products and services, including housing, electricity, food and transportation. It is not possible to invest directly in the Index. |
35
Thrivent Municipal Bond Fund
Janet I. Grangaard, CFA, Portfolio Manager
The Fund seeks a high level of current income exempt from federal income taxes, consistent with capital preservation.*
The Fund is subject to interest rate risk, credit risk related to an underlying issuer’s financial position and volatility risk, which may result in overall price fluctuations over short or even extended time periods. These and other risks are described in the Fund’s prospectus. Views expressed in this discussion of fund performance are the views of this particular Fund’s portfolio management team.
How did the Fund perform during the 12-month period ended October 31, 2012?
Thrivent Municipal Bond Fund earned a return of 9.61%, compared with the median return of its peer group, the Lipper General Municipal Debt Funds category, of 10.89%. The Fund’s market benchmark, the Barclays Municipal Bond Index, earned a return of 9.03%.
What factors affected the Fund’s performance?
The municipal bond market experienced strong results over the fiscal-year period, outpacing Treasuries by a significant margin. Highly accommodative monetary policy by the Federal Reserve drove interest rates lower, which, in turn, fueled a rally in fixed-income asset prices. Non-Treasury fixed-income markets, including municipals, also benefited from tremendous inflows as investors sought out higher-yielding options in the low-rate environment.
Credit spreads narrowed as investors reached for yield amidst their increased comfort with the slow economic recovery and the resulting general improvement in local government budgets. While municipal bond issuance increased somewhat compared to last year’s depressed levels, much of the supply was the result of refunding. As bonds issued years ago at higher yields hit their first call dates, issuers elected to refinance them, which did not meaningfully increase the supply of bonds outstanding.
As a result of credit spread narrowing, lower-grade securities outperformed higher-credit quality bonds over the period. In addition, longer-duration securities outpaced their shorter counterparts due to the general rate decrease. Riskier municipal bond sectors—including tobacco settlement, industrial development revenue and health care bonds—were also the best performers in this environment.
The Fund fell short of its Lipper peers, but outperformed the Barclays benchmark, as our risk profile placed it between the two benchmarks. Compared to the peer group, the Fund has less exposure to A-rated and lower-rated securities and a shorter duration, which led to less interest-rate sensitivity. We were not comfortable taking as much credit and duration risk as our peers, based on current economic uncertainties and the absolute low levels of rates. Compared to the Barclays index, the Fund had more bonds rated A or below and a longer duration.
In terms of sectors, performance was enhanced by two of our largest weightings: health care and higher education. However, our Fund’s overweighting to pre-refunded bonds negatively impacted total return, while continuing to benefit the Fund’s dividend yield. These older, higher coupon issues have been escrowed with U.S. Treasuries to their first call dates, making them high-quality, short-duration issues, which underperformed during this period.
| | | | |
| Major Market Sectors | |
| (% of Net Assets) | |
Other Revenue | | | 16.5 | % |
General Obligation | | | 15.7 | % |
Transportation | | | 14.7 | % |
Health Care | | | 13.1 | % |
Education | | | 11.2 | % |
Escrowed/Pre-refunded | | | 10.2 | % |
Tax Revenue | | | 4.7 | % |
Water & Sewer | | | 4.4 | % |
Industrial Development Revenue | | | 4.1 | % |
Electric Revenue | | | 3.7 | % |
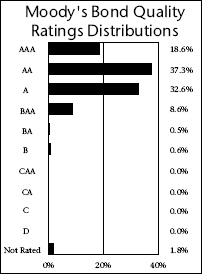
| | | | |
| Top 10 States | |
| (% of Net Assets) | |
California | | | 12.4 | % |
Texas | | | 12.0 | % |
Illinois | | | 8.4 | % |
New York | | | 6.6 | % |
Massachusetts | | | 5.0 | % |
Colorado | | | 4.9 | % |
Florida | | | 4.8 | % |
Pennsylvania | | | 3.8 | % |
Washington | | | 3.6 | % |
Minnesota | | | 3.2 | % |
Investments in securities in these States represent 64.7% of the total net assets of the Fund.
*Investors may be subject to state taxes, the federal alternative minimum tax and capital gains taxes.
Quoted Fund performance is for Class A shares and does not reflect a sales charge.
The returns shown do not reflect taxes a shareholder would pay on distributions or redemptions.
Quoted Major Market Sectors, Moody’s Bond Quality Ratings Distributions and Top 10 States are subject to change.
The lists of Major Market Sectors and Top 10 States exclude short-term investments.
36
What is your outlook?
We expect the U.S. economy will continue its slow growth over the coming year. However, a failure by policymakers to address the looming fiscal cliff and budget deficit could certainly affect this outlook. These issues are also casting a shadow of uncertainty over the tax-exempt market as several government officials have proposed various tax reforms that could significantly impact municipal bonds. We will closely monitor this important topic in the coming fiscal year.
With this backdrop, we intend to maintain the Fund’s current risk profile, focusing our efforts on bottom-up security selection. Our goal is to select credits we are comfortable holding for the long term in order to generate consistent, competitive returns with a focus on tax-exempt income.
Portfolio Facts
As of October 31, 2012
| | | | | | | | |
| | | Class A | | | Institutional Class | |
Ticker | | | AAMBX | | | | TMBIX | |
Transfer Agent ID | | | 015 | | | | 088 | |
Net Assets | | | $1,531,982,827 | | | | $102,516,951 | |
NAV | | | $11.93 | | | | $11.93 | |
NAV - High† | | | 7/26/2012 - $11.96 | | | | 7/26/2012 - $11.96 | |
NAV - Low† | | | 11/15/2011 - $11.29 | | | | 11/15/2011 - $11.29 | |
Number of Holdings: 426 | | | | | | | | |
† | For the year ended October 31, 2012 |
Average Annual Total Returns1
As of October 31, 2012
| | | | | | | | | | | | |
Class A2 | | 1-Year | | | 5 Years | | | 10 Years | |
without sales charge | | | 9.61 | % | | | 5.74 | % | | | 4.83 | % |
with sales charge | | | 4.70 | % | | | 4.76 | % | | | 4.35 | % |
| | | |
Institutional Class3 | | 1-Year | | | 5 Years | | | 10 Years | |
Net Asset Value | | | 9.89 | % | | | 6.03 | % | | | 5.12 | % |
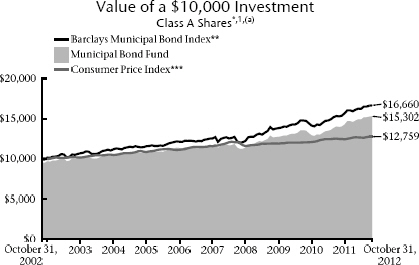
1 | Past performance is not an indication of future results. Average annual total returns represent past performance and reflect changes in share prices, the reinvestment of all dividends and capital gains, and the effects of compounding. The prospectus contains more complete information on the investment objectives, risks, charges and expenses of the investment company, which investors should read and consider carefully before investing. To obtain a prospectus, contact a registered representative or visit www.thrivent.com. At various times, the Fund’s adviser waived its management fee and/or reimbursed Fund expenses. Had the adviser not done so, the Fund’s total returns would have been lower. The returns shown do not reflect taxes a shareholder would pay on distributions or redemptions. Total investment return and principal value of your investment will fluctuate, and your shares, when redeemed, may be worth more or less than their original cost. Current performance may be higher or lower than the performance data quoted. Call 800-THRIVENT or visit www.thrivent.com for performance results current to the most recent month-end. |
2 | Class A performance with sales charge reflects the maximum sales charge of 4.5%. |
3 | Institutional Class shares have no sales load and are for institutional shareholders only. |
(a) | Performance of other classes will be greater or less than the line shown based on the differences in loads and fees paid by shareholders investing in the different classes. |
* | As you compare performance, please note that the Fund’s performance reflects the maximum 4.5% sales charge, while the Barclays Municipal Bond Index and the Consumer Price Index do not reflect any such charges. If you were to purchase any of the above individual securities represented in the Index, any charges you would pay would reduce your total return as well. |
** | The Barclays Municipal Bond Index is a market-value-weighted index of investment-grade municipal bonds with maturities of one year or more. It is not possible to invest directly in the Index. The performance of the Index does not reflect deductions for fees, expenses or taxes. |
*** | The Consumer Price Index is an inflationary indicator that measures the change in the cost of a fixed basket of products and services, including housing, electricity, food and transportation. It is not possible to invest directly in the Index. |
37
Thrivent Income Fund
Stephen D. Lowe, CFA, Portfolio Manager
The Fund seeks high current income while preserving principal and, secondarily, long-term growth of capital.
The Fund is subject to interest rate risk, credit risk related to an underlying company’s financial position and volatility risk, which may result in overall price fluctuations over short or even extended time periods. These and other risks are described in the Fund’s prospectus. Views expressed in this discussion of fund performance are the views of this particular Fund’s portfolio management team.
How did the Fund perform during the 12-month period ended October 31, 2012?
Thrivent Income Fund earned a return of 10.92%, compared with the median return of its peer group, the Lipper Corporate Debt Funds BBB-Rated category, of 10.11%. The Fund’s market benchmark, the Barclays U.S. Aggregate Bond Index, earned a return of 5.25%.
What factors affected the Fund’s performance?
Corporate bonds produced strong returns, despite a sell off in April and May caused by European debt concerns. Investors’ risk appetites grew stronger throughout the period as the European Central Bank took bold steps to shore up its banking system, U.S. economic data showed signs of improvement, and the Federal Reserve implemented more quantitative easing. The corporate bond market also benefited from massive inflows due to robust investor demand for products that provide yield in the low-rate environment. As investors gained confidence in the economic recovery, the yield premium that high-yield and investment-grade corporate bonds offered over Treasury securities narrowed significantly.
With an average of 78% of its portfolio in corporate bonds, the Fund outperformed primarily due to strong security and industry selection as well as a modest overweighting in investment-grade corporates. In investment-grade bonds, the Fund particularly benefited from an overweighting in the top-performing financial sector, and credit selection among banks and insurance companies. Industrial security selection also proved fruitful across the board. In addition, the Fund was rewarded for its slight overweighting in the upper (BB-rated) tier of the high-yield market.
The Fund’s allocation to securitized holdings also performed well, particularly nonagency residential mortgages and commercial mortgage-backed securities. With the improved housing market backdrop, nonagency mortgages appreciated significantly during the period. Finally, the Fund’s average 10% exposure to Treasury and agency securities helped performance compared with the Barclays benchmark, which consists of more than 30% Treasuries, but hindered performance compared to its peer group. We mainly use Treasuries as a risk hedge and to manage interest-rate sensitivity and liquidity.
What is your outlook?
Our near-term outlook is cautious as financial markets continue to face uncertainties due to Europe’s debt crisis, slower U.S. growth and the looming fiscal cliff. Conversely, the housing market is stabilizing, the Fed continues to be extremely accommodative and the financial health of corporations remains strong.
Major Market Sectors
(% of Net Assets)
| | | | |
Financials | | | 27.3 | % |
Communications Services | | | 9.9 | % |
Energy | | | 9.4 | % |
Consumer Non-Cyclical | | | 8.4 | % |
Mortgage-Backed Securities | | | 6.6 | % |
Utilities | | | 6.1 | % |
U.S. Government and Agencies | | | 5.8 | % |
Foreign Government | | | 5.4 | % |
Consumer Cyclical | | | 4.6 | % |
Basic Materials | | | 3.8 | % |
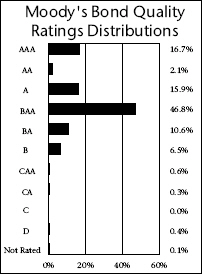
Top 10 Holdings
(% of Net Assets)
| | | | |
Federal National Mortgage Association Conventional 30-Yr. Pass Through | | | 1.7 | % |
Federal National Mortgage Association Conventional 30-Yr. Pass Through | | | 1.0 | % |
Federal National Mortgage Association Conventional 15-Yr. Pass Through | | | 1.0 | % |
Federal National Mortgage Association Conventional 30-Yr. Pass Through | | | 0.9 | % |
Federal National Mortgage Association Conventional 30-Yr. Pass Through | | | 0.7 | % |
Federal Home Loan Mortgage Corporation Gold 30-Yr. Pass Through | | | 0.7 | % |
Federal Home Loan Mortgage Corporation Gold 15-Yr. Pass Through | | | 0.7 | % |
U.S. Treasury Notes | | | 0.6 | % |
U.S. Treasury Notes | | | 0.5 | % |
Province of Ontario | | | 0.5 | % |
These securities represent 8.3% of the total net assets of the Fund.
Quoted Fund performance is for Class A shares and does not reflect a sales charge.
The returns shown do not reflect taxes a shareholder would pay on distributions or redemptions.
Quoted Major Market Sectors, Moody’s Bond Quality Ratings Distributions and Top 10 Holdings are subject to change.
The lists of Major Market Sectors and Top 10 Holdings exclude short-term investments and collateral held for securities loaned.
38
However, with yields at historic lows and prices toward their highs, the total return potential for corporate bonds will be more muted this fiscal year. Investors should not expect to see another round of double-digit gains, but rather more coupon-like returns in the coming year. Higher rates are a significant risk facing the corporate bond market, but are unlikely in the near term, based on Fed policies.
We plan to maintain the Fund’s current risk profile with its moderate overweight to BBB- and BB-rated corporate bonds. Our emphasis on the upper (BB) tier of high-yield is predicated on recent weakness in corporate earnings. To help protect the portfolio from the potential for higher rates, we have added some exposure to leveraged loans that have variable interest rates and less sensitivity to rate increases. As always, we intend to stay focused on the fundamental analysis of individual companies and credits.
| | | | | | | | |
| Portfolio Facts | |
| As of October 31, 2012 | |
| | | Class A | | | Institutional Class | |
Ticker | | | LUBIX | | | | LBIIX | |
Transfer Agent ID | | | 055 | | | | 455 | |
Net Assets | | | $447,986,769 | | | | $456,138,627 | |
NAV | | | $9.38 | | | | $9.37 | |
NAV - High† | | | 10/31/2012 - $9.38 | | | | 10/31/2012 - $9.37 | |
NAV - Low† | | | 12/1/2011 - $8.61 | | | | 12/1/2011 - $8.60 | |
Number of Holdings: 543 | | | | | | | | |
| | |
† For the year ended October 31, 2012 | | | | | | | | |
Average Annual Total Returns1
As of October 31, 2012
| | | | | | | | | | | | |
Class A2 | | 1-Year | | | 5 Years | | | 10 Years | |
without sales charge | | | 10.92 | % | | | 6.91 | % | | | 5.90 | % |
with sales charge | | | 5.97 | % | | | 5.94 | % | | | 5.42 | % |
| | | |
Institutional Class3 | | 1-Year | | | 5 Years | | | 10 Years | |
Net Asset Value | | | 11.34 | % | | | 7.35 | % | | | 6.32 | % |
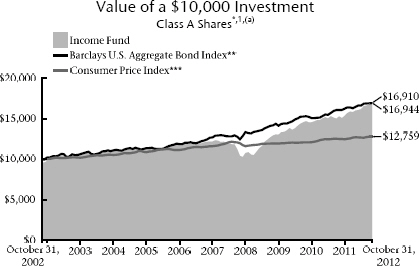
1 | Past performance is not an indication of future results. Average annual total returns represent past performance and reflect changes in share prices, the reinvestment of all dividends and capital gains, and the effects of compounding. The prospectus contains more complete information on the investment objectives, risks, charges and expenses of the investment company, which investors should read and consider carefully before investing. To obtain a prospectus, contact a registered representative or visit www.thrivent.com. At various times, the Fund’s adviser waived its management fee and/or reimbursed Fund expenses. Had the adviser not done so, the Fund’s total returns would have been lower. The returns shown do not reflect taxes a shareholder would pay on distributions or redemptions. Total investment return and principal value of your investment will fluctuate, and your shares, when redeemed, may be worth more or less than their original cost. Current performance may be higher or lower than the performance data quoted. Call 800-THRIVENT or visit www.thrivent.com for performance results current to the most recent month-end. |
2 | Class A performance with sales charge reflects the maximum sales charge of 4.5%. |
3 | Institutional Class shares have no sales load and are for institutional shareholders only. |
(a) | Performance of other classes will be greater or less than the line shown based on the differences in loads and fees paid by shareholders investing in the different classes. |
* | As you compare performance, please note that the Fund’s performance reflects the maximum 4.5% sales charge, while the Barclays U.S. Aggregate Bond Index and the Consumer Price Index do not reflect any such charges. If you were to purchase any of the above individual securities represented in the Index, any charges you would pay would reduce your total return as well. |
** | The Barclays U.S. Aggregate Bond Index is an index that measures the performance of U.S. investment grade bonds. It is not possible to invest directly in the Index. The performance of the Index does not reflect deductions for fees, expenses or taxes. |
*** | The Consumer Price Index is an inflationary indicator that measures the change in the cost of a fixed basket of products and services, including housing, electricity, food and transportation. It is not possible to invest directly in the Index. |
39
Thrivent Core Bond Fund
Michael G. Landreville, CFA and CPA (inactive) and Gregory R. Anderson, CFA, Portfolio Co-Managers
The Fund seeks a high level of current income consistent with capital preservation.
The Fund is subject to interest rate risk, credit risk related to an underlying company’s financial position and volatility risk, which may result in overall price fluctuations over short or even extended time periods. These and other risks are described in the Fund’s prospectus. Views expressed in this discussion of fund performance are the views of this particular Fund’s portfolio management team.
How did the Fund perform during the 12-month period ended October 31, 2012?
Thrivent Core Bond Fund earned a return of 7.59%, compared with the median return of its peer group, the Lipper Intermediate Investment Grade Debt Funds category, of 7.23%. The Fund’s market benchmark, the Barclays U.S. Aggregate Bond Index, earned a return of 5.25%.
What factors affected the Fund’s performance?
After underperforming in late 2011, risk assets rebounded at the beginning of 2012 as evidence of improved economic growth emerged. Strong risk asset performance continued until April 2012, when concerns about European sovereign debt resurfaced. Safe-haven assets, such as U.S. Treasuries, outperformed over the next few months through Moody’s summertime downgrades of Spain and Italy.
At the end of July, the European Central Bank’s president announced he was prepared to do “whatever it takes” to assure the financial solvency of eurozone countries. This triggered a sustained rally in global risk assets, which was subsequently buttressed by the Fed’s September announcement of additional quantitative easing (QE3) and the extension of its “Operation Twist” program to year-end 2012. Mortgage-backed securities (MBS) turned in strong performance on the heels of the Fed’s announcement. Over the period, 10-year Treasury yields fell modestly to historic lows due to a combination of global economic uncertainties, sluggish growth and the Fed’s persistent buying of longer-maturity Treasuries.
Compared to its Lipper peers, the Fund started the year with a modest overweighting in risk assets, such as corporate bonds, MBS and commercial mortgage-backed securities (CMBS). While this slightly hindered performance in the first few months, the Fund more than made up for the shortfall in the second fiscal quarter. We subsequently decreased exposure to both corporates and securitized assets, while moving toward overweighting longer-maturity Treasuries, including Treasury Inflation Protected Securities (TIPS). The corporate bond underweighting modestly hurt relative performance in the fiscal year’s second half, but was offset by the strong returns of the Fund’s MBS and TIPS. Therefore, over the entire period, the Fund outperformed its Lipper peers.
The Fund significantly outperformed the Barclays index due to its initial corporate bond overweighting and U.S. Treasury underweighting. The Fund benefited from owning larger weightings than the index in CMBS, TIPS and MBS that the Fed chose to purchase through its QE3 program.
What is your outlook?
Despite a concerted effort by the Fed and other central banks to flood economies with monetary liquidity, we believe sluggish growth will persist for the foreseeable future. We also believe the low-interest-rate environment will possibly extend past the January 2014 term expiration of Fed Chairman Ben Bernanke. Although not an immediate concern, longer-term inflationary pressures could build up, which would favor TIPS.
Major Market Sectors
(% of Net Assets)
| | | | |
U.S. Government and Agencies | | | 33.5 | % |
Mortgage-Backed Securities | | | 25.8 | % |
Financials | | | 12.6 | % |
Commercial Mortgage-Backed Securities | | | 6.4 | % |
High Yield Bonds | | | 4.6 | % |
Asset-Backed Securities | | | 4.1 | % |
Utilities | | | 4.0 | % |
Communications Services | | | 3.3 | % |
Consumer Non-Cyclical | | | 3.2 | % |
Energy | | | 2.4 | % |
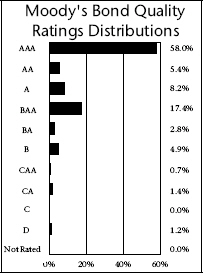
Top 10 Holdings
(% of Net Assets)
| | | | |
U.S. Treasury Notes | | | 8.1 | % |
Federal National Mortgage Association Conventional 30-Yr. Pass Through | | | 6.5 | % |
Federal National Mortgage Association Conventional 30-Yr. Pass Through | | | 5.2 | % |
Thrivent High Yield Fund Federal National Mortgage Association | | | 4.6 | % |
Federal National Mortgage Association Conventional 30-Yr. Pass Through | | | 3.6 | % |
Conventional 15-Yr. Pass Through | | | 3.5 | % |
Federal Home Loan Banks | | | 3.5 | % |
U.S. Treasury Notes | | | 3.2 | % |
Federal Home Loan Mortgage Corporation Gold 15-Yr. Pass Through | | | 2.6 | % |
U.S. Treasury Notes, TIPS | | | 2.6 | % |
These securities represent 43.4% of the total net assets of the Fund.
Quoted Fund performance is for Class A shares and does not reflect a sales charge.
The returns shown do not reflect taxes a shareholder would pay on distributions or redemptions.
Quoted Major Market Sectors, Moody’s Bond Quality Ratings Distributions and Top 10 Holdings are subject to change.
The lists of Major Market Sectors and Top 10 Holdings exclude short-term investments and collateral held for securities loaned.
40
We believe market performance may have gotten ahead of actual economic performance and a bit of a correction in risk assets is likely. Therefore, the Fund is starting the new fiscal year in a more-defensive posture: underweight in corporate bonds, neutral in high-quality securitized assets and overweight in longer-maturity Treasuries, including TIPS. In the event of a market correction, we intend to add back exposure to risk assets.
Portfolio Facts
As of October 31, 2012
| | | | |
| | | Class A | | Institutional Class |
Ticker | | AAINX | | IIINX |
Transfer Agent ID | | 016 | | 089 |
Net Assets | | $249,236,237 | | $37,037,609 |
NAV | | $10.70 | | $10.71 |
NAV - High† | | 10/31/2012 - $10.70 | | 10/31/2012 - $10.71 |
NAV - Low† | | 12/1/2011 - $10.08 | | 12/1/2011 - $10.09 |
Number of Holdings: 204 | | | | |
† | For the year ended October 31, 2012 |
Average Annual Total Returns1
As of October 31, 2012
| | | | | | | | | | | | |
Class A2 | | 1-Year | | | 5 Years | | | 10 Years | |
without sales charge | | | 7.59 | % | | | 5.88 | % | | | 4.90 | % |
with sales charge | | | 2.75 | % | | | 4.91 | % | | | 4.42 | % |
| | | |
Institutional Class3 | | 1-Year | | | 5 Years | | | 10 Years | |
Net Asset Value | | | 8.03 | % | | | 6.23 | % | | | 5.29 | % |
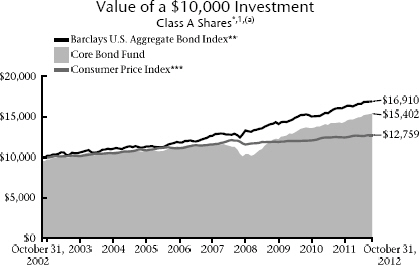
1 | Past performance is not an indication of future results. Average annual total returns represent past performance and reflect changes in share prices, the reinvestment of all dividends and capital gains, and the effects of compounding. The prospectus contains more complete information on the investment objectives, risks, charges and expenses of the investment company, which investors should read and consider carefully before investing. To obtain a prospectus, contact a registered representative or visit www.thrivent.com. At various times, the Fund’s adviser waived its management fee and/or reimbursed Fund expenses. Had the adviser not done so, the Fund’s total returns would have been lower. The returns shown do not reflect taxes a shareholder would pay on distributions or redemptions. Total investment return and principal value of your investment will fluctuate, and your shares, when redeemed, may be worth more or less than their original cost. Current performance may be higher or lower than the performance data quoted. Call 800-THRIVENT or visit www.thrivent.com for performance results current to the most recent month-end. |
2 | Class A performance with sales charge reflects the maximum sales charge of 4.5%. |
3 | Institutional Class shares have no sales load and are for institutional shareholders only. |
(a) | Performance of other classes will be greater or less than the line shown based on the differences in loads and fees paid by shareholders investing in the different classes. |
* | As you compare performance, please note that the Fund’s performance reflects the maximum 4.5% sales charge, while the Barclays U.S. Aggregate Bond Index and the Consumer Price Index do not reflect any such charges. If you were to purchase any of the above individual securities represented in the Index, any charges you would pay would reduce your total return as well. |
** | The Barclays U.S. Aggregate Bond Index is an index that measures the performance of U.S. investment grade bonds. It is not possible to invest directly in the Index. The performance of the Index does not reflect deductions for fees, expenses or taxes. |
*** | The Consumer Price Index is an inflationary indicator that measures the change in the cost of a fixed basket of products and services, including housing, electricity, food and transportation. It is not possible to invest directly in the Index. |
41
Thrivent Government Bond Fund
Michael G. Landreville, CFA and CPA (inactive), Portfolio Manager
The Fund seeks total return, consistent with preservation of capital.
The Fund is subject to interest rate risk, government securities risk and inflation-linked security risk. These and other risks are described in the Fund’s prospectus. Views expressed in this discussion of fund performance are the views of this particular Fund’s portfolio management team.
How did the Fund perform during the 12-month period ended October 31, 2012?
Thrivent Government Bond Fund earned a return of 4.08%, compared with the median return of its peer group, the Lipper General U.S. Government Funds category, of 3.46%. The Fund’s market benchmarks, the Barclays U.S. Agency Index and the Barclays U.S. Treasury Index, earned returns of 2.73% and 3.66%, respectively.
What factors affected the Fund’s performance?
Intermediate and longer-term Treasury rates fell modestly over the fiscal year. Ten-year Treasury yields started the period at 2.11% and ended at 1.69%. Meanwhile, 30-year Treasury rates fell slightly from 3.13% to 2.85% as the effects of the Federal Reserve’s “Operation Twist” program faded.
Throughout the period, 10-year Treasuries traded in a fairly tight range, with rates peaking at 2.40% in mid-March as the economic outlook improved in the U.S. and Europe. Rates hit a low of 1.38% in late July as concerns escalated over the downgrades of Spain and Italy, the upcoming U.S. election and the approaching fiscal cliff. However, at the end of July, the European Central Bank’s president announced he was prepared to do “whatever it takes” to support the troubled eurozone countries. In September, the Fed announced another round of quantitative easing (QE3) and extended Operation Twist until year-end. These combined developments caused a modest increase in rates for 10-year Treasuries as an improvement in overall market confidence diminished their safe-haven appeal. The ongoing U.S. election and fiscal uncertainty, however, kept 10-year Treasury rates low going into the fiscal year-end.
Interestingly, Treasury Inflation Protected Securities (TIPS) experienced strong results during the period as investors surmised that the central bank’s open-ended monetary policy would ultimately be inflationary. Mortgage-backed securities (MBS) also performed well in light of QE3, which has the Fed buying a significant portion of the total supply of MBS each month.
The Fund outpaced its Lipper peers due to its higher weighting in longer-maturity Treasury securities and greater TIPS exposure. Because the Fund and its peer group held MBS and U.S. agency debt securities, those segments did not have a meaningful impact on relative performance. The Fund’s TIPS exposure and emphasis on longer-duration securities also helped it outperform the Barclays Treasury and Agency indexes during this period of falling interest rates and strong TIPS performance.
What is your outlook?
Despite concerted efforts by the Fed and other central banks to flood economies with monetary liquidity, we believe sluggish growth will persist for the foreseeable future. The massive budget deficits preclude stimulatory fiscal policy. As a result of the economic uncertainty, businesses have increased cash holdings rather than investing or borrowing for expansion.
Major Market Sectors
(% of Net Assets)
| | | | |
U.S. Government and Agencies | | | 74.8 | % |
Mortgage-Backed Securities | | | 8.6 | % |
Financials | | | 6.4 | % |
Foreign Government | | | 2.4 | % |
Commercial Mortgage-Backed Securities | | | 1.4 | % |
Asset-Backed Securities | | | 1.3 | % |
Utilities | | | 1.0 | % |
Collateralized Mortgage Obligations | | | 0.6 | % |
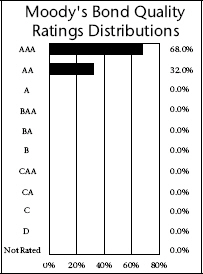
Top 10 Holdings
(% of Net Assets)
| | | | |
U.S. Treasury Notes | | | 12.5 | % |
U.S. Treasury Notes | | | 7.0 | % |
U.S. Treasury Notes | | | 3.5 | % |
Federal Home Loan Banks | | | 3.4 | % |
U.S. Treasury Notes | | | 3.4 | % |
Federal Home Loan Banks | | | 3.2 | % |
U.S. Treasury Bonds | | | 3.1 | % |
Federal Home Loan Mortgage Corporation | | | 2.8 | % |
U.S. Treasury Notes | | | 2.7 | % |
U.S. Treasury Notes | | | 2.7 | % |
These securities represent 44.3% of the total net assets of the Fund.
Quoted Fund performance is for Class A shares and does not reflect a sales charge.
The returns shown do not reflect taxes a shareholder would pay on distributions or redemptions.
Quoted Major Market Sectors, Moody’s Bond Quality Ratings Distributions and Top 10 Holdings are subject to change.
The lists of Major Market Sectors and Top 10 Holdings exclude short-term investments and collateral held for securities loaned.
42
We believe the low-interest-rate environment will extend well past 2013 and, possibly, past the January 2014 term expiration of Fed Chairman Ben Bernanke. Although not an immediate concern, longer-term inflationary pressures could build up, which would favor TIPS.
Because the Fund is intended to serve as a conservative and defensive investment vehicle, we do not attempt to anticipate or time the markets. We will seek to maintain the Fund’s fairly constant investment profile as it serves as a low-risk investment option in periods of global economic uncertainty.
Portfolio Facts
As of October 31, 2012
| | | | | | | | |
| | | Class A | | | Institutional Class | |
Ticker | | | TBFAX | | | | TBFIX | |
Transfer Agent ID | | | 039 | | | | 459 | |
Net Assets | | | $14,543,684 | | | | $98,034,085 | |
NAV | | | $10.76 | | | | $10.76 | |
NAV - High† | | | 7/24/2012 - $10.83 | | | | 7/24/2012 - $10.84 | |
NAV - Low† | | | 3/19/2012 - $10.39 | | | | 3/19/2012 - $10.40 | |
Number of Holdings: 67 | | | | | | | | |
† | For the period ended October 31, 2012 |
Average Annual Total Returns1
As of October 31, 2012
| | | | | | | | |
Class A2 | | 1-Year | | | From
Inception
2/26/2010 | |
without sales charge | | | 4.08 | % | | | 5.53 | % |
with sales charge | | | 1.98 | % | | | 4.76 | % |
| | | | | | | | |
Institutional Class3 | | 1-Year | | | From
Inception
2/26/2010 | |
Net Asset Value | | | 4.44 | % | | | 5.88 | % |
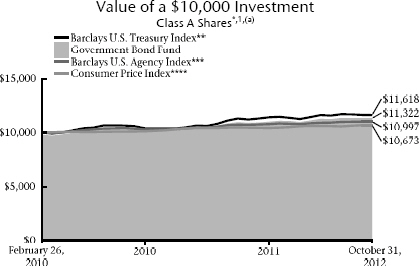
1 | Past performance is not an indication of future results. Average annual total returns represent past performance and reflect changes in share prices, the reinvestment of all dividends and capital gains, and the effects of compounding. The prospectus contains more complete information on the investment objectives, risks, charges and expenses of the investment company, which investors should read and consider carefully before investing. To obtain a prospectus, contact a registered representative or visit www.thrivent.com. At various times, the Fund’s adviser waived its management fee and/or reimbursed Fund expenses. Had the adviser not done so, the Fund’s total returns would have been lower. The returns shown do not reflect taxes a shareholder would pay on distributions or redemptions. Total investment return and principal value of your investment will fluctuate, and your shares, when redeemed, may be worth more or less than their original cost. Current performance may be higher or lower than the performance data quoted. Call 800-THRIVENT or visit www.thrivent.com for performance results current to the most recent month-end. |
2 | Class A performance with sales charge reflects the maximum sales charge of 2%. |
3 | Institutional Class shares have no sales load and are for institutional shareholders only. |
(a) | Performance of other classes will be greater or less than the line shown based on the differences in loads and fees paid by shareholders investing in the different classes. |
* | As you compare performance, please note that the Fund’s performance reflects the maximum 2.0% sales charge, while the Barclays U.S. Treasury Index, the Barclays U.S. Agency Index and the Consumer Price Index do not reflect any such charges. If you were to purchase any of the above individual securities represented in the Index, any charges you would pay would reduce your total return as well. |
** | The Barclays U.S. Treasury Index is an index that measures the performance of the U.S. Treasury bond market. It is not possible to invest directly in the Index. The performance of the Index does not reflect deductions for fees, expenses or taxes. |
*** | The Barclays U.S. Agency Index is an index that measures the performance of the U.S. investment-grade fixed-income securities market. It is not possible to invest directly in the Index. The performance of the Index does not reflect deductions for fees, expenses or taxes. |
**** | The Consumer Price Index is an inflationary indicator that measures the change in the cost of a fixed basket of products and services, including housing, electricity, food and transportation. It is not possible to invest directly in the Index. |
43
Thrivent Limited Maturity Bond Fund
Michael G. Landreville, CFA and CPA (inactive) and Gregory R. Anderson, CFA, Portfolio Co-Managers
The Fund seeks a high level of current income consistent with stability of principal.
The Fund is subject to interest rate risk, credit risk related to an underlying company’s financial position and volatility risk, which may result in overall price fluctuations over short or even extended time periods. These and other risks are described in the Fund’s prospectus. Views expressed in this discussion of fund performance are the views of this particular Fund’s portfolio management team.
How did the Fund perform during the 12-month period ended October 31, 2012?
Thrivent Limited Maturity Bond Fund earned a return of 3.18%, compared with the median return of its peer group, the Lipper Short Investment Grade Debt Funds category, of 3.28%. The Fund’s market benchmark, the Barclays Government/Credit 1-3 Year Bond Index, earned a return of 1.15%.
What factors affected the Fund’s performance?
Fixed-income markets changed course several times during the fiscal year as investors vacillated between embracing and shunning risk. However, in the end, non-government risk assets prevailed. In late 2011, U.S. economic growth and labor markets showed signs of improvement while progress was made in addressing Europe’s sovereign debt crisis. This led risk sectors to outperform through April 2012. Then in the spring, European concerns returned to the headlines and safe-haven assets, such as U.S. Treasuries, outpaced riskier securities. In the period’s final months, risk assets rallied once again as the European Central Bank committed to do “whatever it takes” to assure the financial solvency of eurozone countries. Shortly thereafter, the Federal Reserve instituted additional quantitative easing measures, while extending its language about keeping short-term rates low until at least 2015.
Two-year Treasury yields stayed in a relatively tight range, starting the fiscal year at 0.24% and ending at 0.28%, while five-year Treasury rates declined from 0.96% to 0.72%. The combination of low Treasury yields and several risk rallies during the period led corporate bonds and securitized assets to outperform Treasuries. Top-performing segments included high-yield corporates, nonagency residential mortgage-backed securities (MBS) and commercial mortgage-backed securities (CMBS).
With this backdrop, the Fund’s significant overweighting in corporate bonds and securitized products and strong security selection within those segments generated most of its excess return versus the benchmark. Approximately 63% of the Fund’s portfolio consisted of corporate bonds and securitized assets compared to 20% for the Barclays index. The Fund particularly benefited by having slightly more than 10% of its portfolio in the three top-performing asset classes: high-yield, nonagency MBS and CMBS. The Fund’s slightly longer duration, or interest-rate sensitivity, also proved beneficial as rates declined and prices rose in the five-year segment of the yield curve. Meanwhile, the Fund performed in line with its peer group over the period.
What is your outlook?
Fed policymakers have indicated that short rates will remain at current lows until at least 2015. We expect longer-term rates to also remain low at least for the next year as it appears that economic growth is plateauing, fiscal cliff and debt ceiling wrangling continues and European debt concerns are far from over. We believe the Fed will continue to be very active with monetary policy, which should serve to underpin corporate bonds and securitized assets as investors’ quest for higher-yielding products continues.
Major Market Sectors
(% of Net Assets)
| | | | |
U.S. Government and Agencies | | | 32.3 | % |
Financials | | | 24.1 | % |
Asset-Backed Securities | | | 10.8 | % |
Commercial Mortgage-Backed Securities | | | 7.1 | % |
Mortgage-Backed Securities | | | 5.2 | % |
Foreign Government | | | 3.8 | % |
Collateralized Mortgage Obligations | | | 3.4 | % |
Consumer Non-Cyclical | | | 2.8 | % |
Energy | | | 1.8 | % |
Consumer Cyclical | | | 1.4 | % |
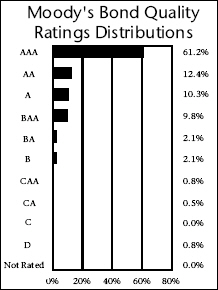
Top 10 Holdings
(% of Net Assets)
| | | | |
U.S. Treasury Notes | | | 6.8 | % |
U.S. Treasury Notes | | | 3.9 | % |
U.S. Treasury Notes | | | 3.8 | % |
Federal National Mortgage Association Conventional 15-Yr. Pass Through | | | 2.1 | % |
U.S. Treasury Notes | | | 1.9 | % |
U.S. Treasury Notes | | | 1.8 | % |
Federal Home Loan Mortgage Corporation Gold 15-Yr. Pass Through | | | 1.7 | % |
Federal Home Loan Banks | | | 1.7 | % |
U.S. Treasury Notes, TIPS | | | 1.5 | % |
Thrivent High Yield Fund | | | 1.3 | % |
These securities represent 26.5% of the total net assets of the Fund.
Quoted Fund performance is for Class A shares.
The returns shown do not reflect taxes a shareholder would pay on distributions or redemptions.
Quoted Major Market Sectors, Moody’s Bond Quality Ratings Distributions and Top 10 Holdings are subject to change.
The lists of Major Market Sectors and Top 10 Holdings exclude short-term investments and collateral held for securities loaned.
44
In light of increased uncertainty, we intend to maintain a slightly lower risk profile and higher-quality bias in the Fund. However, with Treasury yields so low, we plan to keep a modest overweight versus our peers and a significant overweight versus our benchmark in corporate bonds and securitized products.
Portfolio Facts
As of October 31, 2012
| | | | | | | | |
| | | Class A | | | Institutional Class | |
Ticker | | | LBLAX | | | | THLIX | |
Transfer Agent ID | | | 076 | | | | 476 | |
Net Assets | | | $408,238,867 | | | | $472,631,827 | |
NAV | | | $12.62 | | | | $12.62 | |
NAV - High† | | | 10/4/2012 - $12.63 | | | | 10/4/2012 - $12.62 | |
NAV - Low† | | | 12/27/2011 - $12.32 | | | | 12/27/2011 - $12.32 | |
Number of Holdings: 290 | | | | | | | | |
† | For the year ended October 31, 2012 |
Average Annual Total Returns1
As of October 31, 2012
| | | | | | | | | | | | |
Class A2 | | 1-Year | | | 5 Years | | | 10 Years | |
Net Asset Value | | | 3.18 | % | | | 3.17 | % | | | 3.27 | % |
| | | |
Institutional Class3 | | 1-Year | | | 5 Years | | | 10 Years | |
Net Asset Value | | | 3.52 | % | | | 3.48 | % | | | 3.62 | % |
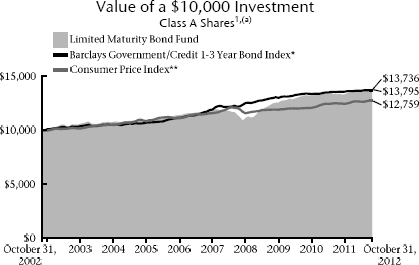
1 | Past performance is not an indication of future results. Average annual total returns represent past performance and reflect changes in share prices, the reinvestment of all dividends and capital gains, and the effects of compounding. The prospectus contains more complete information on the investment objectives, risks, charges and expenses of the investment company, which investors should read and consider carefully before investing. To obtain a prospectus, contact a registered representative or visit www.thrivent.com. At various times, the Fund’s adviser waived its management fee and/or reimbursed Fund expenses. Had the adviser not done so, the Fund’s total returns would have been lower. The returns shown do not reflect taxes a shareholder would pay on distributions or redemptions. Total investment return and principal value of your investment will fluctuate, and your shares, when redeemed, may be worth more or less than their original cost. Current performance may be higher or lower than the performance data quoted. Call 800-THRIVENT or visit www.thrivent.com for performance results current to the most recent month-end. |
2 | Class A shares have no sales load. |
3 | Institutional Class shares have no sales load and are for institutional shareholders only. |
(a) | Performance of other classes will be greater or less than the line shown based on the differences in loads and fees paid by shareholders investing in the different classes. |
* | The Barclays Government/Credit 1-3 Year Bond Index is an index that measures the performance of government and fixed-rate debt securities with maturities of 1-3 years. It is not possible to invest directly in the Index. The performance of the Index does not reflect deductions for fees, expenses or taxes. |
** | The Consumer Price Index is an inflationary indicator that measures the change in the cost of a fixed basket of products and services, including housing, electricity, food and transportation. It is not possible to invest directly in the Index. |
45
Thrivent Money Market Fund
William D. Stouten, Portfolio Manager
The Fund seeks a high level of current income, while maintaining liquidity and a constant net asset value of $1.00 per share.
The principal risk of investing in the Fund is income risk—that is, the income the Fund receives may fall as a result of a decline in interest rates. This and other risks are described in the Fund’s prospectus. Views expressed in this discussion of fund performance are the views of this particular Fund’s portfolio management team.
How did the Fund perform during the 12-month period ended October 31, 2012?
Thrivent Money Market Fund earned a return of 0.00%, compared with the median net return of its peer group, the Lipper Money Market Funds category, of 0.01%.
What factors affected the Fund’s performance?
The low-yield environment that has persisted since 2009 continued during the Fund’s fiscal year. As a result, money has continued to flow out of money market funds and into higher-yielding asset classes. Our Fund experienced a 17% reduction in net assets, ending the fiscal year at $506 million. To manage the Fund’s return in this low-rate environment, we continued to waive certain fees and expenses during the period.
We continued to structure the Fund conservatively to help maintain credit quality and liquidity, with significant exposure to U.S. government-supported securities. The Fund had roughly twice as much exposure to floating-rate agency notes as the industry peers, which resulted in a longer weighted average life (WAL) of 90 to 100 days. On a risk-adjusted basis, we believe these securities are a better value than shorter-term fixed-rate notes. However, owning them limits our ability to extend the Fund’s weighted average maturity (WAM), which was shorter than our peers during most of the fiscal year.
The Fund’s relative yield was negatively impacted by lower exposure to repurchase agreements (repos) than the industry. Repo rates are temporarily elevated as the Federal Reserve program “Operation Twist” has flooded the market with short-term Treasuries, which will likely last through year-end. Going forward, we believe repo rates will be less-competitive than they have been, due to Dodd-Frank regulatory changes.
Given our conservative approach, the Fund held a substantially lower weighting in foreign securities than our peers, particularly in European banks. We are largely avoiding these securities due to regional macro concerns. The Fund’s small international exposure was focused in the Canadian banking sector.
What is your outlook?
The Securities and Exchange Commission (SEC) recently dropped its attempt to pass industry reforms, which included loss-buffer requirements and floating net asset values, after a number of large money market fund companies lobbied against them. Potential reforms are being addressed by the Financial Stability Oversight Council (FSOC). We will monitor the FSOC’s progress and support what we believe to be positive changes for the industry.
Indicators suggest the U.S. economy will continue its slow growth over the coming year. However, failure by policymakers to adequately address the looming fiscal cliff and borrowing limits could cause dislocations in the market and affect short-term rates. The Fed extended its time frame for keeping the federal funds rate at record lows until mid-2015. We believe the Fed may enter into repurchase agreements directly with money market funds. While this could add supply and provide a slight boost to the fed funds rate, we expect money market yields will remain close to 0.00% for an extended period.
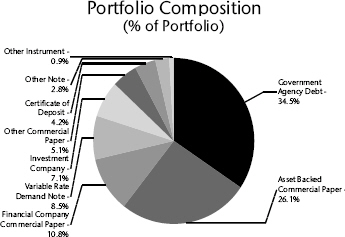
An investment in the Thrivent Money Market Fund is not insured
or guaranteed by the FDIC or any other government agency.
Although the Fund seeks to preserve the value of your investment at $1.00 per share,
it is possible to lose money by investing in the Fund.
Quoted Fund performance is for Class A shares.
The returns shown do not reflect taxes a shareholder would pay on distributions or redemptions.
Quoted Portfolio Composition is subject to change.
46
We foresee a decline in floating-rate agency securities in 2013 as the government shrinks entities like Fannie Mae and Freddie Mac. We will continue our strategy of buying these securities in anticipation of decreased supply next year. As always, the investment strategy will remain conservative with stability and liquidity as its primary objectives.
Portfolio Facts
As of October 31, 2012
| | | | | | | | |
| | | Class A | | | Institutional Class | |
Ticker | | | AMMXX | | | | AALXX | |
Transfer Agent ID | | | 018 | | | | 091 | |
Net Assets | | | $493,895,981 | | | | $12,526,914 | |
NAV | | | $1.00 | | | | $1.00 | |
Number of Holdings: 83 | | | | | | | | |
Average Annual Total Returns1
As of October 31, 2012
| | | | | | | | | | | | |
Class A2 | | 1-Year | | | 5 Years | | | 10 Years | |
Net Asset Value | | | 0.00 | % | | | 0.76 | % | | | 1.59 | % |
| | | |
Institutional Class3 | | 1-Year | | | 5 Years | | | 10 Years | |
Net Asset Value | | | 0.00 | % | | | 0.83 | % | | | 1.79 | % |
Money Market Portfolio Yields*
As of October 31, 2012
| | | | | | | | |
| | | Class A | | | Institutional Class | |
7-Day Yield | | | 0.00 | % | | | 0.00 | % |
7-Day Yield Gross of Waivers | | | -0.63 | % | | | -0.32 | % |
7-Day Effective Yield | | | 0.00 | % | | | 0.00 | % |
7-Day Effective Yield Gross of Waivers | | | -0.63 | % | | | -0.32 | % |
1 | Past performance is not an indication of future results. Average annual total returns represent past performance and reflect changes in share prices, the reinvestment of all dividends and capital gains, and the effects of compounding. The prospectus contains more complete information on the investment objectives, risks, charges and expenses of the investment company, which investors should read and consider carefully before investing. To obtain a prospectus, contact a registered representative or visit www.thrivent.com. At various times, the Fund’s adviser waived its management fee and/or reimbursed Fund expenses. Had the adviser not done so, the Fund’s total returns would have been lower. The returns shown do not reflect taxes a shareholder would pay on distributions or redemptions. Total investment return and principal value of your investment will fluctuate, and your shares, when redeemed, may be worth more or less than their original cost. Current performance may be higher or lower than the performance data quoted. Call 800-THRIVENT or visit www.thrivent.com for performance results current to the most recent month-end. |
2 | Class A shares have no sales load. |
3 | Institutional Class shares have no sales load and are for institutional shareholders only. |
* | Seven-day yields of Thrivent Money Market Fund refer to the income generated by an investment in the Fund over a specified seven-day period. Effective yields reflect the reinvestment of income. A yield gross of waivers represents what the yield would have been if the Adviser were not waiving or reimbursing certain expenses associated with the Fund. Yields are subject to daily fluctuation and should not be considered an indication of future results. |
47
Thrivent Partner Emerging Markets Equity Fund
| | |

| | Subadvised by DuPont Capital Management Corporation |
The Fund seeks long-term capital growth.
Foreign investments, as compared to domestic ones, involve additional risks, including currency fluctuations, different accounting standards, and greater political, economic and market instability. These risks are magnified when the Portfolio invests in emerging markets, which may be of relatively small size and less liquid than domestic markets. These and other risks are described in the Portfolio’s prospectus.
Thrivent Partner Emerging Markets Equity Fund commenced operations on August 31, 2012.
Major Market Sectors
(% of Net Assets)
| | | | |
Financials | | | 26.0 | % |
Energy | | | 17.4 | % |
Industrials | | | 11.9 | % |
Telecommunications Services | | | 10.5 | % |
Materials | | | 10.0 | % |
Consumer Discretionary | | | 9.7 | % |
Consumer Staples | | | 4.8 | % |
Information Technology | | | 3.5 | % |
Health Care | | | 2.2 | % |
Utilities | | | 1.6 | % |
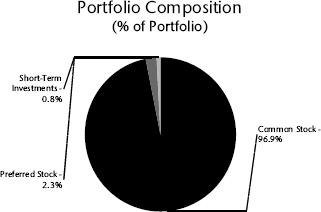
Top 10 Countries
(% of Net Assets)
| | | | |
South Korea | | | 10.4 | % |
Brazil | | | 9.8 | % |
China | | | 8.9 | % |
South Africa | | | 8.2 | % |
United States | | | 7.4 | % |
Taiwan | | | 6.9 | % |
Hong Kong | | | 6.2 | % |
Russia | | | 5.3 | % |
Poland | | | 4.3 | % |
Thailand | | | 3.3 | % |
Investments in securities in these countries represent 70.7% of the total net assets of the Fund.
Quoted Major Market Sectors, Portfolio Composition and Top 10 Countries are subject to change.
The lists of Major Market Sectors and Top 10 Countries exclude short-term investments and collateral held for securities loaned.
The Portfolio Composition chart excludes collateral held for securities loaned.
48
Shareholder Expense Example
(unaudited)
As a shareholder of the Fund, you incur, depending on the fund and share class, two types of costs: (1) transaction costs, including sales charges (loads) on purchase payments; and (2) ongoing costs, including management fees, distribution (12b-1) fees and other Fund expenses. This Example is intended to help you understand your ongoing costs (in dollars) of investing in the Fund and to compare these costs with the ongoing costs of investing in other mutual funds. The Example is based on an investment of $1,000 invested at the beginning of the period and held for the entire period from May 1, 2012 through October 31, 2012.
Actual Expenses
In the table below, the first section, labeled “Actual,” provides information about actual account values and actual expenses. You may use the information in this section, together with the amount you invested, to estimate the expenses that you paid over the period. Simply divide your account value by $1,000 (for example, an $8,600 account value divided by $1,000 = 8.6), then multiply the result by the number from the appropriate Class line under the heading entitled “Expenses Paid During Period” to estimate the expenses you paid. A small account fee of $12 may be charged to Class A shareholder accounts if the value falls below stated account minimums ($2,500 for Thrivent Limited Maturity Bond Fund, $1,500 for Thrivent Money Market Fund and $1,000 for all other Funds). This fee is not included in the table below. If it were and you were assessed such a fee, the expenses you paid during the period would have been higher and the ending account value would have been lower.
Hypothetical Example for Comparison Purposes
In the table below, the second section, labeled “Hypothetical,” provides information about hypothetical account values and hypothetical expenses based on the Fund’s actual expense ratio and an assumed rate of return of 5% per year before expenses, which is not the Fund’s actual return. The hypothetical account values and expenses may not be used to estimate the actual ending account balance or expenses you paid for the period. You may use this information to compare the ongoing costs of investing in the Fund and other funds. To do so, compare this 5% hypothetical example with the 5% hypothetical examples that appear in the shareholder reports of the other funds. A small account fee of $12 may be charged to Class A shareholder accounts if the value falls below stated account minimums ($2,500 for Thrivent Limited Maturity Bond Fund, $1,500 for Thrivent Money Market Fund and $1,000 for all other Funds). This fee is not included in the table below. If it were and you were assessed such a fee, the expenses you paid during the period would have been higher and the ending account value would have been lower.
Please note that the expenses shown in the table are meant to highlight your ongoing costs only and do not reflect any transactional costs, such as sales charges (loads). Therefore, the second section of the table is useful in comparing ongoing costs only, and will not help you determine the relative total costs of owning different funds. In addition, if these transactional costs were included, your costs would have been higher.
| | | | | | | | |
| | | Beginning Account
Value 5/1/2012 | | Ending Account Value
10/31/2012 | | Expenses Paid During
Period 5/1/2012 -
10/31/2012* | | Annualized Expense
Ratio |
Thrivent Aggressive Allocation Fund |
| | | | |
Actual | | | | | | | | |
Class A | | $1,000 | | $1,002 | | $4.25 | | 0.84% |
Institutional Class | | $1,000 | | $1,004 | | $2.03 | | 0.40% |
| | | | |
Hypothetical** | | | | | | | | |
Class A | | $1,000 | | $1,021 | | $4.29 | | 0.84% |
Institutional Class | | $1,000 | | $1,023 | | $2.05 | | 0.40% |
Thrivent Moderately Aggressive Allocation Fund |
| | | | |
Actual | | | | | | | | |
Class A | | $1,000 | | $1,014 | | $3.84 | | 0.76% |
Institutional Class | | $1,000 | | $1,016 | | $1.89 | | 0.37% |
| | | | |
Hypothetical** | | | | | | | | |
Class A | | $1,000 | | $1,021 | | $3.86 | | 0.76% |
Institutional Class | | $1,000 | | $1,023 | | $1.89 | | 0.37% |
Thrivent Moderate Allocation Fund |
| | | | |
Actual | | | | | | | | |
Class A | | $1,000 | | $1,024 | | $3.67 | | 0.72% |
Institutional Class | | $1,000 | | $1,025 | | $1.88 | | 0.37% |
| | | | |
Hypothetical** | | | | | | | | |
Class A | | $1,000 | | $1,022 | | $3.66 | | 0.72% |
Institutional Class | | $1,000 | | $1,023 | | $1.88 | | 0.37% |
49
Shareholder Expense Example
(unaudited)
| | | | | | | | |
| | | Beginning Account
Value 5/1/2012 | | Ending Account Value
10/31/2012 | | Expenses Paid During
Period 5/1/2012 -
10/31/2012 | | Annualized Expense
Ratio |
Thrivent Moderately Conservative Allocation Fund |
| | | | |
Actual | | | | | | | | |
Class A | | $1,000 | | $1,028 | | $3.91 | | 0.77% |
Institutional Class | | $1,000 | | $1,030 | | $2.20 | | 0.43% |
| | | | |
Hypothetical** | | | | | | | | |
Class A | | $1,000 | | $1,021 | | $3.90 | | 0.77% |
Institutional Class | | $1,000 | | $1,023 | | $2.19 | | 0.43% |
Thrivent Partner Small Cap Growth Fund |
| | | | |
Actual | | | | | | | | |
Class A | | $1,000 | | $974 | | $6.94 | | 1.40% |
Institutional Class | | $1,000 | | $975 | | $5.19 | | 1.05% |
| | | | |
Hypothetical** | | | | | | | | |
Class A | | $1,000 | | $1,018 | | $7.09 | | 1.40% |
Institutional Class | | $1,000 | | $1,020 | | $5.31 | | 1.05% |
Thrivent Partner Small Cap Value Fund |
| | | | |
Actual | | | | | | | | |
Class A | | $1,000 | | $1,011 | | $6.82 | | 1.35% |
Institutional Class | | $1,000 | | $1,014 | | $4.31 | | 0.85% |
| | | | |
Hypothetical** | | | | | | | | |
Class A | | $1,000 | | $1,018 | | $6.85 | | 1.35% |
Institutional Class | | $1,000 | | $1,021 | | $4.33 | | 0.85% |
Thrivent Small Cap Stock Fund |
| | | | |
Actual | | | | | | | | |
Class A | | $1,000 | | $988 | | $6.54 | | 1.31% |
Institutional Class | | $1,000 | | $991 | | $3.85 | | 0.77% |
| | | | |
Hypothetical** | | | | | | | | |
Class A | | $1,000 | | $1,019 | | $6.64 | | 1.31% |
Institutional Class | | $1,000 | | $1,021 | | $3.91 | | 0.77% |
Thrivent Mid Cap Growth Fund |
| | | | |
Actual | | | | | | | | |
Class A | | $1,000 | | $958 | | $4.88 | | 0.99% |
Institutional Class | | $1,000 | | $960 | | $2.62 | | 0.53% |
| | | | |
Hypothetical** | | | | | | | | |
Class A | | $1,000 | | $1,020 | | $5.04 | | 0.99% |
Institutional Class | | $1,000 | | $1,022 | | $2.71 | | 0.53% |
Thrivent Partner Mid Cap Value Fund |
| | | | |
Actual | | | | | | | | |
Class A | | $1,000 | | $1,016 | | $6.34 | | 1.25% |
Institutional Class | | $1,000 | | $1,017 | | $4.59 | | 0.91% |
| | | | |
Hypothetical** | | | | | | | | |
Class A | | $1,000 | | $1,019 | | $6.35 | | 1.25% |
Institutional Class | | $1,000 | | $1,021 | | $4.60 | | 0.91% |
Thrivent Mid Cap Stock Fund |
| | | | |
Actual | | | | | | | | |
Class A | | $1,000 | | $991 | | $5.83 | | 1.17% |
Institutional Class | | $1,000 | | $993 | | $3.60 | | 0.72% |
| | | | |
Hypothetical** | | | | | | | | |
Class A | | $1,000 | | $1,019 | | $5.92 | | 1.17% |
Institutional Class | | $1,000 | | $1,022 | | $3.65 | | 0.72% |
50
Shareholder Expense Example
(unaudited)
| | | | | | | | |
| | | Beginning Account
Value 5/1/2012 | | Ending Account Value
10/31/2012 | | Expenses Paid During
Period 5/1/2012 -
10/31/2012* | | Annualized Expense
Ratio |
Thrivent Partner Worldwide Allocation Fund |
| | | | |
Actual | | | | | | | | |
Class A | | $1,000 | | $1,008 | | $6.57 | | 1.30% |
Institutional Class | | $1,000 | | $1,010 | | $4.96 | | 0.98% |
| | | | |
Hypothetical** | | | | | | | | |
Class A | | $1,000 | | $1,019 | | $6.60 | | 1.30% |
Institutional Class | | $1,000 | | $1,020 | | $4.98 | | 0.98% |
Thrivent Large Cap Growth Fund |
| | | | |
Actual | | | | | | | | |
Class A | | $1,000 | | $993 | | $6.01 | | 1.20% |
Institutional Class | | $1,000 | | $997 | | $4.13 | | 0.82% |
| | | | |
Hypothetical** | | | | | | | | |
Class A | | $1,000 | | $1,019 | | $6.09 | | 1.20% |
Institutional Class | | $1,000 | | $1,021 | | $4.18 | | 0.82% |
Thrivent Large Cap Value Fund |
| | | | |
Actual | | | | | | | | |
Class A | | $1,000 | | $1,032 | | $5.17 | | 1.01% |
Institutional Class | | $1,000 | | $1,034 | | $2.70 | | 0.53% |
| | | | |
Hypothetical** | | | | | | | | |
Class A | | $1,000 | | $1,020 | | $5.14 | | 1.01% |
Institutional Class | | $1,000 | | $1,022 | | $2.68 | | 0.53% |
Thrivent Large Cap Stock Fund |
| | | | |
Actual | | | | | | | | |
Class A | | $1,000 | | $1,008 | | $5.37 | | 1.06% |
Institutional Class | | $1,000 | | $1,010 | | $3.14 | | 0.62% |
| | | | |
Hypothetical** | | | | | | | | |
Class A | | $1,000 | | $1,020 | | $5.41 | | 1.06% |
Institutional Class | | $1,000 | | $1,022 | | $3.16 | | 0.62% |
Thrivent Balanced Fund |
| | | | |
Actual | | | | | | | | |
Class A | | $1,000 | | $1,000 | | $5.47 | | 1.09% |
Institutional Class | | $1,000 | | $1,003 | | $3.31 | | 0.66% |
| | | | |
Hypothetical** | | | | | | | | |
Class A | | $1,000 | | $1,020 | | $5.53 | | 1.09% |
Institutional Class | | $1,000 | | $1,022 | | $3.34 | | 0.66% |
Thrivent High Yield Fund |
| | | | |
Actual | | | | | | | | |
Class A | | $1,000 | | $1,059 | | $4.16 | | 0.80% |
Institutional Class | | $1,000 | | $1,061 | | $2.42 | | 0.47% |
| | | | |
Hypothetical** | | | | | | | | |
Class A | | $1,000 | | $1,021 | | $4.08 | | 0.80% |
Institutional Class | | $1,000 | | $1,023 | | $2.37 | | 0.47% |
Thrivent Municipal Bond Fund |
| | | | |
Actual | | | | | | | | |
Class A | | $1,000 | | $1,036 | | $3.77 | | 0.74% |
Institutional Class | | $1,000 | | $1,037 | | $2.47 | | 0.48% |
| | | | |
Hypothetical** | | | | | | | | |
Class A | | $1,000 | | $1,021 | | $3.74 | | 0.74% |
Institutional Class | | $1,000 | | $1,023 | | $2.45 | | 0.48% |
51
Shareholder Expense Example
(unaudited)
| | | | | | | | |
| | | Beginning Account Value 5/1/2012 | | Ending Account Value
10/31/2012 | | Expenses Paid During
Period 5/1/2012 -
10/31/2012* | | Annualized Expense
Ratio |
Thrivent Income Fund |
| | | | |
Actual | | | | | | | | |
Class A | | $1,000 | | $1,059 | | $3.92 | | 0.76% |
Institutional Class | | $1,000 | | $1,060 | | $2.03 | | 0.39% |
| | | | |
Hypothetical** | | | | | | | | |
Class A | | $1,000 | | $1,021 | | $3.84 | | 0.76% |
Institutional Class | | $1,000 | | $1,023 | | $1.99 | | 0.39% |
Thrivent Core Bond Fund |
| | | | |
Actual | | | | | | | | |
Class A | | $1,000 | | $1,041 | | $4.35 | | 0.85% |
Institutional Class | | $1,000 | | $1,043 | | $2.68 | | 0.52% |
| | | | |
Hypothetical** | | | | | | | | |
Class A | | $1,000 | | $1,021 | | $4.31 | | 0.85% |
Institutional Class | | $1,000 | | $1,023 | | $2.65 | | 0.52% |
Thrivent Government Bond Fund |
| | | | |
Actual | | | | | | | | |
Class A | | $1,000 | | $1,019 | | $4.51 | | 0.89% |
Institutional Class | | $1,000 | | $1,021 | | $2.81 | | 0.55% |
| | | | |
Hypothetical** | | | | | | | | |
Class A | | $1,000 | | $1,021 | | $4.51 | | 0.89% |
Institutional Class | | $1,000 | | $1,022 | | $2.81 | | 0.55% |
Thrivent Limited Maturity Bond Fund |
| | | | |
Actual | | | | | | | | |
Class A | | $1,000 | | $1,016 | | $3.00 | | 0.59% |
Institutional Class | | $1,000 | | $1,017 | | $1.81 | | 0.36% |
| | | | |
Hypothetical** | | | | | | | | |
Class A | | $1,000 | | $1,022 | | $3.01 | | 0.59% |
Institutional Class | | $1,000 | | $1,023 | | $1.82 | | 0.36% |
Thrivent Money Market Fund |
| | | | |
Actual | | | | | | | | |
Class A | | $1,000 | | $1,000 | | $1.34 | | 0.27% |
Institutional Class | | $1,000 | | $1,000 | | $1.33 | | 0.27% |
| | | | |
Hypothetical** | | | | | | | | |
Class A | | $1,000 | | $1,024 | | $1.35 | | 0.27% |
Institutional Class | | $1,000 | | $1,024 | | $1.35 | | 0.27% |
| | | | | | | | |
| | | Beginning Account
Value 8/31/2012 | | Ending Account Value
10/31/2012 | | Expenses Paid During
Period 8/31/2012 -
10/31/2012*** | | Annualized Expense
Ratio |
Thrivent Partner Emerging Markets Equity Fund |
| | | | |
Actual | | | | | | | | |
Class A | | $1,000 | | $1,026 | | $0.46 | | 0.27% |
Institutional Class | | $1,000 | | $1,027 | | $0.38 | | 0.22% |
| | | | |
Hypothetical** | | | | | | | | |
Class A | | $1,000 | | $1,008 | | $0.46 | | 0.27% |
Institutional Class | | $1,000 | | $1,008 | | $0.37 | | 0.22% |
* | Expenses are equal to the Fund’s annualized expense ratio, multiplied by the average account value over the period, multiplied by 184/366 to reflect the one-half year period. |
** | Assuming 5% annualized total return before expenses. |
*** | Expenses are equal to the Fund’s annualized expense ratio, multiplied by the average account value over the period, multiplied by 62/366 to reflect the life of the Fund during the annual period. |
52
| | |

| | Report of Independent Registered Public Accounting Firm |
To the Shareholders and Trustees of the Thrivent Mutual Funds:
In our opinion, the accompanying statements of assets and liabilities, including the schedules of investments, and the related statements of operations and of changes in net assets and the financial highlights present fairly, in all material respects, the financial position of the Thrivent Aggressive Allocation Fund, Thrivent Moderately Aggressive Allocation Fund, Thrivent Moderate Allocation Fund, Thrivent Moderately Conservative Allocation Fund, Thrivent Partner Emerging Markets Equity Fund, Thrivent Partner Small Cap Growth Fund, Thrivent Partner Small Cap Value Fund, Thrivent Small Cap Stock Fund, Thrivent Mid Cap Growth Fund, Thrivent Partner Mid Cap Value Fund, Thrivent Mid Cap Stock Fund, Thrivent Partner Worldwide Allocation Fund, Thrivent Large Cap Growth Fund, Thrivent Large Cap Value Fund, Thrivent Large Cap Stock Fund, Thrivent Balanced Fund, Thrivent High Yield Fund, Thrivent Municipal Bond Fund, Thrivent Income Fund, Thrivent Core Bond Fund, Thrivent Government Bond Fund, Thrivent Limited Maturity Bond Fund and Thrivent Money Market Fund (twenty-three of the Thrivent Mutual Funds, hereafter referred to as the “Funds”) at October 31, 2012, the results of each of their operations for the period then ended, the changes in each of their net assets and their financial highlights for each of the periods presented, in conformity with accounting principles generally accepted in the United States of America. These financial statements and financial highlights (hereafter referred to as “financial statements”) are the responsibility of the Funds’ management; our responsibility is to express an opinion on these financial statements based on our audits. We conducted our audits of these financial statements in accordance with the standards of the Public Company Accounting Oversight Board (United States). Those standards require that we plan and perform the audit to obtain reasonable assurance about whether the financial statements are free of material misstatement. An audit includes examining, on a test basis, evidence supporting the amounts and disclosures in the financial statements, assessing the accounting principles used and significant estimates made by management, and evaluating the overall financial statement presentation. We believe that our audits, which included confirmation of securities at October 31, 2012 by correspondence with the custodian, transfer agent and brokers, provide a reasonable basis for our opinion.

December 17, 2012
PricewaterhouseCoopers LLP, Suite 1400, 225 South Sixth Street, Minneapolis, MN 55402 T: (612) 596 6000, F: (612) 373 7160, www.pwc.com/us
53
Aggressive Allocation Fund
Schedule of Investments as of October 31, 2012
| | | | | | | | |
| Shares | | | Mutual Funds (69.1%) | | Value | |
| Equity Mutual Funds (62.3%) | | | | |
| | 1,505,642 | | | Thrivent Natural Resources Fund | | | $13,550,782 | |
| | 3,537,097 | | | Thrivent Partner Small Cap Growth Funda | | | 45,911,513 | |
| | 701,978 | | | Thrivent Partner Small Cap Value Fund | | | 11,793,236 | |
| | 1,004,432 | | | Thrivent Small Cap Stock Funda | | | 16,161,303 | |
| | 1,669,389 | | | Thrivent Mid Cap Growth Funda | | | 34,522,959 | |
| | 1,600,892 | | | Thrivent Partner Mid Cap Value Fund | | | 20,587,471 | |
| | 1,827,872 | | | Thrivent Mid Cap Stock Funda | | | 30,397,516 | |
| | 10,089,922 | | | Thrivent Partner Worldwide Allocation Fund | | | 88,690,414 | |
| | 6,646,866 | | | Thrivent Large Cap Growth Fund | | | 39,282,979 | |
| | 2,275,936 | | | Thrivent Large Cap Value Fund | | | 33,592,812 | |
| | 824,079 | | | Thrivent Large Cap Stock Fund | | | 19,629,570 | |
| | 466,401 | | | Thrivent Equity Income Plus Fund | | | 4,482,114 | |
| | | | | |
| | | | Total | | | 358,602,669 | |
| | | | | |
| |
| Fixed Income Mutual Funds (6.8%) | | | | |
| | 3,231,517 | | | Thrivent High Yield Fund | | | 16,189,902 | |
| | 1,267,930 | | | Thrivent Income Fund | | | 11,880,506 | |
| | 907,050 | | | Thrivent Government Bond Fund | | | 9,759,861 | |
| | 99,841 | | | Thrivent Limited Maturity Bond Fund | | | 1,259,996 | |
| | | | | |
| | | | Total | | | 39,090,265 | |
| | | | | |
| | | | | | | | |
| | | | | |
| | | | Total Mutual Funds (cost $370,390,856) | | | 397,692,934 | |
| | | | | |
| | |
| Shares | | | Common Stock (26.9%) | | Value | |
| Consumer Discretionary (4.2%) | | | | |
| | 5,500 | | | Amazon.com, Inc.a,e | | | 1,280,510 | |
| | 2,900 | | | AutoZone, Inc.a | | | 1,087,500 | |
| | 3,230 | | | CBS Corporation | | | 104,652 | |
| | 5,900 | | | Charter Communications, Inc.a | | | 456,719 | |
| | 5,800 | | | Cheesecake Factory, Inc. | | | 191,748 | |
| | 12,800 | | | Children’s Place Retail Stores, Inc.a | | | 747,904 | |
| | 110,400 | | | Comcast Corporatione | | | 4,141,104 | |
| | 8,258 | | | Delphi Automotive plca | | | 259,632 | |
| | 8,300 | | | DISH Network Corporation | | | 295,729 | |
| | 7,370 | | | Dollar Tree, Inc.a | | | 293,842 | |
| | 21,100 | | | Expedia, Inc. | | | 1,248,065 | |
| | 24,176 | | | Foot Locker, Inc. | | | 809,896 | |
| | 23,800 | | | GNC Holdings, Inc. | | | 920,346 | |
| | 1,560 | | | Harley-Davidson, Inc. | | | 72,946 | |
| | 13,700 | | | Home Depot, Inc. | | | 840,906 | |
| | 69,687 | | | Las Vegas Sands Corporation | | | 3,236,264 | |
| | 15,069 | | | Life Time Fitness, Inc.a | | | 676,447 | |
| | 14,160 | | | Lowe’s Companies, Inc. | | | 458,501 | |
| | 19,600 | | | Meredith Corporation | | | 656,012 | |
| | 11,430 | | | News Corporation | | | 278,435 | |
| | 14,600 | | | NIKE, Inc. | | | 1,334,148 | |
| | 7,300 | | | Omnicom Group, Inc. | | | 349,743 | |
| | 11,400 | | | O’Reilly Automotive, Inc.a | | | 976,752 | |
| | 1,183 | | | Panera Bread Companya | | | 199,501 | |
| | 6,100 | | | Penn National Gaming, Inc.a | | | 246,623 | |
| | 3,000 | | | PetSmart, Inc. | | | 199,170 | |
| | 45,859 | | | Pier 1 Imports, Inc. | | | 935,524 | |
| | 28,000 | | | Sally Beauty Holdings, Inc.a | | | 674,240 | |
| | 8,400 | | | Tempur-Pedic International, Inc.a | | | 222,096 | |
| | 3,250 | | | Time Warner Cable, Inc. | | | 322,107 | |
| | 9,400 | | | Toll Brothers, Inc.a | | | 310,294 | |
| | 11,110 | | | WMS Industries, Inc.a | | | 182,537 | |
| | | | | |
| | | | Total | | | 24,009,893 | |
| | | | | |
| |
| Consumer Staples (1.8%) | | | | |
| | 11,827 | | | Anheuser-Busch InBev NV ADR | | | 991,103 | |
| | 14,865 | | | Annie’s, Inc.a | | | 587,167 | |
| | 9,077 | | | British American Tobacco plc ADR | | | 901,891 | |
| | 5,980 | | | CVS Caremark Corporation | | | 277,472 | |
| | 1,770 | | | Diageo plc ADR | | | 202,205 | |
| | 18,442 | | | Ingredion, Inc. | | | 1,133,445 | |
| | 2,060 | | | Kimberly-Clark Corporation | | | 171,907 | |
| | 3,021 | | | Kraft Foods Group, Inc.a | | | 137,395 | |
| | 84,163 | | | Mondelez International, Inc. | | | 2,233,686 | |
| | 15,400 | | | Nestle SA | | | 977,719 | |
| | 25,973 | | | Philip Morris International, Inc.e | | | 2,300,169 | |
| | 5,849 | | | TreeHouse Foods, Inc.a | | | 313,214 | |
| | 4,690 | | | Unilever NV ADR | | | 172,076 | |
| | | | | |
| | | | Total | | | 10,399,449 | |
| | | | | |
| |
| Energy (2.0%) | | | | |
| | 33,157 | | | Alpha Natural Resources, Inc.a | | | 284,156 | |
| | 10,080 | | | BP plc ADR | | | 432,331 | |
| | 2,690 | | | Chevron Corporation | | | 296,465 | |
| | 28,600 | | | Consol Energy, Inc. | | | 1,005,576 | |
| | 5,000 | | | Ensco plc | | | 289,100 | |
| | 9,370 | | | EOG Resources, Inc. | | | 1,091,511 | |
| | 4,810 | | | EQT Corporation | | | 291,630 | |
| | 15,200 | | | Helix Energy Solutions Group, Inc.a | | | 262,808 | |
| | 43,320 | | | Marathon Oil Corporation | | | 1,302,199 | |
| | 40,800 | | | Marathon Petroleum Corporation | | | 2,241,144 | |
| | 3,306 | | | Oasis Petroleum, Inc.a | | | 97,097 | |
| | 39,445 | | | Petroleum Geo-Services ASA | | | 681,591 | |
| | 14,670 | | | Schlumberger, Ltd. | | | 1,020,005 | |
| | 8,300 | | | Southwestern Energy Companya | | | 288,010 | |
| | 26,986 | | | Swift Energy Companya | | | 450,936 | |
| | 116,900 | | | Weatherford International, Ltd.a | | | 1,320,970 | |
| | | | | |
| | | | Total | | | 11,355,529 | |
| | | | | |
| |
| Financials (3.6%) | | | | |
| | 3,380 | | | ACE, Ltd. | | | 265,837 | |
| | 7,054 | | | Affiliated Managers Group, Inc.a | | | 892,331 | |
| | 2,200 | | | Allied World Assurance Company Holdings AG | | | 176,660 | |
| | 4,110 | | | Allstate Corporation | | | 164,318 | |
| | 7,600 | | | American Assets Trust, Inc. | | | 206,492 | |
| | 4,700 | | | American Campus Communities, Inc. | | | 212,957 | |
| | 16,900 | | | Ameriprise Financial, Inc. | | | 986,453 | |
| | 5,600 | | | Aspen Insurance Holdings, Ltd. | | | 181,160 | |
| | 6,200 | | | Axis Capital Holdings, Ltd. | | | 224,564 | |
| | 33,000 | | | Bank of America Corporation | | | 307,560 | |
| | 11,000 | | | BioMed Realty Trust, Inc. | | | 210,320 | |
| | 2,300 | | | Capital One Financial Corporation | | | 138,391 | |
| | 16,200 | | | CBL & Associates Properties, Inc. | | | 362,394 | |
| | 52,320 | | | Citigroup, Inc. | | | 1,956,245 | |
| | 16,500 | | | CME Group, Inc. | | | 922,845 | |
| | 31,600 | | | DCT Industrial Trust, Inc. | | | 203,820 | |
| | 9,000 | | | Douglas Emmett, Inc. | | | 211,050 | |
The accompanying Notes to Financial Statements are an integral part of this schedule.
54
Aggressive Allocation Fund
Schedule of Investments as of October 31, 2012
| | | | | | | | |
| Shares | | | Common Stock (26.9%) | | Value | |
| Financials (3.6%) - continued | | | | |
| | 19,064 | | | Duke Realty Corporation | | | $276,047 | |
| | 6,400 | | | Endurance Specialty Holdings, Ltd. | | | 259,520 | |
| | 3,000 | | | Equity Lifestyle Properties, Inc. | | | 201,990 | |
| | 6,100 | | | Extra Space Storage, Inc. | | | 210,389 | |
| | 1,380 | | | Goldman Sachs Group, Inc. | | | 168,898 | |
| | 21,641 | | | HCC Insurance Holdings, Inc. | | | 771,285 | |
| | 6,300 | | | Highwoods Properties, Inc. | | | 203,175 | |
| | 23,718 | | | Host Hotels & Resorts, Inc. | | | 342,962 | |
| | 45,900 | | | Huntington Bancshares, Inc. | | | 293,301 | |
| | 7,070 | | | Invesco, Ltd. | | | 171,942 | |
| | 5,000 | | | iShares Russell 2000 Index Fund | | | 406,200 | |
| | 54,669 | | | J.P. Morgan Chase & Company | | | 2,278,604 | |
| | 15,360 | | | KKR & Company, LP | | | 231,168 | |
| | 8,418 | | | Lazard, Ltd. | | | 247,994 | |
| | 3,000 | | | M&T Bank Corporation | | | 312,300 | |
| | 13,060 | | | MetLife, Inc. | | | 463,499 | |
| | 12,500 | | | NASDAQ OMX Group, Inc. | | | 297,625 | |
| | 6,800 | | | Northern Trust Corporation | | | 324,904 | |
| | 22,200 | | | Och-Ziff Capital Management Group, LLC | | | 222,222 | |
| | 8,800 | | | Pebblebrook Hotel Trust | | | 186,736 | |
| | 46,254 | | | Popular, Inc.a | | | 894,090 | |
| | 1,900 | | | ProAssurance Corporation | | | 169,860 | |
| | 8,270 | | | State Street Corporation | | | 368,594 | |
| | 18,050 | | | SVB Financial Groupa | | | 1,021,450 | |
| | 2,680 | | | Taubman Centers, Inc. | | | 210,514 | |
| | 8,600 | | | Tower Group, Inc. | | | 154,972 | |
| | 8,437 | | | W.R. Berkley Corporation | | | 328,115 | |
| | 35,230 | | | Wells Fargo & Company | | | 1,186,899 | |
| | 57,372 | | | Zions Bancorporatione | | | 1,231,777 | |
| | | | | |
| | | | Total | | | 21,060,429 | |
| | | | | |
| |
| Health Care (3.9%) | | | | |
| | 17,900 | | | Abbott Laboratories | | | 1,172,808 | |
| | 2,400 | | | Alexion Pharmaceuticals, Inc.a | | | 216,912 | |
| | 19,200 | | | Align Technology, Inc.a | | | 510,336 | |
| | 22,340 | | | Baxter International, Inc.e | | | 1,399,154 | |
| | 10,000 | | | Biogen Idec, Inc.a,e | | | 1,382,200 | |
| | 65,700 | | | Bristol-Myers Squibb Companye | | | 2,184,525 | |
| | 2,576 | | | C.R. Bard, Inc. | | | 247,785 | |
| | 16,280 | | | Covidien plc | | | 894,586 | |
| | 31,600 | | | Endo Pharmaceutical Holdings, Inc.a | | | 905,656 | |
| | 7,605 | | | HeartWare International, Inc.a | | | 638,668 | |
| | 21,700 | | | Humana, Inc. | | | 1,611,659 | |
| | 5,300 | | | Illumina, Inc.a | | | 251,803 | |
| | 8,400 | | | Medicines Companya | | | 184,128 | |
| | 43,390 | | | Merck & Company, Inc. | | | 1,979,886 | |
| | 72,417 | | | Pfizer, Inc. | | | 1,801,011 | |
| | 8,030 | | | Sanofi ADR | | | 352,116 | |
| | 11,800 | | | Shire Pharmaceuticals Group plc ADR | | | 995,802 | |
| | 10,300 | | | Thoratec Corporationa | | | 367,710 | |
| | 13,208 | | | United Therapeutics Corporationa | | | 603,209 | |
| | 61,000 | | | UnitedHealth Group, Inc.e | | | 3,416,000 | |
| | 42,800 | | | VIVUS, Inc.a | | | 637,720 | |
| | 2,600 | | | Waters Corporationa | | | 212,706 | |
| | 5,051 | | | Zimmer Holdings, Inc. | | | 324,325 | |
| | | | | |
| | | | Total | | | 22,290,705 | |
| | | | | |
| |
| Industrials (3.6%) | | | | |
| | 11,900 | | | 3M Company | | | 1,042,440 | |
| | 26,700 | | | Actuant Corporation | | | 754,008 | |
| | 13,650 | | | ADT Corporationa | | | 566,612 | |
| | 10,031 | | | CSX Corporation | | | 205,335 | |
| | 26,553 | | | EMCOR Group, Inc. | | | 853,944 | |
| | 1,710 | | | FedEx Corporation | | | 157,303 | |
| | 1,800 | | | Flowserve Corporation | | | 243,882 | |
| | 18,100 | | | GATX Corporation | | | 750,426 | |
| | 5,604 | | | General Electric Company | | | 118,020 | |
| | 26,335 | | | HNI Corporation | | | 724,739 | |
| | 24,109 | | | Honeywell International, Inc. | | | 1,476,435 | |
| | 28,370 | | | Jacobs Engineering Group, Inc.a | | | 1,094,798 | |
| | 14,600 | | | Landstar System, Inc. | | | 739,490 | |
| | 7,400 | | | Lockheed Martin Corporation | | | 693,158 | |
| | 77,172 | | | Manitowoc Company, Inc. | | | 1,099,701 | |
| | 22,800 | | | Manpower, Inc. | | | 865,032 | |
| | 21,000 | | | McDermott International, Inc.a | | | 224,910 | |
| | 13,312 | | | Oshkosh Corporationa | | | 399,094 | |
| | 19,432 | | | Parker Hannifin Corporatione | | | 1,528,521 | |
| | 3,983 | | | Pentair, Ltd. | | | 168,242 | |
| | 88,600 | | | Pitney Bowes, Inc. | | | 1,272,296 | |
| | 24,300 | | | Southwest Airlines Company | | | 214,326 | |
| | 1,650 | | | SPX Corporation | | | 113,173 | |
| | 36,600 | | | Tyco International, Ltd. | | | 983,442 | |
| | 25,300 | | | United Parcel Service, Inc. | | | 1,853,225 | |
| | 24,967 | | | United Technologies Corporatione | | | 1,951,421 | |
| | 23,000 | | | Woodward, Inc. | | | 770,500 | |
| | | | | |
| | | | Total | | | 20,864,473 | |
| | | | | |
| |
| Information Technology (5.8%) | | | | |
| | 8,200 | | | Akamai Technologies, Inc.a | | | 311,518 | |
| | 5,100 | | | Alliance Data Systems Corporationa | | | 729,555 | |
| | 10,877 | | | Apple, Inc.e | | | 6,472,903 | |
| | 30,000 | | | Aruba Networks, Inc.a | | | 545,100 | |
| | 130,500 | | | Atmel Corporationa | | | 608,783 | |
| | 21,700 | | | Cavium, Inc.a | | | 720,006 | |
| | 14,200 | | | Citrix Systems, Inc.a | | | 877,702 | |
| | 13,126 | | | Cognizant Technology Solutions Corporationa | | | 874,848 | |
| | 17,336 | | | CoreLogic, Inc.a | | | 412,597 | |
| | 29,624 | | | eBay, Inc.a | | | 1,430,543 | |
| | 2,905 | | | Google, Inc.a,e | | | 1,974,732 | |
| | 22,500 | | | Informatica Corporationa | | | 610,650 | |
| | 59,500 | | | Intel Corporation | | | 1,286,687 | |
| | 10,000 | | | International Business Machines Corporation | | | 1,945,300 | |
| | 7,172 | | | Itron, Inc.a | | | 294,482 | |
| | 13,411 | | | Juniper Networks, Inc.a | | | 222,220 | |
| | 2,200 | | | MasterCard, Inc. | | | 1,014,046 | |
| | 93,614 | | | Microsoft Corporatione | | | 2,671,275 | |
| | 40,870 | | | NetApp, Inc.a | | | 1,099,403 | |
| | 26,548 | | | NVIDIA Corporationa | | | 317,780 | |
| | 65,770 | | | Oracle Corporatione | | | 2,042,158 | |
| | 19,075 | | | Plantronics, Inc. | | | 618,793 | |
| | 19,000 | | | QUALCOMM, Inc.e | | | 1,112,925 | |
| | 81,880 | | | Teradyne, Inc.a | | | 1,197,086 | |
| | 39,210 | | | Texas Instruments, Inc.e | | | 1,101,409 | |
| | 22,929 | | | TIBCO Software, Inc.a | | | 578,040 | |
| | 24,300 | | | VeriFone Systems, Inc.a | | | 720,252 | |
| | 71,000 | | | Vishay Intertechnology, Inc.a | | | 587,880 | |
| | 112 | | | Workday, Inc.a | | | 5,432 | |
| | 19,932 | | | Xilinx, Inc. | | | 652,972 | |
The accompanying Notes to Financial Statements are an integral part of this schedule.
55
Aggressive Allocation Fund
Schedule of Investments as of October 31, 2012
| | | | | | | | |
| Shares | | | Common Stock (26.9%) | | Value | |
| Information Technology (5.8%) - continued | | | | |
| | 13,700 | | | Yahoo!, Inc.a | | | $230,297 | |
| | | | | |
| | | | Total | | | 33,267,374 | |
| | | | | |
| |
| Materials (1.2%) | | | | |
| | 83,800 | | | AK Steel Holding Corporation | | | 422,352 | |
| | 12,700 | | | Buckeye Technologies, Inc. | | | 332,740 | |
| | 9,700 | | | CF Industries Holdings, Inc. | | | 1,990,343 | |
| | 8,600 | | | Eagle Materials, Inc. | | | 455,542 | |
| | 26,146 | | | Freeport-McMoRan Copper & Gold, Inc.e | | | 1,016,556 | |
| | 13,200 | | | H.B. Fuller Company | | | 401,280 | |
| | 7,569 | | | PPG Industries, Inc. | | | 886,179 | |
| | 2,287 | | | Sigma-Aldrich Corporation | | | 160,410 | |
| | 6,494 | | | Silgan Holdings, Inc. | | | 281,255 | |
| | 22,844 | | | Steel Dynamics, Inc. | | | 288,977 | |
| | 24,700 | | | SunCoke Energy, Inc.a | | | 396,929 | |
| | 3,720 | | | United States Steel Corporation | | | 75,851 | |
| | | | | |
| | | | Total | | | 6,708,414 | |
| | | | | |
| |
| Telecommunications Services (0.1%) | | | | |
| | 6,474 | | | Verizon Communications, Inc. | | | 288,999 | |
| | 48,400 | | | Windstream Corporation | | | 461,736 | |
| | | | | |
| | | | Total | | | 750,735 | |
| | | | | |
| |
| Utilities (0.7%) | | | | |
| | 15,100 | | | CMS Energy Corporation | | | 367,232 | |
| | 12,290 | | | NiSource, Inc. | | | 313,026 | |
| | 20,713 | | | NV Energy, Inc. | | | 393,754 | |
| | 11,440 | | | PG&E Corporation | | | 486,429 | |
| | 32,500 | | | PNM Resources, Inc. | | | 720,200 | |
| | 8,400 | | | Public Service Enterprise Group, Inc. | | | 269,136 | |
| | 19,300 | | | Southern Company | | | 904,012 | |
| | 15,440 | | | Southwest Gas Corporation | | | 671,177 | |
| | | | | |
| | | | Total | | | 4,124,966 | |
| | | | | |
| | | | | | | | |
| | | | | |
| | | | Total Common Stock (cost $141,802,397) | | | 154,831,967 | |
| | | | | |
| | |
Principal Amount | | | Long-Term Fixed Income (2.9%) | | Value | |
| Asset-Backed Securities (0.1%) | | | | |
| | | | Renaissance Home Equity Loan Trust | | | | |
| | 650,000 | | | 6.011%, 5/25/2036 | | | 382,490 | |
| | | | | |
| | | | Total | | | 382,490 | |
| | | | | |
| |
| Collateralized Mortgage Obligations (0.1%) | | | | |
| | | | MASTR Alternative Loans Trust | | | | |
| | 74,212 | | | 0.661%, 12/25/2035b | | | 39,909 | |
| | | | Residential Asset Securitization Trust | | | | |
| | 89,481 | | | 0.591%, 8/25/2037b | | | 28,464 | |
| | | | Sequoia Mortgage Trust | | | | |
| | 124,542 | | | 4.960%, 9/20/2046 | | | 23,393 | |
| | 210,816 | | | 4.960%, 9/20/2046 | | | 170,625 | |
| | | | WaMu Mortgage Pass Through Certificates | | | | |
| | 87,688 | | | 2.726%, 9/25/2036 | | | 69,091 | |
| | 133,873 | | | 2.794%, 10/25/2036 | | | 102,019 | |
| | | | | |
| | | | Total | | | 433,501 | |
| | | | | |
| |
| Commercial Mortgage-Backed Securities (<0.1%) | | | | |
| | | | Credit Suisse Mortgage Capital Certificates | | | | |
| | 250,000 | | | 5.509%, 9/15/2039 | | | 263,659 | |
| | | | | |
| | | | Total | | | 263,659 | |
| | | | | |
| |
| Mortgage-Backed Securities (1.1%) | | | | |
| | | | Federal Home Loan Mortgage Corporation Gold 15-Yr. Pass Through | | | | |
| | 320,000 | | | 2.500%, 11/1/2027c | | | 334,200 | |
| | | | Federal Home Loan Mortgage Corporation Gold 30-Yr. Pass Through | | | | |
| | 600,000 | | | 3.000%, 11/1/2042c | | | 628,078 | |
| | | | Federal National Mortgage Association Conventional 15- Yr. Pass Through | | | | |
| | 1,110,000 | | | 2.500%, 11/1/2027c | | | 1,161,684 | |
| | | | Federal National Mortgage Association Conventional 30- Yr. Pass Through | | | | |
| | 370,000 | | | 3.500%, 11/1/2042c | | | 394,108 | |
| | 2,265,000 | | | 4.000%, 11/1/2042c | | | 2,425,320 | |
| | 1,165,000 | | | 5.000%, 11/1/2042c | | | 1,270,942 | |
| | | | | |
| | | | Total | | | 6,214,332 | |
| | | | | |
| |
| U.S. Government and Agencies (1.6%) | | | | |
| | | | U.S. Treasury Bonds | | | | |
| | 550,000 | | | 4.375%, 5/15/2040 | | | 724,797 | |
| | 6,560,000 | | | 3.000%, 5/15/2042 | | | 6,776,277 | |
| | | | U.S. Treasury Notes | | | | |
| | 100,000 | | | 2.500%, 4/30/2015 | | | 105,367 | |
| | 475,000 | | | 0.750%, 6/30/2017 | | | 476,855 | |
| | 1,160,000 | | | 1.625%, 8/15/2022 | | | 1,153,656 | |
| | | | | |
| | | | Total | | | 9,236,952 | |
| | | | | |
| | | | | | | | |
| | | | | |
| | | | Total Long-Term Fixed Income (cost $16,690,377) | | | 16,530,934 | |
| | | | | |
| | |
Shares or
Principal
Amount | | | Short-Term Investments (2.2%) | | Value | |
| | | | Federal Home Loan Mortgage Corporation Discount Notes | | | | |
| | 100,000 | | | 0.160%, 12/17/2012d,e | | | 99,980 | |
| | 6,352,142 | | | Thrivent Financial Securities Lending Trust | | | 6,352,142 | |
The accompanying Notes to Financial Statements are an integral part of this schedule.
56
Aggressive Allocation Fund
Schedule of Investments as of October 31, 2012
| | | | | | | | |
Shares or
Principal
Amount | | | Short-Term Investments (2.2%) | | Value | |
| | | | U.S. Treasury Bills | | | | |
| | 5,000,000 | | | 0.115%, 11/8/2012d | | $ | 4,999,888 | |
| | 1,500,000 | | | 0.125%, 1/17/2013d,e | | | 1,499,599 | |
| | | | | |
| | | | Total Short-Term Investments (at amortized cost) | | | 12,951,609 | |
| | | | | |
| | | | Total Investments (cost $541,835,239) 101.1% | | $ | 582,007,444 | |
| | | | | |
| | | | Other Assets and Liabilities, Net (1.1%) | | | (6,524,543 | ) |
| | | | | |
| | | | Total Net Assets 100.0% | | $ | 575,482,901 | |
| | | | | |
a | Non-income producing security. |
b | Denotes variable rate securities. Variable rate securities are securities whose yields vary with a designated market index or market rate. The rate shown is as of October 31, 2012. |
c | Denotes investments purchased on a when-issued or delayed delivery basis. |
d | The interest rate shown reflects the yield, coupon rate or the discount rate at the date of purchase. |
e | At October 31, 2012, $20,808,384 of investments were held on deposit with the counterparty and pledged as the initial margin deposit for open futures contracts. |
Definitions:
| | | | |
ADR | | - | | American Depositary Receipt, which are certificates for an underlying foreign security’s shares held by an issuing U.S. depository bank. |
Unrealized Appreciation (Depreciation)
Gross unrealized appreciation and depreciation of investments, based on cost for federal income tax purposes, were as follows:
| | | | |
Gross unrealized appreciation | | $ | 53,714,022 | |
Gross unrealized depreciation | | | (18,624,444 | ) |
| | | | |
Net unrealized appreciation (depreciation) | | $ | 35,089,578 | |
| |
Cost for federal income tax purposes | | $ | 546,917,866 | |
Fair Valuation Measurements
The following table is a summary of the inputs used, as of October 31, 2012, in valuing Aggressive Allocation Fund’s assets carried at fair value.
| | | | | | | | | | | | | | | | |
Investments in Securities | | Total | | | Level 1 | | | Level 2 | | | Level 3 | |
| | | | |
Mutual Funds | | | | | | | | | | | | | | | | |
Equity Mutual Funds | | | 358,602,669 | | | | 358,602,669 | | | | – | | | | – | |
Fixed Income Mutual Funds | | | 39,090,265 | | | | 39,090,265 | | | | – | | | | – | |
| | | | |
Common Stock | | | | | | | | | | | | | | | | |
Consumer Discretionary | | | 24,009,893 | | | | 24,009,893 | | | | – | | | | – | |
Consumer Staples | | | 10,399,449 | | | | 9,421,730 | | | | 977,719 | | | | – | |
Energy | | | 11,355,529 | | | | 10,673,938 | | | | 681,591 | | | | – | |
Financials | | | 21,060,429 | | | | 21,060,429 | | | | – | | | | – | |
Health Care | | | 22,290,705 | | | | 22,290,705 | | | | – | | | | – | |
Industrials | | | 20,864,473 | | | | 20,864,473 | | | | – | | | | – | |
Information Technology | | | 33,267,374 | | | | 33,267,374 | | | | – | | | | – | |
Materials | | | 6,708,414 | | | | 6,708,414 | | | | – | | | | – | |
Telecommunications Services | | | 750,735 | | | | 750,735 | | | | – | | | | – | |
Utilities | | | 4,124,966 | | | | 4,124,966 | | | | – | | | | – | |
| | | | |
Long-Term Fixed Income | | | | | | | | | | | | | | | | |
Asset-Backed Securities | | | 382,490 | | | | – | | | | 382,490 | | | | – | |
Collateralized Mortgage Obligations | | | 433,501 | | | | – | | | | 433,501 | | | | – | |
Commercial Mortgage-Backed Securities | | | 263,659 | | | | – | | | | 263,659 | | | | – | |
Mortgage-Backed Securities | | | 6,214,332 | | | | – | | | | 6,214,332 | | | | – | |
U.S. Government and Agencies | | | 9,236,952 | | | | – | | | | 9,236,952 | | | | – | |
Short-Term Investments | | | 12,951,609 | | | | 6,352,142 | | | | 6,599,467 | | | | – | |
| |
Total | | | $582,007,444 | | | | $557,217,733 | | | | $24,789,711 | | | | $– | |
| |
The accompanying Notes to Financial Statements are an integral part of this schedule.
57
Aggressive Allocation Fund
Schedule of Investments as of October 31, 2012
| | | | | | | | | | | | | | | | |
Other Financial Instruments | | Total | | | Level 1 | | | Level 2 | | | Level 3 | |
| | | | |
Asset Derivatives | | | | | | | | | | | | | | | | |
Futures Contracts | | | 5,405,493 | | | | 5,405,493 | | | | – | | | | – | |
| |
Total Asset Derivatives | | | $5,405,493 | | | | $5,405,493 | | | | $– | | | | $– | |
| |
| | | | |
Liability Derivatives | | | | | | | | | | | | | | | | |
Futures Contracts | | | 4,307,183 | | | | 4,307,183 | | | | – | | | | – | |
Foreign Currency Forward Contracts | | | 15 | | | | – | | | | 15 | | | | – | |
| |
Total Liability Derivatives | | | $4,307,198 | | | | $4,307,183 | | | | $15 | | | | $– | |
| |
There were no significant transfers between Levels during the period ended October 31, 2012. Transfers between Levels are identified as of the end of the period.
| | | | | | | | | | | | | | | | | | | | |
Futures Contracts | | Number of
Contracts
Long/(Short) | | | Expiration
Date | | | Notional
Principal Amount | | | Value | | | Unrealized
Gain/(Loss) | |
2-Yr. U.S. Treasury Bond Futures | | | (10 | ) | | | December 2012 | | | | ($2,204,188 | ) | | | ($2,203,281 | ) | | | $907 | |
5-Yr. U.S. Treasury Bond Futures | | | (30 | ) | | | December 2012 | | | | (3,730,377 | ) | | | (3,727,500 | ) | | | 2,877 | |
10-Yr. U.S. Treasury Bond Futures | | | (50 | ) | | | December 2012 | | | | (6,645,707 | ) | | | (6,651,563 | ) | | | (5,856 | ) |
20-Yr U.S. Treasury Bond Futures | | | 15 | | | | December 2012 | | | | 2,246,296 | | | | 2,239,688 | | | | (6,608 | ) |
Eurex EURO STOXX 50 Futures | | | 152 | | | | December 2012 | | | | 5,072,779 | | | | 4,933,223 | | | | (139,556 | ) |
Russell 2000 Index Mini-Futures | | | (580 | ) | | | December 2012 | | | | (49,956,966 | ) | | | (47,345,400 | ) | | | 2,611,566 | |
S&P 400 Index Mini Futures | | | (601 | ) | | | December 2012 | | | | (61,573,953 | ) | | | (58,783,810 | ) | | | 2,790,143 | |
S&P 500 Index Futures | | | 318 | | | | December 2012 | | | | 115,995,763 | | | | 111,840,600 | | | | (4,155,163 | ) |
Total Futures Contracts | | | | | | | | | | | | | | | | | | | $1,098,310 | |
| | | | | | | | | | | | | | | | | | | | | | |
Foreign Currency Forward Contracts | | Counterparty | | Contracts to
Deliver/Receive | | | Settlement
Date | | | Value on
Settlement Date | | | Value | | | Unrealized
Gain/(Loss) | |
| | | | | | |
Sales | | | | | | | | | | | | | | | | | | | | | | |
Euro | | SSB | | | 27,360 | | | | 11/1/2012 | | | | $35,448 | | | | $35,463 | | | | ($15 | ) |
Total Sales | | | | | | | | | | | | | $35,448 | | | | $35,463 | | | | ($15 | ) |
| | | |
Net Unrealized Gain/(Loss) on Foreign Currency Forward Contracts | | | | | | | | | | | | ($15 | ) |
| | | | | | |
Counterparty |
SSB | | | - | | | State Street Bank |
The accompanying Notes to Financial Statements are an integral part of this schedule.
58
Aggressive Allocation Fund
Schedule of Investments as of October 31, 2012
The following table summarizes the fair value and Statement of Assets and Liabilities location, as of October 31, 2012, for Aggressive Allocation Fund’s investments in financial derivative instruments by primary risk exposure as discussed under item (2) Significant Accounting Policies of the Notes to Financial Statements.
| | | | | | |
Derivatives by risk category | | Statement of Assets and Liabilities Location | | Fair Value | |
| | |
Asset Derivatives | | | | | | |
| | |
Equity Contracts | | | | | | |
Futures* | | Net Assets - Net unrealized appreciation/(depreciation) on Futures contracts | | | $5,401,709 | |
Total Equity Contracts | | | | | 5,401,709 | |
| | |
Interest Rate Contracts | | | | | | |
Futures* | | Net Assets - Net unrealized appreciation/(depreciation) on Futures contracts | | | 3,784 | |
Total Interest Rate Contracts | | | | | 3,784 | |
| |
Total Asset Derivatives | | | | | $5,405,493 | |
| |
| | |
Liability Derivatives | | | | | | |
| | |
Equity Contracts | | | | | | |
Futures* | | Net Assets - Net unrealized appreciation/(depreciation) on Futures contracts | | | 4,294,719 | |
Total Equity Contracts | | | | | 4,294,719 | |
| | |
Interest Rate Contracts | | | | | | |
Futures* | | Net Assets - Net unrealized appreciation/(depreciation) on Futures contracts | | | 12,464 | |
Total Interest Rate Contracts | | | | | 12,464 | |
| | |
Foreign Exchange Contracts | | | | | | |
Forward Contracts | | Receivable/Payable for forward contracts, Net Assets - Net unrealized appreciation/(depreciation) on Foreign currency forward contracts | | | 15 | |
Total Foreign Exchange Contracts | | | | | 15 | |
| |
Total Liability Derivatives | | | | | $4,307,198 | |
| |
* | Includes cumulative appreciation/depreciation of futures contracts as reported in the Schedule of Investments. Only current day’s variation margin is reported within the Statement of Assets and Liabilities. |
The following table summarizes the net realized gains/(losses) and Statement of Operations location, for the period ended October 31, 2012, for Aggressive Allocation Fund’s investments in financial derivative instruments by primary risk exposure.
| | | | | | |
Derivatives by risk category | | Statement of Operations Location | | Realized Gains/(Losses)
recognized in Income | |
| | |
Interest Rate Contracts | | | | | | |
Futures | | Net realized gains/(losses) on Futures contracts | | | 16,892 | |
| | |
Total Interest Rate Contracts | | | | | 16,892 | |
| | |
Equity Contracts | | | | | | |
Futures | | Net realized gains/(losses) on Futures contracts | | | 4,659,427 | |
| | |
Total Equity Contracts | | | | | 4,659,427 | |
| | |
Foreign Exchange Contracts | | | | | | |
Forward Contracts | | Net realized gains/(losses) on Foreign currency transactions | | | (22,637 | ) |
| | |
Total Foreign Exchange Contracts | | | | | (22,637 | ) |
| | |
Credit Contracts | | | | | | |
Credit Default Swaps | | Net realized gains/(losses) on Swap agreements | | | 166,026 | |
| | |
Total Credit Contracts | | | | | 166,026 | |
| |
Total | | | | | $4,819,708 | |
| |
The accompanying Notes to Financial Statements are an integral part of this schedule.
59
Aggressive Allocation Fund
Schedule of Investments as of October 31, 2012
The following table summarizes the change in net unrealized appreciation/(depreciation) and Statement of Operations location, for the period ended October 31, 2012, for Aggressive Allocation Fund’s investments in financial derivative instruments by primary risk exposure.
| | | | | | |
Derivatives by risk category | | Statement of Operations Location | | Change in unrealized
appreciation/(depreciation)
recognized in Income | |
| | |
Equity Contracts | | | | | | |
Futures | | Change in net unrealized appreciation/(depreciation) on Futures contracts | | | (1,771,110 | ) |
Total Equity Contracts | | | | | (1,771,110 | ) |
| | |
Interest Rate Contracts | | | | | | |
Futures | | Change in net unrealized appreciation/(depreciation) on Futures contracts | | | (6,811 | ) |
Total Interest Rate Contracts | | | | | (6,811 | ) |
| | |
Foreign Exchange Contracts | | | | | | |
Forward Contracts | | Change in net unrealized appreciation/(depreciation) on Foreign currency forward contracts | | | (15 | ) |
Total Foreign Exchange Contracts | | | | | (15 | ) |
| |
Total | | | | | ($1,777,936 | ) |
| |
The following table presents Aggressive Allocation Fund’s average volume of derivative activity during the period ended October 31, 2012.
| | | | | | | | | | | | |
Derivative Risk Category | | Futures
(Notional*) | | Futures
(Percentage
of Average
Net Assets) | | Forwards
(Notional*) | | Forwards
(Percentage
of Average
Net Assets) | | Swaps
(Notional*) | | Swaps
(Percentage
of Average
Net Assets) |
Equity Contracts | | $217,179,206 | | 38.5% | | N/A | | N/A | | N/A | | N/A |
Interest Rate Contracts | | 6,038,053 | | 1.1 | | N/A | | N/A | | N/A | | N/A |
Foreign Exchange Contracts | | N/A | | N/A | | $96,273 | | <0.1% | | N/A | | N/A |
Credit Contracts | | N/A | | N/A | | N/A | | N/A | | $553,266 | | 0.1% |
* | Notional amount represents long or short, or both, derivative positions held by the Fund. |
The accompanying Notes to Financial Statements are an integral part of this schedule.
60
Aggressive Allocation Fund
Schedule of Investments as of October 31, 2012
Investment in Affiliates
Affiliated issuers, as defined under the Investment Company Act of 1940, include those in which the Fund’s holdings of an issuer represent 5% or more of the outstanding voting securities of an issuer, or any affiliated mutual fund.
A summary of transactions for the fiscal year to date, in Aggressive Allocation Fund, is as follows:
| | | | | | | | | | | | | | | | | | | | | | | | |
Fund | | Value October 31, 2011 | | | Gross
Purchases | | | Gross Sales | | | Shares Held at
October 31, 2012 | | | Value
October 31, 2012 | | | Income Earned
November 1, 2011 - October 31, 2012 | |
Natural Resources | | | $10,180,455 | | | | $5,014,701 | | | | $– | | | | 1,505,642 | | | | $13,550,782 | | | | $14,701 | |
Partner Small Cap Growth | | | 44,357,797 | | | | – | | | | 2,000,000 | | | | 3,537,097 | | | | 45,911,513 | | | | – | |
Partner Small Cap Value | | | 11,425,311 | | | | 196,031 | | | | 1,000,000 | | | | 701,978 | | | | 11,793,236 | | | | 75,784 | |
Small Cap Stock | | | 15,026,295 | | | | – | | | | – | | | | 1,004,432 | | | | 16,161,303 | | | | – | |
Mid Cap Growth | | | 32,808,108 | | | | 245,390 | | | | – | | | | 1,669,389 | | | | 34,522,959 | | | | – | |
Partner Mid Cap Value | | | 18,418,798 | | | | 148,414 | | | | – | | | | 1,600,892 | | | | 20,587,471 | | | | 148,414 | |
Mid Cap Stock | | | 28,204,069 | | | | – | | | | – | | | | 1,827,872 | | | | 30,397,516 | | | | – | |
Partner Worldwide Allocation | | | 83,215,986 | | | | 872,371 | | | | – | | | | 10,089,922 | | | | 88,690,414 | | | | 872,371 | |
Large Cap Growth | | | 35,093,059 | | | | 2,326 | | | | – | | | | 6,646,866 | | | | 39,282,979 | | | | 2,326 | |
Large Cap Value | | | 29,117,144 | | | | 559,768 | | | | – | | | | 2,275,936 | | | | 33,592,812 | | | | 559,768 | |
Large Cap Stock | | | 27,521,460 | | | | 213,407 | | | | 10,000,000 | | | | 824,079 | | | | 19,629,570 | | | | 213,407 | |
Equity Income Plus | | | 4,031,097 | | | | 92,181 | | | | – | | | | 466,401 | | | | 4,482,114 | | | | 92,181 | |
High Yield | | | 5,190,125 | | | | 11,118,917 | | | | 770,389 | | | | 3,231,517 | | | | 16,189,902 | | | | 638,512 | |
Income | | | – | | | | 11,397,930 | | | | 360,000 | | | | 1,267,930 | | | | 11,880,506 | | | | 397,931 | |
Government Bond | | | 11,849,412 | | | | 390,767 | | | | 2,554,043 | | | | 907,050 | | | | 9,759,861 | | | | 142,205 | |
Limited Maturity Bond | | | – | | | | 4,230,378 | | | | 3,000,000 | | | | 99,841 | | | | 1,259,996 | | | | 30,376 | |
Securities Lending Trust-Collateral Investment | | | – | | | | 5,428,712 | | | | 5,428,712 | | | | – | | | | – | | | | 241 | |
Securities Lending Trust-Short Term Investment | | | – | | | | 11,132,713 | | | | 4,780,571 | | | | 6,352,142 | | | | 6,352,142 | | | | 9,969 | |
Total Value and Income Earned | | | 356,439,116 | | | | | | | | | | | | | | | | 404,045,076 | | | | 3,198,186 | |
The accompanying Notes to Financial Statements are an integral part of this schedule.
61
Moderately Aggressive Allocation Fund
Schedule of Investments as of October 31, 2012
| | | | | | | | |
Principal Amount | | | Bank Loans (1.6%)a | | Value | |
| Basic Materials (0.2%) | | | | |
| | | | Arch Coal, Inc., Term Loan | | | | |
| | $364,087 | | | 5.750%, 5/16/2018 | | | $366,949 | |
| | | | FMG Resources August 2006 Pty., Ltd., Term Loan | | | | |
| | 1,965,000 | | | 0.000%, 10/18/2017b,c | | | 1,954,192 | |
| | | | Ineos US Finance, LLC, Term Loan | | | | |
| | 475,197 | | | 6.500%, 5/4/2018 | | | 481,432 | |
| | | | | |
| | | | Total | | | 2,802,573 | |
| | | | | |
| |
| Capital Goods (0.1%) | | | | |
| | | | ADS Waste Holdings, Inc., Term Loan | | | | |
| | 510,000 | | | 1.686%, 10/9/2019b,c | | | 514,590 | |
| | | | MRC Global, Inc., Term Loan | | | | |
| | 365,000 | | | 0.000%, 10/24/2019b,c | | | 364,087 | |
| | | | | |
| | | | Total | | | 878,677 | |
| | | | | |
| |
| Communications Services (0.5%) | | | | |
| | | | Atlantic Broadband Finance, LLC, Term Loan | | | | |
| | 438,900 | | | 5.250%, 4/4/2019 | | | 440,182 | |
| | | | Charter Communications Operating, LLC, Term Loan | | | | |
| | 348,250 | | | 4.000%, 5/15/2019 | | | 350,534 | |
| | | | Clear Channel Communications, Term Loan | | | | |
| | 550,000 | | | 3.820%, 1/29/2016b,c | | | 451,346 | |
| | | | Cogeco Cable, Inc., Term Loan | | | | |
| | 295,000 | | | 0.000%, 9/10/2019b,c | | | 297,213 | |
| | | | Cricket Communications, Inc., Term Loan | | | | |
| | 75,000 | | | 0.000%, 10/10/2019b,c | | | 75,235 | |
| | | | Cumulus Media Holdings, Inc., Term Loan | | | | |
| | 582,298 | | | 5.750%, 9/17/2018 | | | 586,082 | |
| | | | Level 3 Financing, Inc., Term Loan | | | | |
| | 715,000 | | | 4.750%, 8/1/2019 | | | 717,939 | |
| | | | Liberty Cablevision of Puerto Rico, Ltd., Term Loan | | | | |
| | 364,087 | | | 6.000%, 6/9/2017 | | | 363,177 | |
| | | | MCC Georgia, LLC, Term Loan | | | | |
| | 295,000 | | | 4.000%, 1/20/2020 | | | 293,525 | |
| | | | SBA Senior Finance II, LLC, Term Loan | | | | |
| | 215,000 | | | 3.750%, 9/28/2019 | | | 215,914 | |
| | | | Toys R Us, Inc., Term Loan | | | | |
| | 609,253 | | | 5.250%, 5/25/2018 | | | 596,154 | |
| | | | Univision Communications, Inc., Term Loan | | | | |
| | 231,842 | | | 2.212%, 9/29/2014 | | | 230,863 | |
| | 295,000 | | | 4.462%, 3/31/2017 | | | 288,180 | |
| | | | Van Wagner Communications, Inc., Term Loan | | | | |
| | 290,000 | | | 8.250%, 8/3/2018 | | | 293,263 | |
| | | | WideOpenWest Finance, LLC, Term Loan | | | | |
| | 543,637 | | | 6.250%, 7/17/2018 | | | 548,057 | |
| | | | Yankee Cable Acquisition, LLC, Term Loan | | | | |
| | 284,653 | | | 5.250%, 8/26/2016 | | | 285,601 | |
| | | | Zayo Group, LLC, Term Loan | | | | |
| | 768,625 | | | 5.250%, 7/2/2019 | | | 771,315 | |
| | | | | |
| | | | Total | | | 6,804,580 | |
| | | | | |
| |
| Consumer Cyclical (0.2%) | | | | |
| | | | Burlington Coat Factory Warehouse Corporation, Term Loan | | | | |
| | 473,331 | | | 5.500%, 2/23/2017 | | | 476,511 | |
| | | | Chrysler Group, LLC, Term Loan | | | | |
| | 437,783 | | | 6.000%, 5/24/2017 | | | 446,841 | |
| | | | Rock Ohio Caesars, LLC, 18 month Delayed Draw | | | | |
| | 67,500 | | | 5.704%, 8/19/2017b,c | | | 69,019 | |
| | | | Rock Ohio Caesars, LLC, 6 month Delayed Draw | | | | |
| | 40,500 | | | 5.704%, 8/19/2017b,c | | | 41,411 | |
| | | | Rock Ohio Caesars, LLC, Term Loan | | | | |
| | 517,000 | | | 8.426%, 8/19/2017b,c | | | 528,633 | |
| | | | Seven Seas Cruises S de RL, LLC, Term Loan | | | | |
| | 660,000 | | | 6.250%, 12/21/2018 | | | 669,075 | |
| | | | | |
| | | | Total | | | 2,231,490 | |
| | | | | |
| |
| Consumer Non-Cyclical (0.3%) | | | | |
| | | | Bausch & Lomb, Inc., Term Loan | | | | |
| | 364,088 | | | 5.250%, 5/17/2019 | | | 367,860 | |
| | | | Ceridian Corporation, Term Loan | | | | |
| | 440,000 | | | 5.893%, 5/9/2017b,c | | | 438,350 | |
| | | | CHS/Community Health Systems, Inc., Term Loan | | | | |
| | 365,000 | | | 3.921%, 1/25/2017 | | | 366,365 | |
| | | | DJO Finance, LLC, Term Loan | | | | |
| | 364,085 | | | 6.250%, 9/15/2017 | | | 365,148 | |
| | | | Grifols, Inc., Term Loan | | | | |
| | 363,811 | | | 4.500%, 6/1/2017 | | | 366,798 | |
| | | | Hologic, Inc., Term Loan | | | | |
| | 438,900 | | | 4.500%, 8/1/2019 | | | 443,535 | |
| | | | Reynolds Group Holdings, Inc., Term Loan | | | | |
| | 70,000 | | | 0.000%, 9/28/2018b,c | | | 70,201 | |
| | | | Roundy’s Supermarkets, Inc., Term Loan | | | | |
| | 657,625 | | | 5.750%, 2/13/2019 | | | 637,778 | |
| | | | Visant Corporation, Term Loan | | | | |
| | 565,000 | | | 5.095%, 12/22/2016b,c | | | 540,044 | |
| | | | Warner Chilcott Company, LLC, Term Loan | | | | |
| | 28,169 | | | 4.250%, 3/15/2018 | | | 28,248 | |
| | | | Warner Chilcott Corporation, Term Loan | | | | |
| | 56,338 | | | 4.250%, 3/15/2018 | | | 56,496 | |
| | 21,395 | | | 4.250%, 3/15/2018 | | | 21,455 | |
| | | | WC Luxco Sarl, Term Loan | | | | |
| | 38,732 | | | 4.250%, 3/15/2018 | | | 38,841 | |
| | | | | |
| | | | Total | | | 3,741,119 | |
| | | | | |
| |
| Energy (<0.1%) | | | | |
| | | | Chesapeake Energy Corporation, Term Loan | | | | |
| | 150,892 | | | 8.500%, 12/2/2017 | | | 151,037 | |
The accompanying Notes to Financial Statements are an integral part of this schedule.
62
Moderately Aggressive Allocation Fund
Schedule of Investments as of October 31, 2012
| | | | | | | | |
Principal Amount | | | Bank Loans (1.6%)a | | Value | |
| Energy (<0.1%) - continued | | | | |
| | | | GenOn Energy, Inc., Term Loan | | | | |
| | $293,503 | | | 6.500%, 12/4/2017 | | | $295,522 | |
| | | | Plains Exploration & Production Company, Term Loan | | | | |
| | 140,000 | | | 0.000%, 10/15/2019b,c | | | 140,550 | |
| | | | | |
| | | | Total | | | 587,109 | |
| | | | | |
| |
| Financials (0.1%) | | | | |
| | | | Nuveen Investments, Inc., Term Loan | | | | |
| | 105,000 | | | 5.841%, 5/13/2017 | | | 104,606 | |
| | 365,000 | | | 5.846%, 5/13/2017 | | | 364,431 | |
| | | | WaveDivision Holdings, LLC, Term Loan | | | | |
| | 515,000 | | | 4.250%, 8/9/2019b,c | | | 520,577 | |
| | | | | |
| | | | Total | | | 989,614 | |
| | | | | |
| |
| Technology (0.1%) | | | | |
| | | | First Data Corporation Extended, Term Loan | | | | |
| | 440,000 | | | 4.211%, 3/26/2018 | | | 419,100 | |
| | | | First Data Corporation, Term Loan | | | | |
| | 295,000 | | | 5.211%, 9/24/2018 | | | 288,289 | |
| | | | Freescale Semiconductor, Inc., Term Loan | | | | |
| | 482,575 | | | 6.000%, 2/28/2019 | | | 478,473 | |
| | | | Infor US, Inc., Term Loan | | | | |
| | 434,100 | | | 6.077%, 4/5/2018 | | | 438,575 | |
| | | | Intelsat Jackson Holdings SA, Term Loan | | | | |
| | 540,678 | | | 4.500%, 4/2/2018 | | | 544,171 | |
| | | | | |
| | | | Total | | | 2,168,608 | |
| | | | | |
| |
| Transportation (<0.1%) | | | | |
| | | | Delta Air Lines, Inc., Term Loan | | | | |
| | 437,783 | | | 5.500%, 4/20/2017 | | | 437,346 | |
| | | | | |
| | | | Total | | | 437,346 | |
| | | | | |
| |
| Utilities (0.1%) | | | | |
| | | | Calpine Corporation, Term Loan | | | | |
| | 585,000 | | | 4.500%, 10/9/2019 | | | 585,427 | |
| | | | NGPL PipeCo, LLC, Term Loan | | | | |
| | 550,000 | | | 6.750%, 9/15/2017 | | | 560,544 | |
| | | | | |
| | | | Total | | | 1,145,971 | |
| | | | | |
| | | | | | | | |
| | | | | |
| | | | Total Bank Loans (cost $21,654,041) | | | 21,787,087 | |
| | | | | |
| | |
| Shares | | | Mutual Funds (67.4%) | | Value | |
| Equity Mutual Funds (53.2%) | | | | |
| | 3,041,479 | | | Thrivent Natural Resources Fund | | | 27,373,309 | |
| | 3,151,900 | | | Thrivent Partner Small Cap Growth Fundd | | | 40,911,660 | |
| | 1,671,574 | | | Thrivent Partner Small Cap Value Fund | | | 28,082,450 | |
| | 1,344,712 | | | Thrivent Small Cap Stock Fundd | | | 21,636,409 | |
| | 1,772,686 | | | Thrivent Mid Cap Growth Fundd | | | 36,659,156 | |
| | 3,639,699 | | | Thrivent Partner Mid Cap Value Fund | | | 46,806,534 | |
| | 4,016,385 | | | Thrivent Mid Cap Stock Fundd | | | 66,792,476 | |
| | 9,423,219 | | | Thrivent Partner Worldwide Allocation Fund | | | 170,730,097 | |
| | 14,262,471 | | | Thrivent Large Cap Growth Fund | | | 84,291,204 | |
| | 7,437,992 | | | Thrivent Large Cap Value Fund | | | 109,784,766 | |
| | 3,297,726 | | | Thrivent Large Cap Stock Fund | | | 78,551,831 | |
| | 1,182,053 | | | Thrivent Equity Income Plus Fund | | | 11,359,530 | |
| | | | | |
| | | | Total | | | 722,979,422 | |
| | | | | |
| |
| Fixed Income Mutual Funds (14.2%) | | | | |
| | 10,768,068 | | | Thrivent High Yield Fund | | | 53,948,019 | |
| | 9,440,144 | | | Thrivent Income Fund | | | 88,454,152 | |
| | 2,280,527 | | | Thrivent Government Bond Fund | | | 24,538,470 | |
| | 2,087,581 | | | Thrivent Limited Maturity Bond Fund | | | 26,345,273 | |
| | | | | |
| | | | Total | | | 193,285,914 | |
| | | | | |
| | | | | | | | |
| | | | | |
| | | | Total Mutual Funds (cost $871,943,147) | | | 916,265,336 | |
| | | | | |
| | |
| Shares | | | Common Stock (18.9%) | | Value | |
| Consumer Discretionary (2.8%) | | | | |
| | 7,200 | | | Amazon.com, Inc.d | | | 1,676,304 | |
| | 3,800 | | | AutoZone, Inc.d | | | 1,425,000 | |
| | 9,390 | | | CBS Corporation | | | 304,236 | |
| | 11,300 | | | Charter Communications, Inc.d | | | 874,733 | |
| | 11,000 | | | Cheesecake Factory, Inc. | | | 363,660 | |
| | 18,200 | | | Children’s Place Retail Stores, Inc.d | | | 1,063,426 | |
| | 162,400 | | | Comcast Corporation | | | 6,091,624 | |
| | 24,032 | | | Delphi Automotive plcd | | | 755,566 | |
| | 15,700 | | | DISH Network Corporation | | | 559,391 | |
| | 14,436 | | | Dollar Tree, Inc.d | | | 575,563 | |
| | 34,800 | | | Expedia, Inc. | | | 2,058,420 | |
| | 34,488 | | | Foot Locker, Inc. | | | 1,155,348 | |
| | 34,000 | | | GNC Holdings, Inc. | | | 1,314,780 | |
| | 4,570 | | | Harley-Davidson, Inc. | | | 213,693 | |
| | 18,100 | | | Home Depot, Inc. | | | 1,110,978 | |
| | 103,613 | | | Las Vegas Sands Corporation | | | 4,811,788 | |
| | 21,410 | | | Life Time Fitness, Inc.d | | | 961,095 | |
| | 41,140 | | | Lowe’s Companies, Inc. | | | 1,332,113 | |
| | 27,900 | | | Meredith Corporation | | | 933,813 | |
| | 33,210 | | | News Corporation | | | 808,996 | |
| | 19,300 | | | NIKE, Inc. | | | 1,763,634 | |
| | 14,100 | | | Omnicom Group, Inc. | | | 675,531 | |
| | 18,900 | | | O’Reilly Automotive, Inc.d | | | 1,619,352 | |
| | 2,265 | | | Panera Bread Companyd | | | 381,970 | |
| | 11,600 | | | Penn National Gaming, Inc.d | | | 468,988 | |
| | 5,700 | | | PetSmart, Inc. | | | 378,423 | |
| | 65,379 | | | Pier 1 Imports, Inc. | | | 1,333,731 | |
| | 37,100 | | | Sally Beauty Holdings, Inc.d | | | 893,368 | |
| | 16,000 | | | Tempur-Pedic International, Inc.d | | | 423,040 | |
| | 9,490 | | | Time Warner Cable, Inc. | | | 940,554 | |
| | 18,000 | | | Toll Brothers, Inc.d | | | 594,180 | |
| | 20,758 | | | WMS Industries, Inc.d | | | 341,054 | |
| | | | | |
| | | | Total | | | 38,204,352 | |
| | | | | |
| |
| Consumer Staples (1.3%) | | | | |
| | 15,562 | | | Anheuser-Busch InBev NV ADR | | | 1,304,096 | |
| | 21,193 | | | Annie’s, Inc.d | | | 837,124 | |
| | 11,956 | | | British American Tobacco plc ADR | | | 1,187,948 | |
| | 17,390 | | | CVS Caremark Corporation | | | 806,896 | |
The accompanying Notes to Financial Statements are an integral part of this schedule.
63
Moderately Aggressive Allocation Fund
Schedule of Investments as of October 31, 2012
| | | | | | | | |
| Shares | | | Common Stock (18.9%) | | Value | |
| Consumer Staples (1.3%) - continued | | | | |
| | 5,130 | | | Diageo plc ADR | | | $586,051 | |
| | 29,152 | | | Ingredion, Inc. | | | 1,791,682 | |
| | 6,020 | | | Kimberly-Clark Corporation | | | 502,369 | |
| | 8,779 | | | Kraft Foods Group, Inc.d | | | 399,269 | |
| | 149,937 | | | Mondelez International, Inc. | | | 3,979,328 | |
| | 20,200 | | | Nestle SA | | | 1,282,462 | |
| | 45,607 | | | Philip Morris International, Inc.j | | | 4,038,956 | |
| | 11,048 | | | TreeHouse Foods, Inc.d | | | 591,620 | |
| | 13,650 | | | Unilever NV ADR | | | 500,818 | |
| | | | | |
| | | | Total | | | 17,808,619 | |
| | | | | |
| |
| Energy (1.4%) | | | | |
| | 63,114 | | | Alpha Natural Resources, Inc.d | | | 540,887 | |
| | 29,270 | | | BP plc ADR | | | 1,255,390 | |
| | 7,840 | | | Chevron Corporation | | | 864,047 | |
| | 37,600 | | | Consol Energy, Inc. | | | 1,322,016 | |
| | 9,600 | | | Ensco plc | | | 555,072 | |
| | 17,528 | | | EOG Resources, Inc. | | | 2,041,837 | |
| | 13,960 | | | EQT Corporation | | | 846,395 | |
| | 28,700 | | | Helix Energy Solutions Group, Inc.d | | | 496,223 | |
| | 75,320 | | | Marathon Oil Corporation | | | 2,264,119 | |
| | 67,300 | | | Marathon Petroleum Corporation | | | 3,696,789 | |
| | 4,707 | | | Oasis Petroleum, Inc.d | | | 138,245 | |
| | 56,251 | | | Petroleum Geo-Services ASA | | | 971,990 | |
| | 22,280 | | | Schlumberger, Ltd. | | | 1,549,128 | |
| | 15,600 | | | Southwestern Energy Companyd | | | 541,320 | |
| | 38,390 | | | Swift Energy Companyd | | | 641,497 | |
| | 165,900 | | | Weatherford International, Ltd.d | | | 1,874,670 | |
| | | | | |
| | | | Total | | | 19,599,625 | |
| | | | | |
| |
| Financials (2.8%) | | | | |
| | 9,870 | | | ACE, Ltd. | | | 776,275 | |
| | 10,065 | | | Affiliated Managers Group, Inc.d | | | 1,273,223 | |
| | 3,100 | | | Allied World Assurance Company Holdings AG | | | 248,930 | |
| | 11,960 | | | Allstate Corporation | | | 478,161 | |
| | 10,800 | | | American Assets Trust, Inc. | | | 293,436 | |
| | 6,700 | | | American Campus Communities, Inc. | | | 303,577 | |
| | 22,300 | | | Ameriprise Financial, Inc. | | | 1,301,651 | |
| | 7,900 | | | Aspen Insurance Holdings, Ltd. | | | 255,565 | |
| | 11,700 | | | Axis Capital Holdings, Ltd. | | | 423,774 | |
| | 95,970 | | | Bank of America Corporation | | | 894,440 | |
| | 15,800 | | | BioMed Realty Trust, Inc. | | | 302,096 | |
| | 6,710 | | | Capital One Financial Corporation | | | 403,741 | |
| | 30,900 | | | CBL & Associates Properties, Inc. | | | 691,233 | |
| | 92,830 | | | Citigroup, Inc. | | | 3,470,914 | |
| | 22,000 | | | CME Group, Inc. | | | 1,230,460 | |
| | 45,100 | | | DCT Industrial Trust, Inc. | | | 290,895 | |
| | 12,800 | | | Douglas Emmett, Inc. | | | 300,160 | |
| | 35,329 | | | Duke Realty Corporation | | | 511,564 | |
| | 12,900 | | | Endurance Specialty Holdings, Ltd. | | | 523,095 | |
| | 4,300 | | | Equity Lifestyle Properties, Inc. | | | 289,519 | |
| | 8,800 | | | Extra Space Storage, Inc. | | | 303,512 | |
| | 4,010 | | | Goldman Sachs Group, Inc. | | | 490,784 | |
| | 38,482 | | | HCC Insurance Holdings, Inc. | | | 1,371,498 | |
| | 9,000 | | | Highwoods Properties, Inc. | | | 290,250 | |
| | 44,235 | | | Host Hotels & Resorts, Inc. | | | 639,638 | |
| | 87,500 | | | Huntington Bancshares, Inc. | | | 559,125 | |
| | 20,560 | | | Invesco, Ltd. | | | 500,019 | |
| | 7,000 | | | iShares Russell 2000 Index Fund | | | 568,680 | |
| | 93,228 | | | J.P. Morgan Chase & Company | | | 3,885,743 | |
| | 44,580 | | | KKR & Company, LP | | | 670,929 | |
| | 15,936 | | | Lazard, Ltd. | | | 469,475 | |
| | 5,700 | | | M&T Bank Corporation | | | 593,370 | |
| | 37,920 | | | MetLife, Inc. | | | 1,345,781 | |
| | 23,600 | | | NASDAQ OMX Group, Inc. | | | 561,916 | |
| | 12,900 | | | Northern Trust Corporation | | | 616,362 | |
| | 43,500 | | | Och-Ziff Capital Management Group, LLC | | | 435,435 | |
| | 12,500 | | | Pebblebrook Hotel Trust | | | 265,250 | |
| | 65,957 | | | Popular, Inc.d | | | 1,274,949 | |
| | 2,700 | | | ProAssurance Corporation | | | 241,380 | |
| | 24,050 | | | State Street Corporation | | | 1,071,909 | |
| | 29,880 | | | SVB Financial Groupd | | | 1,690,909 | |
| | 3,822 | | | Taubman Centers, Inc. | | | 300,218 | |
| | 12,300 | | | Tower Group, Inc. | | | 221,646 | |
| | 16,073 | | | W.R. Berkley Corporation | | | 625,079 | |
| | 63,860 | | | Wells Fargo & Company | | | 2,151,443 | |
| | 89,098 | | | Zions Bancorporation | | | 1,912,934 | |
| | | | | |
| | | | Total | | | 37,320,943 | |
| | | | | |
| |
| Health Care (2.8%) | | | | |
| | 29,500 | | | Abbott Laboratories | | | 1,932,840 | |
| | 4,600 | | | Alexion Pharmaceuticals, Inc.d | | | 415,748 | |
| | 27,400 | | | Align Technology, Inc.d | | | 728,292 | |
| | 36,920 | | | Baxter International, Inc. | | | 2,312,300 | |
| | 13,200 | | | Biogen Idec, Inc.d | | | 1,824,504 | |
| | 108,100 | | | Bristol-Myers Squibb Company | | | 3,594,325 | |
| | 5,251 | | | C.R. Bard, Inc. | | | 505,094 | |
| | 31,060 | | | Covidien plc | | | 1,706,747 | |
| | 48,900 | | | Endo Pharmaceutical Holdings, Inc.d | | | 1,401,474 | |
| | 10,879 | | | HeartWare International, Inc.d | | | 913,618 | |
| | 35,800 | | | Humana, Inc. | | | 2,658,866 | |
| | 10,300 | | | Illumina, Inc.d | | | 489,353 | |
| | 16,000 | | | Medicines Companyd | | | 350,720 | |
| | 85,570 | | | Merck & Company, Inc. | | | 3,904,559 | |
| | 147,566 | | | Pfizer, Inc. | | | 3,669,966 | |
| | 23,360 | | | Sanofi ADR | | | 1,024,336 | |
| | 15,500 | | | Shire Pharmaceuticals Group plc ADR | | | 1,308,045 | |
| | 19,400 | | | Thoratec Corporationd | | | 692,580 | |
| | 18,902 | | | United Therapeutics Corporationd | | | 863,254 | |
| | 99,661 | | | UnitedHealth Group, Inc. | | | 5,581,016 | |
| | 61,000 | | | VIVUS, Inc.d | | | 908,900 | |
| | 5,600 | | | Waters Corporationd | | | 458,136 | |
| | 9,642 | | | Zimmer Holdings, Inc. | | | 619,113 | |
| | | | | |
| | | | Total | | | 37,863,786 | |
| | | | | |
| |
| Industrials (2.5%) | | | | |
| | 19,700 | | | 3M Company | | | 1,725,720 | |
| | 38,100 | | | Actuant Corporation | | | 1,075,944 | |
| | 21,200 | | | ADT Corporationd | | | 880,012 | |
| | 19,165 | | | CSX Corporation | | | 392,308 | |
| | 37,823 | | | EMCOR Group, Inc. | | | 1,216,388 | |
| | 4,990 | | | FedEx Corporation | | | 459,030 | |
| | 3,400 | | | Flowserve Corporation | | | 460,666 | |
| | 25,900 | | | GATX Corporation | | | 1,073,814 | |
| | 16,301 | | | General Electric Company | | | 343,299 | |
| | 37,537 | | | HNI Corporation | | | 1,033,018 | |
The accompanying Notes to Financial Statements are an integral part of this schedule.
64
Moderately Aggressive Allocation Fund
Schedule of Investments as of October 31, 2012
| | | | | | | | |
| Shares | | | Common Stock (18.9%) | | Value | |
| Industrials (2.5%) - continued | | | | |
| | 38,066 | | | Honeywell International, Inc. | | | $2,331,162 | |
| | 49,480 | | | Jacobs Engineering Group, Inc.d | | | 1,909,433 | |
| | 20,700 | | | Landstar System, Inc. | | | 1,048,455 | |
| | 12,200 | | | Lockheed Martin Corporationj | | | 1,142,774 | |
| | 123,003 | | | Manitowoc Company, Inc. | | | 1,752,793 | |
| | 35,000 | | | Manpower, Inc. | | | 1,327,900 | |
| | 40,000 | | | McDermott International, Inc.d | | | 428,400 | |
| | 25,224 | | | Oshkosh Corporationd | | | 756,216 | |
| | 28,064 | | | Parker Hannifin Corporation | | | 2,207,514 | |
| | 5,231 | | | Pentair, Ltd. | | | 220,957 | |
| | 145,900 | | | Pitney Bowes, Inc. | | | 2,095,124 | |
| | 46,500 | | | Southwest Airlines Company | | | 410,130 | |
| | 4,820 | | | SPX Corporation | | | 330,604 | |
| | 54,700 | | | Tyco International, Ltd. | | | 1,469,789 | |
| | 41,700 | | | United Parcel Service, Inc. | | | 3,054,525 | |
| | 49,570 | | | United Technologies Corporation | | | 3,874,391 | |
| | 32,900 | | | Woodward, Inc. | | | 1,102,150 | |
| | | | | |
| | | | Total | | | 34,122,516 | |
| | | | | |
| |
| Information Technology (3.8%) | | | | |
| | 15,500 | | | Akamai Technologies, Inc.d | | | 588,845 | |
| | 9,500 | | | Alliance Data Systems Corporationd | | | 1,358,975 | |
| | 15,352 | | | Apple, Inc.j | | | 9,135,975 | |
| | 42,700 | | | Aruba Networks, Inc.d | | | 775,859 | |
| | 186,100 | | | Atmel Corporationd | | | 868,157 | |
| | 30,900 | | | Cavium, Inc.d | | | 1,025,262 | |
| | 18,700 | | | Citrix Systems, Inc.d | | | 1,155,847 | |
| | 17,441 | | | Cognizant Technology Solutions Corporationd | | | 1,162,443 | |
| | 32,981 | | | CoreLogic, Inc.d | | | 784,948 | |
| | 42,049 | | | eBay, Inc.d | | | 2,030,546 | |
| | 3,777 | | | Google, Inc.d | | | 2,567,491 | |
| | 32,100 | | | Informatica Corporationd | | | 871,194 | |
| | 97,900 | | | Intel Corporation | | | 2,117,087 | |
| | 16,600 | | | International Business Machines Corporation | | | 3,229,198 | |
| | 13,670 | | | Itron, Inc.d | | | 561,290 | |
| | 25,521 | | | Juniper Networks, Inc.d | | | 422,883 | |
| | 3,500 | | | MasterCard, Inc. | | | 1,613,255 | |
| | 177,883 | | | Microsoft Corporationj | | | 5,075,891 | |
| | 64,600 | | | NetApp, Inc.d | | | 1,737,740 | |
| | 50,707 | | | NVIDIA Corporationd | | | 606,963 | |
| | 118,510 | | | Oracle Corporation | | | 3,679,735 | |
| | 27,210 | | | Plantronics, Inc. | | | 882,692 | |
| | 24,900 | | | QUALCOMM, Inc. | | | 1,458,518 | |
| | 131,780 | | | Teradyne, Inc.d | | | 1,926,624 | |
| | 71,840 | | | Texas Instruments, Inc. | | | 2,017,986 | |
| | 32,622 | | | TIBCO Software, Inc.d | | | 822,401 | |
| | 34,700 | | | VeriFone Systems, Inc.d | | | 1,028,508 | |
| | 101,200 | | | Vishay Intertechnology, Inc.d | | | 837,936 | |
| | 172 | | | Workday, Inc.d | | | 8,342 | |
| | 44,875 | | | Xilinx, Inc. | | | 1,470,105 | |
| | 26,100 | | | Yahoo!, Inc.d | | | 438,741 | |
| | | | | |
| | | | Total | | | 52,261,437 | |
| | | | | |
| |
| Materials (0.8%) | | | | |
| | 119,500 | | | AK Steel Holding Corporation | | | 602,280 | |
| | 18,200 | | | Buckeye Technologies, Inc. | | | 476,840 | |
| | 16,100 | | | CF Industries Holdings, Inc. | | | 3,303,559 | |
| | 12,300 | | | Eagle Materials, Inc. | | | 651,531 | |
| | 34,338 | | | Freeport-McMoRan Copper & Gold, Inc. | | | 1,335,061 | |
| | 18,900 | | | H.B. Fuller Company | | | 574,560 | |
| | 12,350 | | | PPG Industries, Inc. | | | 1,445,938 | |
| | 6,748 | | | Sigma-Aldrich Corporation | | | 473,305 | |
| | 12,250 | | | Silgan Holdings, Inc. | | | 530,547 | |
| | 42,588 | | | Steel Dynamics, Inc. | | | 538,738 | |
| | 35,200 | | | SunCoke Energy, Inc.d | | | 565,664 | |
| | 10,840 | | | United States Steel Corporation | | | 221,028 | |
| | | | | |
| | | | Total | | | 10,719,051 | |
| | | | | |
| |
| Telecommunications Services (0.1%) | | | | |
| | 18,803 | | | Verizon Communications, Inc. | | | 839,366 | |
| | 79,600 | | | Windstream Corporation | | | 759,384 | |
| | | | | |
| | | | Total | | | 1,598,750 | |
| | | | | |
| |
| Utilities (0.6%) | | | | |
| | 28,300 | | | CMS Energy Corporation | | | 688,256 | |
| | 35,740 | | | NiSource, Inc. | | | 910,298 | |
| | 38,627 | | | NV Energy, Inc. | | | 734,299 | |
| | 33,270 | | | PG&E Corporation | | | 1,414,640 | |
| | 46,300 | | | PNM Resources, Inc. | | | 1,026,008 | |
| | 16,000 | | | Public Service Enterprise Group, Inc. | | | 512,640 | |
| | 31,900 | | | Southern Company | | | 1,494,196 | |
| | 21,982 | | | Southwest Gas Corporation | | | 955,558 | |
| | | | | |
| | | | Total | | | 7,735,895 | |
| | | | | |
| | | | | | | | |
| | | | | |
| | | | Total Common Stock (cost $234,829,521) | | | 257,234,974 | |
| | | | | |
| | |
Principal
Amount | | | Long-Term Fixed Income (9.4%) | | Value | |
| Asset-Backed Securities (0.3%) | | | | |
| | | | Morgan Stanley Capital, Inc. | | | | |
| | 659,799 | | | 0.361%, 2/25/2037e | | | 335,267 | |
| | | | Renaissance Home Equity Loan Trust | | | | |
| | 3,377,126 | | | 5.746%, 5/25/2036 | | | 2,145,664 | |
| | 1,780,000 | | | 6.011%, 5/25/2036 | | | 1,047,436 | |
| | | | | |
| | | | Total | | | 3,528,367 | |
| | | | | |
| |
| Basic Materials (0.1%) | | | | |
| | | | ArcelorMittal | | | | |
| | 51,000 | | | 5.375%, 6/1/2013 | | | 52,073 | |
| | | | Arch Coal, Inc. | | | | |
| | 325,000 | | | 7.000%, 6/15/2019f | | | 288,437 | |
| | | | BHP Billiton Finance, Ltd. | | | | |
| | 82,000 | | | 1.000%, 2/24/2015 | | | 82,787 | |
| | | | Dow Chemical Company | | | | |
| | 81,000 | | | 5.900%, 2/15/2015 | | | 90,148 | |
| | | | FMG Resources Property, Ltd. | | | | |
| | 325,000 | | | 8.250%, 11/1/2019f,g | | | 325,000 | |
| | | | Hexion US Finance Corporation/Hexion Nova Scotia Finance ULC | | | | |
| | 340,000 | | | 8.875%, 2/1/2018 | | | 343,400 | |
| | | | International Paper Company | | | | |
| | 53,000 | | | 5.300%, 4/1/2015 | | | 57,596 | |
| | | | LyondellBasell Industries NV | | | | |
| | 365,000 | | | 5.000%, 4/15/2019 | | | 395,112 | |
| | | | Novelis, Inc. | | | | |
| | 325,000 | | | 8.375%, 12/15/2017 | | | 353,437 | |
| | | | Rock-Tenn Company | | | | |
| | 56,000 | | | 3.500%, 3/1/2020g | | | 57,731 | |
The accompanying Notes to Financial Statements are an integral part of this schedule.
65
Moderately Aggressive Allocation Fund
Schedule of Investments as of October 31, 2012
| | | | | | | | |
Principal
Amount | | | Long-Term Fixed Income (9.4%) | | Value | |
| Basic Materials (0.1%) - continued | | | | |
| | | | Xstrata Finance Canada, Ltd. | | | | |
| | $54,000 | | | 1.800%, 10/23/2015g | | | $54,109 | |
| | 27,000 | | | 2.450%, 10/25/2017g | | | 26,931 | |
| | | | | |
| | | | Total | | | 2,126,761 | |
| | | | | |
| |
| Capital Goods (0.2%) | | | | |
| | | | Bombardier, Inc. | | | | |
| | 340,000 | | | 5.750%, 3/15/2022g | | | 358,275 | |
| | | | Case New Holland, Inc. | | | | |
| | 325,000 | | | 7.875%, 12/1/2017 | | | 381,875 | |
| | | | Caterpillar Financial Services Corporation | | | | |
| | 35,000 | | | 1.100%, 5/29/2015 | | | 35,427 | |
| | | | John Deere Capital Corporation | | | | |
| | 56,000 | | | 0.700%, 9/4/2015 | | | 56,078 | |
| | | | Pentair Finance SA | | | | |
| | 56,000 | | | 1.875%, 9/15/2017g | | | 56,173 | |
| | | | Raytheon Company | | | | |
| | 81,000 | | | 1.625%, 10/15/2015 | | | 82,750 | |
| | | | RBS Global, Inc. | | | | |
| | 340,000 | | | 8.500%, 5/1/2018 | | | 373,150 | |
| | | | Reynolds Group Issuer, Inc. | | | | |
| | 325,000 | | | 6.875%, 2/15/2021 | | | 345,313 | |
| | | | Sealed Air Corporation | | | | |
| | 345,000 | | | 8.375%, 9/15/2021g | | | 379,500 | |
| | | | Textron, Inc. | | | | |
| | 106,000 | | | 5.600%, 12/1/2017 | | | 116,700 | |
| | | | United Technologies Corporation | | | | |
| | 9,000 | | | 4.500%, 6/1/2042 | | | 10,352 | |
| | | | UR Financing Escrow Corporation | | | | |
| | 340,000 | | | 7.375%, 5/15/2020g | | | 368,050 | |
| | | | | |
| | | | Total | | | 2,563,643 | |
| | | | | |
| |
| Collateralized Mortgage Obligations (0.6%) | | | | |
| | | | Citigroup Mortgage Loan Trust, Inc. | | | | |
| | 353,624 | | | 5.500%, 11/25/2035 | | | 309,875 | |
| | | | CitiMortgage Alternative Loan Trust | | | | |
| | 1,166,509 | | | 5.750%, 4/25/2037 | | | 922,613 | |
| | | | Countrywide Alternative Loan Trust | | | | |
| | 200,091 | | | 6.500%, 8/25/2036 | | | 130,080 | |
| | 241,742 | | | 6.000%, 1/25/2037 | | | 197,810 | |
| | 1,051,792 | | | 5.500%, 5/25/2037 | | | 779,091 | |
| | 811,704 | | | 7.000%, 10/25/2037 | | | 517,958 | |
| | | | Countrywide Home Loans, Inc. | | | | |
| | 502,155 | | | 5.750%, 4/25/2037 | | | 451,501 | |
| | | | Deutsche Alt-A Securities, Inc. | | | | |
| | 386,194 | | | 6.000%, 10/25/2021 | | | 353,484 | |
| | | | Deutsche Alt-A Securities, Inc.
Alternative Loan Trust | | | | |
| | 194,540 | | | 5.500%, 10/25/2021 | | | 198,250 | |
| | | | J.P. Morgan Mortgage Trust | | | | |
| | 108,000 | | | 4.935%, 10/25/2036 | | | 80,636 | |
| | 1,040,716 | | | 6.250%, 8/25/2037 | | | 718,403 | |
| | | | MASTR Alternative Loans Trust | | | | |
| | 290,005 | | | 6.500%, 7/25/2034 | | | 305,188 | |
| | 544,217 | | | 0.661%, 12/25/2035e | | | 292,666 | |
| | | | Merrill Lynch Alternative Note Asset Trust | | | | |
| | 272,387 | | | 6.000%, 3/25/2037 | | | 216,606 | |
| | | | Residential Asset Securitization Trust | | | | |
| | 715,848 | | | 0.591%, 8/25/2037e | | | 227,715 | |
| | | | Sequoia Mortgage Trust | | | | |
| | 329,147 | | | 4.960%, 9/20/2046 | | | 61,824 | |
| | 671,389 | | | 4.960%, 9/20/2046 | | | 543,392 | |
| | | | WaMu Mortgage Pass Through Certificates | | | | |
| | 171,391 | | | 2.726%, 9/25/2036 | | | 135,041 | |
| | 365,919 | | | 2.794%, 10/25/2036 | | | 278,852 | |
| | | | | |
| | | | Total | | | 6,720,985 | |
| | | | | |
| |
| Commercial Mortgage-Backed Securities (0.9%) | | | | |
| | | | Banc of America Commercial Mortgage, Inc. | | | | |
| | 1,400,000 | | | 5.647%, 4/10/2049 | | | 1,627,501 | |
| | 2,550,000 | | | 5.624%, 6/10/2049 | | | 2,959,958 | |
| | | | Bear Stearns Commercial Mortgage Securities, Inc. | | | | |
| | 1,500,000 | | | 5.331%, 2/11/2044 | | | 1,671,687 | |
| | | | Credit Suisse First Boston Mortgage Securities | | | | |
| | 1,300,000 | | | 5.542%, 1/15/2049 | | | 1,470,175 | |
| | | | Credit Suisse Mortgage Capital Certificates | | | | |
| | 1,625,000 | | | 5.509%, 9/15/2039 | | | 1,713,784 | |
| | | | Greenwich Capital Commercial Funding Corporation | | | | |
| | 900,000 | | | 5.867%, 12/10/2049 | | | 986,135 | |
| | | | J.P. Morgan Chase Commercial Mortgage Securities Corporation | | | | |
| | 750,000 | | | 5.742%, 2/12/2049 | | | 791,043 | |
| | | | Morgan Stanley Capital, Inc. | | | | |
| | 450,000 | | | 5.406%, 3/15/2044 | | | 477,797 | |
| | | | Wachovia Bank Commercial Mortgage Trust | | | | |
| | 1,050,000 | | | 5.603%, 10/15/2048 | | | 1,135,354 | |
| | | | | |
| | | | Total | | | 12,833,434 | |
| | | | | |
| |
| Communications Services (0.5%) | | | | |
| | | | AMC Networks, Inc. | | | | |
| | 345,000 | | | 7.750%, 7/15/2021 | | | 390,713 | |
| | | | America Movil SAB de CV | | | | |
| | 84,000 | | | 3.125%, 7/16/2022 | | | 86,620 | |
| | | | American Tower Corporation | | | | |
| | 68,000 | | | 5.050%, 9/1/2020 | | | 76,411 | |
| | | | AT&T, Inc. | | | | |
| | 114,000 | | | 2.400%, 8/15/2016 | | | 120,489 | |
| | | | British Telecommunications plc | | | | |
| | 70,000 | | | 2.000%, 6/22/2015 | | | 71,799 | |
| | | | Cablevision Systems Corporation | | | | |
| | 325,000 | | | 8.625%, 9/15/2017 | | | 379,438 | |
| | | | CCO Holdings, LLC | | | | |
| | 325,000 | | | 7.000%, 1/15/2019 | | | 349,375 | |
| | | | CenturyLink, Inc. | | | | |
| | 114,000 | | | 5.800%, 3/15/2022 | | | 119,995 | |
The accompanying Notes to Financial Statements are an integral part of this schedule.
66
Moderately Aggressive Allocation Fund
Schedule of Investments as of October 31, 2012
| | | | | | | | |
Principal
Amount | | | Long-Term Fixed Income (9.4%) | | Value | |
| Communications Services (0.5%) - continued | | | | |
| | | | Comcast Corporation | | | | |
| | $115,000 | | | 6.500%, 1/15/2015 | | | $129,471 | |
| | 35,000 | | | 4.650%, 7/15/2042 | | | 37,944 | |
| | | | Digicel, Ltd. | | | | |
| | 170,000 | | | 8.250%, 9/1/2017g | | | 182,750 | |
| | 140,000 | | | 7.000%, 2/15/2020g | | | 147,000 | |
| | | | Dish DBS Corporation | | | | |
| | 295,000 | | | 4.625%, 7/15/2017 | | | 304,219 | |
| | 295,000 | | | 5.875%, 7/15/2022 | | | 309,750 | |
| | | | Frontier Communications Corporation | | | | |
| | 345,000 | | | 8.125%, 10/1/2018 | | | 390,712 | |
| | | | Hughes Satellite Systems Corporation | | | | |
| | 325,000 | | | 6.500%, 6/15/2019 | | | 347,750 | |
| | | | Intelsat Jackson Holdings SA | | | | |
| | 325,000 | | | 7.250%, 4/1/2019 | | | 348,562 | |
| | | | Level 3 Financing, Inc. | | | | |
| | 320,000 | | | 8.625%, 7/15/2020 | | | 348,800 | |
| | | | NBCUniversal Media, LLC | | | | |
| | 82,000 | | | 2.875%, 4/1/2016 | | | 86,951 | |
| | 27,000 | | | 2.875%, 1/15/2023 | | | 27,212 | |
| | | | News America, Inc. | | | | |
| | 56,000 | | | 3.000%, 9/15/2022g | | | 57,074 | |
| | | | Nippon Telegraph & Telephone Corporation | | | | |
| | 56,000 | | | 1.400%, 7/18/2017 | | | 56,472 | |
| | | | SBA Tower Trust | | | | |
| | 50,000 | | | 5.101%, 4/15/2017g | | | 55,540 | |
| | | | Sprint Nextel Corporation | | | | |
| | 170,000 | | | 9.125%, 3/1/2017 | | | 199,750 | |
| | 155,000 | | | 9.000%, 11/15/2018g | | | 191,425 | |
| | | | Telefonica Emisiones SAU | | | | |
| | 56,000 | | | 3.729%, 4/27/2015 | | | 57,120 | |
| | | | Time Warner Cable, Inc. | | | | |
| | 55,000 | | | 3.500%, 2/1/2015 | | | 58,440 | |
| | | | Univision Communications, Inc. | | | | |
| | 280,000 | | | 6.750%, 9/15/2022g | | | 280,000 | |
| | | | UPCB Finance V, Ltd. | | | | |
| | 325,000 | | | 7.250%, 11/15/2021g | | | 357,500 | |
| | | | Verizon Communications, Inc. | | | | |
| | 112,000 | | | 5.500%, 2/15/2018 | | | 136,332 | |
| | | | Virgin Media Finance plc | | | | |
| | 340,000 | | | 5.250%, 2/15/2022 | | | 355,300 | |
| | | | Vivendi SA | | | | |
| | 84,000 | | | 2.400%, 4/10/2015g | | | 85,043 | |
| | | | Vodafone Group plc | | | | |
| | 58,000 | | | 1.250%, 9/26/2017 | | | 58,316 | |
| | | | | |
| | | | Total | | | 6,204,273 | |
| | | | | |
| |
| Consumer Cyclical (0.3%) | | | | |
| | | | American Honda Finance Corporation | | | | |
| | 28,000 | | | 1.000%, 8/11/2015g | | | 28,038 | |
| | 28,000 | | | 1.500%, 9/11/2017g | | | 28,203 | |
| | | | Chrysler Group, LLC | | | | |
| | 280,000 | | | 8.000%, 6/15/2019f | | | 297,850 | |
| | | | Federated Retail Holdings, Inc. | | | | |
| | 81,000 | | | 5.900%, 12/1/2016 | | | 95,431 | |
| | | | Ford Motor Credit Company, LLC | | | | |
| | 58,000 | | | 12.000%, 5/15/2015 | | | 71,485 | |
| | 340,000 | | | 5.000%, 5/15/2018 | | | 375,035 | |
| | | | Host Hotels and Resorts, LP | | | | |
| | 295,000 | | | 6.000%, 11/1/2020 | | | 328,187 | |
| | | | Hyundai Capital America | | | | |
| | 54,000 | | | 1.625%, 10/2/2015g | | | 54,335 | |
| | | | Lennar Corporation | | | | |
| | 335,000 | | | 12.250%, 6/1/2017 | | | 452,250 | |
| | | | Limited Brands, Inc. | | | | |
| | 270,000 | | | 5.625%, 2/15/2022 | | | 291,263 | |
| | | | Macy’s Retail Holdings, Inc. | | | | |
| | 86,000 | | | 3.875%, 1/15/2022 | | | 94,513 | |
| | | | MGM Resorts International | | | | |
| | 365,000 | | | 7.625%, 1/15/2017f | | | 384,162 | |
| | | | Scientific Games International, Inc. | | | | |
| | 340,000 | | | 6.250%, 9/1/2020g | | | 345,525 | |
| | | | Service Corporation International | | | | |
| | 340,000 | | | 8.000%, 11/15/2021 | | | 417,350 | |
| | | | Time Warner, Inc. | | | | |
| | 46,000 | | | 3.150%, 7/15/2015 | | | 48,964 | |
| | | | Toyota Motor Credit Corporation | | | | |
| | 35,000 | | | 1.750%, 5/22/2017 | | | 35,904 | |
| | | | Toys R Us Property Company II, LLC | | | | |
| | 330,000 | | | 8.500%, 12/1/2017 | | | 354,338 | |
| | | | Viacom, Inc. | | | | |
| | 28,000 | | | 1.250%, 2/27/2015 | | | 28,272 | |
| | | | | |
| | | | Total | | | 3,731,105 | |
| | | | | |
| |
| Consumer Non-Cyclical (0.4%) | | | | |
| | | | Amgen, Inc. | | | | |
| | 30,000 | | | 4.850%, 11/18/2014 | | | 32,497 | |
| | 30,000 | | | 2.125%, 5/15/2017 | | | 31,199 | |
| | | | Anheuser-Busch InBev Worldwide, Inc. | | | | |
| | 28,000 | | | 0.800%, 7/15/2015 | | | 28,082 | |
| | 56,000 | | | 1.375%, 7/15/2017 | | | 56,844 | |
| | | | BAT International Finance plc | | | | |
| | 70,000 | | | 1.400%, 6/5/2015g | | | 70,748 | |
| | | | Beam, Inc. | | | | |
| | 15,000 | | | 1.875%, 5/15/2017 | | | 15,401 | |
| | | | Biomet, Inc. | | | | |
| | 365,000 | | | 6.500%, 10/1/2020g | | | 354,963 | |
| | | | Boston Scientific Corporation | | | | |
| | 70,000 | | | 5.450%, 6/15/2014 | | | 74,691 | |
| | 55,000 | | | 4.500%, 1/15/2015 | | | 58,943 | |
| | | | Bunge Limited Finance Corporation | | | | |
| | 28,000 | | | 3.200%, 6/15/2017 | | | 29,517 | |
| | | | Celgene Corporation | | | | |
| | 42,000 | | | 1.900%, 8/15/2017 | | | 42,645 | |
| | 42,000 | | | 3.250%, 8/15/2022 | | | 43,293 | |
| | | | Community Health Systems, Inc. | | | | |
| | 340,000 | | | 8.000%, 11/15/2019 | | | 366,775 | |
| | | | ConAgra Foods, Inc. | | | | |
| | 84,000 | | | 1.350%, 9/10/2015 | | | 84,681 | |
| | | | Covidien International Finance SA | | | | |
| | 70,000 | | | 1.350%, 5/29/2015 | | | 71,102 | |
| | | | CVS Caremark Corporation | | | | |
| | 34,000 | | | 6.125%, 9/15/2039 | | | 45,593 | |
The accompanying Notes to Financial Statements are an integral part of this schedule.
67
Moderately Aggressive Allocation Fund
Schedule of Investments as of October 31, 2012
| | | | | | | | |
Principal
Amount | | | Long-Term Fixed Income (9.4%) | | Value | |
| Consumer Non-Cyclical (0.4%) - continued | | | | |
| | | | Express Scripts Holding Company | | | | |
| | $56,000 | | | 2.750%, 11/21/2014g | | | $58,053 | |
| | 56,000 | | | 3.125%, 5/15/2016 | | | 59,623 | |
| | | | Fresenius Medical Care US Finance II, Inc. | | | | |
| | 325,000 | | | 5.625%, 7/31/2019g | | | 342,063 | |
| | | | Gilead Sciences, Inc. | | | | |
| | 45,000 | | | 2.400%, 12/1/2014 | | | 46,538 | |
| | 49,000 | | | 3.050%, 12/1/2016 | | | 52,663 | |
| | | | Grifols, Inc. | | | | |
| | 365,000 | | | 8.250%, 2/1/2018 | | | 405,150 | |
| | | | HCA, Inc. | | | | |
| | 340,000 | | | 5.875%, 3/15/2022 | | | 364,650 | |
| | | | Heineken NV | | | | |
| | 54,000 | | | 0.800%, 10/1/2015g | | | 54,108 | |
| | 54,000 | | | 1.400%, 10/1/2017g | | | 54,243 | |
| | 14,000 | | | 4.000%, 10/1/2042g | | | 14,161 | |
| | | | JBS USA, LLC | | | | |
| | 325,000 | | | 7.250%, 6/1/2021g | | | 317,850 | |
| | | | Kraft Foods, Inc. | | | | |
| | 70,000 | | | 1.625%, 6/4/2015g | | | 71,418 | |
| | 44,000 | | | 2.250%, 6/5/2017g | | | 45,704 | |
| | | | Laboratory Corporation of America Holdings | | | | |
| | 56,000 | | | 2.200%, 8/23/2017 | | | 57,716 | |
| | | | Libbey Glass, Inc. | | | | |
| | 70,000 | | | 6.875%, 5/15/2020g | | | 74,550 | |
| | | | Lorillard Tobacco Company | | | | |
| | 56,000 | | | 2.300%, 8/21/2017 | | | 56,648 | |
| | | | Rite Aid Corporation | | | | |
| | 550,000 | | | 7.500%, 3/1/2017 | | | 565,125 | |
| | | | Roche Holdings, Inc. | | | | |
| | 56,000 | | | 7.000%, 3/1/2039g | | | 86,735 | |
| | | | SABMiller Holdings, Inc. | | | | |
| | 83,000 | | | 1.850%, 1/15/2015g | | | 85,066 | |
| | | | Safeway, Inc. | | | | |
| | 63,000 | | | 5.000%, 8/15/2019 | | | 67,609 | |
| | | | Spectrum Brands Holdings, Inc. | | | | |
| | 345,000 | | | 9.500%, 6/15/2018 | | | 387,263 | |
| | | | Teva Pharmaceutical Finance Company BV | | | | |
| | 30,000 | | | 2.400%, 11/10/2016 | | | 31,553 | |
| | | | Teva Pharmaceutical Finance IV, LLC | | | | |
| | 63,000 | | | 1.700%, 11/10/2014 | | | 64,392 | |
| | | | Tyson Foods, Inc. | | | | |
| | 70,000 | | | 4.500%, 6/15/2022 | | | 74,200 | |
| | | | Valeant Pharmaceuticals International | | | | |
| | 325,000 | | | 6.875%, 12/1/2018g | | | 346,531 | |
| | | | Watson Pharmaceuticals, Inc. | | | | |
| | 27,000 | | | 1.875%, 10/1/2017 | | | 27,368 | |
| | 11,000 | | | 3.250%, 10/1/2022 | | | 11,335 | |
| | | | | |
| | | | Total | | | 5,229,289 | |
| | | | | |
| |
| Energy (0.2%) | | | | |
| | | | Apache Corporation | | | | |
| | 81,000 | | | 1.750%, 4/15/2017 | | | 83,831 | |
| | | | BP Capital Markets plc | | | | |
| | 82,000 | | | 3.125%, 10/1/2015 | | | 87,636 | |
| | | | Concho Resources, Inc. | | | | |
| | 680,000 | | | 5.500%, 10/1/2022 | | | 712,300 | |
| | | | Denbury Resources, Inc. | | | | |
| | 325,000 | | | 6.375%, 8/15/2021 | | | 355,875 | |
| | | | EOG Resources, Inc. | | | | |
| | 56,000 | | | 2.625%, 3/15/2023 | | | 57,325 | |
| | | | Harvest Operations Corporation | | | | |
| | 300,000 | | | 6.875%, 10/1/2017 | | | 328,500 | |
| | | | Linn Energy, LLC | | | | |
| | 325,000 | | | 7.750%, 2/1/2021 | | | 346,937 | |
| | | | Marathon Oil Corporation | | | | |
| | 81,000 | | | 0.900%, 11/1/2015 | | | 81,286 | |
| | | | Marathon Petroleum Corporation | | | | |
| | 56,000 | | | 3.500%, 3/1/2016 | | | 60,002 | |
| | | | Phillips 66 | | | | |
| | 64,000 | | | 2.950%, 5/1/2017g | | | 68,258 | |
| | | | Pioneer Natural Resources Company | | | | |
| | 28,000 | | | 5.875%, 7/15/2016 | | | 31,807 | |
| | 56,000 | | | 6.650%, 3/15/2017 | | | 66,654 | |
| | | | SandRidge Energy, Inc. | | | | |
| | 365,000 | | | 7.500%, 2/15/2023g | | | 377,775 | |
| | | | Suncor Energy, Inc. | | | | |
| | 49,000 | | | 6.100%, 6/1/2018 | | | 60,430 | |
| | | | Transocean, Inc. | | | | |
| | 28,000 | | | 5.050%, 12/15/2016 | | | 31,360 | |
| | 56,000 | | | 6.000%, 3/15/2018 | | | 65,975 | |
| | | | Valero Energy Corporation | | | | |
| | 56,000 | | | 7.500%, 4/15/2032 | | | 73,917 | |
| | | | Weatherford International, Ltd. | | | | |
| | 84,000 | | | 6.750%, 9/15/2040 | | | 99,768 | |
| | | | | |
| | | | Total | | | 2,989,636 | |
| | | | | |
| |
| Financials (0.6%) | | | | |
| | | | ABN Amro North American Holding Preferred Capital Repackage Trust I | | | | |
| | 27,000 | | | 6.523%, 12/29/2049g,h | | | 27,000 | |
| | | | Ally Financial, Inc. | | | | |
| | 340,000 | | | 5.500%, 2/15/2017 | | | 359,779 | |
| | | | American Express Credit Corporation | | | | |
| | 35,000 | | | 2.375%, 3/24/2017 | | | 36,806 | |
| | | | American International Group, Inc. | | | | |
| | 84,000 | | | 2.375%, 8/24/2015 | | | 85,406 | |
| | 81,000 | | | 3.800%, 3/22/2017 | | | 87,385 | |
| | | | ANZ National International, Ltd. of London | | | | |
| | 83,000 | | | 3.125%, 8/10/2015g | | | 87,144 | |
| | | | Associated Banc Corporation | | | | |
| | 28,000 | | | 1.875%, 3/12/2014 | | | 27,992 | |
| | | | Bank of America Corporation | | | | |
| | 115,000 | | | 7.750%, 8/15/2015 | | | 129,841 | |
| | 82,000 | | | 1.500%, 10/9/2015 | | | 82,093 | |
| | 55,000 | | | 5.750%, 8/15/2016 | | | 60,911 | |
| | 85,000 | | | 5.750%, 12/1/2017 | | | 98,455 | |
| | 55,000 | | | 5.650%, 5/1/2018 | | | 64,034 | |
| | | | Bank of New York Mellon Corporation | | | | |
| | 27,000 | | | 0.700%, 10/23/2015 | | | 27,008 | |
The accompanying Notes to Financial Statements are an integral part of this schedule.
68
Moderately Aggressive Allocation Fund
Schedule of Investments as of October 31, 2012
| | | | | | | | |
Principal
Amount | | | Long-Term Fixed Income (9.4%) | | Value | |
| Financials (0.6%) - continued | | | | |
| | | | Bank of Nova Scotia | | | | |
| | $81,000 | | | 1.850%, 1/12/2015 | | | $83,133 | |
| | | | Barclays Bank plc | | | | |
| | 100,000 | | | 6.050%, 12/4/2017g | | | 109,218 | |
| | | | BBVA US Senior SAU | | | | |
| | 81,000 | | | 4.664%, 10/9/2015 | | | 81,801 | |
| | | | Berkshire Hathaway, Inc. | | | | |
| | 60,000 | | | 1.600%, 5/15/2017 | | | 61,281 | |
| | | | BlackRock, Inc. | | | | |
| | 35,000 | | | 1.375%, 6/1/2015 | | | 35,655 | |
| | | | BNP Paribas SA | | | | |
| | 28,000 | | | 2.375%, 9/14/2017 | | | 28,205 | |
| | | | Capital One Capital V | | | | |
| | 56,000 | | | 10.250%, 8/15/2039 | | | 57,680 | |
| | | | Capital One Financial Corporation | | | | |
| | 81,000 | | | 2.150%, 3/23/2015 | | | 83,265 | |
| | | | CIT Group, Inc. | | | | |
| | 365,000 | | | 4.250%, 8/15/2017 | | | 374,420 | |
| | | | Citigroup, Inc. | | | | |
| | 81,000 | | | 5.850%, 7/2/2013 | | | 83,718 | |
| | 142,000 | | | 5.000%, 9/15/2014 | | | 150,317 | |
| | 83,000 | | | 4.750%, 5/19/2015 | | | 89,954 | |
| | 84,000 | | | 6.000%, 8/15/2017 | | | 98,878 | |
| | | | CNA Financial Corporation | | | | |
| | 97,000 | | | 7.350%, 11/15/2019 | | | 121,557 | |
| | | | Credit Suisse New York, NY | | | | |
| | 84,000 | | | 5.500%, 5/1/2014 | | | 89,566 | |
| | | | Developers Diversified Realty Corporation | | | | |
| | 110,000 | | | 7.500%, 4/1/2017 | | | 132,729 | |
| | 300,000 | | | 7.875%, 9/1/2020 | | | 390,165 | |
| | | | Discover Bank | | | | |
| | 83,000 | | | 8.700%, 11/18/2019 | | | 108,524 | |
| | | | Duke Realty, LP | | | | |
| | 28,000 | | | 3.875%, 10/15/2022 | | | 29,146 | |
| | | | Eksportfinans ASA | | | | |
| | 35,000 | | | 3.000%, 11/17/2014 | | | 34,738 | |
| | 52,000 | | | 5.500%, 5/25/2016 | | | 53,820 | |
| | | | Fifth Third Bancorp | | | | |
| | 63,000 | | | 5.450%, 1/15/2017 | | | 71,118 | |
| | | | General Electric Capital Corporation | | | | |
| | 81,000 | | | 2.150%, 1/9/2015 | | | 83,231 | |
| | 64,000 | | | 0.551%, 1/8/2016e | | | 63,058 | |
| | 20,000 | | | 1.308%, 5/9/2016e | | | 20,014 | |
| | 30,000 | | | 2.300%, 4/27/2017 | | | 30,989 | |
| | 56,000 | | | 3.150%, 9/7/2022 | | | 56,968 | |
| | 84,000 | | | 6.750%, 3/15/2032 | | | 111,731 | |
| | | | Goldman Sachs Group, Inc. | | | | |
| | 81,000 | | | 5.000%, 10/1/2014 | | | 86,805 | |
| | 84,000 | | | 3.700%, 8/1/2015 | | | 88,453 | |
| | 83,000 | | | 0.823%, 3/22/2016e | | | 80,701 | |
| | | | Hartford Financial Services Group, Inc. | | | | |
| | 10,000 | | | 7.300%, 11/1/2015 | | | 11,427 | |
| | 21,000 | | | 5.500%, 10/15/2016 | | | 23,676 | |
| | 81,000 | | | 4.000%, 10/15/2017 | | | 88,132 | |
| | | | HSBC Holdings plc | | | | |
| | 63,000 | | | 4.000%, 3/30/2022 | | | 69,014 | |
| | 46,000 | | | 6.500%, 5/2/2036 | | | 56,321 | |
| | | | Icahn Enterprises, LP | | | | |
| | 55,000 | | | 8.000%, 1/15/2018g | | | 59,125 | |
| | 340,000 | | | 8.000%, 1/15/2018 | | | 365,500 | |
| | | | ING Bank NV | | | | |
| | 95,000 | | | 2.000%, 9/25/2015g | | | 95,773 | |
| | 54,000 | | | 3.750%, 3/7/2017g | | | 57,180 | |
| | | | International Lease Finance Corporation | | | | |
| | 340,000 | | | 5.875%, 4/1/2019 | | | 360,202 | |
| | | | J.P. Morgan Chase & Company | | | | |
| | 80,000 | | | 4.650%, 6/1/2014 | | | 84,783 | |
| | 54,000 | | | 1.875%, 3/20/2015 | | | 55,029 | |
| | 54,000 | | | 3.450%, 3/1/2016 | | | 57,463 | |
| | 84,000 | | | 2.000%, 8/15/2017 | | | 84,900 | |
| | | | J.P. Morgan Chase Bank NA | | | | |
| | 76,000 | | | 0.729%, 6/13/2016e | | | 73,566 | |
| | | | Liberty Mutual Group, Inc. | | | | |
| | 28,000 | | | 4.950%, 5/1/2022g | | | 30,578 | |
| | 27,000 | | | 6.500%, 5/1/2042g | | | 30,770 | |
| | | | Lloyds TSB Bank plc | | | | |
| | 100,000 | | | 6.500%, 9/14/2020g | | | 108,940 | |
| | | | Morgan Stanley | | | | |
| | 56,000 | | | 4.750%, 4/1/2014 | | | 58,095 | |
| | 123,000 | | | 6.000%, 5/13/2014 | | | 130,674 | |
| | 115,000 | | | 4.750%, 3/22/2017 | | | 124,453 | |
| | 27,000 | | | 4.875%, 11/1/2022 | | | 27,295 | |
| | | | Murray Street Investment Trust I | | | | |
| | 96,000 | | | 4.647%, 3/9/2017 | | | 104,169 | |
| | | | Omega Healthcare Investors, Inc. | | | | |
| | 295,000 | | | 5.875%, 3/15/2024 | | | 314,175 | |
| | | | PNC Funding Corporation | | | | |
| | 85,000 | | | 3.300%, 3/8/2022 | | | 91,272 | |
| | | | Prudential Financial, Inc. | | | | |
| | 81,000 | | | 6.200%, 11/15/2040 | | | 100,791 | |
| | | | Realty Income Corporation | | | | |
| | 27,000 | | | 2.000%, 1/31/2018 | | | 27,230 | |
| | | | Regions Bank | | | | |
| | 140,000 | | | 7.500%, 5/15/2018 | | | 168,624 | |
| | | | Reinsurance Group of America, Inc. | | | | |
| | 27,000 | | | 5.000%, 6/1/2021 | | | 29,964 | |
| | | | Royal Bank of Scotland Group plc | | | | |
| | 56,000 | | | 5.050%, 1/8/2015 | | | 57,970 | |
| | 84,000 | | | 2.550%, 9/18/2015 | | | 86,109 | |
| | | | Santander US Debt SAU | | | | |
| | 100,000 | | | 3.724%, 1/20/2015g | | | 100,196 | |
| | | | SLM Corporation | | | | |
| | 81,000 | | | 6.250%, 1/25/2016 | | | 87,484 | |
| | | | Societe Generale SA | | | | |
| | 60,000 | | | 5.200%, 4/15/2021g | | | 65,988 | |
| | | | Svenska Handelsbanken AB | | | | |
| | 81,000 | | | 3.125%, 7/12/2016 | | | 85,933 | |
| | | | U.S. Bancorp | | | | |
| | 54,000 | | | 3.150%, 3/4/2015 | | | 57,104 | |
| | 30,000 | | | 1.650%, 5/15/2017 | | | 30,668 | |
| | | | UBS AG/Stamford, Connecticut | | | | |
| | 54,000 | | | 5.875%, 12/20/2017 | | | 63,898 | |
| | | | UnitedHealth Group, Inc. | | | | |
| | 27,000 | | | 0.850%, 10/15/2015 | | | 27,110 | |
| | 14,000 | | | 1.400%, 10/15/2017 | | | 14,090 | |
| | | | Wachovia Corporation | | | | |
| | 195,000 | | | 5.625%, 10/15/2016 | | | 227,038 | |
| | | | WEA Finance, LLC | | | | |
| | 81,000 | | | 5.700%, 10/1/2016g | | | 92,319 | |
The accompanying Notes to Financial Statements are an integral part of this schedule.
69
Moderately Aggressive Allocation Fund
Schedule of Investments as of October 31, 2012
| | | | | | | | |
Principal
Amount | | | Long-Term Fixed Income (9.4%) | | Value | |
| Financials (0.6%) - continued | | | | |
| | | | Wells Fargo & Company | | | | |
| | $53,000 | | | 2.100%, 5/8/2017 | | | $54,580 | |
| | | | | |
| | | | Total | | | 8,104,300 | |
| | | | | |
| |
| Foreign Government (<0.1%) | | | | |
| | | | Chile Government International Bond | | | | |
| | 50,000 | | | 2.250%, 10/30/2022 | | | 49,250 | |
| | | | Korea Finance Corporation | | | | |
| | 28,000 | | | 2.250%, 8/7/2017 | | | 28,233 | |
| | | | | |
| | | | Total | | | 77,483 | |
| | | | | |
| |
| Mortgage-Backed Securities (3.0%) | | | | |
| | | | Federal Home Loan Mortgage Corporation Gold 15-Yr. Pass Through | | | | |
| | 9,045,000 | | | 2.500%, 11/1/2027c | | | 9,446,372 | |
| | | | Federal Home Loan Mortgage Corporation Gold 30-Yr. Pass Through | | | | |
| | 3,925,000 | | | 3.000%, 11/1/2042c | | | 4,108,678 | |
| | | | Federal National Mortgage Association Conventional 15- Yr. Pass Through | | | | |
| | 1,550,000 | | | 2.500%, 11/1/2027c | | | 1,622,172 | |
| | | | Federal National Mortgage Association Conventional 30- Yr. Pass Through | | | | |
| | 3,800,000 | | | 3.500%, 11/1/2042c | | | 4,047,594 | |
| | 12,317,500 | | | 4.000%, 11/1/2042c | | | 13,189,347 | |
| | 6,172,500 | | | 5.000%, 11/1/2042c | | | 6,733,812 | |
| | 1,500,000 | | | 5.000%, 12/1/2042c | | | 1,636,406 | |
| | | | | |
| | | | Total | | | 40,784,381 | |
| | | | | |
| |
| Technology (0.1%) | | | | |
| | | | Amkor Technology, Inc. | | | | |
| | 345,000 | | | 6.625%, 6/1/2021 | | | 328,612 | |
| | | | Computer Sciences Corporation | | | | |
| | 42,000 | | | 2.500%, 9/15/2015 | | | 42,899 | |
| | | | Equinix, Inc. | | | | |
| | 345,000 | | | 8.125%, 3/1/2018 | | | 379,500 | |
| | | | First Data Corporation | | | | |
| | 340,000 | | | 7.375%, 6/15/2019g | | | 351,900 | |
| | | | Freescale Semiconductor, Inc. | | | | |
| | 190,000 | | | 9.250%, 4/15/2018g | | | 203,300 | |
| | | | Hewlett-Packard Company | | | | |
| | 56,000 | | | 2.125%, 9/13/2015 | | | 55,837 | |
| | 63,000 | | | 2.600%, 9/15/2017 | | | 61,351 | |
| | | | International Business Machines Corporation | | | | |
| | 60,000 | | | 0.750%, 5/11/2015 | | | 60,345 | |
| | | | Oracle Corporation | | | | |
| | 54,000 | | | 1.200%, 10/15/2017 | | | 54,272 | |
| | 27,000 | | | 2.500%, 10/15/2022 | | | 27,487 | |
| | | | Samsung Electronics America, Inc. | | | | |
| | 90,000 | | | 1.750%, 4/10/2017g | | | 90,986 | |
| | | | Xerox Corporation | | | | |
| | 56,000 | | | 7.200%, 4/1/2016 | | | 64,808 | |
| | | | | |
| | | | Total | | | 1,721,297 | |
| | | | | |
| |
| Transportation (0.2%) | | | | |
| | | | Avis Budget Car Rental, LLC | | | | |
| | 280,000 | | | 8.250%, 1/15/2019 | | | 305,550 | |
| | | | Burlington Northern Santa Fe, LLC | | | | |
| | 21,000 | | | 3.050%, 9/1/2022 | | | 21,912 | |
| | | | Continental Airlines, Inc. | | | | |
| | 565,000 | | | 6.750%, 9/15/2015g | | | 591,131 | |
| | 30,000 | | | 4.150%, 4/11/2024 | | | 31,410 | |
| | | | CSX Corporation | | | | |
| | 45,000 | | | 6.250%, 4/1/2015 | | | 50,912 | |
| | | | Delta Air Lines, Inc. | | | | |
| | 83,000 | | | 6.750%, 5/23/2017 | | | 85,075 | |
| | 14,000 | | | 4.750%, 5/7/2020 | | | 14,788 | |
| | | | ERAC USA Finance, LLC | | | | |
| | 54,000 | | | 1.400%, 4/15/2016g | | | 54,455 | |
| | | | Hertz Corporation | | | | |
| | 295,000 | | | 6.750%, 4/15/2019 | | | 313,069 | |
| | | | Kansas City Southern de Mexico SA de CV | | | | |
| | 60,000 | | | 8.000%, 2/1/2014 | | | 66,600 | |
| | | | Navios Maritime Acquisition Corporation | | | | |
| | 345,000 | | | 8.625%, 11/1/2017 | | | 325,162 | |
| | | | Navios Maritime Holdings, Inc. | | | | |
| | 295,000 | | | 8.875%, 11/1/2017 | | | 302,375 | |
| | | | | |
| | | | Total | | | 2,162,439 | |
| | | | | |
| |
| U.S. Government and Agencies (1.8%) | | | | |
| | | | U.S. Treasury Bonds | | | | |
| | 1,175,000 | | | 4.375%, 5/15/2040 | | | 1,548,429 | |
| | 7,780,000 | | | 3.000%, 5/15/2042 | | | 8,036,499 | |
| | 340,000 | | | 2.750%, 8/15/2042 | | | 333,094 | |
| | | | U.S. Treasury Notes | | | | |
| | 500,000 | | | 0.750%, 6/15/2014 | | | 503,886 | |
| | 3,025,000 | | | 2.500%, 4/30/2015 | | | 3,187,358 | |
| | 750,000 | | | 1.000%, 10/31/2016 | | | 763,359 | |
| | 4,200,000 | | | 0.750%, 6/30/2017 | | | 4,216,405 | |
| | 1,500,000 | | | 0.875%, 7/31/2019 | | | 1,479,375 | |
| | 3,410,000 | | | 1.625%, 8/15/2022 | | | 3,391,351 | |
| | | | U.S. Treasury Notes, TIPS | | | | |
| | 700,000 | | | 0.125%, 7/31/2014 | | | 698,141 | |
| | | | | |
| | | | Total | | | 24,157,897 | |
| | | | | |
| |
| Utilities (0.2%) | | | | |
| | | | AES Corporation | | | | |
| | 330,000 | | | 7.375%, 7/1/2021 | | | 368,775 | |
| | | | CenterPoint Energy, Inc. | | | | |
| | 60,000 | | | 6.850%, 6/1/2015 | | | 67,857 | |
| | | | Crosstex Energy, LP/Crosstex Energy Finance Corporation | | | | |
| | 345,000 | | | 8.875%, 2/15/2018 | | | 370,013 | |
| | | | Energy Transfer Partners, LP | | | | |
| | 84,000 | | | 4.650%, 6/1/2021 | | | 93,293 | |
| | | | Enterprise Products Operating, LLC | | | | |
| | 84,000 | | | 1.250%, 8/13/2015 | | | 84,895 | |
| | | | Exelon Corporation | | | | |
| | 117,000 | | | 4.900%, 6/15/2015 | | | 128,634 | |
| | | | FirstEnergy Solutions Corporation | | | | |
| | 118,000 | | | 4.800%, 2/15/2015 | | | 127,570 | |
The accompanying Notes to Financial Statements are an integral part of this schedule.
70
Moderately Aggressive Allocation Fund
Schedule of Investments as of October 31, 2012
| | | | | | | | |
Principal
Amount | | | Long-Term Fixed Income (9.4%) | | Value | |
| Utilities (0.2%) - continued | | | | |
| | | | ITC Holdings Corporation | | | | |
| | $72,000 | | | 5.875%, 9/30/2016g | | | $82,234 | |
| | | | Kinder Morgan Energy Partners, LP | | | | |
| | 56,000 | | | 5.300%, 9/15/2020 | | | 66,353 | |
| | 56,000 | | | 5.000%, 8/15/2042 | | | 60,681 | |
| | | | MarkWest Energy Partners, LP | | | | |
| | 365,000 | | | 5.500%, 2/15/2023 | | | 383,250 | |
| | | | MidAmerican Energy Holdings Company | | | | |
| | 56,000 | | | 6.500%, 9/15/2037 | | | 77,327 | |
| | | | NextEra Energy Capital Holdings, Inc. | | | | |
| | 84,000 | | | 1.200%, 6/1/2015 | | | 84,447 | |
| | | | NGPL PipeCo, LLC | | | | |
| | 295,000 | | | 9.625%, 6/1/2019g | | | 339,250 | |
| | | | NiSource Finance Corporation | | | | |
| | 84,000 | | | 5.950%, 6/15/2041 | | | 102,025 | |
| | | | NRG Energy, Inc. | | | | |
| | 330,000 | | | 6.625%, 3/15/2023g | | | 339,900 | |
| | | | ONEOK Partners, LP | | | | |
| | 28,000 | | | 2.000%, 10/1/2017 | | | 28,573 | |
| | 36,000 | | | 8.625%, 3/1/2019 | | | 47,859 | |
| | | | Pacific Gas & Electric Company | | | | |
| | 81,000 | | | 5.625%, 11/30/2017 | | | 98,688 | |
| | | | PPL Capital Funding, Inc. | | | | |
| | 27,000 | | | 3.500%, 12/1/2022 | | | 27,724 | |
| | | | Sempra Energy | | | | |
| | 81,000 | | | 6.150%, 6/15/2018 | | | 99,894 | |
| | | | Williams Partners, LP | | | | |
| | 28,000 | | | 7.250%, 2/1/2017 | | | 34,438 | |
| | 28,000 | | | 5.250%, 3/15/2020 | | | 32,970 | |
| | | | | |
| | | | Total | | | 3,146,650 | |
| | | | | |
| | | | | | | | |
| | | | | |
| | | | Total Long-Term Fixed Income (cost $123,544,380) | | | 126,081,940 | |
| | | | | |
| | |
| Shares | | | Preferred Stock (<0.1%) | | Value | |
| Financials (<0.1%) | | | | |
| | 1,600 | | | U.S. Bancorp, 6.000%h | | | 45,920 | |
| | | | | |
| | | | Total | | | 45,920 | |
| | | | | |
| | | | | | | | |
| | | | | |
| | | | Total Preferred Stock (cost $40,840) | | | 45,920 | |
| | | | | |
| | |
| Shares | | | Collateral Held for Securities Loaned (0.1%) | | Value | |
| | 1,331,953 | | | Thrivent Financial Securities Lending Trust | | | 1,331,953 | |
| | | | | |
| | | | Total Collateral Held for Securities Loaned (cost $1,331,953) | | | 1,331,953 | |
| | | | | |
| | |
Shares or
Principal
Amount | | | Short-Term Investments (6.1%) | | Value | |
| | | | Federal Home Loan Bank Discount Notes | | | | |
| | 10,000,000 | | | 0.122%, 1/9/2013i | | | 9,997,662 | |
| | | | Federal Home Loan Mortgage Corporation Discount Notes | | | | |
| | 2,300,000 | | | 0.151%, 12/17/2012i,j | | | 2,299,555 | |
| | | | Federal National Mortgage Association Discount Notes | | | | |
| | 5,000,000 | | | 0.120%, 11/21/2012i | | | 4,999,667 | |
| | 52,425,026 | | | Thrivent Financial Securities Lending Trust | | | 52,425,026 | |
| | | | U.S. Treasury Bills | | | | |
| | 10,000,000 | | | 0.115%, 11/8/2012i | | | 9,999,776 | |
| | 2,800,000 | | | 0.125%, 1/17/2013i,j | | | 2,799,251 | |
| | | | | |
| | | | Total Short-Term Investments (at amortized cost) | | | 82,520,937 | |
| | | | | |
| | | | Total Investments (cost $1,335,864,819) 103.5% | | | $1,405,268,147 | |
| | | | | |
| | | | Other Assets and Liabilities, Net (3.5%) | | | (46,938,568 | ) |
| | | | | |
| | | | Total Net Assets 100.0% | | | $1,358,329,579 | |
| | | | | |
a | The stated interest rate represents the weighted average of all contracts within the bank loan facility. |
b | All or a portion of the loan is unfunded. |
c | Denotes investments purchased on a when-issued or delayed delivery basis. |
d | Non-income producing security. |
e | Denotes variable rate securities. Variable rate securities are securities whose yields vary with a designated market index or market rate. The rate shown is as of October 31, 2012. |
f | All or a portion of the security is on loan. |
g | Denotes securities sold under Rule 144A of the Securities Act of 1933, which exempts them from registration. These securities have been deemed liquid and may be resold to other dealers in the program or to other qualified institutional buyers. As of October 31, 2012, the value of these investments was $8,777,815 or 0.6% of total net assets. |
h | Denotes perpetual securities. Perpetual securities pay an indefinite stream of interest, but may be called by the issuer at an earlier date. |
i | The interest rate shown reflects the yield, coupon rate or the discount rate at the date of purchase. |
j | At October 31, 2012, $13,687,696 of investments were held on deposit with the counterparty and pledged as the initial margin deposit for open futures contracts. |
Definitions:
| | | | |
ADR | | - | | American Depositary Receipt, which are certificates for an underlying foreign security’s shares held by an issuing U.S. depository bank. |
TIPS | | - | | Treasury Inflation Protected Security. |
Unrealized Appreciation (Depreciation)
Gross unrealized appreciation and depreciation of investments,based on cost for federal income tax purposes, were as follows:
| | | | |
Gross unrealized appreciation | | | $97,234,391 | |
Gross unrealized depreciation | | | (40,875,011 | ) |
| | | | |
Net unrealized appreciation (depreciation) | | | $56,359,380 | |
| |
Cost for federal income tax purposes | | | $1,348,908,767 | |
The accompanying Notes to Financial Statements are an integral part of this schedule.
71
Moderately Aggressive Allocation Fund
Schedule of Investments as of October 31, 2012
Fair Valuation Measurements
The following table is a summary of the inputs used, as of October 31, 2012, in valuing Moderately Aggressive Allocation Fund’s assets carried at fair value.
| | | | | | | | | | | | | | | | |
Investments in Securities | | Total | | | Level 1 | | | Level 2 | | | Level 3 | |
| | | | |
Bank Loans | | | | | | | | | | | | | | | | |
Basic Materials | | | 2,802,573 | | | | – | | | | 2,802,573 | | | | – | |
Capital Goods | | | 878,677 | | | | – | | | | 878,677 | | | | – | |
Communications Services | | | 6,804,580 | | | | – | | | | 6,804,580 | | | | – | |
Consumer Cyclical | | | 2,231,490 | | | | – | | | | 2,231,490 | | | | – | |
Consumer Non-Cyclical | | | 3,741,119 | | | | – | | | | 3,741,119 | | | | – | |
Energy | | | 587,109 | | | | – | | | | 587,109 | | | | – | |
Financials | | | 989,614 | | | | – | | | | 989,614 | | | | – | |
Technology | | | 2,168,608 | | | | – | | | | 2,168,608 | | | | – | |
Transportation | | | 437,346 | | | | – | | | | 437,346 | | | | – | |
Utilities | | | 1,145,971 | | | | – | | | | 1,145,971 | | | | – | |
| | | | |
Mutual Funds | | | | | | | | | | | | | | | | |
Equity Mutual Funds | | | 722,979,422 | | | | 722,979,422 | | | | – | | | | – | |
Fixed Income Mutual Funds | | | 193,285,914 | | | | 193,285,914 | | | | – | | | | – | |
| | | | |
Common Stock | | | | | | | | | | | | | | | | |
Consumer Discretionary | | | 38,204,352 | | | | 38,204,352 | | | | – | | | | – | |
Consumer Staples | | | 17,808,619 | | | | 16,526,157 | | | | 1,282,462 | | | | – | |
Energy | | | 19,599,625 | | | | 18,627,635 | | | | 971,990 | | | | – | |
Financials | | | 37,320,943 | | | | 37,320,943 | | | | – | | | | – | |
Health Care | | | 37,863,786 | | | | 37,863,786 | | | | – | | | | – | |
Industrials | | | 34,122,516 | | | | 34,122,516 | | | | – | | | | – | |
Information Technology | | | 52,261,437 | | | | 52,261,437 | | | | – | | | | – | |
Materials | | | 10,719,051 | | | | 10,719,051 | | | | – | | | | – | |
Telecommunications Services | | | 1,598,750 | | | | 1,598,750 | | | | – | | | | – | |
Utilities | | | 7,735,895 | | | | 7,735,895 | | | | – | | | | – | |
| | | | |
Long-Term Fixed Income | | | | | | | | | | | | | | | | |
Asset-Backed Securities | | | 3,528,367 | | | | – | | | | 3,528,367 | | | | – | |
Basic Materials | | | 2,126,761 | | | | – | | | | 2,126,761 | | | | – | |
Capital Goods | | | 2,563,643 | | | | – | | | | 2,563,643 | | | | – | |
Collateralized Mortgage Obligations | | | 6,720,985 | | | | – | | | | 6,720,985 | | | | – | |
Commercial Mortgage-Backed Securities | | | 12,833,434 | | | | – | | | | 12,833,434 | | | | – | |
Communications Services | | | 6,204,273 | | | | – | | | | 6,204,273 | | | | – | |
Consumer Cyclical | | | 3,731,105 | | | | – | | | | 3,731,105 | | | | – | |
Consumer Non-Cyclical | | | 5,229,289 | | | | – | | | | 5,229,289 | | | | – | |
Energy | | | 2,989,636 | | | | – | | | | 2,989,636 | | | | – | |
Financials | | | 8,104,300 | | | | – | | | | 8,104,300 | | | | – | |
Foreign Government | | | 77,483 | | | | – | | | | 77,483 | | | | – | |
Mortgage-Backed Securities | | | 40,784,381 | | | | – | | | | 40,784,381 | | | | – | |
Technology | | | 1,721,297 | | | | – | | | | 1,721,297 | | | | – | |
Transportation | | | 2,162,439 | | | | – | | | | 2,162,439 | | | | – | |
U.S. Government and Agencies | | | 24,157,897 | | | | – | | | | 24,157,897 | | | | – | |
Utilities | | | 3,146,650 | | | | – | | | | 3,146,650 | | | | – | |
| | | | |
Preferred Stock | | | | | | | | | | | | | | | | |
Financials | | | 45,920 | | | | 45,920 | | | | – | | | | – | |
Collateral Held for Securities Loaned | | | 1,331,953 | | | | 1,331,953 | | | | – | | | | – | |
Short-Term Investments | | | 82,520,937 | | | | 52,425,026 | | | | 30,095,911 | | | | – | |
| |
Total | | | $1,405,268,147 | | | | $1,225,048,757 | | | | $180,219,390 | | | | $– | |
| |
| | | | |
Other Financial Instruments | | Total | | | Level 1 | | | Level 2 | | | Level 3 | |
| | | | |
Asset Derivatives | | | | | | | | | | | | | | | | |
Futures Contracts | | | 5,186,776 | | | | 5,186,776 | | | | – | | | | – | |
| |
Total Asset Derivatives | | | $5,186,776 | | | | $5,186,776 | | | | $– | | | | $– | |
| |
| | | | |
Liability Derivatives | | | | | | | | | | | | | | | | |
Futures Contracts | | | 4,829,347 | | | | 4,829,347 | | | | – | | | | – | |
Foreign Currency Forward Contracts | | | 39 | | | | – | | | | 39 | | | | – | |
| |
Total Liability Derivatives | | | $4,829,386 | | | | $4,829,347 | | | | $39 | | | | $– | |
| |
The accompanying Notes to Financial Statements are an integral part of this schedule.
72
Moderately Aggressive Allocation Fund
Schedule of Investments as of October 31, 2012
There were no significant transfers between Levels during the period ended October 31, 2012. Transfers between Levels are identified as of the end of the period.
| | | | | | | | | | | | | | | | | | | | |
Futures Contracts | | Number of
Contracts
Long/(Short) | | | Expiration
Date | | | Notional
Principal
Amount | | | Value | | | Unrealized
Gain/(Loss) | |
2-Yr. U.S. Treasury Bond Futures | | | (60 | ) | | | December 2012 | | | | ($13,225,130 | ) | | | ($13,219,688 | ) | | | $5,442 | |
5-Yr. U.S. Treasury Bond Futures | | | (225 | ) | | | December 2012 | | | | (27,994,237 | ) | | | (27,956,250 | ) | | | 37,987 | |
10-Yr. U.S. Treasury Bond Futures | | | (15 | ) | | | December 2012 | | | | (1,994,486 | ) | | | (1,995,469 | ) | | | (983 | ) |
20-Yr U.S. Treasury Bond Futures | | | 115 | | | | December 2012 | | | | 17,221,601 | | | | 17,170,938 | | | | (50,663 | ) |
Eurex EURO STOXX 50 Futures | | | 395 | | | | December 2012 | | | | 13,182,550 | | | | 12,819,888 | | | | (362,662 | ) |
Mini MSCI EAFE Index Futures | | | 266 | | | | December 2012 | | | | 20,715,927 | | | | 20,194,720 | | | | (521,207 | ) |
Russell 2000 Index Mini-Futures | | | (502 | ) | | | December 2012 | | | | (43,238,615 | ) | | | (40,978,260 | ) | | | 2,260,355 | |
S&P 400 Index Mini Futures | | | (621 | ) | | | December 2012 | | | | (63,623,003 | ) | | | (60,740,011 | ) | | | 2,882,992 | |
S&P 500 Index Futures | | | 298 | | | | December 2012 | | | | 108,700,432 | | | | 104,806,600 | | | | (3,893,832 | ) |
Total Futures Contracts | | | | | | | | | | | | | | | | | | | $357,429 | |
| | | | | | | | | | | | | | | | | | | | | | |
Foreign Currency Forward Contracts | | Counterparty | | Contracts to
Deliver/Receive | | | Settlement
Date | | | Value on
Settlement Date | | | Value | | | Unrealized
Gain/(Loss) | |
| | | | | | |
Sales | | | | | | | | | | | | | | | | | | | | | | |
Euro | | SSB | | | 71,100 | | | | 11/1/2012 | | | | $92,117 | | | | $92,156 | | | | ($39 | ) |
Total Sales | | | | | | | | | | | | | $92,117 | | | | $92,156 | | | | ($39 | ) |
Net Unrealized Gain/(Loss) on Foreign Currency Forward Contracts | | | | | | | | | | | | ($39 | ) |
Counterparty
The following table summarizes the fair value and Statement of Assets and Liabilities location, as of October 31, 2012, for Moderately Aggressive Allocation Fund’s investments in financial derivative instruments by primary risk exposure as discussed under item (2) Significant Accounting Policies of the Notes to Financial Statements.
| | | | | | |
Derivatives by risk category | | Statement of Assets and Liabilities Location | | Fair Value | |
| | |
Asset Derivatives | | | | | | |
| | |
Equity Contracts | | | | | | |
Futures* | | Net Assets - Net unrealized appreciation/(depreciation) on Futures contracts | | | 5,143,347 | |
Total Equity Contracts | | | | | 5,143,347 | |
| | |
Interest Rate Contracts | | | | | | |
Futures* | | Net Assets - Net unrealized appreciation/(depreciation) on Futures contracts | | | 43,429 | |
Total Interest Rate Contracts | | | | | 43,429 | |
| |
Total Asset Derivatives | | | | | $5,186,776 | |
| |
| | |
Liability Derivatives | | | | | | |
| | |
Equity Contracts | | | | | | |
Futures* | | Net Assets - Net unrealized appreciation/(depreciation) on Futures contracts | | | 4,777,701 | |
Total Equity Contracts | | | | | 4,777,701 | |
| | |
Interest Rate Contracts | | | | | | |
Futures* | | Net Assets - Net unrealized appreciation/(depreciation) on Futures contracts | | | 51,646 | |
Total Interest Rate Contracts | | | | | 51,646 | |
| | |
Foreign Exchange Contracts | | | | | | |
Forward Contracts | | Receivable/Payable for forward contracts, Net Assets - Net unrealized appreciation/(depreciation) on Foreign currency forward contracts | | | 39 | |
Total Foreign Exchange Contracts | | | | | 39 | |
| |
Total Liability Derivatives | | | | | $4,829,386 | |
| |
* | Includes cumulative appreciation/depreciation of futures contracts as reported in the Schedule of Investments. Only current day’s variation margin is reported within the Statement of Assets and Liabilities. |
The accompanying Notes to Financial Statements are an integral part of this schedule.
73
Moderately Aggressive Allocation Fund
Schedule of Investments as of October 31, 2012
The following table summarizes the net realized gains/(losses) and Statement of Operations location, for the period ended October 31, 2012, for Moderately Aggressive Allocation Fund’s investments in financial derivative instruments by primary risk exposure.
| | | | | | |
Derivatives by risk category | | Statement of Operations Location | | Realized Gains/(Losses)
recognized in Income | |
| | |
Interest Rate Contracts | | | | | | |
Futures | | Net realized gains/(losses) on Futures contracts | | | 773,207 | |
| | |
Total Interest Rate Contracts | | | | | 773,207 | |
| | |
Equity Contracts | | | | | | |
Futures | | Net realized gains/(losses) on Futures contracts | | | 8,072,535 | |
| | |
Total Equity Contracts | | | | | 8,072,535 | |
| | |
Foreign Exchange Contracts | | | | | | |
Forward Contracts | | Net realized gains/(losses) on Foreign currency transactions | | | (42,336 | ) |
| | |
Total Foreign Exchange Contracts | | | | | (42,336 | ) |
| | |
Credit Contracts | | | | | | |
Credit Default Swaps | | Net realized gains/(losses) on Swap agreements | | | 392,719 | |
| | |
Total Credit Contracts | | | | | 392,719 | |
| |
Total | | | | | $9,196,125 | |
| | |
The following table summarizes the change in net unrealized appreciation/(depreciation) and Statement of Operations location, for the period ended October 31, 2012, for Moderately Aggressive Allocation Fund’s investments in financial derivative instruments by primary risk exposure.
| | | | | | |
Derivatives by risk category | | Statement of Operations Location | | Change in unrealized
appreciation/(depreciation)
recognized in Income | |
| | |
Equity Contracts | | | | | | |
Futures | | Change in net unrealized appreciation/(depreciation) on Futures contracts | | | (4,218,425 | ) |
| | |
Total Equity Contracts | | | | | (4,218,425 | ) |
| | |
Interest Rate Contracts | | | | | | |
Futures | | Change in net unrealized appreciation/(depreciation) on Futures contracts | | | (12,663 | ) |
| | |
Total Interest Rate Contracts | | | | | (12,663 | ) |
| | |
Foreign Exchange Contracts | | | | | | |
Forward Contracts | | Change in net unrealized appreciation/(depreciation) on Foreign currency forward contracts | | | (39 | ) |
| | |
Total Foreign Exchange Contracts | | | | | (39 | ) |
| | |
Total | | | | | ($4,231,127 | ) |
| | |
The following table presents Moderately Aggressive Allocation Fund’s average volume of derivative activity during the period ended October 31, 2012.
| | | | | | | | | | | | |
Derivative Risk Category | | Futures
(Notional*) | | Futures
(Percentage
of Average
Net Assets) | | Forwards
(Notional*) | | Forwards
(Percentage
of Average
Net Assets) | | Swaps
(Notional*) | | Swaps
(Percentage
of Average
Net Assets) |
Equity Contracts | | $233,106,329 | | 17.8% | | N/A | | N/A | | N/A | | N/A |
Interest Rate Contracts | | 33,869,535 | | 2.6 | | N/A | | N/A | | N/A | | N/A |
Foreign Exchange Contracts | | N/A | | N/A | | $161,454 | | <0.1% | | N/A | | N/A |
Credit Contracts | | N/A | | N/A | | N/A | | N/A | | $1,291,671 | | 0.1% |
* | Notional amount represents long or short, or both, derivative positions held by the Fund. |
The accompanying Notes to Financial Statements are an integral part of this schedule.
74
Moderately Aggressive Allocation Fund
Schedule of Investments as of October 31, 2012
Investment in Affiliates
Affiliated issuers, as defined under the Investment Company Act of 1940, include those in which the Fund’s holdings of an issuer represent 5% or more of the outstanding voting securities of an issuer, or any affiliated mutual fund.
A summary of transactions for the fiscal year to date, in Moderately Aggressive Allocation Fund, is as follows:
| | | | | | | | | | | | | | | | | | | | | | | | |
Fund | | Value
October 31, 2011 | | | Gross
Purchases | | | Gross Sales | | | Shares Held at
October 31, 2012 | | | Value
October 31, 2012 | | | Income Earned
November 1, 2011 -
October 31, 2012 | |
Natural Resources | | | $41,493,093 | | | | $59,917 | | | | $10,000,000 | | | | 3,041,479 | | | | $27,373,309 | | | | $59,917 | |
Partner Small Cap Growth | | | 37,791,279 | | | | – | | | | – | | | | 3,151,900 | | | | 40,911,660 | | | | – | |
Partner Small Cap Value | | | 24,958,861 | | | | 428,235 | | | | – | | | | 1,671,574 | | | | 28,082,450 | | | | 165,551 | |
Small Cap Stock | | | 20,116,885 | | | | – | | | | – | | | | 1,344,712 | | | | 21,636,409 | | | | – | |
Mid Cap Growth | | | 34,838,195 | | | | 260,574 | | | | – | | | | 1,772,686 | | | | 36,659,156 | | | | – | |
Partner Mid Cap Value | | | 41,875,958 | | | | 337,426 | | | | – | | | | 3,639,699 | | | | 46,806,534 | | | | 337,426 | |
Mid Cap Stock | | | 61,972,814 | | | | – | | | | – | | | | 4,016,385 | | | | 66,792,476 | | | | – | |
Partner Worldwide Allocation | | | 160,191,758 | | | | 1,679,324 | | | | – | | | | 19,423,219 | | | | 170,730,097 | | | | 1,679,324 | |
Large Cap Growth | | | 75,300,710 | | | | 4,992 | | | | – | | | | 14,262,471 | | | | 84,291,204 | | | | 4,992 | |
Large Cap Value | | | 95,157,821 | | | | 1,829,380 | | | | – | | | | 7,437,992 | | | | 109,784,766 | | | | 1,829,380 | |
Large Cap Stock | | | 69,966,193 | | | | 853,991 | | | | – | | | | 3,297,726 | | | | 78,551,831 | | | | 853,991 | |
Equity Income Plus | | | 10,216,465 | | | | 233,625 | | | | – | | | | 1,182,053 | | | | 11,359,530 | | | | 233,625 | |
High Yield | | | 49,636,073 | | | | 3,748,830 | | | | 2,528,937 | | | | 10,768,068 | | | | 53,948,019 | | | | 3,748,831 | |
Income | | | 95,605,280 | | | | 3,539,759 | | | | 16,480,511 | | | | 9,440,144 | | | | 88,454,152 | | | | 3,539,761 | |
Government Bond | | | 26,460,294 | | | | 903,728 | | | | 3,011,575 | | | | 2,280,527 | | | | 24,538,470 | | | | 336,032 | |
Limited Maturity Bond | | | 49,011,536 | | | | 714,748 | | | | 24,060,318 | | | | 2,087,581 | | | | 26,345,273 | | | | 714,713 | |
Securities Lending Trust- Collateral Investment | | | – | | | | 19,132,210 | | | | 17,800,257 | | | | 1,331,953 | | | | 1,331,953 | | | | 1,784 | |
Securities Lending Trust- Short Term Investment | | | – | | | | 63,029,026 | | | | 10,604,000 | | | | 52,425,026 | | | | 52,425,026 | | | | 10,657 | |
Total Value and Income Earned | | | 894,593,215 | | | | | | | | | | | | | | | | 970,022,315 | | | | 13,515,984 | |
The accompanying Notes to Financial Statements are an integral part of this schedule.
75
Moderate Allocation Fund
Schedule of Investments as of October 31, 2012
| | | | | | | | |
Principal Amount | | | Bank Loans (2.1%)a | | Value | |
| Basic Materials (0.3%) | | | | |
| | $488,775 | | | Arch Coal, Inc., Term Loan 5.750%, 5/16/2018 | | | $492,617 | |
| | 2,570,000 | | | FMG Resources August 2006 Pty., Ltd., Term Loan 0.000%, 10/18/2017b,c | | | 2,555,865 | |
| | 635,984 | | | Ineos US Finance, LLC, Term Loan 6.500%, 5/4/2018 | | | 644,328 | |
| | | | | |
| | | | Total | | | 3,692,810 | |
| | | | | |
| |
| Capital Goods (0.1%) | | | | |
| | | | ADS Waste Holdings, Inc., Term Loan | | | | |
| | 690,000 | | | 1.531%, 10/9/2019b,c | | | 696,210 | |
| | | | MRC Global, Inc., Term Loan | | | | |
| | 495,000 | | | 0.000%, 10/24/2019b,c | | | 493,763 | |
| | | | | |
| | | | Total | | | 1,189,973 | |
| | | | | |
| |
| Communications Services (0.6%) | | | | |
| | | | Atlantic Broadband Finance, LLC, Term Loan | | | | |
| | 523,687 | | | 5.250%, 4/4/2019 | | | 525,217 | |
| | | | Charter Communications Operating, LLC, Term Loan | | | | |
| | 417,900 | | | 4.000%, 5/15/2019 | | | 420,641 | |
| | | | Clear Channel Communications, Term Loan | | | | |
| | 675,000 | | | 3.815%, 1/29/2016b,c | | | 553,925 | |
| | | | Cogeco Cable, Inc., Term Loan | | | | |
| | 395,000 | | | 0.000%, 9/10/2019b,c | | | 397,963 | |
| | | | Cricket Communications, Inc., Term Loan | | | | |
| | 100,000 | | | 0.000%, 10/10/2019b,c | | | 100,313 | |
| | | | Cumulus Media Holdings, Inc., Term Loan | | | | |
| | 786,344 | | | 5.750%, 9/17/2018 | | | 791,455 | |
| | | | Level 3 Financing, Inc., Term Loan | | | | |
| | 960,000 | | | 4.750%, 8/1/2019 | | | 963,946 | |
| | | | Liberty Cablevision of Puerto Rico, Ltd., Term Loan | | | | |
| | 493,763 | | | 6.000%, 6/9/2017 | | | 492,528 | |
| | | | MCC Georgia, LLC, Term Loan | | | | |
| | 395,000 | | | 4.000%, 1/20/2020 | | | 393,025 | |
| | | | SBA Senior Finance II, LLC, Term Loan | | | | |
| | 295,000 | | | 3.750%, 9/28/2019 | | | 296,254 | |
| | | | Toys R Us, Inc., Term Loan | | | | |
| | 769,207 | | | 5.250%, 5/25/2018 | | | 752,669 | |
| | | | Univision Communications, Inc., Term Loan | | | | |
| | 311,787 | | | 2.212%, 9/29/2014 | | | 310,471 | |
| | 395,000 | | | 4.462%, 3/31/2017 | | | 385,868 | |
| | | | Van Wagner Communications, Inc., Term Loan | | | | |
| | 390,000 | | | 8.250%, 8/3/2018 | | | 394,387 | |
| | | | WideOpenWest Finance, LLC, Term Loan | | | | |
| | 738,150 | | | 6.250%, 7/17/2018 | | | 744,151 | |
| | | | Yankee Cable Acquisition, LLC, Term Loan | | | | |
| | 387,717 | | | 5.250%, 8/26/2016 | | | 389,008 | |
| | | | Zayo Group, LLC, Term Loan | | | | |
| | 1,033,150 | | | 5.250%, 7/2/2019 | | | 1,036,766 | |
| | | | | |
| | | | Total | | | 8,948,587 | |
| | | | | |
| |
| Consumer Cyclical (0.2%) | | | | |
| | | | Burlington Coat Factory Warehouse Corporation, Term Loan | | | | |
| | 603,900 | | | 5.500%, 2/23/2017 | | | 607,958 | |
| | | | Chrysler Group, LLC, Term Loan | | | | |
| | 522,355 | | | 6.000%, 5/24/2017 | | | 533,163 | |
| | | | Rock Ohio Caesars, LLC, 18 month Delayed Draw | | | | |
| | 90,000 | | | 5.704%, 8/19/2017b,c | | | 92,025 | |
| | | | Rock Ohio Caesars, LLC, 6 month Delayed Draw | | | | |
| | 54,000 | | | 5.704%, 8/19/2017b,c | | | 55,215 | |
| | | | Rock Ohio Caesars, LLC, Term Loan | | | | |
| | 691,000 | | | 8.426%, 8/19/2017b,c | | | 706,547 | |
| | | | Seven Seas Cruises S de RL, LLC, Term Loan | | | | |
| | 885,000 | | | 6.250%, 12/21/2018 | | | 897,169 | |
| | | | | |
| | | | Total | | | 2,892,077 | |
| | | | | |
| |
| Consumer Non-Cyclical (0.4%) | | | | |
| | | | Bausch & Lomb, Inc., Term Loan | | | | |
| | 488,775 | | | 5.250%, 5/17/2019 | | | 493,839 | |
| | | | Ceridian Corporation, Term Loan | | | | |
| | 590,000 | | | 5.893%, 5/9/2017b,c | | | 587,787 | |
| | | | CHS/Community Health Systems, Inc., Term Loan | | | | |
| | 495,000 | | | 3.921%, 1/25/2017 | | | 496,851 | |
| | | | DJO Finance, LLC, Term Loan | | | | |
| | 493,760 | | | 6.250%, 9/15/2017 | | | 495,201 | |
| | | | Grifols, Inc., Term Loan | | | | |
| | 493,388 | | | 4.500%, 6/1/2017 | | | 497,439 | |
| | | | Hologic, Inc., Term Loan | | | | |
| | 588,525 | | | 4.500%, 8/1/2019 | | | 594,740 | |
| | | | Reynolds Group Holdings, Inc., Term Loan | | | | |
| | 100,000 | | | 0.000%, 9/28/2018b,c | | | 100,287 | |
| | | | Roundy’s Supermarkets, Inc., Term Loan | | | | |
| | 817,125 | | | 5.750%, 2/13/2019 | | | 792,464 | |
| | | | Visant Corporation, Term Loan | | | | |
| | 735,000 | | | 5.080%, 12/22/2016b,c | | | 702,535 | |
| | | | Warner Chilcott Company, LLC, Term Loan | | | | |
| | 37,882 | | | 4.250%, 3/15/2018 | | | 37,989 | |
| | | | Warner Chilcott Corporation, Term Loan | | | | |
| | 75,765 | | | 4.250%, 3/15/2018 | | | 75,977 | |
| | 28,772 | | | 4.250%, 3/15/2018 | | | 28,853 | |
| | | | WC Luxco Sarl, Term Loan | | | | |
| | 52,088 | | | 4.250%, 3/15/2018 | | | 52,235 | |
| | | | | |
| | | | Total | | | 4,956,197 | |
| | | | | |
| |
| Energy (0.1%) | | | | |
| | | | Chesapeake Energy Corporation, Term Loan | | | | |
| | 202,713 | | | 8.500%, 12/2/2017 | | | 202,908 | |
The accompanying Notes to Financial Statements are an integral part of this schedule.
76
Moderate Allocation Fund
Schedule of Investments as of October 31, 2012
| | | | | | | | |
Principal
Amount | | | Bank Loans (2.1%)a | | Value | |
| Energy (0.1%) - continued | | | | |
| | | | GenOn Energy, Inc., Term Loan | | | | |
| | $392,995 | | | 6.500%, 12/4/2017 | | | $395,699 | |
| | | | Plains Exploration & Production Company, Term Loan | | | | |
| | 190,000 | | | 0.000%, 10/15/2019b,c | | | 190,747 | |
| | | | | |
| | | | Total | | | 789,354 | |
| | | | | |
| |
| Financials (0.1%) | | | | |
| | | | Nuveen Investments, Inc., Term Loan | | | | |
| | 150,000 | | | 5.841%, 5/13/2017 | | | 149,437 | |
| | 490,000 | | | 5.846%, 5/13/2017 | | | 489,236 | |
| | | | WaveDivision Holdings, LLC, Term Loan | | | | |
| | 690,000 | | | 4.250%, 8/9/2019b,c | | | 697,473 | |
| | | | | |
| | | | Total | | | 1,336,146 | |
| | | | | |
| |
| Technology (0.2%) | | | | |
| | | | First Data Corporation Extended, Term Loan | | | | |
| | 525,000 | | | 4.211%, 3/26/2018 | | | 500,062 | |
| | | | First Data Corporation, Term Loan | | | | |
| | 395,000 | | | 5.211%, 9/24/2018 | | | 386,014 | |
| | | | Freescale Semiconductor, Inc., Term Loan | | | | |
| | 656,700 | | | 6.000%, 2/28/2019 | | | 651,118 | |
| | | | Infor US, Inc., Term Loan | | | | |
| | 523,938 | | | 6.059%, 4/5/2018 | | | 529,339 | |
| | | | Intelsat Jackson Holdings SA, Term Loan | | | | |
| | 660,730 | | | 4.500%, 4/2/2018 | | | 664,999 | |
| | | | | |
| | | | Total | | | 2,731,532 | |
| | | | | |
| |
| Transportation (<0.1%) | | | | |
| | | | Delta Air Lines, Inc., Term Loan | | | | |
| | 522,355 | | | 5.500%, 4/20/2017 | | | 521,833 | |
| | | | | |
| | | | Total | | | 521,833 | |
| | | | | |
| |
| Utilities (0.1%) | | | | |
| | | | Calpine Corporation, Term Loan | | | | |
| | 785,000 | | | 4.500%, 10/9/2019 | | | 785,573 | |
| | | | NGPL PipeCo, LLC, Term Loan | | | | |
| | 740,000 | | | 6.750%, 9/15/2017 | | | 754,186 | |
| | | | | |
| | | | Total | | | 1,539,759 | |
| | | | | |
| | | | | | | | |
| | | | | |
| | | | Total Bank Loans (cost $28,419,388) | | | 28,598,268 | |
| | | | | |
| | |
| Shares | | | Mutual Funds (66.7%) | | Value | |
| Equity Mutual Funds (38.1%) | | | | |
| | 2,739,166 | | | Thrivent Natural Resources Fund | | | 24,652,493 | |
| | 2,161,677 | | | Thrivent Partner Small Cap Growth Fundd | | | 28,058,568 | |
| | 1,582,271 | | | Thrivent Partner Small Cap Value Fund | | | 26,582,148 | |
| | 882,584 | | | Thrivent Small Cap Stock Fundd | | | 14,200,780 | |
| | 741,659 | | | Thrivent Mid Cap Growth Fundd | | | 15,337,507 | |
| | 2,203,370 | | | Thrivent Partner Mid Cap Value Fund | | | 28,335,335 | |
| | 2,616,880 | | | Thrivent Mid Cap Stock Fundd | | | 43,518,716 | |
| | 15,371,774 | | | Thrivent Partner Worldwide Allocation Fund | | | 135,117,892 | |
| | 11,226,944 | | | Thrivent Large Cap Growth Fund | | | 66,351,241 | |
| | 6,764,619 | | | Thrivent Large Cap Value Fund | | | 99,845,770 | |
| | 1,435,716 | | | Thrivent Large Cap Stock Fund | | | 34,198,749 | |
| | 1,154,480 | | | Thrivent Equity Income Plus Fund | | | 11,094,557 | |
| | | | | |
| | | | Total | | | 527,293,756 | |
| | | | | |
| |
| Fixed Income Mutual Funds (28.6%) | | | | |
| | 9,209,135 | | | Thrivent High Yield Fund | | | 46,137,766 | |
| | 20,447,821 | | | Thrivent Income Fund | | | 191,596,078 | |
| | 2,318,648 | | | Thrivent Government Bond Fund | | | 24,948,651 | |
| | 10,485,914 | | | Thrivent Limited Maturity Bond Fund | | | 132,332,229 | |
| | | | | |
| | | | Total | | | 395,014,724 | |
| | | | | |
| | | | | | | | |
| | | | | |
| | | | Total Mutual Funds (cost $865,643,926) | | | 922,308,480 | |
| | | | | |
| | |
Principal
Amount | | | Long-Term Fixed Income (13.8%) | | Value | |
| Asset-Backed Securities (0.1%) | | | | |
| | | | Morgan Stanley Capital, Inc. | | | | |
| | 1,230,779 | | | 0.361%, 2/25/2037e | | | 625,403 | |
| | | | Renaissance Home Equity Loan Trust | | | | |
| | 2,280,000 | | | 6.011%, 5/25/2036 | | | 1,341,659 | |
| | | | | |
| | | | Total | | | 1,967,062 | |
| | | | | |
| |
| Basic Materials (0.2%) | | | | |
| | | | ArcelorMittal | | | | |
| | 151,000 | | | 5.375%, 6/1/2013 | | | 154,176 | |
| | | | Arch Coal, Inc. | | | | |
| | 285,000 | | | 7.000%, 6/15/2019f | | | 252,937 | |
| | | | BHP Billiton Finance, Ltd. | | | | |
| | 245,000 | | | 1.000%, 2/24/2015 | | | 247,350 | |
| | | | Dow Chemical Company | | | | |
| | 242,000 | | | 5.900%, 2/15/2015 | | | 269,332 | |
| | | | FMG Resources Property, Ltd. | | | | |
| | 285,000 | | | 8.250%, 11/1/2019f,g | | | 285,000 | |
| | | | Hexion US Finance Corporation/Hexion Nova Scotia Finance ULC | | | | |
| | 285,000 | | | 8.875%, 2/1/2018 | | | 287,850 | |
| | | | International Paper Company | | | | |
| | 162,000 | | | 5.300%, 4/1/2015 | | | 176,047 | |
| | | | LyondellBasell Industries NV | | | | |
| | 315,000 | | | 5.000%, 4/15/2019 | | | 340,988 | |
| | | | Novelis, Inc. | | | | |
| | 290,000 | | | 8.375%, 12/15/2017 | | | 315,375 | |
| | | | Rock-Tenn Company | | | | |
| | 166,000 | | | 3.500%, 3/1/2020g | | | 171,130 | |
| | | | Xstrata Finance Canada, Ltd. | | | | |
| | 162,000 | | | 1.800%, 10/23/2015g | | | 162,326 | |
| | 81,000 | | | 2.450%, 10/25/2017g | | | 80,793 | |
| | | | | |
| | | | Total | | | 2,743,304 | |
| | | | | |
| |
| Capital Goods (0.3%) | | | | |
| | | | Bombardier, Inc. | | | | |
| | 285,000 | | | 5.750%, 3/15/2022g | | | 300,319 | |
| | | | Case New Holland, Inc. | | | | |
| | 285,000 | | | 7.875%, 12/1/2017 | | | 334,875 | |
| | | | Caterpillar Financial Services Corporation | | | | |
| | 105,000 | | | 1.100%, 5/29/2015 | | | 106,281 | |
The accompanying Notes to Financial Statements are an integral part of this schedule.
77
Moderate Allocation Fund
Schedule of Investments as of October 31, 2012
| | | | | | | | |
Principal
Amount | | | Long-Term Fixed Income (13.8%) | | Value | |
| Capital Goods (0.3%) - continued | | | | |
| | | | John Deere Capital Corporation | | | | |
| | $166,000 | | | 0.700%, 9/4/2015 | | | $166,232 | |
| | | | Pentair Finance SA | | | | |
| | 166,000 | | | 1.875%, 9/15/2017g | | | 166,513 | |
| | | | Raytheon Company | | | | |
| | 245,000 | | | 1.625%, 10/15/2015 | | | 250,293 | |
| | | | RBS Global, Inc. | | | | |
| | 285,000 | | | 8.500%, 5/1/2018 | | | 312,787 | |
| | | | Reynolds Group Issuer, Inc. | | | | |
| | 285,000 | | | 6.875%, 2/15/2021 | | | 302,813 | |
| | | | Sealed Air Corporation | | | | |
| | 550,000 | | | 8.375%, 9/15/2021g | | | 605,000 | |
| | | | Textron, Inc. | | | | |
| | 320,000 | | | 5.600%, 12/1/2017 | | | 352,302 | |
| | | | United Technologies Corporation | | | | |
| | 26,000 | | | 4.500%, 6/1/2042 | | | 29,904 | |
| | | | UR Financing Escrow Corporation | | | | |
| | 285,000 | | | 7.375%, 5/15/2020g | | | 308,513 | |
| | | | | |
| | | | Total | | | 3,235,832 | |
| | | | | |
| |
| Collateralized Mortgage Obligations (1.0%) | | | | |
| | | | Citigroup Mortgage Loan Trust, Inc. | | | | |
| | 663,045 | | | 5.500%, 11/25/2035 | | | 581,016 | |
| | | | CitiMortgage Alternative Loan Trust | | | | |
| | 2,268,211 | | | 5.750%, 4/25/2037 | | | 1,793,969 | |
| | | | Countrywide Alternative Loan Trust | | | | |
| | 753,461 | | | 6.000%, 4/25/2036 | | | 577,350 | |
| | 453,267 | | | 6.000%, 1/25/2037 | | | 370,893 | |
| | 2,145,656 | | | 5.500%, 5/25/2037 | | | 1,589,346 | |
| | 1,684,900 | | | 7.000%, 10/25/2037 | | | 1,075,156 | |
| | | | Countrywide Home Loans, Inc. | | | | |
| | 1,004,311 | | | 5.750%, 4/25/2037 | | | 903,003 | |
| | | | Deutsche Alt-A Securities, Inc. | | | | |
| | 772,389 | | | 6.000%, 10/25/2021 | | | 706,969 | |
| | | | Deutsche Alt-A Securities, Inc. Alternative Loan Trust | | | | |
| | 364,763 | | | 5.500%, 10/25/2021 | | | 371,718 | |
| | | | GSR Mortgage Loan Trust | | | | |
| | 1,309,877 | | | 0.407%, 8/25/2046e | | | 1,202,151 | |
| | | | J.P. Morgan Mortgage Trust | | | | |
| | 461,534 | | | 5.737%, 6/25/2036 | | | 370,207 | |
| | 202,499 | | | 3.023%, 10/25/2036 | | | 151,192 | |
| | 1,836,558 | | | 6.250%, 8/25/2037 | | | 1,267,770 | |
| | | | MASTR Alternative Loans Trust | | | | |
| | 545,892 | | | 6.500%, 7/25/2034 | | | 574,471 | |
| | 989,485 | | | 0.661%, 12/25/2035e | | | 532,121 | |
| | | | Merrill Lynch Alternative Note Asset Trust | | | | |
| | 510,725 | | | 6.000%, 3/25/2037 | | | 406,137 | |
| | | | Residential Asset Securitization Trust | | | | |
| | 1,222,906 | | | 0.591%, 8/25/2037e | | | 389,013 | |
| | | | Sequoia Mortgage Trust | | | | |
| | 587,128 | | | 4.960%, 9/20/2046 | | | 110,281 | |
| | | | WaMu Mortgage Pass Through Certificates | | | | |
| | 171,391 | | | 2.726%, 9/25/2036 | | | 135,041 | |
| | 673,827 | | | 2.794%, 10/25/2036 | | | 513,495 | |
| | | | | |
| | | | Total | | | 13,621,299 | |
| | | | | |
| |
| Commercial Mortgage-Backed Securities (1.3%) | | | | |
| | | | Banc of America Commercial Mortgage, Inc. | | | | |
| | 2,400,000 | | | 5.631%, 4/10/2049 | | | 2,790,002 | |
| | 1,650,000 | | | 5.535%, 6/10/2049 | | | 1,915,267 | |
| | | | Bear Stearns Commercial Mortgage Securities, Inc. | | | | |
| | 1,500,000 | | | 5.331%, 2/11/2044 | | | 1,671,687 | |
| | | | Credit Suisse First Boston Mortgage Securities | | | | |
| | 2,400,000 | | | 5.542%, 1/15/2049 | | | 2,714,170 | |
| | | | Credit Suisse Mortgage Capital Certificates | | | | |
| | 3,000,000 | | | 5.509%, 9/15/2039 | | | 3,163,908 | |
| | | | Greenwich Capital Commercial Funding Corporation | | | | |
| | 1,600,000 | | | 5.867%, 12/10/2049 | | | 1,753,128 | |
| | | | J.P. Morgan Chase Commercial Mortgage Securities Corporation | | | | |
| | 1,200,000 | | | 5.728%, 2/12/2049 | | | 1,265,669 | |
| | | | Morgan Stanley Capital, Inc. | | | | |
| | 750,000 | | | 5.406%, 3/15/2044 | | | 796,327 | |
| | | | Wachovia Bank Commercial Mortgage Trust | | | | |
| | 1,800,000 | | | 5.603%, 10/15/2048 | | | 1,946,322 | |
| | | | | |
| | | | Total | | | 18,016,480 | |
| | | | | |
| |
| Communications Services (0.7%) | | | | |
| | | | AMC Networks, Inc. | | | | |
| | 550,000 | | | 7.750%, 7/15/2021 | | | 622,875 | |
| | | | America Movil SAB de CV | | | | |
| | 249,000 | | | 3.125%, 7/16/2022 | | | 256,765 | |
| | | | American Tower Corporation | | | | |
| | 202,000 | | | 5.050%, 9/1/2020 | | | 226,986 | |
| | | | AT&T, Inc. | | | | |
| | 341,000 | | | 2.400%, 8/15/2016 | | | 360,411 | |
| | | | British Telecommunications plc | | | | |
| | 210,000 | | | 2.000%, 6/22/2015 | | | 215,397 | |
| | | | Cablevision Systems Corporation | | | | |
| | 290,000 | | | 8.625%, 9/15/2017 | | | 338,575 | |
| | | | CCO Holdings, LLC | | | | |
| | 280,000 | | | 7.000%, 1/15/2019 | | | 301,000 | |
| | | | CenturyLink, Inc. | | | | |
| | 346,000 | | | 5.800%, 3/15/2022 | | | 364,194 | |
| | | | Comcast Corporation | | | | |
| | 350,000 | | | 6.500%, 1/15/2015 | | | 394,043 | |
| | 105,000 | | | 4.650%, 7/15/2042 | | | 113,832 | |
| | | | Digicel, Ltd. | | | | |
| | 360,000 | | | 8.250%, 9/1/2017g | | | 387,000 | |
| | 200,000 | | | 7.000%, 2/15/2020g | | | 210,000 | |
| | | | Dish DBS Corporation | | | | |
| | 395,000 | | | 4.625%, 7/15/2017 | | | 407,344 | |
| | 275,000 | | | 5.875%, 7/15/2022 | | | 288,750 | |
| | | | Frontier Communications Corporation | | | | |
| | 550,000 | | | 8.125%, 10/1/2018 | | | 622,875 | |
The accompanying Notes to Financial Statements are an integral part of this schedule.
78
Moderate Allocation Fund
Schedule of Investments as of October 31, 2012
| | | | | | | | |
Principal
Amount | | | Long-Term Fixed Income (13.8%) | | Value | |
| Communications Services (0.7%) - continued | | | | |
| | | | Hughes Satellite Systems Corporation | | | | |
| | $290,000 | | | 6.500%, 6/15/2019 | | | $310,300 | |
| | | | Intelsat Jackson Holdings SA | | | | |
| | 290,000 | | | 7.250%, 4/1/2019 | | | 311,025 | |
| | | | Level 3 Financing, Inc. | | | | |
| | 310,000 | | | 8.625%, 7/15/2020 | | | 337,900 | |
| | | | NBCUniversal Media, LLC | | | | |
| | 249,000 | | | 2.875%, 4/1/2016 | | | 264,033 | |
| | 81,000 | | | 2.875%, 1/15/2023 | | | 81,637 | |
| | | | News America, Inc. | | | | |
| | 166,000 | | | 3.000%, 9/15/2022g | | | 169,185 | |
| | | | Nippon Telegraph & Telephone Corporation | | | | |
| | 166,000 | | | 1.400%, 7/18/2017 | | | 167,399 | |
| | | | SBA Tower Trust | | | | |
| | 145,000 | | | 5.101%, 4/15/2017g | | | 161,066 | |
| | | | Sprint Nextel Corporation | | | | |
| | 90,000 | | | 9.125%, 3/1/2017 | | | 105,750 | |
| | 205,000 | | | 9.000%, 11/15/2018g | | | 253,175 | |
| | | | Telefonica Emisiones SAU | | | | |
| | 166,000 | | | 3.729%, 4/27/2015 | | | 169,320 | |
| | | | Time Warner Cable, Inc. | | | | |
| | 166,000 | | | 3.500%, 2/1/2015 | | | 176,383 | |
| | | | Univision Communications, Inc. | | | | |
| | 255,000 | | | 6.750%, 9/15/2022g | | | 255,000 | |
| | | | UPCB Finance V, Ltd. | | | | |
| | 285,000 | | | 7.250%, 11/15/2021g | | | 313,500 | |
| | | | Verizon Communications, Inc. | | | | |
| | 342,000 | | | 5.500%, 2/15/2018 | | | 416,299 | |
| | | | Virgin Media Finance plc | | | | |
| | 285,000 | | | 5.250%, 2/15/2022 | | | 297,825 | |
| | | | Vivendi SA | | | | |
| | 249,000 | | | 2.400%, 4/10/2015g | | | 252,091 | |
| | | | Vodafone Group plc | | | | |
| | 172,000 | | | 1.250%, 9/26/2017 | | | 172,938 | |
| | | | | |
| | | | Total | | | 9,324,873 | |
| | | | | |
| |
| Consumer Cyclical (0.3%) | | | | |
| | | | American Honda Finance Corporation | | | | |
| | 83,000 | | | 1.000%, 8/11/2015g | | | 83,113 | |
| | 83,000 | | | 1.500%, 9/11/2017g | | | 83,602 | |
| | | | Chrysler Group, LLC | | | | |
| | 280,000 | | | 8.000%, 6/15/2019f | | | 297,850 | |
| | | | Federated Retail Holdings, Inc. | | | | |
| | 245,000 | | | 5.900%, 12/1/2016 | | | 288,649 | |
| | | | Ford Motor Credit Company, LLC | | | | |
| | 172,000 | | | 12.000%, 5/15/2015 | | | 211,990 | |
| | 285,000 | | | 5.000%, 5/15/2018 | | | 314,368 | |
| | | | Host Hotels and Resorts, LP | | | | |
| | 275,000 | | | 6.000%, 11/1/2020 | | | 305,937 | |
| | | | Hyundai Capital America | | | | |
| | 162,000 | | | 1.625%, 10/2/2015g | | | 163,006 | |
| | | | Lennar Corporation | | | | |
| | 280,000 | | | 12.250%, 6/1/2017 | | | 378,000 | |
| | | | Limited Brands, Inc. | | | | |
| | 200,000 | | | 5.625%, 2/15/2022 | | | 215,750 | |
| | | | Macy’s Retail Holdings, Inc. | | | | |
| | 250,000 | | | 3.875%, 1/15/2022 | | | 274,746 | |
| | | | MGM Resorts International | | | | |
| | 375,000 | | | 7.625%, 1/15/2017f | | | 394,687 | |
| | | | Scientific Games International, Inc. | | | | |
| | 390,000 | | | 6.250%, 9/1/2020g | | | 396,338 | |
| | | | Service Corporation International | | | | |
| | 285,000 | | | 8.000%, 11/15/2021 | | | 349,838 | |
| | | | Time Warner, Inc. | | | | |
| | 135,000 | | | 3.150%, 7/15/2015 | | | 143,700 | |
| | | | Toyota Motor Credit Corporation | | | | |
| | 105,000 | | | 1.750%, 5/22/2017 | | | 107,713 | |
| | | | Toys R Us Property Company II, LLC | | | | |
| | 290,000 | | | 8.500%, 12/1/2017 | | | 311,387 | |
| | | | Viacom, Inc. | | | | |
| | 83,000 | | | 1.250%, 2/27/2015 | | | 83,806 | |
| | | | | |
| | | | Total | | | 4,404,480 | |
| | | | | |
| |
| Consumer Non-Cyclical (0.6%) | | | | |
| | | | Amgen, Inc. | | | | |
| | 95,000 | | | 4.850%, 11/18/2014 | | | 102,906 | |
| | 95,000 | | | 2.125%, 5/15/2017 | | | 98,797 | |
| | | | Anheuser-Busch InBev Worldwide, Inc. | | | | |
| | 83,000 | | | 0.800%, 7/15/2015 | | | 83,243 | |
| | 166,000 | | | 1.375%, 7/15/2017 | | | 168,502 | |
| | | | BAT International Finance plc | | | | |
| | 210,000 | | | 1.400%, 6/5/2015g | | | 212,244 | |
| | | | Beam, Inc. | | | | |
| | 47,000 | | | 1.875%, 5/15/2017 | | | 48,258 | |
| | | | Biomet, Inc. | | | | |
| | 375,000 | | | 6.500%, 10/1/2020g | | | 364,688 | |
| | | | Boston Scientific Corporation | | | | |
| | 310,000 | | | 5.450%, 6/15/2014 | | | 330,776 | |
| | 68,000 | | | 4.500%, 1/15/2015 | | | 72,875 | |
| | | | Bunge Limited Finance Corporation | | | | |
| | 83,000 | | | 3.200%, 6/15/2017 | | | 87,497 | |
| | | | Celgene Corporation | | | | |
| | 124,000 | | | 1.900%, 8/15/2017 | | | 125,904 | |
| | 125,000 | | | 3.250%, 8/15/2022 | | | 128,848 | |
| | | | Community Health Systems, Inc. | | | | |
| | 285,000 | | | 8.000%, 11/15/2019 | | | 307,444 | |
| | | | ConAgra Foods, Inc. | | | | |
| | 249,000 | | | 1.350%, 9/10/2015 | | | 251,019 | |
| | | | Covidien International Finance SA | | | | |
| | 210,000 | | | 1.350%, 5/29/2015 | | | 213,304 | |
| | | | CVS Caremark Corporation | | | | |
| | 101,000 | | | 6.125%, 9/15/2039 | | | 135,439 | |
| | | | Express Scripts Holding Company | | | | |
| | 166,000 | | | 2.750%, 11/21/2014g | | | 172,087 | |
| | 166,000 | | | 3.125%, 5/15/2016 | | | 176,738 | |
| | | | Fresenius Medical Care US Finance II, Inc. | | | | |
| | 275,000 | | | 5.625%, 7/31/2019g | | | 289,438 | |
| | | | Gilead Sciences, Inc. | | | | |
| | 133,000 | | | 2.400%, 12/1/2014 | | | 137,545 | |
| | 145,000 | | | 3.050%, 12/1/2016 | | | 155,839 | |
| | | | Grifols, Inc. | | | | |
| | 375,000 | | | 8.250%, 2/1/2018 | | | 416,250 | |
| | | | HCA, Inc. | | | | |
| | 285,000 | | | 5.875%, 3/15/2022 | | | 305,663 | |
The accompanying Notes to Financial Statements are an integral part of this schedule.
79
Moderate Allocation Fund
Schedule of Investments as of October 31, 2012
| | | | | | | | |
Principal
Amount | | | Long-Term Fixed Income (13.8%) | | Value | |
| Consumer Non-Cyclical (0.6%) - continued | | | | |
| | | | Heineken NV | | | | |
| | $162,000 | | | 0.800%, 10/1/2015g | | | $162,325 | |
| | 162,000 | | | 1.400%, 10/1/2017g | | | 162,729 | |
| | 40,000 | | | 4.000%, 10/1/2042g | | | 40,461 | |
| | | | JBS USA, LLC | | | | |
| | 285,000 | | | 7.250%, 6/1/2021g | | | 278,730 | |
| | | | Kraft Foods, Inc. | | | | |
| | 210,000 | | | 1.625%, 6/4/2015g | | | 214,253 | |
| | 131,000 | | | 2.250%, 6/5/2017g | | | 136,074 | |
| | | | Laboratory Corporation of America Holdings | | | | |
| | 166,000 | | | 2.200%, 8/23/2017 | | | 171,088 | |
| | | | Libbey Glass, Inc. | | | | |
| | 130,000 | | | 6.875%, 5/15/2020g | | | 138,450 | |
| | | | Lorillard Tobacco Company | | | | |
| | 166,000 | | | 2.300%, 8/21/2017 | | | 167,921 | |
| | | | Rite Aid Corporation | | | | |
| | 585,000 | | | 7.500%, 3/1/2017 | | | 601,087 | |
| | | | Roche Holdings, Inc. | | | | |
| | 166,000 | | | 7.000%, 3/1/2039g | | | 257,106 | |
| | | | SABMiller Holdings, Inc. | | | | |
| | 248,000 | | | 1.850%, 1/15/2015g | | | 254,172 | |
| | | | Safeway, Inc. | | | | |
| | 185,000 | | | 5.000%, 8/15/2019 | | | 198,534 | |
| | | | Spectrum Brands Holdings, Inc. | | | | |
| | 550,000 | | | 9.500%, 6/15/2018 | | | 617,375 | |
| | | | Teva Pharmaceutical Finance Company BV | | | | |
| | 95,000 | | | 2.400%, 11/10/2016 | | | 99,917 | |
| | | | Teva Pharmaceutical Finance IV, LLC | | | | |
| | 190,000 | | | 1.700%, 11/10/2014 | | | 194,199 | |
| | | | Tyson Foods, Inc. | | | | |
| | 210,000 | | | 4.500%, 6/15/2022 | | | 222,600 | |
| | | | Valeant Pharmaceuticals International | | | | |
| | 285,000 | | | 6.875%, 12/1/2018g | | | 303,881 | |
| | | | Watson Pharmaceuticals, Inc. | | | | |
| | 81,000 | | | 1.875%, 10/1/2017 | | | 82,104 | |
| | 32,000 | | | 3.250%, 10/1/2022 | | | 32,976 | |
| | | | | |
| | | | Total | | | 8,721,286 | |
| | | | | |
| |
| Energy (0.4%) | | | | |
| | | | Apache Corporation | | | | |
| | 245,000 | | | 1.750%, 4/15/2017 | | | 253,564 | |
| | | | BP Capital Markets plc | | | | |
| | 245,000 | | | 3.125%, 10/1/2015 | | | 261,838 | |
| | | | Concho Resources, Inc. | | | | |
| | 690,000 | | | 5.500%, 10/1/2022 | | | 722,775 | |
| | | | Denbury Resources, Inc. | | | | |
| | 275,000 | | | 6.375%, 8/15/2021 | | | 301,125 | |
| | | | EOG Resources, Inc. | | | | |
| | 166,000 | | | 2.625%, 3/15/2023 | | | 169,927 | |
| | | | Harvest Operations Corporation | | | | |
| | 595,000 | | | 6.875%, 10/1/2017 | | | 651,525 | |
| | | | Linn Energy, LLC | | | | |
| | 285,000 | | | 7.750%, 2/1/2021 | | | 304,237 | |
| | | | Marathon Oil Corporation | | | | |
| | 243,000 | | | 0.900%, 11/1/2015 | | | 243,860 | |
| | | | Marathon Petroleum Corporation | | | | |
| | 166,000 | | | 3.500%, 3/1/2016 | | | 177,863 | |
| | | | Phillips 66 | | | | |
| | 191,000 | | | 2.950%, 5/1/2017g | | | 203,708 | |
| | | | Pioneer Natural Resources Company | | | | |
| | 83,000 | | | 5.875%, 7/15/2016 | | | 94,285 | |
| | 166,000 | | | 6.650%, 3/15/2017 | | | 197,581 | |
| | | | SandRidge Energy, Inc. | | | | |
| | 375,000 | | | 7.500%, 2/15/2023g | | | 388,125 | |
| | | | Suncor Energy, Inc. | | | | |
| | 145,000 | | | 6.100%, 6/1/2018 | | | 178,823 | |
| | | | Transocean, Inc. | | | | |
| | 83,000 | | | 5.050%, 12/15/2016 | | | 92,959 | |
| | 166,000 | | | 6.000%, 3/15/2018 | | | 195,569 | |
| | | | Valero Energy Corporation | | | | |
| | 166,000 | | | 7.500%, 4/15/2032 | | | 219,110 | |
| | | | Weatherford International, Ltd. | | | | |
| | 249,000 | | | 6.750%, 9/15/2040 | | | 295,740 | |
| | | | | |
| | | | Total | | | 4,952,614 | |
| | | | | |
| |
| Financials (1.4%) | | | | |
| | | | ABN Amro North American Holding Preferred Capital Repackage Trust I | | | | |
| | 81,000 | | | 6.523%, 12/29/2049g,h | | | 81,000 | |
| | | | Ally Financial, Inc. | | | | |
| | 285,000 | | | 5.500%, 2/15/2017 | | | 301,580 | |
| | | | American Express Credit Corporation | | | | |
| | 105,000 | | | 2.375%, 3/24/2017 | | | 110,417 | |
| | | | American International Group, Inc. | | | | |
| | 249,000 | | | 2.375%, 8/24/2015 | | | 253,167 | |
| | 245,000 | | | 3.800%, 3/22/2017 | | | 264,313 | |
| | | | ANZ National International, Ltd. of London | | | | |
| | 250,000 | | | 3.125%, 8/10/2015g | | | 262,483 | |
| | | | Associated Banc Corporation | | | | |
| | 83,000 | | | 1.875%, 3/12/2014 | | | 82,977 | |
| | | | Bank of America Corporation | | | | |
| | 352,000 | | | 7.750%, 8/15/2015 | | | 397,425 | |
| | 244,000 | | | 1.500%, 10/9/2015 | | | 244,278 | |
| | 165,000 | | | 5.750%, 8/15/2016 | | | 182,732 | |
| | 250,000 | | | 5.750%, 12/1/2017 | | | 289,573 | |
| | 165,000 | | | 5.650%, 5/1/2018 | | | 192,101 | |
| | | | Bank of New York Mellon Corporation | | | | |
| | 81,000 | | | 0.700%, 10/23/2015 | | | 81,023 | |
| | | | Bank of Nova Scotia | | | | |
| | 244,000 | | | 1.850%, 1/12/2015 | | | 250,425 | |
| | | | Barclays Bank plc | | | | |
| | 208,000 | | | 6.050%, 12/4/2017g | | | 227,174 | |
| | | | BBVA US Senior SAU | | | | |
| | 243,000 | | | 4.664%, 10/9/2015 | | | 245,402 | |
| | | | Berkshire Hathaway, Inc. | | | | |
| | 190,000 | | | 1.600%, 5/15/2017 | | | 194,057 | |
| | | | BlackRock, Inc. | | | | |
| | 105,000 | | | 1.375%, 6/1/2015 | | | 106,966 | |
| | | | BNP Paribas SA | | | | |
| | 83,000 | | | 2.375%, 9/14/2017 | | | 83,608 | |
| | | | Capital One Capital V | | | | |
| | 166,000 | | | 10.250%, 8/15/2039 | | | 170,980 | |
The accompanying Notes to Financial Statements are an integral part of this schedule.
80
Moderate Allocation Fund
Schedule of Investments as of October 31, 2012
| | | | | | | | |
Principal
Amount | | | Long-Term Fixed Income (13.8%) | | Value | |
| Financials (1.4%) - continued | | | | |
| | | | Capital One Financial Corporation | | | | |
| | $244,000 | | | 2.150%, 3/23/2015 | | | $250,824 | |
| | | | CIT Group, Inc. | | | | |
| | 375,000 | | | 4.250%, 8/15/2017 | | | 384,678 | |
| | | | Citigroup, Inc. | | | | |
| | 244,000 | | | 5.850%, 7/2/2013 | | | 252,188 | |
| | 433,000 | | | 5.000%, 9/15/2014 | | | 458,362 | |
| | 249,000 | | | 4.750%, 5/19/2015 | | | 269,863 | |
| | 249,000 | | | 6.000%, 8/15/2017 | | | 293,103 | |
| | | | CNA Financial Corporation | | | | |
| | 291,000 | | | 7.350%, 11/15/2019 | | | 364,672 | |
| | | | Credit Suisse New York, NY | | | | |
| | 250,000 | | | 5.500%, 5/1/2014 | | | 266,565 | |
| | | | Developers Diversified Realty Corporation | | | | |
| | 333,000 | | | 7.500%, 4/1/2017 | | | 401,806 | |
| | 320,000 | | | 7.875%, 9/1/2020 | | | 416,176 | |
| | | | Discover Bank | | | | |
| | 249,000 | | | 8.700%, 11/18/2019 | | | 325,573 | |
| | | | Duke Realty, LP | | | | |
| | 83,000 | | | 3.875%, 10/15/2022 | | | 86,398 | |
| | | | Eksportfinans ASA | | | | |
| | 104,000 | | | 3.000%, 11/17/2014 | | | 103,220 | |
| | 154,000 | | | 5.500%, 5/25/2016 | | | 159,390 | |
| | | | Fifth Third Bancorp | | | | |
| | 188,000 | | | 5.450%, 1/15/2017 | | | 212,226 | |
| | | | General Electric Capital Corporation | | | | |
| | 245,000 | | | 2.150%, 1/9/2015 | | | 251,749 | |
| | 159,000 | | | 0.551%, 1/8/2016e | | | 156,660 | |
| | 90,000 | | | 1.308%, 5/9/2016e | | | 90,061 | |
| | 95,000 | | | 2.300%, 4/27/2017 | | | 98,133 | |
| | 166,000 | | | 3.150%, 9/7/2022 | | | 168,870 | |
| | 250,000 | | | 6.750%, 3/15/2032 | | | 332,533 | |
| | | | Goldman Sachs Group, Inc. | | | | |
| | 245,000 | | | 5.000%, 10/1/2014 | �� | | 262,557 | |
| | 250,000 | | | 3.700%, 8/1/2015 | | | 263,252 | |
| | 249,000 | | | 0.823%, 3/22/2016e | | | 242,102 | |
| | | | Hartford Financial Services Group, Inc. | | | | |
| | 40,000 | | | 7.300%, 11/1/2015 | | | 45,708 | |
| | 50,000 | | | 5.500%, 10/15/2016 | | | 56,372 | |
| | 245,000 | | | 4.000%, 10/15/2017 | | | 266,571 | |
| | | | HSBC Holdings plc | | | | |
| | 190,000 | | | 4.000%, 3/30/2022 | | | 208,137 | |
| | 139,000 | | | 6.500%, 5/2/2036 | | | 170,187 | |
| | | | Icahn Enterprises, LP | | | | |
| | 55,000 | | | 8.000%, 1/15/2018g | | | 59,125 | |
| | 285,000 | | | 8.000%, 1/15/2018 | | | 306,375 | |
| | | | ING Bank NV | | | | |
| | 290,000 | | | 2.000%, 9/25/2015g | | | 292,359 | |
| | 162,000 | | | 3.750%, 3/7/2017g | | | 171,540 | |
| | | | International Lease Finance Corporation | | | | |
| | 285,000 | | | 5.875%, 4/1/2019 | | | 301,934 | |
| | | | J.P. Morgan Chase & Company | | | | |
| | 243,000 | | | 4.650%, 6/1/2014 | | | 257,527 | |
| | 162,000 | | | 1.875%, 3/20/2015 | | | 165,088 | |
| | 162,000 | | | 3.450%, 3/1/2016 | | | 172,388 | |
| | 249,000 | | | 2.000%, 8/15/2017 | | | 251,668 | |
| | | | J.P. Morgan Chase Bank NA | | | | |
| | 228,000 | | | 0.729%, 6/13/2016e | | | 220,699 | |
| | | | Liberty Mutual Group, Inc. | | | | |
| | 83,000 | | | 4.950%, 5/1/2022g | | | 90,641 | |
| | 81,000 | | | 6.500%, 5/1/2042g | | | 92,311 | |
| | | | Lloyds TSB Bank plc | | | | |
| | 250,000 | | | 6.500%, 9/14/2020g | | | 272,350 | |
| | | | Morgan Stanley | | | | |
| | 166,000 | | | 4.750%, 4/1/2014 | | | 172,211 | |
| | 373,000 | | | 6.000%, 5/13/2014 | | | 396,272 | |
| | 351,000 | | | 4.750%, 3/22/2017 | | | 379,851 | |
| | 81,000 | | | 4.875%, 11/1/2022 | | | 81,885 | |
| | | | Murray Street Investment Trust I | | | | |
| | 292,000 | | | 4.647%, 3/9/2017 | | | 316,847 | |
| | | | Omega Healthcare Investors, Inc. | | | | |
| | 275,000 | | | 5.875%, 3/15/2024 | | | 292,875 | |
| | | | PNC Funding Corporation | | | | |
| | 250,000 | | | 3.300%, 3/8/2022 | | | 268,448 | |
| | | | Prudential Financial, Inc. | | | | |
| | 243,000 | | | 6.200%, 11/15/2040 | | | 302,373 | |
| | | | Realty Income Corporation | | | | |
| | 81,000 | | | 2.000%, 1/31/2018 | | | 81,691 | |
| | | | Regions Bank | | | | |
| | 415,000 | | | 7.500%, 5/15/2018 | | | 499,851 | |
| | | | Reinsurance Group of America, Inc. | | | | |
| | 81,000 | | | 5.000%, 6/1/2021 | | | 89,891 | |
| | | | Royal Bank of Scotland Group plc | | | | |
| | 166,000 | | | 5.050%, 1/8/2015 | | | 171,839 | |
| | 249,000 | | | 2.550%, 9/18/2015 | | | 255,253 | |
| | | | Santander US Debt SAU | | | | |
| | 210,000 | | | 3.724%, 1/20/2015g | | | 210,412 | |
| | | | SLM Corporation | | | | |
| | 243,000 | | | 6.250%, 1/25/2016 | | | 262,452 | |
| | | | Societe Generale SA | | | | |
| | 170,000 | | | 5.200%, 4/15/2021g | | | 186,966 | |
| | | | Svenska Handelsbanken AB | | | | |
| | 245,000 | | | 3.125%, 7/12/2016 | | | 259,921 | |
| | | | U.S. Bancorp | | | | |
| | 162,000 | | | 3.150%, 3/4/2015 | | | 171,312 | |
| | 95,000 | | | 1.650%, 5/15/2017 | | | 97,115 | |
| | | | UBS AG/Stamford, Connecticut | | | | |
| | 162,000 | | | 5.875%, 12/20/2017 | | | 191,692 | |
| | | | UnitedHealth Group, Inc. | | | | |
| | 81,000 | | | 0.850%, 10/15/2015 | | | 81,330 | |
| | 40,000 | | | 1.400%, 10/15/2017 | | | 40,258 | |
| | | | Wachovia Corporation | | | | |
| | 595,000 | | | 5.625%, 10/15/2016 | | | 692,756 | |
| | | | WEA Finance, LLC | | | | |
| | 245,000 | | | 5.700%, 10/1/2016g | | | 279,235 | |
| | | | Wells Fargo & Company | | | | |
| | 160,000 | | | 2.100%, 5/8/2017 | | | 164,770 | |
| | | | | |
| | | | Total | | | 19,481,128 | |
| | | | | |
| |
| Foreign Government (<0.1%) | | | | |
| | | | Chile Government International Bond | | | | |
| | 162,000 | | | 2.250%, 10/30/2022 | | | 159,570 | |
| | | | Korea Finance Corporation | | | | |
| | 83,000 | | | 2.250%, 8/7/2017 | | | 83,691 | |
| | | | | |
| | | | Total | | | 243,261 | |
| | | | | |
The accompanying Notes to Financial Statements are an integral part of this schedule.
81
Moderate Allocation Fund
Schedule of Investments as of October 31, 2012
| | | | | | | | |
Principal
Amount | | | Long-Term Fixed Income (13.8%) | | Value | |
| Mortgage-Backed Securities (5.8%) | | | | |
| | | | Federal Home Loan Mortgage Corporation Gold 15-Yr. Pass Through | | | | |
| | $9,505,000 | | | 2.500%, 11/1/2027c | | | $9,926,784 | |
| | | | Federal Home Loan Mortgage Corporation Gold 30-Yr. Pass Through | | | | |
| | 7,700,000 | | | 3.000%, 11/1/2042c | | | 8,060,336 | |
| | | | Federal National Mortgage Association Conventional 15- Yr. Pass Through | | | | |
| | 6,700,000 | | | 2.500%, 11/1/2027c | | | 7,011,969 | |
| | | | Federal National Mortgage Association Conventional 30- Yr. Pass Through | | | | |
| | 16,545,000 | | | 3.500%, 11/1/2042c | | | 17,623,009 | |
| | 21,095,000 | | | 4.000%, 11/1/2042c | | | 22,588,129 | |
| | 8,425,000 | | | 5.000%, 11/1/2042c | | | 9,191,149 | |
| | 5,000,000 | | | 5.000%, 12/1/2042c | | | 5,454,688 | |
| | | | | |
| | | | Total | | | 79,856,064 | |
| | | | | |
| |
| Technology (0.2%) | | | | |
| | | | Amkor Technology, Inc. | | | | |
| | 550,000 | | | 6.625%, 6/1/2021 | | | 523,875 | |
| | | | Computer Sciences Corporation | | | | |
| | 124,000 | | | 2.500%, 9/15/2015 | | | 126,653 | |
| | | | Equinix, Inc. | | | | |
| | 550,000 | | | 8.125%, 3/1/2018 | | | 605,000 | |
| | | | First Data Corporation | | | | |
| | 285,000 | | | 7.375%, 6/15/2019g | | | 294,975 | |
| | | | Freescale Semiconductor, Inc. | | | | |
| | 140,000 | | | 9.250%, 4/15/2018g | | | 149,800 | |
| | | | Hewlett-Packard Company | | | | |
| | 166,000 | | | 2.125%, 9/13/2015 | | | 165,518 | |
| | 187,000 | | | 2.600%, 9/15/2017 | | | 182,105 | |
| | | | International Business Machines Corporation | | | | |
| | 190,000 | | | 0.750%, 5/11/2015 | | | 191,091 | |
| | | | Oracle Corporation | | | | |
| | 162,000 | | | 1.200%, 10/15/2017 | | | 162,817 | |
| | 81,000 | | | 2.500%, 10/15/2022 | | | 82,462 | |
| | | | Samsung Electronics America, Inc. | | | | |
| | 272,000 | | | 1.750%, 4/10/2017g | | | 274,980 | |
| | | | Xerox Corporation | | | | |
| | 166,000 | | | 7.200%, 4/1/2016 | | | 192,108 | |
| | | | | |
| | | | Total | | | 2,951,384 | |
| | | | | |
| |
| Transportation (0.2%) | | | | |
| | | | Avis Budget Car Rental, LLC | | | | |
| | 280,000 | | | 8.250%, 1/15/2019 | | | 305,550 | |
| | | | Burlington Northern Santa Fe, LLC | | | | |
| | 62,000 | | | 3.050%, 9/1/2022 | | | 64,693 | |
| | | | Continental Airlines, Inc. | | | | |
| | 585,000 | | | 6.750%, 9/15/2015g | | | 612,056 | |
| | 95,000 | | | 4.150%, 4/11/2024 | | | 99,465 | |
| | | | CSX Corporation | | | | |
| | 134,000 | | | 6.250%, 4/1/2015 | | | 151,605 | |
| | | | Delta Air Lines, Inc. | | | | |
| | 250,000 | | | 6.750%, 5/23/2017 | | | 256,250 | |
| | 43,000 | | | 4.750%, 5/7/2020 | | | 45,421 | |
| | | | ERAC USA Finance, LLC | | | | |
| | 162,000 | | | 1.400%, 4/15/2016g | | | 163,363 | |
| | | | Hertz Corporation | | | | |
| | 275,000 | | | 6.750%, 4/15/2019 | | | 291,844 | |
| | | | Kansas City Southern de Mexico SA de CV | | | | |
| | 190,000 | | | 8.000%, 2/1/2014 | | | 210,900 | |
| | | | Navios Maritime Acquisition Corporation | | | | |
| | 550,000 | | | 8.625%, 11/1/2017 | | | 518,375 | |
| | | | Navios Maritime Holdings, Inc. | | | | |
| | 275,000 | | | 8.875%, 11/1/2017 | | | 281,875 | |
| | | | | |
| | | | Total | | | 3,001,397 | |
| | | | | |
| |
| U.S. Government and Agencies (0.9%) | | | | |
| | | | U.S. Treasury Bonds | | | | |
| | 1,175,000 | | | 4.375%, 5/15/2040 | | | 1,548,429 | |
| | 2,130,000 | | | 3.000%, 5/15/2042 | | | 2,200,224 | |
| | 1,220,000 | | | 2.750%, 8/15/2042 | | | 1,195,219 | |
| | | | U.S. Treasury Notes | | | | |
| | 1,675,000 | | | 2.500%, 4/30/2015 | | | 1,764,901 | |
| | 3,050,000 | | | 0.750%, 6/30/2017 | | | 3,061,913 | |
| | 250,000 | | | 0.875%, 7/31/2019 | | | 246,563 | |
| | 2,610,000 | | | 1.625%, 8/15/2022 | | | 2,595,726 | |
| | | | | |
| | | | Total | | | 12,612,975 | |
| | | | | |
| |
| Utilities (0.4%) | | | | |
| | | | AES Corporation | | | | |
| | 285,000 | | | 7.375%, 7/1/2021 | | | 318,488 | |
| | | | CenterPoint Energy, Inc. | | | | |
| | 189,000 | | | 6.850%, 6/1/2015 | | | 213,750 | |
| | | | Crosstex Energy, LP/Crosstex Energy Finance Corporation | | | | |
| | 550,000 | | | 8.875%, 2/15/2018 | | | 589,875 | |
| | | | Energy Transfer Partners, LP | | | | |
| | 249,000 | | | 4.650%, 6/1/2021 | | | 276,546 | |
| | | | Enterprise Products Operating, LLC | | | | |
| | 249,000 | | | 1.250%, 8/13/2015 | | | 251,654 | |
| | | | Exelon Corporation | | | | |
| | 353,000 | | | 4.900%, 6/15/2015 | | | 388,102 | |
| | | | FirstEnergy Solutions Corporation | | | | |
| | 353,000 | | | 4.800%, 2/15/2015 | | | 381,630 | |
| | | | ITC Holdings Corporation | | | | |
| | 214,000 | | | 5.875%, 9/30/2016g | | | 244,417 | |
| | | | Kinder Morgan Energy Partners, LP | | | | |
| | 166,000 | | | 5.300%, 9/15/2020 | | | 196,690 | |
| | 166,000 | | | 5.000%, 8/15/2042 | | | 179,876 | |
| | | | MarkWest Energy Partners, LP | | | | |
| | 375,000 | | | 5.500%, 2/15/2023 | | | 393,750 | |
| | | | MidAmerican Energy Holdings Company | | | | |
| | 166,000 | | | 6.500%, 9/15/2037 | | | 229,219 | |
| | | | NextEra Energy Capital Holdings, Inc. | | | | |
| | 249,000 | | | 1.200%, 6/1/2015 | | | 250,325 | |
| | | | NGPL PipeCo, LLC | | | | |
| | 275,000 | | | 9.625%, 6/1/2019g | | | 316,250 | |
| | | | NiSource Finance Corporation | | | | |
| | 249,000 | | | 5.950%, 6/15/2041 | | | 302,432 | |
The accompanying Notes to Financial Statements are an integral part of this schedule.
82
Moderate Allocation Fund
Schedule of Investments as of October 31, 2012
| | | | | | | | |
Principal
Amount | | | Long-Term Fixed Income (13.8%) | | Value | |
| Utilities (0.4%) - continued | | | | |
| | | | NRG Energy, Inc. | | | | |
| | $320,000 | | | 6.625%, 3/15/2023g | | | $329,600 | |
| | | | ONEOK Partners, LP | | | | |
| | 83,000 | | | 2.000%, 10/1/2017 | | | 84,697 | |
| | 106,000 | | | 8.625%, 3/1/2019 | | | 140,919 | |
| | | | Pacific Gas & Electric Company | | | | |
| | 245,000 | | | 5.625%, 11/30/2017 | | | 298,501 | |
| | | | PPL Capital Funding, Inc. | | | | |
| | 81,000 | | | 3.500%, 12/1/2022 | | | 83,172 | |
| | | | Sempra Energy | | | | |
| | 245,000 | | | 6.150%, 6/15/2018 | | | 302,147 | |
| | | | Williams Partners, LP | | | | |
| | 83,000 | | | 7.250%, 2/1/2017 | | | 102,085 | |
| | 83,000 | | | 5.250%, 3/15/2020 | | | 97,732 | |
| | | | | |
| | | | Total | | | 5,971,857 | |
| | | | | |
| | | | | | | | |
| | | | | |
| | | | Total Long-Term Fixed Income (cost $186,671,910) | | | 191,105,296 | |
| | | | | |
| | |
| Shares | | | Common Stock (13.7%) | | Value | |
| Consumer Discretionary (2.0%) | | | | |
| | 4,550 | | | Amazon.com, Inc.d | | | 1,059,331 | |
| | 2,400 | | | AutoZone, Inc.d | | | 900,000 | |
| | 9,020 | | | CBS Corporation | | | 292,248 | |
| | 8,200 | | | Charter Communications, Inc.d | | | 634,762 | |
| | 7,800 | | | Cheesecake Factory, Inc. | | | 257,868 | |
| | 11,800 | | | Children’s Place Retail Stores, Inc.d | | | 689,474 | |
| | 113,000 | | | Comcast Corporation | | | 4,238,630 | |
| | 23,032 | | | Delphi Automotive plcd | | | 724,126 | |
| | 11,400 | | | DISH Network Corporation | | | 406,182 | |
| | 10,360 | | | Dollar Tree, Inc.d | | | 413,053 | |
| | 26,300 | | | Expedia, Inc. | | | 1,555,645 | |
| | 22,336 | | | Foot Locker, Inc. | | | 748,256 | |
| | 22,000 | | | GNC Holdings, Inc. | | | 850,740 | |
| | 4,380 | | | Harley-Davidson, Inc. | | | 204,809 | |
| | 11,400 | | | Home Depot, Inc. | | | 699,732 | |
| | 72,610 | | | Las Vegas Sands Corporation | | | 3,372,008 | |
| | 13,918 | | | Life Time Fitness, Inc.d | | | 624,779 | |
| | 39,440 | | | Lowe’s Companies, Inc. | | | 1,277,067 | |
| | 18,100 | | | Meredith Corporation | | | 605,807 | |
| | 31,840 | | | News Corporation | | | 775,622 | |
| | 12,100 | | | NIKE, Inc. | | | 1,105,698 | |
| | 10,100 | | | Omnicom Group, Inc. | | | 483,891 | |
| | 14,300 | | | O’Reilly Automotive, Inc.d | | | 1,225,224 | |
| | 1,610 | | | Panera Bread Companyd | | | 271,511 | |
| | 8,400 | | | Penn National Gaming, Inc.d | | | 339,612 | |
| | 4,000 | | | PetSmart, Inc. | | | 265,560 | |
| | 42,351 | | | Pier 1 Imports, Inc. | | | 863,961 | |
| | 23,300 | | | Sally Beauty Holdings, Inc.d | | | 561,064 | |
| | 11,500 | | | Tempur-Pedic International, Inc.d | | | 304,060 | |
| | 9,110 | | | Time Warner Cable, Inc. | | | 902,892 | |
| | 12,700 | | | Toll Brothers, Inc.d | | | 419,227 | |
| | 15,031 | | | WMS Industries, Inc.d | | | 246,959 | |
| | | | | |
| | | | Total | | | 27,319,798 | |
| | | | | |
| |
| Consumer Staples (1.0%) | | | | |
| | 9,774 | | | Anheuser-Busch InBev NV ADR | | | 819,061 | |
| | 13,765 | | | Annie’s, Inc.d | | | 543,718 | |
| | 7,560 | | | British American Tobacco plc ADR | | | 751,162 | |
| | 16,660 | | | CVS Caremark Corporation | | | 773,024 | |
| | 4,920 | | | Diageo plc ADR | | | 562,061 | |
| | 19,653 | | | Ingredion, Inc. | | | 1,207,873 | |
| | 5,760 | | | Kimberly-Clark Corporation | | | 480,672 | |
| | 8,412 | | | Kraft Foods Group, Inc.d | | | 382,578 | |
| | 118,737 | | | Mondelez International, Inc. | | | 3,151,280 | |
| | 12,700 | | | Nestle SA | | | 806,301 | |
| | 35,906 | | | Philip Morris International, Inc. | | | 3,179,835 | |
| | 8,050 | | | TreeHouse Foods, Inc.d | | | 431,077 | |
| | 13,090 | | | Unilever NV ADR | | | 480,272 | |
| | | | | |
| | | | Total | | | 13,568,914 | |
| | | | | |
| |
| Energy (1.1%) | | | | |
| | 45,376 | | | Alpha Natural Resources, Inc.d | | | 388,872 | |
| | 28,080 | | | BP plc ADR | | | 1,204,351 | |
| | 7,520 | | | Chevron Corporation | | | 828,779 | |
| | 23,600 | | | Consol Energy, Inc. | | | 829,776 | |
| | 6,900 | | | Ensco plc | | | 398,958 | |
| | 14,139 | | | EOG Resources, Inc. | | | 1,647,052 | |
| | 13,390 | | | EQT Corporation | | | 811,836 | |
| | 21,000 | | | Helix Energy Solutions Group, Inc.d | | | 363,090 | |
| | 58,430 | | | Marathon Oil Corporation | | | 1,756,406 | |
| | 50,900 | | | Marathon Petroleum Corporation | | | 2,795,937 | |
| | 3,045 | | | Oasis Petroleum, Inc.d | | | 89,432 | |
| | 36,451 | | | Petroleum Geo-Services ASA | | | 629,856 | |
| | 15,680 | | | Schlumberger, Ltd. | | | 1,090,231 | |
| | 11,300 | | | Southwestern Energy Companyd | | | 392,110 | |
| | 24,923 | | | Swift Energy Companyd | | | 416,463 | |
| | 108,500 | | | Weatherford International, Ltd.d | | | 1,226,050 | |
| | | | | |
| | | | Total | | | 14,869,199 | |
| | | | | |
| |
| Financials (2.0%) | | | | |
| | 9,450 | | | ACE, Ltd. | | | 743,242 | |
| | 6,531 | | | Affiliated Managers Group, Inc.d | | | 826,171 | |
| | 2,000 | | | Allied World Assurance Company Holdings AG | | | 160,600 | |
| | 11,460 | | | Allstate Corporation | | | 458,171 | |
| | 7,000 | | | American Assets Trust, Inc. | | | 190,190 | |
| | 4,400 | | | American Campus Communities, Inc. | | | 199,364 | |
| | 14,000 | | | Ameriprise Financial, Inc. | | | 817,180 | |
| | 5,200 | | | Aspen Insurance Holdings, Ltd. | | | 168,220 | |
| | 8,400 | | | Axis Capital Holdings, Ltd. | | | 304,248 | |
| | 91,980 | | | Bank of America Corporation | | | 857,254 | |
| | 10,200 | | | BioMed Realty Trust, Inc. | | | 195,024 | |
| | 6,430 | | | Capital One Financial Corporation | | | 386,893 | |
| | 22,200 | | | CBL & Associates Properties, Inc. | | | 496,614 | |
| | 73,240 | | | Citigroup, Inc. | | | 2,738,444 | |
| | 13,500 | | | CME Group, Inc. | | | 755,055 | |
| | 29,200 | | | DCT Industrial Trust, Inc. | | | 188,340 | |
| | 8,300 | | | Douglas Emmett, Inc. | | | 194,635 | |
| | 25,719 | | | Duke Realty Corporation | | | 372,411 | |
| | 9,300 | | | Endurance Specialty Holdings, Ltd. | | | 377,115 | |
| | 2,800 | | | Equity Lifestyle Properties, Inc. | | | 188,524 | |
| | 5,700 | | | Extra Space Storage, Inc. | | | 196,593 | |
| | 3,840 | | | Goldman Sachs Group, Inc. | | | 469,978 | |
| | 27,221 | | | HCC Insurance Holdings, Inc. | | | 970,156 | |
| | 5,800 | | | Highwoods Properties, Inc. | | | 187,050 | |
| | 32,257 | | | Host Hotels & Resorts, Inc. | | | 466,436 | |
| | 63,000 | | | Huntington Bancshares, Inc. | | | 402,570 | |
| | 19,700 | | | Invesco, Ltd. | | | 479,104 | |
The accompanying Notes to Financial Statements are an integral part of this schedule.
83
Moderate Allocation Fund
Schedule of Investments as of October 31, 2012
| | | | | | | | |
| Shares | | | Common Stock (13.7%) | | Value | |
| Financials (2.0%) - continued | | | | |
| | 4,000 | | | iShares Russell 2000 Index Fund | | | $324,960 | |
| | 71,709 | | | J.P. Morgan Chase & Company | | | 2,988,831 | |
| | 42,750 | | | KKR & Company, LP | | | 643,388 | |
| | 11,491 | | | Lazard, Ltd. | | | 338,525 | |
| | 4,100 | | | M&T Bank Corporation | | | 426,810 | |
| | 36,350 | | | MetLife, Inc. | | | 1,290,061 | |
| | 16,900 | | | NASDAQ OMX Group, Inc. | | | 402,389 | |
| | 9,200 | | | Northern Trust Corporation | | | 439,576 | |
| | 31,100 | | | Och-Ziff Capital Management Group, LLC | | | 311,311 | |
| | 8,100 | | | Pebblebrook Hotel Trust | | | 171,882 | |
| | 42,739 | | | Popular, Inc.d | | | 826,145 | |
| | 1,800 | | | ProAssurance Corporation | | | 160,920 | |
| | 23,050 | | | State Street Corporation | | | 1,027,338 | |
| | 21,870 | | | SVB Financial Groupd | | | 1,237,623 | |
| | 2,481 | | | Taubman Centers, Inc. | | | 194,883 | |
| | 8,000 | | | Tower Group, Inc. | | | 144,160 | |
| | 11,582 | | | W.R. Berkley Corporation | | | 450,424 | |
| | 50,730 | | | Wells Fargo & Company | | | 1,709,094 | |
| | 60,216 | | | Zions Bancorporation | | | 1,292,838 | |
| | | | | |
| | | | Total | | | 28,170,740 | |
| | | | | |
| |
| Health Care (2.1%) | | | | |
| | 22,300 | | | Abbott Laboratories | | | 1,461,096 | |
| | 3,300 | | | Alexion Pharmaceuticals, Inc.d | | | 298,254 | |
| | 17,800 | | | Align Technology, Inc.d | | | 473,124 | |
| | 27,740 | | | Baxter International, Inc. | | | 1,737,356 | |
| | 8,300 | | | Biogen Idec, Inc.d | | | 1,147,226 | |
| | 81,800 | | | Bristol-Myers Squibb Company | | | 2,719,850 | |
| | 3,767 | | | C.R. Bard, Inc. | | | 362,348 | |
| | 25,340 | | | Covidien plc | | | 1,392,433 | |
| | 32,800 | | | Endo Pharmaceutical Holdings, Inc.d | | | 940,048 | |
| | 7,029 | | | HeartWare International, Inc.d | | | 590,295 | |
| | 27,100 | | | Humana, Inc. | | | 2,012,717 | |
| | 7,400 | | | Illumina, Inc.d | | | 351,574 | |
| | 11,600 | | | Medicines Companyd | | | 254,272 | |
| | 71,350 | | | Merck & Company, Inc. | | | 3,255,701 | |
| | 124,883 | | | Pfizer, Inc. | | | 3,105,840 | |
| | 22,410 | | | Sanofi ADR | | | 982,679 | |
| | 9,700 | | | Shire Pharmaceuticals Group plc ADR | | | 818,583 | |
| | 14,300 | | | Thoratec Corporationd | | | 510,510 | |
| | 12,220 | | | United Therapeutics Corporationd | | | 558,087 | |
| | 74,551 | | | UnitedHealth Group, Inc. | | | 4,174,856 | |
| | 39,500 | | | VIVUS, Inc.d | | | 588,550 | |
| | 3,700 | | | Waters Corporationd | | | 302,697 | |
| | 6,860 | | | Zimmer Holdings, Inc. | | | 440,481 | |
| | | | | |
| | | | Total | | | 28,478,577 | |
| | | | | |
| |
| Industrials (1.8%) | | | | |
| | 14,800 | | | 3M Company | | | 1,296,480 | |
| | 24,700 | | | Actuant Corporation | | | 697,528 | |
| | 14,300 | | | ADT Corporationd | | | 593,593 | |
| | 13,809 | | | CSX Corporation | | | 282,670 | |
| | 24,472 | | | EMCOR Group, Inc. | | | 787,019 | |
| | 4,770 | | | FedEx Corporation | | | 438,792 | |
| | 2,400 | | | Flowserve Corporation | | | 325,176 | |
| | 16,800 | | | GATX Corporation | | | 696,528 | |
| | 15,621 | | | General Electric Company | | | 328,978 | |
| | 24,271 | | | HNI Corporation | | | 667,938 | |
| | 27,786 | | | Honeywell International, Inc. | | | 1,701,615 | |
| | 38,270 | | | Jacobs Engineering Group, Inc.d | | | 1,476,839 | |
| | 13,500 | | | Landstar System, Inc. | | | 683,775 | |
| | 9,300 | | | Lockheed Martin Corporation | | | 871,131 | |
| | 83,592 | | | Manitowoc Company, Inc. | | | 1,191,186 | |
| | 23,300 | | | Manpower, Inc. | | | 884,002 | |
| | 28,800 | | | McDermott International, Inc.d | | | 308,448 | |
| | 18,216 | | | Oshkosh Corporationd | | | 546,116 | |
| | 18,109 | | | Parker Hannifin Corporation | | | 1,424,454 | |
| | 3,311 | | | Pentair, Ltd. | | | 139,857 | |
| | 110,400 | | | Pitney Bowes, Inc. | | | 1,585,344 | |
| | 33,500 | | | Southwest Airlines Company | | | 295,470 | |
| | 4,620 | | | SPX Corporation | | | 316,886 | |
| | 38,700 | | | Tyco International, Ltd. | | | 1,039,869 | |
| | 31,600 | | | United Parcel Service, Inc. | | | 2,314,700 | |
| | 41,460 | | | United Technologies Corporation | | | 3,240,514 | |
| | 21,300 | | | Woodward, Inc. | | | 713,550 | |
| | | | | |
| | | | Total | | | 24,848,458 | |
| | | | | |
| |
| Information Technology (2.7%) | | | | |
| | 11,200 | | | Akamai Technologies, Inc.d | | | 425,488 | |
| | 6,800 | | | Alliance Data Systems Corporationd | | | 972,740 | |
| | 10,402 | | | Apple, Inc.j | | | 6,190,230 | |
| | 27,700 | | | Aruba Networks, Inc.d | | | 503,309 | |
| | 120,600 | | | Atmel Corporationd | | | 562,599 | |
| | 20,000 | | | Cavium, Inc.d | | | 663,600 | |
| | 11,800 | | | Citrix Systems, Inc.d | | | 729,358 | |
| | 10,978 | | | Cognizant Technology Solutions Corporationd | | | 731,684 | |
| | 23,720 | | | CoreLogic, Inc.d | | | 564,536 | |
| | 27,399 | | | eBay, Inc.d | | | 1,323,098 | |
| | 2,344 | | | Google, Inc.d | | | 1,593,381 | |
| | 20,800 | | | Informatica Corporationd | | | 564,512 | |
| | 74,100 | | | Intel Corporation | | | 1,602,412 | |
| | 12,500 | | | International Business Machines Corporation | | | 2,431,625 | |
| | 9,921 | | | Itron, Inc.d | | | 407,356 | |
| | 18,614 | | | Juniper Networks, Inc.d | | | 308,434 | |
| | 2,700 | | | MasterCard, Inc. | | | 1,244,511 | |
| | 145,720 | | | Microsoft Corporationj | | | 4,158,120 | |
| | 46,990 | | | NetApp, Inc.d | | | 1,264,031 | |
| | 36,506 | | | NVIDIA Corporationd | | | 436,977 | |
| | 93,330 | | | Oracle Corporation | | | 2,897,896 | |
| | 17,624 | | | Plantronics, Inc. | | | 571,723 | |
| | 15,700 | | | QUALCOMM, Inc. | | | 919,627 | |
| | 89,849 | | | Teradyne, Inc.d | | | 1,313,592 | |
| | 57,540 | | | Texas Instruments, Inc. | | | 1,616,299 | |
| | 21,189 | | | TIBCO Software, Inc.d | | | 534,175 | |
| | 22,500 | | | VeriFone Systems, Inc.d | | | 666,900 | |
| | 65,600 | | | Vishay Intertechnology, Inc.d | | | 543,168 | |
| | 116 | | | Workday, Inc.d | | | 5,626 | |
| | 37,260 | | | Xilinx, Inc. | | | 1,220,638 | |
| | 18,800 | | | Yahoo!, Inc.d | | | 316,028 | |
| | | | | |
| | | | Total | | | 37,283,673 | |
| | | | | |
| |
| Materials (0.5%) | | | | |
| | 77,400 | | | AK Steel Holding Corporation | | | 390,096 | |
| | 11,800 | | | Buckeye Technologies, Inc. | | | 309,160 | |
| | 12,100 | | | CF Industries Holdings, Inc. | | | 2,482,799 | |
| | 7,900 | | | Eagle Materials, Inc. | | | 418,463 | |
| | 21,578 | | | Freeport-McMoRan Copper & Gold, Inc. | | | 838,953 | |
| | 12,200 | | | H.B. Fuller Company | | | 370,880 | |
| | 9,423 | | | PPG Industries, Inc. | | | 1,103,245 | |
| | 6,385 | | | Sigma-Aldrich Corporation | | | 447,844 | |
The accompanying Notes to Financial Statements are an integral part of this schedule.
84
Moderate Allocation Fund
Schedule of Investments as of October 31, 2012
| | | | | | | | |
| Shares | | | Common Stock (13.7%) | | Value | |
| Materials (0.5%) - continued | | | | |
| | 8,968 | | | Silgan Holdings, Inc. | | | $388,404 | |
| | 31,159 | | | Steel Dynamics, Inc. | | | 394,161 | |
| | 22,800 | | | SunCoke Energy, Inc.d | | | 366,396 | |
| | 10,390 | | | United States Steel Corporation | | | 211,852 | |
| | | | | |
| | | | Total | | | 7,722,253 | |
| | | | | |
| |
| Telecommunications Services (0.1%) | | | | |
| | 18,032 | | | Verizon Communications, Inc. | | | 804,948 | |
| | 60,200 | | | Windstream Corporation | | | 574,308 | |
| | | | | |
| | | | Total | | | 1,379,256 | |
| | | | | |
| |
| Utilities (0.4%) | | | | |
| | 20,700 | | | CMS Energy Corporation | | | 503,424 | |
| | 34,250 | | | NiSource, Inc. | | | 872,347 | |
| | 27,718 | | | NV Energy, Inc. | | | 526,919 | |
| | 31,890 | | | PG&E Corporation | | | 1,355,963 | |
| | 30,000 | | | PNM Resources, Inc. | | | 664,800 | |
| | 11,600 | | | Public Service Enterprise Group, Inc. | | | 371,664 | |
| | 24,100 | | | Southern Company | | | 1,128,844 | |
| | 14,283 | | | Southwest Gas Corporation | | | 620,882 | |
| | | | | |
| | | | Total | | | 6,044,843 | |
| | | | | |
| | | | | | | | |
| | | | | |
| | | | Total Common Stock (cost $173,039,610) | | | 189,685,711 | |
| | | | | |
| | |
| Shares | | | Preferred Stock (<0.1%) | | Value | |
| Financials (<0.1%) | | | | |
| | 4,700 | | | U.S. Bancorp, 6.000%h | | | 134,890 | |
| | | | | |
| | | | Total | | | 134,890 | |
| | | | | |
| | | | | | | | |
| | | | | |
| | | | Total Preferred Stock (cost $118,655) | | | 134,890 | |
| | | | | |
| | |
| Shares | | | Collateral Held for Securities Loaned (0.1%) | | Value | |
| | 1,032,781 | | | Thrivent Financial Securities Lending Trust | | | 1,032,781 | |
| | | | | |
| | | | Total Collateral Held for Securities Loaned (cost $1,032,781) | | | 1,032,781 | |
| | | | | |
| | |
Shares or
Principal
Amount | | | Short-Term Investments (9.8%) | | Value | |
| | | | Federal Home Loan Bank Discount Notes | | | | |
| | 3,000,000 | | | 0.100%, 11/23/2012i | | | 2,999,816 | |
| | | | Federal Home Loan Mortgage Corporation Discount Notes | | | | |
| | 4,400,000 | | | 0.160%, 12/17/2012i,j | | | 4,399,100 | |
| | | | Federal National Mortgage Association Discount Notes | | | | |
| | 5,000,000 | | | 0.120%, 11/21/2012i | | | 4,999,667 | |
| | 122,091,058 | | | Thrivent Financial Securities Lending Trust | | | 122,091,058 | |
| | | | U.S. Treasury Bills | | | | |
| | 1,400,000 | | | 0.125%, 1/17/2013i,j | | | 1,399,626 | |
| | | | | |
| | | | Total Short-Term Investments (at amortized cost) | | | 135,889,267 | |
| | | | | |
| | | | Total Investments (cost $1,390,815,537) 106.2% | | | $1,468,754,693 | |
| | | | | |
| | | | Other Assets and Liabilities, Net (6.2%) | | | (86,258,753 | ) |
| | | | | |
| | | | Total Net Assets 100.0% | | | $1,382,495,940 | |
| | | | | |
a | The stated interest rate represents the weighted average of all contracts within the bank loan facility. |
b | All or a portion of the loan is unfunded. |
c | Denotes investments purchased on a when-issued or delayed delivery basis. |
d | Non-income producing security. |
e | Denotes variable rate securities. Variable rate securities are securities whose yields vary with a designated market index or market rate. The rate shown is as of October 31, 2012. |
f | All or a portion of the security is on loan. |
g | Denotes securities sold under Rule 144A of the Securities Act of 1933, which exempts them from registration. These securities have been deemed liquid and may be resold to other dealers in the program or to other qualified institutional buyers. As of October 31, 2012, the value of these investments was $12,996,178 or 0.9% of total net assets. |
h | Denotes perpetual securities. Perpetual securities pay an indefinite stream of interest, but may be called by the issuer at an earlier date. |
i | The interest rate shown reflects the yield, coupon rate or the discount rate at the date of purchase. |
j | At October 31, 2012, $7,535,226 of investments were held on deposit with the counterparty and pledged as the initial margin deposit for open futures contracts. |
Definitions:
| | |
| ADR | | - American Depositary Receipt, which are certificates for an underlying foreign security’s shares held by an issuing U.S. depository bank. |
Unrealized Appreciation (Depreciation)
Gross unrealized appreciation and depreciation of investments, based on cost for federal income tax purposes, were as follows:
| | | | |
Gross unrealized appreciation | | $ | 89,408,364 | |
Gross unrealized depreciation | | | (23,265,320 | ) |
| | | | |
Net unrealized appreciation (depreciation) | | $ | 66,143,044 | |
| |
Cost for federal income tax purposes | | $ | 1,402,611,649 | |
The accompanying Notes to Financial Statements are an integral part of this schedule.
85
Moderate Allocation Fund
Schedule of Investments as of October 31, 2012
Fair Valuation Measurements
The following table is a summary of the inputs used, as of October 31, 2012, in valuing Moderate Allocation Fund’s assets carried at fair value.
| | | | | | | | | | | | | | | | |
Investments in Securities | | Total | | | Level 1 | | | Level 2 | | | Level 3 | |
| | | | |
Bank Loans | | | | | | | | | | | | | | | | |
Basic Materials | | | 3,692,810 | | | | – | | | | 3,692,810 | | | | – | |
Capital Goods | | | 1,189,973 | | | | – | | | | 1,189,973 | | | | – | |
Communications Services | | | 8,948,587 | | | | – | | | | 8,948,587 | | | | – | |
Consumer Cyclical | | | 2,892,077 | | | | – | | | | 2,892,077 | | | | – | |
Consumer Non-Cyclical | | | 4,956,197 | | | | – | | | | 4,956,197 | | | | – | |
Energy | | | 789,354 | | | | – | | | | 789,354 | | | | – | |
Financials | | | 1,336,146 | | | | – | | | | 1,336,146 | | | | – | |
Technology | | | 2,731,532 | | | | – | | | | 2,731,532 | | | | – | |
Transportation | | | 521,833 | | | | – | | | | 521,833 | | | | – | |
Utilities | | | 1,539,759 | | | | – | | | | 1,539,759 | | | | – | |
| | | | |
Mutual Funds | | | | | | | | | | | | | | | | |
Equity Mutual Funds | | | 527,293,756 | | | | 527,293,756 | | | | – | | | | – | |
Fixed Income Mutual Funds | | | 395,014,724 | | | | 395,014,724 | | | | – | | | | – | |
| | | | |
Long-Term Fixed Income | | | | | | | | | | | | | | | | |
Asset-Backed Securities | | | 1,967,062 | | | | – | | | | 1,967,062 | | | | – | |
Basic Materials | | | 2,743,304 | | | | – | | | | 2,743,304 | | | | – | |
Capital Goods | | | 3,235,832 | | | | – | | | | 3,235,832 | | | | – | |
Collateralized Mortgage Obligations | | | 13,621,299 | | | | – | | | | 13,621,299 | | | | – | |
Commercial Mortgage-Backed Securities | | | 18,016,480 | | | | – | | | | 18,016,480 | | | | – | |
Communications Services | | | 9,324,873 | | | | – | | | | 9,324,873 | | | | – | |
Consumer Cyclical | | | 4,404,480 | | | | – | | | | 4,404,480 | | | | – | |
Consumer Non-Cyclical | | | 8,721,286 | | | | – | | | | 8,721,286 | | | | – | |
Energy | | | 4,952,614 | | | | – | | | | 4,952,614 | | | | – | |
Financials | | | 19,481,128 | | | | – | | | | 19,481,128 | | | | – | |
Foreign Government | | | 243,261 | | | | – | | | | 243,261 | | | | – | |
Mortgage-Backed Securities | | | 79,856,064 | | | | – | | | | 79,856,064 | | | | – | |
Technology | | | 2,951,384 | | | | – | | | | 2,951,384 | | | | – | |
Transportation | | | 3,001,397 | | | | – | | | | 3,001,397 | | | | – | |
U.S. Government and Agencies | | | 12,612,975 | | | | – | | | | 12,612,975 | | | | – | |
Utilities | | | 5,971,857 | | | | – | | | | 5,971,857 | | | | – | |
| | | | |
Common Stock | | | | | | | | | | | | | | | | |
Consumer Discretionary | | | 27,319,798 | | | | 27,319,798 | | | | – | | | | – | |
Consumer Staples | | | 13,568,914 | | | | 12,762,613 | | | | 806,301 | | | | – | |
Energy | | | 14,869,199 | | | | 14,239,343 | | | | 629,856 | | | | – | |
Financials | | | 28,170,740 | | | | 28,170,740 | | | | – | | | | – | |
Health Care | | | 28,478,577 | | | | 28,478,577 | | | | – | | | | – | |
Industrials | | | 24,848,458 | | | | 24,848,458 | | | | – | | | | – | |
Information Technology | | | 37,283,673 | | | | 37,283,673 | | | | – | | | | – | |
Materials | | | 7,722,253 | | | | 7,722,253 | | | | – | | | | – | |
Telecommunications Services | | | 1,379,256 | | | | 1,379,256 | | | | – | | | | – | |
Utilities | | | 6,044,843 | | | | 6,044,843 | | | | – | | | | – | |
| | | | |
Preferred Stock | | | | | | | | | | | | | | | | |
Financials | | | 134,890 | | | | 134,890 | | | | – | | | | – | |
Collateral Held for Securities Loaned | | | 1,032,781 | | | | 1,032,781 | | | | – | | | | – | |
Short-Term Investments | | | 135,889,267 | | | | 122,091,058 | | | | 13,798,209 | | | | – | |
| |
Total | | | $1,468,754,693 | | | | $1,233,816,763 | | | | $234,937,930 | | | | $– | |
| |
The accompanying Notes to Financial Statements are an integral part of this schedule.
86
Moderate Allocation Fund
Schedule of Investments as of October 31, 2012
| | | | | | | | | | | | | | | | |
Other Financial Instruments | | Total | | | Level 1 | | | Level 2 | | | Level 3 | |
| | | | |
Asset Derivatives | | | | | | | | | | | | | | | | |
Futures Contracts | | | 2,919,642 | | | | 2,919,642 | | | | – | | | | – | |
| |
Total Asset Derivatives | | | $2,919,642 | | | | $2,919,642 | | | | $– | | | | $– | |
| |
| | | | |
Liability Derivatives | | | | | | | | | | | | | | | | |
Futures Contracts | | | 3,303,873 | | | | 3,303,873 | | | | – | | | | – | |
Foreign Currency Forward Contracts | | | 39 | | | | – | | | | 39 | | | | – | |
| |
Total Liability Derivatives | | | $3,303,912 | | | | $3,303,873 | | | | $39 | | | | $– | |
| |
There were no significant transfers between Levels during the period ended October 31, 2012. Transfers between Levels are identified as of the end of the period.
| | | | | | | | | | | | | | | | | | | | |
Futures Contracts | | Number of
Contracts
Long/(Short) | | | Expiration
Date | | | Notional
Principal
Amount | | | Value | | | Unrealized
Gain/(Loss) | |
2-Yr. U.S. Treasury Bond Futures | | | (100 | ) | | | December 2012 | | | | ($22,041,883 | ) | | | ($22,032,813 | ) | | | $9,070 | |
5-Yr. U.S. Treasury Bond Futures | | | (250 | ) | | | December 2012 | | | | (31,104,708 | ) | | | (31,062,501 | ) | | | 42,207 | |
10-Yr. U.S. Treasury Bond Futures | | | 280 | | | | December 2012 | | | | 37,199,955 | | | | 37,248,750 | | | | 48,795 | |
20-Yr U.S. Treasury Bond Futures | | | 215 | | | | December 2012 | | | | 32,196,906 | | | | 32,102,188 | | | | (94,718 | ) |
Eurex EURO STOXX 50 Futures | | | 395 | | | | December 2012 | | | | 13,182,550 | | | | 12,819,888 | | | | (362,662 | ) |
Mini MSCI EAFE Index Futures | | | 99 | | | | December 2012 | | | | 7,710,063 | | | | 7,516,080 | | | | (193,983 | ) |
Russell 2000 Index Mini-Futures | | | (188 | ) | | | December 2012 | | | | (16,192,948 | ) | | | (15,346,440 | ) | | | 846,508 | |
S&P 400 Index Mini Futures | | | (425 | ) | | | December 2012 | | | | (43,542,313 | ) | | | (41,569,251 | ) | | | 1,973,062 | |
S&P 500 Index Futures | | | 203 | | | | December 2012 | | | | 74,047,610 | | | | 71,395,100 | | | | (2,652,510 | ) |
Total Futures Contracts | | | | | | | | | | | | | | | | | | | ($384,231 | ) |
| | | | | | | | | | | | | | | | | | | | | | |
Foreign Currency Forward Contracts | | Counterparty | | Contracts to
Deliver/Receive | | | Settlement
Date | | | Value on
Settlement Date | | | Value | | | Unrealized
Gain/(Loss) | |
| | | | | | |
Sales | | | | | | | | | | | | | | | | | | | | | | |
Euro | | SSB | | | 71,100 | | | | 11/1/2012 | | | | $92,117 | | | | $92,156 | | | | ($39 | ) |
Total Sales | | | | | | | | | | | | | $92,117 | | | | $92,156 | | | | ($39 | ) |
| | | |
Net Unrealized Gain/(Loss) on Foreign Currency Forward Contracts | | | | | | | | | | | | ($39 | ) |
| | | | | | |
Counterparty |
SSB | | | - | | | State Street Bank |
The accompanying Notes to Financial Statements are an integral part of this schedule.
87
Moderate Allocation Fund
Schedule of Investments as of October 31, 2012
The following table summarizes the fair value and Statement of Assets and Liabilities location, as of October 31, 2012, for Moderate Allocation Fund’s investments in financial derivative instruments by primary risk exposure as discussed under item (2) Significant Accounting Policies of the Notes to Financial Statements.
| | | | | | |
Derivatives by risk category | | Statement of Assets and Liabilities Location | | Fair Value | |
| | |
Asset Derivatives | | | | | | |
| | |
Equity Contracts | | | | | | |
Futures* | | Net Assets - Net unrealized appreciation/(depreciation) on Futures contracts | | | 2,819,570 | |
Total Equity Contracts | | | | | 2,819,570 | |
| | |
Interest Rate Contracts | | | | | | |
Futures* | | Net Assets - Net unrealized appreciation/(depreciation) on Futures contracts | | | 100,072 | |
Total Interest Rate Contracts | | | | | 100,072 | |
| |
Total Asset Derivatives | | | | | $2,919,642 | |
| |
| | |
Liability Derivatives | | | | | | |
| | |
Equity Contracts | | | | | | |
Futures* | | Net Assets - Net unrealized appreciation/(depreciation) on Futures contracts | | | 3,209,155 | |
Total Equity Contracts | | | | | 3,209,155 | |
| | |
Interest Rate Contracts | | | | | | |
Futures* | | Net Assets - Net unrealized appreciation/(depreciation) on Futures contracts | | | 94,718 | |
Total Interest Rate Contracts | | | | | 94,718 | |
| | |
Foreign Exchange Contracts | | | | | | |
Forward Contracts | | Receivable/Payable for forward contracts, Net Assets - Net unrealized appreciation/(depreciation) on Foreign currency forward contracts | | | 39 | |
Total Foreign Exchange Contracts | | | | | 39 | |
| |
Total Liability Derivatives | | | | | $3,303,912 | |
| |
* | Includes cumulative appreciation/depreciation of futures contracts as reported in the Schedule of Investments. Only current day’s variation margin is reported within the Statement of Assets and Liabilities. |
The following table summarizes the net realized gains/(losses) and Statement of Operations location, for the period ended October 31, 2012, for Moderate Allocation Fund’s investments in financial derivative instruments by primary risk exposure.
| | | | | | |
Derivatives by risk category | | Statement of Operations Location | | Realized Gains/(Losses)
recognized in Income | |
| | |
Interest Rate Contracts | | | | | | |
Futures | | Net realized gains/(losses) on Futures contracts | | | 2,471,086 | |
| | |
Total Interest Rate Contracts | | | | | 2,471,086 | |
| | |
Equity Contracts | | | | | | |
Futures | | Net realized gains/(losses) on Futures contracts | | | 11,582,153 | |
| | |
Total Equity Contracts | | | | | 11,582,153 | |
| | |
Foreign Exchange Contracts | | | | | | |
Forward Contracts | | Net realized gains/(losses) on Foreign currency transactions | | | (31,545 | ) |
| | |
Total Foreign Exchange Contracts | | | | | (31,545 | ) |
| | |
Credit Contracts | | | | | | |
Credit Default Swaps | | Net realized gains/(losses) on Swap agreements | | | 1,098,450 | |
| | |
Total Credit Contracts | | | | | 1,098,450 | |
| |
Total | | | | | $15,120,144 | |
| |
The accompanying Notes to Financial Statements are an integral part of this schedule.
88
Moderate Allocation Fund
Schedule of Investments as of October 31, 2012
The following table summarizes the change in net unrealized appreciation/(depreciation) and Statement of Operations location, for the period ended October 31, 2012, for Moderate Allocation Fund’s investments in financial derivative instruments by primary risk exposure.
| | | | | | |
Derivatives by risk category | | Statement of Operations Location | | Change in unrealized appreciation/(depreciation) recognized in Income | |
| | |
Equity Contracts | | | | | | |
Futures | | Change in net unrealized appreciation/(depreciation) on Futures contracts | | | (7,874,150 | ) |
Total Equity Contracts | | | | | (7,874,150 | ) |
| | |
Interest Rate Contracts | | | | | | |
Futures | | Change in net unrealized appreciation/(depreciation) on Futures contracts | | | 30,339 | |
Total Interest Rate Contracts | | | | | 30,339 | |
| | |
Foreign Exchange Contracts | | | | | | |
Forward Contracts | | Change in net unrealized appreciation/(depreciation) on Foreign currency forward contracts | | | (39 | ) |
Total Foreign Exchange Contracts | | | | | (39 | ) |
| |
Total | | | | | ($7,843,850) | |
| |
The following table presents Moderate Allocation Fund’s average volume of derivative activity during the period ended October 31, 2012.
| | | | | | | | | | | | |
Derivative Risk Category | | Futures (Notional*) | | Futures (Percentage of Average Net Assets) | | Forwards (Notional*) | | Forwards (Percentage of Average Net Assets) | | Swaps (Notional*) | | Swaps (Percentage of Average Net Assets) |
Equity Contracts | | $143,527,493 | | 10.9% | | N/A | | N/A | | N/A | | NA |
Interest Rate Contracts | | 79,407,579 | | 6.0 | | N/A | | N/A | | N/A | | NA |
Foreign Exchange Contracts | | N/A | | N/A | | $112,604 | | <0.1% | | N/A | | NA |
Credit Contracts | | N/A | | N/A | | N/A | | N/A | | $5,577,246 | | 0.4% |
* | Notional amount represents long or short, or both, derivative positions held by the Fund. |
The accompanying Notes to Financial Statements are an integral part of this schedule.
89
Moderate Allocation Fund
Schedule of Investments as of October 31, 2012
Investment in Affiliates
Affiliated issuers, as defined under the Investment Company Act of 1940, include those in which the Fund’s holdings of an issuer represent 5% or more of the outstanding voting securities of an issuer, or any affiliated mutual fund.
A summary of transactions for the fiscal year to date, in Moderate Allocation Fund, is as follows:
| | | | | | | | | | | | | | | | | | | | | | | | |
Fund | | Value October 31, 2011 | | | Gross Purchases | | | Gross Sales | | | Shares Held at October 31, 2012 | | | Value October 31, 2012 | | | Income Earned November 1, 2011 - October 31, 2012 | |
Natural Resources | | | $40,454,277 | | | | $58,416 | | | | $12,000,000 | | | | 2,739,166 | | | | $24,652,493 | | | | $58,416 | |
Partner Small Cap Growth | | | 22,196,780 | | | | 3,700,000 | | | | – | | | | 2,161,677 | | | | 28,058,568 | | | | – | |
Partner Small Cap Value | | | 23,625,437 | | | | 405,357 | | | | – | | | | 1,582,271 | | | | 26,582,148 | | | | 156,706 | |
Small Cap Stock | | | 13,203,459 | | | | – | | | | – | | | | 882,584 | | | | 14,200,780 | | | | – | |
Mid Cap Growth | | | 14,575,651 | | | | 109,019 | | | | – | | | | 741,659 | | | | 15,337,507 | | | | – | |
Partner Mid Cap Value | | | 25,350,505 | | | | 204,268 | | | | – | | | | 2,203,370 | | | | 28,335,335 | | | | 204,268 | |
Mid Cap Stock | | | 40,378,460 | | | | – | | | | – | | | | 2,616,880 | | | | 43,518,716 | | | | – | |
Partner Worldwide Allocation | | | 126,777,721 | | | | 1,329,038 | | | | – | | | | 15,371,774 | | | | 135,117,892 | | | | 1,329,038 | |
Large Cap Growth | | | 59,274,222 | | | | 3,929 | | | | – | | | | 11,226,944 | | | | 66,351,241 | | | | 3,929 | |
Large Cap Value | | | 86,543,027 | | | | 1,663,763 | | | | – | | | | 6,764,619 | | | | 99,845,770 | | | | 1,663,763 | |
Large Cap Stock | | | 36,483,289 | | | | 371,798 | | | | 6,000,000 | | | | 1,435,716 | | | | 34,198,749 | | | | 371,798 | |
Equity Income Plus | | | 9,978,155 | | | | 228,176 | | | | – | | | | 1,154,480 | | | | 11,094,557 | | | | 228,176 | |
High Yield | | | 49,604,487 | | | | 3,521,612 | | | | 9,767,598 | | | | 9,209,135 | | | | 46,137,766 | | | | 3,467,080 | |
Income | | | 187,103,647 | | | | 7,546,673 | | | | 15,701,571 | | | | 20,447,821 | | | | 191,596,078 | | | | 7,407,435 | |
Government Bond | | | 20,821,448 | | | | 4,901,129 | | | | 911,535 | | | | 2,318,648 | | | | 24,948,651 | | | | 330,374 | |
Limited Maturity Bond | | | 183,522,499 | | | | 2,686,528 | | | | 56,484,423 | | | | 10,485,914 | | | | 132,332,229 | | | | 2,671,660 | |
Securities Lending Trust-Collateral Investment | | | – | | | | 41,073,585 | | | | 40,040,804 | | | | 1,032,781 | | | | 1,032,781 | | | | 2,713 | |
Securities Lending Trust-Short Term Investment | | | – | | | | 128,254,274 | | | | 6,163,216 | | | | 122,091,058 | | | | 122,091,058 | | | | 220,997 | |
Total Value and Income Earned | | | 939,893,064 | | | | | | | | | | | | | | | | 1,045,432,319 | | | | 18,116,353 | |
The accompanying Notes to Financial Statements are an integral part of this schedule.
90
Moderately Conservative Allocation Fund
Schedule of Investments as of October 31, 2012
| | | | | | | | |
Principal
Amount | | | Bank Loans (2.8%)a | | Value | |
| Basic Materials (0.3%) | | | | |
| | | | Arch Coal, Inc., Term Loan | | | | |
| | $349,125 | | | 5.750%, 5/16/2018 | | | $351,869 | |
| | | | FMG Resources August 2006 Pty., Ltd., Term Loan | | | | |
| | 1,260,000 | | | 0.000%, 10/18/2017b,c | | | 1,253,070 | |
| | | | Ineos US Finance, LLC, Term Loan | | | | |
| | 449,088 | | | 6.500%, 5/4/2018 | | | 454,980 | |
| | | | | |
| | | | Total | | | 2,059,919 | |
| | | | | |
| |
| Capital Goods (0.1%) | | | | |
| | | | ADS Waste Holdings, Inc., Term Loan | | | | |
| | 485,000 | | | 1.963%, 10/9/2019b,c | | | 489,365 | |
| | | | MRC Global, Inc., Term Loan | | | | |
| | 345,000 | | | 0.000%, 10/24/2019b,c | | | 344,137 | |
| | | | | |
| | | | Total | | | 833,502 | |
| | | | | |
| |
| Communications Services (0.9%) | | | | |
| | | | Atlantic Broadband Finance, LLC, Term Loan | | | | |
| | 254,363 | | | 5.250%, 4/4/2019 | | | 255,105 | |
| | | | Charter Communications Operating, LLC, Term Loan | | | | |
| | 203,975 | | | 4.000%, 5/15/2019 | | | 205,313 | |
| | | | Clear Channel Communications, Term Loan | | | | |
| | 360,000 | | | 3.800%, 1/29/2016b,c | | | 295,427 | |
| | | | Cogeco Cable, Inc., Term Loan | | | | |
| | 275,000 | | | 0.000%, 9/10/2019b,c | | | 277,063 | |
| | | | Cricket Communications, Inc., Term Loan | | | | |
| | 70,000 | | | 0.000%, 10/10/2019b,c | | | 70,219 | |
| | | | Cumulus Media Holdings, Inc., Term Loan | | | | |
| | 547,456 | | | 5.750%, 9/17/2018 | | | 551,015 | |
| | | | Level 3 Financing, Inc., Term Loan | | | | |
| | 675,000 | | | 4.750%, 8/1/2019 | | | 677,774 | |
| | | | Liberty Cablevision of Puerto Rico, Ltd., Term Loan | | | | |
| | 344,138 | | | 6.000%, 6/9/2017 | | | 343,277 | |
| | | | MCC Georgia, LLC, Term Loan | | | | |
| | 275,000 | | | 4.000%, 1/20/2020 | | | 273,625 | |
| | | | SBA Senior Finance II, LLC, Term Loan | | | | |
| | 210,000 | | | 3.750%, 9/28/2019 | | | 210,893 | |
| | | | Toys R Us, Inc., Term Loan | | | | |
| | 450,068 | | | 5.250%, 5/25/2018 | | | 440,392 | |
| | | | Univision Communications, Inc., Term Loan | | | | |
| | 223,847 | | | 2.212%, 9/29/2014 | | | 222,902 | |
| | 275,000 | | | 4.462%, 3/31/2017 | | | 268,642 | |
| | | | Van Wagner Communications, Inc., Term Loan | | | | |
| | 280,000 | | | 8.250%, 8/3/2018 | | | 283,150 | |
| | | | WideOpenWest Finance, LLC, Term Loan | | | | |
| | 518,700 | | | 6.250%, 7/17/2018 | | | 522,917 | |
| | | | Yankee Cable Acquisition, LLC, Term Loan | | | | |
| | 269,930 | | | 5.250%, 8/26/2016 | | | 270,829 | |
| | | | Zayo Group, LLC, Term Loan | | | | |
| | 723,700 | | | 5.250%, 7/2/2019 | | | 726,233 | |
| | | | | |
| | | | Total | | | 5,894,776 | |
| | | | | |
| |
| Consumer Cyclical (0.3%) | | | | |
| | | | Burlington Coat Factory Warehouse Corporation, Term Loan | | | | |
| | 355,286 | | | 5.500%, 2/23/2017 | | | 357,673 | |
| | | | Chrysler Group, LLC, Term Loan | | | | |
| | 253,715 | | | 6.000%, 5/24/2017 | | | 258,965 | |
| | | | Rock Ohio Caesars, LLC, 18 month Delayed Draw | | | | |
| | 64,167 | | | 5.727%, 8/19/2017b,c | | | 65,611 | |
| | | | Rock Ohio Caesars, LLC, 6 month Delayed Draw | | | | |
| | 38,500 | | | 5.727%, 8/19/2017b,c | | | 39,366 | |
| | | | Rock Ohio Caesars, LLC, Term Loan | | | | |
| | 487,333 | | | 8.421%, 8/19/2017b,c | | | 498,298 | |
| | | | Seven Seas Cruises S de RL, LLC, Term Loan | | | | |
| | 620,000 | | | 6.250%, 12/21/2018 | | | 628,525 | |
| | | | | |
| | | | Total | | | 1,848,438 | |
| | | | | |
| |
| Consumer Non-Cyclical (0.5%) | | | | |
| | | | Bausch & Lomb, Inc., Term Loan | | | | |
| | 344,137 | | | 5.250%, 5/17/2019 | | | 347,703 | |
| | | | Ceridian Corporation, Term Loan | | | | |
| | 415,000 | | | 5.892%, 5/9/2017b,c | | | 413,444 | |
| | | | CHS/Community Health Systems, Inc., Term Loan | | | | |
| | 345,000 | | | 3.921%, 1/25/2017 | | | 346,290 | |
| | | | DJO Finance, LLC, Term Loan | | | | |
| | 344,135 | | | 6.250%, 9/15/2017 | | | 345,140 | |
| | | | Grifols, Inc., Term Loan | | | | |
| | 343,877 | | | 4.500%, 6/1/2017 | | | 346,700 | |
| | | | Hologic, Inc., Term Loan | | | | |
| | 408,975 | | | 4.500%, 8/1/2019 | | | 413,294 | |
| | | | Reynolds Group Holdings, Inc., Term Loan | | | | |
| | 70,000 | | | 0.000%, 9/28/2018b,c | | | 70,201 | |
| | | | Roundy’s Supermarkets, Inc., Term Loan | | | | |
| | 463,550 | | | 5.750%, 2/13/2019 | | | 449,560 | |
| | | | Visant Corporation, Term Loan | | | | |
| | 450,000 | | | 5.056%, 12/22/2016b,c | | | 430,123 | |
| | | | Warner Chilcott Company, LLC, Term Loan | | | | |
| | 27,198 | | | 4.250%, 3/15/2018 | | | 27,274 | |
| | | | Warner Chilcott Corporation, Term Loan | | | | |
| | 54,395 | | | 4.250%, 3/15/2018 | | | 54,548 | |
| | 20,657 | | | 4.250%, 3/15/2018 | | | 20,715 | |
| | | | WC Luxco Sarl, Term Loan | | | | |
| | 37,397 | | | 4.250%, 3/15/2018 | | | 37,502 | |
| | | | | |
| | | | Total | | | 3,302,494 | |
| | | | | |
| |
| Energy (0.1%) | | | | |
| | | | Chesapeake Energy Corporation, Term Loan | | | | |
| | 141,747 | | | 8.500%, 12/2/2017 | | | 141,883 | |
The accompanying Notes to Financial Statements are an integral part of this schedule.
91
Moderately Conservative Allocation Fund
Schedule of Investments as of October 31, 2012
| | | | | | | | |
Principal
Amount | | | Bank Loans (2.8%)a | | Value | |
| Energy (0.1%) - continued | | | | |
| | | | GenOn Energy, Inc., Term Loan | | | | |
| | $273,604 | | | 6.500%, 12/4/2017 | | | $275,486 | |
| | | | Plains Exploration & Production Company, Term Loan | | | | |
| | 135,000 | | | 0.000%, 10/15/2019b,c | | | 135,531 | |
| | | | | |
| | | | Total | | | 552,900 | |
| | | | | |
| |
| Financials (0.1%) | | | | |
| | | | Nuveen Investments, Inc., Term Loan | | | | |
| | 105,000 | | | 5.841%, 5/13/2017 | | | 104,606 | |
| | 345,000 | | | 5.846%, 5/13/2017 | | | 344,462 | |
| | | | WaveDivision Holdings, LLC, Term Loan | | | | |
| | 480,000 | | | 4.250%, 8/9/2019b,c | | | 485,198 | |
| | | | | |
| | | | Total | | | 934,266 | |
| | | | | |
| |
| Technology (0.3%) | | | | |
| | | | First Data Corporation Extended, Term Loan | | | | |
| | 255,000 | | | 4.211%, 3/26/2018 | | | 242,887 | |
| | | | First Data Corporation, Term Loan | | | | |
| | 275,000 | | | 5.211%, 9/24/2018 | | | 268,744 | |
| | | | Freescale Semiconductor, Inc., Term Loan | | | | |
| | 472,625 | | | 6.000%, 2/28/2019 | | | 468,608 | |
| | | | Infor US, Inc., Term Loan | | | | |
| | 274,488 | | | 5.995%, 4/5/2018 | | | 277,317 | |
| | | | Intelsat Jackson Holdings SA, Term Loan | | | | |
| | 350,452 | | | 4.500%, 4/2/2018 | | | 352,716 | |
| | | | | |
| | | | Total | | | 1,610,272 | |
| | | | | |
| |
| Transportation (<0.1%) | | | | |
| | | | Delta Air Lines, Inc., Term Loan | | | | |
| | 253,715 | | | 5.500%, 4/20/2017 | | | 253,462 | |
| | | | | |
| | | | Total | | | 253,462 | |
| | | | | |
| |
| Utilities (0.2%) | | | | |
| | | | Calpine Corporation, Term Loan | | | | |
| | 555,000 | | | 4.500%, 10/9/2019 | | | 555,405 | |
| | | | NGPL PipeCo, LLC, Term Loan | | | | |
| | 520,000 | | | 6.750%, 9/15/2017 | | | 529,969 | |
| | | | | |
| | | | Total | | | 1,085,374 | |
| | | | | |
| | | | | | | | |
| | | | | |
| | | | Total Bank Loans (cost $18,251,408) | | | 18,375,403 | |
| | | | | |
Shares | | | Mutual Funds (55.0%) | | Value | |
| Equity Mutual Funds (20.9%) | | | | |
| | 1,197,141 | | | Thrivent Natural Resources Fund | | | 10,774,267 | |
| | 626,155 | | | Thrivent Partner Small Cap Value Fund | | | 10,519,404 | |
| | 167,827 | | | Thrivent Small Cap Stock Fundd | | | 2,700,338 | |
| | 1,091,303 | | | Thrivent Partner Mid Cap Value Fund | | | 14,034,157 | |
| | 426,187 | | | Thrivent Mid Cap Stock Fundd | | | 7,087,492 | |
| | 4,393,476 | | | Thrivent Partner Worldwide Allocation Fund | | | 38,618,651 | |
| | 2,404,707 | | | Thrivent Large Cap Growth Fund | | | 14,211,821 | |
| | 2,386,109 | | | Thrivent Large Cap Value Fund | | | 35,218,971 | |
| | 29,860 | | | Thrivent Large Cap Stock Fund | | | 711,277 | |
| | 476,642 | | | Thrivent Equity Income Plus Fund | | | 4,580,526 | |
| | | | | |
| | | | Total | | | 138,456,904 | |
| | | | | |
| |
| Fixed Income Mutual Funds (34.1%) | | | | |
| | 4,963,219 | | | Thrivent High Yield Fund | | | 24,865,728 | |
| | 8,223,259 | | | Thrivent Income Fund | | | 77,051,939 | |
| | 1,141,646 | | | Thrivent Government Bond Fund | | | 12,284,114 | |
| | 8,830,183 | | | Thrivent Limited Maturity Bond Fund | | | 111,436,908 | |
| | | | | |
| | | | Total | | | 225,638,689 | |
| | | | | |
| | | | | | | | |
| | | | | |
| | | | Total Mutual Funds (cost $338,556,229) | | | 364,095,593 | |
| | | | | |
Principal
Amount | | | Long-Term Fixed Income (26.2%) | | Value | |
| Asset-Backed Securities (0.3%) | | | | |
| | | | Morgan Stanley Capital, Inc. | | | | |
| | 850,126 | | | 0.361%, 2/25/2037e | | | 431,980 | |
| | | | Renaissance Home Equity Loan Trust | | | | |
| | 2,300,000 | | | 6.011%, 5/25/2036 | | | 1,353,428 | |
| | | | | |
| | | | Total | | | 1,785,408 | |
| | | | | |
| |
| Basic Materials (0.5%) | | | | |
| | | | ArcelorMittal | | | | |
| | 119,000 | | | 5.375%, 6/1/2013 | | | 121,503 | |
| | | | Arch Coal, Inc. | | | | |
| | 510,000 | | | 7.000%, 6/15/2019f | | | 452,625 | |
| | | | BHP Billiton Finance, Ltd. | | | | |
| | 191,000 | | | 1.000%, 2/24/2015 | | | 192,832 | |
| | | | Dow Chemical Company | | | | |
| | 190,000 | | | 5.900%, 2/15/2015 | | | 211,459 | |
| | | | FMG Resources Property, Ltd. | | | | |
| | 510,000 | | | 8.250%, 11/1/2019f,g | | | 510,000 | |
| | | | Hexion US Finance Corporation/Hexion Nova Scotia Finance ULC | | | | |
| | 490,000 | | | 8.875%, 2/1/2018 | | | 494,900 | |
| | | | International Paper Company | | | | |
| | 127,000 | | | 5.300%, 4/1/2015 | | | 138,012 | |
| | | | LyondellBasell Industries NV | | | | |
| | 435,000 | | | 5.000%, 4/15/2019 | | | 470,888 | |
| | | | Novelis, Inc. | | | | |
| | 515,000 | | | 8.375%, 12/15/2017 | | | 560,062 | |
| | | | Rock-Tenn Company | | | | |
| | 130,000 | | | 3.500%, 3/1/2020g | | | 134,017 | |
| | | | Xstrata Finance Canada, Ltd. | | | | |
| | 124,000 | | | 1.800%, 10/23/2015g | | | 124,250 | |
| | 62,000 | | | 2.450%, 10/25/2017g | | | 61,841 | |
| | | | | |
| | | | Total | | | 3,472,389 | |
| | | | | |
| |
| Capital Goods (0.6%) | | | | |
| | | | Bombardier, Inc. | | | | |
| | 490,000 | | | 5.750%, 3/15/2022g | | | 516,338 | |
| | | | Case New Holland, Inc. | | | | |
| | 510,000 | | | 7.875%, 12/1/2017 | | | 599,250 | |
| | | | Caterpillar Financial Services Corporation | | | | |
| | 80,000 | | | 1.100%, 5/29/2015 | | | 80,976 | |
| | | | John Deere Capital Corporation | | | | |
| | 130,000 | | | 0.700%, 9/4/2015 | | | 130,182 | |
The accompanying Notes to Financial Statements are an integral part of this schedule.
92
Moderately Conservative Allocation Fund
Schedule of Investments as of October 31, 2012
| | | | | | | | |
Principal
Amount | | | Long-Term Fixed Income (26.2%) | | Value | |
| Capital Goods (0.6%) - continued | | | | |
| | | | Pentair Finance SA | | | | |
| | $130,000 | | | 1.875%, 9/15/2017g | | | $130,401 | |
| | | | Raytheon Company | | | | |
| | 190,000 | | | 1.625%, 10/15/2015 | | | 194,105 | |
| | | | RBS Global, Inc. | | | | |
| | 490,000 | | | 8.500%, 5/1/2018 | | | 537,775 | |
| | | | Reynolds Group Issuer, Inc. | | | | |
| | 510,000 | | | 6.875%, 2/15/2021 | | | 541,875 | |
| | | | Sealed Air Corporation | | | | |
| | 505,000 | | | 8.375%, 9/15/2021g | | | 555,500 | |
| | | | Textron, Inc. | | | | |
| | 253,000 | | | 5.600%, 12/1/2017 | | | 278,539 | |
| | | | United Technologies Corporation | | | | |
| | 20,000 | | | 4.500%, 6/1/2042 | | | 23,003 | |
| | | | UR Financing Escrow Corporation | | | | |
| | 490,000 | | | 7.375%, 5/15/2020g | | | 530,425 | |
| | | | | |
| | | | Total | | | 4,118,369 | |
| | | | | |
| |
| Collateralized Mortgage Obligations (1.4%) | | | | |
| | | | Citigroup Mortgage Loan Trust, Inc. | | | | |
| | 353,624 | | | 5.500%, 11/25/2035 | | | 309,875 | |
| | | | CitiMortgage Alternative Loan Trust | | | | |
| | 1,166,509 | | | 5.750%, 4/25/2037 | | | 922,613 | |
| | | | Countrywide Alternative Loan Trust | | | | |
| | 400,181 | | | 6.500%, 8/25/2036 | | | 260,160 | |
| | 241,742 | | | 6.000%, 1/25/2037 | | | 197,810 | |
| | 1,430,438 | | | 5.500%, 5/25/2037 | | | 1,059,564 | |
| | 1,119,167 | | | 7.000%, 10/25/2037 | | | 714,155 | |
| | | | Countrywide Home Loans, Inc. | | | | |
| | 502,155 | | | 5.750%, 4/25/2037 | | | 451,501 | |
| | | | Deutsche Alt-A Securities, Inc. | | | | |
| | 421,303 | | | 6.000%, 10/25/2021 | | | 385,619 | |
| | | | Deutsche Alt-A Securities, Inc. Alternative Loan Trust | | | | |
| | 194,540 | | | 5.500%, 10/25/2021 | | | 198,250 | |
| | | | Greenpoint Mortgage Funding Trust | | | | |
| | 1,065,874 | | | 0.411%, 10/25/2045e | | | 651,691 | |
| | | | J.P. Morgan Mortgage Trust | | | | |
| | 108,000 | | | 3.023%, 10/25/2036 | | | 80,636 | |
| | 1,224,372 | | | 6.250%, 8/25/2037 | | | 845,180 | |
| | | | MASTR Alternative Loans Trust | | | | |
| | 290,005 | | | 6.500%, 7/25/2034 | | | 305,188 | |
| | 742,114 | | | 0.661%, 12/25/2035e | | | 399,090 | |
| | | | Merrill Lynch Alternative Note Asset Trust | | | | |
| | 272,386 | | | 6.000%, 3/25/2037 | | | 216,606 | |
| | | | Residential Asset Securitization Trust | | | | |
| | 924,637 | | | 0.591%, 8/25/2037e | | | 294,131 | |
| | | | Sequoia Mortgage Trust | | | | |
| | 213,501 | | | 4.960%, 9/20/2046 | | | 40,102 | |
| | 1,803,799 | | | 4.960%, 9/20/2046 | | | 1,459,914 | |
| | | | WaMu Mortgage Pass Through Certificates | | | | |
| | 255,093 | | | 2.726%, 9/25/2036 | | | 200,991 | |
| | 240,793 | | | 2.794%, 10/25/2036 | | | 183,498 | |
| | | | | |
| | | | Total | | | 9,176,574 | |
| | | | | |
| |
| Commercial Mortgage-Backed Securities (2.0%) | | | | |
| | | | Banc of America Commercial Mortgage, Inc. | | | | |
| | 1,600,000 | | | 5.631%, 4/10/2049 | | | 1,860,002 | |
| | 2,450,000 | | | 5.535%, 6/10/2049 | | | 2,843,882 | |
| | | | Bear Stearns Commercial Mortgage Securities, Inc. | | | | |
| | 1,000,000 | | | 5.331%, 2/11/2044 | | | 1,114,458 | |
| | | | Credit Suisse First Boston Mortgage Securities | | | | |
| | 1,700,000 | | | 5.542%, 1/15/2049 | | | 1,922,537 | |
| | | | Credit Suisse Mortgage Capital Certificates | | | | |
| | 1,850,000 | | | 5.509%, 9/15/2039 | | | 1,951,076 | |
| | | | Greenwich Capital Commercial Funding Corporation | | | | |
| | 1,000,000 | | | 5.867%, 12/10/2049 | | | 1,095,705 | |
| | | | J.P. Morgan Chase Commercial Mortgage Securities Corporation | | | | |
| | 800,000 | | | 5.728%, 2/12/2049 | | | 843,779 | |
| | | | Morgan Stanley Capital, Inc. | | | | |
| | 500,000 | | | 5.406%, 3/15/2044 | | | 530,885 | |
| | | | Wachovia Bank Commercial Mortgage Trust | | | | |
| | 1,200,000 | | | 5.603%, 10/15/2048 | | | 1,297,548 | |
| | | | | |
| | | | Total | | | 13,459,872 | |
| | | | | |
| Communications Services (1.6%) | | | | |
| | | | AMC Networks, Inc. | | | | |
| | 505,000 | | | 7.750%, 7/15/2021 | | | 571,913 | |
| | | | America Movil SAB de CV | | | | |
| | 195,000 | | | 3.125%, 7/16/2022 | | | 201,081 | |
| | | | American Tower Corporation | | | | |
| | 155,000 | | | 5.050%, 9/1/2020 | | | 174,173 | |
| | | | AT&T, Inc. | | | | |
| | 259,000 | | | 2.400%, 8/15/2016 | | | 273,743 | |
| | | | British Telecommunications plc | | | | |
| | 170,000 | | | 2.000%, 6/22/2015 | | | 174,369 | |
| | | | Cablevision Systems Corporation | | | | |
| | 515,000 | | | 8.625%, 9/15/2017 | | | 601,263 | |
| | | | CCO Holdings, LLC | | | | |
| | 505,000 | | | 7.000%, 1/15/2019 | | | 542,875 | |
| | | | CenturyLink, Inc. | | | | |
| | 300,000 | | | 5.800%, 3/15/2022 | | | 315,776 | |
| | | | Comcast Corporation | | | | |
| | 270,000 | | | 6.500%, 1/15/2015 | | | 303,976 | |
| | 85,000 | | | 4.650%, 7/15/2042 | | | 92,150 | |
| | | | Digicel, Ltd. | | | | |
| | 410,000 | | | 8.250%, 9/1/2017g | | | 440,750 | |
| | 150,000 | | | 7.000%, 2/15/2020g | | | 157,500 | |
| | | | Dish DBS Corporation | | | | |
| | 275,000 | | | 4.625%, 7/15/2017 | | | 283,594 | |
| | 395,000 | | | 5.875%, 7/15/2022 | | | 414,750 | |
| | | | Frontier Communications Corporation | | | | |
| | 505,000 | | | 8.125%, 10/1/2018 | | | 571,913 | |
| | | | Hughes Satellite Systems Corporation | | | | |
| | 515,000 | | | 6.500%, 6/15/2019 | | | 551,050 | |
| | | | Intelsat Jackson Holdings SA | | | | |
| | 515,000 | | | 7.250%, 4/1/2019 | | | 552,337 | |
The accompanying Notes to Financial Statements are an integral part of this schedule.
93
Moderately Conservative Allocation Fund
Schedule of Investments as of October 31, 2012
| | | | | | | | |
Principal
Amount | | | Long-Term Fixed Income (26.2%) | | Value | |
| Communications Services (1.6%) - continued | | | | |
| | | | Level 3 Financing, Inc. | | | | |
| | $530,000 | | | 8.625%, 7/15/2020 | | | $577,700 | |
| | | | NBCUniversal Media, LLC | | | | |
| | 196,000 | | | 2.875%, 4/1/2016 | | | 207,833 | |
| | 62,000 | | | 2.875%, 1/15/2023 | | | 62,487 | |
| | | | News America, Inc. | | | | |
| | 130,000 | | | 3.000%, 9/15/2022g | | | 132,494 | |
| | | | Nippon Telegraph & Telephone Corporation | | | | |
| | 130,000 | | | 1.400%, 7/18/2017 | | | 131,095 | |
| | | | SBA Telecommunications, Inc. | | | | |
| | 100,000 | | | 5.750%, 7/15/2020g | | | 104,000 | |
| | | | SBA Tower Trust | | | | |
| | 110,000 | | | 5.101%, 4/15/2017g | | | 122,188 | |
| | | | Sprint Nextel Corporation | | | | |
| | 255,000 | | | 9.125%, 3/1/2017 | | | 299,625 | |
| | 145,000 | | | 9.000%, 11/15/2018g | | | 179,075 | |
| | | | Telefonica Emisiones SAU | | | | |
| | 130,000 | | | 3.729%, 4/27/2015 | | | 132,600 | |
| | | | Time Warner Cable, Inc. | | | | |
| | 131,000 | | | 3.500%, 2/1/2015 | | | 139,194 | |
| | | | Univision Communications, Inc. | | | | |
| | 385,000 | | | 6.750%, 9/15/2022g | | | 385,000 | |
| | | | UPCB Finance V, Ltd. | | | | |
| | 510,000 | | | 7.250%, 11/15/2021g | | | 561,000 | |
| | | | Verizon Communications, Inc. | | | | |
| | 259,000 | | | 5.500%, 2/15/2018 | | | 315,267 | |
| | | | Virgin Media Finance plc | | | | |
| | 490,000 | | | 5.250%, 2/15/2022 | | | 512,050 | |
| | | | Vivendi SA | | | | |
| | 195,000 | | | 2.400%, 4/10/2015g | | | 197,420 | |
| | | | Vodafone Group plc | | | | |
| | 132,000 | | | 1.250%, 9/26/2017 | | | 132,720 | |
| | | | | |
| | | | Total | | | 10,414,961 | |
| | | | | |
| |
| Consumer Cyclical (0.8%) | | | | |
| | | | American Honda Finance Corporation | | | | |
| | 65,000 | | | 1.000%, 8/11/2015g | | | 65,088 | |
| | 65,000 | | | 1.500%, 9/11/2017g | | | 65,471 | |
| | | | Chrysler Group, LLC | | | | |
| | 500,000 | | | 8.000%, 6/15/2019f | | | 531,875 | |
| | | | Federated Retail Holdings, Inc. | | | | |
| | 191,000 | | | 5.900%, 12/1/2016 | | | 225,029 | |
| | | | Ford Motor Credit Company, LLC | | | | |
| | 132,000 | | | 12.000%, 5/15/2015 | | | 162,690 | |
| | 490,000 | | | 5.000%, 5/15/2018 | | | 540,492 | |
| | | | Host Hotels and Resorts, LP | | | | |
| | 395,000 | | | 6.000%, 11/1/2020 | | | 439,437 | |
| | | | Hyundai Capital America | | | | |
| | 124,000 | | | 1.625%, 10/2/2015g | | | 124,770 | |
| | | | Lennar Corporation | | | | |
| | 405,000 | | | 12.250%, 6/1/2017 | | | 546,750 | |
| | | | Limited Brands, Inc. | | | | |
| | 345,000 | | | 5.625%, 2/15/2022 | | | 372,169 | |
| | | | Macy’s Retail Holdings, Inc. | | | | |
| | 196,000 | | | 3.875%, 1/15/2022 | | | 215,401 | |
| | | | MGM Resorts International | | | | |
| | 465,000 | | | 7.625%, 1/15/2017f | | | 489,412 | |
| | | | Scientific Games International, Inc. | | | | |
| | 490,000 | | | 6.250%, 9/1/2020g | | | 497,963 | |
| | | | Service Corporation International | | | | |
| | 390,000 | | | 8.000%, 11/15/2021 | | | 478,725 | |
| | | | Time Warner, Inc. | | | | |
| | 106,000 | | | 3.150%, 7/15/2015 | | | 112,831 | |
| | | | Toyota Motor Credit Corporation | | | | |
| | 80,000 | | | 1.750%, 5/22/2017 | | | 82,067 | |
| | | | Toys R Us Property Company II, LLC | | | | |
| | 510,000 | | | 8.500%, 12/1/2017 | | | 547,613 | |
| | | | Viacom, Inc. | | | | |
| | 65,000 | | | 1.250%, 2/27/2015 | | | 65,631 | |
| | | | | |
| | | | Total | | | 5,563,414 | |
| | | | | |
| |
| Consumer Non-Cyclical (1.3%) | | | | |
| | | | Amgen, Inc. | | | | |
| | 75,000 | | | 4.850%, 11/18/2014 | | | 81,241 | |
| | 75,000 | | | 2.125%, 5/15/2017 | | | 77,998 | |
| | | | Anheuser-Busch InBev Worldwide, Inc. | | | | |
| | 65,000 | | | 0.800%, 7/15/2015 | | | 65,190 | |
| | 130,000 | | | 1.375%, 7/15/2017 | | | 131,960 | |
| | | | BAT International Finance plc | | | | |
| | 160,000 | | | 1.400%, 6/5/2015g | | | 161,710 | |
| | | | Beam, Inc. | | | | |
| | 38,000 | | | 1.875%, 5/15/2017 | | | 39,017 | |
| | | | Biomet, Inc. | | | | |
| | 465,000 | | | 6.500%, 10/1/2020g | | | 452,213 | |
| | | | Boston Scientific Corporation | | | | |
| | 270,000 | | | 5.450%, 6/15/2014 | | | 288,095 | |
| | 16,000 | | | 4.500%, 1/15/2015 | | | 17,147 | |
| | | | Bunge Limited Finance Corporation | | | | |
| | 65,000 | | | 3.200%, 6/15/2017 | | | 68,521 | |
| | | | Celgene Corporation | | | | |
| | 98,000 | | | 1.900%, 8/15/2017 | | | 99,505 | |
| | 98,000 | | | 3.250%, 8/15/2022 | | | 101,017 | |
| | | | Community Health Systems, Inc. | | | | |
| | 390,000 | | | 8.000%, 11/15/2019 | | | 420,713 | |
| | | | ConAgra Foods, Inc. | | | | |
| | 195,000 | | | 1.350%, 9/10/2015 | | | 196,581 | |
| | | | Covidien International Finance SA | | | | |
| | 160,000 | | | 1.350%, 5/29/2015 | | | 162,518 | |
| | | | CVS Caremark Corporation | | | | |
| | 77,000 | | | 6.125%, 9/15/2039 | | | 103,256 | |
| | | | Express Scripts Holding Company | | | | |
| | 130,000 | | | 2.750%, 11/21/2014g | | | 134,767 | |
| | 130,000 | | | 3.125%, 5/15/2016 | | | 138,409 | |
| | | | Fresenius Medical Care US Finance II, Inc. | | | | |
| | 400,000 | | | 5.625%, 7/31/2019g | | | 421,000 | |
| | | | Gilead Sciences, Inc. | | | | |
| | 104,000 | | | 2.400%, 12/1/2014 | | | 107,554 | |
| | 114,000 | | | 3.050%, 12/1/2016 | | | 122,522 | |
| | | | Grifols, Inc. | | | | |
| | 465,000 | | | 8.250%, 2/1/2018 | | | 516,150 | |
| | | | HCA, Inc. | | | | |
| | 490,000 | | | 5.875%, 3/15/2022 | | | 525,525 | |
| | | | Heineken NV | | | | |
| | 124,000 | | | 0.800%, 10/1/2015g | | | 124,249 | |
| | 124,000 | | | 1.400%, 10/1/2017g | | | 124,558 | |
| | 31,000 | | | 4.000%, 10/1/2042g | | | 31,357 | |
The accompanying Notes to Financial Statements are an integral part of this schedule.
94
Moderately Conservative Allocation Fund
Schedule of Investments as of October 31, 2012
| | | | | | | | |
Principal
Amount | | | Long-Term Fixed Income (26.2%) | | Value | |
| Consumer Non-Cyclical (1.3%) - continued | | | | |
| | | | JBS USA, LLC | | | | |
| | $490,000 | | | 7.250%, 6/1/2021g | | | $479,220 | |
| | | | Kraft Foods, Inc. | | | | |
| | 160,000 | | | 1.625%, 6/4/2015g | | | 163,240 | |
| | 100,000 | | | 2.250%, 6/5/2017g | | | 103,873 | |
| | | | Laboratory Corporation of America Holdings | | | | |
| | 130,000 | | | 2.200%, 8/23/2017 | | | 133,984 | |
| | | | Libbey Glass, Inc. | | | | |
| | 80,000 | | | 6.875%, 5/15/2020g | | | 85,200 | |
| | | | Lorillard Tobacco Company | | | | |
| | 130,000 | | | 2.300%, 8/21/2017 | | | 131,505 | |
| | | | Rite Aid Corporation | | | | |
| | 410,000 | | | 7.500%, 3/1/2017 | | | 421,275 | |
| | | | Roche Holdings, Inc. | | | | |
| | 130,000 | | | 7.000%, 3/1/2039g | | | 201,348 | |
| | | | SABMiller Holdings, Inc. | | | | |
| | 200,000 | | | 1.850%, 1/15/2015g | | | 204,977 | |
| | | | Safeway, Inc. | | | | |
| | 142,000 | | | 5.000%, 8/15/2019 | | | 152,388 | |
| | | | Spectrum Brands Holdings, Inc. | | | | |
| | 505,000 | | | 9.500%, 6/15/2018 | | | 566,862 | |
| | | | Teva Pharmaceutical Finance Company BV | | | | |
| | 75,000 | | | 2.400%, 11/10/2016 | | | 78,882 | |
| | | | Teva Pharmaceutical Finance IV, LLC | | | | |
| | 148,000 | | | 1.700%, 11/10/2014 | | | 151,271 | |
| | | | Tyson Foods, Inc. | | | | |
| | 160,000 | | | 4.500%, 6/15/2022 | | | 169,600 | |
| | | | Valeant Pharmaceuticals International | | | | |
| | 510,000 | | | 6.875%, 12/1/2018g | | | 543,788 | |
| | | | Watson Pharmaceuticals, Inc. | | | | |
| | 62,000 | | | 1.875%, 10/1/2017 | | | 62,845 | |
| | 25,000 | | | 3.250%, 10/1/2022 | | | 25,762 | |
| | | | | |
| | | | Total | | | 8,388,793 | |
| | | | | |
| |
| Energy (0.8%) | | | | |
| | | | Apache Corporation | | | | |
| | 191,000 | | | 1.750%, 4/15/2017 | | | 197,676 | |
| | | | BP Capital Markets plc | | | | |
| | 192,000 | | | 3.125%, 10/1/2015 | | | 205,196 | |
| | | | Concho Resources, Inc. | | | | |
| | 660,000 | | | 5.500%, 10/1/2022 | | | 691,350 | |
| | | | Denbury Resources, Inc. | | | | |
| | 500,000 | | | 6.375%, 8/15/2021 | | | 547,500 | |
| | | | EOG Resources, Inc. | | | | |
| | 130,000 | | | 2.625%, 3/15/2023 | | | 133,076 | |
| | | | Harvest Operations Corporation | | | | |
| | 585,000 | | | 6.875%, 10/1/2017 | | | 640,575 | |
| | | | Linn Energy, LLC | | | | |
| | 510,000 | | | 7.750%, 2/1/2021 | | | 544,425 | |
| | | | Marathon Oil Corporation | | | | |
| | 186,000 | | | 0.900%, 11/1/2015 | | | 186,658 | |
| | | | Marathon Petroleum Corporation | | | | |
| | 130,000 | | | 3.500%, 3/1/2016 | | | 139,290 | |
| | | | Phillips 66 | | | | |
| | 150,000 | | | 2.950%, 5/1/2017g | | | 159,980 | |
| | | | Pioneer Natural Resources Company | | | | |
| | 65,000 | | | 5.875%, 7/15/2016 | | | 73,838 | |
| | 130,000 | | | 6.650%, 3/15/2017 | | | 154,732 | |
| | | | SandRidge Energy, Inc. | | | | |
| | 465,000 | | | 7.500%, 2/15/2023g | | | 481,275 | |
| | | | Suncor Energy, Inc. | | | | |
| | 114,000 | | | 6.100%, 6/1/2018 | | | 140,592 | |
| | | | Transocean, Inc. | | | | |
| | 65,000 | | | 5.050%, 12/15/2016 | | | 72,799 | |
| | 130,000 | | | 6.000%, 3/15/2018 | | | 153,156 | |
| | | | Valero Energy Corporation | | | | |
| | 130,000 | | | 7.500%, 4/15/2032 | | | 171,592 | |
| | | | Weatherford International, Ltd. | | | | |
| | 195,000 | | | 6.750%, 9/15/2040 | | | 231,604 | |
| | | | | |
| | | | Total | | | 4,925,314 | |
| | | | | |
| |
| Financials (2.5%) | | | | |
| | | | ABN Amro North American Holding Preferred Capital Repackage Trust I | | | | |
| | 62,000 | | | 6.523%, 12/29/2049g,h | | | 62,000 | |
| | | | Ally Financial, Inc. | | | | |
| | 490,000 | | | 5.500%, 2/15/2017 | | | 518,505 | |
| | | | American Express Credit Corporation | | | | |
| | 80,000 | | | 2.375%, 3/24/2017 | | | 84,127 | |
| | | | American International Group, Inc. | | | | |
| | 195,000 | | | 2.375%, 8/24/2015 | | | 198,263 | |
| | 191,000 | | | 3.800%, 3/22/2017 | | | 206,056 | |
| | | | ANZ National International, Ltd. of London | | | | |
| | 197,000 | | | 3.125%, 8/10/2015g | | | 206,837 | |
| | | | Associated Banc Corporation | | | | |
| | 65,000 | | | 1.875%, 3/12/2014 | | | 64,982 | |
| | | | Bank of America Corporation | | | | |
| | 275,000 | | | 7.750%, 8/15/2015 | | | 310,488 | |
| | 186,000 | | | 1.500%, 10/9/2015 | | | 186,212 | |
| | 130,000 | | | 5.750%, 8/15/2016 | | | 143,971 | |
| | 195,000 | | | 5.750%, 12/1/2017 | | | 225,867 | |
| | 130,000 | | | 5.650%, 5/1/2018 | | | 151,352 | |
| | | | Bank of New York Mellon Corporation | | | | |
| | 62,000 | | | 0.700%, 10/23/2015 | | | 62,018 | |
| | | | Bank of Nova Scotia | | | | |
| | 190,000 | | | 1.850%, 1/12/2015 | | | 195,003 | |
| | | | Barclays Bank plc | | | | |
| | 163,000 | | | 6.050%, 12/4/2017g | | | 178,026 | |
| | | | BBVA US Senior SAU | | | | |
| | 186,000 | | | 4.664%, 10/9/2015 | | | 187,839 | |
| | | | Berkshire Hathaway, Inc. | | | | |
| | 150,000 | | | 1.600%, 5/15/2017 | | | 153,203 | |
| | | | BlackRock, Inc. | | | | |
| | 80,000 | | | 1.375%, 6/1/2015 | | | 81,498 | |
| | | | BNP Paribas SA | | | | |
| | 65,000 | | | 2.375%, 9/14/2017 | | | 65,476 | |
| | | | Capital One Capital V | | | | |
| | 130,000 | | | 10.250%, 8/15/2039 | | | 133,900 | |
| | | | Capital One Financial Corporation | | | | |
| | 190,000 | | | 2.150%, 3/23/2015 | | | 195,314 | |
| | | | CIT Group, Inc. | | | | |
| | 465,000 | | | 4.250%, 8/15/2017 | | | 477,000 | |
| | | | Citigroup, Inc. | | | | |
| | 190,000 | | | 5.850%, 7/2/2013 | | | 196,376 | |
| | 340,000 | | | 5.000%, 9/15/2014 | | | 359,915 | |
The accompanying Notes to Financial Statements are an integral part of this schedule.
95
Moderately Conservative Allocation Fund
Schedule of Investments as of October 31, 2012
| | | | | | | | |
Principal
Amount | | | Long-Term Fixed Income (26.2%) | | Value | |
| Financials (2.5%) - continued | | | | |
| | $196,000 | | | 4.750%, 5/19/2015 | | | $212,423 | |
| | 195,000 | | | 6.000%, 8/15/2017 | | | 229,538 | |
| | | | CNA Financial Corporation | | | | |
| | 227,000 | | | 7.350%, 11/15/2019 | | | 284,469 | |
| | | | Credit Suisse New York, NY | | | | |
| | 197,000 | | | 5.500%, 5/1/2014 | | | 210,053 | |
| | | | Developers Diversified Realty Corporation | | | | |
| | 262,000 | | | 7.500%, 4/1/2017 | | | 316,136 | |
| | 380,000 | | | 7.875%, 9/1/2020 | | | 494,209 | |
| | | | Discover Bank | | | | |
| | 196,000 | | | 8.700%, 11/18/2019 | | | 256,274 | |
| | | | Duke Realty, LP | | | | |
| | 65,000 | | | 3.875%, 10/15/2022 | | | 67,661 | |
| | | | Eksportfinans ASA | | | | |
| | 81,000 | | | 3.000%, 11/17/2014 | | | 80,392 | |
| | 120,000 | | | 5.500%, 5/25/2016 | | | 124,200 | |
| | | | Fifth Third Bancorp | | | | |
| | 147,000 | | | 5.450%, 1/15/2017 | | | 165,943 | |
| | | | General Electric Capital Corporation | | | | |
| | 191,000 | | | 2.150%, 1/9/2015 | | | 196,262 | |
| | 110,000 | | | 0.551%, 1/8/2016e | | | 108,381 | |
| | 85,000 | | | 1.308%, 5/9/2016e | | | 85,058 | |
| | 75,000 | | | 2.300%, 4/27/2017 | | | 77,473 | |
| | 130,000 | | | 3.150%, 9/7/2022 | | | 132,248 | |
| | 195,000 | | | 6.750%, 3/15/2032 | | | 259,375 | |
| | | | Goldman Sachs Group, Inc. | | | | |
| | 190,000 | | | 5.000%, 10/1/2014 | | | 203,616 | |
| | 195,000 | | | 3.700%, 8/1/2015 | | | 205,336 | |
| | 195,000 | | | 0.823%, 3/22/2016e | | | 189,598 | |
| | | | Hartford Financial Services Group, Inc. | | | | |
| | 40,000 | | | 7.300%, 11/1/2015 | | | 45,708 | |
| | 28,000 | | | 5.500%, 10/15/2016 | | | 31,568 | |
| | 191,000 | | | 4.000%, 10/15/2017 | | | 207,816 | |
| | | | HSBC Holdings plc | | | | |
| | 148,000 | | | 4.000%, 3/30/2022 | | | 162,128 | |
| | 106,000 | | | 6.500%, 5/2/2036 | | | 129,783 | |
| | | | Icahn Enterprises, LP | | | | |
| | 90,000 | | | 8.000%, 1/15/2018g | | | 96,750 | |
| | 490,000 | | | 8.000%, 1/15/2018 | | | 526,750 | |
| | | | ING Bank NV | | | | |
| | 195,000 | | | 2.000%, 9/25/2015g | | | 196,586 | |
| | 124,000 | | | 3.750%, 3/7/2017g | | | 131,302 | |
| | | | International Lease Finance Corporation | | | | |
| | 490,000 | | | 5.875%, 4/1/2019 | | | 519,115 | |
| | | | J.P. Morgan Chase & Company | | | | |
| | 190,000 | | | 4.650%, 6/1/2014 | | | 201,359 | |
| | 124,000 | | | 1.875%, 3/20/2015 | | | 126,363 | |
| | 124,000 | | | 3.450%, 3/1/2016 | | | 131,951 | |
| | 195,000 | | | 2.000%, 8/15/2017 | | | 197,089 | |
| | | | J.P. Morgan Chase Bank NA | | | | |
| | 178,000 | | | 0.729%, 6/13/2016e | | | 172,300 | |
| | | | Liberty Mutual Group, Inc. | | | | |
| | 65,000 | | | 4.950%, 5/1/2022g | | | 70,984 | |
| | 62,000 | | | 6.500%, 5/1/2042g | | | 70,658 | |
| | | | Lloyds TSB Bank plc | | | | |
| | 195,000 | | | 6.500%, 9/14/2020g | | | 212,433 | |
| | | | Morgan Stanley | | | | |
| | 130,000 | | | 4.750%, 4/1/2014 | | | 134,864 | |
| | 294,000 | | | 6.000%, 5/13/2014 | | | 312,343 | |
| | 270,000 | | | 4.750%, 3/22/2017 | | | 292,193 | |
| | 62,000 | | | 4.875%, 11/1/2022 | | | 62,678 | |
| | | | Murray Street Investment Trust I | | | | |
| | 229,000 | | | 4.647%, 3/9/2017 | | | 248,487 | |
| | | | Omega Healthcare Investors, Inc. | | | | |
| | 400,000 | | | 5.875%, 3/15/2024 | | | 426,000 | |
| | | | PNC Funding Corporation | | | | |
| | 200,000 | | | 3.300%, 3/8/2022 | | | 214,759 | |
| | | | Prudential Financial, Inc. | | | | |
| | 200,000 | | | 6.200%, 11/15/2040 | | | 248,867 | |
| | | | Realty Income Corporation | | | | |
| | 62,000 | | | 2.000%, 1/31/2018 | | | 62,529 | |
| | | | Regions Bank | | | | |
| | 325,000 | | | 7.500%, 5/15/2018 | | | 391,450 | |
| | | | Reinsurance Group of America, Inc. | | | | |
| | 62,000 | | | 5.000%, 6/1/2021 | | | 68,805 | |
| | | | Royal Bank of Scotland Group plc | | | | |
| | 130,000 | | | 5.050%, 1/8/2015 | | | 134,572 | |
| | 195,000 | | | 2.550%, 9/18/2015 | | | 199,897 | |
| | | | Santander US Debt SAU | | | | |
| | 170,000 | | | 3.724%, 1/20/2015g | | | 170,333 | |
| | | | SLM Corporation | | | | |
| | 186,000 | | | 6.250%, 1/25/2016 | | | 200,889 | |
| | | | Societe Generale SA | | | | |
| | 130,000 | | | 5.200%, 4/15/2021g | | | 142,974 | |
| | | | Svenska Handelsbanken AB | | | | |
| | 191,000 | | | 3.125%, 7/12/2016 | | | 202,632 | |
| | | | U.S. Bancorp | | | | |
| | 124,000 | | | 3.150%, 3/4/2015 | | | 131,128 | |
| | 75,000 | | | 1.650%, 5/15/2017 | | | 76,670 | |
| | | | UBS AG/Stamford, Connecticut | | | | |
| | 124,000 | | | 5.875%, 12/20/2017 | | | 146,728 | |
| | | | UnitedHealth Group, Inc. | | | | |
| | 62,000 | | | 0.850%, 10/15/2015 | | | 62,252 | |
| | 31,000 | | | 1.400%, 10/15/2017 | | | 31,200 | |
| | | | Wachovia Corporation | | | | |
| | 465,000 | | | 5.625%, 10/15/2016 | | | 541,398 | |
| | | | WEA Finance, LLC | | | | |
| | 191,000 | | | 5.700%, 10/1/2016g | | | 217,689 | |
| | | | Wells Fargo & Company | | | | |
| | 126,000 | | | 2.100%, 5/8/2017 | | | 129,757 | |
| | | | | |
| | | | Total | | | 16,624,610 | |
| | | | | |
| |
| Foreign Government (<0.1%) | | | | |
| | | | Chile Government International Bond | | | | |
| | 124,000 | | | 2.250%, 10/30/2022 | | | 122,140 | |
| | | | Korea Finance Corporation | | | | |
| | 65,000 | | | 2.250%, 8/7/2017 | | | 65,541 | |
| | | | | |
| | | | Total | | | 187,681 | |
| | | | | |
| |
| Mortgage-Backed Securities (10.7%) | | | | |
| | | | Federal Home Loan Mortgage Corporation Gold 15-Yr. Pass Through | | | | |
| | 5,625,000 | | | 2.500%, 11/1/2027c | | | 5,874,609 | |
| | | | Federal Home Loan Mortgage Corporation Gold 30-Yr. Pass Through | | | | |
| | 6,800,000 | | | 3.000%, 11/1/2042c | | | 7,118,219 | |
The accompanying Notes to Financial Statements are an integral part of this schedule.
96
Moderately Conservative Allocation Fund
Schedule of Investments as of October 31, 2012
| | | | | | | | |
Principal
Amount | | | Long-Term Fixed Income (26.2%) | | Value | |
| Mortgage-Backed Securities (10.7%) - continued | | | | |
| | | | Federal National Mortgage Association Conventional 15- Yr. Pass Through | | | | |
| $ | 10,110,000 | | | 2.500%, 11/1/2027c | | $ | 10,580,747 | |
| | | | Federal National Mortgage Association Conventional 30- Yr. Pass Through | | | | |
| | 14,130,000 | | | 3.500%, 11/1/2042c | | | 15,050,657 | |
| | 17,102,500 | | | 4.000%, 11/1/2042c | | | 18,313,035 | |
| | 9,527,500 | | | 5.000%, 11/1/2042c | | | 10,393,907 | |
| | 3,000,000 | | | 5.000%, 12/1/2042c | | | 3,272,813 | |
| | | | | |
| | | | Total | | | 70,603,987 | |
| | | | | |
| |
| Technology (0.5%) | | | | |
| | | | Amkor Technology, Inc. | | | | |
| | 505,000 | | | 6.625%, 6/1/2021 | | | 481,012 | |
| | | | Computer Sciences Corporation | | | | |
| | 98,000 | | | 2.500%, 9/15/2015 | | | 100,097 | |
| | | | Equinix, Inc. | | | | |
| | 505,000 | | | 8.125%, 3/1/2018 | | | 555,500 | |
| | | | First Data Corporation | | | | |
| | 490,000 | | | 7.375%, 6/15/2019g | | | 507,150 | |
| | | | Freescale Semiconductor, Inc. | | | | |
| | 505,000 | | | 9.250%, 4/15/2018g | | | 540,350 | |
| | | | Hewlett-Packard Company | | | | |
| | 130,000 | | | 2.125%, 9/13/2015 | | | 129,623 | |
| | 146,000 | | | 2.600%, 9/15/2017 | | | 142,179 | |
| | | | International Business Machines Corporation | | | | |
| | 150,000 | | | 0.750%, 5/11/2015 | | | 150,861 | |
| | | | Oracle Corporation | | | | |
| | 124,000 | | | 1.200%, 10/15/2017 | | | 124,625 | |
| | 62,000 | | | 2.500%, 10/15/2022 | | | 63,119 | |
| | | | Samsung Electronics America, Inc. | | | | |
| | 212,000 | | | 1.750%, 4/10/2017g | | | 214,322 | |
| | | | Xerox Corporation | | | | |
| | 130,000 | | | 7.200%, 4/1/2016 | | | 150,446 | |
| | | | | |
| | | | Total | | | 3,159,284 | |
| | | | | |
| |
| Transportation (0.5%) | | | | |
| | | | Avis Budget Car Rental, LLC | | | | |
| | 500,000 | | | 8.250%, 1/15/2019 | | | 545,625 | |
| | | | Burlington Northern Santa Fe, LLC | | | | |
| | 49,000 | | | 3.050%, 9/1/2022 | | | 51,128 | |
| | | | Continental Airlines, Inc. | | | | |
| | 390,000 | | | 6.750%, 9/15/2015g | | | 408,037 | |
| | 75,000 | | | 4.150%, 4/11/2024 | | | 78,525 | |
| | | | CSX Corporation | | | | |
| | 106,000 | | | 6.250%, 4/1/2015 | | | 119,926 | |
| | | | Delta Air Lines, Inc. | | | | |
| | 196,000 | | | 6.750%, 5/23/2017 | | | 200,900 | |
| | 33,000 | | | 4.750%, 5/7/2020 | | | 34,858 | |
| | | | ERAC USA Finance, LLC | | | | |
| | 124,000 | | | 1.400%, 4/15/2016g | | | 125,044 | |
| | | | Hertz Corporation | | | | |
| | 495,000 | | | 6.750%, 4/15/2019 | | | 525,319 | |
| | | | Kansas City Southern de Mexico SA de CV | | | | |
| | 150,000 | | | 8.000%, 2/1/2014 | | | 166,500 | |
| | | | Navios Maritime Acquisition Corporation | | | | |
| | 505,000 | | | 8.625%, 11/1/2017 | | | 475,963 | |
| | | | Navios Maritime Holdings, Inc. | | | | |
| | 395,000 | | | 8.875%, 11/1/2017 | | | 404,875 | |
| | | | | |
| | | | Total | | | 3,136,700 | |
| | | | | |
| |
| U.S. Government and Agencies (1.8%) | | | | |
| | | | U.S. Treasury Bonds | | | | |
| | 550,000 | | | 4.375%, 5/15/2040 | | | 724,797 | |
| | 1,580,000 | | | 3.000%, 5/15/2042 | | | 1,632,091 | |
| | 580,000 | | | 2.750%, 8/15/2042 | | | 568,219 | |
| | | | U.S. Treasury Notes | | | | |
| | 250,000 | | | 0.750%, 6/15/2014 | | | 251,943 | |
| | 2,150,000 | | | 2.500%, 4/30/2015 | | | 2,265,395 | |
| | 750,000 | | | 1.000%, 10/31/2016 | | | 763,359 | |
| | 2,600,000 | | | 0.750%, 6/30/2017 | | | 2,610,155 | |
| | 1,200,000 | | | 0.875%, 7/31/2019 | | | 1,183,500 | |
| | 1,410,000 | | | 1.625%, 8/15/2022 | | | 1,402,289 | |
| | | | U.S. Treasury Notes, TIPS | | | | |
| | 550,000 | | | 0.125%, 7/31/2014 | | | 548,539 | |
| | | | | |
| | | | Total | | | 11,950,287 | |
| | | | | |
| |
| Utilities (0.9%) | | | | |
| | | | AES Corporation | | | | |
| | 510,000 | | | 7.375%, 7/1/2021 | | | 569,925 | |
| | | | CenterPoint Energy, Inc. | | | | |
| | 151,000 | | | 6.850%, 6/1/2015 | | | 170,774 | |
| | | | Crosstex Energy, LP/Crosstex Energy Finance Corporation | | | | |
| | 505,000 | | | 8.875%, 2/15/2018 | | | 541,612 | |
| | | | Energy Transfer Partners, LP | | | | |
| | 195,000 | | | 4.650%, 6/1/2021 | | | 216,572 | |
| | | | Enterprise Products Operating, LLC | | | | |
| | 195,000 | | | 1.250%, 8/13/2015 | | | 197,078 | |
| | | | Exelon Corporation | | | | |
| | 270,000 | | | 4.900%, 6/15/2015 | | | 296,849 | |
| | | | FirstEnergy Solutions Corporation | | | | |
| | 275,000 | | | 4.800%, 2/15/2015 | | | 297,304 | |
| | | | ITC Holdings Corporation | | | | |
| | 169,000 | | | 5.875%, 9/30/2016g | | | 193,021 | |
| | | | Kinder Morgan Energy Partners, LP | | | | |
| | 130,000 | | | 5.300%, 9/15/2020 | | | 154,034 | |
| | 130,000 | | | 5.000%, 8/15/2042 | | | 140,867 | |
| | | | MarkWest Energy Partners, LP | | | | |
| | 465,000 | | | 5.500%, 2/15/2023 | | | 488,250 | |
| | | | MidAmerican Energy Holdings Company | | | | |
| | 130,000 | | | 6.500%, 9/15/2037 | | | 179,509 | |
| | | | NextEra Energy Capital Holdings, Inc. | | | | |
| | 195,000 | | | 1.200%, 6/1/2015 | | | 196,038 | |
| | | | NGPL PipeCo, LLC | | | | |
| | 495,000 | | | 9.625%, 6/1/2019g | | | 569,250 | |
| | | | NiSource Finance Corporation | | | | |
| | 195,000 | | | 5.950%, 6/15/2041 | | | 236,845 | |
| | | | NRG Energy, Inc. | | | | |
| | 430,000 | | | 6.625%, 3/15/2023g | | | 442,900 | |
| | | | ONEOK Partners, LP | | | | |
| | 65,000 | | | 2.000%, 10/1/2017 | | | 66,329 | |
| | 84,000 | | | 8.625%, 3/1/2019 | | | 111,671 | |
The accompanying Notes to Financial Statements are an integral part of this schedule.
97
Moderately Conservative Allocation Fund
Schedule of Investments as of October 31, 2012
| | | | | | | | |
Principal
Amount | | | Long-Term Fixed Income (26.2%) | | Value | |
| Utilities (0.9%) - continued | | | | |
| | | | Pacific Gas & Electric Company | | | | |
| | $191,000 | | | 5.625%, 11/30/2017 | | | $232,709 | |
| | | | PPL Capital Funding, Inc. | | | | |
| | 62,000 | | | 3.500%, 12/1/2022 | | | 63,663 | |
| | | | Sempra Energy | | | | |
| | 191,000 | | | 6.150%, 6/15/2018 | | | 235,552 | |
| | | | Williams Partners, LP | | | | |
| | 65,000 | | | 7.250%, 2/1/2017 | | | 79,946 | |
| | 65,000 | | | 5.250%, 3/15/2020 | | | 76,537 | |
| | | | | |
| | | | Total | | | 5,757,235 | |
| | | | | |
| | | | | | | | |
| | | | | |
| | | | Total Long-Term Fixed Income (cost $169,255,931) | | | 172,724,878 | |
| | | | | |
| | |
| Shares | | | Common Stock (11.1%) | | Value | |
| Consumer Discretionary (1.6%) | | | | |
| | 2,400 | | | Amazon.com, Inc.d | | | 558,768 | |
| | 1,275 | | | AutoZone, Inc.d | | | 478,125 | |
| | 3,590 | | | CBS Corporation | | | 116,316 | |
| | 1,800 | | | Charter Communications, Inc.d | | | 139,338 | |
| | 1,900 | | | Cheesecake Factory, Inc. | | | 62,814 | |
| | 4,500 | | | Children’s Place Retail Stores, Inc.d | | | 262,935 | |
| | 48,200 | | | Comcast Corporation | | | 1,807,982 | |
| | 9,198 | | | Delphi Automotive plcd | | | 289,185 | |
| | 2,700 | | | DISH Network Corporation | | | 96,201 | |
| | 2,290 | | | Dollar Tree, Inc.d | | | 91,302 | |
| | 9,200 | | | Expedia, Inc. | | | 544,180 | |
| | 8,454 | | | Foot Locker, Inc. | | | 283,209 | |
| | 8,200 | | | GNC Holdings, Inc. | | | 317,094 | |
| | 1,740 | | | Harley-Davidson, Inc. | | | 81,362 | |
| | 6,000 | | | Home Depot, Inc. | | | 368,280 | |
| | 30,408 | | | Las Vegas Sands Corporation | | | 1,412,148 | |
| | 5,140 | | | Life Time Fitness, Inc.d | | | 230,735 | |
| | 15,770 | | | Lowe’s Companies, Inc. | | | 510,633 | |
| | 6,800 | | | Meredith Corporation | | | 227,596 | |
| | 12,720 | | | News Corporation | | | 309,859 | |
| | 6,400 | | | NIKE, Inc. | | | 584,832 | |
| | 2,100 | | | Omnicom Group, Inc. | | | 100,611 | |
| | 4,900 | | | O’Reilly Automotive, Inc.d | | | 419,832 | |
| | 428 | | | Panera Bread Companyd | | | 72,178 | |
| | 1,900 | | | Penn National Gaming, Inc.d | | | 76,817 | |
| | 900 | | | PetSmart, Inc. | | | 59,751 | |
| | 15,949 | | | Pier 1 Imports, Inc. | | | 325,360 | |
| | 12,300 | | | Sally Beauty Holdings, Inc.d | | | 296,184 | |
| | 2,700 | | | Tempur-Pedic International, Inc.d | | | 71,388 | |
| | 3,630 | | | Time Warner Cable, Inc. | | | 359,769 | |
| | 2,700 | | | Toll Brothers, Inc.d | | | 89,127 | |
| | 3,801 | | | WMS Industries, Inc.d | | | 62,450 | |
| | | | | |
| | | | Total | | | 10,706,361 | |
| | | | | |
| |
| Consumer Staples (0.8%) | | | | |
| | 5,238 | | | Anheuser-Busch InBev NV ADR | | | 438,944 | |
| | 5,118 | | | Annie’s, Inc.d | | | 202,161 | |
| | 4,050 | | | British American Tobacco plc ADR | | | 402,408 | |
| | 6,650 | | | CVS Caremark Corporation | | | 308,560 | |
| | 1,970 | | | Diageo plc ADR | | | 225,053 | |
| | 5,812 | | | Ingredion, Inc. | | | 357,206 | |
| | 2,290 | | | Kimberly-Clark Corporation | | | 191,101 | |
| | 3,363 | | | Kraft Foods Group, Inc.d | | | 152,949 | |
| | 42,691 | | | Mondelez International, Inc. | | | 1,133,019 | |
| | 6,700 | | | Nestle SA | | | 425,371 | |
| | 12,833 | | | Philip Morris International, Inc. | | | 1,136,490 | |
| | 1,902 | | | TreeHouse Foods, Inc.d | | | 101,852 | |
| | 5,230 | | | Unilever NV ADR | | | 191,889 | |
| | | | | |
| | | | Total | | | 5,267,003 | |
| | | | | |
| |
| Energy (0.9%) | | | | |
| | 11,119 | | | Alpha Natural Resources, Inc.d | | | 95,290 | |
| | 11,220 | | | BP plc ADR | | | 481,226 | |
| | 3,000 | | | Chevron Corporation | | | 330,630 | |
| | 12,500 | | | Consol Energy, Inc. | | | 439,500 | |
| | 1,700 | | | Ensco plc | | | 98,294 | |
| | 6,243 | | | EOG Resources, Inc. | | | 727,247 | |
| | 5,350 | | | EQT Corporation | | | 324,370 | |
| | 6,000 | | | Helix Energy Solutions Group, Inc.d | | | 103,740 | |
| | 26,730 | | | Marathon Oil Corporation | | | 803,504 | |
| | 17,700 | | | Marathon Petroleum Corporation | | | 972,261 | |
| | 1,140 | | | Oasis Petroleum, Inc.d | | | 33,482 | |
| | 13,650 | | | Petroleum Geo-Services ASA | | | 235,865 | |
| | 7,670 | | | Schlumberger, Ltd. | | | 533,295 | |
| | 2,900 | | | Southwestern Energy Companyd | | | 100,630 | |
| | 9,391 | | | Swift Energy Companyd | | | 156,924 | |
| | 50,500 | | | Weatherford International, Ltd.d | | | 570,650 | |
| | | | | |
| | | | Total | | | 6,006,908 | |
| | | | | |
| |
| Financials (1.6%) | | | | |
| | 3,780 | | | ACE, Ltd. | | | 297,297 | |
| | 2,376 | | | Affiliated Managers Group, Inc.d | | | 300,564 | |
| | 700 | | | Allied World Assurance Company Holdings AG | | | 56,210 | |
| | 4,580 | | | Allstate Corporation | | | 183,108 | |
| | 2,600 | | | American Assets Trust, Inc. | | | 70,642 | |
| | 1,700 | | | American Campus Communities, Inc. | | | 77,027 | |
| | 7,400 | | | Ameriprise Financial, Inc. | | | 431,938 | |
| | 2,000 | | | Aspen Insurance Holdings, Ltd. | | | 64,700 | |
| | 2,100 | | | Axis Capital Holdings, Ltd. | | | 76,062 | |
| | 36,750 | | | Bank of America Corporation | | | 342,510 | |
| | 3,800 | | | BioMed Realty Trust, Inc. | | | 72,656 | |
| | 2,550 | | | Capital One Financial Corporation | | | 153,433 | |
| | 5,900 | | | CBL & Associates Properties, Inc. | | | 131,983 | |
| | 28,940 | | | Citigroup, Inc. | | | 1,082,067 | |
| | 7,000 | | | CME Group, Inc. | | | 391,510 | |
| | 10,900 | | | DCT Industrial Trust, Inc. | | | 70,305 | |
| | 3,100 | | | Douglas Emmett, Inc. | | | 72,695 | |
| | 7,355 | | | Duke Realty Corporation | | | 106,500 | |
| | 1,800 | | | Endurance Specialty Holdings, Ltd. | | | 72,990 | |
| | 1,100 | | | Equity Lifestyle Properties, Inc. | | | 74,063 | |
| | 2,100 | | | Extra Space Storage, Inc. | | | 72,429 | |
| | 1,540 | | | Goldman Sachs Group, Inc. | | | 188,481 | |
| | 8,180 | | | HCC Insurance Holdings, Inc. | | | 291,535 | |
| | 2,100 | | | Highwoods Properties, Inc. | | | 67,725 | |
| | 9,439 | | | Host Hotels & Resorts, Inc. | | | 136,488 | |
| | 15,600 | | | Huntington Bancshares, Inc. | | | 99,684 | |
| | 7,880 | | | Invesco, Ltd. | | | 191,642 | |
| | 1,500 | | | iShares Russell 2000 Index Fund | | | 121,860 | |
| | 29,013 | | | J.P. Morgan Chase & Company | | | 1,209,262 | |
| | 17,100 | | | KKR & Company, LP | | | 257,355 | |
| | 2,873 | | | Lazard, Ltd. | | | 84,639 | |
| | 1,000 | | | M&T Bank Corporation | | | 104,100 | |
| | 14,530 | | | MetLife, Inc. | | | 515,670 | |
The accompanying Notes to Financial Statements are an integral part of this schedule.
98
Moderately Conservative Allocation Fund
Schedule of Investments as of October 31, 2012
| | | | | | | | |
| Shares | | | Common Stock (11.1%) | | Value | |
| Financials (1.6%) - continued | | | | |
| | 4,400 | | | NASDAQ OMX Group, Inc. | | | $104,764 | |
| | 2,100 | | | Northern Trust Corporation | | | 100,338 | |
| | 7,200 | | | Och-Ziff Capital Management Group, LLC | | | 72,072 | |
| | 3,000 | | | Pebblebrook Hotel Trust | | | 63,660 | |
| | 15,953 | | | Popular, Inc.d | | | 308,371 | |
| | 700 | | | ProAssurance Corporation | | | 62,580 | |
| | 9,210 | | | State Street Corporation | | | 410,490 | |
| | 8,350 | | | SVB Financial Groupd | | | 472,526 | |
| | 843 | | | Taubman Centers, Inc. | | | 66,218 | |
| | 3,000 | | | Tower Group, Inc. | | | 54,060 | |
| | 2,946 | | | W.R. Berkley Corporation | | | 114,570 | |
| | 22,880 | | | Wells Fargo & Company | | | 770,827 | |
| | 20,330 | | | Zions Bancorporation | | | 436,485 | |
| | | | | |
| | | | Total | | | 10,506,091 | |
| | | | | |
| |
| Health Care (1.7%) | | | | |
| | 7,800 | | | Abbott Laboratories | | | 511,056 | |
| | 800 | | | Alexion Pharmaceuticals, Inc.d | | | 72,304 | |
| | 6,700 | | | Align Technology, Inc.d | | | 178,086 | |
| | 12,990 | | | Baxter International, Inc. | | | 813,564 | |
| | 4,400 | | | Biogen Idec, Inc.d | | | 608,168 | |
| | 28,600 | | | Bristol-Myers Squibb Company | | | 950,950 | |
| | 892 | | | C.R. Bard, Inc. | | | 85,801 | |
| | 11,270 | | | Covidien plc | | | 619,287 | |
| | 10,700 | | | Endo Pharmaceutical Holdings, Inc.d | | | 306,662 | |
| | 2,598 | | | HeartWare International, Inc.d | | | 218,180 | |
| | 9,400 | | | Humana, Inc. | | | 698,138 | |
| | 1,800 | | | Illumina, Inc.d | | | 85,518 | |
| | 2,900 | | | Medicines Companyd | | | 63,568 | |
| | 26,450 | | | Merck & Company, Inc. | | | 1,206,913 | |
| | 46,767 | | | Pfizer, Inc. | | | 1,163,095 | |
| | 8,950 | | | Sanofi ADR | | | 392,458 | |
| | 5,100 | | | Shire Pharmaceuticals Group plc ADR | | | 430,389 | |
| | 3,700 | | | Thoratec Corporationd | | | 132,090 | |
| | 4,601 | | | United Therapeutics Corporationd | | | 210,128 | |
| | 30,570 | | | UnitedHealth Group, Inc. | | | 1,711,920 | |
| | 14,800 | | | VIVUS, Inc.d | | | 220,520 | |
| | 800 | | | Waters Corporationd | | | 65,448 | |
| | 1,537 | | | Zimmer Holdings, Inc. | | | 98,691 | |
| | | | | |
| | | | Total | | | 10,842,934 | |
| | | | | |
| |
| Industrials (1.4%) | | | | |
| | 5,200 | | | 3M Company | | | 455,520 | |
| | 9,300 | | | Actuant Corporation | | | 262,632 | |
| | 5,400 | | | ADT Corporationd | | | 224,154 | |
| | 3,678 | | | CSX Corporation | | | 75,289 | |
| | 9,251 | | | EMCOR Group, Inc. | | | 297,512 | |
| | 1,900 | | | FedEx Corporation | | | 174,781 | |
| | 600 | | | Flowserve Corporation | | | 81,294 | |
| | 6,300 | | | GATX Corporation | | | 261,198 | |
| | 6,244 | | | General Electric Company | | | 131,499 | |
| | 9,040 | | | HNI Corporation | | | 248,781 | |
| | 13,289 | | | Honeywell International, Inc. | | | 813,818 | |
| | 17,510 | | | Jacobs Engineering Group, Inc.d | | | 675,711 | |
| | 5,100 | | | Landstar System, Inc. | | | 258,315 | |
| | 3,300 | | | Lockheed Martin Corporation | | | 309,111 | |
| | 26,805 | | | Manitowoc Company, Inc. | | | 381,971 | |
| | 7,600 | | | Manpower, Inc. | | | 288,344 | |
| | 7,100 | | | McDermott International, Inc.d | | | 76,041 | |
| | 4,804 | | | Oshkosh Corporationd | | | 144,024 | |
| | 8,077 | | | Parker Hannifin Corporation | | | 635,337 | |
| | 1,727 | | | Pentair, Ltd. | | | 72,948 | |
| | 38,500 | | | Pitney Bowes, Inc. | | | 552,860 | |
| | 8,200 | | | Southwest Airlines Company | | | 72,324 | |
| | 1,840 | | | SPX Corporation | | | 126,206 | |
| | 15,900 | | | Tyco International, Ltd. | | | 427,233 | |
| | 11,000 | | | United Parcel Service, Inc. | | | 805,750 | |
| | 15,437 | | | United Technologies Corporation | | | 1,206,556 | |
| | 7,900 | | | Woodward, Inc. | | | 264,650 | |
| | | | | |
| | | | Total | | | 9,323,859 | |
| | | | | |
| |
| Information Technology (2.3%) | | | | |
| | 2,700 | | | Akamai Technologies, Inc.d | | | 102,573 | |
| | 1,400 | | | Alliance Data Systems Corporationd | | | 200,270 | |
| | 4,767 | | | Apple, Inc. | | | 2,836,842 | |
| | 10,400 | | | Aruba Networks, Inc.d | | | 188,968 | |
| | 45,100 | | | Atmel Corporationd | | | 210,392 | |
| | 7,500 | | | Cavium, Inc.d | | | 248,850 | |
| | 6,200 | | | Citrix Systems, Inc.d | | | 383,222 | |
| | 5,830 | | | Cognizant Technology Solutions Corporationd | | | 388,569 | |
| | 5,877 | | | CoreLogic, Inc.d | | | 139,873 | |
| | 12,375 | | | eBay, Inc.d | | | 597,589 | |
| | 1,332 | | | Google, Inc.d | | | 905,454 | |
| | 7,800 | | | Informatica Corporationd | | | 211,692 | |
| | 25,800 | | | Intel Corporation | | | 557,925 | |
| | 4,300 | | | International Business Machines Corporation | | | 836,479 | |
| | 2,349 | | | Itron, Inc.d | | | 96,450 | |
| | 5,004 | | | Juniper Networks, Inc.d | | | 82,916 | |
| | 900 | | | MasterCard, Inc. | | | 414,837 | |
| | 53,494 | | | Microsoft Corporation | | | 1,526,451 | |
| | 22,460 | | | NetApp, Inc.d | | | 604,174 | |
| | 9,052 | | | NVIDIA Corporationd | | | 108,352 | |
| | 42,270 | | | Oracle Corporation | | | 1,312,483 | |
| | 6,614 | | | Plantronics, Inc. | | | 214,558 | |
| | 8,300 | | | QUALCOMM, Inc. | | | 486,173 | |
| | 28,302 | | | Teradyne, Inc.d | | | 413,775 | |
| | 25,850 | | | Texas Instruments, Inc. | | | 726,126 | |
| | 7,871 | | | TIBCO Software, Inc.d | | | 198,428 | |
| | 8,400 | | | VeriFone Systems, Inc.d | | | 248,976 | |
| | 24,500 | | | Vishay Intertechnology, Inc.d | | | 202,860 | |
| | 39 | | | Workday, Inc.d | | | 1,892 | |
| | 12,557 | | | Xilinx, Inc. | | | 411,367 | |
| | 4,600 | | | Yahoo!, Inc.d | | | 77,326 | |
| | | | | |
| | | | Total | | | 14,935,842 | |
| | | | | |
| |
| Materials (0.4%) | | | | |
| | 29,000 | | | AK Steel Holding Corporation | | | 146,160 | |
| | 4,400 | | | Buckeye Technologies, Inc. | | | 115,280 | |
| | 4,200 | | | CF Industries Holdings, Inc. | | | 861,798 | |
| | 2,900 | | | Eagle Materials, Inc. | | | 153,613 | |
| | 11,451 | | | Freeport-McMoRan Copper & Gold, Inc. | | | 445,215 | |
| | 4,500 | | | H.B. Fuller Company | | | 136,800 | |
| | 3,322 | | | PPG Industries, Inc. | | | 388,940 | |
| | 2,557 | | | Sigma-Aldrich Corporation | | | 179,348 | |
| | 2,348 | | | Silgan Holdings, Inc. | | | 101,692 | |
| | 8,515 | | | Steel Dynamics, Inc. | | | 107,715 | |
| | 8,500 | | | SunCoke Energy, Inc.d | | | 136,595 | |
| | 4,150 | | | United States Steel Corporation | | | 84,618 | |
| | | | | |
| | | | Total | | | 2,857,774 | |
| | | | | |
The accompanying Notes to Financial Statements are an integral part of this schedule.
99
Moderately Conservative Allocation Fund
Schedule of Investments as of October 31, 2012
| | | | | | | | |
| Shares | | | Common Stock (11.1%) | | Value | |
| Telecommunications Services (0.1%) | | | | |
| | 7,213 | | | Verizon Communications, Inc. | | | $321,988 | |
| | 21,000 | | | Windstream Corporation | | | 200,340 | |
| | | | | |
| | | | Total | | | 522,328 | |
| | | | | |
| |
| Utilities (0.3%) | | | | |
| | 5,900 | | | CMS Energy Corporation | | | 143,488 | |
| | 13,700 | | | NiSource, Inc. | | | 348,939 | |
| | 8,204 | | | NV Energy, Inc. | | | 155,958 | |
| | 12,740 | | | PG&E Corporation | | | 541,705 | |
| | 11,300 | | | PNM Resources, Inc. | | | 250,408 | |
| | 2,700 | | | Public Service Enterprise Group, Inc. | | | 86,508 | |
| | 8,400 | | | Southern Company | | | 393,456 | |
| | 5,332 | | | Southwest Gas Corporation | | | 231,782 | |
| | | | | |
| | | | Total | | | 2,152,244 | |
| | | | | |
| | | | | | | | |
| | | | | |
| | | | Total Common Stock (cost $66,654,903) | | | 73,121,344 | |
| | | | | |
| | |
| Shares | | | Preferred Stock (<0.1%) | | Value | |
| Financials (<0.1%) | | | | |
| | 3,400 | | | U.S. Bancorp, 6.000%h | | | 97,580 | |
| | | | | |
| | | | Total | | | 97,580 | |
| | | | | |
| | | | | | | | |
| | | | | |
| | | | Total Preferred Stock (cost $85,000) | | | 97,580 | |
| | | | | |
| | |
| Shares | | | Collateral Held for Securities Loaned (0.3%) | | Value | |
| | 2,059,172 | | | Thrivent Financial Securities Lending Trust | | | 2,059,172 | |
| | | | | |
| | | | Total Collateral Held for Securities Loaned (cost $2,059,172) | | | 2,059,172 | |
| | | | | |
| | |
Shares or
Principal
Amount | | | Short-Term Investments (15.9%) | | Value | |
| | | | Federal Home Loan Bank Discount Notes | | | | |
| | 3,000,000 | | | 0.125%, 12/21/2012i | | | 2,999,479 | |
| | 10,000,000 | | | 0.122%, 1/9/2013i | | | 9,997,662 | |
| | | | Federal National Mortgage Association Discount Notes | | | | |
| | 10,000,000 | | | 0.120%, 11/21/2012i | | | 9,999,333 | |
| | 65,969,481 | | | Thrivent Financial Securities Lending Trust | | | 65,969,481 | |
| | | | U.S. Treasury Bills | | | | |
| | 15,000,000 | | | 0.115%, 11/8/2012i,j | | | 14,999,665 | |
| | 1,100,000 | | | 0.125%, 1/17/2013i,j | | | 1,099,706 | |
| | | | | |
| | | | Total Short-Term Investments (at amortized cost) | | | 105,065,326 | |
| | | | | |
| | | | Total Investments (cost $699,927,969) 111.3% | | $ | 735,539,296 | |
| | | | | |
| | | | Other Assets and Liabilities, Net (11.3%) | | | (74,594,778 | ) |
| | | | | |
| | | | Total Net Assets 100.0% | | $ | 660,944,518 | |
| | | | | |
a | The stated interest rate represents the weighted average of all contracts within the bank loan facility. |
b | All or a portion of the loan is unfunded. |
c | Denotes investments purchased on a when-issued or delayed delivery basis. |
d | Non-income producing security. |
e | Denotes variable rate securities. Variable rate securities are securities whose yields vary with a designated market index or market rate. The rate shown is as of October 31, 2012. |
f | All or a portion of the security is on loan. |
g | Denotes securities sold under Rule 144A of the Securities Act of 1933, which exempts them from registration. These securities have been deemed liquid and may be resold to other dealers in the program or to other qualified institutional buyers. As of October 31, 2012, the value of these investments was $14,224,892 or 2.2% of total net assets. |
h | Denotes perpetual securities. Perpetual securities pay an indefinite stream of interest, but may be called by the issuer at an earlier date. |
i | The interest rate shown reflects the yield, coupon rate or the discount rate at the date of purchase. |
j | At October 31, 2012, $3,099,661 of investments were held on deposit with the counterparty and pledged as the initial margin deposit for open futures contracts. |
Definitions:
| | | | |
|
ADR | | - | | American Depositary Receipt, which are certificates for an underlying foreign security’s shares held by an issuing U.S. depository bank. |
TIPS | | - | | Treasury Inflation Protected Security. |
Unrealized Appreciation (Depreciation)
Gross unrealized appreciation and depreciation of investments, based on cost for federal income tax purposes, were as follows:
| | | | |
Gross unrealized appreciation | | $ | 37,066,027 | |
Gross unrealized depreciation | | | (5,350,224 | ) |
| | | | |
Net unrealized appreciation (depreciation) | | $ | 31,715,803 | |
| |
Cost for federal income tax purposes | | $ | 703,823,493 | |
The accompanying Notes to Financial Statements are an integral part of this schedule.
100
Moderately Conservative Allocation Fund
Schedule of Investments as of October 31, 2012
Fair Valuation Measurements
The following table is a summary of the inputs used, as of October 31, 2012, in valuing Moderately Conservative Allocation Fund’s assets carried at fair value.
| | | | | | | | | | | | | | | | |
Investments in Securities | | Total | | | Level 1 | | | Level 2 | | | Level 3 | |
| | | | |
Bank Loans | | | | | | | | | | | | | | | | |
Basic Materials | | | 2,059,919 | | | | – | | | | 2,059,919 | | | | – | |
Capital Goods | | | 833,502 | | | | – | | | | 833,502 | | | | – | |
Communications Services | | | 5,894,776 | | | | – | | | | 5,894,776 | | | | – | |
Consumer Cyclical | | | 1,848,438 | | | | – | | | | 1,848,438 | | | | – | |
Consumer Non-Cyclical | | | 3,302,494 | | | | – | | | | 3,302,494 | | | | – | |
Energy | | | 552,900 | | | | – | | | | 552,900 | | | | – | |
Financials | | | 934,266 | | | | – | | | | 934,266 | | | | – | |
Technology | | | 1,610,272 | | | | – | | | | 1,610,272 | | | | – | |
Transportation | | | 253,462 | | | | – | | | | 253,462 | | | | – | |
Utilities | | | 1,085,374 | | | | – | | | | 1,085,374 | | | | – | |
| | | | |
Mutual Funds | | | | | | | | | | | | | | | | |
Equity Mutual Funds | | | 138,456,904 | | | | 138,456,904 | | | | – | | | | – | |
Fixed Income Mutual Funds | | | 225,638,689 | | | | 225,638,689 | | | | – | | | | – | |
| | | | |
Long-Term Fixed Income | | | | | | | | | | | | | | | | |
Asset-Backed Securities | | | 1,785,408 | | | | – | | | | 1,785,408 | | | | – | |
Basic Materials | | | 3,472,389 | | | | – | | | | 3,472,389 | | | | – | |
Capital Goods | | | 4,118,369 | | | | – | | | | 4,118,369 | | | | – | |
Collateralized Mortgage Obligations | | | 9,176,574 | | | | – | | | | 9,176,574 | | | | – | |
Commercial Mortgage-Backed Securities | | | 13,459,872 | | | | – | | | | 13,459,872 | | | | – | |
Communications Services | | | 10,414,961 | | | | – | | | | 10,414,961 | | | | – | |
Consumer Cyclical | | | 5,563,414 | | | | – | | | | 5,563,414 | | | | – | |
Consumer Non-Cyclical | | | 8,388,793 | | | | – | | | | 8,388,793 | | | | – | |
Energy | | | 4,925,314 | | | | – | | | | 4,925,314 | | | | – | |
Financials | | | 16,624,610 | | | | – | | | | 16,624,610 | | | | – | |
Foreign Government | | | 187,681 | | | | – | | | | 187,681 | | | | – | |
Mortgage-Backed Securities | | | 70,603,987 | | | | – | | | | 70,603,987 | | | | – | |
Technology | | | 3,159,284 | | | | – | | | | 3,159,284 | | | | – | |
Transportation | | | 3,136,700 | | | | – | | | | 3,136,700 | | | | – | |
U.S. Government and Agencies | | | 11,950,287 | | | | – | | | | 11,950,287 | | | | – | |
Utilities | | | 5,757,235 | | | | – | | | | 5,757,235 | | | | – | |
| | | | |
Common Stock | | | | | | | | | | | | | | | | |
Consumer Discretionary | | | 10,706,361 | | | | 10,706,361 | | | | – | | | | – | |
Consumer Staples | | | 5,267,003 | | | | 4,841,632 | | | | 425,371 | | | | – | |
Energy | | | 6,006,908 | | | | 5,771,043 | | | | 235,865 | | | | – | |
Financials | | | 10,506,091 | | | | 10,506,091 | | | | – | | | | – | |
Health Care | | | 10,842,934 | | | | 10,842,934 | | | | – | | | | – | |
Industrials | | | 9,323,859 | | | | 9,323,859 | | | | – | | | | – | |
Information Technology | | | 14,935,842 | | | | 14,935,842 | | | | – | | | | – | |
Materials | | | 2,857,774 | | | | 2,857,774 | | | | – | | | | – | |
Telecommunications Services | | | 522,328 | | | | 522,328 | | | | – | | | | – | |
Utilities | | | 2,152,244 | | | | 2,152,244 | | | | – | | | | – | |
| | | | |
Preferred Stock | | | | | | | | | | | | | | | | |
Financials | | | 97,580 | | | | 97,580 | | | | – | | | | – | |
Collateral Held for Securities Loaned | | | 2,059,172 | | | | 2,059,172 | | | | – | | | | – | |
Short-Term Investments | | | 105,065,326 | | | | 65,969,481 | | | | 39,095,845 | | | | – | |
| |
Total | | | $735,539,296 | | | | $504,681,934 | | | | $230,857,362 | | | | $– | |
| |
The accompanying Notes to Financial Statements are an integral part of this schedule.
101
Moderately Conservative Allocation Fund
Schedule of Investments as of October 31, 2012
| | | | | | | | | | | | | | | | |
| | | | |
Other Financial Instruments | | Total | | | Level 1 | | | Level 2 | | | Level 3 | |
| | | | |
Asset Derivatives | | | | | | | | | | | | | | | | |
Futures Contracts | | | 621,147 | | | | 621,147 | | | | – | | | | – | |
| |
Total Asset Derivatives | | | $621,147 | | | | $621,147 | | | | $– | | | | $– | |
| |
| | | | |
Liability Derivatives | | | | | | | | | | | | | | | | |
Futures Contracts | | | 935,932 | | | | 935,932 | | | | – | | | | – | |
Foreign Currency Forward Contracts | | | 21 | | | | – | | | | 21 | | | | – | |
| |
Total Liability Derivatives | | | $935,953 | | | | $935,932 | | | | $21 | | | | $– | |
| |
There were no significant transfers between Levels during the period ended October 31, 2012. Transfers between Levels are identified as of the end of the period.
| | | | | | | | | | | | | | | | | | | | |
Futures Contracts | | Number of
Contracts
Long/(Short) | | | Expiration
Date | | | Notional
Principal
Amount | | | Value | | | Unrealized
Gain/(Loss) | |
2-Yr. U.S. Treasury Bond Futures | | | (80 | ) | | | December 2012 | | | ($ | 17,633,506 | ) | | ($ | 17,626,250 | ) | | $ | 7,256 | |
5-Yr. U.S. Treasury Bond Futures | | | (75 | ) | | | December 2012 | | | | (9,331,412 | ) | | | (9,318,750 | ) | | | 12,662 | |
10-Yr. U.S. Treasury Bond Futures | | | 130 | | | | December 2012 | | | | 17,275,162 | | | | 17,294,063 | | | | 18,901 | |
20-Yr U.S. Treasury Bond Futures | | | 170 | | | | December 2012 | | | | 25,458,019 | | | | 25,383,125 | | | | (74,894 | ) |
Eurex EURO STOXX 50 Futures | | | 212 | | | | December 2012 | | | | 7,075,192 | | | | 6,880,548 | | | | (194,644 | ) |
Russell 2000 Index Mini-Futures | | | (52 | ) | | | December 2012 | | | | (4,478,900 | ) | | | (4,244,760 | ) | | | 234,140 | |
S&P 400 Index Mini Futures | | | (75 | ) | | | December 2012 | | | | (7,683,938 | ) | | | (7,335,750 | ) | | | 348,188 | |
S&P 500 Index Futures | | | 51 | | | | December 2012 | | | | 18,603,094 | | | | 17,936,700 | | | | (666,394 | ) |
Total Futures Contracts | | | | | | | | | | | | | | | | | | | ($314,785 | ) |
| | | | | | | | | | | | | | | | | | | | |
Foreign Currency
Forward Contracts | | Counterparty | | Contracts to
Deliver/Receive | | | Settlement Date | | Value on
Settlement Date | | | Value | | | Unrealized
Gain/(Loss) | |
| | | | | | |
Sales | | | | | | | | | | | | | | | | | | | | |
Euro | | SSB | | | 38,160 | | | 11/1/2012 | | $ | 49,440 | | | $ | 49,461 | | | ($ | 21 | ) |
Total Sales | | | | | | | | | | $ | 49,440 | | | $ | 49,461 | | | ($ | 21 | ) |
| | | |
Net Unrealized Gain/(Loss) on Foreign Currency Forward Contracts | | | | | | | | | | ($ | 21 | ) |
| | | | | | |
Counterparty |
SSB | | | - | | | State Street Bank |
The accompanying Notes to Financial Statements are an integral part of this schedule.
102
Moderately Conservative Allocation Fund
Schedule of Investments as of October 31, 2012
The following table summarizes the fair value and Statement of Assets and Liabilities location, as of October 31, 2012, for Moderately Conservative Allocation Fund’s investments in financial derivative instruments by primary risk exposure as discussed under item (2) Significant Accounting Policies of the Notes to Financial Statements.
| | | | | | |
Derivatives by risk category | | Statement of Assets and Liabilities Location | | Fair Value | |
| | |
Asset Derivatives | | | | | | |
| | |
Equity Contracts | | | | | | |
Futures* | | Net Assets - Net unrealized appreciation/(depreciation) on Futures contracts | | | $582,328 | |
Total Equity Contracts | | | | | 582,328 | |
| | |
Interest Rate Contracts | | | | | | |
Futures* | | Net Assets - Net unrealized appreciation/(depreciation) on Futures contracts | | | 38,819 | |
Total Interest Rate Contracts | | | | | 38,819 | |
Total Asset Derivatives | | | | | $621,147 | |
| |
| | |
Liability Derivatives | | | | | | |
| | |
Equity Contracts | | | | | | |
Futures* | | Net Assets - Net unrealized appreciation/(depreciation) on Futures contracts | | | 861,038 | |
Total Equity Contracts | | | | | 861,038 | |
| | |
Interest Rate Contracts | | | | | | |
Futures* | | Net Assets - Net unrealized appreciation/(depreciation) on Futures contracts | | | 74,894 | |
Total Interest Rate Contracts | | | | | 74,894 | |
| | |
Foreign Exchange Contracts | | | | | | |
Forward Contracts | | Receivable/Payable for forward contracts, Net Assets - Net unrealized appreciation/(depreciation) on Foreign currency forward contracts | | | 21 | |
Total Foreign Exchange Contracts | | | | | 21 | |
Total Liability Derivatives | | | | | $935,953 | |
| |
* | Includes cumulative appreciation/depreciation of futures contracts as reported in the Schedule of Investments. Only current day’s variation margin is reported within the Statement of Assets and Liabilities. |
The following table summarizes the net realized gains/(losses) and Statement of Operations location, for the period ended October 31, 2012, for Moderately Conservative Allocation Fund’s investments in financial derivative instruments by primary risk exposure.
| | | | | | |
Derivatives by risk category | | Statement of Operations Location | | Realized Gains/(Losses)
recognized in Income | |
| | |
Interest Rate Contracts | | | | | | |
Futures | | Net realized gains/(losses) on Futures contracts | | | 2,848,174 | |
| | |
Total Interest Rate Contracts | | | | | 2,848,174 | |
| | |
Equity Contracts | | | | | | |
Futures | | Net realized gains/(losses) on Futures contracts | | | 3,951,234 | |
| | |
Total Equity Contracts | | | | | 3,951,234 | |
| | |
Foreign Exchange Contracts | | | | | | |
Forward Contracts | | Net realized gains/(losses) on Foreign currency transactions | | | 702 | |
| | |
Total Foreign Exchange Contracts | | | | | 702 | |
| | |
Credit Contracts | | | | | | |
Credit Default Swaps | | Net realized gains/(losses) on Swap agreements | | | 717,552 | |
| | |
Total Credit Contracts | | | | | 717,552 | |
| |
Total | | | | | $7,517,662 | |
| |
The accompanying Notes to Financial Statements are an integral part of this schedule.
103
Moderately Conservative Allocation Fund
Schedule of Investments as of October 31, 2012
The following table summarizes the change in net unrealized appreciation/(depreciation) and Statement of Operations location, for the period ended October 31, 2012, for Moderately Conservative Allocation Fund’s investments in financial derivative instruments by primary risk exposure.
| | | | | | |
Derivatives by risk category | | Statement of Operations Location | | Change in unrealized
appreciation/(depreciation)
recognized in Income | |
| | |
Equity Contracts | | | | | | |
Futures | | Change in net unrealized appreciation/(depreciation) on Futures contracts | | | (2,992,891 | ) |
| | |
Total Equity Contracts | | | | | (2,992,891 | ) |
| | |
Interest Rate Contracts | | | | | | |
Futures | | Change in net unrealized appreciation/(depreciation) on Futures contracts | | | (2,514 | ) |
| | |
Total Interest Rate Contracts | | | | | (2,514 | ) |
| | |
Foreign Exchange Contracts | | | | | | |
Forward Contracts | | Change in net unrealized appreciation/(depreciation) on Foreign currency forward contracts | | | (21 | ) |
Total Foreign Exchange Contracts | | | | | (21 | ) |
| |
Total | | | | | ($2,995,426) | |
| |
The following table presents Moderately Conservative Allocation Fund’s average volume of derivative activity during the period ended October 31, 2012.
| | | | | | | | | | | | |
Derivative Risk Category | | Futures
(Notional*) | | Futures
(Percentage
of Average
Net Assets) | | Forwards
(Notional*) | | Forwards
(Percentage
of Average
Net Assets) | | Swaps
(Notional*) | | Swaps
(Percentage
of Average
Net Assets) |
Equity Contracts | | $31,988,392 | | 5.2% | | N/A | | N/A | | N/A | | N/A |
Interest Rate Contracts | | 75,943,361 | | 12.2 | | N/A | | N/A | | N/A | | N/A |
Foreign Exchange Contracts | | N/A | | N/A | | $3,165 | | <0.1% | | N/A | | N/A |
Credit Contracts | | N/A | | N/A | | N/A | | N/A | | $3,916,361 | | 0.6% |
* | Notional amount represents long or short, or both, derivative positions held by the Fund. |
Investment in Affiliates
Affiliated issuers, as defined under the Investment Company Act of 1940, include those in which the Fund’s holdings of an issuer represent 5% or more of the outstanding voting securities of an issuer, or any affiliated mutual fund.
A summary of transactions for the fiscal year to date, in Moderately Conservative Allocation Fund, is as follows:
| | | | | | | | | | | | | | | | | | | | | | | | |
Fund | | Value
October 31, 2011 | | | Gross
Purchases | | | Gross
Sales | | | Shares Held at
October 31, 2012 | | | Value
October 31, 2012 | | | Income Earned
November 1, 2011 -
October 31, 2012 | |
Natural Resources | | | $10,592,836 | | | | $1,615,296 | | | | $– | | | | 1,197,141 | | | | $10,774,267 | | | | $15,296 | |
Partner Small Cap Value | | | 9,349,338 | | | | 160,413 | | | | – | | | | 626,155 | | | | 10,519,404 | | | | 62,014 | |
Small Cap Stock | | | 2,510,694 | | | | – | | | | – | | | | 167,827 | | | | 2,700,338 | | | | – | |
Partner Mid Cap Value | | | 12,555,806 | | | | 101,172 | | | | – | | | | 1,091,303 | | | | 14,034,157 | | | | 101,172 | |
Mid Cap Stock | | | 6,576,068 | | | | – | | | | – | | | | 426,187 | | | | 7,087,492 | | | | – | |
Partner Worldwide Allocation | | | 36,234,910 | | | | 379,858 | | | | – | | | | 4,393,476 | | | | 38,618,651 | | | | 379,858 | |
Large Cap Growth | | | 12,695,989 | | | | 842 | | | | – | | | | 2,404,707 | | | | 14,211,821 | | | | 842 | |
Large Cap Value | | | 30,526,644 | | | | 586,865 | | | | – | | | | 2,386,109 | | | | 35,218,971 | | | | 586,865 | |
Large Cap Stock | | | 633,535 | | | | 7,733 | | | | – | | | | 29,860 | | | | 711,277 | | | | 7,733 | |
Equity Income Plus | | | 4,119,606 | | | | 94,205 | | | | – | | | | 476,642 | | | | 4,580,526 | | | | 94,214 | |
High Yield | | | 22,643,063 | | | | 1,714,537 | | | | 904,078 | | | | 4,963,219 | | | | 24,865,728 | | | | 1,689,645 | |
Income | | | 78,667,958 | | | | 3,059,178 | | | | 9,750,604 | | | | 8,223,259 | | | | 77,051,939 | | | | 3,000,635 | |
Government Bond | | | 12,115,144 | | | | 446,039 | | | | 361,631 | | | | 1,141,646 | | | | 12,284,114 | | | | 165,214 | |
Limited Maturity Bond | | | 173,653,196 | | | | 2,597,370 | | | | 67,392,521 | | | | 8,830,183 | | | | 111,436,908 | | | | 2,583,319 | |
Securities Lending Trust- Collateral Investment | | | – | | | | 20,893,512 | | | | 18,834,340 | | | | 2,059,172 | | | | 2,059,172 | | | | 2,202 | |
Securities Lending Trust- Short Term Investment | | | – | | | | 78,367,855 | | | | 12,398,374 | | | | 65,969,481 | | | | 65,969,481 | | | | 104,196 | |
Total Value and Income Earned | | | 412,874,787 | | | | | | | | | | | | | | | | 432,124,246 | | | | 8,793,205 | |
The accompanying Notes to Financial Statements are an integral part of this schedule.
104
Partner Emerging Markets Equity Fund
Schedule of Investments as of October 31, 2012
| | | | | | | | |
| Shares | | | Common Stock (95.4%) | | Value | |
| Bermuda (2.3%) | | | | |
| | 373,000 | | | Pacific Basin Shipping, Ltd. | | | $199,078 | |
| | 14,542 | | | VimpelCom, Ltd. | | | 160,253 | |
| | | | | |
| | | | Total | | | 359,331 | |
| | | | | |
| |
| Brazil (7.6%) | | | | |
| | 23,400 | | | All America Latina Logistica SA | | | 106,455 | |
| | 19,633 | | | Autometal SA | | | 164,329 | |
| | 10,700 | | | Banco do Estado do Rio Grande do Sul SA | | | 84,555 | |
| | 17,200 | | | Cia Paranaense de Energia | | | 254,056 | |
| | 9,400 | | | Cyrela Brazil Realty SA Empreendimentos e Participacoes | | | 79,697 | |
| | 40,800 | | | Embraer SA | | | 285,251 | |
| | 13,100 | | | Even Construtora e Incorporadora SA | | | 52,244 | |
| | 200 | | | Porto Seguro SA | | | 2,127 | |
| | 17,800 | | | Sul America SA | | | 140,223 | |
| | | | | |
| | | | Total | | | 1,168,937 | |
| | | | | |
| |
| Chile (3.2%) | | | | |
| | 7,004 | | | Cia Cervecerias Unidas SA | | | 496,794 | |
| | | | | |
| | | | Total | | | 496,794 | |
| | | | | |
| |
| China (8.9%) | | | | |
| | 436,000 | | | China Petroleum & Chemical Corporation | | | 459,490 | |
| | 130,000 | | | Dongfeng Motor Group Company, Ltd. | | | 160,784 | |
| | 362,000 | | | PetroChina Company, Ltd. | | | 491,204 | |
| | 172,000 | | | Yanzhou Coal Mining Company, Ltd. | | | 256,388 | |
| | | | | |
| | | | Total | | | 1,367,866 | |
| | | | | |
| |
| Colombia (2.2%) | | | | |
| | 21,853 | | | Bancolombia SA | | | 341,914 | |
| | | | | |
| | | | Total | | | 341,914 | |
| | | | | |
| |
| Czech Republic (1.5%) | | | | |
| | 1,118 | | | Komercni Banka AS | | | 228,777 | |
| | | | | |
| | | | Total | | | 228,777 | |
| | | | | |
| |
| Egypt (0.7%) | | | | |
| | 65,653 | | | Ezz Steel | | | 110,642 | |
| | | | | |
| | | | Total | | | 110,642 | |
| | | | | |
| |
| Hong Kong (6.2%) | | | | |
| | 52,000 | | | China Mobile, Ltd. | | | 576,771 | |
| | 44,000 | | | China Overseas Land & Investment, Ltd. | | | 114,569 | |
| | 205,000 | | | Sinotruk Hong Kong, Ltd. | | | 117,324 | |
| | 40,000 | | | Weichai Power Company, Ltd. | | | 141,016 | |
| | | | | |
| | | | Total | | | 949,680 | |
| | | | | |
| |
| Hungary (1.0%) | | | | |
| | 2,004 | | | EGIS Pharmaceuticals plc | | | 161,276 | |
| | | | | |
| | | | Total | | | 161,276 | |
| | | | | |
| |
| India (2.6%) | | | | |
| | 2,925 | | | ICICI Bank, Ltd. ADR | | | 114,806 | |
| | 9,525 | | | Reliance Industries, Ltd.a | | | 283,326 | |
| | | | | |
| | | | Total | | | 398,132 | |
| | | | | |
| |
| Indonesia (3.1%) | | | | |
| | 24,500 | | | Indo Tambangraya Megah Tbk PT | | | 103,170 | |
| | 17,537 | | | PT Bank Rakyat Indonesia (Persero) Tbk | | | 269,877 | |
| | 7,959 | | | Vale Indonesia Tbk PT | | | 111,865 | |
| | | | | |
| | | | Total | | | 484,912 | |
| | | | | |
| |
| Lebanon (0.5%) | | | | |
| | 5,946 | | | Solidere | | | 74,325 | |
| | | | | |
| | | | Total | | | 74,325 | |
| | | | | |
| |
| Luxembourg (1.5%) | | | | |
| | 10,923 | | | Ternium SA ADR | | | 224,249 | |
| | | | | |
| | | | Total | | | 224,249 | |
| | | | | |
| |
| Malaysia (2.9%) | | | | |
| | 104,600 | | | Genting Berhad | | | 303,104 | |
| | 50,400 | | | Malayan Banking Berhad | | | 149,095 | |
| | | | | |
| | | | Total | | | 452,199 | |
| | | | | |
| |
| Mexico (1.8%) | | | | |
| | 118,100 | | | America Movil SAB de CV | | | 149,812 | |
| | 55,000 | | | Kimberly-Clark de Mexico SAB de CV | | | 133,321 | |
| | | | | |
| | | | Total | | | 283,133 | |
| | | | | |
| |
| Panama (1.3%) | | | | |
| | 2,211 | | | Copa Holdings SA | | | 205,225 | |
| | | | | |
| | | | Total | | | 205,225 | |
| | | | | |
| |
| Philippines (0.6%) | | | | |
| | 3,340 | | | Globe Telecom, Inc. | | | 92,305 | |
| | | | | |
| | | | Total | | | 92,305 | |
| | | | | |
| |
| Poland (4.3%) | | | | |
| | 8,208 | | | Bank Handlowy w Warszawie SA | | | 239,526 | |
| | 4,144 | | | Bank Pekao SA | | | 199,061 | |
| | 21,926 | | | Grupa Lotos SAb | | | 231,675 | |
| | | | | |
| | | | Total | | | 670,262 | |
| | | | | |
| |
| Russia (5.3%) | | | | |
| | 66,573 | | | Gazprom OAO | | | 608,477 | |
| | 3,311 | | | Novolipetsk Steel OJSC | | | 62,729 | |
| | 12,220 | | | Sberbank of Russia | | | 142,363 | |
| | | | | |
| | | | Total | | | 813,569 | |
| | | | | |
| |
| South Africa (8.2%) | | | | |
| | 20,976 | | | ABSA Group, Ltd. | | | 336,307 | |
| | 36,863 | | | Aveng, Ltd. | | | 131,541 | |
| | 11,325 | | | Impala Platinum Holdings, Ltd. | | | 204,183 | |
| | 21,225 | | | MTN Group, Ltd. | | | 383,524 | |
| | 53,646 | | | PPC, Ltd. | | | 179,363 | |
| | 3,192 | | | Reunert, Ltd. | | | 28,110 | |
| | | | | |
| | | | Total | | | 1,263,028 | |
| | | | | |
| |
| South Korea (10.4%) | | | | |
| | 1,400 | | | Hyundai Heavy Industries Company, Ltd. | | | 293,385 | |
| | 944 | | | Hyundai Mobis | | | 239,913 | |
| | 19,680 | | | LG Uplus Corporation | | | 125,681 | |
| | 1,912 | | | POSCO ADR | | | 149,863 | |
| | 3,440 | | | Samsung Heavy Industries Company, Ltd. | | | 104,984 | |
The accompanying Notes to Financial Statements are an integral part of this schedule.
105
Partner Emerging Markets Equity Fund
Schedule of Investments as of October 31, 2012
| | | | | | | | |
| Shares | | | Common Stock (95.4%) | | Value | |
| South Korea (10.4%) - continued | | | | |
| | 11,766 | | | Shinhan Financial Group Company, Ltd. | | | $403,838 | |
| | 1,494 | | | Shinsegae Company, Ltd. | | | 266,965 | |
| | | | | |
| | | | Total | | | 1,584,629 | |
| | | | | |
| |
| Taiwan (6.9%) | | | | |
| | 396,000 | | | Compal Electronics, Inc. | | | 249,091 | |
| | 112,000 | | | Novatek Microelectronics Corporation | | | 421,223 | |
| | 66,000 | | | Taiwan Fertilizer Company, Ltd. | | | 157,074 | |
| | 7,995 | | | Taiwan Semiconductor Manufacturing Company, Ltd. ADR | | | 127,121 | |
| | 379,000 | | | Walsin Lihwa Corporationb | | | 103,618 | |
| | | | | |
| | | | Total | | | 1,058,127 | |
| | | | | |
| |
| Thailand (3.3%) | | | | |
| | 18,900 | | | Advanced Info Service pcl | | | 121,421 | |
| | 24,600 | | | Kasikornbank pcl | | | 143,045 | |
| | 114,000 | | | Thai Oil pcl | | | 246,969 | |
| | | | | |
| | | | Total | | | 511,435 | |
| | | | | |
| |
| Turkey (0.6%) | | | | |
| | 8,807 | | | Ford Otomotiv Sanayi AS | | | 90,339 | |
| | | | | |
| | | | Total | | | 90,339 | |
| | | | | |
| |
| United Kingdom (1.1%) | | | | |
| | 14,593 | | | Hikma Pharmaceuticals plc | | | 174,290 | |
| | | | | |
| | | | Total | | | 174,290 | |
| | | | | |
| |
| United States (7.4%) | | | | |
| | 13,880 | | | iShares MSCI Emerging Markets Index Fund | | | 570,607 | |
| | 13,610 | | | Vanguard MSCI Emerging Markets ETF | | | 564,679 | |
| | | | | |
| | | | Total | | | 1,135,286 | |
| | | | | |
| | | | | | | | |
| | | | | |
| | | | Total Common Stock (cost $14,453,259) | | | 14,700,662 | |
| | | | | |
| | |
| Shares | | | Preferred Stock (2.2%) | | Value | |
| Brazil (2.2%) | | | | |
| | 19,200 | | | Vale SA | | | 343,625 | |
| | | | | |
| | | | Total | | | 343,625 | |
| | | | | |
| | | | | | | | |
| | | | | |
| | | | Total Preferred Stock (cost $324,694) | | | 343,625 | |
| | | | | |
| | |
Shares or Principal
Amount | | | Short-Term Investments (0.8%) | | Value | |
| | 124,811 | | | Thrivent Financial Securities Lending Trust | | | 124,811 | |
| | | | | |
| | | | Total Short-Term Investments (at amortized cost) | | | 124,811 | |
| | | | | |
| | | | Total Investments (cost $14,902,764) 98.4% | | $ | 15,169,098 | |
| | | | | |
| | | | Other Assets and Liabilities, Net 1.6% | | | 245,536 | |
| | | | | |
| | | | Total Net Assets 100.0% | | $ | 15,414,634 | |
| | | | | |
a | Denotes securities sold under Rule 144A of the Securities Act of 1933, which exempts them from registration. These securities have been deemed liquid and may be resold to other dealers in the program or to other qualified institutional buyers. As of October 31, 2012, the value of these investments was $283,326 or 1.8% of total net assets. |
b | Non-income producing security. |
Definitions:
| | |
ADR | | - American Depositary Receipt, which are certificates for an underlying foreign security’s shares held by an issuing U.S. depository bank. |
ETF | | - Exchange Traded Fund. |
Unrealized Appreciation (Depreciation)
Gross unrealized appreciation and depreciation of investments, based on cost for federal income tax purposes, were as follows:
| | | | |
Gross unrealized appreciation | | $ | 733,325 | |
Gross unrealized depreciation | | | (466,991 | ) |
| | | | |
Net unrealized appreciation (depreciation) | | $ | 266,334 | |
| |
Cost for federal income tax purposes | | $ | 14,902,764 | |
The accompanying Notes to Financial Statements are an integral part of this schedule.
106
Partner Emerging Markets Equity Fund
Schedule of Investments as of October 31, 2012
Fair Valuation Measurements
The following table is a summary of the inputs used, as of October 31, 2012, in valuing Partner Emerging Markets Equity Fund’s assets carried at fair value.
| | | | | | | | | | | | | | | | |
Investments in Securities | | Total | | | Level 1 | | | Level 2 | | | Level 3 | |
| | | | |
Common Stock | | | | | | | | | | | | | | | | |
Communications Services | | | 872,743 | | | | – | | | | 872,743 | | | | – | |
Consumer Discretionary | | | 1,498,391 | | | | – | | | | 1,498,391 | | | | – | |
Consumer Staples | | | 736,570 | | | | 496,794 | | | | 239,776 | | | | – | |
Energy | | | 2,680,699 | | | | 608,477 | | | | 2,072,222 | | | | – | |
Financials | | | 4,005,125 | | | | 1,662,332 | | | | 2,342,793 | | | | – | |
Health Care | | | 335,566 | | | | – | | | | 335,566 | | | | – | |
Industrials | | | 1,832,176 | | | | 205,225 | | | | 1,626,951 | | | | – | |
Information Technology | | | 548,344 | | | | 127,121 | | | | 421,223 | | | | – | |
Materials | | | 1,199,968 | | | | 485,977 | | | | 713,991 | | | | – | |
Telecommunications Services | | | 737,024 | | | | 160,253 | | | | 576,771 | | | | – | |
Utilities | | | 254,056 | | | | – | | | | 254,056 | | | | – | |
| | | | |
Preferred Stock | | | | | | | | | | | | | | | | |
Materials | | | 343,625 | | | | – | | | | 343,625 | | | | – | |
Short-Term Investments | | | 124,811 | | | | 124,811 | | | | – | | | | – | |
| |
Total | | | $15,169,098 | | | | $3,870,990 | | | | $11,298,108 | | | | $– | |
| |
| | | | |
Other Financial Instruments | | Total | | | Level 1 | | | Level 2 | | | Level 3 | |
| | | | |
Asset Derivatives | | | | | | | | | | | | | | | | |
Foreign Currency Forward Contracts | | | 17 | | | | – | | | | 17 | | | | – | |
| |
Total Asset Derivatives | | | $17 | | | | $– | | | | $17 | | | | $– | |
| |
| | | | |
Liability Derivatives | | | | | | | | | | | | | | | | |
Foreign Currency Forward Contracts | | | 32 | | | | – | | | | 32 | | | | – | |
| |
Total Liability Derivatives | | | $32 | | | | $– | | | | $32 | | | | $– | |
| |
There were no significant transfers between Levels during the period ended October 31, 2012. Transfers between Levels are identified as of the end of the period.
| | | | | | | | | | | | | | | | | | | | |
Foreign Currency
Forward Contracts | | Counterparty | | Contracts to Deliver/Receive | | | Settlement Date | | Value on Settlement Date | | | Value | | | Unrealized Gain/(Loss) | |
| | | | | | |
Purchases | | | | | | | | | | | | | | | | | | | | |
Indonesian Rupiah | | SSB | | | 63,970,292 | | | 11/1/2012 | | | $6,643 | | | | $6,660 | | | | $17 | |
| | | | | | |
Total Purchases | | | | | | | | | | | $6,643 | | | | $6,660 | | | | $17 | |
| | | | | | |
Sales | | | | | | | | | | | | | | | | | | | | |
Brazilian Real | | SSB | | | 16,836 | | | 11/1/2012 | | | $8,272 | | | | $8,289 | | | | ($17 | ) |
South African Rand | | RBS | | | 55,507 | | | 11/1/2012 -11/2/2012 | | | 6,387 | | | | 6,402 | | | | (15 | ) |
| | | | | | |
Total Sales | | | | | | | | | | | $14,659 | | | | $14,691 | | | | ($32 | ) |
| | | |
Net Unrealized Gain/(Loss) on Foreign Currency Forward Contracts | | | | | | | | | | | ($15 | ) |
| | | | | | |
Counterparty |
SSB | | | - | | | State Street Bank |
RBS | | | - | | | The Royal Bank of Scotland |
The accompanying Notes to Financial Statements are an integral part of this schedule.
107
Partner Emerging Markets Equity Fund
Schedule of Investments as of October 31, 2012
The following table summarizes the fair value and Statement of Assets and Liabilities location, as of October 31, 2012, for Partner Emerging Markets Equity Fund’s investments in financial derivative instruments by primary risk exposure as discussed under item (2) Significant Accounting Policies of the Notes to Financial Statements.
| | | | | | |
Derivatives by risk category | | Statement of Assets and Liabilities Location | | Fair Value | |
| | |
Asset Derivatives | | | | | | |
| | |
Foreign Exchange Contracts | | | | | | |
Forward Contracts | | Receivable/Payable for forward contracts, Net Assets - Net unrealized appreciation/(depreciation) on Foreign currency forward contracts | | | 17 | |
Total Foreign Exchange Contracts | | | | | 17 | |
Total Asset Derivatives | | | | | $17 | |
| |
| | |
Liability Derivatives | | | | | | |
| | |
Foreign Exchange Contracts | | | | | | |
Forward Contracts | | Receivable/Payable for forward contracts, Net Assets - Net unrealized appreciation/(depreciation) on Foreign currency forward contracts | | | 32 | |
Total Foreign Exchange Contracts | | | | | 32 | |
Total Liability Derivatives | | | | | $32 | |
| |
The following table summarizes the net realized gains/(losses) and Statement of Operations location, for the period ended October 31, 2012, for Partner Emerging Markets Equity Fund’s investments in financial derivative instruments by primary risk exposure.
| | | | | | |
Derivatives by risk category | | Statement of Operations Location | | Realized Gains/(Losses) recognized in Income | |
| | |
Foreign Exchange Contracts | | | | | | |
Forward Contracts | | Net realized gains/(losses) on Foreign currency transactions | | | 26,206 | |
| | |
Total Foreign Exchange Contracts | | | | | 26,206 | |
| |
Total | | | | | $26,206 | |
| |
The following table summarizes the change in net unrealized appreciation/(depreciation) and Statement of Operations location, for the period ended October 31, 2012, for Partner Emerging Markets Equity Fund’s investments in financial derivative instruments by primary risk exposure.
| | | | | | |
Derivatives by risk category | | Statement of Operations Location | | Change in unrealized appreciation/(depreciation) recognized in Income | |
| | |
Foreign Exchange Contracts | | | | | | |
Forward Contracts | | Change in net unrealized appreciation/(depreciation) on Foreign currency forward contracts | | | (15 | ) |
| | |
Total Foreign Exchange Contracts | | | | | (15) | |
| |
Total | | | | | ($15) | |
| |
The following table presents Partner Emerging Markets Equity Fund’s average volume of derivative activity during the period ended October 31, 2012.
| | | | | | |
Derivative Risk Category | | Forwards (Notional*) | | Forwards
(Percentage
of Average
Net Assets) | |
Foreign Exchange Contracts | | $131,724 | | | 0.8% | |
The accompanying Notes to Financial Statements are an integral part of this schedule.
108
Partner Emerging Markets Equity Fund
Schedule of Investments as of October 31, 2012
Investment in Affiliates
Affiliated issuers, as defined under the Investment Company Act of 1940, include those in which the Fund’s holdings of an issuer represent 5% or more of the outstanding voting securities of an issuer, or any affiliated mutual fund.
A summary of transactions for the fiscal year to date, in Partner Emerging Markets Equity Fund, is as follows:
| | | | | | | | | | | | | | | | | | | | | | | | |
Fund | | Value
August 31, 2012 | | | Gross
Purchases | | | Gross
Sales | | | Shares Held at
October 31, 2012 | | | Value
October 31, 2012 | | | Income Earned
August 31, 2012 -
October 31, 2012 | |
Securities Lending Trust-Short Term Investment | | | $– | | | | $220,290 | | | | $95,479 | | | | 124,811 | | | | $124,811 | | | | $12 | |
Total Value and Income Earned | | | – | | | | | | | | | | | | | | | | 124,811 | | | | 12 | |
The accompanying Notes to Financial Statements are an integral part of this schedule.
109
Partner Small Cap Growth Fund
Schedule of Investments as of October 31, 2012
| | | | | | | | |
| Shares | | | Common Stock (96.8%) | | Value | |
| Consumer Discretionary (17.5%) | | | | |
| | 27,860 | | | Aeropostale, Inc.a | | | $332,927 | |
| | 10,670 | | | Ann, Inc.a | | | 375,157 | |
| | 4,020 | | | Arctic Cat, Inc.a | | | 145,805 | |
| | 22,320 | | | BJ’s Restaurants, Inc.a | | | 737,676 | |
| | 45,310 | | | Brunswick Corporation | | | 1,068,863 | |
| | 4,050 | | | Buffalo Wild Wings, Inc.a | | | 307,598 | |
| | 6,320 | | | Children’s Place Retail Stores, Inc.a | | | 369,278 | |
| | 9,440 | | | Cracker Barrel Old Country Store, Inc. | | | 600,856 | |
| | 14,870 | | | DSW, Inc. | | | 930,713 | |
| | 19,790 | | | Five Below, Inc.a,b | | | 655,841 | |
| | 15,940 | | | Hibbett Sports, Inc.a | | | 860,601 | |
| | 39,220 | | | HomeAway, Inc.a,b | | | 1,008,346 | |
| | 36,800 | | | Imax Corporationa,b | | | 831,312 | |
| | 34,270 | | | Meritage Homes Corporationa | | | 1,267,305 | |
| | 6,690 | | | Oxford Industries, Inc. | | | 371,161 | |
| | 5,640 | | | Red Robin Gourmet Burgers, Inc.a | | | 188,376 | |
| | 6,230 | | | Rue21, Inc.a | | | 187,585 | |
| | 11,570 | | | Select Comfort Corporationa | | | 321,993 | |
| | 89,980 | | | SHFL entertainment, Inc.a | | | 1,271,417 | |
| | 36,280 | | | Shutterfly, Inc.a | | | 1,097,833 | |
| | 48,700 | | | Sonic Automotive, Inc. | | | 944,780 | |
| | 29,060 | | | Sotheby’s Holdings, Inc. | | | 904,638 | |
| | 18,610 | | | Stamps.com, Inc.a | | | 512,147 | |
| | 25,395 | | | Steven Madden, Ltd.a | | | 1,089,953 | |
| | 33,900 | | | Tenneco, Inc.a | | | 1,035,645 | |
| | 50,130 | | | Texas Roadhouse, Inc. | | | 816,116 | |
| | 4,400 | | | Ulta Salon Cosmetics & Fragrance, Inc. | | | 405,768 | |
| | 14,630 | | | Vail Resorts, Inc. | | | 830,692 | |
| | 30,900 | | | Vera Bradley, Inc.a,b | | | 921,129 | |
| | 32,360 | | | Vitamin Shoppe, Inc.a | | | 1,852,286 | |
| | 33,860 | | | Zumiez, Inc.a,b | | | 856,997 | |
| | | | | |
| | | | Total | | | 23,100,794 | |
| | | | | |
|
| Consumer Staples (4.0%) | |
| | 43,180 | | | B&G Foods, Inc. | | | 1,307,059 | |
| | 1,180 | | | Boston Beer Company, Inc.a,b | | | 126,944 | |
| | 12,580 | | | Hain Celestial Group, Inc.a | | | 727,124 | |
| | 33,360 | | | Susser Holdings Corporationa | | | 1,198,958 | |
| | 4,680 | | | TreeHouse Foods, Inc.a | | | 250,614 | |
| | 32,450 | | | United Natural Foods, Inc.a | | | 1,727,638 | |
| | | | | |
| | | | Total | | | 5,338,337 | |
| | | | | |
|
| Energy (5.7%) | |
| | 6,490 | | | Bonanza Creek Energy, Inc.a | | | 160,757 | |
| | 33,230 | | | Carrizo Oil & Gas, Inc.a | | | 891,229 | |
| | 48,020 | | | Comstock Resources, Inc.a | | | 822,102 | |
| | 12,220 | | | Diamondback Energy, Inc.a | | | 208,107 | |
| | 16,960 | | | Dril-Quip, Inc.a | | | 1,174,650 | |
| | 29,160 | | | Energy XXI, Ltd. | | | 965,196 | |
| | 30,300 | | | Gulfport Energy Corporationa | | | 1,005,354 | |
| | 9,323 | | | Halcon Resources Corporationa | | | 60,320 | |
| | 103,370 | | | Kodiak Oil & Gas Corporationa | | | 955,139 | |
| | 2,220 | | | Lufkin Industries, Inc. | | | 111,022 | |
| | 27,950 | | | Rex Energy Corporationa | | | 370,058 | |
| | 35,540 | | | Stone Energy Corporationa | | | 838,388 | |
| | | | | |
| | | | Total | | | 7,562,322 | |
| | | | | |
|
| Financials (8.1%) | |
| | 33,770 | | | Alterra Capital Holdings, Ltd. | | | 825,001 | |
| | 27,650 | | | Bank of the Ozarks, Inc. | | | 905,261 | |
| | 46,290 | | | Colonial Properties Trust | | | 1,001,253 | |
| | 126,960 | | | Education Realty Trust, Inc. | | | 1,336,889 | |
| | 47,940 | | | Equity One, Inc. | | | 1,001,946 | |
| | 27,860 | | | Highwoods Properties, Inc. | | | 898,485 | |
| | 7,370 | | | Home Loan Servicing Solutions, Ltd. | | | 142,978 | |
| | 16,980 | | | MarketAxess Holdings, Inc. | | | 530,455 | |
| | 8,130 | | | ProAssurance Corporation | | | 726,822 | |
| | 6,920 | | | Sovran Self Storage, Inc. | | | 399,976 | |
| | 6,850 | | | Sun Communities, Inc. | | | 287,563 | |
| | 23,510 | | | Texas Capital Bancshares, Inc.a | | | 1,116,020 | |
| | 12,180 | | | Umpqua Holdings Corporation | | | 147,256 | |
| | 16,540 | | | Walter Investment Management Corporationa | | | 799,378 | |
| | 15,630 | | | Zillow, Inc.a,b | | | 583,937 | |
| | | | | |
| | | | Total | | | 10,703,220 | |
| | | | | |
|
| Health Care (17.1%) | |
| | 41,540 | | | Acadia Healthcare Company, Inc.a | | | 854,478 | |
| | 23,130 | | | Affymax, Inc.a | | | 527,133 | |
| | 12,390 | | | Air Methods Corporationa | | | 1,358,316 | |
| | 101,820 | | | Akorn, Inc.a | | | 1,222,858 | |
| | 39,780 | | | Align Technology, Inc.a | | | 1,057,352 | |
| | 5,590 | | | Analogic Corporation | | | 411,759 | |
| | 19,200 | | | ArthroCare Corporationa | | | 577,536 | |
| | 49,610 | | | Bruker Corporationa | | | 599,785 | |
| | 20,474 | | | Catamaran Corporationa | | | 965,554 | |
| | 5,150 | | | Computer Programs and Systems, Inc. | | | 251,372 | |
| | 28,360 | | | Cubist Pharmaceuticals, Inc.a | | | 1,216,644 | |
| | 8,570 | | | Cyberonics, Inc.a | | | 396,362 | |
| | 47,330 | | | Endologix, Inc.a | | | 637,062 | |
| | 110,940 | | | Health Management Associates, Inc.a | | | 809,862 | |
| | 32,000 | | | Incyte Corporationa,b | | | 510,720 | |
| | 37,640 | | | Integra LifeSciences Holdings Corporationa | | | 1,439,730 | |
| | 13,100 | | | Molina Healthcare, Inc.a | | | 328,417 | |
| | 10,800 | | | Onyx Pharmaceuticals, Inc.a | | | 846,288 | |
| | 5,890 | | | Orthofix International NVa | | | 233,597 | |
| | 37,630 | | | PAREXEL International Corporationa | | | 1,154,865 | |
| | 14,420 | | | Pharmacyclics, Inc.a,b | | | 880,629 | |
| | 35,260 | | | PSS World Medical, Inc.a | | | 1,009,141 | |
| | 3,740 | | | QLT, Inc.a | | | 28,125 | |
| | 17,760 | | | Sirona Dental Systems, Inc.a | | | 1,016,938 | |
| | 12,890 | | | Synageva BioPharma Corporationa | | | 544,989 | |
| | 26,540 | | | Team Health Holdings, Inc.a | | | 706,229 | |
| | 23,540 | | | Teleflex, Inc. | | | 1,599,543 | |
| | 15,140 | | | Wellcare Health Plans, Inc.a | | | 720,664 | |
| | 12,280 | | | West Pharmaceutical Services, Inc. | | | 661,524 | |
| | | | | |
| | | | Total | | | 22,567,472 | |
| | | | | |
|
| Industrials (16.0%) | |
| | 16,360 | | | Alaska Air Group, Inc.a | | | 625,606 | |
| | 77,860 | | | Avis Budget Group, Inc.a | | | 1,287,026 | |
| | 30,840 | | | Belden, Inc. | | | 1,104,072 | |
| | 20,550 | | | Chart Industries, Inc.a | | | 1,454,735 | |
| | 17,490 | | | Clean Harbors, Inc.a | | | 1,020,541 | |
| | 28,140 | | | Colfax Corporationa | | | 967,735 | |
| | 16,240 | | | Copa Holdings SA | | | 1,507,397 | |
| | 9,160 | | | EnPro Industries, Inc.a | | | 334,890 | |
| | 5,790 | | | ESCO Technologies, Inc. | | | 216,778 | |
The accompanying Notes to Financial Statements are an integral part of this schedule.
110
Partner Small Cap Growth Fund
Schedule of Investments as of October 31, 2012
| | | | | | | | |
| Shares | | | Common Stock (96.8%) | | Value | |
| Industrials (16.0%) - continued | | | | |
| | 18,280 | | | Genesee & Wyoming, Inc.a | | | $1,324,752 | |
| | 35,430 | | | Healthcare Services Group, Inc. | | | 846,777 | |
| | 54,970 | | | Hexcel Corporationa | | | 1,405,033 | |
| | 21,440 | | | Huron Consulting Group, Inc.a | | | 618,544 | |
| | 6,830 | | | Kforce, Inc.a | | | 76,154 | |
| | 5,540 | | | Middleby Corporationa | | | 692,223 | |
| | 40,990 | | | Old Dominion Freight Line, Inc.a | | | 1,374,805 | |
| | 13,680 | | | On Assignment, Inc.a | | | 261,014 | |
| | 2,480 | | | RBC Bearings, Inc.a | | | 123,157 | |
| | 26,960 | | | Thermon Group Holdings, Inc.a | | | 669,686 | |
| | 59,240 | | | Titan International, Inc.b | | | 1,242,855 | |
| | 10,230 | | | Triumph Group, Inc. | | | 669,247 | |
| | 39,920 | | | TrueBlue, Inc.a | | | 520,956 | |
| | 78,540 | | | US Airways Group, Inc.a,b | | | 956,617 | |
| | 30,350 | | | USG Corporationa,b | | | 810,648 | |
| | 30,610 | | | Woodward, Inc. | | | 1,025,435 | |
| | | | | |
| | | | Total | | | 21,136,683 | |
| | | | | |
| |
| Information Technology (22.7%) | | | | |
| | 33,330 | | | Allot Communications, Ltd.a | | | 778,589 | |
| | 4,920 | | | ANSYS, Inc.a | | | 348,730 | |
| | 28,630 | | | Aspen Technology, Inc.a | | | 709,451 | |
| | 3,280 | | | Blucora, Inc.a | | | 57,564 | |
| | 7,790 | | | Bottomline Technologies, Inc.a | | | 182,286 | |
| | 29,970 | | | Broadsoft, Inc.a,b | | | 1,145,453 | |
| | 47,630 | | | Cardtronics, Inc.a | | | 1,353,168 | |
| | 40,060 | | | Cavium, Inc.a,b | | | 1,329,191 | |
| | 59,440 | | | Ciena Corporationa,b | | | 737,650 | |
| | 38,530 | | | Cirrus Logic, Inc.a | | | 1,570,483 | |
| | 26,240 | | | Cognex Corporation | | | 956,710 | |
| | 4,580 | | | Coherent, Inc.a | | | 209,077 | |
| | 19,850 | | | CommVault Systems, Inc.a | | | 1,240,029 | |
| | 22,970 | | | Cornerstone OnDemand, Inc.a | | | 642,930 | |
| | 15,820 | | | Electronics for Imaging, Inc.a | | | 274,635 | |
| | 4,960 | | | Ellie Mae, Inc.a | | | 124,000 | |
| | 58,540 | | | Finisar Corporationa,b | | | 674,381 | |
| | 29,050 | | | Fusion-io, Inc.a,b | | | 685,580 | |
| | 21,410 | | | GSI Group, Inc.a | | | 166,356 | |
| | 27,120 | | | Guidewire Software, Inc.a | | | 830,957 | |
| | 42,450 | | | Heartland Payment Systems, Inc. | | | 1,107,096 | |
| | 7,880 | | | Imperva, Inc.a | | | 248,456 | |
| | 1,510 | | | Infoblox, Inc.a | | | 25,081 | |
| | 13,650 | | | IPG Photonics Corporationa,b | | | 724,542 | |
| | 14,310 | | | Manhattan Associates, Inc.a | | | 858,600 | |
| | 25,960 | | | MAXIMUS, Inc. | | | 1,432,473 | |
| | 44,890 | | | Monolithic Power Systems, Inc.a | | | 872,213 | |
| | 4,270 | | | NETGEAR, Inc.a | | | 151,628 | |
| | 36,130 | | | NetScout Systems, Inc.a | | | 893,495 | |
| | 20,770 | | | OSI Systems, Inc.a | | | 1,646,022 | |
| | 19,550 | | | Plexus Corporationa | | | 526,090 | |
| | 23,370 | | | Power Integrations, Inc. | | | 691,285 | |
| | 7,120 | | | Procera Networks, Inc.a | | | 161,268 | |
| | 26,090 | | | QLIK Technologies, Inc.a | | | 480,317 | |
| | 2,610 | | | Radware, Inc.a | | | 85,608 | |
| | 40,740 | | | Semtech Corporationa | | | 1,017,278 | |
| | 23,200 | | | Sourcefire, Inc.a | | | 992,728 | |
| | 11,510 | | | Stratasys, Inc.a,b | | | 767,372 | |
| | 9,170 | | | Synchronoss Technologies, Inc.a | | | 187,893 | |
| | 53,260 | | | Teradyne, Inc.a | | | 778,661 | |
| | 7,190 | | | Tyler Technologies, Inc.a | | | 343,754 | |
| | 9,710 | | | Ultimate Software Group, Inc.a | | | 984,206 | |
| | 34,380 | | | Ultratech, Inc.a | | | 1,062,686 | |
| | | | | |
| | | | Total | | | 30,055,972 | |
| | | | | |
| |
| Materials (4.9%) | | | | |
| | 143,060 | | | Boise, Inc. | | | 1,200,273 | |
| | 18,070 | | | Carpenter Technology Corporation | | | 878,383 | |
| | 52,680 | | | Chemtura Corporationa | | | 839,192 | |
| | 58,790 | | | Commercial Metals Company | | | 808,951 | |
| | 11,630 | | | KapStone Paper and Packaging Corporationa | | | 255,511 | |
| | 77,870 | | | Louisiana-Pacific Corporationa | | | 1,229,567 | |
| | 6,640 | | | LSB Industries, Inc.a | | | 267,393 | |
| | 21,610 | | | Methanex Corporationb | | | 648,300 | |
| | 9,090 | | | Rentech Nitrogen Partners, LP | | | 349,147 | |
| | | | | |
| | | | Total | | | 6,476,717 | |
| | | | | |
| |
| Telecommunications Services (0.7%) | | | | |
| | 19,120 | | | 8x8, Inc.a | | | 125,236 | |
| | 37,900 | | | Cogent Communications Group, Inc. | | | 822,809 | |
| | | | | |
| | | | Total | | | 948,045 | |
| | | | | |
| |
| Utilities (0.1%) | | | | |
| | 4,080 | | | Artesian Resources Corporation | | | 93,881 | |
| | | | | |
| | | | Total | | | 93,881 | |
| | | | | |
| | | | | | | | |
| | | | | |
| | | | Total Common Stock (cost $110,922,008) | | | 127,983,443 | |
| | | | | |
| | |
| Shares | | | Collateral Held for Securities Loaned (11.1%) | | Value | |
| | 14,689,588 | | | Thrivent Financial Securities Lending Trust | | | 14,689,588 | |
| | | | | |
| | | | Total Collateral Held for Securities Loaned (cost $14,689,588) | | | 14,689,588 | |
| | | | | |
| | |
Shares or
Principal
Amount | | | Short-Term Investments (2.6%) | | Value | |
| | 3,459,124 | | | Thrivent Financial Securities Lending Trust | | | 3,459,124 | |
| | | | | |
| | | | Total Short-Term Investments (at amortized cost) | | | 3,459,124 | |
| | | | | |
| | | | Total Investments (cost $129,070,720) 110.5% | | | $146,132,155 | |
| | | | | |
| | | | Other Assets and Liabilities, Net (10.5%) | | | (13,859,003 | ) |
| | | | | |
| | | | Total Net Assets 100.0% | | | $132,273,152 | |
| | | | | |
a | Non-income producing security. |
b | All or a portion of the security is on loan. |
Unrealized Appreciation (Depreciation)
Gross unrealized appreciation and depreciation of investments, based on cost for federal income tax purposes, were as follows:
| | | | |
Gross unrealized appreciation | | $ | 19,491,598 | |
Gross unrealized depreciation | | | (3,157,214 | ) |
| | | | |
Net unrealized appreciation (depreciation) | | $ | 16,334,384 | |
| |
Cost for federal income tax purposes | | $ | 129,797,771 | |
The accompanying Notes to Financial Statements are an integral part of this schedule.
111
Partner Small Cap Growth Fund
Schedule of Investments as of October 31, 2012
Fair Valuation Measurements
The following table is a summary of the inputs used, as of October 31, 2012, in valuing Partner Small Cap Growth Fund’s assets carried at fair value.
| | | | | | | | | | | | | | | | |
Investments in Securities | | Total | | | Level 1 | | | Level 2 | | | Level 3 | |
| | | | |
Common Stock | | | | | | | | | | | | | | | | |
Consumer Discretionary | | | 23,100,794 | | | | 23,100,794 | | | | – | | | | – | |
Consumer Staples | | | 5,338,337 | | | | 5,338,337 | | | | – | | | | – | |
Energy | | | 7,562,322 | | | | 7,562,322 | | | | – | | | | – | |
Financials | | | 10,703,220 | | | | 10,703,220 | | | | – | | | | – | |
Health Care | | | 22,567,472 | | | | 22,567,472 | | | | – | | | | – | |
Industrials | | | 21,136,683 | | | | 21,136,683 | | | | – | | | | – | |
Information Technology | | | 30,055,972 | | | | 30,055,972 | | | | – | | | | – | |
Materials | | | 6,476,717 | | | | 6,476,717 | | | | – | | | | – | |
Telecommunications Services | | | 948,045 | | | | 948,045 | | | | – | | | | – | |
Utilities | | | 93,881 | | | | 93,881 | | | | – | | | | – | |
Collateral Held for Securities Loaned | | | 14,689,588 | | | | 14,689,588 | | | | – | | | | – | |
Short-Term Investments | | | 3,459,124 | | | | 3,459,124 | | | | – | | | | – | |
| |
Total | | | $146,132,155 | | | | $146,132,155 | | | | $– | | | | $– | |
| |
There were no significant transfers between Levels during the period ended October 31, 2012. Transfers between Levels are identified as of the end of the period.
Investment in Affiliates
Affiliated issuers, as defined under the Investment Company Act of 1940, include those in which the Fund’s holdings of an issuer represent 5% or more of the outstanding voting securities of an issuer, or any affiliated mutual fund.
A summary of transactions for the fiscal year to date, in Partner Small Cap Growth Fund, is as follows:
| | | | | | | | | | | | | | | | | | | | | | | | |
Fund | | Value
October 31, 2011 | | | Gross
Purchases | | | Gross
Sales | | | Shares Held at
October 31, 2012 | | | Value
October 31, 2012 | | | Income Earned
November 1, 2011 -
October 31, 2012 | |
Securities Lending Trust-Collateral Investment | | | $11,198,490 | | | | $78,500,348 | | | | $75,009,250 | | | | 14,689,588 | | | | $14,689,588 | | | | $98,248 | |
Securities Lending Trust-Short Term Investment | | | – | | | | 5,538,720 | | | | 2,079,596 | | | | 3,459,124 | | | | 3,459,124 | | | | 310 | |
Total Value and Income Earned | | | 11,198,490 | | | | | | | | | | | | | | | | 18,148,712 | | | | 98,558 | |
The accompanying Notes to Financial Statements are an integral part of this schedule.
112
Partner Small Cap Value Fund
Schedule of Investments as of October 31, 2012
| | | | | | | | |
| Shares | | | Common Stock (97.7%) | | Value | |
| Consumer Discretionary (15.4%) | | | | |
| | 173,000 | | | Aaron’s, Inc. | | | $5,333,590 | |
| | 29,000 | | | Ascent Capital Group, Inc.a | | | 1,724,050 | |
| | 46,000 | | | CSS Industries, Inc. | | | 924,600 | |
| | 94,500 | | | Dorman Products, Inc.a | | | 2,886,975 | |
| | 84,500 | | | Drew Industries, Inc.a | | | 2,676,115 | |
| | 51,000 | | | Ethan Allen Interiors, Inc.b | | | 1,499,910 | |
| | 111,500 | | | Fifth & Pacific Companies, Inc.a | | | 1,224,270 | |
| | 75,000 | | | Fred’s, Inc. | | | 1,016,250 | |
| | 82,000 | | | Haverty Furniture Companies, Inc. | | | 1,230,820 | |
| | 36,000 | | | Hooker Furniture Corporation | | | 491,040 | |
| | 55,500 | | | M/I Homes, Inc.a | | | 1,234,875 | |
| | 83,900 | | | MarineMax, Inc.a | | | 690,497 | |
| | 48,500 | | | Matthews International Corporation | | | 1,395,345 | |
| | 64,000 | | | Men’s Wearhouse, Inc. | | | 2,098,560 | |
| | 86,500 | | | Meritage Homes Corporationa | | | 3,198,770 | |
| | 83,900 | | | Modine Manufacturing Companya | | | 570,520 | |
| | 166,900 | | | Orient-Express Hotels, Ltd.a | | | 1,957,737 | |
| | 127,000 | | | Shiloh Industries, Inc. | | | 1,445,260 | |
| | 56,000 | | | Stanley Furniture Company, Inc.a | | | 260,400 | |
| | 140,000 | | | Stein Mart, Inc.a | | | 1,100,400 | |
| | 23,200 | | | Steven Madden, Ltd.a | | | 995,744 | |
| | | | | |
| | | | Total | | | 33,955,728 | |
| | | | | |
| |
| Consumer Staples (0.5%) | | | | |
| | 214,000 | | | Alliance One International, Inc.a | | | 650,560 | |
| | 25,200 | | | Nash Finch Company | | | 484,596 | |
| | | | | |
| | | | Total | | | 1,135,156 | |
| | | | | |
| |
| Energy (4.0%) | | | | |
| | 29,100 | | | C&J Energy Services, Inc.a,b | | | 563,958 | |
| | 6,500 | | | Carbo Ceramics, Inc.b | | | 480,675 | |
| | 81,200 | | | Cloud Peak Energy, Inc.a | | | 1,713,320 | |
| | 76,000 | | | Gulf Island Fabrication, Inc. | | | 1,803,480 | |
| | 185,000 | | | Hercules Offshore, Inc.a | | | 880,600 | |
| | 34,600 | | | PDC Energy, Inc.a | | | 1,047,342 | |
| | 61,300 | | | Swift Energy Companya | | | 1,024,323 | |
| | 207,000 | | | Teekay Tankers, Ltd.b | | | 712,080 | |
| | 105,500 | | | Tetra Technologies, Inc.a | | | 564,425 | |
| | | | | |
| | | | Total | | | 8,790,203 | |
| | | | | |
| |
| Financials (24.7%) | | | | |
| | 66,000 | | | Alterra Capital Holdings, Ltd. | | | 1,612,380 | |
| | 165,000 | | | Ares Capital Corporation | | | 2,880,900 | |
| | 28,400 | | | Assured Guaranty, Ltd. | | | 394,476 | |
| | 155,000 | | | CBL & Associates Properties, Inc. | | | 3,467,350 | |
| | 246,500 | | | Cedar Realty Trust, Inc. | | | 1,303,985 | |
| | 334,700 | | | CoBiz Financial, Inc. | | | 2,386,411 | |
| | 60,100 | | | Columbia Banking System, Inc. | | | 1,064,371 | |
| | 45,400 | | | Compass Diversified Holdings | | | 653,760 | |
| | 113,300 | | | Cousins Properties, Inc. | | | 952,853 | |
| | 94,000 | | | East West Bancorp, Inc. | | | 2,001,260 | |
| | 39,000 | | | Employers Holdings, Inc. | | | 711,750 | |
| | 96,900 | | | First Potomac Realty Trust | | | 1,154,079 | |
| | 77,100 | | | Glacier Bancorp, Inc. | | | 1,117,950 | |
| | 77,800 | | | Golub Capital BDC, Inc. | | | 1,216,014 | |
| | 53,500 | | | Hatteras Financial Corporation | | | 1,458,945 | |
| | 161,000 | | | Hercules Technology Growth Capital, Inc. | | | 1,738,800 | |
| | 74,400 | | | Home Bancshares, Inc. | | | 2,577,216 | |
| | 20,600 | | | iShares Russell 2000 Value Index Fund | | | 1,500,092 | |
| | 50,100 | | | JMP Group, Inc. | | | 277,554 | |
| | 47,000 | | | Kilroy Realty Corporation | | | 2,087,270 | |
| | 295,800 | | | Kite Realty Group Trust | | | 1,618,026 | |
| | 72,000 | | | LaSalle Hotel Properties | | | 1,723,680 | |
| | 2,200 | | | Markel Corporationa | | | 1,038,268 | |
| | 88,000 | | | Meadowbrook Insurance Group, Inc. | | | 494,560 | |
| | 66,000 | | | National Interstate Corporation | | | 1,712,700 | |
| | 14,600 | | | Potlatch Corporation | | | 561,808 | |
| | 57,000 | | | ProAssurance Corporation | | | 5,095,800 | |
| | 86,700 | | | Radian Group, Inc.b | | | 406,623 | |
| | 170,100 | | | Redwood Trust, Inc. | | | 2,651,859 | |
| | 111,000 | | | Safeguard Scientifics, Inc.a | | | 1,759,350 | |
| | 98,000 | | | Sandy Spring Bancorp, Inc. | | | 1,873,760 | |
| | 15,400 | | | Stifel Financial Corporationa | | | 488,180 | |
| | 45,100 | | | SVB Financial Groupa | | | 2,552,209 | |
| | 54,200 | | | Wintrust Financial Corporation | | | 2,002,690 | |
| | | | | |
| | | | Total | | | 54,536,929 | |
| | | | | |
| |
| Health Care (4.1%) | | | | |
| | 7,600 | | | Analogic Corporation | | | 559,816 | |
| | 5,800 | | | Atrion Corporation | | | 1,178,792 | |
| | 517,200 | | | Lexicon Pharmaceuticals, Inc.a | | | 1,070,604 | |
| | 29,500 | | | National Healthcare Corporation | | | 1,404,790 | |
| | 78,000 | | | Triple-S Management Corporationa | | | 1,407,120 | |
| | 58,000 | | | Vanguard Health Systems, Inc.a | | | 561,440 | |
| | 51,000 | | | West Pharmaceutical Services, Inc. | | | 2,747,370 | |
| | | | | |
| | | | Total | | | 8,929,932 | |
| | | | | |
| |
| Industrials (25.6%) | | | | |
| | 51,000 | | | A.O. Smith Corporation | | | 3,099,270 | |
| | 81,000 | | | Aegion Corporationa | | | 1,496,070 | |
| | 73,500 | | | Alaska Air Group, Inc.a | | | 2,810,640 | |
| | 33,200 | | | Applied Industrial Technologies, Inc. | | | 1,347,588 | |
| | 28,800 | | | Astec Industries, Inc.a | | | 829,440 | |
| | 121,000 | | | Beacon Roofing Supply, Inc.a | | | 3,913,140 | |
| | 48,700 | | | Belden, Inc. | | | 1,743,460 | |
| | 20,300 | | | Cascade Corporation | | | 1,319,297 | |
| | 31,000 | | | Circor International, Inc. | | | 1,069,190 | |
| | 76,000 | | | Comfort Systems USA, Inc. | | | 828,400 | |
| | 66,000 | | | Dolan Companya | | | 305,580 | |
| | 20,600 | | | Franklin Electric Company, Inc. | | | 1,193,564 | |
| | 19,600 | | | FTI Consulting, Inc.a | | | 508,816 | |
| | 53,900 | | | G & K Services, Inc. | | | 1,738,275 | |
| | 68,500 | | | Genesee & Wyoming, Inc.a | | | 4,964,195 | |
| | 93,000 | | | Gibraltar Industries, Inc.a | | | 1,158,780 | |
| | 90,000 | | | Greenbrier Companies, Inc.a | | | 1,566,900 | |
| | 35,300 | | | Hub Group, Inc.a | | | 1,094,653 | |
| | 44,000 | | | IDEX Corporation | | | 1,871,320 | |
| | 41,500 | | | Kaman Corporation | | | 1,543,800 | |
| | 82,000 | | | Kforce, Inc.a | | | 914,300 | |
| | 64,500 | | | Kirby Corporationa | | | 3,707,460 | |
| | 111,000 | | | Kratos Defense & Security Solutions, Inc.a | | | 611,610 | |
| | 98,000 | | | McGrath Rentcorp | | | 2,573,480 | |
| | 35,000 | | | Mine Safety Appliances Company | | | 1,351,000 | |
| | 103,000 | | | Navigant Consulting, Inc.a | | | 1,070,170 | |
| | 39,000 | | | Nordson Corporation | | | 2,302,170 | |
| | 12,100 | | | RBC Bearings, Inc.a | | | 600,886 | |
| | 28,800 | | | Robbins & Myers, Inc. | | | 1,707,264 | |
The accompanying Notes to Financial Statements are an integral part of this schedule.
113
Partner Small Cap Value Fund
Schedule of Investments as of October 31, 2012
| | | | | | | | |
| Shares | | | Common Stock (97.7%) | | Value | |
| Industrials (25.6%) - continued | | | | |
| | 22,000 | | | Sterling Construction Company, Inc.a | | | $195,800 | |
| | 37,500 | | | Sun Hydraulics Corporationb | | | 999,000 | |
| | 25,000 | | | Universal Forest Products, Inc. | | | 962,500 | |
| | 69,500 | | | Universal Truckload Services, Inc. | | | 1,100,880 | |
| | 77,000 | | | Vitran Corporation, Inc.a | | | 402,710 | |
| | 54,000 | | | Waste Connections, Inc. | | | 1,772,820 | |
| | 56,500 | | | Woodward, Inc. | | | 1,892,750 | |
| | | | | |
| | | | Total | | | 56,567,178 | |
| | | | | |
| |
| Information Technology (8.5%) | | | | |
| | 61,200 | | | Accelrys, Inc.a | | | 547,740 | |
| | 96,400 | | | Advanced Energy Industries, Inc.a | | | 1,138,484 | |
| | 31,500 | | | ATMI, Inc.a | | | 622,125 | |
| | 78,500 | | | Brooks Automation, Inc. | | | 566,770 | |
| | 32,800 | | | Cabot Microelectronics Corporation | | | 977,440 | |
| | 25,000 | | | Cognex Corporation | | | 911,500 | |
| | 53,000 | | | Cohu, Inc. | | | 466,400 | |
| | 107,000 | | | Electro Rent Corporation | | | 1,682,040 | |
| | 64,000 | | | Electro Scientific Industries, Inc. | | | 683,520 | |
| | 136,600 | | | Intevac, Inc.a | | | 683,000 | |
| | 14,600 | | | Littelfuse, Inc. | | | 782,560 | |
| | 76,500 | | | Methode Electronics, Inc. | | | 774,180 | |
| | 57,000 | | | Monotype Imaging Holdings, Inc. | | | 872,670 | |
| | 34,700 | | | Newport Corporationa | | | 375,454 | |
| | 92,000 | | | Progress Software Corporationa | | | 1,814,240 | |
| | 42,500 | | | RealNetworks, Inc.a | | | 321,725 | |
| | 135,600 | | | ShoreTel, Inc.a | | | 600,708 | |
| | 270,000 | | | Sonus Networks, Inc.a | | | 502,200 | |
| | 56,000 | | | Synnex Corporationa | | | 1,813,840 | |
| | 65,000 | | | Teradyne, Inc.a | | | 950,300 | |
| | 57,000 | | | Xyratex, Ltd. | | | 471,390 | |
| | 67,000 | | | Zygo Corporationa | | | 1,247,540 | |
| | | | | |
| | | | Total | | | 18,805,826 | |
| | | | | |
| |
| Materials (9.2%) | | | | |
| | 34,300 | | | AMCOL International Corporation | | | 1,083,194 | |
| | 60,000 | | | AptarGroup, Inc. | | | 3,076,800 | |
| | 22,700 | | | Carpenter Technology Corporation | | | 1,103,447 | |
| | 68,000 | | | Clearwater Paper Corporationa | | | 2,688,720 | |
| | 48,700 | | | Franco-Nevada Corporation | | | 2,804,242 | |
| | 18,300 | | | Haynes International, Inc. | | | 927,444 | |
| | 78,100 | | | Innospec, Inc.a | | | 2,528,878 | |
| | 20,400 | | | Minerals Technologies, Inc. | | | 1,461,864 | |
| | 104,000 | | | Myers Industries, Inc. | | | 1,542,320 | |
| | 146,500 | | | North American Palladium, Ltd.a,b | | | 230,005 | |
| | 28,000 | | | Schnitzer Steel Industries, Inc. | | | 798,280 | |
| | 15,100 | | | Texas Industries, Inc.a,b | | | 651,263 | |
| | 179,000 | | | Wausau Paper Corporation | | | 1,480,330 | |
| | | | | |
| | | | Total | | | 20,376,787 | |
| | | | | |
| |
| Telecommunications Services (0.3%) | | | | |
| | 83,000 | | | Premiere Global Services, Inc.a | | | 705,500 | |
| | | | | |
| | | | Total | | | 705,500 | |
| | | | | |
| |
| Utilities (5.4%) | | | | |
| | 26,000 | | | Black Hills Corporation | | | 930,020 | |
| | 84,000 | | | Cleco Corporation | | | 3,624,600 | |
| | 56,700 | | | El Paso Electric Company | | | 1,927,233 | |
| | 46,000 | | | NorthWestern Corporation | | | 1,647,260 | |
| | 44,400 | | | PNM Resources, Inc. | | | 983,904 | |
| | 55,800 | | | Southwest Gas Corporation | | | 2,425,626 | |
| | 15,300 | | | Vectren Corporation | | | 452,421 | |
| | | | | |
| | | | Total | | | 11,991,064 | |
| | | | | |
| | | | | | | | |
| | | | | |
| | | | Total Common Stock (cost $159,349,005) | | | 215,794,303 | |
| | | | | |
| | |
| Shares | | | Preferred Stock (0.7%) | | Value | |
| Financials (0.5%) | | | | |
| | 705 | | | East West Bancorp, Inc.c | | | 1,046,925 | |
| | | | | |
| | | | Total | | | 1,046,925 | |
| | | | | |
| |
| Health Care (0.2%) | | | | |
| | 37,800 | | | National Healthcare Corporation, Convertiblec | | | 584,766 | |
| | | | | |
| | | | Total | | | 584,766 | |
| | | | | |
| | | | | | | | |
| | | | | |
| | | | Total Preferred Stock (cost $1,186,284) | | | 1,631,691 | |
| | | | | |
| | |
| Shares | | | Collateral Held for Securities Loaned (2.1%) | | Value | |
| | 4,654,850 | | | Thrivent Financial Securities Lending Trust | | | 4,654,850 | |
| | | | | |
| | | | Total Collateral Held for Securities Loaned (cost $4,654,850) | | | 4,654,850 | |
| | | | | |
| | |
Shares or
Principal
Amount | | | Short-Term Investments (1.5%) | | Value | |
| | 3,272,308 | | | Thrivent Financial Securities Lending Trust | | | 3,272,308 | |
| | | | | |
| | | | Total Short-Term Investments (at amortized cost) | | | 3,272,308 | |
| | | | | |
| | | | Total Investments (cost $168,462,447) 102.0% | | | $225,353,152 | |
| | | | | |
| | | | Other Assets and Liabilities, Net (2.0%) | | | (4,432,559 | ) |
| | | | | |
| | | | Total Net Assets 100.0% | | | $220,920,593 | |
| | | | | |
a | Non-income producing security. |
b | All or a portion of the security is on loan. |
c | Denotes perpetual securities. Perpetual securities pay an indefinite stream of interest, but may be called by the issuer at an earlier date. |
Unrealized Appreciation (Depreciation)
Gross unrealized appreciation and depreciation of investments, based on cost for federal income tax purposes, were as follows:
| | | | |
Gross unrealized appreciation | | $ | 67,475,988 | |
Gross unrealized depreciation | | | (12,214,974 | ) |
| | | | |
Net unrealized appreciation (depreciation) | | $ | 55,261,014 | |
| |
Cost for federal income tax purposes | | $ | 170,092,138 | |
The accompanying Notes to Financial Statements are an integral part of this schedule.
114
Partner Small Cap Value Fund
Schedule of Investments as of October 31, 2012
Fair Valuation Measurements
The following table is a summary of the inputs used, as of October 31, 2012, in valuing Partner Small Cap Value Fund’s assets carried at fair value.
| | | | | | | | | | | | | | | | |
Investments in Securities | | Total | | | Level 1 | | | Level 2 | | | Level 3 | |
| | | | |
Common Stock | | | | | | | | | | | | | | | | |
Consumer Discretionary | | | 33,955,728 | | | | 33,955,728 | | | | – | | | | – | |
Consumer Staples | | | 1,135,156 | | | | 1,135,156 | | | | – | | | | – | |
Energy | | | 8,790,203 | | | | 8,790,203 | | | | – | | | | – | |
Financials | | | 54,536,929 | | | | 54,536,929 | | | | – | | | | – | |
Health Care | | | 8,929,932 | | | | 8,929,932 | | | | – | | | | – | |
Industrials | | | 56,567,178 | | | | 56,567,178 | | | | – | | | | – | |
Information Technology | | | 18,805,826 | | | | 18,805,826 | | | | – | | | | – | |
Materials | | | 20,376,787 | | | | 17,572,545 | | | | 2,804,242 | | | | – | |
Telecommunications Services | | | 705,500 | | | | 705,500 | | | | – | | | | – | |
Utilities | | | 11,991,064 | | | | 11,991,064 | | | | – | | | | – | |
| | | | |
Preferred Stock | | | | | | | | | | | | | | | | |
Financials | | | 1,046,925 | | | | – | | | | 1,046,925 | | | | – | |
Health Care | | | 584,766 | | | | 584,766 | | | | – | | | | – | |
Collateral Held for Securities Loaned | | | 4,654,850 | | | | 4,654,850 | | | | – | | | | – | |
Short-Term Investments | | | 3,272,308 | | | | 3,272,308 | | | | – | | | | – | |
| |
Total | | | $225,353,152 | | | | $221,501,985 | | | | $3,851,167 | | | | $– | |
| |
There were no significant transfers between Levels during the period ended October 31, 2012. Transfers between Levels are identified as of the end of the period.
The following table summarizes the net realized gains/(losses) and Statement of Operations location, for the period ended October 31, 2012, for Partner Small Cap Value Fund’s investments in financial derivative instruments by primary risk exposure.
| | | | | | |
Derivatives by risk category | | Statement of Operations Location | | Realized Gains/(Losses)
recognized in Income | |
| | |
Foreign Exchange Contracts | | | | | | |
Forward Contracts | | Net realized gains/(losses) on Foreign currency transactions | | | (85 | ) |
| | |
Total Foreign Exchange Contracts | | | | | (85 | ) |
| |
Total | | | | | ($85 | ) |
| |
The following table presents Partner Small Cap Value Fund’s average volume of derivative activity during the period ended October 31, 2012.
| | | | | | | | |
Derivative Risk Category | | Forwards
(Notional*) | | | Forwards
(Percentage
of Average
Net Assets) | |
Foreign Exchange Contracts | | | $786 | | | | <0.1% | |
* | Notional amount represents long or short, or both, derivative positions held by the Fund. |
Investment in Affiliates
Affiliated issuers, as defined under the Investment Company Act of 1940, include those in which the Fund’s holdings of an issuer represent 5% or more of the outstanding voting securities of an issuer, or any affiliated mutual fund.
A summary of transactions for the fiscal year to date, in Partner Small Cap Value Fund, is as follows:
| | | | | | | | | | | | | | | | | | | | | | | | |
Fund | | Value
October 31, 2011 | | | Gross
Purchases | | | Gross
Sales | | | Shares Held at
October 31, 2012 | | | Value
October 31, 2012 | | | Income Earned
November 1, 2011 -
October 31, 2012 | |
Securities Lending Trust-Collateral Investment | | | $12,183,249 | | | | $50,153,788 | | | | $57,682,187 | | | | 4,654,850 | | | | $4,654,850 | | | | $130,123 | |
Securities Lending Trust-Short Term Investment | | | – | | | | 3,951,743 | | | | 679,435 | | | | 3,272,308 | | | | 3,272,308 | | | | 326 | |
Total Value and Income Earned | | | 12,183,249 | | | | | | | | | | | | | | | | 7,927,158 | | | | 130,449 | |
The accompanying Notes to Financial Statements are an integral part of this schedule.
115
Small Cap Stock Fund
Schedule of Investments as of October 31, 2012
| | | | | | | | |
| Shares | | | Common Stock (85.0%) | | Value | |
| Consumer Discretionary (10.9%) | | | | |
| | 96,400 | | | Children’s Place Retail Stores, Inc.a | | | $5,632,652 | |
| | 207,907 | | | Foot Locker, Inc. | | | 6,964,885 | |
| | 74,800 | | | GNC Holdings, Inc. | | | 2,892,516 | |
| | 105,845 | | | Life Time Fitness, Inc.a | | | 4,751,382 | |
| | 144,100 | | | Meredith Corporationb | | | 4,823,027 | |
| | 269,080 | | | Pier 1 Imports, Inc. | | | 5,489,232 | |
| | | | | |
| | | | Total | | | 30,553,694 | |
| | | | | |
| |
| Consumer Staples (4.0%) | | | | |
| | 64,292 | | | Annie’s, Inc.a,b | | | 2,539,534 | |
| | 141,292 | | | Ingredion, Inc. | | | 8,683,806 | |
| | | | | |
| | | | Total | | | 11,223,340 | |
| | | | | |
| |
| Energy (3.9%) | | | | |
| | 19,818 | | | Oasis Petroleum, Inc.a | | | 582,055 | |
| | 432,308 | | | Petroleum Geo-Services ASA | | | 7,470,076 | |
| | 162,509 | | | Swift Energy Companya | | | 2,715,525 | |
| | | | | |
| | | | Total | | | 10,767,656 | |
| | | | | |
| |
| Financials (24.1%) | | | | |
| | 42,032 | | | Affiliated Managers Group, Inc.a | | | 5,317,048 | |
| | 45,200 | | | Allied World Assurance Company Holdings AG | | | 3,629,560 | |
| | 74,800 | | | American Assets Trust, Inc. | | | 2,032,316 | |
| | 71,600 | | | American Campus Communities, Inc. | | | 3,244,196 | |
| | 110,300 | | | Aspen Insurance Holdings, Ltd. | | | 3,568,205 | |
| | 108,900 | | | BioMed Realty Trust, Inc. | | | 2,082,168 | |
| | 267,800 | | | DCT Industrial Trust, Inc. | | | 1,727,310 | |
| | 139,000 | | | Douglas Emmett, Inc. | | | 3,259,550 | |
| | 45,700 | | | Equity Lifestyle Properties, Inc. | | | 3,076,981 | |
| | 52,100 | | | Extra Space Storage, Inc. | | | 1,796,929 | |
| | 97,600 | | | HCC Insurance Holdings, Inc. | | | 3,478,464 | |
| | 53,400 | | | Highwoods Properties, Inc. | | | 1,722,150 | |
| | 50,600 | | | Home Properties, Inc. | | | 3,075,974 | |
| | 55,400 | | | iShares Russell 2000 Index Fund | | | 4,500,696 | |
| | 86,400 | | | Pebblebrook Hotel Trust | | | 1,833,408 | |
| | 261,409 | | | Popular, Inc.a | | | 5,053,036 | |
| | 33,500 | | | ProAssurance Corporation | | | 2,994,900 | |
| | 97,400 | | | SVB Financial Groupa | | | 5,511,866 | |
| | 37,754 | | | Taubman Centers, Inc. | | | 2,965,577 | |
| | 132,566 | | | Tower Group, Inc. | | | 2,388,839 | |
| | 197,537 | | | Zions Bancorporation | | | 4,241,119 | |
| | | | | |
| | | | Total | | | 67,500,292 | |
| | | | | |
| |
| Health Care (5.3%) | | | | |
| | 124,500 | | | Align Technology, Inc.a | | | 3,309,210 | |
| | 160,300 | | | Endo Pharmaceutical Holdings, Inc.a | | | 4,594,198 | |
| | 22,554 | | | HeartWare International, Inc.a,b | | | 1,894,085 | |
| | 65,338 | | | United Therapeutics Corporationa | | | 2,983,986 | |
| | 136,600 | | | VIVUS, Inc.a,b | | | 2,035,340 | |
| | | | | |
| | | | Total | | | 14,816,819 | |
| | | | | |
| |
| Industrials (14.8%) | | | | |
| | 268,300 | | | Actuant Corporation | | | 7,576,791 | |
| | 272,311 | | | EMCOR Group, Inc. | | | 8,757,522 | |
| | 174,400 | | | GATX Corporation | | | 7,230,624 | |
| | 76,954 | | | HNI Corporation | | | 2,117,774 | |
| | 118,900 | | | Landstar System, Inc. | | | 6,022,285 | |
| | 292,687 | | | Manitowoc Company, Inc. | | | 4,170,790 | |
| | 55,100 | | | Manpower, Inc. | | | 2,090,494 | |
| | 106,300 | | | Woodward, Inc. | | | 3,561,050 | |
| | | | | |
| | | | Total | | | 41,527,330 | |
| | | | | |
| |
| Information Technology (12.2%) | | | | |
| | 152,900 | | | Aruba Networks, Inc.a,b | | | 2,778,193 | |
| | 405,100 | | | Atmel Corporationa | | | 1,889,791 | |
| | 137,900 | | | Cavium, Inc.a,b | | | 4,575,522 | |
| | 70,700 | | | Informatica Corporationa | | | 1,918,798 | |
| | 196,336 | | | Plantronics, Inc. | | | 6,369,140 | |
| | 489,919 | | | Teradyne, Inc.a | | | 7,162,616 | |
| | 155,883 | | | TIBCO Software, Inc.a | | | 3,929,810 | |
| | 107,300 | | | VeriFone Systems, Inc.a | | | 3,180,372 | |
| | 294,200 | | | Vishay Intertechnology, Inc.a | | | 2,435,976 | |
| | 699 | | | Workday, Inc.a | | | 33,902 | |
| | | | | |
| | | | Total | | | 34,274,120 | |
| | | | | |
| |
| Materials (5.0%) | | | | |
| | 417,500 | | | AK Steel Holding Corporation | | | 2,104,200 | |
| | 68,600 | | | Buckeye Technologies, Inc. | | | 1,797,320 | |
| | 44,400 | | | Eagle Materials, Inc. | | | 2,351,868 | |
| | 90,800 | | | H.B. Fuller Company | | | 2,760,320 | |
| | 80,100 | | | Materials Select Sector SPDR Fund | | | 2,882,799 | |
| | 124,200 | | | SunCoke Energy, Inc.a | | | 1,995,894 | |
| | | | | |
| | | | Total | | | 13,892,401 | |
| | | | | |
| |
| Utilities (4.8%) | | | | |
| | 284,800 | | | PNM Resources, Inc. | | | 6,311,168 | |
| | 161,491 | | | Southwest Gas Corporation | | | 7,020,014 | |
| | | | | |
| | | | Total | | | 13,331,182 | |
| | | | | |
| | | | | | | | |
| | | | | |
| | | | Total Common Stock (cost $230,002,332) | | | 237,886,834 | |
| | | | | |
| | |
| Shares | | | Collateral Held for Securities Loaned (6.6%) | | Value | |
| | 18,604,753 | | | Thrivent Financial Securities Lending Trust | | | 18,604,753 | |
| | | | | |
| | | | Total Collateral Held for Securities Loaned (cost $18,604,753) | | | 18,604,753 | |
| | | | | |
| | |
Shares or
Principal
Amount | | | Short-Term Investments (15.1%) | | Value | |
| | | | Federal Home Loan Mortgage Corporation Discount Notes | | | | |
| | 1,700,000 | | | 0.160%, 12/17/2012c,d | | | 1,699,653 | |
| | 29,007,394 | | | Thrivent Financial Securities Lending Trust U.S. Treasury Bills | | | 29,007,394 | |
| | 10,000,000 | | | 0.115%, 11/8/2012c | | | 9,999,776 | |
| | 1,600,000 | | | 0.125%, 1/17/2013c,d | | | 1,599,572 | |
| | | | | |
| | | | Total Short-Term Investments (at amortized cost) | | | 42,306,395 | |
| | | | | |
| | | | Total Investments (cost $290,913,480) 106.7% | | $ | 298,797,982 | |
| | | | | |
| | | | Other Assets and Liabilities, Net (6.7%) | | | (18,767,877 | ) |
| | | | | |
| | | | Total Net Assets 100.0% | | $ | 280,030,105 | |
| | | | | |
The accompanying Notes to Financial Statements are an integral part of this schedule.
116
Small Cap Stock Fund
Schedule of Investments as of October 31, 2012
a | Non-income producing security. |
b | All or a portion of the security is on loan. |
c | The interest rate shown reflects the yield, coupon rate or the discount rate at the date of purchase. |
d | At October 31, 2012, $3,299,225 of investments were held on deposit with the counterparty and pledged as the initial margin deposit for open futures contracts. |
Unrealized Appreciation (Depreciation)
Gross unrealized appreciation and depreciation of investments, based on cost for federal income tax purposes, were as follows:
| | | | |
Gross unrealized appreciation | | $ | 24,266,339 | |
Gross unrealized depreciation | | | (16,382,044 | ) |
| | | | |
Net unrealized appreciation (depreciation) | | $ | 7,884,295 | |
| |
Cost for federal income tax purposes | | $ | 290,913,687 | |
Fair Valuation Measurements
The following table is a summary of the inputs used, as of October 31, 2012, in valuing Small Cap Stock Fund’s assets carried at fair value.
| | | | | | | | | | | | | | | | |
Investments in Securities | | Total | | | Level 1 | | | Level 2 | | | Level 3 | |
| | | | |
Common Stock | | | | | | | | | | | | | | | | |
Consumer Discretionary | | | 30,553,694 | | | | 30,553,694 | | | | – | | | | – | |
Consumer Staples | | | 11,223,340 | | | | 11,223,340 | | | | – | | | | – | |
Energy | | | 10,767,656 | | | | 3,297,580 | | | | 7,470,076 | | | | – | |
Financials | | | 67,500,292 | | | | 67,500,292 | | | | – | | | | – | |
Health Care | | | 14,816,819 | | | | 14,816,819 | | | | – | | | | – | |
Industrials | | | 41,527,330 | | | | 41,527,330 | | | | – | | | | – | |
Information Technology | | | 34,274,120 | | | | 34,274,120 | | | | – | | | | – | |
Materials | | | 13,892,401 | | | | 13,892,401 | | | | – | | | | – | |
Utilities | | | 13,331,182 | | | | 13,331,182 | | | | – | | | | – | |
Collateral Held for Securities Loaned | | | 18,604,753 | | | | 18,604,753 | | | | – | | | | – | |
Short-Term Investments | | | 42,306,395 | | | | 29,007,394 | | | | 13,299,001 | | | | – | |
| |
Total | | | $298,797,982 | | | | $278,028,905 | | | | $20,769,077 | | | | $– | |
| |
| | | | |
Other Financial Instruments | | Total | | | Level 1 | | | Level 2 | | | Level 3 | |
| | | | |
Liability Derivatives | | | | | | | | | | | | | | | | |
Futures Contracts | | | 1,633,417 | | | | 1,633,417 | | | | – | | | | – | |
| |
Total Liability Derivatives | | | $1,633,417 | | | | $1,633,417 | | | | $– | | | | $– | |
| |
There were no significant transfers between Levels during the period ended October 31, 2012. Transfers between Levels are identified as of the end of the period.
| | | | | | | | | | | | | | | | | | | | |
Futures Contracts | | Number of
Contracts
Long/(Short) | | | Expiration
Date | | | Notional
Principal
Amount | | | Value | | | Unrealized
Gain/(Loss) | |
Russell 2000 Index Mini-Futures | | | 403 | | | | December 2012 | | | $ | 34,530,307 | | | $ | 32,896,890 | | | ($ | 1,633,417 | ) |
Total Futures Contracts | | | | | | | | | | | | | | | | | | ($ | 1,633,417 | ) |
The following table summarizes the fair value and Statement of Assets and Liabilities location, as of October 31, 2012, for Small Cap Stock Fund’s investments in financial derivative instruments by primary risk exposure as discussed under item (2) Significant Accounting Policies of the Notes to Financial Statements.
| | | | | | |
Derivatives by risk category | | Statement of Assets and Liabilities Location | | Fair Value | |
| | |
Liability Derivatives | | | | | | |
| | |
Equity Contracts | | | | | | |
Futures* | | Net Assets - Net unrealized appreciation/(depreciation) on Futures contracts | | $ | 1,633,417 | |
Total Equity Contracts | | | | | 1,633,417 | |
Total Liability Derivatives | | | | $ | 1,633,417 | |
| |
* | Includes cumulative appreciation/depreciation of futures contracts as reported in the Schedule of Investments. Only current day’s variation margin is reported within the Statement of Assets and Liabilities. |
The accompanying Notes to Financial Statements are an integral part of this schedule.
117
Small Cap Stock Fund
Schedule of Investments as of October 31, 2012
The following table summarizes the net realized gains/(losses) and Statement of Operations location, for the period ended October 31, 2012, for Small Cap Stock Fund’s investments in financial derivative instruments by primary risk exposure.
| | | | | | |
Derivatives by risk category | | Statement of Operations Location | | Realized Gains/(Losses)
recognized in Income | |
| | |
Equity Contracts | | | | | | |
Futures | | Net realized gains/(losses) on Futures contracts | | | 6,901,609 | |
| | |
Total Equity Contracts | | | | | 6,901,609 | |
| | |
Foreign Exchange Contracts | | | | | | |
Forward Contracts | | Net realized gains/(losses) on Foreign currency transactions | | | (4,368) | |
| | |
Total Foreign Exchange Contracts | | | | | (4,368) | |
| |
Total | | | | | $6,897,241 | |
| |
The following table summarizes the change in net unrealized appreciation/(depreciation) and Statement of Operations location, for the period ended October 31, 2012, for Small Cap Stock Fund’s investments in financial derivative instruments by primary risk exposure.
| | | | | | |
Derivatives by risk category | | Statement of Operations Location | | Change in unrealized appreciation/(depreciation)
recognized in Income | |
| | |
Equity Contracts | | | | | | |
Futures | | Change in net unrealized appreciation/(depreciation) on Futures contracts | | | (2,714,861 | ) |
Total Equity Contracts | | | | | (2,714,861 | ) |
| |
Total | | | | | ($2,714,861 | ) |
| |
The following table presents Small Cap Stock Fund’s average volume of derivative activity during the period ended October 31, 2012.
| | | | | | | | | | | | | | | | |
Derivative Risk Category | | Futures
(Notional*) | | | Futures
(Percentage
of Average
Net Assets) | | | Forwards
(Notional*) | | | Forwards
(Percentage
of Average
Net Assets) | |
Equity Contracts | | | $29,321,258 | | | | 10.2% | | | | N/A | | | | N/A | |
Foreign Exchange Contracts | | | N/A | | | | N/A | | | | $17,400 | | | | <0.1% | |
* | Notional amount represents long or short, or both, derivative positions held by the Fund. |
Investment in Affiliates
Affiliated issuers, as defined under the Investment Company Act of 1940, include those in which the Fund’s holdings of an issuer represent 5% or more of the outstanding voting securities of an issuer, or any affiliated mutual fund.
A summary of transactions for the fiscal year to date, in Small Cap Stock Fund, is as follows:
| | | | | | | | | | | | | | | | | | | | | | | | |
Fund | | Value
October 31, 2011 | | | Gross
Purchases | | | Gross Sales | | | Shares Held at
October 31, 2012 | | | Value
October 31, 2012 | | | Income Earned
November 1, 2011 -
October 31, 2012 | |
Securities Lending Trust-Collateral Investment | | | $5,560,875 | | | | $117,788,350 | | | | $104,744,472 | | | | 18,604,753 | | | | $18,604,753 | | | | $369,593 | |
Securities Lending Trust-Short Term Investment | | | – | | | | 33,640,229 | | | | 4,632,835 | | | | 29,007,394 | | | | 29,007,394 | | | | 1,084 | |
Total Value and Income Earned | | | 5,560,875 | | | | | | | | | | | | | | | | 47,612,147 | | | | 370,677 | |
The accompanying Notes to Financial Statements are an integral part of this schedule.
118
Mid Cap Growth Fund
Schedule of Investments as of October 31, 2012
| | | | | | | | |
| Shares | | | Common Stock (95.1%) | | Value | |
| Consumer Discretionary (16.9%) | | | | |
| | 82,300 | | | Abercrombie & Fitch Company | | | $2,516,734 | |
| | 59,600 | | | Darden Restaurants, Inc. | | | 3,136,152 | |
| | 151,250 | | | Discovery Communications, Inc.a | | | 8,926,775 | |
| | 199,400 | | | Dollar Tree, Inc.a | | | 7,950,078 | |
| | 134,685 | | | GNC Holdings, Inc. | | | 5,208,269 | |
| | 126,300 | | | Limited Brands, Inc. | | | 6,048,507 | |
| | 70,000 | | | Marriott International, Inc. | | | 2,553,600 | |
| | 32,200 | | | O’Reilly Automotive, Inc.a | | | 2,758,896 | |
| | 89,600 | | | PetSmart, Inc. | | | 5,948,544 | |
| | 114,200 | | | Toll Brothers, Inc.a | | | 3,769,742 | |
| | 78,500 | | | Tractor Supply Company | | | 7,554,840 | |
| | 25,900 | | | VF Corporation | | | 4,052,832 | |
| | 31,400 | | | Wynn Resorts, Ltd. | | | 3,801,284 | |
| | | | | |
| | | | Total | | | 64,226,253 | |
| | | | | |
| |
| Consumer Staples (3.3%) | | | | |
| | 54,700 | | | Clorox Company | | | 3,954,810 | |
| | 91,599 | | | Whole Foods Market, Inc. | | | 8,677,173 | |
| | | | | |
| | | | Total | | | 12,631,983 | |
| | | | | |
| |
| Energy (10.6%) | | | | |
| | 537,700 | | | Alpha Natural Resources, Inc.a,b | | | 4,608,089 | |
| | 126,900 | | | Cameron International Corporationa | | | 6,426,216 | |
| | 62,500 | | | Concho Resources, Inc.a | | | 5,382,500 | |
| | 49,600 | | | Ensco plc | | | 2,867,872 | |
| | 157,593 | | | Helix Energy Solutions Group, Inc.a | | | 2,724,783 | |
| | 70,800 | | | Oil States International, Inc.a | | | 5,175,480 | |
| | 130,500 | | | Peabody Energy Corporation | | | 3,640,950 | |
| | 65,100 | | | Range Resources Corporation | | | 4,254,936 | |
| | 48,600 | | | SM Energy Company | | | 2,620,512 | |
| | 241,100 | | | Weatherford International, Ltd.a | | | 2,724,430 | |
| | | | | |
| | | | Total | | | 40,425,768 | |
| | | | | |
| |
| Financials (5.5%) | | | | |
| | 65,120 | | | Affiliated Managers Group, Inc.a | | | 8,237,680 | |
| | 19,200 | | | Ameriprise Financial, Inc. | | | 1,120,704 | |
| | 229,900 | | | Discover Financial Services | | | 9,425,900 | |
| | 31,600 | | | T. Rowe Price Group, Inc. | | | 2,052,104 | |
| | | | | |
| | | | Total | | | 20,836,388 | |
| | | | | |
| |
| Health Care (14.1%) | | | | |
| | 59,600 | | | Alexion Pharmaceuticals, Inc.a | | | 5,386,648 | |
| | 144,200 | | | AmerisourceBergen Corporation | | | 5,687,248 | |
| | 87,300 | | | BioMarin Pharmaceutical, Inc.a | | | 3,233,592 | |
| | 132,552 | | | Catamaran Corporationa | | | 6,251,153 | |
| | 60,600 | | | CIGNA Corporation | | | 3,090,600 | |
| | 29,200 | | | Mettler-Toledo International, Inc.a | | | 4,945,604 | |
| | 41,900 | | | Onyx Pharmaceuticals, Inc.a | | | 3,283,284 | |
| | 49,200 | | | Perrigo Company | | | 5,658,492 | |
| | 94,800 | | | PSS World Medical, Inc.a,b | | | 2,713,176 | |
| | 122,000 | | | Thoratec Corporationa | | | 4,355,400 | |
| | 103,800 | | | Watson Pharmaceuticals, Inc.a | | | 8,921,610 | |
| | | | | |
| | | | Total | | | 53,526,807 | |
| | | | | |
| |
| Industrials (15.8%) | | | | |
| | 180,277 | | | AMETEK, Inc. | | | 6,408,847 | |
| | 75,500 | | | BE Aerospace, Inc.a | | | 3,404,295 | |
| | 99,100 | | | Expeditors International of Washington, Inc. | | | 3,628,051 | |
| | 45,155 | | | Flowserve Corporation | | | 6,118,051 | |
| | 75,600 | | | Jacobs Engineering Group, Inc.a | | | 2,917,404 | |
| | 126,700 | | | JB Hunt Transport Services, Inc. | | | 7,437,290 | |
| | 86,700 | | | Kansas City Southern | | | 6,975,882 | |
| | 71,200 | | | Pentair, Ltd. | | | 3,007,488 | |
| | 144,000 | | | Quanta Services, Inc.a | | | 3,733,920 | |
| | 55,000 | | | Roper Industries, Inc. | | | 6,004,350 | |
| | 63,400 | | | SPX Corporation | | | 4,348,606 | |
| | 62,900 | | | Stericycle, Inc.a | | | 5,960,404 | |
| | | | | |
| | | | Total | | | 59,944,588 | |
| | | | | |
| |
| Information Technology (21.1%) | | | | |
| | 63,400 | | | Agilent Technologies, Inc. | | | 2,281,766 | |
| | 128,674 | | | Akamai Technologies, Inc.a | | | 4,888,325 | |
| | 105,100 | | | ANSYS, Inc.a | | | 7,449,488 | |
| | 206,980 | | | Atmel Corporationa | | | 965,562 | |
| | 120,486 | | | Autodesk, Inc.a | | | 3,836,274 | |
| | 203,000 | | | Broadcom Corporationa | | | 6,401,605 | |
| | 153,000 | | | Ciena Corporationa,b | | | 1,898,730 | |
| | 96,600 | | | F5 Networks, Inc.a | | | 7,967,568 | |
| | 113,600 | | | Fortinet, Inc.a | | | 2,200,432 | |
| | 32,200 | | | Lam Research Corporationa | | | 1,139,880 | |
| | 38,400 | | | Mercadolibre, Inc.b | | | 3,224,448 | |
| | 44,700 | | | Nice Systems, Ltd. ADRa | | | 1,488,510 | |
| | 288,719 | | | Nuance Communications, Inc.a | | | 6,426,885 | |
| | 550,000 | | | NVIDIA Corporationa | | | 6,583,500 | |
| | 233,900 | | | NXP Semiconductors NVa | | | 5,674,414 | |
| | 57,800 | | | Red Hat, Inc.a | | | 2,842,026 | |
| | 106,700 | | | Synopsys, Inc.a | | | 3,435,740 | |
| | 41,100 | | | Teradata Corporationa | | | 2,807,541 | |
| | 180,700 | | | Teradyne, Inc.a | | | 2,641,834 | |
| | 71,229 | | | VeriFone Systems, Inc.a | | | 2,111,228 | |
| | 111,800 | | | Xilinx, Inc. | | | 3,662,568 | |
| | | | | |
| | | | Total | | | 79,928,324 | |
| | | | | |
| |
| Materials (4.9%) | | | | |
| | 36,000 | | | Agrium, Inc.b | | | 3,799,440 | |
| | 17,500 | | | Airgas, Inc. | | | 1,556,975 | |
| | 55,000 | | | Celanese Corporation | | | 2,089,450 | |
| | 90,600 | | | FMC Corporation | | | 4,848,912 | |
| | 64,200 | | | Newmont Mining Corporation | | | 3,502,110 | |
| | 69,800 | | | Silver Wheaton Corporation | | | 2,826,900 | |
| | | | | |
| | | | Total | | | 18,623,787 | |
| | | | | |
| |
| Telecommunications Services (2.9%) | | | | |
| | 69,000 | | | SBA Communications Corporationa | | | 4,597,470 | |
| | 247,200 | | | TW Telecom, Inc.a | | | 6,296,184 | |
| | | | | |
| | | | Total | | | 10,893,654 | |
| | | | | |
| | | | | | | | |
| | | | | |
| | | | Total Common Stock (cost $279,492,435) | | | 361,037,552 | |
| | | | | |
| | |
| Shares | | | Collateral Held for Securities Loaned (3.2%) | | Value | |
| | 12,303,975 | | | Thrivent Financial Securities Lending Trust | | | 12,303,975 | |
| | | | | |
| | | | Total Collateral Held for Securities Loaned (cost $12,303,975) | | | 12,303,975 | |
| | | | | |
The accompanying Notes to Financial Statements are an integral part of this schedule.
119
Mid Cap Growth Fund
Schedule of Investments as of October 31, 2012
| | | | | | | | |
Shares or
Principal
Amount | | | Short-Term Investments (5.3%) | | Value | |
| | 19,928,389 | | | Thrivent Financial Securities Lending Trust | | | $19,928,389 | |
| | | | | |
| | | | Total Short-Term Investments (at amortized cost) | | | 19,928,389 | |
| | | | | |
| | | | Total Investments (cost $311,724,799) 103.6% | | | $393,269,916 | |
| | | | | |
| | | | Other Assets and Liabilities, Net (3.6%) | | | (13,560,511 | ) |
| | | | | |
| | | | Total Net Assets 100.0% | | | $379,709,405 | |
| | | | | |
a | Non-income producing security. |
b | All or a portion of the security is on loan. |
Definitions:
| | | | |
ADR | | - American Depositary Receipt, which are certificates for an underlying foreign security’s shares held by an issuing U.S. depository bank. |
Unrealized Appreciation (Depreciation)
Gross unrealized appreciation and depreciation of investments, based on cost for federal income tax purposes, were as follows:
| | | | |
Gross unrealized appreciation | | $ | 89,976,337 | |
Gross unrealized depreciation | | | (8,595,458 | ) |
| | | | |
Net unrealized appreciation (depreciation) | | $ | 81,380,879 | |
| |
Cost for federal income tax purposes | | $ | 311,889,037 | |
Fair Valuation Measurements
The following table is a summary of the inputs used, as of October 31, 2012, in valuing Mid Cap Growth Fund’s assets carried at fair value.
| | | | | | | | | | | | | | | | |
Investments in Securities | | Total | | | Level 1 | | | Level 2 | | | Level 3 | |
| | | | |
Common Stock | | | | | | | | | | | | | | | | |
Consumer Discretionary | | | 64,226,253 | | | | 64,226,253 | | | | – | | | | – | |
Consumer Staples | | | 12,631,983 | | | | 12,631,983 | | | | – | | | | – | |
Energy | | | 40,425,768 | | | | 40,425,768 | | | | – | | | | – | |
Financials | | | 20,836,388 | | | | 20,836,388 | | | | – | | | | – | |
Health Care | | | 53,526,807 | | | | 53,526,807 | | | | – | | | | – | |
Industrials | | | 59,944,588 | | | | 59,944,588 | | | | – | | | | – | |
Information Technology | | | 79,928,324 | | | | 79,928,324 | | | | – | | | | – | |
Materials | | | 18,623,787 | | | | 18,623,787 | | | | – | | | | – | |
Telecommunications Services | | | 10,893,654 | | | | 10,893,654 | | | | – | | | | – | |
Collateral Held for Securities Loaned | | | 12,303,975 | | | | 12,303,975 | | | | – | | | | – | |
Short-Term Investments | | | 19,928,389 | | | | 19,928,389 | | | | – | | | | – | |
| |
Total | | | $393,269,916 | | | | $393,269,916 | | | | $– | | | | $– | |
| |
There were no significant transfers between Levels during the period ended October 31, 2012. Transfers between Levels are identified as of the end of the period.
Investment in Affiliates
Affiliated issuers, as defined under the Investment Company Act of 1940, include those in which the Fund’s holdings of an issuer represent 5% or more of the outstanding voting securities of an issuer, or any affiliated mutual fund.
A summary of transactions for the fiscal year to date, in Mid Cap Growth Fund, is as follows:
| | | | | | | | | | | | | | | | | | | | | | | | |
Fund | | Value
October 31, 2011 | | | Gross
Purchases | | | Gross Sales | | | Shares Held at
October 31, 2012 | | | Value
October 31, 2012 | | | Income Earned
November 1, 2011 -
October 31, 2012 | |
Securities Lending Trust-Collateral Investment | | | $8,790,050 | | | | $118,536,751 | | | | $115,022,826 | | | | 12,303,975 | | | | $12,303,975 | | | | $12,324 | |
Securities Lending Trust-Short Term Investment | | | – | | | | 23,504,382 | | | | 3,575,993 | | | | 19,928,389 | | | | 19,928,389 | | | | 704 | |
Total Value and Income Earned | | | 8,790,050 | | | | | | | | | | | | | | | | 32,232,364 | | | | 13,028 | |
The accompanying Notes to Financial Statements are an integral part of this schedule.
120
Partner Mid Cap Value Fund
Schedule of Investments as of October 31, 2012
| | | | | | | | |
| Shares | | | Common Stock (97.4%) | | Value | |
| Consumer Discretionary (10.5%) | | | | |
| | 2,589 | | | AutoZone, Inc.a | | | $970,875 | |
| | 3,947 | | | Chipotle Mexican Grill, Inc.a | | | 1,004,630 | |
| | 36,189 | | | D.R. Horton, Inc. | | | 758,521 | |
| | 18,853 | | | Delphi Automotive plca | | | 592,738 | |
| | 73,436 | | | Liberty Interactive Corporationa | | | 1,468,720 | |
| | 13,064 | | | Limited Brands, Inc. | | | 625,635 | |
| | 38,618 | | | Macy’s, Inc. | | | 1,470,187 | |
| | 109,990 | | | MGM Resorts Internationala | | | 1,133,997 | |
| | 9,971 | | | PetSmart, Inc. | | | 661,975 | |
| | 13,502 | | | PVH Corporation | | | 1,485,085 | |
| | 7,891 | | | Ross Stores, Inc. | | | 480,956 | |
| | 11,141 | | | Scripps Networks Interactive | | | 676,482 | |
| | 8,490 | | | Starwood Hotels & Resorts Worldwide, Inc. | | | 440,206 | |
| | 18,365 | | | Toll Brothers, Inc.a | | | 606,229 | |
| | 16,358 | | | TRW Automotive Holdings Corporationa | | | 760,811 | |
| | 16,022 | | | Urban Outfitters, Inc.a | | | 572,947 | |
| | | | | |
| | | | Total | | | 13,709,994 | |
| | | | | |
| |
| Consumer Staples (5.5%) | | | | |
| | 12,028 | | | Church & Dwight Company, Inc. | | | 610,541 | |
| | 39,281 | | | Coca-Cola Enterprises, Inc. | | | 1,234,995 | |
| | 27,915 | | | Constellation Brands, Inc.a | | | 986,516 | |
| | 21,465 | | | Ingredion, Inc. | | | 1,319,239 | |
| | 20,284 | | | J.M. Smucker Company | | | 1,737,122 | |
| | 6,780 | | | Lorillard, Inc. | | | 786,548 | |
| | 12,033 | | | Monster Beverage Corporationa | | | 537,514 | |
| | | | | |
| | | | Total | | | 7,212,475 | |
| | | | | |
| |
| Energy (8.3%) | | | | |
| | 38,425 | | | Cameron International Corporationa | | | 1,945,842 | |
| | 18,619 | | | Energen Corporation | | | 868,576 | |
| | 15,043 | | | EQT Corporation | | | 912,057 | |
| | 26,954 | | | HollyFrontier Corporation | | | 1,041,233 | |
| | 21,838 | | | Marathon Petroleum Corporation | | | 1,199,561 | |
| | 25,609 | | | Peabody Energy Corporation | | | 714,491 | |
| | 15,628 | | | Pioneer Natural Resources Company | | | 1,651,098 | |
| | 19,970 | | | Range Resources Corporation | | | 1,305,239 | |
| | 14,782 | | | Southwestern Energy Companya | | | 512,936 | |
| | 17,967 | | | Tesoro Corporation | | | 677,536 | |
| | | | | |
| | | | Total | | | 10,828,569 | |
| | | | | |
| |
| Financials (29.9%) | | | | |
| | 21,792 | | | Alexandria Real Estate Equities, Inc. | | | 1,534,811 | |
| | 25,128 | | | Ameriprise Financial, Inc. | | | 1,466,721 | |
| | 12,604 | | | AvalonBay Communities, Inc. | | | 1,708,598 | |
| | 13,455 | | | Camden Property Trust | | | 883,052 | |
| | 31,305 | | | CIT Group, Inc.a | | | 1,165,172 | |
| | 23,518 | | | Douglas Emmett, Inc. | | | 551,497 | |
| | 17,090 | | | Everest Re Group, Ltd. | | | 1,897,845 | |
| | 23,963 | | | First Republic Bank | | | 823,129 | |
| | 45,395 | | | Hartford Financial Services Group, Inc. | | | 985,525 | |
| | 115,092 | | | Host Hotels & Resorts, Inc. | | | 1,664,230 | |
| | 79,504 | | | Invesco, Ltd. | | | 1,933,537 | |
| | 17,500 | | | iShares Russell Midcap Value Index Fund | | | 853,475 | |
| | 68,072 | | | Kimco Realty Corporation | | | 1,328,765 | |
| | 19,195 | | | Lazard, Ltd. | | | 565,485 | |
| | 41,032 | | | Liberty Property Trust | | | 1,441,044 | |
| | 25,313 | | | M&T Bank Corporationb | | | 2,635,083 | |
| | 148,109 | | | MFA Financial, Inc. | | | 1,210,051 | |
| | 66,711 | | | NASDAQ OMX Group, Inc. | | | 1,588,389 | |
| | 14,005 | | | PartnerRe, Ltd. | | | 1,134,405 | |
| | 21,017 | | | Piedmont Office Realty Trust, Inc. | | | 374,103 | |
| | 80,473 | | | Principal Financial Group, Inc. | | | 2,216,226 | |
| | 113,245 | | | SLM Corporation | | | 1,990,847 | |
| | 54,691 | | | SunTrust Banks, Inc. | | | 1,487,595 | |
| | 34,642 | | | Tanger Factory Outlet Centers, Inc. | | | 1,090,184 | |
| | 30,729 | | | Ventas, Inc. | | | 1,944,224 | |
| | 43,108 | | | W.R. Berkley Corporation | | | 1,676,470 | |
| | 35,352 | | | Willis Group Holdings plc | | | 1,190,302 | |
| | 67,665 | | | XL Group plc | | | 1,674,032 | |
| | | | | |
| | | | Total | | | 39,014,797 | |
| | | | | |
| |
| Health Care (7.1%) | | | | |
| | 41,584 | | | Aetna, Inc. | | | 1,817,221 | |
| | 16,402 | | | AmerisourceBergen Corporation | | | 646,895 | |
| | 270,032 | | | Boston Scientific Corporationa | | | 1,387,964 | |
| | 66,585 | | | Hologic, Inc.a | | | 1,372,983 | |
| | 27,040 | | | Life Technologies Corporationa | | | 1,322,526 | |
| | 76,312 | | | Mylan, Inc.a | | | 1,933,746 | |
| | 14,874 | | | Vertex Pharmaceuticals, Inc.a | | | 717,522 | |
| | 3,532 | | | Warner Chilcott plc | | | 40,901 | |
| | | | | |
| | | | Total | | | 9,239,758 | |
| | | | | |
| |
| Industrials (8.8%) | | | | |
| | 19,970 | | | BE Aerospace, Inc.a | | | 900,447 | |
| | 30,665 | | | Dover Corporation | | | 1,785,316 | |
| | 28,666 | | | Fortune Brands Home and Security, Inc.a | | | 815,261 | |
| | 14,849 | | | Gardner Denver, Inc. | | | 1,029,481 | |
| | 27,604 | | | Lennox International, Inc. | | | 1,381,580 | |
| | 4,970 | | | Parker Hannifin Corporation | | | 390,940 | |
| | 22,675 | | | Pentair, Ltd. | | | 957,792 | |
| | 9,343 | | | Rockwell Automation, Inc. | | | 663,914 | |
| | 57,884 | | | Spirit Aerosystems Holdings, Inc.a | | | 904,727 | |
| | 20,152 | | | Stanley Black & Decker, Inc. | | | 1,396,534 | |
| | 51,242 | | | Textron, Inc. | | | 1,291,811 | |
| | | | | |
| | | | Total | | | 11,517,803 | |
| | | | | |
| |
| Information Technology (10.1%) | | | | |
| | 28,697 | | | Adobe Systems, Inc.a | | | 975,698 | |
| | 47,839 | | | Altera Corporation | | | 1,458,133 | |
| | 11,188 | | | Amphenol Corporation | | | 672,734 | |
| | 13,345 | | | Check Point Software Technologies, Ltd.a | | | 594,253 | |
| | 34,982 | | | Fidelity National Information Services, Inc. | | | 1,149,858 | |
| | 88,363 | | | Juniper Networks, Inc.a | | | 1,464,175 | |
| | 60,923 | | | Lam Research Corporationa | | | 2,156,674 | |
| | 80,158 | | | LSI Corporationa | | | 549,082 | |
| | 29,582 | | | NetApp, Inc.a | | | 795,756 | |
| | 164,356 | | | ON Semiconductor Corporationa | | | 1,010,789 | |
| | 58,807 | | | Parametric Technology Corporationa | | | 1,186,725 | |
| | 17,936 | | | Paychex, Inc. | | | 581,665 | |
| | 60,423 | | | Polycom, Inc.a | | | 605,439 | |
| | | | | |
| | | | Total | | | 13,200,981 | |
| | | | | |
The accompanying Notes to Financial Statements are an integral part of this schedule.
121
Partner Mid Cap Value Fund
Schedule of Investments as of October 31, 2012
| | | | | | | | |
| Shares | | | Common Stock (97.4%) | | Value | |
| |
| Materials (6.2%) | | | | |
| | 21,753 | | | Albemarle Corporation | | | 1,198,808 | |
| | 21,952 | | | Carpenter Technology Corporation | | | $1,067,087 | |
| | 8,994 | | | Cliffs Natural Resources, Inc.b | | | 326,212 | |
| | 22,542 | | | Crown Holdings, Inc.a | | | 862,231 | |
| | 11,193 | | | Cytec Industries, Inc. | | | 770,302 | |
| | 14,600 | | | Martin Marietta Materials, Inc.b | | | 1,201,726 | |
| | 21,573 | | | Reliance Steel & Aluminum | | | | |
| | | | Company | | | 1,172,277 | |
| | 74,883 | | | Sealed Air Corporation | | | 1,214,602 | |
| | 4,873 | | | Vulcan Materials Company | | | 224,012 | |
| | | | | |
| | | | Total | | | 8,037,257 | |
| | | | | |
| |
| Utilities (11.0%) | | | | |
| | 60,340 | | | Calpine Corporationa | | | 1,061,984 | |
| | 23,916 | | | CMS Energy Corporation | | | 581,637 | |
| | 29,991 | | | Edison International, Inc. | | | 1,407,778 | |
| | 21,959 | | | Great Plains Energy, Inc. | | | 492,760 | |
| | 37,332 | | | Northeast Utilities | | | 1,467,148 | |
| | 63,177 | | | NV Energy, Inc. | | | 1,200,995 | |
| | 18,868 | | | Pinnacle West Capital Corporation | | | 999,438 | |
| | 61,518 | | | PPL Corporation | | | 1,819,702 | |
| | 23,835 | | | Questar Corporation | | | 482,420 | |
| | 32,570 | | | SCANA Corporation | | | 1,598,536 | |
| | 16,578 | | | Sempra Energy | | | 1,156,315 | |
| | 75,301 | | | Xcel Energy, Inc. | | | 2,127,253 | |
| | | | | |
| | | | Total | | | 14,395,966 | |
| | | | | |
| | | | | | | | |
| | | | | |
| | | | Total Common Stock (cost $110,312,243) | | | 127,157,600 | |
| | | | | |
| | |
| Shares | | | Collateral Held for Securities Loaned (3.1%) | | Value | |
| | 4,042,325 | | | Thrivent Financial Securities Lending Trust | | | 4,042,325 | |
| | | | | |
| | | | Total Collateral Held for Securities Loaned (cost $4,042,325) | | | 4,042,325 | |
| | | | | |
| | |
Shares or
Principal
Amount | | | Short-Term Investments (2.1%) | | Value | |
| | 2,762,894 | | | Thrivent Financial Securities Lending Trust | | | 2,762,894 | |
| | | | | |
| | | | Total Short-Term Investments (at amortized cost) | | | 2,762,894 | |
| | | | | |
| | | | Total Investments (cost $117,117,462) 102.6% | | | $133,962,819 | |
| | | | | |
| | | | Other Assets and Liabilities, Net (2.6%) | | | (3,451,471 | ) |
| | | | | |
| | | | Total Net Assets 100.0% | | | $130,511,348 | |
| | | | | |
a | Non-income producing security. |
b | All or a portion of the security is on loan. |
Unrealized Appreciation (Depreciation)
Gross unrealized appreciation and depreciation of investments, based on cost for federal income tax purposes, were as follows:
| | | | |
Gross unrealized appreciation | | $ | 19,990,032 | |
Gross unrealized depreciation | | | (3,579,627 | ) |
| | | | |
Net unrealized appreciation (depreciation) | | $ | 16,410,405 | |
| |
Cost for federal income tax purposes | | $ | 117,552,414 | |
The accompanying Notes to Financial Statements are an integral part of this schedule.
122
Partner Mid Cap Value Fund
Schedule of Investments as of October 31, 2012
Fair Valuation Measurements
The following table is a summary of the inputs used, as of October 31, 2012, in valuing Partner Mid Cap Value Fund’s assets carried at fair value.
| | | | | | | | | | | | | | | | |
Investments in Securities | | Total | | | Level 1 | | | Level 2 | | | Level 3 | |
| | | | |
Common Stock | | | | | | | | | | | | | | | | |
Consumer Discretionary | | | 13,709,994 | | | | 13,709,994 | | | | – | | | | – | |
Consumer Staples | | | 7,212,475 | | | | 7,212,475 | | | | – | | | | – | |
Energy | | | 10,828,569 | | | | 10,828,569 | | | | – | | | | – | |
Financials | | | 39,014,797 | | | | 39,014,797 | | | | – | | | | – | |
Health Care | | | 9,239,758 | | | | 9,239,758 | | | | – | | | | – | |
Industrials | | | 11,517,803 | | | | 11,517,803 | | | | – | | | | – | |
Information Technology | | | 13,200,981 | | | | 13,200,981 | | | | – | | | | – | |
Materials | | | 8,037,257 | | | | 8,037,257 | | | | – | | | | – | |
Utilities | | | 14,395,966 | | | | 14,395,966 | | | | – | | | | – | |
Collateral Held for Securities Loaned | | | 4,042,325 | | | | 4,042,325 | | | | – | | | | – | |
Short-Term Investments | | | 2,762,894 | | | | 2,762,894 | | | | – | | | | – | |
| |
Total | | | $133,962,819 | | | | $133,962,819 | | | | $– | | | | $– | |
| |
There were no significant transfers between Levels during the period ended October 31, 2012. Transfers between Levels are identified as of the end of the period.
Investment in Affiliates
Affiliated issuers, as defined under the Investment Company Act of 1940, include those in which the Fund’s holdings of an issuer represent 5% or more of the outstanding voting securities of an issuer, or any affiliated mutual fund.
A summary of transactions for the fiscal year to date, in Partner Mid Cap Value Fund, is as follows:
| | | | | | | | | | | | | | | | | | | | | | | | |
Fund | | Value
October 31, 2011 | | | Gross
Purchases | | | Gross
Sales | | | Shares Held at
October 31, 2012 | | | Value
October 31, 2012 | | | Income Earned
November 1, 2011 -
October 31, 2012 | |
Securities Lending Trust-Collateral Investment | | | $1,504,980 | | | | $24,685,355 | | | | $22,148,010 | | | | 4,042,325 | | | | $4,042,325 | | | | $1,896 | |
Securities Lending Trust-Short Term Investment | | | – | | | | 3,344,101 | | | | 581,207 | | | | 2,762,894 | | | | 2,762,894 | | | | 167 | |
Total Value and Income Earned | | | 1,504,980 | | | | | | | | | | | | | | | | 6,805,219 | | | | 2,063 | |
The accompanying Notes to Financial Statements are an integral part of this schedule.
123
Mid Cap Stock Fund
Schedule of Investments as of October 31, 2012
| | | | | | | | |
| Shares | | | Common Stock (95.6%) | | Value | |
| Consumer Discretionary (14.9%) | | | | |
| | 216,300 | | | Charter Communications, Inc.a | | | $16,743,783 | |
| | 210,900 | | | Cheesecake Factory, Inc. | | | 6,972,354 | |
| | 306,900 | | | DISH Network Corporation | | | 10,934,847 | |
| | 274,142 | | | Dollar Tree, Inc.a | | | 10,930,042 | |
| | 265,800 | | | Omnicom Group, Inc. | | | 12,734,478 | |
| | 43,614 | | | Panera Bread Companya | | | 7,355,065 | |
| | 228,400 | | | Penn National Gaming, Inc.a | | | 9,234,212 | |
| | 114,700 | | | PetSmart, Inc. | | | 7,614,933 | |
| | 306,700 | | | Tempur-Pedic International, Inc.a | | | 8,109,148 | |
| | 362,800 | | | Toll Brothers, Inc.a | | | 11,976,028 | |
| | 423,508 | | | WMS Industries, Inc.a | | | 6,958,236 | |
| | | | | |
| | | | Total | | | 109,563,126 | |
| | | | | |
| |
| Consumer Staples (3.4%) | | | | |
| | 225,300 | | | Ingredion, Inc. | | | 13,846,938 | |
| | 212,687 | | | TreeHouse Foods, Inc.a | | | 11,389,389 | |
| | | | | |
| | | | Total | | | 25,236,327 | |
| | | | | |
| |
| Energy (6.8%) | | | | |
| | 1,233,534 | | | Alpha Natural Resources, Inc.a,b | | | 10,571,386 | |
| | 190,300 | | | Ensco plc | | | 11,003,146 | |
| | 535,900 | | | Helix Energy Solutions Group, Inc.a | | | 9,265,711 | |
| | 301,400 | | | Southwestern Energy Companya | | | 10,458,580 | |
| | 773,900 | | | Weatherford International, Ltd.a | | | 8,745,070 | |
| | | | | |
| | | | Total | | | 50,043,893 | |
| | | | | |
| |
| Financials (21.9%) | | | | |
| | 231,800 | | | Axis Capital Holdings, Ltd. | | | 8,395,796 | |
| | 587,600 | | | CBL & Associates Properties, Inc. | | | 13,144,612 | |
| | 666,333 | | | Duke Realty Corporation | | | 9,648,502 | |
| | 246,226 | | | Endurance Specialty Holdings, Ltd. | | | 9,984,464 | |
| | 590,626 | | | HCC Insurance Holdings, Inc. | | | 21,049,910 | |
| | 827,509 | | | Host Hotels & Resorts, Inc. | | | 11,965,780 | |
| | 1,737,300 | | | Huntington Bancshares, Inc. | | | 11,101,347 | |
| | 305,382 | | | Lazard, Ltd. | | | 8,996,554 | |
| | 112,300 | | | M&T Bank Corporationb | | | 11,690,430 | |
| | 453,100 | | | NASDAQ OMX Group, Inc. | | | 10,788,311 | |
| | 248,290 | | | Northern Trust Corporation | | | 11,863,296 | |
| | 855,000 | | | Och-Ziff Capital Management Group, LLC | | | 8,558,550 | |
| | 314,112 | | | W.R. Berkley Corporation | | | 12,215,816 | |
| | 582,202 | | | Zions Bancorporationb | | | 12,499,877 | |
| | | | | |
| | | | Total | | | 161,903,245 | |
| | | | | |
| |
| Health Care (10.6%) | | | | |
| | 89,800 | | | Alexion Pharmaceuticals, Inc.a | | | 8,116,124 | |
| | 102,814 | | | C.R. Bard, Inc. | | | 9,889,679 | |
| | 312,900 | | | Endo Pharmaceutical Holdings, Inc.a | | | 8,967,714 | |
| | 197,900 | | | Illumina, Inc.a,b | | | 9,402,229 | |
| | 322,000 | | | Medicines Companya | | | 7,058,240 | |
| | 373,800 | | | Thoratec Corporationa | | | 13,344,660 | |
| | 111,100 | | | Waters Corporationa | | | 9,089,091 | |
| | 190,263 | | | Zimmer Holdings, Inc. | | | 12,216,787 | |
| | | | | |
| | | | Total | | | 78,084,524 | |
| | | | | |
| |
| Industrials (11.9%) | | | | |
| | 203,241 | | | ADT Corporationa | | | 8,436,534 | |
| | 365,217 | | | CSX Corporation | | | 7,475,992 | |
| | 67,600 | | | Flowserve Corporation | | | 9,159,124 | |
| | 1,029,730 | | | Manitowoc Company, Inc. | | | 14,673,653 | |
| | 167,598 | | | Manpower, Inc. | | | 6,358,668 | |
| | 787,100 | | | McDermott International, Inc.a | | | 8,429,841 | |
| | 484,444 | | | Oshkosh Corporationa | | | 14,523,631 | |
| | 134,818 | | | Parker Hannifin Corporation | | | 10,604,784 | |
| | 917,400 | | | Southwest Airlines Company | | | 8,091,468 | |
| | | | | |
| | | | Total | | | 87,753,695 | |
| | | | | |
| |
| Information Technology (18.4%) | | | | |
| | 309,100 | | | Akamai Technologies, Inc.a | | | 11,742,709 | |
| | 184,700 | | | Alliance Data Systems Corporationa,b | | | 26,421,335 | |
| | 648,888 | | | CoreLogic, Inc.a | | | 15,443,534 | |
| | 211,053 | | | eBay, Inc.a | | | 10,191,749 | |
| | 265,059 | | | Itron, Inc.a | | | 10,883,323 | |
| | 491,650 | | | Juniper Networks, Inc.a | | | 8,146,640 | |
| | 1,013,662 | | | NVIDIA Corporationa | | | 12,133,534 | |
| | 1,182,614 | | | Teradyne, Inc.a | | | 17,289,817 | |
| | 1,069 | | | Workday, Inc.a | | | 51,847 | |
| | 450,696 | | | Xilinx, Inc. | | | 14,764,801 | |
| | 502,200 | | | Yahoo!, Inc.a | | | 8,441,982 | |
| | | | | |
| | | | Total | | | 135,511,271 | |
| | | | | |
| |
| Materials (2.7%) | | | | |
| | 220,064 | | | Silgan Holdings, Inc. | | | 9,530,972 | |
| | 829,794 | | | Steel Dynamics, Inc. | | | 10,496,894 | |
| | | | | |
| | | | Total | | | 20,027,866 | |
| | | | | |
| |
| Utilities (5.0%) | | | | |
| | 535,500 | | | CMS Energy Corporation | | | 13,023,360 | |
| | 724,938 | | | NV Energy, Inc. | | | 13,781,071 | |
| | 321,800 | | | Public Service Enterprise Group, Inc. | | | 10,310,472 | |
| | | | | |
| | | | Total | | | 37,114,903 | |
| | | | | |
| | | | | | | | |
| | | | | |
| | | | Total Common Stock (cost $600,771,966) | | | 705,238,850 | |
| | | | | |
| | |
| Shares | | | Collateral Held for Securities Loaned (9.1%) | | Value | |
| | 66,998,025 | | | Thrivent Financial Securities Lending Trust | | | 66,998,025 | |
| | | | | |
| | | | Total Collateral Held for Securities Loaned (cost $66,998,025) | | | 66,998,025 | |
| | | | | |
| | |
Shares or
Principal
Amount | | | Short-Term Investments (4.5%)c | | Value | |
| | | | Federal Home Loan Bank Discount Notes | | | | |
| | 5,000,000 | | | 0.080%, 11/1/2012c | | | 5,000,000 | |
| | 8,537,682 | | | Thrivent Financial Securities Lending Trust | | | 8,537,682 | |
| | | | U.S. Treasury Bills | | | | |
| | 20,000,000 | | | 0.115%, 11/8/2012c | | | 19,999,553 | |
| | | | | |
| | | | Total Short-Term Investments (at amortized cost) | | | 33,537,235 | |
| | | | | |
| | | | Total Investments (cost $701,307,226) 109.2% | | | $805,774,110 | |
| | | | | |
| | | | Other Assets and Liabilities, Net (9.2%) | | | (67,830,749 | ) |
| | | | | |
| | | | Total Net Assets 100.0% | | | $737,943,361 | |
| | | | | |
The accompanying Notes to Financial Statements are an integral part of this schedule.
124
Mid Cap Stock Fund
Schedule of Investments as of October 31, 2012
a | Non-income producing security. |
b | All or a portion of the security is on loan. |
c | The interest rate shown reflects the yield, coupon rate or the discount rate at the date of purchase. |
Unrealized Appreciation (Depreciation)
Gross unrealized appreciation and depreciation of investments, based on cost for federal income tax purposes, were as follows:
| | | | |
Gross unrealized appreciation | | $ | 137,232,520 | |
Gross unrealized depreciation | | | (32,882,952 | ) |
| | | | |
Net unrealized appreciation (depreciation) | | $ | 104,349,568 | |
| |
Cost for federal income tax purposes | | $ | 701,424,542 | |
Fair Valuation Measurements
The following table is a summary of the inputs used, as of October 31, 2012, in valuing Mid Cap Stock Fund’s assets carried at fair value.
| | | | | | | | | | | | | | | | |
Investments in Securities | | Total | | | Level 1 | | | Level 2 | | | Level 3 | |
| | | | |
Common Stock | | | | | | | | | | | | | | | | |
Consumer Discretionary | | | 109,563,126 | | | | 109,563,126 | | | | – | | | | – | |
Consumer Staples | | | 25,236,327 | | | | 25,236,327 | | | | – | | | | – | |
Energy | | | 50,043,893 | | | | 50,043,893 | | | | – | | | | – | |
Financials | | | 161,903,245 | | | | 161,903,245 | | | | – | | | | – | |
Health Care | | | 78,084,524 | | | | 78,084,524 | | | | – | | | | – | |
Industrials | | | 87,753,695 | | | | 87,753,695 | | | | – | | | | – | |
Information Technology | | | 135,511,271 | | | | 135,511,271 | | | | – | | | | – | |
Materials | | | 20,027,866 | | | | 20,027,866 | | | | – | | | | – | |
Utilities | | | 37,114,903 | | | | 37,114,903 | | | | – | | | | – | |
Collateral Held for Securities Loaned | | | 66,998,025 | | | | 66,998,025 | | | | – | | | | – | |
Short-Term Investments | | | 33,537,235 | | | | 8,537,682 | | | | 24,999,553 | | | | – | |
| |
Total | | | $805,774,110 | | | | $780,774,557 | | | | $24,999,553 | | | | $– | |
| |
There were no significant transfers between Levels during the period ended October 31, 2012. Transfers between Levels are identified as of the end of the period.
Investment in Affiliates
Affiliated issuers, as defined under the Investment Company Act of 1940, include those in which the Fund’s holdings of an issuer represent 5% or more of the outstanding voting securities of an issuer, or any affiliated mutual fund.
A summary of transactions for the fiscal year to date, in Mid Cap Stock Fund, is as follows:
| | | | | | | | | | | | | | | | | | | | | | | | |
Fund | | Value
October 31, 2011 | | | Gross
Purchases | | | Gross Sales | | | Shares Held at
October 31, 2012 | | | Value
October 31, 2012 | | | Income Earned
November 1, 2011 -
October 31, 2012 | |
Securities Lending Trust-Collateral Investment | | | $35,829,950 | | | | $161,132,250 | | | | $129,964,175 | | | | 66,998,025 | | | | $66,998,025 | | | | $155,713 | |
Securities Lending Trust-Short Term Investment | | | – | | | | 9,806,387 | | | | 1,268,705 | | | | 8,537,682 | | | | 8,537,682 | | | | 600 | |
Total Value and Income Earned | | | 35,829,950 | | | | | | | | | | | | | | | | 75,535,707 | | | | 156,313 | |
The accompanying Notes to Financial Statements are an integral part of this schedule.
125
Partner Worldwide Allocation Fund
Schedule of Investments as of October 31, 2012
| | | | | | | | |
| Shares | | | Common Stock (87.8%) | | Value | |
| Australia (3.3%) | | | | |
| | 113,780 | | | ALS, Ltd. | | | $1,092,241 | |
| | 60,240 | | | Australia & New Zealand Banking Group, Ltd. | | | 1,589,215 | |
| | 1,298,861 | | | Beach Energy, Ltd. | | | 1,855,076 | |
| | 58,420 | | | BHP Billiton, Ltd. | | | 2,068,396 | |
| | 27,395 | | | Flight Centre, Ltd.a | | | 755,821 | |
| | 166,850 | | | GrainCorp, Ltd. | | | 2,118,858 | |
| | 861,112 | | | Imdex, Ltd. | | | 1,193,891 | |
| | 79,411 | | | McMillan Shakespeare, Ltd. | | | 1,062,758 | |
| | 366,737 | | | Mermaid Marine Australia, Ltd. | | | 1,232,567 | |
| | 150,823 | | | Mineral Resources, Ltd. | | | 1,355,497 | |
| | 48,433 | | | Monadelphous Group, Ltd. | | | 1,058,975 | |
| | 104,984 | | | NRW Holdings, Ltd. | | | 222,676 | |
| | 50,308 | | | Ramsay Health Care, Ltd. | | | 1,240,656 | |
| | 27,104 | | | Rio Tinto, Ltd. | | | 1,597,942 | |
| | 303,455 | | | SAI Global, Ltd. | | | 1,277,167 | |
| | 428,302 | | | Skilled Group, Ltd. | | | 1,180,853 | |
| | 1,600,963 | | | Tiger Resources, Ltd.b | | | 513,261 | |
| | 107,854 | | | Troy Resources, Ltd. | | | 495,821 | |
| | 402,654 | | | Westfield Retail Trust | | | 1,292,958 | |
| | | | | |
| | | | Total | | | 23,204,629 | |
| | | | | |
| |
| Austria (0.1%) | | | | |
| | 18,811 | | | Voestalpine AG | | | 592,319 | |
| | | | | |
| | | | Total | | | 592,319 | |
| | | | | |
| |
| Belgium (0.9%) | | | | |
| | 49,826 | | | Anheuser-Busch InBev NV | | | 4,166,983 | |
| | 16,611 | | | Barco NV | | | 1,142,681 | |
| | 4,333 | | | Compagnie d’ Entreprises CFE | | | 213,190 | |
| | 19,737 | | | EVS Broadcast Equipment SA | | | 1,145,737 | |
| | | | | |
| | | | Total | | | 6,668,591 | |
| | | | | |
| |
| Bermuda (0.2%) | | | | |
| | 165,000 | | | Cheung Kong Infrastructure Holdings, Ltd. | | | 966,710 | |
| | 372,000 | | | Pacific Basin Shipping, Ltd. | | | 198,545 | |
| | 14,360 | | | VimpelCom, Ltd. | | | 158,247 | |
| | | | | |
| | | | Total | | | 1,323,502 | |
| | | | | |
| |
| Brazil (2.9%) | | | | |
| | 23,500 | | | All America Latina Logistica SA | | | 106,910 | |
| | 15,400 | | | Autometal SA | | | 128,899 | |
| | 212,181 | | | Banco Bradesco SA ADR | | | 3,322,754 | |
| | 6,600 | | | Banco do Estado do Rio Grande do Sul SA | | | 52,155 | |
| | 17,200 | | | Cia Paranaense de Energia | | | 254,056 | |
| | 11,500 | | | Cyrela Brazil Realty SA Empreendimentos e Participacoes | | | 97,501 | |
| | 38,400 | | | Embraer SA | | | 268,472 | |
| | 2,000 | | | Even Construtora e Incorporadora SA | | | 7,976 | |
| | 37,000 | | | Lojas Renner SA | | | 1,369,932 | |
| | 42,000 | | | Multiplan Empreendimentos Imobiliarios SA | | | 1,230,398 | |
| | 113,000 | | | Petroleo Brasileiro SA ADR | | | 2,396,730 | |
| | 148,000 | | | Petroleo Brasileiro SA ADR | | | 3,038,440 | |
| | 200 | | | Porto Seguro SA | | | 2,127 | |
| | 320,450 | | | Rossi Residencial SA | | | 673,702 | |
| | 107,500 | | | Souza Cruz SA | | | 1,402,600 | |
| | 17,400 | | | Sul America SA | | | 137,072 | |
| | 126,412 | | | Ultrapar Participacoes SA | | | 2,651,412 | |
| | 185,000 | | | Vale SA SP PREF ADR | | | 3,291,150 | |
| | | | | |
| | | | Total | | | 20,432,286 | |
| | | | | |
| |
| Canada (3.7%) | | | | |
| | 25,421 | | | Agrium, Inc. | | | 2,677,127 | |
| | 39,233 | | | Alimentation Couche-Tard, Inc. | | | 1,927,180 | |
| | 15,128 | | | Bank of Nova Scotia | | | 821,721 | |
| | 62,757 | | | Barrick Gold Corporation | | | 2,537,928 | |
| | 37,124 | | | Canadian National Railway Company | | | 3,205,581 | |
| | 15,600 | | | Canadian Natural Resources, Ltd. | | | 470,148 | |
| | 15,008 | | | Dollarama, Inc. | | | 948,040 | |
| | 41,374 | | | Enbridge, Inc. | | | 1,646,260 | |
| | 192,250 | | | Encana Corporation | | | 4,335,237 | |
| | 26,637 | | | Gibson Energy, Inc. | | | 612,351 | |
| | 97,065 | | | Lundin Mining Corporationb | | | 505,370 | |
| | 10,926 | | | Metro, Inc. | | | 644,566 | |
| | 59,085 | | | Pacific Rubiales Energy Corporation | | | 1,389,644 | |
| | 61,909 | | | Sherritt International Corporation | | | 267,782 | |
| | 48,503 | | | Suncor Energy, Inc. | | | 1,627,854 | |
| | 35,900 | | | Talisman Energy, Inc. | | | 406,897 | |
| | 84,576 | | | Yamana Gold, Inc. | | | 1,708,033 | |
| | | | | |
| | | | Total | | | 25,731,719 | |
| | | | | |
| |
| Chile (0.3%) | | | | |
| | 56,106 | | | Banco Santander Chile SA ADR | | | 1,525,522 | |
| | 6,510 | | | Cia Cervecerias Unidas SA | | | 461,754 | |
| | | | | |
| | | | Total | | | 1,987,276 | |
| | | | | |
| |
| China (0.6%) | | | | |
| | 438,000 | | | China Petroleum & Chemical Corporation | | | 461,598 | |
| | 126,000 | | | Dongfeng Motor Group Company, Ltd. | | | 155,837 | |
| | 2,559,000 | | | PetroChina Company, Ltd. | | | 3,472,354 | |
| | 166,000 | | | Yanzhou Coal Mining Company, Ltd. | | | 247,444 | |
| | | | | |
| | | | Total | | | 4,337,233 | |
| | | | | |
| |
| Colombia (<0.1%) | | | | |
| | 5,075 | | | Bancolombia SA | | | 324,902 | |
| | | | | |
| | | | Total | | | 324,902 | |
| | | | | |
| |
| Cyprus (0.2%) | | | | |
| | 160,522 | | | Prosafe SE | | | 1,334,957 | |
| | | | | |
| | | | Total | | | 1,334,957 | |
| | | | | |
| |
| Czech Republic (<0.1%) | | | | |
| | 1,081 | | | Komercni Banka AS | | | 221,206 | |
| | | | | |
| | | | Total | | | 221,206 | |
| | | | | |
| |
| Denmark (1.4%) | | | | |
| | 40,487 | | | Christian Hansen Holding AS | | | 1,266,942 | |
| | 2,384 | | | Coloplast AS | | | 522,921 | |
| | 257,400 | | | Danske Bank AS ADRb | | | 4,026,685 | |
| | 67,376 | | | GN Store Nord A/S | | | 1,055,949 | |
| | 17,132 | | | Novo Nordisk AS | | | 2,746,526 | |
| | | | | |
| | | | Total | | | 9,619,023 | |
| | | | | |
The accompanying Notes to Financial Statements are an integral part of this schedule.
126
Partner Worldwide Allocation Fund
Schedule of Investments as of October 31, 2012
| | | | | | | | |
| Shares | | | Common Stock (87.8%) | | Value | |
| Egypt (<0.1%) | | | | |
| | 36,910 | | | Ezz Steel | | | $62,203 | |
| | | | | |
| | | | Total | | | 62,203 | |
| | | | | |
| |
| Finland (0.8%) | | | | |
| | 111,638 | | | Amer Sports Oyj | | | 1,581,928 | |
| | 202,200 | | | Neste Oil Oyj | | | 2,532,101 | |
| | 33,026 | | | Outotec Oyj | | | 1,613,702 | |
| | | | | |
| | | | Total | | | 5,727,731 | |
| | | | | |
| |
| France (6.1%) | | | | |
| | 47,549 | | | Alten SA | | | 1,496,349 | |
| | 18,140 | | | AtoS | | | 1,217,950 | |
| | 296,066 | | | AXA SA | | | 4,718,886 | |
| | 101,669 | | | Beneteau SA | | | 1,015,609 | |
| | 48,433 | | | Bouygues SA | | | 1,164,061 | |
| | 107,850 | | | Cap Gemini SA | | | 4,537,057 | |
| | 9,773 | | | Christian Dior SA | | | 1,404,066 | |
| | 11,393 | | | Cie Generale des Etablissements Michelin | | | 982,127 | |
| | 105,448 | | | Compagnie de Saint-Gobain | | | 3,714,417 | |
| | 15,093 | | | Essilor International SA | | | 1,360,982 | |
| | 172,700 | | | GDF Suez | | | 3,963,851 | |
| | 34,992 | | | Ingenico | | | 1,852,764 | |
| | 892 | | | Remy Cointreau SA | | | 92,516 | |
| | 17,765 | | | Sanofi | | | 1,560,247 | |
| | 14,731 | | | Sartorius Stedim Biotech | | | 1,333,049 | |
| | 87,650 | | | Total SA | | | 4,414,926 | |
| | 5,853 | | | Unibail-Rodamco | | | 1,318,298 | |
| | 35,606 | | | Vinci SA | | | 1,578,266 | |
| | 6,788 | | | Virbac SA | | | 1,182,458 | |
| | 208,340 | | | Vivendi SA | | | 4,269,158 | |
| | | | | |
| | | | Total | | | 43,177,037 | |
| | | | | |
| |
| Germany (7.1%) | | | | |
| | 46,781 | | | BASF SE | | | 3,880,483 | |
| | 9,495 | | | Bayer AG | | | 827,894 | |
| | 16,558 | | | Bilfinger SE | | | 1,622,550 | |
| | 9,310 | | | Brenntag AG | | | 1,174,720 | |
| | 2,307,650 | | | Commerzbank AGb | | | 4,433,158 | |
| | 93,250 | | | Daimler AG | | | 4,368,258 | |
| | 18,378 | | | Delticom AG | | | 1,030,591 | |
| | 74,600 | | | Deutsche Boerse AG | | | 4,042,241 | |
| | 31,130 | | | Duerr AG | | | 2,335,239 | |
| | 27,355 | | | Gerresheimer AGb | | | 1,357,777 | |
| | 29,280 | | | Gerry Weber International AG | | | 1,331,435 | |
| | 28,845 | | | Henkel AG & Company KGaA | | | 2,306,365 | |
| | 111,400 | | | Metro AG | | | 3,211,477 | |
| | 35,349 | | | NORMA Group | | | 976,826 | |
| | 12,088 | | | Pfeiffer Vacuum Technology AG | | | 1,235,823 | |
| | 20,384 | | | RWE AG | | | 932,863 | |
| | 11,514 | | | Salzgitter AG | | | 497,933 | |
| | 47,428 | | | SAP AG ADR | | | 3,458,575 | |
| | 50,957 | | | Suedzucker AG | | | 1,975,339 | |
| | 44,360 | | | Symrise AG | | | 1,595,643 | |
| | 188,250 | | | ThyssenKrupp AG | | | 4,289,736 | |
| | 11,220 | | | Volkswagen AG | | | 2,329,550 | |
| | | | | |
| | | | Total | | | 49,214,476 | |
| | | | | |
| |
| Hong Kong (3.4%) | | | | |
| | 572,400 | | | AIA Group, Ltd. | | | 2,257,241 | |
| | 87,000 | | | Cheung Kong Holdings, Ltd. | | | 1,282,342 | |
| | 411,500 | | | China Mobile, Ltd. | | | 4,564,254 | |
| | 46,000 | | | China Overseas Land & Investment, Ltd. | | | 119,777 | |
| | 2,174,000 | | | Guangzhou Automobile Group Company, Ltd. | | | 1,488,651 | |
| | 393,000 | | | Hang Lung Group, Ltd. | | | 2,322,883 | |
| | 383,500 | | | Hutchison Whampoa, Ltd. | | | 3,756,948 | |
| | 1,942,408 | | | New World Development Company, Ltd. | | | 2,988,554 | |
| | 2,051,000 | | | Sany Heavy Equipment International Holdings Company, Ltd. | | | 1,072,509 | |
| | 204,000 | | | Sinotruk Hong Kong, Ltd. | | | 116,751 | |
| | 150,500 | | | Swire Pacific, Ltd., Class A | | | 1,780,088 | |
| | 270,000 | | | Swire Pacific, Ltd., Class B | | | 609,557 | |
| | 166,950 | | | Swire Properties, Ltd. | | | 515,825 | |
| | 40,000 | | | Weichai Power Company, Ltd. | | | 141,016 | |
| | 217,000 | | | Wheelock and Company, Ltd. | | | 946,538 | |
| | | | | |
| | | | Total | | | 23,962,934 | |
| | | | | |
| |
| Hungary (0.3%) | | | | |
| | 1,985 | | | EGIS Pharmaceuticals plc | | | 159,747 | |
| | 9,001 | | | Richter Gedeon Nyrt | | | 1,675,839 | |
| | | | | |
| | | | Total | | | 1,835,586 | |
| | | | | |
| |
| India (1.6%) | | | | |
| | 22,800 | | | GlaxoSmithKline Pharmaceuticals, Ltd. | | | 848,682 | |
| | 9,500 | | | Grasim Industries, Ltd. | | | 583,722 | |
| | 40,779 | | | Hero Motocorp, Ltd. | | | 1,416,081 | |
| | 90,000 | | | Hindustan Unilever, Ltd. | | | 912,586 | |
| | 182,000 | | | Housing Development Finance Corporation | | | 2,569,288 | |
| | 65,000 | | | ICICI Bank, Ltd. | | | 1,264,982 | |
| | 2,931 | | | ICICI Bank, Ltd. ADR | | | 115,042 | |
| | 53,800 | | | Infosys, Ltd. | | | 2,355,361 | |
| | 9,544 | | | Reliance Industries, Ltd.c | | | 283,890 | |
| | 31,428 | | | Ultra Tech Cement, Ltd. | | | 1,163,403 | |
| | | | | |
| | | | Total | | | 11,513,037 | |
| | | | | |
| |
| Indonesia (0.5%) | | | | |
| | 328,000 | | | Bank Rakyat Indonesia Persero Tbk PT | | | 251,349 | |
| | 22,000 | | | Indo Tambangraya Megah Tbk PT | | | 92,642 | |
| | 3,825,000 | | | PT Astra International Tbk | | | 3,192,788 | |
| | 430,000 | | | Vale Indonesia Tbk PT | | | 120,007 | |
| | | | | |
| | | | Total | | | 3,656,786 | |
| | | | | |
| |
| Ireland (0.5%) | | | | |
| | 466,757 | | | Greencore Group plc | | | 685,432 | |
| | 19,983 | | | Paddy Power plc | | | 1,474,237 | |
| | 45,299 | | | Ryanair Holdings plc ADRb | | | 1,460,893 | |
| | | | | |
| | | | Total | | | 3,620,562 | |
| | | | | |
| |
| Israel (1.0%) | | | | |
| | 71,748 | | | Gazit-Globe, Ltd. | | | 795,190 | |
| | 4,982 | | | Mellanox Technologies, Ltd.b | | | 375,979 | |
| | 13,824 | | | Mellanox Technologies, Ltd.b | | | 1,064,033 | |
| | 35,589 | | | Radware, Inc.b | | | 1,167,319 | |
| | 97,450 | | | Teva Pharmaceutical Industries, Ltd. ADR | | | 3,938,930 | |
| | | | | |
| | | | Total | | | 7,341,451 | |
| | | | | |
| |
| Italy (2.0%) | | | | |
| | 37,800 | | | DiaSorin SPAa | | | 1,269,385 | |
| | 210,250 | | | Eni SPA | | | 4,838,020 | |
| | 2,936,400 | | | Intesa Sanpaolo SPA | | | 4,730,207 | |
The accompanying Notes to Financial Statements are an integral part of this schedule.
127
Partner Worldwide Allocation Fund
Schedule of Investments as of October 31, 2012
| | | | | | | | |
| Shares | | | Common Stock (87.8%) | | Value | |
| Italy (2.0%) - continued | | | | |
| | 35,236 | | | Prysmian SPA | | | $679,379 | |
| | 3,607,425 | | | Telecom Italia SPA | | | 2,888,689 | |
| | | | | |
| | | | Total | | | 14,405,680 | |
| | | | | |
| |
| Japan (13.0%) | | | | |
| | 24,900 | | | Aisin Seiki Company, Ltd. | | | 727,188 | |
| | 10,200 | | | Alfresca Holdings Corporation | | | 461,122 | |
| | 48,400 | | | Aoyama Trading Company, Ltd. | | | 956,497 | |
| | 89,000 | | | Asics Corporation | | | 1,293,414 | |
| | 211,800 | | | Bridgestone Corporation | | | 4,947,439 | |
| | 76,000 | | | Chiyoda Corporation | | | 1,227,654 | |
| | 74,400 | | | CMK Corporation | | | 242,808 | |
| | 48,000 | | | Daihatsu Motor Company, Ltd. | | | 840,062 | |
| | 68,450 | | | Daiichi Sankyo Company, Ltd. | | | 1,047,699 | |
| | 122,000 | | | Daiwa House Industry Company, Ltd. | | | 1,850,159 | |
| | 1,072,014 | | | Daiwa Securities Group, Inc. | | | 4,276,438 | |
| | 27,300 | | | East Japan Railway Company | | | 1,873,783 | |
| | 18,000 | | | FamilyMart Company, Ltd. | | | 872,297 | |
| | 120,000 | | | Hino Motors, Ltd. | | | 927,585 | |
| | 34,200 | | | HIS Company, Ltd. | | | 1,033,708 | |
| | 203,000 | | | Hitachi, Ltd. | | | 1,076,544 | |
| | 20,500 | | | Hogy Medical Company, Ltd. | | | 1,048,852 | |
| | 15,100 | | | Idemitsu Kosan Company, Ltd. | | | 1,299,609 | |
| | 484,000 | | | IHI Corporation | | | 1,019,289 | |
| | 127,900 | | | ITOCHU Corporation | | | 1,280,223 | |
| | 65,800 | | | Japan Tobacco, Inc. | | | 1,819,518 | |
| | 48,500 | | | JTEKT Corporation | | | 364,214 | |
| | 48,000 | | | Kaken Pharmaceutical Company, Ltd. | | | 743,463 | |
| | 12,900 | | | KDDI Corporation | | | 1,002,076 | |
| | 302,152 | | | Kureha Corporation | | | 1,175,090 | |
| | 149,000 | | | Marubeni Corporation | | | 965,503 | |
| | 36,200 | | | MEIJI Holdings Company, Ltd. | | | 1,656,299 | |
| | 338 | | | Message Company, Ltd. | | | 1,042,349 | |
| | 194,000 | | | Mitsubishi Chemical Holdings Corporation | | | 768,350 | |
| | 181,100 | | | Mitsubishi UFJ Financial Group, Inc. | | | 819,291 | |
| | 191,050 | | | Mori Seiki Company, Ltd. | | | 1,196,596 | |
| | 216,207 | | | MS and AD Insurance Group Holdings, Inc. | | | 3,666,611 | |
| | 128,000 | | | Nikkiso Company, Ltd. | | | 1,528,450 | |
| | 153,700 | | | Nikon Corporation | | | 3,920,779 | |
| | 642,250 | | | Nippon Sheet Glass Companya | | | 531,953 | |
| | 110,000 | | | Nippon Shokubai Company, Ltd. | | | 1,078,877 | |
| | 29,100 | | | Nippon Telegraph & Telephone Corporation | | | 1,330,689 | |
| | 185,000 | | | Nippon Yusen Kabushiki Kaisha | | | 352,635 | |
| | 483,650 | | | Nissan Motor Company, Ltd. | | | 4,044,939 | |
| | 673 | | | NTT DoCoMo, Inc. | | | 975,195 | |
| | 99,400 | | | OSG Corporation | | | 1,302,964 | |
| | 28,551 | | | Pigeon Corporation | | | 1,315,553 | |
| | 21,600 | | | Ryohin Keikaku Company, Ltd. | | | 1,430,426 | |
| | 41,000 | | | Softbank Corporation | | | 1,294,874 | |
| | 727,800 | | | Sojitz Corporation | | | 903,488 | |
| | 632 | | | So-net M3, Inc. | | | 1,213,987 | |
| | 223,000 | | | Sumitomo Chemical Company, Ltd. | | | 626,692 | |
| | 353,600 | | | Sumitomo Corporation | | | 4,820,557 | |
| | 124,700 | | | Sumitomo Electric Industries, Ltd. | | | 1,341,485 | |
| | 1,506,050 | | | Sumitomo Mitsui Trust Holdings, Inc. | | | 4,570,562 | |
| | 378,000 | | | Sumitomo Osaka Cement Company, Ltd. | | | 1,230,672 | |
| | 40,100 | | | Suzuki Motor Corporation | | | 909,421 | |
| | 25,800 | | | Sysmex Corporation | | | 1,213,135 | |
| | 43,800 | | | Tamron Company, Ltd. | | | 1,190,330 | |
| | 61,000 | | | Tatsuta Electric Wire and Cable Company, Ltd. | | | 606,812 | |
| | 96,200 | | | Toyota Motor Corporation | | | 3,709,199 | |
| | 10,200 | | | Tsuruha Holdings, Inc. | | | 773,164 | |
| | 55,900 | | | Unipres Corporation | | | 1,288,674 | |
| | 47,700 | | | United Arrows, Ltd. | | | 1,222,176 | |
| | 50,300 | | | West Japan Railway Company | | | 2,195,984 | |
| | 45,000 | | | Yokohama Rubber Company, Ltd. | | | 316,304 | |
| | | | | |
| | | | Total | | | 90,761,706 | |
| | | | | |
| |
| Jersey (0.2%) | | | | |
| | 26,108 | | | Wolseley plc | | | 1,144,515 | |
| | | | | |
| | | | Total | | | 1,144,515 | |
| | | | | |
| |
| Lebanon (<0.1%) | | | | |
| | 5,739 | | | Solidere | | | 71,738 | |
| | | | | |
| | | | Total | | | 71,738 | |
| | | | | |
| |
| Luxembourg (0.3%) | | | | |
| | 59,000 | | | Tenaris SA ADR | | | 2,219,580 | |
| | 11,069 | | | Ternium SA ADR | | | 227,247 | |
| | | | | |
| | | | Total | | | 2,446,827 | |
| | | | | |
| |
| Malaysia (0.2%) | | | | |
| | 240,000 | | | CIMB Group Holdings Berhad | | | 599,799 | |
| | 104,900 | | | Genting Berhad | | | 303,972 | |
| | 50,200 | | | Malayan Banking Berhad | | | 148,504 | |
| | 135,500 | | | Public Bank Berhad | | | 706,416 | |
| | | | | |
| | | | Total | | | 1,758,691 | |
| | | | | |
| |
| Mexico (1.2%) | | | | |
| | 113,600 | | | America Movil SAB de CV | | | 144,104 | |
| | 168,000 | | | Consorcio ARA SAB de CVb | | | 53,117 | |
| | 33,000 | | | Fomento Economico Mexicano SAB de CV ADR | | | 2,990,130 | |
| | 11,100 | | | Grupo Aeroportuario del Sureste SAB de CV ADR | | | 1,071,927 | |
| | 476,500 | | | Grupo Financiero Banorte SAB de CV ADR | | | 2,649,244 | |
| | 54,800 | | | Kimberly-Clark de Mexico SAB de CV | | | 132,836 | |
| | 323,000 | | | Organizacion Soriana SAB de CV | | | 1,085,383 | |
| | | | | |
| | | | Total | | | 8,126,741 | |
| | | | | |
| |
| Netherlands (3.0%) | | | | |
| | 84,615 | | | Aalberts Industries NV | | | 1,538,057 | |
| | 1,039,900 | | | Aegon NV | | | 5,815,770 | |
| | 12,991 | | | ASML Holding NV | | | 714,141 | |
| | 16,749 | | | European Aeronautic Defence and Space Company | | | 596,093 | |
| | 15,487 | | | Gemalto NV | | | 1,398,784 | |
| | 47,913 | | | Imtech NV | | | 1,204,408 | |
| | 63,553 | | | Koninklijke (Royal) Ahold NV | | | 809,315 | |
| | 112,521 | | | Koninklijke DSM NV | | | 5,786,240 | |
| | 24,033 | | | Nutreco NV | | | 1,800,206 | |
| | 51,896 | | | TKH Group NV | | | 1,187,287 | |
| | 14,737 | | | Unilever NV | | | 541,650 | |
| | | | | |
| | | | Total | | | 21,391,951 | |
| | | | | |
The accompanying Notes to Financial Statements are an integral part of this schedule.
128
Partner Worldwide Allocation Fund
Schedule of Investments as of October 31, 2012
| | | | | | | | |
| Shares | | | Common Stock (87.8%) | | Value | |
| New Zealand (0.3%) | | | | |
| | 396,801 | | | Ryman Healthcare, Ltd. | | | $1,320,776 | |
| | 342,787 | | | Telecom Corporation of New | | | | |
| | | | Zealand, Ltd. | | | 677,649 | |
| | | | | |
| | | | Total | | | 1,998,425 | |
| | | | | |
| |
| Norway (1.7%) | | | | |
| | 32,516 | | | Aker Solutions ASA | | | 640,774 | |
| | 24,760 | | | Petroleum Geo-Services ASA | | | 427,841 | |
| | 35,000 | | | Schibsted ASA | | | 1,309,883 | |
| | 50,300 | | | Seadrill, Ltd. | | | 2,038,170 | |
| | 99,306 | | | Statoil ASA | | | 2,445,803 | |
| | 464,000 | | | STX OSV Holdings, Ltd. | | | 579,351 | |
| | 44,284 | | | TGS Nopec Geophysical Company ASA | | | 1,504,642 | |
| | 165,504 | | | Tomra Systems ASA | | | 1,359,659 | |
| | 36,663 | | | Yara International ASA | | | 1,727,887 | |
| | | | | |
| | | | Total | | | 12,034,010 | |
| | | | | |
| |
| Panama (<0.1%) | | | | |
| | 2,220 | | | Copa Holdings SA | | | 206,060 | |
| | | | | |
| | | | Total | | | 206,060 | |
| | | | | |
| |
| Philippines (0.4%) | | | | |
| | 2,769,500 | | | Ayala Land, Inc. | | | 1,582,953 | |
| | 733,966 | | | Bank of the Philippine Islands | | | 1,441,419 | |
| | 3,290 | | | Globe Telecom, Inc. | | | 90,923 | |
| | | | | |
| | | | Total | | | 3,115,295 | |
| | | | | |
| |
| Poland (0.3%) | | | | |
| | 7,631 | | | Bank Handlowy w Warszawie SA | | | 222,687 | |
| | 40,248 | | | Bank Pekao SA | | | 1,933,352 | |
| | 21,318 | | | Grupa Lotos SAb | | | 225,251 | |
| | | | | |
| | | | Total | | | 2,381,290 | |
| | | | | |
| |
| Portugal (0.4%) | | | | |
| | 3,111,975 | | | Banco Espirito Santo SAb | | | 3,028,706 | |
| | | | | |
| | | | Total | | | 3,028,706 | |
| | | | | |
| |
| Russia (0.5%) | | | | |
| | 66,985 | | | Gazprom OAO | | | 612,243 | |
| | 45,500 | | | Lukoil ADR | | | 2,761,319 | |
| | 2,768 | | | Novolipetsk Steel OJSC | | | 52,441 | |
| | 11,800 | | | Sberbank of Russia | | | 137,470 | |
| | | | | |
| | | | Total | | | 3,563,473 | |
| | | | | |
| |
| Singapore (1.6%) | | | | |
| | 1,218,000 | | | Biosensors International Group, Ltd.b | | | 1,079,264 | |
| | 2,471,000 | | | China Minzhong Food Corporation, Ltd.a,b | | | 1,630,704 | |
| | 1,349,000 | | | Ezion Holdings, Ltd. | | | 1,423,883 | |
| | 14,216,000 | | | GMG Global, Ltd. | | | 1,463,777 | |
| | 415,560 | | | Keppel Corporation, Ltd. | | | 3,615,569 | |
| | 650,000 | | | Raffles Medical Group, Ltd. | | | 1,302,301 | |
| | 271,000 | | | Super Group, Ltd. | | | 542,089 | |
| | | | | |
| | | | Total | | | 11,057,587 | |
| | | | | |
| |
| South Africa (0.7%) | | | | |
| | 21,218 | | | ABSA Group, Ltd. | | | 340,187 | |
| | 35,382 | | | Aveng, Ltd. | | | 126,255 | |
| | 11,342 | | | Impala Platinum Holdings, Ltd. | | | 204,490 | |
| | 67,890 | | | Massmart Holdings, Ltd. | | | 1,365,656 | |
| | 20,759 | | | MTN Group, Ltd. | | | 375,104 | |
| | 52,568 | | | PPC, Ltd. | | | 175,759 | |
| | 1,035 | | | Reunert, Ltd. | | | 9,115 | |
| | 214,000 | | | Truworths International, Ltd. | | | 2,330,359 | |
| | | | | |
| | | | Total | | | 4,926,925 | |
| | | | | |
| |
| South Korea (2.1%) | | | | |
| | 3,003 | | | E-Mart Company, Ltd. | | | 650,907 | |
| | 1,360 | | | Hyundai Heavy Industries Company, Ltd. | | | 285,004 | |
| | 916 | | | Hyundai Mobis | | | 232,797 | |
| | 19,000 | | | LG Uplus Corporation | | | 121,339 | |
| | 12,000 | | | POSCO | | | 3,772,254 | |
| | 1,836 | | | POSCO ADR | | | 143,906 | |
| | 6,650 | | | Samsung Electronics Company, Ltd. | | | 4,827,491 | |
| | 3,310 | | | Samsung Heavy Industries Company, Ltd. | | | 101,016 | |
| | 11,360 | | | Shinhan Financial Group Company, Ltd. | | | 389,903 | |
| | 1,415 | | | Shinsegae Company, Ltd. | | | 252,848 | |
| | 4,830 | | | SK Telecom Company, Ltd. | | | 682,266 | |
| | 226,133 | | | SK Telecom Company, Ltd. ADR | | | 3,534,459 | |
| | | | | |
| | | | Total | | | 14,994,190 | |
| | | | | |
| |
| Spain (1.1%) | | | | |
| | 4,845 | | | Banco Bilbao Vizcaya Argentaria SA | | | 40,484 | |
| | 341,767 | | | Bankia SAb | | | 515,856 | |
| | 916,300 | | | Iberdrola SA | | | 4,745,455 | |
| | 12,440 | | | Industria de Diseno Textil SA (Inditex) | | | 1,588,482 | |
| | 15,918 | | | Viscofan SA | | | 771,252 | |
| | | | | |
| | | | Total | | | 7,661,529 | |
| | | | | |
| |
| Sweden (1.3%) | | | | |
| | 59,649 | | | Boliden AB | | | 1,045,271 | |
| | 31,295 | | | Hexpol AB | | | 1,399,364 | |
| | 39,708 | | | Hoganas AB | | | 1,324,233 | |
| | 78,841 | | | JM AB | | | 1,420,167 | |
| | 190,497 | | | Skandinaviska Enskilda Banken AB | | | 1,580,704 | |
| | 182,993 | | | Volvo AB | | | 2,469,347 | |
| | | | | |
| | | | Total | | | 9,239,086 | |
| | | | | |
| |
| Switzerland (6.9%) | | | | |
| | 33,416 | | | Actelion, Ltd.b | | | 1,612,907 | |
| | 80,650 | | | Adecco SAb | | | 3,910,915 | |
| | 9,099 | | | Bucher Industries AG | | | 1,707,376 | |
| | 4,513 | | | Burckhardt Compression Holding AG | | | 1,293,512 | |
| | 48,054 | | | Compagnie Financiere Richemont SA | | | 3,118,610 | |
| | 192,850 | | | Credit Suisse Group AGb | | | 4,484,796 | |
| | 4,480 | | | Dufry AGb | | | 569,797 | |
| | 137,761 | | | EFG International AGb | | | 1,259,875 | |
| | 774 | | | Galenica AG | | | 454,565 | |
| | 3,333 | | | Givaudan SAb | | | 3,333,960 | |
| | 87,863 | | | Holcim, Ltd.b | | | 5,996,319 | |
| | 94,653 | | | Nestle SA | | | 6,009,351 | |
| | 64,200 | | | Novartis AG | | | 3,871,297 | |
| | 46,571 | | | Roche Holding AG | | | 8,970,748 | |
| | 6,140 | | | Zurich Insurance Group AGb | | | 1,513,631 | |
| | | | | |
| | | | Total | | | 48,107,659 | |
| | | | | |
The accompanying Notes to Financial Statements are an integral part of this schedule.
129
Partner Worldwide Allocation Fund
Schedule of Investments as of October 31, 2012
| | | | | | | | |
| Shares | | | Common Stock (87.8%) | | Value | |
| Taiwan (0.8%) | | | | |
| | 383,000 | | | Compal Electronics, Inc. | | | $240,913 | |
| | 109,000 | | | Novatek Microelectronics Corporation | | | 409,941 | |
| | 66,000 | | | Taiwan Fertilizer Company, Ltd. | | | 157,074 | |
| | 314,100 | | | Taiwan Mobile Company, Ltd. | | | 1,095,771 | |
| | 1,204,362 | | | Taiwan Semiconductor Manufacturing Company, Ltd. | | | 3,669,763 | |
| | 367,000 | | | Walsin Lihwa Corporationb | | | 100,338 | |
| | | | | |
| | | | Total | | | 5,673,800 | |
| | | | | |
| |
| Thailand (1.8%) | | | | |
| | 18,700 | | | Advanced Info Service pcl | | | 120,136 | |
| | 359,650 | | | Bangkok Bank pcl | | | 2,113,910 | |
| | 24,500 | | | Kasikornbank pcl | | | 142,464 | |
| | 287,000 | | | PTT Exploration & Production pcl | | | 1,548,396 | |
| | 452,650 | | | PTT pcl | | | 4,679,939 | |
| | 130,800 | | | Siam Cement pcl | | | 1,767,618 | |
| | 378,400 | | | Siam Commercial Bank pcl | | | 1,978,196 | |
| | 113,900 | | | Thai Oil pcl | | | 246,752 | |
| | | | | |
| | | | Total | | | 12,597,411 | |
| | | | | |
| |
| Turkey (0.8%) | | | | |
| | 544,258 | | | Akbank TAS | | | 2,626,034 | |
| | 35,398 | | | BIM Birlesik Magazalar AS | | | 1,644,390 | |
| | 9,781 | | | Ford Otomotiv Sanayi AS | | | 100,330 | |
| | 321,000 | | | Turkiye Garanti Bankasi AS | | | 1,533,726 | |
| | | | | |
| | | | Total | | | 5,904,480 | |
| | | | | |
| |
| United Kingdom (12.1%) | | | | |
| | 49,579 | | | Aveva Group plc | | | 1,595,416 | |
| | 210,452 | | | Babcock International Group plc | | | 3,326,728 | |
| | 1,094,911 | | | BAE Systems plc | | | 5,526,336 | |
| | 91,646 | | | Bellway plc | | | 1,498,084 | |
| | 82,403 | | | BG Group plc | | | 1,529,979 | |
| | 17,000 | | | BHP Billiton plc | | | 546,215 | |
| | 35,568 | | | British American Tobacco plc | | | 1,764,172 | |
| | 152,655 | | | BTG plcb | | | 841,528 | |
| | 52,011 | | | Diageo plc | | | 1,486,929 | |
| | 161,703 | | | Elementis plc | | | 547,319 | |
| | 40,084 | | | Eurasian Natural Resources | | | 212,490 | |
| | 274,300 | | | Fenner plc | | | 1,602,581 | |
| | 99,945 | | | GlaxoSmithKline plc | | | 2,239,531 | |
| | 239,437 | | | Halma plc | | | 1,595,873 | |
| | 14,092 | | | Hikma Pharmaceuticals plc | | | 168,306 | |
| | 88,850 | | | HSBC Holdings plc ADR | | | 4,385,636 | |
| | 12,692 | | | Imperial Tobacco Group plc | | | 480,008 | |
| | 138,995 | | | Inchcape plc | | | 903,953 | |
| | 633,884 | | | Intermediate Capital Group plc | | | 3,128,760 | |
| | 562,977 | | | ITV plc | | | 788,181 | |
| | 83,195 | | | J Sainsbury plc | | | 477,012 | |
| | 117,168 | | | Lancashire Holdings, Ltd. | | | 1,633,913 | |
| | 405,836 | | | Legal & General Group plc | | | 879,747 | |
| | 94,630 | | | London Stock Exchange Group plc | | | 1,493,144 | |
| | 154,428 | | | Mondi plc | | | 1,702,338 | |
| | 258,130 | | | Morgan Crucible Company plc | | | 1,054,646 | |
| | 78,853 | | | National Grid plc | | | 899,291 | |
| | 15,188 | | | Next plc | | | 875,538 | |
| | 386,668 | | | Pace plc | | | 1,160,622 | |
| | 105,800 | | | Pearson plc | | | 2,127,332 | |
| | 139,471 | | | Persimmon plc | | | 1,794,563 | |
| | 120,230 | | | Prudential plc | | | 1,651,204 | |
| | 46,949 | | | Rio Tinto plc | | | 2,345,422 | |
| | 41,331 | | | SABMiller plc | | | 1,761,534 | |
| | 51,608 | | | Spirax-Sarco Engineering plc | | | 1,615,782 | |
| | 501,565 | | | Spirent plc | | | 1,169,650 | |
| | 80,860 | | | Sports Direct International plcb | | | 521,064 | |
| | 225,911 | | | Standard Chartered plc | | | 5,348,835 | |
| | 683,288 | | | Taylor Wimpey plc | | | 675,343 | |
| | 105,686 | | | Telecity Group plc | | | 1,539,507 | |
| | 1,158,429 | | | Tesco plc | | | 5,994,260 | |
| | 60,385 | | | Ultra Electronics Holdings plc | | | 1,652,401 | |
| | 44,377 | | | Unilever plc | | | 1,655,416 | |
| | 17,330 | | | Vedanta Resources plc | | | 318,425 | |
| | 1,441,687 | | | Vodafone Group plc | | | 3,915,127 | |
| | 27,897 | | | Whitbread plc | | | 1,060,180 | |
| | 366,800 | | | WPP plc | | | 4,741,030 | |
| | | | | |
| | | | Total | | | 84,231,351 | |
| | | | | |
| |
| United States (0.2%) | | | | |
| | 14,600 | | | iShares MSCI Emerging Markets Index Fund | | | 600,206 | |
| | 11,600 | | | Vanguard MSCI Emerging Markets ETF | | | 481,284 | |
| | | | | |
| | | | Total | | | 1,081,490 | |
| | | | | |
| | | | | | | | |
| | | | | |
| | | | Total Common Stock (cost $605,693,016) | | | 617,800,062 | |
| | | | | |
| | |
Principal
Amount | | | Long-Term Fixed Income (10.3%) | | Value | |
| Angola (<0.1%) | | | | |
| | | | Republic of Angola Via Northern Lights III BV | | | | |
| | 250,000 | | | 7.000%, 8/16/2019 | | | 279,375 | |
| | | | | |
| | | | Total | | | 279,375 | |
| | | | | |
| |
| Argentina (0.2%) | | | | |
| | | | Argentina Government International Bond | | | | |
| | 956,391 | | | 7.820%, 12/31/2033d | | | 761,126 | |
| | 75,771 | | | 8.280%, 12/31/2033 | | | 49,251 | |
| | 5,284,000 | | | 0.000%, 12/15/2035d,e | | | 684,882 | |
| | 1,060,000 | | | 0.000%, 12/15/2035e | | | 109,710 | |
| | 330,000 | | | 0.000%, 12/15/2035e | | | 35,640 | |
| | | | | |
| | | | Total | | | 1,640,609 | |
| | | | | |
| |
| Azerbaijan (<0.1%) | | | | |
| | | | State Oil Company of Azerbaijan Republic | | | | |
| | 200,000 | | | 5.450%, 2/9/2017 | | | 215,538 | |
| | | | | |
| | | | Total | | | 215,538 | |
| | | | | |
| |
| Belarus (0.1%) | | | | |
| | | | Belarus Government International Bond | | | | |
| | 466,000 | | | 8.750%, 8/3/2015 | | | 466,000 | |
| | | | | |
| | | | Total | | | 466,000 | |
| | | | | |
| |
| Belize (<0.1%) | | | | |
| | | | Belize Government International Bond | | | | |
| | 140,000 | | | 8.500%, 2/20/2029 | | | 54,250 | |
| | | | | |
| | | | Total | | | 54,250 | |
| | | | | |
The accompanying Notes to Financial Statements are an integral part of this schedule.
130
Partner Worldwide Allocation Fund
Schedule of Investments as of October 31, 2012
| | | | | | | | |
Principal
Amount | | | Long-Term Fixed Income (10.3%) | | Value | |
| Bermuda (0.1%) | | | | |
| | | | China Resources Gas Group, Ltd | | | | |
| | $400,000 | | | 4.500%, 4/5/2022 | | | $439,046 | |
| | | | Digicel Group, Ltd. | | | | |
| | 370,000 | | | 8.250%, 9/30/2020c | | | 398,675 | |
| | | | | |
| | | | Total | | | 837,721 | |
| | | | | |
| |
| Bolivia (<0.1%) | | | | |
| | | | Bolivia Government International Bond | | | | |
| | 200,000 | | | 4.875%, 10/29/2022c | | | 201,000 | |
| | | | | |
| | | | Total | | | 201,000 | |
| | | | | |
| |
| Brazil (0.4%) | | | | |
| | | | Banco do Brasil SA/Cayman Islands | | | | |
| | 840,000 | | | 3.875%, 10/10/2022 | | | 837,480 | |
| | | | Banco do Estado do Rio Grande do Sul SA | | | | |
| | 460,000 | | | 7.375%, 2/2/2022c | | | 522,100 | |
| | | | Brazil Government International Bond | | | | |
| | 570,000 | | | 2.625%, 1/5/2023 | | | 568,575 | |
| | 10,000 | | | 8.250%, 1/20/2034 | | | 16,400 | |
| | 340,000 | | | 11.000%, 8/17/2040 | | | 430,950 | |
| | 300,000 | | | 5.625%, 1/7/2041 | | | 384,000 | |
| | | | Independencia International, Ltd. | | | | |
| | 95,246 | | | 12.000%, 12/30/2016c,f,g | | | 1 | |
| | | | | |
| | | | Total | | | 2,759,506 | |
| | | | | |
| |
| Canada (0.1%) | | | | |
| | | | Nexen, Inc. | | | | |
| | 65,000 | | | 6.400%, 5/15/2037 | | | 83,413 | |
| | | | PTTEP Canada International Finance, Ltd. | | | | |
| | 200,000 | | | 5.692%, 4/5/2021 | | | 232,729 | |
| | 200,000 | | | 5.692%, 4/5/2021c | | | 232,729 | |
| | 210,000 | | | 6.350%, 6/12/2042c | | | 265,712 | |
| | | | | |
| | | | Total | | | 814,583 | |
| | | | | |
| |
| Cayman Islands (0.2%) | | | | |
| | | | Country Garden Holdings Company, Ltd. | | | | |
| | 700,000 | | | 2.500%, 2/22/2013h | | | 134,087 | |
| | | | Dubai Holding Commercial Operations MTN, Ltd. | | | | |
| | 100,000 | | | 4.750%, 1/30/2014d | | | 127,022 | |
| | 50,000 | | | 6.000%, 2/1/2017i | | | 77,582 | |
| | | | Evergrande Real Estate Group, Ltd. | | | | |
| | 1,000,000 | | | 7.500%, 1/19/2014h | | | 153,752 | |
| | | | Petrobras International Finance Company | | | | |
| | 170,000 | | | 5.750%, 1/20/2020 | | | 196,092 | |
| | 470,000 | | | 5.375%, 1/27/2021 | | | 533,006 | |
| | | | Raizen Fuels Finance, Ltd. | | | | |
| | 330,000 | | | 9.500%, 8/15/2014 | | | 371,249 | |
| | | | | |
| | | | Total | | | 1,592,790 | |
| | | | | |
| |
| Chile (0.5%) | | | | |
| | | | AES Gener SA | | | | |
| | 70,000 | | | 5.250%, 8/15/2021c | | | 78,982 | |
| | 140,000 | | | 5.250%, 8/15/2021 | | | 157,965 | |
| | | | Banco de Credito e Inversiones | | | | |
| | 580,000 | | | 3.000%, 9/13/2017c | | | 588,783 | |
| | | | Banco del Estado de Chile | | | | |
| | 150,000 | | | 0.210%, 12/21/2012 | | | 150,000 | |
| | 430,000 | | | 4.125%, 10/7/2020 | | | 473,884 | |
| | 100,000 | | | 4.125%, 10/7/2020c | | | 110,206 | |
| | | | Banco Santander Chile | | | | |
| | 190,000 | | | 3.875%, 9/20/2022c | | | 196,124 | |
| | | | Chile Government International Bond | | | | |
| | 100,000 | | | 3.875%, 8/5/2020 | | | 113,500 | |
| | 380,000 | | | 3.250%, 9/14/2021 | | | 412,300 | |
| | 150,000 | | | 3.625%, 10/30/2042 | | | 146,250 | |
| | | | Corporacion Nacional del Cobre de Chile | | | | |
| | 100,000 | | | 7.500%, 1/15/2019 | | | 129,951 | |
| | 100,000 | | | 3.750%, 11/4/2020c | | | 108,361 | |
| | 190,000 | | | 3.750%, 11/4/2020 | | | 205,886 | |
| | 200,000 | | | 4.250%, 7/17/2042c | | | 203,248 | |
| | | | E-CL SA | | | | |
| | 120,000 | | | 5.625%, 1/15/2021c | | | 137,233 | |
| | | | | |
| | | | Total | | | 3,212,673 | |
| | | | | |
| |
| Colombia (0.7%) | | | | |
| | | | Banco de Bogota SA | | | | |
| | 400,000 | | | 5.000%, 1/15/2017 | | | 428,000 | |
| | | | Bancolombia SA | | | | |
| | 100,000 | | | 5.950%, 6/3/2021 | | | 115,500 | |
| | 260,000 | | | 5.125%, 9/11/2022 | | | 271,700 | |
| | | | Colombia Government International Bond | | | | |
| | 20,000 | | | 8.250%, 12/22/2014 | | | 23,130 | |
| | 450,000 | | | 7.375%, 1/27/2017 | | | 559,125 | |
| | 540,000 | | | 7.375%, 3/18/2019 | | | 712,800 | |
| | 400,000 | | | 7.375%, 9/18/2037 | | | 617,000 | |
| | 520,000 | | | 6.125%, 1/18/2041 | | | 709,800 | |
| | | | Colombia Telecomunicaciones SA ESP | | | | |
| | 200,000 | | | 5.375%, 9/27/2022c | | | 204,500 | |
| | | | Empresa de Energia de Bogota SA | | | | |
| | 520,000 | | | 6.125%, 11/10/2021c | | | 587,600 | |
| | | | Empresas Publicas de Medellin ESP | | | | |
| | 100,000 | | | 7.625%, 7/29/2019 | | | 127,250 | |
| | | | Transportadora de Gas del Internacional SA ESP | | | | |
| | 200,000 | | | 5.700%, 3/20/2022c | | | 223,000 | |
| | | | | |
| | | | Total | | | 4,579,405 | |
| | | | | |
| |
| Dominican Republic (0.3%) | | | | |
| | | | Dominican Republic Government International Bond | | | | |
| | 131,157 | | | 9.040%, 1/23/2018 | | | 150,831 | |
| | 1,410,000 | | | 7.500%, 5/6/2021 | | | 1,656,750 | |
| | 390,000 | | | 8.625%, 4/20/2027 | | | 468,000 | |
| | | | | |
| | | | Total | | | 2,275,581 | |
| | | | | |
| |
| Egypt (0.1%) | | | | |
| | | | Egypt Government International Bond | | | | |
| | 350,000 | | | 5.750%, 4/29/2020 | | | 359,625 | |
| | | | | |
| | | | Total | | | 359,625 | |
| | | | | |
The accompanying Notes to Financial Statements are an integral part of this schedule.
131
Partner Worldwide Allocation Fund
Schedule of Investments as of October 31, 2012
| | | | | | | | |
Principal
Amount | | | Long-Term Fixed Income (10.3%) | | Value | |
| Gabon (<0.1%) | | | | |
| | | | Gabon Government International Bond | | | | |
| | $235,000 | | | 8.200%, 12/12/2017 | | | $284,938 | |
| | | | | |
| | | | Total | | | 284,938 | |
| | | | | |
| |
| Ghana (<0.1%) | | | | |
| | | | Ghana Government International Bond | | | | |
| | 190,000 | | | 8.500%, 10/4/2017 | | | 220,400 | |
| | | | | |
| | | | Total | | | 220,400 | |
| | | | | |
| |
| Greece (<0.1%) | | | | |
| | | | Greece Government International Bond | | | | |
| | 40,000 | | | 2.000%, 2/24/2035d,j | | | 11,168 | |
| | 60,000 | | | 2.000%, 2/24/2036d,j | | | 16,712 | |
| | 50,000 | | | 2.000%, 2/24/2037d,j | | | 13,739 | |
| | 100,000 | | | 2.000%, 2/24/2038d,j | | | 27,627 | |
| | | | | |
| | | | Total | | | 69,246 | |
| | | | | |
| |
| Guatemala (0.1%) | | | | |
| | | | Guatemala Government International Bond | | | | |
| | 390,000 | | | 5.750%, 6/6/2022c | | | 444,600 | |
| | | | | |
| | | | Total | | | 444,600 | |
| | | | | |
| |
| Hong Kong (<0.1%) | | | | |
| | | | Zijin International Finance Company, Ltd. | | | | |
| | 100,000 | | | 4.250%, 6/30/2016 | | | 106,017 | |
| | | | | |
| | | | Total | | | 106,017 | |
| | | | | |
| |
| Hungary (0.1%) | | | | |
| | | | Hungary Government International Bond | | | | |
| | 100,000 | | | 3.500%, 7/18/2016d | | | 124,233 | |
| | 190,000 | | | 4.375%, 7/4/2017d | | | 239,546 | |
| | 31,000 | | | 3.875%, 2/24/2020d | | | 37,026 | |
| | | | | |
| | | | Total | | | 400,805 | |
| | | | | |
| |
| Iceland (0.1%) | | | | |
| | | | Iceland Government International Bond | | | | |
| | 200,000 | | | 4.875%, 6/16/2016c | | | 210,250 | |
| | 360,000 | | | 4.875%, 6/16/2016 | | | 378,450 | |
| | 110,000 | | | 5.875%, 5/11/2022c | | | 119,917 | |
| | | | | |
| | | | Total | | | 708,617 | |
| | | | | |
| |
| Indonesia (1.1%) | | | | |
| | | | Berau Coal Energy Tbk PT | | | | |
| | 200,000 | | | 7.250%, 3/13/2017c | | | 187,500 | |
| | | | Indonesia Government International Bond | | | | |
| | 100,000 | | | 6.750%, 3/10/2014 | | | 106,750 | |
| | 2,380,000 | | | 11.625%, 3/4/2019 | | | 3,617,600 | |
| | 721,000 | | | 4.875%, 5/5/2021 | | | 821,940 | |
| | 290,000 | | | 8.500%, 10/12/2035 | | | 464,725 | |
| | 650,000 | | | 7.750%, 1/17/2038 | | | 983,938 | |
| | 590,000 | | | 5.250%, 1/17/2042c | | | 679,975 | |
| | 310,000 | | | 5.250%, 1/17/2042 | | | 357,275 | |
| | | | Perusahaan Penerbit SBSN | | | | |
| | 270,000 | | | 4.000%, 11/21/2018c | | | 285,188 | |
| | | | | |
| | | | Total | | | 7,504,891 | |
| | | | | |
| |
| Iraq (0.1%) | | | | |
| | | | Iraq Government International Bond | | | | |
| | 500,000 | | | 5.800%, 1/15/2028 | | | 465,000 | |
| | | | | |
| | | | Total | | | 465,000 | |
| | | | | |
| |
| Ireland (0.1%) | | | | |
| | | | MTS International Funding, Ltd. | | | | |
| | 520,000 | | | 8.625%, 6/22/2020 | | | 640,276 | |
| | | | Vimpel Communications Via VIP Finance Ireland, Ltd. OJSC | | | | |
| | 170,000 | | | 9.125%, 4/30/2018 | | | 199,075 | |
| | | | | |
| | | | Total | | | 839,351 | |
| | | | | |
| |
| Ivory Coast (0.3%) | | | | |
| | |
| | | | Ivory Coast Government International Bond | | | | |
| | 2,208,000 | | | 3.750%, 12/31/2032 | | | 1,987,200 | |
| | | | | |
| | | | Total | | | 1,987,200 | |
| | | | | |
| |
| Kazakhstan (0.2%) | | | | |
| | | | Kazatomprom Natsionalnaya Atomnaya Kompaniya AO | | | | |
| | 100,000 | | | 6.250%, 5/20/2015 | | | 109,625 | |
| | | | KazMunaiGaz Finance Sub BV | | | | |
| | 290,000 | | | 7.000%, 5/5/2020 | | | 356,346 | |
| | | | KazMunayGas National Company | | | | |
| | 240,000 | | | 11.750%, 1/23/2015 | | | 287,803 | |
| | 260,000 | | | 6.375%, 4/9/2021 | | | 306,475 | |
| | 200,000 | | | 6.375%, 4/9/2021c | | | 235,750 | |
| | | | | |
| | | | Total | | | 1,295,999 | |
| | | | | |
| |
| Luxembourg (0.3%) | | | | |
| | | | Gazprom OAO Via Gaz Capital SA | | | | |
| | 478,000 | | | 9.250%, 4/23/2019 | | | 623,790 | |
| | 280,000 | | | 4.950%, 7/19/2022c | | | 296,972 | |
| | | | Sberbank of Russia Via SB Capital SA | | | | |
| | 220,000 | | | 5.125%, 10/29/2022c | | | 219,399 | |
| | | | TNK-BP Finance SA | | | | |
| | 490,000 | | | 7.875%, 3/13/2018 | | | 581,841 | |
| | 220,000 | | | 7.250%, 2/2/2020 | | | 260,566 | |
| | | | | |
| | | | Total | | | 1,982,568 | |
| | | | | |
| |
| Malaysia (0.1%) | | | | |
| | | | Wakala Global Sukuk Bhd | | | | |
| | 360,000 | | | 4.646%, 7/6/2021 | | | 412,904 | |
| | | | | |
| | | | Total | | | 412,904 | |
| | | | | |
| |
| Mexico (0.6%) | | | | |
| | | | America Movil SAB de CV | | | | |
| | 210,000 | | | 3.125%, 7/16/2022 | | | 216,549 | |
| | | | Mexichem SAB de CV | | | | |
| | 200,000 | | | 4.875%, 9/19/2022c | | | 211,500 | |
| | | | Mexico Government International Bond | | | | |
| | 470,000 | | | 6.375%, 1/16/2013 | | | 475,405 | |
| | 540,000 | | | 5.875%, 1/15/2014 | | | 571,050 | |
| | 10,000 | | | 6.625%, 3/3/2015 | | | 11,290 | |
The accompanying Notes to Financial Statements are an integral part of this schedule.
132
Partner Worldwide Allocation Fund
Schedule of Investments as of October 31, 2012
| | | | | | | | |
Principal
Amount | | | Long-Term Fixed Income (10.3%) | | Value | |
| Mexico (0.6%) - continued | | | | |
| | $40,000 | | | 5.625%, 1/15/2017 | | | $46,760 | |
| | 16,000 | | | 3.625%, 3/15/2022 | | | 17,480 | |
| | 250,000 | | | 6.750%, 9/27/2034 | | | 353,750 | |
| | 60,000 | | | 6.050%, 1/11/2040 | | | 79,650 | |
| | 890,000 | | | 4.750%, 3/8/2044 | | | 987,900 | |
| | 60,000 | | | 5.750%, 10/12/2110 | | | 70,500 | |
| | | | Pemex Project Funding Master Trust | | | | |
| | 590,000 | | | 6.625%, 6/15/2035 | | | 736,025 | |
| | | | Petroleos Mexicanos | | | | |
| | 30,000 | | | 8.000%, 5/3/2019 | | | 39,300 | |
| | 200,000 | | | 5.500%, 1/21/2021 | | | 233,500 | |
| | 50,000 | | | 6.500%, 6/2/2041 | | | 62,063 | |
| | | | | |
| | | | Total | | | 4,112,722 | |
| | | | | |
| |
| Netherlands (0.1%) | | | | |
| | | | Kazakhstan Temir Zholy Finance BV | | | | |
| | 200,000 | | | 6.950%, 7/10/2042c | | | 244,108 | |
| | | | Listrindo Capital BV | | | | |
| | 200,000 | | | 6.950%, 2/21/2019 | | | 226,484 | |
| | | | VimpelCom Holdings BV | | | | |
| | 200,000 | | | 7.504%, 3/1/2022c | | | 216,000 | |
| | | | | |
| | | | Total | | | 686,592 | |
| | | | | |
| |
| Nigeria (0.1%) | | | | |
| | | | Nigeria Government International Bond | | | | |
| | 460,000 | | | 6.750%, 1/28/2021 | | | 530,150 | |
| | | | | |
| | | | Total | | | 530,150 | |
| | | | | |
| |
| Pakistan (<0.1%) | | | | |
| | | | Pakistan Government International Bond | | | | |
| | 200,000 | | | 6.875%, 6/1/2017 | | | 180,000 | |
| | 120,000 | | | 7.875%, 3/31/2036 | | | 86,400 | |
| | | | | |
| | | | Total | | | 266,400 | |
| | | | | |
| |
| Panama (0.3%) | | | | |
| | | | Panama Government International Bond | | | | |
| | 230,000 | | | 7.250%, 3/15/2015 | | | 262,200 | |
| | 527,000 | | | 8.875%, 9/30/2027 | | | 855,058 | |
| | 190,000 | | | 9.375%, 4/1/2029 | | | 325,850 | |
| | 480,000 | | | 6.700%, 1/26/2036 | | | 683,280 | |
| | | | | |
| | | | Total | | | 2,126,388 | |
| | | | | |
| |
| Paraguay (<0.1%) | | | | |
| | | | Banco Continental SAECA | | | | |
| | 150,000 | | | 8.875%, 10/15/2017c | | | 156,000 | |
| | | | | |
| | | | Total | | | 156,000 | |
| | | | | |
| |
| Peru (0.3%) | | | | |
| | | | Corporacion Financiera de Desarrollo SA | | | | |
| | 200,000 | | | 4.750%, 2/8/2022c | | | 223,500 | |
| | | | Corporacion Lindley SA | | | | |
| | 90,000 | | | 6.750%, 11/23/2021c | | | 103,815 | |
| | | | Peru Government International Bond | | | | |
| | 200,000 | | | 5.625%, 11/18/2050 | | | 259,000 | |
| | 260,000 | | | 7.350%, 7/21/2025 | | | 378,300 | |
| | 445,000 | | | 8.750%, 11/21/2033 | | | 778,750 | |
| | | | Volcan Cia Minera SAA | | | | |
| | 10,000 | | | 5.375%, 2/2/2022 | | | 10,775 | |
| | 44,000 | | | 5.375%, 2/2/2022c | | | 47,410 | |
| | | | | |
| | | | Total | | | 1,801,550 | |
| | | | | |
| |
| Philippines (0.6%) | | | | |
| | | | Energy Development Corporation | | | | |
| | 200,000 | | | 6.500%, 1/20/2021 | | | 222,135 | |
| | | | Philippines Government International Bond | | | | |
| | 100,000 | | | 8.375%, 6/17/2019 | | | 138,000 | |
| | 860,000 | | | 7.500%, 9/25/2024 | | | 1,234,100 | |
| | 60,000 | | | 9.500%, 10/21/2024 | | | 98,100 | |
| | 530,000 | | | 5.500%, 3/30/2026 | | | 670,450 | |
| | 284,000 | | | 9.500%, 2/2/2030 | | | 496,290 | |
| | 752,000 | | | 6.375%, 10/23/2034 | | | 1,045,280 | |
| | | | | |
| | | | Total | | | 3,904,355 | |
| | | | | |
| |
| Qatar (<0.1%) | | | | |
| | | | Ras Laffan Liquefied Natural Gas Company, Ltd. II | | | | |
| | 239,250 | | | 5.298%, 9/30/2020 | | | 269,754 | |
| | | | | |
| | | | Total | | | 269,754 | |
| | | | | |
| |
| Romania (0.1%) | | | | |
| | | | Romania Government International Bond | | | | |
| | 27,000 | | | 6.500%, 6/18/2018d | | | 38,390 | |
| | 150,000 | | | 6.750%, 2/7/2022 | | | 173,250 | |
| | 360,000 | | | 6.750%, 2/7/2022c | | | 415,800 | |
| | | | | |
| | | | Total | | | 627,440 | |
| | | | | |
| |
| Russia (0.4%) | | | | |
| | | | Gazprom Neft Capital SA | | | | |
| | 230,000 | | | 4.375%, 9/19/2022c | | | 230,575 | |
| | | | Russia Government International Bond | | | | |
| | 100,000 | | | 5.000%, 4/29/2020 | | | 115,750 | |
| | 1,400,000 | | | 4.500%, 4/4/2022c | | | 1,566,320 | |
| | 709,125 | | | 7.500%, 3/31/2030 | | | 897,965 | |
| | | | | |
| | | | Total | | | 2,810,610 | |
| | | | | |
| |
| Serbia (0.1%) | | | | |
| | | | Serbia Government International Bond | | | | |
| | 310,000 | | | 7.250%, 9/28/2021 | | | 330,150 | |
| | 125,000 | | | 6.750%, 11/1/2024 | | | 123,750 | |
| | | | | |
| | | | Total | | | 453,900 | |
| | | | | |
| |
| Slovenia (0.2%) | | | | |
| | | | Slovenia Government International Bond | | | | |
| | 1,030,000 | | | 5.500%, 10/26/2022c | | | 1,041,330 | |
| | 480,000 | | | 4.625%, 9/9/2024d | | | 554,471 | |
| | 100,000 | | | 5.125%, 8/30/2026d | | | 116,700 | |
| | | | | |
| | | | Total | | | 1,712,501 | |
| | | | | |
| |
| South Africa (0.1%) | | | | |
| | | | Peermont Global Proprietary, Ltd. | | | | |
| | 280,000 | | | 7.750%, 4/30/2014d | | | 350,218 | |
The accompanying Notes to Financial Statements are an integral part of this schedule.
133
Partner Worldwide Allocation Fund
Schedule of Investments as of October 31, 2012
| | | | | | | | |
Principal
Amount | | | Long-Term Fixed Income (10.3%) | | Value | |
| South Africa (0.1%) - continued | | | | |
| | | | Transnet SOC, Ltd. | | | | |
| | $330,000 | | | 4.000%, 7/26/2022c | | | $330,000 | |
| | | | | |
| | | | Total | | | 680,218 | |
| | | | | |
| |
| South Korea (0.1%) | | | | |
| | | | South Korea Government International Bond | | | | |
| | 453,000 | | | 7.125%, 4/16/2019 | | | 590,664 | |
| | | | | |
| | | | Total | | | 590,664 | |
| | | | | |
| |
| Sri Lanka (<0.1%) | | | | |
| | | | Sri Lanka Government International Bond | | | | |
| | 220,000 | | | 6.250%, 7/27/2021c | | | 246,004 | |
| | | | | |
| | | | Total | | | 246,004 | |
| | | | | |
| |
| Supranational (0.2%) | | | | |
| | | | Corporacion Andina de Fomento | | | | |
| | 599,000 | | | 3.750%, 1/15/2016 | | | 629,084 | |
| | 424,000 | | | 4.375%, 6/15/2022 | | | 461,048 | |
| | | | | |
| | | | Total | | | 1,090,132 | |
| | | | | |
| |
| Thailand (<0.1%) | | | | |
| | | | PTT pcl | | | | |
| | 30,000 | | | 4.500%, 10/25/2042c | | | 29,833 | |
| | | | | |
| | | | Total | | | 29,833 | |
| | | | | |
| |
| Turkey (0.9%) | | | | |
| | | | Anadolu Efes Biracilik Ve Malt Sanayii AS | | | | |
| | 200,000 | | | 3.375%, 11/1/2022c | | | 194,000 | |
| | | | Export Credit Bank of Turkey | | | | |
| | 270,000 | | | 5.375%, 11/4/2016c | | | 288,401 | |
| | | | Turkey Government International Bond | | | | |
| | 1,400,000 | | | Zero Coupon, 9/11/2013k | | | 738,161 | |
| | 180,000 | | | 7.000%, 9/26/2016 | | | 209,250 | |
| | 1,545,000 | | | 6.750%, 4/3/2018 | | | 1,839,322 | |
| | 422,000 | | | 5.625%, 3/30/2021 | | | 490,575 | |
| | 1,110,000 | | | 6.250%, 9/26/2022 | | | 1,344,765 | |
| | 340,000 | | | 7.375%, 2/5/2025 | | | 444,550 | |
| | | | Turkiye Halk Bankasi AS | | | | |
| | 200,000 | | | 4.875%, 7/19/2017 | | | 204,000 | |
| | 200,000 | | | 4.875%, 7/19/2017c | | | 204,000 | |
| | | | Turkiye Is Bankasi | | | | |
| | 210,000 | | | 6.000%, 10/24/2022c | | | 214,200 | |
| | | | | |
| | | | Total | | | 6,171,224 | |
| | | | | |
| |
| Ukraine (<0.1%) | | | | |
| | | | Ukraine Government International Bond | | | | |
| | 200,000 | | | 9.250%, 7/24/2017 | | | 218,114 | |
| | 100,000 | | | 8.375%, 11/3/2017 | | | 95,000 | |
| | | | | |
| | | | Total | | | 313,114 | |
| | | | | |
| |
| United Arab Emirates (0.1%) | | | | |
| | | | Dolphin Energy, Ltd. | | | | |
| | 192,096 | | | 5.888%, 6/15/2019 | | | 218,029 | |
| | 210,000 | | | 5.500%, 12/15/2021 | | | 243,285 | |
| | | | | |
| | | | Total | | | 461,314 | |
| | | | | |
| |
| United Kingdom (0.1%) | | | | |
| | | | HSBC Bank plc | | | | |
| | 78,000,000 | | | Zero Coupon, 8/12/2013c,g | | | $447,706 | |
| | | | | |
| | | | Total | | | 447,706 | |
| | | | | |
| |
| United States (0.2%) | | | | |
| | | | Cemex Finance, LLC | | | | |
| | 230,000 | | | 9.375%, 10/12/2022c | | | 240,350 | |
| | | | HSBC Bank USA NA/New York | | | | |
| | 996,000 | | | Zero Coupon, 1/4/2013g,l | | | 484,873 | |
| | 600,000 | | | 15.484%, 8/15/2040g,m | | | 872,995 | |
| | | | | |
| | | | Total | | | 1,598,218 | |
| | | | | |
| |
| Uruguay (0.1%) | | | | |
| | | | Uruguay Government International Bond | | | | |
| | 542,000 | | | 7.625%, 3/21/2036 | | | 841,455 | |
| | | | | |
| | | | Total | | | 841,455 | |
| | | | | |
| |
| Venezuela (0.5%) | | | | |
| | | | Petroleos de Venezuela SA | | | | |
| | 778,400 | | | 5.250%, 4/12/2017 | | | 614,936 | |
| | 450,000 | | | 9.000%, 11/17/2021 | | | 372,375 | |
| | 300,000 | | | 5.375%, 4/12/2027 | | | 187,500 | |
| | 10,000 | | | 5.500%, 4/12/2037 | | | 6,125 | |
| | | | Venezuela Government International Bond | | | | |
| | 90,000 | | | 7.750%, 10/13/2019 | | | 78,300 | |
| | 630,000 | | | 9.000%, 5/7/2023 | | | 552,825 | |
| | 570,000 | | | 8.250%, 10/13/2024 | | | 470,250 | |
| | 80,000 | | | 7.650%, 4/21/2025 | | | 63,000 | |
| | 10,000 | | | 11.750%, 10/21/2026 | | | 10,125 | |
| | 1,420,000 | | | 11.950%, 8/5/2031 | | | 1,451,949 | |
| | | | | |
| | | | Total | | | 3,807,385 | |
| | | | | |
| |
| Vietnam (<0.1%) | | | | |
| | | | Vietnam Government International Bond | | | | |
| | 100,000 | | | 6.875%, 1/15/2016 | | | 110,500 | |
| | | | | |
| | | | Total | | | 110,500 | |
| | | | | |
| |
| Virgin Islands, British (<0.1%) | | | | |
| | | | Central American Bottling Corporation | | | | |
| | 50,000 | | | 6.750%, 2/9/2022c | | | 54,625 | |
| | | | Talent Yield Investments, Ltd. | | | | |
| | 260,000 | | | 4.500%, 4/25/2022c | | | 283,301 | |
| | | | | |
| | | | Total | | | 337,926 | |
| | | | | |
| |
| Zambia (<0.1%) | | | | |
| | | | Zambia Government International Bond | | | | |
| | 210,000 | | | 5.375%, 9/20/2022c | | | 211,575 | |
| | | | | |
| | | | Total | | | 211,575 | |
| | | | | |
| | | | | | | | |
| | | | | |
| | | | Total Long-Term Fixed Income (cost $66,387,629) | | | 72,406,822 | |
| | | | | |
The accompanying Notes to Financial Statements are an integral part of this schedule.
134
Partner Worldwide Allocation Fund
Schedule of Investments as of October 31, 2012
| | | | | | | | |
| Shares | | | Preferred Stock (<0.1%) | | Value | |
| Brazil (<0.1%) | | | | |
| | 18,500 | | | Vale SA | | | $331,097 | |
| | | | | |
| | | | Total | | | 331,097 | |
| | | | | |
| | | | | | | | |
| | | | | |
| | | | Total Preferred Stock (cost $328,828) | | | 331,097 | |
| | | | | |
| | |
| Shares | | | Collateral Held for Securities Loaned (0.6%) | | Value | |
| | 4,431,715 | | | Thrivent Financial Securities Lending Trust | | | 4,431,715 | |
| | | | | |
| | | | Total Collateral Held for Securities Loaned (cost $4,431,715) | | | 4,431,715 | |
| | | | | |
| | |
Shares or
Principal
Amount | | | Short-Term Investments (1.2%) | | Value | |
| | | | Federal Home Loan Mortgage Corporation Discount Notes | | | | |
| | 100,000 | | | 0.160%, 12/17/2012n,o | | | 99,980 | |
| | 8,450,079 | | | Thrivent Financial Securities Lending Trust | | | 8,450,079 | |
| | | | | |
| | | | Total Short-Term Investments (at amortized cost) | | | 8,550,059 | |
| | | | | |
| | | | Total Investments (cost $685,391,247) 99.9% | | | $703,519,755 | |
| | | | | |
| | | | Other Assets and Liabilities, Net 0.1% | | | 648,154 | |
| | | | | |
| | | | Total Net Assets 100.0% | | | $704,167,909 | |
| | | | | |
a | All or a portion of the security is on loan. |
b | Non-income producing security. |
c | Denotes securities sold under Rule 144A of the Securities Act of 1933, which exempts them from registration. These securities have been deemed liquid and may be resold to other dealers in the program or to other qualified institutional buyers. As of October 31, 2012, the value of these investments was $14,222,048 or 2.0% of total net assets. |
d | Principal amount is displayed in Euros. |
e | Denotes variable rate securities. Variable rate securities are securities whose yields vary with a designated market index or market rate. The rate shown is as of October 31, 2012. |
f | Defaulted security. Interest is not being accrued. |
g | Security is fair valued. |
h | Principal amount is displayed in Chinese Yuan. |
i | Principal amount is displayed in British Pounds. |
j | Denotes step coupon securities. Step coupon securities pay an initial coupon rate for the first period and then different coupon rates for following periods. The rate shown is as of October 31, 2012. |
k | Principal amount is displayed in Turkish Lira. |
l | Principal amount is displayed in Brazilian Real. |
m | Principal amount is displayed in Brazilian Real. Security is linked to Brazilian Government Bonds due August 15, 2040. |
n | The interest rate shown reflects the yield, coupon rate or the discount rate at the date of purchase. |
o | At October 31, 2012, $99,980 of investments were held on deposit with the counterparty and pledged as the initial margin deposit for open futures contracts. |
Definitions:
| | | | |
ADR | | - | | American Depositary Receipt, which are certificates for an underlying foreign security’s shares held by an issuing U.S. depository bank. |
ETF | | - | | Exchange Traded Fund. |
Unrealized Appreciation (Depreciation)
Gross unrealized appreciation and depreciation of investments, based on cost for federal income tax purposes, were as follows:
| | | | |
Gross unrealized appreciation | | $ | 67,612,039 | |
Gross unrealized depreciation | | | (52,609,157 | ) |
| | | | |
Net unrealized appreciation (depreciation) | | $ | 15,002,882 | |
| |
Cost for federal income tax purposes | | $ | 688,516,873 | |
The accompanying Notes to Financial Statements are an integral part of this schedule.
135
Partner Worldwide Allocation Fund
Schedule of Investments as of October 31, 2012
Fair Valuation Measurements
The following table is a summary of the inputs used, as of October 31, 2012, in valuing Partner Worldwide Allocation Fund’s assets carried at fair value.
| | | | | | | | | | | | | | | | |
Investments in Securities | | Total | | | Level 1 | | | Level 2 | | | Level 3 | |
| | | | |
Common Stock | | | | | | | | | | | | | | | | |
Communications Services | | | 851,606 | | | | – | | | | 851,606 | | | | – | |
Consumer Discretionary | | | 85,881,965 | | | | – | | | | 85,881,965 | | | | – | |
Consumer Staples | | | 58,796,958 | | | | 3,451,884 | | | | 55,345,074 | | | | – | |
Energy | | | 65,816,645 | | | | 12,602,230 | | | | 53,214,415 | | | | – | |
Financials | | | 119,324,435 | | | | 10,892,816 | | | | 108,431,619 | | | | – | |
Health Care | | | 50,376,071 | | | | 3,938,930 | | | | 46,437,141 | | | | – | |
Industrials | | | 103,685,414 | | | | 2,738,880 | | | | 100,946,534 | | | | – | |
Information Technology | | | 42,654,477 | | | | 2,231,352 | | | | 40,423,125 | | | | – | |
Materials | | | 65,554,667 | | | | 3,662,303 | | | | 61,892,364 | | | | – | |
Telecommunications Services | | | 20,824,422 | | | | 3,692,706 | | | | 17,131,716 | | | | – | |
Utilities | | | 4,033,402 | | | | – | | | | 4,033,402 | | | | – | |
| | | | |
Long-Term Fixed Income | | | | | | | | | | | | | | | | |
Basic Materials | | | 1,210,648 | | | | – | | | | 1,210,648 | | | | – | |
Capital Goods | | | 240,350 | | | | – | | | | 240,350 | | | | – | |
Communications Services | | | 1,875,075 | | | | – | | | | 1,875,075 | | | | – | |
Consumer Cyclical | | | 484,305 | | | | – | | | | 484,305 | | | | – | |
Consumer Non-Cyclical | | | 723,690 | | | | – | | | | 723,689 | | | | 1 | |
Energy | | | 7,567,698 | | | | – | | | | 7,567,698 | | | | – | |
Financials | | | 6,503,888 | | | | – | | | | 4,698,314 | | | | 1,805,574 | |
Foreign Government | | | 50,100,075 | | | | – | | | | 50,100,075 | | | | – | |
Public Corporate | | | 150,000 | | | | – | | | | 150,000 | | | | – | |
Transportation | | | 574,108 | | | | – | | | | 574,108 | | | | – | |
Utilities | | | 2,976,985 | | | | – | | | | 2,976,985 | | | | – | |
| | | | |
Preferred Stock | | | | | | | | | | | | | | | | |
Materials | | | 331,097 | | | | – | | | | 331,097 | | | | – | |
Collateral Held for Securities Loaned | | | 4,431,715 | | | | 4,431,715 | | | | – | | | | – | |
Short-Term Investments | | | 8,550,059 | | | | 8,450,079 | | | | 99,980 | | | | – | |
| |
Total | | | $703,519,755 | | | | $56,092,895 | | | | $645,621,285 | | | | $1,805,575 | |
| |
| | | | |
Other Financial Instruments | | Total | | | Level 1 | | | Level 2 | | | Level 3 | |
| | | | |
Asset Derivatives | | | | | | | | | | | | | | | | |
Foreign Currency Forward Contracts | | | 170,840 | | | | – | | | | 170,840 | | | | – | |
| |
Total Asset Derivatives | | | $170,840 | | | | $– | | | | $170,840 | | | | $– | |
| |
| | | | |
Liability Derivatives | | | | | | | | | | | | | | | | |
Futures Contracts | | | 9,132 | | | | 9,132 | | | | – | | | | – | |
Foreign Currency Forward Contracts | | | 298,815 | | | | – | | | | 298,815 | | | | – | |
| |
Total Liability Derivatives | | | $307,947 | | | | $9,132 | | | | $298,815 | | | | $– | |
| |
There were no significant transfers between Levels during the period ended October 31, 2012. Transfers between Levels are identified as of the end of the period.
| | | | | | | | | | | | | | | | | | | | |
Futures Contracts | | Number of
Contracts
Long/(Short) | | | Expiration
Date | | | Notional
Principal
Amount | | | Value | | | Unrealized
Gain/(Loss) | |
2-Yr. U.S. Treasury Bond Futures | | | 14 | | | | December 2012 | | | | $3,086,145 | | | | $3,084,594 | | | | ($1,551 | ) |
5-Yr. U.S. Treasury Bond Futures | | | 15 | | | | December 2012 | | | | 1,863,934 | | | | 1,863,750 | | | | (184 | ) |
10-Yr. U.S. Treasury Bond Futures | | | 9 | | | | December 2012 | | | | 1,198,961 | | | | 1,197,281 | | | | (1,680 | ) |
20-Yr U.S. Treasury Bond Futures | | | 1 | | | | December 2012 | | | | 150,007 | | | | 149,312 | | | | (695 | ) |
Mini MSCI EAFE Index Futures | | | 14 | | | | December 2012 | | | | 1,064,820 | | | | 1,062,880 | | | | (1,940 | ) |
Ultra Long Term U.S. Treasury Bond Futures | | | (3 | ) | | | December 2012 | | | | (492,199 | ) | | | (495,281 | ) | | | (3,082 | ) |
Total Futures Contracts | | | | | | | | | | | | | | | | | | | ($9,132 | ) |
The accompanying Notes to Financial Statements are an integral part of this schedule.
136
Partner Worldwide Allocation Fund
Schedule of Investments as of October 31, 2012
| | | | | | | | | | | | | | | | | | | | |
Foreign Currency
Forward Contracts | | Counterparty | | Contracts to
Deliver/Receive | | | Settlement Date | | Value on Settlement Date | | | Value | | | Unrealized Gain/(Loss) | |
| | | | | | |
Purchases | | | | | | | | | | | | | | | | | | | | |
Australian Dollar | | SSB | | | 174,711 | | | 11/1/2012 | | | $181,028 | | | | $181,359 | | | | $331 | |
Brazilian Real | | JPM | | | 763,521 | | | 11/14/2012 | | | 373,469 | | | | 375,249 | | | | 1,780 | |
Brazilian Real | | RBC | | | 751,033 | | | 11/21/2012 | | | 367,092 | | | | 368,779 | | | | 1,687 | |
British Pound | | SSB | | | 1,743,849 | | | 11/1/2012 - 11/5/2012 | | | 2,794,953 | | | | 2,814,157 | | | | 19,204 | |
Chilean Peso | | CSFB | | | 440,112,900 | | | 11/5/2012 - 11/19/2012 | | | 926,000 | | | | 913,666 | | | | (12,334 | ) |
Chinese Yuan | | BOA | | | 1,405,490 | | | 2/4/2013 | | | 223,200 | | | | 223,299 | | | | 99 | |
Chinese Yuan | | HSBC | | | 4,093,328 | | | 2/4/2013 | | | 645,000 | | | | 650,331 | | | | 5,331 | |
Chinese Yuan | | DB | | | 2,343,700 | | | 2/4/2013 | | | 372,000 | | | | 372,357 | | | | 357 | |
Colombian Peso | | CSFB | | | 253,389,891 | | | 1/17/2013 | | | 139,049 | | | | 137,138 | | | | (1,911 | ) |
Euro | | DB | | | 284,000 | | | 12/19/2012 | | | 370,685 | | | | 368,247 | | | | (2,438 | ) |
Euro | | JPM | | | 333,214 | | | 11/16/2012 - 12/19/2012 | | | 433,238 | | | | 432,040 | | | | (1,198 | ) |
Euro | | CITI | | | 283,000 | | | 12/19/2012 | | | 371,497 | | | | 366,950 | | | | (4,547 | ) |
Hungarian Forint | | CSFB | | | 20,421,020 | | | 12/19/2012 | | | 91,945 | | | | 92,885 | | | | 940 | |
Indian Rupee | | BB | | | 55,173,821 | | | 11/21/2012 | | | 1,058,186 | | | | 1,021,320 | | | | (36,866 | ) |
Indian Rupee | | CITI | | | 30,476,508 | | | 11/15/2012 | | | 575,300 | | | | 564,829 | | | | (10,471 | ) |
Indian Rupee | | HSBC | | | 9,897,060 | | | 11/16/2012 | | | 186,000 | | | | 183,388 | | | | (2,612 | ) |
Indian Rupee | | SB | | | 19,646,495 | | | 11/16/2012 -11/19/2012 | | | 371,500 | | | | 363,931 | | | | (7,569 | ) |
Indian Rupee | | RBS | | | 16,606,315 | | | 11/6/2012 -11/15/2012 | | | 310,935 | | | | 308,160 | | | | (2,775 | ) |
Indonesian Rupiah | | SSB | | | 213,234,307 | | | 11/1/2012 | | | 22,143 | | | | 22,200 | | | | 57 | |
Israeli Shekel | | JPM | | | 1,072,249 | | | 12/19/2012 | | | 270,597 | | | | 275,730 | | | | 5,133 | |
Israeli Shekel | | DB | | | 2,531,422 | | | 12/19/2012 | | | 650,000 | | | | 650,959 | | | | 959 | |
Japanese Yen | | SSB | | | 145,398,262 | | | 11/1/2012 | | | 1,824,668 | | | | 1,821,349 | | | | (3,319 | ) |
Japanese Yen | | BB | | | 7,324,642 | | | 12/19/2012 | | | 93,000 | | | | 91,825 | | | | (1,175 | ) |
Japanese Yen | | DB | | | 22,396,262 | | | 12/19/2012 | | | 281,000 | | | | 280,770 | | | | (230 | ) |
Malaysian Ringgit | | UBS | | | 1,968,658 | | | 11/23/2012 | | | 640,485 | | | | 645,400 | | | | 4,915 | |
Malaysian Ringgit | | JPM | | | 870,158 | | | 1/31/2013 | | | 283,448 | | | | 283,896 | | | | 448 | |
Malaysian Ringgit | | MSC | | | 873,739 | | | 1/17/2013 | | | 284,977 | | | | 285,355 | | | | 378 | |
Malaysian Ringgit | | DB | | | 568,920 | | | 11/9/2012 | | | 186,000 | | | | 186,673 | | | | 673 | |
Malaysian Ringgit | | HSBC | | | 859,320 | | | 11/9/2012 | | | 279,000 | | | | 281,959 | | | | 2,959 | |
Malaysian Ringgit | | CITI | | | 567,765 | | | 12/3/2012 | | | 186,000 | | | | 186,017 | | | | 17 | |
Mexican Peso | | RBS | | | 1,186,386 | | | 12/19/2012 | | | 92,000 | | | | 90,161 | | | | (1,839 | ) |
Mexican Peso | | CSFB | | | 4,837,461 | | | 12/19/2012 | | | 369,000 | | | | 367,628 | | | | (1,372 | ) |
Mexican Peso | | HSBC | | | 925,000 | | | 12/19/2012 | | | 70,933 | | | | 70,296 | | | | (637 | ) |
Mexican Peso | | SSB | | | 21,892,674 | | | 11/26/2012 -12/19/2012 | | | 1,685,933 | | | | 1,664,619 | | | | (21,314 | ) |
Mexican Peso | | JPM | | | 9,077,339 | | | 12/19/2012 | | | 704,096 | | | | 689,841 | | | | (14,255 | ) |
Mexican Peso | | UBS | | | 4,811,681 | | | 12/19/2012 | | | 373,000 | | | | 365,669 | | | | (7,331 | ) |
New Taiwan Dollar | | CITI | | | 21,710,417 | | | 11/19/2012 -12/3/2012 | | | 745,000 | | | | 743,417 | | | | (1,583 | ) |
Philippines Peso | | DB | | | 15,406,206 | | | 11/19/2012 | | | 373,000 | | | | 373,988 | | | | 988 | |
Philippines Peso | | RBS | | | 8,009,500 | | | 11/5/2012 | | | 193,000 | | | | 194,430 | | | | 1,430 | |
Philippines Peso | | JPM | | | 22,995,285 | | | 11/5/2012 -11/14/2012 | | | 553,771 | | | | 558,211 | | | | 4,440 | |
Philippines Peso | | BB | | | 42,898,120 | | | 11/5/2012 -11/19/2012 | | | 1,039,379 | | | | 1,041,354 | | | | 1,975 | |
Russian Ruble | | CITI | | | 39,157,473 | | | 11/13/2012 -1/17/2013 | | | 1,244,998 | | | | 1,233,289 | | | | (11,709 | ) |
Russian Ruble | | UBS | | | 8,861,243 | | | 11/13/2012 -11/26/2012 | | | 281,000 | | | | 281,519 | | | | 519 | |
Russian Ruble | | CSFB | | | 23,403,759 | | | 11/6/2012 -11/27/2012 | | | 747,681 | | | | 744,168 | | | | (3,513 | ) |
Russian Ruble | | JPM | | | 14,410,518 | | | 11/14/2012 | | | 465,477 | | | | 458,394 | | | | (7,083 | ) |
Russian Ruble | | SB | | | 6,004,635 | | | 11/15/2012 | | | 192,920 | | | | 190,975 | | | | (1,945 | ) |
South African Rand | | SB | | | 235,600 | | | 12/19/2012 | | | 26,040 | | | | 27,004 | | | | 964 | |
South African Rand | | BOA | | | 1,565,840 | | | 12/19/2012 | | | 184,000 | | | | 179,471 | | | | (4,529 | ) |
South African Rand | | UBS | | | 3,147,937 | | | 12/19/2012 | | | 375,025 | | | | 360,806 | | | | (14,219 | ) |
South African Rand | | RBC | | | 1,514,151 | | | 12/19/2012 | | | 183,000 | | | | 173,546 | | | | (9,454 | ) |
South Korea Won | | SB | | | 205,068,000 | | | 11/5/2012 | | | 184,000 | | | | 188,029 | | | | 4,029 | |
South Korea Won | | CITI | | | 206,757,600 | | | 11/14/2012 | | | 186,000 | | | | 189,573 | | | | 3,573 | |
South Korea Won | | BB | | | 207,352,800 | | | 11/9/2012 | | | 186,000 | | | | 190,122 | | | | 4,122 | |
South Korea Won | | SSB | | | 409,898,640 | | | 11/14/2012 | | | 375,692 | | | | 375,831 | | | | 139 | |
South Korea Won | | DB | | | 204,830,640 | | | 11/5/2012 | | | 184,000 | | | | 187,812 | | | | 3,812 | |
Turkish Lira | | RBS | | | 666,612 | | | 12/19/2012 | | | 368,000 | | | | 369,569 | | | | 1,569 | |
Turkish Lira | | JPM | | | 2,295,657 | | | 12/19/2012 | | | 1,263,917 | | | | 1,272,711 | | | | 8,794 | |
Total Purchases | | | | | | | | | | | $27,439,257 | | | | $27,332,651 | | | | ($106,606 | ) |
The accompanying Notes to Financial Statements are an integral part of this schedule.
137
Partner Worldwide Allocation Fund
Schedule of Investments as of October 31, 2012
| | | | | | | | | | | | | | | | | | | | |
Foreign Currency
Forward Contracts | | Counterparty | | Contracts to
Deliver/Receive | | | Settlement Date | | Value on Settlement Date | | | Value | | | Unrealized Gain/(Loss) | |
| | | | | | |
Sales | | | | | | | | | | | | | | | | | | | | |
Australian Dollar | | SSB | | | 1,359,445 | | | 11/1/2012 | | | $1,407,025 | | | | $1,411,178 | | | | ($4,153 | ) |
Brazilian Real | | UBS | | | 3,379,039 | | | 11/14/2012 - 1/17/2013 | | | 1,650,677 | | | | 1,649,738 | | | | 939 | |
Brazilian Real | | SSB | | | 16,836 | | | 11/1/2012 | | | 8,272 | | | | 8,289 | | | | (17 | ) |
Brazilian Real | | JPM | | | 380,078 | | | 11/21/2012 | | | 187,000 | | | | 186,629 | | | | 371 | |
Brazilian Real | | BB | | | 380,171 | | | 11/21/2012 | | | 187,000 | | | | 186,675 | | | | 325 | |
British Pound | | SSB | | | 1,229,946 | | | 11/1/2012 | | | 1,970,005 | | | | 1,984,841 | | | | (14,836 | ) |
Chilean Peso | | CSFB | | | 265,697,620 | | | 11/5/2012 -11/13/2012 | | | 553,337 | | | | 551,772 | | | | 1,565 | |
Chinese Yuan | | JPM | | | 2,701,943 | | | 2/4/2013 | | | 422,872 | | | | 429,274 | | | | (6,402 | ) |
Euro | | DB | | | 1,984,159 | | | 12/19/2012 | | | 2,563,218 | | | | 2,572,745 | | | | (9,527 | ) |
Euro | | CSFB | | | 71,000 | | | 12/19/2012 | | | 91,945 | | | | 92,062 | | | | (117 | ) |
Euro | | MSC | | | 71,000 | | | 12/19/2012 | | | 91,978 | | | | 92,062 | | | | (84 | ) |
Euro | | CITI | | | 1,440,335 | | | 11/16/2012 - 12/19/2012 | | | 1,854,859 | | | | 1,867,090 | | | | (12,231 | ) |
Euro | | JPM | | | 569,960 | | | 11/16/2012 - 12/19/2012 | | | 743,114 | | | | 738,867 | | | | 4,247 | |
Euro | | BB | | | 35,290 | | | 11/1/2012 | | | 45,645 | | | | 45,741 | | | | (96 | ) |
Euro | | SSB | | | 1,001,652 | | | 11/1/2012 -11/2/2012 | | | 1,291,464 | | | | 1,298,284 | | | | (6,820 | ) |
Hungarian Forint | | DB | | | 20,472,850 | | | 12/19/2012 | | | 91,285 | | | | 93,121 | | | | (1,836 | ) |
Indian Rupee | | DB | | | 4,883,820 | | | 11/6/2012 | | | 92,000 | | | | 90,677 | | | | 1,323 | |
Indian Rupee | | BOA | | | 30,389,463 | | | 11/30/2012 | | | 560,000 | | | | 561,520 | | | | (1,520 | ) |
Indian Rupee | | JPM | | | 10,149,703 | | | 11/30/2012 | | | 186,500 | | | | 187,541 | | | | (1,041 | ) |
Indonesian Rupiah | | SSB | | | 67,290,671 | | | 11/1/2012 | | | 6,988 | | | | 7,006 | | | | (18 | ) |
Israeli Shekel | | BB | | | 361,179 | | | 12/19/2012 | | | 93,000 | | | | 92,878 | | | | 122 | |
Israeli Shekel | | JPM | | | 717,816 | | | 12/19/2012 | | | 188,000 | | | | 184,587 | | | | 3,413 | |
Japanese Yen | | SB | | | 29,959,270 | | | 12/19/2012 | | | 374,000 | | | | 375,583 | | | | (1,583 | ) |
Japanese Yen | | CITI | | | 53,308,591 | | | 12/19/2012 | | | 682,194 | | | | 668,012 | | | | 14,182 | |
Japanese Yen | | HSBC | | | 5,531,500 | | | 12/19/2012 | | | 70,933 | | | | 69,345 | | | | 1,588 | |
Japanese Yen | | BIO | | | 41,192,542 | | | 11/5/2012 | | | 516,049 | | | | 516,003 | | | | 46 | |
Japanese Yen | | BOA | | | 22,043,452 | | | 11/2/2012 | | | 276,789 | | | | 276,130 | | | | 659 | |
Japanese Yen | | SSB | | | 33,041,514 | | | 11/1/2012 | | | 414,938 | | | | 413,898 | | | | 1,040 | |
Malaysian Ringgit | | DB | | | 571,446 | | | 11/23/2012 | | | 187,000 | | | | 187,341 | | | | (341 | ) |
Mexican Peso | | UBS | | | 2,367,211 | | | 12/19/2012 | | | 183,000 | | | | 179,899 | | | | 3,101 | |
Mexican Peso | | DB | | | 4,860,485 | | | 12/19/2012 | | | 373,000 | | | | 369,377 | | | | 3,623 | |
Mexican Peso | | BOA | | | 4,887,095 | | | 12/19/2012 | | | 374,000 | | | | 371,400 | | | | 2,600 | |
Mexican Peso | | SSB | | | 9,220,146 | | | 12/19/2012 | | | 707,000 | | | | 700,694 | | | | 6,306 | |
Mexican Peso | | HSBC | | | 2,404,056 | | | 12/19/2012 | | | 185,000 | | | | 182,698 | | | | 2,302 | |
Philippines Peso | | RBS | | | 8,009,500 | | | 11/5/2012 | | | 194,344 | | | | 194,430 | | | | (86 | ) |
Philippines Peso | | CITI | | | 15,542,175 | | | 11/19/2012 | | | 375,000 | | | | 377,289 | | | | (2,289 | ) |
Philippines Peso | | BB | | | 15,675,900 | | | 11/5/2012 | | | 380,853 | | | | 380,531 | | | | 322 | |
Philippines Peso | | JPM | | | 7,666,400 | | | 11/5/2012 | | | 186,019 | | | | 186,101 | | | | (82 | )�� |
Russian Ruble | | BOA | | | 8,612,498 | | | 11/14/2012 | | | 279,000 | | | | 273,961 | | | | 5,039 | |
Russian Ruble | | CSFB | | | 10,210,185 | | | 11/14/2012 -11/26/2012 | | | 327,000 | | | | 324,506 | | | | 2,494 | |
Russian Ruble | | UBS | | | 33,687,879 | | | 11/26/2012 -11/27/2012 | | | 1,079,296 | | | | 1,069,358 | | | | 9,938 | |
South African Rand | | BB | | | 3,665,610 | | | 12/19/2012 | | | 434,905 | | | | 420,139 | | | | 14,766 | |
South African Rand | | RBS | | | 52,441 | | | 11/1/2012 -11/2/2012 | | | 6,035 | | | | 6,048 | | | | (13 | ) |
South African Rand | | MSC | | | 1,748,057 | | | 12/19/2012 | | | 201,000 | | | | 200,356 | | | | 644 | |
South African Rand | | SSB | | | 235,600 | | | 12/19/2012 | | | 26,914 | | | | 27,004 | | | | (90 | ) |
South African Rand | | UBS | | | 814,262 | | | 12/19/2012 | | | 93,000 | | | | 93,328 | | | | (328 | ) |
South Korea Won | | SSB | | | 409,898,640 | | | 11/5/2012 | | | 375,881 | | | | 375,841 | | | | 40 | |
South Korea Won | | DB | | | 414,739,876 | | | 11/14/2012 | | | 375,000 | | | | 380,270 | | | | (5,270 | ) |
Swiss Franc | | SSB | | | 4,608 | | | 11/1/2012 | | | 4,946 | | | | 4,948 | | | | (2 | ) |
Turkish Lira | | RBS | | | 775,551 | | | 12/19/2012 | | | 426,000 | | | | 429,965 | | | | (3,965 | ) |
Turkish Lira | | JPM | | | 1,257,215 | | | 12/19/2012 | | | 690,000 | | | | 697,000 | | | | (7,000 | ) |
Turkish Lira | | CSFB | | | 1,000,846 | | | 12/19/2012 | | | 550,000 | | | | 554,868 | | | | (4,868 | ) |
Turkish Lira | | DB | | | 1,310,148 | | | 9/27/2013 | | | 695,999 | | | | 713,748 | | | | (17,749 | ) |
Total Sales | | | | | | | | | | | $25,331,279 | | | | $25,352,648 | | | | ($21,369 | ) |
| | |
Net Unrealized Gain/(Loss) on Foreign Currency Forward Contracts | | | | | | | | ($127,975 | ) |
The accompanying Notes to Financial Statements are an integral part of this schedule.
138
Partner Worldwide Allocation Fund
Schedule of Investments as of October 31, 2012
| | | | | | |
Counterparty |
BOA | | | - | | | Bank of America |
BB | | | - | | | Barclays Bank |
BIO | | | - | | | Brown Brothers Harriman |
CITI | | | - | | | Citibank |
CSFB | | | - | | | CS First Boston Corporation |
DB | | | - | | | Deutsche Bank |
HSBC | | | - | | | HSBC Securities, Inc. |
JPM | | | - | | | J.P. Morgan |
MSC | | | - | | | Morgan Stanley & Company |
RBC | | | - | | | The Royal Bank of Canada |
SB | | | - | | | Standard Bank plc |
SSB | | | - | | | State Street Bank |
UBS | | | - | | | UBS Securities, Ltd. |
RBS | | | - | | | The Royal Bank of Scotland |
The following table summarizes the fair value and Statement of Assets and Liabilities location, as of October 31, 2012, for Partner Worldwide Allocation Fund’s investments in financial derivative instruments by primary risk exposure as discussed under item (2) Significant Accounting Policies of the Notes to Financial Statements.
| | | | | | |
Derivatives by risk category | | Statement of Assets and Liabilities Location | | Fair Value | |
| | |
Asset Derivatives | | | | | | |
| | |
Foreign Exchange Contracts | | | | | | |
Forward Contracts | | Receivable/Payable for forward contracts, Net Assets - Net unrealized appreciation/(depreciation) on Foreign currency forward contracts | | | 170,840 | |
| | |
Total Foreign Exchange Contracts | | | | | 170,840 | |
| |
Total Asset Derivatives | | | | $ | 170,840 | |
| |
| | |
Liability Derivatives | | | | | | |
| | |
Interest Rate Contracts | | | | | | |
Futures* | | Net Assets - Net unrealized appreciation/(depreciation) on Futures contracts | | | 7,192 | |
| | |
Total Interest Rate Contracts | | | | | 7,192 | |
| | |
Equity Contracts | | | | | | |
Futures* | | Net Assets - Net unrealized appreciation/(depreciation) on Futures contracts | | | 1,940 | |
| | |
Total Equity Contracts | | | | | 1,940 | |
| | |
Foreign Exchange Contracts | | | | | | |
Forward Contracts | | Receivable/Payable for forward contracts, Net Assets - Net unrealized appreciation/(depreciation) on Foreign currency forward contracts | | | 298,815 | |
Total Foreign Exchange Contracts | | | | | 298,815 | |
| |
Total Liability Derivatives | | | | $ | 307,947 | |
| |
* | Includes cumulative appreciation/depreciation of futures contracts as reported in the Schedule of Investments. Only current day’s variation margin is reported within the Statement of Assets and Liabilities. |
The following table summarizes the net realized gains/(losses) and Statement of Operations location, for the period ended October 31, 2012, for Partner Worldwide Allocation Fund’s investments in financial derivative instruments by primary risk exposure.
| | | | | | |
Derivatives by risk category | | Statement of Operations Location | | Realized Gains/(Losses)
recognized in Income | |
| | |
Interest Rate Contracts | | | | | | |
Futures | | Net realized gains/(losses) on Futures contracts | | | 53,582 | |
| | |
Total Interest Rate Contracts | | | | | 53,582 | |
| | |
Equity Contracts | | | | | | |
Futures | | Net realized gains/(losses) on Futures contracts | | | (1,773 | ) |
| | |
Total Equity Contracts | | | | | (1,773 | ) |
| | |
Foreign Exchange Contracts | | | | | | |
Forward Contracts | | Net realized gains/(losses) on Foreign currency transactions | | | 675,834 | |
| | |
Total Foreign Exchange Contracts | | | | | 675,834 | |
| |
Total | | | | $ | 727,643 | |
| |
The accompanying Notes to Financial Statements are an integral part of this schedule.
139
Partner Worldwide Allocation Fund
Schedule of Investments as of October 31, 2012
The following table summarizes the change in net unrealized appreciation/(depreciation) and Statement of Operations location, for the period ended October 31, 2012, for Partner Worldwide Allocation Fund’s investments in financial derivative instruments by primary risk exposure.
| | | | | | |
Derivatives by risk category | | Statement of Operations Location | | Change in unrealized
appreciation/(depreciation)
recognized in Income | |
| | |
Interest Rate Contracts | | | | | | |
Futures | | Change in net unrealized appreciation/(depreciation) on Futures contracts | | | (4,494 | ) |
| | |
Total Interest Rate Contracts | | | | | (4,494 | ) |
| | |
Equity Contracts | | | | | | |
Futures | | Change in net unrealized appreciation/(depreciation) on Futures contracts | | | 183 | |
| | |
Total Equity Contracts | | | | | 183 | |
| | |
Foreign Exchange Contracts | | | | | | |
Forward Contracts | | Change in net unrealized appreciation/(depreciation) on Foreign currency forward contracts | | | (194,167 | ) |
Total Foreign Exchange Contracts | | | | | (194,167 | ) |
| |
Total | | | | | ($198,478 | ) |
| |
The following table presents Partner Worldwide Allocation Fund’s average volume of derivative activity during the period ended October 31, 2012.
| | | | | | | | |
Derivative Risk Category | | Futures
(Notional*) | | Futures
(Percentage of
Average Net
Assets) | | Forwards
(Notional*) | | Forwards
(Percentage
of Average
Net Assets) |
Equity Contracts | | $1,173,661 | | 0.2% | | N/A | | N/A |
Interest Rate Contracts | | 16,551,760 | | 2.5 | | N/A | | N/A |
Foreign Exchange Contracts | | N/A | | N/A | | $39,867,945 | | 6.0% |
* | Notional amount represents long or short, or both, derivative positions held by the Fund. |
Investment in Affiliates
Affiliated issuers, as defined under the Investment Company Act of 1940, include those in which the Fund’s holdings of an issuer represent 5% or more of the outstanding voting securities of an issuer, or any affiliated mutual fund.
A summary of transactions for the fiscal year to date, in Partner Worldwide Allocation Fund, is as follows:
| | | | | | | | | | | | | | | | | | | | | | | | |
Fund | | Value
October 31, 2011 | | | Gross
Purchases | | | Gross
Sales | | | Shares Held at
October 31, 2012 | | | Value
October 31, 2012 | | | Income Earned
November 1, 2011 - October 31, 2012 | |
Securities Lending Trust-Collateral Investment | | | $– | | | | $10,841,677 | | | | $6,409,962 | | | | 4,431,715 | | | | $4,431,715 | | | | $25,016 | |
Securities Lending Trust-Short Term Investment | | | – | | | | 25,283,001 | | | | 16,832,922 | | | | 8,450,079 | | | | 8,450,079 | | | | 861 | |
Total Value and Income Earned | | | – | | | | | | | | | | | | | | | | 12,881,794 | | | | 25,877 | |
The accompanying Notes to Financial Statements are an integral part of this schedule.
140
Large Cap Growth Fund
Schedule of Investments as of October 31, 2012
| | | | | | | | |
| Shares | | | Common Stock (95.0%) | | Value | |
| Consumer Discretionary (17.1%) | | | | |
| | 43,041 | | | Amazon.com, Inc.a | | | $10,020,806 | |
| | 21,900 | | | AutoZone, Inc.a | | | 8,212,500 | |
| | 307,800 | | | Comcast Corporation | | | 11,545,578 | |
| | 160,300 | | | Home Depot, Inc. | | | 9,839,214 | |
| | 130,600 | | | Las Vegas Sands Corporation | | | 6,065,064 | |
| | 79,900 | | | NIKE, Inc. | | | 7,301,262 | |
| | 4,400 | | | Priceline.com, Inc.a | | | 2,524,588 | |
| | 183,700 | | | Sally Beauty Holdings, Inc.a | | | 4,423,496 | |
| | | | | |
| | | | Total | | | 59,932,508 | |
| | | | | |
| |
| Consumer Staples (5.6%) | | | | |
| | 43,110 | | | Anheuser-Busch InBev NV ADR | | | 3,612,618 | |
| | 68,597 | | | British American Tobacco plc ADR | | | 6,815,798 | |
| | 36,200 | | | Costco Wholesale Corporation | | | 3,563,166 | |
| | 86,400 | | | Nestle SA | | | 5,485,383 | |
| | | | | |
| | | | Total | | | 19,476,965 | |
| | | | | |
| |
| Energy (8.3%) | | | | |
| | 58,900 | | | Consol Energy, Inc. | | | 2,070,924 | |
| | 53,600 | | | EOG Resources, Inc. | | | 6,243,864 | |
| | 134,000 | | | Marathon Oil Corporation | | | 4,028,040 | |
| | 119,300 | | | Schlumberger, Ltd. | | | 8,294,929 | |
| | 742,500 | | | Weatherford International, Ltd.a | | | 8,390,250 | |
| | | | | |
| | | | Total | | | 29,028,007 | |
| | | | | |
| |
| Financials (7.3%) | | | | |
| | 91,300 | | | Ameriprise Financial, Inc. | | | 5,329,181 | |
| | 111,200 | | | Citigroup, Inc. | | | 4,157,768 | |
| | 83,700 | | | CME Group, Inc. | | | 4,681,341 | |
| | 88,939 | | | J.P. Morgan Chase & Company | | | 3,706,978 | |
| | 224,700 | | | Wells Fargo & Company | | | 7,570,143 | |
| | | | | |
| | | | Total | | | 25,445,411 | |
| | | | | |
| |
| Health Care (13.7%) | | | | |
| | 40,200 | | | Allergan, Inc. | | | 3,614,784 | |
| | 124,400 | | | Baxter International, Inc. | | | 7,791,172 | |
| | 67,400 | | | Biogen Idec, Inc.a | | | 9,316,028 | |
| | 141,500 | | | Covidien plc | | | 7,775,425 | |
| | 43,800 | | | Express Scripts Holding Companya | | | 2,695,452 | |
| | 69,000 | | | Shire Pharmaceuticals Group plc ADR | | | 5,822,910 | |
| | 193,800 | | | UnitedHealth Group, Inc. | | | 10,852,800 | |
| | | | | |
| | | | Total | | | 47,868,571 | |
| | | | | |
| |
| Industrials (9.5%) | | | | |
| | 73,150 | | | ADT Corporationa | | | 3,036,456 | |
| | 150,700 | | | Honeywell International, Inc. | | | 9,228,868 | |
| | 217,700 | | | Jacobs Engineering Group, Inc.a | | | 8,401,043 | |
| | 92,800 | | | Parker Hannifin Corporation | | | 7,299,648 | |
| | 35,103 | | | Pentair, Ltd. | | | 1,482,751 | |
| | 146,300 | | | Tyco International, Ltd. | | | 3,931,081 | |
| | | | | |
| | | | Total | | | 33,379,847 | |
| | | | | |
| |
| Information Technology (32.5%) | | | | |
| | 55,152 | | | Apple, Inc. | | | 32,820,955 | |
| | 90,500 | | | Citrix Systems, Inc.a | | | 5,593,805 | |
| | 136,498 | | | Cognizant Technology Solutions Corporationa | | | 9,097,592 | |
| | 213,950 | | | eBay, Inc.a | | | 10,331,645 | |
| | 131,700 | | | EMC Corporationa | | | 3,216,114 | |
| | 23,503 | | | Google, Inc.a | | | 15,976,634 | |
| | 93,700 | | | NetApp, Inc.a | | | 2,520,530 | |
| | 368,814 | | | Oracle Corporation | | | 11,451,675 | |
| | 209,050 | | | QUALCOMM, Inc. | | | 12,245,104 | |
| | 234,600 | | | Texas Instruments, Inc. | | | 6,589,914 | |
| | 27,200 | | | Visa, Inc. | | | 3,774,272 | |
| | | | | |
| | | | Total | | | 113,618,240 | |
| | | | | |
| |
| Materials (1.0%) | | | | |
| | 91,994 | | | Freeport-McMoRan Copper & Gold, Inc. | | | 3,576,727 | |
| | | | | |
| | | | Total | | | 3,576,727 | |
| | | | | |
| | | | | | | | |
| | | | | |
| | | | Total Common Stock (cost $309,888,896) | | | 332,326,276 | |
| | | | | |
| | |
Shares or
Principal
Amount | | | Short-Term Investments (4.9%)b | | Value | |
| | 7,293,093 | | | Thrivent Financial Securities Lending Trust | | | 7,293,093 | |
| | | | U.S. Treasury Bills | | | | |
| | 10,000,000 | | | 0.115%, 11/8/2012b | | | 9,999,776 | |
| | | | | |
| | | | Total Short-Term Investments (at amortized cost) | | | 17,292,869 | |
| | | | | |
| | | | Total Investments (cost $327,181,765) 99.9% | | | $349,619,145 | |
| | | | | |
| | | | Other Assets and Liabilities, Net 0.1% | | | 265,596 | |
| | | | | |
| | | | Total Net Assets 100.0% | | | $349,884,741 | |
| | | | | |
a | Non-income producing security. |
b | The interest rate shown reflects the yield, coupon rate or the discount rate at the date of purchase. |
Definitions:
| | | | |
ADR | | - | | American Depositary Receipt, which are certificates for an underlying foreign security’s shares held by an issuing U.S. depository bank. |
Unrealized Appreciation (Depreciation)
Gross unrealized appreciation and depreciation of investments, based on cost for federal income tax purposes, were as follows:
| | | | |
Gross unrealized appreciation | | | $36,924,811 | |
Gross unrealized depreciation | | | (14,516,523 | ) |
| | | | |
Net unrealized appreciation (depreciation) | | | $22,408,288 | |
| |
Cost for federal income tax purposes | | | $327,210,857 | |
The accompanying Notes to Financial Statements are an integral part of this schedule.
141
Large Cap Growth Fund
Schedule of Investments as of October 31, 2012
Fair Valuation Measurements
The following table is a summary of the inputs used, as of October 31, 2012, in valuing Large Cap Growth Fund’s assets carried at fair value.
| | | | | | | | | | | | | | | | |
Investments in Securities | | Total | | | Level 1 | | | Level 2 | | | Level 3 | |
| | | | |
Common Stock | | | | | | | | | | | | | | | | |
Consumer Discretionary | | | 59,932,508 | | | | 59,932,508 | | | | – | | | | – | |
Consumer Staples | | | 19,476,965 | | | | 13,991,582 | | | | 5,485,383 | | | | – | |
Energy | | | 29,028,007 | | | | 29,028,007 | | | | – | | | | – | |
Financials | | | 25,445,411 | | | | 25,445,411 | | | | – | | | | – | |
Health Care | | | 47,868,571 | | | | 47,868,571 | | | | – | | | | – | |
Industrials | | | 33,379,847 | | | | 33,379,847 | | | | – | | | | – | |
Information Technology | | | 113,618,240 | | | | 113,618,240 | | | | – | | | | – | |
Materials | | | 3,576,727 | | | | 3,576,727 | | | | – | | | | – | |
Short-Term Investments | | | 17,292,869 | | | | 7,293,093 | | | | 9,999,776 | | | | – | |
| |
Total | | | $349,619,145 | | | | $334,133,986 | | | | $15,485,159 | | | | $– | |
| |
There were no significant transfers between Levels during the period ended October 31, 2012. Transfers between Levels are identified as of the end of the period.
The following table summarizes the net realized gains/(losses) and Statement of Operations location, for the period ended October 31, 2012, for Large Cap Growth Fund’s investments in financial derivative instruments by primary risk exposure.
| | | | | | |
Derivatives by risk category | | Statement of Operations Location | | Realized Gains/(Losses)
recognized in Income | |
| | |
Foreign Exchange Contracts | | | | | | |
Forward Contracts | | Net realized gains/(losses) on Foreign currency transactions | | | 44,456 | |
| | |
Total Foreign Exchange Contracts | | | | | 44,456 | |
| |
Total | | | | | $44,456 | |
| |
The following table presents Large Cap Growth Fund’s average volume of derivative activity during the period ended October 31, 2012.
| | | | |
Derivative Risk Category | | Forwards
(Notional*) | | Forwards
(Percentage
of Average
Net Assets) |
Foreign Exchange Contracts | | $32,798 | | <0.1% |
Investment in Affiliates
Affiliated issuers, as defined under the Investment Company Act of 1940, include those in which the Fund’s holdings of an issuer represent 5% or more of the outstanding voting securities of an issuer, or any affiliated mutual fund.
A summary of transactions for the fiscal year to date, in Large Cap Growth Fund, is as follows:
| | | | | | | | | | | | | | | | | | | | | | | | |
Fund | | Value
October 31, 2011 | | | Gross
Purchases | | | Gross
Sales | | | Shares Held at
October 31, 2012 | | | Value
October 31, 2012 | | | Income Earned
November 1, 2011 -
October 31, 2012 | |
Securities Lending Trust-Collateral Investment | | | $– | | | | $14,003,625 | | | | $14,003,625 | | | | – | | | | $– | | | | $5,200 | |
Securities Lending Trust-Short Term Investment | | | – | | | | 8,874,217 | | | | 1,581,124 | | | | 7,293,093 | | | | 7,293,093 | | | | 381 | |
Total Value and Income Earned | | | – | | | | | | | | | | | | | | | | 7,293,093 | | | | 5,581 | |
The accompanying Notes to Financial Statements are an integral part of this schedule.
142
Large Cap Value Fund
Schedule of Investments as of October 31, 2012
| | | | | | | | |
| Shares | | | Common Stock (95.7%) | | Value | |
| Consumer Discretionary (9.3%) | | | | |
| | 113,670 | | | CBS Corporation | | | $3,682,908 | |
| | 294,174 | | | Delphi Automotive plca | | | 9,248,830 | |
| | 55,510 | | | Harley-Davidson, Inc. | | | 2,595,648 | |
| | 508,811 | | | Lowe’s Companies, Inc. | | | 16,475,300 | |
| | 410,530 | | | News Corporation | | | 10,000,511 | |
| | 117,600 | | | Time Warner Cable, Inc. | | | 11,655,336 | |
| | | | | |
| | | | Total | | | 53,658,533 | |
| | | | | |
| |
| Consumer Staples (8.8%) | | | | |
| | 215,020 | | | CVS Caremark Corporation | | | 9,976,928 | |
| | 63,283 | | | Diageo plc ADR | | | 7,229,450 | |
| | 73,730 | | | Kimberly-Clark Corporation | | | 6,152,768 | |
| | 109,268 | | | Kraft Foods Group, Inc.a | | | 4,969,509 | |
| | 327,806 | | | Mondelez International, Inc. | | | 8,699,971 | |
| | 82,887 | | | Philip Morris International, Inc. | | | 7,340,473 | |
| | 169,233 | | | Unilever NV ADRb | | | 6,209,159 | |
| | | | | |
| | | | Total | | | 50,578,258 | |
| | | | | |
| |
| Energy (11.8%) | | | | |
| | 360,940 | | | BP plc ADR | | | 15,480,717 | |
| | 96,519 | | | Chevron Corporation | | | 10,637,359 | |
| | 119,137 | | | EOG Resources, Inc. | | | 13,878,269 | |
| | 175,250 | | | EQT Corporation | | | 10,625,407 | |
| | 414,650 | | | Marathon Oil Corporation | | | 12,464,379 | |
| | 63,640 | | | Schlumberger, Ltd. | | | 4,424,889 | |
| | | | | |
| | | | Total | | | 67,511,020 | |
| | | | | |
| |
| Financials (21.6%) | | | | |
| | 120,867 | | | ACE, Ltd. | | | 9,506,189 | |
| | 147,920 | | | Allstate Corporation | | | 5,913,842 | |
| | 1,184,990 | | | Bank of America Corporation | | | 11,044,107 | |
| | 82,330 | | | Capital One Financial Corporation | | | 4,953,796 | |
| | 324,010 | | | Citigroup, Inc. | | | 12,114,734 | |
| | 49,490 | | | Goldman Sachs Group, Inc. | | | 6,057,081 | |
| | 253,230 | | | Invesco, Ltd. | | | 6,158,554 | |
| | 269,633 | | | J.P. Morgan Chase & Company | | | 11,238,303 | |
| | 545,640 | | | KKR & Company, LP | | | 8,211,882 | |
| | 469,790 | | | MetLife, Inc. | | | 16,672,847 | |
| | 298,100 | | | State Street Corporation | | | 13,286,317 | |
| | 98,393 | | | SVB Financial Groupa | | | 5,568,060 | |
| | 396,965 | | | Wells Fargo & Company | | | 13,373,751 | |
| | | | | |
| | | | Total | | | 124,099,463 | |
| | | | | |
| |
| Health Care (14.8%) | | | | |
| | 171,440 | | | Baxter International, Inc. | | | 10,737,287 | |
| | 208,356 | | | Covidien plc | | | 11,449,162 | |
| | 397,810 | | | Merck & Company, Inc. | | | 18,152,070 | |
| | 809,490 | | | Pfizer, Inc. | | | 20,132,016 | |
| | 286,170 | | | Sanofi ADR | | | 12,548,555 | |
| | 212,223 | | | UnitedHealth Group, Inc. | | | 11,884,488 | |
| | | | | |
| | | | Total | | | 84,903,578 | |
| | | | | |
| |
| Industrials (9.0%) | | | | |
| | 62,400 | | | FedEx Corporation | | | 5,740,176 | |
| | 201,802 | | | General Electric Company | | | 4,249,950 | |
| | 135,306 | | | Honeywell International, Inc. | | | 8,286,140 | |
| | 268,820 | | | Jacobs Engineering Group, Inc.a | | | 10,373,764 | |
| | 59,210 | | | SPX Corporation | | | 4,061,214 | |
| | 243,752 | | | United Technologies Corporation | | | 19,051,656 | |
| | | | | |
| | | | Total | | | 51,762,900 | |
| | | | | |
| |
| Information Technology (12.1%) | | | | |
| | 675,811 | | | Microsoft Corporation | | | 19,284,267 | |
| | 241,350 | | | NetApp, Inc.a | | | 6,492,315 | |
| | 721,893 | | | Oracle Corporation | | | 22,414,778 | |
| | 452,150 | | | Texas Instruments, Inc. | | | 12,700,893 | |
| | 264,613 | | | Xilinx, Inc. | | | 8,668,722 | |
| | | | | |
| | | | Total | | | 69,560,975 | |
| | | | | |
| |
| Materials (1.5%) | | | | |
| | 80,181 | | | Sigma-Aldrich Corporation | | | 5,623,895 | |
| | 134,140 | | | United States Steel Corporationb | | | 2,735,115 | |
| | | | | |
| | | | Total | | | 8,359,010 | |
| | | | | |
| |
| Telecommunications Services (1.8%) | | | | |
| | 232,659 | | | Verizon Communications, Inc. | | | 10,385,898 | |
| | | | | |
| | | | Total | | | 10,385,898 | |
| | | | | |
| |
| Utilities (5.0%) | | | | |
| | 445,080 | | | NiSource, Inc. | | | 11,336,188 | |
| | 410,950 | | | PG&E Corporation | | | 17,473,594 | |
| | | | | |
| | | | Total | | | 28,809,782 | |
| | | | | |
| | | | | | | | |
| | | | | |
| | | | Total Common Stock (cost $489,360,554) | | | 549,629,417 | |
| | | | | |
| | |
| Shares | | | Collateral Held for Securities Loaned (1.3%) | | Value | |
| | 7,650,413 | | | Thrivent Financial Securities Lending Trust | | | 7,650,413 | |
| | | | | |
| | | | Total Collateral Held for Securities Loaned (cost $7,650,413) | | | 7,650,413 | |
| | | | | |
| | |
Shares or
Principal
Amount | | | Short-Term Investments (4.2%) | | Value | |
| | | | Federal Home Loan Bank Discount Notes | | | | |
| | 4,750,000 | | | 0.080%, 11/1/2012c | | | 4,750,000 | |
| | 19,252,997 | | | Thrivent Financial Securities Lending Trust | | | 19,252,997 | |
| | | | | |
| | | | Total Short-Term Investments (at amortized cost) | | | 24,002,997 | |
| | | | | |
| | | | Total Investments (cost $521,013,964) 101.2% | | | $581,282,827 | |
| | | | | |
| | | | Other Assets and Liabilities, Net (1.2%) | | | (7,095,803 | ) |
| | | | | |
| | | | Total Net Assets 100.0% | | | $574,187,024 | |
| | | | | |
a | Non-income producing security. |
b | All or a portion of the security is on loan. |
c | The interest rate shown reflects the yield, coupon rate or the discount rate at the date of purchase. |
Definitions:
| | |
| ADR | | - American Depositary Receipt, which are certificates for an underlying foreign security’s shares held by an issuing U.S. depository bank. |
The accompanying Notes to Financial Statements are an integral part of this schedule.
143
Large Cap Value Fund
Schedule of Investments as of October 31, 2012
| | | | |
Unrealized Appreciation (Depreciation) | | | | |
Gross unrealized appreciation and depreciation of investments, based on cost for federal income tax purposes, were as follows: | | | | |
Gross unrealized appreciation | | | $64,930,162 | |
Gross unrealized depreciation | | | (5,086,463 | ) |
| | | | |
Net unrealized appreciation (depreciation) | | | $59,843,699 | |
| |
Cost for federal income tax purposes | | | $521,439,128 | |
Fair Valuation Measurements
The following table is a summary of the inputs used, as of October 31, 2012, in valuing Large Cap Value Fund’s assets carried at fair value.
| | | | | | | | | | | | | | | | |
Investments in Securities | | Total | | | Level 1 | | | Level 2 | | | Level 3 | |
| | | | |
Common Stock | | | | | | | | | | | | | | | | |
Consumer Discretionary | | | 53,658,533 | | | | 53,658,533 | | | | – | | | | – | |
Consumer Staples | | | 50,578,258 | | | | 50,578,258 | | | | – | | | | – | |
Energy | | | 67,511,020 | | | | 67,511,020 | | | | – | | | | – | |
Financials | | | 124,099,463 | | | | 124,099,463 | | | | – | | | | – | |
Health Care | | | 84,903,578 | | | | 84,903,578 | | | | – | | | | – | |
Industrials | | | 51,762,900 | | | | 51,762,900 | | | | – | | | | – | |
Information Technology | | | 69,560,975 | | | | 69,560,975 | | | | – | | | | – | |
Materials | | | 8,359,010 | | | | 8,359,010 | | | | – | | | | – | |
Telecommunications Services | | | 10,385,898 | | | | 10,385,898 | | | | – | | | | – | |
Utilities | | | 28,809,782 | | | | 28,809,782 | | | | – | | | | – | |
Collateral Held for Securities Loaned | | | 7,650,413 | | | | 7,650,413 | | | | – | | | | – | |
Short-Term Investments | | | 24,002,997 | | | | 19,252,997 | | | | 4,750,000 | | | | – | |
| |
Total | | | $581,282,827 | | | | $576,532,827 | | | | $4,750,000 | | | | $– | |
| |
There were no significant transfers between Levels during the period ended October 31, 2012. Transfers between Levels are identified as of the end of the period.
Investment in Affiliates
Affiliated issuers, as defined under the Investment Company Act of 1940, include those in which the Fund’s holdings of an issuer represent 5% or more of the outstanding voting securities of an issuer, or any affiliated mutual fund.
A summary of transactions for the fiscal year to date, in Large Cap Value Fund, is as follows:
| | | | | | | | | | | | | | | | | | | | | | | | |
Fund | | Value
October 31, 2011 | | | Gross
Purchases | | | Gross
Sales | | | Shares Held at
October 31, 2012 | | | Value
October 31, 2012 | | | Income Earned
November 1, 2011 -
October 31, 2012 | |
Securities Lending Trust-Collateral Investment | | | $11,556,500 | | | | $87,863,012 | | | | $91,769,099 | | | | 7,650,413 | | | | $7,650,413 | | | | $15,102 | |
Securities Lending Trust-Short Term Investment | | | – | | | | 24,876,277 | | | | 5,623,280 | | | | 19,252,997 | | | | 19,252,997 | | | | 718 | |
Total Value and Income Earned | | | 11,556,500 | | | | | | | | | | | | | | | | 26,903,410 | | | | 15,820 | |
The accompanying Notes to Financial Statements are an integral part of this schedule.
144
Large Cap Stock Fund
Schedule of Investments as of October 31, 2012
| | | | | | | | |
| Shares | | | Common Stock (88.5%) | | Value | |
| Consumer Discretionary (13.8%) | | | | |
| | 67,300 | | | Amazon.com, Inc.a | | | $15,668,786 | |
| | 138,600 | | | AutoZone, Inc.a | | | 51,975,000 | |
| | 876,300 | | | Comcast Corporation | | | 32,870,013 | |
| | 552,600 | | | Home Depot, Inc. | | | 33,918,588 | |
| | 557,730 | | | Las Vegas Sands Corporation | | | 25,900,981 | |
| | 566,000 | | | Sally Beauty Holdings, Inc.a | | | 13,629,280 | |
| | 408,390 | | | Time Warner Cable, Inc. | | | 40,475,533 | |
| | | | | |
| | | | Total | | | 214,438,181 | |
| | | | | |
| |
| Consumer Staples (5.2%) | | | | |
| | 288,358 | | | Anheuser-Busch InBev NV ADRb | | | 24,164,400 | |
| | 574,400 | | | Kimberly-Clark Corporation | | | 47,933,680 | |
| | 127,700 | | | Nestle SA | | | 8,107,447 | |
| | | | | |
| | | | Total | | | 80,205,527 | |
| | | | | |
| |
| Energy (8.5%) | | | | |
| | 943,970 | | | BP plc ADR | | | 40,486,873 | |
| | 1,183,600 | | | Marathon Oil Corporation | | | 35,579,016 | |
| | 309,570 | | | Schlumberger, Ltd. | | | 21,524,402 | |
| | 3,113,100 | | | Weatherford International, Ltd.a | | | 35,178,030 | |
| | | | | |
| | | | Total | | | 132,768,321 | |
| | | | | |
| |
| Financials (13.6%) | | | | |
| | 212,400 | | | ACE, Ltd. | | | 16,705,260 | |
| | 1,504,350 | | | Citigroup, Inc. | | | 56,247,647 | |
| | 1,617,374 | | | J.P. Morgan Chase & Company | | | 67,412,148 | |
| | 2,210,988 | | | KKR & Company, LP | | | 33,275,369 | |
| | 1,118,450 | | | Wells Fargo & Company | | | 37,680,581 | |
| | | | | |
| | | | Total | | | 211,321,005 | |
| | | | | |
| |
| Health Care (14.0%) | | | | |
| | 203,860 | | | Baxter International, Inc. | | | 12,767,752 | |
| | 156,400 | | | Biogen Idec, Inc.a | | | 21,617,608 | |
| | 167,820 | | | Covidien plc | | | 9,221,709 | |
| | 1,162,270 | | | Merck & Company, Inc. | | | 53,034,380 | |
| | 2,790,013 | | | Pfizer, Inc. | | | 69,387,623 | |
| | 231,700 | | | Shire Pharmaceuticals Group plc ADR | | | 19,553,163 | |
| | 564,370 | | | UnitedHealth Group, Inc. | | | 31,604,720 | |
| | | | | |
| | | | Total | | | 217,186,955 | |
| | | | | |
| |
| Industrials (11.1%) | | | | |
| | 69,850 | | | ADT Corporationa | | | 2,899,474 | |
| | 362,900 | | | FedEx Corporation | | | 33,383,171 | |
| | 530,020 | | | Honeywell International, Inc. | | | 32,458,425 | |
| | 573,380 | | | Jacobs Engineering Group, Inc.a | | | 22,126,734 | |
| | 224,850 | | | Parker Hannifin Corporation | | | 17,686,701 | |
| | 33,520 | | | Pentair, Ltd. | | | 1,415,885 | |
| | 139,700 | | | Tyco International, Ltd. | | | 3,753,739 | |
| | 757,420 | | | United Technologies Corporation | | | 59,199,947 | |
| | | | | |
| | | | Total | | | 172,924,076 | |
| | | | | |
| |
| Information Technology (17.7%) | | | | |
| | 149,878 | | | Apple, Inc. | | | 89,192,398 | |
| | 295,900 | | | Citrix Systems, Inc.a | | | 18,289,579 | |
| | 234,238 | | | Cognizant Technology Solutions Corporationa | | | 15,611,963 | |
| | 181,100 | | | eBay, Inc.a | | | 8,745,319 | |
| | 40,242 | | | Google, Inc.a | | | 27,355,304 | |
| | 613,700 | | | NetApp, Inc.a | | | 16,508,530 | |
| | 1,113,320 | | | Oracle Corporation | | | 34,568,586 | |
| | 303,950 | | | QUALCOMM, Inc. | | | 17,803,871 | |
| | 1,366,830 | | | Texas Instruments, Inc. | | | 38,394,255 | |
| | 240,030 | | | Xilinx, Inc. | | | 7,863,383 | |
| | | | | |
| | | | Total | | | 274,333,188 | |
| | | | | |
| |
| Materials (1.5%) | | | | |
| | 594,785 | | | Freeport-McMoRan Copper & Gold, Inc. | | | 23,125,241 | |
| | | | | |
| | | | Total | | | 23,125,241 | |
| | | | | |
| |
| Utilities (3.1%) | | | | |
| | 1,878,680 | | | NiSource, Inc. | | | 47,849,980 | |
| | | | | |
| | | | Total | | | 47,849,980 | |
| | | | | |
| | | | | | | | |
| | | | | |
| | | | Total Common Stock (cost $1,190,345,229) | | | 1,374,152,474 | |
| | | | | |
| | |
| Shares | | | Collateral Held for Securities Loaned (0.7%) | | Value | |
| | 10,379,100 | | | Thrivent Financial Securities Lending Trust | | | 10,379,100 | |
| | | | | |
| | | | Total Collateral Held for Securities Loaned (cost $10,379,100) | | | 10,379,100 | |
| | | | | |
| | |
Shares or
Principal
Amount | | | Short-Term Investments (11.6%) | | Value | |
| | | | Federal Home Loan Bank Discount Notes | | | | |
| | 5,000,000 | | | 0.080%, 11/1/2012c | | | 5,000,000 | |
| | 25,000,000 | | | 0.080%, 11/28/2012c,d | | | 24,998,500 | |
| | 10,000,000 | | | 0.125%, 12/21/2012c | | | 9,998,264 | |
| | 100,658,452 | | | Thrivent Financial Securities Lending Trust | | | 100,658,452 | |
| | | | U.S. Treasury Bills | | | | |
| | 40,000,000 | | | 0.115%, 11/8/2012c | | | 39,999,105 | |
| | | | | |
| | | | Total Short-Term Investments (at amortized cost) | | | 180,654,321 | |
| | | | | |
| | | | Total Investments (cost $1,381,378,650) 100.8% | | | $1,565,185,895 | |
| | | | | |
| | | | Other Assets and Liabilities, Net (0.8%) | | | (12,419,122 | ) |
| | | | | |
| | | | Total Net Assets 100.0% | | | $1,552,766,773 | |
| | | | | |
a | Non-income producing security. |
b | All or a portion of the security is on loan. |
c | The interest rate shown reflects the yield, coupon rate or the discount rate at the date of purchase. |
d | At October 31, 2012, $5,999,640 of investments were held on deposit with the counterparty and pledged as the initial margin deposit for open futures contracts. |
Definitions:
| | | | |
| | ADR | | - American Depositary Receipt, which are certificates for an underlying foreign security’s shares held by an issuing U.S. depository bank. |
The accompanying Notes to Financial Statements are an integral part of this schedule.
145
Large Cap Stock Fund
Schedule of Investments as of October 31, 2012
Unrealized Appreciation (Depreciation)
Gross unrealized appreciation and depreciation of investments, based on cost for federal income tax purposes, were as follows:
| | | | |
Gross unrealized appreciation | | | $192,173,142 | |
Gross unrealized depreciation | | | (25,579,118 | ) |
| | | | |
Net unrealized appreciation (depreciation) | | | $166,594,024 | |
| |
Cost for federal income tax purposes | | | $1,398,591,871 | |
Fair Valuation Measurements
The following table is a summary of the inputs used, as of October 31, 2012, in valuing Large Cap Stock Fund’s assets carried at fair value.
| | | | | | | | | | | | | | | | |
Investments in Securities | | Total | | | Level 1 | | | Level 2 | | | Level 3 | |
Common Stock | | | | | | | | | | | | | | | | |
Consumer Discretionary | | | 214,438,181 | | | | 214,438,181 | | | | – | | | | – | |
Consumer Staples | | | 80,205,527 | | | | 72,098,080 | | | | 8,107,447 | | | | – | |
Energy | | | 132,768,321 | | | | 132,768,321 | | | | – | | | | – | |
Financials | | | 211,321,005 | | | | 211,321,005 | | | | – | | | | – | |
Health Care | | | 217,186,955 | | | | 217,186,955 | | | | – | | | | – | |
Industrials | | | 172,924,076 | | | | 172,924,076 | | | | – | | | | – | |
Information Technology | | | 274,333,188 | | | | 274,333,188 | | | | – | | | | – | |
Materials | | | 23,125,241 | | | | 23,125,241 | | | | – | | | | – | |
Utilities | | | 47,849,980 | | | | 47,849,980 | | | | – | | | | – | |
Collateral Held for Securities Loaned | | | 10,379,100 | | | | 10,379,100 | | | | – | | | | – | |
Short-Term Investments | | | 180,654,321 | | | | 100,658,452 | | | | 79,995,869 | | | | – | |
| |
Total | | | $1,565,185,895 | | | | $1,477,082,579 | | | | $88,103,316 | | | | $– | |
| |
| | | | |
Other Financial Instruments | | Total | | | Level 1 | | | Level 2 | | | Level 3 | |
Liability Derivatives Futures Contracts | | | 3,781,442 | | | | 3,781,442 | | | | – | | | | – | |
| |
Total Liability Derivatives | | | $3,781,442 | | | | $3,781,442 | | | | $– | | | | $– | |
| |
There were no significant transfers between Levels during the period ended October 31, 2012. Transfers between Levels are identified as of the end of the period.
| | | | | | | | | | | | | | | | | | | | |
Futures Contracts | | Number of
Contracts
Long/(Short) | | | Expiration
Date | | | Notional
Principal
Amount | | | Value | | | Unrealized
Gain/(Loss) | |
S&P 500 Index Futures | | | 319 | | | | December 2012 | | | $ | 115,973,742 | | | $ | 112,192,300 | | | ($ | 3,781,442 | ) |
Total Futures Contracts | | | | | | | | | | | | | | | | | | ($ | 3,781,442 | ) |
The following table summarizes the fair value and Statement of Assets and Liabilities location, as of October 31, 2012, for Large Cap Stock Fund’s investments in financial derivative instruments by primary risk exposure as discussed under item (2) Significant Accounting Policies of the Notes to Financial Statements.
| | | | | | |
Derivatives by risk category | | Statement of Assets and Liabilities Location | | Fair Value | |
| | |
Liability Derivatives | | | | | | |
| | |
Equity Contracts | | | | | | |
Futures* | | Net Assets – Net unrealized appreciation/(depreciation) on Futures contracts | | | 3,781,442 | |
Total Equity Contracts | | | | | 3,781,442 | |
Total Liability Derivatives | | | | $ | 3,781,442 | |
| |
* | Includes cumulative appreciation/depreciation of futures contracts as reported in the Schedule of Investments. Only current day’s variation margin is reported within the Statement of Assets and Liabilities. |
The accompanying Notes to Financial Statements are an integral part of this schedule.
146
Large Cap Stock Fund
Schedule of Investments as of October 31, 2012
The following table summarizes the net realized gains/(losses) and Statement of Operations location, for the period ended October 31, 2012, for Large Cap Stock Fund’s investments in financial derivative instruments by primary risk exposure.
| | | | | | |
Derivatives by risk category | | Statement of Operations Location | | Realized Gains/(Losses)
recognized in Income | |
| | |
Equity Contracts | | | | | | |
Options Written | | Net realized gains/(losses) on Written option contracts | | | (78,015 | ) |
Futures | | Net realized gains/(losses) on Futures contracts | | | 7,841,717 | |
| | |
Total Equity Contracts | | | | | 7,763,702 | |
| | |
Foreign Exchange Contracts | | | | | | |
Forward Contracts | | Net realized gains/(losses) on Foreign currency transactions | | | 65,707 | |
| | |
Total Foreign Exchange Contracts | | | | | 65,707 | |
| |
Total | | | | | $7,829,409 | |
| |
The following table summarizes the change in net unrealized appreciation/(depreciation) and Statement of Operations location, for the period ended October 31, 2012, for Large Cap Stock Fund’s investments in financial derivative instruments by primary risk exposure.
| | | | | | |
Derivatives by risk category | | Statement of Operations Location | | Change in unrealized
appreciation/(depreciation)
recognized in Income | |
| | |
Equity Contracts | | | | | | |
Options Written | | Change in net unrealized appreciation/(depreciation) on Written option contracts | | | (18,000 | ) |
Futures | | Change in net unrealized appreciation/(depreciation) on Futures contracts | | | (3,853,851 | ) |
Total Equity Contracts | | | | | (3,871,851 | ) |
| |
Total | | | | | ($3,871,851 | ) |
| |
The following table presents Large Cap Stock Fund’s average volume of derivative activity during the period ended October 31, 2012.
| | | | | | | | | | | | | | | | | | | | |
Derivative Risk Category | | Futures
(Notional*) | | | Futures
(Percentage
of Average
Net Assets) | | | Forwards
(Notional*) | | | Forwards
(Percentage
of Average
Net Assets) | | | Options
(Contracts) | |
Equity Contracts | | | $34,017,401 | | | | 2.2 | % | | | N/A | | | | N/A | | | | 16 | |
Foreign Exchange Contracts | | | N/A | | | | N/A | | | | $26,318 | | | | <0.1 | % | | | N/A | |
* | Notional amount represents long or short, or both, derivative positions held by the Fund. |
Investment in Affiliates
Affiliated issuers, as defined under the Investment Company Act of 1940, include those in which the Fund’s holdings of an issuer represent 5% or more of the outstanding voting securities of an issuer, or any affiliated mutual fund.
A summary of transactions for the fiscal year to date, in Large Cap Stock Fund, is as follows:
| | | | | | | | | | | | | | | | | | | | | | | | |
Fund | | Value
October 31, 2011 | | | Gross
Purchases | | | Gross Sales | | | Shares Held at
October 31, 2012 | | | Value
October 31, 2012 | | | Income Earned
November 1, 2011 -
October 31, 2012 | |
Securities Lending Trust-Collateral Investment | | | $6,767,600 | | | | $262,172,276 | | | | $258,560,776 | | | | 10,379,100 | | | | $10,379,100 | | | | $43,055 | |
Securities Lending Trust-Short Term Investment | | | – | | | | 109,520,625 | | | | 8,862,173 | | | | 100,658,452 | | | | 100,658,452 | | | | 3,136 | |
Total Value and Income Earned | | | 6,767,600 | | | | | | | | | | | | | | | | 111,037,552 | | | | 46,191 | |
The accompanying Notes to Financial Statements are an integral part of this schedule.
147
Balanced Fund
Schedule of Investments as of October 31, 2012
| | | | | | | | |
| Shares | | | Common Stock (65.9%) | | Value | |
| Consumer Discretionary (9.6%) | | | | |
| | 5,300 | | | AutoZone, Inc.a | | | $1,987,500 | |
| | 84,868 | | | Comcast Corporationl | | | 3,183,399 | |
| | 14,172 | | | Dollar Tree, Inc.a | | | 565,038 | |
| | 17,451 | | | Foot Locker, Inc. | | | 584,608 | |
| | 17,500 | | | GNC Holdings, Inc. | | | 676,725 | |
| | 32,500 | | | Home Depot, Inc. | | | 1,994,850 | |
| | 80,600 | | | Las Vegas Sands Corporation | | | 3,743,064 | |
| | 13,500 | | | Life Time Fitness, Inc.a | | | 606,015 | |
| | 20,600 | | | NIKE, Inc. | | | 1,882,428 | |
| | 32,978 | | | Pier 1 Imports, Inc. | | | 672,751 | |
| | 25,100 | | | Time Warner Cable, Inc. | | | 2,487,661 | |
| | | | | |
| | | | Total | | | 18,384,039 | |
| | | | | |
| |
| Consumer Staples (5.9%) | | | | |
| | 22,929 | | | Anheuser-Busch InBev NV ADR | | | 1,921,450 | |
| | 13,356 | | | Annie’s, Inc.a,b | | | 527,562 | |
| | 10,500 | | | Beam, Inc. | | | 583,380 | |
| | 18,936 | | | British American Tobacco plc ADR | | | 1,881,481 | |
| | 11,249 | | | Ingredion, Inc. | | | 691,364 | |
| | 30,800 | | | Nestle SA | | | 1,955,437 | |
| | 54,100 | | | Procter & Gamble Company | | | 3,745,884 | |
| | | | | |
| | | | Total | | | 11,306,558 | |
| | | | | |
| |
| Energy (6.4%) | | | | |
| | 48,548 | | | BP plc ADR | | | 2,082,224 | |
| | 6,200 | | | Concho Resources, Inc.a | | | 533,944 | |
| | 19,900 | | | EOG Resources, Inc. | | | 2,318,151 | |
| | 69,100 | | | Marathon Oil Corporation | | | 2,077,146 | |
| | 7,766 | | | Oil States International, Inc.a | | | 567,695 | |
| | 35,533 | | | Petroleum Geo-Services ASA | | | 613,993 | |
| | 28,200 | | | Schlumberger, Ltd. | | | 1,960,746 | |
| | 186,200 | | | Weatherford International, Ltd.a | | | 2,104,060 | |
| | | | | |
| | | | Total | | | 12,257,959 | |
| | | | | |
| |
| Financials (11.7%) | | | | |
| | 25,000 | | | ACE, Ltd. | | | 1,966,250 | |
| | 5,500 | | | Affiliated Managers Group, Inc.a | | | 695,750 | |
| | 34,400 | | | Ameriprise Financial, Inc. | | | 2,007,928 | |
| | 4,100 | | | Boston Properties, Inc. | | | 435,830 | |
| | 68,100 | | | Citigroup, Inc. | | | 2,546,259 | |
| | 1,000 | | | Essex Property Trust, Inc. | | | 150,000 | |
| | 1,400 | | | Federal Realty Investment Trust | | | 150,962 | |
| | 15,500 | | | Hartford Financial Services Group, Inc. | | | 336,505 | |
| | 13,500 | | | HCC Insurance Holdings, Inc. | | | 481,140 | |
| | 81,700 | | | Invesco, Ltd. | | | 1,986,944 | |
| | 138,700 | | | KKR & Company, LP | | | 2,087,435 | |
| | 20,381 | | | Lazard, Ltd. | | | 600,424 | |
| | 2,700 | | | Macerich Company | | | 153,900 | |
| | 35,899 | | | Popular, Inc.a | | | 693,928 | |
| | 35,894 | | | Prudential Financial, Inc. | | | 2,047,753 | |
| | 3,100 | | | Public Storage, Inc. | | | 429,753 | |
| | 3,100 | | | Rayonier, Inc. REIT | | | 151,931 | |
| | 2,900 | | | Simon Property Group, Inc. | | | 441,409 | |
| | 1,900 | | | SL Green Realty Corporation | | | 143,070 | |
| | 17,100 | | | SPDR DJ Wilshire Real Estate ETF | | | 1,219,572 | |
| | 6,200 | | | UDR, Inc. | | | 150,474 | |
| | 15,700 | | | Unum Group | | | 318,396 | |
| | 7,200 | | | Ventas, Inc. | | | 455,544 | |
| | 56,200 | | | Wells Fargo & Company | | | 1,893,378 | |
| | 32,125 | | | Zions Bancorporationb | | | 689,724 | |
| | | | | |
| | | | Total | | | 22,234,259 | |
| | | | | |
| |
| Health Care (7.5%) | | | | |
| | 16,900 | | | Biogen Idec, Inc.a | | | 2,335,918 | |
| | 17,100 | | | BioMarin Pharmaceutical, Inc.a | | | 633,384 | |
| | 41,362 | | | Covidien plc | | | 2,272,842 | |
| | 19,100 | | | Endo Pharmaceutical Holdings, Inc.a | | | 547,406 | |
| | 27,100 | | | Hologic, Inc.a | | | 558,802 | |
| | 58,100 | | | Sanofi ADR | | | 2,547,685 | |
| | 23,200 | | | Shire Pharmaceuticals Group plc ADR | | | 1,957,848 | |
| | 38,488 | | | UnitedHealth Group, Inc. | | | 2,155,328 | |
| | 7,600 | | | Waters Corporationa | | | 621,756 | |
| | 7,948 | | | Watson Pharmaceuticals, Inc.a | | | 683,130 | |
| | | | | |
| | | | Total | | | 14,314,099 | |
| | | | | |
| |
| Industrials (8.3%) | | | | |
| | 24,000 | | | Actuant Corporation | | | 677,760 | |
| | 17,010 | | | BE Aerospace, Inc.a | | | 766,981 | |
| | 23,788 | | | EMCOR Group, Inc. | | | 765,022 | |
| | 16,900 | | | Expeditors International of Washington, Inc. | | | 618,709 | |
| | 25,900 | | | FedEx Corporation | | | 2,382,541 | |
| | 23,682 | | | HNI Corporation | | | 651,728 | |
| | 35,100 | | | Honeywell International, Inc. | | | 2,149,524 | |
| | 17,634 | | | Jacobs Engineering Group, Inc.a | | | 680,496 | |
| | 16,688 | | | Manpower, Inc. | | | 633,143 | |
| | 35,009 | | | Parker Hannifin Corporation | | | 2,753,808 | |
| | 10,687 | | | SPX Corporation | | | 733,022 | |
| | 6,700 | | | Stericycle, Inc.a | | | 634,892 | |
| | 31,200 | | | United Technologies Corporation | | | 2,438,592 | |
| | | | | |
| | | | Total | | | 15,886,218 | |
| | | | | |
| |
| Information Technology (11.6%) | | | | |
| | 16,091 | | | Akamai Technologies, Inc.a | | | 611,297 | |
| | 6,869 | | | Apple, Inc. | | | 4,087,742 | |
| | 27,000 | | | Aruba Networks, Inc.a,b | | | 490,590 | |
| | 117,288 | | | Atmel Corporationa | | | 547,148 | |
| | 21,300 | | | Avnet, Inc.a | | | 610,245 | |
| | 13,400 | | | Check Point Software Technologies, Ltd.a | | | 596,702 | |
| | 38,400 | | | Citrix Systems, Inc.a | | | 2,373,504 | |
| | 30,800 | | | Cognizant Technology Solutions Corporationa | | | 2,052,820 | |
| | 21,900 | | | Informatica Corporationa | | | 594,366 | |
| | 32,700 | | | Jabil Circuit, Inc. | | | 567,018 | |
| | 59,000 | | | NetApp, Inc.a | | | 1,587,100 | |
| | 93,518 | | | Oracle Corporation | | | 2,903,734 | |
| | 43,311 | | | Teradyne, Inc.a | | | 633,207 | |
| | 71,333 | | | Texas Instruments, Inc. | | | 2,003,744 | |
| | 20,000 | | | VeriFone Systems, Inc.a | | | 592,800 | |
| | 58,171 | | | Xilinx, Inc. | | | 1,905,682 | |
| | | | | |
| | | | Total | | | 22,157,699 | |
| | | | | |
| |
| Materials (2.6%) | | | | |
| | 4,300 | | | Airgas, Inc. | | | 382,571 | |
| | 5,100 | | | Ashland, Inc. | | | 362,865 | |
| | 9,800 | | | Crown Holdings, Inc.a | | | 374,850 | |
| | 6,500 | | | FMC Corporation | | | 347,880 | |
| | 86,400 | | | Materials Select Sector SPDR Fund | | | 3,109,536 | |
| | 7,100 | | | Reliance Steel & Aluminum Company | | | 385,814 | |
| | | | | |
| | | | Total | | | 4,963,516 | |
| | | | | |
| |
| Utilities (2.3%) | | | | |
| | 35,026 | | | Calpine Corporationa | | | 616,458 | |
The accompanying Notes to Financial Statements are an integral part of this schedule.
148
Balanced Fund
Schedule of Investments as of October 31, 2012
| | | | | | | | |
| Shares | | | Common Stock (65.9%) | | Value | |
| Utilities (2.3%) - continued | | | | |
| | 13,958 | | | Southwest Gas Corporation | | | $606,754 | |
| | 83,600 | | | Utilities Select Sector SPDR Fund | | | 3,082,332 | |
| | | | | |
| | | | Total | | | 4,305,544 | |
| | | | | |
| | | | | | | | |
| | | | | |
| | | | Total Common Stock (cost $117,777,948) | | | 125,809,891 | |
| | | | | |
| | |
Principal Amount | | | Long-Term Fixed Income (34.3%) | | Value | |
| Asset-Backed Securities (1.2%) | | | | |
| | | | Carrington Mortgage Loan Trust | | | | |
| | 150,000 | | | 0.361%, 8/25/2036c | | | 61,138 | |
| | | | Conseco Financial Corporation | | | | |
| | 205,221 | | | 6.330%, 11/1/2029 | | | 217,874 | |
| | | | Countrywide Asset-Backed Certificates | | | | |
| | 100,000 | | | 5.859%, 10/25/2046 | | | 64,090 | |
| | | | First Horizon ABS Trust | | | | |
| | 360,015 | | | 0.341%, 10/25/2026c,d | | | 307,962 | |
| | | | GMAC Mortgage Corporation Loan Trust | | | | |
| | 471,029 | | | 0.391%, 8/25/2035c,d | | | 317,038 | |
| | 432,517 | | | 0.391%, 12/25/2036c,d | | | 311,629 | |
| | | | Popular ABS Mortgage Pass-Through Trust | | | | |
| | 250,000 | | | 5.297%, 11/25/2035 | | | 157,871 | |
| | | | Renaissance Home Equity Loan Trust | | | | |
| | 362,168 | | | 5.608%, 5/25/2036 | | | 213,874 | |
| | 500,000 | | | 5.285%, 1/25/2037 | | | 250,853 | |
| | | | Wachovia Asset Securitization, Inc. | | | | |
| | 542,953 | | | 0.351%, 7/25/2037c,d,e | | | 395,733 | |
| | | | | |
| | | | Total | | | 2,298,062 | |
| | | | | |
| |
| Basic Materials (0.2%) | | | | |
| | | | Dow Chemical Company | | | | |
| | 200,000 | | | 4.250%, 11/15/2020 | | | 221,690 | |
| | | | Freeport-McMoRan Copper & Gold, Inc. | | | | |
| | 100,000 | | | 3.550%, 3/1/2022 | | | 101,820 | |
| | | | Xstrata Finance Canada, Ltd. | | | | |
| | 100,000 | | | 2.450%, 10/25/2017f | | | 99,744 | |
| | | | | |
| | | | Total | | | 423,254 | |
| | | | | |
| |
| Capital Goods (0.3%) | | | | |
| | | | John Deere Capital Corporation | | | | |
| | 125,000 | | | 1.700%, 1/15/2020 | | | 125,372 | |
| | | | Owens Corning, Inc. | | | | |
| | 50,000 | | | 4.200%, 12/15/2022 | | | 50,537 | |
| | | | Republic Services, Inc. | | | | |
| | 100,000 | | | 5.000%, 3/1/2020 | | | 116,006 | |
| | | | Textron, Inc. | | | | |
| | 100,000 | | | 7.250%, 10/1/2019 | | | 120,872 | |
| | | | United Technologies Corporation | | | | |
| | 100,000 | | | 0.918%, 6/1/2015c | | | 101,240 | |
| | | | | |
| | | | Total | | | 514,027 | |
| | | | | |
| |
| Collateralized Mortgage Obligations (0.4%) | | | | |
| | | | Bear Stearns Mortgage Funding Trust | | | | |
| | 104,288 | | | 0.491%, 8/25/2036c | | | 29,708 | |
| | | | HomeBanc Mortgage Trust | | | | |
| | 485,215 | | | 2.634%, 4/25/2037 | | | 308,979 | |
| | | | J.P. Morgan Alternative Loan Trust | | | | |
| | 436,133 | | | 2.808%, 3/25/2036 | | | 300,415 | |
| | | | Master Asset Securitization Trust | | | | |
| | 176,512 | | | 0.711%, 6/25/2036c | | | 115,381 | |
| | | | | |
| | | | Total | | | 754,483 | |
| | | | | |
| |
| Commercial Mortgage-Backed Securities (2.3%) | | | | |
| | | | Bear Stearns Commercial Mortgage Securities, Inc. | | | | |
| | 93,869 | | | 5.613%, 6/11/2050 | | | 96,321 | |
| | 152,852 | | | 0.364%, 3/15/2022c,f | | | 148,332 | |
| | 97,106 | | | 4.487%, 2/11/2041 | | | 97,550 | |
| | | | Citigroup/Deutsche Bank Commercial Mortgage | | | | |
| | 250,000 | | | 5.322%, 12/11/2049 | | | 287,309 | |
| | | | Commercial Mortgage Pass-Through Certificates | | | | |
| | 1,000,000 | | | 0.344%, 12/15/2020c,f | | | 929,513 | |
| | | | Credit Suisse Mortgage Capital Certificates | | | | |
| | 593,857 | | | 0.384%, 10/15/2021c,f | | | 579,470 | |
| | | | Government National Mortgage Association | | | | |
| | 508,913 | | | 3.214%, 1/16/2040 | | | 535,427 | |
| | | | GS Mortgage Securities Corporation II | | | | |
| | 1,000,000 | | | 1.260%, 3/6/2020c,f | | | 999,614 | |
| | | | Morgan Stanley Capital I | | | | |
| | 200,000 | | | 3.224%, 7/15/2049 | | | 215,972 | |
| | | | Wachovia Bank Commercial Mortgage Trust | | | | |
| | 375,000 | | | 5.765%, 7/15/2045 | | | 432,269 | |
| | | | | |
| | | | Total | | | 4,321,777 | |
| | | | | |
| |
| Communications Services (1.0%) | | | | |
| | | | American Tower Corporation | | | | |
| | 200,000 | | | 5.050%, 9/1/2020 | | | 224,740 | |
| | | | CBS Corporation | | | | |
| | 200,000 | | | 8.875%, 5/15/2019 | | | 275,247 | |
| | | | CenturyLink, Inc. | | | | |
| | 125,000 | | | 5.800%, 3/15/2022 | | | 131,573 | |
| | | | Crown Castle Towers, LLC | | | | |
| | 200,000 | | | 4.883%, 8/15/2020f | | | 228,545 | |
| | | | Discovery Communications, LLC | | | | |
| | 100,000 | | | 4.950%, 5/15/2042 | | | 112,732 | |
| | | | Frontier Communications Corporation | | | | |
| | 120,000 | | | 6.250%, 1/15/2013 | | | 120,900 | |
| | | | Qwest Communications International, Inc. | | | | |
| | 150,000 | | | 7.125%, 4/1/2018 | | | 158,440 | |
| | | | SBA Tower Trust | | | | |
| | 200,000 | | | 5.101%, 4/15/2017f | | | 222,160 | |
| | | | Time Warner Cable, Inc. | | | | |
| | 100,000 | | | 4.500%, 9/15/2042 | | | 102,754 | |
| | | | Verizon Communications, Inc. | | | | |
| | 100,000 | | | 8.950%, 3/1/2039 | | | 176,809 | |
The accompanying Notes to Financial Statements are an integral part of this schedule.
149
Balanced Fund
Schedule of Investments as of October 31, 2012
| | | | | | | | |
Principal
Amount | | | Long-Term Fixed Income (34.3%) | | Value | |
| Communications Services (1.0%) - continued | | | | |
| | | | Virgin Media Secured Finance plc | | | | |
| | $100,000 | | | 5.250%, 1/15/2021 | | | $116,503 | |
| | | | | |
| | | | Total | | | 1,870,403 | |
| | | | | |
| |
| Consumer Cyclical (0.4%) | | | | |
| | | | California Institute of Technology | | | | |
| | 150,000 | | | 4.700%, 11/1/2111 | | | 165,254 | |
| | | | Dartmouth College | | | | |
| | 100,000 | | | 3.760%, 6/1/2043 | | | 103,706 | |
| | | | Ford Motor Credit Company, LLC | | | | |
| | 200,000 | | | 3.984%, 6/15/2016 | | | 211,978 | |
| | 100,000 | | | 5.000%, 5/15/2018 | | | 110,304 | |
| | | | Macy’s Retail Holdings, Inc. | | | | |
| | 100,000 | | | 7.450%, 7/15/2017 | | | 123,971 | |
| | | | | |
| | | | Total | | | 715,213 | |
| | | | | |
| |
| Consumer Non-Cyclical (1.1%) | | | | |
| | | | Altria Group, Inc. | | | | |
| | 100,000 | | | 4.250%, 8/9/2042 | | | 102,143 | |
| | | | Anheuser-Busch InBev Worldwide, Inc. | | | | |
| | 150,000 | | | 1.375%, 7/15/2017 | | | 152,261 | |
| | | | Beam, Inc. | | | | |
| | 100,000 | | | 3.250%, 5/15/2022 | | | 105,026 | |
| | | | Colgate-Palmolive Company | | | | |
| | 250,000 | | | 2.625%, 5/1/2017 | | | 267,732 | |
| | | | CVS Caremark Corporation | | | | |
| | 125,000 | | | 6.125%, 9/15/2039 | | | 167,623 | |
| | | | Express Scripts Holding Company | | | | |
| | 100,000 | | | 3.900%, 2/15/2022f | | | 109,306 | |
| | | | HCA, Inc. | | | | |
| | 200,000 | | | 6.500%, 2/15/2020 | | | 221,000 | |
| | | | Heineken NV | | | | |
| | 50,000 | | | 1.400%, 10/1/2017f | | | 50,225 | |
| | 100,000 | | | 2.750%, 4/1/2023f | | | 101,031 | |
| | | | Koninklijke Philips Electronics NV | | | | |
| | 150,000 | | | 3.750%, 3/15/2022 | | | 166,009 | |
| | | | Mayo Clinic Rochester | | | | |
| | 100,000 | | | 3.774%, 11/15/2043 | | | 99,354 | |
| | | | Quest Diagnostics, Inc. | | | | |
| | 250,000 | | | 4.700%, 4/1/2021 | | | 282,036 | |
| | | | Reynolds American, Inc. | | | | |
| | 75,000 | | | 1.050%, 10/30/2015 | | | 75,220 | |
| | 75,000 | | | 3.250%, 11/1/2022 | | | 75,857 | |
| | | | SABMiller Holdings, Inc. | | | | |
| | 200,000 | | | 3.750%, 1/15/2022f | | | 219,968 | |
| | | | | |
| | | | Total | | | 2,194,791 | |
| | | | | |
| |
| Energy (0.6%) | | | | |
| | | | BP Capital Markets plc | | | | |
| | 250,000 | | | 4.742%, 3/11/2021 | | | 295,800 | |
| | | | EOG Resources, Inc. | | | | |
| | 125,000 | | | 2.625%, 3/15/2023 | | | 127,957 | |
| | | | Marathon Oil Corporation | | | | |
| | 25,000 | | | 0.900%, 11/1/2015 | | | 25,088 | |
| | 100,000 | | | 2.800%, 11/1/2022 | | | 100,801 | |
| | | | Rowan Companies, Inc. | | | | |
| | 125,000 | | | 4.875%, 6/1/2022 | | | 138,195 | |
| | | | Transocean, Inc. | | | | |
| | 200,000 | | | 7.375%, 4/15/2018 | | | 241,802 | |
| | | | Valero Energy Corporation | | | | |
| | 200,000 | | | 6.125%, 2/1/2020 | | | 247,040 | |
| | | | | |
| | | | Total | | | 1,176,683 | |
| | | | | |
| |
| Financials (4.1%) | | | | |
| | | | Ally Financial, Inc. | | | | |
| | 100,000 | | | 4.500%, 2/11/2014 | | | 103,000 | |
| | | | Associated Banc Corporation | | | | |
| | 125,000 | | | 1.875%, 3/12/2014 | | | 124,966 | |
| | | | Bank of America Corporation | | | | |
| | 100,000 | | | 5.650%, 5/1/2018 | | | 116,425 | |
| | 75,000 | | | 5.875%, 2/7/2042 | | | 92,185 | |
| | | | Bank of New York Mellon Corporation | | | | |
| | 50,000 | | | 1.281%, 11/24/2014c | | | 50,719 | |
| | 50,000 | | | 1.700%, 11/24/2014 | | | 51,121 | |
| | | | Barclays Bank plc | | | | |
| | 200,000 | | | 2.375%, 1/13/2014 | | | 204,042 | |
| | | | Bear Stearns Companies, LLC | | | | |
| | 200,000 | | | 6.400%, 10/2/2017 | | | 240,994 | |
| | | | Boston Properties, LP | | | | |
| | 200,000 | | | 4.125%, 5/15/2021 | | | 219,405 | |
| | | | Capital One Capital V | | | | |
| | 150,000 | | | 10.250%, 8/15/2039 | | | 154,500 | |
| | | | Citigroup, Inc. | | | | |
| | 82,000 | | | 1.290%, 4/1/2014c | | | 82,205 | |
| | | | CNA Financial Corporation | | | | |
| | 200,000 | | | 6.500%, 8/15/2016 | | | 230,885 | |
| | | | Cooperatieve Centrale Raiffeisen-Boerenleenbank BA | | | | |
| | 150,000 | | | 4.750%, 1/15/2020f | | | 171,969 | |
| | | | Credit Suisse Securities USA, LLC | | | | |
| | 300,000 | | | 1.000%, 4/28/2017g | | | 311,520 | |
| | | | Duke Realty, LP | | | | |
| | 100,000 | | | 3.875%, 10/15/2022 | | | 104,094 | |
| | | | Eksportfinans ASA | | | | |
| | 100,000 | | | 2.375%, 5/25/2016 | | | 94,250 | |
| | | | Fifth Third Bancorp | | | | |
| | 200,000 | | | 5.450%, 1/15/2017 | | | 225,772 | |
| | | | General Electric Capital Corporation | | | | |
| | 200,000 | | | 3.800%, 6/18/2019f | | | 213,437 | |
| | | | Goldman Sachs Group, Inc., Convertible | | | | |
| | 4,080 | | | 1.000%, 7/10/2013f,h | | | 119,642 | |
| | | | Health Care REIT, Inc. | | | | |
| | 200,000 | | | 6.125%, 4/15/2020 | | | 235,344 | |
| | | | HSBC Holdings plc | | | | |
| | 165,000 | | | 6.500%, 5/2/2036 | | | 202,020 | |
| | | | ING Bank NV | | | | |
| | 50,000 | | | 5.000%, 6/9/2021f | | | 56,468 | |
| | | | ING Capital Funding Trust III | | | | |
| | 25,000 | | | 3.962%, 12/31/2049i | | | 23,469 | |
| | | | International Lease Finance Corporation | | | | |
| | 100,000 | | | 8.625%, 9/15/2015 | | | 112,600 | |
| | | | J.P. Morgan Chase & Company | | | | |
| | 150,000 | | | 2.000%, 8/15/2017 | | | 151,607 | |
| | | | Kommuninvest I Sverige AB | | | | |
| | 150,000 | | | 1.000%, 10/24/2017f | | | 150,073 | |
| | | | Liberty Mutual Group, Inc. | | | | |
| | 50,000 | | | 4.950%, 5/1/2022f | | | 54,603 | |
The accompanying Notes to Financial Statements are an integral part of this schedule.
150
Balanced Fund
Schedule of Investments as of October 31, 2012
| | | | | | | | |
Principal
Amount | | | Long-Term Fixed Income (34.3%) | | Value | |
| Financials (4.1%) - continued | | | | |
| | | | Liberty Property, LP | | | | |
| | $200,000 | | | 5.500%, 12/15/2016 | | | $227,363 | |
| | | | Macquarie Bank, Ltd. | | | | |
| | 100,000 | | | 5.000%, 2/22/2017f | | | 108,613 | |
| | | | Metropolitan Life Global Funding I | | | | |
| | 250,000 | | | 3.650%, 6/14/2018f | | | 274,354 | |
| | | | Morgan Stanley | | | | |
| | 200,000 | | | 7.300%, 5/13/2019 | | | 240,664 | |
| | | | National Australia Bank, Ltd. | | | | |
| | 125,000 | | | 2.000%, 6/20/2017f | | | 129,225 | |
| | | | PNC Funding Corporation | | | | |
| | 200,000 | | | 5.125%, 2/8/2020 | | | 239,990 | |
| | | | Principal Financial Group, Inc. | | | | |
| | 200,000 | | | 8.875%, 5/15/2019 | | | 265,744 | |
| | | | Prudential Financial, Inc. | | | | |
| | 250,000 | | | 6.100%, 6/15/2017 | | | 296,688 | |
| | | | Rabobank Capital Funding Trust II | | | | |
| | 101,000 | | | 5.260%, 12/29/2049f,i | | | 101,000 | |
| | | | Reinsurance Group of America, Inc. | | | | |
| | 300,000 | | | 5.625%, 3/15/2017 | | | 341,893 | |
| | | | Simon Property Group, LP | | | | |
| | 200,000 | | | 4.375%, 3/1/2021 | | | 225,831 | |
| | | | SLM Corporation | | | | |
| | 100,000 | | | 6.250%, 1/25/2016 | | | 108,005 | |
| | 100,000 | | | 8.000%, 3/25/2020 | | | 115,812 | |
| | | | Swiss RE Capital I, LP | | | | |
| | 275,000 | | | 6.854%, 5/29/2049f,i | | | 286,887 | |
| | | | Travelers Companies, Inc. | | | | |
| | 105,000 | | | 6.250%, 6/15/2037 | | | 143,522 | |
| | | | UBS AG/London | | | | |
| | 200,000 | | | 1.875%, 1/23/2015f | | | 203,715 | |
| | | | UnionBanCal Corporation | | | | |
| | 125,000 | | | 3.500%, 6/18/2022 | | | 132,483 | |
| | | | UnitedHealth Group, Inc. | | | | |
| | 125,000 | | | 1.400%, 10/15/2017 | | | 125,806 | |
| | | | WEA Finance, LLC | | | | |
| | 225,000 | | | 6.750%, 9/2/2019f | | | 278,498 | |
| | | | Willis North America, Inc. | | | | |
| | 125,000 | | | 6.200%, 3/28/2017 | | | 143,552 | |
| | | | | |
| | | | Total | | | 7,886,960 | |
| | | | | |
| |
| Foreign Government (0.7%) | | | | |
| | | | Bank Nederlandse Gemeenten NV | | | | |
| | 170,000 | | | 4.375%, 2/16/2021f | | | 198,747 | |
| | | | Chile Government International Bond | | | | |
| | 200,000 | | | 3.875%, 8/5/2020 | | | 227,000 | |
| | | | Corporacion Andina de Fomento | | | | |
| | 141,000 | | | 4.375%, 6/15/2022 | | | 153,320 | |
| | | | Kommunalbanken AS | | | | |
| | 200,000 | | | 1.000%, 9/26/2017f | | | 199,572 | |
| | | | Mexico Government International Bond | | | | |
| | 50,000 | | | 6.050%, 1/11/2040 | | | 66,375 | |
| | | | Province of Manitoba | | | | |
| | 150,000 | | | 1.300%, 4/3/2017 | | | 153,465 | |
| | | | Province of New Brunswick | | | | |
| | 150,000 | | | 2.750%, 6/15/2018 | | | 162,112 | |
| | | | Province of Ontario | | | | |
| | 150,000 | | | 1.100%, 10/25/2017 | | | 150,240 | |
| | | | | |
| | | | Total | | | 1,310,831 | |
| | | | | |
| |
| Mortgage-Backed Securities (10.0%) | | | | |
| | | | Federal Home Loan Mortgage Corporation Gold 15-Yr. Pass Through | | | | |
| | 1,700,000 | | | 2.500%, 11/1/2027j | | | 1,775,438 | |
| | | | Federal Home Loan Mortgage Corporation Gold 30-Yr. Pass Through | | | | |
| | 1,850,000 | | | 3.000%, 11/1/2042j | | | 1,936,574 | |
| | | | Federal National Mortgage Association Conventional 15- Yr. Pass Through | | | | |
| | 2,525,000 | | | 2.500%, 11/1/2027j | | | 2,642,570 | |
| | | | Federal National Mortgage Association Conventional 30- Yr. Pass Through | | | | |
| | 4,500,000 | | | 3.500%, 11/1/2042j | | | 4,793,203 | |
| | 2,475,000 | | | 4.000%, 11/1/2042j | | | 2,650,183 | |
| | 3,900,000 | | | 5.000%, 11/1/2042j | | | 4,254,656 | |
| | 1,000,000 | | | 5.000%, 12/1/2042j | | | 1,090,938 | |
| | | | | |
| | | | Total | | | 19,143,562 | |
| | | | | |
| |
| Technology (0.2%) | | | | |
| | | | Affiliated Computer Services, Inc. | | | | |
| | 200,000 | | | 5.200%, 6/1/2015 | | | 215,808 | |
| | | | Oracle Corporation | | | | |
| | 100,000 | | | 1.200%, 10/15/2017 | | | 100,504 | |
| | | | | |
| | | | Total | | | 316,312 | |
| | | | | |
| |
| Transportation (0.4%) | | | | |
| | | | Burlington Northern Santa Fe, LLC | | | | |
| | 100,000 | | | 3.050%, 9/1/2022 | | | 104,343 | |
| | | | Continental Airlines, Inc. | | | | |
| | 125,000 | | | 4.150%, 4/11/2024 | | | 130,875 | |
| | | | CSX Corporation | | | | |
| | 200,000 | | | 3.700%, 10/30/2020 | | | 217,186 | |
| | | | Delta Air Lines, Inc. | | | | |
| | 91,622 | | | 4.950%, 11/23/2019 | | | 99,071 | |
| | 50,000 | | | 4.750%, 5/7/2020 | | | 52,815 | |
| | | | ERAC USA Finance, LLC | | | | |
| | 200,000 | | | 5.250%, 10/1/2020f | | | 229,395 | |
| | | | | |
| | | | Total | | | 833,685 | |
| | | | | |
| |
| U.S. Government and Agencies (9.8%) | | | | |
| | | | Federal Home Loan Banks | | | | |
| | 1,250,000 | | | 1.375%, 5/28/2014 | | | 1,272,572 | |
| | 150,000 | | | 0.500%, 11/20/2015 | | | 150,220 | |
| | | | Federal Home Loan Mortgage Corporation | | | | |
| | 250,000 | | | 1.250%, 8/1/2019 | | | 249,922 | |
| | 250,000 | | | 1.250%, 10/2/2019 | | | 249,305 | |
| | | | U.S. Treasury Bonds | | | | |
| | 1,965,000 | | | 3.000%, 5/15/2042 | | | 2,029,784 | |
| | | | U.S. Treasury Bonds, TIPS | | | | |
| | 150,000 | | | 0.750%, 2/15/2042 | | | 170,263 | |
| | | | U.S. Treasury Notes | | | | |
| | 150,000 | | | 0.750%, 6/15/2014 | | | 151,166 | |
| | 1,700,000 | | | 0.250%, 9/15/2015 | | | 1,694,023 | |
The accompanying Notes to Financial Statements are an integral part of this schedule.
151
Balanced Fund
Schedule of Investments as of October 31, 2012
| | | | | | | | |
Principal
Amount | | | Long-Term Fixed Income (34.3%) | | Value | |
| U.S. Government and Agencies (9.8%) - continued | | | | |
| | $2,250,000 | | | 0.750%, 6/30/2017 | | | $2,258,788 | |
| | 5,150,000 | | | 0.875%, 7/31/2019 | | | 5,079,187 | |
| | 725,000 | | | 1.625%, 8/15/2022 | | | 721,035 | |
| | | | U.S. Treasury Notes, TIPS | | | | |
| | 1,000,000 | | | 0.125%, 4/15/2017 | | | 1,087,644 | |
| | 1,625,000 | | | 1.125%, 1/15/2021 | | | 2,023,462 | |
| | 1,450,000 | | | 0.125%, 1/15/2022 | | | 1,613,993 | |
| | | | | |
| | | | Total | | | 18,751,364 | |
| | | | | |
| |
| U.S. Municipals (0.1%) | | | | |
| | | | North Texas Tollway Authority Revenue Bonds (Build America Bonds) | | | | |
| | 150,000 | | | 6.718%, 1/1/2049 | | | 205,218 | |
| | | | | |
| | | | Total | | | 205,218 | |
| | | | | |
| |
| Utilities (1.5%) | | | | |
| | | | Cleveland Electric Illuminating Company | | | | |
| | 245,000 | | | 5.700%, 4/1/2017 | | | 277,890 | |
| | | | Duke Energy Carolinas, LLC | | | | |
| | 100,000 | | | 4.000%, 9/30/2042 | | | 106,636 | |
| | | | Energy Transfer Partners, LP | | | | |
| | 250,000 | | | 4.650%, 6/1/2021 | | | 277,657 | |
| | | | FirstEnergy Solutions Corporation | | | | |
| | 150,000 | | | 4.800%, 2/15/2015 | | | 162,166 | |
| | | | ITC Holdings Corporation | | | | |
| | 225,000 | | | 6.050%, 1/31/2018f | | | 264,991 | |
| | | | Kinder Morgan Energy Partners, LP | | | | |
| | 100,000 | | | 5.300%, 9/15/2020 | | | 118,488 | |
| | | | MidAmerican Energy Holdings Company | | | | |
| | 225,000 | | | 6.500%, 9/15/2037 | | | 310,688 | |
| | | | NiSource Finance Corporation | | | | |
| | 100,000 | | | 6.125%, 3/1/2022 | | | 123,084 | |
| | 100,000 | | | 3.850%, 2/15/2023 | | | 105,831 | |
| | | | ONEOK Partners, LP | | | | |
| | 200,000 | | | 8.625%, 3/1/2019 | | | 265,885 | |
| | | | Pennsylvania Electric Company | | | | |
| | 200,000 | | | 5.200%, 4/1/2020 | | | 228,363 | |
| | | | Sempra Energy | | | | |
| | 100,000 | | | 2.300%, 4/1/2017 | | | 104,421 | |
| | | | Union Electric Company | | | | |
| | 350,000 | | | 6.400%, 6/15/2017 | | | 431,311 | |
| | | | Williams Partners, LP | | | | |
| | 100,000 | | | 3.350%, 8/15/2022 | | | 103,666 | |
| | | | | |
| | | | Total | | | 2,881,077 | |
| | | | | |
| | | | | | | | |
| | | | | |
| | | | Total Long-Term Fixed Income (cost $64,208,717) | | | 65,597,702 | |
| | | | | |
| |
| Fixed Income Mutual Funds (1.0%) | | | | |
| | 366,132 | | | Thrivent High Yield Fund | | | 1,834,321 | |
| | | | | |
| | | | Total | | | 1,834,321 | |
| | | | | |
| | | | | | | | |
| | | | | |
| | | | Total Other Mutual Funds (cost $1,400,000) | | | 1,834,321 | |
| | | | | |
| | |
| Shares | | | Preferred Stock (0.1%) | | Value | |
| Financials (0.1%) | | | | |
| | 2,600 | | | Discover Financial Services, | | | | |
| | | | 6.500%i | | | 66,170 | |
| | 4,000 | | | HSBC Holdings plc, 8.000%i | | | 112,880 | |
| | | | | |
| | | | Total | | | 179,050 | |
| | | | | |
| | | | | | | | |
| | | | | |
| | | | Total Preferred Stock (cost $164,896) | | | 179,050 | |
| | | | | |
| | |
| Shares | | | Collateral Held for Securities Loaned (0.6%) | | Value | |
| | 1,067,718 | | | Thrivent Financial Securities Lending Trust | | | 1,067,718 | |
| | | | | |
| | | | Total Collateral Held for Securities Loaned (cost $1,067,718) | | | 1,067,718 | |
| | | | | |
| | |
Shares or
Principal
Amount | | | Short-Term Investments (8.9%) | | Value | |
| | | | Federal Home Loan Bank Discount Notes | | | | |
| | 3,000,000 | | | 0.125%, 12/21/2012k | | | 2,999,479 | |
| | | | Federal Home Loan Mortgage Corporation Discount Notes | | | | |
| | 100,000 | | | 0.160%, 12/17/2012k,l | | | 99,979 | |
| | 13,922,888 | | | Thrivent Financial Securities Lending Trust | | | 13,922,888 | |
| | | | | |
| | | | Total Short-Term Investments (at amortized cost) | | | 17,022,346 | |
| | | | | |
| | | | Total Investments (cost $201,641,625) 110.8% | | | $211,511,028 | |
| | | | | |
| | | | Other Assets and Liabilities, Net (10.8%) | | | (20,599,369 | ) |
| | | | | |
| | | | Total Net Assets 100.0% | | | $190,911,659 | |
| | | | | |
a | Non-income producing security. |
b | All or a portion of the security is on loan. |
c | Denotes variable rate securities. Variable rate securities are securities whose yields vary with a designated market index or market rate. The rate shown is as of October 31, 2012. |
d | All or a portion of the security is insured or guaranteed. |
e | Denotes restricted securities. Restricted securities are investment securities which have been deemed illiquid and cannot be offered for public sale without first being registered under the Securities Act of 1933. The following table indicates the acquisition date and cost of restricted securities Balanced Fund owned as of October 31, 2012. |
| | | | | | | | |
Security | | Acquisition
Date | | | Cost | |
Wachovia Asset Securitization, Inc. | | | 3/16/2007 | | | $ | 542,953 | |
f | Denotes securities sold under Rule 144A of the Securities Act of 1933, which exempts them from registration. These securities have been deemed liquid and may be resold to other dealers in the program or to other qualified institutional buyers. As of October 31, 2012, the value of these investments was $6,729,097 or 3.5% of total net assets. |
The accompanying Notes to Financial Statements are an integral part of this schedule.
152
Balanced Fund
Schedule of Investments as of October 31, 2012
g | Denotes equity-linked structured security. This security is linked to the S&P 500 Index. |
h | Security is displayed in shares. This security is an equity-linked structured security. This security is linked to the common stock of Microsoft Corporation. |
i | Denotes perpetual securities. Perpetual securities pay an indefinite stream of interest, but may be called by the issuer at an earlier date. |
j | Denotes investments purchased on a when-issued or delayed delivery basis. |
k | The interest rate shown reflects the yield, coupon rate or the discount rate at the date of purchase. |
l | At October 31, 2012, $475,079 of investments were held on deposit with the counterparty and pledged as the initial margin deposit for open futures contracts. |
Definitions:
| | |
| ADR | | - American Depositary Receipt, which are certificates for an underlying foreign security’s shares held by an issuing U.S. depository bank. |
| REIT | | - Real Estate Investment Trust is a company that buys, develops, manages and/or sells real estate assets. |
| TIPS | | - Treasury Inflation Protected Security. |
| ETF | | - Exchange Traded Fund. |
| | | | |
Unrealized Appreciation (Depreciation) | | | | |
Gross unrealized appreciation and depreciation of investments, based on cost for federal income tax purposes, were as follows: | | | | |
Gross unrealized appreciation | | | $16,558,660 | |
Gross unrealized depreciation | | | (6,831,788 | ) |
| | | | |
Net unrealized appreciation (depreciation) | | | $9,726,872 | |
| |
Cost for federal income tax purposes | | | $201,784,156 | |
The accompanying Notes to Financial Statements are an integral part of this schedule.
153
Balanced Fund
Schedule of Investments as of October 31, 2012
Fair Valuation Measurements
The following table is a summary of the inputs used, as of October 31, 2012, in valuing Balanced Fund’s assets carried at fair value.
| | | | | | | | | | | | | | | | |
Investments in Securities | | Total | | | Level 1 | | | Level 2 | | | Level 3 | |
| | | | |
Common Stock | | | | | | | | | | | | | | | | |
Consumer Discretionary | | | 18,384,039 | | | | 18,384,039 | | | | – | | | | – | |
Consumer Staples | | | 11,306,558 | | | | 9,351,121 | | | | 1,955,437 | | | | – | |
Energy | | | 12,257,959 | | | | 11,643,966 | | | | 613,993 | | | | – | |
Financials | | | 22,234,259 | | | | 22,234,259 | | | | – | | | | – | |
Health Care | | | 14,314,099 | | | | 14,314,099 | | | | – | | | | – | |
Industrials | | | 15,886,218 | | | | 15,886,218 | | | | – | | | | – | |
Information Technology | | | 22,157,699 | | | | 22,157,699 | | | | – | | | | – | |
Materials | | | 4,963,516 | | | | 4,963,516 | | | | – | | | | – | |
Utilities | | | 4,305,544 | | | | 4,305,544 | | | | – | | | | – | |
| | | | |
Long-Term Fixed Income | | | | | | | | | | | | | | | | |
Asset-Backed Securities | | | 2,298,062 | | | | – | | | | 2,298,062 | | | | – | |
Basic Materials | | | 423,254 | | | | – | | | | 423,254 | | | | – | |
Capital Goods | | | 514,027 | | | | – | | | | 514,027 | | | | – | |
Collateralized Mortgage Obligations | | | 754,483 | | | | – | | | | 754,483 | | | | – | |
Commercial Mortgage-Backed Securities | | | 4,321,777 | | | | – | | | | 4,321,777 | | | | – | |
Communications Services | | | 1,870,403 | | | | – | | | | 1,870,403 | | | | – | |
Consumer Cyclical | | | 715,213 | | | | – | | | | 715,213 | | | | – | |
Consumer Non-Cyclical | | | 2,194,791 | | | | – | | | | 2,194,791 | | | | – | |
Energy | | | 1,176,683 | | | | – | | | | 1,176,683 | | | | – | |
Financials | | | 7,886,960 | | | | – | | | | 7,455,798 | | | | 431,162 | |
Foreign Government | | | 1,310,831 | | | | – | | | | 1,310,831 | | | | – | |
Mortgage-Backed Securities | | | 19,143,562 | | | | – | | | | 19,143,562 | | | | – | |
Technology | | | 316,312 | | | | – | | | | 316,312 | | | | – | |
Transportation | | | 833,685 | | | | – | | | | 833,685 | | | | – | |
U.S. Government and Agencies | | | 18,751,364 | | | | – | | | | 18,751,364 | | | | – | |
U.S. Municipals | | | 205,218 | | | | – | | | | 205,218 | | | | – | |
Utilities | | | 2,881,077 | | | | – | | | | 2,881,077 | | | | – | |
Fixed Income Mutual Funds | | | 1,834,321 | | | | 1,834,321 | | | | – | | | | – | |
| | | | |
Preferred Stock | | | | | | | | | | | | | | | | |
Financials | | | 179,050 | | | | 179,050 | | | | – | | | | – | |
Collateral Held for Securities Loaned | | | 1,067,718 | | | | 1,067,718 | | | | – | | | | – | |
Short-Term Investments | | | 17,022,346 | | | | 13,922,888 | | | | 3,099,458 | | | | – | |
| |
Total | | | $211,511,028 | | | | $140,244,438 | | | | $70,835,428 | | | | $431,162 | |
| |
| | | | |
Other Financial Instruments | | Total | | | Level 1 | | | Level 2 | | | Level 3 | |
| | | | |
Asset Derivatives | | | | | | | | | | | | | | | | |
Futures Contracts | | | 4,209 | | | | 4,209 | | | | – | | | | – | |
| |
Total Asset Derivatives | | | $4,209 | | | | $4,209 | | | | $– | | | | $– | |
| |
| | | | |
Liability Derivatives | | | | | | | | | | | | | | | | |
Futures Contracts | | | 8,811 | | | | 8,811 | | | | – | | | | – | |
Credit Default Swaps | | | 38,580 | | | | – | | | | 38,580 | | | | – | |
| |
Total Liability Derivatives | | | $47,391 | | | | $8,811 | | | | $38,580 | | | | $– | |
| |
There were no significant transfers between Levels during the period ended October 31, 2012. Transfers between Levels are identified as of the end of the period.
The accompanying Notes to Financial Statements are an integral part of this schedule.
154
Balanced Fund
Schedule of Investments as of October 31, 2012
| | | | | | | | | | | | | | | | | | |
Futures Contracts | | Number of
Contracts
Long/(Short) | | | Expiration
Date | | Notional Principal Amount | | | Value | | | Unrealized
Gain/(Loss) | |
2-Yr. U.S. Treasury Bond Futures | | | (15 | ) | | December 2012 | | | ($3,306,282 | ) | | | ($3,304,922 | ) | | | $1,360 | |
10-Yr. U.S. Treasury Bond Futures | | | (65 | ) | | December 2012 | | | (8,649,880 | ) | | | (8,647,031 | ) | | | 2,849 | |
20-Yr U.S. Treasury Bond Futures | | | 20 | | | December 2012 | | | 2,995,061 | | | | 2,986,250 | | | | (8,811 | ) |
Total Futures Contracts | | | | | | | | | | | | | | | | | ($4,602 | ) |
| | | | | | | | | | | | | | | | | | | | | | |
Credit Default Swaps and
Counterparty | | Buy/Sell Protection1 | | Termination Date | | | Notional Principal Amount2 | | | Upfront
Payments Received (Made) | | | Value3 | | | Unrealized
Gain/(Loss) | |
CDX HY, Series 18, 5 Year, at
5.00%; Bank of America | | Buy | | | 6/20/2017 | | | | $742,500 | | | | ($36,695 | ) | | | ($1,721 | ) | | | ($38,416 | ) |
CDX IG, Series 18, 5 Year, at
1.00%; J.P. Morgan Chase and Co. | | Buy | | | 6/20/2017 | | | | 1,500,000 | | | | 7,253 | | | | (7,417 | ) | | | (164 | ) |
Total Credit Default Swaps | | | | | | | | | | | | | | | | | ($9,138 | ) | | | ($38,580 | ) |
1 | As the buyer of protection, Balanced Fund pays periodic fees in return for payment by the seller which is contingent upon an adverse credit event occurring in the underlying issuer or reference entity. As the seller of protection, Balanced Fund collects periodic fees from the buyer and profits if the credit of the underlying issuer or reference entity remains stable or improves while the swap is outstanding, but the seller in a credit default swap contract would be required to pay the amount of credit loss, determined as specified in the agreement, to the buyer in the event of an adverse credit event in the reference entity. |
2 | The maximum potential amount of future payments Balanced Fund could be required to make as the seller or receive as the buyer of protection. |
3 | The values for credit indexes (CDX or LCDX) serve as an indicator of the current status of the payment/performance risk and represent the liability or profit for the credit default swap contract had the contract been closed as of the reporting date. When protection has been sold, the value of the swap will increase when the swap spread declines representing an improvement in the reference entity’s credit worthiness. The value of the swap will decrease when the swap spread increases representing a deterioration in the reference entity’s credit worthiness. When protection has been purchased, the value of the swap will increase when the swap spread increases representing a deterioration in the reference entity’s credit worthiness. The value of the swap will decrease when the swap spread declines representing an improvement in the reference entity’s credit worthiness. |
The following table summarizes the fair value and Statement of Assets and Liabilities location, as of October 31, 2012, for Balanced Fund’s investments in financial derivative instruments by primary risk exposure as discussed under item (2) Significant Accounting Policies of the Notes to Financial Statements.
| | | | | | |
Derivatives by risk category | | Statement of Assets and Liabilities Location | | Fair Value | |
| | |
Asset Derivatives | | | | | | |
| | |
Interest Rate Contracts | | | | | | |
Futures* | | Net Assets - Net unrealized appreciation/(depreciation) on Futures contracts | | | 4,209 | |
Total Interest Rate Contracts | | | | | 4,209 | |
| |
Total Asset Derivatives | | | | | $4,209 | |
| |
| | |
Liability Derivatives | | | | | | |
| | |
Interest Rate Contracts | | | | | | |
Futures* | | Net Assets - Net unrealized appreciation/(depreciation) on Futures contracts | | | 8,811 | |
Total Interest Rate Contracts | | | | | 8,811 | |
| | |
Credit Contracts | | | | | | |
Credit Default Swaps | | Receivable/Payable - Swap agreements, at value; Net Assets - Net unrealized appreciation/(depreciation) on Swap agreements | | | 38,580 | |
Total Credit Contracts | | | | | 38,580 | |
| |
Total Liability Derivatives | | | | | $47,391 | |
| |
* | Includes cumulative appreciation/depreciation of futures contracts as reported in the Schedule of Investments. Only current day’s variation margin is reported within the Statement of Assets and Liabilities. |
The accompanying Notes to Financial Statements are an integral part of this schedule.
155
Balanced Fund
Schedule of Investments as of October 31, 2012
The following table summarizes the net realized gains/(losses) and Statement of Operations location, for the period ended October 31, 2012, for Balanced Fund’s investments in financial derivative instruments by primary risk exposure.
| | | | | | |
Derivatives by risk category | | Statement of Operations Location | | Realized Gains/(Losses)
recognized in Income | |
| | |
Interest Rate Contracts | | | | | | |
Options Written | | Net realized gains/(losses) on Written option contracts | | | 1,503 | |
Futures | | Net realized gains/(losses) on Futures contracts | | | (183,494 | ) |
| | |
Total Interest Rate Contracts | | | | | (181,991 | ) |
| | |
Equity Contracts | | | | | | |
Options Purchased | | Net realized gains/(losses) on Investments | | | (6,593 | ) |
Futures | | Net realized gains/(losses) on Futures contracts | | | 606,324 | |
| | |
Total Equity Contracts | | | | | 599,731 | |
| | |
Foreign Exchange Contracts | | | | | | |
Forward Contracts | | Net realized gains/(losses) on Foreign currency transactions | | | 13,875 | |
| | |
Total Foreign Exchange Contracts | | | | | 13,875 | |
| | |
Credit Contracts | | | | | | |
Credit Default Swaps | | Net realized gains/(losses) on Swap agreements | | | 13,422 | |
| | |
Total Credit Contracts | | | | | 13,422 | |
| |
Total | | | | | $445,037 | |
| |
The following table summarizes the change in net unrealized appreciation/(depreciation) and Statement of Operations location, for the period ended October 31, 2012, for Balanced Fund’s investments in financial derivative instruments by primary risk exposure.
| | | | | | |
Derivatives by risk category | | Statement of Operations Location | | Change in unrealized
appreciation/(depreciation)
recognized in Income | |
Interest Rate Contracts | | | | | | |
Futures | | Change in net unrealized appreciation/(depreciation) on Futures contracts | | | (55,938 | ) |
Total Interest Rate Contracts | | | | | (55,938 | ) |
| | |
Credit Contracts | | | | | | |
Credit Default Swaps | | Change in net unrealized appreciation/(depreciation) on Swap agreements | | | (124,267 | ) |
Total Credit Contracts | | | | | (124,267 | ) |
| | |
Equity Contracts | | | | | | |
Futures | | Change in net unrealized appreciation/(depreciation) on Futures contracts | | | (132,509 | ) |
Total Equity Contracts | | | | | (132,509 | ) |
| |
Total | | | | | ($312,714 | ) |
| |
The following table presents Balanced Fund’s average volume of derivative activity during the period ended October 31, 2012.
| | | | | | | | | | | | | | | | | | | | | | | | | | | | |
Derivative Risk Category | | Futures
(Notional*) | | | Futures
(Percentage
of Average
Net Assets) | | | Forwards
(Notional*) | | | Forwards
(Percentage
of Average
Net Assets) | | | Swaps
(Notional*) | | | Swaps
(Percentage
of Average
Net Assets) | | | Options
(Contracts) | |
Equity Contracts | | | $1,138,707 | | | | 0.6% | | | | N/A | | | | N/A | | | | N/A | | | | N/A | | | | 1 | |
Interest Rate Contracts | | | 14,791,543 | | | | 7.6 | | | | N/A | | | | N/A | | | | N/A | | | | N/A | | | | N/A | |
Foreign Exchange Contracts | | | N/A | | | | N/A | | | | $15,058 | | | | <0.1% | | | | N/A | | | | N/A | | | | N/A | |
Credit Contracts | | | N/A | | | | N/A | | | | N/A | | | | N/A | | | | $1,663,518 | | | | 0.9% | | | | N/A | |
* | Notional amount represents long or short, or both, derivative positions held by the Fund. |
The accompanying Notes to Financial Statements are an integral part of this schedule.
156
Balanced Fund
Schedule of Investments as of October 31, 2012
Investment in Affiliates
Affiliated issuers, as defined under the Investment Company Act of 1940, include those in which the Fund’s holdings of an issuer represent 5% or more of the outstanding voting securities of an issuer, or any affiliated mutual fund.
A summary of transactions for the fiscal year to date, in Balanced Fund, is as follows:
| | | | | | | | | | | | | | | | | | | | | | | | |
Fund | | Value
October 31, 2011 | | | Gross
Purchases | | | Gross
Sales | | | Shares Held at
October 31, 2012 | | | Value
October 31, 2012 | | | Income Earned
November 1, 2011 -
October 31, 2012 | |
High Yield | | | $1,728,143 | | | | $– | | | | $– | | | | 366,132 | | | | $1,834,321 | | | | $128,399 | |
Securities Lending Trust-Collateral Investment | | | 3,606,713 | | | | 72,228,068 | | | | 74,767,063 | | | | 1,067,718 | | | | 1,067,718 | | | | 14,258 | |
Securities Lending Trust-Short Term Investment | | | – | | | | 15,288,772 | | | | 1,365,884 | | | | 13,922,888 | | | | 13,922,888 | | | | 1,636 | |
Total Value and Income Earned | | | 5,334,856 | | | | | | | | | | | | | | | | 16,824,927 | | | | 144,293 | |
The accompanying Notes to Financial Statements are an integral part of this schedule.
157
High Yield Fund
Schedule of Investments as of October 31, 2012
| | | | | | | | |
Principal
Amount | | | Bank Loans (1.4%)a | | Value | |
| Consumer Non-Cyclical (0.5%) | | | | |
| | | | HCA, Inc., Term Loan | | | | |
| | $4,270,454 | | | 3.462%, 5/1/2018 | | | $4,272,376 | |
| | | | | |
| | | | Total | | | 4,272,376 | |
| | | | | |
| |
| Energy (0.1%) | | | | |
| | | | Chesapeake Energy Corporation, Term Loan | | | | |
| | 862,676 | | | 8.500%, 12/2/2017 | | | 863,504 | |
| | | | | |
| | | | Total | | | 863,504 | |
| | | | | |
| |
| Financials (0.3%) | | | | |
| | | | Nuveen Investments, Inc., Term Loan | | | | |
| | 2,350,000 | | | 8.250%, 2/28/2019 | | | 2,385,250 | |
| | | | | |
| | | | Total | | | 2,385,250 | |
| | | | | |
| |
| Technology (0.5%) | | | | |
| | | | First Data Corporation Extended, Term Loan | | | | |
| | 3,809,215 | | | 4.211%, 3/26/2018 | | | 3,628,277 | |
| | | | | |
| | | | Total | | | 3,628,277 | |
| | | | | |
| | | | | | | | |
| | | | | |
| | | | Total Bank Loans (cost $10,911,521) | | | 11,149,407 | |
| | | | | |
| | |
Principal
Amount | | | Long-Term Fixed Income (92.5%) | | Value | |
| Asset-Backed Securities (0.3%) | | | | |
| | | | Renaissance Home Equity Loan Trust | | | | |
| | 2,251,417 | | | 5.746%, 5/25/2036 | | | 1,430,443 | |
| | 1,600,000 | | | 6.011%, 5/25/2036 | | | 941,515 | |
| | | | | |
| | | | Total | | | 2,371,958 | |
| | | | | |
| |
| Basic Materials (7.8%) | | | | |
| | | | AbitibiBowater, Inc. | | | | |
| | 3,659,000 | | | 10.250%, 10/15/2018 | | | 4,171,260 | |
| | | | APERAM | | | | |
| | 1,430,000 | | | 7.750%, 4/1/2018b | | | 1,172,600 | |
| | | | Arch Coal, Inc. | | | | |
| | 1,900,000 | | | 7.000%, 6/15/2019c | | | 1,686,250 | |
| | 1,500,000 | | | 7.250%, 10/1/2020c | | | 1,327,500 | |
| | 950,000 | | | 7.250%, 6/15/2021c | | | 838,375 | |
| | | | Consol Energy, Inc. | | | | |
| | 1,700,000 | | | 8.000%, 4/1/2017 | | | 1,797,750 | |
| | 2,430,000 | | | 8.250%, 4/1/2020 | | | 2,575,800 | |
| | | | FMG Resources Property, Ltd. | | | | |
| | 2,370,000 | | | 7.000%, 11/1/2015b,c | | | 2,393,700 | |
| | 1,410,000 | | | 6.000%, 4/1/2017b,c | | | 1,353,600 | |
| | 3,300,000 | | | 6.875%, 2/1/2018b,c | | | 3,192,750 | |
| | 3,860,000 | | | 8.250%, 11/1/2019b,c | | | 3,860,000 | |
| | | | Graphic Packaging International, Inc. | | | | |
| | 700,000 | | | 9.500%, 6/15/2017 | | | 764,750 | |
| | 1,400,000 | | | 7.875%, 10/1/2018 | | | 1,547,000 | |
| | | | Hexion US Finance Corporation/Hexion Nova Scotia Finance ULC | | | | |
| | 2,820,000 | | | 8.875%, 2/1/2018 | | | 2,848,200 | |
| | 2,850,000 | | | 9.000%, 11/15/2020 | | | 2,557,875 | |
| | | | Ineos Finance plc | | | | |
| | 780,000 | | | 7.500%, 5/1/2020b | | | 789,750 | |
| | | | Inmet Mining Corporation | | | | |
| | 3,400,000 | | | 8.750%, 6/1/2020b | | | 3,527,500 | |
| | | | LyondellBasell Industries NV | | | | |
| | 4,710,000 | | | 5.000%, 4/15/2019 | | | 5,098,575 | |
| | 1,400,000 | | | 6.000%, 11/15/2021 | | | 1,618,750 | |
| | | | Midwest Vanadium Pty., Ltd. | | | | |
| | 3,070,000 | | | 11.500%, 2/15/2018b | | | 1,842,000 | |
| | | | NOVA Chemicals Corporation | | | | |
| | 4,890,000 | | | 8.625%, 11/1/2019 | | | 5,537,925 | |
| | | | Novelis, Inc. | | | | |
| | 3,550,000 | | | 8.750%, 12/15/2020 | | | 3,913,875 | |
| | | | Ryerson, Inc. | | | | |
| | 1,900,000 | | | 9.000%, 10/15/2017b | | | 1,938,000 | |
| | 950,000 | | | 11.250%, 10/15/2018b | | | 921,500 | |
| | | | Sappi Papier Holding GmbH | | | | |
| | 1,420,000 | | | 7.750%, 7/15/2017b,c | | | 1,508,750 | |
| | | | Severstal Columbus, LLC | | | | |
| | 1,400,000 | | | 10.250%, 2/15/2018 | | | 1,442,000 | |
| | | | Tembec Industries, Inc. | | | | |
| | 2,820,000 | | | 11.250%, 12/15/2018 | | | 2,982,150 | |
| | | | | |
| | | | Total | | | 63,208,185 | |
| | | | | |
| |
| Capital Goods (7.6%) | | | | |
| | | | BE Aerospace, Inc. | | | | |
| | 3,280,000 | | | 6.875%, 10/1/2020c | | | 3,640,800 | |
| | | | Case New Holland, Inc. | | | | |
| | 2,210,000 | | | 7.875%, 12/1/2017 | | | 2,596,750 | |
| | | | Cemex Finance, LLC | | | | |
| | 470,000 | | | 9.375%, 10/12/2022b | | | 491,150 | |
| | | | Cemex SAB de CV | | | | |
| | 2,370,000 | | | 9.000%, 1/11/2018b,c | | | 2,458,875 | |
| | | | CNH Capital, LLC | | | | |
| | 1,500,000 | | | 3.875%, 11/1/2015b | | | 1,537,500 | |
| | | | Coleman Cable, Inc. | | | | |
| | 1,580,000 | | | 9.000%, 2/15/2018 | | | 1,682,700 | |
| | | | EnergySolutions, Inc. | | | | |
| | 2,350,000 | | | 10.750%, 8/15/2018 | | | 2,179,625 | |
| | | | Liberty Tire Recycling | | | | |
| | 1,870,000 | | | 11.000%, 10/1/2016b | | | 1,851,300 | |
| | | | Manitowoc Company, Inc. | | | | |
| | 4,270,000 | | | 8.500%, 11/1/2020 | | | 4,793,075 | |
| | | | Nortek, Inc. | | | | |
| | 2,840,000 | | | 10.000%, 12/1/2018 | | | 3,148,850 | |
| | 1,000,000 | | | 8.500%, 4/15/2021b | | | 1,070,000 | |
| | 2,860,000 | | | 8.500%, 4/15/2021 | | | 3,074,500 | |
| | | | Owens-Illinois, Inc. | | | | |
| | 3,030,000 | | | 7.800%, 5/15/2018 | | | 3,484,500 | |
| | | | RBS Global, Inc. | | | | |
| | 3,980,000 | | | 8.500%, 5/1/2018 | | | 4,368,050 | |
| | | | Reynolds Group Issuer, Inc. | | | | |
| | 1,420,000 | | | 9.000%, 4/15/2019 | | | 1,437,750 | |
| | 2,340,000 | | | 9.875%, 8/15/2019 | | | 2,451,150 | |
| | 1,900,000 | | | 5.750%, 10/15/2020b | | | 1,919,000 | |
| | 2,370,000 | | | 8.250%, 2/15/2021 | | | 2,328,525 | |
| | | | RSC Equipment Rental, Inc. | | | | |
| | 2,780,000 | | | 8.250%, 2/1/2021 | | | 3,071,900 | |
| | | | Sealed Air Corporation | | | | |
| | 1,450,000 | | | 8.375%, 9/15/2021b | | | 1,595,000 | |
| | | | Silgan Holdings, Inc. | | | | |
| | 3,530,000 | | | 5.000%, 4/1/2020 | | | 3,627,075 | |
| | | | Tekni-Plex, Inc. | | | | |
| | 3,300,000 | | | 9.750%, 6/1/2019b | | | 3,531,000 | |
The accompanying Notes to Financial Statements are an integral part of this schedule.
158
High Yield Fund
Schedule of Investments as of October 31, 2012
| | | | | | | | |
Principal Amount | | | Long-Term Fixed Income (92.5%) | | Value | |
| Capital Goods (7.6%) - continued | | | | |
| | | | UR Financing Escrow Corporation | | | | |
| | $930,000 | | | 7.375%, 5/15/2020b | | | $1,006,725 | |
| | 3,750,000 | | | 7.625%, 4/15/2022b | | | 4,106,250 | |
| | | | | |
| | | | Total | | | 61,452,050 | |
| | | | | |
| |
| Communications Services (20.1%) | | | | |
| | | | AMC Networks, Inc. | | | | |
| | 4,690,000 | | | 7.750%, 7/15/2021 | | | 5,311,425 | |
| | | | Cablevision Systems Corporation | | | | |
| | 3,740,000 | | | 8.625%, 9/15/2017 | | | 4,366,450 | |
| | | | CCO Holdings, LLC | | | | |
| | 3,750,000 | | | 7.250%, 10/30/2017 | | | 4,096,875 | |
| | 1,890,000 | | | 7.000%, 1/15/2019 | | | 2,031,750 | |
| | 700,000 | | | 7.375%, 6/1/2020 | | | 784,000 | |
| | | | Cequel Communications Escrow 1, LLC | | | | |
| | 2,370,000 | | | 6.375%, 9/15/2020b | | | 2,399,625 | |
| | | | Clear Channel Worldwide Holdings, Inc. | | | | |
| | 7,140,000 | | | 9.250%, 12/15/2017 | | | 7,657,650 | |
| | | | Crown Castle International Corporation | | | | |
| | 5,690,000 | | | 5.250%, 1/15/2023b | | | 5,889,150 | |
| | | | Digicel, Ltd. | | | | |
| | 3,790,000 | | | 8.250%, 9/1/2017b | | | 4,074,250 | |
| | 1,470,000 | | | 7.000%, 2/15/2020b | | | 1,543,500 | |
| | | | Dish DBS Corporation | | | | |
| | 2,220,000 | | | 5.875%, 7/15/2022 | | | 2,331,000 | |
| | | | Eileme 2 AB | | | | |
| | 3,740,000 | | | 11.625%, 1/31/2020b | | | 4,202,825 | |
| | | | Frontier Communications Corporation | | | | |
| | 2,810,000 | | | 8.250%, 4/15/2017c | | | 3,238,525 | |
| | | | Hughes Satellite Systems Corporation | | | | |
| | 4,400,000 | | | 6.500%, 6/15/2019 | | | 4,708,000 | |
| | | | Intelsat Bermuda, Ltd. | | | | |
| | 6,460,000 | | | 11.250%, 2/4/2017 | | | 6,783,000 | |
| | | | Intelsat Jackson Holdings SA | | | | |
| | 710,000 | | | 7.250%, 10/15/2020b | | | 752,600 | |
| | 6,320,000 | | | 7.250%, 10/15/2020 | | | 6,715,000 | |
| | 1,420,000 | | | 6.625%, 12/15/2022b,c | | | 1,409,350 | |
| | | | Intelsat Luxembourg SA | | | | |
| | 3,228,461 | | | 11.500%, 2/4/2017 | | | 3,397,955 | |
| | | | Lamar Media Corporation | | | | |
| | 4,950,000 | | | 5.000%, 5/1/2023b | | | 4,950,000 | |
| | | | Leap Wireless International, Inc., Convertible | | | | |
| | 3,615,000 | | | 4.500%, 7/15/2014c | | | 3,486,216 | |
| | | | Level 3 Financing, Inc. | | | | |
| | 1,880,000 | | | 8.125%, 7/1/2019 | | | 2,006,900 | |
| | 3,700,000 | | | 8.625%, 7/15/2020 | | | 4,033,000 | |
| | | | Satmex Escrow SA de CV | | | | |
| | 4,770,000 | | | 9.500%, 5/15/2017 | | | 5,056,200 | |
| | | | SBA Telecommunications, Inc. | | | | |
| | 1,540,000 | | | 5.750%, 7/15/2020b | | | 1,601,600 | |
| | | | Sprint Capital Corporation | | | | |
| | 2,370,000 | | | 6.875%, 11/15/2028 | | | 2,423,325 | |
| | | | Sprint Nextel Corporation | | | | |
| | 6,100,000 | | | 9.125%, 3/1/2017 | | | 7,167,500 | |
| | 7,620,000 | | | 9.000%, 11/15/2018b | | | 9,410,700 | |
| | 2,530,000 | | | 7.000%, 3/1/2020b | | | 2,934,800 | |
| | 2,370,000 | | | 7.000%, 8/15/2020 | | | 2,601,075 | |
| | | | Telesat Canada | | | | |
| | 5,210,000 | | | 6.000%, 5/15/2017b | | | 5,431,425 | |
| | | | TW Telecom Holdings, Inc. | | | | |
| | 710,000 | | | 5.375%, 10/1/2022b | | | 729,525 | |
| | | | Univision Communications, Inc. | | | | |
| | 5,500,000 | | | 6.750%, 9/15/2022b | | | 5,500,000 | |
| | | | UPC Holding BV | | | | |
| | 4,000,000 | | | 9.875%, 4/15/2018b | | | 4,490,000 | |
| | | | UPCB Finance V, Ltd. | | | | |
| | 1,400,000 | | | 7.250%, 11/15/2021b | | | 1,540,000 | |
| | | | Videotron Ltee | | | | |
| | 1,090,000 | | | 5.000%, 7/15/2022 | | | 1,128,150 | |
| | | | Virgin Media Finance plc | | | | |
| | 1,560,000 | | | 8.375%, 10/15/2019 | | | 1,794,000 | |
| | 3,400,000 | | | 4.875%, 2/15/2022 | | | 3,434,000 | |
| | 2,470,000 | | | 5.250%, 2/15/2022 | | | 2,581,150 | |
| | | | WideOpenWest Finance, LLC | | | | |
| | 5,680,000 | | | 10.250%, 7/15/2019b | | | 5,978,200 | |
| | | | Wind Acquisition Finance SA | | | | |
| | 4,740,000 | | | 11.750%, 7/15/2017b | | | 4,621,500 | |
| | | | XM Satellite Radio, Inc. | | | | |
| | 3,320,000 | | | 7.625%, 11/1/2018b | | | 3,668,600 | |
| | | | Zayo Group, LLC | | | | |
| | 3,075,000 | | | 8.125%, 1/1/2020 | | | 3,367,125 | |
| | | | | |
| | | | Total | | | 161,627,921 | |
| | | | | |
| |
| Consumer Cyclical (13.6%) | | | | |
| | | | Algeco Scotsman Global Finance plc | | | | |
| | 3,320,000 | | | 8.500%, 10/15/2018b | | | 3,419,600 | |
| | | | American Axle & Manufacturing, Inc. | | | | |
| | 2,800,000 | | | 7.875%, 3/1/2017c | | | 2,901,500 | |
| | | | Beazer Homes USA, Inc. | | | | |
| | 2,800,000 | | | 6.875%, 7/15/2015 | | | 2,814,000 | |
| | 2,370,000 | | | 9.125%, 5/15/2019 | | | 2,488,500 | |
| | | | Boyd Gaming Corporation | | | | |
| | 1,980,000 | | | 9.000%, 7/1/2020b | | | 1,984,950 | |
| | | | Burlington Coat Factory Warehouse Corporation | | | | |
| | 3,350,000 | | | 10.000%, 2/15/2019 | | | 3,697,562 | |
| | | | Choice Hotels International, Inc. | | | | |
| | 1,880,000 | | | 5.750%, 7/1/2022 | | | 2,058,600 | |
| | | | Chrysler Group, LLC | | | | |
| | 2,230,000 | | | 8.000%, 6/15/2019c | | | 2,372,162 | |
| | 2,400,000 | | | 8.250%, 6/15/2021c | | | 2,565,000 | |
| | | | DineEquity, Inc. | | | | |
| | 3,800,000 | | | 9.500%, 10/30/2018 | | | 4,279,750 | |
| | | | Eldorado Resorts, LLC | | | | |
| | 4,330,000 | | | 8.625%, 6/15/2019c,d | | | 4,200,100 | |
| | | | General Motors Financial Company, Inc. | | | | |
| | 2,600,000 | | | 4.750%, 8/15/2017b | | | 2,661,877 | |
| | 1,190,000 | | | 6.750%, 6/1/2018 | | | 1,319,295 | |
| | | | Host Hotels and Resorts, Inc. | | | | |
| | 3,290,000 | | | 5.250%, 3/15/2022c | | | 3,635,450 | |
| | | | KB Home | | | | |
| | 930,000 | | | 7.250%, 6/15/2018 | | | 1,018,350 | |
| | 1,750,000 | | | 8.000%, 3/15/2020c | | | 1,955,625 | |
| | 1,420,000 | | | 7.500%, 9/15/2022 | | | 1,542,475 | |
| | | | Lear Corporation | | | | |
| | 1,755,000 | | | 7.875%, 3/15/2018 | | | 1,906,369 | |
The accompanying Notes to Financial Statements are an integral part of this schedule.
159
High Yield Fund
Schedule of Investments as of October 31, 2012
| | | | | | | | |
Principal
Amount | | | Long-Term Fixed Income (92.5%) | | Value | |
| Consumer Cyclical (13.6%) - continued | | | | |
| | $1,755,000 | | | 8.125%, 3/15/2020 | | | $1,950,244 | |
| | | | Limited Brands, Inc. | | | | |
| | 1,430,000 | | | 6.625%, 4/1/2021 | | | 1,635,563 | |
| | 1,640,000 | | | 5.625%, 2/15/2022 | | | 1,769,150 | |
| | | | MGM Resorts International | | | | |
| | 4,693,000 | | | 10.000%, 11/1/2016 | | | 5,350,020 | |
| | | | Mohegan Tribal Gaming Authority | | | | |
| | 4,280,000 | | | 10.500%, 12/15/2016b | | | 4,033,900 | |
| | | | NCL Corporation, Ltd. | | | | |
| | 1,830,000 | | | 11.750%, 11/15/2016 | | | 2,095,350 | |
| | 4,970,000 | | | 9.500%, 11/15/2018 | | | 5,491,850 | |
| | | | Peninsula Gaming, LLC | | | | |
| | 4,450,000 | | | 10.750%, 8/15/2017 | | | 5,011,812 | |
| | | | Realogy Corporation | | | | |
| | 2,645,000 | | | 11.500%, 4/15/2017 | | | 2,856,600 | |
| | | | ROC Finance, LLC | | | | |
| | 4,220,000 | | | 12.125%, 9/1/2018b | | | 4,874,100 | |
| | | | Ryman Hospitality Properties, Inc. | | | | |
| | 4,390,000 | | | 6.750%, 11/15/2014c | | | 4,390,000 | |
| | | | Scientific Games International, Inc. | | | | |
| | 1,900,000 | | | 6.250%, 9/1/2020b | | | 1,930,875 | |
| | | | Seminole Indian Tribe of Florida | | | | |
| | 4,170,000 | | | 7.804%, 10/1/2020b | | | 4,268,412 | |
| | | | Seven Seas Cruises S de RL, LLC | | | | |
| | 4,730,000 | | | 9.125%, 5/15/2019b | | | 4,913,288 | |
| | | | Toys R Us, Inc. | | | | |
| | 1,420,000 | | | 10.375%, 8/15/2017b | | | 1,451,950 | |
| | | | Tunica-Biloxi Gaming Authority | | | | |
| | 4,230,000 | | | 9.000%, 11/15/2015d | | | 3,807,000 | |
| | | | West Corporation | | | | |
| | 4,350,000 | | | 8.625%, 10/1/2018 | | | 4,534,875 | |
| | 2,140,000 | | | 7.875%, 1/15/2019 | | | 2,182,800 | |
| | | | | |
| | | | Total | | | 109,368,954 | |
| | | | | |
| |
| Consumer Non-Cyclical (12.2%) | | | | |
| | | | Biomet, Inc. | | | | |
| | 6,650,000 | | | 6.500%, 10/1/2020b | | | 6,467,125 | |
| | | | CDRT Holding Corporation | | | | |
| | 2,370,000 | | | 9.250%, 10/1/2017b | | | 2,275,200 | |
| | | | Community Health Systems, Inc. | | | | |
| | 1,890,000 | | | 5.125%, 8/15/2018c | | | 1,960,875 | |
| | 3,060,000 | | | 8.000%, 11/15/2019 | | | 3,300,975 | |
| | | | DaVita HealthCare Partners, Inc. | | | | |
| | 2,370,000 | | | 5.750%, 8/15/2022 | | | 2,476,650 | |
| | | | Del Monte Corporation | | | | |
| | 1,275,000 | | | 7.625%, 2/15/2019 | | | 1,310,063 | |
| | | | DJO Finance, LLC | | | | |
| | 1,400,000 | | | 9.750%, 10/15/2017 | | | 1,176,000 | |
| | 3,250,000 | | | 8.750%, 3/15/2018b | | | 3,469,375 | |
| | | | Elan Finance plc | | | | |
| | 2,370,000 | | | 6.250%, 10/15/2019b | | | 2,393,700 | |
| | | | Emergency Medical Services Corporation | | | | |
| | 4,630,000 | | | 8.125%, 6/1/2019 | | | 4,907,800 | |
| | | | Fresenius Medical Care US Finance, Inc. | | | | |
| | 2,340,000 | | | 6.500%, 9/15/2018b | | | 2,620,800 | |
| | | | Grifols, Inc. | | | | |
| | 3,620,000 | | | 8.250%, 2/1/2018 | | | 4,018,200 | |
| | | | HCA, Inc. | | | | |
| | 4,570,000 | | | 7.500%, 2/15/2022 | | | 5,106,975 | |
| | 5,140,000 | | | 4.750%, 5/1/2023 | | | 5,140,000 | |
| | | | HealthSouth Corporation | | | | |
| | 3,560,000 | | | 5.750%, 11/1/2024 | | | 3,595,600 | |
| | | | Ingles Markets, Inc. | | | | |
| | 1,400,000 | | | 8.875%, 5/15/2017 | | | 1,506,750 | |
| | | | JBS Finance II, Ltd. | | | | |
| | 4,450,000 | | | 8.250%, 1/29/2018c,d | | | 4,639,125 | |
| | | | JBS USA, LLC/JBS USA Finance, Inc. | | | | |
| | 2,850,000 | | | 11.625%, 5/1/2014 | | | 3,192,000 | |
| | | | Libbey Glass, Inc. | | | | |
| | 3,310,000 | | | 6.875%, 5/15/2020b | | | 3,525,150 | |
| | | | Michael Foods, Inc. | | | | |
| | 3,760,000 | | | 9.750%, 7/15/2018 | | | 4,183,000 | |
| | | | Mylan, Inc. | | | | |
| | 2,790,000 | | | 7.875%, 7/15/2020b | | | 3,149,212 | |
| | | | Revlon Consumer Products Corporation | | | | |
| | 3,270,000 | | | 9.750%, 11/15/2015 | | | 3,445,762 | |
| | | | Rite Aid Corporation | | | | |
| | 2,530,000 | | | 7.500%, 3/1/2017 | | | 2,599,575 | |
| | 1,790,000 | | | 9.500%, 6/15/2017 | | | 1,839,225 | |
| | | | Spectrum Brands Holdings, Inc. | | | | |
| | 820,000 | | | 9.500%, 6/15/2018b | | | 920,450 | |
| | 3,300,000 | | | 9.500%, 6/15/2018 | | | 3,704,250 | |
| | | | Teleflex, Inc. | | | | |
| | 3,790,000 | | | 6.875%, 6/1/2019 | | | 4,074,250 | |
| | | | Vanguard Health Holding Company II, LLC | | | | |
| | 700,000 | | | 7.750%, 2/1/2019b | | | 726,250 | |
| | 2,145,000 | | | 7.750%, 2/1/2019c | | | 2,225,438 | |
| | | | Visant Corporation | | | | |
| | 4,360,000 | | | 10.000%, 10/1/2017c | | | 4,212,850 | |
| | | | Warner Chilcott Company, LLC | | | | |
| | 3,890,000 | | | 7.750%, 9/15/2018 | | | 4,103,950 | |
| | | | | |
| | | | Total | | | 98,266,575 | |
| | | | | |
| |
| Energy (10.9%) | | | | |
| | | | Chaparral Energy, Inc. | | | | |
| | 2,350,000 | | | 7.625%, 11/15/2022b | | | 2,485,125 | |
| | | | Coffeyville Resources, LLC | | | | |
| | 3,900,000 | | | 10.875%, 4/1/2017b,c | | | 4,309,500 | |
| | | | Concho Resources, Inc. | | | | |
| | 4,760,000 | | | 6.500%, 1/15/2022 | | | 5,224,100 | |
| | | | Continental Resources, Inc. | | | | |
| | 950,000 | | | 5.000%, 9/15/2022b | | | 1,002,250 | |
| | 2,340,000 | | | 5.000%, 9/15/2022 | | | 2,462,850 | |
| | | | Denbury Resources, Inc. | | | | |
| | 700,000 | | | 9.750%, 3/1/2016 | | | 747,250 | |
| | 369,000 | | | 8.250%, 2/15/2020 | | | 417,893 | |
| | 1,540,000 | | | 6.375%, 8/15/2021 | | | 1,686,300 | |
| | | | Drill Rigs Holdings, Inc. | | | | |
| | 1,190,000 | | | 6.500%, 10/1/2017b | | | 1,184,050 | |
| | | | Energy XXI Gulf Coast, Inc. | | | | |
| | 1,890,000 | | | 9.250%, 12/15/2017 | | | 2,130,975 | |
| | 1,420,000 | | | 7.750%, 6/15/2019 | | | 1,540,700 | |
| | | | Halcon Resources Corporation | | | | |
| | 4,750,000 | | | 8.875%, 5/15/2021b,e | | | 4,815,312 | |
| | | | Harvest Operations Corporation | | | | |
| | 4,710,000 | | | 6.875%, 10/1/2017 | | | 5,157,450 | |
The accompanying Notes to Financial Statements are an integral part of this schedule.
160
High Yield Fund
Schedule of Investments as of October 31, 2012
| | | | | | | | |
Principal
Amount | | | Long-Term Fixed Income (92.5%) | | Value | |
| Energy (10.9%) - continued | | | | |
| | | | Helix Energy Solutions Group, Inc. | | | | |
| | $2,026,000 | | | 9.500%, 1/15/2016b | | | $2,094,378 | |
| | | | Helix Energy Solutions Group, Inc., Convertible | | | | |
| | 950,000 | | | 3.250%, 3/15/2032c | | | 1,047,375 | |
| | | | Key Energy Services, Inc. | | | | |
| | 1,410,000 | | | 6.750%, 3/1/2021b | | | 1,395,900 | |
| | | | Linn Energy, LLC | | | | |
| | 2,250,000 | | | 8.625%, 4/15/2020 | | | 2,460,937 | |
| | 1,930,000 | | | 7.750%, 2/1/2021 | | | 2,060,275 | |
| | | | Markwest Energy Partners, LP/Markwest Energy Finance Corporation | | | | |
| | 2,340,000 | | | 6.250%, 6/15/2022 | | | 2,533,050 | |
| | | | McJunkin Red Man Corporation | | | | |
| | 2,770,000 | | | 9.500%, 12/15/2016 | | | 2,994,370 | |
| | | | MEG Energy Corporation | | | | |
| | 2,840,000 | | | 6.375%, 1/30/2023b | | | 3,038,800 | |
| | | | Newfield Exploration Company | | | | |
| | 2,840,000 | | | 5.750%, 1/30/2022 | | | 3,067,200 | |
| | | | Oasis Petroleum, Inc. | | | | |
| | 2,430,000 | | | 7.250%, 2/1/2019 | | | 2,600,100 | |
| | 1,410,000 | | | 6.500%, 11/1/2021 | | | 1,491,075 | |
| | | | Plains Exploration & Production Company | | | | |
| | 2,500,000 | | | 6.125%, 6/15/2019 | | | 2,493,750 | |
| | 1,500,000 | | | 6.750%, 2/1/2022 | | | 1,507,500 | |
| | | | Precision Drilling Corporation | | | | |
| | 2,200,000 | | | 6.625%, 11/15/2020 | | | 2,354,000 | |
| | 940,000 | | | 6.500%, 12/15/2021 | | | 994,050 | |
| | | | QEP Resources, Inc. | | | | |
| | 3,230,000 | | | 6.875%, 3/1/2021 | | | 3,682,200 | |
| | | | SandRidge Energy, Inc. | | | | |
| | 3,320,000 | | | 8.000%, 6/1/2018b | | | 3,486,000 | |
| | 1,420,000 | | | 7.500%, 2/15/2023b | | | 1,469,700 | |
| | | | Seadrill, Ltd. | | | | |
| | 1,420,000 | | | 5.625%, 9/15/2017b | | | 1,420,000 | |
| | | | SESI, LLC | | | | |
| | 1,550,000 | | | 6.375%, 5/1/2019 | | | 1,658,500 | |
| | 2,800,000 | | | 7.125%, 12/15/2021 | | | 3,122,000 | |
| | | | Swift Energy Company | | | | |
| | 2,840,000 | | | 7.875%, 3/1/2022b | | | 2,953,600 | |
| | | | United Refining Company | | | | |
| | 4,290,000 | | | 10.500%, 2/28/2018 | | | 4,686,825 | |
| | | | | |
| | | | Total | | | 87,775,340 | |
| | | | | |
| |
| Financials (7.8%) | | | | |
| | | | Ally Financial, Inc. | | | | |
| | 1,920,000 | | | 7.500%, 12/31/2013 | | | 2,037,600 | |
| | 1,590,000 | | | 5.500%, 2/15/2017 | | | 1,682,497 | |
| | 2,350,000 | | | 8.000%, 3/15/2020 | | | 2,802,610 | |
| | 4,910,000 | | | 7.500%, 9/15/2020 | | | 5,787,662 | |
| | | | Aviv Healthcare Properties, LP | | | | |
| | 4,730,000 | | | 7.750%, 2/15/2019 | | | 4,984,237 | |
| | | | CIT Group, Inc. | | | | |
| | 2,630,000 | | | 5.250%, 4/1/2014b | | | 2,728,625 | |
| | 2,140,000 | | | 5.000%, 5/15/2017 | | | 2,255,132 | |
| | | | Community Choice Financial, Inc. | | | | |
| | 2,380,000 | | | 10.750%, 5/1/2019 | | | 2,314,550 | |
| | | | Developers Diversified Realty Corporation | | | | |
| | 2,810,000 | | | 7.875%, 9/1/2020 | | | 3,654,543 | |
| | 720,000 | | | 4.625%, 7/15/2022 | | | 797,714 | |
| | | | Eksportfinans ASA | | | | |
| | 2,330,000 | | | 2.375%, 5/25/2016 | | | 2,196,025 | |
| | | | Harbinger Group, Inc. | | | | |
| | 2,610,000 | | | 10.625%, 11/15/2015c | | | 2,818,800 | |
| | | | Icahn Enterprises, LP | | | | |
| | 4,270,000 | | | 7.750%, 1/15/2016 | | | 4,462,150 | |
| | 5,220,000 | | | 8.000%, 1/15/2018 | | | 5,611,500 | |
| | 1,420,000 | | | 8.000%, 1/15/2018b | | | 1,526,500 | |
| | | | International Lease Finance Corporation | | | | |
| | 2,250,000 | | | 8.625%, 9/15/2015 | | | 2,533,500 | |
| | 2,050,000 | | | 8.750%, 3/15/2017 | | | 2,393,683 | |
| | 1,400,000 | | | 8.875%, 9/1/2017 | | | 1,648,500 | |
| | 1,650,000 | | | 5.875%, 4/1/2019 | | | 1,748,041 | |
| | | | Omega Healthcare Investors, Inc. | | | | |
| | 6,100,000 | | | 5.875%, 3/15/2024 | | | 6,496,500 | |
| | | | Speedy Cash, Inc. | | | | |
| | 2,250,000 | | | 10.750%, 5/15/2018b | | | 2,390,625 | |
| | | | | |
| | | | Total | | | 62,870,994 | |
| | | | | |
| |
| Technology (4.2%) | | | | |
| | | | Alliance Data Systems Corporation | | | | |
| | 3,535,000 | | | 6.375%, 4/1/2020b | | | 3,751,519 | |
| | | | Amkor Technology, Inc. | | | | |
| | 3,280,000 | | | 6.625%, 6/1/2021c | | | 3,124,200 | |
| | | | Equinix, Inc. | | | | |
| | 3,330,000 | | | 8.125%, 3/1/2018 | | | 3,663,000 | |
| | 950,000 | | | 7.000%, 7/15/2021 | | | 1,054,500 | |
| | | | First Data Corporation | | | | |
| | 3,320,000 | | | 11.250%, 3/31/2016c | | | 3,245,300 | |
| | 1,000,000 | | | 7.375%, 6/15/2019b | | | 1,035,000 | |
| | 1,629,000 | | | 12.625%, 1/15/2021 | | | 1,681,942 | |
| | | | Freescale Semiconductor, Inc. | | | | |
| | 1,890,000 | | | 8.050%, 2/1/2020c | | | 1,767,150 | |
| | 2,089,000 | | | 10.750%, 8/1/2020 | | | 2,193,450 | |
| | | | Infor US, Inc. | | | | |
| | 2,910,000 | | | 9.375%, 4/1/2019 | | | 3,215,550 | |
| | | | Jabil Circuit, Inc. | | | | |
| | 1,420,000 | | | 4.700%, 9/15/2022 | | | 1,420,000 | |
| | | | NXP BV/NXP Funding, LLC | | | | |
| | 2,340,000 | | | 9.750%, 8/1/2018b | | | 2,731,950 | |
| | | | Seagate HDD Cayman | | | | |
| | 2,860,000 | | | 7.750%, 12/15/2018 | | | 3,103,100 | |
| | | | Sensata Technologies BV | | | | |
| | 1,900,000 | | | 6.500%, 5/15/2019b,c | | | 2,004,500 | |
| | | | | |
| | | | Total | | | 33,991,161 | |
| | | | | |
| |
| Transportation (3.0%) | | | | |
| | | | American Petroleum Tankers, LLC | | | | |
| | 1,059,000 | | | 10.250%, 5/1/2015 | | | 1,106,655 | |
| | | | Avis Budget Car Rental, LLC | | | | |
| | 4,670,000 | | | 8.250%, 1/15/2019 | | | 5,096,137 | |
| | | | Bristow Group, Inc. | | | | |
| | 1,430,000 | | | 6.250%, 10/15/2022 | | | 1,496,137 | |
| | | | CMA CGM SA | | | | |
| | 4,290,000 | | | 8.500%, 4/15/2017b,c | | | 3,228,225 | |
| | | | Continental Airlines, Inc. | | | | |
| | 2,750,000 | | | 6.750%, 9/15/2015b | | | 2,877,187 | |
The accompanying Notes to Financial Statements are an integral part of this schedule.
161
High Yield Fund
Schedule of Investments as of October 31, 2012
| | | | | | | | |
Principal
Amount | | | Long-Term Fixed Income (92.5%) | | Value | |
| Transportation (3.0%) - continued | | | | |
| | $470,000 | | | 6.250%, 4/11/2020 | | | $499,963 | |
| | | | HDTFS, Inc. | | | | |
| | 710,000 | | | 6.250%, 10/15/2022b | | | 719,763 | |
| | | | Navios Maritime Acquisition Corporation | | | | |
| | 1,430,000 | | | 8.625%, 11/1/2017 | | | 1,347,775 | |
| | | | Navios Maritime Holdings, Inc. | | | | |
| | 2,590,000 | | | 8.875%, 11/1/2017 | | | 2,654,750 | |
| | 2,030,000 | | | 8.125%, 2/15/2019 | | | 1,796,550 | |
| | | | Navios South American Logistics, Inc./Navios Logistics Finance US, Inc. | | | | |
| | 1,240,000 | | | 9.250%, 4/15/2019 | | | 1,174,900 | |
| | | | United Air Lines, Inc. | | | | |
| | 1,514,932 | | | 9.750%, 1/15/2017 | | | 1,739,142 | |
| | | | | |
| | | | Total | | | 23,737,184 | |
| | | | | |
| |
| Utilities (5.0%) | | | | |
| | | | AES Corporation | | | | |
| | 5,350,000 | | | 7.375%, 7/1/2021 | | | 5,978,625 | |
| | | | Atlas Pipeline Partners, LP | | | | |
| | 1,330,000 | | | 6.625%, 10/1/2020b | | | 1,376,550 | |
| | | | Chesapeake Midstream Partners, LP | | | | |
| | 810,000 | | | 6.125%, 7/15/2022 | | | 856,575 | |
| | | | Covanta Holding Corporation | | | | |
| | 2,400,000 | | | 7.250%, 12/1/2020 | | | 2,664,212 | |
| | 1,650,000 | | | 6.375%, 10/1/2022 | | | 1,795,652 | |
| | | | Crosstex Energy, LP/Crosstex Energy Finance Corporation | | | | |
| | 3,270,000 | | | 8.875%, 2/15/2018 | | | 3,507,075 | |
| | 940,000 | | | 7.125%, 6/1/2022b | | | 944,700 | |
| | | | Energy Future Intermediate Holding Company, LLC | | | | |
| | 5,640,000 | | | 11.750%, 3/1/2022b | | | 5,513,100 | |
| | | | Holly Energy Partners, LP | | | | |
| | 1,870,000 | | | 8.250%, 3/15/2018 | | | 2,019,600 | |
| | 820,000 | | | 6.500%, 3/1/2020b | | | 861,000 | |
| | | | NRG Energy, Inc. | | | | |
| | 4,740,000 | | | 6.625%, 3/15/2023b | | | 4,882,200 | |
| | | | Regency Energy Partners, LP | | | | |
| | 3,330,000 | | | 6.875%, 12/1/2018 | | | 3,579,750 | |
| | 760,000 | | | 5.500%, 4/15/2023 | | | 790,400 | |
| | | | Targa Resources Partners, LP | | | | |
| | 2,090,000 | | | 7.875%, 10/15/2018 | | | 2,288,550 | |
| | 2,140,000 | | | 5.250%, 5/1/2023b | | | 2,161,400 | |
| | | | Tesoro Logistics, LP | | | | |
| | 880,000 | | | 5.875%, 10/1/2020b | | | 910,800 | |
| | | | | |
| | | | Total | | | 40,130,189 | |
| | | | | |
| | | | | | | | |
| | | | | |
| | | | Total Long-Term Fixed Income (cost $706,102,925) | | | 744,800,511 | |
| | | | | |
| | |
| Shares | | | Preferred Stock (0.5%) | | Value | |
| Financials (0.5%) | | | | |
| | 3,014 | | | Ally Financial, Inc., 7.000%b,f | | | 2,904,366 | |
| | 57,310 | | | Ally Financial, Inc., 8.500%f | | | 1,435,615 | |
| | | | | |
| | | | Total | | | 4,339,981 | |
| | | | | |
| | | | | | | | |
| | | | | |
| | | | Total Preferred Stock (cost $3,466,907) | | | 4,339,981 | |
| | | | | |
| | |
| Shares | | | Common Stock (<0.1%) | | Value | |
| Consumer Discretionary (<0.1%) | | | | |
| | 36,330 | | | TVMAX Holdings, Inc.g,h | | | $4 | |
| | | | | |
| | | | Total | | | 4 | |
| | | | | |
| | | | | | | | |
| | | | | |
| | | | Total Common Stock (cost $2,245,000) | | | 4 | |
| | | | | |
| | |
| Shares | | | Collateral Held for Securities Loaned (8.0%) | | Value | |
| | 64,588,487 | | | Thrivent Financial Securities Lending Trust | | | 64,588,487 | |
| | | | | |
| | | | Total Collateral Held for Securities Loaned (cost $64,588,487) | | | 64,588,487 | |
| | | | | |
| | |
Shares or
Principal
Amount | | | Short-Term Investments (4.5%) | | Value | |
| | 31,101,499 | | | Thrivent Financial Securities Lending Trust | | | 31,101,499 | |
| | | | U.S. Treasury Bills | | | | |
| | 5,000,000 | | | 0.115%, 11/8/2012i | | | 4,999,888 | |
| | | | | |
| | | | Total Short-Term Investments (at amortized cost) | | | 36,101,387 | |
| | | | | |
| | | | Total Investments (cost $823,416,227) 106.9% | | $ | 860,979,777 | |
| | | | | |
| | | | Other Assets and Liabilities, Net (6.9%) | | | (55,240,444 | ) |
| | | | | |
| | | | Total Net Assets 100.0% | | $ | 805,739,333 | |
| | | | | |
a | The stated interest rate represents the weighted average of all contracts within the bank loan facility. |
b | Denotes securities sold under Rule 144A of the Securities Act of 1933, which exempts them from registration. These securities have been deemed liquid and may be resold to other dealers in the program or to other qualified institutional buyers. As of October 31, 2012, the value of these investments was $240,483,439 or 29.8% of total net assets. |
c | All or a portion of the security is on loan. |
d | Denotes restricted securities. Restricted securities are investment securities which have been deemed illiquid and cannot be offered for public sale without first being registered under the Securities Act of 1933. The following table indicates the acquisition date and cost of restricted securities High Yield Fund owned as of October 31, 2012. |
| | | | | | | | |
Security | | Acquisition Date | | | Cost | |
Eldorado Resorts, LLC | | | 5/19/2011 | | | $ | 4,241,891 | |
JBS Finance II, Ltd. | | | 7/22/2010 | | | | 4,389,213 | |
Tunica-Biloxi Gaming Authority | | | 11/8/2005 | | | | 4,215,563 | |
e | Denotes investments purchased on a when-issued or delayed delivery basis. |
f | Denotes perpetual securities. Perpetual securities pay an indefinite stream of interest, but may be called by the issuer at an earlier date. |
g | Security is fair valued. |
h | Non-income producing security. |
The accompanying Notes to Financial Statements are an integral part of this schedule.
162
High Yield Fund
Schedule of Investments as of October 31, 2012
i | The interest rate shown reflects the yield, coupon rate or the discount rate at the date of purchase. |
Unrealized Appreciation (Depreciation)
Gross unrealized appreciation and depreciation of investments, based on cost for federal income tax purposes, were as follows:
| | | | |
Gross unrealized appreciation | | | $45,942,177 | |
Gross unrealized depreciation | | | (8,498,678 | ) |
| | | | |
Net unrealized appreciation (depreciation) | | | $37,443,499 | |
| |
Cost for federal income tax purposes | | | $823,536,278 | |
Fair Valuation Measurements
The following table is a summary of the inputs used, as of October 31, 2012, in valuing High Yield Fund’s assets carried at fair value.
| | | | | | | | | | | | | | | | |
Investments in Securities | | Total | | | Level 1 | | | Level 2 | | | Level 3 | |
| | | | |
Bank Loans | | | | | | | | | | | | | | | | |
Consumer Non-Cyclical | | | 4,272,376 | | | | – | | | | 4,272,376 | | | | – | |
Energy | | | 863,504 | | | | – | | | | 863,504 | | | | – | |
Financials | | | 2,385,250 | | | | – | | | | 2,385,250 | | | | – | |
Technology | | | 3,628,277 | | | | – | | | | 3,628,277 | | | | – | |
| | | | |
Long-Term Fixed Income | | | | | | | | | | | | | | | | |
Asset-Backed Securities | | | 2,371,958 | | | | – | | | | 2,371,958 | | | | – | |
Basic Materials | | | 63,208,185 | | | | – | | | | 63,208,185 | | | | – | |
Capital Goods | | | 61,452,050 | | | | – | | | | 61,452,050 | | | | – | |
Communications Services | | | 161,627,921 | | | | – | | | | 161,627,921 | | | | – | |
Consumer Cyclical | | | 109,368,954 | | | | – | | | | 109,368,954 | | | | – | |
Consumer Non-Cyclical | | | 98,266,575 | | | | – | | | | 98,266,575 | | | | – | |
Energy | | | 87,775,340 | | | | – | | | | 87,775,340 | | | | – | |
Financials | | | 62,870,994 | | | | – | | | | 62,870,994 | | | | – | |
Technology | | | 33,991,161 | | | | – | | | | 33,991,161 | | | | – | |
Transportation | | | 23,737,184 | | | | – | | | | 23,737,184 | | | | – | |
Utilities | | | 40,130,189 | | | | – | | | | 40,130,189 | | | | – | |
| | | | |
Preferred Stock | | | | | | | | | | | | | | | | |
Financials | | | 4,339,981 | | | | 1,435,615 | | | | 2,904,366 | | | | – | |
| | | | |
Common Stock | | | | | | | | | | | | | | | | |
Consumer Discretionary | | | 4 | | | | – | | | | – | | | | 4 | |
Collateral Held for Securities Loaned | | | 64,588,487 | | | | 64,588,487 | | | | – | | | | – | |
Short-Term Investments | | | 36,101,387 | | | | 31,101,499 | | | | 4,999,888 | | | | – | |
| |
Total | | | $860,979,777 | | | | $97,125,601 | | | | $763,854,172 | | | | $4 | |
| |
| | | | |
Other Financial Instruments | | Total | | | Level 1 | | | Level 2 | | | Level 3 | |
| | | | |
Liability Derivatives Credit Default Swaps | | | 290,057 | | | | – | | | | 290,057 | | | | – | |
| |
Total Liability Derivatives | | | $290,057 | | | | $– | | | | $290,057 | | | | $– | |
| |
There were no significant transfers between Levels during the period ended October 31, 2012. Transfers between Levels are identified as of the end of the period.
The accompanying Notes to Financial Statements are an integral part of this schedule.
163
High Yield Fund
Schedule of Investments as of October 31, 2012
| | | | | | | | | | | | | | | | | | | | | | | | |
Credit Default Swaps and
Counterparty | | Buy/Sell Protection1 | | | Termination
Date | | | Notional
Principal
Amount2 | | | Upfront
Payments
Received (Made) | | | Value3 | | | Unrealized
Gain/(Loss) | |
CDX HY, Series 18, 5 Year, at 5.00%; Bank of America | | | Buy | | | | 6/20/2017 | | | | $6,930,000 | | | | ($273,999 | ) | | | ($16,058 | ) | | | ($290,057 | ) |
Total Credit Default Swaps | | | | | | | | | | | | | | | | | | | ($16,058 | ) | | | ($290,057 | ) |
1 | As the buyer of protection, High Yield Fund pays periodic fees in return for payment by the seller which is contingent upon an adverse credit event occurring in the underlying issuer or reference entity. As the seller of protection, High Yield Fund collects periodic fees from the buyer and profits if the credit of the underlying issuer or reference entity remains stable or improves while the swap is outstanding, but the seller in a credit default swap contract would be required to pay the amount of credit loss, determined as specified in the agreement, to the buyer in the event of an adverse credit event in the reference entity. |
2 | The maximum potential amount of future payments High Yield Fund could be required to make as the seller or receive as the buyer of protection. |
3 | The values for credit indexes (CDX or LCDX) serve as an indicator of the current status of the payment/performance risk and represent the liability or profit for the credit default swap contract had the contract been closed as of the reporting date. When protection has been sold, the value of the swap will increase when the swap spread declines representing an improvement in the reference entity’s credit worthiness. The value of the swap will decrease when the swap spread increases representing a deterioration in the reference entity’s credit worthiness. When protection has been purchased, the value of the swap will increase when the swap spread increases representing a deterioration in the reference entity’s credit worthiness. The value of the swap will decrease when the swap spread declines representing an improvement in the reference entity’s credit worthiness. |
The following table summarizes the fair value and Statement of Assets and Liabilities location, as of October 31, 2012, for High Yield Fund’s investments in financial derivative instruments by primary risk exposure as discussed under item (2) Significant Accounting Policies of the Notes to Financial Statements.
| | | | | | |
Derivatives by risk category | | Statement of Assets and Liabilities Location | | Fair Value | |
| | |
Liability Derivatives | | | | | | |
| | |
Credit Contracts | | | | | | |
Credit Default Swaps | | Receivable/Payable - Swap agreements, at value; Net Assets - Net unrealized appreciation/(depreciation) on Swap agreements | | | 290,057 | |
| | |
Total Credit Contracts | | | | | 290,057 | |
| |
| | |
Total Liability Derivatives | | | | | $290,057 | |
| |
The following table summarizes the net realized gains/(losses) and Statement of Operations location, for the period ended October 31, 2012, for High Yield Fund’s investments in financial derivative instruments by primary risk exposure.
| | | | | | |
Derivatives by risk category | | Statement of Operations Location | | Realized Gains/(Losses)
recognized in Income | |
| | |
Interest Rate Contracts | | | | | | |
Futures | | Net realized gains/(losses) on Futures contracts | | | 52,588 | |
| | |
Total Interest Rate Contracts | | | | | 52,588 | |
| | |
Equity Contracts | | | | | | |
Futures | | Net realized gains/(losses) on Futures contracts | | | 246,240 | |
| | |
Total Equity Contracts | | | | | 246,240 | |
| | |
Credit Contracts | | | | | | |
Credit Default Swaps | | Net realized gains/(losses) on Swap agreements | | | (228,955 | ) |
| | |
Total Credit Contracts | | | | | (228,955 | ) |
| |
| | |
Total | | | | | $69,873 | |
| |
The accompanying Notes to Financial Statements are an integral part of this schedule.
164
High Yield Fund
Schedule of Investments as of October 31, 2012
The following table summarizes the change in net unrealized appreciation/(depreciation) and Statement of Operations location, for the period ended October 31, 2012, for High Yield Fund’s investments in financial derivative instruments by primary risk exposure.
| | | | | | |
Derivatives by risk category | | Statement of Operations Location | | Change in unrealized
appreciation/(depreciation)
recognized in Income | |
| | |
Credit Contracts | | | | | | |
Credit Default Swaps | | Change in net unrealized appreciation/(depreciation) on Swap agreements | | | (290,057 | ) |
| | |
Total Credit Contracts | | | | | (290,057 | ) |
| | |
Equity Contracts | | | | | | |
Futures | | Change in net unrealized appreciation/(depreciation) on Futures contracts | | | (25,961 | ) |
Total Equity Contracts | | | | | (25,961 | ) |
| |
| | |
Total | | | | | ($316,018 | ) |
| |
The following table presents High Yield Fund’s average volume of derivative activity during the period ended October 31, 2012.
| | | | | | | | | | |
Derivative Risk Category | | Futures
(Notional*) | | | Futures
(Percentage
of Average
Net Assets) | | Swaps
(Notional*) | | Swaps
(Percentage
of Average
Net Assets) |
Equity Contracts | | | $312,349 | | | <0.1% | | N/A | | N/A |
Interest Rate Contracts | | | 12,194 | | | <0.1% | | N/A | | N/A |
Credit Contracts | | | N/A | | | N/A | | $1,105,251 | | 0.2% |
* | Notional amount represents long or short, or both, derivative positions held by the Fund. |
Investment in Affiliates
Affiliated issuers, as defined under the Investment Company Act of 1940, include those in which the Fund’s holdings of an issuer represent 5% or more of the outstanding voting securities of an issuer, or any affiliated mutual fund.
A summary of transactions for the fiscal year to date, in High Yield Fund, is as follows:
| | | | | | | | | | | | | | | | | | | | | | | | |
Fund | | Value
October 31, 2011 | | | Gross
Purchases | | | Gross Sales | | | Shares Held at
October 31, 2012 | | | Value
October 31, 2012 | | | Income Earned
November 1, 2011 -
October 31, 2012 | |
Securities Lending Trust- Collateral Investment | | | $64,933,950 | | | | $280,203,798 | | | | $280,549,261 | | | | 64,588,487 | | | | $64,588,487 | | | | $263,222 | |
Securities Lending Trust- Short Term
Investment | | | – | | | | 47,846,667 | | | | 16,745,168 | | | | 31,101,499 | | | | 31,101,499 | | | | 2,200 | |
Total Value and Income Earned | | | 64,933,950 | | | | | | | | | | | | | | | | 95,689,986 | | | | 265,422 | |
The accompanying Notes to Financial Statements are an integral part of this schedule.
165
Municipal Bond Fund
Schedule of Investments as of October 31, 2012
| | | | | | | | |
Principal
Amount | | | Long-Term Fixed Income (98.9%) | | Value | |
| Alabama (0.1%) | | | | |
| | | | Alabama Public School and College Authority Capital Improvement Revenue Refunding Bonds | | | | |
| | $1,500,000 | | | 5.000%, 5/1/2029, Series Aa | | | $1,881,420 | |
| | | | | |
| | | | Total | | | 1,881,420 | |
| | | | | |
| |
| Alaska (0.3%) | | | | |
| | | | Valdez, Alaska Marine Terminal Revenue Bonds (Exxon Pipeline Company) | | | | |
| | 790,000 | | | 0.220%, 10/1/2025b | | | 790,000 | |
| | | | Valdez, Alaska Marine Terminal Revenue Bonds (ExxonMobil) | | | | |
| | 3,690,000 | | | 0.220%, 12/1/2029b | | | 3,690,000 | |
| | | | | |
| | | | Total | | | 4,480,000 | |
| | | | | |
| |
| Arizona (0.8%) | | | | |
| | | | Arizona Health Facilities Authority Revenue Bonds (Blood Systems, Inc.) | | | | |
| | 1,000,000 | | | 5.000%, 4/1/2017 | | | 1,051,360 | |
| | 1,200,000 | | | 5.000%, 4/1/2018 | | | 1,261,284 | |
| | | | Arizona Sports and Tourism Authority Revenue Refunding Bonds (Multipurpose Stadium Facility) | | | | |
| | 500,000 | | | 4.000%, 7/1/2017, Series A | | | 556,475 | |
| | | | Arizona Transportation Board Highway Revenue Bonds | | | | |
| | 1,500,000 | | | 5.000%, 7/1/2036, Series A | | | 1,722,210 | |
| | | | Glendale, Arizona Industrial Development Authority Revenue Bonds (Midwestern University) | | | | |
| | 2,500,000 | | | 5.000%, 5/15/2031 | | | 2,737,900 | |
| | 1,000,000 | | | 5.000%, 5/15/2035 | | | 1,069,800 | |
| | | | Phoenix, Arizona Civic Improvement Corporation Airport Revenue Bonds | | | | |
| | 3,025,000 | | | 5.250%, 7/1/2033, Series A | | | 3,431,984 | |
| | | | Phoenix-Mesa Gateway Airport Authority Special Facility Revenue Bonds | | | | |
| | 700,000 | | | 5.000%, 7/1/2038, AMT | | | 736,085 | |
| | | | Yavapai County Industrial Development Authority Hospital Revenue Bonds (Yavapai Regional Medical Center) | | | | |
| | 500,000 | | | 6.000%, 8/1/2033, Series A | | | 517,780 | |
| | | | | |
| | | | Total | | | 13,084,878 | |
| | | | | |
| |
| Arkansas (0.4%) | | | | |
| | | | Arkansas Community Water System Public Water Authority Water Revenue Refunding and Construction Bonds (NATL-RE Insured) | | | | |
| | 2,400,000 | | | 5.000%, 10/1/2023, Series Bc | | | 2,404,776 | |
| | | | Rogers, Arkansas Sales and Use Tax Refunding and Improvement Bonds | | | | |
| | 2,975,000 | | | 4.000%, 11/1/2027, Series 2011 | | | 3,264,408 | |
| | 1,000,000 | | | 4.125%, 11/1/2031, Series 2011 | | | 1,088,880 | |
| | | | | |
| | | | Total | | | 6,758,064 | |
| | | | | |
| |
| California (12.4%) | | | | |
| | | | Anaheim Public Financing Authority Lease Revenue Bonds (Anaheim Public Improvements) (AGM Insured) | | | | |
| | 3,950,000 | | | 6.000%, 9/1/2024, Series Ac | | | 4,907,915 | |
| | | | Beverly Hills Unified School District, Los Angeles County, California General Obligation Bonds | | | | |
| | 10,000,000 | | | Zero Coupon, 8/1/2031 | | | 4,726,000 | |
| | | | California Educational Facilities Authority Revenue Bonds (Stanford University) | | | | |
| | 6,615,000 | | | 5.250%, 4/1/2040 | | | 9,289,378 | |
| | | | California General Obligation Refunding Bonds | | | | |
| | 2,765,000 | | | 5.000%, 9/1/2015 | | | 3,100,782 | |
| | | | California Health Facilities Financing Authority Refunding Revenue Bonds (Lucile Salter Packard Children’s Hospital at Stanford) | | | | |
| | 3,840,000 | | | 1.450%, 8/15/2033, Series Ab | | | 3,890,496 | |
| | | | California Health Facilities Financing Authority Revenue Bonds (Stanford Hospital and Clinics) | | | | |
| | 500,000 | | | 5.000%, 8/15/2017, Series B | | | 590,510 | |
| | | | California Infrastructure and Economic Development Bank Bay Area Toll Bridges Seismic Retrofit Revenue Bonds (FGIC Insured) | | | | |
| | 5,000,000 | | | 5.000%, 7/1/2025, Series Aa,c | | | 6,676,650 | |
| | | | California Infrastructure and Economic Development Bank Revenue Bonds (California Independent System Operator Corporation) | | | | |
| | 3,000,000 | | | 6.250%, 2/1/2039, Series A | | | 3,250,170 | |
| | | | California Municipal Finance Authority Refunding Revenue Bonds (Biola University) | | | | |
| | 1,500,000 | | | 5.875%, 10/1/2034 | | | 1,636,200 | |
| | | | California State Department of Water Resources Supply Revenue Bonds | | | | |
| | 6,250,000 | | | 5.000%, 5/1/2016, Series M | | | 7,202,750 | |
The accompanying Notes to Financial Statements are an integral part of this schedule.
166
Municipal Bond Fund
Schedule of Investments as of October 31, 2012
| | | | | | | | |
Principal
Amount | | | Long-Term Fixed Income (98.9%) | | Value | |
| California (12.4%) - continued | | | | |
| | | | California State Public Works Board Lease Revenue Bonds (Regents of the University of California - UCLA Replacement Hospital) (AGM Insured) | | | | |
| | $4,000,000 | | | 5.375%, 10/1/2015, Series Ac | | | $4,000,000 | |
| | | | California Various Purpose General Obligation Bonds | | | | |
| | 2,000,000 | | | 5.250%, 11/1/2021a | | | 2,099,720 | |
| | 10,000 | | | 5.250%, 4/1/2029 | | | 10,480 | |
| | 3,990,000 | | | 5.250%, 4/1/2029a | | | 4,267,983 | |
| | 10,000,000 | | | 5.250%, 3/1/2038 | | | 11,083,200 | |
| | 10,000,000 | | | 6.000%, 4/1/2038 | | | 11,909,500 | |
| | 5,000,000 | | | 6.000%, 11/1/2039 | | | 6,065,750 | |
| | | | California Various Purpose General Obligation Bonds (NATL-RE Insured) | | | | |
| | 300,000 | | | 6.000%, 8/1/2016c | | | 304,020 | |
| | | | Chula Vista Industrial Development Revenue Refunding Bonds (San Diego Gas & Electric Company) | | | | |
| | 2,000,000 | | | 5.875%, 2/15/2034, Series C | | | 2,348,440 | |
| | | | Contra Costa County, California Home Mortgage Revenue Bonds (GNMA Collateralized) | | | | |
| | 4,030,000 | | | 7.500%, 5/1/2014a,c | | | 4,462,016 | |
| | | | East Bay Municipal Utility District, Alameda and Contra Costa Counties, California Water System Revenue Refunding Bonds (NATL-RE FGIC Insured) | | | | |
| | 10,000,000 | | | 5.000%, 6/1/2037, Series Ac | | | 11,230,000 | |
| | | | El Camino Community College District General Obligation Bonds (Election of 2002) | | | | |
| | 6,480,000 | | | Zero Coupon, 8/1/2034, Series C | | | 2,300,983 | |
| | | | Foothill-De Anza California Community College District General Obligation Bonds | | | | |
| | 5,000,000 | | | 5.000%, 8/1/2040, Series C | | | 5,771,800 | |
| | | | Golden West Schools Financing Authority Revenue Bonds (NATL-RE Insured) | | | | |
| | 420,000 | | | 5.800%, 2/1/2022, Series Ac | | | 486,679 | |
| | | | Los Angeles Community College District, Los Angeles County, California General Obligation Bonds (Election 2008) | | | | |
| | 10,000,000 | | | 6.000%, 8/1/2033, Series A | | | 12,262,100 | |
| | | | Los Angeles Department of Airports Revenue Bonds (Los Angeles International Airport) | | | | |
| | 8,000,000 | | | 5.000%, 5/15/2040, Series A | | | 9,030,640 | |
| | | | Los Angeles Unified School District, Los Angeles County, California General Obligation Bonds | | | | |
| | 5,000,000 | | | 5.000%, 1/1/2034, Series I | | | 5,679,800 | |
| | | | Pittsburg, California Redevelopment Agency Tax Allocation Bonds (Los Medanos Community Development) (AMBAC Insured) | | | | |
| | 5,000,000 | | | Zero Coupon, 8/1/2024c | | | 2,718,150 | |
| | | | Pomona, California Single Family Mortgage Revenue Refunding Bonds (GNMA/FNMA Collateralized) | | | | |
| | 3,225,000 | | | 7.600%, 5/1/2023, Series Aa,c | | | 4,084,398 | |
| | | | San Bernardino, California Single Family Mortgage Revenue Refunding Bonds (FHA/VA MTGS GNMA Collateralized) | | | | |
| | 1,150,000 | | | 7.500%, 5/1/2023, Series Aa,c | | | 1,539,562 | |
| | | | San Diego Community College District, San Diego County, California General Obligation Bonds (AGM Insured) | | | | |
| | 10,000,000 | | | 5.000%, 5/1/2030a,c | | | 11,135,400 | |
| | | | San Diego County, California Certificates of Participation | | | | |
| | 5,000,000 | | | 5.250%, 7/1/2030 | | | 5,568,750 | |
| | | | San Diego Unified School District General Obligation Bonds | | | | |
| | 10,000,000 | | | Zero Coupon, 7/1/2033, Series Ad | | | 7,982,700 | |
| | | | San Francisco, California City & County Airport Commission Revenue Bonds (San Francisco International Airport) | | | | |
| | 7,030,000 | | | 6.000%, 5/1/2039, Series E | | | 8,265,171 | |
| | | | San Jose, California Airport Revenue Bonds (AMBAC Insured) | | | | |
| | 8,000,000 | | | 5.000%, 3/1/2037, Series A, AMTc | | | 8,192,880 | |
| | | | San Jose, California Redevelopment Agency Tax Allocation Refunding Bonds (Merged Area Redevelopment) (NATL-RE Insured) | | | | |
| | 2,760,000 | | | 5.000%, 8/1/2025, Series Ac | | | 2,752,079 | |
| | | | Santa Monica Community College District, Los Angeles County, California General Obligation Bonds | | | | |
| | 5,000,000 | | | Zero Coupon, 8/1/2025, Series C | | | 3,205,700 | |
| | | | Tuolumne Wind Project Authority Revenue Bonds (Tuolumne Company) | | | | |
| | 2,000,000 | | | 5.625%, 1/1/2029, Series A | | | 2,344,500 | |
| | | | University of California General Revenue Bonds | | | | |
| | 5,000,000 | | | 5.250%, 5/15/2039, Series O | | | 5,703,750 | |
| | | | | |
| | | | Total | | | 202,077,002 | |
| | | | | |
The accompanying Notes to Financial Statements are an integral part of this schedule.
167
Municipal Bond Fund
Schedule of Investments as of October 31, 2012
| | | | | | | | |
Principal
Amount | | | Long-Term Fixed Income (98.9%) | | Value | |
| Colorado (4.9%) | | | | |
| | | | Colorado Educational and Cultural Facilities Authority Charter School Revenue Bonds (Cheyenne Mountain Charter Academy) | | | | |
| | $475,000 | | | 5.125%, 6/15/2032, Series A | | | $486,419 | |
| | 1,000,000 | | | 5.375%, 6/15/2038, Series A | | | 1,031,400 | |
| | | | Colorado Educational and Cultural Facilities Authority Charter School Revenue Bonds (Crown Pointe Academy of Westminster) | | | | |
| | 1,000,000 | | | 5.000%, 7/15/2039 | | | 1,039,690 | |
| | | | Colorado Educational and Cultural Facilities Authority Charter School Revenue Bonds (Pinnacle Charter School, Inc.) | | | | |
| | 3,000,000 | | | 5.125%, 12/1/2039 | | | 3,106,890 | |
| | | | Colorado Health Facilities Authority Health Facilities Revenue Bonds (Evangelical Lutheran Good Samaritan Society) | | | | |
| | 2,110,000 | | | 5.000%, 12/1/2024 | | | 2,400,463 | |
| | 1,000,000 | | | 6.125%, 6/1/2038, Series Aa | | | 1,090,800 | |
| | 10,000,000 | | | 5.000%, 12/1/2042 | | | 10,706,300 | |
| | | | Colorado Health Facilities Authority Hospital Revenue Refunding Bonds (Valley View Hospital Association) | | | | |
| | 3,000,000 | | | 5.750%, 5/15/2036 | | | 3,225,690 | |
| | | | Colorado Higher Education Capital Construction Lease Purchase Financing Program Certificates of Participation | | | | |
| | 405,000 | | | 5.500%, 11/1/2027a | | | 516,638 | |
| | 1,140,000 | | | 5.500%, 11/1/2027 | | | 1,321,568 | |
| | | | Colorado Housing and Finance Authority Single Family Program Bonds | | | | |
| | 150,000 | | | 6.700%, 8/1/2017, Series B-3 | | | 154,974 | |
| | | | Colorado Water Resources and Power Development Authority Clean Water Revenue Bonds (FSA Insured) | | | | |
| | 5,000 | | | 6.250%, 9/1/2013, Series Ac | | | 5,020 | |
| | | | Colorado Water Resources and Power Development Authority Small Water Resources Revenue Bonds (NATL-RE FGIC Insured) | | | | |
| | 300,000 | | | 5.250%, 11/1/2021, Series Aa,c | | | 300,000 | |
| | 3,225,000 | | | 5.250%, 11/1/2021, Series Aa,c | | | 3,225,000 | |
| | | | Denver Health and Hospital Authority Healthcare Revenue Bonds | | | | |
| | 2,000,000 | | | 5.250%, 12/1/2031, Series A | | | 2,099,160 | |
| | | | Denver, Colorado Airport System Revenue Bonds (XLCA Insured) | | | | |
| | 5,000,000 | | | 5.000%, 11/15/2022, Series Ac | | | 5,542,750 | |
| | | | Denver, Colorado Board of Water Commissioners General Obligation Water Refunding Bonds | | | | |
| | 6,000,000 | | | 5.600%, 10/1/2029a | | | 6,294,120 | |
| | | | Denver, Colorado Health & Hospital Authority Healthcare Revenue Bonds | | | | |
| | 5,000,000 | | | 5.500%, 12/1/2030 | | | 5,542,000 | |
| | | | Jefferson County School District No. R-1, Jefferson and Broomfield Counties, Colorado General Obligation Refunding Bonds (AGM Insured) | | | | |
| | 10,000,000 | | | 5.000%, 12/15/2016, Series Ac | | | 11,327,600 | |
| | | | Larimer County, Colorado, Poudre School District R-1 General Obligation Improvement Bonds (NATL-RE-IBC Insured) | | | | |
| | 3,000,000 | | | 7.000%, 12/15/2016c | | | 3,369,510 | |
| | | | Northwest Parkway Public Highway Authority Revenue Bonds (AMBAC Insured) | | | | |
| | 4,000,000 | | | 5.700%, 6/15/2021, Series Ca,c | | | 4,722,920 | |
| | | | University of Colorado University Enterprise Revenue Bonds | | | | |
| | 1,250,000 | | | 5.375%, 6/1/2032, Series A | | | 1,494,975 | |
| | 9,790,000 | | | 5.000%, 6/1/2033 | | | 11,437,363 | |
| | | | | |
| | | | Total | | | 80,441,250 | |
| | | | | |
| |
| District of Columbia (0.9%) | | | | |
| | | | District of Columbia Income Tax Secured Revenue Refunding Bonds | | | | |
| | 2,325,000 | | | 5.000%, 12/1/2017, Series A | | | 2,802,997 | |
| | 5,225,000 | | | 5.000%, 12/1/2028, Series C | | | 6,185,773 | |
| | | | District of Columbia Tobacco Settlement Financing Corporation Tobacco Settlement Asset-Backed Bonds | | | | |
| | 4,995,000 | | | 6.250%, 5/15/2024 | | | 5,109,185 | |
| | | | | |
| | | | Total | | | 14,097,955 | |
| | | | | |
| |
| Florida (4.8%) | | | | |
| | | | Broward County, Florida Water and Sewer Utility Revenue Bonds | | | | |
| | 3,000,000 | | | 5.250%, 10/1/2034, Series A | | | 3,444,930 | |
| | | | CityPlace Community Development District Special Assessment and Revenue Refunding Bonds | | | | |
| | 500,000 | | | 5.000%, 5/1/2017 | | | 565,010 | |
| | 2,000,000 | | | 5.000%, 5/1/2026 | | | 2,278,720 | |
| | | | Florida State Board of Education Public Education Capital Outlay Bonds (NATL-RE-IBC Insured) | | | | |
| | 90,000 | | | 9.125%, 6/1/2014c | | | 97,119 | |
The accompanying Notes to Financial Statements are an integral part of this schedule.
168
Municipal Bond Fund
Schedule of Investments as of October 31, 2012
| | | | | | | | |
Principal
Amount | | | Long-Term Fixed Income (98.9%) | | Value | |
| Florida (4.8%) - continued | | | | |
| | | | Greater Orlando Aviation Authority Airport Facilities Revenue Bonds | | | | |
| $ | 1,500,000 | | | 5.000%, 10/1/2039, Series C | | | $1,640,775 | |
| | | | Gulf Breeze, Florida Revenue Refunding Bonds | | | | |
| | 2,000,000 | | | 5.000%, 12/1/2033 | | | 2,212,300 | |
| | | | Hillsborough County, Florida Community Investment Tax Refunding Revenue Bonds | | | | |
| | 4,025,000 | | | 5.000%, 11/1/2017, Series B | | | 4,772,080 | |
| | | | Hillsborough County, Florida Industrial Development Authority Pollution Control Revenue Refunding Bonds (Tampa Electric Company) | | | | |
| | 2,500,000 | | | 5.150%, 9/1/2025, Series B | | | 2,591,225 | |
| | | | Jacksonville Port Authority Revenue and Refunding Bonds | | | | |
| | 2,265,000 | | | 5.000%, 11/1/2038, Series A, AMT | | | 2,446,132 | |
| | | | Leon County Educational Facilities Authority Certificates of Participation (Southgate Residence Hall Project) | | | | |
| | 1,145,000 | | | 8.500%, 9/1/2017a | | | 1,553,433 | |
| | | | Miami-Dade County Authority Toll System Revenue Bonds (Florida Expressway) | | | | |
| | 2,000,000 | | | 5.000%, 7/1/2040, Series A | | | 2,178,820 | |
| | | | Miami-Dade County, Florida Aviation Revenue Bonds (Miami International Airport - Hub of the Americas) | | | | |
| | 7,500,000 | | | 5.500%, 10/1/2036, Series B | | | 8,516,175 | |
| | 8,000,000 | | | 5.500%, 10/1/2041, Series A | | | 8,865,040 | |
| | | | Miami-Dade County, Florida Public Facilities Revenue Bonds (Jackson Health System) (AGM Insured) | | | | |
| | 2,000,000 | | | 5.625%, 6/1/2034c | | | 2,247,540 | |
| | | | Orange County, Florida Health Facilities Authority Hospital Revenue Bonds (Orlando Health, Inc.) | | | | |
| | 5,000,000 | | | 5.125%, 10/1/2026 | | | 5,595,250 | |
| | | | Orange County, Florida Health Facilities Authority Hospital Revenue Bonds (Orlando Regional Healthcare System) (NATL-RE Insured) | | | | |
| | 2,700,000 | | | 6.250%, 10/1/2018, Series Ac | | | 3,252,609 | |
| | | | Orange County, Orlando Expressway Authority Revenue Bonds | | | | |
| | 4,070,000 | | | 5.000%, 7/1/2035, Series C | | | 4,522,910 | |
| | | | Orange County, Orlando Expressway Authority Revenue Bonds (Florida Expressway) | | | | |
| | 3,600,000 | | | 5.000%, 7/1/2030, Series A | | | 4,083,804 | |
| | | | South Miami, Florida Health Facilities Authority Hospital Revenue Bonds (Baptist Health South Florida) | | | | |
| | 6,000,000 | | | 5.000%, 8/15/2032 | | | 6,449,880 | |
| | | | St. Johns County Industrial Development Authority Revenue Bonds (Presbyterian Retirement Communities) | | | | |
| | 6,415,000 | | | 5.875%, 8/1/2040, Series A | | | 7,163,117 | |
| | | | Tallahassee, Florida Consolidated Utility Systems Revenue Bonds | | | | |
| | 4,000,000 | | | 5.000%, 10/1/2032 | | | 4,586,200 | |
| | | | | |
| | | | Total | | | 79,063,069 | |
| | | | | |
| |
| Georgia (1.3%) | | | | |
| | | | Atlanta, Georgia Airport General Revenue Bonds | | | | |
| | 1,000,000 | | | 5.000%, 1/1/2033, Series C, AMT | | | 1,124,100 | |
| | 500,000 | | | 5.000%, 1/1/2034, Series C, AMT | | | 559,960 | |
| | 500,000 | | | 5.000%, 1/1/2037, Series C, AMT | | | 554,165 | |
| | | | Brunswick, Georgia Water and Sewer Revenue Refunding and Improvement Bonds (NATL-RE Insured) | | | | |
| | 1,500,000 | | | 6.100%, 10/1/2019a,c | | | 1,848,105 | |
| | | | Burke County Development Authority Pollution Control Revenue Bonds (Oglethorpe Power Corporation Vogtle) | | | | |
| | 6,000,000 | | | 5.700%, 1/1/2043, Series C | | | 6,523,020 | |
| | | | Chatham County Hospital Authority, Savannah, Georgia Hospital Revenue Improvement Bonds (Memorial Health University Medical Center, Inc.) | | | | |
| | 1,560,000 | | | 5.750%, 1/1/2029, Series Aa | | | 1,656,673 | |
| | | | Cherokee County, Georgia Water and Sewerage Authority Water and Sewerage Revenue Bonds (Refunding and Improvements) (NATL-RE Insured) | | | | |
| | 4,910,000 | | | 5.500%, 8/1/2018c | | | 5,607,564 | |
| | | | Milledgeville and Baldwin County Development Authority Revenue Bonds (Georgia College and State University Foundation Property III, LLC Student Housing System) | | | | |
| | 2,500,000 | | | 5.500%, 9/1/2024a | | | 2,761,400 | |
| | | | | |
| | | | Total | | | 20,634,987 | |
| | | | | |
| |
| Hawaii (1.9%) | | | | |
| | | | Hawaii Airports System Revenue Bonds | | | | |
| | 3,040,000 | | | 5.250%, 7/1/2030, Series A | | | 3,552,179 | |
The accompanying Notes to Financial Statements are an integral part of this schedule.
169
Municipal Bond Fund
Schedule of Investments as of October 31, 2012
| | | | | | | | |
Principal
Amount | | | Long-Term Fixed Income (98.9%) | | Value | |
| Hawaii (1.9%) - continued | | | | |
| | | | Hawaii State Department of Budget and Finance Special Purpose Senior Living Revenue Refunding Bonds | | | | |
| | $1,000,000 | | | 5.125%, 11/15/2032 | | | $1,072,510 | |
| | 1,000,000 | | | 5.250%, 11/15/2037 | | | 1,065,800 | |
| | | | Hawaii State Harbor System Revenue Bonds | | | | |
| | 6,000,000 | | | 5.250%, 7/1/2030, Series A | | | 6,943,680 | |
| | | | Honolulu City and County, Hawaii General Obligation Bonds (NATL-RE Insured) | | | | |
| | 1,410,000 | | | 5.250%, 3/1/2027, Series Aa,c | | | 1,429,627 | |
| | | | Honolulu, Hawaii Board of Water Supply Water System Revenue Bonds (NATL-RE Insured) | | | | |
| | 5,000,000 | | | 5.000%, 7/1/2036, Series Ac | | | 5,463,250 | |
| | | | Honolulu, Hawaii General Obligation Bonds (NATL-RE FGIC-TCRS Insured) | | | | |
| | 2,555,000 | | | 6.250%, 4/1/2014, Series Ac | | | 2,766,912 | |
| | | | Honolulu, Hawaii General Obligation Bonds (NATL-RE Insured) | | | | |
| | 8,590,000 | | | 5.250%, 3/1/2027, Series Aa,c | | | 8,729,330 | |
| | | | | |
| | | | Total | | | 31,023,288 | |
| | | | | |
| |
| Illinois (8.4%) | | | | |
| | | | Broadview, Cook County, Illinois Tax Increment Revenue Bonds | | | | |
| | 1,000,000 | | | 5.375%, 7/1/2015 | | | 1,000,840 | |
| | | | Chicago General Obligation Bonds (City Colleges of Chicago Capital Improvement) (NATL-RE FGIC Insured) | | | | |
| | 10,000,000 | | | Zero Coupon, 1/1/2024c | | | 6,463,900 | |
| | | | Chicago Metropolitan Water Reclamation District General Obligation Refunding Bonds | | | | |
| | 7,950,000 | | | 5.250%, 12/1/2032, Series C | | | 10,546,629 | |
| | | | Chicago Tax Increment Allocation Bonds (Near South Redevelopment Project) (ACA Insured) | | | | |
| | 7,200,000 | | | Zero Coupon, 11/15/2014, Series Ac | | | 6,657,624 | |
| | | | Chicago, Illinois Midway Airport Revenue Bonds | | | | |
| | 2,000,000 | | | 5.000%, 1/1/2034, Series Bb | | | 2,152,760 | |
| | | | Cook County, Illinois Community Consolidated School District No. 15 Limited Tax Capital Appreciation School Bonds (NATL-RE FGIC Insured) | | | | |
| | 1,000,000 | | | Zero Coupon, 12/1/2014a,c | | | 953,910 | |
| | | | Cook County, Illinois School District No. 99 (Cicero) General Obligation School Bonds (NATL-RE FGIC Insured) | | | | |
| | 1,565,000 | | | 8.500%, 12/1/2014c | | | 1,772,848 | |
| | 1,815,000 | | | 8.500%, 12/1/2016c | | | 2,264,448 | |
| | | | Illinois Educational Facilities Authority Revenue Bonds (Northwestern University) | | | | |
| | 4,900,000 | | | 5.250%, 11/1/2032a | | | 5,605,355 | |
| | | | Illinois Finance Authority Revenue Bonds (DePaul University) | | | | |
| | 4,000,000 | | | 6.000%, 10/1/2032, Series A | | | 4,681,320 | |
| | | | Illinois Finance Authority Revenue Bonds (Rush University Medical Center) | | | | |
| | 5,000,000 | | | 7.250%, 11/1/2038, Series A | | | 6,442,000 | |
| | | | Illinois Finance Authority Revenue Bonds (The Art Institute of Chicago) | | | | |
| | 2,390,000 | | | 5.000%, 3/1/2034, Series A | | | 2,711,598 | |
| | | | Illinois Finance Authority Revenue Refunding Bonds (Rush University Medical Center) (NATL-RE Insured) | | | | |
| | 2,000,000 | | | 5.250%, 11/1/2035, Series Bc | | | 2,150,700 | |
| | | | Illinois Finance Authority Sales Tax Revenue Bonds | | | | |
| | 2,000,000 | | | 5.000%, 6/15/2028 | | | 2,122,540 | |
| | | | Illinois General Obligation Bonds | | | | |
| | 5,000,000 | | | 5.000%, 3/1/2027 | | | 5,529,050 | |
| | 5,000,000 | | | 5.000%, 9/1/2031, Series A | | | 5,329,300 | |
| | | | Illinois General Obligation Refunding Bonds | | | | |
| | 9,000,000 | | | 5.000%, 8/1/2017 | | | 10,359,810 | |
| | | | Illinois Health Facilities Authority Revenue Bonds (Centegra Health System) | | | | |
| | 2,000,000 | | | 5.250%, 9/1/2018 | | | 2,003,660 | |
| | | | Illinois Health Facilities Authority Revenue Refunding Bonds (Lutheran General Health System) (AGM-CR Insured) | | | | |
| | 2,020,000 | | | 6.000%, 4/1/2018, Series Cc | | | 2,353,037 | |
| | | | Illinois Health Facilities Authority Revenue Refunding Bonds (Thorek Hospital and Medical Center) | | | | |
| | 3,065,000 | | | 5.250%, 8/15/2018 | | | 3,070,885 | |
| | | | Illinois Sales Tax Revenue Bonds (Build Illinois Bonds) (NATL-RE FGIC Insured) | | | | |
| | 7,975,000 | | | 5.750%, 6/15/2018, 2nd Seriesc | | | 9,874,645 | |
| | | | Joliet Regional Port District, Illinois Marine Terminal Revenue Refunding Bonds (Exxon) | | | | |
| | 450,000 | | | 0.220%, 10/1/2024b | | | 450,000 | |
| | | | McHenry and Lake Counties, Illinois, Community High School District No. 157 General Obligation School Bonds (AGM Insured) | | | | |
| | 3,035,000 | | | 9.000%, 12/1/2017c | | | 4,006,595 | |
The accompanying Notes to Financial Statements are an integral part of this schedule.
170
Municipal Bond Fund
Schedule of Investments as of October 31, 2012
| | | | | | | | |
Principal
Amount | | | Long-Term Fixed Income (98.9%) | | Value | |
| Illinois (8.4%) - continued | | | | |
| | | | Metropolitan Pier and Exposition Authority, Illinois Refunding Bonds (McCormick Place Expansion) (NATL-RE FGIC Insured) | | | | |
| | $885,000 | | | 5.500%, 6/15/2015, Series Ac | | | $978,908 | |
| | 17,505,000 | | | Zero Coupon, 6/15/2020, Series Ac | | | 13,665,453 | |
| | | | Metropolitan Pier and Exposition Authority, Illinois Refunding Bonds (McCormick Place Expansion) (NATL-RE Insured) | | | | |
| | 7,000,000 | | | 5.500%, 6/15/2020, Series Bc | | | 8,067,430 | |
| | 3,100,000 | | | Zero Coupon, 6/15/2024, Series Ac | | | 1,961,711 | |
| | 2,000,000 | | | Zero Coupon, 12/15/2024, Series Ac | | | 1,237,980 | |
| | | | Railsplitter Tobacco Settlement Authority Tobacco Settlement Revenue Bonds | | | | |
| | 6,000,000 | | | 5.000%, 6/1/2017 | | | 6,824,880 | |
| | | | Regional Transportation Authority, Cook, DuPage, Kane, Lake, McHenry and Will Counties, Illinois Revenue Bonds (NATL-RE FGIC Insured) | | | | |
| | 3,000,000 | | | 6.700%, 11/1/2021, Series Ac | | | 3,669,630 | |
| | | | University of Illinois Auxiliary Facilities System Revenue Bonds | | | | |
| | 2,500,000 | | | 5.750%, 4/1/2038, Series A | | | 2,837,075 | |
| | | | | |
| | | | Total | | | 137,746,521 | |
| | | | | |
| |
| Indiana (1.8%) | | | | |
| | | | East Chicago Elementary School Building Corporation, Lake County, Indiana First Mortgage Refunding Bonds | | | | |
| | 650,000 | | | 6.250%, 1/5/2016 | | | 688,103 | |
| | | | Indiana Bond Bank Special Program Bonds (Clark Memorial Hospital) | | | | |
| | 7,000,000 | | | 5.500%, 8/1/2029, Series D | | | 7,861,560 | |
| | | | Indiana Finance Authority Hospital Revenue Bonds (Deaconess Hospital) | | | | |
| | 1,500,000 | | | 6.750%, 3/1/2039, Series A | | | 1,772,385 | |
| | | | Indiana Health and Educational Facility Financing Authority Health System Revenue Refunding Bonds (Sisters of St. Francis Health Services, Inc.) (AGM Insured) | | | | |
| | 500,000 | | | 5.250%, 5/15/2041, Series Ec | | | 534,590 | |
| | | | Indiana Municipal Power Agency Power Supply System Revenue Bonds | | | | |
| | 4,155,000 | | | 5.000%, 1/1/2042, Series A | | | 4,669,555 | |
| | | | Indiana Transportation Finance Authority Highway Revenue Bonds | | | | |
| | 190,000 | | | 6.800%, 12/1/2016, Series A | | | 210,944 | |
| | | | Indiana Transportation Finance Authority Highway Revenue Bonds (NATL-RE-IBC Insured) | | | | |
| | 2,210,000 | | | 7.250%, 6/1/2015, Series Ac | | | 2,431,685 | |
| | | | Indianapolis Local Public Improvement Bond Bank Bonds (Waterworks) | | | | |
| | 5,000,000 | | | 5.750%, 1/1/2038, Series A | | | 5,698,050 | |
| | | | Knox County, Indiana Economic Development Revenue and Refunding Bonds (Good Samaritan Hospital) | | | | |
| | 2,850,000 | | | 5.000%, 4/1/2037, Series A | | | 3,120,608 | |
| | 1,650,000 | | | 5.000%, 4/1/2042, Series A | | | 1,802,575 | |
| | | | | |
| | | | Total | | | 28,790,055 | |
| | | | | |
| |
| Iowa (0.5%) | | | | |
| | | | Cedar Falls Community School District, Black Hawk County School Infrastructure Sales, Services and Use Tax Revenue Bonds | | | | |
| | 3,165,000 | | | 5.400%, 6/1/2029 | | | 3,525,082 | |
| | | | Des Moines, Iowa Airport Authority Revenue Refunding Bonds | | | | |
| | 1,205,000 | | | 5.000%, 6/1/2024, AMT | | | 1,368,760 | |
| | | | Waterloo Iowa Community School District Tax Revenue Refunding Bonds (School Infrastructure Sales, Services, and Use) | | | | |
| | 3,560,000 | | | 5.000%, 7/1/2029, Series A | | | 3,861,247 | |
| | | | | |
| | | | Total | | | 8,755,089 | |
| | | | | |
| |
| Kansas (0.4%) | | | | |
| | | | Kansas Development Finance Authority Revenue Bonds | | | | |
| | 3,500,000 | | | 5.000%, 5/15/2030, Series S | | | 3,716,195 | |
| | | | Salina, Kansas Hospital Refunding and Improvement Revenue Bonds (Salina Regional Health Center, Inc.) | | | | |
| | 1,725,000 | | | 5.000%, 10/1/2036 | | | 1,803,384 | |
| | | | Sedgwick and Shawnee Counties, Kansas Single Family Mortgage Revenue Bonds (GNMA Collateralized) | | | | |
| | 85,000 | | | 6.700%, 6/1/2029, Series A- 2c | | | 89,002 | |
| | | | Wyandotte County/Kansas City, Kansas Sales Tax Special Obligation Revenue Refunding Bonds (Redevelopment Project Area B) | | | | |
| | 1,625,000 | | | 5.000%, 12/1/2020 | | | 1,630,606 | |
| | | | | |
| | | | Total | | | 7,239,187 | |
| | | | | |
The accompanying Notes to Financial Statements are an integral part of this schedule.
171
Municipal Bond Fund
Schedule of Investments as of October 31, 2012
| | | | | | | | |
Principal
Amount | | | Long-Term Fixed Income (98.9%) | | Value | |
| Kentucky (0.9%) | | | | |
| | | | Kentucky Economic Development Finance Authority Hospital Revenue Bonds (Owensboro Medical Health System, Inc.) | | | | |
| | $5,980,000 | | | 6.375%, 6/1/2040, Series A | | | $7,106,034 | |
| | | | Kentucky Economic Development Finance Authority Revenue Bonds (Louisville Arena Authority, Inc.) (AGM Insured) | | | | |
| | 1,000,000 | | | 6.000%, 12/1/2033, Series A-1c | | | 1,105,810 | |
| | | | Paducah, Kentucky Electric Plant Board Revenue Bonds (AGM Insured) | | | | |
| | 2,500,000 | | | 5.250%, 10/1/2035, Series Ac | | | 2,779,325 | |
| | | | Pikeville, Kentucky Hospital Revenue Bonds (Pikeville Medical Center, Inc.) | | | | |
| | 3,500,000 | | | 6.500%, 3/1/2041 | | | 4,127,550 | |
| | | | | |
| | | | Total | | | 15,118,719 | |
| | | | | |
| |
| Louisiana (2.6%) | | | | |
| | | | Louisiana Public Facilities Authority Revenue Bonds (University of New Orleans Research and Technology Foundation, Inc. - Student Housing) (NATL-RE Insured) | | | | |
| | 4,745,000 | | | 5.250%, 3/1/2031c | | | 5,065,715 | |
| | | | Louisiana State Gas and Fuels Tax Revenue Bonds | | | | |
| | 5,000,000 | | | 5.000%, 5/1/2033, Series B | | | 5,793,350 | |
| | 7,000,000 | | | 5.000%, 5/1/2045, Series B | | | 7,988,190 | |
| | | | Regional Transit Authority, Louisiana Sales Tax Revenue Refunding Bonds (NATL-RE FGIC Insured) | | | | |
| | 2,605,000 | | | 8.000%, 12/1/2012, Series Ac,e | | | 2,609,525 | |
| | | | St. John the Baptist Parish, Louisiana Revenue Bonds (Marathon Oil Corporation) | | | | |
| | 15,500,000 | | | 5.125%, 6/1/2037, Series A | | | 16,876,400 | |
| | | | St. Tammany Parish, Louisiana Utilities Revenue Bonds | | | | |
| | 2,000,000 | | | 5.500%, 8/1/2035, Series B | | | 2,279,200 | |
| | | | Tobacco Settlement Financing Corporation Tobacco Settlement Asset-Backed Bonds | | | | |
| | 2,435,000 | | | 5.500%, 5/15/2030, Series 2001B | | | 2,494,633 | |
| | | | | |
| | | | Total | | | 43,107,013 | |
| | | | | |
| |
| Maryland (0.3%) | | | | |
| | | | Maryland Economic Development Corporation Student Housing Revenue Bonds (University Village at Sheppard Pratt) (ACA Insured) | | | | |
| | 1,550,000 | | | 6.000%, 7/1/2033c | | | 1,491,348 | |
| | | | Morgan State University Academic Fees and Auxiliary Facilities Fees Revenue Refunding Bonds (NATL-RE Insured) | | | | |
| | 2,860,000 | | | 6.050%, 7/1/2015c | | | 3,095,578 | |
| | | | | |
| | | | Total | | | 4,586,926 | |
| | | | | |
| |
| Massachusetts (5.0%) | | | | |
| | | | Massachusetts Bay Transportation Authority Sales Tax Revenue Bonds | | | | |
| | 6,000,000 | | | 5.250%, 7/1/2031, Series A | | | 7,958,580 | |
| | | | Massachusetts Bay Transportation Authority Sales Tax Revenue Bonds (NATL-RE Insured) | | | | |
| | 5,000,000 | | | 5.500%, 7/1/2025, Series Bc | | | 6,721,850 | |
| | | | Massachusetts Development Finance Agency Revenue Bonds | | | | |
| | 3,000,000 | | | 5.000%, 7/1/2042, Series J | | | 3,475,080 | |
| | | | Massachusetts Development Finance Agency Revenue Bonds (Northeastern University) | | | | |
| | 750,000 | | | 5.000%, 10/1/2031 | | | 868,643 | |
| | | | Massachusetts General Obligation Bonds (NATL-RE FGIC-TCRS Insured) | | | | |
| | 4,935,000 | | | 5.250%, 1/1/2013, Series Ac | | | 4,973,986 | |
| | | | Massachusetts Health and Educational Facilities Authority Revenue Bonds (Massachusetts Institute of Technology) | | | | |
| | 15,000,000 | | | 5.250%, 7/1/2033, Series L | | | 21,113,400 | |
| | | | Massachusetts Health and Educational Facilities Authority Revenue Bonds (Tufts University) | | | | |
| | 5,400,000 | | | 5.500%, 2/15/2028, Series M | | | 7,380,288 | |
| | | | Massachusetts Port Authority Revenue Bonds | | | | |
| | 1,000,000 | | | 5.000%, 7/1/2037, Series A, AMT | | | 1,128,950 | |
| | 8,300,000 | | | 5.000%, 7/1/2042, Series A, AMT | | | 9,297,826 | |
| | | | Massachusetts School Building Authority Sales Tax Refunding Bonds | | | | |
| | 10,000,000 | | | 5.000%, 8/15/2021, Series A | | | 12,680,100 | |
| | | | Massachusetts Water Pollution Abatement Trust Pool Program Refunding Bonds | | | | |
| | 5,000,000 | | | 5.000%, 8/1/2024 | | | 6,471,300 | |
| | | | | |
| | | | Total | | | 82,070,003 | |
| | | | | |
The accompanying Notes to Financial Statements are an integral part of this schedule.
172
Municipal Bond Fund
Schedule of Investments as of October 31, 2012
| | | | | | | | |
Principal
Amount | | | Long-Term Fixed Income (98.9%) | | Value | |
| Michigan (1.8%) | | | | |
| | | | East Lansing Building Authority, Ingham and Clinton Counties, Michigan Building Authority Bonds (General Obligation Limited Tax) | | | | |
| | $2,000,000 | | | 5.700%, 4/1/2020 | | | $2,403,020 | |
| | | | Grand Valley State University General Revenue Bonds | | | | |
| | 1,025,000 | | | 5.750%, 12/1/2034 | | | 1,136,008 | |
| | | | Kalamazoo Hospital Finance Authority Hospital Revenue Bonds (AGM Insured) | | | | |
| | 4,000,000 | | | 5.250%, 5/15/2036c | | | 4,493,440 | |
| | | | Kalamazoo Hospital Finance Authority Hospital Revenue Refunding Bonds (Bronson Methodist Hospital) (AGM Insured) | | | | |
| | 3,250,000 | | | 5.000%, 5/15/2026, Series Ac | | | 3,578,802 | |
| | | | Kent County, Michigan General Obligation Bonds | | | | |
| | 2,775,000 | | | 5.000%, 1/1/2024, AMT | | | 3,255,242 | |
| | | | Michigan State Hospital Finance Authority Hospital Revenue and Refunding Bonds (Crittenton Hospital Medical Center) | | | | |
| | 2,750,000 | | | 5.500%, 3/1/2022, Series A | | | 2,773,100 | |
| | | | Michigan State Hospital Finance Authority Hospital Revenue and Refunding Bonds (Sisters of Mercy Health Corporation) (NATL-RE Insured) | | | | |
| | 40,000 | | | 5.375%, 8/15/2014, Series Pa,c | | | 42,062 | |
| | 1,250,000 | | | 5.375%, 8/15/2014, Series Pa,c | | | 1,314,450 | |
| | | | Michigan State Trunk Line Fund Refunding Bonds (AGM Insured) | | | | |
| | 5,000,000 | | | 5.000%, 11/1/2022c | | | 5,523,550 | |
| | | | Rochester Community School District, Oakland and Macomb Counties, Michigan School Building and Site General Obligation Bonds (NATL-RE Q-SBLF Insured) | | | | |
| | 4,500,000 | | | 5.000%, 5/1/2019c | | | 5,396,445 | |
| | | | | |
| | | | Total | | | 29,916,119 | |
| | | | | |
| |
| Minnesota (3.2%) | | | | |
| | | | Baytown Township, Minnesota Lease Revenue Bonds (St. Croix Preparatory Academy) | | | | |
| | 1,000,000 | | | 7.000%, 8/1/2038, Series A | | | 1,047,330 | |
| | 750,000 | | | 5.750%, 8/1/2042 | | | 754,290 | |
| | | | Minneapolis and St. Paul, Minnesota Housing and Redevelopment Authority Health Care Facility Revenue Bonds (HealthPartners) | | | | |
| | 800,000 | | | 6.000%, 12/1/2021 | | | 842,720 | |
| | | | Minnesota Agricultural and Economic Development Board Health Care System Revenue Bonds (Fairview Hospital and Healthcare Services) (NATL-RE Insured) | | | | |
| | $85,000 | | | 5.750%, 11/15/2026, Series Ac | | | $85,260 | |
| | | | Minnesota Higher Education Facilities Authority Revenue Bonds | | | | |
| | 1,575,000 | | | 5.250%, 12/1/2035, Series H | | | 1,726,673 | |
| | | | Minnesota Higher Education Facilities Authority Revenue Bonds (College of St. Scholastica, Inc.) | | | | |
| | 1,800,000 | | | 6.300%, 12/1/2040, Series 7J | | | 2,040,912 | |
| | | | Minnesota Higher Education Facilities Authority Revenue Bonds (University of St. Thomas) | | | | |
| | 530,000 | | | 5.250%, 10/1/2019, Series 5- Y | | | 569,167 | |
| | | | North Oaks, Minnesota Senior Housing Revenue Bonds (Presbyterian Homes of North Oaks, Inc.) | | | | |
| | 2,000,000 | | | 6.125%, 10/1/2039 | | | 2,131,580 | |
| | | | Northern Municipal Power Agency, Minnesota Electric System Revenue Bonds (AMBAC Insured) | | | | |
| | 2,000,000 | | | 5.000%, 1/1/2026, Series Ac | | | 2,233,200 | |
| | | | Rochester, Minnesota Health Care Facilities Revenue Bonds (Olmsted Medical Center) | | | | |
| | 1,000,000 | | | 5.875%, 7/1/2030 | | | 1,102,440 | |
| | | | St. Cloud, Minnesota Health Care Revenue Bonds (CentraCare Health System) | | | | |
| | 2,040,000 | | | 5.125%, 5/1/2030, Series A | | | 2,273,784 | |
| | | | St. Louis Park, Minnesota Health Care Facilities Revenue Refunding Bonds (Park Nicollet Health Services) | | | | |
| | 2,000,000 | | | 5.250%, 7/1/2030, Series Ba | | | 2,158,840 | |
| | 1,000,000 | | | 5.750%, 7/1/2030, Series C | | | 1,140,350 | |
| | 5,580,000 | | | 5.750%, 7/1/2039 | | | 6,337,094 | |
| | | | St. Paul, Minnesota Housing and Redevelopment Authority Educational Facility Revenue Refunding Bonds (Saint Paul Academy and Summit School) | | | | |
| | 4,000,000 | | | 5.000%, 10/1/2024 | | | 4,431,600 | |
| | | | St. Paul, Minnesota Housing and Redevelopment Authority Health Care Facility Revenue Bonds (HealthPartners) | | | | |
| | 230,000 | | | 5.250%, 5/15/2019 | | | 250,863 | |
| | 1,500,000 | | | 5.250%, 5/15/2036 | | | 1,577,070 | |
| | | | Tobacco Securitization Authority Tobacco Settlement Revenue Bonds | | | | |
| | 5,610,000 | | | 5.000%, 3/1/2018, Series B | | | 6,409,818 | |
The accompanying Notes to Financial Statements are an integral part of this schedule.
173
Municipal Bond Fund
Schedule of Investments as of October 31, 2012
| | | | | | | | |
Principal
Amount | | | Long-Term Fixed Income (98.9%) | | Value | |
| Minnesota (3.2%) - continued | | | | |
| | | | Tobacco Securitization Authority Tobacco Settlement Revenue Bonds - continued | | | | |
| | $10,000,000 | | | 5.250%, 3/1/2023, Series B | | | $11,817,500 | |
| | | | University of Minnesota Revenue Bonds (State Supported Biomedical Science Research Facilities Funding) | | | | |
| | 1,655,000 | | | 5.000%, 8/1/2030, Series B | | | 2,015,658 | |
| | | | Winona, Minnesota Health Care Facilities Refunding Revenue Bonds (Winona Health Obligated Group) | | | | |
| | 500,000 | | | 5.000%, 7/1/2034 | | | 523,575 | |
| | | | | |
| | | | Total | | | 51,469,724 | |
| | | | | |
| |
| Missouri (1.4%) | | | | |
| | | | Jackson County, Missouri Special Obligation Bonds (Harry S. Truman Sports Complex) (AMBAC Insured) | | | | |
| | 7,500,000 | | | 5.000%, 12/1/2027c | | | 7,940,850 | |
| | | | Missouri State Development Finance Board Infrastructure Facilities Revenue Bonds | | | | |
| | 4,200,000 | | | 5.000%, 6/1/2037, Series A | | | 4,438,728 | |
| | | | Missouri State Environmental Improvement and Energy Resources Authority Water Pollution Revenue Bonds | | | | |
| | 175,000 | | | 5.250%, 1/1/2018 | | | 176,078 | |
| | 825,000 | | | 5.250%, 1/1/2018a | | | 831,460 | |
| | | | Missouri State Health and Educational Facilities Authority Health Facilities Revenue Bonds (Barnes-Jewish, Inc./Christian Health Services) | | | | |
| | 3,000,000 | | | 5.250%, 5/15/2014, Series A | | | 3,101,100 | |
| | | | Missouri State Health and Educational Facilities Authority Health Facilities Revenue Bonds (BJC Health System) | | | | |
| | 2,500,000 | | | 5.000%, 5/15/2020, Series A | | | 2,722,100 | |
| | | | Missouri State Health and Educational Facilities Authority Health Facilities Revenue Bonds (Lake Regional Health System) | | | | |
| | 1,500,000 | | | 5.600%, 2/15/2025 | | | 1,539,315 | |
| | | | St. Louis, Missouri Airport Revenue Refunding Bonds (Lambert-St. Louis International Airport) | | | | |
| | 900,000 | | | 5.000%, 7/1/2016, AMT | | | 992,358 | |
| | 1,000,000 | | | 5.000%, 7/1/2032, AMT | | | 1,078,560 | |
| | | | | |
| | | | Total | | | 22,820,549 | |
| | | | | |
| |
| Montana (0.4%) | | | | |
| | | | Montana Facility Finance Authority Hospital Facilities Revenue Bonds (St. Peter’s Hospital) | | | | |
| | 3,860,000 | | | 5.250%, 6/1/2018 | | | 4,052,537 | |
| | | | Montana Facility Finance Authority Revenue Bonds (Providence Health & Services) | | | | |
| | 2,830,000 | | | 5.000%, 10/1/2024 | | | 3,130,546 | |
| | | | | |
| | | | Total | | | 7,183,083 | |
| | | | | |
| |
| Nebraska (1.6%) | | | | |
| | | | Douglas County, Nebraska Hospital Authority No. 3 Health Facilities Refunding and Revenue Bonds (Nebraska Methodist Health System) | | | | |
| | 2,000,000 | | | 5.750%, 11/1/2048 | | | 2,159,340 | |
| | | | Lincoln, Nebraska Lincoln Electric System Revenue Refunding Bonds | | | | |
| | 2,500,000 | | | 5.000%, 9/1/2037 | | | 2,915,600 | |
| | | | Nebraska Public Power District General Revenue Bonds (AMBAC Insured) | | | | |
| | 2,500,000 | | | 5.000%, 1/1/2013, Series Bc | | | 2,518,450 | |
| | | | Omaha, Nebraska Public Power District Electric System Revenue Bonds | | | | |
| | 5,780,000 | | | 5.000%, 2/1/2046, Series Aa | | | 6,114,893 | |
| | | | University of Nebraska Student Fees and Facilities Revenue Bonds | | | | |
| | 5,000,000 | | | 5.000%, 7/1/2023, Series Ba | | | 5,251,300 | |
| | 1,000,000 | | | 5.000%, 7/1/2037 | | | 1,148,680 | |
| | | | University of Nebraska Student Fees and Facilities Revenue Refunding Bonds | | | | |
| | 3,050,000 | | | 5.000%, 7/1/2038 | | | 3,557,947 | |
| | | | University of Nebraska Student Housing Revenue Bonds | | | | |
| | 1,680,000 | | | 5.000%, 5/15/2040, Series B | | | 1,898,854 | |
| | | | | |
| | | | Total | | | 25,565,064 | |
| | | | | |
| |
| New Hampshire (0.2%) | | | | |
| | | | New Hampshire State Turnpike System Revenue Bonds | | | | |
| | 1,000,000 | | | 5.000%, 2/1/2017, Series Bf | | | 1,167,860 | |
| | | | New Hampshire State Turnpike System Revenue Refunding Bonds | | | | |
| | 2,000,000 | | | 5.000%, 10/1/2019 | | | 2,464,920 | |
| | | | | |
| | | | Total | | | 3,632,780 | |
| | | | | |
| |
| New Jersey (1.3%) | | | | |
| | | | Hudson County, New Jersey Refunding Certificates of Participation (NATL-RE Insured) | | | | |
| | 2,000,000 | | | 6.250%, 12/1/2015c | | | 2,238,680 | |
The accompanying Notes to Financial Statements are an integral part of this schedule.
174
Municipal Bond Fund
Schedule of Investments as of October 31, 2012
| | | | | | | | |
Principal
Amount | | | Long-Term Fixed Income (98.9%) | | Value | |
| New Jersey (1.3%) - continued | | | | |
| | | | New Jersey Educational Facilities Authority Revenue Refunding Bonds (Kean University) | | | | |
| | $1,000,000 | | | 5.500%, 9/1/2036, Series A | | | $1,146,510 | |
| | | | New Jersey General Obligation Bonds (AMBAC Insured) | | | | |
| | 1,000,000 | | | 5.250%, 7/15/2018, Series Lc | | | 1,232,800 | |
| | | | New Jersey Transportation Trust Fund Authority Revenue Bonds | | | | |
| | 1,500,000 | | | 5.000%, 6/15/2026, Series A | | | 1,776,105 | |
| | | | New Jersey Transportation Trust Fund Authority Transportation System Bonds (AGM Insured) | | | | |
| | 5,000,000 | | | 5.500%, 12/15/2016, Series Ac | | | 5,908,400 | |
| | | | New Jersey Turnpike Authority Turnpike Revenue Bonds (AMBAC-TCRS Insured) | | | | |
| | 260,000 | | | 6.500%, 1/1/2016, Series Ca,c | | | 308,958 | |
| | 260,000 | | | 6.500%, 1/1/2016, Series Ca,c | | | 288,223 | |
| | 485,000 | | | 6.500%, 1/1/2016, Series Cc | | | 564,356 | |
| | | | New Jersey Turnpike Authority Turnpike Revenue Bonds (AMBAC-TCRS-BNY Insured) | | | | |
| | 2,860,000 | | | 6.500%, 1/1/2016, Series Ca,c | | | 3,170,453 | |
| | | | Ocean County, New Jersey Utilities Authority Wastewater Revenue Bonds (NATL-RE Insured) | | | | |
| | 3,180,000 | | | 5.250%, 1/1/2025c | | | 4,189,554 | |
| | | | | |
| | | | Total | | | 20,824,039 | |
| | | | | |
| |
| New Mexico (0.8%) | | | | |
| | | | Jicarilla, New Mexico Apache Nation Revenue Bonds | | | | |
| | 3,500,000 | | | 5.500%, 9/1/2023, Series A | | | 3,608,010 | |
| | | | Sandoval County, New Mexico Incentive Payment Refunding Revenue Bonds | | | | |
| | 9,000,000 | | | 5.000%, 6/1/2020 | | | 9,563,940 | |
| | | | | |
| | | | Total | | | 13,171,950 | |
| | | | | |
| |
| New York (6.6%) | | | | |
| | | | Metropolitan Transportation Authority State Service Contract Refunding Bonds | | | | |
| | 5,000,000 | | | 5.500%, 7/1/2017, Series A | | | 6,026,000 | |
| | | | Metropolitan Transportation Authority Transit Facilities Service Contract Bonds | | | | |
| | 250,000 | | | 5.750%, 7/1/2013, Series Oa | | | 259,068 | |
| | | | New York City General Obligation Bonds | | | | |
| | 12,000,000 | | | 5.250%, 8/1/2017, Series B | | | 13,011,840 | |
| | 220,000 | | | 5.500%, 8/1/2022, Series Aa | | | 228,587 | |
| | 1,530,000 | | | 5.500%, 8/1/2022, Series A | | | 1,585,294 | |
| | 5,000,000 | | | 4.900%, 12/15/2028, Series F2b | | | 5,205,200 | |
| | | | New York City Municipal Water Finance Authority Water and Sewer System Revenue Bonds | | | | |
| | 5,000,000 | | | 5.000%, 6/15/2038, Series A | | | 5,657,500 | |
| | 11,155,000 | | | 5.750%, 6/15/2040, Series A | | | 13,318,847 | |
| | 2,000,000 | | | 5.375%, 6/15/2043, Series EE | | | 2,372,900 | |
| | | | New York City Transitional Finance Authority Future Tax Secured Bonds | | | | |
| | 15,000,000 | | | 5.000%, 11/1/2033, Series D-1 | | | 17,697,900 | |
| | | | New York City Transitional Finance Authority Future Tax Secured Refunding Bonds | | | | |
| | 2,540,000 | | | 5.375%, 11/15/2021, Series Aa | | | 2,543,708 | |
| | | | New York City Trust for Cultural Resources Refunding Revenue Bonds (The Museum of Modern Art) | | | | |
| | 2,000,000 | | | 5.000%, 4/1/2017, Series A | | | 2,345,820 | |
| | | | New York State Dormitory Authority State Personal Income Tax Revenue Bonds | | | | |
| | 5,125,000 | | | 5.000%, 2/15/2029, Series A | | | 6,100,954 | |
| | | | New York State Dormitory Authority State University Educational Facilities Revenue Bonds | | | | |
| | 2,000,000 | | | 7.500%, 5/15/2013, Series A | | | 2,076,540 | |
| | 5,000,000 | | | 5.875%, 5/15/2017, Series A | | | 5,912,350 | |
| | | | New York State Liberty Development Corporation Liberty Revenue Bonds | | | | |
| | 10,000,000 | | | 5.250%, 12/15/2043 | | | 11,574,500 | |
| | | | New York State Local Government Assistance Corporation Refunding Bonds (NATL-RE-IBC Insured) | | | | |
| | 2,000,000 | | | 5.250%, 4/1/2016, Series Ec | | | 2,272,840 | |
| | | | New York State Urban Development Corporation State Personal Income Tax Revenue Bonds (State Facilities and Equipment) | | | | |
| | 3,870,000 | | | 5.000%, 3/15/2036, Series B-1 | | | 4,524,881 | |
| | | | Port Authority of New York and New Jersey Bonds (AGM Insured) | | | | |
| | 5,000,000 | | | 4.750%, 12/15/2022, AMTc | | | 5,162,350 | |
| | | | | |
| | | | Total | | | 107,877,079 | |
| | | | | |
| |
| North Carolina (2.5%) | | | | |
| | | | North Carolina Eastern Municipal Power Agency Power System Revenue Bonds | | | | |
| | 5,000,000 | | | 5.500%, 1/1/2014, Series D | | | 5,285,250 | |
| | 4,000,000 | | | 5.375%, 1/1/2017, Series Ca | | | 4,032,120 | |
| | 7,170,000 | | | 5.250%, 1/1/2020, Series A | | | 8,440,524 | |
| | 2,580,000 | | | 5.000%, 1/1/2021, Series A | | | 3,159,726 | |
| | 2,000,000 | | | 5.000%, 1/1/2026, Series B | | | 2,286,020 | |
| | 1,475,000 | | | 6.000%, 1/1/2026, Series Aa | | | 2,013,611 | |
The accompanying Notes to Financial Statements are an integral part of this schedule.
175
Municipal Bond Fund
Schedule of Investments as of October 31, 2012
| | | | | | | | |
Principal
Amount | | | Long-Term Fixed Income (98.9%) | | Value | |
| North Carolina (2.5%) - continued | | | | |
| | | | North Carolina Eastern Municipal Power Agency Power System Revenue Refunding Bonds | | | | |
| | $2,500,000 | | | 5.000%, 1/1/2017, Series D | | | $2,914,900 | |
| | | | North Carolina Municipal Power Agency No. 1 Catawba Electric Revenue Bonds | | | | |
| | 3,200,000 | | | 5.000%, 1/1/2025, Series A | | | 3,675,360 | |
| | 1,250,000 | | | 5.000%, 1/1/2030, Series A | | | 1,404,462 | |
| | | | Raleigh-Durham, North Carolina Airport Authority Revenue Bonds | | | | |
| | 4,435,000 | | | 5.000%, 5/1/2036, Series A | | | 5,045,079 | |
| | | | Wake County Industrial Facilities and Pollution Control Financing Authority Pollution Control Revenue Refunding Bonds (Carolina Power & Light Company) | | | | |
| | 2,000,000 | | | 5.375%, 2/1/2017 | | | 2,026,460 | |
| | | | | |
| | | | Total | | | 40,283,512 | |
| | | | | |
| |
| North Dakota (0.7%) | | | | |
| | | | North Dakota Public Finance Authority Revenue Bonds (State Revolving Fund) | | | | |
| | 1,495,000 | | | 5.000%, 10/1/2031, Series A | | | 1,778,557 | |
| | | | South Central Regional Water District, North Dakota Utility System Revenue Bonds (Refunding and Northern Burleigh County Expansion) | | | | |
| | 2,945,000 | | | 5.650%, 10/1/2029, Series Aa | | | 3,239,382 | |
| | | | Ward County, North Dakota Health Care Facilities Refunding Revenue Bonds (Trinity) | | | | |
| | 2,810,000 | | | 6.250%, 7/1/2021, Series B | | | 2,815,507 | |
| | | | Ward County, North Dakota Health Care Facilities Revenue Bonds (Trinity) | | | | |
| | 2,895,000 | | | 5.125%, 7/1/2025 | | | 3,055,991 | |
| | | | | |
| | | | Total | | | 10,889,437 | |
| | | | | |
| |
| Ohio (3.0%) | | | | |
| | | | Akron, Ohio Non-Tax Revenue Economic Development Bonds (NATL-RE Insured) | | | | |
| | 310,000 | | | 6.000%, 12/1/2012a,c | | | 311,701 | |
| | | | AMP Fremont Energy Center Revenue Bonds | | | | |
| | 3,000,000 | | | 5.000%, 2/15/2037, Series B | | | 3,326,130 | |
| | | | Buckeye Tobacco Settlement Financing Authority Tobacco Settlement Asset-Backed Bonds | | | | |
| | 11,925,000 | | | 5.125%, 6/1/2024, Series A-2 | | | 10,307,374 | |
| | | | Kent State University General Receipts Bonds | | | | |
| | 350,000 | | | 5.000%, 5/1/2017, Series A | | | 406,955 | |
| | 1,500,000 | | | 5.000%, 5/1/2037, Series A | | | 1,698,450 | |
| | | | Lucas County, Ohio Health Care System Refunding Revenue Bonds (Sunset Retirement Communities) | | | | |
| | 1,250,000 | | | 5.125%, 8/15/2025 | | | 1,366,712 | |
| | 1,750,000 | | | 5.500%, 8/15/2030 | | | 1,924,633 | |
| | | | Miami University, Ohio General Receipts Revenue and Refunding Bonds | | | | |
| | 1,600,000 | | | 5.000%, 9/1/2036 | | | 1,831,680 | |
| | | | Ohio Higher Educational Facility Commission Revenue Bonds (Case Western Reserve University) | | | | |
| | 2,000,000 | | | 6.500%, 10/1/2020, Series B | | | 2,476,160 | |
| | | | Ohio Higher Educational Facility Commission Revenue Bonds (Kenyon College) | | | | |
| | 4,740,000 | | | 5.250%, 7/1/2044 | | | 5,205,800 | |
| | | | Ohio Turnpike Commission Turnpike Revenue Refunding Bonds (NATL-RE FGIC Insured) | | | | |
| | 2,000,000 | | | 5.500%, 2/15/2024, Series Ac | | | 2,581,840 | |
| | 10,000,000 | | | 5.500%, 2/15/2026, Series Ac | | | 13,159,000 | |
| | | | Port of Greater Cincinnati Development Authority Economic Development Revenue Bonds (Sisters of Mercy of the Americas, Regional Community of Cincinnati) | | | | |
| | 1,750,000 | | | 5.000%, 10/1/2025 | | | 1,850,240 | |
| | | | University of Cincinnati General Receipts Bonds (AMBAC Insured) | | | | |
| | 2,545,000 | | | 5.000%, 6/1/2016, Series Da,c | | | 2,731,218 | |
| | | | | |
| | | | Total | | | 49,177,893 | |
| | | | | |
| |
| Oklahoma (0.2%) | | | | |
| | | | Oklahoma Municipal Power Authority Power Supply System Revenue Bonds | | | | |
| | 1,545,000 | | | 6.000%, 1/1/2038, Series A | | | 1,745,896 | |
| | | | Oklahoma State Turnpike Authority Revenue Bonds | | | | |
| | 500,000 | | | 5.000%, 1/1/2028, Series A | | | 593,315 | |
| | | | | |
| | | | Total | | | 2,339,211 | |
| | | | | |
| |
| Oregon (0.2%) | | | | |
| | | | Clackamas County, Oregon Hospital Facility Authority Revenue Bonds (Legacy Health Systems) | | | | |
| | 300,000 | | | 5.500%, 7/15/2035, Series A | | | 335,136 | |
| | | | Salem-Keizer School District No. 24J, Marion and Polk Counties, Oregon General Obligation Bonds | | | | |
| | 5,000,000 | | | Zero Coupon, 6/15/2028, Series B | | | 3,078,950 | |
| | | | | |
| | | | Total | | | 3,414,086 | |
| | | | | |
The accompanying Notes to Financial Statements are an integral part of this schedule.
176
Municipal Bond Fund
Schedule of Investments as of October 31, 2012
| | | | | | | | |
Principal
Amount | | | Long-Term Fixed Income (98.9%) | | Value | |
| Pennsylvania (3.8%) | | | | |
| | | | Allegheny County Hospital Development Authority Revenue Bonds (University of Pittsburgh Medical Center) | | | | |
| | 3,000,000 | | | 5.000%, 6/15/2018, Series B | | | 3,557,670 | |
| | 2,000,000 | | | 5.625%, 8/15/2039 | | | 2,259,500 | |
| | | | Beaver County Industrial Development Authority Pollution Control Revenue Refunding Bonds (FirstEnergy Nuclear Generation) | | | | |
| | 3,000,000 | | | 2.700%, 4/1/2035, Series A, AMT | | | 3,016,530 | |
| | 5,000,000 | | | 2.500%, 12/1/2041, Series Bb | | | 5,010,700 | |
| | | | Cornwall-Lebanon School District, Lebanon County, General Obligation Notes (AGM Insured) | | | | |
| | 2,000,000 | | | Zero Coupon, 3/15/2016c | | | 1,893,800 | |
| | 1,520,000 | | | Zero Coupon, 3/15/2017c | | | 1,406,958 | |
| | | | Cumberland County, Municipal Authority Revenue Bonds (Diakon Lutheran Social Ministries) | | | | |
| | 2,750,000 | | | 5.000%, 1/1/2027 | | | 2,886,400 | |
| | 2,000,000 | | | 6.125%, 1/1/2029 | | | 2,244,800 | |
| | 2,455,000 | | | 5.000%, 1/1/2036 | | | 2,517,750 | |
| | | | Lancaster County Hospital Authority Hospital Revenue Bonds (Lancaster General Hospital) | | | | |
| | 2,000,000 | | | 5.500%, 3/15/2026a | | | 2,087,040 | |
| | | | Lycoming County Authority Health System Revenue Bonds (Susquehanna Health System) | | | | |
| | 6,795,000 | | | 5.750%, 7/1/2039, Series A | | | 7,475,111 | |
| | | | Pennsylvania Economic Development Financing Authority Unemployment Compensation Revenue Bonds | | | | |
| | 3,000,000 | | | 5.000%, 7/1/2020, Series B | | | 3,703,320 | |
| | | | Pennsylvania Turnpike Commission Turnpike Revenue Bonds (AGM Insured) | | | | |
| | 8,000,000 | | | Zero Coupon, 6/1/2033, Series Cc,d | | | 8,559,840 | |
| | 10,070,000 | | | 6.250%, 6/1/2038, Series Cc | | | 12,215,212 | |
| | | | Philadelphia Authority for Industrial Development Revenue Bonds (Please Touch Museum) | | | | |
| | 2,000,000 | | | 5.250%, 9/1/2026 | | | 1,940,580 | |
| | | | York County, Pennsylvania Solid Waste and Refuse Authority Solid Waste System Refunding Revenue Bonds (NATL-RE FGIC Insured) | | | | |
| | 1,000,000 | | | 5.500%, 12/1/2012c | | | 1,000,000 | |
| | | | | |
| | | | Total | | | 61,775,211 | |
| | | | | |
| |
| Puerto Rico (0.5%) | | | | |
| | | | Puerto Rico Industrial, Tourist, Educational, Medical, and Environmental Control Facilities Financing Authority Cogeneration Facility Revenue Bonds (AES Puerto Rico) | | | | |
| | 7,655,000 | | | 6.625%, 6/1/2026, AMT | | | 7,659,363 | |
| | | | Puerto Rico Sales Tax Financing Corporation Sales Tax Revenue Bonds | | | | |
| | 1,000,000 | | | 5.000%, 8/1/2022, Series C | | | 1,204,710 | |
| | | | | |
| | | | Total | | | 8,864,073 | |
| | | | | |
| |
| South Carolina (1.5%) | | | | |
| | | | Greenwood County, South Carolina Hospital Facilities Refunding Revenue Bonds (Self Regional Healthcare) | | | | |
| | 1,120,000 | | | 5.000%, 10/1/2024, Series B | | | 1,268,971 | |
| | 2,890,000 | | | 5.000%, 10/1/2031, Series B | | | 3,205,444 | |
| | | | Greenwood County, South Carolina Hospital Facilities Revenue Bonds (Self Regional Healthcare) | | | | |
| | 2,250,000 | | | 5.375%, 10/1/2039 | | | 2,456,257 | |
| | | | Piedmont, South Carolina Municipal Power Agency Electric Revenue Bonds (NATL-RE FGIC Insured) | | | | |
| | 4,000,000 | | | 6.250%, 1/1/2021c | | | 5,179,040 | |
| | | | South Carolina Jobs-Economic Development Authority Hospital Refunding and Improvement Revenue Bonds (Palmetto Health Alliance) | | | | |
| | 605,000 | | | 6.875%, 8/1/2027, Series Ca | | | 633,961 | |
| | 4,895,000 | | | 6.875%, 8/1/2027, Series Ca | | | 5,129,324 | |
| | | | South Carolina Public Service Authority Revenue Obligations (Santee Cooper) | | | | |
| | 3,765,000 | | | 5.500%, 1/1/2038, Series A | | | 4,429,071 | |
| | | | Spartanburg, South Carolina Water System Revenue Bonds (FGIC Insured) | | | | |
| | 2,000,000 | | | 5.250%, 6/1/2028a,c | | | 2,154,180 | |
| | | | | |
| | | | Total | | | 24,456,248 | |
| | | | | |
| |
| South Dakota (0.9%) | | | | |
| | | | South Dakota Educational Enhancement Funding Corporation Tobacco Settlement Asset-Backed Bonds | | | | |
| | 5,000,000 | | | 6.500%, 6/1/2032, Series B | | | 5,176,050 | |
| | | | South Dakota Health and Educational Facilities Authority Revenue Bonds (Prairie Lakes Health Care System) | | | | |
| | 1,170,000 | | | 5.625%, 4/1/2032a | | | 1,195,670 | |
The accompanying Notes to Financial Statements are an integral part of this schedule.
177
Municipal Bond Fund
Schedule of Investments as of October 31, 2012
| | | | | | | | |
Principal
Amount | | | Long-Term Fixed Income (98.9%) | | Value | |
| South Dakota (0.9%) - continued | | | | |
| | | | South Dakota Health and Educational Facilities Authority Revenue Bonds (Regional Health) | | | | |
| | $1,000,000 | | | 5.000%, 9/1/2023 | | | $1,117,780 | |
| | 820,000 | | | 5.000%, 9/1/2025 | | | 908,822 | |
| | | | South Dakota Health and Educational Facilities Authority Revenue Bonds (Sanford Health) | | | | |
| | 5,000,000 | | | 5.000%, 11/1/2040 | | | 5,292,000 | |
| | 1,250,000 | | | 5.500%, 11/1/2040 | | | 1,394,775 | |
| | | | | |
| | | | Total | | | 15,085,097 | |
| | | | | |
| |
| Tennessee (0.4%) | | | | |
| | | | Jackson, Tennessee Hospital Revenue Refunding and Improvement Bonds (Jackson- Madison County General Hospital) | | | | |
| | 2,060,000 | | | 5.625%, 4/1/2038 | | | 2,287,733 | |
| | 3,450,000 | | | 5.750%, 4/1/2041 | | | 3,848,958 | |
| | | | Metropolitan Government of Nashville and Davidson County, Tennessee Health and Educational Facilities Board Revenue Bonds (Belmont University) | | | | |
| | 600,000 | | | 5.000%, 11/1/2030 | | | 656,778 | |
| | | | | |
| | | | Total | | | 6,793,469 | |
| | | | | |
| |
| Texas (12.0%) | | | | |
| | | | Alliance Airport Authority, Inc. Special Facilities Revenue Refunding Bonds (Federal Express Corporation) | | | | |
| | 10,285,000 | | | 4.850%, 4/1/2021, AMT | | | 11,079,619 | |
| | | | Amarillo Health Facilities Corporation Hospital Revenue Bonds (Baptist St. Anthony’s Hospital Corporation) (AGM Insured) | | | | |
| | 2,000,000 | | | 5.500%, 1/1/2017c | | | 2,150,140 | |
| | | | Austin, Texas Combined Utility Systems Revenue Refunding Bonds (NATL-RE FGIC-TCRS Insured) | | | | |
| | 885,000 | | | 6.000%, 11/15/2013c | | | 887,451 | |
| | | | Bexar County Housing Finance Corporation Multifamily Housing Revenue Bonds (Dymaxion and Marbach Park Apartments) (NATL-RE Insured) | | | | |
| | 1,930,000 | | | 6.000%, 8/1/2023, Series Ac | | | 1,935,346 | |
| | | | Clifton Higher Education Finance Corporation Education Revenue Bonds (IDEA Public Schools) | | | | |
| | 1,000,000 | | | 5.000%, 8/15/2042 | | | 1,056,150 | |
| | | | Clifton Higher Education Finance Corporation Education Revenue Bonds (Uplift Education) | | | | |
| | 4,000,000 | | | 6.250%, 12/1/2045, Series A | | | 4,530,000 | |
| | | | Dallas and Fort Worth, Texas Joint Revenue Improvement and Refunding Bonds (Dallas/Fort Worth International Airport) | | | | |
| | 5,000,000 | | | 5.000%, 11/1/2035, Series F, AMT | | | 5,489,500 | |
| | 12,500,000 | | | 5.000%, 11/1/2038, Series D, AMT | | | 13,682,875 | |
| | | | Dallas and Fort Worth, Texas Joint Revenue Improvement and Refunding Bonds (Dallas/Fort Worth International Airport) (NATL-RE Insured) | | | | |
| | 1,000,000 | | | 5.500%, 11/1/2016, Series A, AMTc | | | 1,002,990 | |
| | 500,000 | | | 5.500%, 11/1/2017, Series A, AMTc | | | 501,420 | |
| | | | Dallas Independent School District, Dallas County, Texas Unlimited Tax School Building Bonds (PSF-GTD Insured) | | | | |
| | 10,000,000 | | | 6.375%, 2/15/2034c | | | 12,390,000 | |
| | | | Deer Park Independent School District, Harris County, Texas School Building Refunding Bonds (PSF-GTD Insured) | | | | |
| | 1,375,000 | | | 5.000%, 2/15/2013c | | | 1,393,356 | |
| | | | Denton, Texas Utility System Revenue Bonds (AGM Insured) | | | | |
| | 3,210,000 | | | 5.250%, 12/1/2015, Series Aa,c | | | 3,221,781 | |
| | | | Gulf Coast Waste Disposal Authority, Texas Pollution Control Revenue Refunding Bonds (Exxon) | | | | |
| | 7,000,000 | | | 0.220%, 6/1/2020b | | | 7,000,000 | |
| | 7,450,000 | | | 0.220%, 10/1/2024b | | | 7,450,000 | |
| | | | Harris County General Obligation and Revenue Refunding Bonds (NATL-RE Insured) | | | | |
| | 7,000,000 | | | Zero Coupon, 8/15/2024c | | | 5,157,740 | |
| | | | Harris County Health Facilities Development Corporation Hospital Revenue Refunding Bonds (Memorial Hermann Healthcare System) | | | | |
| | 2,000,000 | | | 7.250%, 12/1/2035, Series B | | | 2,492,500 | |
| | | | Harris County Industrial Development Corporation Pollution Control Revenue Bonds (Exxon) | | | | |
| | 2,000,000 | | | 0.220%, 3/1/2024b | | | 2,000,000 | |
| | | | Harris County Toll Road Revenue and Refunding Bonds | | | | |
| | 6,500,000 | | | 5.250%, 8/15/2047, Series B | | | 7,377,240 | |
The accompanying Notes to Financial Statements are an integral part of this schedule.
178
Municipal Bond Fund
Schedule of Investments as of October 31, 2012
| | | | | | | | |
Principal
Amount | | | Long-Term Fixed Income (98.9%) | | Value | |
| Texas (12.0%) - continued | | | | |
| | | | Houston, Texas Water and Sewer System Revenue Refunding Bonds (AGM Insured) | | | | |
| | $10,000,000 | | | 5.750%, 12/1/2032, Series Aa,c | | | $14,921,700 | |
| | | | Lewisville Independent School District, Denton County, Texas Unlimited Tax School Building and Refunding Bonds (PSF-GTD Insured) | | | | |
| | 5,315,000 | | | Zero Coupon, 8/15/2019c | | | 4,774,039 | |
| | | | Lower Colorado River Authority Revenue Refunding Bonds (AGM Insured) | | | | |
| | 215,000 | | | 5.875%, 5/15/2015, Series Ac | | | 215,830 | |
| | | | North East Independent School District, Bexar County, Texas Unlimited Tax Refunding Bonds (PSF-GTD Insured) | | | | |
| | 5,000,000 | | | 5.250%, 2/1/2028c | | | 6,584,000 | |
| | 2,000,000 | | | 5.250%, 2/1/2029c | | | 2,648,140 | |
| | | | North Texas Education Finance Corporation Education Revenue Bonds (Uplift Education) | | | | |
| | 2,500,000 | | | 5.125%, 12/1/2042, Series A | | | 2,648,275 | |
| | | | North Texas Health Facilities Development Corporation Hospital Revenue Bonds (United Regional Healthcare System, Inc.) | | | | |
| | 2,600,000 | | | 6.000%, 9/1/2023a | | | 2,720,926 | |
| | | | North Texas Tollway Authority System Revenue Refunding Bonds | | | | |
| | 15,000,000 | | | 5.000%, 9/1/2030, Series D | | | 17,448,600 | |
| | 1,000,000 | | | 5.625%, 1/1/2033, Series A | | | 1,129,580 | |
| | 5,000,000 | | | 5.000%, 1/1/2042, Series B | | | 5,549,850 | |
| | | | North Texas Tollway Authority System Revenue Refunding Bonds (AGM Insured) | | | | |
| | 5,000,000 | | | Zero Coupon, 1/1/2028, Series Dc | | | 2,706,950 | |
| | | | Pharr, Texas Higher Education Finance Authority Education Revenue Bonds (IDEA Public Schools) | | | | |
| | 2,500,000 | | | 6.250%, 8/15/2029, Series A | | | 2,837,225 | |
| | 2,000,000 | | | 6.500%, 8/15/2039, Series A | | | 2,287,740 | |
| | | | Ridge Parc Development Corporation Multifamily Housing Revenue Bonds (GNMA Collateralized) | | | | |
| | 1,000,000 | | | 6.100%, 6/20/2033c | | | 1,051,300 | |
| | 2,795,000 | | | 6.150%, 11/20/2041c | | | 2,937,964 | |
| | | | San Juan, Texas Higher Education Finance Authority Education Revenue Bonds (IDEA Public Schools) | | | | |
| | 2,000,000 | | | 6.700%, 8/15/2040, Series A | | | 2,338,800 | |
| | | | San Leanna Education Facilities Corporation Higher Education Revenue Bonds (Saint Edward’s University) | | | | |
| | 1,160,000 | | | 5.125%, 6/1/2024 | | | 1,251,686 | |
| | 1,000,000 | | | 5.125%, 6/1/2027 | | | 1,065,470 | |
| | | | Socorro, Texas Independent School District General Obligation Refunding Bonds (School Building) (PSF-GTD Insured) | | | | |
| | 2,000,000 | | | 5.000%, 8/15/2034c | | | 2,314,600 | |
| | | | Southeast Texas Housing Finance Corporation Single Family Mortgage Revenue Bonds (NATL-RE Insured) | | | | |
| | 11,615,000 | | | Zero Coupon, 9/1/2017a,c | | | 11,058,874 | |
| | | | Southwest Higher Education Authority, Inc. Higher Education Revenue Bonds (Southern Methodist University) | | | | |
| | 1,500,000 | | | 5.000%, 10/1/2041 | | | 1,713,105 | |
| | | | Tarrant County College District, Texas General Obligation Refunding Bonds | | | | |
| | 1,410,000 | | | 5.375%, 2/15/2013 | | | 1,430,403 | |
| | | | Tarrant County Cultural Education Facilities Finance Corporation Hospital Revenue Bonds (Hendrick Medical Center) (AGM Insured) | | | | |
| | 1,250,000 | | | 5.250%, 9/1/2026, Series Bc | | | 1,414,063 | |
| | 2,000,000 | | | 5.250%, 9/1/2027, Series Bc | | | 2,253,320 | |
| | 1,000,000 | | | 5.250%, 9/1/2028, Series Bc | | | 1,122,100 | |
| | | | Tarrant County Cultural Education Facilities Finance Corporation Refunding Revenue Bonds (Texas Health Resources System) | | | | |
| | 2,000,000 | | | 5.000%, 2/15/2023, Series A | | | 2,226,500 | |
| | | | Texas College Student Loan General Obligation Bonds | | | | |
| | 1,900,000 | | | 5.000%, 8/1/2017, AMT | | | 2,227,769 | |
| | | | Westlake, Certificates of Obligation | | | | |
| | 315,000 | | | 6.500%, 5/1/2013 | | | 324,437 | |
| | 350,000 | | | 6.500%, 5/1/2015a | | | 382,158 | |
| | 335,000 | | | 6.500%, 5/1/2017a | | | 365,780 | |
| | 1,650,000 | | | 5.750%, 5/1/2024a | | | 1,783,238 | |
| | 2,000,000 | | | 5.800%, 5/1/2032a | | | 2,162,980 | |
| | | | | |
| | | | Total | | | 196,695,510 | |
| | | | | |
| |
| Utah (0.9%) | | | | |
| | | | Riverton, Utah Hospital Revenue Bonds (IHC Health Services, Inc.) | | | | |
| | 3,000,000 | | | 5.000%, 8/15/2041 | | | 3,330,420 | |
| | | | Utah Associated Municipal Power Systems Revenue and Refunding Bonds (Central-St. George Transmission) | | | | |
| | 6,000,000 | | | 5.250%, 12/1/2027 | | | 6,728,460 | |
The accompanying Notes to Financial Statements are an integral part of this schedule.
179
Municipal Bond Fund
Schedule of Investments as of October 31, 2012
| | | | | | | | |
Principal
Amount | | | Long-Term Fixed Income (98.9%) | | Value | |
| Utah (0.9%) - continued | | | | |
| | | | Utah County, Utah Hospital Revenue Bonds (IHC Health Services, Inc.) | | | | |
| | $3,000,000 | | | 5.000%, 5/15/2043 | | | $3,390,630 | |
| | | | Utah State Charter School Finance Authority Charter School Revenue Bonds (North Davis Preparatory) | | | | |
| | 1,000,000 | | | 6.250%, 7/15/2030 | | | 1,053,490 | |
| | | | | |
| | | | Total | | | 14,503,000 | |
| | | | | |
| |
| Virginia (1.2%) | | | | |
| | | | Fairfax County, Virginia Industrial Development Authority Health Care Revenue Bonds (Inova Health System) | | | | |
| | 1,000,000 | | | 5.000%, 5/15/2025, Series C | | | 1,153,610 | |
| | | | Fairfax County, Virginia Industrial Development Authority Hospital Revenue Refunding Bonds (Inova Health System Hospitals) | | | | |
| | 2,500,000 | | | 5.250%, 8/15/2019 | | | 2,884,575 | |
| | | | Virginia Commonwealth Transportation Board Revenue Bonds | | | | |
| | 10,000,000 | | | 5.000%, 5/15/2034 | | | 11,733,100 | |
| | | | Virginia Port Authority Port Facilities Revenue Refunding Bonds | | | | |
| | 2,000,000 | | | 5.000%, 7/1/2040 | | | 2,223,060 | |
| | | | Virginia Small Business Financing Authority Revenue Bonds (Elizabeth River Crossings Opco, LLC) | | | | |
| | 2,000,000 | | | 6.000%, 1/1/2037, AMT | | | 2,288,340 | |
| | | | | |
| | | | Total | | | 20,282,685 | |
| | | | | |
| |
| Washington (3.6%) | | | | |
| | | | Franklin County, Washington, Pasco School District No. 1 Unlimited Tax General Obligation Bonds (NATL-RE Insured) | | | | |
| | 6,000,000 | | | 5.250%, 12/1/2022a,c | | | 7,000,800 | |
| | | | FYI Properties Lease Revenue Bonds (State of Washington DIS) | | | | |
| | 2,500,000 | | | 5.500%, 6/1/2034 | | | 2,830,400 | |
| | | | King County, Washington Limited Tax General Obligation Bonds | | | | |
| | 1,100,000 | | | 5.125%, 1/1/2033 | | | 1,292,555 | |
| | | | Tobacco Settlement Authority Tobacco Settlement Asset-Backed Bonds | | | | |
| | 6,890,000 | | | 6.500%, 6/1/2026 | | | 7,185,994 | |
| | | | Washington Economic Development Finance Authority Lease Revenue Bonds (Washington Biomedical Research Properties II) (NATL-RE Insured) | | | | |
| | 5,620,000 | | | 5.000%, 6/1/2030c | | | 6,043,242 | |
| | | | Washington General Obligation Bonds | | | | |
| | 3,200,000 | | | 6.750%, 2/1/2015, Series A | | | 3,355,968 | |
| | | | Washington General Obligation Bonds (AGM Insured) | | | | |
| | 5,000,000 | | | 5.000%, 7/1/2021, Series 2007Ac | | | 5,721,900 | |
| | | | Washington Health Care Facilities Authority Revenue Bonds | | | | |
| | 2,500,000 | | | 5.250%, 12/1/2030 | | | 2,690,475 | |
| | 5,000,000 | | | 5.250%, 10/1/2032, Series A | | | 5,660,350 | |
| | | | Washington Health Care Facilities Authority Revenue Bonds (Kadlec Medical Center) (AGM Insured) | | | | |
| | 1,000,000 | | | 5.000%, 12/1/2030, Series Ac | | | 1,047,160 | |
| | | | Washington Health Care Facilities Authority Revenue Bonds (Kadlec Regional Medical Center) | | | | |
| | 1,500,000 | | | 5.000%, 12/1/2042 | | | 1,548,540 | |
| | | | Washington Health Care Facilities Authority Revenue Bonds (Seattle Cancer Care Alliance) | | | | |
| | 5,000,000 | | | 7.375%, 3/1/2038 | | | 6,169,850 | |
| | | | Washington Higher Education Facilities Authority Refunding Revenue Bonds (Gonzaga University) | | | | |
| | 5,325,000 | | | 5.000%, 4/1/2029, Series B | | | 5,770,117 | |
| | | | Washington Higher Education Facilities Authority Revenue and Refunding Revenue Bonds (Whitworth University) | | | | |
| | 1,290,000 | | | 5.875%, 10/1/2034 | | | 1,446,206 | |
| | 1,000,000 | | | 5.625%, 10/1/2040 | | | 1,092,120 | |
| | | | | |
| | | | Total | | | 58,855,677 | |
| | | | | |
| |
| Wisconsin (1.0%) | | | | |
| | | | Kaukauna, Wisconsin Electric System Revenue Bonds (AGM Insured) | | | | |
| | 3,000,000 | | | 5.000%, 12/15/2035, Series Ac | | | 3,306,780 | |
| | | | Monroe, Wisconsin Redevelopment Authority Development Revenue Bonds (Monroe Clinic, Inc.) | | | | |
| | 3,500,000 | | | 5.875%, 2/15/2039 | | | 3,914,435 | |
The accompanying Notes to Financial Statements are an integral part of this schedule.
180
Municipal Bond Fund
Schedule of Investments as of October 31, 2012
| | | | | | | | |
Principal
Amount | | | Long-Term Fixed Income (98.9%) | | Value | |
| Wisconsin (1.0%) - continued | | | | |
| | | | Wisconsin Health and Educational Facilities Authority Revenue Bonds (Blood Center of Southeastern Wisconsin, Inc.) | | | | |
| | $2,000,000 | | | 5.750%, 6/1/2034 | | | $2,101,460 | |
| | | | Wisconsin Health and Educational Facilities Authority Revenue Bonds (Thedacare, Inc.) | | | | |
| | 5,300,000 | | | 5.500%, 12/15/2038, Series A | | | 5,909,023 | |
| | | | Wisconsin Health and Educational Facilities Authority Revenue Refunding Bonds (Marquette University) | | | | |
| | 1,000,000 | | | 5.000%, 10/1/2033, Series B-1 | | | 1,101,880 | |
| | | | | |
| | | | Total | | | 16,333,578 | |
| | | | | |
| |
| Wyoming (1.5%) | | | | |
| | | | Kemmerer, Wyoming Pollution Control Revenue Bonds (Exxon) | | | | |
| | 4,800,000 | | | 0.220%, 11/1/2014b | | | 4,800,000 | |
| | | | Lincoln County, Wyoming Pollution Control Revenue Bonds (Exxon) | | | | |
| | 985,000 | | | 0.220%, 11/1/2014, Series Db | | | 985,000 | |
| | 5,025,000 | | | 0.220%, 11/1/2014, Series Bb | | | 5,025,000 | |
| | 2,885,000 | | | 0.220%, 11/1/2014, Series Cb | | | 2,885,000 | |
| | | | Wyoming Municipal Power Agency Power Supply System Revenue Bonds | | | | |
| | 3,270,000 | | | 5.375%, 1/1/2042, Series A | | | 3,542,326 | |
| | | | Wyoming State Farm Loan Board Capital Facilities Refunding Revenue Bonds | | | | |
| | 5,825,000 | | | 5.750%, 10/1/2020 | | | 6,735,797 | |
| | | | | |
| | | | Total | | | 23,973,123 | |
| | | | | |
| | | | Total Long-Term Fixed Income (cost $1,457,474,356) | | | 1,617,137,623 | |
| | | | | |
| | | | | | | | |
| | | | | |
| | | | Total Investments (cost $1,457,474,356) 98.9% | | | $1,617,137,623 | |
| | | | | |
| | | | Other Assets and Liabilities, Net 1.1% | | | 17,362,155 | |
| | | | | |
| | | | Total Net Assets 100.0% | | | $1,634,499,778 | |
| | | | | |
a | Denotes securities that have been pre-refunded or escrowed to maturity. Under such an arrangement, money is deposited into an irrevocable escrow account and is used to purchase U.S. Treasury securities or government agency securities with maturing principal and interest earnings sufficient to pay all debt service requirements of the pre-refunded bonds. |
b | Denotes variable rate securities. Variable rate securities are securities whose yields vary with a designated market index or market rate. The rate shown is as of October 31, 2012. |
c | To reduce certain risks associated with securities issued by municipalities, which may include but are not limited to economic development in a specific industry or municipality, the principal and/or interest payments are guaranteed by the bond insurance company or government agency identified. |
d | Denotes step coupon securities. Step coupon securities pay an initial coupon rate for the first period and then different coupon rates for following periods. The rate shown is as of October 31, 2012. |
e | Denotes restricted securities. Restricted securities are investment securities which have been deemed illiquid and cannot be offered for public sale without first being registered under the Securities Act of 1933. The following table indicates the acquisition date and cost of restricted securities Municipal Bond Fund owned as of October 31, 2012. |
| | | | | | | | |
Security | | Acquisition
Date | | | Cost | |
Regional Transit Authority, Louisiana Sales Tax Revenue Refunding Bonds (NATL-RE FGIC Insured) | | | 1/21/2000 | | | $ | 2,609,525 | |
f | Denotes investments purchased on a when-issued or delayed delivery basis. |
Definitions:
| | | | | | |
| | ACA | | - | | American Capital Access Holding, Ltd. |
| | AGM | | - | | Assured Guaranty Municipal Corporation |
| | AMBAC | | - | | American Municipal Bond Insurance |
| | | | | | Corporation |
| | AMT | | - | | Subject to Alternative Minimum Tax |
| | BNY | | - | | The Bank of New York Mellon Corporation |
| | CR | | - | | Custodial Receipts |
| | FGIC | | - | | Financial Guaranty Insurance Company |
| | FHA | | - | | Federal Housing Administration |
| | FNMA | | - | | Federal National Mortgage Association |
| | FSA | | - | | Financial Security Assurance, Inc. |
| | GNMA | | - | | Government National Mortgage Association |
| | IBC | | - | | Insured Bond Certificate |
| | NATL-RE | | - | | National Public Finance Guarantee |
| | | | | | Corporation |
| | PSF-GTD | | - | | Permanent School Fund Guarantee Program |
| | Q-SBLF | | - | | Qualified School Bond Loan Fund |
| | TCRS | | - | | Temporary Custodial Receipts |
| | VA MTGS | | - | | Department of Veterans’ Affairs - Mortgages |
| | XLCA | | - | | XL Capital Assurance |
Unrealized Appreciation (Depreciation)
Gross unrealized appreciation and depreciation of investments, based on cost for federal income tax purposes, were as follows:
| | | | |
Gross unrealized appreciation | | | $160,238,366 | |
Gross unrealized depreciation | | | (575,099 | ) |
| | | | |
Net unrealized appreciation (depreciation) | | | $159,663,267 | |
| |
Cost for federal income tax purposes | | | $1,457,474,356 | |
The accompanying Notes to Financial Statements are an integral part of this schedule.
181
Municipal Bond Fund
Schedule of Investments as of October 31, 2012
Fair Valuation Measurements
The following table is a summary of the inputs used, as of October 31, 2012, in valuing Municipal Bond Fund’s assets carried at fair value.
| | | | | | | | | | | | | | | | |
Investments in Securities | | Total | | | Level 1 | | | Level 2 | | | Level 3 | |
| | | | |
Long-Term Fixed Income | | | | | | | | | | | | | | | | |
Education | | | 182,690,692 | | | | – | | | | 182,690,692 | | | | – | |
Electric Revenue | | | 61,193,377 | | | | – | | | | 61,193,377 | | | | – | |
Escrowed/Pre-refunded | | | 166,492,906 | | | | – | | | | 166,492,906 | | | | – | |
General Obligation | | | 256,118,295 | | | | – | | | | 256,118,295 | | | | – | |
Health Care | | | 213,377,561 | | | | – | | | | 213,377,561 | | | | – | |
Housing Finance | | | 10,479,617 | | | | – | | | | 10,479,617 | | | | – | |
Industrial Development Revenue | | | 67,023,350 | | | | – | | | | 67,023,350 | | | | – | |
Other Revenue | | | 270,322,212 | | | | – | | | | 270,322,212 | | | | – | |
Tax Revenue | | | 77,368,131 | | | | – | | | | 77,368,131 | | | | – | |
Transportation | | | 239,469,256 | | | | – | | | | 239,469,256 | | | | – | |
Water & Sewer | | | 72,602,226 | | | | – | | | | 72,602,226 | | | | – | |
| |
Total | | | $1,617,137,623 | | | | $– | | | | $1,617,137,623 | | | | $– | |
| |
There were no significant transfers between Levels during the period ended October 31, 2012. Transfers between Levels are identified as of the end of the period.
The accompanying Notes to Financial Statements are an integral part of this schedule.
182
Income Fund
Schedule of Investments as of October 31, 2012
| | | | | | | | |
Principal Amount | | | Bank Loans (2.8%)a | | Value | |
| Basic Materials (0.3%) | | | | |
| | | | Arch Coal, Inc., Term Loan | | | | |
| | $892,762 | | | 5.750%, 5/16/2018 | | | $899,780 | |
| | | | FMG Resources August 2006 Pty., Ltd., Term Loan | | | | |
| | 1,000,000 | | | 0.000%, 10/18/2017b,c | | | 994,500 | |
| | | | Ineos US Finance, LLC, Term Loan | | | | |
| | 895,500 | | | 6.500%, 5/4/2018 | | | 907,249 | |
| | | | | |
| | | | Total | | | 2,801,529 | |
| | | | | |
| |
| Capital Goods (0.1%) | | | | |
| | | | ADS Waste Holdings, Inc., Term Loan | | | | |
| | 540,000 | | | 0.815%, 10/9/2019b,c | | | 544,860 | |
| | | | | |
| | | | Total | | | 544,860 | |
| | | | | |
| |
| Communications Services (0.8%) | | | | |
| | | | Atlantic Broadband Finance, LLC, Term Loan | | | | |
| | 897,750 | | | 5.250%, 4/4/2019 | | | 900,371 | |
| | | | Charter Communications Operating, LLC, Term Loan | | | | |
| | 527,350 | | | 4.000%, 5/15/2019 | | | 530,809 | |
| | | | Clear Channel Communications, Term Loan | | | | |
| | 900,000 | | | 3.862%, 1/29/2016b,c | | | 738,567 | |
| | | | Cumulus Media Holdings, Inc., Term Loan | | | | |
| | 890,257 | | | 5.750%, 9/17/2018 | | | 896,044 | |
| | | | Level 3 Financing, Inc., Term Loan | | | | |
| | 900,000 | | | 4.750%, 8/1/2019 | | | 903,699 | |
| | | | Toys R Us, Inc., Term Loan | | | | |
| | 872,813 | | | 5.250%, 5/25/2018 | | | 854,047 | |
| | | | Univision Communications, Inc., Term Loan | | | | |
| | 575,607 | | | 2.212%, 9/29/2014 | | | 573,178 | |
| | | | Van Wagner Communications, Inc., Term Loan | | | | |
| | 180,000 | | | 8.250%, 8/3/2018 | | | 182,025 | |
| | | | WideOpenWest Finance, LLC, Term Loan | | | | |
| | 897,750 | | | 6.250%, 7/17/2018 | | | 905,049 | |
| | | | Zayo Group, LLC, Term Loan | | | | |
| | 897,750 | | | 5.250%, 7/2/2019 | | | 900,892 | |
| | | | | |
| | | | Total | | | 7,384,681 | |
| | | | | |
| |
| Consumer Cyclical (0.3%) | | | | |
| | | | Burlington Coat Factory Warehouse Corporation, Term Loan | | | | |
| | 881,100 | | | 5.500%, 2/23/2017 | | | 887,021 | |
| | | | Chrysler Group, LLC, Term Loan | | | | |
| | 1,422,000 | | | 6.000%, 5/24/2017 | | | 1,451,421 | |
| | | | | |
| | | | Total | | | 2,338,442 | |
| | | | | |
| |
| Consumer Non-Cyclical (0.5%) | | | | |
| | | | Bausch & Lomb, Inc., Term Loan | | | | |
| | 897,750 | | | 5.250%, 5/17/2019 | | | 907,051 | |
| | | | CHS/Community Health Systems, Inc., Term Loan | | | | |
| | 900,000 | | | 3.921%, 1/25/2017 | | | 903,366 | |
| | | | Dole Food Company, Term Loan | | | | |
| | 125,467 | | | 5.036%, 7/13/2018b,c | | | 125,766 | |
| | | | Michael Foods, Inc., Term Loan | | | | |
| | 720,357 | | | 4.250%, 2/25/2018 | | | 722,878 | |
| | | | Roundy’s Supermarkets, Inc., Term Loan | | | | |
| | 895,500 | | | 5.750%, 2/13/2019 | | | 868,474 | |
| | | | Solvest, Ltd., Term Loan | | | | |
| | 224,521 | | | 5.021%, 7/13/2018b,c | | | 225,055 | |
| | | | Visant Corporation, Term Loan | | | | |
| | 710,000 | | | 5.250%, 12/22/2016b,c | | | 678,639 | |
| | | | | |
| | | | Total | | | 4,431,229 | |
| | | | | |
| |
| Energy (<0.1%) | | | | |
| | | | Chesapeake Energy Corporation, Term Loan | | | | |
| | 274,349 | | | 8.500%, 12/2/2017 | | | 274,613 | |
| | | | | |
| | | | Total | | | 274,613 | |
| | | | | |
| |
| Financials (0.1%) | | | | |
| | | | Nuveen Investments, Inc., Term Loan | | | | |
| | 900,000 | | | 5.846%, 5/13/2017 | | | 898,596 | |
| | | | | |
| | | | Total | | | 898,596 | |
| | | | | |
| |
| Technology (0.4%) | | | | |
| | | | First Data Corporation Extended, Term Loan | | | | |
| | 900,000 | | | 4.211%, 3/26/2018 | | | 857,250 | |
| | | | Freescale Semiconductor, Term Loan | | | | |
| | 939,430 | | | 4.465%, 12/1/2016 | | | 908,664 | |
| | | | Infor US, Inc., Term Loan | | | | |
| | 623,438 | | | 6.250%, 4/5/2018 | | | 629,865 | |
| | | | Intelsat Jackson Holdings SA, Term Loan | | | | |
| | 1,096,125 | | | 4.500%, 4/2/2018 | | | 1,103,206 | |
| | | | Syniverse Holdings, Inc., Term Loan | | | | |
| | 359,100 | | | 5.000%, 4/23/2019 | | | 360,895 | |
| | | | | |
| | | | Total | | | 3,859,880 | |
| | | | | |
| |
| Transportation (0.1%) | | | | |
| | | | Delta Air Lines, Inc., Term Loan | | | | |
| | 1,431,875 | | | 5.500%, 4/20/2017 | | | 1,430,443 | |
| | | | | |
| | | | Total | | | 1,430,443 | |
| | | | | |
| |
| Utilities (0.2%) | | | | |
| | | | Calpine Corporation, Term Loan | | | | |
| | 700,000 | | | 4.500%, 10/9/2019 | | | 700,511 | |
| | | | NGPL PipeCo, LLC, Term Loan | | | | |
| | 900,000 | | | 6.750%, 9/15/2017 | | | 917,253 | |
| | | | | |
| | | | Total | | | 1,617,764 | |
| | | | | |
| | | | | | | | |
| | | | | |
| | | | Total Bank Loans (cost $25,339,219) | | | 25,582,037 | |
| | | | | |
| | |
Principal Amount | | | Long-Term Fixed Income (93.9%) | | Value | |
| Asset-Backed Securities (0.8%) | | | | |
| | | | Carrington Mortgage Loan Trust | | | | |
| | 1,100,000 | | | 0.361%, 8/25/2036d | | | 448,348 | |
The accompanying Notes to Financial Statements are an integral part of this schedule.
183
Income Fund
Schedule of Investments as of October 31, 2012
| | | | | | | | |
Principal
Amount | | | Long-Term Fixed Income (93.9%) | | Value | |
| Asset-Backed Securities (0.8%) - continued | | | | |
| | | | First Horizon ABS Trust | | | | |
| | $1,004,709 | | | 0.371%, 10/25/2034d,e | | | $718,002 | |
| | | | GMAC Mortgage Corporation Loan Trust | | | | |
| | 2,569,249 | | | 0.391%, 8/25/2035d,e | | | 1,729,298 | |
| | 2,811,365 | | | 0.391%, 12/25/2036d,e | | | 2,025,591 | |
| | | | IndyMac Seconds Asset-Backed Trust | | | | |
| | 1,476,080 | | | 0.381%, 10/25/2036d,e | | | 366,937 | |
| | | | Renaissance Home Equity Loan Trust | | | | |
| | 1,969,990 | | | 5.746%, 5/25/2036 | | | 1,251,637 | |
| | 1,400,000 | | | 6.011%, 5/25/2036 | | | 823,826 | |
| | | | | |
| | | | Total | | | 7,363,639 | |
| | | | | |
| |
| Basic Materials (3.5%) | | | | |
| | | | AbitibiBowater, Inc. | | | | |
| | 982,000 | | | 10.250%, 10/15/2018 | | | 1,119,480 | |
| | | | Alcoa, Inc. | | | | |
| | 710,000 | | | 5.720%, 2/23/2019 | | | 776,707 | |
| | 1,000,000 | | | 6.750%, 1/15/2028 | | | 1,106,322 | |
| | | | ArcelorMittal | | | | |
| | 790,000 | | | 9.250%, 2/15/2015 | | | 876,900 | |
| | 2,250,000 | | | 5.500%, 8/5/2020 | | | 2,170,035 | |
| | | | CF Industries, Inc. | | | | |
| | 1,670,000 | | | 6.875%, 5/1/2018 | | | 2,050,733 | |
| | | | Dow Chemical Company | | | | |
| | 2,150,000 | | | 4.250%, 11/15/2020 | | | 2,383,165 | |
| | 880,000 | | | 5.250%, 11/15/2041 | | | 1,006,509 | |
| | | | Freeport-McMoRan Copper & Gold, Inc. | | | | |
| | 2,460,000 | | | 3.550%, 3/1/2022 | | | 2,504,767 | |
| | | | Georgia-Pacific, LLC | | | | |
| | 1,310,000 | | | 5.400%, 11/1/2020f | | | 1,554,775 | |
| | | | International Paper Company | | | | |
| | 1,500,000 | | | 7.500%, 8/15/2021 | | | 1,992,001 | |
| | 750,000 | | | 7.300%, 11/15/2039 | | | 1,041,725 | |
| | | | LyondellBasell Industries NV | | | | |
| | 1,600,000 | | | 5.000%, 4/15/2019 | | | 1,732,000 | |
| | 180,000 | | | 6.000%, 11/15/2021 | | | 208,125 | |
| | | | NOVA Chemicals Corporation | | | | |
| | 750,000 | | | 8.625%, 11/1/2019 | | | 849,375 | |
| | | | Rio Tinto Finance USA, Ltd. | | | | |
| | 1,965,000 | | | 6.500%, 7/15/2018 | | | 2,464,479 | |
| | | | Rock-Tenn Company | | | | |
| | 1,070,000 | | | 4.000%, 3/1/2023f | | | 1,101,696 | |
| | | | Teck Resources, Ltd. | | | | |
| | 700,000 | | | 2.500%, 2/1/2018 | | | 708,073 | |
| | 1,050,000 | | | 3.750%, 2/1/2023g | | | 1,063,711 | |
| | | | Vale Overseas, Ltd. | | | | |
| | 1,075,000 | | | 6.875%, 11/10/2039g | | | 1,337,655 | |
| | | | Weyerhaeuser Company | | | | |
| | 1,430,000 | | | 7.375%, 3/15/2032 | | | 1,820,137 | |
| | | | Xstrata Finance Canada, Ltd. | | | | |
| | 1,440,000 | | | 2.450%, 10/25/2017f | | | 1,436,314 | |
| | 720,000 | | | 4.000%, 10/25/2022f | | | 723,172 | |
| | | | | |
| | | | Total | | | 32,027,856 | |
| | | | | |
| |
| Capital Goods (2.6%) | | | | |
| | | | BAE Systems plc | | | | |
| | 2,120,000 | | | 4.750%, 10/11/2021f | | | 2,384,748 | |
| | | | Boeing Capital Corporation | | | | |
| | 900,000 | | | 2.125%, 8/15/2016 | | | 944,113 | |
| | | | Bombardier, Inc. | | | | |
| | 1,060,000 | | | 5.750%, 3/15/2022f | | | 1,116,975 | |
| | | | Case New Holland, Inc. | | | | |
| | 750,000 | | | 7.750%, 9/1/2013 | | | 787,500 | |
| | 865,000 | | | 7.875%, 12/1/2017 | | | 1,016,375 | |
| | | | CNH Capital, LLC | | | | |
| | 720,000 | | | 3.875%, 11/1/2015f | | | 738,000 | |
| | 250,000 | | | 6.250%, 11/1/2016f | | | 270,000 | |
| | | | Flowserve Corporation | | | | |
| | 1,800,000 | | | 3.500%, 9/15/2022 | | | 1,831,513 | |
| | | | John Deere Capital Corporation | | | | |
| | 1,700,000 | | | 5.350%, 4/3/2018 | | | 2,038,433 | |
| | | | Masco Corporation | | | | |
| | 875,000 | | | 5.950%, 3/15/2022 | | | 979,089 | |
| | | | Owens Corning, Inc. | | | | |
| | 720,000 | | | 4.200%, 12/15/2022 | | | 727,733 | |
| | | | Republic Services, Inc. | | | | |
| | 370,000 | | | 5.500%, 9/15/2019 | | | 438,651 | |
| | 900,000 | | | 5.000%, 3/1/2020 | | | 1,044,051 | |
| | 1,300,000 | | | 5.250%, 11/15/2021 | | | 1,554,112 | |
| | | | Reynolds Group Issuer, Inc. | | | | |
| | 1,060,000 | | | 9.875%, 8/15/2019 | | | 1,110,350 | |
| | 360,000 | | | 5.750%, 10/15/2020f | | | 363,600 | |
| | | | Sealed Air Corporation | | | | |
| | 710,000 | | | 8.375%, 9/15/2021f | | | 781,000 | |
| | | | Textron, Inc. | | | | |
| | 1,500,000 | | | 6.200%, 3/15/2015 | | | 1,643,446 | |
| | 1,430,000 | | | 5.600%, 12/1/2017 | | | 1,574,350 | |
| | | | United Rentals North America, Inc. | | | | |
| | 180,000 | | | 6.125%, 6/15/2023 | | | 182,250 | |
| | | | UR Financing Escrow Corporation | | | | |
| | 700,000 | | | 5.750%, 7/15/2018f | | | 752,500 | |
| | | | Waste Management, Inc. | | | | |
| | 1,335,000 | | | 2.900%, 9/15/2022 | | | 1,341,019 | |
| | | | | |
| | | | Total | | | 23,619,808 | |
| | | | | |
| |
| Collateralized Mortgage Obligations (1.0%) | | | | |
| | | | Bear Stearns Mortgage Funding Trust | | | | |
| | 417,152 | | | 0.491%, 8/25/2036d | | | 118,833 | |
| | | | CitiMortgage Alternative Loan Trust | | | | |
| | 1,639,593 | | | 5.750%, 4/25/2037 | | | 1,296,783 | |
| | | | Countrywide Alternative Loan Trust | | | | |
| | 2,266,335 | | | 6.000%, 1/25/2037 | | | 1,854,467 | |
| | | | HomeBanc Mortgage Trust | | | | |
| | 1,698,254 | | | 2.634%, 4/25/2037 | | | 1,081,428 | |
| | | | Wachovia Mortgage Loan Trust, LLC | | | | |
| | 1,786,317 | | | 2.898%, 5/20/2036 | | | 1,393,529 | |
| | | | WaMu Mortgage Pass Through Certificates | | | | |
| | 1,260,685 | | | 0.501%, 10/25/2045d | | | 1,138,470 | |
The accompanying Notes to Financial Statements are an integral part of this schedule.
184
Income Fund
Schedule of Investments as of October 31, 2012
| | | | | | | | |
Principal
Amount | | | Long-Term Fixed Income (93.9%) | | Value | |
| Collateralized Mortgage Obligations (1.0%) - continued | | | | |
| | | | Washington Mutual Alternative Mortgage Pass Through Certificates | | | | |
| | $3,014,470 | | | 0.904%, 2/25/2047d | | | $1,464,179 | |
| | | | | |
| | | | Total | | | 8,347,689 | |
| | | | | |
| |
| Commercial Mortgage-Backed Securities (1.6%) | | | | |
| | | | Bear Stearns Commercial Mortgage Securities, Inc. | | | | |
| | 305,704 | | | 0.364%, 3/15/2022d,f | | | 296,664 | |
| | 2,500,000 | | | 5.331%, 2/11/2044 | | | 2,786,145 | |
| | | | Citigroup/Deutsche Bank Commercial Mortgage | | | | |
| | 1,300,000 | | | 5.322%, 12/11/2049 | | | 1,494,007 | |
| | | | Commercial Mortgage Pass-Through Certificates | | | | |
| | 4,000,000 | | | 0.344%, 12/15/2020d,f | | | 3,718,052 | |
| | | | Credit Suisse First Boston Mortgage Securities | | | | |
| | 1,800,000 | | | 5.542%, 1/15/2049 | | | 2,035,627 | |
| | | | Credit Suisse Mortgage Capital Certificates | | | | |
| | 1,583,619 | | | 0.384%, 10/15/2021d,f | | | 1,545,254 | |
| | 2,500,000 | | | 5.467%, 9/15/2039 | | | 2,851,903 | |
| | | | | |
| | | | Total | | | 14,727,652 | |
| | | | | |
| |
| Communications Services (9.1%) | | | | |
| | | | Alltel Corporation | | | | |
| | 2,350,000 | | | 7.000%, 3/15/2016 | | | 2,817,885 | |
| | | | America Movil SAB de CV | | | | |
| | 2,200,000 | | | 5.000%, 3/30/2020 | | | 2,588,078 | |
| | 900,000 | | | 3.125%, 7/16/2022 | | | 928,068 | |
| | | | American Tower Corporation | | | | |
| | 2,180,000 | | | 4.500%, 1/15/2018 | | | 2,414,054 | |
| | 720,000 | | | 5.900%, 11/1/2021 | | | 862,353 | |
| | | | AT&T, Inc. | | | | |
| | 1,400,000 | | | 4.450%, 5/15/2021 | | | 1,665,751 | |
| | 1,245,000 | | | 5.550%, 8/15/2041 | | | 1,584,590 | |
| | | | Cablevision Systems Corporation | | | | |
| | 700,000 | | | 8.625%, 9/15/2017 | | | 817,250 | |
| | | | CBS Corporation | | | | |
| | 1,780,000 | | | 1.950%, 7/1/2017 | | | 1,823,555 | |
| | 700,000 | | | 7.875%, 9/1/2023 | | | 901,566 | |
| | | | CCO Holdings, LLC | | | | |
| | 1,120,000 | | | 7.250%, 10/30/2017 | | | 1,223,600 | |
| | 720,000 | | | 7.000%, 1/15/2019 | | | 774,000 | |
| | | | CenturyLink, Inc. | | | | |
| | 1,480,000 | | | 5.150%, 6/15/2017 | | | 1,595,191 | |
| | 2,400,000 | | | 5.800%, 3/15/2022 | | | 2,526,204 | |
| | | | Clear Channel Worldwide Holdings, Inc. | | | | |
| | 1,830,000 | | | 9.250%, 12/15/2017 | | | 1,962,675 | |
| | | | Comcast Corporation | | | | |
| | 1,100,000 | | | 6.300%, 11/15/2017 | | | 1,365,932 | |
| | 1,100,000 | | | 5.700%, 5/15/2018 | | | 1,339,307 | |
| | 1,430,000 | | | 3.125%, 7/15/2022 | | | 1,503,205 | |
| | 1,300,000 | | | 6.400%, 5/15/2038 | | | 1,712,273 | |
| | | | Cox Communications, Inc. | | | | |
| | 1,100,000 | | | 9.375%, 1/15/2019f | | | 1,536,339 | |
| | 1,500,000 | | | 8.375%, 3/1/2039f | | | 2,380,151 | |
| | | | Crown Castle International Corporation | | | | |
| | 360,000 | | | 5.250%, 1/15/2023f | | | 372,600 | |
| | | | Crown Castle Towers, LLC | | | | |
| | 2,950,000 | | | 4.174%, 8/15/2017f | | | 3,239,876 | |
| | | | DIRECTV Holdings, LLC | | | | |
| | 2,125,000 | | | 5.000%, 3/1/2021 | | | 2,416,406 | |
| | 1,095,000 | | | 3.800%, 3/15/2022 | | | 1,140,902 | |
| | | | Discovery Communications, LLC | | | | |
| | 1,080,000 | | | 4.375%, 6/15/2021 | | | 1,222,038 | |
| | 535,000 | | | 3.300%, 5/15/2022 | | | 562,449 | |
| | | | Dish DBS Corporation | | | | |
| | 1,055,000 | | | 6.750%, 6/1/2021 | | | 1,175,006 | |
| | | | Hughes Satellite Systems Corporation | | | | |
| | 1,780,000 | | | 6.500%, 6/15/2019 | | | 1,904,600 | |
| | | | Intelsat Jackson Holdings SA | | | | |
| | 710,000 | | | 7.250%, 4/1/2019 | | | 761,475 | |
| | 1,100,000 | | | 7.500%, 4/1/2021 | | | 1,179,750 | |
| | | | Interpublic Group of Companies, Inc. | | | | |
| | 1,425,000 | | | 4.000%, 3/15/2022 | | | 1,494,646 | |
| | | | NBCUniversal Media, LLC | | | | |
| | 2,250,000 | | | 5.150%, 4/30/2020 | | | 2,694,490 | |
| | 2,490,000 | | | 4.375%, 4/1/2021 | | | 2,850,856 | |
| | 890,000 | | | 2.875%, 1/15/2023 | | | 896,997 | |
| | | | News America, Inc. | | | | |
| | 1,100,000 | | | 7.625%, 11/30/2028 | | | 1,443,190 | |
| | 1,350,000 | | | 6.400%, 12/15/2035 | | | 1,731,256 | |
| | | | Oi SA | | | | |
| | 975,000 | | | 5.750%, 2/10/2022f | | | 1,053,000 | |
| | | | Omnicom Group, Inc. | | | | |
| | 2,310,000 | | | 3.625%, 5/1/2022 | | | 2,470,621 | |
| | | | Qwest Communications International, Inc. | | | | |
| | 1,820,000 | | | 7.125%, 4/1/2018 | | | 1,922,411 | |
| | | | Qwest Corporation | | | | |
| | 1,800,000 | | | 6.500%, 6/1/2017 | | | 2,112,192 | |
| | | | SBA Tower Trust | | | | |
| | 2,000,000 | | | 5.101%, 4/15/2017f | | | 2,221,598 | |
| | | | Sirius XM Radio, Inc. | | | | |
| | 1,070,000 | | | 5.250%, 8/15/2022f | | | 1,070,000 | |
| | | | Sprint Nextel Corporation | | | | |
| | 710,000 | | | 9.125%, 3/1/2017 | | | 834,250 | |
| | 350,000 | | | 7.000%, 3/1/2020f | | | 406,000 | |
| | | | Telemar Norte Leste SA | | | | |
| | 1,670,000 | | | 5.500%, 10/23/2020f | | | 1,795,250 | |
| | | | Time Warner Cable, Inc. | | | | |
| | 1,500,000 | | | 8.250%, 4/1/2019 | | | 2,028,068 | |
| | 1,450,000 | | | 6.750%, 6/15/2039 | | | 1,935,409 | |
| | | | Time Warner Entertainment Company, LP | | | | |
| | 1,150,000 | | | 8.375%, 3/15/2023 | | | 1,639,067 | |
| | | | Univision Communications, Inc. | | | | |
| | 1,170,000 | | | 6.750%, 9/15/2022f | | | 1,170,000 | |
| | | | UPCB Finance VI, Ltd. | | | | |
| | 1,400,000 | | | 6.875%, 1/15/2022f | | | 1,498,000 | |
| | | | Virgin Media Finance plc | | | | |
| | 360,000 | | | 4.875%, 2/15/2022 | | | 363,600 | |
The accompanying Notes to Financial Statements are an integral part of this schedule.
185
Income Fund
Schedule of Investments as of October 31, 2012
| | | | | | | | |
Principal
Amount | | | Long-Term Fixed Income (93.9%) | | Value | |
| Communications Services (9.1%) - continued | | | | |
| | | | WPP Finance 2010 | | | | |
| | $625,000 | | | 3.625%, 9/7/2022 | | | $640,551 | |
| | | | | |
| | | | Total | | | 82,568,581 | |
| | | | | |
| |
| Consumer Cyclical (4.3%) | | | | |
| | | | American Honda Finance Corporation | | | | |
| | 2,600,000 | | | 3.875%, 9/21/2020f | | | 2,810,441 | |
| | | | Daimler Finance North America, LLC | | | | |
| | 1,240,000 | | | 3.875%, 9/15/2021f | | | 1,350,436 | |
| | | | Ford Motor Credit Company, LLC | | | | |
| | 2,100,000 | | | 3.875%, 1/15/2015 | | | 2,189,147 | |
| | 1,800,000 | | | 3.984%, 6/15/2016 | | | 1,907,802 | |
| | 1,750,000 | | | 4.250%, 2/3/2017 | | | 1,865,633 | |
| | 370,000 | | | 6.625%, 8/15/2017 | | | 432,588 | |
| | 1,425,000 | | | 4.250%, 9/20/2022 | | | 1,476,635 | |
| | | | General Motors Financial Company, Inc. | | | | |
| | 620,000 | | | 4.750%, 8/15/2017f | | | 634,755 | |
| | | | Home Depot, Inc. | | | | |
| | 1,390,000 | | | 5.875%, 12/16/2036 | | | 1,879,247 | |
| | | | Hyatt Hotels Corporation | | | | |
| | 1,900,000 | | | 5.750%, 8/15/2015f | | | 2,084,490 | |
| | | | Hyundai Motor Manufacturing Czech | | | | |
| | 1,475,000 | | | 4.500%, 4/15/2015f | | | 1,576,627 | |
| | | | Johnson Controls, Inc. | | | | |
| | 1,850,000 | | | 5.250%, 12/1/2041 | | | 2,109,525 | |
| | | | KIA Motors Corporation | | | | |
| | 1,740,000 | | | 3.625%, 6/14/2016f | | | 1,833,890 | |
| | | | Macy’s Retail Holdings, Inc. | | | | |
| | 1,790,000 | | | 7.450%, 7/15/2017 | | | 2,219,076 | |
| | 1,930,000 | | | 3.875%, 1/15/2022 | | | 2,121,041 | |
| | | | Marriott International, Inc. | | | | |
| | 1,750,000 | | | 3.000%, 3/1/2019 | | | 1,789,480 | |
| | | | MGM Resorts International | | | | |
| | 720,000 | | | 11.125%, 11/15/2017 | | | 793,800 | |
| | | | Sheraton Holding Corporation | | | | |
| | 710,000 | | | 7.375%, 11/15/2015 | | | 823,162 | |
| | | | Starwood Hotels & Resorts Worldwide, Inc. | | | | |
| | 1,150,000 | | | 6.750%, 5/15/2018 | | | 1,390,623 | |
| | | | Time Warner, Inc. | | | | |
| | 700,000 | | | 4.000%, 1/15/2022 | | | 778,697 | |
| | 390,000 | | | 3.400%, 6/15/2022 | | | 416,855 | |
| | 1,400,000 | | | 7.700%, 5/1/2032 | | | 2,051,532 | |
| | | | Toll Brothers Finance Corporation | | | | |
| | 1,000,000 | | | 6.750%, 11/1/2019 | | | 1,192,019 | |
| | | | Toys R Us Property Company II, LLC | | | | |
| | 1,430,000 | | | 8.500%, 12/1/2017 | | | 1,535,462 | |
| | | | Wyndham Worldwide Corporation | | | | |
| | 730,000 | | | 5.625%, 3/1/2021 | | | 814,539 | |
| | 700,000 | | | 4.250%, 3/1/2022 | | | 730,204 | |
| | | | | |
| | | | Total | | | 38,807,706 | |
| | | | | |
| |
| Consumer Non-Cyclical (7.9%) | | | | |
| | | | Altria Group, Inc. | | | | |
| | 338,000 | | | 9.700%, 11/10/2018 | | | 482,062 | |
| | 905,000 | | | 4.750%, 5/5/2021 | | | 1,048,346 | |
| | 1,500,000 | | | 9.950%, 11/10/2038 | | | 2,592,464 | |
| | | | Amgen, Inc. | | | | |
| | 2,150,000 | | | 2.125%, 5/15/2017 | | | 2,235,936 | |
| | | | Anheuser-Busch InBev Worldwide, Inc. | | | | |
| | 1,450,000 | | | 5.375%, 1/15/2020 | | | 1,802,057 | |
| | 1,475,000 | | | 5.000%, 4/15/2020 | | | 1,800,622 | |
| | | | BAT International Finance plc | | | | |
| | 2,140,000 | | | 3.250%, 6/7/2022f | | | 2,223,017 | |
| | | | Beam, Inc. | | | | |
| | 127,000 | | | 5.375%, 1/15/2016 | | | 143,076 | |
| | 900,000 | | | 1.875%, 5/15/2017 | | | 924,084 | |
| | 827,000 | | | 5.875%, 1/15/2036 | | | 1,005,334 | |
| | | | Biomet, Inc. | | | | |
| | 1,370,000 | | | 6.500%, 8/1/2020f | | | 1,414,525 | |
| | | | Boston Scientific Corporation | | | | |
| | 2,200,000 | | | 4.500%, 1/15/2015 | | | 2,357,731 | |
| | | | Bunge Limited Finance Corporation | | | | |
| | 1,265,000 | | | 5.100%, 7/15/2015 | | | 1,361,111 | |
| | | | Cargill, Inc. | | | | |
| | 1,050,000 | | | 3.250%, 11/15/2021f | | | 1,092,907 | |
| | | | Celgene Corporation | | | | |
| | 1,250,000 | | | 1.900%, 8/15/2017 | | | 1,269,191 | |
| | 1,500,000 | | | 3.950%, 10/15/2020 | | | 1,634,811 | |
| | | | ConAgra Foods, Inc. | | | | |
| | 1,775,000 | | | 2.100%, 3/15/2018 | | | 1,796,169 | |
| | | | Covidien International Finance SA | | | | |
| | 2,140,000 | | | 3.200%, 6/15/2022 | | | 2,269,851 | |
| | | | Energizer Holdings, Inc. | | | | |
| | 800,000 | | | 4.700%, 5/24/2022 | | | 858,141 | |
| | | | Express Scripts Holding Company | | | | |
| | 1,265,000 | | | 3.125%, 5/15/2016 | | | 1,346,830 | |
| | 1,765,000 | | | 4.750%, 11/15/2021f | | | 2,059,928 | |
| | | | Fresenius Medical Care US Finance II, Inc. | | | | |
| | 390,000 | | | 5.625%, 7/31/2019f | | | 410,475 | |
| | | | Fresenius Medical Care US Finance, Inc. | | | | |
| | 710,000 | | | 6.500%, 9/15/2018f | | | 795,200 | |
| | | | Grifols, Inc. | | | | |
| | 1,070,000 | | | 8.250%, 2/1/2018 | | | 1,187,700 | |
| | | | Grupo Bimbo SAB de CV | | | | |
| | 2,110,000 | | | 4.500%, 1/25/2022f | | | 2,321,097 | |
| | | | Hasbro, Inc. | | | | |
| | 1,750,000 | | | 6.350%, 3/15/2040 | | | 2,200,124 | |
| | | | HCA, Inc. | | | | |
| | 1,510,000 | | | 8.500%, 4/15/2019 | | | 1,696,863 | |
| | 1,440,000 | | | 4.750%, 5/1/2023 | | | 1,440,000 | |
| | | | Heineken NV | | | | |
| | 1,430,000 | | | 2.750%, 4/1/2023f | | | 1,444,742 | |
| | | | JBS Finance II, Ltd. | | | | |
| | 750,000 | | | 8.250%, 1/29/2018h | | | 781,875 | |
| | | | Koninklijke Philips Electronics NV | | | | |
| | 1,485,000 | | | 3.750%, 3/15/2022 | | | 1,643,487 | |
| | | | Kraft Foods, Inc. | | | | |
| | 339,000 | | | 6.125%, 2/1/2018 | | | 417,990 | |
| | 961,000 | | | 6.125%, 8/23/2018f | | | 1,190,999 | |
| | 942,000 | | | 5.375%, 2/10/2020f | | | 1,155,494 | |
The accompanying Notes to Financial Statements are an integral part of this schedule.
186
Income Fund
Schedule of Investments as of October 31, 2012
| | | | | | | | |
Principal
Amount | | | Long-Term Fixed Income (93.9%) | | Value | |
| Consumer Non-Cyclical (7.9%) - continued | | | | |
| | $858,000 | | | 5.375%, 2/10/2020 | | | $1,053,107 | |
| | 900,000 | | | 5.000%, 6/4/2042f | | | 1,051,084 | |
| | | | Life Technologies Corporation | | | | |
| | 2,115,000 | | | 6.000%, 3/1/2020 | | | 2,531,378 | |
| | | | Molson Coors Brewing Company | | | | |
| | 900,000 | | | 3.500%, 5/1/2022 | | | 964,903 | |
| | 900,000 | | | 5.000%, 5/1/2042 | | | 1,035,492 | |
| | | | Mylan, Inc. | | | | |
| | 1,435,000 | | | 7.875%, 7/15/2020f | | | 1,619,756 | |
| | | | Pernod-Ricard SA | | | | |
| | 2,650,000 | | | 2.950%, 1/15/2017f | | | 2,794,955 | |
| | | | Reynolds American, Inc. | | | | |
| | 2,160,000 | | | 3.250%, 11/1/2022 | | | 2,184,676 | |
| | | | Roche Holdings, Inc. | | | | |
| | 1,790,000 | | | 6.000%, 3/1/2019f | | | 2,251,195 | |
| | | | SABMiller Holdings, Inc. | | | | |
| | 885,000 | | | 2.450%, 1/15/2017f | | | 927,702 | |
| | 1,775,000 | | | 3.750%, 1/15/2022f | | | 1,952,216 | |
| | | | Safeway, Inc. | | | | |
| | 890,000 | | | 5.000%, 8/15/2019 | | | 955,109 | |
| | | | Teva Pharmaceutical Finance IV BV | | | | |
| | 2,275,000 | | | 3.650%, 11/10/2021 | | | 2,476,149 | |
| | | | Tyson Foods, Inc. | | | | |
| | 715,000 | | | 4.500%, 6/15/2022 | | | 757,900 | |
| | | | | |
| | | | Total | | | 70,959,861 | |
| | | | | |
| |
| Energy (9.4%) | | | | |
| | | | Anadarko Petroleum Corporation | | | | |
| | 1,600,000 | | | 6.375%, 9/15/2017 | | | 1,939,621 | |
| | | | BP Capital Markets plc | | | | |
| | 1,750,000 | | | 2.248%, 11/1/2016 | | | 1,828,542 | |
| | 1,975,000 | | | 4.500%, 10/1/2020 | | | 2,319,207 | |
| | | | Canadian Natural Resources, Ltd. | | | | |
| | 1,225,000 | | | 3.450%, 11/15/2021 | | | 1,329,252 | |
| | | | Canadian Oil Sands, Ltd. | | | | |
| | 1,400,000 | | | 4.500%, 4/1/2022f | | | 1,534,145 | |
| | | | CenterPoint Energy Resources Corporation | | | | |
| | 2,400,000 | | | 6.125%, 11/1/2017 | | | 2,923,241 | |
| | | | CNPC HK Overseas Capital, Ltd. | | | | |
| | 1,630,000 | | | 5.950%, 4/28/2041f | | | 2,116,203 | |
| | | | Concho Resources, Inc. | | | | |
| | 1,070,000 | | | 6.500%, 1/15/2022 | | | 1,174,325 | |
| | | | El Paso Pipeline Partners Operating Company, LLC | | | | |
| | 710,000 | | | 5.000%, 10/1/2021 | | | 803,896 | |
| | | | Enbridge Energy Partners, LP | | | | |
| | 550,000 | | | 5.200%, 3/15/2020 | | | 639,781 | |
| | 2,200,000 | | | 8.050%, 10/1/2037 | | | 2,513,500 | |
| | | | Encana Corporation | | | | |
| | 1,080,000 | | | 5.900%, 12/1/2017 | | | 1,288,223 | |
| | 720,000 | | | 5.150%, 11/15/2041 | | | 788,720 | |
| | | | Energy Transfer Partners, LP | | | | |
| | 2,880,000 | | | 6.700%, 7/1/2018 | | | 3,537,156 | |
| | | | EOG Resources, Inc. | | | | |
| | 900,000 | | | 2.625%, 3/15/2023 | | | 921,291 | |
| | | | EQT Corporation | | | | |
| | 800,000 | | | 8.125%, 6/1/2019 | | | 1,002,912 | |
| | | | Gazprom OAO Via Gaz Capital SA | | | | |
| | 1,750,000 | | | 4.950%, 5/23/2016f | | | 1,866,620 | |
| | | | Key Energy Services, Inc. | | | | |
| | 1,175,000 | | | 6.750%, 3/1/2021 | | | 1,169,125 | |
| | | | Kinder Morgan Energy Partners, LP | | | | |
| | 710,000 | | | 6.850%, 2/15/2020 | | | 906,920 | |
| | 2,550,000 | | | 5.800%, 3/1/2021 | | | 3,121,509 | |
| | | | Linn Energy, LLC | | | | |
| | 1,750,000 | | | 7.750%, 2/1/2021 | | | 1,868,125 | |
| | | | Marathon Oil Corporation | | | | |
| | 1,273,000 | | | 5.900%, 3/15/2018 | | | 1,547,647 | |
| | 1,080,000 | | | 2.800%, 11/1/2022 | | | 1,088,655 | |
| | | | Markwest Energy Partners, LP/Markwest Energy Finance Corporation | | | | |
| | 700,000 | | | 6.250%, 6/15/2022 | | | 757,750 | |
| | | | Nabors Industries, Inc. | | | | |
| | 1,425,000 | | | 4.625%, 9/15/2021 | | | 1,567,152 | |
| | | | Newfield Exploration Company | | | | |
| | 390,000 | | | 5.750%, 1/30/2022 | | | 421,200 | |
| | 625,000 | | | 5.625%, 7/1/2024 | | | 667,188 | |
| | | | Noble Energy, Inc. | | | | |
| | 1,900,000 | | | 8.250%, 3/1/2019 | | | 2,521,234 | |
| | | | ONEOK Partners, LP | | | | |
| | 1,750,000 | | | 6.850%, 10/15/2037 | | | 2,351,699 | |
| | | | Petrobras International Finance Company | | | | |
| | 2,700,000 | | | 5.375%, 1/27/2021 | | | 3,061,951 | |
| | | | Phillips 66 | | | | |
| | 700,000 | | | 4.300%, 4/1/2022f | | | 787,144 | |
| | | | Pioneer Natural Resources Company | | | | |
| | 1,500,000 | | | 6.875%, 5/1/2018 | | | 1,844,576 | |
| | 430,000 | | | 3.950%, 7/15/2022 | | | 460,228 | |
| | | | Plains All American Pipeline, LP | | | | |
| | 1,850,000 | | | 6.500%, 5/1/2018 | | | 2,268,309 | |
| | | | Plains Exploration & Production Company | | | | |
| | 1,130,000 | | | 8.625%, 10/15/2019 | | | 1,245,825 | |
| | | | QEP Resources, Inc. | | | | |
| | 1,060,000 | | | 5.375%, 10/1/2022g | | | 1,113,000 | |
| | | | Rowan Companies, Inc. | | | | |
| | 2,550,000 | | | 5.000%, 9/1/2017 | | | 2,795,889 | |
| | 1,175,000 | | | 4.875%, 6/1/2022 | | | 1,299,033 | |
| | | | Samson Investment Company | | | | |
| | 710,000 | | | 9.750%, 2/15/2020f | | | 749,050 | |
| | | | SandRidge Energy, Inc. | | | | |
| | 550,000 | | | 7.500%, 3/15/2021 | | | 572,000 | |
| | 530,000 | | | 7.500%, 3/15/2021f | | | 551,200 | |
| | | | Southwestern Energy Company | | | | |
| | 1,500,000 | | | 4.100%, 3/15/2022f | | | 1,622,799 | |
| | | | Spectra Energy Partners, LP | | | | |
| | 1,800,000 | | | 4.600%, 6/15/2021 | | | 1,963,386 | |
| | | | Suncor Energy, Inc. | | | | |
| | 2,290,000 | | | 6.100%, 6/1/2018 | | | 2,824,175 | |
| | 1,060,000 | | | 6.850%, 6/1/2039 | | | 1,512,801 | |
| | | | Transocean, Inc. | | | | |
| | 1,300,000 | | | 5.050%, 12/15/2016 | | | 1,455,983 | |
| | 1,080,000 | | | 7.375%, 4/15/2018 | | | 1,305,731 | |
| | 720,000 | | | 6.375%, 12/15/2021 | | | 876,120 | |
| | 890,000 | | | 3.800%, 10/15/2022 | | | 910,245 | |
| | | | Valero Energy Corporation | | | | |
| | 1,875,000 | | | 6.125%, 2/1/2020 | | | 2,315,996 | |
| | | | Weatherford International, Inc. | | | | |
| | 1,300,000 | | | 6.350%, 6/15/2017 | | | 1,518,821 | |
The accompanying Notes to Financial Statements are an integral part of this schedule.
187
Income Fund
Schedule of Investments as of October 31, 2012
| | | | | | | | |
Principal
Amount | | | Long-Term Fixed Income (93.9%) | | Value | |
| Energy (9.4%) - continued | | | | |
| | | | Weatherford International, Ltd. | | | | |
| | $2,500,000 | | | 6.000%, 3/15/2018 | | | $2,877,445 | |
| | 450,000 | | | 4.500%, 4/15/2022 | | | 479,077 | |
| | | | Woodside Finance, Ltd. | | | | |
| | 1,875,000 | | | 4.500%, 11/10/2014f | | | 1,994,460 | |
| | | | | |
| | | | Total | | | 84,920,083 | |
| | | | | |
| |
| Financials (25.6%) | | | | |
| | | | ABN Amro North American Holding Preferred Capital Repackage Trust I | | | | |
| | 1,430,000 | | | 6.523%, 12/29/2049f,i | | | 1,430,000 | |
| | | | Aegon NV | | | | |
| | 1,400,000 | | | 1.867%, 7/29/2049d,i | | | 730,450 | |
| | | | Ally Financial, Inc. | | | | |
| | 1,785,000 | | | 4.625%, 6/26/2015 | | | 1,854,392 | |
| | 710,000 | | | 5.500%, 2/15/2017 | | | 751,304 | |
| | | | American Express Credit Corporation | | | | |
| | 2,825,000 | | | 2.800%, 9/19/2016 | | | 3,008,213 | |
| | 1,775,000 | | | 2.375%, 3/24/2017 | | | 1,866,565 | |
| | | | American International Group, Inc. | | | | |
| | 1,775,000 | | | 4.250%, 9/15/2014 | | | 1,878,885 | |
| | 1,050,000 | | | 3.800%, 3/22/2017 | | | 1,132,768 | |
| | 1,750,000 | | | 6.400%, 12/15/2020 | | | 2,149,172 | |
| | | | Associated Banc Corporation | | | | |
| | 1,820,000 | | | 5.125%, 3/28/2016 | | | 1,995,654 | |
| | | | Associates Corporation of North America | | | | |
| | 2,200,000 | | | 6.950%, 11/1/2018 | | | 2,657,703 | |
| | | | AXA SA | | | | |
| | 1,420,000 | | | 8.600%, 12/15/2030 | | | 1,767,184 | |
| | | | Axis Specialty Finance, LLC | | | | |
| | 1,430,000 | | | 5.875%, 6/1/2020 | | | 1,616,990 | |
| | | | Banco do Brasil SA | | | | |
| | 1,050,000 | | | 9.250%, 10/31/2049f,i | | | 1,291,500 | |
| | | | Bank of America Corporation | | | | |
| | 1,420,000 | | | 5.625%, 10/14/2016 | | | 1,619,075 | |
| | 1,700,000 | | | 5.750%, 12/1/2017 | | | 1,969,095 | |
| | 2,220,000 | | | 7.625%, 6/1/2019 | | | 2,815,204 | |
| | 420,000 | | | 5.625%, 7/1/2020 | | | 490,017 | |
| | 1,060,000 | | | 5.875%, 1/5/2021 | | | 1,242,685 | |
| | 1,050,000 | | | 5.875%, 2/7/2042 | | | 1,290,591 | |
| | | | Bank of Nova Scotia | | | | |
| | 2,145,000 | | | 2.150%, 8/3/2016f | | | 2,255,468 | |
| | | | Bank of Tokyo-Mitsubishi UFJ, Ltd. | | | | |
| | 1,765,000 | | | 2.350%, 2/23/2017f | | | 1,835,095 | |
| | | | Barclays Bank plc | | | | |
| | 1,780,000 | | | 6.050%, 12/4/2017f | | | 1,944,084 | |
| | | | BBVA Bancomer SA/Texas | | | | |
| | 1,965,000 | | | 6.750%, 9/30/2022f | | | 2,225,362 | |
| | | | Berkshire Hathaway, Inc. | | | | |
| | 1,785,000 | | | 3.750%, 8/15/2021 | | | 1,997,752 | |
| | | | Boston Properties, LP | | | | |
| | 2,250,000 | | | 5.875%, 10/15/2019 | | | 2,701,773 | |
| | | | Capital One Capital IV | | | | |
| | 1,070,000 | | | 6.745%, 2/17/2037 | | | 1,081,235 | |
| | | | Capital One Financial Corporation | | | | |
| | 930,000 | | | 6.150%, 9/1/2016 | | | 1,065,215 | |
| | 1,790,000 | | | 4.750%, 7/15/2021 | | | 2,053,773 | |
| | | | Cigna Corporation | | | | |
| | 1,780,000 | | | 4.000%, 2/15/2022 | | | 1,945,476 | |
| | | | CIT Group, Inc. | | | | |
| | 980,000 | | | 5.250%, 3/15/2018 | | | 1,041,250 | |
| | | | Citigroup, Inc. | | | | |
| | 2,700,000 | | | 4.750%, 5/19/2015 | | | 2,926,230 | |
| | 1,790,000 | | | 6.000%, 8/15/2017 | | | 2,107,045 | |
| | 1,300,000 | | | 6.125%, 5/15/2018 | | | 1,553,365 | |
| | 1,450,000 | | | 8.500%, 5/22/2019 | | | 1,933,468 | |
| | 1,075,000 | | | 4.500%, 1/14/2022 | | | 1,186,744 | |
| | 2,160,000 | | | 5.950%, 12/29/2049i | | | 2,226,150 | |
| | | | CNA Financial Corporation | | | | |
| | 2,225,000 | | | 7.350%, 11/15/2019 | | | 2,788,301 | |
| | 700,000 | | | 5.875%, 8/15/2020 | | | 823,456 | |
| | | | CommonWealth REIT | | | | |
| | 1,850,000 | | | 6.250%, 8/15/2016 | | | 2,020,228 | |
| | | | Cooperatieve Centrale Raiffeisen-Boerenleenbank BA | | | | |
| | 1,085,000 | | | 5.250%, 5/24/2041 | | | 1,297,085 | |
| | 710,000 | | | 11.000%, 12/29/2049f,i | | | 949,625 | |
| | | | Credit Suisse of New York, Convertible | | | | |
| | 720,000 | | | 0.500%, 6/22/2018j | | | 702,720 | |
| | | | Developers Diversified Realty Corporation | | | | |
| | 710,000 | | | 7.875%, 9/1/2020 | | | 923,390 | |
| | 535,000 | | | 4.625%, 7/15/2022 | | | 592,746 | |
| | | | Discover Bank | | | | |
| | 1,125,000 | | | 8.700%, 11/18/2019 | | | 1,470,962 | |
| | 1,300,000 | | | 7.000%, 4/15/2020 | | | 1,593,406 | |
| | | | DnB NOR Boligkreditt | | | | |
| | 2,600,000 | | | 2.900%, 3/29/2016f | | | 2,770,820 | |
| | | | Duke Realty, LP | | | | |
| | 1,780,000 | | | 3.875%, 10/15/2022 | | | 1,852,868 | |
| | | | Eksportfinans ASA | | | | |
| | 1,750,000 | | | 2.375%, 5/25/2016 | | | 1,649,375 | |
| | | | Fairfax Financial Holdings, Ltd. | | | | |
| | 1,085,000 | | | 5.800%, 5/15/2021f | | | 1,111,645 | |
| | | | Fifth Third Bancorp | | | | |
| | 1,790,000 | | | 0.799%, 12/20/2016d | | | 1,727,250 | |
| | 1,700,000 | | | 5.450%, 1/15/2017 | | | 1,919,065 | |
| | | | Fifth Third Capital Trust IV | | | | |
| | 1,050,000 | | | 6.500%, 4/15/2067 | | | 1,052,625 | |
| | | | GE Capital Trust I | | | | |
| | 2,500,000 | | | 6.375%, 11/15/2067 | | | 2,678,125 | |
| | | | General Electric Capital Corporation | | | | |
| | 1,775,000 | | | 3.800%, 6/18/2019f | | | 1,894,253 | |
| | 1,100,000 | | | 6.000%, 8/7/2019 | | | 1,347,401 | |
| | 900,000 | | | 5.300%, 2/11/2021 | | | 1,047,222 | |
| | 925,000 | | | 6.750%, 3/15/2032 | | | 1,230,370 | |
| | 1,800,000 | | | 7.125%, 12/15/2049i | | | 2,059,362 | |
| | | | Goldman Sachs Group, Inc. | | | | |
| | 1,750,000 | | | 6.250%, 9/1/2017 | | | 2,056,311 | |
| | 1,600,000 | | | 5.375%, 3/15/2020 | | | 1,809,083 | |
| | 1,750,000 | | | 5.250%, 7/27/2021 | | | 1,955,350 | |
| | 740,000 | | | 6.750%, 10/1/2037 | | | 814,903 | |
| | | | HCP, Inc. | | | | |
| | 450,000 | | | 3.750%, 2/1/2019 | | | 477,629 | |
| | | | Health Care Property Investors, Inc. | | | | |
| | 1,900,000 | | | 5.625%, 5/1/2017 | | | 2,171,022 | |
The accompanying Notes to Financial Statements are an integral part of this schedule.
188
Income Fund
Schedule of Investments as of October 31, 2012
| | | | | | |
Principal
Amount | | | Long-Term Fixed Income (93.9%) | | Value |
| Financials (25.6%) - continued |
| | | | Health Care REIT, Inc. | | |
| | $1,800,000 | | | 6.125%, 4/15/2020 | | $2,118,100 |
| | 1,850,000 | | | 4.950%, 1/15/2021 | | 2,051,260 |
| | | | HSBC Finance Corporation | | |
| | 1,070,000 | | | 6.676%, 1/15/2021 | | 1,266,168 |
| | | | HSBC Holdings plc | | |
| | 1,400,000 | | | 4.000%, 3/30/2022 | | 1,533,643 |
| | | | HSBC USA, Inc. | | |
| | 1,100,000 | | | 5.000%, 9/27/2020 | | 1,195,829 |
| | | | Huntington Bancshares, Inc. | | |
| | 1,650,000 | | | 7.000%, 12/15/2020 | | 1,998,056 |
| | | | Icahn Enterprises, LP | | |
| | 710,000 | | | 7.750%, 1/15/2016 | | 741,950 |
| | 340,000 | | | 8.000%, 1/15/2018 | | 365,500 |
| | | | ING Bank NV | | |
| | 2,140,000 | | | 2.000%, 9/25/2015f | | 2,157,405 |
| | | | ING US, Inc. | | |
| | 1,785,000 | | | 5.500%, 7/15/2022f | | 1,940,534 |
| | | | International Lease Finance Corporation | | |
| | 1,050,000 | | | 4.875%, 4/1/2015 | | 1,086,750 |
| | 900,000 | | | 5.750%, 5/15/2016 | | 950,299 |
| | 1,125,000 | | | 6.750%, 9/1/2016f | | 1,271,250 |
| | | | J.P. Morgan Chase & Company | | |
| | 1,780,000 | | | 2.000%, 8/15/2017 | | 1,799,069 |
| | 1,850,000 | | | 5.500%, 10/15/2040 | | 2,252,384 |
| | | | J.P. Morgan Chase Bank NA | | |
| | 1,785,000 | | | 5.875%, 6/13/2016 | | 2,028,752 |
| | 1,420,000 | | | 6.000%, 10/1/2017 | | 1,679,377 |
| | | | Kilroy Realty, LP | | |
| | 1,435,000 | | | 4.800%, 7/15/2018 | | 1,587,608 |
| | | | Liberty Mutual Group, Inc. | | |
| | 1,965,000 | | | 4.950%, 5/1/2022f | | 2,145,900 |
| | | | Liberty Property, LP | | |
| | 1,830,000 | | | 5.500%, 12/15/2016 | | 2,080,371 |
| | 1,125,000 | | | 4.750%, 10/1/2020 | | 1,241,296 |
| | | | Macquarie Bank, Ltd. | | |
| | 1,785,000 | | | 5.000%, 2/22/2017f | | 1,938,742 |
| | | | Merrill Lynch & Company, Inc. | | |
| | 1,950,000 | | | 6.875%, 4/25/2018 | | 2,354,397 |
| | 2,000,000 | | | 7.750%, 5/14/2038 | | 2,635,436 |
| | | | MetLife Capital Trust IV | | |
| | 300,000 | | | 7.875%, 12/15/2037f | | 362,222 |
| | | | MetLife Capital Trust X | | |
| | 750,000 | | | 9.250%, 4/8/2038f | | 1,042,500 |
| | | | Mizuho Corporate Bank, Ltd. | | |
| | 1,775,000 | | | 2.550%, 3/17/2017f | | 1,858,464 |
| | 1,080,000 | | | 1.550%, 10/17/2017f | | 1,083,850 |
| | | | Morgan Stanley | | |
| | 1,420,000 | | | 5.375%, 10/15/2015 | | 1,547,843 |
| | 2,270,000 | | | 6.625%, 4/1/2018 | | 2,640,187 |
| | 1,100,000 | | | 5.625%, 9/23/2019 | | 1,221,521 |
| | 1,600,000 | | | 5.500%, 1/26/2020 | | 1,766,517 |
| | 1,075,000 | | | 4.875%, 11/1/2022 | | 1,086,751 |
| | | | MUFG Capital Finance 1, Ltd. | | |
| | 1,920,000 | | | 6.346%, 7/29/2049i | | 2,125,638 |
| | | | Murray Street Investment Trust I | | |
| | 700,000 | | | 4.647%, 3/9/2017 | | 759,566 |
| | | | National Bank of Canada | | |
| | 2,110,000 | | | 2.200%, 10/19/2016f | | 2,225,417 |
| | | | National City Bank | | |
| | 1,170,000 | | | 5.800%, 6/7/2017 | | 1,391,991 |
| | | | Nationwide Building Society | | |
| | 1,600,000 | | | 6.250%, 2/25/2020f | | 1,871,706 |
| | | | Nordea Bank AB | | |
| | 1,830,000 | | | 4.875%, 5/13/2021f | | 1,936,323 |
| | | | Omega Healthcare Investors, Inc. | | |
| | 920,000 | | | 5.875%, 3/15/2024 | | 979,800 |
| | | | ORIX Corporation | | |
| | 2,550,000 | | | 5.000%, 1/12/2016 | | 2,748,441 |
| | | | Preferred Term Securities XXIII, Ltd. | | |
| | 2,585,288 | | | 0.589%, 12/22/2036d,h | | 1,602,879 |
| | | | ProLogis, LP | | |
| | 1,450,000 | | | 6.250%, 3/15/2017 | | 1,649,179 |
| | 1,070,000 | | | 6.875%, 3/15/2020 | | 1,319,228 |
| | | | Prudential Financial, Inc. | | |
| | 750,000 | | | 6.200%, 1/15/2015 | | 826,180 |
| | 1,875,000 | | | 5.375%, 6/21/2020 | | 2,198,012 |
| | 825,000 | | | 6.200%, 11/15/2040 | | 1,026,575 |
| | 1,070,000 | | | 5.875%, 9/15/2042 | | 1,126,175 |
| | | | QBE Capital Funding III, Ltd. | | |
| | 1,260,000 | | | 7.250%, 5/24/2041f | | 1,316,700 |
| | | | Rabobank Capital Funding Trust II | | |
| | 1,249,000 | | | 5.260%, 12/29/2049f,i | | 1,249,000 |
| | | | Reinsurance Group of America, Inc. | | |
| | 1,030,000 | | | 5.625%, 3/15/2017 | | 1,173,832 |
| | 1,070,000 | | | 6.450%, 11/15/2019 | | 1,266,162 |
| | | | Santander Holdings USA, Inc. | | |
| | 1,425,000 | | | 3.000%, 9/24/2015 | | 1,452,279 |
| | | | Simon Property Group, LP | | |
| | 750,000 | | | 10.350%, 4/1/2019 | | 1,080,668 |
| | | | SLM Corporation | | |
| | 1,090,000 | | | 5.000%, 10/1/2013 | | 1,125,425 |
| | 1,700,000 | | | 5.375%, 5/15/2014 | | 1,780,889 |
| | 1,370,000 | | | 6.250%, 1/25/2016 | | 1,479,668 |
| | 1,945,000 | | | 6.000%, 1/25/2017 | | 2,110,325 |
| | | | SunTrust Banks, Inc. | | |
| | 1,780,000 | | | 3.600%, 4/15/2016 | | 1,908,427 |
| | | | Swedbank AB | | |
| | 2,145,000 | | | 2.125%, 9/29/2017f | | 2,165,957 |
| | | | Swiss RE Capital I, LP | | |
| | 2,600,000 | | | 6.854%, 5/29/2049f,i | | 2,712,390 |
| | | | TD Ameritrade Holding Corporation | | |
| | 2,225,000 | | | 5.600%, 12/1/2019 | | 2,607,206 |
| | | | U.S. Bank National Association | | |
| | 1,800,000 | | | 3.778%, 4/29/2020 | | 1,905,547 |
| | | | UnionBanCal Corporation | | |
| | 1,420,000 | | | 3.500%, 6/18/2022 | | 1,505,007 |
| | | | UnitedHealth Group, Inc. | | |
| | 720,000 | | | 1.400%, 10/15/2017 | | 724,644 |
| | 1,500,000 | | | 6.500%, 6/15/2037 | | 2,050,543 |
| | | | Unum Group | | |
| | 1,500,000 | | | 7.125%, 9/30/2016 | | 1,767,099 |
| | | | Vesey Street Investment Trust I | | |
| | 700,000 | | | 4.404%, 9/1/2016 | | 758,518 |
| | | | Wachovia Corporation | | |
| | 1,500,000 | | | 5.250%, 8/1/2014 | | 1,610,005 |
| | | | WEA Finance, LLC | | |
| | 1,710,000 | | | 7.125%, 4/15/2018f | | 2,103,839 |
| | 720,000 | | | 6.750%, 9/2/2019f | | 891,192 |
| | | | Wells Fargo & Company | | |
| | 1,480,000 | | | 2.625%, 12/15/2016 | | 1,563,426 |
| | 1,780,000 | | | 7.980%, 3/29/2049i | | 2,104,850 |
The accompanying Notes to Financial Statements are an integral part of this schedule.
189
Income Fund
Schedule of Investments as of October 31, 2012
| | | | | | | | |
Principal
Amount | | | Long-Term Fixed Income (93.9%) | | Value | |
| Financials (25.6%) - continued | | | | |
| | | | Willis North America, Inc. | | | | |
| | $1,850,000 | | | 6.200%, 3/28/2017 | | | $2,124,575 | |
| | | | ZFS Finance USA Trust II | | | | |
| | 1,500,000 | | | 6.450%, 12/15/2065f | | | 1,612,500 | |
| | | | | |
| | | | Total | | | 231,391,244 | |
| | | | | |
| |
| Foreign Government (5.4%) | | | | |
| | | | Brazil Government International Bond | | | | |
| | 1,070,000 | | | 4.875%, 1/22/2021 | | | 1,281,325 | |
| | | | Canada Government International Bond | | | | |
| | 2,125,000 | | | 0.875%, 2/14/2017 | | | 2,141,787 | |
| | | | Chile Government International Bond | | | | |
| | 2,480,000 | | | 3.250%, 9/14/2021 | | | 2,690,800 | |
| | 1,800,000 | | | 2.250%, 10/30/2022 | | | 1,773,000 | |
| | | | Corporacion Andina de Fomento | | | | |
| | 1,226,000 | | | 4.375%, 6/15/2022 | | | 1,333,124 | |
| | | | Export-Import Bank of Korea | | | | |
| | 1,420,000 | | | 4.375%, 9/15/2021 | | | 1,596,050 | |
| | | | Hydro Quebec | | | | |
| | 1,800,000 | | | 2.000%, 6/30/2016 | | | 1,880,820 | |
| | | | Kommunalbanken AS | | | | |
| | 1,780,000 | | | 1.000%, 9/26/2017f | | | 1,776,185 | |
| | | | Korea Development Bank | | | | |
| | 1,500,000 | | | 4.375%, 8/10/2015 | | | 1,623,306 | |
| | | | Mexico Government International Bond | | | | |
| | 1,850,000 | | | 5.125%, 1/15/2020 | | | 2,210,750 | |
| | 1,270,000 | | | 6.050%, 1/11/2040 | | | 1,685,925 | |
| | | | Peru Government International Bond | | | | |
| | 710,000 | | | 5.625%, 11/18/2050 | | | 919,450 | |
| | | | Province of British Colombia | | | | |
| | 2,150,000 | | | 2.000%, 10/23/2022 | | | 2,141,116 | |
| | | | Province of British Columbia | | | | |
| | 2,170,000 | | | 2.100%, 5/18/2016 | | | 2,281,104 | |
| | 800,000 | | | 1.200%, 4/25/2017 | | | 815,285 | |
| | 1,750,000 | | | 2.650%, 9/22/2021 | | | 1,860,950 | |
| | | | Province of Manitoba | | | | |
| | 2,485,000 | | | 1.300%, 4/3/2017 | | | 2,542,404 | |
| | | | Province of New Brunswick | | | | |
| | 2,150,000 | | | 2.750%, 6/15/2018 | | | 2,323,610 | |
| | | | Province of Ontario | | | | |
| | 3,200,000 | | | 2.300%, 5/10/2016 | | | 3,373,760 | |
| | 1,800,000 | | | 1.100%, 10/25/2017 | | | 1,802,880 | |
| | 4,320,000 | | | 3.000%, 7/16/2018 | | | 4,720,032 | |
| | | | Province of Quebec | | | | |
| | 1,770,000 | | | 5.125%, 11/14/2016 | | | 2,070,192 | |
| | 2,493,000 | | | 2.750%, 8/25/2021 | | | 2,605,108 | |
| | | | Russia Government International Bond | | | | |
| | 1,050,000 | | | 3.250%, 4/4/2017f | | | 1,114,250 | |
| | | | | |
| | | | Total | | | 48,563,213 | |
| | | | | |
| |
| Mortgage-Backed Securities (6.6%) | | | | |
| | | | Federal Home Loan Mortgage Corporation Gold 15-Yr. Pass Through | | | | |
| | 5,700,000 | | | 2.500%, 11/1/2027c | | | 5,952,937 | |
| | | | Federal Home Loan Mortgage Corporation Gold 30-Yr. Pass Through | | | | |
| | 5,775,000 | | | 3.000%, 11/1/2042c | | | 6,045,252 | |
| | | | Federal National Mortgage Association Conventional 15-Yr. Pass Through | | | | |
| | 8,500,000 | | | 2.500%, 11/1/2027c | | | 8,895,782 | |
| | | | Federal National Mortgage Association Conventional 30-Yr. Pass Through | | | | |
| | 14,225,000 | | | 3.500%, 11/1/2042c | | | 15,151,847 | |
| | 8,400,000 | | | 4.000%, 11/1/2042c | | | 8,994,562 | |
| | 7,600,000 | | | 5.000%, 11/1/2042c | | | 8,291,125 | |
| | 6,000,000 | | | 5.000%, 12/1/2042c | | | 6,545,625 | |
| | | | | |
| | | | Total | | | 59,877,130 | |
| | | | | |
| |
| Technology (1.7%) | | | | |
| | | | CA, Inc. | | | | |
| | 1,925,000 | | | 5.375%, 12/1/2019 | | | 2,240,188 | |
| | | | Computer Sciences Corporation | | | | |
| | 1,250,000 | | | 2.500%, 9/15/2015 | | | 1,276,744 | |
| | | | Equinix, Inc. | | | | |
| | 1,100,000 | | | 8.125%, 3/1/2018 | | | 1,210,000 | |
| | 360,000 | | | 7.000%, 7/15/2021 | | | 399,600 | |
| | | | Hewlett-Packard Company | | | | |
| | 1,800,000 | | | 2.650%, 6/1/2016 | | | 1,802,117 | |
| | 700,000 | | | 2.600%, 9/15/2017g | | | 681,678 | |
| | 1,410,000 | | | 4.650%, 12/9/2021 | | | 1,411,393 | |
| | | | Motorola Solutions, Inc. | | | | |
| | 2,500,000 | | | 3.750%, 5/15/2022 | | | 2,600,450 | |
| | | | Oracle Corporation | | | | |
| | 1,800,000 | | | 2.500%, 10/15/2022 | | | 1,832,481 | |
| | | | Xerox Corporation | | | | |
| | 750,000 | | | 6.400%, 3/15/2016 | | | 856,337 | |
| | 1,050,000 | | | 2.950%, 3/15/2017 | | | 1,081,897 | |
| | | | | |
| | | | Total | | | 15,392,885 | |
| | | | | |
| |
| Transportation (2.2%) | | | | |
| | | | Burlington Northern Santa Fe, LLC | | | | |
| | 625,000 | | | 3.050%, 9/1/2022 | | | 652,146 | |
| | | | Continental Airlines, Inc. | | | | |
| | 1,300,000 | | | 6.750%, 9/15/2015f | | | 1,360,125 | |
| | 608,678 | | | 7.250%, 11/10/2019 | | | 693,893 | |
| | 785,000 | | | 4.000%, 10/29/2024 | | | 822,287 | |
| | | | CSX Corporation | | | | |
| | 793,000 | | | 7.900%, 5/1/2017 | | | 1,004,033 | |
| | 720,000 | | | 4.250%, 6/1/2021 | | | 806,285 | |
| | 1,107,000 | | | 6.220%, 4/30/2040 | | | 1,466,471 | |
| | | | Delta Air Lines, Inc. | | | | |
| | 1,282,706 | | | 4.950%, 11/23/2019g | | | 1,386,990 | |
| | 715,000 | | | 4.750%, 5/7/2020 | | | 755,254 | |
| | | | ERAC USA Finance, LLC | | | | |
| | 2,050,000 | | | 5.250%, 10/1/2020f | | | 2,351,297 | |
| | 1,085,000 | | | 4.500%, 8/16/2021f | | | 1,193,405 | |
| | | | Hertz Corporation | | | | |
| | 1,430,000 | | | 6.750%, 4/15/2019g | | | 1,517,587 | |
| | | | Kansas City Southern de Mexico SA de CV | | | | |
| | 270,000 | | | 6.125%, 6/15/2021 | | | 301,725 | |
The accompanying Notes to Financial Statements are an integral part of this schedule.
190
Income Fund
Schedule of Investments as of October 31, 2012
| | | | | | | | |
Principal
Amount | | | Long-Term Fixed Income (93.9%) | | Value | |
| Transportation (2.2%) - continued | | | | |
| | | | Navios Maritime Holdings, Inc. | | | | |
| | $990,000 | | | 8.875%, 11/1/2017 | | | $1,014,750 | |
| | | | Navios South American Logistics, Inc./Navios Logistics Finance US, Inc. | | | | |
| | 270,000 | | | 9.250%, 4/15/2019 | | | 255,825 | |
| | | | Penske Truck Leasing Company, LP | | | | |
| | 2,135,000 | | | 2.500%, 3/15/2016f | | | 2,127,811 | |
| | | | United Parcel Service, Inc. | | | | |
| | 1,780,000 | | | 2.450%, 10/1/2022 | | | 1,816,839 | |
| | | | | |
| | | | Total | | | 19,526,723 | |
| | | | | |
| |
| U.S. Government and Agencies (5.8%) | | | | |
| | | | Federal Home Loan Mortgage Corporation | | | | |
| | 1,050,000 | | | 1.750%, 5/30/2019 | | | 1,085,299 | |
| | | | Tennessee Valley Authority | | | | |
| | 1,780,000 | | | 1.875%, 8/15/2022g | | | 1,770,347 | |
| | | | U.S. Treasury Bonds | | | | |
| | 4,240,000 | | | 3.125%, 11/15/2041 | | | 4,499,700 | |
| | 3,920,000 | | | 3.000%, 5/15/2042 | | | 4,049,239 | |
| | | | U.S. Treasury Notes | | | | |
| | 1,780,000 | | | 1.000%, 3/31/2017 | | | 1,809,064 | |
| | 3,590,000 | | | 2.875%, 3/31/2018 | | | 3,984,620 | |
| | 3,890,000 | | | 2.375%, 6/30/2018 | | | 4,216,091 | |
| | 2,840,000 | | | 3.625%, 2/15/2020 | | | 3,325,686 | |
| | 4,500,000 | | | 3.500%, 5/15/2020 | | | 5,238,279 | |
| | 3,980,000 | | | 2.625%, 11/15/2020 | | | 4,371,783 | |
| | 4,195,000 | | | 3.125%, 5/15/2021 | | | 4,768,863 | |
| | 3,675,000 | | | 2.000%, 11/15/2021 | | | 3,817,406 | |
| | | | U.S. Treasury Notes, TIPS | | | | |
| | 2,212,281 | | | 0.125%, 4/15/2016 | | | 2,332,231 | |
| | 2,525,156 | | | 0.125%, 4/15/2017 | | | 2,708,233 | |
| | 3,607,586 | | | 0.625%, 7/15/2021 | | | 4,127,872 | |
| | | | | |
| | | | Total | | | 52,104,713 | |
| | | | | |
| |
| U.S. Municipals (0.5%) | | | | |
| | | | California General Obligation Bonds (Build America Bonds) | | | | |
| | 720,000 | | | 7.950%, 3/1/2036 | | | 862,272 | |
| | | | Denver, Colorado City & County Airport Revenue Bonds | | | | |
| | 1,450,000 | | | 5.250%, 11/15/2022 | | | 1,720,193 | |
| | | | Illinois State General Obligation Bonds | | | | |
| | 1,825,000 | | | 5.877%, 3/1/2019 | | | 2,100,721 | |
| | | | | |
| | | | Total | | | 4,683,186 | |
| | | | | |
| |
| Utilities (5.9%) | | | | |
| | | | AES Corporation | | | | |
| | 935,000 | | | 7.750%, 10/15/2015 | | | 1,049,538 | |
| | | | Ameren Illinois Company | | | | |
| | 1,800,000 | | | 6.125%, 11/15/2017 | | | 2,171,167 | |
| | | | Cleveland Electric Illuminating Company | | | | |
| | 1,065,000 | | | 5.700%, 4/1/2017 | | | 1,207,971 | |
| | | | Commonwealth Edison Company | | | | |
| | 1,000,000 | | | 6.150%, 9/15/2017 | | | 1,229,589 | |
| | | | DPL, Inc. | | | | |
| | 1,770,000 | | | 6.500%, 10/15/2016 | | | 1,920,450 | |
| | | | DTE Energy Company | | | | |
| | 1,500,000 | | | 6.375%, 4/15/2033 | | | 1,985,708 | |
| | | | Energy Transfer Partners, LP | | | | |
| | 1,500,000 | | | 4.650%, 6/1/2021 | | | 1,665,942 | |
| | 1,000,000 | | | 5.200%, 2/1/2022 | | | 1,147,910 | |
| | | | Enterprise Products Operating, LLC | | | | |
| | 1,400,000 | | | 7.034%, 1/15/2068 | | | 1,599,500 | |
| | 1,180,000 | | | 6.300%, 9/15/2017 | | | 1,446,727 | |
| | 1,070,000 | | | 6.650%, 4/15/2018 | | | 1,340,184 | |
| | | | Exelon Generation Company, LLC | | | | |
| | 600,000 | | | 5.200%, 10/1/2019 | | | 690,401 | |
| | 1,500,000 | | | 4.000%, 10/1/2020 | | | 1,617,330 | |
| | | | Florida Power Corporation | | | | |
| | 1,000,000 | | | 6.400%, 6/15/2038 | | | 1,416,180 | |
| | | | ITC Holdings Corporation | | | | |
| | 2,000,000 | | | 5.875%, 9/30/2016f | | | 2,284,270 | |
| | 1,400,000 | | | 6.050%, 1/31/2018f | | | 1,648,836 | |
| | | | Kinder Morgan Energy Partners, LP | | | | |
| | 1,065,000 | | | 5.000%, 8/15/2042 | | | 1,154,022 | |
| | | | Markwest Energy Partners, LP | | | | |
| | 1,090,000 | | | 6.500%, 8/15/2021 | | | 1,179,925 | |
| | | | Nevada Power Company | | | | |
| | 1,700,000 | | | 6.750%, 7/1/2037 | | | 2,433,900 | |
| | | | NiSource Finance Corporation | | | | |
| | 1,700,000 | | | 6.400%, 3/15/2018 | | | 2,069,240 | |
| | 1,800,000 | | | 5.450%, 9/15/2020 | | | 2,137,772 | |
| | | | NRG Energy, Inc. | | | | |
| | 710,000 | | | 8.250%, 9/1/2020 | | | 782,775 | |
| | | | Ohio Edison Company | | | | |
| | 950,000 | | | 6.875%, 7/15/2036 | | | 1,287,893 | |
| | | | Ohio Power Company | | | | |
| | 1,600,000 | | | 6.050%, 5/1/2018 | | | 1,933,875 | |
| | | | ONEOK Partners, LP | | | | |
| | 710,000 | | | 2.000%, 10/1/2017 | | | 724,520 | |
| | | | Pennsylvania Electric Company | | | | |
| | 2,300,000 | | | 5.200%, 4/1/2020 | | | 2,626,172 | |
| | | | PPL Capital Funding, Inc. | | | | |
| | 1,795,000 | | | 3.500%, 12/1/2022 | | | 1,843,135 | |
| | | | PSEG Power, LLC | | | | |
| | 700,000 | | | 5.320%, 9/15/2016 | | | 799,511 | |
| | | | Southern California Edison Company | | | | |
| | 1,415,000 | | | 6.250%, 8/1/2049i | | | 1,555,453 | |
| | | | Southern Star Central Corporation | | | | |
| | 2,400,000 | | | 6.750%, 3/1/2016 | | | 2,445,000 | |
| | | | Southwestern Public Service Company | | | | |
| | 1,730,000 | | | 6.000%, 10/1/2036 | | | 2,204,833 | |
| | | | Union Electric Company | | | | |
| | 1,600,000 | | | 6.400%, 6/15/2017 | | | 1,971,707 | |
| | | | Williams Partners, LP | | | | |
| | 1,780,000 | | | 3.350%, 8/15/2022 | | | 1,845,257 | |
| | | | | |
| | | | Total | | | 53,416,693 | |
| | | | | |
| | | | | | | | |
| | | | | |
| | | | Total Long-Term Fixed Income (cost $781,590,293) | | | 848,298,662 | |
| | | | | |
The accompanying Notes to Financial Statements are an integral part of this schedule.
191
Income Fund
Schedule of Investments as of October 31, 2012
| | | | | | | | |
| Shares | | | Preferred Stock (1.6%) | | Value | |
| Financials (1.6%) | | | | |
| $ | 52,000 | | | Annaly Capital Management, Inc., 7.500%i,k | | | $1,323,400 | |
| | 81,000 | | | BB&T Corporation, 5.200%i,k | | | 2,004,750 | |
| | 12,500 | | | CoBank ACB, 6.250%f,i,k | | | 1,321,875 | |
| | 72,000 | | | Discover Financial Services, 6.500%i | | | 1,832,400 | |
| | 43,750 | | | HSBC Holdings plc, 8.000%i | | | 1,234,625 | |
| | 91,786 | | | PNC Financial Services Group, Inc., 6.125%i | | | 2,570,008 | |
| | 70,937 | | | Royal Bank of Scotland Group plc, 7.250%i | | | 1,684,754 | |
| | 34,789 | | | U.S. Bancorp, 6.000%i | | | 998,444 | |
| | 45,400 | | | U.S. Bancorp, 6.500%i | | | 1,342,478 | |
| | | | | |
| | | | Total | | | 14,312,734 | |
| | | | | |
| | | | | | | | |
| | | | | |
| | | | Total Preferred Stock (cost $13,069,068) | | | 14,312,734 | |
| | | | | |
| | |
| Shares | | | Collateral Held for Securities Loaned (0.8%) | | Value | |
| | 7,306,530 | | | Thrivent Financial Securities Lending Trust | | | 7,306,530 | |
| | | | | |
| | | | Total Collateral Held for Securities Loaned (cost $7,306,530) | | | 7,306,530 | |
| | | | | |
| | |
Shares or
Principal
Amount | | | Short-Term Investments (7.5%) | | Value | |
| | 500,000 | | | Federal Home Loan Mortgage Corporation Discount Notes 0.160%, 12/17/2012l,m | | | 499,898 | |
| | 67,355,631 | | | Thrivent Financial Securities Lending Trust | | | 67,355,631 | |
| | | | | |
| | | | Total Short-Term Investments (at amortized cost) | | | 67,855,529 | |
| | | | | |
| | | | Total Investments (cost $895,160,639) 106.6% | | $ | 963,355,492 | |
| | | | | |
| | | | Other Assets and Liabilities, Net (6.6%) | | | (59,230,096 | ) |
| | | | | |
| | | | Total Net Assets 100.0% | | $ | 904,125,396 | |
| | | | | |
a | The stated interest rate represents the weighted average of all contracts within the bank loan facility. |
b | All or a portion of the loan is unfunded. |
c | Denotes investments purchased on a when-issued or delayed delivery basis. |
d | Denotes variable rate securities. Variable rate securities are securities whose yields vary with a designated market index or market rate. The rate shown is as of October 31, 2012. |
e | All or a portion of the security is insured or guaranteed. |
f | Denotes securities sold under Rule 144A of the Securities Act of 1933, which exempts them from registration. These securities have been deemed liquid and may be resold to other dealers in the program or to other qualified institutional buyers. As of October 31, 2012, the value of these investments was $144,514,913 or 16.0% of total net assets. |
g | All or a portion of the security is on loan. |
h | Denotes restricted securities. Restricted securities are investment securities which have been deemed illiquid and cannot be offered for public sale without first being registered under the Securities Act of 1933. The following table indicates the acquisition date and cost of restricted securities Income Fund owned as of October 31, 2012. |
| | | | | | | | |
Security | | Acquisition
Date | | | Cost | |
JBS Finance II, Ltd. | | | 7/22/2010 | | | | $739,755 | |
Preferred Term Securities XXIII, Ltd. | | | 9/14/2006 | | | | $2,585,288 | |
i | Denotes perpetual securities. Perpetual securities pay an indefinite stream of interest, but may be called by the issuer at an earlier date. |
j | Denotes equity-linked structured security. This security is linked to the common stock of Berkshire Hathaway, Inc. |
k | Non-income producing security. |
l | The interest rate shown reflects the yield, coupon rate or the discount rate at the date of purchase. |
m | At October 31, 2012, $499,898 of investments were held on deposit with the counterparty and pledged as the initial margin deposit for open futures contracts. |
Definitions:
| | | | | | |
| | REIT | | - | | Real Estate Investment Trust is a company that buys, develops, manages and/or sells real estate assets. |
| | TIPS | | - | | Treasury Inflation Protected Security. |
| | | | |
Unrealized Appreciation (Depreciation) | | | |
Gross unrealized appreciation and depreciation of investments, based on cost for federal income tax purposes, were as follows: | | | | |
Gross unrealized appreciation | | | $76,762,576 | |
Gross unrealized depreciation | | | (8,646,319 | ) |
| | | | |
Net unrealized appreciation (depreciation) | | | $68,116,257 | |
| |
Cost for federal income tax purposes | | | $895,239,235 | |
The accompanying Notes to Financial Statements are an integral part of this schedule.
192
Income Fund
Schedule of Investments as of October 31, 2012
Fair Valuation Measurements
The following table is a summary of the inputs used, as of October 31, 2012, in valuing Income Fund’s assets carried at fair value.
| | | | | | | | | | | | | | | | |
Investments in Securities | | Total | | | Level 1 | | | Level 2 | | | Level 3 | |
| | | | |
Bank Loans | | | | | | | | | | | | | | | | |
Basic Materials | | | 2,801,529 | | | | – | | | | 2,801,529 | | | | – | |
Capital Goods | | | 544,860 | | | | – | | | | 544,860 | | | | – | |
Communications Services | | | 7,384,681 | | | | – | | | | 7,384,681 | | | | – | |
Consumer Cyclical | | | 2,338,442 | | | | – | | | | 2,338,442 | | | | – | |
Consumer Non-Cyclical | | | 4,431,229 | | | | – | | | | 4,431,229 | | | | – | |
Energy | | | 274,613 | | | | – | | | | 274,613 | | | | – | |
Financials | | | 898,596 | | | | – | | | | 898,596 | | | | – | |
Technology | | | 3,859,880 | | | | – | | | | 3,859,880 | | | | – | |
Transportation | | | 1,430,443 | | | | – | | | | 1,430,443 | | | | – | |
Utilities | | | 1,617,764 | | | | – | | | | 1,617,764 | | | | – | |
| | | | |
Long-Term Fixed Income | | | | | | | | | | | | | | | | |
Asset-Backed Securities | | | 7,363,639 | | | | – | | | | 7,363,639 | | | | – | |
Basic Materials | | | 32,027,856 | | | | – | | | | 32,027,856 | | | | – | |
Capital Goods | | | 23,619,808 | | | | – | | | | 23,619,808 | | | | – | |
Collateralized Mortgage Obligations | | | 8,347,689 | | | | – | | | | 8,347,689 | | | | – | |
Commercial Mortgage-Backed Securities | | | 14,727,652 | | | | – | | | | 14,727,652 | | | | – | |
Communications Services | | | 82,568,581 | | | | – | | | | 82,568,581 | | | | – | |
Consumer Cyclical | | | 38,807,706 | | | | – | | | | 38,807,706 | | | | – | |
Consumer Non-Cyclical | | | 70,959,861 | | | | – | | | | 70,959,861 | | | | – | |
Energy | | | 84,920,083 | | | | – | | | | 84,920,083 | | | | – | |
Financials | | | 231,391,244 | | | | – | | | | 229,085,645 | | | | 2,305,599 | |
Foreign Government | | | 48,563,213 | | | | – | | | | 48,563,213 | | | | – | |
Mortgage-Backed Securities | | | 59,877,130 | | | | – | | | | 59,877,130 | | | | – | |
Technology | | | 15,392,885 | | | | – | | | | 15,392,885 | | | | – | |
Transportation | | | 19,526,723 | | | | – | | | | 19,526,723 | | | | – | |
U.S. Government and Agencies | | | 52,104,713 | | | | – | | | | 52,104,713 | | | | – | |
U.S. Municipals | | | 4,683,186 | | | | – | | | | 4,683,186 | | | | – | |
Utilities | | | 53,416,693 | | | | – | | | | 53,416,693 | | | | – | |
| | | | |
Preferred Stock | | | | | | | | | | | | | | | | |
Financials | | | 14,312,734 | | | | 12,990,859 | | | | 1,321,875 | | | | – | |
Collateral Held for Securities Loaned | | | 7,306,530 | | | | 7,306,530 | | | | – | | | | – | |
Short-Term Investments | | | 67,855,529 | | | | 67,355,631 | | | | 499,898 | | | | – | |
| |
Total | | $ | 963,355,492 | | | $ | 87,653,020 | | | $ | 873,396,873 | | | $ | 2,305,599 | |
| |
| | | | |
Other Financial Instruments | | Total | | | Level 1 | | | Level 2 | | | Level 3 | |
| | | | |
Asset Derivatives | | | | | | | | | | | | | | | | |
Futures Contracts | | | 12,063 | | | | 12,063 | | | | – | | | | – | |
| |
Total Asset Derivatives | | | $12,063 | | | | $12,063 | | | | $– | | | | $– | |
| |
| | | | |
Liability Derivatives | | | | | | | | | | | | | | | | |
Futures Contracts | | | 322,260 | | | | 322,260 | | | | – | | | | – | |
Credit Default Swaps | | | 251,053 | | | | – | | | | 251,053 | | | | – | |
| |
Total Liability Derivatives | | | $573,313 | | | | $322,260 | | | | $251,053 | | | | $– | |
| |
There were no significant transfers between Levels during the period ended October 31, 2012. Transfers between Levels are identified as of the end of the period.
The accompanying Notes to Financial Statements are an integral part of this schedule.
193
Income Fund
Schedule of Investments as of October 31, 2012
| | | | | | | | | | | | | | | | | | | | |
Futures Contracts | | Number of
Contracts
Long/(Short) | | | Expiration
Date | | | Notional
Principal
Amount | | | Value | | | Unrealized
Gain/(Loss) | |
2-Yr. U.S. Treasury Bond Futures | | | 155 | | | | December 2012 | | | | $34,161,020 | | | | $34,150,860 | | | | ($10,160 | ) |
5-Yr. U.S. Treasury Bond Futures | | | (335 | ) | | | December 2012 | | | | (41,635,813 | ) | | | (41,623,750 | ) | | | 12,063 | |
10-Yr. U.S. Treasury Bond Futures | | | (840 | ) | | | December 2012 | | | | (111,592,748 | ) | | | (111,746,250 | ) | | | (153,502 | ) |
20-Yr U.S. Treasury Bond Futures | | | 360 | | | | December 2012 | | | | 53,911,098 | | | | 53,752,500 | | | | (158,598 | ) |
Total Futures Contracts | | | | | | | | | | | | | | | | | | | ($310,197 | ) |
| | | | | | | | | | | | | | | | | | | | | | |
Credit Default Swaps and
Counterparty | | Buy/Sell Protection1 | | Termination
Date | | | Notional
Principal
Amount2 | | | Upfront
Payments
Received (Made) | | | Value3 | | | Unrealized
Gain/(Loss) | |
CDX HY, Series 18, 5 Year, at
5.00%; Bank of America | | Buy | | | 6/20/2017 | | | $ | 5,346,000 | | | | ($238,666 | ) | | | ($12,387 | ) | | | ($251,053 | ) |
Total Credit Default Swaps | | | | | | | | | | | | | | | | | ($12,387 | ) | | | ($251,053 | ) |
1 | As the buyer of protection, Income Fund pays periodic fees in return for payment by the seller which is contingent upon an adverse credit event occurring in the underlying issuer or reference entity. As the seller of protection, Income Fund collects periodic fees from the buyer and profits if the credit of the underlying issuer or reference entity remains stable or improves while the swap is outstanding, but the seller in a credit default swap contract would be required to pay the amount of credit loss, determined as specified in the agreement, to the buyer in the event of an adverse credit event in the reference entity. |
2 | The maximum potential amount of future payments Income Fund could be required to make as the seller or receive as the buyer of protection. |
3 | The values for credit indexes (CDX or LCDX) serve as an indicator of the current status of the payment/performance risk and represent the liability or profit for the credit default swap contract had the contract been closed as of the reporting date. When protection has been sold, the value of the swap will increase when the swap spread declines representing an improvement in the reference entity’s credit worthiness. The value of the swap will decrease when the swap spread increases representing a deterioration in the reference entity’s credit worthiness. When protection has been purchased, the value of the swap will increase when the swap spread increases representing a deterioration in the reference entity’s credit worthiness. The value of the swap will decrease when the swap spread declines representing an improvement in the reference entity’s credit worthiness. |
The following table summarizes the fair value and Statement of Assets and Liabilities location, as of October 31, 2012, for Income Fund’s investments in financial derivative instruments by primary risk exposure as discussed under item (2) Significant Accounting Policies of the Notes to Financial Statements.
| | | | | | |
Derivatives by risk category | | Statement of Assets and Liabilities Location | | Fair Value | |
| | |
Asset Derivatives | | | | | | |
| | |
Interest Rate Contracts | | | | | | |
Futures* | | Net Assets - Net unrealized appreciation/(depreciation) on Futures contracts | | | 12,063 | |
Total Interest Rate Contracts | | | | | 12,063 | |
Total Asset Derivatives | | | | | $12,063 | |
| |
| | |
Liability Derivatives | | | | | | |
| | |
Interest Rate Contracts | | | | | | |
Futures* | | Net Assets - Net unrealized appreciation/(depreciation) on Futures contracts | | | 322,260 | |
Total Interest Rate Contracts | | | | | 322,260 | |
| | |
Credit Contracts | | | | | | |
Credit Default Swaps | | Receivable/Payable - Swap agreements, at value; Net Assets - Net unrealized appreciation/(depreciation) on Swap agreements | | | 251,053 | |
| | |
Total Credit Contracts | | | | | 251,053 | |
Total Liability Derivatives | | | | | $573,313 | |
| |
* | Includes cumulative appreciation/depreciation of futures contracts as reported in the Schedule of Investments. Only current day’s variation margin is reported within the Statement of Assets and Liabilities. |
The accompanying Notes to Financial Statements are an integral part of this schedule.
194
Income Fund
Schedule of Investments as of October 31, 2012
The following table summarizes the net realized gains/(losses) and Statement of Operations location, for the period ended October 31, 2012, for Income Fund’s investments in financial derivative instruments by primary risk exposure.
| | | | | | |
Derivatives by risk category | | Statement of Operations Location | | Realized Gains/(Losses)
recognized in Income | |
| | |
Interest Rate Contracts | | | | | | |
Futures | | Net realized gains/(losses) on Futures contracts | | | (1,915,276 | ) |
| | |
Total Interest Rate Contracts | | | | | (1,915,276 | ) |
| | |
Foreign Exchange Contracts | | | | | | |
Forward Contracts | | Net realized gains/(losses) on Foreign currency transactions | | | (383 | ) |
| | |
Total Foreign Exchange Contracts | | | | | (383 | ) |
| | |
Credit Contracts | | | | | | |
Credit Default Swaps | | Net realized gains/(losses) on Swap agreements | | | (19,234 | ) |
| | |
Total Credit Contracts | | | | | (19,234 | ) |
| |
Total | | | | | ($1,934,893 | ) |
| |
The following table summarizes the change in net unrealized appreciation/(depreciation) and Statement of Operations location, for the period ended October 31, 2012, for Income Fund’s investments in financial derivative instruments by primary risk exposure.
| | | | | | |
Derivatives by risk category | | Statement of Operations Location | | Change in unrealized
appreciation/(depreciation)
recognized in Income | |
| | |
Interest Rate Contracts | | | | | | |
Futures | | Change in net unrealized appreciation/(depreciation) on Futures contracts | | | (871,217 | ) |
Total Interest Rate Contracts | | | | | (871,217 | ) |
| | |
Credit Contracts | | | | | | |
Credit Default Swaps | | Change in net unrealized appreciation/(depreciation) on Swap agreements | | | (156,171 | ) |
Total Credit Contracts | | | | | (156,171 | ) |
| |
Total | | | | | ($1,027,388 | ) |
| |
The following table presents Income Fund’s average volume of derivative activity during the period ended October 31, 2012.
| | | | | | | | | | | | | | | | |
Derivative Risk Category | | Futures
(Notional*) | | | Futures
(Percentage
of Average
Net Assets) | | | Swaps
(Notional*) | | | Swaps
(Percentage
of Average
Net Assets) | |
Interest Rate Contracts | | $ | 238,951,003 | | | | 28.6 | % | | | N/A | | | | N/A | |
Credit Contracts | | | N/A | | | | N/A | | | $ | 4,727,018 | | | | 0.6 | % |
* | Notional amount represents long or short, or both, derivative positions held by the Fund. |
Investment in Affiliates
Affiliated issuers, as defined under the Investment Company Act of 1940, include those in which the Fund’s holdings of an issuer represent 5% or more of the outstanding voting securities of an issuer, or any affiliated mutual fund.
A summary of transactions for the fiscal year to date, in Income Fund, is as follows:
| | | | | | | | | | | | | | | | | | | | | | | | |
Fund | | Value
October 31, 2011 | | | Gross
Purchases | | | Gross
Sales | | | Shares Held at
October 31, 2012 | | | Value
October 31, 2012 | | | Income Earned
November 1, 2011 -
October 31, 2012 | |
High Yield | | | $945,118 | | | | $– | | | | $935,106 | | | | – | | | | $– | | | | $– | |
Securities Lending Trust-Collateral Investment | | | 16,053,730 | | | | 80,375,687 | | | | 89,122,887 | | | | 7,306,530 | | | | 7,306,530 | | | | 30,383 | |
Securities Lending Trust-Short Term Investment | | | – | | | | 76,165,636 | | | | 8,810,005 | | | | 67,355,631 | | | | 67,355,631 | | | | 4,356 | |
Total Value and Income Earned | | | 16,998,848 | | | | | | | | | | | | | | | | 74,662,161 | | | | 34,739 | |
The accompanying Notes to Financial Statements are an integral part of this schedule.
195
Core Bond Fund
Schedule of Investments as of October 31, 2012
| | | | | | | | |
Principal
Amount | | | Long-Term Fixed Income (103.9%) | | Value | |
| Asset-Backed Securities (4.1%) | | | | |
| | | | Carrington Mortgage Loan Trust | | | | |
| | $650,000 | | | 0.361%, 8/25/2036a | | | $264,933 | |
| | | | Conseco Financial Corporation | | | | |
| | 5,492 | | | 7.650%, 10/15/2027 | | | 5,505 | |
| | | | Countrywide Asset-Backed Certificates | | | | |
| | 675,000 | | | 5.859%, 10/25/2046 | | | 432,605 | |
| | | | Credit Based Asset Servicing and Securitization, LLC | | | | |
| | 722,631 | | | 4.384%, 12/25/2036 | | | 440,407 | |
| | | | First Horizon ABS Trust | | | | |
| | 1,440,060 | | | 0.341%, 10/25/2026a,b | | | 1,231,846 | |
| | 1,339,613 | | | 0.371%, 10/25/2034a,b | | | 957,337 | |
| | | | GMAC Mortgage Corporation Loan Trust | | | | |
| | 2,141,041 | | | 0.391%, 8/25/2035a,b | | | 1,441,081 | |
| | 1,730,070 | | | 0.391%, 12/25/2036a,b | | | 1,246,517 | |
| | | | Master Credit Card Trust | | | | |
| | 2,000,000 | | | 0.780%, 4/21/2017c | | | 1,999,606 | |
| | | | Popular ABS Mortgage Pass-Through Trust | | | | |
| | 900,000 | | | 5.297%, 11/25/2035 | | | 568,336 | |
| | | | Renaissance Home Equity Loan Trust | | | | |
| | 1,476,839 | | | 5.608%, 5/25/2036 | | | 872,133 | |
| | 1,000,000 | | | 5.285%, 1/25/2037 | | | 501,705 | |
| | | | Wachovia Asset Securitization, Inc. | | | | |
| | 2,171,812 | | | 0.351%, 7/25/2037a,b,d | | | 1,582,933 | |
| | | | | |
| | | | Total | | | 11,544,944 | |
| | | | | |
| |
| Basic Materials (0.7%) | | | | |
| | | | Dow Chemical Company | | | | |
| | 800,000 | | | 4.250%, 11/15/2020 | | | 886,759 | |
| | | | Freeport-McMoRan Copper & Gold, Inc. | | | | |
| | 500,000 | | | 3.550%, 3/1/2022 | | | 509,099 | |
| | | | Xstrata Finance Canada, Ltd. | | | | |
| | 550,000 | | | 2.450%, 10/25/2017c | | | 548,592 | |
| | | | | |
| | | | Total | | | 1,944,450 | |
| | | | | |
| |
| Capital Goods (0.7%) | | | | |
| | | | John Deere Capital Corporation | | | | |
| | 300,000 | | | 1.700%, 1/15/2020 | | | 300,893 | |
| | | | Owens Corning, Inc. | | | | |
| | 225,000 | | | 4.200%, 12/15/2022 | | | 227,417 | |
| | | | Republic Services, Inc. | | | | |
| | 400,000 | | | 5.000%, 3/1/2020 | | | 464,023 | |
| | | | Textron, Inc. | | | | |
| | 500,000 | | | 7.250%, 10/1/2019 | | | 604,360 | |
| | | | United Technologies Corporation | | | | |
| | 400,000 | | | 0.918%, 6/1/2015a | | | 404,961 | |
| | | | | |
| | | | Total | | | 2,001,654 | |
| | | | | |
| |
| Collateralized Mortgage Obligations (2.1%) | | | | |
| | | | Bear Stearns Mortgage Funding Trust | | | | |
| | 417,152 | | | 0.491%, 8/25/2036a | | | 118,833 | |
| | | | Countrywide Alternative Loan Trust | | | | |
| | 1,206,445 | | | 6.000%, 1/25/2037 | | | 987,195 | |
| | | | GMAC Mortgage Corporation Loan Trust | | | | |
| | 673,878 | | | 5.351%, 9/19/2035 | | | 656,876 | |
| | | | HomeBanc Mortgage Trust | | | | |
| | 1,698,254 | | | 2.634%, 4/25/2037 | | | 1,081,428 | |
| | | | J.P. Morgan Alternative Loan Trust | | | | |
| | 2,180,664 | | | 2.808%, 3/25/2036 | | | 1,502,074 | |
| | 678,215 | | | 6.500%, 3/25/2036 | | | 572,375 | |
| | | | Master Asset Securitization Trust | | | | |
| | 706,049 | | | 0.711%, 6/25/2036a | | | 461,524 | |
| | | | WaMu Mortgage Pass Through Certificates | | | | |
| | 328,380 | | | 2.725%, 8/25/2046 | | | 255,736 | |
| | | | Wells Fargo Mortgage Backed Securities Trust | | | | |
| | 529,693 | | | 6.000%, 7/25/2037 | | | 518,396 | |
| | | | | |
| | | | Total | | | 6,154,437 | |
| | | | | |
| |
| Commercial Mortgage-Backed Securities (6.4%) | | | | |
| | | | Bear Stearns Commercial Mortgage Securities, Inc. | | | | |
| | 563,212 | | | 5.613%, 6/11/2050 | | | 577,927 | |
| | 509,507 | | | 0.364%, 3/15/2022a,c | | | 494,440 | |
| | | | Citigroup/Deutsche Bank Commercial Mortgage | | | | |
| | 1,250,000 | | | 5.322%, 12/11/2049 | | | 1,436,545 | |
| | | | Commercial Mortgage Pass- Through Certificates | | | | |
| | 4,000,000 | | | 0.344%, 12/15/2020a,c | | | 3,718,052 | |
| | | | Credit Suisse Mortgage Capital Certificates | | | | |
| | 1,583,619 | | | 0.384%, 10/15/2021a,c | | | 1,545,254 | |
| | 1,200,000 | | | 5.467%, 9/15/2039 | | | 1,368,913 | |
| | | | Government National Mortgage Association | | | | |
| | 1,817,546 | | | 3.214%, 1/16/2040 | | | 1,912,237 | |
| | | | GS Mortgage Securities Corporation II | | | | |
| | 3,000,000 | | | 1.260%, 3/6/2020a,c | | | 2,998,842 | |
| | | | LB-UBS Commercial Mortgage Trust | | | | |
| | 700,000 | | | 5.866%, 9/15/2045 | | | 841,693 | |
| | | | Morgan Stanley Capital I | | | | |
| | 1,000,000 | | | 3.224%, 7/15/2049 | | | 1,079,861 | |
| | | | Wachovia Bank Commercial Mortgage Trust | | | | |
| | 2,000,000 | | | 5.765%, 7/15/2045 | | | 2,305,432 | |
| | | | | |
| | | | Total | | | 18,279,196 | |
| | | | | |
| |
| Communications Services (3.3%) | | | | |
| | | | American Tower Corporation | | | | |
| | 1,000,000 | | | 5.050%, 9/1/2020 | | | 1,123,696 | |
| | | | CBS Corporation | | | | |
| | 800,000 | | | 8.875%, 5/15/2019 | | | 1,100,990 | |
| | | | CenturyLink, Inc. | | | | |
| | 500,000 | | | 5.800%, 3/15/2022 | | | 526,293 | |
| | | | Cox Communications, Inc. | | | | |
| | 750,000 | | | 8.375%, 3/1/2039c | | | 1,190,075 | |
| | | | Crown Castle Towers, LLC | | | | |
| | 800,000 | | | 4.883%, 8/15/2020c | | | 914,178 | |
The accompanying Notes to Financial Statements are an integral part of this schedule.
196
Core Bond Fund
Schedule of Investments as of October 31, 2012
| | | | | | | | |
Principal
Amount | | | Long-Term Fixed Income (103.9%) | | Value | |
| Communications Services (3.3%) - continued | | | | |
| | | | Discovery Communications, LLC | | | | |
| | $400,000 | | | 4.950%, 5/15/2042 | | | $450,929 | |
| | | | Frontier Communications Corporation | | | | |
| | 681,000 | | | 6.250%, 1/15/2013 | | | 686,108 | |
| | | | Qwest Communications International, Inc. | | | | |
| | 450,000 | | | 7.125%, 4/1/2018 | | | 475,322 | |
| | | | SBA Tower Trust | | | | |
| | 800,000 | | | 5.101%, 4/15/2017c | | | 888,639 | |
| | | | Telemar Norte Leste SA | | | | |
| | 500,000 | | | 5.500%, 10/23/2020c | | | 537,500 | |
| | | | Time Warner Cable, Inc. | | | | |
| | 450,000 | | | 4.500%, 9/15/2042 | | | 462,393 | |
| | | | Verizon Communications, Inc. | | | | |
| | 350,000 | | | 8.950%, 3/1/2039 | | | 618,830 | |
| | | | Virgin Media Secured Finance plc | | | | |
| | 400,000 | | | 5.250%, 1/15/2021 | | | 466,011 | |
| | | | | |
| | | | Total | | | 9,440,964 | |
| | | | | |
| |
| Consumer Cyclical (1.2%) | | | | |
| | | | California Institute of Technology | | | | |
| | 750,000 | | | 4.700%, 11/1/2111 | | | 826,267 | |
| | | | Dartmouth College | | | | |
| | 575,000 | | | 3.760%, 6/1/2043 | | | 596,309 | |
| | | | Ford Motor Credit Company, LLC | | | | |
| | 500,000 | | | 3.984%, 6/15/2016 | | | 529,945 | |
| | 400,000 | | | 5.000%, 5/15/2018 | | | 441,218 | |
| | | | Macy’s Retail Holdings, Inc. | | | | |
| | 800,000 | | | 7.450%, 7/15/2017 | | | 991,766 | |
| | | | | |
| | | | Total | | | 3,385,505 | |
| | | | | |
| |
| Consumer Non-Cyclical (3.2%) | | | | |
| | | | Altria Group, Inc. | | | | |
| | 400,000 | | | 4.250%, 8/9/2042 | | | 408,573 | |
| | | | Anheuser-Busch InBev Worldwide, Inc. | | | | |
| | 700,000 | | | 1.375%, 7/15/2017 | | | 710,552 | |
| | | | Beam, Inc. | | | | |
| | 400,000 | | | 3.250%, 5/15/2022 | | | 420,104 | |
| | | | Celgene Corporation | | | | |
| | 1,000,000 | | | 3.950%, 10/15/2020 | | | 1,089,874 | |
| | | | Coca-Cola Enterprises, Inc. | | | | |
| | 500,000 | | | 3.250%, 8/19/2021 | | | 525,289 | |
| | | | Colgate-Palmolive Company | | | | |
| | 500,000 | | | 2.625%, 5/1/2017 | | | 535,464 | |
| | | | CVS Caremark Corporation | | | | |
| | 500,000 | | | 6.125%, 9/15/2039 | | | 670,491 | |
| | | | Express Scripts Holding Company | | | | |
| | 400,000 | | | 3.900%, 2/15/2022c | | | 437,224 | |
| | | | HCA, Inc. | | | | |
| | 800,000 | | | 6.500%, 2/15/2020 | | | 884,000 | |
| | | | Heineken NV | | | | |
| | 200,000 | | | 1.400%, 10/1/2017c | | | 200,900 | |
| | 400,000 | | | 2.750%, 4/1/2023c | | | 404,124 | |
| | | | Koninklijke Philips Electronics NV | | | | |
| | 600,000 | | | 3.750%, 3/15/2022 | | | 664,035 | |
| | | | Mayo Clinic Rochester | | | | |
| | 450,000 | | | 3.774%, 11/15/2043 | | | 447,093 | |
| | | | Quest Diagnostics, Inc. | | | | |
| | 350,000 | | | 4.700%, 4/1/2021 | | | 394,850 | |
| | | | Reynolds American, Inc. | | | | |
| | 275,000 | | | 1.050%, 10/30/2015 | | | 275,808 | |
| | 325,000 | | | 3.250%, 11/1/2022 | | | 328,713 | |
| | | | SABMiller Holdings, Inc. | | | | |
| | 800,000 | | | 3.750%, 1/15/2022c | | | 879,872 | |
| | | | | |
| | | | Total | | | 9,276,966 | |
| | | | | |
| |
| Energy (2.4%) | | | | |
| | | | BP Capital Markets plc | | | | |
| | 1,000,000 | | | 4.500%, 10/1/2020 | | | 1,174,282 | |
| | | | EOG Resources, Inc. | | | | |
| | 425,000 | | | 2.625%, 3/15/2023 | | | 435,054 | |
| | | | International Petroleum Investment Company, Ltd. | | | | |
| | 1,000,000 | | | 5.000%, 11/15/2020c | | | 1,112,500 | |
| | | | Marathon Oil Corporation | | | | |
| | 400,000 | | | 0.900%, 11/1/2015 | | | 401,415 | |
| | | | Rowan Companies, Inc. | | | | |
| | 500,000 | | | 4.875%, 6/1/2022 | | | 552,780 | |
| | | | Transocean, Inc. | | | | |
| | 800,000 | | | 7.375%, 4/15/2018 | | | 967,208 | |
| | | | Valero Energy Corporation | | | | |
| | 800,000 | | | 6.125%, 2/1/2020 | | | 988,158 | |
| | | | Weatherford International, Ltd. | | | | |
| | 500,000 | | | 6.000%, 3/15/2018 | | | 575,489 | |
| | 500,000 | | | 5.125%, 9/15/2020 | | | 556,632 | |
| | | | | |
| | | | Total | | | 6,763,518 | |
| | | | | |
| |
| Financials (12.3%) | | | | |
| | | | Ally Financial, Inc. | | | | |
| | 400,000 | | | 4.500%, 2/11/2014 | | | 412,000 | |
| | | | American Express Bank FSB | | | | |
| | 500,000 | | | 6.000%, 9/13/2017 | | | 608,511 | |
| | | | Associated Banc Corporation | | | | |
| | 425,000 | | | 1.875%, 3/12/2014 | | | 424,883 | |
| | | | Bank of America Corporation | | | | |
| | 400,000 | | | 5.650%, 5/1/2018 | | | 465,699 | |
| | 400,000 | | | 5.875%, 2/7/2042 | | | 491,654 | |
| | | | Bank of New York Mellon Corporation | | | | |
| | 450,000 | | | 1.281%, 11/24/2014a | | | 456,472 | |
| | 450,000 | | | 1.700%, 11/24/2014 | | | 460,093 | |
| | | | Barclays Bank plc | | | | |
| | 550,000 | | | 5.140%, 10/14/2020 | | | 575,290 | |
| | | | Bear Stearns Companies, LLC | | | | |
| | 800,000 | | | 6.400%, 10/2/2017 | | | 963,974 | |
| | | | Boston Properties, LP | | | | |
| | 800,000 | | | 4.125%, 5/15/2021 | | | 877,621 | |
| | | | Capital One Capital V | | | | |
| | 850,000 | | | 10.250%, 8/15/2039 | | | 875,500 | |
| | | | Citigroup, Inc. | | | | |
| | 409,000 | | | 1.290%, 4/1/2014a | | | 410,020 | |
| | | | CNA Financial Corporation | | | | |
| | 800,000 | | | 6.500%, 8/15/2016 | | | 923,542 | |
| | | | Cooperatieve Centrale Raiffeisen- Boerenleenbank BA | | | | |
| | 500,000 | | | 4.750%, 1/15/2020c | | | 573,230 | |
| | 500,000 | | | 11.000%, 12/29/2049c,e | | | 668,750 | |
| | | | Credit Suisse of New York, Convertible | | | | |
| | 350,000 | | | 0.500%, 6/22/2018f | | | 341,600 | |
The accompanying Notes to Financial Statements are an integral part of this schedule.
197
Core Bond Fund
Schedule of Investments as of October 31, 2012
| | | | | | | | |
Principal
Amount | | | Long-Term Fixed Income (103.9%) | | Value | |
| Financials (12.3%) - continued | | | | |
| | | | Credit Suisse Securities USA, LLC | | | | |
| | $1,200,000 | | | 1.000%, 4/28/2017g | | | $1,246,080 | |
| | | | Discover Bank | | | | |
| | 500,000 | | | 7.000%, 4/15/2020 | | | 612,848 | |
| | | | Duke Realty, LP | | | | |
| | 475,000 | | | 3.875%, 10/15/2022 | | | 494,445 | |
| | | | Eksportfinans ASA | | | | |
| | 500,000 | | | 2.375%, 5/25/2016 | | | 471,250 | |
| | | | Fifth Third Bancorp | | | | |
| | 650,000 | | | 5.450%, 1/15/2017 | | | 733,760 | |
| | | | General Electric Capital Corporation | | | | |
| | 800,000 | | | 3.800%, 6/18/2019c | | | 853,748 | |
| | 300,000 | | | 6.750%, 3/15/2032 | | | 399,039 | |
| | | | Goldman Sachs Group, Inc., Convertible | | | | |
| | 20,398 | | | 1.000%, 7/10/2013c,h | | | 598,151 | |
| | | | HCP, Inc. | | | | |
| | 800,000 | | | 5.375%, 2/1/2021 | | | 925,979 | |
| | | | Health Care REIT, Inc. | | | | |
| | 800,000 | | | 6.125%, 4/15/2020 | | | 941,378 | |
| | | | HSBC Holdings plc | | | | |
| | 575,000 | | | 6.500%, 5/2/2036 | | | 704,009 | |
| | | | ING Bank NV | | | | |
| | 250,000 | | | 5.000%, 6/9/2021c | | | 282,340 | |
| | | | ING Capital Funding Trust III | | | | |
| | 100,000 | | | 3.962%, 12/31/2049e | | | 93,876 | |
| | | | International Lease Finance Corporation | | | | |
| | 300,000 | | | 8.625%, 9/15/2015 | | | 337,800 | |
| | | | J.P. Morgan Chase & Company | | | | |
| | 725,000 | | | 2.000%, 8/15/2017 | | | 732,767 | |
| | | | Kommuninvest I Sverige AB | | | | |
| | 275,000 | | | 1.000%, 10/24/2017c | | | 275,133 | |
| | | | Liberty Mutual Group, Inc. | | | | |
| | 200,000 | | | 4.950%, 5/1/2022c | | | 218,412 | |
| | | | Liberty Property, LP | | | | |
| | 630,000 | | | 5.500%, 12/15/2016 | | | 716,193 | |
| | | | Lloyds TSB Bank plc | | | | |
| | 600,000 | | | 6.500%, 9/14/2020c | | | 653,640 | |
| | | | Macquarie Bank, Ltd. | | | | |
| | 500,000 | | | 5.000%, 2/22/2017c | | | 543,065 | |
| | | | Metropolitan Life Global Funding I | | | | |
| | 750,000 | | | 3.650%, 6/14/2018c | | | 823,061 | |
| | | | Morgan Stanley | | | | |
| | 800,000 | | | 7.300%, 5/13/2019 | | | 962,654 | |
| | | | National Australia Bank, Ltd. | | | | |
| | 300,000 | | | 2.000%, 6/20/2017c | | | 310,140 | |
| | | | PNC Funding Corporation | | | | |
| | 800,000 | | | 5.125%, 2/8/2020 | | | 959,961 | |
| | | | Principal Financial Group, Inc. | | | | |
| | 800,000 | | | 8.875%, 5/15/2019 | | | 1,062,977 | |
| | | | Prudential Financial, Inc. | | | | |
| | 1,150,000 | | | 6.100%, 6/15/2017 | | | 1,364,764 | |
| | | | Rabobank Capital Funding Trust II | | | | |
| | 405,000 | | | 5.260%, 12/29/2049c,e | | | 405,000 | |
| | | | Reinsurance Group of America, Inc. | | | | |
| | 950,000 | | | 5.625%, 3/15/2017 | | | 1,082,661 | |
| | | | Royal Bank of Canada | | | | |
| | 850,000 | | | 1.013%, 10/30/2014a | | | 858,393 | |
| | | | Simon Property Group, LP | | | | |
| | 800,000 | | | 4.375%, 3/1/2021 | | | 903,325 | |
| | | | SLM Corporation | | | | |
| | 400,000 | | | 6.250%, 1/25/2016 | | | 432,020 | |
| | 400,000 | | | 8.000%, 3/25/2020 | | | 463,248 | |
| | | | Swiss RE Capital I, LP | | | | |
| | 850,000 | | | 6.854%, 5/29/2049c,e | | | 886,743 | |
| | | | Travelers Companies, Inc. | | | | |
| | 350,000 | | | 6.250%, 6/15/2037 | | | 478,407 | |
| | | | UBS AG/London | | | | |
| | 900,000 | | | 1.875%, 1/23/2015c | | | 916,718 | |
| | | | UnionBanCal Corporation | | | | |
| | 575,000 | | | 3.500%, 6/18/2022 | | | 609,422 | |
| | | | WEA Finance, LLC | | | | |
| | 600,000 | | | 6.750%, 9/2/2019c | | | 742,660 | |
| | | | Willis North America, Inc. | | | | |
| | 570,000 | | | 6.200%, 3/28/2017 | | | 654,599 | |
| | | | | |
| | | | Total | | | 35,279,505 | |
| | | | | |
| |
| Foreign Government (2.2%) | | | | |
| | | | Bank Nederlandse Gemeenten NV | | | | |
| | 900,000 | | | 4.375%, 2/16/2021c | | | 1,052,190 | |
| | | | Chile Government International Bond | | | | |
| | 800,000 | | | 3.875%, 8/5/2020 | | | 908,000 | |
| | | | Corporacion Andina de Fomento | | | | |
| | 425,000 | | | 4.375%, 6/15/2022 | | | 462,135 | |
| | | | Mexico Government International Bond | | | | |
| | 450,000 | | | 6.050%, 1/11/2040 | | | 597,375 | |
| | | | Province of British Columbia | | | | |
| | 1,375,000 | | | 2.650%, 9/22/2021 | | | 1,462,175 | |
| | | | Province of Manitoba | | | | |
| | 750,000 | | | 1.300%, 4/3/2017 | | | 767,325 | |
| | | | Province of New Brunswick | | | | |
| | 475,000 | | | 2.750%, 6/15/2018 | | | 513,356 | |
| | | | Province of Ontario | | | | |
| | 750,000 | | | 1.100%, 10/25/2017 | | | 751,200 | |
| | | | | |
| | | | Total | | | 6,513,756 | |
| | | | | |
| |
| Mortgage-Backed Securities (25.8%) | | | | |
| | | | Federal Home Loan Mortgage Corporation Gold 15-Yr. Pass Through | | | | |
| | 7,175,000 | | | 2.500%, 11/1/2027i | | | 7,493,391 | |
| | | | Federal Home Loan Mortgage Corporation Gold 30-Yr. Pass Through | | | | |
| | 6,750,000 | | | 3.000%, 11/1/2042i | | | 7,065,879 | |
| | | | Federal National Mortgage Association Conventional 15- Yr. Pass Through | | | | |
| | 9,650,000 | | | 2.500%, 11/1/2027i | | | 10,099,328 | |
| | | | Federal National Mortgage Association Conventional 30- Yr. Pass Through | | | | |
| | 17,425,000 | | | 3.500%, 11/1/2042i | | | 18,560,347 | |
| | 9,525,000 | | | 4.000%, 11/1/2042i | | | 10,199,191 | |
| | 13,725,000 | | | 5.000%, 11/1/2042i | | | 14,973,117 | |
| | 5,000,000 | | | 5.000%, 12/1/2042i | | | 5,454,687 | |
| | | | | |
| | | | Total | | | 73,845,940 | |
| | | | | |
The accompanying Notes to Financial Statements are an integral part of this schedule.
198
Core Bond Fund
Schedule of Investments as of October 31, 2012
| | | | | | | | |
Principal
Amount | | | Long-Term Fixed Income (103.9%) | | Value | |
| Technology (0.3%) | | | | |
| | | | Affiliated Computer Services, Inc. | | | | |
| | $800,000 | | | 5.200%, 6/1/2015 | | | $863,232 | |
| | | | | |
| | | | Total | | | 863,232 | |
| | | | | |
| |
| Transportation (1.3%) | | | | |
| | | | Burlington Northern Santa Fe, LLC | | | | |
| | 400,000 | | | 3.050%, 9/1/2022 | | | 417,373 | |
| | | | Continental Airlines, Inc. | | | | |
| | 625,000 | | | 4.150%, 4/11/2024 | | | 654,375 | |
| | | | CSX Corporation | | | | |
| | 800,000 | | | 3.700%, 10/30/2020 | | | 868,744 | |
| | | | Delta Air Lines, Inc. | | | | |
| | 458,109 | | | 4.950%, 11/23/2019 | | | 495,354 | |
| | 250,000 | | | 4.750%, 5/7/2020 | | | 264,075 | |
| | | | ERAC USA Finance, LLC | | | | |
| | 800,000 | | | 5.250%, 10/1/2020c | | | 917,579 | |
| | | | | |
| | | | Total | | | 3,617,500 | |
| | | | | |
| |
| U.S. Government and Agencies (33.5%) | | | | |
| | | | Federal Home Loan Banks | | | | |
| | 10,000,000 | | | 0.142%, 4/19/2013a | | | 9,999,670 | |
| | 1,750,000 | | | 1.375%, 5/28/2014 | | | 1,781,601 | |
| | 650,000 | | | 0.500%, 11/20/2015 | | | 650,953 | |
| | | | Federal Home Loan Mortgage Corporation | | | | |
| | 5,000,000 | | | 0.164%, 6/17/2013a | | | 5,003,040 | |
| | 1,000,000 | | | 1.250%, 8/1/2019 | | | 999,689 | |
| | 875,000 | | | 1.250%, 10/2/2019 | | | 872,568 | |
| | | | U.S. Treasury Bonds | | | | |
| | 1,500,000 | | | 4.500%, 5/15/2038 | | | 2,005,782 | |
| | 100,000 | | | 3.500%, 2/15/2039 | | | 114,422 | |
| | 6,760,000 | | | 3.000%, 5/15/2042 | | | 6,982,870 | |
| | | | U.S. Treasury Bonds, TIPS | | | | |
| | 1,019,369 | | | 0.750%, 2/15/2042 | | | 1,135,085 | |
| | | | U.S. Treasury Notes | | | | |
| | 1,750,000 | | | 0.750%, 6/15/2014 | | | 1,763,603 | |
| | 4,275,000 | | | 0.250%, 9/15/2015 | | | 4,259,969 | |
| | 3,750,000 | | | 1.000%, 10/31/2016 | | | 3,816,795 | |
| | 9,175,000 | | | 0.750%, 6/30/2017 | | | 9,210,838 | |
| | 1,000,000 | | | 2.375%, 6/30/2018 | | | 1,083,828 | |
| | 23,400,000 | | | 0.875%, 7/31/2019 | | | 23,078,250 | |
| | 1,000,000 | | | 3.125%, 5/15/2021 | | | 1,136,797 | |
| | 2,425,000 | | | 1.625%, 8/15/2022 | | | 2,411,738 | |
| | | | U.S. Treasury Notes, TIPS | | | | |
| | 5,070,600 | | | 0.125%, 4/15/2017 | | | 5,438,218 | |
| | 6,212,458 | | | 1.125%, 1/15/2021 | | | 7,346,723 | |
| | 6,207,903 | | | 0.125%, 1/15/2022 | | | 6,789,900 | |
| | | | | |
| | | | Total | | | 95,882,339 | |
| | | | | |
| |
| U.S. Municipals (0.4%) | | | | |
| | | | North Texas Tollway Authority Revenue Bonds (Build America Bonds) | | | | |
| | 850,000 | | | 6.718%, 1/1/2049 | | | 1,162,902 | |
| | | | | |
| | | | Total | | | 1,162,902 | |
| | | | | |
| |
| Utilities (4.0%) | | | | |
| | | | Cleveland Electric Illuminating Company | | | | |
| | 825,000 | | | 5.700%, 4/1/2017 | | | 935,752 | |
| | | | Duke Energy Carolinas, LLC | | | | |
| | 350,000 | | | 4.000%, 9/30/2042 | | | 373,228 | |
| | | | Energy Transfer Partners, LP | | | | |
| | 1,000,000 | | | 4.650%, 6/1/2021 | | | 1,110,628 | |
| | | | FirstEnergy Solutions Corporation | | | | |
| | 850,000 | | | 4.800%, 2/15/2015 | | | 918,938 | |
| | | | ITC Holdings Corporation | | | | |
| | 775,000 | | | 6.050%, 1/31/2018c | | | 912,748 | |
| | | | Kinder Morgan Energy Partners, LP | | | | |
| | 400,000 | | | 5.300%, 9/15/2020 | | | 473,952 | |
| | | | MidAmerican Energy Holdings Company | | | | |
| | 775,000 | | | 6.500%, 9/15/2037 | | | 1,070,149 | |
| | | | NiSource Finance Corporation | | | | |
| | 400,000 | | | 6.125%, 3/1/2022 | | | 492,336 | |
| | 400,000 | | | 3.850%, 2/15/2023 | | | 423,324 | |
| | | | ONEOK Partners, LP | | | | |
| | 450,000 | | | 8.625%, 3/1/2019 | | | 598,240 | |
| | | | Pennsylvania Electric Company | | | | |
| | 800,000 | | | 5.200%, 4/1/2020 | | | 913,451 | |
| | | | Potomac Electric Power Company | | | | |
| | 600,000 | | | 7.900%, 12/15/2038 | | | 979,179 | |
| | | | Sempra Energy | | | | |
| | 400,000 | | | 2.300%, 4/1/2017 | | | 417,684 | |
| | | | Union Electric Company | | | | |
| | 1,150,000 | | | 6.400%, 6/15/2017 | | | 1,417,165 | |
| | | | Williams Partners, LP | | | | |
| | 450,000 | | | 3.350%, 8/15/2022 | | | 466,497 | |
| | | | | |
| | | | Total | | | 11,503,271 | |
| | | | | |
| | | | Total Long-Term Fixed Income (cost $289,250,128) | | | 297,460,079 | |
| | | | | |
| | |
| Shares | | | Mutual Funds (4.6%) | | Value | |
| Fixed Income Mutual Funds (4.6%) | | | | |
| | 2,646,014 | | | Thrivent High Yield Fund | | | 13,256,528 | |
| | | | | |
| | | | Total | | | 13,256,528 | |
| | | | | |
| | | | Total Mutual Funds (cost $9,800,000) | | | 13,256,528 | |
| | | | | |
| | |
| Shares | | | Preferred Stock (0.3%) | | Value | |
| Financials (0.3%) | | | | |
| | 10,000 | | | Discover Financial Services, | | | | |
| | | | 6.500%e | | | 254,500 | |
| | 16,000 | | | HSBC Holdings plc, 8.000%e | | | 451,520 | |
| | | | | |
| | | | Total | | | 706,020 | |
| | | | | |
| | | | | | | | |
| | | | | |
| | | | Total Preferred Stock (cost $649,600) | | | 706,020 | |
| | | | | |
| | |
Shares or
Principal
Amount | | | Short-Term Investments (16.7%) | | Value | |
| | | | Federal Home Loan Mortgage Corporation Discount Notes | | | | |
| | 300,000 | | | 0.160%, 12/17/2012j,k | | | 299,939 | |
| | 43,110,519 | | | Thrivent Financial Securities Lending Trust | | | 43,110,519 | |
The accompanying Notes to Financial Statements are an integral part of this schedule.
199
Core Bond Fund
Schedule of Investments as of October 31, 2012
| | | | | | | | |
Shares or
Principal
Amount | | | Short-Term Investments (16.7%) | | Value | |
| | | | U.S. Treasury Bills | | | | |
| | 4,500,000 | | | 0.115%, 11/8/2012j | | | $4,499,899 | |
| | | | | |
| | | | Total Short-Term Investments (at amortized cost) | | | 47,910,357 | |
| | | | | |
| | | | Total Investments (cost $347,610,085) 125.5% | | | $359,332,984 | |
| | | | | |
| | | | Other Assets and Liabilities, Net (25.5%) | | | (73,059,138 | ) |
| | | | | |
| | | | Total Net Assets 100.0% | | | $286,273,846 | |
| | | | | |
a | Denotes variable rate securities. Variable rate securities are securities whose yields vary with a designated market index or market rate. The rate shown is as of October 31, 2012. |
b | All or a portion of the security is insured or guaranteed. |
c | Denotes securities sold under Rule 144A of the Securities Act of 1933, which exempts them from registration. These securities have been deemed liquid and may be resold to other dealers in the program or to other qualified institutional buyers. As of October 31, 2012, the value of these investments was $29,503,106 or 10.3% of total net assets. |
d | Denotes restricted securities. Restricted securities are investment securities which have been deemed illiquid and cannot be offered for public sale without first being registered under the Securities Act of 1933. The following table indicates the acquisition date and cost of restricted securities Core Bond Fund owned as of October 31, 2012. |
| | | | | | | | |
Security | | Acquisition
Date | | | Cost | |
Wachovia Asset Securitization, Inc. | | | 3/16/2007 | | | $ | 2,171,812 | |
e | Denotes perpetual securities. Perpetual securities pay an indefinite stream of interest, but may be called by the issuer at an earlier date. |
f | Denotes equity-linked structured security. This security is linked to the common stock of Berkshire Hathaway, Inc. |
g | Denotes equity-linked structured security. This security is linked to the S&P 500 Index. |
h | Security is displayed in shares. This security is an equity-linked structured security. This security is linked to the common stock of Microsoft Corporation. |
i | Denotes investments purchased on a when-issued or delayed delivery basis. |
j | The interest rate shown reflects the yield, coupon rate or the discount rate at the date of purchase. |
k | At October 31, 2012, $299,939 of investments were held on deposit with the counterparty and pledged as the initial margin deposit for open futures contracts. |
Definitions:
| | | | |
REIT | | - | | Real Estate Investment Trust is a company that buys, develops, manages and/or sells real estate assets. |
TIPS | | - | | Treasury Inflation Protected Security. |
Unrealized Appreciation (Depreciation)
Gross unrealized appreciation and depreciation of investments, based on cost for federal income tax purposes, were as follows:
| | | | |
Gross unrealized appreciation | | | $17,641,377 | |
Gross unrealized depreciation | | | (6,039,395 | ) |
| | | | |
Net unrealized appreciation (depreciation) | | | $11,601,982 | |
| |
Cost for federal income tax purposes | | | $347,731,002 | |
The accompanying Notes to Financial Statements are an integral part of this schedule.
200
Core Bond Fund
Schedule of Investments as of October 31, 2012
Fair Valuation Measurements
The following table is a summary of the inputs used, as of October 31, 2012, in valuing Core Bond Fund’s assets carried at fair value.
| | | | | | | | | | | | | | | | |
| | | | |
Investments in Securities | | Total | | | Level 1 | | | Level 2 | | | Level 3 | |
| | | | |
Long-Term Fixed Income | | | | | | | | | | | | | | | | |
Asset-Backed Securities | | | 11,544,944 | | | | – | | | | 11,544,944 | | | | – | |
Basic Materials | | | 1,944,450 | | | | – | | | | 1,944,450 | | | | – | |
Capital Goods | | | 2,001,654 | | | | – | | | | 2,001,654 | | | | – | |
Collateralized Mortgage Obligations | | | 6,154,437 | | | | – | | | | 6,154,437 | | | | – | |
Commercial Mortgage-Backed Securities | | | 18,279,196 | | | | – | | | | 18,279,196 | | | | – | |
Communications Services | | | 9,440,964 | | | | – | | | | 9,440,964 | | | | – | |
Consumer Cyclical | | | 3,385,505 | | | | – | | | | 3,385,505 | | | | – | |
Consumer Non-Cyclical | | | 9,276,966 | | | | – | | | | 9,276,966 | | | | – | |
Energy | | | 6,763,518 | | | | – | | | | 6,763,518 | | | | – | |
Financials | | | 35,279,505 | | | | – | | | | 33,093,674 | | | | 2,185,831 | |
Foreign Government | | | 6,513,756 | | | | – | | | | 6,513,756 | | | | – | |
Mortgage-Backed Securities | | | 73,845,940 | | | | – | | | | 73,845,940 | | | | – | |
Technology | | | 863,232 | | | | – | | | | 863,232 | | | | – | |
Transportation | | | 3,617,500 | �� | | | – | | | | 3,617,500 | | | | – | |
U.S. Government and Agencies | | | 95,882,339 | | | | – | | | | 95,882,339 | | | | – | |
U.S. Municipals | | | 1,162,902 | | | | – | | | | 1,162,902 | | | | – | |
Utilities | | | 11,503,271 | | | | – | | | | 11,503,271 | | | | – | |
| | | | |
Mutual Funds | | | | | | | | | | | | | | | | |
Fixed Income Mutual Funds | | | 13,256,528 | | | | 13,256,528 | | | | – | | | | – | |
| | | | |
Preferred Stock | | | | | | | | | | | | | | | | |
Financials | | | 706,020 | | | | 706,020 | | | | – | | | | – | |
Short-Term Investments | | | 47,910,357 | | | | 43,110,519 | | | | 4,799,838 | | | | – | |
| |
Total | | $ | 359,332,984 | | | $ | 57,073,067 | | | $ | 300,074,086 | | | $ | 2,185,831 | |
| |
| | | | |
Other Financial Instruments | | Total | | | Level 1 | | | Level 2 | | | Level 3 | |
| | | | |
Asset Derivatives | | | | | | | | | | | | | | | | |
Futures Contracts | | | 22,525 | | | | 22,525 | | | | – | | | | – | |
| |
Total Asset Derivatives | | | $22,525 | | | | $22,525 | | | | $– | | | | $– | |
| |
| | | | |
Liability Derivatives | | | | | | | | | | | | | | | | |
Futures Contracts | | | 35,244 | | | | 35,244 | | | | – | | | | – | |
Credit Default Swaps | | | 308,639 | | | | – | | | | 308,639 | | | | – | |
| |
Total Liability Derivatives | | $ | 343,883 | | | $ | 35,244 | | | $ | 308,639 | | | $ | – | |
| |
There were no significant transfers between Levels during the period ended October 31, 2012. Transfers between Levels are identified as of the end of the period.
| | | | | | | | | | | | | | | | | | | | |
Futures Contracts | | Number of
Contracts
Long/(Short) | | | Expiration
Date | | | Notional
Principal
Amount | | | Value | | | Unrealized
Gain/(Loss) | |
2-Yr. U.S. Treasury Bond Futures | | | (100 | ) | | | December 2012 | | | ($ | 22,041,883 | ) | | ($ | 22,032,813 | ) | | $ | 9,070 | |
5-Yr. U.S. Treasury Bond Futures | | | (45 | ) | | | December 2012 | | | | (5,592,870 | ) | | | (5,591,249 | ) | | | 1,621 | |
10-Yr. U.S. Treasury Bond Futures | | | (270 | ) | | | December 2012 | | | | (35,930,272 | ) | | | (35,918,438 | ) | | | 11,834 | |
20-Yr U.S. Treasury Bond Futures | | | 80 | | | | December 2012 | | | | 11,980,244 | | | | 11,945,000 | | | | (35,244 | ) |
Total Futures Contracts | | | | | | | | | | | | | | | | | | ($ | 12,719 | ) |
The accompanying Notes to Financial Statements are an integral part of this schedule.
201
Core Bond Fund
Schedule of Investments as of October 31, 2012
| | | | | | | | | | | | | | | | | | | | | | |
Credit Default Swaps and
Counterparty | | Buy/Sell Protection1 | | Termination
Date | | | Notional
Principal
Amount2 | | | Upfront
Payments
Received (Made) | | | Value3 | | | Unrealized
Gain/(Loss) | |
CDX HY, Series 18, 5 Year,
at 5.00%; Bank of America | | Buy | | | 6/20/2017 | | | | $5,940,000 | | | | ($293,561 | ) | | | ($13,764 | ) | | | ($307,325 | ) |
CDX IG, Series 18, 5 Year,
at 1.00%; J.P. Morgan Chase and Co. | | Buy | | | 6/20/2017 | | | | 12,000,000 | | | | 58,022 | | | | (59,336 | ) | | | (1,314 | ) |
Total Credit Default Swaps | | | | | | | | | | | | | | | | | ($73,100 | ) | | | ($308,639 | ) |
1 | As the buyer of protection, Core Bond Fund pays periodic fees in return for payment by the seller which is contingent upon an adverse credit event occurring in the underlying issuer or reference entity. As the seller of protection, Core Bond Fund collects periodic fees from the buyer and profits if the credit of the underlying issuer or reference entity remains stable or improves while the swap is outstanding, but the seller in a credit default swap contract would be required to pay the amount of credit loss, determined as specified in the agreement, to the buyer in the event of an adverse credit event in the reference entity. |
2 | The maximum potential amount of future payments Core Bond Fund could be required to make as the seller or receive as the buyer of protection. |
3 | The values for credit indexes (CDX or LCDX) serve as an indicator of the current status of the payment/performance risk and represent the liability or profit for the credit default swap contract had the contract been closed as of the reporting date. When protection has been sold, the value of the swap will increase when the swap spread declines representing an improvement in the reference entity’s credit worthiness. The value of the swap will decrease when the swap spread increases representing a deterioration in the reference entity’s credit worthiness. When protection has been purchased, the value of the swap will increase when the swap spread increases representing a deterioration in the reference entity’s credit worthiness. The value of the swap will decrease when the swap spread declines representing an improvement in the reference entity’s credit worthiness. |
The following table summarizes the fair value and Statement of Assets and Liabilities location, as of October 31, 2012, for Core Bond Fund’s investments in financial derivative instruments by primary risk exposure as discussed under item (2) Significant Accounting Policies of the Notes to Financial Statements.
| | | | | | |
Derivatives by risk category | | Statement of Assets and Liabilities Location | | Fair Value | |
| | |
Asset Derivatives | | | | | | |
| | |
Interest Rate Contracts | | | | | | |
Futures* | | Net Assets - Net unrealized appreciation/(depreciation) on Futures contracts | | | 22,525 | |
Total Interest Rate Contracts | | | | | 22,525 | |
| |
Total Asset Derivatives | | | | | $22,525 | |
| |
| | |
Liability Derivatives | | | | | | |
| | |
Interest Rate Contracts | | | | | | |
Futures* | | Net Assets - Net unrealized appreciation/(depreciation) on Futures contracts | | | 35,244 | |
Total Interest Rate Contracts | | | | | 35,244 | |
| | |
Credit Contracts | | | | | | |
Credit Default Swaps | | Receivable/Payable - Swap agreements, at value; Net Assets - Net unrealized appreciation/(depreciation) on Swap agreements | | | 308,639 | |
Total Credit Contracts | | | | | 308,639 | |
| |
Total Liability Derivatives | | | | | $343,883 | |
| |
* | Includes cumulative appreciation/depreciation of futures contracts as reported in the Schedule of Investments. Only current day’s variation margin is reported within the Statement of Assets and Liabilities. |
The accompanying Notes to Financial Statements are an integral part of this schedule.
202
Core Bond Fund
Schedule of Investments as of October 31, 2012
The following table summarizes the net realized gains/(losses) and Statement of Operations location, for the period ended October 31, 2012, for Core Bond Fund’s investments in financial derivative instruments by primary risk exposure.
| | | | | | |
Derivatives by risk category | | Statement of Operations Location | | Realized Gains/(Losses)
recognized in Income | |
| | |
Interest Rate Contracts | | | | | | |
Options Written | | Net realized gains/(losses) on Written option contracts | | | 6,010 | |
Futures | | Net realized gains/(losses) on Futures contracts | | | (949,575 | ) |
| | |
Total Interest Rate Contracts | | | | | (943,565 | ) |
| | |
Equity Contracts | | | | | | |
Options Purchased | | Net realized gains/(losses) on Investments | | | (26,370 | ) |
| | |
Total Equity Contracts | | | | | (26,370 | ) |
| | |
Credit Contracts | | | | | | |
Credit Default Swaps | | Net realized gains/(losses) on Swap agreements | | | 107,362 | |
Total Credit Contracts | | | | | 107,362 | |
| |
Total | | | | | ($862,573 | ) |
| |
The following table summarizes the change in net unrealized appreciation/(depreciation) and Statement of Operations location, for the period ended October 31, 2012, for Core Bond Fund’s investments in financial derivative instruments by primary risk exposure.
| | | | | | |
Derivatives by risk category | | Statement of Operations Location | | Change in unrealized
appreciation/(depreciation)
recognized in Income | |
| | |
Interest Rate Contracts | | | | | | |
Futures | | Change in net unrealized appreciation/(depreciation) on Futures contracts | | | (220,077 | ) |
Total Interest Rate Contracts | | | | | (220,077 | ) |
| | |
Credit Contracts | | | | | | |
Credit Default Swaps | | Change in net unrealized appreciation/(depreciation) on Swap agreements | | | (994,124 | ) |
Total Credit Contracts | | | | | (994,124 | ) |
| |
Total | | | | | ($1,214,201 | ) |
| |
The following table presents Core Bond Fund’s average volume of derivative activity during the period ended October 31, 2012.
| | | | | | | | | | | | | | | | | | | | |
Derivative Risk Category | | Futures
(Notional*) | | | Futures
(Percentage of
Average Net Assets) | | | Swaps
(Notional*) | | | Swaps
(Percentage of
Average Net Assets) | | | Options
(Contracts) | |
Equity Contracts | | | N/A | | | | N/A | % | | | N/A | | | | N/A | | | | 5 | |
Interest Rate Contracts | | $ | 74,869,148 | | | | 26.1 | | | | N/A | | | | N/A | | | | 1 | |
Credit Contracts | | | N/A | | | | N/A | | | $ | 13,308,457 | | | | 4.6 | % | | | N/A | |
* | Notional amount represents long or short, or both, derivative positions held by the Fund. |
Investment in Affiliates
Affiliated issuers, as defined under the Investment Company Act of 1940, include those in which the Fund’s holdings of an issuer represent 5% or more of the outstanding voting securities of an issuer, or any affiliated mutual fund.
A summary of transactions for the fiscal year to date, in Core Bond Fund, is as follows:
| | | | | | | | | | | | | | | | | | | | | | | | |
Fund | | Value
October 31,
2011 | | | Gross
Purchases | | | Gross
Sales | | | Shares Held at
October 31, 2012 | | | Value
October 31, 2012 | | | Income Earned
November 1, 2011 -
October 31, 2012 | |
High Yield | | | $12,489,184 | | | | $– | | | | $– | | | | 2,646,014 | | | | $13,256,528 | | | | $927,956 | |
Securities Lending Trust- Short Term Investment | | | — | | | | 47,062,798 | | | | 3,952,279 | | | | 43,110,519 | | | | 43,110,519 | | | | 7,257 | |
Total Value and Income Earned | | | 12,489,184 | | | | | | | | | | | | | | | | 56,367,047 | | | | 935,213 | |
The accompanying Notes to Financial Statements are an integral part of this schedule.
203
Government Bond Fund
Schedule of Investments as of October 31, 2012
| | | | | | | | |
Principal
Amount | | | Long-Term Fixed Income (96.5%) | | Value | |
| Asset-Backed Securities (1.3%) | | | | |
| | | | Education Loan Asset-Backed Trust I | | | | |
| | $460,623 | | | 0.661%, 6/25/2022a | | | $460,814 | |
| | | | Northstar Student Loan Trust I | | | | |
| | 1,000,000 | | | 0.966%, 12/26/2031a | | | 1,000,175 | |
| | | | | |
| | | | Total | | | 1,460,989 | |
| | | | | |
| |
| Collateralized Mortgage Obligations (0.6%) | | | | |
| | | | Federal National Mortgage Association | | | | |
| | 611,356 | | | 2.250%, 6/25/2025 | | | 633,246 | |
| | | | | |
| | | | Total | | | 633,246 | |
| | | | | |
| |
| Commercial Mortgage-Backed Securities (1.4%) | | | | |
| | | | Government National Mortgage Association | | | | |
| | 785,344 | | | 2.164%, 3/16/2033 | | | 798,050 | |
| | 727,018 | | | 3.214%, 1/16/2040 | | | 764,895 | |
| | | | | |
| | | | Total | | | 1,562,945 | |
| | | | | |
| |
| Financials (6.4%) | | | | |
| | | | Achmea Hypotheekbank NV | | | | |
| | 608,000 | | | 3.200%, 11/3/2014b | | | 636,533 | |
| | | | Bank of Montreal | | | | |
| | 750,000 | | | 2.625%, 1/25/2016b | | | 797,325 | |
| | | | Bank of Nova Scotia | | | | |
| | 500,000 | | | 1.450%, 7/26/2013b | | | 504,000 | |
| | | | Canadian Imperial Bank of Commerce | | | | |
| | 1,000,000 | | | 2.600%, 7/2/2015b | | | 1,054,000 | |
| | | | Dexia Credit Local SA | | | | |
| | 500,000 | | | 2.750%, 4/29/2014b | | | 505,243 | |
| | | | National Bank of Canada | | | | |
| | 500,000 | | | 2.200%, 10/19/2016b | | | 527,350 | |
| | | | NCUA Guaranteed Notes | | | | |
| | 677,142 | | | 0.669%, 10/7/2020a | | | 679,443 | |
| | | | Private Export Funding Corporation | | | | |
| | 1,000,000 | | | 1.375%, 2/15/2017 | | | 1,020,545 | |
| | 1,000,000 | | | 2.050%, 11/15/2022 | | | 997,432 | |
| | | | Toronto-Dominion Bank | | | | |
| | 500,000 | | | 2.200%, 7/29/2015b | | | 522,150 | |
| | | | | |
| | | | Total | | | 7,244,021 | |
| | | | | |
| |
| Foreign Government (2.4%) | | | | |
| | | | Bank Nederlandse Gemeenten NV | | | | |
| | 280,000 | | | 4.375%, 2/16/2021b | | | 327,348 | |
| | | | Kommunalbanken AS | | | | |
| | 500,000 | | | 2.750%, 5/5/2015b | | | 526,850 | |
| | | | Kreditanstalt fuer Wiederaufbau | | | | |
| | 825,000 | | | 0.224%, 6/17/2013a | | | 825,045 | |
| | | | Province of British Columbia | | | | |
| | 1,000,000 | | | 2.650%, 9/22/2021 | | | 1,063,400 | |
| | | | | |
| | | | Total | | | 2,742,643 | |
| | | | | |
| |
| Mortgage-Backed Securities (8.6%) | | | | |
| | | | Federal Home Loan Mortgage Corporation Gold 15-Yr. Pass Through | | | | |
| | 1,700,000 | | | 2.500%, 11/1/2027c | | | 1,775,438 | |
| | | | Federal Home Loan Mortgage Corporation Gold 30-Yr. Pass Through | | | | |
| | 950,000 | | | 3.000%, 11/1/2042c | | | 994,457 | |
| | | | Federal National Mortgage Association Conventional 15-Yr. Pass Through | | | | |
| | 1,050,000 | | | 2.500%, 11/1/2027c | | | 1,098,891 | |
| | | | Federal National Mortgage Association Conventional 30-Yr. Pass Through | | | | |
| | 2,275,000 | | | 3.500%, 11/1/2042c | | | 2,423,230 | |
| | 1,050,000 | | | 4.000%, 11/1/2042c | | | 1,124,320 | |
| | 2,050,000 | | | 5.000%, 11/1/2042c | | | 2,236,422 | |
| | | | | |
| | | | Total | | | 9,652,758 | |
| | | | | |
| |
| U.S. Government and Agencies (74.8%) | | | | |
| | | | FDIC Structured Sale Guaranteed Notes | | | | |
| | 400,000 | | | Zero Coupon, 1/7/2014b | | | 397,536 | |
| | | | Federal Agricultural Mortgage Corporation | | | | |
| | 1,000,000 | | | 2.125%, 9/15/2015 | | | 1,040,238 | |
| | 1,000,000 | | | 2.000%, 7/27/2016 | | | 1,047,068 | |
| | | | Federal Farm Credit Banks | | | | |
| | 500,000 | | | 2.210%, 8/1/2024 | | | 497,929 | |
| | | | Federal Home Loan Banks | | | | |
| | 3,875,000 | | | 0.375%, 1/29/2014 | | | 3,880,564 | |
| | 2,000,000 | | | 1.375%, 5/28/2014 | | | 2,036,116 | |
| | 1,000,000 | | | 0.500%, 11/20/2015 | | | 1,001,466 | |
| | 2,000,000 | | | 1.000%, 6/21/2017 | | | 2,022,640 | |
| | 3,000,000 | | | 5.000%, 11/17/2017 | | | 3,616,827 | |
| | | | Federal Home Loan Mortgage Corporation | | | | |
| | 660,000 | | | 1.750%, 9/10/2015 | | | 684,582 | |
| | 1,000,000 | | | 1.250%, 8/1/2019 | | | 999,689 | |
| | 1,000,000 | | | 1.250%, 10/2/2019 | | | 997,220 | |
| | 3,000,000 | | | 2.375%, 1/13/2022 | | | 3,144,054 | |
| | | | Federal National Mortgage Association | | | | |
| | 1,815,000 | | | 1.250%, 2/27/2014 | | | 1,841,071 | |
| | 2,450,000 | | | 0.500%, 5/27/2015 | | | 2,456,377 | |
| | 500,000 | | | 1.375%, 11/15/2016 | | | 514,673 | |
| | 2,950,000 | | | 0.875%, 12/20/2017 | | | 2,944,100 | |
| | 1,250,000 | | | 6.250%, 5/15/2029 | | | 1,819,421 | |
| | | | Tennessee Valley Authority | | | | |
| | 1,225,000 | | | 5.250%, 9/15/2039 | | | 1,639,308 | |
| | | | U.S. Treasury Bonds | | | | |
| | 2,125,000 | | | 7.625%, 2/15/2025 | | | 3,452,462 | |
| | 850,000 | | | 6.500%, 11/15/2026 | | | 1,301,297 | |
| | 1,100,000 | | | 3.000%, 5/15/2042 | | | 1,136,266 | |
| | | | U.S. Treasury Bonds, TIPS | | | | |
| | 336,041 | | | 2.375%, 1/15/2025 | | | 459,458 | |
| | 346,349 | | | 2.125%, 2/15/2040 | | | 515,195 | |
| | 509,684 | | | 0.750%, 2/15/2042 | | | 567,542 | |
| | | | U.S. Treasury Notes | | | | |
| | 2,800,000 | | | 2.625%, 2/29/2016 | | | 3,002,126 | |
| | 1,050,000 | | | 1.000%, 10/31/2016 | | | 1,068,703 | |
| | 3,500,000 | | | 3.250%, 3/31/2017 | | | 3,901,132 | |
| | 3,000,000 | | | 0.750%, 6/30/2017 | | | 3,011,718 | |
| | 3,500,000 | | | 2.375%, 6/30/2018 | | | 3,793,398 | |
| | 14,220,000 | | | 0.875%, 7/31/2019 | | | 14,024,475 | |
The accompanying Notes to Financial Statements are an integral part of this schedule.
204
Government Bond Fund
Schedule of Investments as of October 31, 2012
| | | | | | | | |
Principal
Amount | | | Long-Term Fixed Income (96.5%) | | Value | |
| U.S. Government and Agencies (74.8%) - continued | | | | |
| | $7,890,000 | | | 1.625%, 8/15/2022 | | | $7,846,850 | |
| | | | U.S. Treasury Notes, TIPS | | | | |
| | 120,630 | | | 1.625%, 1/15/2015 | | | 128,414 | |
| | 1,267,650 | | | 0.125%, 4/15/2017 | | | 1,359,555 | |
| | 1,555,917 | | | 2.625%, 7/15/2017 | | | 1,868,925 | |
| | 1,078,769 | | | 1.875%, 7/15/2019 | | | 1,320,061 | |
| | 1,579,439 | | | 1.125%, 1/15/2021 | | | 1,867,811 | |
| | 890,478 | | | 0.125%, 1/15/2022 | | | 973,961 | |
| | | | | |
| | | | Total | | | 84,180,228 | |
| | | | | |
| |
| Utilities (1.0%) | | | | |
| | | | John Sevier Combined Cycle Generation, LLC | | | | |
| | 993,490 | | | 4.626%, 1/15/2042 | | | 1,126,021 | |
| | | | | |
| | | | Total | | | 1,126,021 | |
| | | | | |
| | | | | | | | |
| | | | | |
| | | | Total Long-Term Fixed Income (cost $104,074,674) | | | 108,602,851 | |
| | | | | |
| | |
Shares or
Principal
Amount | | | Short-Term Investments (9.0%) | | Value | |
| | | | Federal Home Loan Bank Discount Notes | | | | |
| | 2,333,000 | | | 0.080%, 11/1/2012d | | | 2,333,000 | |
| | 4,848,944 | | | Thrivent Financial Securities Lending Trust | | | 4,848,944 | |
| | | | U.S. Treasury Bills | | | | |
| | 3,000,000 | | | 0.115%, 11/8/2012d | | | 2,999,933 | |
| | | | | |
| | | | Total Short-Term Investments (at amortized cost) | | | 10,181,877 | |
| | | | | |
| | | | Total Investments (cost $114,256,551) 105.5% | | $ | 118,784,728 | |
| | | | | |
| | | | Other Assets and Liabilities, Net (5.5%) | | | (6,206,959 | ) |
| | | | | |
| | | | Total Net Assets 100.0% | | $ | 112,577,769 | |
| | | | | |
a | Denotes variable rate securities. Variable rate securities are securities whose yields vary with a designated market index or market rate. The rate shown is as of October 31, 2012. |
b | Denotes securities sold under Rule 144A of the Securities Act of 1933, which exempts them from registration. These securities have been deemed liquid and may be resold to other dealers in the program or to other qualified institutional buyers. As of October 31, 2012, the value of these investments was $5,798,335 or 5.2% of total net assets. |
c | Denotes investments purchased on a when-issued or delayed delivery basis. |
d | The interest rate shown reflects the yield, coupon rate or the discount rate at the date of purchase. |
Definitions:
TIPS - Treasury Inflation Protected Security.
Unrealized Appreciation (Depreciation)
Gross unrealized appreciation and depreciation of investments, based on cost for federal income tax purposes, were as follows:
| | | | |
Gross unrealized appreciation | | | $4,558,075 | |
Gross unrealized depreciation | | | (81,230 | ) |
| | | | |
Net unrealized appreciation (depreciation) | | | $4,476,845 | |
| |
Cost for federal income tax purposes | | | $114,307,883 | |
The accompanying Notes to Financial Statements are an integral part of this schedule.
205
Government Bond Fund
Schedule of Investments as of October 31, 2012
Fair Valuation Measurements
The following table is a summary of the inputs used, as of October 31, 2012, in valuing Government Bond Fund’s assets carried at fair value.
| | | | | | | | | | | | | | | | |
Investments in Securities | | Total | | | Level 1 | | | Level 2 | | | Level 3 | |
Long-Term Fixed Income | | | | | | | | | | | | | | | | |
Asset-Backed Securities | | | 1,460,989 | | | | – | | | | 1,460,989 | | | | – | |
Collateralized Mortgage Obligations | | | 633,246 | | | | – | | | | 633,246 | | | | – | |
Commercial Mortgage-Backed Securities | | | 1,562,945 | | | | – | | | | 1,562,945 | | | | – | |
Financials | | | 7,244,021 | | | | – | | | | 7,244,021 | | | | – | |
Foreign Government | | | 2,742,643 | | | | – | | | | 2,742,643 | | | | – | |
Mortgage-Backed Securities | | | 9,652,758 | | | | – | | | | 9,652,758 | | | | – | |
U.S. Government and Agencies | | | 84,180,228 | | | | – | | | | 84,180,228 | | | | – | |
Utilities | | | 1,126,021 | | | | – | | | | 1,126,021 | | | | – | |
Short-Term Investments | | | 10,181,877 | | | | 4,848,944 | | | | 5,332,933 | | | | – | |
| |
Total | | | $118,784,728 | | | | $4,848,944 | | | | $113,935,784 | | | | $– | |
| |
There were no significant transfers between Levels during the period ended October 31, 2012. Transfers between Levels are identified as of the end of the period.
Investment in Affiliates
Affiliated issuers, as defined under the Investment Company Act of 1940, include those in which the Fund’s holdings of an issuer represent 5% or more of the outstanding voting securities of an issuer, or any affiliated mutual fund.
A summary of transactions for the fiscal year to date, in Government Bond Fund, is as follows:
| | | | | | | | | | | | | | | | | | | | | | | | |
Fund | | Value
October 31, 2011 | | | Gross
Purchases | | | Gross
Sales | | | Shares Held at
October 31, 2012 | | | Value
October 31, 2012 | | | Income Earned
November 1, 2011 -
October 31, 2012 | |
Securities Lending Trust-Collateral Investment | | | $– | | | | $8,067,525 | | | | $8,067,525 | | | | – | | | | $– | | | | $1,121 | |
Securities Lending Trust-Short Term Investment | | | – | | | | 6,661,114 | | | | 1,812,170 | | | | 4,848,944 | | | | 4,848,944 | | | | 470 | |
Total Value and Income Earned | | | – | | | | | | | | | | | | | | | | 4,848,944 | | | | 1,591 | |
The accompanying Notes to Financial Statements are an integral part of this schedule.
206
Limited Maturity Bond Fund
Schedule of Investments as of October 31, 2012
| | | | | | | | |
Principal
Amount | | | Long-Term Fixed Income (98.0%) | | Value | |
| Asset-Backed Securities (10.8%) | | | | |
| | | | Avis Budget Rental Car Funding | | | | |
| | $3,500,000 | | | 2.370%, 11/20/2014a | | | $3,596,684 | |
| | | | Carrington Mortgage Loan Trust | | | | |
| | 1,000,000 | | | 0.361%, 8/25/2036b | | | 407,589 | |
| | | | Citibank Omni Master Trust | | | | |
| | 4,000,000 | | | 4.900%, 11/15/2018a | | | 4,340,636 | |
| | | | Countrywide Home Loans, Inc. | | | | |
| | 924,733 | | | 6.085%, 6/25/2021c | | | 717,372 | |
| | | | Credit Based Asset Servicing and Securitization, LLC | | | | |
| | 758,763 | | | 4.384%, 12/25/2036 | | | 462,427 | |
| | | | Discover Card Master Trust | | | | |
| | 4,500,000 | | | 0.864%, 9/15/2015b | | | 4,508,937 | |
| | | | Education Loan Asset-Backed Trust I | | | | |
| | 6,448,727 | | | 0.661%, 6/25/2022b | | | 6,451,396 | |
| | | | Enterprise Fleet Financing, LLC | | | | |
| | 3,188,224 | | | 1.430%, 10/20/2016a | | | 3,198,299 | |
| | 2,000,000 | | | 0.720%, 4/20/2018a | | | 2,000,812 | |
| | | | First Franklin Mortgage Loan Asset-Backed Certificates | | | | |
| | 86,028 | | | 5.500%, 3/25/2036d,e | | | 1 | |
| | | | First Horizon ABS Trust | | | | |
| | 369,526 | | | 0.337%, 9/25/2029b,c | | | 281,507 | |
| | | | Ford Credit Floor Plan Master Owner Trust | | | | |
| | 5,000,000 | | | 1.500%, 9/15/2015 | | | 5,046,785 | |
| | | | Fosse Master Issuer plc | | | | |
| | 3,144,485 | | | 1.725%, 10/18/2054a,b | | | 3,193,492 | |
| | | | GMAC Mortgage Corporation Loan Trust | | | | |
| | 642,312 | | | 0.391%, 8/25/2035b,c | | | 432,324 | |
| | 849,977 | | | 5.750%, 10/25/2036c | | | 728,228 | |
| | 1,297,553 | | | 0.391%, 12/25/2036b,c | | | 934,888 | |
| | | | Hyundai Auto Lease Securitization Trust | | | | |
| | 5,000,000 | | | 1.020%, 8/15/2014a | | | 5,015,860 | |
| | | | J.P. Morgan Mortgage Trust | | | | |
| | 1,206,253 | | | 2.811%, 2/25/2036 | | | 999,649 | |
| | | | Master Credit Card Trust | | | | |
| | 7,000,000 | | | 0.780%, 4/21/2017a | | | 6,998,620 | |
| | | | Montana Higher Education Student Assistance Corporation | | | | |
| | 2,804,063 | | | 0.811%, 9/20/2022b | | | 2,812,947 | |
| | | | Mortgage Equity Conversion Asset Trust | | | | |
| | 2,511,771 | | | 0.670%, 1/25/2042b,d | | | 2,009,417 | |
| | 2,453,730 | | | 0.650%, 2/25/2042b,d | | | 1,962,984 | |
| | | | Nissan Auto Receivables Owner Trust | | | | |
| | 688,771 | | | 4.740%, 8/17/2015 | | | 692,269 | |
| | | | Northstar Student Loan Trust I | | | | |
| | 4,000,000 | | | 0.966%, 12/26/2031b | | | 4,000,700 | |
| | | | Renaissance Home Equity Loan Trust | | | | |
| | 1,609,634 | | | 5.608%, 5/25/2036 | | | 950,553 | |
| | 750,000 | | | 5.285%, 1/25/2037 | | | 376,279 | |
| | | | SLM Student Loan Trust | | | | |
| | 5,688,433 | | | 0.385%, 4/27/2020b | | | 5,661,123 | |
| | 2,482,631 | | | 1.314%, 1/18/2022a,b | | | 2,501,814 | |
| | 5,245,003 | | | 0.385%, 4/25/2022b | | | 5,236,831 | |
| | 2,313,693 | | | 0.395%, 4/25/2023b | | | 2,309,081 | |
| | 4,000,000 | | | 0.964%, 10/6/2023a,b | | | 4,000,832 | |
| | 2,130,371 | | | 0.611%, 3/25/2025b | | | 2,132,604 | |
| | 5,646,901 | | | 0.731%, 3/25/2026b | | | 5,644,964 | |
| | | | Toyota Auto Receivables Owner Trust | | | | |
| | 932,051 | | | 1.270%, 12/16/2013 | | | 933,361 | |
| | | | Wachovia Asset Securitization, Inc. | | | | |
| | 814,430 | | | 0.351%, 7/25/2037b,c,d | | | 593,600 | |
| | | | Wachovia Student Loan Trust | | | | |
| | 3,164,752 | | | 0.425%, 7/27/2020b | | | 3,151,843 | |
| | | | World Omni Auto Receivables Trust | | | | |
| | 1,250,000 | | | 1.330%, 1/15/2018 | | | 1,270,350 | |
| | | | | |
| | | | Total | | | 95,557,058 | |
| | | | | |
| |
| Basic Materials (1.1%) | | | | |
| | | | BHP Billiton Finance USA, Ltd. | | | | |
| | 3,000,000 | | | 0.704%, 2/18/2014b | | | 3,010,689 | |
| | | | Dow Chemical Company | | | | |
| | 1,500,000 | | | 2.500%, 2/15/2016 | | | 1,568,154 | |
| | | | Freeport-McMoRan Copper & Gold, Inc. | | | | |
| | 2,000,000 | | | 1.400%, 2/13/2015 | | | 2,020,400 | |
| | 750,000 | | | 2.150%, 3/1/2017 | | | 761,644 | |
| | | | Xstrata Finance Canada, Ltd. | | | | |
| | 1,950,000 | | | 2.450%, 10/25/2017a | | | 1,945,008 | |
| | | | | |
| | | | Total | | | 9,305,895 | |
| | | | | |
| |
| Capital Goods (0.8%) | | | | |
| | | | Caterpillar Financial Services Corporation | | | | |
| | 1,000,000 | | | 1.625%, 6/1/2017 | | | 1,024,924 | |
| | | | Danaher Corporation | | | | |
| | 1,000,000 | | | 0.626%, 6/21/2013b | | | 1,002,175 | |
| | | | John Deere Capital Corporation | | | | |
| | 3,000,000 | | | 0.443%, 10/8/2014b | | | 3,003,033 | |
| | | | Textron, Inc. | | | | |
| | 1,300,000 | | | 6.200%, 3/15/2015 | | | 1,424,320 | |
| | | | United Technologies Corporation | | | | |
| | 1,000,000 | | | 0.918%, 6/1/2015b | | | 1,012,403 | |
| | | | | |
| | | | Total | | | 7,466,855 | |
| | | | | |
| |
| Collateralized Mortgage Obligations (3.4%) | | | | |
| | | | American Home Mortgage Assets, LLC | | | | |
| | 1,449,527 | | | 1.074%, 11/25/2046b | | | 741,332 | |
| | | | Bear Stearns Adjustable Rate Mortgage Trust | | | | |
| | 799,316 | | | 2.470%, 10/25/2035b | | | 748,349 | |
| | | | Countrywide Alternative Loan Trust | | | | |
| | 635,660 | | | 5.500%, 11/25/2035 | | | 636,796 | |
| | 520,837 | | | 5.500%, 2/25/2036 | | | 424,465 | |
| | 755,445 | | | 6.000%, 1/25/2037 | | | 618,156 | |
| | | | Countrywide Home Loans, Inc. | | | | |
| | 963,626 | | | 2.758%, 3/20/2036 | | | 647,145 | |
| | 1,020,276 | | | 2.868%, 9/20/2036 | | | 613,170 | |
| | | | Deutsche Alt-A Securities, Inc. Alternative Loan Trust | | | | |
| | 1,706,709 | | | 0.924%, 4/25/2047b | | | 1,249,709 | |
The accompanying Notes to Financial Statements are an integral part of this schedule.
207
Limited Maturity Bond Fund
Schedule of Investments as of October 31, 2012
| | | | | | | | |
Principal
Amount | | | Long-Term Fixed Income (98.0%) | | Value | |
| Collateralized Mortgage Obligations (3.4%) - continued | |
| | | | Federal National Mortgage Association | | | | |
| | $5,604,100 | | | 2.250%, 6/25/2025 | | | $5,804,760 | |
| | | | GSR Mortgage Loan Trust | | | | |
| | 1,600,240 | | | 0.401%, 8/25/2046b | | | 1,468,635 | |
| | | | HomeBanc Mortgage Trust | | | | |
| | 970,431 | | | 2.634%, 4/25/2037 | | | 617,959 | |
| | | | Impac CMB Trust | | | | |
| | 733,084 | | | 0.851%, 8/25/2035b | | | 611,204 | |
| | | | J.P. Morgan Alternative Loan Trust | | | | |
| | 1,633,317 | | | 2.808%, 3/25/2036 | | | 1,125,053 | |
| | | | J.P. Morgan Mortgage Trust | | | | |
| | 654,613 | | | 3.023%, 10/25/2036 | | | 488,754 | |
| | | | Master Asset Securitization Trust | | | | |
| | 1,341,494 | | | 0.711%, 6/25/2036b | | | 876,896 | |
| | | | Permanent Master plc | | | | |
| | 5,000,000 | | | 1.840%, 7/15/2042a,b | | | 5,058,930 | |
| | | | Residential Accredit Loans, Inc. | | | | |
| | 872,156 | | | 3.855%, 9/25/2035 | | | 630,853 | |
| | | | Wachovia Mortgage Loan Trust, LLC | | | | |
| | 680,502 | | | 2.898%, 5/20/2036 | | | 530,868 | |
| | | | WaMu Mortgage Pass Through Certificates | | | | |
| | 573,038 | | | 0.501%, 10/25/2045b | | | 517,486 | |
| | 1,433,558 | | | 1.034%, 10/25/2046b | | | 1,013,046 | |
| | 1,779,095 | | | 0.974%, 12/25/2046b | | | 1,329,079 | |
| | 1,688,302 | | | 0.894%, 1/25/2047b | | | 1,184,315 | |
| | | | Washington Mutual Alternative Mortgage Pass Through Certificates | | | | |
| | 1,231,517 | | | 1.074%, 9/25/2046b | | | 590,498 | |
| | 1,989,550 | | | 0.904%, 2/25/2047b | | | 966,358 | |
| | | | Wells Fargo Mortgage Backed Securities Trust | | | | |
| | 302,903 | | | 2.629%, 3/25/2036 | | | 293,383 | |
| | 1,118,748 | | | 2.726%, 3/25/2036 | | | 1,049,332 | |
| | | | | |
| | | | Total | | | 29,836,531 | |
| | | | | |
|
| Commercial Mortgage-Backed Securities (7.1%) | |
| | | | Bear Stearns Commercial Mortgage Securities, Inc. | | | | |
| | 1,689,636 | | | 5.613%, 6/11/2050 | | | 1,733,781 | |
| | 203,803 | | | 0.364%, 3/15/2022a,b | | | 197,776 | |
| | 823,155 | | | 5.664%, 6/11/2040 | | | 845,427 | |
| | 1,700,000 | | | 5.331%, 2/11/2044 | | | 1,894,579 | |
| | | | Citigroup Commercial Mortgage Trust | | | | |
| | 750,000 | | | 5.699%, 12/10/2049 | | | 889,259 | |
| | | | Citigroup/Deutsche Bank Commercial Mortgage | | | | |
| | 1,595,000 | | | 5.322%, 12/11/2049 | | | 1,833,031 | |
| | | | Commercial Mortgage Pass- Through Certificates | | | | |
| | 1,000,000 | | | 0.344%, 12/15/2020a,b | | | 929,513 | |
| | 1,000,000 | | | 5.306%, 12/10/2046 | | | 1,149,857 | |
| | | | Credit Suisse First Boston Mortgage Securities Corporation | | | | |
| | 4,001,683 | | | 4.691%, 4/15/2037 | | | 4,155,876 | |
| | | | Credit Suisse Mortgage Capital Certificates | | | | |
| | 593,857 | | | 0.384%, 10/15/2021a,b | | | 579,470 | |
| | 1,750,000 | | | 5.467%, 9/15/2039 | | | 1,996,332 | |
| | | | Government National Mortgage Association | | | | |
| | 2,507,564 | | | 2.870%, 3/16/2051 | | | 2,595,953 | |
| | 4,680,936 | | | 1.864%, 8/16/2031 | | | 4,740,922 | |
| | 5,379,603 | | | 2.164%, 3/16/2033 | | | 5,466,645 | |
| | 4,725,620 | | | 3.214%, 1/16/2040 | | | 4,971,815 | |
| | | | Greenwich Capital Commercial Funding Corporation | | | | |
| | 2,697,000 | | | 5.074%, 1/5/2036 | | | 2,773,152 | |
| | 4,500,000 | | | 5.224%, 4/10/2037 | | | 4,981,244 | |
| | | | J.P. Morgan Chase Commercial Mortgage Securities Corporation | | | | |
| | 3,500,000 | | | 5.429%, 12/12/2043 | | | 4,009,264 | |
| | | | LB-UBS Commercial Mortgage Trust | | | | |
| | 726,408 | | | 5.303%, 2/15/2040 | | | 726,920 | |
| | | | Morgan Stanley Capital I | | | | |
| | 2,350,000 | | | 3.224%, 7/15/2049 | | | 2,537,673 | |
| | | | Morgan Stanley Capital, Inc. | | | | |
| | 2,866,501 | | | 5.576%, 4/12/2049 | | | 2,948,856 | |
| | | | NCUA Guaranteed Notes | | | | |
| | 4,007,160 | | | 1.600%, 10/29/2020 | | | 4,077,887 | |
| | | | Network Rail Infrastructure Finance plc | | | | |
| | 4,000,000 | | | 1.500%, 1/13/2014a | | | 4,053,120 | |
| | | | Wachovia Bank Commercial Mortgage Trust | | | | |
| | 1,500,000 | | | 5.765%, 7/15/2045 | | | 1,729,074 | |
| | | | | |
| | | | Total | | | 61,817,426 | |
| | | | | |
| |
| Communications Services (1.3%) | | | | |
| | | | CBS Corporation | | | | |
| | 1,500,000 | | | 8.875%, 5/15/2019 | | | 2,064,355 | |
| | | | Crown Castle Towers, LLC | | | | |
| | 1,500,000 | | | 3.214%, 8/15/2015a | | | 1,562,405 | |
| | 850,000 | | | 4.174%, 8/15/2017a | | | 933,524 | |
| | | | GTP Acquisition Partners I, LLC | | | | |
| | 1,500,000 | | | 4.347%, 6/15/2016a | | | 1,578,946 | |
| | | | Qwest Communications International, Inc. | | | | |
| | 1,000,000 | | | 7.125%, 4/1/2018 | | | 1,056,270 | |
| | | | SBA Tower Trust | | | | |
| | 3,500,000 | | | 4.254%, 4/15/2015a | | | 3,678,626 | |
| | | | Telemar Norte Leste SA | | | | |
| | 500,000 | | | 5.500%, 10/23/2020a | | | 537,500 | |
| | | | | |
| | | | Total | | | 11,411,626 | |
| | | | | |
| |
| Consumer Cyclical (1.4%) | | | | |
| | | | American Honda Finance Corporation | | | | |
| | 3,000,000 | | | 1.850%, 9/19/2014a | | | 3,053,064 | |
| | | | Daimler Finance North America, LLC | | | | |
| | 3,000,000 | | | 0.972%, 3/28/2014a,b | | | 3,011,547 | |
| | | | Ford Motor Credit Company, LLC | | | | |
| | 1,250,000 | | | 4.207%, 4/15/2016 | | | 1,331,269 | |
| | 1,300,000 | | | 3.984%, 6/15/2016 | | | 1,377,857 | |
The accompanying Notes to Financial Statements are an integral part of this schedule.
208
Limited Maturity Bond Fund
Schedule of Investments as of October 31, 2012
| | | | | | | | |
Principal
Amount | | | Long-Term Fixed Income (98.0%) | | Value | |
| Consumer Cyclical (1.4%) - continued | | | | |
| $ | 500,000 | | | 3.000%, 6/12/2017 | | | $511,346 | |
| | | | Volkswagen International Finance NV | | | | |
| | 3,000,000 | | | 1.625%, 3/22/2015a | | | 3,045,054 | |
| | | | | |
| | | | Total | | | 12,330,137 | |
| | | | | |
| |
| Consumer Non-Cyclical (2.8%) | | | | |
| | | | Altria Group, Inc. | | | | |
| | 500,000 | | | 2.850%, 8/9/2022 | | | 501,429 | |
| | | | Anheuser-Busch InBev Worldwide, Inc. | | | | |
| | 2,450,000 | | | 1.375%, 7/15/2017 | | | 2,486,934 | |
| | | | Beam, Inc. | | | | |
| | 1,000,000 | | | 1.875%, 5/15/2017 | | | 1,026,760 | |
| | | | Cargill, Inc. | | | | |
| | 1,073,000 | | | 4.307%, 5/14/2021a | | | 1,189,204 | |
| | | | Celgene Corporation | | | | |
| | 1,500,000 | | | 2.450%, 10/15/2015 | | | 1,563,839 | |
| | | | Coca-Cola Enterprises, Inc. | | | | |
| | 2,000,000 | | | 2.000%, 8/19/2016 | | | 2,057,950 | |
| | | | Express Scripts Holding Company | | | | |
| | 2,000,000 | | | 2.650%, 2/15/2017a | | | 2,087,734 | |
| | | | General Mills, Inc. | | | | |
| | 2,000,000 | | | 0.787%, 5/16/2014b | | | 2,008,584 | |
| | | | Heineken NV | | | | |
| | 2,000,000 | | | 1.400%, 10/1/2017a | | | 2,008,996 | |
| | | | Lorillard Tobacco Company | | | | |
| | 1,000,000 | | | 3.500%, 8/4/2016 | | | 1,062,625 | |
| | | | Quest Diagnostics, Inc. | | | | |
| | 2,000,000 | | | 1.223%, 3/24/2014b | | | 2,013,778 | |
| | | | Reynolds American, Inc. | | | | |
| | 2,600,000 | | | 1.050%, 10/30/2015 | | | 2,607,636 | |
| | | | SABMiller Holdings, Inc. | | | | |
| | 2,000,000 | | | 2.450%, 1/15/2017a | | | 2,096,502 | |
| | | | Teva Pharmaceutical Finance III BV | | | | |
| | 2,000,000 | | | 0.876%, 3/21/2014b | | | 2,011,528 | |
| | | | | |
| | | | Total | | | 24,723,499 | |
| | | | | |
| |
| Energy (1.8%) | | | | |
| | | | BP Capital Markets plc | | | | |
| | 4,000,000 | | | 1.008%, 3/11/2014b | | | 4,029,156 | |
| | | | Cameron International Corporation | | | | |
| | 2,000,000 | | | 1.351%, 6/2/2014b | | | 1,998,978 | |
| | | | Energy Transfer Partners, LP | | | | |
| | 1,000,000 | | | 6.000%, 7/1/2013 | | | 1,032,117 | |
| | | | International Petroleum Investment Company, Ltd. | | | | |
| | 1,000,000 | | | 3.125%, 11/15/2015a | | | 1,036,250 | |
| | | | Marathon Oil Corporation | | | | |
| | 1,800,000 | | | 0.900%, 11/1/2015 | | | 1,806,368 | |
| | | | Rowan Companies, Inc. | | | | |
| | 1,500,000 | | | 5.000%, 9/1/2017 | | | 1,644,641 | |
| | | | Schlumberger SA | | | | |
| | 2,500,000 | | | 2.650%, 1/15/2016a | | | 2,625,500 | |
| | | | Valero Energy Corporation | | | | |
| | 350,000 | | | 6.125%, 2/1/2020 | | | 432,319 | |
| | | | Weatherford International, Ltd. | | | | |
| | 1,000,000 | | | 6.000%, 3/15/2018 | | | 1,150,978 | |
| | | | | |
| | | | Total | | | 15,756,307 | |
| | | | | |
| |
| Financials (23.9%) | | | | |
| | | | ABN Amro Bank NV | | | | |
| $ | 3,000,000 | | | 2.083%, 1/30/2014a,b | | | 3,033,822 | |
| | | | ABN Amro North American Holding Preferred Capital Repackage Trust I | | | | |
| | 600,000 | | | 6.523%, 12/29/2049a,f | | | 600,000 | |
| | | | Achmea Hypotheekbank NV | | | | |
| | 3,343,000 | | | 3.200%, 11/3/2014a | | | 3,499,887 | |
| | | | Ally Financial, Inc. | | | | |
| | 1,250,000 | | | 4.500%, 2/11/2014 | | | 1,287,500 | |
| | | | American International Group, Inc. | | | | |
| | 1,500,000 | | | 5.050%, 10/1/2015 | | | 1,653,979 | |
| | | | Associated Banc Corporation | | | | |
| | 2,000,000 | | | 1.875%, 3/12/2014 | | | 1,999,450 | |
| | | | Australia and New Zealand Banking Group, Ltd. | | | | |
| | 2,000,000 | | | 1.000%, 10/6/2015a | | | 2,008,400 | |
| | 3,500,000 | | | 2.400%, 11/23/2016a | | | 3,683,050 | |
| | | | Bank Nederlandse Gemeenten NV | | | | |
| | 3,500,000 | | | 1.500%, 3/28/2014a | | | 3,544,310 | |
| | | | Bank of America Corporation | | | | |
| | 2,000,000 | | | 1.733%, 1/30/2014b | | | 2,017,666 | |
| | 1,125,000 | | | 1.500%, 10/9/2015 | | | 1,126,281 | |
| | 1,000,000 | | | 5.625%, 10/14/2016 | | | 1,140,194 | |
| | | | Bank of Montreal | | | | |
| | 3,250,000 | | | 2.625%, 1/25/2016a | | | 3,455,075 | |
| | | | Bank of New York Mellon Corporation | | | | |
| | 1,600,000 | | | 1.281%, 11/24/2014b | | | 1,623,011 | |
| | 1,600,000 | | | 1.700%, 11/24/2014 | | | 1,635,885 | |
| | | | Bank of Nova Scotia | | | | |
| | 2,000,000 | | | 1.250%, 11/7/2014a | | | 2,032,800 | |
| | 2,000,000 | | | 2.150%, 8/3/2016a | | | 2,103,000 | |
| | | | Barclays Bank plc | | | | |
| | 1,500,000 | | | 2.375%, 1/13/2014 | | | 1,530,318 | |
| | 3,000,000 | | | 2.500%, 9/21/2015a,g | | | 3,125,583 | |
| | | | Bear Stearns Companies, LLC | | | | |
| | 1,500,000 | | | 6.400%, 10/2/2017 | | | 1,807,452 | |
| | | | Berkshire Hathaway Finance Corporation | | | | |
| | 2,000,000 | | | 2.450%, 12/15/2015 | | | 2,105,618 | |
| | | | Caisse Centrale Desjardins du Quebec | | | | |
| | 2,000,000 | | | 2.550%, 3/24/2016a | | | 2,123,400 | |
| | | | Canadian Imperial Bank of Commerce | | | | |
| | 3,500,000 | | | 0.900%, 9/19/2014a | | | 3,532,200 | |
| | 1,500,000 | | | 2.600%, 7/2/2015a | | | 1,581,000 | |
| | | | Capital One Financial Corporation | | | | |
| | 3,000,000 | | | 1.490%, 7/15/2014b | | | 3,023,784 | |
| | | | CDP Financial, Inc. | | | | |
| | 4,000,000 | | | 3.000%, 11/25/2014a | | | 4,188,680 | |
| | | | Chesapeake Funding, LLC | | | | |
| | 2,000,000 | | | 0.661%, 5/7/2024a,b | | | 2,000,333 | |
| | | | Citigroup, Inc. | | | | |
| | 786,000 | | | 1.290%, 4/1/2014b | | | 787,961 | |
| | | | CNA Financial Corporation | | | | |
| | 2,000,000 | | | 6.500%, 8/15/2016 | | | 2,308,854 | |
| | | | Commonwealth Bank of Australia | | | | |
| | 3,300,000 | | | 2.500%, 12/10/2012a | | | 3,288,153 | |
The accompanying Notes to Financial Statements are an integral part of this schedule.
209
Limited Maturity Bond Fund
Schedule of Investments as of October 31, 2012
| | | | | | | | |
Principal
Amount | | | Long-Term Fixed Income (98.0%) | | Value | |
| Financials (23.9%) - continued | | | | |
| | | | Cooperatieve Centrale Raiffeisen-Boerenleenbank BA | | | | |
| | $2,000,000 | | | 3.200%, 3/11/2015a | | | $2,100,016 | |
| | | | Credit Agricole Home Loan SFH | | | | |
| | 4,000,000 | | | 1.069%, 7/21/2014a,b | | | 3,962,628 | |
| | | | Credit Suisse AG Guernsey | | | | |
| | 1,000,000 | | | 1.625%, 3/6/2015a | | | 1,016,128 | |
| | 1,000,000 | | | 2.600%, 5/27/2016a | | | 1,051,701 | |
| | | | Credit Suisse of New York, Convertible | | | | |
| | 1,050,000 | | | 0.500%, 6/22/2018h | | | 1,024,800 | |
| | | | Credit Suisse Securities USA, LLC | | | | |
| | 3,000,000 | | | 1.000%, 4/28/2017i | | | 3,115,200 | |
| | | | Dexia Credit Local SA | | | | |
| | 3,500,000 | | | 2.750%, 4/29/2014a | | | 3,536,697 | |
| | | | DnB NOR Boligkreditt | | | | |
| | 3,500,000 | | | 2.900%, 3/29/2016a | | | 3,729,950 | |
| | | | Eksportfinans ASA | | | | |
| | 1,500,000 | | | 2.375%, 5/25/2016 | | | 1,413,750 | |
| | | | Fifth Third Bank | | | | |
| | 2,250,000 | | | 0.545%, 5/17/2013b | | | 2,248,884 | |
| | | | General Electric Capital Corporation | | | | |
| | 3,500,000 | | | 0.551%, 1/8/2016b | | | 3,448,494 | |
| | | | Goldman Sachs Group, Inc., Convertible | | | | |
| | 53,035 | | | 1.000%, 7/10/2013a,j | | | 1,555,198 | |
| | | | HCP, Inc. | | | | |
| | 2,000,000 | | | 2.700%, 2/1/2014 | | | 2,038,378 | |
| | | | Health Care REIT, Inc. | | | | |
| | 500,000 | | | 6.125%, 4/15/2020 | | | 588,361 | |
| | | | HSBC Bank plc | | | | |
| | 4,000,000 | | | 1.625%, 7/7/2014a,g | | | 4,018,480 | |
| | | | ING Bank NV | | | | |
| | 3,500,000 | | | 2.500%, 1/14/2016a | | | 3,634,050 | |
| | | | ING Capital Funding Trust III | | | | |
| | 360,000 | | | 3.962%, 12/31/2049f | | | 337,953 | |
| | | | International Lease Finance Corporation | | | | |
| | 700,000 | | | 8.625%, 9/15/2015 | | | 788,200 | |
| | | | Irish Life & Permanent plc | | | | |
| | 3,500,000 | | | 3.600%, 1/14/2013a | | | 3,500,000 | |
| | | | J.P. Morgan Chase & Company | | | | |
| | 3,000,000 | | | 1.112%, 9/30/2013b | | | 3,018,894 | |
| | | | J.P. Morgan Chase Bank NA | | | | |
| | 1,000,000 | | | 5.875%, 6/13/2016 | | | 1,136,556 | |
| | | | Kommuninvest I Sverige AB | | | | |
| | 2,500,000 | | | 1.000%, 10/24/2017a | | | 2,501,208 | |
| | | | Landwirtschaftliche Rentenbank | | | | |
| | 5,000,000 | | | 0.589%, 3/15/2016a,b | | | 5,001,650 | |
| | | | Lloyds TSB Bank plc | | | | |
| | 300,000 | | | 6.500%, 9/14/2020a | | | 326,820 | |
| | | | Macquarie Bank, Ltd. | | | | |
| | 1,750,000 | | | 5.000%, 2/22/2017a | | | 1,900,727 | |
| | | | MassMutual Global Funding II | | | | |
| | 2,500,000 | | | 2.000%, 4/5/2017a | | | 2,553,753 | |
| | | | MetLife, Inc. | | | | |
| | 1,000,000 | | | 1.756%, 12/15/2017 | | | 1,016,288 | |
| | | | Metropolitan Life Global Funding I | | | | |
| | 1,320,000 | | | 5.125%, 4/10/2013a | | | 1,346,469 | |
| | 2,250,000 | | | 3.650%, 6/14/2018a | | | 2,469,184 | |
| | | | Morgan Stanley Mortgage Loan Trust | | | | |
| | 2,000,000 | | | 5.750%, 10/18/2016 | | | 2,226,818 | |
| | | | National Australia Bank, Ltd. | | | | |
| | 2,750,000 | | | 2.000%, 6/20/2017a | | | 2,842,950 | |
| | | | National Bank of Canada | | | | |
| | 2,000,000 | | | 1.650%, 1/30/2014a | | | 2,031,000 | |
| | 1,750,000 | | | 2.200%, 10/19/2016a | | | 1,845,725 | |
| | | | NCUA Guaranteed Notes | | | | |
| | 3,385,708 | | | 0.669%, 10/7/2020b | | | 3,397,214 | |
| | 3,506,040 | | | 0.559%, 12/7/2020b | | | 3,507,907 | |
| | | | Nederlandse Waterschapsbank NV | | | | |
| | 3,500,000 | | | 1.375%, 5/16/2014a | | | 3,543,470 | |
| | | | New York Life Global Funding | | | | |
| | 4,000,000 | | | 3.000%, 5/4/2015a | | | 4,222,244 | |
| | | | Norddeutsche Landesbank Girozentrale | | | | |
| | 3,000,000 | | | 0.875%, 10/16/2015a,g | | | 3,000,900 | |
| | | | Nordea Bank AB | | | | |
| | 2,000,000 | | | 3.125%, 3/20/2017a | | | 2,106,800 | |
| | | | Private Export Funding Corporation | | | | |
| | 3,000,000 | | | 2.125%, 7/15/2016 | | | 3,164,574 | |
| | | | Prudential Financial, Inc. | | | | |
| | 2,000,000 | | | 5.100%, 9/20/2014 | | | 2,154,446 | |
| | 1,000,000 | | | 6.100%, 6/15/2017 | | | 1,186,751 | |
| | | | Rabobank Capital Funding Trust II | | | | |
| | 1,012,000 | | | 5.260%, 12/29/2049a,f | | | 1,012,000 | |
| | | | Realty Income Corporation | | | | |
| | 1,000,000 | | | 2.000%, 1/31/2018 | | | 1,008,529 | |
| | | | Royal Bank of Canada | | | | |
| | 3,000,000 | | | 1.013%, 10/30/2014b | | | 3,029,622 | |
| | 3,000,000 | | | 1.200%, 9/19/2017 | | | 3,014,700 | |
| | | | SLM Corporation | | | | |
| | 1,000,000 | | | 8.000%, 3/25/2020 | | | 1,158,120 | |
| | | | Stadshypotek AB | | | | |
| | 4,000,000 | | | 0.912%, 9/30/2013a,b | | | 4,007,780 | |
| | 2,000,000 | | | 1.875%, 10/2/2019a | | | 2,001,200 | |
| | | | Swedbank Hypotek AB | | | | |
| | 5,000,000 | | | 0.812%, 3/28/2014a,b | | | 4,998,410 | |
| | | | Toronto-Dominion Bank | | | | |
| | 3,000,000 | | | 0.494%, 7/26/2013b | | | 3,005,007 | |
| | 2,500,000 | | | 2.200%, 7/29/2015a | | | 2,610,750 | |
| | | | U.S. Bank National Association | | | | |
| | 3,000,000 | | | 3.778%, 4/29/2020 | | | 3,175,911 | |
| | | | UBS AG/London | | | | |
| | 4,500,000 | | | 1.875%, 1/23/2015a | | | 4,583,592 | |
| | | | UnitedHealth Group, Inc. | | | | |
| | 1,800,000 | | | 1.400%, 10/15/2017 | | | 1,811,610 | |
| | | | Vestjysk Bank AS | | | | |
| | 3,500,000 | | | 0.939%, 6/17/2013a,b | | | 3,507,819 | |
| | | | WEA Finance, LLC/WT Finance Australia, Pty, Ltd. | | | | |
| | 1,650,000 | | | 5.750%, 9/2/2015a | | | 1,838,352 | |
| | | | Wells Fargo & Company | | | | |
| | 2,500,000 | | | 2.625%, 12/15/2016 | | | 2,640,923 | |
| | | | | |
| | | | Total | | | 210,863,187 | |
| | | | | |
The accompanying Notes to Financial Statements are an integral part of this schedule.
210
Limited Maturity Bond Fund
Schedule of Investments as of October 31, 2012
| | | | | | | | |
Principal
Amount | | | Long-Term Fixed Income (98.0%) | | Value | |
| Foreign Government (3.8%) | | | | |
| | | | Canada Government International Bond | | | | |
| | $5,500,000 | | | 0.875%, 2/14/2017 | | | $5,543,450 | |
| | | | Corporacion Andina de Fomento | | | | |
| | 1,419,000 | | | 4.375%, 6/15/2022 | | | 1,542,988 | |
| | | | European Investment Bank | | | | |
| | 4,000,000 | | | 1.750%, 3/15/2017 | | | 4,146,680 | |
| | | | Hydro Quebec | | | | |
| | 2,000,000 | | | 2.000%, 6/30/2016 | | | 2,089,800 | |
| | | | Kommunalbanken AS | | | | |
| | 4,000,000 | | | 2.750%, 5/5/2015a | | | 4,214,800 | |
| | | | Kreditanstalt fuer Wiederaufbau | | | | |
| | 5,500,000 | | | 0.224%, 6/17/2013b | | | 5,500,297 | |
| | | | Mexico Government International Bond | | | | |
| | 750,000 | | | 5.125%, 1/15/2020 | | | 896,250 | |
| | | | Province of British Columbia | | | | |
| | 3,500,000 | | | 2.100%, 5/18/2016 | | | 3,679,200 | |
| | | | Province of Manitoba | | | | |
| | 3,000,000 | | | 1.300%, 4/3/2017 | | | 3,069,300 | |
| | | | Province of Ontario | | | | |
| | 2,500,000 | | | 1.100%, 10/25/2017 | | | 2,504,000 | |
| | | | | |
| | | | Total | | | 33,186,765 | |
| | | | | |
| |
| Mortgage-Backed Securities (5.2%) | | | | |
| | | | Federal Home Loan Mortgage Corporation Gold 15-Yr. Pass Through | | | | |
| | 14,500,000 | | | 2.500%, 11/1/2027k | | | 15,143,438 | |
| | | | Federal Home Loan Mortgage Corporation Gold 30-Yr. Pass Through | | | | |
| | 1,153,209 | | | 6.500%, 9/1/2037 | | | 1,311,599 | |
| | | | Federal National Mortgage Association Conventional 15- Yr. Pass Through | | | | |
| | 17,900,000 | | | 2.500%, 11/1/2027k | | | 18,733,469 | |
| | | | Federal National Mortgage Association Conventional 20- Yr. Pass Through | | | | |
| | 1,358,472 | | | 6.000%, 8/1/2024 | | | 1,532,663 | |
| | | | Federal National Mortgage Association Conventional 30- Yr. Pass Through | | | | |
| | 1,940,920 | | | 5.846%, 9/1/2037b | | | 2,110,976 | |
| | 921,969 | | | 5.611%, 10/1/2037b | | | 999,171 | |
| | 1,340,000 | | | 5.000%, 11/1/2042k | | | 1,461,856 | |
| | 4,000,000 | | | 5.000%, 12/1/2042k | | | 4,363,750 | |
| | | | | |
| | | | Total | | | 45,656,922 | |
| | | | | |
| |
| Technology (0.6%) | | | | |
| | | | Affiliated Computer Services, Inc. | | | | |
| | 1,000,000 | | | 5.200%, 6/1/2015 | | | 1,079,041 | |
| | | | Oracle Corporation | | | | |
| | 325,000 | | | 1.200%, 10/15/2017 | | | 326,638 | |
| | | | Texas Instruments, Inc. | | | | |
| | 2,000,000 | | | 0.615%, 5/15/2013b | | | 2,003,530 | |
| | | | Xerox Corporation | | | | |
| | 2,000,000 | | | 1.257%, 5/16/2014b | | | 1,997,538 | |
| | | | | |
| | | | Total | | | 5,406,747 | |
| | | | | |
| | | | | | | | |
| |
| Transportation (1.2%) | | | | |
| | | | Continental Airlines, Inc. | | | | |
| | 1,350,000 | | | 6.750%, 9/15/2015a | | | 1,412,438 | |
| | 2,000,000 | | | 4.150%, 4/11/2024 | | | 2,094,000 | |
| | | | CSX Corporation | | | | |
| | 1,500,000 | | | 6.250%, 4/1/2015 | | | 1,697,071 | |
| | | | Delta Air Lines, Inc. | | | | |
| | 750,000 | | | 4.750%, 5/7/2020 | | | 792,225 | |
| | | | Erac USA Finance Company | | | | |
| | 2,500,000 | | | 2.750%, 7/1/2013a | | | 2,535,303 | |
| | | | Kansas City Southern de Mexico SA de CV | | | | |
| | 1,500,000 | | | 8.000%, 2/1/2014 | | | 1,665,000 | |
| | | | | |
| | | | Total | | | 10,196,037 | |
| | | | | |
| |
| U.S. Government and Agencies (32.3%) | | | | |
| | | | FDIC Structured Sale Guaranteed Notes | | | | |
| | 6,000,000 | | | Zero Coupon, 1/7/2013a | | | 5,999,580 | |
| | | | Federal Agricultural Mortgage Corporation | | | | |
| | 4,000,000 | | | 1.250%, 12/6/2013 | | | 4,040,460 | |
| | 2,500,000 | | | 2.125%, 9/15/2015 | | | 2,600,595 | |
| | 2,500,000 | | | 2.000%, 7/27/2016 | | | 2,617,670 | |
| | | | Federal Farm Credit Banks | | | | |
| | 5,000,000 | | | 1.375%, 6/25/2013 | | | 5,040,430 | |
| | 10,000,000 | | | 0.318%, 9/23/2013b | | | 10,004,350 | |
| | | | Federal Home Loan Banks | | | | |
| | 5,000,000 | | | 0.410%, 9/16/2013b | | | 5,008,195 | |
| | 3,000,000 | | | 0.375%, 1/29/2014 | | | 3,004,308 | |
| | 14,500,000 | | | 1.375%, 5/28/2014 | | | 14,761,841 | |
| | 1,500,000 | | | 0.500%, 11/20/2015 | | | 1,502,199 | |
| | | | Federal Home Loan Mortgage Corporation | | | | |
| | 1,000,000 | | | 1.250%, 8/1/2019 | | | 999,689 | |
| | 3,250,000 | | | 1.250%, 10/2/2019 | | | 3,240,965 | |
| | | | Federal National Mortgage Association | | | | |
| | 4,000,000 | | | 0.500%, 5/27/2015 | | | 4,010,412 | |
| | | | U.S. Treasury Bonds | | | | |
| | 2,915,000 | | | 3.000%, 5/15/2042 | | | 3,011,105 | |
| | | | U.S. Treasury Bonds, TIPS | | | | |
| | 3,000,000 | | | 0.750%, 2/15/2042 | | | 3,405,254 | |
| | | | U.S. Treasury Notes | | | | |
| | 4,000,000 | | | 0.250%, 11/30/2013 | | | 4,000,936 | |
| | 8,350,000 | | | 1.500%, 12/31/2013 | | | 8,472,970 | |
| | 2,500,000 | | | 0.250%, 4/30/2014 | | | 2,499,707 | |
| | 6,200,000 | | | 2.250%, 5/31/2014 | | | 6,393,992 | |
| | 33,425,000 | | | 0.750%, 6/15/2014 | | | 33,684,813 | |
| | 16,475,000 | | | 0.250%, 9/15/2015 | | | 16,417,074 | |
| | 33,550,000 | | | 1.000%, 10/31/2016 | | | 34,147,593 | |
| | 60,025,000 | | | 0.750%, 6/30/2017 | | | 60,259,458 | |
| | 400,000 | | | 2.375%, 6/30/2018 | | | 433,531 | |
| | 16,365,000 | | | 0.875%, 7/31/2019 | | | 16,139,981 | |
| | 2,850,000 | | | 1.625%, 8/15/2022 | | | 2,834,413 | |
| | | | U.S. Treasury Notes, TIPS | | | | |
| | 9,200,000 | | | 0.125%, 4/15/2017 | | | 10,006,322 | |
| | 10,500,000 | | | 1.125%, 1/15/2021 | | | 13,074,677 | |
| | 6,500,000 | | | 0.125%, 1/15/2022 | | | 7,235,140 | |
| | | | | |
| | | | Total | | | 284,847,660 | |
| | | | | |
| |
| Utilities (0.5%) | | | | |
| | | | Northeast Utilities | | | | |
| | 2,000,000 | | | 1.129%, 9/20/2013b | | | 2,010,720 | |
The accompanying Notes to Financial Statements are an integral part of this schedule.
211
Limited Maturity Bond Fund
Schedule of Investments as of October 31, 2012
| | | | | | | | |
Principal
Amount | | | Long-Term Fixed Income (98.0%) | | Value | |
| Utilities (0.5%) - continued | | | | |
| | | | ONEOK Partners, LP | | | | |
| | $350,000 | | | 8.625%, 3/1/2019 | | | $465,298 | |
| | | | Sempra Energy | | | | |
| | 1,750,000 | | | 2.300%, 4/1/2017 | | | 1,827,366 | |
| | | | Williams Partners, LP | | | | |
| | 500,000 | | | 3.350%, 8/15/2022 | | | 518,330 | |
| | | | | |
| | | | Total | | | 4,821,714 | |
| | | | | |
| | | | | | | | |
| | | | | |
| | | | Total Long-Term Fixed Income (cost $854,557,092) | | | 863,184,366 | |
| | | | | |
| |
| Fixed Income Mutual Funds (1.3%) | | | | |
| | 2,247,228 | | | Thrivent High Yield Fund | | | 11,258,614 | |
| | | | | |
| | | | Total | | | 11,258,614 | |
| | | | | |
| | | | | | | | |
| | | | | |
| | | | Total Other Mutual Funds (cost $8,300,000) | | | 11,258,614 | |
| | | | | |
| | |
| Shares | | | Preferred Stock (0.4%) | | Value | |
| Financials (0.2%) | | | | |
| | 26,000 | | | Discover Financial Services, 6.500%f | | | 661,700 | |
| | 39,000 | | | HSBC Holdings plc, 8.000%f | | | 1,100,580 | |
| | | | | |
| | | | Total | | | 1,762,280 | |
| | | | | |
| |
| Utilities (0.2%) | | | | |
| | 16,250 | | | Southern California Edison Company, 4.320%f | | | 1,630,587 | |
| | | | | |
| | | | Total | | | 1,630,587 | |
| | | | | |
| | | | | | | | |
| | | | | |
| | | | Total Preferred Stock (cost $3,236,772) | | | 3,392,867 | |
| | | | | |
| | |
| Shares | | | Collateral Held for Securities Loaned (0.8%) | | Value | |
| | 6,949,000 | | | Thrivent Financial Securities Lending Trust | | | 6,949,000 | |
| | | | | |
| | | | | | | | |
| | | | | |
| | | | Total Collateral Held for Securities Loaned (cost $6,949,000) | | | 6,949,000 | |
| | | | | |
| | |
Shares or
Principal
Amount | | | Short-Term Investments (4.3%) | | Value | |
| | | | Federal Home Loan Bank Discount Notes | | | | |
| | 10,000,000 | | | 0.080%, 11/1/2012l | | | 10,000,000 | |
| | | | Federal Home Loan Mortgage Corporation Discount Notes | | | | |
| | 1,100,000 | | | 0.160%, 12/17/2012l,m | | | 1,099,775 | |
| | 26,939,653 | | | Thrivent Financial Securities Lending Trust | | | 26,939,653 | |
| | | | | |
| | | | Total Short-Term Investments (at amortized cost) | | | 38,039,428 | |
| | | | | |
| | | | Total Investments (cost $911,082,292) 104.8% | | $ | 922,824,275 | |
| | | | | |
| | | | Other Assets and Liabilities, Net (4.8%) | | | (41,953,581 | ) |
| | | | | |
| | | | Total Net Assets 100.0% | | $ | 880,870,694 | |
| | | | | |
a | Denotes securities sold under Rule 144A of the Securities Act of 1933, which exempts them from registration. These securities have been deemed liquid and may be resold to other dealers in the program or to other qualified institutional buyers. As of October 31, 2012, the value of these investments was $222,375,183 or 25.2% of total net assets. |
b | Denotes variable rate securities. Variable rate securities are securities whose yields vary with a designated market index or market rate. The rate shown is as of October 31, 2012. |
c | All or a portion of the security is insured or guaranteed. |
d | Denotes restricted securities. Restricted securities are investment securities which have been deemed illiquid and cannot be offered for public sale without first being registered under the Securities Act of 1933. The following table indicates the acquisition date and cost of restricted securities Limited Maturity Bond Fund owned as of October 31, 2012. |
| | | | | | | | |
Security | | Acquisition
Date | | | Cost | |
First Franklin Mortgage Loan Asset-Backed Certificates | | | 4/19/2006 | | | | $85,895 | |
Mortgage Equity Conversion Asset Trust | | | 2/14/2007 | | | | $2,453,730 | |
Mortgage Equity Conversion Asset Trust | | | 1/18/2007 | | | | $2,511,771 | |
Wachovia Asset Securitization, Inc. | | | 3/16/2007 | | | | $814,429 | |
e | Defaulted security. Interest is not being accrued. |
f | Denotes perpetual securities. Perpetual securities pay an indefinite stream of interest, but may be called by the issuer at an earlier date. |
g | All or a portion of the security is on loan. |
h | Denotes equity-linked structured security. This security is linked to the common stock of Berkshire Hathaway, Inc. |
i | Denotes equity-linked structured security. This security is linked to the S&P 500 Index. |
j | Security is displayed in shares. This security is an equity-linked structured security. This security is linked to the common stock of Microsoft Corporation. |
k | Denotes investments purchased on a when-issued or delayed delivery basis. |
l | The interest rate shown reflects the yield, coupon rate or the discount rate at the date of purchase. |
m | At October 31, 2012, $1,099,775 of investments were held on deposit with the counterparty and pledged as the initial margin deposit for open futures contracts. |
Definitions:
| | | | |
| | REIT | | - Real Estate Investment Trust is a company that buys, develops, manages and/or sells real estate assets. |
| | | | |
| | TIPS | | - Treasury Inflation Protected Security. |
Unrealized Appreciation (Depreciation)
Gross unrealized appreciation and depreciation of investments, based on cost for federal income tax purposes, were as follows:
| | | | |
Gross unrealized appreciation | | | $21,955,336 | |
Gross unrealized depreciation | | | (10,345,524 | ) |
| | | | |
Net unrealized appreciation (depreciation) | | | $11,609,812 | |
| |
Cost for federal income tax purposes | | $ | 911,214,463 | |
The accompanying Notes to Financial Statements are an integral part of this schedule.
212
Limited Maturity Bond Fund
Schedule of Investments as of October 31, 2012
Fair Valuation Measurements
The following table is a summary of the inputs used, as of October 31, 2012, in valuing Limited Maturity Bond Fund’s assets carried at fair value.
| | | | | | | | | | | | | | | | |
Investments in Securities | | Total | | | Level 1 | | | Level 2 | | | Level 3 | |
| | | | |
Long-Term Fixed Income | | | | | | | | | | | | | | | | |
Asset-Backed Securities | | | 95,557,058 | | | | – | | | | 91,584,657 | | | | 3,972,401 | |
Basic Materials | | | 9,305,895 | | | | – | | | | 9,305,895 | | | | – | |
Capital Goods | | | 7,466,855 | | | | – | | | | 7,466,855 | | | | – | |
Collateralized Mortgage Obligations | | | 29,836,531 | | | | – | | | | 29,836,531 | | | | – | |
Commercial Mortgage-Backed Securities | | | 61,817,426 | | | | – | | | | 61,817,426 | | | | – | |
Communications Services | | | 11,411,626 | | | | – | | | | 11,411,626 | | | | – | |
Consumer Cyclical | | | 12,330,137 | | | | – | | | | 12,330,137 | | | | – | |
Consumer Non-Cyclical | | | 24,723,499 | | | | – | | | | 24,723,499 | | | | – | |
Energy | | | 15,756,307 | | | | – | | | | 15,756,307 | | | | – | |
Financials | | | 210,863,187 | | | | – | | | | 205,167,989 | | | | 5,695,198 | |
Foreign Government | | | 33,186,765 | | | | – | | | | 33,186,765 | | | | – | |
Mortgage-Backed Securities | | | 45,656,922 | | | | – | | | | 45,656,922 | | | | – | |
Technology | | | 5,406,747 | | | | – | | | | 5,406,747 | | | | – | |
Transportation | | | 10,196,037 | | | | – | | | | 10,196,037 | | | | – | |
U.S. Government and Agencies | | | 284,847,660 | | | | – | | | | 284,847,660 | | | | – | |
Utilities | | | 4,821,714 | | | | – | | | | 4,821,714 | | | | – | |
Fixed Income Mutual Funds | | | 11,258,614 | | | | 11,258,614 | | | | – | | | | – | |
Preferred Stock | | | | | | | | | | | | | | | | |
Financials | | | 1,762,280 | | | | 1,762,280 | | | | – | | | | – | |
Utilities | | | 1,630,587 | | | | – | | | | 1,630,587 | | | | – | |
Collateral Held for Securities Loaned | | | 6,949,000 | | | | 6,949,000 | | | | – | | | | – | |
Short-Term Investments | | | 38,039,428 | | | | 26,939,653 | | | | 11,099,775 | | | | – | |
| |
Total | | $ | 922,824,275 | | | $ | 46,909,547 | | | $ | 866,247,129 | | | $ | 9,667,599 | |
| |
| | | | |
Other Financial Instruments | | Total | | | Level 1 | | | Level 2 | | | Level 3 | |
Asset Derivatives | | | | | | | | | | | | | | | | |
Futures Contracts | | | 16,695 | | | | 16,695 | | | | – | | | | – | |
| |
Total Asset Derivatives | | | $16,695 | | | | $16,695 | | | | $– | | | | $– | |
| |
| | | | |
Liability Derivatives | | | | | | | | | | | | | | | | |
Futures Contracts | | | 239,795 | | | | 239,795 | | | | – | | | | – | |
Credit Default Swaps | | | 334,360 | | | | – | | | | 334,360 | | | | – | |
| |
Total Liability Derivatives | | | $574,155 | | | | $239,795 | | | | $334,360 | | | | $– | |
| |
There were no significant transfers between Levels during the period ended October 31, 2012. Transfers between Levels are identified as of the end of the period.
| | | | | | | | | | | | | | | | | | | | |
Futures Contracts | | Number of
Contracts
Long/(Short) | | | Expiration
Date | | | Notional
Principal
Amount | | | Value | | | Unrealized
Gain/(Loss) | |
2-Yr. U.S. Treasury Bond Futures | | | (85 | ) | | | December 2012 | | | | ($18,735,601 | ) | | | ($18,727,891 | ) | | | $7,710 | |
5-Yr. U.S. Treasury Bond Futures | | | (1,100 | ) | | | December 2012 | | | | (136,439,611 | ) | | | (136,675,000 | ) | | | (235,389 | ) |
10-Yr. U.S. Treasury Bond Futures | | | (205 | ) | | | December 2012 | | | | (27,280,391 | ) | | | (27,271,406 | ) | | | 8,985 | |
20-Yr U.S. Treasury Bond Futures | | | 10 | | | | December 2012 | | | | 1,497,531 | | | | 1,493,125 | | | | (4,406 | ) |
Total Futures Contracts | | | | | | | | | | | | | | | | | | | ($223,100 | ) |
The accompanying Notes to Financial Statements are an integral part of this schedule.
213
Limited Maturity Bond Fund
Schedule of Investments as of October 31, 2012
| | | | | | | | | | | | | | | | | | | | | | |
Credit Default Swaps and Counterparty | | Buy/Sell
Protection1 | | Termination
Date | | | Notional
Principal
Amount2 | | | Upfront
Payments
Received (Made) | | | Value3 | | | Unrealized
Gain/(Loss) | |
CDX HY, Series 18, 5 Year, at 5.00%; Bank of America | | Buy | | | 6/20/2017 | | | | $6,435,000 | | | | ($318,025 | ) | | | ($14,911 | ) | | | ($332,936 | ) |
CDX IG, Series 18, 5 Year, at 1.00%; J.P. Morgan Chase and Co. | | Buy | | | 6/20/2017 | | | | 13,000,000 | | | | 62,857 | | | | (64,281 | ) | | | (1,424 | ) |
Total Credit Default Swaps | | | | | | | | | | | | | | | | | ($79,192 | ) | | | ($334,360 | ) |
1 | As the buyer of protection, Limited Maturity Bond Fund pays periodic fees in return for payment by the seller which is contingent upon an adverse credit event occurring in the underlying issuer or reference entity. As the seller of protection, Limited Maturity Bond Fund collects periodic fees from the buyer and profits if the credit of the underlying issuer or reference entity remains stable or improves while the swap is outstanding, but the seller in a credit default swap contract would be required to pay the amount of credit loss, determined as specified in the agreement, to the buyer in the event of an adverse credit event in the reference entity. |
2 | The maximum potential amount of future payments Limited Maturity Bond Fund could be required to make as the seller or receive as the buyer of protection. |
3 | The values for credit indexes (CDX or LCDX) serve as an indicator of the current status of the payment/performance risk and represent the liability or profit for the credit default swap contract had the contract been closed as of the reporting date. When protection has been sold, the value of the swap will increase when the swap spread declines representing an improvement in the reference entity’s credit worthiness. The value of the swap will decrease when the swap spread increases representing a deterioration in the reference entity’s credit worthiness. When protection has been purchased, the value of the swap will increase when the swap spread increases representing a deterioration in the reference entity’s credit worthiness. The value of the swap will decrease when the swap spread declines representing an improvement in the reference entity’s credit worthiness. |
The following table summarizes the fair value and Statement of Assets and Liabilities location, as of October 31, 2012, for Limited Maturity Bond Fund’s investments in financial derivative instruments by primary risk exposure as discussed under item (2) Significant Accounting Policies of the Notes to Financial Statements.
| | | | | | |
Derivatives by risk category | | Statement of Assets and Liabilities Location | | Fair Value | |
Asset Derivatives | | | | | | |
| | |
Interest Rate Contracts | | | | | | |
Futures* | | Net Assets - Net unrealized appreciation/(depreciation) on Futures contracts | | | 16,695 | |
Total Interest Rate Contracts | | | | | 16,695 | |
| |
Total Asset Derivatives | | | | | $16,695 | |
| |
| | |
Liability Derivatives | | | | | | |
| | |
Interest Rate Contracts | | | | | | |
Futures* | | Net Assets - Net unrealized appreciation/(depreciation) on Futures contracts | | | 239,795 | |
Total Interest Rate Contracts | | | | | 239,795 | |
| | |
Credit Contracts | | | | | | |
Credit Default Swaps | | Receivable/Payable - Swap agreements, at value; Net Assets - Net unrealized appreciation/(depreciation) on Swap agreements | | | 334,360 | |
Total Credit Contracts | | | | | 334,360 | |
| |
Total Liability Derivatives | | | | | $574,155 | |
| |
* | Includes cumulative appreciation/depreciation of futures contracts as reported in the Schedule of Investments. Only current day’s variation margin is reported within the Statement of Assets and Liabilities. |
The accompanying Notes to Financial Statements are an integral part of this schedule.
214
Limited Maturity Bond Fund
Schedule of Investments as of October 31, 2012
The following table summarizes the net realized gains/(losses) and Statement of Operations location, for the period ended October 31, 2012, for Limited Maturity Bond Fund’s investments in financial derivative instruments by primary risk exposure.
| | | | | | |
Derivatives by risk category | | Statement of Operations Location | | Realized Gains/(Losses)
recognized in Income | |
| | |
Interest Rate Contracts | | | | | | |
Options Written | | Net realized gains/(losses) on Written option contracts | | | 15,025 | |
Futures | | Net realized gains/(losses) on Futures contracts | | | (4,223,968 | ) |
Total Interest Rate Contracts | | | | | (4,208,943 | ) |
| | |
Equity Contracts | | | | | | |
Options Purchased | | Net realized gains/(losses) on Investments | | | (65,925 | ) |
Total Equity Contracts | | | | | (65,925 | ) |
| | |
Credit Contracts | | | | | | |
Credit Default Swaps | | Net realized gains/(losses) on Swap agreements | | | 116,308 | |
Total Credit Contracts | | | | | 116,308 | |
| |
Total | | | | | ($4,158,560 | ) |
| |
The following table summarizes the change in net unrealized appreciation/(depreciation) and Statement of Operations location, for the period ended October 31, 2012, for Limited Maturity Bond Fund’s investments in financial derivative instruments by primary risk exposure.
| | | | | | |
Derivatives by risk category | | Statement of Operations Location | | Change in unrealized
appreciation/(depreciation)
recognized in Income | |
| | |
Interest Rate Contracts | | | | | | |
Futures | | Change in net unrealized appreciation/(depreciation) on Futures contracts | | | (243,900 | ) |
Total Interest Rate Contracts | | | | | (243,900 | ) |
| | |
Credit Contracts | | | | | | |
Credit Default Swaps | | Change in net unrealized appreciation/(depreciation) on Swap agreements | | | (1,076,968 | ) |
Total Credit Contracts | | | | | (1,076,968 | ) |
| |
Total | | | | | ($1,320,868 | ) |
| |
The following table presents Limited Maturity Bond Fund’s average volume of derivative activity during the period ended October 31, 2012.
| | | | | | | | | | | | | | | | | | | | |
Derivative Risk Category | | Futures
(Notional*) | | | Futures
(Percentage of
Average Net Assets) | | | Swaps
(Notional*) | | | Swaps
(Percentage of
Average Net Assets) | | | Options
(Contracts) | |
Equity Contracts | | | N/A | | | | N/A | % | | | N/A | | | | N/A | | | | 13 | |
Interest Rate Contracts | | $ | 183,310,166 | | | | 20.3 | | | | N/A | | | | N/A | | | | 3 | |
Credit Contracts | | | N/A | | | | N/A | | | $ | 12,622,854 | | | | 1.4 | % | | | N/A | |
* | Notional amount represents long or short, or both, derivative positions held by the Fund. |
Investment in Affiliates
Affiliated issuers, as defined under the Investment Company Act of 1940, include those in which the Fund’s holdings of an issuer represent 5% or more of the outstanding voting securities of an issuer, or any affiliated mutual fund.
A summary of transactions for the fiscal year to date, in Limited Maturity Bond Fund, is as follows:
| | | | | | | | | | | | | | | | | | | | | | | | |
Fund | | Value
October 31, 2011 | | | Gross
Purchases | | | Gross Sales | | | Shares Held at
October 31, 2012 | | | Value
October 31,
2012 | | | Income Earned
November 1, 2011 -
October 31, 2012 | |
High Yield | | | $10,606,918 | | | | $– | | | | $– | | | | 2,247,228 | | | | $11,258,614 | | | | $788,044 | |
Securities Lending Trust-Collateral Investment | | | 25,117,922 | | | | 220,432,950 | | | | 238,601,872 | | | | 6,949,000 | | | | 6,949,000 | | | | 48,455 | |
Securities Lending Trust-Short Term Investment | | | – | | | | 51,243,153 | | | | 24,303,500 | | | | 26,939,653 | | | | 26,939,653 | | | | 5,904 | |
Total Value and Income Earned | | | 35,724,840 | | | | | | | | | | | | | | | | 45,147,267 | | | | 842,403 | |
The accompanying Notes to Financial Statements are an integral part of this schedule.
215
Money Market Fund
Schedule of Investments as of October 31, 2012
| | | | | | | | |
Principal
Amount | | | Asset Backed Commercial Paper (26.0%)a | | Value | |
| | | | Barton Capital Corporation | | | | |
| $ | 20,000,000 | | | 0.240%, 11/1/2012b,c | | | $20,000,000 | |
| | | | Dealers Capital Access | | | | |
| | 5,060,000 | | | 0.360%, 11/1/2012 | | | 5,060,000 | |
| | 5,110,000 | | | 0.390%, 11/15/2012 | | | 5,109,225 | |
| | 5,070,000 | | | 0.390%, 11/19/2012 | | | 5,069,011 | |
| | 5,110,000 | | | 0.480%, 1/14/2013 | | | 5,104,958 | |
| | | | Fairway Finance Corporation | | | | |
| | 3,530,000 | | | 0.200%, 11/23/2012b,c | | | 3,529,569 | |
| | | | Golden Funding Corporation | | | | |
| | 5,280,000 | | | 0.400%, 11/15/2012b,c | | | 5,279,179 | |
| | | | Kells Funding, LLC | | | | |
| | 5,100,000 | | | 0.250%, 11/5/2012b,c | | | 5,099,858 | |
| | 5,080,000 | | | 0.230%, 11/20/2012b,c | | | 5,079,384 | |
| | 5,140,000 | | | 0.300%, 2/19/2013b,c | | | 5,135,288 | |
| | | | Liberty Street Funding, LLC | | | | |
| | 5,200,000 | | | 0.200%, 12/19/2012b,c | | | 5,198,613 | |
| | | | Nieuw Amsterdam Receivables Corporation | | | | |
| | 15,500,000 | | | 0.150%, 11/1/2012b,c | | | 15,500,000 | |
| | 5,190,000 | | | 0.210%, 11/14/2012b,c | | | 5,189,606 | |
| | | | Old Line Funding, LLC | | | | |
| | 5,150,000 | | | 0.180%, 11/19/2012b,c | | | 5,149,537 | |
| | 5,290,000 | | | 0.240%, 11/20/2012b,c | | | 5,289,330 | |
| | 5,120,000 | | | 0.220%, 2/15/2013b,c | | | 5,116,683 | |
| | 5,205,000 | | | 0.320%, 3/15/2013b,c | | | 5,198,800 | |
| | | | Sydney Capital Corporation | | | | |
| | 5,260,000 | | | 0.270%, 11/14/2012b,c | | | 5,259,487 | |
| | 5,200,000 | | | 0.300%, 12/14/2012b,c | | | 5,198,137 | |
| | 5,120,000 | | | 0.300%, 1/8/2013b,c | | | 5,117,099 | |
| | | | Thunder Bay Funding, LLC | | | | |
| | 5,280,000 | | | 0.230%, 12/10/2012b,c | | | 5,278,684 | |
| | | | | |
| | | | Total | | | 131,962,448 | |
| | | | | |
| | |
Principal
Amount | | | Certificate of Deposit (4.3%)a | | Value | |
| | | | Bank of Nova Scotia/Houston | | | | |
| | 3,175,000 | | | 0.518%, 5/10/2013d | | | 3,175,000 | |
| | | | Rabobank Nederland | | | | |
| | 5,180,000 | | | 0.470%, 2/19/2013 | | | 5,181,420 | |
| | | | Toronto-Dominion Bank NY | | | | |
| | 2,630,000 | | | 0.302%, 4/19/2013d | | | 2,630,000 | |
| | 5,190,000 | | | 0.399%, 9/13/2013d | | | 5,190,000 | |
| | 5,220,000 | | | 0.321%, 10/21/2013d | | | 5,220,000 | |
| | | | | |
| | | | Total | | | 21,396,420 | |
| | | | | |
| | |
Principal
Amount | | | Financial Company Commercial Paper (10.8%)a | | Value | |
| | | | AllianceBernstein, LP | | | | |
| | 20,000,000 | | | 0.400%, 11/1/2012c | | | 20,000,000 | |
| | | | River Fuel Company No. 2, Inc. | | | | |
| | 5,080,000 | | | 0.220%, 1/15/2013 | | | 5,077,672 | |
| | | | Skandinav Enskilda Bank | | | | |
| | 5,200,000 | | | 0.230%, 11/13/2012c | | | 5,199,601 | |
| | | | Societe Generale North America, Inc. | | | | |
| | 14,175,000 | | | 0.180%, 11/1/2012 | | | 14,175,000 | |
| | | | Svenska Handelsbanken, Inc. | | | | |
| | 5,070,000 | | | 0.260%, 2/15/2013c | | | 5,066,119 | |
| | | | Westpac Banking Corporation | | | | |
| | 5,180,000 | | | 0.584%, 12/14/2012c,d | | | 5,182,500 | |
| | | | | |
| | | | Total | | | 54,700,892 | |
| | | | | |
| | |
Principal
Amount | | | Government Agency Debt (34.6%)a | | Value | |
| | | | Federal Agricultural Mortgage Corporation | | | | |
| | 5,210,000 | | | 0.202%, 2/1/2013d | | | 5,209,106 | |
| | | | Federal Farm Credit Bank | | | | |
| | 5,640,000 | | | 0.231%, 8/22/2013d | | | 5,643,719 | |
| | 5,480,000 | | | 0.247%, 8/27/2013d | | | 5,480,000 | |
| | 4,000,000 | | | 0.184%, 1/13/2014d | | | 4,000,517 | |
| | 5,790,000 | | | 0.231%, 2/24/2014d | | | 5,795,842 | |
| | | | Federal Home Loan Banks | | | | |
| | 6,150,000 | | | 0.330%, 1/25/2013d | | | 6,150,071 | |
| | 5,340,000 | | | 0.270%, 12/20/2013d | | | 5,338,158 | |
| | 5,260,000 | | | 0.260%, 2/24/2014d | | | 5,260,000 | |
| | 5,120,000 | | | 0.320%, 6/4/2014d | | | 5,125,769 | |
| | | | Federal Home Loan Mortgage Corporation | | | | |
| | 3,090,000 | | | 0.410%, 9/3/2013d | | | 3,089,435 | |
| | 5,480,000 | | | 0.154%, 9/13/2013d | | | 5,479,801 | |
| | 10,900,000 | | | 0.185%, 11/4/2013d | | | 10,901,793 | |
| | 1,800,000 | | | 0.480%, 11/18/2013d | | | 1,803,429 | |
| | | | Federal National Mortgage Association | | | | |
| | 3,700,000 | | | 0.380%, 11/23/2012d | | | 3,699,956 | |
| | 5,340,000 | | | 0.241%, 12/20/2012d | | | 5,340,887 | |
| | 3,000,000 | | | 0.410%, 10/28/2013d | | | 2,999,696 | |
| | 5,330,000 | | | 0.191%, 6/20/2014d | | | 5,328,238 | |
| | 5,330,000 | | | 0.440%, 8/25/2014d | | | 5,343,708 | |
| | | | Overseas Private Investment Corporation | | | | |
| | 18,725,000 | | | 0.489%, 12/9/2012 | | | 18,809,006 | |
| | 12,780,000 | | | 0.500%, 12/9/2012 | | | 12,837,335 | |
| | 7,295,000 | | | 0.500%, 12/9/2012 | | | 7,327,727 | |
| | 3,870,000 | | | 0.500%, 12/9/2012 | | | 3,887,345 | |
| | 3,330,000 | | | 0.352%, 7/12/2013 | | | 3,383,424 | |
| | | | Straight-A Funding, LLC | | | | |
| | 5,295,000 | | | 0.180%, 11/2/2012b,c | | | 5,294,974 | |
| | 5,295,000 | | | 0.180%, 11/7/2012b,c | | | 5,294,841 | |
| | 5,280,000 | | | 0.180%, 11/8/2012b,c | | | 5,279,815 | |
| | 5,205,000 | | | 0.180%, 12/5/2012b,c | | | 5,204,115 | |
| | 5,170,000 | | | 0.180%, 12/18/2012b,c | | | 5,168,785 | |
| | 5,160,000 | | | 0.180%, 12/20/2012b,c | | | 5,158,736 | |
| | 5,050,000 | | | 0.180%, 1/29/2013b,c | | | 5,047,753 | |
| | | | | |
| | | | Total | | | 174,683,981 | |
| | | | | |
| | |
| Shares | | | Investment Company (7.1%) | | Value | |
| | | | AIM Investments Institutional Government and Agency Portfolio | | | | |
| | 100,000 | | | 0.030% | | | 100,000 | |
| | | | BlackRock Cash Funds | | | | |
| | 22,978,000 | | | 0.220% | | | 22,978,000 | |
| | | | Dreyfus Institutional Cash Advantage Fund | | | | |
| | 12,815,000 | | | 0.120% | | | 12,815,000 | |
The accompanying Notes to Financial Statements are an integral part of this schedule.
216
Money Market Fund
Schedule of Investments as of October 31, 2012
| | | | | | | | |
| Shares | | | Investment Company (7.1%) | | Value | |
| | | | DWS Money Market Series | | | | |
| | $182,024 | | | 0.150% | | | $182,024 | |
| | | | | |
| | | | Total | | | 36,075,024 | |
| | | | | |
| | |
Principal
Amount | | | Other Commercial Paper (5.1%)a | | Value | |
| | | | BHP Billiton Finance USA, Ltd. | | | | |
| | 5,200,000 | | | 0.320%, 3/7/2013c | | | 5,194,176 | |
| | | | General Electric Capital Corporation | | | | |
| | 5,330,000 | | | 0.230%, 11/23/2012 | | | 5,329,251 | |
| | | | Nestle Finance International, Ltd. | | | | |
| | 5,180,000 | | | 0.250%, 4/15/2013 | | | 5,174,065 | |
| | 5,130,000 | | | 0.249%, 4/22/2013 | | | 5,123,868 | |
| | | | Toyota Credit Canada, Inc. | | | | |
| | 5,180,000 | | | 0.180%, 11/26/2012 | | | 5,179,352 | |
| | | | | |
| | | | Total | | | 26,000,712 | |
| | | | | |
| | |
Principal
Amount | | | Other Instrument (0.9%)a | | Value | |
| | | | US Bank NA (Bankers Acceptance) | | | | |
| | 4,614,411 | | | 0.210%, 12/3/2012 | | | 4,613,549 | |
| | | | | |
| | | | Total | | | 4,613,549 | |
| | | | | |
| | |
Principal
Amount | | | Other Note (2.8%)a | | Value | |
| | | | General Electric Capital Corporation | | | | |
| | 5,060,000 | | | 0.281%, 5/1/2013 | | | 5,173,528 | |
| | | | General Electric Company | | | | |
| | 5,200,000 | | | 0.337%, 2/1/2013 | | | 5,260,612 | |
| | | | Wells Fargo & Company | | | | |
| | 3,900,000 | | | 0.276%, 1/31/2013 | | | 3,939,488 | |
| | | | | |
| | | | Total | | | 14,373,628 | |
| | | | | |
| | |
Principal
Amount | | | Variable Rate Demand Note (8.3%)a | | Value | |
| | | | Douglas County, Nebraska Hospital Authority No. 2 Health Facilities Revenue Refunding Bonds (Children’s Hospital) | | | | |
| | 6,700,000 | | | 0.250%, 11/1/2012d | | | 6,700,000 | |
| | | | Louisiana Housing Finance Agency Qualified Gulf Opportunity Zone Bonds (Canterbury House Apartments - Sherwood) | | | | |
| | 8,730,000 | | | 0.210%, 11/7/2012d | | | 8,730,000 | |
| | | | Overseas Private Investment Corporation | | | | |
| | 4,122,810 | | | 0.170%, 11/7/2012d | | | 4,122,810 | |
| | 1,075,860 | | | 0.170%, 11/7/2012d | | | 1,075,860 | |
| | 1,637,930 | | | 0.170%, 11/7/2012d | | | 1,637,930 | |
| | 5,275,000 | | | 0.180%, 11/7/2012d | | | 5,275,000 | |
| | | | St. Cloud, Minnesota Health Care Refunding Revenue Bonds (CentraCare Health System) | | | | |
| | 8,240,000 | | | 0.200%, 11/7/2012d | | | 8,240,000 | |
| | |
Principal
Amount | | | Variable Rate Demand Note (8.3%)a | | Value | |
| | | | Wisconsin State Health & Educational Facilities Authority Revenue Prohealth Care, Inc. | | | | |
| | $6,445,000 | | | 0.250%, 11/1/2012d | | | $6,445,000 | |
| | | | | |
| | | | Total | | | 42,226,600 | |
| | | | | |
| | | | Total Investments (at amortized cost) 99.9% | | | $506,033,254 | |
| | | | | |
| | | | Other Assets and Liabilities, Net 0.1% | | | 389,641 | |
| | | | | |
| | | | Total Net Assets 100.0% | | | $506,422,895 | |
| | | | | |
a | The interest rate shown reflects the yield, coupon rate or the discount rate at the date of purchase. |
b | Denotes variable rate securities. Variable rate securities are securities whose yields vary with a designated market index or market rate. The rate shown is as of October 31, 2012. |
c | Denotes investments that benefit from credit enhancement or liquidity support provided by a third party bank, institution or government. |
d | Denotes securities sold under Rule 144A of the Securities Act of 1933, which exempts them from registration. These securities have been deemed liquid and may be resold to other dealers in the program or to other qualified institutional buyers. As of October 31, 2012, the value of these investments was $188,710,669 or 37.3% of total net assets. |
| | |
Cost for federal income tax purposes | | $506,033,254 |
The accompanying Notes to Financial Statements are an integral part of this schedule.
217
Money Market Fund
Schedule of Investments as of October 31, 2012
Fair Valuation Measurements
The following table is a summary of the inputs used, as of October 31, 2012, in valuing Money Market Fund’s assets carried at fair value or amortized cost, which approximates fair value.
| | | | | | | | | | | | | | | | |
Investments in Securities | | Total | | | Level 1 | | | Level 2 | | | Level 3 | |
Asset Backed Commercial Paper | | | 131,962,448 | | | | – | | | | 131,962,448 | | | | – | |
Certificate of Deposit | | | 21,396,420 | | | | – | | | | 21,396,420 | | | | – | |
Financial Company Commercial Paper | | | 54,700,892 | | | | – | | | | 54,700,892 | | | | – | |
Government Agency Debt | | | 174,683,981 | | | | – | | | | 174,683,981 | | | | – | |
Investment Company | | | 36,075,024 | | | | 36,075,024 | | | | – | | | | – | |
Other Commercial Paper | | | 26,000,712 | | | | – | | | | 26,000,712 | | | | – | |
Other Instrument | | | 4,613,549 | | | | – | | | | 4,613,549 | | | | – | |
Other Note | | | 14,373,628 | | | | – | | | | 14,373,628 | | | | – | |
Variable Rate Demand Note | | | 42,226,600 | | | | – | | | | 42,226,600 | | | | – | |
| |
Total | | $ | 506,033,254 | | | $ | 36,075,024 | | | $ | 469,958,230 | | | $ | – | |
| |
There were no significant transfers between Levels during the period ended October 31, 2012. Transfers between Levels are identified as of the end of the period.
The accompanying Notes to Financial Statements are an integral part of this schedule.
218
THIS PAGE INTENTIONALLY LEFT BLANK
219
Thrivent Mutual Funds
Statement of Assets and Liabilities
| | | | | | | | | | | | | | | | |
As of October 31, 2012 | | Aggressive
Allocation
Fund | | | Moderately
Aggressive
Allocation Fund | | | Moderate
Allocation Fund | | | Moderately
Conservative
Allocation
Fund | |
Assets | | | | | | | | | | | | | | | | |
Investments at cost | | | $541,835,239 | | | | $1,335,864,819 | | | | $1,390,815,537 | | | | $699,927,969 | |
Investments in securities at value | | | 177,962,368 | | | | 435,245,832 | | | | 423,322,374 | | | | 303,415,050 | |
Investments in affiliates at value | | | 404,045,076 | | | | 970,022,315 | | | | 1,045,432,319 | | | | 432,124,246 | |
Investments at Value | | | 582,007,444 | | | | 1,405,268,147 | | | | 1,468,754,693 | | | | 735,539,296 | |
| | | | |
Cash | | | 1,250,525 | (a) | | | 1,081,252 | (b) | | | 1,083,709 | (b) | | | 1,042,856 | (c) |
Dividends and interest receivable | | | 198,236 | | | | 1,079,718 | | | | 1,296,987 | | | | 1,227,857 | |
Prepaid expenses | | | 18,413 | | | | 25,132 | | | | 24,540 | | | | 20,717 | |
Receivable for investments sold | | | 96,786 | | | | 1,858,764 | | | | 5,603,077 | | | | 3,289,593 | |
Receivable for fund shares sold | | | 442,646 | | | | 1,385,152 | | | | 1,766,075 | | | | 952,789 | |
Receivable for forward contracts | | | – | | | | – | | | | – | | | | – | |
Receivable from affiliate | | | – | | | | – | | | | – | | | | – | |
Receivable for variation margin | | | 10,312 | | | | 79,063 | | | | 248,436 | | | | 163,593 | |
Total Assets | | | 584,024,362 | | | | 1,410,777,228 | | | | 1,478,777,517 | | | | 742,236,701 | |
| | | | |
Liabilities | | | | | | | | | | | | | | | | |
Accrued expenses | | | 89,871 | | | | 152,765 | | | | 134,621 | | | | 76,571 | |
Payable for investments purchased | | | 6,379,454 | | | | 47,184,737 | | | | 91,765,298 | | | | 77,866,709 | |
Payable upon return of collateral for securities loaned | | | – | | | | 1,331,953 | | | | 1,032,781 | | | | 2,059,172 | |
Payable for fund shares redeemed | | | 1,063,795 | | | | 2,112,433 | | | | 2,008,840 | | | | 743,365 | |
Payable for forward contracts | | | 15 | | | | 39 | | | | 39 | | | | 21 | |
Payable for variation margin | | | 661,098 | | | | 853,492 | | | | 494,732 | | | | 107,570 | |
Payable to affiliate | | | 344,141 | | | | 791,274 | | | | 797,422 | | | | 404,097 | |
Mortgage dollar roll deferred revenue | | | 3,087 | | | | 20,956 | | | | 47,844 | | | | 34,678 | |
Total Liabilities | | | 8,541,461 | | | | 52,447,649 | | | | 96,281,577 | | | | 81,292,183 | |
| | | | |
Net Assets | | | | | | | | | | | | | | | | |
Capital stock (beneficial interest) | | | 536,094,825 | | | | 1,287,052,473 | | | | 1,301,039,558 | | | | 619,252,824 | |
Accumulated undistributed net investment income/(loss) | | | 132,214 | | | | 6,761,916 | | | | 1,145,709 | | | | 773,764 | |
Accumulated undistributed net realized gain/(loss) | | | (2,014,556 | ) | | | (5,245,439 | ) | | | 2,755,810 | | | | 5,621,409 | |
Net unrealized appreciation/(depreciation) on: | | | | | | | | | | | | | | | | |
Investments | | | 12,870,127 | | | | 25,081,139 | | | | 21,274,602 | | | | 10,071,963 | |
Affiliated investments | | | 27,302,078 | | | | 44,322,189 | | | | 56,664,554 | | | | 25,539,364 | |
Futures contracts | | | 1,098,310 | | | | 357,429 | | | | (384,231 | ) | | | (314,785 | ) |
Foreign currency forward contracts | | | (15 | ) | | | (39 | ) | | | (39 | ) | | | (21 | ) |
Foreign currency transactions | | | (82 | ) | | | (89 | ) | | | (23 | ) | | | – | |
Total Net Assets | | | $575,482,901 | | | | $1,358,329,579 | | | | $1,382,495,940 | | | | $660,944,518 | |
| | | | |
Class A Share Capital | | | $494,277,313 | | | | $1,268,160,769 | | | | $1,316,468,921 | | | | $632,934,529 | |
Shares of beneficial interest outstanding (Class A) | | | 42,818,450 | | | | 108,989,157 | | | | 114,024,514 | | | | 55,805,253 | |
Net asset value per share | | | $11.54 | | | | $11.64 | | | | $11.55 | | | | $11.34 | |
Maximum public offering price | | | $12.21 | | | | $12.32 | | | | $12.22 | | | | $12.00 | |
Institutional Class Share Capital | | | $81,205,588 | | | | $90,168,810 | | | | $66,027,019 | | | | $28,009,989 | |
Shares of beneficial interest outstanding (Institutional Class) | | | 6,978,719 | | | | 7,690,138 | | | | 5,706,255 | | | | 2,463,259 | |
Net asset value per share | | | $11.64 | | | | $11.73 | | | | $11.57 | | | | $11.37 | |
(a) | Includes foreign currency holdings of $35,462 (cost $35,462). |
(b) | Includes foreign currency holdings of $92,156 (cost $92,156). |
(c) | Includes foreign currency holdings of $49,461 (cost $49,461). |
The accompanying Notes to Financial Statements are an integral part of this schedule.
220
Thrivent Mutual Funds
Statement of Assets and Liabilities – continued
| | | | | | | | | | | | | | | | | | | | | | | | | | |
Partner
Emerging
Markets
Equity Fund | | | Partner Small
Cap Growth
Fund | | | Partner Small
Cap Value Fund | | | Small Cap Stock
Fund | | | Mid Cap
Growth Fund | | | Partner Mid
Cap Value Fund | | | Mid Cap Stock
Fund | |
| | | | | | | | | | | | | | | | | | | | | | | | | | |
| | $14,902,764 | | | | $129,070,720 | | | | $168,462,447 | | | | $290,913,480 | | | | $311,724,799 | | | | $117,117,462 | | | | $701,307,226 | |
| | 15,044,287 | | | | 127,983,443 | | | | 217,425,994 | | | | 251,185,835 | | | | 361,037,552 | | | | 127,157,600 | | | | 730,238,403 | |
| | 124,811 | | | | 18,148,712 | | | | 7,927,158 | | | | 47,612,147 | | | | 32,232,364 | | | | 6,805,219 | | | | 75,535,707 | |
| | 15,169,098 | | | | 146,132,155 | | | | 225,353,152 | | | | 298,797,982 | | | | 393,269,916 | | | | 133,962,819 | | | | 805,774,110 | |
| | | | | | |
| | 178,797 | | | | 1,319,343 | | | | 265,814 | | | | 500,000 | | | | 102,341 | | | | 500,000 | | | | 500,000 | |
| | 15,902 | | | | 35,544 | | | | 79,380 | | | | 71,199 | | | | 111,757 | | | | 43,541 | | | | 202,813 | |
| | 33,984 | | | | 12,683 | | | | 13,345 | | | | 15,953 | | | | 15,189 | | | | 12,655 | | | | 17,589 | |
| | 182,213 | | | | 247,483 | | | | 451,743 | | | | 239,283 | | | | 14,677,781 | | | | 536,349 | | | | 568,349 | |
| | 18,223 | | | | 24,664 | | | | 248,058 | | | | 68,463 | | | | 222,193 | | | | 19,090 | | | | 121,445 | |
| | 17 | | | | – | | | | – | | | | – | | | | – | | | | – | | | | – | |
| | 38 | | | | – | | | | – | | | | – | | | | – | | | | – | | | | – | |
| | – | | | | – | | | | – | | | | 177,320 | | | | – | | | | – | | | | – | |
| | 15,598,272 | | | | 147,771,872 | | | | 226,411,492 | | | | 299,870,200 | | | | 408,399,177 | | | | 135,074,454 | | | | 807,184,306 | |
| | | | | | |
| | | | | | | | | | | | | | | | | | | | | | | | | | |
| | 13,423 | | | | 31,772 | | | | 59,997 | | | | 125,741 | | | | 112,500 | | | | 33,772 | | | | 227,922 | |
| | 163,409 | | | | 634,467 | | | | 325,696 | | | | 656,309 | | | | 15,406,571 | | | | 354,464 | | | | 594,197 | |
| | – | | | | 14,689,588 | | | | 4,654,850 | | | | 18,604,753 | | | | 12,303,975 | | | | 4,042,325 | | | | 66,998,025 | |
| | 6,774 | | | | 27,901 | | | | 277,851 | | | | 211,768 | | | | 673,055 | | | | 37,059 | | | | 807,919 | |
| | 32 | | | | – | | | | – | | | | – | | | | – | | | | – | | | | – | |
| | – | | | | – | | | | – | | | | – | | | | – | | | | – | | | | – | |
| | – | | | | 114,992 | | | | 172,505 | | | | 241,524 | | | | 193,671 | | | | 95,486 | | | | 612,882 | |
| | – | | | | – | | | | – | | | | – | | | | – | | | | – | | | | – | |
| | 183,638 | | | | 15,498,720 | | | | 5,490,899 | | | | 19,840,095 | | | | 28,689,772 | | | | 4,563,106 | | | | 69,240,945 | |
| | | | | | |
| | | | | | | | | | | | | | | | | | | | | | | | | | |
| | 15,006,650 | | | | 112,731,579 | | | | 159,541,121 | | | | 293,755,839 | | | | 272,018,260 | | | | 110,307,433 | | | | 741,091,768 | |
| | (395 | ) | | | (638,357 | ) | | | 760,871 | | | | (414,612 | ) | | | (55,225 | ) | | | 1,002,117 | | | | (45,558 | ) |
| | 142,056 | | | | 3,118,495 | | | | 3,727,896 | | | | (19,562,207 | ) | | | 26,201,253 | | | | 2,356,441 | | | | (107,569,733 | ) |
| | 266,334 | | | | 17,061,435 | | | | 56,890,705 | | | | 7,884,502 | | | | 81,545,117 | | | | 16,845,357 | | | | 104,466,884 | |
| | – | | | | – | | | | – | | | | – | | | | – | | | | – | | | | – | |
| | – | | | | – | | | | – | | | | (1,633,417 | ) | | | – | | | | – | | | | – | |
| | (15 | ) | | | – | | | | – | | | | – | | | | – | | | | – | | | | – | |
| | 4 | | | | – | | | | – | | | | – | | | | – | | | | – | | | | – | |
| | $15,414,634 | | | | $132,273,152 | | | | $220,920,593 | | | | $280,030,105 | | | | $379,709,405 | | | | $130,511,348 | | | | $737,943,361 | |
| | | | | | |
| | $14,392,337 | | | | $17,247,327 | | | | $71,986,174 | | | | $216,595,123 | | | | $228,980,567 | | | | $19,448,623 | | | | $517,523,970 | |
| | 1,401,807 | | | | 1,364,257 | | | | 4,501,010 | | | | 15,164,537 | | | | 12,486,904 | | | | 1,518,207 | | | | 33,740,647 | |
| | $10.27 | | | | $12.64 | | | | $15.99 | | | | $14.28 | | | | $18.34 | | | | $12.81 | | | | $15.34 | |
| | $10.87 | | | | $13.38 | | | | $16.92 | | | | $15.11 | | | | $19.41 | | | | $13.56 | | | | $16.23 | |
| | $1,022,297 | | | | $115,025,825 | | | | $148,934,419 | | | | $63,434,982 | | | | $150,728,838 | | | | $111,062,725 | | | | $220,419,391 | |
| | 99,523 | | | | 8,860,464 | | | | 8,867,025 | | | | 3,942,205 | | | | 7,289,590 | | | | 8,635,747 | | | | 13,256,692 | |
| | $10.27 | | | | $12.98 | | | | $16.80 | | | | $16.09 | | | | $20.68 | | | | $12.86 | | | | $16.63 | |
The accompanying Notes to Financial Statements are an integral part of this schedule.
221
Thrivent Mutual Funds
Statement of Assets and Liabilities – continued
| | | | | | | | | | | | | | | | |
As of October 31, 2012 | | Partner
Worldwide
Allocation Fund | | | Large Cap
Growth Fund | | | Large Cap Value Fund | | | Large Cap
Stock Fund | |
Assets | | | | | | | | | | | | | | | | |
Investments at cost | | | $685,391,247 | | | | $327,181,765 | | | | $521,013,964 | | | | $1,381,378,650 | |
Investments in securities at value | | | 690,637,961 | | | | 342,326,052 | | | | 554,379,417 | | | | 1,454,148,343 | |
Investments in affiliates at value | | | 12,881,794 | | | | 7,293,093 | | | | 26,903,410 | | | | 111,037,552 | |
Investments at Value | | | 703,519,755 | | | | 349,619,145 | | | | 581,282,827 | | | | 1,565,185,895 | |
| | | | |
Cash | | | 2,004,039 | (a) | | | 441,552 | | | | 500,000 | | | | 520,301 | |
Initial margin deposit on open future contracts | | | 15,175 | | | | – | | | | – | | | | – | |
Dividends and interest receivable | | | 2,926,396 | | | | 165,307 | | | | 539,263 | | | | 1,065,273 | |
Prepaid expenses | | | 11,303 | | | | 15,903 | | | | 16,031 | | | | 22,934 | |
Receivable for investments sold | | | 6,338,879 | | | | – | | | | – | | | | – | |
Receivable for fund shares sold | | | 305,396 | | | | 156,580 | | | | 323,301 | | | | 307,240 | |
Receivable for forward contracts | | | 170,840 | | | | – | | | | – | | | | – | |
Receivable for variation margin | | | 8,328 | | | | – | | | | – | | | | – | |
Total Assets | | | 715,300,111 | | | | 350,398,487 | | | | 582,661,422 | | | | 1,567,101,643 | |
| | | | |
Liabilities | | | | | | | | | | | | | | | | |
Distributions payable | | | – | | | | – | | | | – | | | | – | |
Accrued expenses | | | 219,162 | | | | 105,735 | | | | 133,764 | | | | 711,680 | |
Payable for investments purchased | | | 5,377,168 | | | | – | | | | – | | | | – | |
Payable upon return of collateral for securities loaned | | | 4,431,715 | | | | – | | | | 7,650,413 | | | | 10,379,100 | |
Payable for fund shares redeemed | | | 248,228 | | | | 157,781 | | | | 394,933 | | | | 2,028,632 | |
Payable for forward contracts | | | 298,815 | | | | – | | | | – | | | | – | |
Swap agreements, at value | | | – | | | | – | | | | – | | | | – | |
Payable for variation margin | | | 12,219 | | | | – | | | | – | | | | 63,800 | |
Payable to affiliate | | | 544,895 | | | | 250,230 | | | | 295,288 | | | | 1,151,658 | |
Mortgage dollar roll deferred revenue | | | – | | | | – | | | | – | | | | – | |
Total Liabilities | | | 11,132,202 | | | | 513,746 | | | | 8,474,398 | | | | 14,334,870 | |
| | | | |
Net Assets | | | | | | | | | | | | | | | | |
Capital stock (beneficial interest) | | | 810,340,671 | | | | 396,954,206 | | | | 558,903,478 | | | | 1,293,002,825 | |
Accumulated undistributed net investment income/(loss) | | | 14,470,995 | | | | 1,394,354 | | | | 7,418,453 | | | | 10,294,234 | |
Accumulated undistributed net realized gain/(loss) | | | (138,606,929 | ) | | | (70,901,199 | ) | | | (52,403,770 | ) | | | 69,443,911 | |
Net unrealized appreciation/(depreciation) on: | | | | | | | | | | | | | | | | |
Investments | | | 18,128,508 | | | | 22,437,380 | | | | 60,268,863 | | | | 183,807,245 | |
Affiliated investments | | | – | | | | – | | | | – | | | | – | |
Futures contracts | | | (9,132 | ) | | | – | | | | – | | | | (3,781,442 | ) |
Foreign currency forward contracts | | | (127,975 | ) | | | – | | | | – | | | | – | |
Foreign currency transactions | | | (28,229 | ) | | | – | | | | – | | | | – | |
Swap agreements | | | – | | | | – | | | | – | | | | – | |
Total Net Assets | | | $704,167,909 | | | | $349,884,741 | | | | $574,187,024 | | | | $1,552,766,773 | |
| | | | |
Class A Share Capital | | | $159,530,340 | | | | $124,999,186 | | | | $171,145,528 | | | | $1,382,461,581 | |
Shares of beneficial interest outstanding (Class A) | | | 18,270,642 | | | | 22,796,609 | | | | 11,675,943 | | | | 58,483,036 | |
Net asset value per share | | | $8.73 | | | | $5.48 | | | | $14.66 | | | | $23.64 | |
Maximum public offering price | | | $9.24 | | | | $5.80 | | | | $15.51 | | | | $25.02 | |
Institutional Class Share Capital | | | $544,637,569 | | | | $224,885,555 | | | | $403,041,496 | | | | $170,305,192 | |
Shares of beneficial interest outstanding (Institutional Class) | | | 61,986,387 | | | | 38,083,166 | | | | 27,299,572 | | | | 7,149,765 | |
Net asset value per share | | | $8.79 | | | | $5.91 | | | | $14.76 | | | | $23.82 | |
(a) | Includes foreign currency holdings of $47,774 (cost $47,781). |
The accompanying Notes to Financial Statements are an integral part of this schedule.
222
Thrivent Mutual Funds
Statement of Assets and Liabilities – continued
| | | | | | | | | | | | | | | | | | | | | | | | | | |
| Balanced Fund | | | High Yield
Fund | | | Municipal
Bond Fund | | | Income Fund | | | Core Bond
Fund | | | Government
Bond Fund | | | Limited
Maturity Bond
Fund | |
| | | | | | | | | | | | | | | | | | | | | | | | | | |
| | $201,641,625 | | | | $823,416,227 | | | | $1,457,474,356 | | | | $895,160,639 | | | | $347,610,085 | | | | $114,256,551 | | | | $911,082,292 | |
| | 194,686,101 | | | | 765,289,791 | | | | 1,617,137,623 | | | | 888,693,331 | | | | 302,965,937 | | | | 113,935,784 | | | | 877,677,008 | |
| | 16,824,927 | | | | 95,689,986 | | | | – | | | | 74,662,161 | | | | 56,367,047 | | | | 4,848,944 | | | | 45,147,267 | |
| | 211,511,028 | | | | 860,979,777 | | | | 1,617,137,623 | | | | 963,355,492 | | | | 359,332,984 | | | | 118,784,728 | | | | 922,824,275 | |
| | | | | | |
| | 500,000 | | | | 116,206 | | | | 233,686 | | | | 505,154 | | | | 500,000 | | | | 100,000 | | | | 500,000 | |
| | – | | | | – | | | | – | | | | – | | | | – | | | | – | | | | – | |
| | 346,494 | | | | 14,733,735 | | | | 22,102,441 | | | | 8,749,471 | | | | 1,339,961 | | | | 502,901 | | | | 2,699,628 | |
| | 18,788 | | | | 18,987 | | | | 27,809 | | | | 17,887 | | | | 16,689 | | | | 7,781 | | | | 26,327 | |
| | 1,200,249 | | | | – | | | | – | | | | 8,258,482 | | | | 5,672,374 | | | | 2,940,116 | | | | 7,634,844 | |
| | 18,692 | | | | 1,554,394 | | | | 2,894,710 | | | | 1,086,579 | | | | 398,252 | | | | 106,168 | | | | 4,719,178 | |
| | – | | | | – | | | | – | | | | – | | | | – | | | | – | | | | – | |
| | 13,750 | | | | – | | | | – | | | | 254,767 | | | | 55,000 | | | | – | | | | 6,875 | |
| | 213,609,001 | | | | 877,403,099 | | | | 1,642,396,269 | | | | 982,227,832 | | | | 367,315,260 | | | | 122,441,694 | | | | 938,411,127 | |
| | | | | | |
| | | | | | | | | | | | | | | | | | | | | | | | | | |
| | – | | | | 1,134,089 | | | | 815,900 | | | | 207,152 | | | | 50,385 | | | | 1,200 | | | | 16,429 | |
| | 96,900 | | | | 153,443 | | | | 293,080 | | | | 156,645 | | | | 118,225 | | | | 17,931 | | | | 129,539 | |
| | 20,883,802 | | | | 4,714,233 | | | | 3,898,054 | | | | 69,003,661 | | | | 79,585,446 | | | | 9,705,732 | | | | 47,421,574 | |
| | 1,067,718 | | | | 64,588,487 | | | | – | | | | 7,306,530 | | | | – | | | | – | | | | 6,949,000 | |
| | 467,455 | | | | 628,050 | | | | 1,898,506 | | | | 583,454 | | | | 884,625 | | | | 88,185 | | | | 2,243,656 | |
| | – | | | | – | | | | – | | | | – | | | | – | | | | – | | | | – | |
| | 9,138 | | | | 16,058 | | | | – | | | | 12,387 | | | | 73,100 | | | | – | | | | 79,192 | |
| | 24,062 | | | | – | | | | – | | | | 385,621 | | | | 112,968 | | | | – | | | | 352,656 | |
| | 137,504 | | | | 429,406 | | | | 990,951 | | | | 410,289 | | | | 174,476 | | | | 45,298 | | | | 314,162 | |
| | 10,763 | | | | – | | | | – | | | | 36,697 | | | | 42,189 | | | | 5,579 | | | | 34,225 | |
| | 22,697,342 | | | | 71,663,766 | | | | 7,896,491 | | | | 78,102,436 | | | | 81,041,414 | | | | 9,863,925 | | | | 57,540,433 | |
| | | | | | |
| | | | | | | | | | | | | | | | | | | | | | | | | | |
| | 171,591,896 | | | | 834,402,698 | | | | 1,474,590,389 | | | | 866,067,610 | | | | 283,731,133 | | | | 104,079,190 | | | | 871,729,606 | |
| | (76,130 | ) | | | (40,750 | ) | | | (62,577 | ) | | | (125,835 | ) | | | (57,231 | ) | | | 67,870 | | | | 33,418 | |
| | 9,569,672 | | | | (65,896,108 | ) | | | 308,699 | | | | (29,449,982 | ) | | | (8,801,597 | ) | | | 3,902,532 | | | | (2,076,853 | ) |
| | 9,435,082 | | | | 37,563,550 | | | | 159,663,267 | | | | 68,194,853 | | | | 8,266,372 | | | | 4,528,177 | | | | 8,783,369 | |
| | 434,321 | | | | – | | | | – | | | | – | | | | 3,456,527 | | | | – | | | | 2,958,614 | |
| | (4,602 | ) | | | – | | | | – | | | | (310,197 | ) | | | (12,719 | ) | | | – | | | | (223,100 | ) |
| | – | | | | – | | | | – | | | | – | | | | – | | | | – | | | | – | |
| | – | | | | – | | | | – | | | | – | | | | – | | | | – | | | | – | |
| | (38,580 | ) | | | (290,057 | ) | | | – | | | | (251,053 | ) | | | (308,639 | ) | | | – | | | | (334,360 | ) |
| | $190,911,659 | | | | $805,739,333 | | | | $1,634,499,778 | | | | $904,125,396 | | | | $286,273,846 | | | | $112,577,769 | | | | $880,870,694 | |
| | | | | | |
| | $141,015,387 | | | | $520,048,625 | | | | $1,531,982,827 | | | | $447,986,769 | | | | $249,236,237 | | | | $14,543,684 | | | | $408,238,867 | |
| | 11,162,690 | | | | 103,865,373 | | | | 128,397,843 | | | | 47,753,780 | | | | 23,283,268 | | | | 1,351,787 | | | | 32,341,491 | |
| | $12.63 | | | | $5.01 | | | | $11.93 | | | | $9.38 | | | | $10.70 | | | | $10.76 | | | | $12.62 | |
| | $13.37 | | | | $5.25 | | | | $12.49 | | | | $9.82 | | | | $11.20 | | | | $10.98 | | | | $12.62 | |
| | $49,896,272 | | | | $285,690,708 | | | | $102,516,951 | | | | $456,138,627 | | | | $37,037,609 | | | | $98,034,085 | | | | $472,631,827 | |
| | 3,955,786 | | | | 57,031,861 | | | | 8,592,240 | | | | 48,663,785 | | | | 3,459,129 | | | | 9,109,863 | | | | 37,450,979 | |
| | $12.61 | | | | $5.01 | | | | $11.93 | | | | $9.37 | | | | $10.71 | | | | $10.76 | | | | $12.62 | |
The accompanying Notes to Financial Statements are an integral part of this schedule.
223
Thrivent Mutual Funds
Statement of Assets and Liabilities – continued
| | | | |
As of October 31, 2012 | | Money Market
Fund | |
Assets | | | | |
Investments at cost | | | $506,033,254 | |
Investments in securities at value | | | 506,033,254 | |
Investments at Value | | | 506,033,254 | 1 |
| |
Cash | | | 4,241 | |
Dividends and interest receivable | | | 283,872 | |
Prepaid expenses | | | 24,734 | |
Receivable for fund shares sold | | | 4,668,764 | |
Receivable from affiliate | | | 11,676 | |
Total Assets | | | 511,026,541 | |
| |
Liabilities | | | | |
Accrued expenses | | | 92,258 | |
Payable for fund shares redeemed | | | 4,511,388 | |
Payable to affiliate | | | – | |
Total Liabilities | | | 4,603,646 | |
| |
Net Assets | | | | |
Capital stock (beneficial interest) | | | 506,422,895 | |
Accumulated undistributed net investment income/(loss) | | | – | |
Accumulated undistributed net realized gain/(loss) | | | – | |
Total Net Assets | | | $506,422,895 | |
| |
Class A Share Capital | | | $493,895,981 | |
Shares of beneficial interest outstanding (Class A) | | | 493,895,980 | |
Net asset value per share | | | $1.00 | |
Maximum public offering price | | | $1.00 | |
Institutional Class Share Capital | | | $12,526,914 | |
Shares of beneficial interest outstanding (Institutional Class) | | | 12,526,914 | |
Net asset value per share | | | $1.00 | |
1 | Securities held by this fund are valued on the basis of amortized cost, which approximates market value. |
The accompanying Notes to Financial Statements are an integral part of this schedule.
224
THIS PAGE INTENTIONALLY LEFT BLANK
225
Thrivent Mutual Funds
Statement of Operations
| | | | | | | | | | | | | | | | |
For the year ended October 31, 2012 | | Aggressive
Allocation
Fund | | | Moderately
Aggressive
Allocation
Fund | | | Moderate
Allocation
Fund | | | Moderately
Conservative
Allocation
Fund | |
Investment Income | | | | | | | | | | | | | | | | |
Dividends | | | $2,448,485 | | | | $4,375,148 | | | | $3,299,082 | | | | $1,242,834 | |
Taxable interest | | | 576,853 | | | | 4,261,268 | | | | 6,240,994 | | | | 4,181,715 | |
Income from mortgage dollar rolls | | | 258,372 | | | | 914,382 | | | | 1,183,264 | | | | 982,746 | |
Income from securities loaned | | | 241 | | | | 1,784 | | | | 2,713 | | | | 2,202 | |
Income from affiliated investments | | | 3,197,945 | | | | 13,514,200 | | | | 18,113,640 | | | | 8,791,003 | |
Foreign tax withholding | | | (9,320 | ) | | | (15,427 | ) | | | (11,395 | ) | | | (4,401 | ) |
Total Investment Income | | | 6,472,576 | | | | 23,051,355 | | | | 28,828,298 | | | | 15,196,099 | |
| | | | |
Expenses | | | | | | | | | | | | | | | | |
Adviser fees | | | 1,991,428 | | | | 4,239,154 | | | | 4,071,435 | | | | 2,131,159 | |
Sub-Adviser fees | | | – | | | | – | | | | – | | | | – | |
Administrative service fees | | | 182,705 | | | | 331,850 | | | | 334,548 | | | | 193,996 | |
Amortization of offering costs | | | – | | | | – | | | | – | | | | – | |
Audit and legal fees | | | 26,820 | | | | 37,492 | | | | 37,651 | | | | 27,418 | |
Custody fees | | | 55,940 | | | | 69,345 | | | | 67,671 | | | | 53,927 | |
Distribution expenses Class A | | | 1,203,156 | | | | 3,051,321 | | | | 3,148,924 | | | | 1,486,328 | |
Insurance expenses | | | 6,865 | | | | 11,338 | | | | 11,234 | | | | 6,909 | |
Printing and postage expenses Class A | | | 182,838 | | | | 355,889 | | | | 290,145 | | | | 122,817 | |
Printing and postage expenses Institutional Class | | | 474 | | | | 435 | | | | 428 | | | | 378 | |
SEC and state registration expenses | | | 45,000 | | | | 68,753 | | | | 74,249 | | | | 59,404 | |
Transfer agent fees Class A | | | 768,138 | | | | 1,466,763 | | | | 1,131,530 | | | | 456,083 | |
Transfer agent fees Institutional Class | | | 408 | | | | 424 | | | | 639 | | | | 685 | |
Trustees’ fees | | | 12,927 | | | | 19,833 | | | | 19,632 | | | | 13,714 | |
Other expenses | | | 16,392 | | | | 24,533 | | | | 24,730 | | | | 21,856 | |
Total Expenses Before Reimbursement | | | 4,493,091 | | | | 9,677,130 | | | | 9,212,816 | | | | 4,574,674 | |
Less: | | | | | | | | | | | | | | | | |
Reimbursement from adviser | | | (201,525 | ) | | | – | | | | – | | | | – | |
Custody earnings credit | | | (1,310 | ) | | | (1,278 | ) | | | (1,194 | ) | | | (1,417 | ) |
Total Net Expenses | | | 4,290,256 | | | | 9,675,852 | | | | 9,211,622 | | | | 4,573,257 | |
| | | | | | | | | | | | | | | | |
Net Investment Income/(Loss) | | | 2,182,320 | | | | 13,375,503 | | | | 19,616,676 | | | | 10,622,842 | |
Realized and Unrealized Gains/(Losses) | | | | | | | | | | | | | | | | |
Net realized gains/(losses) on: | | | | | | | | | | | | | | | | |
Investments | | | 7,908,511 | | | | 14,794,745 | | | | 13,184,171 | | | | 6,251,865 | |
Affiliated investments | | | (3,055,676 | ) | | | (1,639,603 | ) | | | (4,427,721 | ) | | | (107,186 | ) |
Distributions of realized capital gains from affiliated investments | | | 610,558 | | | | 1,082,834 | | | | 925,010 | | | | 375,498 | |
Futures contracts | | | 4,676,319 | | | | 8,845,742 | | | | 14,053,239 | | | | 6,799,408 | |
Foreign currency transactions | | | (37,019 | ) | | | (64,839 | ) | | | (47,241 | ) | | | (4,654 | ) |
Swap agreements | | | 166,026 | | | | 392,719 | | | | 1,098,450 | | | | 717,552 | |
Change in net unrealized appreciation/(depreciation) on: | | | | | | | | | | | | | | | | |
Investments | | | 5,958,008 | | | | 13,811,368 | | | | 12,767,838 | | | | 6,786,225 | |
Affiliated investments | | | 29,511,530 | | | | 64,798,537 | | | | 60,979,114 | | | | 18,973,320 | |
Futures contracts | | | (1,777,921 | ) | | | (4,231,088 | ) | | | (7,843,811 | ) | | | (2,995,405 | ) |
Foreign currency forward contracts | | | (15 | ) | | | (39 | ) | | | (39 | ) | | | (21 | ) |
Foreign currency transactions | | | 366 | | | | 698 | | | | 511 | | | | – | |
Net Realized and Unrealized Gains/(Losses) | | | 43,960,687 | | | | 97,791,074 | | | | 90,689,521 | | | | 36,796,602 | |
| | | | | | | | | | | | | | | | |
Net Increase/(Decrease) in Net Assets Resulting From Operations | | | $46,143,007 | | | | $111,166,577 | | | | $110,306,197 | | | | $47,419,444 | |
The accompanying Notes to Financial Statements are an integral part of this schedule.
226
Thrivent Mutual Funds
Statement of Operations – continued
| | | | | | | | | | | | | | | | | | | | | | | | | | |
Partner
Emerging
Markets Equity
Fund(a) | | | Partner Small
Cap Growth
Fund | | | Partner Small
Cap Value Fund | | | Small Cap
Stock Fund | | | Mid Cap
Growth Fund | | | Partner Mid
Cap Value Fund | | | Mid Cap Stock
Fund | |
| | | | | | | | | | | | | | | | | | | | | | | | | | |
| | $62,859 | | | | $579,972 | | | | $4,163,438 | | | | $2,586,669 | | | | $2,564,386 | | | | $2,610,109 | | | | $8,116,952 | |
| | 15 | | | | 1,599 | | | | 2,944 | | | | 28,933 | | | | 16,587 | | | | 1,076 | | | | 27,244 | |
| | – | | | | – | | | | – | | | | – | | | | – | | | | – | | | | – | |
| | – | | | | 98,248 | | | | 130,123 | | | | 369,593 | | | | 12,324 | | | | 1,896 | | | | 155,713 | |
| | 12 | | | | 310 | | | | 326 | | | | 1,084 | | | | 704 | | | | 167 | | | | 600 | |
| | (5,530 | ) | | | (1,574 | ) | | | (3,991 | ) | | | (24,046 | ) | | | (14,949 | ) | | | (859 | ) | | | (5,883 | ) |
| | 57,356 | | | | 678,555 | | | | 4,292,840 | | | | 2,962,233 | | | | 2,579,052 | | | | 2,612,389 | | | | 8,294,626 | |
| | | | | | |
| | | | | | | | | | | | | | | | | | | | | | | | | | |
| | 14,598 | | | | 353,865 | | | | 222,857 | | | | 1,968,623 | | | | 1,540,882 | | | | 339,099 | | | | 4,975,969 | |
| | 16,479 | | | | 815,596 | | | | 1,314,128 | | | | – | | | | – | | | | 591,289 | | | | – | |
| | 12,186 | | | | 95,988 | | | | 113,914 | | | | 127,496 | | | | 148,051 | | | | 94,810 | | | | 220,030 | |
| | 6,773 | | | | – | | | | – | | | | – | | | | – | | | | – | | | | – | |
| | 13,732 | | | | 20,472 | | | | 21,756 | | | | 22,863 | | | | 24,454 | | | | 20,358 | | | | 29,863 | |
| | 3,938 | | | | 26,637 | | | | 12,411 | | | | 18,951 | | | | 15,179 | | | | 28,098 | | | | 26,611 | |
| | 6,060 | | | | 48,413 | | | | 179,359 | | | | 561,557 | | | | 591,713 | | | | 46,364 | | | | 1,326,276 | |
| | 574 | | | | 4,189 | | | | 4,861 | | | | 5,403 | | | | 5,873 | | | | 4,188 | | | | 8,493 | |
| | 841 | | | | 6,963 | | | | 37,538 | | | | 117,843 | | | | 133,621 | | | | 8,830 | | | | 195,089 | |
| | 26 | | | | 573 | | | | 12,235 | | | | 567 | | | | 14,330 | | | | 750 | | | | 2,062 | |
| | – | | | | 25,395 | | | | 26,468 | | | | 27,825 | | | | 30,363 | | | | 25,558 | | | | 34,573 | |
| | 144 | | | | 38,080 | | | | 192,862 | | | | 591,512 | | | | 604,968 | | | | 47,686 | | | | 965,767 | |
| | 15 | | | | 317 | | | | 76,074 | | | | 1,098 | | | | 91,691 | | | | 2,036 | | | | 8,683 | |
| | 422 | | | | 10,975 | | | | 16,737 | | | | 30,046 | | | | 27,693 | | | | 11,113 | | | | 59,765 | |
| | 2,005 | | | | 10,817 | | | | 10,825 | | | | 10,174 | | | | 10,580 | | | | 9,694 | | | | 12,994 | |
| | 77,793 | | | | 1,458,280 | | | | 2,242,025 | | | | 3,483,958 | | | | 3,239,398 | | | | 1,229,873 | | | | 7,866,175 | |
| | | | | | | | | | | | | | | | | | | | | | | | | | |
| | (36,566 | ) | | | (22,002 | ) | | | (943 | ) | | | – | | | | – | | | | (38,797 | ) | | | – | |
| | – | | | | (1,475 | ) | | | (699 | ) | | | (590 | ) | | | (518 | ) | | | (722 | ) | | | (429 | ) |
| | 41,227 | | | | 1,434,803 | | | | 2,240,383 | | | | 3,483,368 | | | | 3,238,880 | | | | 1,190,354 | | | | 7,865,746 | |
| | | | | | | | | | | | | | | | | | | | | | | | | | |
| | 16,129 | | | | (756,248) | | | | 2,052,457 | | | | (521,135 | ) | | | (659,828 | ) | | | 1,422,035 | | | | 428,880 | |
| | | | | | | | | | | | | | | | | | | | | | | | | | |
| | | | | | | | | | | | | | | | | | | | | | | | | | |
| | 150,711 | | | | 9,426,892 | | | | 3,862,241 | | | | 11,192,356 | | | | 27,994,939 | | | | 3,228,750 | | | | 60,824,551 | |
| | – | | | | – | | | | – | | | | – | | | | – | | | | – | | | | – | |
| | – | | | | – | | | | – | | | | – | | | | – | | | | – | | | | – | |
| | – | | | | – | | | | – | | | | 6,901,609 | | | | – | | | | – | | | | – | |
| | (31,850 | ) | | | – | | | | 147 | | | | (7,543 | ) | | | – | | | | – | | | | – | |
| | – | | | | – | | | | – | | | | – | | | | – | | | | – | | | | – | |
| | | | | | | | | | | | | | | | | | | | | | | | | | |
| | 266,334 | | | | 1,426,438 | | | | 19,436,689 | | | | 5,056,055 | | | | (8,378,199 | ) | | | 9,120,146 | | | | (7,148,855 | ) |
| | – | | | | – | | | | – | | | | – | | | | – | | | | – | | | | – | |
| | – | | | | – | | | | – | | | | (2,714,861 | ) | | | – | | | | – | | | | – | |
| | (15 | ) | | | – | | | | – | | | | – | | | | – | | | | – | | | | – | |
| | 4 | | | | – | | | | – | | | | – | | | | – | | | | – | | | | – | |
| | 385,184 | | | | 10,853,330 | | | | 23,299,077 | | | | 20,427,616 | | | | 19,616,740 | | | | 12,348,896 | | | | 53,675,696 | |
| | | | | | | | | | | | | | | | | | | | | | | | | | |
| | $401,313 | | | | $10,097,082 | | | | $25,351,534 | | | | $19,906,481 | | | | $18,956,912 | | | | $13,770,931 | | | | $54,104,576 | |
(a) | For the period from August 31, 2012 (inception) through October 31, 2012 |
The accompanying Notes to Financial Statements are an integral part of this schedule.
227
Thrivent Mutual Funds
Statement of Operations – continued
| | | | | | | | | | | | | | | | |
For the year ended October 31, 2012 | | Partner
Worldwide
Allocation
Fund | | | Large Cap
Growth Fund | | | Large Cap
Value Fund | | | Large Cap
Stock Fund | |
Investment Income | | | | | | | | | | | | | | | | |
Dividends | | | $19,568,753 | | | | $4,721,302 | | | | $13,400,198 | | | | $30,012,411 | |
Taxable interest | | | 4,069,678 | | | | 14,604 | | | | 11,026 | | | | 75,506 | |
Tax-Exempt interest | | | – | | | | – | | | | – | | | | – | |
Income from mortgage dollar rolls | | | – | | | | – | | | | – | | | | – | |
Income from securities loaned | | | 25,016 | | | | 5,200 | | | | 15,102 | | | | 43,055 | |
Income from affiliated investments | | | 861 | | | | 381 | | | | 718 | | | | 3,136 | |
Foreign tax withholding | | | (1,682,532 | ) | | | (12,584 | ) | | | (64,531 | ) | | | (129,794 | ) |
Total Investment Income | | | 21,981,776 | | | | 4,728,903 | | | | 13,362,513 | | | | 30,004,314 | |
| | | | |
Expenses | | | | | | | | | | | | | | | | |
Adviser fees | | | 2,429,285 | | | | 2,546,408 | | | | 2,466,317 | | | | 8,928,623 | |
Sub-Adviser fees | | | 3,357,766 | | | | – | | | | – | | | | – | |
Administrative service fees | | | 203,225 | | | | 137,904 | | | | 179,614 | | | | 382,145 | |
Audit and legal fees | | | 36,377 | | | | 23,451 | | | | 26,416 | | | | 41,965 | |
Custody fees | | | 342,365 | | | | 17,834 | | | | 23,736 | | | | 64,045 | |
Distribution expenses Class A | | | 421,879 | | | | 304,643 | | | | 418,965 | | | | 3,489,262 | |
Insurance expenses | | | 6,345 | | | | 5,613 | | | | 6,905 | | | | 14,679 | |
Printing and postage expenses Class A | | | 97,721 | | | | 82,856 | | | | 78,313 | | | | 573,947 | |
Printing and postage expenses Institutional Class | | | 2,337 | | | | 837 | | | | 9,310 | | | | 763 | |
SEC and state registration expenses | | | 36,194 | | | | 30,848 | | | | 29,479 | | | | 43,185 | |
Transfer agent fees Class A | | | 542,634 | | | | 410,609 | | | | 382,502 | | | | 2,464,198 | |
Transfer agent fees Institutional Class | | | 6,006 | | | | 1,369 | | | | 56,819 | | | | 1,638 | |
Trustees’ fees | | | 43,560 | | | | 28,896 | | | | 38,872 | | | | 163,634 | |
Other expenses | | | 94,297 | | | | 9,804 | | | | 11,456 | | | | 22,776 | |
Total Expenses Before Reimbursement | | | 7,619,991 | | | | 3,601,072 | | | | 3,728,704 | | | | 16,190,860 | |
| | | | |
Less: | | | | | | | | | | | | | | | | |
Reimbursement from adviser | | | (525,126 | ) | | | (340,919 | ) | | | – | | | | – | |
Custody earnings credit | | | (3,339 | ) | | | (508 | ) | | | (523 | ) | | | (967 | ) |
Total Net Expenses | | | 7,091,526 | | | | 3,259,645 | | | | 3,728,181 | | | | 16,189,893 | |
| | | | | | | | | | | | | | | | |
Net Investment Income/(Loss) | | | 14,890,250 | | | | 1,469,258 | | | | 9,634,332 | | | | 13,814,421 | |
| | | | |
Realized and Unrealized Gains/(Losses) | | | | | | | | | | | | | | | | |
Net realized gains/(losses) on: | | | | | | | | | | | | | | | | |
Investments | | | (943,112 | ) | | | 25,820,567 | | | | 34,221,609 | | | | 80,080,625 | |
Affiliated investments | | | – | | | | – | | | | – | | | | – | |
Written option contracts | | | – | | | | – | | | | – | | | | (78,015 | ) |
Futures contracts | | | 51,810 | | | | – | | | | – | | | | 7,841,717 | |
Foreign currency transactions | | | 340,872 | | | | (8,629 | ) | | | – | | | | (12,754 | ) |
Swap agreements | | | – | | | | – | | | | – | | | | – | |
Change in net unrealized appreciation/(depreciation) on: | | | | | | | | | | | | | | | | |
Investments | | | 29,033,817 | | | | 10,068,813 | | | | 33,858,232 | | | | 76,446,660 | |
Affiliated investments | | | – | | | | – | | | | – | | | | – | |
Written option contracts | | | – | | | | – | | | | – | | | | (18,000 | ) |
Futures contracts | | | (4,311 | ) | | | – | | | | – | | | | (3,853,851 | ) |
Foreign currency forward contracts | | | (194,167 | ) | | | – | | | | – | | | | – | |
Foreign currency transactions | | | 1,498 | | | | – | | | | – | | | | – | |
Swap agreements | | | – | | | | – | | | | – | | | | – | |
Net Realized and Unrealized Gains/(Losses) | | | 28,286,407 | | | | 35,880,751 | | | | 68,079,841 | | | | 160,406,382 | |
| | | | | | | | | | | | | | | | |
Net Increase/(Decrease) in Net Assets Resulting From Operations | | | $43,176,657 | | | | $37,350,009 | | | | $77,714,173 | | | | $174,220,803 | |
The accompanying Notes to Financial Statements are an integral part of this schedule.
228
Thrivent Mutual Funds
Statement of Operations – continued
| | | | | | | | | | | | | | | | | | | | | | | | | | |
| Balanced Fund | | | High Yield
Fund | | | Municipal
Bond Fund | | | Income Fund | | | Core Bond
Fund | | | Government
Bond Fund | | | Limited
Maturity Bond
Fund | |
| | $2,189,714 | | | | $621,416 | | | | $– | | | | $474,151 | | | | $81,784 | | | | $– | | | | $278,165 | |
| | 1,607,756 | | | | 56,005,970 | | | | 279,431 | | | | 35,926,084 | | | | 7,493,072 | | | | 1,983,507 | | | | 17,522,988 | |
| | – | | | | – | | | | 69,082,497 | | | | – | | | | – | | | | – | | | | – | |
| | 304,324 | | | | – | | | | – | | | | 794,026 | | | | 1,247,804 | | | | 136,484 | | | | 513,567 | |
| | 14,258 | | | | 263,222 | | | | – | | | | 30,383 | | | | – | | | | 1,121 | | | | 48,455 | |
| | 130,035 | | | | 2,200 | | | | – | | | | 4,356 | | | | 935,213 | | | | 470 | | | | 793,948 | |
| | (24,684 | ) | | | – | | | | – | | | | – | | | | – | | | | – | | | | – | |
| | 4,221,403 | | | | 56,892,808 | | | | 69,361,928 | | | | 37,229,000 | | | | 9,757,873 | | | | 2,121,582 | | | | 19,157,123 | |
| | | | | | |
| | | | | | | | | | | | | | | | | | | | | | | | | | | |
| | 1,067,454 | | | | 2,812,360 | | | | 6,136,576 | | | | 2,836,635 | | | | 1,293,319 | | | | 438,799 | | | | 2,611,845 | |
| | – | | | | – | | | | – | | | | – | | | | – | | | | – | | | | – | |
| | 108,817 | | | | 216,421 | | | | 377,804 | | | | 236,870 | | | | 127,481 | | | | 91,940 | | | | 250,862 | |
| | 21,483 | | | | 28,851 | | | | 39,837 | | | | 30,561 | | | | 22,966 | | | | 20,104 | | | | 32,655 | |
| | 20,619 | | | | 23,830 | | | | 36,553 | | | | 33,929 | | | | 18,377 | | | | 8,450 | | | | 33,906 | |
| | 354,675 | | | | 1,184,433 | | | | 3,604,154 | | | | 1,037,642 | | | | 600,375 | | | | 14,549 | | | | 458,148 | |
| | 4,722 | | | | 7,910 | | | | 12,716 | | | | 8,472 | | | | 5,279 | | | | 3,905 | | | | 8,507 | |
| | 53,782 | | | | 132,039 | | | | 170,336 | | | | 109,072 | | | | 67,944 | | | | 5,724 | | | | 111,411 | |
| | 412 | | | | 11,450 | | | | 5,891 | | | | 1,236 | | | | 671 | | | | 485 | | | | 14,100 | |
| | 25,332 | | | | 42,781 | | | | 62,686 | | | | 38,256 | | | | 29,870 | | | | 26,372 | | | | 76,313 | |
| | 233,341 | | | | 499,636 | | | | 567,525 | | | | 428,007 | | | | 296,430 | | | | 29,971 | | | | 403,778 | |
| | 474 | | | | 76,005 | | | | 37,070 | | | | 6,015 | | | | 1,709 | | | | 625 | | | | 89,281 | |
| | 23,801 | | | | 46,474 | | | | 93,749 | | | | 51,711 | | | | 29,974 | | | | 6,917 | | | | 44,840 | |
| | 17,808 | | | | 22,030 | | | | 69,226 | | | | 35,249 | | | | 18,293 | | | | 11,045 | | | | 25,933 | |
| | 1,932,720 | | | | 5,104,220 | | | | 11,214,123 | | | | 4,853,655 | | | | 2,512,688 | | | | 658,886 | | | | 4,161,579 | |
| | | | | | | | | | | | | | | | | | | | | | | | | | | |
| | (6,818 | ) | | | – | | | | – | | | | (20 | ) | | | (223,497 | ) | | | (10,693 | ) | | | (41,844 | ) |
| | (656 | ) | | | (337 | ) | | | (290 | ) | | | (467 | ) | | | (731 | ) | | | (916 | ) | | | (562 | ) |
| | 1,925,246 | | | | 5,103,883 | | | | 11,213,833 | | | | 4,853,168 | | | | 2,288,460 | | | | 647,277 | | | | 4,119,173 | |
| | | | | | | | | | | | | | | | | | | | | | | | | | | |
| | 2,296,157 | | | | 51,788,925 | | | | 58,148,095 | | | | 32,375,832 | | | | 7,469,413 | | | | 1,474,305 | | | | 15,037,950 | |
| | | | | | | | | | | | | | | | | | | | | | | | | | | |
| | | | | | | | | | | | | | | | | | | | | | | | | | | |
| | 9,423,161 | | | | 4,933,530 | | | | 1,165,769 | | | | 8,408,567 | | | | 8,260,777 | | | | 3,955,281 | | | | 7,132,973 | |
| | – | | | | – | | | | – | | | | 218,258 | | | | – | | | | – | | | | – | |
| | 1,503 | | | | – | | | | – | | | | – | | | | 6,010 | | | | – | | | | 15,025 | |
| | 422,830 | | | | 298,828 | | | | – | | | | (1,915,276 | ) | | | (949,575 | ) | | | – | | | | (4,223,968 | ) |
| | (3,525 | ) | | | – | | | | – | | | | (9,555 | ) | | | – | | | | – | | | | – | |
| | 13,422 | | | | (228,955 | ) | | | – | | | | (19,234 | ) | | | 107,362 | | | | – | | | | 116,308 | |
| | | | | | | | | | | | | | | | | | | | | | | | | | | |
| | 3,716,997 | | | | 39,202,174 | | | | 80,759,589 | | | | 51,351,925 | | | | 6,866,298 | | | | (742,442 | ) | | | 12,674,514 | |
| | 106,178 | | | | – | | | | – | | | | (228,270 | ) | | | 767,343 | | | | – | | | | 651,696 | |
| | – | | | | – | | | | – | | | | – | | | | – | | | | – | | | | – | |
| | (188,447 | ) | | | (25,961 | ) | | | – | | | | (871,217 | ) | | | (220,077 | ) | | | – | | | | (243,900 | ) |
| | – | | | | – | | | | – | | | | – | | | | – | | | | – | | | | – | |
| | – | | | | – | | | | – | | | | 64 | | | | – | | | | – | | | | – | |
| | (124,267 | ) | | | (290,057 | ) | | | – | | | | (156,171 | ) | | | (994,124 | ) | | | – | | | | (1,076,968 | ) |
| | 13,367,852 | | | | 43,889,559 | | | | 81,925,358 | | | | 56,779,091 | | | | 13,844,014 | | | | 3,212,839 | | | | 15,045,680 | |
| | | | | | | | | | | | | | | | | | | | | | | | | | | |
| | $15,664,009 | | | | $95,678,484 | | | | $140,073,453 | | | | $89,154,923 | | | | $21,313,427 | | | | $4,687,144 | | | | $30,083,630 | |
The accompanying Notes to Financial Statements are an integral part of this schedule.
229
Thrivent Mutual Funds
Statement of Operations – continued
| | | | |
For the year ended October 31, 2012 | | Money Market
Fund | |
Investment Income | | | | |
Dividends | | | $61,002 | |
Taxable interest | | | 1,554,788 | |
Total Investment Income | | | 1,615,790 | |
| |
Expenses | | | | |
Adviser fees | | | 2,699,925 | |
Administrative service fees | | | 179,996 | |
Audit and legal fees | | | 26,799 | |
Custody fees | | | 24,832 | |
Distribution expenses Class A | | | 672,312 | |
Insurance expenses | | | 7,971 | |
Printing and postage expenses Class A | | | 329,566 | |
Printing and postage expenses Institutional Class | | | 552 | |
SEC and state registration expenses | | | 96,158 | |
Transfer agent fees Class A | | | 1,001,790 | |
Transfer agent fees Institutional Class | | | 1,722 | |
Trustees’ fees | | | 26,321 | |
Other expenses | | | 12,271 | |
Total Expenses Before Reimbursement | | | 5,080,215 | |
Less: | | | | |
Reimbursement from adviser | | | (3,462,992 | ) |
Custody earnings credit | | | (162 | ) |
Total Net Expenses | | | 1,617,061 | |
| | | | |
Net Investment Income/(Loss) | | | (1,271 | ) |
Realized and Unrealized Gains/(Losses) | | | | |
Net realized gains/(losses) on: | | | | |
Investments | | | 1,271 | |
Net Realized and Unrealized Gains/(Losses) | | | 1,271 | |
| | | | |
Net Increase/(Decrease) in Net Assets Resulting From Operations | | | $– | |
The accompanying Notes to Financial Statements are an integral part of this schedule.
230
THIS PAGE INTENTIONALLY LEFT BLANK
231
Thrivent Mutual Funds
Statement of Changes in Net Assets
| | | | | | | | | | | | | | | | |
| | | Aggressive Allocation Fund | | | Moderately Aggressive
Allocation Fund | |
For the periods ended | | 10/31/2012 | | | 10/31/2011 | | | 10/31/2012 | | | 10/31/2011 | |
Operations | | | | | | | | | | | | | | | | |
Net investment income/(loss) | | | $2,182,320 | | | | $3,844,417 | | | | $13,375,503 | | | | $18,503,872 | |
Net realized gains/(losses) | | | 10,268,719 | | | | 8,633,892 | | | | 23,411,598 | | | | 9,323,827 | |
Change in net unrealized appreciation/(depreciation) | | | 33,691,968 | | | | 7,219,682 | | | | 74,379,476 | | | | 6,835,313 | |
Net Change in Net Assets Resulting From Operations | | | 46,143,007 | | | | 19,697,991 | | | | 111,166,577 | | | | 34,663,012 | |
Distributions to Shareholders | | | | | | | | | | | | | | | | |
From net investment income Class A | | | (2,362,528 | ) | | | (2,192,280 | ) | | | (15,228,935 | ) | | | (15,308,506 | ) |
From net investment income Institutional Class | | | (687,226 | ) | | | (604,063 | ) | | | (1,430,963 | ) | | | (1,376,000 | ) |
Total From Net Investment Income | | | (3,049,754 | ) | | | (2,796,343 | ) | | | (16,659,898 | ) | | | (16,684,506 | ) |
From net realized gains Class A | | | – | | | | – | | | | – | | | | – | |
From net realized gains Institutional Class | | | – | | | | – | | | | – | | | | – | |
Total From Net Realized Gains | | | – | | | | – | | | | – | | | | – | |
Total Distributions to Shareholders | | | (3,049,754 | ) | | | (2,796,343 | ) | | | (16,659,898 | ) | | | (16,684,506 | ) |
Capital Stock Transactions | | | | | | | | | | | | | | | | |
| | | | |
Class A | | | | | | | | | | | | | | | | |
Sold | | | 55,000,663 | | | | 72,979,932 | | | | 140,815,765 | | | | 191,221,945 | |
Distributions reinvested | | | 2,358,027 | | | | 2,185,958 | | | | 15,171,749 | | | | 15,263,771 | |
Redeemed | | | (61,838,154 | ) | | | (62,704,921 | ) | | | (144,482,829 | ) | | | (139,703,885 | ) |
Total Class A Capital Stock Transactions | | | (4,479,464 | ) | | | 12,460,969 | | | | 11,504,685 | | | | 66,781,831 | |
| | | | |
Institutional Class | | | | | | | | | | | | | | | | |
Sold | | | 15,664,364 | | | | 21,133,637 | | | | 11,803,770 | | | | 17,258,665 | |
Distributions reinvested | | | 687,225 | | | | 604,063 | | | | 1,429,891 | | | | 1,373,640 | |
Redeemed | | | (21,638,126 | ) | | | (18,139,215 | ) | | | (14,598,328 | ) | | | (14,480,535 | ) |
Total Institutional Class Capital Stock Transactions | | | (5,286,537 | ) | | | 3,598,485 | | | | (1,364,667 | ) | | | 4,151,770 | |
Capital Stock Transactions | | | (9,766,001 | ) | | | 16,059,454 | | | | 10,140,018 | | | | 70,933,601 | |
| | | | | | | | | | | | | | | | |
Net Increase/(Decrease) in Net Assets | | | 33,327,252 | | | | 32,961,102 | | | | 104,646,697 | | | | 88,912,107 | |
Net Assets, Beginning of Period | | | 542,155,649 | | | | 509,194,547 | | | | 1,253,682,882 | | | | 1,164,770,775 | |
Net Assets, End of Period | | | $575,482,901 | | | | $542,155,649 | | | | $1,358,329,579 | | | | $1,253,682,882 | |
Accumulated Undistributed Net Investment Income/(Loss) | | | $132,214 | | | | $1,024,456 | | | | $6,761,916 | | | | $10,247,581 | |
| | | | |
Capital Stock Share Transactions | | | | | | | | | | | | | | | | |
| | | | |
Class A shares | | | | | | | | | | | | | | | | |
Sold | | | 4,938,608 | | | | 6,576,113 | | | | 12,578,142 | | | | 17,106,063 | |
Distributions reinvested | | | 225,003 | | | | 197,830 | | | | 1,439,445 | | | | 1,377,675 | |
Redeemed | | | (5,541,047 | ) | | | (5,649,501 | ) | | | (12,889,713 | ) | | | (12,574,154 | ) |
Total Class A shares | | | (377,436 | ) | | | 1,124,442 | | | | 1,127,874 | | | | 5,909,584 | |
| | | | |
Institutional Class shares | | | | | | | | | | | | | | | | |
Sold | | | 1,407,797 | | | | 1,914,739 | | | | 1,051,797 | | | | 1,554,504 | |
Distributions reinvested | | | 65,326 | | | | 54,420 | | | | 135,023 | | | | 123,529 | |
Redeemed | | | (1,916,314 | ) | | | (1,614,642 | ) | | | (1,289,591 | ) | | | (1,301,965 | ) |
Total Institutional Class shares | | | (443,191 | ) | | | 354,517 | | | | (102,771 | ) | | | 376,068 | |
The accompanying Notes to Financial Statements are an integral part of this schedule.
232
Thrivent Mutual Funds
Statement of Changes in Net Assets – continued
| | | | | | | | | | | | | | | | | | | | | | | | | | |
| Moderate Allocation Fund | | | Moderately Conservative
Allocation Fund | | | Partner
Emerging
Markets Equity
Fund | | | Partner Small Cap Growth Fund | |
| 10/31/2012 | | | 10/31/2011 | | | 10/31/2012 | | | 10/31/2011 | | | 10/31/2012(a) | | | 10/31/2012 | | | 10/31/2011 | |
| | | | | | | | | | | | | | | | | | | | | | | | | | |
| | $19,616,676 | | | | $25,654,551 | | | | $10,622,842 | | | | $12,911,591 | | | | $16,129 | | | | $(756,248 | ) | | | $(965,418 | ) |
| | 24,785,908 | | | | 8,843,588 | | | | 14,032,483 | | | | 2,226,686 | | | | 118,861 | | | | 9,426,892 | | | | 20,963,346 | |
| | 65,903,613 | | | | 1,594,497 | | | | 22,764,119 | | | | (2,245,062 | ) | | | 266,323 | | | | 1,426,438 | | | | (10,113,995 | ) |
| | 110,306,197 | | | | 36,092,636 | | | | 47,419,444 | | | | 12,893,215 | | | | 401,313 | | | | 10,097,082 | | | | 9,883,933 | |
| | | | | | | | | | | | | | | | | | | | | | | | | | |
| | (18,540,380) | | | | (23,758,811 | ) | | | (10,200,483 | ) | | | (12,198,274 | ) | | | – | | | | – | | | | – | |
| | (1,162,146) | | | | (1,328,738 | ) | | | (517,656 | ) | | | (564,122 | ) | | | – | | | | – | | | | – | |
| | (19,702,526) | | | | (25,087,549 | ) | | | (10,718,139 | ) | | | (12,762,396 | ) | | | – | | | | – | | | | – | |
| | (1,435,970) | | | | – | | | | (3,065,524 | ) | | | – | | | | – | | | | – | | | | – | |
| | (72,960) | | | | – | | | | (123,672 | ) | | | – | | | | – | | | | – | | | | – | |
| | (1,508,930) | | | | – | | | | (3,189,196 | ) | | | – | | | | – | | | | – | | | | – | |
| | (21,211,456) | | | | (25,087,549 | ) | | | (13,907,335 | ) | | | (12,762,396 | ) | | | – | | | | – | | | | – | |
| | | | | | | | | | | | | | | | | | | | | | | | | | |
| | | | | | |
| | | | | | | | | | | | | | | | | | | | | | | | | | |
| | 168,819,869 | | | | 216,818,090 | | | | 111,972,893 | | | | 131,811,352 | | | | 14,304,841 | | | | 1,789,864 | | | | 4,189,096 | |
| | 19,811,801 | | | | 23,524,722 | | | | 13,135,303 | | | | 12,059,387 | | | | – | | | | – | | | | – | |
| | (164,531,041) | | | | (162,036,497 | ) | | | (83,973,451 | ) | | | (88,008,474 | ) | | | (286,520 | ) | | | (5,750,627 | ) | | | (2,873,078 | ) |
| | 24,100,629 | | | | 78,306,315 | | | | 41,134,745 | | | | 55,862,265 | | | | 14,018,321 | | | | (3,960,763 | ) | | | 1,316,018 | |
| | | | | | |
| | | | | | | | | | | | | | | | | | | | | | | | | | |
| | 13,467,649 | | | | 19,051,720 | | | | 9,336,950 | | | | 8,556,023 | | | | 1,005,000 | | | | 3,788,480 | | | | 157,714 | |
| | 1,220,635 | | | | 1,315,981 | | | | 629,456 | | | | 560,593 | | | | – | | | | – | | | | – | |
| | (12,626,406) | | | | (11,598,838 | ) | | | (5,748,174 | ) | | | (8,385,190 | ) | | | (10,000 | ) | | | (2,057,440 | ) | | | (105,696 | ) |
| | 2,061,878 | | | | 8,768,863 | | | | 4,218,232 | | | | 731,426 | | | | 995,000 | | | | 1,731,040 | | | | 52,018 | |
| | 26,162,507 | | | | 87,075,178 | | | | 45,352,977 | | | | 56,593,691 | | | | 15,013,321 | | | | (2,229,723 | ) | | | 1,368,036 | |
| | | | | | | | | | | | | | | | | | | | | | | | | | |
| | 115,257,248 | | | | 98,080,265 | | | | 78,865,086 | | | | 56,724,510 | | | | 15,414,634 | | | | 7,867,359 | | | | 11,251,969 | |
| | 1,267,238,692 | | | | 1,169,158,427 | | | | 582,079,432 | | | | 525,354,922 | | | | – | | | | 124,405,793 | | | | 113,153,824 | |
| | $1,382,495,940 | | | | $1,267,238,692 | | | | $660,944,518 | | | | $582,079,432 | | | | $15,414,634 | | | | $132,273,152 | | | | $124,405,793 | |
| | $1,145,709 | | | | $1,286,371 | | | | $773,764 | | | | $770,688 | | | | $(395 | ) | | | $(638,357 | ) | | | $(15,220 | ) |
| | | | | | |
| | | | | | | | | | | | | | | | | | | | | | | | | | |
| | | | | | |
| | | | | | | | | | | | | | | | | | | | | | | | | | |
| | 15,129,103 | | | | 19,555,874 | | | | 10,178,876 | | | | 12,034,613 | | | | 1,429,301 | | | | 143,788 | | | | 336,293 | |
| | 1,803,430 | | | | 2,162,972 | | | | 1,212,494 | | | | 1,113,915 | | | | – | | | | – | | | | – | |
| | (14,768,857) | | | | (14,682,271 | ) | | | (7,639,901 | ) | | | (8,049,776 | ) | | | (27,494 | ) | | | (484,264 | ) | | | (230,042 | ) |
| | 2,163,676 | | | | 7,036,575 | | | | 3,751,469 | | | | 5,098,752 | | | | 1,401,807 | | | | (340,476 | ) | | | 106,251 | |
| | | | | | |
| | | | | | | | | | | | | | | | | | | | | | | | | | |
| | 1,208,900 | | | | 1,723,560 | | | | 847,571 | | | | 781,661 | | | | 100,487 | | | | 317,524 | | | | 12,216 | |
| | 110,637 | | | | 120,804 | | | | 57,811 | | | | 51,693 | | | | – | | | | – | | | | – | |
| | (1,129,919) | | | | (1,052,198 | ) | | | (522,458 | ) | | | (769,403 | ) | | | (964 | ) | | | (167,122 | ) | | | (9,118 | ) |
| | 189,618 | | | | 792,166 | | | | 382,924 | | | | 63,951 | | | | 99,523 | | | | 150,402 | | | | 3,098 | |
(a) | For the period from August 31, 2012 (inception) through October 31, 2012 |
The accompanying Notes to Financial Statements are an integral part of this schedule.
233
Thrivent Mutual Funds
Statement of Changes in Net Assets – continued
| | | | | | | | | | | | | | | | |
| | | Partner Small Cap Value Fund | | | Small Cap Stock Fund | |
For the periods ended | | 10/31/2012 | | | 10/31/2011 | | | 10/31/2012 | | | 10/31/2011 | |
Operations | | | | | | | | | | | | | | | | |
Net investment income/(loss) | | | $2,052,457 | | | | $1,515,649 | | | | $(521,135 | ) | | | $(1,715,934 | ) |
Net realized gains/(losses) | | | 3,862,388 | | | | 2,706,740 | | | | 18,086,422 | | | | 46,821,873 | |
Change in net unrealized appreciation/(depreciation) | | | 19,436,689 | | | | 11,809,912 | | | | 2,341,194 | | | | (22,873,337 | ) |
Net Change in Net Assets Resulting From Operations | | | 25,351,534 | | | | 16,032,301 | | | | 19,906,481 | | | | 22,232,602 | |
Distributions to Shareholders | | | | | | | | | | | | | | | | |
From net investment income Class A | | | (72,063 | ) | | | (460,512 | ) | | | – | | | | – | |
From net investment income Institutional Class | | | (937,645 | ) | | | (1,636,460 | ) | | | – | | | | – | |
Total From Net Investment Income | | | (1,009,708 | ) | | | (2,096,972 | ) | | | – | | | | – | |
From net realized gains Class A | | | (756,922 | ) | | | – | | | | – | | | | – | |
From net realized gains Institutional Class | | | (1,493,501 | ) | | | – | | | | – | | | | – | |
Total From Net Realized Gains | | | (2,250,423 | ) | | | – | | | | – | | | | – | |
Total Distributions to Shareholders | | | (3,260,131 | ) | | | (2,096,972 | ) | | | – | | | | – | |
Capital Stock Transactions | | | | | | | | | | | | | | | | |
| | | | |
Class A | | | | | | | | | | | | | | | | |
Sold | | | 5,763,763 | | | | 8,129,748 | | | | 7,602,804 | | | | 10,133,524 | |
Issued in connection with merger | | | – | | | | – | | | | – | | | | – | |
Distributions reinvested | | | 820,196 | | | | 455,500 | | | | – | | | | – | |
Redeemed | | | (11,122,924 | ) | | | (15,114,533 | ) | | | (32,732,800 | ) | | | (39,659,221 | ) |
Total Class A Capital Stock Transactions | | | (4,538,965 | ) | | | (6,529,285 | ) | | | (25,129,996 | ) | | | (29,525,697 | ) |
| | | | |
Institutional Class | | | | | | | | | | | | | | | | |
Sold | | | 14,023,979 | | | | 23,113,533 | | | | 724,705 | | | | 549,852 | |
Issued in connection with merger | | | – | | | | – | | | | – | | | | – | |
Distributions reinvested | | | 2,431,146 | | | | 1,636,460 | | | | – | | | | – | |
Redeemed | | | (25,795,278 | ) | | | (51,890,518 | ) | | | (2,085,560 | ) | | | (14,383,661 | ) |
Total Institutional Class Capital Stock Transactions | | | (9,340,153 | ) | | | (27,140,525 | ) | | | (1,360,855 | ) | | | (13,833,809 | ) |
Capital Stock Transactions | | | (13,879,118 | ) | | | (33,669,810 | ) | | | (26,490,851 | ) | | | (43,359,506 | ) |
| | | | | | | | | | | | | | | | |
Net Increase/(Decrease) in Net Assets | | | 8,212,285 | | | | (19,734,481 | ) | | | (6,584,370 | ) | | | (21,126,904 | ) |
Net Assets, Beginning of Period | | | 212,708,308 | | | | 232,442,789 | | | | 286,614,475 | | | | 307,741,379 | |
Net Assets, End of Period | | | $220,920,593 | | | | $212,708,308 | | | | $280,030,105 | | | | $286,614,475 | |
Accumulated Undistributed Net Investment Income/(Loss) | | | $760,871 | | | | $44,202 | | | | $(414,612 | ) | | | $(67,634 | ) |
| | | | |
Capital Stock Share Transactions | | | | | | | | | | | | | | | | |
| | | | |
Class A shares | | | | | | | | | | | | | | | | |
Sold | | | 375,943 | | | | 541,306 | | | | 542,602 | | | | 717,941 | |
Issued in connection with merger | | | – | | | | – | | | | – | | | | – | |
Distributions reinvested | | | 57,957 | | | | 29,752 | | | | – | | | | – | |
Redeemed | | | (721,876 | ) | | | (1,006,570 | ) | | | (2,327,430 | ) | | | (2,801,742 | ) |
Total Class A shares | | | (287,976 | ) | | | (435,512 | ) | | | (1,784,828 | ) | | | (2,083,801 | ) |
| | | | |
Institutional Class shares | | | | | | | | | | | | | | | | |
Sold | | | 870,204 | | | | 1,473,068 | | | | 46,917 | | | | 42,060 | |
Issued in connection with merger | | | – | | | | – | | | | – | | | | – | |
Distributions reinvested | | | 161,594 | | | | 102,279 | | | | – | | | | – | |
Redeemed | | | (1,604,851 | ) | | | (3,304,858 | ) | | | (134,487 | ) | | | (916,311 | ) |
Total Institutional Class shares | | | (573,053 | ) | | | (1,729,511 | ) | | | (87,570 | ) | | | (874,251 | ) |
The accompanying Notes to Financial Statements are an integral part of this schedule.
234
Thrivent Mutual Funds
Statement of Changes in Net Assets – continued
| | | | | | | | | | | | | | | | | | | | | | | | | | | | | | |
| Mid Cap Growth Fund | | | Partner Mid Cap Value Fund | | | Mid Cap Stock Fund | | | Partner Worldwide
Allocation Fund | |
| 10/31/2012 | | | 10/31/2011 | | | 10/31/2012 | | | 10/31/2011 | | | 10/31/2012 | | | 10/31/2011 | | | 10/31/2012 | | | 10/31/2011 | |
| | | | | | | | | | | | | | | | | | | | | | | | | | | | | | |
| | $(659,828 | ) | | | $(549,863 | ) | | | $1,422,035 | | | | $933,131 | | | | $428,880 | | | | $(154,328 | ) | | | $14,890,250 | | | | $6,817,813 | |
| | 27,994,939 | | | | 7,282,668 | | | | 3,228,750 | | | | 14,017,044 | | | | 60,824,551 | | | | 63,409,154 | | | | (550,430 | ) | | | 10,750,786 | |
| | (8,378,199 | ) | | | 20,162,608 | | | | 9,120,146 | | | | (10,124,703 | ) | | | (7,148,855 | ) | | | (10,647,308 | ) | | | 28,836,837 | | | | (24,609,284 | ) |
| | 18,956,912 | | | | 26,895,413 | | | | 13,770,931 | | | | 4,825,472 | | | | 54,104,576 | | | | 52,607,518 | | | | 43,176,657 | | | | (7,040,685 | ) |
| | | | | | | | | | | | | | | | | | | | | | | | | | | | | | |
| | – | | | | – | | | | (78,552 | ) | | | (61,484 | ) | | | – | | | | – | | | | (1,608,097 | ) | | | (427,163 | ) |
| | – | | | | – | | | | (808,554 | ) | | | (649,610 | ) | | | – | | | | (701,194 | ) | | | (5,022,998 | ) | | | (3,182,677 | ) |
| | – | | | | – | | | | (887,106 | ) | | | (711,094 | ) | | | – | | | | (701,194 | ) | | | (6,631,095 | ) | | | (3,609,840 | ) |
| | (1,969,401 | ) | | | – | | | | – | | | | – | | | | – | | | | – | | | | – | | | | – | |
| | (1,129,905 | ) | | | – | | | | – | | | | – | | | | – | | | | – | | | | – | | | | – | |
| | (3,099,306 | ) | | | – | | | | – | | | | – | | | | – | | | | – | | | | – | | | | – | |
| | (3,099,306 | ) | | | – | | | | (887,106 | ) | | | (711,094 | ) | | | – | | | | (701,194 | ) | | | (6,631,095 | ) | | | (3,609,840 | ) |
| | | | | | | | | | | | | | | | | | | | | | | | | | | | | | |
| | | | | | | |
| | | | | | | | | | | | | | | | | | | | | | | | | | | | | | |
| | 11,101,603 | | | | 16,969,696 | | | | 1,585,359 | | | | 2,949,752 | | | | 14,058,207 | | | | 20,133,595 | | | | 10,087,585 | | | | 10,960,979 | |
| | – | | | | – | | | | – | | | | – | | | | – | | | | – | | | | – | | | | 139,748,822 | |
| | 1,943,741 | | | | 6 | | | | 77,568 | | | | 60,710 | | | | (1,305 | ) | | | – | | | | 1,586,088 | | | | 423,858 | |
| | (31,100,462 | ) | | | (36,287,847 | ) | | | (1,903,254 | ) | | | (2,342,670 | ) | | | (72,900,438 | ) | | | (90,080,115 | ) | | | (39,668,003 | ) | | | (6,244,494 | ) |
| | (18,055,118 | ) | | | (19,318,145 | ) | | | (240,327 | ) | | | 667,792 | | | | (58,843,536 | ) | | | (69,946,520 | ) | | | (27,994,330 | ) | | | 144,889,165 | |
| | | | | | | |
| | | | | | | | | | | | | | | | | | | | | | | | | | | | | | |
| | 16,031,070 | | | | 32,340,395 | | | | 281,240 | | | | 1,494,093 | | | | 7,740,246 | | | | 10,124,335 | | | | 40,496,317 | | | | 27,438,370 | |
| | – | | | | – | | | | – | | | | – | | | | – | | | | – | | | | – | | | | 244,906,000 | |
| | 1,125,713 | | | | – | | | | 808,554 | | | | 649,610 | | | | – | | | | 697,344 | | | | 4,998,295 | | | | 3,178,915 | |
| | (26,025,910 | ) | | | (38,374,110 | ) | | | (1,361,626 | ) | | | (9,563,591 | ) | | | (19,446,120 | ) | | | (26,104,038 | ) | | | (7,701,083 | ) | | | (6,484,240 | ) |
| | (8,869,127 | ) | | | (6,033,715 | ) | | | (271,832 | ) | | | (7,419,888 | ) | | | (11,705,874 | ) | | | (15,282,359 | ) | | | 37,793,529 | | | | 269,039,045 | |
| | (26,924,245 | ) | | | (25,351,860 | ) | | | (512,159 | ) | | | (6,752,096 | ) | | | (70,549,410 | ) | | | (85,228,879 | ) | | | 9,799,199 | | | | 413,928,210 | |
| | | | | | | | | | | | | | | | | | | | | | | | | | | | | | |
| | (11,066,639 | ) | | | 1,543,553 | | | | 12,371,666 | | | | (2,637,718 | ) | | | (16,444,834 | ) | | | (33,322,555 | ) | | | 46,344,761 | | | | 403,277,685 | |
| | 390,776,044 | | | | 389,232,491 | | | | 118,139,682 | | | | 120,777,400 | | | | 754,388,195 | | | | 787,710,750 | | | | 657,823,148 | | | | 254,545,463 | |
| | $379,709,405 | | | | $390,776,044 | | | | $130,511,348 | | | | $118,139,682 | | | | $737,943,361 | | | | $754,388,195 | | | | $704,167,909 | | | | $657,823,148 | |
| | $(55,225 | ) | | | $(44,303 | ) | | | $1,002,117 | | | | $542,505 | | | | $(45,558 | ) | | | $(132,044 | ) | | | $14,470,995 | | | | $5,378,677 | |
| | | | | | | |
| | | | | | | | | | | | | | | | | | | | | | | | | | | | | | |
| | | | | | | |
| | | | | | | | | | | | | | | | | | | | | | | | | | | | | | |
| | 609,758 | | | | 932,901 | | | | 130,008 | | | | 242,135 | | | | 946,125 | | | | 1,334,701 | | | | 1,211,715 | | | | 1,242,781 | |
| | – | | | | – | | | | – | | | | – | | | | – | | | | – | | | | – | | | | 17,097,278 | |
| | 117,802 | | | | – | | | | 6,834 | | | | 4,993 | | | | (91 | ) | | | – | | | | 204,130 | | | | 47,518 | |
| | (1,710,760 | ) | | | (2,003,953 | ) | | | (157,207 | ) | | | (191,822 | ) | | | (4,886,042 | ) | | | (5,998,350 | ) | | | (4,808,833 | ) | | | (736,865 | ) |
| | (983,200 | ) | | | (1,071,052 | ) | | | (20,365 | ) | | | 55,306 | | | | (3,940,008 | ) | | | (4,663,649 | ) | | | (3,392,988 | ) | | | 17,650,712 | |
| | | | | | | |
| | | | | | | | | | | | | | | | | | | | | | | | | | | | | | |
| | 787,890 | | | | 1,612,274 | | | | 23,193 | | | | 122,097 | | | | 486,111 | | | | 638,012 | | | | 4,960,787 | | | | 3,016,555 | |
| | – | | | | – | | | | – | | | | – | | | | – | | | | – | | | | – | | | | 29,836,547 | |
| | 60,784 | | | | – | | | | 71,176 | | | | 53,378 | | | | – | | | | 43,126 | | | | 641,630 | | | | 355,549 | |
| | (1,270,759) | | | | (1,864,757 | ) | | | (111,417 | ) | | | (803,760 | ) | | | (1,207,389 | ) | | | (1,612,954 | ) | | | (916,945 | ) | | | (735,786 | ) |
| | (422,085) | | | | (252,483 | ) | | | (17,048 | ) | | | (628,285 | ) | | | (721,278 | ) | | | (931,816 | ) | | | 4,685,472 | | | | 32,472,865 | |
The accompanying Notes to Financial Statements are an integral part of this schedule.
235
Thrivent Mutual Funds
Statement of Changes in Net Assets – continued
| | | | | | | | | | | | | | | | |
| | | Large Cap Growth Fund | | | Large Cap Value Fund | |
For the periods ended | | 10/31/2012 | | | 10/31/2011 | | | 10/31/2012 | | | 10/31/2011 | |
Operations | | | | | | | | | | | | | | | | |
Net investment income/(loss) | | | $1,469,258 | | | | $12,809 | | | | $9,634,332 | | | | $8,556,157 | |
Net realized gains/(losses) | | | 25,811,938 | | | | 30,721,744 | | | | 34,221,609 | | | | 42,679,438 | |
Change in net unrealized appreciation/(depreciation) | | | 10,068,813 | | | | (21,305,656 | ) | | | 33,858,232 | | | | (31,565,657 | ) |
Net Change in Net Assets Resulting From Operations | | | 37,350,009 | | | | 9,428,897 | | | | 77,714,173 | | | | 19,669,938 | |
Distributions to Shareholders | | | | | | | | | | | | | | | | |
From net investment income Class A | | | – | | | | – | | | | (2,169,450 | ) | | | (1,579,142 | ) |
From net investment income Institutional Class | | | (13,488 | ) | | | – | | | | (6,836,912 | ) | | | (4,934,596 | ) |
Total From Net Investment Income | | | (13,488 | ) | | | – | | | | (9,006,362 | ) | | | (6,513,738 | ) |
From net realized gains Class A | | | – | | | | – | | | | – | | | | – | |
From net realized gains Institutional Class | | | – | | | | – | | | | – | | | | – | |
Total From Net Realized Gains | | | – | | | | – | | | | – | | | | – | |
Total Distributions to Shareholders | | | (13,488 | ) | | | – | | | | (9,006,362 | ) | | | (6,513,738 | ) |
Capital Stock Transactions | | | | | | | | | | | | | | | | |
| | | | |
Class A | | | | | | | | | | | | | | | | |
Sold | | | 12,362,061 | | | | 14,799,227 | | | | 8,777,138 | | | | 12,881,324 | |
Distributions reinvested | | | – | | | | 8 | | | | 2,110,852 | | | | 1,534,657 | |
Redeemed | | | (18,151,402 | ) | | | (21,654,591 | ) | | | (25,305,098 | ) | | | (31,046,601 | ) |
Total Class A Capital Stock Transactions | | | (5,789,341 | ) | | | (6,855,356 | ) | | | (14,417,108 | ) | | | (16,630,620 | ) |
| | | | |
Institutional Class | | | | | | | | | | | | | | | | |
Sold | | | 1,219,731 | | | | 3,338,841 | | | | 21,350,756 | | | | 40,269,765 | |
Distributions reinvested | | | 13,397 | | | | – | | | | 6,815,490 | | | | 4,917,644 | |
Redeemed | | | (4,911,445 | ) | | | (5,186,236 | ) | | | (28,853,618 | ) | | | (28,246,884 | ) |
Total Institutional Class Capital Stock Transactions | | | (3,678,317 | ) | | | (1,847,395 | ) | | | (687,372 | ) | | | 16,940,525 | |
Capital Stock Transactions | | | (9,467,658 | ) | | | (8,702,751 | ) | | | (15,104,480 | ) | | | 309,905 | |
| | | | | | | | | | | | | | | | |
Net Increase/(Decrease) in Net Assets | | | 27,868,863 | | | | 726,146 | | | | 53,603,331 | | | | 13,466,105 | |
Net Assets, Beginning of Period | | | 322,015,878 | | | | 321,289,732 | | | | 520,583,693 | | | | 507,117,588 | |
Net Assets, End of Period | | | $349,884,741 | | | | $322,015,878 | | | | $574,187,024 | | | | $520,583,693 | |
Accumulated Undistributed Net Investment Income/(Loss) | | | $1,394,354 | | | | $(45,123 | ) | | | $7,418,453 | | | | $6,757,974 | |
| | | | |
Capital Stock Share Transactions | | | | | | | | | | | | | | | | |
| | | | |
Class A shares | | | | | | | | | | | | | | | | |
Sold | | | 2,322,784 | | | | 2,915,107 | | | | 636,502 | | | | 950,048 | |
Distributions reinvested | | | – | | | | 2 | | | | 162,749 | | | | 113,342 | |
Redeemed | | | (3,459,864 | ) | | | (4,273,848 | ) | | | (1,842,703 | ) | | | (2,299,498 | ) |
Total Class A shares | | | (1,137,080 | ) | | | (1,358,739 | ) | | | (1,043,452 | ) | | | (1,236,108 | ) |
| | | | |
Institutional Class shares | | | | | | | | | | | | | | | | |
Sold | | | 227,497 | | | | 676,635 | | | | 1,544,526 | | | | 3,005,622 | |
Distributions reinvested | | | 2,612 | | | | – | | | | 523,865 | | | | 362,124 | |
Redeemed | | | (883,140 | ) | | | (941,925 | ) | | | (2,077,997 | ) | | | (2,116,224 | ) |
Total Institutional Class shares | | | (653,031 | ) | | | (265,290 | ) | | | (9,606 | ) | | | 1,251,522 | |
The accompanying Notes to Financial Statements are an integral part of this schedule.
236
Thrivent Mutual Funds
Statement of Changes in Net Assets – continued
| | | | | | | | | | | | | | | | | | | | | | | | | | | | | | |
| Large Cap Stock Fund | | | Balanced Fund | | | High Yield Fund | | | Municipal Bond Fund | |
| 10/31/2012 | | | 10/31/2011 | | | 10/31/2012 | | | 10/31/2011 | | | 10/31/2012 | | | 10/31/2011 | | | 10/31/2012 | | | 10/31/2011 | |
| | | | | | | | | | | | | | | | | | | | | | | | | | | | | | |
| | $13,814,421 | | | | $10,632,390 | | | | $2,296,157 | | | | $2,845,850 | | | | $51,788,925 | | | | $52,836,686 | | | | $58,148,095 | | | | $58,883,409 | |
| | 87,831,573 | | | | 132,357,805 | | | | 9,857,391 | | | | 16,742,890 | | | | 5,003,403 | | | | 25,795,339 | | | | 1,165,769 | | | | (460,915 | ) |
| | 72,574,809 | | | | (92,809,839 | ) | | | 3,510,461 | | | | (8,821,033 | ) | | | 38,886,156 | | | | (46,779,742 | ) | | | 80,759,589 | | | | (14,792,119 | ) |
| | 174,220,803 | | | | 50,180,356 | | | | 15,664,009 | | | | 10,767,707 | | | | 95,678,484 | | | | 31,852,283 | | | | 140,073,453 | | | | 43,630,375 | |
| | | | | | | | | | | | | | | | | | | | | | | | | | | | | | |
| | (9,327,896 | ) | | | (5,246,492 | ) | | | (1,466,431 | ) | | | (1,841,354 | ) | | | (32,753,321 | ) | | | (33,268,039 | ) | | | (54,235,793 | ) | | | (55,185,971 | ) |
| | (1,875,088 | ) | | | (1,549,194 | ) | | | (777,933 | ) | | | (962,616 | ) | | | (18,753,112 | ) | | | (19,523,402 | ) | | | (3,912,302 | ) | | | (4,017,796 | ) |
| | (11,202,984 | ) | | | (6,795,686 | ) | | | (2,244,364 | ) | | | (2,803,970 | ) | | | (51,506,433 | ) | | | (52,791,441 | ) | | | (58,148,095 | ) | | | (59,203,767 | ) |
| | – | | | | – | | | | (3,512,172 | ) | | | – | | | | – | | | | – | | | | – | | | | (2,455,320 | ) |
| | – | | | | – | | | | (1,317,538 | ) | | | – | | | | – | | | | – | | | | – | | | | (169,100 | ) |
| | – | | | | – | | | | (4,829,710 | ) | | | – | | | | – | | | | – | | | | – | | | | (2,624,420 | ) |
| | (11,202,984 | ) | | | (6,795,686 | ) | | | (7,074,074 | ) | | | (2,803,970 | ) | | | (51,506,433 | ) | | | (52,791,441 | ) | | | (58,148,095 | ) | | | (61,828,187 | ) |
| | | | | | | | | | | | | | | | | | | | | | | | | | | | | | |
| | | | | | | |
| | | | | | | | | | | | | | | | | | | | | | | | | | | | | | |
| | 31,996,054 | | | | 40,472,102 | | | | 7,056,563 | | | | 6,990,434 | | | | 76,377,949 | | | | 45,990,851 | | | | 186,898,390 | | | | 107,696,648 | |
| | 9,174,488 | | | | 5,160,525 | | | | 4,875,836 | | | | 1,794,656 | | | | 23,331,994 | | | | 23,674,359 | | | | 45,255,062 | | | | 48,031,722 | |
| | (198,360,312 | ) | | | (241,048,632 | ) | | | (18,182,481 | ) | | | (22,410,197 | ) | | | (53,561,522 | ) | | | (58,752,341 | ) | | | (116,539,725 | ) | | | (183,703,992 | ) |
| | (157,189,770 | ) | | | (195,416,005 | ) | | | (6,250,082 | ) | | | (13,625,107 | ) | | | 46,148,421 | | | | 10,912,869 | | | | 115,613,727 | | | | (27,975,622 | ) |
| | | | | | | |
| | | | | | | | | | | | | | | | | | | | | | | | | | | | | | |
| | 5,003,328 | | | | 3,428,263 | | | | 382,949 | | | | 751,956 | | | | 46,507,732 | | | | 46,710,070 | | | | 37,413,504 | | | | 31,844,349 | |
| | 1,862,179 | | | | 1,540,355 | | | | 2,091,209 | | | | 960,765 | | | | 15,061,146 | | | | 13,717,817 | | | | 3,569,918 | | | | 3,815,536 | |
| | (23,667,338 | ) | | | (14,984,926 | ) | | | (7,621,983 | ) | | | (7,766,371 | ) | | | (34,843,781 | ) | | | (64,343,015 | ) | | | (30,129,328 | ) | | | (43,170,718 | ) |
| | (16,801,831 | ) | | | (10,016,308 | ) | | | (5,147,825 | ) | | | (6,053,650 | ) | | | 26,725,097 | | | | (3,915,128 | ) | | | 10,854,094 | | | | (7,510,833 | ) |
| | (173,991,601 | ) | | | (205,432,313 | ) | | | (11,397,907 | ) | | | (19,678,757 | ) | | | 72,873,518 | | | | 6,997,741 | | | | 126,467,821 | | | | (35,486,455 | ) |
| | | | | | | | | | | | | | | | | | | | | | | | | | | | | | |
| | (10,973,782 | ) | | | (162,047,643 | ) | | | (2,807,972 | ) | | | (11,715,020 | ) | | | 117,045,569 | | | | (13,941,417 | ) | | | 208,393,179 | | | | (53,684,267 | ) |
| | 1,563,740,555 | | | | 1,725,788,198 | | | | 193,719,631 | | | | 205,434,651 | | | | 688,693,764 | | | | 702,635,181 | | | | 1,426,106,599 | | | | 1,479,790,866 | |
| | $1,552,766,773 | | | | $1,563,740,555 | | | | $190,911,659 | | | | $193,719,631 | | | | $805,739,333 | | | | $688,693,764 | | | | $1,634,499,778 | | | | $1,426,106,599 | |
| | $10,294,234 | | | | $7,816,114 | | | | $(76,130 | ) | | | $(6,748 | ) | | | $(40,750 | ) | | | $(216,746 | ) | | | $(62,577 | ) | | | $(62,577 | ) |
| | | | | | | |
| | | | | | | | | | | | | | | | | | | | | | | | | | | | | | |
| | | | | | | |
| | | | | | | | | | | | | | | | | | | | | | | | | | | | | | |
| | 1,411,090 | | | | 1,825,037 | | | | 573,850 | | | | 561,207 | | | | 15,686,279 | | | | 9,538,503 | | | | 15,932,923 | | | | 9,743,582 | |
| | 436,257 | | | | 232,142 | | | | 420,251 | | | | 146,440 | | | | 4,806,324 | | | | 4,916,656 | | | | 3,853,694 | | | | 4,360,334 | |
| | (8,794,470 | ) | | | (10,868,388 | ) | | | (1,475,757 | ) | | | (1,811,312 | ) | | | (11,082,025 | ) | | | (12,170,187 | ) | | | (9,949,435 | ) | | | (16,755,034 | ) |
| | (6,947,123 | ) | | | (8,811,209 | ) | | | (481,656 | ) | | | (1,103,665 | ) | | | 9,410,578 | | | | 2,284,972 | | | | 9,837,182 | | | | (2,651,118 | ) |
| | | | | | | |
| | | | | | | | | | | | | | | | | | | | | | | | | | | | | | |
| | 221,930 | | | | 156,349 | | | | 31,574 | | | | 59,780 | | | | 9,550,400 | | | | 9,649,659 | | | | 3,199,745 | | | | 2,902,159 | |
| | 88,213 | | | | 69,012 | | | | 179,362 | | | | 78,556 | | | | 3,101,077 | | | | 2,850,368 | | | | 303,961 | | | | 346,539 | |
| | (1,087,231 | ) | | | (680,359 | ) | | | (616,929 | ) | | | (628,129 | ) | | | (7,234,550 | ) | | | (13,219,326 | ) | | | (2,566,745 | ) | | | (3,935,093 | ) |
| | (777,088 | ) | | | (454,998 | ) | | | (405,993 | ) | | | (489,793 | ) | | | 5,416,927 | | | | (719,299 | ) | | | 936,961 | | | | (686,395 | ) |
The accompanying Notes to Financial Statements are an integral part of this schedule.
237
Thrivent Mutual Funds
Statement of Changes in Net Assets – continued
| | | | | | | | | | | | | | | | |
| | | Income Fund | | | Core Bond Fund | |
For the periods ended | | 10/31/2012 | | | 10/31/2011 | | | 10/31/2012 | | | 10/31/2011 | |
Operations | | | | | | | | | | | | | | | | |
Net investment income/(loss) | | | $32,375,832 | | | | $35,757,270 | | | | $7,469,413 | | | | $10,786,777 | |
Net realized gains/(losses) | | | 6,682,760 | | | | 18,894,238 | | | | 7,424,574 | | | | 3,417,932 | |
Change in net unrealized appreciation/(depreciation) | | | 50,096,331 | | | | (21,818,727 | ) | | | 6,419,440 | | | | (1,127,654 | ) |
Net Change in Net Assets Resulting From Operations | | | 89,154,923 | | | | 32,832,781 | | | | 21,313,427 | | | | 13,077,055 | |
Distributions to Shareholders | | | | | | | | | | | | | | | | |
From net investment income Class A | | | (15,152,431 | ) | | | (17,401,619 | ) | | | (5,834,738 | ) | | | (8,686,567 | ) |
From net investment income Institutional Class | | | (16,888,569 | ) | | | (18,309,267 | ) | | | (1,334,789 | ) | | | (2,154,708 | ) |
Total From Net Investment Income | | | (32,041,000 | ) | | | (35,710,886 | ) | | | (7,169,527 | ) | | | (10,841,275 | ) |
From net realized gains Class A | | | – | | | | – | | | | – | | | | – | |
From net realized gains Institutional Class | | | – | | | | – | | | | – | | | | – | |
Total From Net Realized Gains | | | – | | | | – | | | | – | | | | – | |
Total Distributions to Shareholders | | | (32,041,000 | ) | | | (35,710,886 | ) | | | (7,169,527 | ) | | | (10,841,275 | ) |
Capital Stock Transactions | | | | | | | | | | | | | | | | |
| | | | |
Class A | | | | | | | | | | | | | | | | |
Sold | | | 54,132,265 | | | | 35,013,016 | | | | 28,424,145 | | | | 20,476,289 | |
Distributions reinvested | | | 12,828,346 | | | | 14,639,654 | | | | 5,243,953 | | | | 7,807,323 | |
Redeemed | | | (45,329,117 | ) | | | (55,211,906 | ) | | | (32,556,065 | ) | | | (38,752,826 | ) |
Total Class A Capital Stock Transactions | | | 21,631,494 | | | | (5,559,236 | ) | | | 1,112,033 | | | | (10,469,214 | ) |
| | | | |
Institutional Class | | | | | | | | | | | | | | | | |
Sold | | | 60,999,457 | | | | 33,301,247 | | | | 19,240,418 | | | | 23,090,523 | |
Distributions reinvested | | | 16,641,954 | | | | 18,023,904 | | | | 1,251,147 | | | | 2,054,740 | |
Redeemed | | | (51,287,785 | ) | | | (19,683,227 | ) | | | (42,211,397 | ) | | | (19,265,677 | ) |
Total Institutional Class Capital Stock Transactions | | | 26,353,626 | | | | 31,641,924 | | | | (21,719,832 | ) | | | 5,879,586 | |
Capital Stock Transactions | | | 47,985,120 | | | | 26,082,688 | | | | (20,607,799 | ) | | | (4,589,628 | ) |
| | | | | | | | | | | | | | | | |
Net Increase/(Decrease) in Net Assets | | | 105,099,043 | | | | 23,204,583 | | | | (6,463,899 | ) | | | (2,353,848 | ) |
Net Assets, Beginning of Period | | | 799,026,353 | | | | 775,821,770 | | | | 292,737,745 | | | | 295,091,593 | |
Net Assets, End of Period | | | $904,125,396 | | | | $799,026,353 | | | | $286,273,846 | | | | $292,737,745 | |
Accumulated Undistributed Net Investment Income/(Loss) | | | $(125,835 | ) | | | $(11,177 | ) | | | $(57,231 | ) | | | $(30,817 | ) |
| | | | |
Capital Stock Share Transactions | | | | | | | | | | | | | | | | |
| | | | |
Class A shares | | | | | | | | | | | | | | | | |
Sold | | | 5,985,753 | | | | 4,010,830 | | | | 2,728,733 | | | | 2,030,938 | |
Distributions reinvested | | | 1,421,324 | | | | 1,675,223 | | | | 504,491 | | | | 774,028 | |
Redeemed | | | (5,042,251 | ) | | | (6,333,359 | ) | | | (3,134,100 | ) | | | (3,849,331 | ) |
Total Class A shares | | | 2,364,826 | | | | (647,306 | ) | | | 99,124 | | | | (1,044,365 | ) |
| | | | |
Institutional Class shares | | | | | | | | | | | | | | | | |
Sold | | | 6,782,001 | | | | 3,814,841 | | | | 1,857,729 | | | | 2,297,871 | |
Distributions reinvested | | | 1,844,971 | | | | 2,064,056 | | | | 120,709 | | | | 203,610 | |
Redeemed | | | (5,748,876 | ) | | | (2,258,819 | ) | | | (4,061,141 | ) | | | (1,915,101 | ) |
Total Institutional Class shares | | | 2,878,096 | | | | 3,620,078 | | | | (2,082,703 | ) | | | 586,380 | |
The accompanying Notes to Financial Statements are an integral part of this schedule.
238
Thrivent Mutual Funds
Statement of Changes in Net Assets – continued
| | | | | | | | | | | | | | | | | | | | | | |
| Government Bond Fund | | | Limited Maturity Bond Fund | | | Money Market Fund | |
| 10/31/2012 | | | 10/31/2011 | | | 10/31/2012 | | | 10/31/2011 | | | 10/31/2012 | | | 10/31/2011 | |
| | | | | | | | | | | | | | | | | | | | | | |
| | $1,474,305 | | | | $2,216,659 | | | | $15,037,950 | | | | $20,871,928 | | | | $(1,271 | ) | | | $(19,413 | ) |
| | 3,955,281 | | | | 2,407,322 | | | | 3,040,338 | | | | (1,834,753 | ) | | | 1,271 | | | | 19,413 | |
| | (742,442 | ) | | | (466,415 | ) | | | 12,005,342 | | | | (10,418,675 | ) | | | – | | | | – | |
| | 4,687,144 | | | | 4,157,566 | | | | 30,083,630 | | | | 8,618,500 | | | | – | | | | – | |
| | | | | | | | | | | | | | | | | | | | | | |
| | (119,305 | ) | | | (95,619 | ) | | | (5,306,573 | ) | | | (7,000,789 | ) | | | – | | | | – | |
| | (1,355,000 | ) | | | (2,131,632 | ) | | | (9,221,678 | ) | | | (13,990,772 | ) | | | – | | | | – | |
| | (1,474,305 | ) | | | (2,227,251 | ) | | | (14,528,251 | ) | | | (20,991,561 | ) | | | – | | | | – | |
| | (211,872 | ) | | | (40,966 | ) | | | – | | | | – | | | | – | | | | – | |
| | (2,209,175 | ) | | | (805,421 | ) | | | – | | | | – | | | | – | | | | – | |
| | (2,421,047 | ) | | | (846,387 | ) | | | – | | | | – | | | | – | | | | – | |
| | (3,895,352 | ) | | | (3,073,638 | ) | | | (14,528,251 | ) | | | (20,991,561 | ) | | | – | | | | – | |
| | | | | | | | | | | | | | | | | | | | | | |
| | | | | |
| | | | | | | | | | | | | | | | | | | | | | |
| | 10,297,214 | | | | 4,812,940 | | | | 206,880,185 | | | | 218,047,690 | | | | 505,037,332 | | | | 564,068,703 | |
| | 322,703 | | | | 132,849 | | | | 5,128,349 | | | | 6,742,670 | | | | – | | | | – | |
| | (3,483,749 | ) | | | (3,596,543 | ) | | | (155,039,162 | ) | | | (148,163,749 | ) | | | (599,026,272 | ) | | | (693,165,743 | ) |
| | 7,136,168 | | | | 1,349,246 | | | | 56,969,372 | | | | 76,626,611 | | | | (93,988,940 | ) | | | (129,097,040 | ) |
| | | | | |
| | | | | | | | | | | | | | | | | | | | | | |
| | 12,162,989 | | | | 11,761,893 | | | | 83,075,844 | | | | 120,601,099 | | | | 6,176,252 | | | | 1,788,060 | |
| | 3,540,589 | | | | 2,924,411 | | | | 9,168,683 | | | | 13,918,831 | | | | – | | | | – | |
| | (12,928,987 | ) | | | (26,757,219 | ) | | | (213,356,680 | ) | | | (72,722,440 | ) | | | (5,211,686 | ) | | | (4,732,296 | ) |
| | 2,774,591 | | | | (12,070,915 | ) | | | (121,112,153 | ) | | | 61,797,490 | | | | 964,566 | | | | (2,944,236 | ) |
| | 9,910,759 | | | | (10,721,669 | ) | | | (64,142,781 | ) | | | 138,424,101 | | | | (93,024,374 | ) | | | (132,041,276 | ) |
| | | | | | | | | | | | | | | | | | | | | | |
| | 10,702,551 | | | | (9,637,741 | ) | | | (48,587,402 | ) | | | 126,051,040 | | | | (93,024,374 | ) | | | (132,041,276 | ) |
| | 101,875,218 | | | | 111,512,959 | | | | 929,458,096 | | | | 803,407,056 | | | | 599,447,269 | | | | 731,488,545 | |
| | $112,577,769 | | | | $101,875,218 | | | | $880,870,694 | | | | $929,458,096 | | | | $506,422,895 | | | | $599,447,269 | |
| | $67,870 | | | | $35,528 | | | | $33,418 | | | | $(292,465 | ) | | | $– | | | | $– | |
| | | | | |
| | | | | | | | | | | | | | | | | | | | | | |
| | | | | |
| | | | | | | | | | | | | | | | | | | | | | |
| | 965,428 | | | | 459,087 | | | | 16,553,075 | | | | 17,446,301 | | | | 505,037,329 | | | | 564,068,701 | |
| | 30,503 | | | | 12,946 | | | | 410,636 | | | | 539,808 | | | | – | | | | – | |
| | (327,092 | ) | | | (349,438 | ) | | | (12,417,077 | ) | | | (11,865,052 | ) | | | (599,026,270 | ) | | | (693,165,741 | ) |
| | 668,839 | | | | 122,595 | | | | 4,546,634 | | | | 6,121,057 | | | | (93,988,941 | ) | | | (129,097,040 | ) |
| | | | | |
| | | | | | | | | | | | | | | | | | | | | | |
| | 1,135,462 | | | | 1,142,619 | | | | 6,650,362 | | | | 9,652,673 | | | | 6,176,252 | | | | 1,788,061 | |
| | 334,592 | | | | 284,986 | | | | 734,882 | | | | 1,114,575 | | | | – | | | | – | |
| | (1,205,506 | ) | | | (2,576,237 | ) | | | (17,074,059 | ) | | | (5,827,458 | ) | | | (5,211,686 | ) | | | (4,732,296 | ) |
| | 264,548 | | | | (1,148,632 | ) | | | (9,688,815 | ) | | | 4,939,790 | | | | 964,566 | | | | (2,944,235 | ) |
The accompanying Notes to Financial Statements are an integral part of this schedule.
239
Thrivent Mutual Funds
Notes to Financial Statements
October 31, 2012
(1) ORGANIZATION
Thrivent Mutual Funds (the “Trust”) was organized as a Massachusetts Business Trust on March 10, 1987 and is registered as an open-end management investment company under the Investment Company Act of 1940 (the “1940 Act”). The Trust is divided into twenty-six separate series (each, a “Fund” and, collectively, the “Funds”), each with its own investment objective and policies. The Trust currently consists of four allocation funds, thirteen equity funds, two hybrid funds, six fixed-income funds and one money market fund. Thrivent Natural Resources Fund, Thrivent Equity Income Plus Fund and Thrivent Diversified Income Plus Fund have a fiscal year end on a calendar-year basis and are presented under a separate shareholder report.
(A) Fund Mergers – At a meeting held on September 9, 2011, shareholders of Thrivent Partner International Stock Fund (the “Target Fund”) approved the merger of the Target Fund into Thrivent Partner Worldwide Allocation Fund (the “Acquiring Fund”). The merger occurred at the close of business on September 16, 2011. Acquisition of the assets and liabilities of the Target Fund by the Acquiring Fund was followed by the distribution of the Acquiring Fund shares to the Target Fund shareholders. The shares issued of the Acquiring Fund are disclosed in the Statement of Changes in Net Assets.
The merger was accomplished by a tax free exchange as detailed below:
| | | | | | |
Fund | | Description | | Net Assets as of September 16, 2011 | |
Partner Worldwide Allocation | | Acquiring Fund | | | $264,018,467 | |
Partner International Stock | | Target Fund | | | $384,586,546 | |
Partner Worldwide Allocation | | After Acquisition | | | $648,605,013 | |
As of September 16, 2011, the net assets of the Target Fund were comprised of the following:
| | | | | | | | | | | | |
Unrealized
Depreciation | | Undistributed
Net Investment
Income | | | Accumulated
Net Realized
Losses | | | Capital Stock | |
$(19,746,473) | | $ | (447,637 | ) | | $ | (129,811,787 | ) | | $ | 534,592,443 | |
The Target Fund’s capital loss carryovers are carried over to the Acquiring Fund. The amounts and applicable limitations are disclosed in Note (4) Tax Information.
(B) Share Classes – As of October 31, 2012, the Trust includes two classes of shares: Class A and Institutional Class. The classes of shares differ principally in their respective distribution expenses and other class-specific expenses and arrangements. Class A shares have a 0.25% annual 12b-1 fee and a maximum front-end sales load of 5.50% for equity funds and 4.50% for fixed-income funds, although some of the fixed-income funds have reduced 12b-1 fees and either a reduced or no front-end sales load. Institutional Class shares are offered at net asset value and have no annual 12b-1 fees. The share classes have identical rights to earnings, assets and voting privileges, except for class-specific expenses and exclusive rights to vote on matters affecting only individual classes. All 26 Funds of the Trust offer Class A and Institutional Class shares.
(C) Other – Under the Trust’s organizational documents, its officers and trustees are indemnified against certain liabilities arising out of the performance of their duties to the Trust. In addition, in the normal course of business, the Trust enters into contracts with vendors and others that provide general damage clauses. The Trust’s maximum exposure under these contracts is unknown, as this would involve future claims that may be made against the Trust. However, based on experience, the Trust expects the risk of loss to be remote.
(2) SIGNIFICANT ACCOUNTING POLICIES
(A) Valuation of Investments – Securities traded on U.S. or foreign securities exchanges or included in a national market system are valued at the official closing price at the close of each business day unless otherwise stated below. Over-the-counter securities and listed securities for which no price is readily available are valued at the current bid price considered best to represent the value at that time. Swap agreements are valued at the fair value of the contract as furnished by an independent pricing service. Security prices are based on quotes that are obtained from an independent pricing service approved by the Trust’s Board of Trustees (“Board”). The pricing service, in determining values of fixed-income securities, takes into consideration such factors as current quotations by broker/dealers, coupon, maturity, quality, type of issue, trading characteristics, and other yield and risk factors it deems relevant in determining valuations. Securities which cannot be valued by the approved pricing service are valued using valuations obtained from dealers that make markets in the securities. Exchange-listed options and futures contracts are valued at the last quoted sales price. Investments in mutual funds are valued at the net asset value at the close of each business day. Short-term securities are valued at amortized cost (which approximates market value) to the extent it is not materially different than market value. Securities held by Money Market Fund are valued on the basis of amortized cost (which approximates market value), whereby a portfolio security is valued at its cost initially and thereafter valued to reflect a constant amortization to maturity of any discount or premium. Money Market Fund and the Trust’s investment adviser, Thrivent Asset Management, LLC (“Thrivent Asset Mgt.” or the “Adviser”), follow procedures designed to help maintain a constant net asset value of $1.00 per share.
The Board has delegated responsibility for daily valuation to the Adviser. The Adviser has formed a Portfolio
240
Thrivent Mutual Funds
Notes to Financial Statements
October 31, 2012
Compliance and Valuation Committee (“Committee”) that is responsible for overseeing the Fund valuation policies in accordance with Valuation Policies and Procedures. The Committee meets on a monthly and on an as-needed basis to review price challenges, price overrides, stale prices, shadow prices, manual prices, money market pricing, international fair valuation, and other securities requiring fair valuation.
The Committee monitors for significant events occurring prior to the close of trading on the New York Stock Exchange that could have a material impact on the value of any securities that are held by the Funds. Examples of such events include trading halts, national news/events, and issuer-specific developments. If the Committee decides that such events warrant using fair value estimates, the Committee will take such events into consideration in determining the fair value of such securities. If market quotations or prices are not readily available or determined to be unreliable, the securities will be valued at fair value as determined in good faith pursuant to procedures adopted by the Board.
Financial Accounting Standards Board (FASB) guidelines require increased fair value disclosure intended to improve the consistency and comparability of fair value measurements used in financial reporting. The guidelines define fair value, establish a framework for measuring fair value in U.S. Generally Accepted Accounting Principles (“GAAP”) and expand disclosures about fair value requirements. The various inputs used to determine the fair value of the Funds’ investments are summarized in three broad levels: Level 1 includes quoted prices in active markets for identical securities, typically included in this level are U.S. equity securities, futures and options; Level 2 includes other significant observable inputs such as quoted prices for similar securities, interest rates, prepayment speeds and credit risk, typically included in this level are fixed income securities, international securities, swaps and forward contracts; and Level 3 includes significant unobservable inputs such as the Adviser’s own assumptions and broker evaluations in determining the fair value of investments. Of the Level 3 securities, those for which market values were not readily available or were deemed unreliable were fair valued as determined in good faith under procedures established by the Board. As of October 31, 2012, the following funds held these types of Level 3 securities:
| | | | |
Fund | | Number of
Securities | | Percent of Fund’s
Net Assets |
Partner Worldwide Allocation | | 4 | | 0.26% |
High Yield | | 1 | | 0.00% |
Valuation of International Securities – Because many foreign markets close before the U.S. markets, events may occur between the close of the foreign markets and the close of the U.S. markets that could have a material impact on the valuation of foreign securities. The Funds, under the supervision of the Board, evaluate the impacts of these events and may adjust the valuation of foreign securities to reflect fair value as of the close of the U.S. markets. The Board has authorized the Adviser to make fair valuation determinations pursuant to policies approved by the Board.
(B) Foreign Currency Translation – The accounting records of each Fund are maintained in U.S. dollars. Securities and other assets and liabilities that are denominated in foreign currencies are translated into U.S. dollars at the daily closing rates of exchange.
Foreign currency amounts related to the purchase or sale of securities and income and expenses are translated at the exchange rate on the transaction date. Net realized and unrealized currency gains and losses are recorded from sales of foreign currency, exchange gains or losses between the trade date and settlement date on securities transactions, and other translation gains or losses on dividends, interest income and foreign withholding taxes. The Funds do not separately report the effect of changes in foreign exchange rates from changes in market prices on securities held. Such changes are included in net realized and unrealized gain or loss from investments in the Statement of Operations. For federal income tax purposes, the Funds treat the effect of changes in foreign exchange rates arising from actual foreign currency transactions and the changes in foreign exchange rates between the trade date and settlement date as ordinary income.
(C) Foreign Currency Forward Contracts – In connection with purchases and sales of securities denominated in foreign currencies all Funds, except Money Market Fund, may enter into foreign currency forward contracts. Additionally, the Funds may enter into such contracts to hedge certain other foreign-currency-denominated investments. These contracts are recorded at value and the related realized and unrealized foreign exchange gains and losses are included in the Statement of Operations. In the event that counterparties fail to settle these forward contracts, the Funds could be exposed to foreign currency fluctuations. Foreign currency contracts are valued daily and unrealized appreciation or depreciation is recorded daily as the difference between the contract exchange rate and the closing forward rate applied to the face amount of the contract. A realized gain or loss is recorded at the time a forward contract is closed. These contracts are over-the-counter and the Fund is exposed to counterparty risk equal to the discounted net amount of payments to the Fund. This risk is partially mitigated by the Fund’s collateral posting requirements.
(D) Foreign Denominated Investments – Foreign denominated assets and currency contracts may involve more risks than domestic transactions including currency risk, political and economic risk, regulatory risk, and market risk. Certain Funds may also invest in securities of companies located in emerging markets. Future economic or political developments could adversely affect the liquidity or value, or both, of such securities.
241
Thrivent Mutual Funds
Notes to Financial Statements
October 31, 2012
(E) Federal Income Taxes – No provision has been made for income taxes because each Fund’s policy is to qualify as a regulated investment company under the Internal Revenue Code and distribute substantially all investment company taxable income and net capital gain on a timely basis. It is also the intention of each Fund to distribute an amount sufficient to avoid imposition of any federal excise tax. The Funds, accordingly, anticipate paying no federal taxes and no federal tax provision was recorded. Each Fund is treated as a separate taxable entity for federal income tax purposes. Certain Funds may utilize earnings and profits distributed to shareholders on the redemption of shares as part of the dividends paid deduction.
Foreign Income Taxes – Certain Funds are subject to foreign income taxes imposed by certain countries in which they invest. Withholding taxes on foreign dividends have been provided for in accordance with the applicable country’s tax rules and rates. These amounts are shown as foreign dividend tax withholding on the Statement of Operations. The Funds pay tax on foreign capital gains, where applicable.
GAAP requires management of the Funds (i.e., the Adviser) to make additional tax disclosures with respect to the tax effects of certain income tax positions, whether those positions were taken on previously filed tax returns or are expected to be taken on future returns. These positions must meet a “more likely than not” standard that, based on the technical merits of the position, would have a greater than 50 percent likelihood of being sustained upon examination. In evaluating whether a tax position has met the more-likely-than-not recognition threshold, the Adviser must presume that the position will be examined by the appropriate taxing authority that has full knowledge of all relevant information.
The Adviser analyzed all open tax years, as defined by the statute of limitations, for all major jurisdictions. Open tax years are those that are open for examination by taxing authorities. Major jurisdictions for the Funds include U.S. Federal, Minnesota, Wisconsin, and Massachusetts as well as certain foreign countries. As of October 31, 2012, open U.S. Federal, Minnesota, Wisconsin and Massachusetts tax years include the tax years ended October 31, 2009 through 2012. Additionally, as of October 31, 2012, the tax year ended October 31, 2008 is open for Wisconsin. The Funds have no examinations in progress and none are expected at this time.
As of October 31, 2012, the Adviser has reviewed all open tax years and major jurisdictions and concluded that there is no effect to the Funds’ tax liability, financial position or results of operations. There is no tax liability resulting from unrecognized tax benefits related to uncertain income tax positions taken or expected to be taken in future tax returns. The Funds are also not aware of any tax positions for which it is reasonably possible that the total amounts of unrecognized tax benefits will significantly change in the next 12 months.
(F) Expenses and Income – Estimated expenses are accrued daily. The Funds are charged for those expenses that are directly attributable to them. Expenses that are not directly attributable to a Fund are allocated among all appropriate Funds in proportion to their respective net assets, number of shareholder accounts or other reasonable basis. Net investment income, expenses which are not class-specific, and realized and unrealized gains and losses are allocated directly to each class based upon the relative net asset value of outstanding shares.
Interest income is accrued daily and is determined on the basis of interest or discount earned on all debt securities, including accretion of market discount and original issue discount and amortization of premium. Paydown gains and losses on mortgage- and asset-backed securities are recorded as components of interest income. Dividend income is recorded on the ex-dividend date.
For certain securities, including real estate investment trusts, the Trust records distributions received in excess of income as a reduction of cost of investments and/or realized gain. Such amounts are based on estimates if actual amounts are not available. Actual amounts of income, realized gain and return of capital may differ from the estimated amounts. The Trust adjusts the estimated amounts of the components of distributions as adjustments to investment income, unrealized appreciation/depreciation and realized gain/loss on investments as necessary, once the issuers provide information about the actual composition of the distributions.
(G) Custody Earnings Credit – The Funds have a deposit arrangement with the custodian whereby interest earned on uninvested cash balances is used to pay a portion of custodian fees. This deposit arrangement is an alternative to overnight investments. Earnings credits are shown as a reduction of total expenses on the Statement of Operations.
(H) Distributions to Shareholders – Dividend and capital gain distributions are recorded on the ex-dividend date. With the exception of Money Market Fund, net realized gains from securities transactions, if any, are paid at least annually after the close of the fiscal year.
| | | | | | | | |
Fund | | Dividends
Declared | | | Dividends
Paid | |
Aggressive Allocation | | | Annually | | | | Annually | |
Moderately Aggressive Allocation | | | Annually | | | | Annually | |
Moderate Allocation | | | Quarterly | | | | Quarterly | |
Moderately Conservative Allocation | | | Quarterly | | | | Quarterly | |
Partner Emerging Markets Equity | | | Annually | | | | Annually | |
Partner Small Cap Growth | | | Annually | | | | Annually | |
Partner Small Cap Value | | | Annually | | | | Annually | |
Small Cap Stock | | | Annually | | | | Annually | |
242
Thrivent Mutual Funds
Notes to Financial Statements
October 31, 2012
| | | | | | | | |
Fund | | Dividends
Declared | | | Dividends
Paid | |
Mid Cap Growth | | | Annually | | | | Annually | |
Partner Mid Cap Value | | | Annually | | | | Annually | |
Mid Cap Stock | | | Annually | | | | Annually | |
Partner Worldwide Allocation | | | Annually | | | | Annually | |
Large Cap Growth | | | Annually | | | | Annually | |
Large Cap Value | | | Annually | | | | Annually | |
Large Cap Stock | | | Annually | | | | Annually | |
Balanced | | | Quarterly | | | | Quarterly | |
High Yield | | | Daily | | | | Monthly | |
Municipal Bond | | | Daily | | | | Monthly | |
Income | | | Daily | | | | Monthly | |
Core Bond | | | Daily | | | | Monthly | |
Government Bond | | | Daily | | | | Monthly | |
Limited Maturity Bond | | | Daily | | | | Monthly | |
Money Market | | | Daily | | | | Monthly | |
* | Dividends are net of any short-term realized gains or losses on the sale of securities. |
(I) Options – All Funds, with the exception of Money Market Fund, may buy put and call options and write put and covered call options. The Funds intend to use such derivative instruments as hedges to facilitate buying or selling securities or to provide protection against adverse movements in security prices or interest rates. The Funds may also enter into options contracts to protect against adverse foreign exchange rate fluctuations. Option contracts are valued daily and unrealized appreciation or depreciation is recorded. A Fund will realize a gain or loss upon expiration or closing of the option transaction. When an option is exercised, the proceeds upon sale for a written call option or the cost of a security for purchased put and call options is adjusted by the amount of premium received or paid.
Buying put options tends to decrease a Fund’s exposure to the underlying security while buying call options tends to increase a Fund’s exposure to the underlying security. The risk associated with purchasing put and call options is limited to the premium paid. There is no significant counterparty risk on exchange-traded options as the exchange guarantees the contract against default. Writing put options tends to increase a Fund’s exposure to the underlying security while writing call options tends to decrease a Fund’s exposure to the underlying security. The writer of an option has no control over whether the underlying security may be bought or sold, and therefore bears the market risk of an unfavorable change in the price of the underlying security. The counterparty risk for purchased options arises when a Fund has purchased an option, exercises that option, and the counterparty doesn’t buy from the Fund or sell to the Fund the underlying asset as required. In the case where a Fund has written an option, the Fund doesn’t have counterparty risk. Counterparty risk on purchased over-the-counter options is partially mitigated by the Fund’s collateral posting requirements. As the option increases in value to the Fund, the Fund receives collateral from the counterparty. Risks of loss may exceed amounts recognized on the Statement of Assets and Liabilities.
(J) Futures Contracts – Certain Funds may use futures contracts to manage the exposure to interest rate and market or currency fluctuations. Gains or losses on futures contracts can offset changes in the yield of securities. When a futures contract is opened, cash or other investments equal to the required “initial margin deposit” are held on deposit with and pledged to the broker. Additional securities held by the Funds may be earmarked to cover open futures contracts. The futures contract’s daily change in value (“variation margin”) is either paid to or received from the broker, and is recorded as an unrealized gain or loss. When the contract is closed, realized gain or loss is recorded equal to the difference between the value of the contract when opened and the value of the contract when closed. Futures contracts involve, to varying degrees, risk of loss in excess of the variation margin disclosed in the Statement of Assets and Liabilities. Exchange-traded futures have no significant counterparty risk as the exchange guarantees the contracts against default.
(K) Swap Agreements – Certain Funds enter into swap transactions, which involve swapping one or more investment characteristics of a security or a basket of securities with another party. Such transactions include market risk, risk of default by the other party to the transaction, risk of imperfect correlation and manager risk and may involve commissions or other costs. Swap transactions generally do not involve delivery of securities, other underlying assets or principal. Accordingly, the risk of loss with respect to swap transactions is generally limited to the net amount of payments that the Fund is contractually obligated to make, or in the case of the counterparty defaulting, the net amount of payments that the Fund is contractually entitled to receive. Risks of loss may exceed amounts recognized on the Statement of Assets and Liabilities. If there is a default by the counterparty, the Fund may have contractual remedies pursuant to the agreements related to the transaction. The contracts are valued daily and unrealized appreciation or depreciation is recorded. Swap agreements are valued at fair value of the contract as provided by an independent pricing service. The pricing service takes into account such factors as swap curves, default probabilities, recent trades, recovery rates and other factors it deems relevant in determining valuations. The Fund accrues for the periodic payment and amortizes upfront payments, if any, on swap agreements on a daily basis with the net amount recorded as realized gains or losses on the Statement of Operations. Receipts and payments received or made as a result of a credit event or termination of the contract are also recognized as realized gains or losses on the Statement of Operations. Collateral, in the form of cash or securities, may be required to be held with the Fund’s custodian, or a third party, in connection with these agreements. These swap agreements are over-the-counter and the Fund is exposed to counterparty risk, which is the discounted net amount of payments owed to the Fund. This risk is partially mitigated by the Fund’s collateral posting requirements. As the swap increases in value to the Fund, the Fund receives collateral from the counterparty.
243
Thrivent Mutual Funds
Notes to Financial Statements
October 31, 2012
Credit Default Swaps – A credit default swap is a swap agreement between two parties to exchange the credit risk of a particular issuer, basket of securities or reference entity. In a credit default swap transaction, a buyer pays periodic fees in return for payment by the seller which is contingent upon an adverse credit event occurring in the underlying issuer or reference entity. The seller collects periodic fees from the buyer and profits if the credit of the underlying issuer or reference entity remains stable or improves while the swap is outstanding, but the seller in a credit default swap contract would be required to pay the amount of credit loss, determined as specified in the agreement, to the buyer in the event of an adverse credit event in the reference entity. A buyer of a credit default swap is said to buy protection whereas a seller of a credit default swap is said to sell protection. The Funds may be either the protection seller or the protection buyer.
Certain Funds enter into credit default derivative contracts directly through credit default swaps (CDS) or through credit default swap indices (CDX Indices). CDX indices are static pools of equally weighted credit default swaps referencing corporate bonds and/or loans designed to provide diversified credit exposure to these asset classes. Funds sell default protection and assume long-risk positions in individual credits or indices. Index positions are entered into to gain exposure to the corporate bond and/or loan markets in a cost-efficient and diversified structure. In the event that a position defaults, by going into bankruptcy and failing to pay interest or principal on borrowed money, within any given CDX Index held, the maximum potential amount of future payments required would be equal to the pro-rata share of that position within the index based on the notional amount of the index. In the event of a default under a CDS contract the maximum potential amount of future payments would be the notional amount. For CDS, the default events could be bankruptcy and failing to pay interest or principal on borrowed money or a restructuring. A restructuring is a change in the underlying obligations which would include reduction in interest or principal, maturity extension and subordination to other obligations. Refer to the credit default swap tables located within the Funds’ Schedules of Investments for additional information as of October 31, 2012.
(L) Mortgage Dollar Roll Transactions – Certain Funds enter into dollar roll transactions on securities issued or to be issued by the Government National Mortgage Association, Federal National Mortgage Association and Federal Home Loan Mortgage Corporation, in which the Funds sell mortgage securities and simultaneously agree to repurchase similar (same type and coupon) securities at a later date at an agreed upon price. The Funds must maintain liquid securities having a value not less than the repurchase price (including accrued interest) for such dollar rolls. The value of the securities that the Funds are required to purchase may decline below the agreed upon repurchase price of those securities.
During the period between the sale and repurchase, the Funds forgo principal and interest paid on the mortgage securities sold. The Funds are compensated from negotiated fees paid by brokers offered as an inducement to the Funds to “roll over” their purchase commitments, thus enhancing the yield. Mortgage dollar rolls may be renewed with a new purchase and repurchase price and a cash settlement made on settlement date without physical delivery of the securities subject to the contract. The fees received are recognized over the roll period and are included in Income from mortgage dollar rolls in the Statement of Operations.
(M) Securities Lending – The Trust has entered into a Securities Lending Agreement (the “Agreement”) with Deutsche Bank AG (“Deutsche”). The Agreement authorizes Deutsche to lend securities to authorized borrowers on behalf of the Funds. Pursuant to the Agreement, all loaned securities are initially collateralized by cash equal to at least 102% of the value of the loaned securities. All cash collateral received is invested in Thrivent Financial Securities Lending Trust. The Funds receive dividends and interest that would have been earned on the securities loaned while simultaneously seeking to earn income on the investment of cash collateral. Amounts earned on investments in Thrivent Financial Securities Lending Trust, net of rebates, fees paid to Deutsche for services provided and any other securities lending expenses, are included in Income from securities loaned on the Statement of Operations. By investing any cash collateral it receives in these transactions, a Fund could realize additional gains or losses. If the borrower fails to return the securities or the invested collateral has declined in value, the Fund could lose money.
During the year ended October 31, 2012, all Funds except Partner Emerging Markets Equity Fund, Municipal Bond Fund, Core Bond Fund, Government Bond Fund and Money Market Fund had securities on loan. As of October 31, 2012, the value of securities on loan is as follows:
| | | | |
Fund | | Securities
on Loan | |
Moderately Aggressive Allocation | | $ | 1,269,042 | |
Moderate Allocation | | | 985,528 | |
Moderately Conservative Allocation | | | 1,962,682 | |
Partner Small Cap Growth | | | 14,423,606 | |
Partner Small Cap Value | | | 4,500,531 | |
Small Cap Stock | | | 18,265,716 | |
Mid Cap Growth | | | 11,821,468 | |
Partner Mid Cap Value | | | 3,784,250 | |
Mid Cap Stock | | | 65,350,655 | |
Partner Worldwide Allocation | | | 4,181,017 | |
Large Cap Value | | | 7,365,788 | |
Large Cap Stock | | | 9,997,340 | |
Balanced | | | 1,043,256 | |
High Yield | | | 62,154,486 | |
244
Thrivent Mutual Funds
Notes to Financial Statements
October 31, 2012
| | | | |
Fund | | Securities
on Loan | |
Income | | | 7,103,965 | |
Limited Maturity Bond | | | 6,809,425 | |
(N) When-Issued and Delayed Delivery Transactions – Certain Funds may purchase or sell securities on a when-issued or delayed delivery basis. These transactions involve a commitment by a Fund to purchase or sell securities for a predetermined price or yield, with payment and delivery taking place beyond the customary settlement period. When delayed delivery purchases are outstanding, a Fund will designate liquid assets in an amount sufficient to meet the purchase price. When purchasing a security on a delayed delivery basis, a Fund assumes the rights and risks of ownership of the security, including the risk of price and yield fluctuations, and takes such fluctuations into account when determining its net asset value. A Fund may dispose of a delayed delivery transaction after it is entered into, and may sell when-issued securities before they are delivered, which may result in a capital gain or loss. When a Fund has sold a security on a delayed delivery basis, a Fund does not participate in future gains and losses with respect to the security.
(O) Treasury Inflation Protected Securities – Certain Funds may invest in treasury inflation protected securities (TIPS). These securities are fixed income securities whose principal value is periodically adjusted to the rate of inflation. The coupon interest rate is generally fixed at issuance. Interest is paid based on the principal value, which is adjusted for inflation. Any increase in the principal amount will be included as taxable interest in the Statement of Operations and received in cash upon maturity or sale of the security.
(P) Repurchase Agreements – Each Fund may engage in repurchase agreement transactions in pursuit of its investment objective. A repurchase agreement consists of a purchase and a simultaneous agreement to resell an investment for later delivery at an agreed upon price and rate of interest. The Fund uses a third-party custodian to maintain the collateral. If the original seller of a security subject to a repurchase agreement fails to repurchase the security at the agreed upon time, the Fund could incur a loss due to a drop in the value of the security during the time it takes the Fund to either sell the security or take action to enforce the original seller’s agreement to repurchase the security. Also, if a defaulting original seller filed for bankruptcy or became insolvent, disposition of such security might be delayed by pending legal action. The Fund may only enter into repurchase agreements with banks and other recognized financial institutions such as broker/dealers that are found by the Adviser or subadviser to be creditworthy. During the year ended October 31, 2012, none of the Funds engaged in these types of investments.
(Q) Equity-Linked Structured Securities – Certain funds may invest in equity-linked structured notes. Equity-linked structured notes are debt securities which combine the characteristics of common stock and the sale of an option. The return component is based upon the performance of a single equity security, a basket of equity securities, or an equity index and the sale of an option. There is no guaranteed return of principal with these securities. The appreciation potential of these securities may be limited by a maximum payment or call right and can be influenced by many unpredictable factors. In addition to the performance of the equity, the nature and credit of the issuer may also impact return.
(R) Credit Risk – The Funds may be susceptible to credit risk to the extent an issuer or counterparty defaults on its payment obligation. The Funds’ policy is to monitor the creditworthiness of issuers and counterparties. Interest receivable on defaulted securities is monitored for ability to collect payments in default and is adjusted accordingly.
(S) Accounting Estimates – The preparation of financial statements in conformity with GAAP requires management to make estimates and assumptions that affect the reported amounts of assets and liabilities and disclosure of contingent assets and liabilities at the date of the financial statements and the reported amounts of income and expenses during the reporting period. Actual results could differ from those estimates.
(T) Loan Commitments – Certain Funds may enter into loan commitments, which generally have interest rates which are reset daily, monthly, quarterly or semi-annually by reference to a base lending rate, plus a premium. These base rates are primarily the London-Interbank Offered Rate (“LIBOR”), and secondarily the prime rate offered by one or more major United States banks (the “Prime Rate”) and the certificate of deposit (“CD”) rate or other base lending rates used by commercial lenders. Loan commitments often require prepayments from excess cash flows or allow the borrower to repay at its election. The rate at which the borrower repays cannot be predicted with accuracy. Therefore, the remaining maturity may be considerably less than the stated maturity shown in the Schedule of Investments.
All or a portion of these loan commitments may be unfunded. A Fund is obligated to fund these commitments at the borrower’s discretion. Therefore, the Fund must have funds sufficient to cover its contractual obligation. These unfunded loan commitments, which are marked to market daily, are presented in the Schedule of Investments.
(U) Loss Contingencies – Thrivent High Yield Fund and Thrivent Income Fund are defendants in an adversary action filed on July 31, 2009 by the Official Committee of Unsecured Creditors of Motors Liquidation Company, formerly known as General Motors Corporation (GM),
245
Thrivent Mutual Funds
Notes to Financial Statements
October 31, 2012
against prior and current holders of term loan debt of GM. The suit seeks to determine whether GM’s term loan facility was secured at the time it entered bankruptcy. High Yield Fund at one time held term loans in an original principal amount of at least $4,723,994 and, if the plaintiffs are successful, it is reasonably possible that the Fund will be required to make payments in some amount. This loss contingency has not been accrued as a liability because the amount of potential damages and the likelihood of loss cannot be reasonably estimated. Thrivent Income Fund is named as a defendant in this action, but we do not expect that the Fund’s assets will be subject to a loss contingency.
(V) Litigation – Awards from class action litigation are recorded as a reduction of cost if the Fund still owns the applicable securities on the payment date. If the Fund no longer owns the applicable securities, the proceeds are recorded as realized gains.
(W) Amortization of Offering Costs – The offering costs referenced in the Statement of Operations for Partner Emerging Markets Equity Fund are costs incurred by the Fund in order to establish it for sale. These costs generally include costs related to registering the shares for sale with the various states as well as any legal costs associated with registering the Fund. These costs are amortized over a period of 12 months from inception.
(X) Recent Accounting Pronouncements – In December 2011, FASB released Accounting Standards Update 2011-11 (ASU 2011-11), Balance Sheet (Topic 210), Disclosures about Offsetting Assets and Liabilities. This updated standard is a result of collaboration between FASB and International Accounting Standards Board (IASB) to enhance current disclosures. The amendments include new disclosure requirements of gross and net information about instruments and transactions, such as derivatives, eligible for offset in the Statement of Assets and Liabilities or subject to a master netting arrangement or similar agreement. The disclosures required by ASU 2011-11 will be effective any reporting period (annual or interim) beginning on or after January 1, 2013. Management is currently evaluating the application of ASU 2011-11 on the Fund’s financial statements.
(Y) Other – For financial statement purposes, investment security transactions are accounted for on the trade date. Realized gains and losses from investment transactions are determined on a specific cost identification basis, which is the same basis used for federal income tax purposes.
(3) FEES AND COMPENSATION PAID TO AFFILIATES
(A) Investment Advisory Fees – The Trust has entered into an Investment Advisory Agreement with Thrivent Asset Mgt. Under the Investment Advisory Agreement, each of the Funds pays a fee for investment advisory services. The fees are accrued daily and paid monthly.
The four Asset Allocation Funds – Aggressive Allocation Fund, Moderately Aggressive Allocation Fund, Moderate Allocation Fund and Moderately Conservative Allocation Fund – pay investment advisory fees for asset allocation services. In addition, for investments (other than underlying Thrivent Funds) held directly by the Asset Allocation Funds, each Asset Allocation Fund will pay an additional advisory fee. The annual rates of fees as a percentage of average daily net assets under the Investment Advisory Agreement are as follows:
| | | | | | | | | | | | |
Fund (M – Millions) | | $0 to
$500M | | | Over
$500 to
$2,000M | | | Over
$2,000M | |
Aggressive Allocation | | | 0.150 | % | | | 0.125 | % | | | 0.100 | % |
Aggressive Allocation – Direct Holdings | | | 0.600 | % | | | 0.600 | % | | | 0.600 | % |
Moderately Aggressive Allocation | | | 0.150 | % | | | 0.125 | % | | | 0.100 | % |
Moderately Aggressive Allocation – Direct Holdings | | | 0.550 | % | | | 0.550 | % | | | 0.550 | % |
Moderate Allocation | | | 0.150 | % | | | 0.125 | % | | | 0.100 | % |
Moderate Allocation – Direct Holdings | | | 0.500 | % | | | 0.500 | % | | | 0.500 | % |
Moderately Conservative Allocation | | | 0.150 | % | | | 0.125 | % | | | 0.100 | % |
Moderately Conservative Allocation – Direct Holdings | | | 0.450 | % | | | 0.450 | % | | | 0.450 | % |
246
Thrivent Mutual Funds
Notes to Financial Statements
October 31, 2012
For all other Funds, the annual rates of fees as a percent of average daily net assets under the Investment Advisory Agreement were as follows:
| | | | | | | | | | | | | | | | | | | | | | | | | | | | | | | | | | | | | | | | | | | | |
Fund (M – Millions) | | $0 to
$50M | | | Over
$50 to
$100M | | | Over
$100 to
$200M | | | Over
$200 to
$250M | | | Over
$250 to
$500M | | | Over
$500 to
$750M | | | Over
$750 to
$1,000M | | | Over
$1,000 to
$2,000M | | | Over
$2,000 to
$2,500M | | | Over
$2,500 to
$5,000M | | | Over
$5,000M | |
Aggressive Allocation | | | 0.150 | % | | | 0.150 | % | | | 0.150 | % | | | 0.150 | % | | | 0.150 | % | | | 0.125 | % | | | 0.125 | % | | | 0.125 | % | | | 0.100 | % | | | 0.100 | % | | | 0.100 | % |
Moderately Aggressive Allocation | | | 0.150 | % | | | 0.150 | % | | | 0.150 | % | | | 0.150 | % | | | 0.150 | % | | | 0.125 | % | | | 0.125 | % | | | 0.125 | % | | | 0.100 | % | | | 0.100 | % | | | 0.100 | % |
Moderate Allocation | | | 0.150 | % | | | 0.150 | % | | | 0.150 | % | | | 0.150 | % | | | 0.150 | % | | | 0.125 | % | | | 0.125 | % | | | 0.125 | % | | | 0.100 | % | | | 0.100 | % | | | 0.100 | % |
Moderately Conservative Allocation | | | 0.150 | % | | | 0.150 | % | | | 0.150 | % | | | 0.150 | % | | | 0.150 | % | | | 0.125 | % | | | 0.125 | % | | | 0.125 | % | | | 0.100 | % | | | 0.100 | % | | | 0.100 | % |
Partner Emerging Markets Equity | | | 1.200 | % | | | 1.070 | % | | | 1.070 | % | | | 1.070 | % | | | 1.070 | % | | | 1.070 | % | | | 1.070 | % | | | 1.070 | % | | | 1.070 | % | | | 1.070 | % | | | 1.070 | % |
Partner Small Cap Growth | | | 0.900 | % | | | 0.900 | % | | | 0.900 | % | | | 0.900 | % | | | 0.900 | % | | | 0.800 | % | | | 0.800 | % | | | 0.800 | % | | | 0.800 | % | | | 0.800 | % | | | 0.800 | % |
Partner Small Cap Value | | | 0.700 | % | | | 0.700 | % | | | 0.700 | % | | | 0.700 | % | | | 0.700 | % | | | 0.700 | % | | | 0.700 | % | | | 0.700 | % | | | 0.700 | % | | | 0.700 | % | | | 0.700 | % |
Small Cap Stock | | | 0.700 | % | | | 0.700 | % | | | 0.700 | % | | | 0.650 | % | | | 0.650 | % | | | 0.650 | % | | | 0.650 | % | | | 0.600 | % | | | 0.600 | % | | | 0.550 | % | | | 0.525 | % |
Mid Cap Growth | | | 0.450 | % | | | 0.450 | % | | | 0.400 | % | | | 0.400 | % | | | 0.350 | % | | | 0.300 | % | | | 0.300 | % | | | 0.250 | % | | | 0.250 | % | | | 0.250 | % | | | 0.250 | % |
Partner Mid Cap Value | | | 0.750 | % | | | 0.750 | % | | | 0.750 | % | | | 0.700 | % | | | 0.700 | % | | | 0.700 | % | | | 0.700 | % | | | 0.700 | % | | | 0.700 | % | | | 0.700 | % | | | 0.700 | % |
Mid Cap Stock | | | 0.700 | % | | | 0.700 | % | | | 0.700 | % | | | 0.650 | % | | | 0.650 | % | | | 0.650 | % | | | 0.650 | % | | | 0.600 | % | | | 0.600 | % | | | 0.550 | % | | | 0.525 | % |
Partner Worldwide Allocation | | | 0.900 | % | | | 0.900 | % | | | 0.900 | % | | | 0.900 | % | | | 0.850 | % | | | 0.850 | % | | | 0.850 | % | | | 0.800 | % | | | 0.800 | % | | | 0.800 | % | | | 0.800 | % |
Large Cap Growth | | | 0.750 | % | | | 0.750 | % | | | 0.750 | % | | | 0.750 | % | | | 0.750 | % | | | 0.700 | % | | | 0.700 | % | | | 0.650 | % | | | 0.650 | % | | | 0.600 | % | | | 0.575 | % |
Large Cap Value | | | 0.450 | % | | | 0.450 | % | | | 0.450 | % | | | 0.450 | % | | | 0.450 | % | | | 0.450 | % | | | 0.450 | % | | | 0.450 | % | | | 0.450 | % | | | 0.450 | % | | | 0.450 | % |
Large Cap Stock | | | 0.650 | % | | | 0.650 | % | | | 0.650 | % | | | 0.650 | % | | | 0.650 | % | | | 0.575 | % | | | 0.575 | % | | | 0.500 | % | | | 0.475 | % | | | 0.450 | % | | | 0.425 | % |
Balanced | | | 0.550 | % | | | 0.550 | % | | | 0.550 | % | | | 0.550 | % | | | 0.550 | % | | | 0.500 | % | | | 0.500 | % | | | 0.475 | % | | | 0.475 | % | | | 0.450 | % | | | 0.425 | % |
High Yield | | | 0.400 | % | | | 0.400 | % | | | 0.400 | % | | | 0.400 | % | | | 0.400 | % | | | 0.350 | % | | | 0.350 | % | | | 0.300 | % | | | 0.300 | % | | | 0.300 | % | | | 0.300 | % |
Municipal Bond | | | 0.450 | % | | | 0.450 | % | | | 0.450 | % | | | 0.450 | % | | | 0.450 | % | | | 0.400 | % | | | 0.400 | % | | | 0.350 | % | | | 0.350 | % | | | 0.325 | % | | | 0.300 | % |
Income | | | 0.350 | % | | | 0.350 | % | | | 0.350 | % | | | 0.350 | % | | | 0.350 | % | | | 0.325 | % | | | 0.325 | % | | | 0.300 | % | | | 0.300 | % | | | 0.300 | % | | | 0.300 | % |
Core Bond | | | 0.450 | % | | | 0.450 | % | | | 0.450 | % | | | 0.450 | % | | | 0.450 | % | | | 0.400 | % | | | 0.400 | % | | | 0.375 | % | | | 0.375 | % | | | 0.350 | % | | | 0.325 | % |
Government Bond | | | 0.400 | % | | | 0.400 | % | | | 0.400 | % | | | 0.400 | % | | | 0.400 | % | | | 0.350 | % | | | 0.350 | % | | | 0.350 | % | | | 0.350 | % | | | 0.350 | % | | | 0.350 | % |
Limited Maturity Bond | | | 0.300 | % | | | 0.300 | % | | | 0.300 | % | | | 0.300 | % | | | 0.300 | % | | | 0.275 | % | | | 0.275 | % | | | 0.250 | % | | | 0.250 | % | | | 0.250 | % | | | 0.250 | % |
Money Market | | | 0.500 | % | | | 0.500 | % | | | 0.500 | % | | | 0.500 | % | | | 0.500 | % | | | 0.400 | % | | | 0.350 | % | | | 0.325 | % | | | 0.325 | % | | | 0.300 | % | | | 0.275 | % |
(B) Sub-Adviser Fees – The following subadviser fees are charged as part of the total investment advisory fees stated in the table above. The subadvisory fees are borne directly by the Adviser and do not increase the overall fees paid by the Fund.
Partner Emerging Markets Equity Fund
The Adviser has entered into subadvisory agreements with DuPont Capital Management Corporation (“DuPont Capital”) for the performance of subadvisory services. The fee payable for DuPont Capital is equal to 0.72% of the first $50 million of average daily net assets and 0.68% for assets over $50 million. Thrivent Partner Worldwide Allocation Fund and Thrivent Partner Worldwide Allocation Portfolio are included in determining breakpoints for the assets managed by DuPont Capital.
Partner Small Cap Growth Fund
The Adviser has entered into a subadvisory agreement with Turner Investments, L.P. (“Turner”) for performance of subadvisory services. For assets that are defined as microcap assets, the fee payable is equal to 0.80% of the average daily net assets in that microcap portion. For all other assets, the fee payable is equal to 0.65% of the average daily net assets when the entire portfolio assets (including the microcap portion) are no greater than $100 million, 0.60% of the average daily net assets when the entire portfolio assets are greater than $100 million but no greater than $350 million, and 0.575% of the average daily net assets when the entire portfolio assets are greater than $350 million. Thrivent Partner Small Cap Growth Portfolio (including the microcap portion of that Portfolio) is included in determining breakpoints for the assets managed by Turner.
Partner Small Cap Value Fund
The Adviser has entered into a subadvisory agreement with T. Rowe Price Associates, Inc. for performance of subadvisory services. The fee payable is equal to 0.60% of average daily net assets.
Partner Mid Cap Value Fund
The Adviser has entered into a subadvisory agreement with Goldman Sachs Asset Management, L.P. (“GSAM”) for the performance of subadvisory services. The fee payable is equal to 0.50% of the first $200 million of average daily net assets and 0.45% for assets over $200 million. Thrivent Partner Mid Cap Value Portfolio is included in determining breakpoints for the assets managed by GSAM.
Partner Worldwide Allocation Fund
The Adviser has entered into subadvisory agreements with Mercator Asset Management, LP (“Mercator”), Principal
247
Thrivent Mutual Funds
Notes to Financial Statements
October 31, 2012
Global Investors, LLC (“Principal”), Aberdeen Asset Managers Limited (formerly Aberdeen Asset Management Investment Services Limited) (“Aberdeen”), DuPont Capital, Victory Capital Management, Inc. (“Victory”) and GSAM for the performance of subadvisory services.
The fee payable for Mercator is equal to 0.75% of the first $25 million of average daily net assets, 0.60% of the next $25 million, 0.55% of the next $25 million, 0.50% of the next $225 million, 0.40% of the next $200 million and 0.20% of average daily net assets over $500 million. Thrivent Partner Worldwide Allocation Portfolio is included in determining breakpoints for the assets managed by Mercator.
The fee payable for Principal is equal to 0.35% of the first $500 million of average daily net assets, 0.30% of the next $500 million and 0.25% of average daily net assets over $1 billion. Thrivent Partner Worldwide Allocation Portfolio and Thrivent Partner Emerging Markets Equity Portfolio is included in determining breakpoints for the assets managed by Principal.
The fee payable for Aberdeen is equal to 0.85% of the first $50 million of average daily net assets, 0.72% of the next $50 million and 0.68% of average daily net assets over $100 million. Thrivent Partner Worldwide Allocation Portfolio and Thrivent Partner Emerging Markets Equity Portfolio are included in determining breakpoints for the assets managed by Aberdeen.
The fee payable for DuPont Capital is equal to 0.72% of the first $50 million of average daily net assets and 0.68% of average daily net net assets over $50 million. Thrivent Partner Worldwide Allocation Portfolio and Thrivent Partner Emerging Markets Equity Portfolio are included in determining breakpoints for the assets managed by DuPont Capital.
The fee payable for Victory is equal to 0.95% of the first $25 million of average daily net assets, 0.85% of the next $75 million, 0.80% of the next $50 million, 0.75% of the next $100 million and 0.70% of average daily net assets over $250 million. Thrivent Partner Worldwide Allocation Portfolio is included in determining breakpoints for the assets managed by Victory.
The fee payable for GSAM is equal to 0.55% of the first $50 million of average daily net assets, 0.50% of the next $200 million and 0.45% of average daily net assets over $250 million. Thrivent Partner Worldwide Allocation Portfolio is included in determining breakpoints for the assets managed by GSAM.
(C) Expense Reimbursements – As of October 31, 2012, the following contractual expense reimbursements, as a percentage of net assets, were in effect:
| | | | | | | | | | | | |
Fund | | Class A | | | Institutional
Class | | | Expiration Date | |
Money Market* | | | 0.20% | | | | 0.10% | | | | 2/28/2013 | |
* Thrivent Asset Management has voluntarily agreed to reimburse certain class-specific and fund level expenses of Thrivent Money Market Fund to the extent necessary in order to maintain a minimum annualized net yield of 0.00% for all classes of the Fund. As of October 31, 2012, contractual expense reimbursements to limit expenses to the following percentages were in effect: | |
| | | |
Fund | | Class A | | | Institutional
Class | | | Expiration
Date | |
Aggressive Allocation | | | 1.38 | %1 | | | N/A | | | | 2/28/2013 | |
Partner Emerging Markets Equity | | | 1.79 | % | | | 1.32 | % | | | 2/28/2014 | |
Partner Small Cap Growth | | | 1.40 | %2 | | | N/A | | | | 2/28/2013 | |
Partner Small Cap Value | | | 1.35 | %3 | | | N/A | | | | 2/28/2013 | |
Small Cap Stock | | | 1.35 | %4 | | | N/A | | | | 2/28/2013 | |
Partner Mid Cap Value | | | 1.25 | % | | | N/A | | | | 2/28/2013 | |
Partner Worldwide Allocation | | | 1.30 | % | | | 1.00 | % | | | 2/28/2013 | |
Large Cap Growth | | | 1.20 | % | | | N/A | | | | 2/28/2013 | |
Core Bond | | | 0.85 | % | | | N/A | | | | 2/28/2013 | |
Government Bond | | | 0.90 | % | | | N/A | 5 | | | 2/28/2013 | |
1 | Prior contractual expense cap of 1.30% expired on 2/28/2012. |
2 | Prior contractual expense cap of 1.45% expired on 2/28/2012. |
3 | Prior contractual expense cap of 1.40% expired on 2/28/2012. |
4 | Prior contractual expense cap of 1.40% expired on 2/28/2012. |
5 | Prior contractual expense cap of 0.65% expired on 2/28/2012. |
The expense caps for Aggressive Allocation include all indirect expenses.
Thrivent does not recoup amounts previously reimbursed or waived in prior fiscal years.
Each equity, hybrid and fixed income fund may invest cash in High Yield Fund and Money Market Fund, subject to certain limitations. During the year ended October 31, 2012, Balanced Fund, Income Fund, Core Bond Fund and Limited Maturity Bond Fund invested in High Yield Fund. During the year ended October 31, 2012, no funds invested in Money Market Fund. These related-party transactions are subject to the same terms as non-related party transactions except that, to avoid duplicate investment advisory fees, Thrivent Asset Mgt. reimburses an amount equal to the advisory fee that is charged to the equity, hybrid or fixed income fund for its investment in High Yield Fund or Money Market Fund.
(D) Distribution Plan – Thrivent Investment Management, Inc. (“Thrivent Investment Mgt.”) is the Trust’s distributor. The Trust has adopted a Distribution Plan pursuant to Rule 12b-1 under the 1940 Act. Class A shares have a Rule 12b-1 fee of up to 0.25% (up to 0.125% for
248
Thrivent Mutual Funds
Notes to Financial Statements
October 31, 2012
Government Bond Fund, Limited Maturity Bond Fund and Money Market Fund) of average net assets.
(E) Sales Charges and Other Fees – For the year ended October 31, 2012, Thrivent Investment Mgt. received $11,551,142 of aggregate underwriting concessions from the sales of the Trust’s Class A shares. Sales charges are not an expense of the Trust and are not reflected in the financial statements of any of the Funds.
The Trust has entered into an accounting and administrative services agreement with Thrivent Asset Mgt. pursuant to which Thrivent Asset Mgt. provides certain accounting and administrative personnel and services to the Funds. For the year ended October 31, 2012, Thrivent Asset Mgt. received aggregate fees for accounting and administrative personnel and services of $4,348,681 from the Trust.
The Trust has entered into an agreement with Thrivent Financial Investor Services Inc. (“Thrivent Investor Services”) to provide the Funds with transfer agent services. For the year ended October 31, 2012, Thrivent Investor Services received $14,843,217 for transfer agent services from the Trust.
Each Trustee is eligible to participate in a deferred compensation plan with respect to fees received from the Funds. Participants in the plan may designate their deferred Trustee’s fees as if invested in a series of the Thrivent Mutual Funds. The value of each Trustee’s deferred compensation account will increase or decrease as if invested in shares of that series. Their fees as well as the change in value are included in Trustee fees in the Statement of Operations. The deferred fees remain in the appropriate Fund until distribution in accordance with the plan. The deferred fee liability, included in accrued expenses in the Statement of Assets and Liabilities, is unsecured.
Those Trustees not participating in the above plan received $345,947 in fees from the Trust for the year ended October 31, 2012. In addition, the Trust reimbursed independent Trustees for reasonable expenses incurred in relation to attendance at meetings and industry conferences. Certain officers and non-independent Trustees of the Trust are officers and directors of Thrivent Asset Mgt., Thrivent Investment Mgt. and Thrivent Investor Services; however, they receive no compensation from the Trust.
(F) Indirect Expenses – Some Funds invest in other mutual funds. Fees and expenses of those underlying funds are not included in those Funds’ expense ratios. The Funds indirectly bear their proportionate share of the annualized weighted average expense ratio of the underlying funds in which they invest.
(4) TAX INFORMATION
Distributions are based on amounts calculated in accordance with the applicable federal income tax regulations, which may differ from GAAP. To the extent that these differences are permanent in nature, such amounts are reclassified within the capital accounts based on their federal tax-basis treatment; temporary differences do not require reclassifications.
On the Statement of Assets and Liabilities, as a result of permanent book-to-tax differences, reclassification adjustments were made as follows [Increase/(Decrease)]:
| | | | | | | | | | | | |
Fund | | Accumulated
Net
Investment
Income/(Loss) | | | Accumulated
Net Realized
Gain/(Loss) | | | Capital
Stock | |
Aggressive Allocation | | | ($24,808 | ) | | | $24,808 | | | | $– | |
Moderately Aggressive Allocation | | | (201,270 | ) | | | 201,270 | | | | – | |
Moderate Allocation | | | (54,812 | ) | | | 48,708 | | | | 6,104 | |
Moderately Conservative Allocation | | | 98,373 | | | | (100,293 | ) | | | 1,920 | |
Partner Emerging Markets Equity | | | (16,524 | ) | | | 23,195 | | | | (6,671 | ) |
Partner Small Cap Growth | | | 133,111 | | | | (10,334 | ) | | | (122,777 | ) |
Partner Small Cap Value | | | (326,080 | ) | | | 228,641 | | | | 97,439 | |
Small Cap Stock | | | 174,157 | | | | 79,685 | | | | (253,842 | ) |
Mid Cap Growth | | | 648,906 | | | | (1,260,344 | ) | | | 611,438 | |
Partner Mid Cap Value | | | (75,317 | ) | | | 75,317 | | | | – | |
Mid Cap Stock | | | (342,394 | ) | | | 479,500 | | | | (137,106 | ) |
Partner Worldwide Allocation | | | 833,163 | | | | (838,207 | ) | | | 5,044 | |
Large Cap Growth | | | (16,293 | ) | | | 16,293 | | | | – | |
Large Cap Value | | | 32,509 | | | | (32,509 | ) | | | – | |
Large Cap Stock | | | (133,317 | ) | | | (366,683 | ) | | | 500,000 | |
Balanced | | | (121,175 | ) | | | 163,814 | | | | (42,639 | ) |
High Yield | | | (106,496 | ) | | | 6,801,899 | | | | (6,695,403 | ) |
Income | | | (449,490 | ) | | | 449,490 | | | | – | |
Core Bond | | | (326,300 | ) | | | 384,090 | | | | (57,790 | ) |
Government Bond | | | 32,342 | | | | (32,342 | ) | | | – | |
Limited Maturity Bond | | | (183,816 | ) | | | 283,858 | | | | (100,042 | ) |
Money Market | | | 1,271 | | | | (1,271 | ) | | | – | |
At October 31, 2012, the components of distributable earnings on a tax basis were as follows:
| | | | | | | | |
Fund | | Undistributed
Ordinary Income | | | Undistributed
Long-Term
Capital Gain | |
Aggressive Allocation | | | $ 1,223,245 | | | | $ 3,645,360 | |
Moderately Aggressive Allocation | | | 6,785,828 | | | | 10,581,815 | |
Moderate Allocation | | | 10,377,654 | | | | 7,961,234 | |
Moderately Conservative Allocation | | | 5,927,616 | | | | 5,910,025 | |
Partner Emerging Markets Equity | | | 142,056 | | | | – | |
Partner Small Cap Growth | | | – | | | | 3,837,173 | |
249
Thrivent Mutual Funds
Notes to Financial Statements
October 31, 2012
| | | | | | | | |
Fund | | Undistributed
Ordinary Income | | | Undistributed
Long-Term
Capital Gain | |
Partner Small Cap Value | | | 2,388,442 | | | | 3,760,709 | |
Mid Cap Growth | | | 484,010 | | | | 25,881,481 | |
Partner Mid Cap Value | | | 1,019,858 | | | | 2,791,393 | |
Mid Cap Stock | | | 128,974 | | | | – | |
Partner Worldwide Allocation | | | 15,295,886 | | | | – | |
Large Cap Growth | | | 1,465,363 | | | | – | |
Large Cap Value | | | 7,510,084 | | | | – | |
Large Cap Stock | | | 23,402,617 | | | | 70,280,062 | |
Balanced | | | 4,177,889 | | | | 5,516,055 | |
High Yield | | | 69,066 | | | | – | |
Municipal Bonda | | | 143,082 | | | | 583,098 | |
Income | | | 57,010 | | | | – | |
Core Bond | | | 65,410 | | | | – | |
Government Bond | | | 2,818,133 | | | | 1,209,386 | |
Limited Maturity Bond | | | 201,495 | | | | – | |
a | Municipal Bond Fund undistributed ordinary income is primarily exempt from federal income taxes. |
At October 31, 2012, the following Funds had accumulated net realized capital loss carryovers expiring as follows:
| | | | | | | | |
Fund | | Capital Loss
Carryover | | | Expiration
Year | |
| | | | | | | | |
Small Cap Stock | | | $21,195,417 | | | | 2017 | |
| | | | | | | | |
| | | $21,195,417 | | | | | |
| | | | | | | | |
Mid Cap Stock | | | 26,672,932 | | | | 2016 | |
| | | 80,779,485 | | | | 2017 | |
| | | | | | | | |
| | | $107,452,417 | | | | | |
| | | | | | | | |
Partner Worldwide Allocation | | | 21,819,886 | | | | 2015 | |
| | | 105,432,640 | | | | 2016 | |
| | | 6,799,658 | | | | 2017 | |
| | | | | | | | |
| | | $134,052,184 | | | | | |
| | | | | | | | |
Large Cap Growth | | | 3,125,391 | | | | 2015 | |
| | | 7,508,041 | | | | 2016 | |
| | | 60,235,691 | | | | 2017 | |
| | | | | | | | |
| | | $70,869,123 | | | | | |
| | | | | | | | |
Large Cap Value | | | 51,978,606 | | | | 2017 | |
| | | | | | | | |
| | | $51,978,606 | | | | | |
| | | | | | | | |
High Yield | | | 1,037,644 | | | | 2013 | |
| | | 1,574,393 | | | | 2014 | |
| | | 32,937,341 | | | | 2016 | |
| | | 30,243,630 | | | | 2017 | |
| | | | | | | | |
| | | $65,793,008 | | | | | |
| | | | | | | | |
Income | | | 25,364,376 | | | | 2017 | |
| | | | | | | | |
| | | $25,364,376 | | | | | |
| | | | | | | | |
Core Bond | | | 45,847 | | | | 2016 | |
| | | 8,698,163 | | | | 2017 | |
| | | | | | | | |
| | | $8,744,010 | | | | | |
| | | | | | | | |
Limited Maturity Bond | | | 201,343 | | | | 2017 | |
| | | 775,940 | | | | 2019 | |
| | | | | | | | |
| | | $977,283 | | | | | |
| | | | | | | | |
To the extent that these Funds realize future net capital gains, taxable distributions will be reduced by any unused capital loss carryovers as permitted by the Internal Revenue Code.
Capital losses generated during the year ending October 31, 2012 and later, are subject to the provisions of the Regulated Investment Company Modernization Act of 2010 (the “Act”). Under the Act, if capital losses are not reduced by gains, the losses will be carried forward with no expiration and with the short-term or long-term character of the loss retained. Additionally, these capital losses must be fully utilized before those capital loss carryovers listed with noted expiration dates in the table above, which may make them more likely to expire unused.
At October 31, 2012, the following Fund had accumulated net realized capital loss carryovers subject to the Act, as follows:
| | | | | | | | |
Fund | | Capital Loss
Carryover | | | Tax Character | |
Partner Worldwide Allocation | | | $2,145,173 | | | | Short-term | |
| | | | | | | | |
| | | $2,145,173 | | | | | |
| | | | | | | | |
Of the capital loss carryovers attributable to Partner Worldwide Allocation Fund, the following amounts were obtained as a result of the reorganization, as described in Note (1)(A), with Partner International Stock Fund in September 2011:
| | | | | | | | |
Fund | | Capital Loss
Carryover | | | Expiration Year | |
| | | | | | | | |
Partner Worldwide Allocation Fund | | | 21,819,886 | | | | 2015 | |
| | | 105,432,640 | | | | 2016 | |
| | | | | | | | |
| | | $127,252,526 | | | | | |
| | | | | | | | |
The Internal Revenue Code may limit the ability to utilize capital losses after a fund merger.
During the fiscal year 2012, capital loss carryovers utilized by the Funds were as follows:
| | | | |
Fund | | Capital Loss Carryover | |
Aggressive Allocation | | | $3,273,794 | |
Moderately Aggressive Allocation | | | 8,360,647 | |
Partner Small Cap Growth | | | 5,450,939 | |
250
Thrivent Mutual Funds
Notes to Financial Statements
October 31, 2012
| | | | |
Fund | | Capital Loss
Carryover | |
Small Cap Stock | | | 15,281,217 | |
Partner Mid Cap Value | | | 416,544 | |
Mid Cap Stock | | | 58,580,450 | |
Large Cap Growth | | | 24,969,030 | |
Large Cap Value | | | 34,161,490 | |
Large Cap Stock | | | 9,023,674 | |
High Yield | | | 5,090,933 | |
Municipal Bond | | | 582,671 | |
Income | | | 7,358,932 | |
Core Bond | | | 7,051,848 | |
Limited Maturity Bond | | | 1,587,495 | |
In addition, the following capital loss carryovers expired during the fiscal year 2012: High Yield Fund; $6,701,548.
The following funds deferred, on a tax basis, the following Late Year Ordinary Losses:
| | | | |
Fund | | Ordinary Losses | |
Partner Small Cap Growth | | | $613,457 | |
Small Cap Stock | | | $332,852 | |
These amounts are deferred for tax purposes, deemed to occur on the first day of the following fiscal year, and are subject to the provisions of the Regulated Investment Company Modernization Act of 2010.
The tax character of distributions paid during the years ended October 31, 2012 and 2011 was as follows:
| | | | | | | | | | | | | | | | | | | | | | | | |
| | | Tax-Exempt Income | | | Ordinary Income | | | Long-Term Capital Gain | |
Fund | | 10/31/2012 | | | 10/31/2011 | | | 10/31/2012 | | | 10/31/2011 | | | 10/31/2012 | | | 10/31/2011 | |
Aggressive Allocation | | $ | – | | | $ | – | | | $ | 3,049,754 | | | $ | 2,796,343 | | | $ | – | | | $ | – | |
Moderately Aggressive Allocation | | | – | | | | – | | | | 16,659,898 | | | | 16,684,506 | | | | – | | | | – | |
Moderate Allocation | | | – | | | | – | | | | 19,702,434 | | | | 25,087,549 | | | | 1,509,022 | | | | – | |
Moderately Conservative Allocation | | | – | | | | – | | | | 11,586,711 | | | | 12,762,396 | | | | 2,320,624 | | | | – | |
Partner Small Cap Value | | | – | | | | – | | | | 1,009,708 | | | | 2,096,972 | | | | 2,250,423 | | | | – | |
Mid Cap Growth | | | – | | | | – | | | | – | | | | – | | | | 3,099,306 | | | | – | |
Partner Mid Cap Value | | | – | | | | – | | | | 887,106 | | | | 711,094 | | | | – | | | | – | |
Mid Cap Stock | | | – | | | | – | | | | – | | | | 701,194 | | | | – | | | | – | |
Partner Worldwide Allocation | | | – | | | | – | | | | 6,631,095 | | | | 3,609,840 | | | | – | | | | – | |
Large Cap Growth | | | – | | | | – | | | | 13,488 | | | | – | | | | – | | | | – | |
Large Cap Value | | | – | | | | – | | | | 9,006,362 | | | | 6,513,738 | | | | – | | | | – | |
Large Cap Stock | | | – | | | | – | | | | 11,202,984 | | | | 6,795,686 | | | | – | | | | – | |
Balanced | | | – | | | | – | | | | 2,244,364 | | | | 2,803,970 | | | | 4,829,710 | | | | – | |
High Yield | | | – | | | | – | | | | 51,506,433 | | | | 52,791,441 | | | | – | | | | – | |
Municipal Bond | | | 57,906,525 | | | | 58,916,628 | | | | 241,570 | | | | 288,179 | | | | – | | | | 2,623,380 | |
Income | | | – | | | | – | | | | 32,041,000 | | | | 35,710,886 | | | | – | | | | – | |
Core Bond | | | – | | | | – | | | | 7,169,527 | | | | 10,841,275 | | | | – | | | | – | |
Government Bond | | | – | | | | – | | | | 2,568,232 | | | | 3,073,638 | | | | 1,327,120 | | | | – | |
Limited Maturity Bond | | | – | | | | – | | | | 14,528,251 | | | | 20,991,561 | | | | – | | | | – | |
251
Thrivent Mutual Funds
Notes to Financial Statements
October 31, 2012
(5) SECURITY TRANSACTIONS
(A) Purchases and Sales of Investment Securities – For the year ended October 31, 2012, the cost of purchases and the proceeds from sales of investment securities, other than U.S. Government and short-term securities, were as follows:
| | | | | | | | |
| | | In thousands | |
Fund | | Purchases | | | Sales | |
Aggressive Allocation | | $ | 219,879 | | | $ | 208,502 | |
Moderately Aggressive Allocation | | | 385,691 | | | | 396,010 | |
Moderate Allocation | | | 370,441 | | | | 393,889 | |
Moderately Conservative Allocation | | | 193,250 | | | | 199,677 | |
Partner Emerging Markets Equity | | | 19,630 | | | | 5,003 | |
Partner Small Cap Growth | | | 125,826 | | | | 129,385 | |
Partner Small Cap Value | | | 23,214 | | | | 38,145 | |
Small Cap Stock | | | 224,318 | | | | 250,726 | |
Mid Cap Growth | | | 168,137 | | | | 194,360 | |
Partner Mid Cap Value | | | 101,251 | | | | 102,504 | |
Mid Cap Stock | | | 260,297 | | | | 341,944 | |
Partner Worldwide Allocation | | | 392,861 | | | | 369,659 | |
Large Cap Growth | | | 327,115 | | | | 350,706 | |
Large Cap Value | | | 489,734 | | | | 521,580 | |
Large Cap Stock | | | 1,834,801 | | | | 2,159,964 | |
Balanced | | | 138,639 | | | | 158,299 | |
High Yield | | | 417,077 | | | | 362,766 | |
Municipal Bond | | | 311,097 | | | | 189,036 | |
Income | | | 400,662 | | | | 388,785 | |
Core Bond | | | 95,644 | | | | 143,582 | |
Government Bond | | | 19,260 | | | | 16,122 | |
Limited Maturity Bond | | | 221,256 | | | | 362,696 | |
Purchases and sales of U.S. Government securities were:
| | | | | | | | |
| | | In thousands | |
Fund | | Purchases | | | Sales | |
Aggressive Allocation | | $ | 155,423 | | | $ | 149,857 | |
Moderately Aggressive Allocation | | | 618,439 | | | | 581,921 | |
Moderate Allocation | | | 866,168 | | | | 802,205 | |
Moderately Conservative Allocation | | | 718,150 | | | | 651,919 | |
Partner Worldwide Allocation | | | – | | | | 601 | |
Balanced | | | 245,346 | | | | 238,821 | |
Income | | | 608,678 | | | | 571,004 | |
Core Bond | | | 1,015,390 | | | | 1,000,020 | |
Government Bond | | | 191,828 | | | | 187,015 | |
Limited Maturity Bond | | | 800,937 | | | | 726,802 | |
(B) Investments in Restricted Securities – Certain Funds may own restricted securities that have been deemed illiquid and were purchased in private placement transactions without registration under the Securities Act of 1933. Unless such securities subsequently become registered, they generally may be resold only in privately negotiated transactions with a limited number of purchasers. As of October 31, 2012, the following funds held restricted securities:
| | | | | | | | |
Fund | | Number of
Securities | | | Percent of Fund’s
Net Assets | |
Balanced | | | 1 | | | | 0.21 | % |
High Yield | | | 3 | | | | 1.57 | % |
Municipal Bond | | | 1 | | | | 0.16 | % |
Income | | | 2 | | | | 0.26 | % |
Core Bond | | | 1 | | | | 0.55 | % |
Limited Maturity Bond | | | 4 | | | | 0.52 | % |
The Funds have no right to require registration of unregistered securities.
(C) Investments in High-Yielding Securities – High Yield Fund invests primarily in high-yielding fixed-income securities. Each of the other Funds, except Money Market Fund, may also invest in high-yielding securities. These securities will typically be in the lower rating categories or will be non-rated and generally will involve more risk than securities in the higher rating categories. Lower rated or unrated securities (e.g., junk bonds) are more likely to react to developments affecting market risk and credit risk than are more highly rated securities, which react primarily to movements in the general level of interest rates.
(D) Investments in Options and Futures Contracts – The movement in the price of the security underlying an option or futures contract may not correlate perfectly with the movement in the prices of the portfolio securities being hedged. A lack of correlation could render a Fund’s hedging strategy unsuccessful and could result in a loss to the Fund. In the event that a liquid secondary market would not exist, the Fund could be prevented from entering into a closing transaction, which could result in additional losses to the Fund.
(E) Written Option Contracts – The number of contracts and premium amounts associated with call option contracts written during the year ended October 31, 2012 were as follows:
| | | | | | | | |
| | | Number of
Contracts | | | Premium
Amount | |
Large Cap Stock | | | | | | | | |
Balance at October 31, 2011 | | | 80 | | | $ | 40,300 | |
Opened | | | 350 | | | | 268,261 | |
Closed | | | (410 | ) | | | (298,111 | ) |
Expired | | | (20 | ) | | | (10,450 | ) |
Exercised | | | – | | | | – | |
| | | | | | | | |
Balance at October 31, 2012 | | | – | | | $ | – | |
| | | | | | | | |
| | |
Balanced | | | | | | | | |
Balance at October 31, 2011 | | | – | | | $ | – | |
Opened | | | 10 | | | | 2,158 | |
Closed | | | (10 | ) | | | (2,158 | ) |
Expired | | | – | | | | – | |
Exercised | | | – | | | | – | |
| | | | | | | | |
Balance at October 31, 2012 | | | – | | | $ | – | |
| | | | | | | | |
252
Thrivent Mutual Funds
Notes to Financial Statements
October 31, 2012
| | | | | | | | |
| | | Number of
Contracts | | | Premium
Amount | |
Core Bond | | | | | | | | |
Balance at October 31, 2011 | | | – | | | $ | – | |
Opened | | | 40 | | | | 8,630 | |
Closed | | | (40 | ) | | | (8,630 | ) |
Expired | | | – | | | | – | |
Exercised | | | – | | | | – | |
| | | | | | | | |
Balance at October 31, 2012 | | | – | | | $ | – | |
| | | | | | | | |
| | |
Limited Maturity Bond | | | | | | | | |
Balance at October 31, 2011 | | | – | | | $ | – | |
Opened | | | 100 | | | | 21,575 | |
Closed | | | (100 | ) | | | (21,575 | ) |
Expired | | | – | | | | – | |
Exercised | | | – | | | | – | |
| | | | | | | | |
Balance at October 31, 2012 | | | – | | | $ | – | |
| | | | | | | | |
(6) SECURITY TRANSACTIONS WITH AFFILIATED FUNDS
The Funds are permitted to purchase or sell securities from or to certain other Funds under specified conditions outlined in procedures adopted by the Board. The procedures have been designed to ensure that any purchase or sale of securities by a Fund from or to another fund or portfolio that is or could be considered an affiliate by virtue of having a common investment adviser (or affiliated investment advisers), common Trustees and/or common officers complies with Rule 17a-7 of the 1940 Act. Further, as defined under the procedures, each transaction is executed at the current market price.
(7) RELATED PARTY TRANSACTIONS
As of October 31, 2012, related parties (other than the Thrivent Asset Allocation Funds) held the following shares in excess of 5% of Thrivent Mutual Funds:
| | | | | | | | |
Fund | | Shares | | | Percent of
Fund’s
Outstanding
Shares | |
Partner Emerging Markets Equity | | | 1,471,542 | | | | 98.0 | % |
Partner Small Cap Growth | | | 624,175 | | | | 6.1 | % |
Partner Worldwide Allocation | | | 6,166,523 | | | | 7.7 | % |
Core Bond | | | 2,389,804 | | | | 8.9 | % |
Government Bond | | | 2,326,372 | | | | 22.2 | % |
As of October 31, 2012, retirement plans sponsored by Thrivent Financial for Lutherans held the following shares in excess of 5% of Thrivent Mutual Funds:
| | | | | | | | |
Fund | | Shares | | | Percent of
Fund’s
Outstanding
Shares | |
Aggressive Allocation | | | 6,870,510 | | | | 13.8 | % |
Moderately Aggressive Allocation | | | 7,542,397 | | | | 6.5 | % |
| | | | | | | | |
Fund | | Shares | | | Percent of
Fund’s
Outstanding
Shares | |
Partner Small Cap Value | | | 1,178,446 | | | | 8.8 | % |
Mid Cap Stock | | | 2,948,740 | | | | 6.3 | % |
Balanced | | | 3,854,978 | | | | 25.5 | % |
(8) SUBSEQUENT EVENTS
The Adviser of the Funds has evaluated the impact of subsequent events, and, except as already included in the Notes to Financial Statements, has determined that no additional items require disclosure.
253
Thrivent Mutual Funds
Financial Highlights
| | | | | | | | | | | | |
| | | FOR A SHARE OUTSTANDING THROUGHOUT EACH PERIOD* |
| | | | | Income from Investment Operations | | Less Distributions from |
| | | Net Asset
Value,
Beginning of
Period | | Net
Investment
Income/(Loss) | | Net Realized
and Unrealized
Gain/(Loss) on
Investments(a) | | Total from
Investment
Operations | | Net
Investment
Income | | Net Realized
Gain on
Investments |
AGGRESSIVE ALLOCATION FUND |
Class A Shares | | | | | | | | | | | | |
Year Ended 10/31/2012 | | $10.70 | | $0.04 | | $0.85 | | $0.89 | | $(0.05) | | $– |
Year Ended 10/31/2011 | | 10.35 | | 0.07 | | 0.33 | | 0.40 | | (0.05) | | – |
Year Ended 10/31/2010 | | 8.81 | | 0.06 | | 1.55 | | 1.61 | | (0.07) | | – |
Year Ended 10/31/2009 | | 8.26 | | 0.10 | | 0.99 | | 1.09 | | (0.09) | | (0.45) |
Year Ended 10/31/2008 | | 13.79 | | 0.16 | | (5.13) | | (4.97) | | (0.35) | | (0.21) |
Institutional Class Shares | | | | | | | | | | | | |
Year Ended 10/31/2012 | | 10.78 | | 0.09 | | 0.86 | | 0.95 | | (0.09) | | – |
Year Ended 10/31/2011 | | 10.43 | | 0.11 | | 0.33 | | 0.44 | | (0.09) | | – |
Year Ended 10/31/2010 | | 8.87 | | 0.09 | | 1.56 | | 1.65 | | (0.09) | | – |
Year Ended 10/31/2009 | | 8.31 | | 0.13 | | 1.00 | | 1.13 | | (0.12) | | (0.45) |
Year Ended 10/31/2008 | | 13.86 | | 0.21 | | (5.18) | | (4.97) | | (0.37) | | (0.21) |
MODERATELY AGGRESSIVE ALLOCATION FUND |
Class A Shares | | | | | | | | | | | | |
Year Ended 10/31/2012 | | 10.83 | | 0.11 | | 0.84 | | 0.95 | | (0.14) | | – |
Year Ended 10/31/2011 | | 10.65 | | 0.16 | | 0.17 | | 0.33 | | (0.15) | | – |
Year Ended 10/31/2010 | | 9.25 | | 0.16 | | 1.39 | | 1.55 | | (0.15) | | – |
Year Ended 10/31/2009 | | 8.36 | | 0.20 | | 1.11 | | 1.31 | | (0.20) | | (0.22) |
Year Ended 10/31/2008 | | 13.23 | | 0.24 | | (4.58) | | (4.34) | | (0.36) | | (0.17) |
Institutional Class Shares | | | | | | | | | | | | |
Year Ended 10/31/2012 | | 10.92 | | 0.16 | | 0.83 | | 0.99 | | (0.18) | | – |
Year Ended 10/31/2011 | | 10.72 | | 0.20 | | 0.18 | | 0.38 | | (0.18) | | – |
Year Ended 10/31/2010 | | 9.31 | | 0.20 | | 1.39 | | 1.59 | | (0.18) | | – |
Year Ended 10/31/2009 | | 8.41 | | 0.23 | | 1.12 | | 1.35 | | (0.23) | | (0.22) |
Year Ended 10/31/2008 | | 13.30 | | 0.27 | | (4.60) | | (4.33) | | (0.39) | | (0.17) |
MODERATE ALLOCATION FUND |
Class A Shares | | | | | | | | | | | | |
Year Ended 10/31/2012 | | 10.80 | | 0.16 | | 0.77 | | 0.93 | | (0.17) | | (0.01) |
Year Ended 10/31/2011 | | 10.67 | | 0.22 | | 0.13 | | 0.35 | | (0.22) | | – |
Year Ended 10/31/2010 | | 9.46 | | 0.23 | | 1.20 | | 1.43 | | (0.22) | | – |
Year Ended 10/31/2009 | | 8.42 | | 0.27 | | 1.09 | | 1.36 | | (0.26) | | (0.06) |
Year Ended 10/31/2008 | | 12.32 | | 0.30 | | (3.62) | | (3.32) | | (0.41) | | (0.17) |
Institutional Class Shares | | | | | | | | | | | | |
Year Ended 10/31/2012 | | 10.82 | | 0.20 | | 0.77 | | 0.97 | | (0.21) | | (0.01) |
Year Ended 10/31/2011 | | 10.69 | | 0.26 | | 0.13 | | 0.39 | | (0.26) | | – |
Year Ended 10/31/2010 | | 9.48 | | 0.26 | | 1.20 | | 1.46 | | (0.25) | | – |
Year Ended 10/31/2009 | | 8.43 | | 0.29 | | 1.11 | | 1.40 | | (0.29) | | (0.06) |
Year Ended 10/31/2008 | | 12.34 | | 0.35 | | (3.65) | | (3.30) | | (0.44) | | (0.17) |
(a) | The amount shown may not correlate with the change in aggregate gains and losses of portfolio securities due to the timing of sales and redemptions of fund shares. |
* | All per share amounts have been rounded to the nearest cent. |
The accompanying Notes to Financial Statements are an integral part of this schedule.
254
Thrivent Mutual Funds
Financial Highlights – continued
| | | | | | | | | | | | | | | | |
| | | RATIOS / SUPPLEMENTAL DATA |
| | | | | | | | | Ratio to Average Net
Assets** | | Ratios to Average Net
Assets Before Expenses
Waived, Credited or Paid
Indirectly** |
Total Distributions | | Net Asset Value, End of Period | | Total
Return(b) | | Net Assets, End
of Period
(in millions) | | Expenses | | Net
Investment
Income/(Loss) | | Expenses | | Net
Investment Income/(Loss) | | Portfolio Turnover Rate |
| | | | | | | | | | | | | | | | |
| | | | | | | | | | | | | | | | |
| $(0.05) | | $11.54 | | 8.42% | | $494.3 | | 0.82% | | 0.33% | | 0.86% | | 0.29% | | 66% |
(0.05) | | 10.70 | | 3.87% | | 462.1 | | 0.75% | | 0.64% | | 0.89% | | 0.51% | | 72% |
(0.07) | | 10.35 | | 18.29% | | 435.5 | | 0.70% | | 0.57% | | 0.90% | | 0.37% | | 52% |
(0.54) | | 8.81 | | 14.66% | | 354.6 | | 0.57% | | 1.27% | | 0.88% | | 0.96% | | 19% |
(0.56) | | 8.26 | | (37.44)% | | 264.2 | | 0.53% | | 0.94% | | 0.72% | | 0.75% | | 15% |
| | | | | | | | | | | | | | | | |
| | | | | | | | | | | | | | | | |
(0.09) | | 11.64 | | �� 8.94% | | 81.2 | | 0.42% | | 0.73% | | 0.42% | | 0.73% | | 66% |
(0.09) | | 10.78 | | 4.16% | | 80.0 | | 0.40% | | 1.01% | | 0.41% | | 1.00% | | 72% |
(0.09) | | 10.43 | | 18.73% | | 73.7 | | 0.35% | | 0.94% | | 0.39% | | 0.90% | | 52% |
(0.57) | | 8.87 | | 15.16% | | 62.9 | | 0.23% | | 1.62% | | 0.25% | | 1.60% | | 19% |
(0.58) | | 8.31 | | (37.27)% | | 50.4 | | 0.20% | | 1.26% | | 0.20% | | 1.26% | | 15% |
| | | | | | | | | | | | | | | | |
| | | | | | | | | | | | | | | | |
(0.14) | | 11.64 | | 8.92% | | 1,268.2 | | 0.77% | | 0.99% | | 0.77% | | 0.99% | | 78% |
(0.15) | | 10.83 | | 3.06% | | 1,168.6 | | 0.70% | | 1.44% | | 0.75% | | 1.39% | | 58% |
(0.15) | | 10.65 | | 16.92% | | 1,085.3 | | 0.62% | | 1.60% | | 0.75% | | 1.47% | | 39% |
(0.42) | | 9.25 | | 16.78% | | 904.1 | | 0.54% | | 2.50% | | 0.72% | | 2.31% | | 17% |
(0.53) | | 8.36 | | (33.99)% | | 698.3 | | 0.51% | | 1.87% | | 0.61% | | 1.78% | | 20% |
| | | | | | | | | | | | | | | | |
| | | | | | | | | | | | | | | | |
(0.18) | | 11.73 | | 9.29% | | 90.2 | | 0.37% | | 1.39% | | 0.37% | | 1.39% | | 78% |
(0.18) | | 10.92 | | 3.55% | | 85.1 | | 0.32% | | 1.82% | | 0.33% | | 1.81% | | 58% |
(0.18) | | 10.72 | | 17.24% | | 79.5 | | 0.28% | | 1.94% | | 0.31% | | 1.92% | | 39% |
(0.45) | | 9.31 | | 17.27% | | 69.0 | | 0.20% | | 2.85% | | 0.21% | | 2.84% | | 17% |
(0.56) | | 8.41 | | (33.83)% | | 56.2 | | 0.18% | | 2.21% | | 0.18% | | 2.21% | | 20% |
| | | | | | | | | | | | | | | | |
| | | | | | | | | | | | | | | | |
(0.18) | | 11.55 | | 8.68% | | 1,316.5 | | 0.71% | | 1.47% | | 0.71% | | 1.47% | | 94% |
(0.22) | | 10.80 | | 3.27% | | 1,207.6 | | 0.65% | | 2.02% | | 0.68% | | 1.99% | | 46% |
(0.22) | | 10.67 | | 15.30% | | 1,118.6 | | 0.60% | | 2.28% | | 0.68% | | 2.21% | | 30% |
(0.32) | | 9.46 | | 16.91% | | 923.2 | | 0.53% | | 3.24% | | 0.64% | | 3.12% | | 19% |
(0.58) | | 8.42 | | (28.06)% | | 739.6 | | 0.50% | | 2.61% | | 0.55% | | 2.56% | | 17% |
| | | | | | | | | | | | | | | | |
(0.22) | | 11.57 | | 9.05% | | 66.0 | | 0.35% | | 1.83% | | 0.35% | | 1.83% | | 94% |
(0.26) | | 10.82 | | 3.62% | | 59.7 | | 0.30% | | 2.36% | | 0.31% | | 2.35% | | 46% |
(0.25) | | 10.69 | | 15.64% | | 50.5 | | 0.27% | | 2.60% | | 0.29% | | 2.58% | | 30% |
(0.35) | | 9.48 | | 17.38% | | 38.5 | | 0.20% | | 3.55% | | 0.21% | | 3.54% | | 19% |
(0.61) | | 8.43 | | (27.87)% | | 28.4 | | 0.18% | | 2.92% | | 0.18% | | 2.92% | | 17% |
(b) | Total investment return assumes dividend reinvestment and does not reflect any deduction for applicable sales charges. Not annualized for periods less than one year. |
** Computed on an annualized basis for periods less than one year.
The accompanying Notes to Financial Statements are an integral part of this schedule.
255
Thrivent Mutual Funds
Financial Highlights – continued
| | | | | | | | | | | | |
| | | FOR A SHARE OUTSTANDING THROUGHOUT EACH PERIOD* |
| | | | | Income from Investment Operations | | Less Distributions from |
| | | Net Asset
Value,
Beginning of
Period | | Net
Investment
Income/(Loss) | | Net Realized
and Unrealized
Gain/(Loss) on
Investments(a) | | Total from
Investment
Operations | | Net
Investment
Income | | Net Realized
Gain on
Investments |
MODERATELY CONSERVATIVE ALLOCATION FUND |
Class A Shares | | | | | | | | | | | | |
Year Ended 10/31/2012 | | $10.75 | | $0.19 | | $0.65 | | $0.84 | | $(0.19) | | $(0.06) |
Year Ended 10/31/2011 | | 10.73 | | 0.25 | | 0.02 | | 0.27 | | (0.25) | | – |
Year Ended 10/31/2010 | | 9.78 | | 0.27 | | 0.94 | | 1.21 | | (0.26) | | – |
Year Ended 10/31/2009 | | 8.75 | | 0.30 | | 1.03 | | 1.33 | | (0.30) | | – |
Year Ended 10/31/2008 | | 11.54 | | 0.34 | | (2.63) | | (2.29) | | (0.40) | | (0.10) |
Institutional Class Shares | | | | | | | | | | | | |
Year Ended 10/31/2012 | | 10.78 | | 0.22 | | 0.65 | | 0.87 | | (0.22) | | (0.06) |
Year Ended 10/31/2011 | | 10.75 | | 0.28 | | 0.03 | | 0.31 | | (0.28) | | – |
Year Ended 10/31/2010 | | 9.80 | | 0.29 | | 0.94 | | 1.23 | | (0.28) | | – |
Year Ended 10/31/2009 | | 8.77 | | 0.32 | | 1.03 | | 1.35 | | (0.32) | | – |
Year Ended 10/31/2008 | | 11.56 | | 0.37 | | (2.63) | | (2.26) | | (0.43) | | (0.10) |
PARTNER EMERGING MARKETS EQUITY FUND | | | | | | | | |
Class A Shares | | | | | | | | | | | | |
Year Ended 10/31/2012 (c) | | 10.00 | | 0.01 | | 0.26 | | 0.27 | | – | | – |
Institutional Class Shares | | | | | | | | | | | | |
Year Ended 10/31/2012 (c) | | 10.00 | | 0.02 | | 0.25 | | 0.27 | | – | | – |
PARTNER SMALL CAP GROWTH FUND | | | | | | | | |
Class A Shares | | | | | | | | | | | | |
Year Ended 10/31/2012 | | 11.72 | | (0.17) | | 1.09 | | 0.92 | | – | | – |
Year Ended 10/31/2011 | | 10.81 | | (0.12) | | 1.03 | | 0.91 | | – | | – |
Year Ended 10/31/2010 | | 8.31 | | (0.11) | | 2.61 | | 2.50 | | – | | – |
Year Ended 10/31/2009 | | 7.72 | | (0.04) | | 0.63 | | 0.59 | | – | | – |
Year Ended 10/31/2008 | | 13.93 | | (0.04) | | (5.59) | | (5.63) | | – | | (0.58) |
Institutional Class Shares | | | | | | | | | | | | |
Year Ended 10/31/2012 | | 11.99 | | (0.07) | | 1.06 | | 0.99 | | – | | – |
Year Ended 10/31/2011 | | 11.01 | | (0.08) | | 1.06 | | 0.98 | | – | | – |
Year Ended 10/31/2010 | | 8.42 | | (0.07) | | 2.66 | | 2.59 | | – | | – |
Year Ended 10/31/2009 | | 7.79 | | (0.03) | | 0.66 | | 0.63 | | – | | – |
Year Ended 10/31/2008 | | 14.00 | | (0.01) | | (5.62) | | (5.63) | | – | | (0.58) |
PARTNER SMALL CAP VALUE FUND | | | | | | | | | | |
Class A Shares | | | | | | | | | | | | |
Year Ended 10/31/2012 | | 14.47 | | 0.09 | | 1.60 | | 1.69 | | (0.01) | | (0.16) |
Year Ended 10/31/2011 | | 13.72 | | 0.04 | | 0.80 | | 0.84 | | (0.09) | | – |
Year Ended 10/31/2010 | | 11.26 | | 0.02 | | 2.47 | | 2.49 | | (0.03) | | – |
Year Ended 10/31/2009 | | 11.02 | | 0.05 | | 0.86 | | 0.91 | | (0.05) | | (0.62) |
Year Ended 10/31/2008 | | 16.41 | | 0.09 | | (4.26) | | (4.17) | | – | | (1.22) |
Institutional Class Shares | | | | | | | | | | | | |
Year Ended 10/31/2012 | | 15.19 | | 0.18 | | 1.69 | | 1.87 | | (0.10) | | (0.16) |
Year Ended 10/31/2011 | | 14.39 | | 0.14 | | 0.82 | | 0.96 | | (0.16) | | – |
Year Ended 10/31/2010 | | 11.81 | | 0.09 | | 2.59 | | 2.68 | | (0.10) | | – |
Year Ended 10/31/2009 | | 11.53 | | 0.10 | | 0.94 | | 1.04 | | (0.14) | | (0.62) |
Year Ended 10/31/2008 | | 17.10 | | 0.12 | | (4.37) | | (4.25) | | (0.10) | | (1.22) |
(a) | The amount shown may not correlate with the change in aggregate gains and losses of portfolio securities due to the timing of sales and redemptions of fund shares. |
(c) | Since fund inception, August 31, 2012. |
* | All per share amounts have been rounded to the nearest cent. |
The accompanying Notes to Financial Statements are an integral part of this schedule.
256
Thrivent Mutual Funds
Financial Highlights – continued
| | | | | | | | | | | | | | | | |
| | | RATIOS / SUPPLEMENTAL DATA |
| | | | | | | | | Ratio to Average Net
Assets** | | Ratios to Average Net
Assets Before Expenses
Waived, Credited or Paid
Indirectly** |
Total
Distributions | | Net Asset
Value, End of
Period | | Total
Return(b) | | Net Assets, End
of Period
(in millions) | | Expenses | | Net
Investment
Income/(Loss) | | Expenses | | Net
Investment
Income/(Loss) | | Portfolio
Turnover Rate |
| | | | | | | | | | | | | | | | |
| | | | | | | | | | | | | | | | |
$(0.25) | | $11.34 | | 7.92% | | $632.9 | | 0.75% | | 1.70% | | 0.75% | | 1.70% | | 145% |
(0.25) | | 10.75 | | 2.49% | | 559.7 | | 0.64% | | 2.28% | | 0.69% | | 2.23% | | 46% |
(0.26) | | 10.73 | | 12.53% | | 503.7 | | 0.58% | | 2.61% | | 0.69% | | 2.50% | | 29% |
(0.30) | | 9.78 | | 15.66% | | 392.9 | | 0.51% | | 3.45% | | 0.64% | | 3.31% | | 21% |
(0.50) | | 8.75 | | (20.53)% | | 314.7 | | 0.47% | | 3.15% | | 0.56% | | 3.06% | | 19% |
| | | | | | | | | | | | | | | | |
(0.28) | | 11.37 | | 8.26% | | 28.0 | | 0.41% | | 2.03% | | 0.41% | | 2.03% | | 145% |
(0.28) | | 10.78 | | 2.88% | | 22.4 | | 0.33% | | 2.59% | | 0.33% | | 2.59% | | 46% |
(0.28) | | 10.75 | | 12.78% | | 21.7 | | 0.32% | | 2.87% | | 0.33% | | 2.86% | | 29% |
(0.32) | | 9.80 | | 15.91% | | 13.8 | | 0.25% | | 3.72% | | 0.25% | | 3.71% | | 21% |
(0.53) | | 8.77 | | (20.30)% | | 11.1 | | 0.22% | | 3.45% | | 0.22% | | 3.45% | | 19% |
| | | | | | | | | | | | | | | | |
| | | | | | | | | | | | | | | | |
| – | | 10.27 | | 2.70% | | 14.4 | | 1.61% | | 0.60% | | 3.02% | | (0.81)% | | 33% |
| | | | | | | | | | | | | | | | |
– | | 10.27 | | 2.70% | | 1.0 | | 1.32% | | 0.89% | | 2.75% | | (0.54)% | | 33% |
| | | | | | | | | | | | | | | | |
| | | | | | | | | | | | | | | | |
| – | | 12.64 | | 7.85% | | 17.2 | | 1.42% | | (0.89)% | | 1.53% | | (1.01)% | | 100% |
| – | | 11.72 | | 8.42% | | 20.0 | | 1.47% | | (1.10)% | | 1.51% | | (1.13)% | | 106% |
| �� – | | 10.81 | | 30.08% | | 17.3 | | 1.56% | | (1.14)% | | 1.56% | | (1.14)% | | 102% |
| – | | 8.31 | | 7.64% | | 12.8 | | 1.58% | | (0.90)% | | 1.61% | | (0.93)% | | 116% |
(0.58) | | 7.72 | | (41.96)% | | 9.6 | | 1.42% | | (0.44)% | | 1.43% | | (0.45)% | | 186% |
| | | | | | | | | | | | | | | | |
– | | 12.98 | | 8.26% | | 115.0 | | 1.05% | | (0.53)% | | 1.05% | | (0.53)% | | 100% |
– | | 11.99 | | 8.90% | | 104.4 | | 1.05% | | (0.67)% | | 1.05% | | (0.67)% | | 106% |
– | | 11.01 | | 30.76% | | 95.9 | | 1.09% | | (0.67)% | | 1.09% | | (0.67)% | | 102% |
– | | 8.42 | | 8.09% | | 72.7 | | 1.09% | | (0.40)% | | 1.12% | | (0.43)% | | 116% |
(0.58) | | 7.79 | | (41.74)% | | 64.7 | | 1.06% | | (0.07)% | | 1.07% | | (0.08)% | | 186% |
| | | | | | | | | | | | | | | | |
| | | | | | | | | | | | | | | | |
(0.17) | | 15.99 | | 11.87% | | 72.0 | | 1.36% | | 0.59% | | 1.37% | | 0.59% | | 11% |
(0.09) | | 14.47 | | 6.08% | | 69.3 | | 1.40% | | 0.28% | | 1.40% | | 0.28% | | 9% |
(0.03) | | 13.72 | | 22.14% | | 71.7 | | 1.40% | | 0.14% | | 1.47% | | 0.07% | | 17% |
(0.67) | | 11.26 | | 9.51% | | 59.0 | | 1.56% | | 0.55% | | 1.67% | | 0.44% | | 14% |
(1.22) | | 11.02 | | (26.94)% | | 54.3 | | 1.35% | | 0.61% | | 1.46% | | 0.49% | | 35% |
| | | | | | | | | | | | | | | | |
(0.26) | | 16.80 | | 12.51% | | 148.9 | | 0.85% | | 1.10% | | 0.85% | | 1.10% | | 11% |
(0.16) | | 15.19 | | 6.64% | | 143.4 | | 0.84% | | 0.84% | | 0.84% | | 0.84% | | 9% |
(0.10) | | 14.39 | | 22.78% | | 160.7 | | 0.85% | | 0.70% | | 0.85% | | 0.70% | | 17% |
(0.76) | | 11.81 | | 10.37% | | 119.2 | | 0.83% | | 1.25% | | 0.87% | | 1.21% | | 14% |
(1.32) | | 11.53 | | (26.46)% | | 75.4 | | 0.69% | | 1.27% | | 0.80% | | 1.15% | | 35% |
(b) Total investment return assumes dividend reinvestment and does not reflect any deduction for applicable sales charges. Not annualized for periods less than one year.
** Computed on an annualized basis for periods less than one year.
The accompanying Notes to Financial Statements are an integral part of this schedule.
257
Thrivent Mutual Funds
Financial Highlights – continued
| | | | | | | | | | | | |
| | | FOR A SHARE OUTSTANDING THROUGHOUT EACH PERIOD* |
| | | | | Income from Investment Operations | | Less Distributions from |
| | | Net Asset
Value,
Beginning of
Period | | Net
Investment
Income/(Loss) | | Net Realized
and Unrealized
Gain/(Loss) on
Investments(a) | | Total from
Investment
Operations | | Net
Investment
Income | | Net Realized
Gain on
Investments |
SMALL CAP STOCK FUND |
Class A Shares | | | | | | | | | | | | |
Year Ended 10/31/2012 | | $13.35 | | $(0.06) | | $0.99 | | $0.93 | | $– | | $– |
Year Ended 10/31/2011 | | 12.56 | | (0.11) | | 0.90 | | 0.79 | | – | | – |
Year Ended 10/31/2010 | | 10.26 | | (0.09) | | 2.39 | | 2.30 | | – | | – |
Year Ended 10/31/2009 | | 10.33 | | – | | (0.06) | | (0.06) | | (0.01) | | – |
Year Ended 10/31/2008 | | 18.98 | | 0.01 | | (6.34) | | (6.33) | | – | | (2.32) |
Institutional Class Shares | | | | | | | | | | | | |
Year Ended 10/31/2012 | | 14.96 | | 0.05 | | 1.08 | | 1.13 | | – | | – |
Year Ended 10/31/2011 | | 13.99 | | 0.07 | | 0.90 | | 0.97 | | – | | – |
Year Ended 10/31/2010 | | 11.35 | | 0.02 | | 2.62 | | 2.64 | | – | | – |
Year Ended 10/31/2009 | | 11.43 | | 0.22 | | (0.20) | | 0.02 | | (0.10) | | – |
Year Ended 10/31/2008 | | 20.62 | | 0.01 | | (6.88) | | (6.87) | | – | | (2.32) |
MID CAP GROWTH FUND |
Class A Shares | | | | | | | | | | | | |
Year Ended 10/31/2012 | | 17.67 | | (0.08) | | 0.90 | | 0.82 | | – | | (0.15) |
Year Ended 10/31/2011 | | 16.62 | | (0.08) | | 1.13 | | 1.05 | | – | | – |
Year Ended 10/31/2010 | | 12.92 | | (0.08) | | 3.78 | | 3.70 | | – | | – |
Year Ended 10/31/2009 | | 10.24 | | (0.06) | | 2.74 | | 2.68 | | – | | – |
Year Ended 10/31/2008 | | 19.45 | | (0.03) | | (6.95) | | (6.98) | | – | | (2.23) |
Institutional Class Shares | | | | | | | | | | | | |
Year Ended 10/31/2012 | | 19.81 | | 0.05 | | 0.97 | | 1.02 | | – | | (0.15) |
Year Ended 10/31/2011 | | 18.53 | | 0.05 | | 1.23 | | 1.28 | | – | | – |
Year Ended 10/31/2010 | | 14.31 | | (0.02) | | 4.24 | | 4.22 | | – | | – |
Year Ended 10/31/2009 | | 11.24 | | (0.05) | | 3.12 | | 3.07 | | – | | – |
Year Ended 10/31/2008 | | 20.98 | | (0.08) | | (7.43) | | (7.51) | | – | | (2.23) |
PARTNER MID CAP VALUE FUND |
Class A Shares | | | | | | | | | | | | |
Year Ended 10/31/2012 | | 11.55 | | 0.10 | | 1.21 | | 1.31 | | (0.05) | | – |
Year Ended 10/31/2011 | | 11.19 | | 0.05 | | 0.35 | | 0.40 | | (0.04) | | – |
Year Ended 10/31/2010 | | 8.97 | | 0.06 | | 2.23 | | 2.29 | | (0.07) | | – |
Year Ended 10/31/2009 | | 7.89 | | 0.04 | | 1.11 | | 1.15 | | (0.07) | | – |
Year Ended 10/31/2008 | | 12.93 | | 0.12 | | (4.43) | | (4.31) | | (0.09) | | (0.64) |
Institutional Class Shares | | | | | | | | | | | | |
Year Ended 10/31/2012 | | 11.60 | | 0.15 | | 1.20 | | 1.35 | | (0.09) | | – |
Year Ended 10/31/2011 | | 11.23 | | 0.10 | | 0.35 | | 0.45 | | (0.08) | | – |
Year Ended 10/31/2010 | | 8.99 | | 0.09 | | 2.24 | | 2.33 | | (0.09) | | – |
Year Ended 10/31/2009 | | 7.92 | | 0.09 | | 1.08 | | 1.17 | | (0.10) | | – |
Year Ended 10/31/2008 | | 12.97 | | 0.10 | | (4.40) | | (4.30) | | (0.11) | | (0.64) |
(a) | The amount shown may not correlate with the change in aggregate gains and losses of portfolio securities due to the timing of sales and redemptions of fund shares. |
* | All per share amounts have been rounded to the nearest cent. |
The accompanying Notes to Financial Statements are an integral part of this schedule.
258
Thrivent Mutual Funds
Financial Highlights – continued
| | | | | | | | | | | | | | | | | | | | | | | | | | |
| | | RATIOS / SUPPLEMENTAL DATA | |
| | | | | | | | | | Ratio to Average Net
Assets** | | | Ratios to Average Net
Assets Before Expenses
Waived, Credited or Paid
Indirectly** | |
Total
Distributions | | Net Asset
Value, End of
Period | | Total
Return(b) | | | Net Assets, End
of Period
(in millions) | | Expenses | | Net
Investment
Income/(Loss) | | | Expenses | | | Net
Investment
Income/(Loss) | | | Portfolio
Turnover Rate | |
| | | | | | | | | | | | | | | | | | | | | | | | | | |
| | | | | | | | | | | | | | | | | | | | | | | | | | |
$– | | $14.28 | | | 6.97% | | | $216.6 | | 1.33% | | | (0.31)% | | | | 1.33 | % | | | (0.31)% | | | | 91 | % |
– | | 13.35 | | | 6.29% | | | 226.3 | | 1.37% | | | (0.67)% | | | | 1.37 | % | | | (0.67)% | | | | 99 | % |
– | | 12.56 | | | 22.42% | | | 239.1 | | 1.46% | | | (0.62)% | | | | 1.46 | % | | | (0.62)% | | | | 203 | % |
(0.01) | | 10.26 | | | (0.54)% | | | 221.2 | | 1.58% | | | 0.03% | | | | 1.58 | % | | | 0.03% | | | | 283 | % |
(2.32) | | 10.33 | | | (37.25)% | | | 241.9 | | 1.32% | | | 0.09% | | | | 1.33 | % | | | 0.07% | | | | 245 | % |
| | | | | | | | | | | | | | | | | | | | | | | | | | |
– | | 16.09 | | | 7.55% | | | 63.4 | | 0.77% | | | 0.26% | | | | 0.77 | % | | | 0.26% | | | | 91 | % |
– | | 14.96 | | | 6.93% | | | 60.3 | | 0.76% | | | (0.05)% | | | | 0.76 | % | | | (0.05)% | | | | 99 | % |
– | | 13.99 | | | 23.26% | | | 68.6 | | 0.78% | | | 0.05% | | | | 0.78 | % | | | 0.05% | | | | 203 | % |
(0.10) | | 11.35 | | | 0.27% | | | 58.8 | | 0.77% | | | 0.82% | | | | 0.78 | % | | | 0.82% | | | | 283 | % |
(2.32) | | 11.43 | | | (36.86)% | | | 106.7 | | 0.73% | | | 0.66% | | | | 0.74 | % | | | 0.64% | | | | 245 | % |
| | | | | | | | | | | | | | | | | | | | | | | | | | |
| | | | | | | | | | | | | | | | | | | | | | | | | | |
(0.15) | | 18.34 | | | 4.72% | | | 229.0 | | 1.03% | | | (0.36)% | | | | 1.03 | % | | | (0.36)% | | | | 46 | % |
– | | 17.67 | | | 6.32% | | | 238.0 | | 1.07% | | | (0.35)% | | | | 1.07 | % | | | (0.35)% | | | | 68 | % |
– | | 16.62 | | | 28.64% | | | 241.7 | | 1.18% | | | (0.51)% | | | | 1.18 | % | | | (0.51)% | | | | 55 | % |
– | | 12.92 | | | 26.17% | | | 201.0 | | 1.40% | | | (0.55)% | | | | 1.41 | % | | | (0.56)% | | | | 65 | % |
(2.23) | | 10.24 | | | (39.95)% | | | 165.0 | | 1.16% | | | (0.19)% | | | | 1.19 | % | | | (0.22)% | | | | 85 | % |
| | | | | | | | | | | | | | | | | | | | | | | | | | |
(0.15) | | 20.68 | | | 5.23% | | | 150.7 | | 0.53% | | | 0.13% | | | | 0.53 | % | | | 0.13% | | | | 46 | % |
– | | 19.81 | | | 6.91% | | | 152.8 | | 0.52% | | | 0.21% | | | | 0.52 | % | | | 0.21% | | | | 68 | % |
– | | 18.53 | | | 29.49% | | | 147.6 | | 0.53% | | | 0.15% | | | | 0.53 | % | | | 0.15% | | | | 55 | % |
– | | 14.31 | | | 27.31% | | | 90.8 | | 0.54% | | | 0.29% | | | | 0.55 | % | | | 0.28% | | | | 65 | % |
(2.23) | | 11.24 | | | (39.52)% | | | 45.2 | | 0.45% | | | 0.51% | | | | 0.48 | % | | | 0.49% | | | | 85 | % |
| | | | | | | | | | | | | | | | | | | | | | | | | | |
| | | | | | | | | | | | | | | | | | | | | | | | | | |
(0.05) | | 12.81 | | | 11.41% | | | 19.4 | | 1.25% | | | 0.85% | | | | 1.46 | % | | | 0.64% | | | | 83 | % |
(0.04) | | 11.55 | | | 3.57% | | | 17.8 | | 1.25% | | | 0.45% | | | | 1.43 | % | | | 0.27% | | | | 78 | % |
(0.07) | | 11.19 | | | 25.63% | | | 16.6 | | 1.25% | | | 0.60% | | | | 1.46 | % | | | 0.38% | | | | 91 | % |
(0.07) | | 8.97 | | | 14.70% | | | 13.3 | | 1.25% | | | 0.80% | | | | 1.57 | % | | | 0.48% | | | | 111 | % |
(0.73) | | 7.89 | | | (35.12)% | | | 7.4 | | 1.25% | | | 1.12% | | | | 1.41 | % | | | 0.96% | | | | 100 | % |
| | | | | | | | | | | | | | | | | | | | | | | | | | |
(0.09) | | 12.86 | | | 11.77% | | | 111.1 | | 0.91% | | | 1.20% | | | | 0.91 | % | | | 1.20% | | | | 83 | % |
(0.08) | | 11.60 | | | 3.94% | | | 100.4 | | 0.90% | | | 0.81% | | | | 0.90 | % | | | 0.81% | | | | 78 | % |
(0.09) | | 11.23 | | | 26.07% | | | 104.2 | | 0.93% | | | 0.92% | | | | 0.93 | % | | | 0.92% | | | | 91 | % |
(0.10) | | 8.99 | | | 15.02% | | | 81.0 | | 0.95% | | | 1.19% | | | | 0.97 | % | | | 1.18% | | | | 111 | % |
(0.75) | | 7.92 | | | (34.95)% | | | 69.4 | | 0.93% | | | 1.41% | | | | 0.95 | % | | | 1.38% | | | | 100 | % |
(b) Total investment return assumes dividend reinvestment and does not reflect any deduction for applicable sales charges. Not annualized for periods less than one year.
** Computed on an annualized basis for periods less than one year.
The accompanying Notes to Financial Statements are an integral part of this schedule.
259
Thrivent Mutual Funds
Financial Highlights – continued
| | | | | | | | | | | | |
| | | FOR A SHARE OUTSTANDING THROUGHOUT EACH PERIOD* |
| | | | | Income from Investment Operations | | Less Distributions from |
| | | Net Asset
Value,
Beginning of
Period | | Net
Investment
Income/(Loss) | | Net Realized
and Unrealized
Gain/(Loss) on
Investments(a) | | Total from
Investment
Operations | | Net
Investment
Income | | Net Realized
Gain on
Investments |
MID CAP STOCK FUND | | | | |
Class A Shares | | | | | | | | |
Year Ended 10/31/2012 | | $14.30 | | $(0.01) | | $1.05 | | $1.04 | | $– | | $– |
Year Ended 10/31/2011 | | 13.49 | | (0.02) | | 0.83 | | 0.81 | | – | | – |
Year Ended 10/31/2010 | | 10.89 | | – | | 2.60 | | 2.60 | | – | | – |
Year Ended 10/31/2009 | | 9.05 | | 0.01 | | 1.87 | | 1.88 | | (0.04) | | – |
Year Ended 10/31/2008 | | 17.98 | | 0.05 | | (6.60) | | (6.55) | | (0.01) | | (2.37) |
Institutional Class Shares | | | | | | | | |
Year Ended 10/31/2012 | | 15.43 | | 0.07 | | 1.13 | | 1.20 | | – | | – |
Year Ended 10/31/2011 | | 14.53 | | 0.06 | | 0.89 | | 0.95 | | (0.05) | | – |
Year Ended 10/31/2010 | | 11.71 | | 0.07 | | 2.79 | | 2.86 | | (0.04) | | – |
Year Ended 10/31/2009 | | 9.74 | | 0.07 | | 2.01 | | 2.08 | | (0.11) | | – |
Year Ended 10/31/2008 | | 19.14 | | 0.07 | | (7.02) | | (6.95) | | (0.08) | | (2.37) |
PARTNER WORLDWIDE ALLOCATION FUND | | | | |
Class A Shares | | | | | | | | |
Year Ended 10/31/2012 | | 8.30 | | 0.19 | | 0.32 | | 0.51 | | (0.08) | | – |
Year Ended 10/31/2011 | | 8.80 | | 0.10 | | (0.50) | | (0.40) | | (0.10) | | – |
Year Ended 10/31/2010 | | 7.70 | | 0.11 | | 1.10 | | 1.21 | | (0.11) | | – |
Year Ended 10/31/2009 | | 6.09 | | 0.11 | | 1.61 | | 1.72 | | (0.11) | | – |
Year Ended 10/31/2008 (c) | | 10.00 | | 0.15 | | (4.06) | | (3.91) | | – | | – |
Institutional Class Shares | | | | | | | | |
Year Ended 10/31/2012 | | 8.34 | | 0.19 | | 0.35 | | 0.54 | | (0.09) | | – |
Year Ended 10/31/2011 | | 8.83 | | 0.08 | | (0.45) | | (0.37) | | (0.12) | | – |
Year Ended 10/31/2010 | | 7.72 | | 0.13 | | 1.11 | | 1.24 | | (0.13) | | – |
Year Ended 10/31/2009 | | 6.10 | | 0.08 | | 1.66 | | 1.74 | | (0.12) | | – |
Year Ended 10/31/2008 (c) | | 10.00 | | 0.17 | | (4.07) | | (3.90) | | – | | – |
LARGE CAP GROWTH FUND | | | | |
Class A Shares | | | | | | | | |
Year Ended 10/31/2012 | | 4.92 | | 0.01 | | 0.55 | | 0.56 | | – | | – |
Year Ended 10/31/2011 | | 4.80 | | (0.01) | | 0.13 | | 0.12 | | – | | – |
Year Ended 10/31/2010 | | 4.26 | | (0.01) | | 0.56 | | 0.55 | | (0.01) | | – |
Year Ended 10/31/2009 | | 3.69 | | – | | 0.57 | | 0.57 | | – | | – |
Year Ended 10/31/2008 | | 6.52 | | – | | (2.40) | | (2.40) | | – | | (0.43) |
Institutional Class Shares | | | | | | | | |
Year Ended 10/31/2012 | | 5.28 | | 0.03 | | 0.60 | | 0.63 | | – | | – |
Year Ended 10/31/2011 | | 5.13 | | 0.01 | | 0.14 | | 0.15 | | – | | – |
Year Ended 10/31/2010 | | 4.54 | | 0.01 | | 0.60 | | 0.61 | | (0.02) | | – |
Year Ended 10/31/2009 | | 3.94 | | 0.03 | | 0.58 | | 0.61 | | (0.01) | | – |
Year Ended 10/31/2008 | | 6.93 | | 0.02 | | (2.55) | | (2.53) | | (0.03) | | (0.43) |
(a) The amount shown may not correlate with the change in aggregate gains and losses of portfolio securities due to the timing of sales and redemptions of fund shares.
(c) Since fund inception, February 29, 2008.
* All per share amounts have been rounded to the nearest cent.
The accompanying Notes to Financial Statements are an integral part of this schedule.
260
Thrivent Mutual Funds
Financial Highlights – continued
| | | | | | | | | | | | | | | | | | | | | | | | |
| | | RATIOS / SUPPLEMENTAL DATA | |
| | | | | | | | | | Ratio to Average Net
Assets** | | | Ratio to Average Net
Assets Before Expenses
Waived, Credited or Paid
Indirectly** | |
Total
Distributions | | Net Asset
Value, End of
Period | | Total
Return(b) | | | Net Assets, End
of Period
(in millions) | | Expenses | | Net
Investment
Income/(Loss) | | | Expenses | | Net
Investment
Income/(Loss) | | | Portfolio
Turnover Rate | |
| | | | | | | | | | | | | | | | | | | | | | | | |
| | | | | | | | | | | | | | | | | | | | | | | | |
| $– | | $15.34 | | | 7.27% | | | $517.5 | | 1.18% | | | (0.08)% | | | 1.18% | | | (0.08)% | | | | 36 | % |
– | | 14.30 | | | 6.00% | | | 538.7 | | 1.20% | | | (0.15)% | | | 1.20% | | | (0.15)% | | | | 35 | % |
– | | 13.49 | | | 23.88% | | | 571.1 | | 1.25% | | | 0.01% | | | 1.25% | | | 0.01% | | | | 69 | % |
(0.04) | | 10.89 | | | 20.85% | | | 517.6 | | 1.35% | | | 0.08% | | | 1.35% | | | 0.08% | | | | 56 | % |
(2.38) | | 9.05 | | | (41.38)% | | | 488.9 | | 1.20% | | | 0.34% | | | 1.21% | | | 0.33% | | | | 242 | % |
| | | | | | | | | | | | | | | | | | | | | | | | |
– | | 16.63 | | | 7.78% | | | 220.4 | | 0.72% | | | 0.38% | | | 0.72% | | | 0.38% | | | | 36 | % |
(0.05) | | 15.43 | | | 6.51% | | | 215.6 | | 0.71% | | | 0.33% | | | 0.71% | | | 0.33% | | | | 35 | % |
(0.04) | | 14.53 | | | 24.50% | | | 216.6 | | 0.73% | | | 0.55% | | | 0.73% | | | 0.55% | | | | 69 | % |
(0.11) | | 11.71 | | | 21.63% | | | 205.9 | | 0.73% | | | 0.65% | | | 0.73% | | | 0.65% | | | | 56 | % |
(2.45) | | 9.74 | | | (41.07)% | | | 217.4 | | 0.71% | | | 0.79% | | | 0.71% | | | 0.78% | | | | 242 | % |
| | | | | | | | | | | | | | | | | | | | | | | | |
| | | | | | | | | | | | | | | | | | | | | | | | |
(0.08) | | 8.73 | | | 6.20% | | | 159.5 | | 1.30% | | | 2.02% | | | 1.61% | | | 1.71% | | | | 57 | % |
(0.10) | | 8.30 | | | (4.60)% | | | 179.9 | | 1.30% | | | 1.86% | | | 1.61% | | | 1.55% | | | | 101 | % |
(0.11) | | 8.80 | | | 15.88% | | | 35.3 | | 1.30% | | | 1.61% | | | 1.64% | | | 1.27% | | | | 88 | % |
(0.11) | | 7.70 | | | 28.63% | | | 25.5 | | 1.30% | | | 2.03% | | | 1.78% | | | 1.55% | | | | 90 | % |
– | | 6.09 | | | (39.10)% | | | 15.9 | | 1.30% | | | 2.46% | | | 1.66% | | | 2.10% | | | | 47 | % |
(0.09) | | 8.79 | | | 6.58% | | | 544.6 | | 0.98% | | | 2.31% | | | 0.98% | | | 2.31% | | | | 57 | % |
(0.12) | | 8.34 | | | (4.24)% | | | 478.0 | | 1.00% | | | 2.16% | | | 1.06% | | | 2.10% | | | | 101 | % |
(0.13) | | 8.83 | | | 16.26% | | | 219.2 | | 0.99% | | | 1.95% | | | 1.19% | | | 1.75% | | | | 88 | % |
(0.12) | | 7.72 | | | 29.13% | | | 119.0 | | 0.95% | | | 2.37% | | | 1.34% | | | 1.99% | | | | 90 | % |
| | | | | | | | | | | | | | | | | | | | | | | | |
| | | | | | | | | | | | | | | | | | | | | | | | |
– | | 6.10 | | | (39.00)% | | | 47.0 | | 0.96% | | | 2.80% | | | 1.28% | | | 2.48% | | | | 47 | % |
– | | 5.48 | | | 11.38% | | | 125.0 | | 1.20% | | | 0.19% | | | 1.48% | | | (0.09)% | | | | 101 | % |
– | | 4.92 | | | 2.50% | | | 117.7 | | 1.20% | | | (0.23)% | | | 1.56% | | | (0.59)% | | | | 249 | % |
(0.01) | | 4.80 | | | 12.94% | | | 121.3 | | 1.19% | | | (0.22)% | | | 1.64% | | | (0.66)% | | | | 232 | % |
– | | 4.26 | | | 15.45% | | | 118.7 | | 1.17% | | | 0.17% | | | 1.79% | | | (0.44)% | | | | 221 | % |
(0.43) | | 3.69 | | | (39.08)% | | | 89.0 | | 1.17% | | | (0.01)% | | | 1.48% | | | (0.32)% | | | | 188 | % |
| | | | | | | | | | | | | | | | | | | | | | | | |
| | | | | | | | | | | | | | | | | | | | | | | | |
– | | 5.91 | | | 11.94% | | | 224.9 | | 0.83% | | | 0.57% | | | 0.83% | | | 0.57% | | | | 101 | % |
– | | 5.28 | | | 2.92% | | | 204.3 | | 0.83% | | | 0.14% | | | 0.83% | | | 0.14% | | | | 249 | % |
(0.02) | | 5.13 | | | 13.52% | | | 200.0 | | 0.84% | | | 0.13% | | | 0.84% | | | 0.13% | | | | 232 | % |
(0.01) | | 4.54 | | | 15.72% | | | 173.6 | | 0.84% | | | 0.56% | | | 0.84% | | | 0.56% | | | | 221 | % |
(0.46) | | 3.94 | | | (38.86)% | | | 216.4 | | 0.80% | | | 0.36% | | | 0.81% | | | 0.35% | | | | 188 | % |
(b) Total investment return assumes dividend reinvestment and does not reflect any deduction for applicable sales charges. Not annualized for periods less than one year.
** Computed on an annualized basis for periods less than one year.
The accompanying Notes to Financial Statements are an integral part of this schedule.
261
Thrivent Mutual Funds
Financial Highlights – continued
| | | | | | | | | | | | |
| | | FOR A SHARE OUTSTANDING THROUGHOUT EACH PERIOD* |
| | | | | Income from Investment Operations | | Less Distributions from |
| | | Net Asset Value,
Beginning of
Period | | Net
Investment
Income/(Loss) | | Net Realized
and Unrealized
Gain/(Loss) on
Investments(a) | | Total from
Investment
Operations | | Net
Investment
Income | | Net Realized
Gain on
Investments |
LARGE CAP VALUE FUND | | | | | | | | | | | | |
Class A Shares | | | | | | | | | | | | |
Year Ended 10/31/2012 | | $12.94 | | $0.22 | | $1.67 | | $1.89 | | $(0.17) | | $– |
Year Ended 10/31/2011 | | 12.61 | | 0.19 | | 0.26 | | 0.45 | | (0.12) | | – |
Year Ended 10/31/2010 | | 11.55 | | 0.13 | | 1.07 | | 1.20 | | (0.14) | | – |
Year Ended 10/31/2009 | | 11.10 | | 0.17 | | 0.52 | | 0.69 | | (0.24) | | – |
Year Ended 10/31/2008 | | 17.92 | | 0.27 | | (6.09) | | (5.82) | | (0.19) | | (0.81) |
Institutional Class Shares | | | | | | | | | | | | |
Year Ended 10/31/2012 | | 13.04 | | 0.27 | | 1.70 | | 1.97 | | (0.25) | | – |
Year Ended 10/31/2011 | | 12.71 | | 0.24 | | 0.28 | | 0.52 | | (0.19) | | – |
Year Ended 10/31/2010 | | 11.64 | | 0.18 | | 1.10 | | 1.28 | | (0.21) | | – |
Year Ended 10/31/2009 | | 11.19 | | 0.23 | | 0.54 | | 0.77 | | (0.32) | | – |
Year Ended 10/31/2008 | | 18.07 | | 0.30 | | (6.10) | | (5.80) | | (0.27) | | (0.81) |
LARGE CAP STOCK FUND | | | | | | | | | | | | |
Class A Shares | | | | | | | | | | | | |
Year Ended 10/31/2012 | | 21.30 | | 0.20 | | 2.29 | | 2.49 | | (0.15) | | – |
Year Ended 10/31/2011 | | 20.87 | | 0.13 | | 0.37 | | 0.50 | | (0.07) | | – |
Year Ended 10/31/2010 | | 18.87 | | 0.06 | | 2.04 | | 2.10 | | (0.10) | | – |
Year Ended 10/31/2009 | | 17.67 | | 0.15 | | 1.31 | | 1.46 | | (0.26) | | – |
Year Ended 10/31/2008 | | 31.33 | | 0.24 | | (10.28) | | (10.04) | | (0.23) | | (3.39) |
Institutional Class Shares | | | | | | | | | | | | |
Year Ended 10/31/2012 | | 21.48 | | 0.30 | | 2.30 | | 2.60 | | (0.26) | | – |
Year Ended 10/31/2011 | | 21.05 | | 0.24 | | 0.38 | | 0.62 | | (0.19) | | – |
Year Ended 10/31/2010 | | 19.02 | | 0.15 | | 2.09 | | 2.24 | | (0.21) | | – |
Year Ended 10/31/2009 | | 17.84 | | 0.25 | | 1.31 | | 1.56 | | (0.38) | | – |
Year Ended 10/31/2008 | | 31.59 | | 0.35 | | (10.35) | | (10.00) | | (0.36) | | (3.39) |
BALANCED FUND | | | | | | | | | | | | |
Class A Shares | | | | | | | | | | | | |
Year Ended 10/31/2012 | | 12.11 | | 0.13 | | 0.83 | | 0.96 | | (0.13) | | (0.31) |
Year Ended 10/31/2011 | | 11.68 | | 0.16 | | 0.42 | | 0.58 | | (0.15) | | – |
Year Ended 10/31/2010 | | 10.20 | | 0.15 | | 1.48 | | 1.63 | | (0.15) | | – |
Year Ended 10/31/2009 | | 8.91 | | 0.14 | | 1.30 | | 1.44 | | (0.15) | | – |
Year Ended 10/31/2008 | | 13.64 | | 0.23 | | (3.89) | | (3.66) | | (0.23) | | (0.84) |
Institutional Class Shares | | | | | | | | | | | | |
Year Ended 10/31/2012 | | 12.09 | | 0.19 | | 0.82 | | 1.01 | | (0.18) | | (0.31) |
Year Ended 10/31/2011 | | 11.66 | | 0.21 | | 0.43 | | 0.64 | | (0.21) | | – |
Year Ended 10/31/2010 | | 10.19 | | 0.20 | | 1.47 | | 1.67 | | (0.20) | | – |
Year Ended 10/31/2009 | | 8.90 | | 0.19 | | 1.30 | | 1.49 | | (0.20) | | – |
Year Ended 10/31/2008 | | 13.63 | | 0.28 | | (3.88) | | (3.60) | | (0.29) | | (0.84) |
(a) The amount shown may not correlate with the change in aggregate gains and losses of portfolio securities due to the timing of sales and redemptions of fund shares.
* | All per share amounts have been rounded to the nearest cent. |
The accompanying Notes to Financial Statements are an integral part of this schedule.
262
Thrivent Mutual Funds
Financial Highlights – continued
| | | | | | | | | | | | | | | | | | | | | | | | | | | | | | | | |
| | | | RATIOS / SUPPLEMENTAL DATA | |
| | | | | | | | | | | | Ratio to Average Net
Assets** | | | Ratios to Average Net
Assets Before Expenses
Waived, Credited or Paid
Indirectly** | |
Total
Distributions | | Net Asset
Value, End of
Period | | | Total
Return(b) | | | Net Assets,
End of Period
(in millions) | | | Expenses | | | Net Investment
Income/(Loss) | | | Expenses | | | Net
Investment
Income/(Loss) | | | Portfolio
Turnover Rate | |
| | | | | | | | | | | | | | | | | | | | | | | | | | | | | | | | |
| | | | | | | | | | | | | | | | | | | | | | | | | | | | | | | | |
| $(0.17) | | | $14.66 | | | | 14.82% | | | | $171.1 | | | | 1.04 | % | | | 1.42 | % | | | 1.04 | % | | | 1.42 | % | | | 92 | % |
(0.12) | | | 12.94 | | | | 3.49% | | | | 164.5 | | | | 1.06 | % | | | 1.22 | % | | | 1.06 | % | | | 1.22 | % | | | 74 | % |
(0.14) | | | 12.61 | | | | 10.45% | | | | 176.0 | | | | 1.10 | % | | | 0.91 | % | | | 1.10 | % | | | 0.91 | % | | | 115 | % |
(0.24) | | | 11.55 | | | | 6.54% | | | | 179.6 | | | | 1.17 | % | | | 1.48 | % | | | 1.18 | % | | | 1.48 | % | | | 105 | % |
(1.00) | | | 11.10 | | | | (34.17)% | | | | 187.4 | | | | 1.01 | % | | | 1.71 | % | | | 1.02 | % | | | 1.71 | % | | | 49 | % |
| | | | | | | | | | | | | | | | | | | | | | | | | | | | | | | | |
(0.25) | | | 14.76 | | | | 15.37% | | | | 403.0 | | | | 0.53 | % | | | 1.92 | % | | | 0.53 | % | | | 1.92 | % | | | 92 | % |
(0.19) | | | 13.04 | | | | 4.03% | | | | 356.0 | | | | 0.52 | % | | | 1.76 | % | | | 0.52 | % | | | 1.76 | % | | | 74 | % |
(0.21) | | | 12.71 | | | | 11.09% | | | | 331.2 | | | | 0.53 | % | | | 1.46 | % | | | 0.53 | % | | | 1.46 | % | | | 115 | % |
(0.32) | | | 11.64 | | | | 7.32% | | | | 273.5 | | | | 0.52 | % | | | 2.10 | % | | | 0.52 | % | | | 2.10 | % | | | 105 | % |
(1.08) | | | 11.19 | | | | (33.88)% | | | | 268.9 | | | | 0.50 | % | | | 2.21 | % | | | 0.50 | % | | | 2.21 | % | | | 49 | % |
| | | | | | | | | | | | | | | | | | | | | | | | | | | | | | | | |
| | | | | | | | | | | | | | | | | | | | | | | | | | | | | | | | |
(0.15) | | | 23.64 | | | | 11.75% | | | | 1,382.5 | | | | 1.09 | % | | | 0.84 | % | | | 1.09 | % | | | 0.84 | % | | | 124 | % |
(0.07) | | | 21.30 | | | | 2.39% | | | | 1,393.5 | | | | 1.11 | % | | | 0.56 | % | | | 1.11 | % | | | 0.56 | % | | | 146 | % |
(0.10) | | | 20.87 | | | | 11.16% | | | | 1,549.4 | | | | 1.13 | % | | | 0.29 | % | | | 1.13 | % | | | 0.29 | % | | | 185 | % |
(0.26) | | | 18.87 | | | | 8.55% | | | | 1,579.3 | | | | 1.20 | % | | | 0.82 | % | | | 1.20 | % | | | 0.82 | % | | | 149 | % |
(3.62) | | | 17.67 | | | | (35.72)% | | | | 1,658.8 | | | | 1.03 | % | | | 1.03 | % | | | 1.04 | % | | | 1.03 | % | | | 93 | % |
| | | | | | | | | | | | | | | | | | | | | | | | | | | | | | | | |
(0.26) | | | 23.82 | | | | 12.27% | | | | 170.3 | | | | 0.62 | % | | | 1.30 | % | | | 0.62 | % | | | 1.30 | % | | | 124 | % |
(0.19) | | | 21.48 | | | | 2.89% | | | | 170.2 | | | | 0.60 | % | | | 1.06 | % | | | 0.60 | % | | | 1.06 | % | | | 146 | % |
(0.21) | | | 21.05 | | | | 11.80% | | | | 176.4 | | | | 0.61 | % | | | 0.81 | % | | | 0.61 | % | | | 0.81 | % | | | 185 | % |
(0.38) | | | 19.02 | | | | 9.15% | | | | 174.2 | | | | 0.62 | % | | | 1.39 | % | | | 0.62 | % | | | 1.39 | % | | | 149 | % |
(3.75) | | | 17.84 | | | | (35.42)% | | | | 164.2 | | | | 0.57 | % | | | 1.49 | % | | | 0.57 | % | | | 1.48 | % | | | 93 | % |
| | | | | | | | | | | | | | | | | | | | | | | | | | | | | | | | |
| | | | | | | | | | | | | | | | | | | | | | | | | | | | | | | | |
(0.44) | | | 12.63 | | | | 8.22% | | | | 141.0 | | | | 1.11 | % | | | 1.06 | % | | | 1.12 | % | | | 1.06 | % | | | 197 | % |
(0.15) | | | 12.11 | | | | 4.98% | | | | 141.0 | | | | 1.12 | % | | | 1.25 | % | | | 1.13 | % | | | 1.24 | % | | | 211 | % |
(0.15) | | | 11.68 | | | | 16.04% | | | | 148.9 | | | | 1.17 | % | | | 1.30 | % | | | 1.17 | % | | | 1.30 | % | | | 219 | % |
(0.15) | | | 10.20 | | | | 16.42% | | | | 144.0 | | | | 1.23 | % | | | 1.55 | % | | | 1.24 | % | | | 1.54 | % | | | 264 | % |
(1.07) | | | 8.91 | | | | (28.76)% | | | | 143.0 | | | | 1.09 | % | | | 1.96 | % | | | 1.11 | % | | | 1.94 | % | | | 176 | % |
| | | | | | | | | | | | | | | | | | | | | | | | | | | | | | | | |
(0.49) | | | 12.61 | | | | 8.72% | | | | 49.9 | | | | 0.66 | % | | | 1.52 | % | | | 0.67 | % | | | 1.51 | % | | | 197 | % |
(0.21) | | | 12.09 | | | | 5.50% | | | | 52.7 | | | | 0.65 | % | | | 1.73 | % | | | 0.65 | % | | | 1.72 | % | | | 211 | % |
(0.20) | | | 11.66 | | | | 16.55% | | | | 56.6 | | | | 0.67 | % | | | 1.80 | % | | | 0.67 | % | | | 1.80 | % | | | 219 | % |
(0.20) | | | 10.19 | | | | 17.12% | | | | 54.2 | | | | 0.66 | % | | | 2.11 | % | | | 0.67 | % | | | 2.10 | % | | | 264 | % |
(1.13) | | | 8.90 | | | | (28.43)% | | | | 50.7 | | | | 0.61 | % | | | 2.44 | % | | | 0.63 | % | | | 2.41 | % | | | 176 | % |
(b) Total investment return assumes dividend reinvestment and does not reflect any deduction for applicable sales charges. Not annualized for periods less than one year.
** | Computed on an annualized basis for periods less than one year. |
The accompanying Notes to Financial Statements are an integral part of this schedule.
263
Thrivent Mutual Funds
Financial Highlights – continued
| | | | | | | | | | | | |
| | | | | FOR A SHARE OUTSTANDING THROUGHOUT EACH PERIOD* |
| | | | | Income from Investment Operations | | Less Distributions from |
| | | Net Asset
Value,
Beginning of
Period | | Net
Investment
Income/(Loss) | | Net Realized
and Unrealized
Gain/(Loss) on
Investments(a) | | Total from
Investment
Operations | | Net
Investment
Income | | Net Realized
Gain on
Investments |
HIGH YIELD FUND | | | | |
Class A Shares | | | | | | | | | | | | |
Year Ended 10/31/2012 | | $4.71 | | $0.34 | | $0.30 | | $0.64 | | $(0.34) | | $– |
Year Ended 10/31/2011 | | 4.86 | | 0.36 | | (0.15) | | 0.21 | | (0.36) | | – |
Year Ended 10/31/2010 | | 4.47 | | 0.37 | | 0.39 | | 0.76 | | (0.37) | | – |
Year Ended 10/31/2009 | | 3.59 | | 0.36 | | 0.87 | | 1.23 | | (0.35) | | – |
Year Ended 10/31/2008 | | 5.03 | | 0.36 | | (1.43) | | (1.07) | | (0.37) | | – |
Institutional Class Shares | | | | | | | | | | | | |
Year Ended 10/31/2012 | | 4.72 | | 0.35 | | 0.29 | | 0.64 | | (0.35) | | – |
Year Ended 10/31/2011 | | 4.86 | | 0.38 | | (0.14) | | 0.24 | | (0.38) | | – |
Year Ended 10/31/2010 | | 4.47 | | 0.39 | | 0.38 | | 0.77 | | (0.38) | | – |
Year Ended 10/31/2009 | | 3.59 | | 0.38 | | 0.87 | | 1.25 | | (0.37) | | – |
Year Ended 10/31/2008 | | 5.04 | | 0.38 | | (1.44) | | (1.06) | | (0.39) | | – |
MUNICIPAL BOND FUND | | | | |
Class A Shares | | | | | | | | | | | | |
Year Ended 10/31/2012 | | 11.30 | | 0.44 | | 0.63 | | 1.07 | | (0.44) | | – |
Year Ended 10/31/2011 | | 11.42 | | 0.46 | | (0.10) | | 0.36 | | (0.46) | | (0.02) |
Year Ended 10/31/2010 | | 11.15 | | 0.47 | | 0.27 | | 0.74 | | (0.47) | | – |
Year Ended 10/31/2009 | | 10.37 | | 0.48 | | 0.79 | | 1.27 | | (0.48) | | (0.01) |
Year Ended 10/31/2008 | | 11.16 | | 0.48 | | (0.79) | | (0.31) | | (0.48) | | – |
Institutional Class Shares | | | | | | | | | | | | |
Year Ended 10/31/2012 | | 11.30 | | 0.47 | | 0.63 | | 1.10 | | (0.47) | | – |
Year Ended 10/31/2011 | | 11.42 | | 0.49 | | (0.10) | | 0.39 | | (0.49) | | (0.02) |
Year Ended 10/31/2010 | | 11.15 | | 0.50 | | 0.27 | | 0.77 | | (0.50) | | – |
Year Ended 10/31/2009 | | 10.36 | | 0.51 | | 0.80 | | 1.31 | | (0.51) | | (0.01) |
Year Ended 10/31/2008 | | 11.16 | | 0.51 | | (0.80) | | (0.29) | | (0.51) | | – |
INCOME FUND | | | | |
Class A Shares | | | | | | | | | | | | |
Year Ended 10/31/2012 | | 8.77 | | 0.33 | | 0.61 | | 0.94 | | (0.33) | | – |
Year Ended 10/31/2011 | | 8.80 | | 0.38 | | (0.03) | | 0.35 | | (0.38) | | – |
Year Ended 10/31/2010 | | 8.12 | | 0.40 | | 0.68 | | 1.08 | | (0.40) | | – |
Year Ended 10/31/2009 | | 6.92 | | 0.40 | | 1.21 | | 1.61 | | (0.41) | | – |
Year Ended 10/31/2008 | | 8.50 | | 0.42 | | (1.57) | | (1.15) | | (0.43) | | – |
Institutional Class Shares | | | | | | | | | | | | |
Year Ended 10/31/2012 | | 8.76 | | 0.37 | | 0.60 | | 0.97 | | (0.36) | | – |
Year Ended 10/31/2011 | | 8.79 | | 0.42 | | (0.03) | | 0.39 | | (0.42) | | – |
Year Ended 10/31/2010 | | 8.12 | | 0.44 | | 0.67 | | 1.11 | | (0.44) | | – |
Year Ended 10/31/2009 | | 6.91 | | 0.43 | | 1.22 | | 1.65 | | (0.44) | | �� – |
Year Ended 10/31/2008 | | 8.49 | | 0.45 | | (1.57) | | (1.12) | | (0.46) | | – |
(a) | The amount shown may not correlate with the change in aggregate gains and losses of portfolio securities due to the timing of sales and redemptions of fund shares. |
* | All per share amounts have been rounded to the nearest cent. |
The accompanying Notes to Financial Statements are an integral part of this schedule.
264
Thrivent Mutual Funds
Financial Highlights – continued
| | | | | | | | | | | | | | | | | | | | | | | | | | | | | | | | |
| | | | RATIOS / SUPPLEMENTAL DATA | |
| | | | | | | | | | | | Ratio to Average Net
Assets** | | | Ratios to Average Net
Assets Before Expenses
Waived, Credited or Paid
Indirectly** | |
Total
Distributions | | Net Asset
Value, End of
Period | | | Total
Return(b) | | |
Net Assets,
End of Period
(in millions) | | | Expenses | | | Net Investment
Income/(Loss) | | | Expenses | | | Net Investment
Income/(Loss) | | | Portfolio
Turnover Rate | |
| | | | | | | | | | | | | | | | | | | | | | | | | | | | | | | | |
| | | | | | | | | | | | | | | | | | | | | | | | | | | | | | | | |
| $(0.34) | | | $5.01 | | | | 13.96% | | | | $520.0 | | | | 0.82 | % | | | 6.95 | % | | | 0.82 | % | | | 6.95 | % | | | 52 | % |
| (0.36) | | | 4.71 | | | | 4.37% | | | | 445.3 | | | | 0.84 | % | | | 7.43 | % | | | 0.84 | % | | | 7.43 | % | | | 63 | % |
| (0.37) | | | 4.86 | | | | 17.65% | | | | 448.1 | | | | 0.86 | % | | | 7.96 | % | | | 0.86 | % | | | 7.96 | % | | | 83 | % |
| (0.35) | | | 4.47 | | | | 36.32% | | | | 403.7 | | | | 0.93 | % | | | 9.24 | % | | | 0.93 | % | | | 9.24 | % | | | 54 | % |
| (0.37) | | | 3.59 | | | | (22.70)% | | | | 318.8 | | | | 0.87 | % | | | 7.81 | % | | | 0.88 | % | | | 7.79 | % | | | 51 | % |
| | | | | | | | |
| | | | | | | | | | | | | | | | | | | | | | | | | | | | | | | | |
| (0.35) | | | 5.01 | | | | 14.12% | | | | 285.7 | | | | 0.47 | % | | | 7.30 | % | | | 0.47 | % | | | 7.30 | % | | | 52 | % |
| (0.38) | | | 4.72 | | | | 4.98% | | | | 243.4 | | | | 0.47 | % | | | 7.80 | % | | | 0.47 | % | | | 7.80 | % | | | 63 | % |
| (0.38) | | | 4.86 | | | | 18.12% | | | | 254.6 | | | | 0.46 | % | | | 8.36 | % | | | 0.46 | % | | | 8.36 | % | | | 83 | % |
| (0.37) | | | 4.47 | | | | 36.96% | | | | 230.9 | | | | 0.46 | % | | | 9.57 | % | | | 0.46 | % | | | 9.57 | % | | | 54 | % |
(0.39) | | | 3.59 | | | | (22.52)% | | | | 129.4 | | | | 0.44 | % | | | 8.31 | % | | | 0.45 | % | | | 8.30 | % | | | 51 | % |
| | | | | | | | | | | | | | | | | | | | | | | | | | | | | | | | |
| | | | | | | | | | | | | | | | | | | | | | | | | | | | | | | | |
| (0.44) | | | 11.93 | | | | 9.61% | | | | 1,532.0 | | | | 0.74 | % | | | 3.76 | % | | | 0.74 | % | | | 3.76 | % | | | 13 | % |
| (0.48) | | | 11.30 | | | | 3.39% | | | | 1,339.6 | | | | 0.76 | % | | | 4.19 | % | | | 0.76 | % | | | 4.19 | % | | | 8 | % |
| (0.47) | | | 11.42 | | | | 6.79% | | | | 1,384.5 | | | | 0.76 | % | | | 4.20 | % | | | 0.76 | % | | | 4.20 | % | | | 9 | % |
| (0.49) | | | 11.15 | | | | 12.48% | | | | 1,246.5 | | | | 0.78 | % | | | 4.43 | % | | | 0.78 | % | | | 4.43 | % | | | 8 | % |
| (0.48) | | | 10.37 | | | | (2.92)% | | | | 1,104.8 | | | | 0.78 | % | | | 4.36 | % | | | 0.78 | % | | | 4.36 | % | | | 9 | % |
| | | | | | | | | | | | | | | | | | | | | | | | | | | | | | | | |
| (0.47) | | | 11.93 | | | | 9.89% | | | | 102.5 | | | | 0.49 | % | | | 4.02 | % | | | 0.49 | % | | | 4.02 | % | | | 13 | % |
| (0.51) | | | 11.30 | | | | 3.67% | | | | 86.5 | | | | 0.49 | % | | | 4.46 | % | | | 0.49 | % | | | 4.46 | % | | | 8 | % |
| (0.50) | | | 11.42 | | | | 7.08% | | | | 95.3 | | | | 0.50 | % | | | 4.46 | % | | | 0.50 | % | | | 4.46 | % | | | 9 | % |
| (0.52) | | | 11.15 | | | | 12.90% | | | | 86.4 | | | | 0.50 | % | | | 4.69 | % | | | 0.50 | % | | | 4.69 | % | | | 8 | % |
(0.51) | | | 10.36 | | | | (2.71)% | | | | 35.1 | | | | 0.47 | % | | | 4.69 | % | | | 0.47 | % | | | 4.69 | % | | | 9 | % |
| | | | | | | | | | | | | | | | | | | | | | | | | | | | | | | | |
| | | | | | | | | | | | | | | | | | | | | | | | | | | | | | | | |
| (0.33) | | | 9.38 | | | | 10.92% | | | | 448.0 | | | | 0.77 | % | | | 3.69 | % | | | 0.77 | % | | | 3.69 | % | | | 117 | % |
| (0.38) | | | 8.77 | | | | 4.11% | | | | 397.9 | | | | 0.79 | % | | | 4.38 | % | | | 0.79 | % | | | 4.38 | % | | | 138 | % |
| (0.40) | | | 8.80 | | | | 13.66% | | | | 405.1 | | | | 0.80 | % | | | 4.81 | % | | | 0.81 | % | | | 4.80 | % | | | 146 | % |
| (0.41) | | | 8.12 | | | | 24.03% | | | | 365.9 | | | | 0.84 | % | | | 5.53 | % | | | 0.85 | % | | | 5.53 | % | | | 173 | % |
| (0.43) | | | 6.92 | | | | (14.19)% | | | | 326.2 | | | | 0.80 | % | | | 5.16 | % | | | 0.81 | % | | | 5.15 | % | | | 160 | % |
| | | | | | | | | | | | | | | | | | | | | | | | | | | | | | | | |
| (0.36) | | | 9.37 | | | | 11.34% | | | | 456.1 | | | | 0.39 | % | | | 4.07 | % | | | 0.39 | % | | | 4.07 | % | | | 117 | % |
| (0.42) | | | 8.76 | | | | 4.52% | | | | 401.1 | | | | 0.39 | % | | | 4.78 | % | | | 0.39 | % | | | 4.77 | % | | | 138 | % |
| (0.44) | | | 8.79 | | | | 13.99% | | | | 370.7 | | | | 0.39 | % | | | 5.23 | % | | | 0.40 | % | | | 5.22 | % | | | 146 | % |
| (0.44) | | | 8.12 | | | | 24.76% | | | | 383.1 | | | | 0.39 | % | | | 5.98 | % | | | 0.40 | % | | | 5.97 | % | | | 173 | % |
| (0.46) | | | 6.91 | | | | (13.85)% | | | | 318.5 | | | | 0.39 | % | | | 5.58 | % | | | 0.40 | % | | | 5.57 | % | | | 160 | % |
(b) Total investment return assumes dividend reinvestment and does not reflect any deduction for applicable sales charges. Not annualized for periods less than one year.
** Computed on an annualized basis for periods less than one year.
The accompanying Notes to Financial Statements are an integral part of this schedule.
265
Thrivent Mutual Funds
Financial Highlights – continued
| | | | | | | | | | | | |
| | | FOR A SHARE OUTSTANDING THROUGHOUT EACH PERIOD* |
| | | | | Income from Investment Operations | | Less Distributions from |
| | | Net Asset
Value,
Beginning of
Period | | Net
Investment
Income/(Loss) | | Net Realized
and Unrealized
Gain/(Loss) on
Investments(a) | | Total from
Investment
Operations | | Net
Investment
Income | | Net Realized
Gain on
Investments |
CORE BOND FUND |
Class A Shares | | | | | | | | | | | | |
Year Ended 10/31/2012 | | $10.19 | | $0.26 | | $0.50 | | $0.76 | | $(0.25) | | $– |
Year Ended 10/31/2011 | | 10.11 | | 0.37 | | 0.08 | | 0.45 | | (0.37) | | – |
Year Ended 10/31/2010 | | 9.36 | | 0.39 | | 0.75 | | 1.14 | | (0.39) | | – |
Year Ended 10/31/2009 | | 8.36 | | 0.37 | | 1.02 | | 1.39 | | (0.39) | | – |
Year Ended 10/31/2008 | | 9.77 | | 0.45 | | (1.40) | | (0.95) | | (0.46) | | – |
Institutional Class Shares | | | | | | | | | | | | |
Year Ended 10/31/2012 | | 10.19 | | 0.30 | | 0.51 | | 0.81 | | (0.29) | | – |
Year Ended 10/31/2011 | | 10.11 | | 0.40 | | 0.08 | | 0.48 | | (0.40) | | – |
Year Ended 10/31/2010 | | 9.36 | | 0.43 | | 0.74 | | 1.17 | | (0.42) | | – |
Year Ended 10/31/2009 | | 8.36 | | 0.40 | | 1.02 | | 1.42 | | (0.42) | | – |
Year Ended 10/31/2008 | | 9.78 | | 0.48 | | (1.41) | | (0.93) | | (0.49) | | – |
GOVERNMENT BOND FUND |
Class A Shares | | | | | | | | | | | | |
Year Ended 10/31/2012 | | 10.69 | | 0.11 | | 0.32 | | 0.43 | | (0.11) | | (0.25) |
Year Ended 10/31/2011 | | 10.56 | | 0.19 | | 0.21 | | 0.40 | | (0.19) | | (0.08) |
Year Ended 10/31/2010 (c) | | 10.00 | | 0.11 | | 0.56 | | 0.67 | | (0.11) | | – |
Institutional Class Shares | | | | | | | | | | | | |
Year Ended 10/31/2012 | | 10.69 | | 0.14 | | 0.32 | | 0.46 | | (0.14) | | (0.25) |
Year Ended 10/31/2011 | | 10.57 | | 0.23 | | 0.20 | | 0.43 | | (0.23) | | (0.08) |
Year Ended 10/31/2010 (c) | | 10.00 | | 0.13 | | 0.57 | | 0.70 | | (0.13) | | – |
LIMITED MATURITY BOND FUND |
Class A Shares | | | | | | | | | | | | |
Year Ended 10/31/2012 | | 12.41 | | 0.19 | | 0.20 | | 0.39 | | (0.18) | | – |
Year Ended 10/31/2011 | | 12.58 | | 0.28 | | (0.17) | | 0.11 | | (0.28) | | – |
Year Ended 10/31/2010 | | 12.24 | | 0.38 | | 0.34 | | 0.72 | | (0.38) | | – |
Year Ended 10/31/2009 | | 11.40 | | 0.46 | | 0.83 | | 1.29 | | (0.45) | | – |
Year Ended 10/31/2008 | | 12.53 | | 0.52 | | (1.13) | | (0.61) | | (0.52) | | – |
Institutional Class Shares | | | | | | | | | | | | |
Year Ended 10/31/2012 | | 12.40 | | 0.22 | | 0.21 | | 0.43 | | (0.21) | | – |
Year Ended 10/31/2011 | | 12.58 | | 0.31 | | (0.18) | | 0.13 | | (0.31) | | – |
Year Ended 10/31/2010 | | 12.23 | | 0.42 | | 0.34 | | 0.76 | | (0.41) | | – |
Year Ended 10/31/2009 | | 11.40 | | 0.50 | | 0.82 | | 1.32 | | (0.49) | | – |
Year Ended 10/31/2008 | | 12.53 | | 0.56 | | (1.13) | | (0.57) | | (0.56) | | – |
(a) | The amount shown may not correlate with the change in aggregate gains and losses of portfolio securities due to the timing of sales and redemptions of fund shares. |
(c) | Since fund inception, February 26, 2010. |
* | All per share amounts have been rounded to the nearest cent. |
The accompanying Notes to Financial Statements are an integral part of this schedule.
266
Thrivent Mutual Funds
Financial Highlights – continued
| | | | | | | | | | | | | | | | |
| | RATIOS / SUPPLEMENTAL DATA |
| | | | | | | | | Ratio to Average Net
Assets** | | Ratios to Average Net
Assets Before Expenses
Waived, Credited or Paid
Indirectly** |
Total
Distributions | | Net Asset
Value, End of
Period | | Total
Return(b) | | Net Assets, End
of Period
(in millions) | | Expenses | | Net Investment
Income/(Loss) | | Expenses | | Net
Investment
Income/(Loss) | | Portfolio
Turnover Rate |
| | | | | | | | | | | | | | | | |
| | | | | | | | | | | | | | | | |
| $(0.25) | | $10.70 | | 7.59% | | $249.2 | | 0.85% | | 2.53% | | 0.94% | | 2.44% | | 355% |
(0.37) | | 10.19 | | 4.53% | | 236.3 | | 0.85% | | 3.64% | | 0.95% | | 3.54% | | 333% |
(0.39) | | 10.11 | | 12.42% | | 245.0 | | 0.86% | | 4.08% | | 0.97% | | 3.96% | | 307% |
(0.39) | | 9.36 | | 17.12% | | 231.4 | | 0.89% | | 4.35% | | 1.01% | | 4.24% | | 409% |
(0.46) | | 8.36 | | (10.13)% | | 223.5 | | 0.83% | | 4.77% | | 0.95% | | 4.65% | | 344% |
| | | | | | | | | | | | | | | | |
| | | | | | | | | | | | | | | | |
| (0.29) | | 10.71 | | 8.03% | | 37.0 | | 0.53% | | 2.93% | | 0.54% | | 2.91% | | 355% |
(0.40) | | 10.19 | | 4.88% | | 56.5 | | 0.52% | | 3.97% | | 0.53% | | 3.95% | | 333% |
(0.42) | | 10.11 | | 12.79% | | 50.1 | | 0.53% | | 4.42% | | 0.55% | | 4.40% | | 307% |
(0.42) | | 9.36 | | 17.54% | | 64.0 | | 0.53% | | 4.71% | | 0.54% | | 4.69% | | 409% |
(0.49) | | 8.36 | | (9.92)% | | 65.0 | | 0.50% | | 5.12% | | 0.52% | | 5.10% | | 344% |
| | | | | | | | | | | | | | | | |
| | | | | | | | | | | | | | | | |
(0.36) | | 10.76 | | 4.08% | | 14.5 | | 0.89% | | 1.02% | | 0.99% | | 0.93% | | 191% |
(0.27) | | 10.69 | | 3.99% | | 7.3 | | 0.92% | | 1.82% | | 1.00% | | 1.74% | | 183% |
(0.11) | | 10.56 | | 6.73% | | 5.9 | | 0.87% | | 1.61% | | 0.87% | | 1.61% | | 146% |
| | | | | | | | | | | | | | | | |
| | | | | | | | | | | | | | | | |
(0.39) | | 10.76 | | 4.44% | | 98.0 | | 0.55% | | 1.38% | | 0.55% | | 1.38% | | 191% |
(0.31) | | 10.69 | | 4.25% | | 94.6 | | 0.57% | | 2.18% | | 0.57% | | 2.18% | | 183% |
(0.13) | | 10.57 | | 7.04% | | 105.6 | | 0.60% | | 1.94% | | 0.60% | | 1.94% | | 146% |
| | | | | | | | | | | | | | | | |
| | | | | | | | | | | | | | | | |
(0.18) | | 12.62 | | 3.18% | | 408.2 | | 0.60% | | 1.51% | | 0.61% | | 1.50% | | 113% |
(0.28) | | 12.41 | | 0.87% | | 344.8 | | 0.61% | | 2.20% | | 0.61% | | 2.19% | | 109% |
(0.38) | | 12.58 | | 5.97% | | 272.7 | | 0.64% | | 3.09% | | 0.64% | | 3.09% | | 131% |
(0.45) | | 12.24 | | 11.62% | | 128.1 | | 0.73% | | 3.98% | | 0.73% | | 3.98% | | 164% |
(0.52) | | 11.40 | | (5.03)% | | 90.5 | | 0.68% | | 4.22% | | 0.70% | | 4.20% | | 113% |
| | | | | | | | | | | | | | | | |
| | | | | | | | | | | | | | | | |
(0.21) | | 12.62 | | 3.52% | | 472.6 | | 0.36% | | 1.77% | | 0.36% | | 1.77% | | 113% |
(0.31) | | 12.40 | | 1.05% | | 584.7 | | 0.35% | | 2.45% | | 0.36% | | 2.45% | | 109% |
(0.41) | | 12.58 | | 6.35% | | 530.8 | | 0.36% | | 3.38% | | 0.37% | | 3.38% | | 131% |
(0.49) | | 12.23 | | 11.93% | | 455.6 | | 0.37% | | 4.35% | | 0.38% | | 4.35% | | 164% |
(0.56) | | 11.40 | | (4.71)% | | 376.9 | | 0.35% | | 4.56% | | 0.36% | | 4.54% | | 113% |
(b) Total investment return assumes dividend reinvestment and does not reflect any deduction for applicable sales charges. Not annualized for periods less than one year.
** Computed on an annualized basis for periods less than one year.
The accompanying Notes to Financial Statements are an integral part of this schedule.
267
Thrivent Mutual Funds
Financial Highlights – continued
| | | | | | | | | | | | | | |
| | | FOR A SHARE OUTSTANDING THROUGHOUT EACH PERIOD* |
| | | | | | | Income from Investment Operations | | Less Distributions from |
| | | | | Net Asset
Value,
Beginning of
Period | | Net
Investment
Income/(Loss) | | Net Realized
and Unrealized
Gain/(Loss) on
Investments(a) | | Total from
Investment
Operations | | Net
Investment
Income | | Net Realized
Gain on
Investments |
MONEY MARKET FUND | | | | | | | | | | | | |
Class A Shares | | | | | | | | | | | | |
Year Ended 10/31/2012 | | $1.00 | | $– | | $– | | $– | | $– | | $– |
Year Ended 10/31/2011 | | 1.00 | | – | | – | | – | | – | | – |
Year Ended 10/31/2010 | | 1.00 | | – | | – | | – | | – | | – |
Year Ended 10/31/2009 | | 1.00 | | 0.01 | | – | | 0.01 | | (0.01) | | – |
Year Ended 10/31/2008 | | 1.00 | | 0.03 | | – | | 0.03 | | (0.03) | | – |
Institutional Class Shares | | | | | | | | | | | | |
Year Ended 10/31/2012 | | 1.00 | | – | | – | | – | | – | | – |
Year Ended 10/31/2011 | | 1.00 | | – | | – | | – | | – | | – |
Year Ended 10/31/2010 | | 1.00 | | – | | – | | – | | – | | – |
Year Ended 10/31/2009 | | 1.00 | | 0.01 | | – | | 0.01 | | (0.01) | | – |
Year Ended 10/31/2008 | | 1.00 | | 0.03 | | – | | 0.03 | | (0.03) | | – |
(a) The amount shown may not correlate with the change in aggregate gains and losses of portfolio securities due to the timing of sales and redemptions of fund shares.
* | All per share amounts have been rounded to the nearest cent. |
The accompanying Notes to Financial Statements are an integral part of this schedule.
268
Thrivent Mutual Funds
Financial Highlights – continued
| | | | | | | | | | | | | | | | |
| | | RATIOS / SUPPLEMENTAL DATA |
| | | | | | | | | Ratio to Average Net
Assets** | | Ratios to Average Net
Assets Before Expenses Waived,
Credited or Paid Indirectly** |
Total
Distributions | | Net Asset
Value, End of
Period | | Total
Return(b) | | Net Assets, End
of Period
(in millions) | | Expenses | | Net
Investment
Income/(Loss) | | Expenses | | Net
Investment
Income/(Loss) | | Portfolio
Turnover Rate |
| | | | | | | | | | | | | | | | |
| | | | | | | | | | | | | | | | |
$– | | $1.00 | | 0.00% | | $493.9 | | 0.29% | | 0.00% | | 0.93% | | (0.64)% | | N/A |
– | | 1.00 | | 0.00% | | 587.9 | | 0.30% | | 0.00% | | 0.93% | | (0.63)% | | N/A |
– | | 1.00 | | 0.00% | | 717.0 | | 0.30% | | 0.00% | | 0.88% | | (0.57)% | | N/A |
(0.01) | | 1.00 | | 0.61% | | 1,017.3 | | 0.60% | | 0.63% | | 0.83% | | 0.40% | | N/A |
(0.03) | | 1.00 | | 3.21% | | 1,306.0 | | 0.54% | | 3.14% | | 0.74% | | 2.94% | | N/A |
| | | | | | | | | | | | | | | | |
– | | 1.00 | | 0.00% | | 12.5 | | 0.29% | | 0.00% | | 0.58% | | (0.29)% | | N/A |
– | | 1.00 | | 0.00% | | 11.6 | | 0.30% | | 0.00% | | 0.56% | | (0.27)% | | N/A |
– | | 1.00 | | 0.00% | | 14.5 | | 0.30% | | 0.00% | | 0.52% | | (0.22)% | | N/A |
(0.01) | | 1.00 | | 0.80% | | 68.4 | | 0.40% | | 0.93% | | 0.50% | | 0.83% | | N/A |
(0.03) | | 1.00 | | 3.41% | | 223.3 | | 0.35% | | 3.45% | | 0.45% | | 3.36% | | N/A |
(b) Total investment return assumes dividend reinvestment and does not reflect any deduction for applicable sales charges. Not annualized for periods less than one year.
** Computed on an annualized basis for periods less than one year.
The accompanying Notes to Financial Statements are an integral part of this schedule.
269
Additional Information
(unaudited)
Shareholder Notification of Federal Tax Information
The following information is provided solely to satisfy the requirements set forth by the Internal Revenue Code. Shareholders will be provided information regarding their distributions in January 2013.
The Funds designate the following percentages of dividends declared from net investment income as dividends qualifying for the 70% dividends received deduction for corporations or as qualified dividend income for individuals under the Jobs and Growth Tax Relief Reconciliation Act of 2003 for the tax period ending October 31, 2012:
| | | | | | | | |
Fund | | Dividends
Received
Deduction
for
Corporations | | | Qualified
Dividend
Income for
Individuals | |
Aggressive Allocation | | | 85 | % | | | 100 | % |
Moderately Aggressive Allocation | | | 39 | % | | | 63 | % |
Moderate Allocation | | | 19 | % | | | 25 | % |
Moderately Conservative Allocation | | | 12 | % | | | 16 | % |
Partner Small Cap Value | | | 100 | % | | | 100 | % |
Partner Mid Cap Value | | | 100 | % | | | 100 | % |
Partner Worldwide Allocation | | | 3 | % | | | 100 | % |
Large Cap Growth | | | 100 | % | | | 100 | % |
Large Cap Value | | | 100 | % | | | 100 | % |
Large Cap Stock | | | 99 | % | | | 100 | % |
Balanced | | | 23 | % | | | 30 | % |
High Yield | | | 1 | % | | | 1 | % |
Income | | | 1 | % | | | 1 | % |
Core Bond | | | 0 | % | | | 1 | % |
Limited Maturity Bond | | | 0 | % | | | 1 | % |
The Municipal Bond Fund designates 99.58% of the dividends declared from net investment income as exempt from federal income tax for the tax period ended October 31, 2012.
Pursuant to IRC 852(b)(3) of the Internal Revenue Code, the Funds hereby designate the following amounts as long-term capital gains distributed during the year ended October 31, 2012, or if subsequently determined to be different, the net capital gain of such year:
| | | | |
Fund | | Distributions
of Long- Term
Capital Gains | |
Moderate Allocation | | $ | 1,509,022 | |
Moderately Conservative Allocation | | $ | 2,320,624 | |
Partner Small Cap Value | | $ | 2,250,423 | |
Mid Cap Growth | | $ | 3,699,684 | |
Large Cap Stock | | $ | 375,096 | |
Balanced | | $ | 4,829,710 | |
Government Bond | | $ | 1,327,120 | |
These amounts may include earnings and profits distributed to shareholders on the redemption of shares as part of the dividend paid deduction.
Proxy Voting
The policies and procedures that the Trust uses to determine how to vote proxies relating to portfolio securities are attached to the Trust’s Statement of Additional Information. You may request a free copy of the Statement of Additional Information or the report of how the Trust voted proxies relating to portfolio securities during the most recent 12-month period ended June 30 by calling 1-800-847-4836. You also may review the Statement of Additional Information or the report of how the Trust voted proxies relating to portfolio securities during the most recent 12-month period ended June 30 at www.thrivent.com or www.sec.gov.
Quarterly Schedule of Portfolio Holdings
The Trust files its Schedule of Portfolio Holdings on Form N-Q with the SEC for the first and third quarters of each fiscal year. You may request a free copy of the Trust’s Forms N-Q by calling 1-800-847-4836. The Trust’s most recent Form N-Q Schedule of Investments also is at www.thrivent.com or www.sec.gov. You also may review and copy the Forms N-Q for the Trust at the SEC’s Public Reference Room in Washington, DC. You may get information about the operation of the Public Reference Room by calling 1-800-SEC-0330.
270
Board of Trustees and Officers
The following table provides information about the Trustees and Officers of the Trust. Each Trustee oversees each of the 26 series of the Trust and also serves as:
| | • | | Director of Thrivent Series Fund, Inc., a registered investment company consisting of 36 portfolios that serve as underlying funds for variable contracts issued by Thrivent Financial for Lutherans (“Thrivent Financial”) and Thrivent Life Insurance Company and investment options in the retirement plan offered by Thrivent Financial, and |
| | • | | Trustee of Thrivent Financial Securities Lending Trust, a registered investment company consisting of one portfolio that serves as a cash collateral fund for a securities lending program sponsored by Thrivent Financial. |
The 26 series of the Trust, the 36 portfolios of Thrivent Series Fund, Inc. and Thrivent Financial Securities Lending Trust are referred to herein as the “Fund Complex.” The Statement of Additional Information includes additional information about the Trustees and is available, without charge, by calling 1-800-847-4836.
Interested Trustee (1)(2)(3)(4)
| | |
Name
(Year of Birth)
Year Elected | | Principal Occupation(s) and Directorships of Public Companies and Other Investment Companies
During the Past Five Years |
Russell W. Swansen
(1957)
2008 | | Senior Vice President, Chief Investment Officer, Thrivent Financial since 2003 |
Independent Trustees (2)(3)(4)(5)
| | |
Name
(Year of Birth)
Year Elected | | Principal Occupation(s) and Directorships of Public Companies and Other Investment Companies
During the Past Five Years |
Janice B. Case
(1952)
2011 | | Independent Trustee of North American Electric Reliability Corporation (self-regulatory organization) since 2008; Independent Director of Western Electricity Coordinating Council (nonprofit corporation coordinating and promoting bulk electric system reliability) from 2002 through 2008; Independent Director/Trustee of three affiliated family of funds (AEGON/Transamerica Series Trust (consisted of 40 funds), Transamerica IDEX Funds (consisted of 53 funds) and Transamerica Income Shares, Inc. (consisted of one fund)) from 2001 through 2007; Independent Director of Central Vermont Public Service Corporation (electric utility) from 2001 through 2007; Advisory Board Director of AmSouth Bank, N.A. from 1997 through 2007 |
| |
Richard L. Gady
(1943)
1987 | | Retired |
| |
Richard A. Hauser
(1943)
2004 | | Vice President and Assistant General Counsel, Boeing Company since 2007; President, National Legal Center for the Public Interest from 2004 to 2007. Previously, Director of Washington Hospital Center |
| |
Marc S. Joseph
(1960)
2011 | | Managing Director of GraniteRidgeLLP (consulting and advisory firm) since 2009; Managing Director of MJosephLLC (private investing and consulting firm) since 2004 |
| |
Paul R. Laubscher
(1956)
2009
| | Portfolio Manager for U.S. and international equity portfolios and private real estate portfolios of IBM Retirement Funds |
| |
James A. Nussle
(1960)
2011 | | President and Chief Operating Officer of Growth Energy (trade association) since 2010; Advisory Board member of AVISTA Capital Partners (private equity firm) since 2010; Contributor on CNBC (media) since 2010; CEO of The Nussle Group LLC (consulting firm) since 2009; Director of the Office of Management and Budget from 2007 through 2009; CEO of The Nussle Group, Navigating Strategies LLC (consulting firm) from January 2007 through September 2007; and Member of Congress in U.S. House of Representatives from 1991 through 2007. Currently, Advisory Board member of AVISTA Capital Partners |
| |
Douglas D. Sims
(1946)
2006 | | Currently, Director of Keystone Neighbourhood Company, Keystone Center and Keystone Science School. Previously, Director of the Center for Corporate Excellence |
271
Board of Trustees and Officers
| | |
Name (Year of Birth) Year Elected | | Principal Occupation(s) and Directorships of Public Companies and Other
Investment Companies During the Past Five Years |
Constance L. Souders
(1950)
2007 | | Retired; previously Director from 1983 to 2007, Executive Vice President from 2001 to 2007 and AML Compliance Officer from 2003 to 2007 of Harbor Capital Advisors, Inc.; Director from 1992 to 2007, President from 2000 to 2007 and AML Compliance Officer from 2003 to 2007 of Harbor Services Group, Inc.; Director from 1992 to 2007, Executive Vice President from 2001 to 2007, Chief Compliance Officer from 2004 to 2007, AML Compliance Officer from 2003 to 2007 and Supervisory Registered Principal from 2000 to 2007 of Harbor Funds Distributors, Inc.; Vice President from 2000 to 2007 of Harbor Funds |
Executive Officers (4)
| | |
Name (Year of Birth)
Position Held With Thrivent | | Principal Occupation(s) During the Past Five Years |
Russell W. Swansen (1957) President | | Senior Vice President, Chief Investment Officer, Thrivent Financial since 2003 |
| |
David S. Royal (1971) Secretary and Chief Legal Officer | | Vice President and Managing Counsel since 2006; Interim Investment Company and Investment Adviser Chief Compliance Officer from May 2010 until December 2010 |
| |
Gerard V. Vaillancourt (1967) Treasurer and Principal Accounting Officer | | Vice President, Mutual Fund Accounting since 2006 |
| |
Ted S. Dryden (1965) Chief Compliance Officer | | Investment Company and Investment Adviser Chief Compliance Officer, Thrivent Financial since December 2010; Chief Compliance Officer, OptumHealth Financial Services from 2009 to 2010; Vice President, Asset Management Compliance, Ameriprise Financial from 2006 to 2009 |
| |
Janice M. Guimond (1965) Vice President | | Vice President, Investment Operations, Thrivent Financial since 2004 |
| |
Kathleen M. Koelling (1977) Anti-Money Laundering Officer (6) | | Privacy and Anti-Money Laundering Officer, Thrivent Financial since 2010; Senior Counsel, Thrivent Financial since 2002 |
| |
Mark D. Anema (1961) Vice President | | Vice President, Accumulation and Retirement Income Solutions, Thrivent Financial since 2007; Vice President, Strategic Planning, Thrivent Financial from 2004 to 2007 |
| |
Jody L. Bancroft (1971) Assistant Vice President | | Director, Investment Field Operations, Thrivent Financial since 2009; Director, Annuity & Settlement Option New Services, Thrivent Financial from 2007 until 2009; Manager, Life & Health New Business Services, Thrivent Financial from 2006 to 2007 |
| |
James M. Odland (1955) Assistant Secretary | | Vice President and Managing Counsel, Thrivent Financial since 2005 |
| |
Rebecca A. Paulzine (1979) Assistant Secretary | | Counsel, Thrivent Financial since January 2010; Associate, Faegre & Benson LLP from 2005 to December 2009 |
| |
Todd J. Kelly (1969) Assistant Treasurer (6) | | Director, Fund Accounting Operations, Thrivent Financial since 2002 |
| |
Sarah L. Bergstrom (1977) Assistant Treasurer | | Director, Fund Accounting Administration, Thrivent Financial since 2007; Manager, Fund Accounting Administration, Thrivent Financial from 2005 to 2007 |
(1) | “Interested Trustee” of the Fund as defined in the Investment Company Act of 1940 by virtue of positions with Thrivent Financial. Mr. Swansen is considered an interested trustee because of his principal occupation with Thrivent Financial. |
(2) | Each Trustee generally serves an indefinite term until her or his successor is duly elected and qualified. Trustees serve at the discretion of the board until their successors are duly appointed and qualified. |
(3) | Each Trustee oversees 63 portfolios. |
(4) | The address for each Trustee and Officer unless otherwise noted is 625 Fourth Avenue South, Minneapolis, MN 55415 |
(5) | The Trustees other than Mr. Swansen are not “interested trustees” of the Fund and are referred to as “Independent Trustees.” |
(6) | The address for this Officer is 4321 North Ballard Road, Appleton, WI 54913 |
272
1

We’re listening to you!
In response to concerns regarding multiple mailings, we send one copy of a shareholder report and one copy of a prospectus for Thrivent Mutual Funds to each household. This consolidation helps reduce printing and postage costs, thereby saving money. If you wish to receive an additional copy of this report, call us toll-free at 800-847-4836.
Choose Paperless Delivery
By signing below, I request electronic delivery of the following documents regarding my Thrivent Mutual Funds and variable insurance products issued by Thrivent Financial for Lutherans and Thrivent Life Insurance Company (including Thrivent Series Fund, Inc.):
| | | | |
• Prospectus | | • Annual and semiannual reports | | • Annual privacy notices |
I understand and agree to the following:
| | |
• I will receive electronic delivery of Thrivent documents designated above. | | |
• I will no longer receive paper copies of these documents in the mail. | | 
|
• A link to a printable copy of the annual privacy notice will be sent to me by electronic means at the email address I provide. I will continue to receive any daily confirmations and copies of the Thrivent Financial health privacy notice and/or Notice of Insurance Information Practices by regular mail. | |
• I will receive periodic emails directing me to Thrivent Financial’s website where documents will be available. | |
• I will update Thrivent Financial if my email address changes. | |
• I have the ability to access the Internet at my own cost and will need Adobe® Reader® to view the documents. (If I don’t have it, I can download Reader® free from adobe.com) | |
• This consent can be used for Thrivent Financial products I currently own or may purchase in the future, until consent is revoked. | |
• I can request specific documents in paper form free of charge without revoking this consent by calling Thrivent Financial Customer Service at 800-847-4836. | |
• My consent will remain in effect until I revoke it. I can revoke this consent or update my information at any time by changing my preference to “U.S. Mail” in the Preference Center at Thrivent.com/gopaperless (requires registration) or by calling 800-847-4836. | | |
Each investor requesting eDelivery must complete.
| | | | | | | | |
Investor 1: | | | | | | Investor 2: | | |
| | (Please print first and last name.) | | | | | | (Please print first and last name.) |
| | | | | | | | |
Address (If different than above): | | |
Securities offered through Thrivent Investment Management Inc., 625 Fourth Ave. S., Minneapolis, MN 55415, a FINRA and SIPC member and a wholly owned subsidiary of Thrivent Financial for Lutherans.
Item 2. Code of Ethics
As of the end of the period covered by this report, registrant has adopted a code of ethics (as defined in Item 2 of Form N-CSR) applicable to registrant’s Principal Executive Officer, Principal Financial Officer and Principal Accounting Officer. No waivers were granted to such code of ethics during the period covered by this report. A copy of this code of ethics is filed as an exhibit to this Form N-CSR.
Item 3. Audit Committee Financial Expert
Registrant’s Board of Trustees has determined that Constance L. Souders, an independent trustee, is the Audit Committee Financial Expert.
Item 4. Principal Accountant Fees and Services
The aggregate fees billed by registrant’s independent public accountants, PricewaterhouseCoopers LLP (“PwC”), for the fiscal year ended October 31, 2011 and the fiscal year ended October 31, 2012, for professional services rendered in connection with the audit of registrant’s annual financial statements or services that are normally provided by the accountant in connection with statutory and regulatory filings or engagements were $335,601.08 and $342,409.51, respectively.
The aggregate fees PwC billed to registrant for the fiscal year ended October 31, 2011 and the fiscal year ended October 31, 2012, for assurance and other services that are reasonably related to the performance of registrant’s audit and are not reported under Item 4(a), were $0 for each respective period. The aggregate fees PwC billed to registrant’s investment adviser and any entity controlling, controlled by, or under common control with registrant’s investment adviser for the fiscal year ended October 31, 2011 and the fiscal year ended October 31, 2012, for assurance and other services directly related to the operations and financial reporting of registrant, were $0 for each respective period.
The aggregate tax fees PwC billed to registrant for the fiscal year ended October 31, 2011 and the fiscal year ended October 31, 2012, for tax compliance, tax advice and tax planning services, were $121,530.00 and $111,090.00, respectively. The aggregate tax fees PwC billed to registrant’s investment adviser and any entity controlling, controlled by, or under common control with registrant’s investment adviser for the fiscal year ended October 31, 2011 and the fiscal year ended October 31, 2012, for services directly related to the operations and financial reporting of registrant, were $0 for each respective period.
The aggregate fees PwC billed to registrant for the fiscal year ended October 31, 2011 and the fiscal year ended October 31, 2012 for products and services provided, other than the services reported in paragraphs (a) through (c) of this item, were $0 for each respective period. The aggregate fees PwC billed to registrant’s investment adviser and any entity controlling, controlled by, or under common control with registrant’s investment adviser for the fiscal year ended October 31, 2011 and the fiscal year ended October 31, 2012, for products and services provided, other than the services reported in paragraphs (a) through (c) of this item, were $1,800 and $6,800.00, respectively. These payments were for access to a PwC-sponsored online library that provides interpretive guidance regarding U.S. and foreign accounting standards. In 2012, these payments also included services provided related to the mergers of certain series of Thrivent Series Fund, Inc.. These figures are also reported in response to item 4(g) below.
| | (e) | Registrant’s audit committee charter provides that the audit committee (comprised of the independent Trustees of registrant) is responsible for pre-approval of all auditing services performed for the registrant. The audit committee also is responsible for pre-approval (subject to the de minimis exceptions for non-audit services described in Section 10A(i)(1)(B) of the Securities Exchange Act of 1934) of all non-auditing services performed for the registrant or an affiliate of registrant. In addition, registrant’s audit committee charter permits a designated member of the audit committee to pre-approve, between meetings, one or more audit or non-audit service projects, subject to an expense limit and notification to the audit committee at the next committee meeting. Registrant’s audit committee pre-approved all fees described above that PwC billed to registrant. |
| | (f) | Less than 50% of the hours billed by PwC for auditing services to registrant for the fiscal year ended October 31, 2012 was for work performed by persons other than full-time permanent employees of PwC. |
| | (g) | The aggregate non-audit fees billed by PwC to registrant and to registrant’s investment adviser and any entity controlling, controlled by, or under common control with registrant’s investment adviser for the fiscal year ended October 31, 2011 and the fiscal year ended October 31, 2012 were $1,800 and $6,800.00 for each respective period. These figures are also reported in response to item 4(d) above. |
| | (h) | Registrant’s audit committee has considered the non-audit services provided to the registrant and registrant’s investment adviser and any entity controlling, controlled by, or under common control with registrant’s investment adviser as described above and determined that these services do not compromise PwC’s independence. |
Item 5. Audit Committee of Listed Registrants
Not applicable.
Item 6. Schedule of Investments
(a) Registrant’s Schedule of Investments is included in the report to shareholders filed under Item 1.
(b) Not applicable to this filing.
Item 7. Disclosure of Proxy Voting Policies and Procedures for Closed-End Management Investment Companies
Not applicable.
Item 8. Portfolio Managers of Closed-End Management Investment Companies
Not applicable.
Item 9. Purchases of Equity Securities by Closed-End Management Investment Company and Affiliated Purchasers.
Not applicable.
Item 10. Submission of Matters to a Vote of Security Holders
There have been no material changes to the procedures by which shareholders may recommend nominees to registrant’s board of trustees.
Item 11. Controls and Procedures
(a)(i) Registrant’s President and Treasurer have concluded that registrant’s disclosure controls and procedures (as defined in Rule 30a-3(c) under the Investment Company Act of 1940) are effective, based on their evaluation of these controls and procedures as of a date within 90 days of the filing date of this report.
(a)(ii) Registrant’s President and Treasurer are aware of no change in registrant’s internal control over financial reporting (as defined in Rule 30a-3(d) under the Investment Company Act of 1940) that occurred during registrant’s most recent fiscal quarter that has materially affected, or is reasonably likely to materially affect, registrant’s internal control over financial reporting.
Item 12. Exhibits
(a) The code of ethics pursuant to Item 2 is attached hereto.
(b) Certifications pursuant to Rules 30a-2(a) and 30a-2(b) under the Investment Company Act of 1940 are attached hereto.
SIGNATURES
Pursuant to the requirements of the Securities Exchange Act of 1934 and the Investment Company Act of 1940, the registrant has duly caused this report to be signed on its behalf by the undersigned, thereunto duly authorized.
| | | | |
| Date: December 28, 2012 | | THRIVENT MUTUAL FUNDS |
| | |
| | By: | | |
| | | | /s/ Russell W. Swansen |
| | | | Russell W. Swansen |
| | | | President |
Pursuant to the requirements of the Securities Exchange Act of 1934 and the Investment Company Act of 1940, this report has been signed below by the following persons on behalf of the registrant and in the capacities and on the dates indicated.
| | | | |
| Date: December 28, 2012 | | By: | | |
| | |
| | | | /s/ Russell W. Swansen |
| | | | Russell W. Swansen |
| | | | President |
| | |
| Date: December 28, 2012 | | By: | | |
| | |
| | | | /s/ Gerard V. Vaillancourt |
| | | | Gerard V. Vaillancourt |
| | | | Treasurer |