UNITED STATES
SECURITIES AND EXCHANGE COMMISSION
Washington, D.C. 20549
FORM N-CSR
CERTIFIED SHAREHOLDER REPORT OF REGISTERED MANAGEMENT INVESTMENT
COMPANIES
Investment Company Act file number: 811-05075
Thrivent Mutual Funds
(Exact name of registrant as specified in charter)
625 Fourth Avenue South
Minneapolis, Minnesota 55415
(Address of principal executive offices) (Zip code)
Michael W. Kremenak
625 Fourth Avenue South
Minneapolis, Minnesota 55415
(Name and address of agent for service)
Registrant’s telephone number, including area code: (612) 844-4198
Date of fiscal year end: October 31
Date of reporting period: October 31, 2013
Item 1. Report to Stockholders

Table of Contents
Dear Shareholder:
The stock market soared in the fiscal year ending October 31, 2013, as the U.S. economy continued its slow but persistent expansion and Europe showed signs of emerging from a recession. Fixed-income markets mostly fell as investors worried that the improving economic picture might prompt the Federal Reserve to begin tempering its accommodative monetary policy.
Economic Review
After a slow start, the U.S. economy picked up steam as the 12-month reporting period progressed. By the third quarter of 2013, the nation’s gross domestic product (GDP) was expanding at an annual rate of 2.8%, according to the advance estimate of the Bureau of Economic Analysis. The economy has now grown in 16 of the past 17 quarters.
The private sector expanded at an even faster rate during the reporting period, at an estimated 3.4% pace in the third quarter. Reduced spending by the federal government kept the final GDP number below that level.
Among the sectors contributing to the economy’s improved performance were consumer spending and commercial and residential construction. Housing starts rose in August to a seasonally adjusted annual rate of 891,000 units, up 19% from a year earlier.
Despite the favorable economic news, the recovery from the 2008–2009 recession has been sluggish by historical standards, with GDP growth averaging about 2% annually over the last three years. That is only about half what we would expect in a more normal recovery, and it has translated into sluggish improvement in the job market, too. On average, the economy created nearly 200,000 nonfarm payrolls a month during the 12-month reporting period, yet the country still has roughly 1.5 million fewer jobs today than it did prior to the recession.
With the economy begrudgingly adding jobs, the unemployment rate continued to inch lower during the reporting period, falling from 7.9% in October 2012 to 7.2% in September 2013. It ticked up to 7.3% in October 2013 after the federal government closed for 16 days, temporarily adding hundreds of thousands of federal workers to the ranks of the unemployed. The shutdown was triggered when Congress failed to reach agreement on a federal spending plan for the U.S. fiscal year that began October 1.
Economic conditions also improved in Europe and China, which are important to the U.S. economy and its financial markets. After a year and a half of economic contraction, GDP for the 17-country eurozone grew 0.3% in the second quarter according to Eurostat, the statistical office of the European Union. China, after watching its economic growth slow for much of the past three years, saw its GDP rise 7.5% year-over-year in the second quarter, then jump 7.8% in the third.
Market Review
The stock market rose steadily during the reporting period. It received an early boost on New Year’s Day when Congress voted to permanently extend most of the temporary income tax cuts enacted by former President George W. Bush, a move viewed as bullish for the economy. Prices then continued to rise as the economic recovery gained speed, the Federal Reserve stuck to its campaign of stimulating economic growth by keeping interest rates low, and overseas economies showed early signs of a rebound.
In late March, the S&P 500 Index of large-company stocks set its first record high since October 2007. It finished the reporting period with a total return of 27.2%. Small-company stocks did even better, with the Russell 2000® Index earning 36.3%.
Stocks in developed markets overseas also posted stellar returns as the economy in Europe appeared to stabilize and fears about the sustainability of the euro faded. Investors also were encouraged by Japan’s shift to fiscal and monetary policies aimed at promoting economic growth in that country. The MSCI EAFE Index, which tracks developed markets in Europe, Australasia and Far East, posted a total return of 26.9%.
Emerging market stocks largely sat out the party, with the MSCI Emerging Markets Index posting a total return of 6.9%. The index slumped during the second quarter as investors worried about slowing economic growth in China, India and Brazil, and about lower commodities prices, which adversely impact the many natural resources companies located in emerging economies. Prices reversed course in October when China’s economy began showing new signs of strength.
Fixed-income markets were mostly higher in the first half of the reporting period, but tumbled in the second as investors speculated that the Federal Reserve might begin backing away from its easy monetary policy as soon as September. In particular, they worried that the Fed might begin to wind down its latest quantitative easing program in which it has been buying $85 billion of bonds each month to help keep long-term interest rates low. By the end of the reporting period, that still hadn’t happened. Nonetheless, the yield on the benchmark 10-year Treasury bond had risen nearly a percentage point to just under 2.6%. When interest rates rise, bond prices go down. With most sectors of the bond market taking their lead from Treasuries, the broad Barclays U.S. Aggregate Bond Index finished the reporting period with a loss of 1.1%. Treasuries did much worse, with the Barclays 20+ Treasury Bond Index losing 10.5%. High-yield corporate bonds, which often trade in sympathy with stocks, were among the few sectors to escape the downturn. The Barclays U.S. Corporate High Yield Bond Index posted a positive return of 8.8%.
Our Outlook
Five years into an economic recovery, we have enjoyed extraordinary gains in the financial markets, particularly in equities. Valuations are now relatively high, tempering our expectations for the future.
Our forecasting models suggest the economic recovery will persevere through the year ahead, albeit at about the same plodding rate we have experienced for the past three years. The political stalemate in Washington that led to the government shutdown is likely to continue as well, although we do not anticipate that Congress will allow another
2
shutdown any time soon given the public backlash that followed the last one. On the other hand, there also is little likelihood of a tax-and-spending “grand bargain” that would have a meaningful impact on the nation’s growing long-term debt. That debt could become a bigger threat to the economy as time passes.
Against that backdrop, the unemployment rate should continue to inch down at a modest rate. The Fed will eventually conclude that the economy is healthy enough to pull back from its easy monetary policy, but the impact on the financial markets should be modest given that it is already on the radar screen of most investors. Leading indicators suggest that China and Europe should enjoy moderate economic growth as well.
The bulk of the stock market’s gains in the reporting period were attributable not to growth in corporate profits, which was good but not extraordinary, but rather to an expansion of price-to-earnings multiples. That suggests investors were expecting an even better economic environment—and higher corporate profits—ahead. If their enthusiasm is rewarded, U.S. stocks could add to last year’s gains in 2014, although it is hard to envision a scenario in which they match last year’s performance. We see more attractive stock valuations in Europe, particularly in shares of large European companies that generate their profits globally.
Fixed-income markets will continue to battle two big headwinds: Congress’ inability to agree on a long-term debt-reduction plan, and the impending shift in Fed monetary policy. We would not be surprised to see another modest loss in the Treasury sector, although the high-yield bond and leveraged loan sectors could notch moderate gains as fixed-income investors continue their search for yield in a low-interest-rate environment.
If you are uncertain about how your portfolio is positioned to weather the months ahead, we encourage you to meet with your Thrivent Financial representative. He or she can make sure your portfolio remains aligned with your financial goals and tolerance for risk.
As always, thank you for the trust you have placed in our entire team of professionals at Thrivent Asset Management.
Sincerely,

Russell W. Swansen
President and Chief Investment Officer
Thrivent Mutual Funds
3
Thrivent Aggressive Allocation Fund
Russell W. Swansen, David C. Francis, CFA and Mark L. Simenstad, CFA, Portfolio Co-Managers
The Fund seeks long-term capital growth.
The Fund invests in other Thrivent mutual funds and in directly held equity and debt instruments. The Fund is subject to its own operating expenses and the operating expenses of the other funds in which it invests, and is subject to all of the risks of the other funds in which it invests. The value of the Fund is influenced by factors impacting the overall market, certain asset classes, certain investment styles, and specific issuers. The Fund may incur losses due to incorrect assessments of investments by its investment adviser. Foreign investments involve additional risks, including currency fluctuations, liquidity, political, economic and market instability, and different legal and accounting standards. Bond prices generally fall as interest rates rise. Credit risk is the risk that an issuer of a debt security may not pay its debt, and high yield securities are subject to increased credit risk as well as liquidity risk. The use of equity index futures involves transaction costs and the loss from investing in them can exceed the initial investment.
How did the Fund perform during the 12-month period ended October 31, 2013?
Thrivent Aggressive Allocation Fund earned a return of 24.64%, compared with the median return of its peer group, the Lipper Multi-Cap Core Funds category, of 29.31%. The Fund’s market benchmarks, the S&P 500 Index and the Barclays U.S. Aggregate Bond Index, earned returns of 27.18% and -1.08%, respectively.
What factors affected the Fund’s performance?
Most major equity markets meaningfully outperformed fixed-income markets in the period. Across equity markets, small and mid-cap domestic stocks outperformed large caps in both domestic and foreign developed markets. Emerging market equities, while positive, provided dramatically lower returns versus most other stock groups.
In fixed income, Treasury and agency securities underperformed both investment-grade corporate and high-yield bonds. The Fund’s return in its fixed-income segment bested the bond index because our portfolio had limited exposure to the underperforming sectors.
The Fund’s return was aided by its significant exposure to equities across most major market segments. We were overweighted in large-cap stocks within our equity portfolio, which partially limited our advance because large-cap stocks did not keep pace with small and mid caps, although returns to all categories were quite attractive on an absolute basis.
Over the period, the Fund had an average exposure to fixed-income securities of 6%. Our holdings performed well versus the fixed-income benchmark, but even the best segment of bonds did not keep pace with the strong advance in U.S. stocks. Performance across the actively managed equity segments of the Fund was mixed. The large-cap growth and value segments outperformed while the mid-cap growth and small-cap core portfolios underperformed, each measured versus their respective benchmarks. However, absolute returns for all of the domestic equity segments of the Fund were quite good.
Within our international section, we had exposure to emerging markets debt and equity, and both of those segments—while performing well against their respective indexes—did not keep pace with the broader market advance. In total, results were close to management expectations given the asset mix of the portfolio.
What is your outlook?
As the period drew to a close, we became modestly more conservative in our portfolio positioning. Within fixed income, in the absence of an unexpected decline in the economy, we believe U.S. Treasury and agency securities are overvalued due to an aggressive purchase program that the Federal Reserve Bank has undertaken. As a result, we are overweighted in corporate bonds, and underweighted in Treasury and agency securities.
In equities, we have taken steps to modestly reduce our equity exposure. With the significant advance in global stock markets, it is difficult to represent that stocks are undervalued. At best, we would suggest equities are fairly valued. That does not mean any decline is imminent; in our process, however, it suggests it is appropriate to modestly adjust allocations.
While the rally certainly could continue to advance, we feel it would likely be at a more moderate pace. We do think that within equities, small and mid-cap domestic stocks are richly priced versus large caps, and that within large caps, non-U.S. stocks provide better opportunities. Thus, we have tilted the portfolio positions to take advantage of those opportunities.
Quoted Fund performance is for Class A shares and does not reflect a sales charge.
The returns shown do not reflect taxes a shareholder would pay on distributions or redemptions.
4
| | | | |
| Portfolio Composition | |
| (% of Portfolio) | |
Large Cap | | | 49.5 | % |
International | | | 21.9 | % |
Small Cap | | | 9.9 | % |
Mid Cap | | | 7.6 | % |
Short-Term Investments | | | 5.9 | % |
Natural Resources | | | 2.1 | % |
Investment Grade Debt | | | 1.9 | % |
High Yield | | | 1.2 | % |
| | | | |
Total | | | 100.0 | % |
| | | | |
| Top 10 Holdings | |
| (% of Net Assets) | |
Thrivent Partner Worldwide Allocation Fund | | | 15.1 | % |
Thrivent Partner Small Cap Growth Fund | | | 8.3 | % |
Thrivent Large Cap Growth Fund | | | 7.0 | % |
Thrivent Large Cap Value Fund | | | 6.2 | % |
Thrivent Mid Cap Stock Fund | | | 5.7 | % |
Thrivent Mid Cap Growth Fund | | | 5.0 | % |
Thrivent Partner Mid Cap Value Fund | | | 3.5 | % |
Thrivent Large Cap Stock Fund | | | 3.5 | % |
Thrivent Small Cap Stock Fund | | | 3.0 | % |
Thrivent Natural Resources Fund | | | 2.2 | % |
These securities represent 59.5% of the total net assets of the Fund.
Portfolio Composition illustrates market exposure of all asset classes, including derivatives.
The list of Top 10 Holdings excludes short-term investments.
Quoted Portfolio Composition and Top 10 Holdings are subject to change.
Average Annual Total Returns1
As of October 31, 2013
| | | | | | | | | | | | |
Class A2 | | 1-Year | | | 5 Years | | | From
Inception
6/30/2005 | |
without sales charge | | | 24.64 | % | | | 13.74 | % | | | 6.52 | % |
with sales charge | | | 17.80 | % | | | 12.46 | % | | | 5.80 | % |
| | | |
Institutional Class3 | | 1-Year | | | 5 Years | | | From
Inception
6/30/2005 | |
Net Asset Value | | | 25.11 | % | | | 14.18 | % | | | 6.92 | % |

1 | Past performance is not an indication of future results. Average annual total returns represent past performance and reflect changes in share prices, the reinvestment of all dividends and capital gains, and the effects of compounding. The prospectus contains more complete information on the investment objectives, risks, charges and expenses of the investment company, which investors should read and consider carefully before investing. To obtain a prospectus, contact a registered representative or visit www.thrivent.com. At various times, the Fund’s adviser waived its management fee and/or reimbursed Fund expenses. Had the adviser not done so, the Fund’s total returns would have been lower. The returns shown do not reflect taxes a shareholder would pay on distributions or redemptions. Total investment return and principal value of your investment will fluctuate, and your shares, when redeemed, may be worth more or less than their original cost. Current performance may be higher or lower than the performance data quoted. Call 800-THRIVENT or visit www.thrivent.com for performance results current to the most recent month-end. |
2 | Class A performance with sales charge reflects the maximum sales charge of 5.5%. |
3 | Institutional Class shares have no sales load and are for institutional shareholders only. |
(a) | Performance of other classes will be greater or less than the line shown based on the differences in loads and fees paid by shareholders investing in the different classes. |
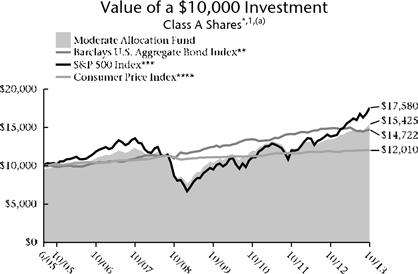
* | As you compare performance, please note that the Fund’s performance reflects the maximum 5.5% sales charge, while the Consumer Price Index, the S&P 500 Index and the Barclays U.S. Aggregate Bond Index do not reflect any such charges. If you were to purchase any of the above individual securities represented in those Indexes, any charges you would pay would reduce your total return as well. |
** | The Barclays U.S. Aggregate Bond Index is an index that measures the performance of U.S. investment grade bonds. It is not possible to invest directly in the Index. The performance of the Index does not reflect deductions for fees, expenses or taxes. |
*** | The S&P 500 Index is an index that represents the average performance of a group of 500 widely held, publicly traded stocks. “S&P 500®” is a trademark of The McGraw-Hill Companies, Inc. and has been licensed for use by Thrivent Financial for Lutherans. The product is not sponsored, endorsed or promoted by Standard & Poor’s and Standard & Poor’s makes no representation regarding the advisability of investing in the product. It is not possible to invest directly in the Index. The performance of the Index does not reflect deductions for fees, expenses or taxes. |
**** | The Consumer Price Index is an inflationary indicator that measures the change in the cost of a fixed basket of products and services, including housing, electricity, food and transportation. It is not possible to invest directly in the Index. |
5
Thrivent Moderately Aggressive Allocation Fund
Russell W. Swansen, David C. Francis, CFA and Mark L. Simenstad, CFA, Portfolio Co-Managers
The Fund seeks long-term capital growth.
The Fund invests in other Thrivent mutual funds and in directly held equity and debt instruments. The Fund is subject to its own operating expenses and the operating expenses of the other funds in which it invests, and is subject to all of the risks of the other funds in which it invests. The value of the Fund is influenced by factors impacting the overall market, certain asset classes, certain investment styles, and specific issuers. The Fund may incur losses due to incorrect assessments of investments by its investment adviser. Foreign investments involve additional risks, including currency fluctuations, liquidity, political, economic and market instability, and different legal and accounting standards. Bond prices generally fall as interest rates rise. Credit risk is the risk that an issuer of a debt security may not pay its debt, and high yield securities are subject to increased credit risk as well as liquidity risk. The use of equity index futures involves transaction costs and the loss from investing in them can exceed the initial investment.
How did the Fund perform during the 12-month period ended October 31, 2013?
Thrivent Moderately Aggressive Allocation Fund earned a return of 20.28%, compared with the median return of its peer group, the Lipper Mixed-Asset Target Allocation Growth Funds category, of 17.94%. The Fund’s market benchmarks, the S&P 500 Index and the Barclays U.S. Aggregate Bond Index, earned returns of 27.18% and -1.08%, respectively.
What factors affected the Fund’s performance?
Most major equity markets meaningfully outperformed fixed-income markets in the period. Across equity markets, small and mid-cap domestic stocks outperformed large caps—both domestic as well as foreign. Emerging market equities, while positive, provided dramatically lower returns versus most other stock groups.
In fixed income, Treasury and agency securities underperformed both investment-grade corporate and high-yield bonds. The Fund’s return in its fixed-income segment bested the bond index because our portfolio had limited exposure to the underperforming sectors.
The Fund’s return was aided by its significant exposure to equities across most major market segments. We were overweighted in large-cap stocks within our equity portfolio, which partially limited our advance because large-cap stocks did not keep pace with small and mid caps, but returns to all categories were quite attractive on an absolute basis.
Over the period, the Fund had an average exposure to fixed-income securities of 23%. Our holdings performed well versus the fixed-income benchmark, but even the best segment of bonds did not keep pace with the strong advance in U.S. stocks. Performance across the actively managed equity segments of the Fund were mixed. The large-cap growth and value segments outperformed while the mid-cap growth and small-cap core portfolios underperformed, each measured versus their respective benchmarks. However, absolute returns for all of the domestic equity segments of the Fund were quite good.
Within our international section, we had exposure to emerging markets debt and equity, and both of those segments—while performing well against their respective indexes—did not keep pace with the broader market advance. In total, results were close to management expectations given the asset mix of the portfolio.
What is your outlook?
As the period drew to a close, we became modestly more conservative in our portfolio positioning. Within fixed income, in the absence of an unexpected decline in the economy, we believe U.S. Treasury and agency securities are overvalued due to an aggressive purchase program that the Federal Reserve Bank has undertaken. As a result, we are overweighted in corporate bonds, and underweighted in Treasury and agency securities.
In equities, we have taken steps to modestly reduce our equity exposure. With the significant advance in global stock markets, it is difficult to represent that stocks are undervalued. At best, we would suggest equities are fairly valued. That does not mean any decline is imminent; in our process, however, it suggests it is appropriate to modestly adjust allocations.
While the rally certainly could continue to advance, we feel it would likely be at a more moderate pace. We do think that within equities, small and mid-cap domestic stocks are richly priced versus large caps, and that within large caps, non-U.S. stocks provide better opportunities. Thus, we have tilted the portfolio positions to take advantage of those opportunities.
Quoted Fund performance is for Class A shares and does not reflect a sales charge.
The returns shown do not reflect taxes a shareholder would pay on distributions or redemptions.
6
| | | | |
| Portfolio Composition | |
| (% of Portfolio) | |
Large Cap | | | 39.3 | % |
International | | | 18.1 | % |
Investment Grade Debt | | | 9.6 | % |
Mid Cap | | | 8.6 | % |
Short-Term Investments | | | 7.0 | % |
Small Cap | | | 6.9 | % |
High Yield | | | 4.1 | % |
Floating Rate Debt | | | 3.7 | % |
Natural Resources | | | 1.8 | % |
Municipals | | | 0.9 | % |
Total | | | 100.0 | % |
| | | | |
| Top 10 Holdings | |
| (% of Net Assets) | |
Thrivent Partner Worldwide Allocation Fund | | | 12.4 | % |
Thrivent Large Cap Value Fund | | | 8.5 | % |
Thrivent Large Cap Growth Fund | | | 6.6 | % |
Thrivent Mid Cap Stock Fund | | | 5.3 | % |
Thrivent Large Cap Stock Fund | | | 5.3 | % |
Thrivent Income Fund | | | 4.3 | % |
Thrivent High Yield Fund | | | 3.4 | % |
Thrivent Partner Small Cap Growth Fund | | | 3.2 | % |
Thrivent Partner Mid Cap Value Fund | | | 3.1 | % |
Thrivent Mid Cap Growth Fund | | | 2.8 | % |
These securities represent 54.9% of the total net assets of the Fund.
Portfolio Composition illustrates market exposure of all asset classes, including derivatives.
The list of Top 10 Holdings excludes short-term investments.
Quoted Portfolio Composition and Top 10 Holdings are subject to change.
Average Annual Total Returns1
As of October 31, 2013
| | | | | | | | | | | | |
Class A2 | | 1-Year | | | 5 Years | | | From Inception 6/30/2005 | |
without sales charge | | | 20.28 | % | | | 13.01 | % | | | 6.31 | % |
with sales charge | | | 13.64 | % | | | 11.73 | % | | | 5.60 | % |
| | | |
Institutional Class3 | | 1-Year | | | 5 Years | | | From Inception 6/30/2005 | |
Net Asset Value | | | 20.66 | % | | | 13.42 | % | | | 6.69 | % |

1 | Past performance is not an indication of future results. Average annual total returns represent past performance and reflect changes in share prices, the reinvestment of all dividends and capital gains, and the effects of compounding. The prospectus contains more complete information on the investment objectives, risks, charges and expenses of the investment company, which investors should read and consider carefully before investing. To obtain a prospectus, contact a registered representative or visit www.thrivent.com. At various times, the Fund’s adviser waived its management fee and/or reimbursed Fund expenses. Had the adviser not done so, the Fund’s total returns would have been lower. The returns shown do not reflect taxes a shareholder would pay on distributions or redemptions. Total investment return and principal value of your investment will fluctuate, and your shares, when redeemed, may be worth more or less than their original cost. Current performance may be higher or lower than the performance data quoted. Call 800-THRIVENT or visit www.thrivent.com for performance results current to the most recent month-end. |
2 | Class A performance with sales charge reflects the maximum sales charge of 5.5%. |
3 | Institutional Class shares have no sales load and are for institutional shareholders only. |
(a) | Performance of other classes will be greater or less than the line shown based on the differences in loads and fees paid by shareholders investing in the different classes. |
* | As you compare performance, please note that the Fund’s performance reflects the maximum 5.5% sales charge, while the Consumer Price Index, the S&P 500 Index and the Barclays U.S. Aggregate Bond Index do not reflect any such charges. If you were to purchase any of the above individual securities represented in those Indexes, any charges you would pay would reduce your total return as well. |
** | The Barclays U.S. Aggregate Bond Index is an index that measures the performance of U.S. investment grade bonds. It is not possible to invest directly in the Index. The performance of the Index does not reflect deductions for fees, expenses or taxes. |
*** | The S&P 500 Index is an index that represents the average performance of a group of 500 widely held, publicly traded stocks. “S&P 500®” is a trademark of The McGraw-Hill Companies, Inc. and has been licensed for use by Thrivent Financial for Lutherans. The product is not sponsored, endorsed or promoted by Standard & Poor’s and Standard & Poor’s makes no representation regarding the advisability of investing in the product. It is not possible to invest directly in the Index. The performance of the Index does not reflect deductions for fees, expenses or taxes. |
**** | The Consumer Price Index is an inflationary indicator that measures the change in the cost of a fixed basket of products and services, including housing, electricity, food and transportation. It is not possible to invest directly in the Index. |
7
Thrivent Moderate Allocation Fund
Russell W. Swansen, David C. Francis, CFA and Mark L. Simenstad, CFA, Portfolio Co-Managers
The Fund seeks long-term capital growth while providing reasonable stability of principal.
The Fund invests in other Thrivent mutual funds and in directly held equity and debt instruments. The Fund is subject to its own operating expenses and the operating expenses of the other funds in which it invests, and is subject to all of the risks of the other funds in which it invests. The value of the Fund is influenced by factors impacting the overall market, certain asset classes, certain investment styles, and specific issuers. The Fund may incur losses due to incorrect assessments of investments by its investment adviser. Foreign investments involve additional risks, including currency fluctuations, liquidity, political, economic and market instability, and different legal and accounting standards. Bond prices generally fall as interest rates rise. Credit risk is the risk that an issuer of a debt security may not pay its debt, and high yield securities are subject to increased credit risk as well as liquidity risk. The use of equity index futures involves transaction costs and the loss from investing in them can exceed the initial investment.
How did the Fund perform during the 12-month period ended October 31, 2013?
Thrivent Moderate Allocation Fund earned a return of 14.74%, compared with the median return of its peer group, the Lipper Mixed-Asset Target Allocation Moderate Funds category, of 13.83%. The Fund’s market benchmarks, the S&P 500 Index and the Barclays U.S. Aggregate Bond Index, earned returns of 27.18% and -1.08%, respectively.
What factors affected the Fund’s performance?
Most major equity markets meaningfully outperformed fixed-income markets in the period. Across equity markets, small and mid-cap domestic stocks outperformed large caps—both domestic as well as foreign. Emerging market equities, while positive, provided dramatically lower returns versus most other stock groups.
In fixed income, Treasury and agency securities underperformed both investment-grade corporate and high-yield bonds. The Fund’s return in its fixed-income segment bested the bond index because our portfolio had limited exposure to the underperforming sectors.
The Fund’s return was aided by its significant exposure to equities across most major market segments. We were overweighted in large-cap stocks within our equity portfolio, which partially limited our advance because large-cap stocks did not keep pace with small and mid caps, but returns to all categories were quite attractive on an absolute basis.
Over the period, the Fund had an average exposure to fixed-income securities of 42%. Our holdings performed well versus the fixed-income benchmark, but even the best segment of bonds did not keep pace with the strong advance in U.S. stocks. Performance across the actively managed equity segments of the Fund were mixed. The large-cap growth and value segments outperformed while the mid-cap growth and small-cap core portfolios underperformed, each measured versus their respective benchmarks. However, absolute returns for all of the domestic equity segments of the Fund were quite good.
Within our international section, we had exposure to emerging markets debt and equity, and both of those segments—while performing well against their respective indexes—did not keep pace with the broader market advance. In total, results were close to management expectations given the asset mix of the portfolio.
What is your outlook?
As the period drew to a close, we became modestly more conservative in our portfolio positioning. Within fixed income, in the absence of an unexpected decline in the economy, we believe U.S. Treasury and agency securities are overvalued due to an aggressive purchase program that the Federal Reserve Bank has undertaken. As a result, we are overweighted in corporate bonds, and underweighted in Treasury and agency securities.
In equities, we have taken steps to modestly reduce our equity exposure. With the significant advance in global stock markets, it is difficult to represent that stocks are undervalued. At best, we would suggest equities are fairly valued. That does not mean any decline is imminent; in our process, however, it suggests it is appropriate to modestly adjust allocations.
While the rally certainly could continue to advance, we feel it would likely be at a more moderate pace. We do think that within equities, small and mid-cap domestic stocks are richly priced versus large caps, and that within large caps, non-U.S. stocks provide better opportunities. Thus, we have tilted the portfolio positions to take advantage of those opportunities.
Quoted Fund performance is for Class A shares and does not reflect a sales charge.
The returns shown do not reflect taxes a shareholder would pay on distributions or redemptions.
8
| | | | |
| Portfolio Composition | |
| (% of Portfolio) | |
Large Cap | | | 28.6 | % |
Investment Grade Debt | | | 25.7 | % |
International | | | 14.0 | % |
Short-Term Investments | | | 7.8 | % |
Floating Rate Debt | | | 6.3 | % |
Small Cap | | | 5.9 | % |
Mid Cap | | | 4.7 | % |
High Yield | | | 3.6 | % |
Municipals | | | 1.7 | % |
Natural Resources | | | 1.7 | % |
| | | | |
Total | | | 100.0 | % |
| | | | |
| Top 10 Holdings | |
| (% of Net Assets) | |
Thrivent Income Fund | | | 10.4 | % |
Thrivent Partner Worldwide Allocation Fund | | | 9.7 | % |
Thrivent Large Cap Value Fund | | | 7.5 | % |
Thrivent Limited Maturity Bond Fund | | | 7.1 | % |
Thrivent Large Cap Growth Fund | | | 5.3 | % |
Thrivent Mid Cap Stock Fund | | | 3.6 | % |
Thrivent High Yield Fund | | | 3.0 | % |
Thrivent Partner Small Cap Growth Fund | | | 2.1 | % |
Thrivent Large Cap Stock Fund | | | 2.1 | % |
Thrivent Partner Mid Cap Value Fund | | | 2.1 | % |
These securities represent 52.9% of the total net assets of the Fund.
Portfolio Composition illustrates market exposure of all asset classes, including derivatives.
The list of Top 10 Holdings excludes short-term investments.
Quoted Portfolio Composition and Top 10 Holdings are subject to change.
Average Annual Total Returns1
As of October 31, 2013
| | | | | | | | | | | | |
Class A2 | | 1-Year | | | 5 Years | | | From
Inception
6/30/2005 | |
without sales charge | | | 14.74 | % | | | 11.66 | % | | | 6.05 | % |
with sales charge | | | 8.45 | % | | | 10.41 | % | | | 5.33 | % |
| | | |
Institutional Class3 | | 1-Year | | | 5 Years | | | From
Inception
6/30/2005 | |
Net Asset Value | | | 15.18 | % | | | 12.06 | % | | | 6.40 | % |
1 | Past performance is not an indication of future results. Average annual total returns represent past performance and reflect changes in share prices, the reinvestment of all dividends and capital gains, and the effects of compounding. The prospectus contains more complete information on the investment objectives, risks, charges and expenses of the investment company, which investors should read and consider carefully before investing. To obtain a prospectus, contact a registered representative or visit www.thrivent.com. At various times, the Fund’s adviser waived its management fee and/or reimbursed Fund expenses. Had the adviser not done so, the Fund’s total returns would have been lower. The returns shown do not reflect taxes a shareholder would pay on distributions or redemptions. Total investment return and principal value of your investment will fluctuate, and your shares, when redeemed, may be worth more or less than their original cost. Current performance may be higher or lower than the performance data quoted. Call 800-THRIVENT or visit www.thrivent.com for performance results current to the most recent month-end. |
2 | Class A performance with sales charge reflects the maximum sales charge of 5.5%. |
3 | Institutional Class shares have no sales load and are for institutional shareholders only. |
(a) | Performance of other classes will be greater or less than the line shown based on the differences in loads and fees paid by shareholders investing in the different classes. |
* | As you compare performance, please note that the Fund’s performance reflects the maximum 5.5% sales charge, while the Consumer Price Index, the S&P 500 Index and the Barclays U.S. Aggregate Bond Index do not reflect any such charges. If you were to purchase any of the above individual securities represented in those Indexes, any charges you would pay would reduce your total return as well. |
** | The Barclays U.S. Aggregate Bond Index is an index that measures the performance of U.S. investment grade bonds. It is not possible to invest directly in the Index. The performance of the Index does not reflect deductions for fees, expenses or taxes. |
*** | The S&P 500 Index is an index that represents the average performance of a group of 500 widely held, publicly traded stocks. “S&P 500®” is a trademark of The McGraw-Hill Companies, Inc. and has been licensed for use by Thrivent Financial for Lutherans. The product is not sponsored, endorsed or promoted by Standard & Poor’s and Standard & Poor’s makes no representation regarding the advisability of investing in the product. It is not possible to invest directly in the Index. The performance of the Index does not reflect deductions for fees, expenses or taxes. |
**** | The Consumer Price Index is an inflationary indicator that measures the change in the cost of a fixed basket of products and services, including housing, electricity, food and transportation. It is not possible to invest directly in the Index. |
9
Thrivent Moderately Conservative Allocation Fund
Russell W. Swansen, David C. Francis, CFA and Mark L. Simenstad, CFA, Portfolio Co-Managers
The Fund seeks long-term capital growth while providing reasonable stability of principal.
The Fund invests in other Thrivent mutual funds and in directly held equity and debt instruments. The Fund is subject to its own operating expenses and the operating expenses of the other funds in which it invests, and is subject to all of the risks of the other funds in which it invests. The value of the Fund is influenced by factors impacting the overall market, certain asset classes, certain investment styles, and specific issuers. The Fund may incur losses due to incorrect assessments of investments by its investment adviser. Foreign investments involve additional risks, including currency fluctuations, liquidity, political, economic and market instability, and different legal and accounting standards. Bond prices generally fall as interest rates rise. Credit risk is the risk that an issuer of a debt security may not pay its debt, and high yield securities are subject to increased credit risk as well as liquidity risk. The use of equity index futures involves transaction costs and the loss from investing in them can exceed the initial investment.
How did the Fund perform during the 12-month period ended October 31, 2013?
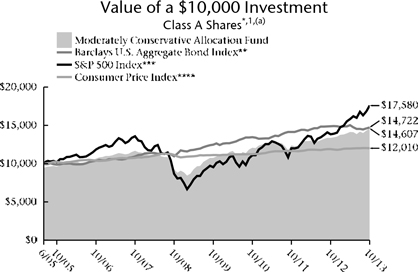
Thrivent Moderately Conservative Allocation Fund earned a return of 9.32%, compared with the median return of its peer group, the Lipper Mixed-Asset Target Allocation Conservative Funds category, of 7.20%. The Fund’s market benchmarks, the S&P 500 Index and the Barclays U.S. Aggregate Bond Index, earned returns of 27.18% and -1.08%, respectively.
What factors affected the Fund’s performance?
Most major equity markets meaningfully outperformed fixed-income markets in the period. Across equity markets, small and mid-cap domestic stocks outperformed large caps—both domestic as well as foreign. Emerging market equities, while positive, provided dramatically lower returns versus most other stock groups.
In fixed income, Treasury and agency securities underperformed both investment-grade corporate and high-yield bonds. The Fund’s return in its fixed-income segment bested the bond index because our portfolio had limited exposure to the underperforming sectors.
The Fund’s return was aided by its significant exposure to equities across most major market segments. We were overweighted in large-cap stocks within our equity portfolio, which partially limited our advance because large-cap stocks did not keep pace with small and mid caps, but returns to all categories were quite attractive on an absolute basis.
Over the period, the Fund had an average exposure to fixed-income securities of 62%. Our holdings performed well versus the fixed-income benchmark, but even the best segment of bonds did not keep pace with the strong advance in U.S. stocks. Performance across the actively managed equity segments of the Fund was mixed. The large-cap growth and value segments outperformed while the mid-cap growth and small-cap core portfolios underperformed, each measured versus their respective benchmarks. However, absolute returns for all of the domestic equity segments of the Fund were quite good.
Within our international section, we had exposure to emerging markets debt and equity, and both of those segments—while performing well against their respective indexes—did not keep pace with the broader market advance. In total, results were close to management expectations given the asset mix of the portfolio.
What is your outlook?
As the period drew to a close, we became modestly more conservative in our portfolio positioning. Within fixed income, in the absence of an unexpected decline in the economy, we believe U.S. Treasury and agency securities are overvalued due to an aggressive purchase program that the Federal Reserve Bank has undertaken. As a result, we are overweighted in corporate bonds, and underweighted in Treasury and agency securities.
In equities, we have taken steps to modestly reduce our equity exposure. With the significant advance in global stock markets, it is difficult to represent that stocks are undervalued. At best, we would suggest equities are fairly valued. That does not mean any decline is imminent; in our process, however, it suggests it is appropriate to modestly adjust allocations.
While the rally certainly could continue to advance, we feel it would likely be at a more moderate pace. We do think that within equities, small and mid-cap domestic stocks are richly priced versus large caps, and that within large caps, non-U.S. stocks provide better opportunities. Thus, we have tilted the portfolio positions to take advantage of those opportunities.
Quoted Fund performance is for Class A shares and does not reflect a sales charge.
The returns shown do not reflect taxes a shareholder would pay on distributions or redemptions.
10
| | | | |
| Portfolio Composition | |
| (% of Portfolio) | |
Investment Grade Debt | | | 36.9 | % |
Large Cap | | | 17.5 | % |
Short-Term Investments | | | 12.2 | % |
International | | | 9.7 | % |
Floating Rate Debt | | | 9.0 | % |
High Yield | | | 5.0 | % |
Small Cap | | | 2.9 | % |
Mid Cap | | | 2.7 | % |
Municipals | | | 2.6 | % |
Natural Resources | | | 1.5 | % |
| | | | |
Total | | | 100.0 | % |
Top 10 Holdings
(% of Net Assets)
| | | | |
Thrivent Limited Maturity Bond Fund | | | 12.3 | % |
Thrivent Income Fund | | | 9.0 | % |
Thrivent Partner Worldwide Allocation Fund | | | 6.4 | % |
Thrivent Large Cap Value Fund | | | 5.6 | % |
Thrivent High Yield Fund | | | 3.5 | % |
Thrivent Partner Mid Cap Value Fund | | | 2.5 | % |
Thrivent Large Cap Growth Fund | | | 2.4 | % |
Federal National Mortgage Association Conventional 30-Yr. Pass Through | | | 1.8 | % |
Federal National Mortgage Association Conventional 30-Yr. Pass Through | | | 1.8 | % |
Thrivent Natural Resources Fund | | | 1.7 | % |
These securities represent 47.0% of the total net assets ofthe Fund.
Portfolio Composition illustrates market exposure of all asset classes, including derivatives.
The list of Top 10 Holdings excludes short-term investments.
Quoted Portfolio Composition and Top 10 Holdings are subject to change.
Average Annual Total Returns1
As of October 31, 2013
| | | | | | | | | | | | |
Class A2 | | 1-Year | | | 5 Years | | | From
Inception
6/30/2005 | |
without sales charge | | | 9.32 | % | | | 9.49 | % | | | 5.36 | % |
with sales charge | | | 3.31 | % | | | 8.26 | % | | | 4.65 | % |
| | | |
Institutional Class3 | | 1-Year | | | 5 Years | | | From
Inception
6/30/2005 | |
Net Asset Value | | | 9.62 | % | | | 9.81 | % | | | 5.66 | % |
1 | Past performance is not an indication of future results. Average annual total returns represent past performance and reflect changes in share prices, the reinvestment of all dividends and capital gains, and the effects of compounding. The prospectus contains more complete information on the investment objectives, risks, charges and expenses of the investment company, which investors should read and consider carefully before investing. To obtain a prospectus, contact a registered representative or visit www.thrivent.com. At various times, the Fund’s adviser waived its management fee and/or reimbursed Fund expenses. Had the adviser not done so, the Fund’s total returns would have been lower. The returns shown do not reflect taxes a shareholder would pay on distributions or redemptions. Total investment return and principal value of your investment will fluctuate, and your shares, when redeemed, may be worth more or less than their original cost. Current performance may be higher or lower than the performance data quoted. Call 800-THRIVENT or visit www.thrivent.com for performance results current to the most recent month-end. |
2 | Class A performance with sales charge reflects the maximum sales charge of 5.5%. |
3 | Institutional Class shares have no sales load and are for institutional shareholders only. |
(a) | Performance of other classes will be greater or less than the line shown based on the differences in loads and fees paid by shareholders investing in the different classes. |
* | As you compare performance, please note that the Fund’s performance reflects the maximum 5.5% sales charge, while the Consumer Price Index, the S&P 500 Index and the Barclays U.S. Aggregate Bond Index do not reflect any such charges. If you were to purchase any of the above individual securities represented in those Indexes, any charges you would pay would reduce your total return as well. |
** | The Barclays U.S. Aggregate Bond Index is an index that measures the performance of U.S. investment grade bonds. It is not possible to invest directly in the Index. The performance of the Index does not reflect deductions for fees, expenses or taxes. |
*** | The S&P 500 Index is an index that represents the average performance of a group of 500 widely held, publicly traded stocks. “S&P 500®” is a trademark of The McGraw-Hill Companies, Inc. and has been licensed for use by Thrivent Financial for Lutherans. The product is not sponsored, endorsed or promoted by Standard & Poor’s and Standard & Poor’s makes no representation regarding the advisability of investing in the product. It is not possible to invest directly in the Index. The performance of the Index does not reflect deductions for fees, expenses or taxes. |
**** | The Consumer Price Index is an inflationary indicator that measures the change in the cost of a fixed basket of products and services, including housing, electricity, food and transportation. It is not possible to invest directly in the Index. |
11
Thrivent Balanced Income Plus Fund
Darren M. Bagwell, CFA, Michael G. Landreville, CFA and CPA (inactive), and Stephen D. Lowe, CFA, Portfolio Co-Managers*
The Fund seeks long-term total return through a balance between income and the potential for long-term capital growth.
The Fund invests in equity securities and debt securities. The value of the Fund is influenced by factors impacting the overall market, certain asset classes, certain investment styles, and specific issuers. The Fund may incur losses due to incorrect assessments of investments by its investment adviser. Bond prices generally fall as interest rates rise. Credit risk is the risk that an issuer of a debt security may not pay its debt, and high yield securities are subject to increased credit risk as well as liquidity risk. Leveraged loans, preferred securities, sovereign debt, and mortgage-related and other asset-backed securities are subject to additional risks. Foreign investments involve additional risks, including currency fluctuations, liquidity, political, economic and market instability, and different legal and accounting standards; these risks are magnified for investments in emerging markets. As of August 16, 2013, the Fund changed its name from Thrivent Balanced Fund to its current name.
* | Effective June 2013, Stephen D. Lowe became a Portfolio Co-Manager. |
How did the Fund perform during the 12-month period ended October 31, 2013?
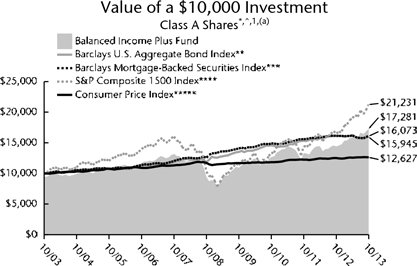
Thrivent Balanced Income Plus Fund earned a return of 19.95%, compared with the median return of its peer group, the Lipper Mixed-Asset Target Allocation Moderate Funds category, of 13.83%. The Fund’s market benchmarks, the S&P Composite 1500 Index, the Barclays U.S. High Yield Loan Index and the Barclays U.S. Mortgage-Backed Securities Index, earned returns of 28.09%, 5.65% and -0.36%, respectively.
What factors affected the Fund’s performance?
Effective August 16, 2013, Thrivent Balanced Fund was converted to Thrivent Balanced Income Plus Fund, which entailed significant changes to its principal investment strategies and benchmarks. We began transitioning the Fund’s holdings to reflect its new strategy and expect to be done by year-end. Therefore, the majority of the Fund’s performance during the fiscal year, particularly in fixed income, is reflective of a portfolio that was materially different from its new composition and benchmarks.
The Fund’s equity portfolio outperformed due to strong security selection. In particular, results were favorable among Internet-related holdings in technology, aerospace-related positions in industrials, and oil and gas producers within energy. However, the fixed-income portfolio returns fell short of the Barclays benchmarks because of our higher Treasury exposure, lower high-yield exposure and significantly longer duration, or interest-rate sensitivity, for most of the period.
How are you positioning the Fund?
The goals of the Fund’s new approach are to reduce interest rate risk while at the same time to enhance yield. We continue to make changes in the fixed-income portion of the Fund to accomplish these goals. These changes include eliminating longer-duration, lower-yielding U.S. Treasury securities, while increasing exposure to higher-yielding floating-rate leveraged bank loan securities, high-yield securities and emerging market debt securities.
The Fund will also continue to hold mortgage-backed securities and investment-grade corporate bonds. While these securities tend to have more yield and less interest rate risk than medium- to longer-term Treasury securities, they also have more credit risk than Treasuries.
Going forward, much of the fixed-income portfolio will be rated below investment grade in terms of credit quality, although most of these holdings will be at the higher end of the noninvestment-grade spectrum. In addition, the Fund will now target a 50/50 split between fixed-income and equity exposure.
While equity exposure was lowered from two-thirds to one-half of the overall Fund, we continued to use the same investment approach. We are focused on driving equity returns through individual security selection, while maintaining a generally sector-neutral portfolio.
What is your outlook?
We expect economic growth and capital spending to continue improving at a modest, but positive, pace while inflationary pressures will likely remain muted. This should allow the Fed to remain accommodative in its monetary policy. Fiscal policy will likely remain somewhat unpredictable in 2014, as it was in 2013 and earlier. We would not be surprised to see increased interest rate volatility over the course of the year. We expect to continue emphasizing more cyclical and discretionary holdings within the various equity market sectors.
Quoted Fund performance is for Class A shares and does not reflect a sales charge.
The returns shown do not reflect taxes a shareholder would pay on distributions or redemptions.
12
Portfolio Composition
(% of Portfolio)
| | | | |
Common Stock | | | 47.4 | % |
Long-Term Fixed Income | | | 27.7 | % |
Bank Loans | | | 14.4 | % |
Short-Term Investments | | | 10.4 | % |
Preferred Stock | | | 0.1 | % |
| | | | |
Total | | | 100.0 | % |
Major Market Sectors
(% of Net Assets)
| | | | |
Financials | | | 15.6 | % |
Consumer Discretionary | | | 11.5 | % |
Information Technology | | | 10.3 | % |
Consumer Staples | | | 9.7 | % |
Telecommunications Services | | | 7.8 | % |
Energy | | | 7.1 | % |
Industrials | | | 6.7 | % |
Mortgage-Backed Securities | | | 6.6 | % |
Health Care | | | 5.8 | % |
Materials | | | 5.1 | % |
Top 10 Holdings
(% of Net Assets)
| | | | |
Apple, Inc. | | | 2.2 | % |
Total SA ADR | | | 2.2 | % |
Comcast Corporation | | | 2.1 | % |
Federal National Mortgage Association Conventional 30-Yr. Pass Through | | | 1.9 | % |
Federal National Mortgage Association Conventional 30-Yr. Pass Through | | | 1.9 | % |
Las Vegas Sands Corporation | | | 1.9 | % |
U.S. Treasury Notes | | | 1.8 | % |
British American Tobacco plc ADR | | | 1.3 | % |
Honeywell International, Inc. | | | 1.3 | % |
Boeing Company | | | 1.3 | % |
These securities represent 17.9% of the total net assets of the Fund.
Quoted Major Market Sectors, Portfolio Composition and Top 10 Holdings are subject to change.
The lists of Major Market Sectors and Top 10 Holdings exclude short-term investments and collateral held for securities loaned.
The Portfolio Composition chart excludes collateral held for securities loaned.
Average Annual Total Returns1
As of October 31, 2013
| | | | | | | | | | | | |
Class A2 | | 1-Year | | | 5 Years | | | 10 Years | |
without sales charge | | | 19.95 | % | | | 12.98 | % | | | 6.22 | % |
with sales charge | | | 13.31 | % | | | 11.71 | % | | | 5.62 | % |
| | | |
Institutional Class3 | | 1-Year | | | 5 Years | | | 10 Years | |
Net Asset Value | | | 20.49 | % | | | 13.53 | % | | | 6.73 | % |
1 | Past performance is not an indication of future results. Average annual total returns represent past performance and reflect changes in share prices, the reinvestment of all dividends and capital gains, and the effects of compounding. The prospectus contains more complete information on the investment objectives, risks, charges and expenses of the investment company, which investors should read and consider carefully before investing. To obtain a prospectus, contact a registered representative or visit www.thrivent.com. At various times, the Fund’s adviser waived its management fee and/or reimbursed Fund expenses. Had the adviser not done so, the Fund’s total returns would have been lower. The returns shown do not reflect taxes a shareholder would pay on distributions or redemptions. Total investment return and principal value of your investment will fluctuate, and your shares, when redeemed, may be worth more or less than their original cost. Current performance may be higher or lower than the performance data quoted. Call 800-THRIVENT or visit www.thrivent.com for performance results current to the most recent month-end. |
2 | Class A performance with sales charge reflects the maximum sales charge of 5.5%. |
3 | Institutional Class shares have no sales load and are for institutional shareholders only. |
(a) | Performance of other classes will be greater or less than the line shown based on the differences in loads and fees paid by shareholders investing in the different classes. |
* | Effective August 2013, the Fund’s benchmark indices changed from the Barclays U.S. Aggregate Bond Index to the Barclays U.S. Mortgage-Backed Securities Index and the Barclays U.S. High Yield Loan Index. The Adviser made these benchmark changes because of changes to the Fund’s principal investment strategies. As you compare performance, please note that the Fund’s performance reflects the maximum 5.5% sales charge, while the benchmark indices do not reflect any such charges, deductions for fees, expenses or taxes. It is not possible to invest directly in the indices shown. If you were to purchase any of the above individual securities represented in those indices, any charges you would pay would reduce your total return as well. |
** | The Barclays U.S. Aggregate Bond Index measures the performance of U.S. investment grade bonds. |
*** | The Barclays U.S. Mortgage-Backed Securities Index (MBS) is formed by grouping the universe of over 600,000 individual fixed-rate U.S. government agency MBS pools into approximately 3,500 generic types of securities. |
**** | The S&P 500 Index represents the average performance of a group of 500 widely held, publicly traded stocks. “S&P 500®” is a trademark of The McGraw-Hill Companies, Inc. and has been licensed for use by Thrivent Financial for Lutherans. The product is not sponsored, endorsed or promoted by Standard & Poor’s and Standard & Poor’s makes no representation regarding the advisability of investing in the product. |
***** | The Consumer Price Index is an inflationary indicator that measures the change in the cost of a fixed basket of products and services, including housing, electricity, food and transportation. |
^ | The Barclays U.S. High Yield Loan Index is a benchmark index that incepted in January 2006. This index is not shown in the chart because it does not have 10 years of history and thus an accurate comparison of a $10,000 investment over 10 years cannot be shown. |
13
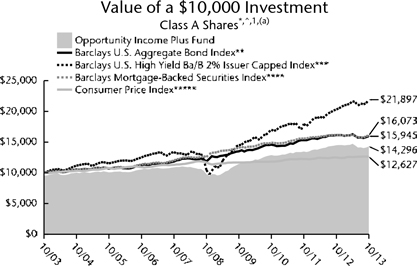
Thrivent Opportunity Income Plus Fund
Michael G. Landreville, CFA and CPA (inactive), Gregory R. Anderson, CFA, and Conrad Smith, CFA, Portfolio Co-Managers*
The Fund seeks a high level of current income consistent with capital preservation.
The Fund primarily invests in a broad range of debt securities. The value of the Fund is influenced by factors impacting the overall market, certain asset classes, certain investment styles, and specific issuers. The Fund may incur losses due to incorrect assessments of investments by its investment adviser. Bond prices generally fall as interest rates rise. Credit risk is the risk that an issuer of a debt security may not pay its debt, and high yield securities are subject to increased credit risk as well as liquidity risk. Leveraged loans, sovereign debt, and mortgage-related and other asset-backed securities are subject to additional risks. Foreign investments involve additional risks, including currency fluctuations, liquidity, political, economic and market instability, and different legal and accounting standards; these risks are magnified for investments in emerging markets. The prices of futures contracts can be highly volatile and the loss from investing in them can exceed the initial investment. As of August 16, 2013, the Fund changed its name from Thrivent Core Bond Fund to its current name.
* | Effective June 2013, Conrad Smith became a Portfolio Co-Manager. |
How did the Fund perform during the 12-month period ended October 31, 2013?
Thrivent Opportunity Income Plus Fund earned a return of -1.26%, compared with the median return of its peer group, the Lipper Multi-Sector Income Funds category, of 2.16%. The Fund’s market benchmarks, the Barclays U.S. High Yield Loan Index and the Barclays U.S. High Yield Ba/B 2% Issuer Cap Index, earned returns of 5.65% and 7.69%, respectively.
What factors affected the Fund’s performance?
Effective August 16, 2013, Thrivent Core Bond Fund was converted to Thrivent Opportunity Income Plus Fund, which entailed significant changes to its principal investment strategies and benchmarks. We began transitioning the Fund’s holdings to reflect its new strategy, and expect to be done by year-end. Therefore, the majority of the Fund’s performance during the fiscal year is reflective of a portfolio that was materially different from its new composition and benchmarks.
Fund returns fell short of the new Barclays benchmarks and the new Lipper peer group because of several factors. For the majority of the reporting period before the transition, the Fund had more than 20% of its net assets invested in Treasury securities. Treasuries underperformed other fixed-income asset classes as interest rates rose substantially over the period as a whole. The Fund also had a significantly longer duration stance, making it more interest-rate sensitive for the majority of the fiscal year. As rates rose, the yield curve steepened, meaning that yields went up (and prices went down) more for longer-maturity bonds than they did for shorter maturities. In addition, the new Barclays benchmarks are composed solely of high-yield securities, which strongly outperformed all other fixed-income sectors over the reporting period.
How are you positioning the Fund?
The goals of the Fund’s new approach are to reduce interest rate risk while at the same time to enhance yield. We continue to make changes to the Fund’s portfolio to accomplish these goals. These changes include eliminating longer-duration, lower-yielding U.S. Treasury securities, while increasing exposure to higher-yielding floating-rate leveraged bank loan securities, high-yield securities and emerging-market debt securities. The Fund will also continue to hold mortgage-backed securities and investment-grade corporate bonds. While, on balance, these securities have more yield and less interest-rate risk than medium- to longer-term Treasury securities, they also have more credit-quality risk than Treasuries. Going forward, much of the Fund’s portfolio will be rated below investment-grade in terms of credit quality, although most of these holdings will be at the higher end of the noninvestment-grade spectrum.
What is your outlook?
We expect economic growth and capital spending to continue to improve at a modest, but positive, pace while inflationary pressures will likely remain muted. This should allow the Fed to remain accommodative in its monetary policy. Fiscal policy will likely remain somewhat unpredictable in 2014, as it was in 2013 and earlier. We would not be surprised to see increased interest rate volatility over the course of the year. We remain focused on completing the Fund’s transition to its new approach before the start of 2014.
Quoted Fund performance is for Class A shares and does not reflect a sales charge.
The returns shown do not reflect taxes a shareholder would pay on distributions or redemptions.
14
Major Market Sectors
(% of Net Assets)
| | | | |
Communications Services | | | 18.6 | % |
Financials | | | 13.3 | % |
Mortgage-Backed Securities | | | 12.9 | % |
Consumer Cyclical | | | 7.9 | % |
Consumer Non-Cyclical | | | 7.6 | % |
Collateralized Mortgage Obligations | | | 4.5 | % |
Transportation | | | 4.5 | % |
Technology | | | 4.5 | % |
Capital Goods | | | 4.4 | % |
Asset-Backed Securities | | | 4.1 | % |
Top 10 Holdings
(% of Net Assets)
| | | | |
Federal National Mortgage Association Conventional 30-Yr. Pass Through | | | 3.4 | % |
Federal National Mortgage Association Conventional 30-Yr. Pass Through | | | 3.1 | % |
Federal Home Loan Mortgage Corporation Gold 30-Yr. Pass Through | | | 2.7 | % |
U.S. Treasury Notes | | | 2.5 | % |
iShares J.P. Morgan USD Emerging Markets Bond ETF | | | 1.8 | % |
American Airlines, Inc., Term Loan | | | 1.8 | % |
Federal Home Loan Mortgage Corporation Gold 15-Yr. Pass Through | | | 1.6 | % |
Federal National Mortgage Association Conventional 15-Yr. Pass Through | | | 1.5 | % |
Albertsons, LLC, Term Loan | | | 1.0 | % |
Supervalu, Inc., Term Loan | | | 0.9 | % |
These securities represent 20.3% of the total net assets of the Fund.
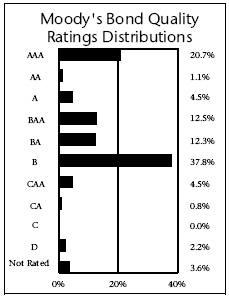
Quoted Major Market Sectors, Moody’s Bond Quality Ratings Distributions and Top 10 Holdings are subject to change.
The lists of Major Market Sectors and Top 10 Holdings exclude short-term investments and collateral held for securities loaned.
Average Annual Total Returns1
As of October 31, 2013
| | | | | | | | | | | | |
Class A2 | | 1-Year | | | 5 Years | | | 10 Years | |
without sales charge | | | -1.26 | % | | | 7.89 | % | | | 4.12 | % |
with sales charge | | | -5.67 | % | | | 6.91 | % | | | 3.64 | % |
| | | |
Institutional Class3 | | 1-Year | | | 5 Years | | | 10 Years | |
Net Asset Value | | | -1.04 | % | | | 8.25 | % | | | 4.49 | % |
1 | Past performance is not an indication of future results. Average annual total returns represent past performance and reflect changes in share prices, the reinvestment of all dividends and capital gains, and the effects of compounding. The prospectus contains more complete information on the investment objectives, risks, charges and expenses of the investment company, which investors should read and consider carefully before investing. To obtain a prospectus, contact a registered representative or visit www.thrivent.com. At various times, the Fund’s adviser waived its management fee and/or reimbursed Fund expenses. Had the adviser not done so, the Fund’s total returns would have been lower. The returns shown do not reflect taxes a shareholder would pay on distributions or redemptions. Total investment return and principal value of your investment will fluctuate, and your shares, when redeemed, may be worth more or less than their original cost. Current performance may be higher or lower than the performance data quoted. Call 800-THRIVENT or visit www.thrivent.com for performance results current to the most recent month-end. |
2 | Class A performance with sales charge reflects the maximum sales charge of 4.5%. |
3 | Institutional Class shares have no sales load and are for institutional shareholders only. |
(a) | Performance of other classes will be greater or less than the line shown based on the differences in loads and fees paid by shareholders investing in the different classes. |
* | Effective August 2013, the Fund’s benchmark indices changed from the Barclays U.S. Aggregate Bond Index to the Barclays U.S. Mortgage-Backed Securities Index, the Barclays U.S. High Yield Ba/B 2% Issuer Cap Index and the Barclays U.S. High Yield Loan Index. The Adviser made these benchmark changes because of changes to the Fund’s principal investment strategies. As you compare performance, please note that the Fund’s performance reflects the maximum 4.5% sales charge, while the benchmark indices do not reflect any such charges, deductions for fees, expenses or taxes. It is not possible to invest directly in the indices shown. If you were to purchase any of the above individual securities represented in those indices, any charges you would pay would reduce your total return as well. |
** | The Barclays U.S. Aggregate Bond Index measures the performance of U.S. investment grade bonds. |
*** | The Barclays U.S. High-Yield Ba/B 2% Issuer Capped Index covers the USD denominated, non-investment grade, Ba or B rated, fixed-rate, taxable corporate bond market. The Index limits issuer exposures to a maximum 2%, redistributing excess market value index-wide on a pro-rata basis. |
**** | The Barclays U.S. Mortgage-Backed Securities Index (MBS) is formed by grouping the universe of over 600,000 individual fixed-rate U.S. government agency MBS pools into approximately 3,500 generic types of securities. |
***** | The Consumer Price Index is an inflationary indicator that measures the change in the cost of a fixed basket of products and services, including housing, electricity, food and transportation. |
^ | The Barclays U.S. High Yield Loan Index is a benchmark index that incepted in January 2006. This index is not shown in the chart because it does not have 10 years of history and thus an accurate comparison of a $10,000 investment over 10 years cannot be shown. |
15
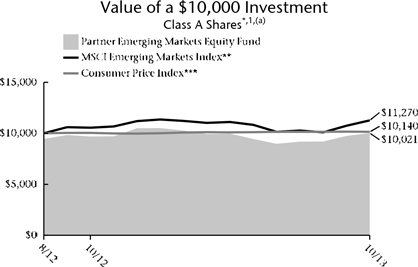
Thrivent Partner Emerging Markets Equity Fund
| | |

| | Subadvised by DuPont Capital Management Corporation |
The Fund seeks long-term capital growth.
The Fund primarily invests in emerging markets equities. Foreign investments involve additional risks, including currency fluctuations, liquidity, political, economic and market instability, and different legal and accounting standards; these risks are magnified for investments in emerging markets. The value of the Fund is influenced by factors impacting the overall market, certain asset classes, certain investment styles, and specific issuers. The Fund may incur losses due to incorrect assessments of investments by its investment advisers. Small and medium-sized companies often have greater price volatility and less liquidity than larger companies. Large cap companies may be unable to respond quickly to new competitive challenges and may not be able to attain a high growth rate.
How did the Fund perform during the 12-month period ended October 31, 2013?
Thrivent Partner Emerging Markets Equity Fund earned a return of 3.26%, compared with the median return of its peer group, the Lipper Emerging Markets Funds category, of 6.90%. The Fund’s market benchmark, the MSCI Emerging Markets Index, earned a return of 6.90%.
What factors affected the Fund’s performance?
Over the past year, unfavorable relative performance was mostly derived from stock selection in Asia. Specifically, stock selection in China, Taiwan, Indonesia and Thailand detracted from relative performance. Stock selection was also unfavorable in South Africa.
Offsetting some of the underperformance in Asia was positive stock selection in Korea and India. Other countries with favorable stock selection included the Czech Republic, Panama, Poland and Mexico.
From a country allocation perspective, the overallocation to Korea and Poland benefited performance, while an underallocation to Taiwan detracted from results.
From a sector perspective, two sectors with stock selection that detracted from performance were energy and technology. In regards to sector allocation, an underallocation to technology and an overallocation to energy unfavorably impacted performance.
Stock selection within the financial sector was the strongest positive contributor to performance. This was mostly due to three Eastern European banks that performed well. In addition, an underallocation to banks in countries with high current account deficits helped performance within this sector.
Other sectors with positive stock selection were industrials and consumer discretionary.
What is your outlook?
We have a positive outlook for emerging markets equities as valuations appear attractive and the long-term drivers of growth remain in place. The MSCI Emerging Markets Index is currently valued at approximately 1.6 times book value and 10.6 times forward earnings expectations, and both measures look reasonable on a long-term basis. Given our long-term expected earnings growth rate of 7.5% and a current dividend yield of 2.6% for companies in the emerging markets index, the long-term expected return for emerging markets appears favorable.
Short-term market returns will likely be influenced by the outlook for global growth and the process in which developed market central banks, particularly the U.S. Federal Reserve, remove the extraordinary monetary stimulus measures taken since the onset of the global financial crisis.
In the near term, we expect global economies will continue to grow at a moderate pace and monetary stimulus will be cautiously withdrawn. If the environment shifts toward slower growth, our underallocation to the financial sector should help our relative performance.
Quoted Fund performance is for Class A shares and does not reflect a sales charge.
The returns shown do not reflect taxes a shareholder would pay on distributions or redemptions.
16
| | | | |
| Portfolio Composition | |
| (% of Portfolio) | |
Common Stock | | | 96.3 | % |
Preferred Stock | | | 2.0 | % |
Short-Term Investments | | | 1.7 | % |
| | | | |
Total | | | 100.0 | % |
| | | | |
| Major Market Sectors | |
| (% of Net Assets) | |
Financials | | | 26.5 | % |
Consumer Discretionary | | | 16.2 | % |
Materials | | | 16.0 | % |
Industrials | | | 12.5 | % |
Telecommunications Services | | | 10.8 | % |
Energy | | | 10.6 | % |
Information Technology | | | 3.9 | % |
Utilities | | | 1.5 | % |
Health Care | | | 0.4 | % |
| | | | |
| Top 10 Countries | |
| (% of Net Assets) | |
South Korea | | | 23.4 | % |
China | | | 8.3 | % |
South Africa | | | 6.7 | % |
Russia | | | 6.5 | % |
Hong Kong | | | 6.2 | % |
Poland | | | 6.1 | % |
Brazil | | | 5.5 | % |
Taiwan | | | 4.9 | % |
Indonesia | | | 4.3 | % |
United States | | | 4.1 | % |
Investments in securities in these countries represent 76.0% of the total net assets of the Fund.
Quoted Portfolio Composition, Major Market Sectors and Top 10 Countries are subject to change.
Portfolio Composition excludes collateral held for securities loaned.
The lists of Major Market Sectors and Top 10 Countries exclude short-term investments and collateral held for securities loaned.
Average Annual Total Returns1
As of October 31, 2013
| | | | | | | | |
Class A2 | | 1-Year | | | From
Inception
8/31/2012 | |
without sales charge | | | 3.26 | % | | | 5.16 | % |
with sales charge | | | -2.35 | % | | | 0.20 | % |
| | |
Institutional Class3 | | 1-Year | | | From
Inception
8/31/2012 | |
Net Asset Value | | | 3.65 | % | | | 5.50 | % |
1 | Past performance is not an indication of future results. Average annual total returns represent past performance and reflect changes in share prices, the reinvestment of all dividends and capital gains, and the effects of compounding. The prospectus contains more complete information on the investment objectives, risks, charges and expenses of the investment company, which investors should read and consider carefully before investing. To obtain a prospectus, contact a registered representative or visit www.thrivent.com. At various times, the Fund’s adviser waived its management fee and/or reimbursed Fund expenses. Had the adviser not done so, the Fund’s total returns would have been lower. The returns shown do not reflect taxes a shareholder would pay on distributions or redemptions. Total investment return and principal value of your investment will fluctuate, and your shares, when redeemed, may be worth more or less than their original cost. Current performance may be higher or lower than the performance data quoted. Call 800-THRIVENT or visit www.thrivent.com for performance results current to the most recent month-end. |
2 | Class A performance with sales charge reflects the maximum sales charge of 5.5%. |
3 | Institutional Class shares have no sales load and are for institutional shareholders only. |
(a) | Performance of other classes will be greater or less than the line shown based on the differences in loads and fees paid by shareholders investing in the different classes. |
* | As you compare performance, please note that the Fund’s performance reflects the maximum 5.5% sales charge, while the Barclays U.S. Aggregate Bond Index and the Consumer Price Index do not reflect any such charges. If you were to purchase any of the above individual securities represented in the Index, any charges you would pay would reduce your total return as well. |
** | The MSCI Emerging Markets Index is a modified capitalization-weighted index of selected emerging economies from around the world. It is not possible to invest directly in the Index. The performance of the Index does not reflect deductions for fees, expenses or taxes. |
*** | The Consumer Price Index is an inflationary indicator that measures the change in the cost of a fixed basket of products and services, including housing, electricity, food and transportation. It is not possible to invest directly in the Index. |
17
Thrivent Partner Small Cap Growth Fund
| | |

| | Subadvised by Turner Investments, L.P. The Fund seeks long-term growth of capital. The Fund primarily invests in securities of small companies. Smaller, less seasoned companies often have greater price volatility, lower trading volume, and less liquidity than larger, more established companies. The value of the Fund is influenced by factors impacting the overall market, certain asset classes, certain investment styles, and specific issuers. The Fund may incur losses due to incorrect assessments of investments by its investment advisers. |
How did the Fund perform during the 12-month period ended October 31, 2013?
Thrivent Partner Small Cap Growth Fund earned a return of 38.86%, compared with the median return of its peer group, the Lipper Small Cap Growth Funds category, of 37.26%. The Fund’s market benchmark, the Russell 2000® Growth Index, earned a return of 39.84%.
What factors affected the Fund’s performance?
During the period, five of the Fund’s nine sectors beat their corresponding index sectors on a relative basis. Contributing the most to performance were holdings in the health care sector, while the technology sector detracted the most from results.
The health care sector was an area of strength for the Fund. Shares of Acadia Pharmaceuticals rose after it received early approval from the FDA to file an application for its new drug pimavanserin, a treatment for Parkinson’s psychosis. We believe pimavanserin may have the potential to become a blockbuster drug because there are currently no FDA-approved treatments for the pyschosis in the U.S. NPS Pharmaceuticals also rose during the period as investors have responded favorably to the initial sales of its “orphan” drug Gattex, a treatment for the rare medical condition known as short-bowel syndrome (SBS). NPS has exclusivity on Gattex in the U.S. through 2020 and in Europe through 2022.
The technology sector was an area of weakness for the Fund. Allot Communications, a provider of Internet Protocol (IP) service optimization solutions for fixed and mobile broadband providers and large enterprises, came under pressure during the period on fears of a slowdown of its business, particularly in Europe. Internet telephony provider BroadSoft suffered from the delayed pickup in enterprise telecommunications spending as it provides Voice over Internet Protocol (VoIP) technology, which is replacing traditional telephony. We elected to sell these positions in the Fund and use the assets to invest in more high-conviction names.
What is your outlook?
As we see it, the market can continue to rise, supported by synchronized global expansion. In the U.S., a supportive financial market environment and the turnaround in the housing industry have improved consumer wealth. We believe this will lead to further strength for the consumer as we move into the holiday season and beyond.
A more stable Europe, an improving China and continued growth in emerging markets should also be supportive of future equity prices in our view. We expect equities to be an attractive area of investment that is supported by robust earnings growth, continued money flows and accommodative valuations.
Quoted Fund performance is for Class A shares and does not reflect a sales charge.
The returns shown do not reflect taxes a shareholder would pay on distributions or redemptions.
18
| | | | |
| Portfolio Composition | |
| (% of Portfolio) | |
Common Stock | | | 95.4 | % |
Short-Term Investments | | | 4.6 | % |
| | | | |
Total | | | 100.0 | % |
| | | | |
| Major Market Sectors | |
| (% of Net Assets) | |
Information Technology | | | 24.2 | % |
Industrials | | | 17.6 | % |
Consumer Discretionary | | | 17.6 | % |
Health Care | | | 16.2 | % |
Financials | | | 6.9 | % |
Consumer Staples | | | 5.9 | % |
Energy | | | 4.9 | % |
Materials | | | 3.4 | % |
Utilities | | | 0.1 | % |
| | | | |
| Top 10 Holdings | |
| (% of Net Assets) | |
United Natural Foods, Inc. | | | 1.4 | % |
NPS Pharmaceuticals, Inc. | | | 1.3 | % |
Monolithic Power Systems, Inc. | | | 1.2 | % |
Align Technology, Inc. | | | 1.2 | % |
Cardtronics, Inc. | | | 1.2 | % |
Rosetta Resources, Inc. | | | 1.2 | % |
OSI Systems, Inc. | | | 1.1 | % |
ANN, Inc. | | | 1.1 | % |
B&G Foods, Inc. | | | 1.1 | % |
Aspen Technology, Inc. | | | 1.1 | % |
These securities represent 11.9% of the total net assets of the Fund.
Quoted Major Market Sectors, Portfolio Composition and Top 10 Holdings are subject to change.
The lists of Major Market Sectors and Top 10 Holdings exclude short-term investments and collateral held for securities loaned.
The Portfolio Composition chart excludes collateral held for securities loaned.
Average Annual Total Returns1
As of October 31, 2013
| | | | | | | | | | | | |
Class A2 | | 1-Year | | | 5 Years | | | From
Inception
6/30/2005 | |
without sales charge | | | 38.86 | % | | | 17.85 | % | | | 7.57 | % |
with sales charge | | | 31.18 | % | | | 16.53 | % | | | 6.85 | % |
| | | |
Institutional Class3 | | 1-Year | | | 5 Years | | | From
Inception
6/30/2005 | |
Net Asset Value | | | 39.40 | % | | | 18.36 | % | | | 7.98 | % |
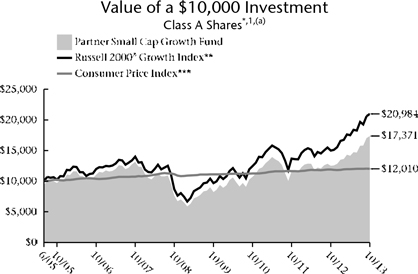
1 | Past performance is not an indication of future results. Average annual total returns represent past performance and reflect changes in share prices, the reinvestment of all dividends and capital gains, and the effects of compounding. The prospectus contains more complete information on the investment objectives, risks, charges and expenses of the investment company, which investors should read and consider carefully before investing. To obtain a prospectus, contact a registered representative or visit www.thrivent.com. At various times, the Fund’s adviser waived its management fee and/or reimbursed Fund expenses. Had the adviser not done so, the Fund’s total returns would have been lower. The returns shown do not reflect taxes a shareholder would pay on distributions or redemptions. Total investment return and principal value of your investment will fluctuate, and your shares, when redeemed, may be worth more or less than their original cost. Current performance may be higher or lower than the performance data quoted. Call 800-THRIVENT or visit www.thrivent.com for performance results current to the most recent month-end. |
2 | Class A performance with sales charge reflects the maximum sales charge of 5.5%. |
3 | Institutional Class shares have no sales load and are for institutional shareholders only. |
(a) | Performance of other classes will be greater or less than the line shown based on the differences in loads and fees paid by shareholders investing in the different classes. |
* | As you compare performance, please note that the Fund’s performance reflects the maximum 5.5% sales charge, while the Consumer Price Index and the Russell 2000® Growth Index do not reflect any such charges. If you were to purchase any of the above individual securities represented in the Index, any charges you would pay would reduce your total return as well. |
** | The Russell 2000® Growth Index is an index comprised of companies with a greater-than-average growth orientation. It is not possible to invest directly in the Index. The performance of the Index does not reflect deductions for fees, expenses or taxes. |
*** | The Consumer Price Index is an inflationary indicator that measures the change in the cost of a fixed basket of products and services, including housing, electricity, food and transportation. It is not possible to invest directly in the Index. |
19
Thrivent Partner Small Cap Value Fund
| | |

| | Subadvised by T. Rowe Price Associates, Inc. The Fund seeks long-term capital appreciation. The Fund primarily invests in securities of small companies. Smaller, less seasoned companies often have greater price volatility, lower trading volume, and less liquidity than larger, more established companies. The value of the Fund is influenced by factors impacting the overall market, certain asset classes, certain investment styles, and specific issuers. The Fund may incur losses due to incorrect assessments of investments by its investment advisers. Foreign investments involve additional risks, including currency fluctuations, liquidity, political, economic and market instability, and different legal and accounting standards. |
How did the Fund perform during the 12-month period ended October 31, 2013?
Thrivent Partner Small Cap Value Fund earned a return of 33.79%, compared with the median return of its peer group, the Lipper Small Cap Value Funds category, of 35.46%. The Fund’s market benchmark, the Russell 2000® Value Index, earned a return of 32.83%.
What factors affected the Fund’s performance?
At the overall sector level, stock selection was the primary driver of relative outperformance versus the benchmark, while beneficial sector allocation was also a strong contributor for the year.
Stock selection in financials was the largest contributor toward relative results, while our underweighting to the sector also largely helped. One of the stocks held in the portfolio was Home Bancshares, an Arkansas-based bank with some operations in Florida. The bank’s relatively strong position has allowed it to participate in a number of FDIC-assisted deals around the state of Florida, expanding its asset base and geographic footprint. Further, our underweighting to the financials sector has benefited relative performance as performance of the sector trailed several other sectors during the period, even though we believe the prospects for the space have improved tremendously since the nadir of the global financial crisis.
Our overweighting in industrials and business services further added to relative results. Our significant overweighting to this sector is primarily a residual effect of bottom-up analysis, as well as less-than-favorable views toward several other sectors. However, we are encouraged by the early signs of a resurgence in American manufacturing and what that could mean for the prospects of the sector.
Stock selection in consumer discretionary was a notable detractor for the period. Shares of specialty retailer Aarons continued to face headwinds. Same-store sales and customer growth were relatively lackluster in the most recent earnings release, and the HomeSmart concept has yet to show significant success.
What is your outlook?
The market’s strong performance thus far this year has heightened our caution about the likelihood of further gains in the remainder of the year. Moreover, the market’s gains have come with increasing signs of speculative activity. These have been most evident in the IPO market, where several stocks have soared 50%, if not doubled, on their first day of trading. Historically, phenomena such as this have been an indication that the market is closer to a top than to a bottom.
While we are not anticipating a market tumble, we have been adopting a more defensive stance in the portfolio. In becoming more defensive, we are employing the same fundamental approach that we use when stocks have sold off and we perceive ample opportunity: We have been going through the portfolio on a stock-by-stock basis and attempting to identify where we might substitute an existing holding for another one with a more compelling valuation. This has led us to trim or eliminate some of our winners, including some long-time holdings, where valuations have become stretched and the stock has pushed upward into the mid-cap category. In their place, we have been adding stocks that have lagged in the rally and appear mispriced relative to their prospects.
Despite our more defensive posture, we are maintaining our focus on long-term opportunities and continue to make investments across all segments of the market.
Quoted Fund performance is for Class A shares and does not reflect a sales charge.
The returns shown do not reflect taxes a shareholder would pay on distributions or redemptions.
20
Portfolio Composition
(% of Portfolio)
| | | | |
Common Stock | | | 96.9 | % |
Short-Term Investments | | | 2.9 | % |
Preferred Stock | | | 0.2 | % |
| | | | |
Total | | | 100.0 | % |
Major Market Sectors
(% of Net Assets)
| | | | |
Industrials | | | 25.2 | % |
Financials | | | 23.9 | % |
Consumer Discretionary | | | 15.2 | % |
Information Technology | | | 10.7 | % |
Materials | | | 8.8 | % |
Utilities | | | 4.8 | % |
Energy | | | 3.9 | % |
Health Care | | | 3.8 | % |
Consumer Staples | | | 0.6 | % |
Telecommunications Services | | | 0.3 | % |
Top 10 Holdings
(% of Net Assets)
| | | | |
Kirby Corporation | | | 1.9 | % |
Genesee & Wyoming, Inc. | | | 1.8 | % |
A.O. Smith Corporation | | | 1.8 | % |
ProAssurance Corporation | | | 1.8 | % |
Alaska Air Group, Inc. | | | 1.8 | % |
West Pharmaceutical Services, Inc. | | | 1.7 | % |
Aaron’s, Inc. | | | 1.7 | % |
Home Bancshares, Inc. | | | 1.7 | % |
East West Bancorp, Inc. | | | 1.6 | % |
SVB Financial Group | | | 1.5 | % |
These securities represent 17.3% of the total net assets of the Fund.
Quoted Major Market Sectors, Portfolio Composition and Top 10 Holdings are subject to change.
The lists of Major Market Sectors and Top 10 Holdings exclude short-term investments and collateral held for securities loaned.
The Portfolio Composition chart excludes collateral held for securities loaned.
Average Annual Total Returns1
As of October 31, 2013
| | | | | | | | | | | | |
Class A2 | | 1-Year | | | 5 Years | | | 10 Years | |
without sales charge | | | 33.79 | % | | | 16.26 | % | | | 10.56 | % |
with sales charge | | | 26.43 | % | | | 14.95 | % | | | 9.93 | % |
| | | |
Institutional Class3 | | 1-Year | | | 5 Years | | | 10 Years | |
Net Asset Value | | | 34.41 | % | | | 16.93 | % | | | 11.25 | % |
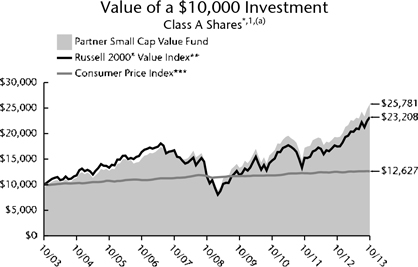
1 | Past performance is not an indication of future results. Average annual total returns represent past performance and reflect changes in share prices, the reinvestment of all dividends and capital gains, and the effects of compounding. The prospectus contains more complete information on the investment objectives, risks, charges and expenses of the investment company, which investors should read and consider carefully before investing. To obtain a prospectus, contact a registered representative or visit www.thrivent.com. At various times, the Fund’s adviser waived its management fee and/or reimbursed Fund expenses. Had the adviser not done so, the Fund’s total returns would have been lower. The returns shown do not reflect taxes a shareholder would pay on distributions or redemptions. Total investment return and principal value of your investment will fluctuate, and your shares, when redeemed, may be worth more or less than their original cost. Current performance may be higher or lower than the performance data quoted. Call 800-THRIVENT or visit www.thrivent.com for performance results current to the most recent month-end. |
2 | Class A performance with sales charge reflects the maximum sales charge of 5.5%. |
3 | Institutional Class shares have no sales load and are for institutional shareholders only. |
(a) | Performance of other classes will be greater or less than the line shown based on the differences in loads and fees paid by shareholders investing in the different classes. |
* | As you compare performance, please note that the Fund’s performance reflects the maximum 5.5% sales charge, while the Russell 2000® Value Index and the Consumer Price Index do not reflect any such charges. If you were to purchase any of the above individual securities represented in the Index, any charges you would pay would reduce your total return as well. |
** | The Russell 2000® Value Index measures the performance of small cap value stocks. It is not possible to invest directly in the Index. The performance of the Index does not reflect deductions for fees, expenses or taxes. |
*** | The Consumer Price Index is an inflationary indicator that measures the change in the cost of a fixed basket of products and services, including housing, electricity, food and transportation. It is not possible to invest directly in the Index. |
21
Thrivent Small Cap Stock Fund
Matthew D. Finn, CFA, Portfolio Manager*
The Fund seeks long-term capital growth.
The Fund primarily invests in securities of small companies. Smaller, less seasoned companies often have greater price volatility, lower trading volume, and less liquidity than larger, more established companies. The value of the Fund is influenced by factors impacting the overall market, certain asset classes, certain investment styles, and specific issuers. The Fund may incur losses due to incorrect assessments of investments by its investment adviser.
* | Effective March 2013, Matthew D. Finn became the Portfolio Manager. |
How did the Fund perform during the 12-month period ended October 31, 2013?
Thrivent Small Cap Stock Fund earned a return of 29.69%, compared with the median return of its peer group, the Lipper Small Cap Core Funds category, of 35.40%. The Fund’s market benchmark, the Russell 2000® Index, earned a return of 36.28%.
What factors affected the Fund’s performance?
Sector allocation and stock selection hurt relative performance during the period. Underweightings in strong sectors, including technology, health care and consumer discretionary, and an overweighting in the weakest area, utilities, accounted for the negative contribution from sector allocation. Stock selection was poor in technology, consumer discretionary, energy, consumer staples, industrials and health care. Stock selection was positive in the materials and financials sectors.
What is your outlook?
Since March 31, 2013, the positions in 23 companies have been removed from the portfolio and 32 companies have been added. Differences in sector and industry group weightings versus the benchmark have been reduced in many cases. Our approach is to add value through stock selection. By purchasing what we view as advantaged companies at prices that allow attractive expected returns, we expect to outperform our peers and benchmarks over time. Overall risk in the portfolio has been reduced, and in our view, return potential has been increased.
Quoted Fund performance is for Class A shares and does not reflect a sales charge.
The returns shown do not reflect taxes a shareholder would pay on distributions or redemptions.
22
| | | | |
| Portfolio Composition | |
| (% of Portfolio) | |
Common Stock | | | 92.1 | % |
Short-Term Investments | | | 7.9 | % |
| | | | |
Total | | | 100.0 | % |
| | | | |
| Major Market Sectors | |
| (% of Net Assets) | |
Financials | | | 19.2 | % |
Industrials | | | 18.7 | % |
Consumer Discretionary | | | 14.5 | % |
Information Technology | | | 11.3 | % |
Health Care | | | 8.7 | % |
Materials | | | 5.9 | % |
Energy | | | 5.2 | % |
Utilities | | | 4.4 | % |
Consumer Staples | | | 3.6 | % |
Telecommunications Services | | | 0.7 | % |
| | | | |
| Top 10 Holdings | |
| (% of Net Assets) | |
Affiliated Managers Group, Inc. | | | 2.8 | % |
SVB Financial Group | | | 2.8 | % |
EMCOR Group, Inc. | | | 2.7 | % |
GATX Corporation | | | 2.5 | % |
Meredith Corporation | | | 2.4 | % |
Align Technology, Inc. | | | 2.4 | % |
H.B. Fuller Company | | | 2.3 | % |
Manpower, Inc. | | | 2.2 | % |
Rosetta Resources, Inc. | | | 2.2 | % |
Nexstar Broadcasting Group, Inc. | | | 2.2 | % |
These securities represent 24.5% of the total net assets of the Fund.
Quoted Major Market Sectors, Portfolio Composition and Top 10 Holdings are subject to change.
The lists of Major Market Sectors and Top 10 Holdings exclude short-term investments and collateral held for securities loaned.
The Portfolio Composition chart excludes collateral held for securities loaned.
Average Annual Total Returns1
As of October 31, 2013
| | | | | | | | | | | | |
Class A2 | | 1-Year | | | 5 Years | | | 10 Years | |
without sales charge | | | 29.69 | % | | | 12.42 | % | | | 7.06 | % |
with sales charge | | | 22.57 | % | | | 11.15 | % | | | 6.46 | % |
| | | |
Institutional Class3 | | 1-Year | | | 5 Years | | | 10 Years | |
Net Asset Value | | | 30.39 | % | | | 13.14 | % | | | 7.72 | % |
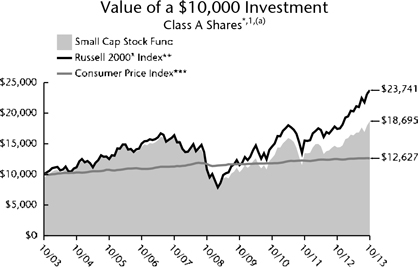
1 | Past performance is not an indication of future results. Average annual total returns represent past performance and reflect changes in share prices, the reinvestment of all dividends and capital gains, and the effects of compounding. The prospectus contains more complete information on the investment objectives, risks, charges and expenses of the investment company, which investors should read and consider carefully before investing. To obtain a prospectus, contact a registered representative or visit www.thrivent.com. At various times, the Fund’s adviser waived its management fee and/or reimbursed Fund expenses. Had the adviser not done so, the Fund’s total returns would have been lower. The returns shown do not reflect taxes a shareholder would pay on distributions or redemptions. Total investment return and principal value of your investment will fluctuate, and your shares, when redeemed, may be worth more or less than their original cost. Current performance may be higher or lower than the performance data quoted. Call 800-THRIVENT or visit www.thrivent.com for performance results current to the most recent month-end. |
2 | Class A performance with sales charge reflects the maximum sales charge of 5.5%. |
3 | Institutional Class shares have no sales load and are for institutional shareholders only. |
(a) | Performance of other classes will be greater or less than the line shown based on the differences in loads and fees paid by shareholders investing in the different classes. |
* | As you compare performance, please note that the Fund’s performance reflects the maximum 5.5% sales charge, while the Russell 2000® Index and the Consumer Price Index do not reflect any such charges. If you were to purchase any of the above individual securities represented in the Index, any charges you would pay would reduce your total return as well. |
** | The Russell 2000® Index measures the performance of small cap stocks. It is not possible to invest directly in the Index. The performance of the Index does not reflect deductions for fees, expenses or taxes. |
*** | The Consumer Price Index is an inflationary indicator that measures the change in the cost of a fixed basket of products and services, including housing, electricity, food and transportation. It is not possible to invest directly in the Index. |
23
Thrivent Mid Cap Growth Fund
Andrea J. Thomas, CFA, Portfolio Manager
The Fund seeks long-term growth of capital.
The Fund primarily invests in securities of mid-sized companies, which often have greater price volatility, lower trading volume, and less liquidity than larger, more established companies. The value of the Fund is influenced by factors impacting the overall market, certain asset classes, certain investment styles, and specific issuers. The Fund may incur losses due to incorrect assessments of investments by its investment adviser.
How did the Fund perform during the 12-month period ended October 31, 2013?
Thrivent Mid Cap Growth Fund earned a return of 27.13%, compared with the median return of its peer group, the Lipper Mid Cap Growth Funds category, of 32.47%. The Fund’s market benchmark, the Russell Midcap® Growth Index, earned a return of 33.93%.
What factors affected the Fund’s performance?
The fund was up strongly on an absolute basis, but underperformed its peers on a relative basis. This was primarily the result of owning fewer high multiple, high- growth momentum-driven names that were boosted by liquidity provided from the Fed. Despite this liquidity, there was a dearth of economic growth worldwide.
Due to this, investors flocked into a relatively narrow list of stocks that had revenue growth, without regard for valuations. Most of the underperformance occurred in the second quarter of 2013, a period in which investors were willing to pay astronomical multiples for seemingly strong organic growth companies. At the same time, because of the relative weakness of the world economy, companies with a cyclical bias experienced multiple compressions. We have had a bias against the former (extremely high valuations) and toward the latter (more cyclically sensitive, but with attractive valuations) as our experience shows that the latter group will ultimately be the source of sustainable excess returns.
Since mid-year 2013, we have seen a discernible shift on the part of investors away from the select group of highly valued, momentum-driven stocks into later cycle stocks, and this aided relative performance late in the period.
What is your outlook?
We are starting to see the “growth at any price” strategy that has been working for the past two years wane and a rotation beginning to occur. This rotation is toward later cycle economic growth, and we have positioned the portfolio to take advantage of this move. We have been very consistent with our strategy of buying growth companies, while being cognizant of the valuations of these names. While this limited returns relative to the benchmark early in the period, we believe the rotation in relative performance that began in the third quarter is likely to persist. As we have witnessed in the past, once this begins, these rotations can be very swift.
We continue to buy well-managed companies with sustainable growth trajectories and good balance sheets at reasonable prices. Although we believe overall market multiples could expand if the Fed continues its quantitative easing program, we do not believe extreme valuations on a very narrow list of names are ultimately sustainable. As the market broadens out, we expect to outperform our peers.
Quoted Fund performance is for Class A shares and does not reflect a sales charge.
The returns shown do not reflect taxes a shareholder would pay on distributions or redemptions.
24
| | | | |
| Portfolio Composition | |
| (% of Portfolio) | |
Common Stock | | | 95.5 | % |
Short-Term Investments | | | 4.5 | % |
| | | | |
Total | | | 100.0 | % |
| | | | |
| Major Market Sectors | |
| (% of Net Assets) | |
Industrials | | | 20.9 | % |
Information Technology | | | 19.4 | % |
Consumer Discretionary | | | 16.7 | % |
Health Care | | | 11.3 | % |
Financials | | | 8.8 | % |
Energy | | | 7.5 | % |
Consumer Staples | | | 5.2 | % |
Materials | | | 4.2 | % |
Telecommunications Services | | | 1.5 | % |
| | | | |
| Top 10 Holdings | |
| (% of Net Assets) | |
Affiliated Managers Group, Inc. | | | 3.0 | % |
Dollar Tree, Inc. | | | 2.7 | % |
Discovery Communications, Inc. | | | 2.6 | % |
Tractor Supply Company | | | 2.1 | % |
AMETEK, Inc. | | | 2.0 | % |
Whole Foods Market, Inc. | | | 1.9 | % |
ANSYS, Inc. | | | 1.9 | % |
Stericycle, Inc. | | | 1.9 | % |
Perrigo Company | | | 1.8 | % |
Agilent Technologies, Inc. | | | 1.7 | % |
These securities represent 21.6% of the total net assets of the Fund.
Quoted Major Market Sectors, Portfolio Composition and Top 10 Holdings are subject to change.
The lists of Major Market Sectors and Top 10 Holdings exclude short-term investments and collateral held for securities loaned.
The Portfolio Composition chart excludes collateral held for securities loaned.
Average Annual Total Returns1
As of October 31, 2013
| | | | | | | | | | | | |
Class A2 | | 1-Year | | | 5 Years | | | 10 Years | |
without sales charge | | | 27.13 | % | | | 18.10 | % | | | 8.85 | % |
with sales charge | | | 20.12 | % | | | 16.76 | % | | | 8.23 | % |
| | | |
Institutional Class3 | | 1-Year | | | 5 Years | | | 10 Years | |
Net Asset Value | | | 27.72 | % | | | 18.82 | % | | | 9.59 | % |
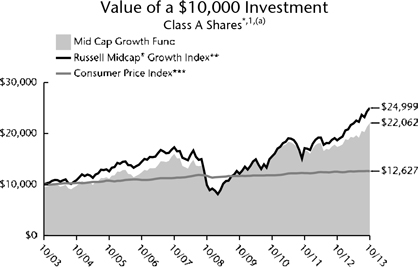
1 | Past performance is not an indication of future results. Average annual total returns represent past performance and reflect changes in share prices, the reinvestment of all dividends and capital gains, and the effects of compounding. The prospectus contains more complete information on the investment objectives, risks, charges and expenses of the investment company, which investors should read and consider carefully before investing. To obtain a prospectus, contact a registered representative or visit www.thrivent.com. At various times, the Fund’s adviser waived its management fee and/or reimbursed Fund expenses. Had the adviser not done so, the Fund’s total returns would have been lower. The returns shown do not reflect taxes a shareholder would pay on distributions or redemptions. Total investment return and principal value of your investment will fluctuate, and your shares, when redeemed, may be worth more or less than their original cost. Current performance may be higher or lower than the performance data quoted. Call 800-THRIVENT or visit www.thrivent.com for performance results current to the most recent month-end. |
2 | Class A performance with sales charge reflects the maximum sales charge of 5.5%. |
3 | Institutional Class shares have no sales load and are for institutional shareholders only. |
(a) | Performance of other classes will be greater or less than the line shown based on the differences in loads and fees paid by shareholders investing in the different classes. |
* | As you compare performance, please note that the Fund’s performance reflects the maximum 5.5% sales charge, while the Russell Midcap® Growth Index and the Consumer Price Index do not reflect any such charges. If you were to purchase any of the above individual securities represented in the Index, any charges you would pay would reduce your total return as well. |
** | The Russell Midcap® Growth Index measures the performance of mid-cap growth stocks. It is not possible to invest directly in the Index. The performance of the Index does not reflect deductions for fees, expenses, or taxes. |
*** | The Consumer Price Index is an inflationary indicator that measures the change in the cost of a fixed basket of products and services, including housing, electricity, food and transportation. It is not possible to invest directly in the Index. |
25
| | |

| | Thrivent Partner Mid Cap Value Fund |
| | Subadvised by Goldman Sachs Asset Management, L.P. |
| | The Fund seeks to achieve long-term capital appreciation. The Fund primarily invests in securities of mid-cap issuers, which often have greater price volatility, lower trading volume, and less liquidity than larger, more established companies. The value of the Fund is influenced by factors impacting the overall market, certain asset classes, certain investment styles, and specific issuers. The Fund may incur losses due to incorrect assessments of investments by its investment advisers. Foreign investments involve additional risks, including currency fluctuations, liquidity, political, economic and market instability, and different legal and accounting standards; these risks are magnified for investments in emerging markets. |
How did the Fund perform during the 12-month period ended October 31, 2013?
Thrivent Partner Mid Cap Value Fund generated a return of 30.68%, compared with the median return of its peer group, the Lipper Mid Cap Value Funds category, of 33.90%. The Fund’s market benchmark, the Russell Midcap® Value Index, posted a return of 33.45%.
What factors affected the Fund’s performance?
Our investments in the industrials and information technology sectors detracted from results, whereas our investments in the energy and financials sectors contributed to performance. Within industrials, Owens Corning was a top detractor. Its shares fell in February 2013 after the company guided lower-than-consensus expectations. We believe this was driven by increased competition and weak pricing in the company’s composites business. Its shares also dropped in June 2013 after completing a buyout of Thermafiber, a maker of mineral wool commercial and industrial insulation products.
Within the information technology sector, Altera was a top detractor. It posted disappointing results for consecutive quarters due to inventory transitioning and a weaker-than-expected global industry spending environment.
Within the energy sector, Pioneer Natural Resources was the top contributor to performance. Its shares rose as sentiment and expectations concerning its northern acreage increased. Management also announced expanded drilling in its most-productive acreage.
Principal Financial Group was a top contributor within the financials sector. The company reported positive results throughout 2013, largely due to strength in its retirement and investor services segments. More recently, Principal Financial Group and other insurance providers have benefited from the improving interest rate environment.
What is your outlook?
Our constructive view on the U.S. equity market has not wavered. From a valuation perspective, U.S. equities remain fair, relative to history, and inexpensive, relative to fixed income. Going forward, strong corporate balance sheets should provide companies with a number of options to enhance shareholder value, in our view. Furthermore, signs of improving U.S. economic growth remain intact. Still, uncertainties surrounding the scale and timing of the Federal Reserve Board’s tapering of asset purchases, rising interest rates, political gridlock in Washington D.C., and geopolitical risks associated with developments in the Middle East remain potential headwinds. Overall, regardless of the market direction, our fundamental, bottom-up stock selection continues to drive our process, rather than headlines or sentiment.
Quoted Fund performance is for Class A shares and does not reflect a sales charge.
The returns shown do not reflect taxes a shareholder would pay on distributions or redemptions.
26
| | | | |
| Portfolio Composition | |
| (% of Portfolio) | |
Common Stock | | | 98.4 | % |
Short-Term Investments | | | 1.6 | % |
| | | | |
Total | | | 100.0 | % |
| | | | |
| Major Market Sectors | |
| (% of Net Assets) | |
Financials | | | 31.6 | % |
Information Technology | | | 12.7 | % |
Consumer Discretionary | | | 11.1 | % |
Industrials | | | 9.4 | % |
Energy | | | 9.2 | % |
Health Care | | | 8.9 | % |
Utilities | | | 7.3 | % |
Materials | | | 5.1 | % |
Consumer Staples | | | 3.5 | % |
| | | | |
| Top 10 Holdings | |
| (% of Net Assets) | |
Cardinal Health, Inc. | | | 1.9 | % |
Chesapeake Energy Corporation | | | 1.9 | % |
Principal Financial Group, Inc. | | | 1.8 | % |
M&T Bank Corporation | | | 1.8 | % |
Invesco, Ltd. | | | 1.7 | % |
Cimarex Energy Company | | | 1.6 | % |
Liberty Interactive Corporation | | | 1.5 | % |
Agilent Technologies, Inc. | | | 1.5 | % |
Sempra Energy | | | 1.5 | % |
AvalonBay Communities, Inc. | | | 1.5 | % |
These securities represent 16.7% of the total net assets of the Fund.
Quoted Major Market Sectors, Portfolio Composition and Top 10 Holdings are subject to change.
The lists of Major Market Sectors and Top 10 Holdings exclude short-term investments and collateral held for securities loaned.
The Portfolio Composition chart excludes collateral held for securities loaned.
Average Annual Total Returns1
As of October 31, 2013
| | | | | | | | | | | | |
Class A2 | | 1-Year | | | 5 Years | | | From
Inception
6/30/2005 | |
without sales charge | | | 30.68 | % | | | 16.79 | % | | | 7.76 | % |
with sales charge | | | 23.45 | % | | | 15.47 | % | | | 7.03 | % |
| | | |
Institutional Class3 | | 1-Year | | | 5 Years | | | From
Inception
6/30/2005 | |
Net Asset Value | | | 31.14 | % | | | 17.18 | % | | | 8.10 | % |
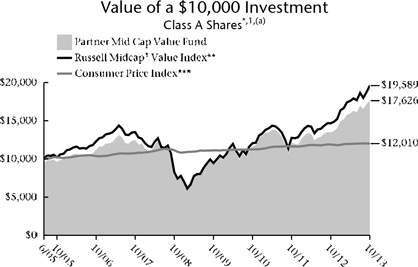
1 | Past performance is not an indication of future results. Average annual total returns represent past performance and reflect changes in share prices, the reinvestment of all dividends and capital gains, and the effects of compounding. The prospectus contains more complete information on the investment objectives, risks, charges and expenses of the investment company, which investors should read and consider carefully before investing. To obtain a prospectus, contact a registered representative or visit www.thrivent.com. At various times, the Fund’s adviser waived its management fee and/or reimbursed Fund expenses. Had the adviser not done so, the Fund’s total returns would have been lower. The returns shown do not reflect taxes a shareholder would pay on distributions or redemptions. Total investment return and principal value of your investment will fluctuate, and your shares, when redeemed, may be worth more or less than their original cost. Current performance may be higher or lower than the performance data quoted. Call 800-THRIVENT or visit www.thrivent.com for performance results current to the most recent month-end. |
2 | Class A performance with sales charge reflects the maximum sales charge of 5.5%. |
3 | Institutional Class shares have no sales load and are for institutional shareholders only. |
(a) | Performance of other classes will be greater or less than the line shown based on the differences in loads and fees paid by shareholders investing in the different classes. |
* | As you compare performance, please note that the Fund’s performance reflects the maximum 5.5% sales charge, while the Russell Midcap® Value Index and the Consumer Price Index do not reflect any such charges. If you were to purchase any of the above individual securities represented in the Index, any charges you would pay would reduce your total return as well. |
** | The Russell Midcap® Value Index is an index comprised of mid-cap companies with lower than average price-to-book ratios and lower forecasted growth values. It is not possible to invest directly in the Index. The performance of the Index does not reflect deductions for fees, expenses or taxes. |
*** | The Consumer Price Index is an inflationary indicator that measures the change in the cost of a fixed basket of products and services, including housing, electricity, food and transportation. It is not possible to invest directly in the Index. |
27
Thrivent Mid Cap Stock Fund
Brian J. Flanagan, CFA, Portfolio Manager
The Fund seeks long-term capital growth.
The Fund primarily invests in securities of mid-sized companies, which often have greater price volatility, lower trading volume, and less liquidity than larger, more established companies. The value of the Fund is influenced by factors impacting the overall market, certain asset classes, certain investment styles, and specific issuers. The Fund may incur losses due to incorrect assessments of investments by its investment adviser.
How did the Fund perform during the 12-month period ended October 31, 2013?
Thrivent Mid Cap Stock Fund earned a return of 32.86%, compared with the median return of its peer group, the Lipper Mid Cap Core Funds category, of 32.86%. The Fund’s market benchmark, the Russell Midcap® Index, earned a return of 33.79%.
What factors affected the Fund’s performance?
Strong returns within the information technology and industrial sectors offset weak returns within the energy and financial sectors. The information technology sector performance was broad-based as semiconductor, IT services and Internet software stocks contributed to the significant outperformance. Oshkosh led the industrial sector, as productivity improvements combined with solid end markets increased earnings. Southwest Airlines also contributed to the industrial sector’s performance as a focus on return-on-invested capital versus market share improved returns. Within the energy sector, Alpha Natural Resources suffered through a declining coal market driven by tougher regulations, increased international supply, and higher natural gas competition. Drillers Patterson-UTI Energy and Ensco were victims of pending capacity additions outpacing demand. Finally, the Fund’s financial holding returns, while solid, did not keep up with the extraordinary performance of competing firms more highly levered to an improving environment.
What is your outlook?
While valuation spreads have narrowed significantly, worldwide central banks continue to provide prodigious stimulus to the global economy and profit margins remain strong. This backdrop requires a balanced approach, and the Fund’s focus remains heavily weighted toward security selection with an equal billing to growth and valuation. As valuations continue to rise and growth factors gain prominence within our analysis, we anticipate holding somewhat smaller position sizes and more stocks. Semiconductor valuations remain attractive at the same time inventories are low and units are undershipping long-term demand—characteristics that should provide attractive returns. We expect the Fund will continue to be overweight in financials that will benefit from rising rates, as Fed tapering is more a question of when than if. Most corporations remain tight-fisted with expansionary capital, continue to generate significant cash flow, and do not require bank loans to expand their businesses. However, as confidence slowly increases and businesses expand once again, the combination of increased loan demand and rising interest rates should benefit regional banks. The consumer discretionary sector is one sector that has begun to increase capacity after a long retrenchment period. This increased capacity may increase an already competitive environment, limiting margins and returns. Therefore, the largest underweight in the Fund is the specialty retail space.
Overall, market multiples still have the potential to expand— even with slightly higher interest rates that are anticipated to accompany an improving economy. Given the central banks’ actions around the world, an improving worldwide economy seems likely. However, as valuations continue to move higher and worldwide economies move deeper into an expansionary phase, risks to stocks will increase. In this environment, improving margins and returns will be more important than simply cheap valuations. As previously mentioned, we will balance this risk with more holdings and somewhat smaller position sizes.
Quoted Fund performance is for Class A shares and does not reflect a sales charge.
The returns shown do not reflect taxes a shareholder would pay on distributions or redemptions.
28
| | | | |
| Portfolio Composition | |
| (% of Portfolio) | |
Common Stock | | | 95.9 | % |
Short-Term Investments | | | 4.1 | % |
| | | | |
Total | | | 100.0 | % |
| | | | |
| Major Market Sectors | |
| (% of Net Assets) | |
Financials | | | 21.7 | % |
Information Technology | | | 20.8 | % |
Industrials | | | 14.5 | % |
Consumer Discretionary | | | 12.3 | % |
Health Care | | | 12.1 | % |
Energy | | | 6.2 | % |
Materials | | | 3.9 | % |
Utilities | | | 2.5 | % |
Consumer Staples | | | 2.1 | % |
| | | | |
| Top 10 Holdings | |
| (% of Net Assets) | |
Alliance Data Systems Corporation | | | 4.3 | % |
NVIDIA Corporation | | | 2.4 | % |
Oshkosh Corporation | | | 2.4 | % |
Applied Materials, Inc. | | | 2.3 | % |
Illumina, Inc. | | | 2.1 | % |
Huntington Bancshares, Inc. | | | 2.0 | % |
Thoratec Corporation | | | 1.9 | % |
Teradyne, Inc. | | | 1.9 | % |
Zimmer Holdings, Inc. | | | 1.8 | % |
Zions Bancorporation | | | 1.8 | % |
These securities represent 22.9% of the total net assets of the Fund.
Quoted Major Market Sectors, Portfolio Composition and Top 10 Holdings are subject to change.
The lists of Major Market Sectors and Top 10 Holdings exclude short-term investments and collateral held for securities loaned.
The Portfolio Composition chart excludes collateral held for securities loaned.
Average Annual Total Returns1
As of October 31, 2013
| | | | | | | | | | | | |
Class A2 | | 1-Year | | | 5 Years | | | 10 Years | |
without sales charge | | | 32.86 | % | | | 17.73 | % | | | 9.16 | % |
with sales charge | | | 25.58 | % | | | 16.40 | % | | | 8.55 | % |
| | | |
Institutional Class3 | | 1-Year | | | 5 Years | | | 10 Years | |
Net Asset Value | | | 33.41 | % | | | 18.32 | % | | | 9.72 | % |
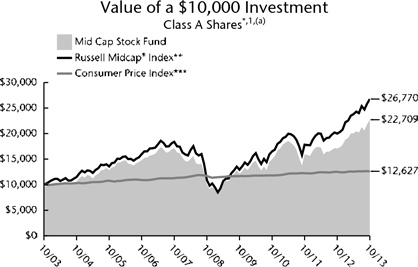
1 | Past performance is not an indication of future results. Average annual total returns represent past performance and reflect changes in share prices, the reinvestment of all dividends and capital gains, and the effects of compounding. The prospectus contains more complete information on the investment objectives, risks, charges and expenses of the investment company, which investors should read and consider carefully before investing. To obtain a prospectus, contact a registered representative or visit www.thrivent.com. At various times, the Fund’s adviser waived its management fee and/or reimbursed Fund expenses. Had the adviser not done so, the Fund’s total returns would have been lower. The returns shown do not reflect taxes a shareholder would pay on distributions or redemptions. Total investment return and principal value of your investment will fluctuate, and your shares, when redeemed, may be worth more or less than their original cost. Current performance may be higher or lower than the performance data quoted. Call 800-THRIVENT or visit www.thrivent.com for performance results current to the most recent month-end. |
2 | Class A performance with sales charge reflects the maximum sales charge of 5.5%. |
3 | Institutional Class shares have no sales load and are for institutional shareholders only. |
(a) | Performance of other classes will be greater or less than the line shown based on the differences in loads and fees paid by shareholders investing in the different classes. |
* | As you compare performance, please note that the Fund’s performance reflects the maximum 5.5% sales charge, while the Russell Midcap® Index and the Consumer Price Index do not reflect any such charges. If you were to purchase any of the above individual securities represented in the Index, any charges you would pay would reduce your total return as well. |
** | The Russell Midcap® Index is an index that measures the performance of the smallest 800 securities in the Russell 1000® Index, as ranked by total market capitalization. It is not possible to invest directly in these Indexes. The performance of these Indexes does not reflect deductions for fees, expenses or taxes. |
*** | The Consumer Price Index is an inflationary indicator that measures the change in the cost of a fixed basket of products and services, including housing, electricity, food and transportation. It is not possible to invest directly in the Index. |
29
| | |

| | Thrivent Partner Worldwide Allocation Fund |
| | Subadvised by Mercator Asset Management, LP, Principal Global Investors, LLC, Aberdeen Asset Managers Limited, DuPont Capital Management, Inc., and Goldman Sachs Asset Management, L.P.* |
| | The Fund seeks long-term capital growth. |
| | The Fund primarily invests in equity and debt securities of issuers throughout the world. Foreign investments involve additional risks, including currency fluctuations, liquidity, political, economic and market instability, and different legal and accounting standards; these risks are magnified for investments in emerging markets. The value of the Fund is influenced by factors impacting the overall market, certain asset classes, certain investment styles, and specific issuers. The Fund may incur losses due to incorrect assessments of investments by its investment advisers. Small and medium-sized companies often have greater price volatility and less liquidity than larger companies. Large cap companies may be unable to respond quickly to new competitive challenges and may not be able to attain a high growth rate. Bond prices generally fall as interest rates rise. Credit risk is the risk that an issuer of a debt security may not pay its debt, and high yield securities are subject to increased credit risk as well as liquidity risk. The investment styles employed by the Fund’s sub-advisers may not be complementary. |
| | * Effective September 2013, Goldman Sachs Asset Management, L.P. replaced Victory Capital Management Inc. as a subadviser. |
How did the Fund perform during the 12-month period ended October 31, 2013?
Thrivent Partner Worldwide Allocation Fund earned a return of 20.26%, compared with the median return of its peer group, the Lipper International Multi-Cap Core Funds category, of 23.69%. The Fund’s market benchmark, the Morgan Stanley Capital International (MSCI) All Country World Index ex-USA, earned a return of 20.80%.
What factors affected the Fund’s performance?
The Fund has allocations in developed markets, including large-cap as well as mid- and small-cap Europe, Asia and Australasian markets. We also maintain an allocation in emerging markets debt and equities. Within those categories, the developed market segments outperformed the emerging segments by a significant margin, although the emerging market debt segment did not perform as well as the equity segment. Most of the portfolio’s component managers did well versus their respective benchmarks, achieving particularly good relative returns in the large-cap growth and value segments of the portfolio. The emerging market managers did not perform as well as their segments.
What is your outlook?
Equity markets have seen a sharp recovery over the period with particular strength in the developed market segments, after several years of underperforming the U.S.
Europe has been in an extended period of unusually low growth and fiscal instability for some time, and entered a modest recession in 2012. Data suggests those economies are beginning to recover and the fiscal imbalances are improving. Generally, however, equity markets outside the U.S. are selling for below-average valuations versus their respective histories, and we believe they present interesting valuation opportunities. Emerging markets, while statistically undervalued, appear to continue to be facing economic headwinds related to both the extended commodity overinvestment cycle and uncertainty related to growth in the Chinese economy. We are monitoring the situation in emerging markets equities but have not yet increased our position.
Quoted Fund performance is for Class A shares and does not reflect a sales charge.
The returns shown do not reflect taxes a shareholder would pay on distributions or redemptions.
30
| | | | |
| Portfolio Composition | |
| (% of Portfolio) | |
Common Stock | | | 89.5 | % |
Long-Term Fixed Income | | | 8.5 | % |
Short-Term Investments | | | 1.6 | % |
Preferred Stock | | | 0.4 | % |
| | | | |
Total | | | 100.0 | % |
| | | | |
| Major Market Sectors | |
| (% of Net Assets) | |
Financials | | | 22.0 | % |
Industrials | | | 17.1 | % |
Consumer Discretionary | | | 14.1 | % |
Energy | | | 8.2 | % |
Consumer Staples | | | 8.1 | % |
Materials | | | 7.6 | % |
Foreign Government | | | 5.6 | % |
Health Care | | | 5.5 | % |
Information Technology | | | 5.4 | % |
Telecommunications Services | | | 3.6 | % |
| | | | |
| Top 10 Countries | |
| (% of Net Assets) | |
Japan | | | 15.9 | % |
United Kingdom | | | 12.0 | % |
Switzerland | | | 8.1 | % |
France | | | 6.3 | % |
Germany | | | 5.5 | % |
Australia | | | 3.8 | % |
Canada | | | 3.4 | % |
Hong Kong | | | 3.1 | % |
Italy | | | 3.0 | % |
Netherlands | | | 2.8 | % |
Investments in securities in these countries represent 63.9% of the total net assets of the Fund.
Quoted Major Market Sectors, Portfolio Composition and Top 10 Countries are subject to change.
The lists of Major Market Sectors and Top 10 Countries exclude short-term investments and collateral held for securities loaned.
The Portfolio Composition chart excludes collateral held for securities loaned.
Average Annual Total Returns1
As of October 31, 2013
| | | | | | | | | | | | |
Class A2 | | 1-Year | | | 5 Years | | | From
Inception
2/29/2008 | |
without sales charge | | | 20.26 | % | | | 12.68 | % | | | 1.79 | % |
with sales charge | | | 13.62 | % | | | 11.42 | % | | | 0.79 | % |
| | | |
Institutional Class3 | | 1-Year | | | 5 Years | | | From
Inception
2/29/2008 | |
Net Asset Value | | | 20.64 | % | | | 13.07 | % | | | 2.14 | % |
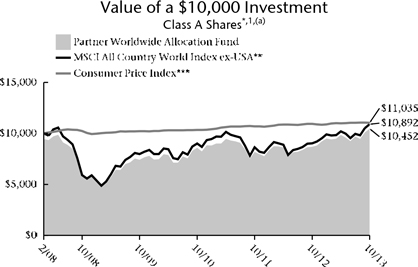
1 | Past performance is not an indication of future results. Average annual total returns represent past performance and reflect changes in share prices, the reinvestment of all dividends and capital gains, and the effects of compounding. The prospectus contains more complete information on the investment objectives, risks, charges and expenses of the investment company, which investors should read and consider carefully before investing. To obtain a prospectus, contact a registered representative or visit www.thrivent.com. At various times, the Fund’s adviser waived its management fee and/or reimbursed Fund expenses. Had the adviser not done so, the Fund’s total returns would have been lower. The returns shown do not reflect taxes a shareholder would pay on distributions or redemptions. Total investment return and principal value of your investment will fluctuate, and your shares, when redeemed, may be worth more or less than their original cost. Current performance may be higher or lower than the performance data quoted. Call 800-THRIVENT or visit www.thrivent.com for performance results current to the most recent month-end. |
2 | Class A performance with sales charge reflects the maximum sales charge of 5.5%. |
3 | Institutional Class shares have no sales load and are for institutional shareholders only. |
(a) | Performance of other classes will be greater or less than the line shown based on the differences in loads and fees paid by shareholders investing in the different classes. |
* | As you compare performance, please note that the Fund’s performance reflects the maximum 5.5% sales charge, while the MSCI All Country World Index ex-USA and the Consumer Price Index do not reflect any such charges. If you were to purchase any of the above individual securities represented in the Index, any charges you would pay would reduce your total return as well. |
** | The MSCI All Country World Index ex-USA is an unmanaged market capitalization-weighted index that is designed to represent the performance of developed and emerging stock markets throughout the world. It is not possible to invest directly in the Index. The performance of the Index does not reflect deductions for fees, expenses or taxes. |
*** | The Consumer Price Index is an inflationary indicator that measures the change in the cost of a fixed basket of products and services, including housing, electricity, food and transportation. It is not possible to invest directly in the Index. |
31
Thrivent Large Cap Growth Fund
David C. Francis, CFA, Portfolio Manager
The Fund seeks long-term capital appreciation.
The Fund primarily invests in securities of large companies, which may be unable to respond quickly to new competitive challenges and may not be able to attain a high growth rate. The value of the Fund is influenced by factors impacting the overall market, certain asset classes, certain investment styles, and specific issuers. The Fund may incur losses due to incorrect assessments of investments by its investment adviser. Foreign investments involve additional risks, including currency fluctuations, liquidity, political, economic and market instability, and different legal and accounting standards.
How did the Fund perform during the 12-month period ended October 31, 2013?
Thrivent Large Cap Growth Fund earned a return of 29.99%, compared with the median return for its peer group, the Lipper Large Cap Growth Funds category, of 28.73%. The Fund’s market benchmark, the Russell 1000® Growth Index, earned a return of 28.30%.
What factors affected the Fund’s performance?
The Fund’s results were favorably impacted compared with its benchmark by good stock selection in the information technology (IT), health care and industrials sections of the portfolio. Mitigating that performance in this year, despite the strong absolute levels of performance, was a small cash position held for liquidity and transaction purposes as well as sub-par stock selection in the materials and consumer discretionary groups.
Holdings in Facebook and Google were the lead contributors to results in the technology group, with additional performance support from holdings in Visa and MasterCard in the IT services industry and Texas Instruments in the semiconductor industry. Apple, which had previously provided excellent returns, declined in the period as concerns surfaced relative to the sustainability of its still strong organic growth and competitive positioning. VMware and Citrix Systems also limited returns in the software sector.
Holdings in biotechnology, health care equipment and specialty pharmaceutical company Shire Pharmaceuticals provided superior results in the health care sector. In the industrials sector, Jacobs Engineering and Parker-Hannifin provided excellent results.
In consumer-specialty retail, holdings in Sally Beauty and AutoZone performed below their respective groups and the market, detracting from returns.
What is your outlook?
The market has advanced strongly over the last 18 months, largely on the basis of expanding valuations in the form of higher price/earnings (P/E) ratios. After recovering sharply from the financial crisis, earnings growth has advanced, and we believe will continue to do so, but at a more moderate pace, consistent with a tepid-but-sustained recovery. Economic growth could accelerate with employment growth, sustained recovery in housing and moderation of the fiscal drag implicit in a declining deficit. Monetary policy is expected to remain accommodative well into 2014.
That said, valuations are full and profits margins have likely peaked for the cycle, so incremental growth will be challenging. There are signs of recovery in Europe, which could be an additional economic tailwind. Despite the challenges for growth, both domestically and globally, we must be invested and continue to emphasize companies with strong management, sound business models and organic growth with a multi-year investment horizon, as we believe those attributes are consistent with superior excess returns. Of late, we are finding a number of interesting investment opportunities in large-capitalization companies domiciled outside of the U.S., and are selectively taking positions in them.
Quoted Fund performance is for Class A shares and does not reflect a sales charge.
The returns shown do not reflect taxes a shareholder would pay on distributions or redemptions.
32
| | | | |
| Portfolio Composition | |
| (% of Portfolio) | |
Common Stock | | | 95.9 | % |
Short-Term Investments | | | 4.1 | % |
| | | | |
Total | | | 100.0 | % |
| | | | |
| Major Market Sectors | |
| (% of Net Assets) | |
Information Technology | | | 28.9 | % |
Consumer Discretionary | | | 19.1 | % |
Health Care | | | 14.0 | % |
Industrials | | | 10.6 | % |
Financials | | | 9.5 | % |
Energy | | | 8.3 | % |
Consumer Staples | | | 3.1 | % |
Materials | | | 1.9 | % |
| | | | |
| Top 10 Holdings | |
| (% of Net Assets) | |
Apple, Inc. | | | 8.1 | % |
Google, Inc. | | | 7.1 | % |
Gilead Sciences, Inc. | | | 5.0 | % |
Amazon.com, Inc. | | | 4.2 | % |
QUALCOMM, Inc. | | | 4.1 | % |
Facebook, Inc. | | | 3.8 | % |
Comcast Corporation | | | 3.4 | % |
Weatherford International, Ltd. | | | 3.1 | % |
Jacobs Engineering Group, Inc. | | | 3.1 | % |
Honeywell International, Inc. | | | 3.0 | % |
These securities represent 44.9% of the total net assets of the Fund.
Quoted Major Market Sectors, Portfolio Composition and Top 10 Holdings are subject to change.
The lists of Major Market Sectors and Top 10 Holdings exclude short-term investments and collateral held for securities loaned.
The Portfolio Composition chart excludes collateral held for securities loaned.
Average Annual Total Returns1
As of October 31, 2013
| | | | | | | | | | | | |
Class A2 | | 1-Year | | | 5 Years | | | 10 Years | |
without sales charge | | | 29.99 | % | | | 14.11 | % | | | 6.04 | % |
with sales charge | | | 22.82 | % | | | 12.86 | % | | | 5.44 | % |
| | | |
Institutional Class3 | | 1-Year | | | 5 Years | | | 10 Years | |
Net Asset Value | | | 30.30 | % | | | 14.55 | % | | | 6.56 | % |
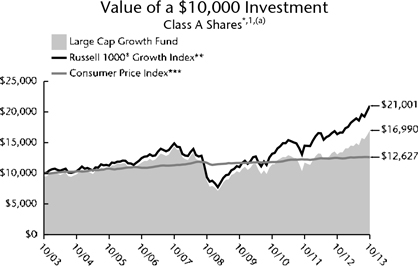
1 | Past performance is not an indication of future results. Average annual total returns represent past performance and reflect changes in share prices, the reinvestment of all dividends and capital gains, and the effects of compounding. The prospectus contains more complete information on the investment objectives, risks, charges and expenses of the investment company, which investors should read and consider carefully before investing. To obtain a prospectus, contact a registered representative or visit www.thrivent.com. At various times, the Fund’s adviser waived its management fee and/or reimbursed Fund expenses. Had the adviser not done so, the Fund’s total returns would have been lower. The returns shown do not reflect taxes a shareholder would pay on distributions or redemptions. Total investment return and principal value of your investment will fluctuate, and your shares, when redeemed, may be worth more or less than their original cost. Current performance may be higher or lower than the performance data quoted. Call 800-THRIVENT or visit www.thrivent.com for performance results current to the most recent month-end. |
2 | Class A performance with sales charge reflects the maximum sales charge of 5.5%. |
3 | Institutional Class shares have no sales load and are for institutional shareholders only. |
(a) | Performance of other classes will be greater or less than the line shown based on the differences in loads and fees paid by shareholders investing in the different classes. |
* | As you compare performance, please note that the Fund’s performance reflects the maximum 5.5% sales charge, while the Russell 1000® Growth Index and the Consumer Price Index do not reflect any such charges. If you were to purchase any of the above individual securities represented in the Index, any charges you would pay would reduce your total return as well. |
** | The Russell 1000® Growth Index measures the performance of large cap growth stocks. It is not possible to invest directly in the Index. The performance of the Index does not reflect deductions for fees, expenses or taxes. |
*** | The Consumer Price Index is an inflationary indicator that measures the change in the cost of a fixed basket of products and services, including housing, electricity, food and transportation. It is not possible to invest directly in the Index. |
33
Thrivent Large Cap Value Fund
Kurt J. Lauber, CFA, Portfolio Manager*
The Fund seeks to achieve long-term growth of capital.
The Fund primarily invests in securities of large companies, which may be unable to respond quickly to new competitive challenges and may not be able to attain a high growth rate. The value of the Fund is influenced by factors impacting the overall market, certain asset classes, certain investment styles, and specific issuers. The Fund may incur losses due to incorrect assessments of investments by its investment adviser. Foreign investments involve additional risks, including currency fluctuations, liquidity, political, economic and market instability, and different legal and accounting standards.
* | Effective March 2013, Kurt J. Lauber became the Portfolio Manager. |
How did the Fund perform during the 12-month period ended October 31, 2013?
Thrivent Large Cap Value Fund earned a return of 28.92%, compared with the median return of its peer group, the Lipper Large Cap Value Funds category, of 27.21%. The Fund’s market benchmark, the Russell 1000® Value Index, earned a return of 28.29%.
What factors affected the Fund’s performance?
Stock selection was strong in consumer discretionary, financials, energy and materials, and negative in health care. In consumer discretionary, Delphi Automotive, an auto parts company, and Lowe’s Companies, a home improvement retailer, were the largest contributors to performance. The process for selecting shares of Lowe’s Company is a good illustration of our value investment approach. Due to a decline in the housing market and slow recovery in the economy, consumers put off home improvements and the renovation of homes for sale or after purchase. Under these conditions, Lowe’s was under-earning. However, home improvement companies have historically provided good returns due to fewer competitors and less cannibalization from online shopping compared to other retailers. Additionally, retailers that slow square footage and introduce new initiatives tend to achieve improved returns. Lowe’s slowed store builds, initiated a strategic review of all products, and is now benefiting from these initiatives and the recovery in home improvement spending.
In the financial sector, State Street Corporation, Bank of America and SVB Financial Bank were the best performers. Stock selection continued to be strong in the energy exploration and production sector with EOG Resources and EQT Corporation. Both companies have used new drilling techniques in the U.S. to discover more oil and gas than investors expected and at a lower cost.
Health care was the portfolio’s weakest area of stock selection. Merck had some potential pharmaceutical products fail during late-stage testing and a few products delayed by the FDA, as well as unexpected weakness in its Januvia franchise that put pressure on shares. The portfolio continues to hold the stock due to a new head of R&D, announced restructuring, and new products in the area of cancer treatment.
What is your outlook?
As always, our focus is on stock selection. Buying good-return companies at attractive prices will be rewarding in the long run. We will continue to use valuation as our guide and take advantage of opportunities as they present themselves. Our deep fundamental analysis approach will help identify companies with improving operating performance and catalysts to unlock value.
While never easy, stock selection will become more difficult now that valuation spreads have compressed in most sectors. The largest area of overweight is technology, where valuation spreads remain wide, especially for companies perceived to be secular or long-term losers, like Cisco, Symantec, NetApp and Teradata. However, good-return companies, which are priced at free cash-flow yields that predict no or slow growth, have products or company-specific initiatives that we believe address and overcome secular risks.
Total Corporation replaced BP as the largest weighted company in energy. After years of refocus and reinvestment in operations, we believe Total is in a position to provide the best growth among large integrated oil companies with the lowest valuation.
Quoted Fund performance is for Class A shares and does not reflect a sales charge.
The returns shown do not reflect taxes a shareholder would pay on distributions or redemptions.
34
| | | | |
| Portfolio Composition | |
| (% of Portfolio) | |
Common Stock | | | 97.4 | % |
Short-Term Investments | | | 2.6 | % |
| | | | |
Total | | | 100.0 | % |
| | | | |
| Major Market Sectors | |
| (% of Net Assets) | |
Financials | | | 22.5 | % |
Energy | | | 13.0 | % |
Information Technology | | | 13.0 | % |
Health Care | | | 12.7 | % |
Consumer Discretionary | | | 10.4 | % |
Industrials | | | 9.8 | % |
Consumer Staples | | | 7.0 | % |
Utilities | | | 4.4 | % |
Materials | | | 3.0 | % |
Telecommunications Services | | | 1.6 | % |
| | | | |
| Top 10 Holdings | |
| (% of Net Assets) | |
Citigroup, Inc. | | | 4.1 | % |
Merck & Company, Inc. | | | 3.6 | % |
Lowe’s Companies, Inc. | | | 3.6 | % |
Bank of America Corporation | | | 3.2 | % |
MetLife, Inc. | | | 3.1 | % |
Total SA ADR | | | 2.9 | % |
Texas Instruments, Inc. | | | 2.7 | % |
Marathon Oil Corporation | | | 2.7 | % |
Cisco Systems, Inc. | | | 2.6 | % |
Baxter International, Inc. | | | 2.5 | % |
These securities represent 31.0% of the total net assets of the Fund.
Quoted Major Market Sectors, Portfolio Composition and Top 10 Holdings are subject to change.
The lists of Major Market Sectors and Top 10 Holdings exclude short-term investments and collateral held for securities loaned.
The Portfolio Composition chart excludes collateral held for securities loaned.
Average Annual Total Returns1
As of October 31, 2013
| | | | | | | | | | | | |
Class A2 | | 1-Year | | | 5 Years | | | 10 Years | |
without sales charge | | | 28.92 | % | | | 12.51 | % | | | 7.25 | % |
with sales charge | | | 21.86 | % | | | 11.24 | % | | | 6.64 | % |
| | | |
Institutional Class3 | | 1-Year | | | 5 Years | | | 10 Years | |
Net Asset Value | | | 29.57 | % | | | 13.14 | % | | | 7.83 | % |
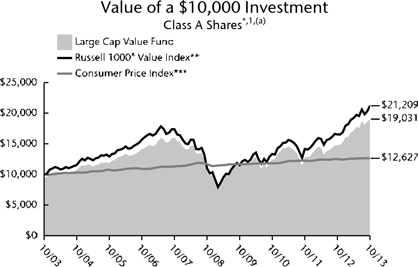
1 | Past performance is not an indication of future results. Average annual total returns represent past performance and reflect changes in share prices, the reinvestment of all dividends and capital gains, and the effects of compounding. The prospectus contains more complete information on the investment objectives, risks, charges and expenses of the investment company, which investors should read and consider carefully before investing. To obtain a prospectus, contact a registered representative or visit www.thrivent.com. At various times, the Fund’s adviser waived its management fee and/or reimbursed Fund expenses. Had the adviser not done so, the Fund’s total returns would have been lower. The returns shown do not reflect taxes a shareholder would pay on distributions or redemptions. Total investment return and principal value of your investment will fluctuate, and your shares, when redeemed, may be worth more or less than their original cost. Current performance may be higher or lower than the performance data quoted. Call 800-THRIVENT or visit www.thrivent.com for performance results current to the most recent month-end. |
2 | Class A performance with sales charge reflects the maximum sales charge of 5.5%. |
3 | Institutional Class shares have no sales load and are for institutional shareholders only. |
(a) | Performance of other classes will be greater or less than the line shown based on the differences in loads and fees paid by shareholders investing in the different classes. |
* | As you compare performance, please note that the Fund’s performance reflects the maximum 5.5% sales charge, while the Russell 1000® Value Index and the Consumer Price Index do not reflect any such charges. If you were to purchase any of the above individual securities represented in the Index, any charges you would pay would reduce your total return as well. |
** | The Russell 1000® Value Index measures the performance of large cap value stocks. It is not possible to invest directly in the Index. The performance of the Index does not reflect deductions for fees, expenses or taxes. |
*** | The Consumer Price Index is an inflationary indicator that measures the change in the cost of a fixed basket of products and services, including housing, electricity, food and transportation. It is not possible to invest directly in the Index. |
35
Thrivent Large Cap Stock Fund
David C. Francis, CFA, and Kurt J. Lauber, CFA, Portfolio Co-Managers*
The Fund seeks long-term capital growth.
The Fund primarily invests in securities of large companies, which may be unable to respond quickly to new competitive challenges and may not be able to attain a high growth rate. The value of the Fund is influenced by factors impacting the overall market, certain asset classes, certain investment styles, and specific issuers. The Fund may incur losses due to incorrect assessments of investments by its investment adviser. Foreign investments involve additional risks, including currency fluctuations, liquidity, political, economic and market instability, and different legal and accounting standards.
* Effective March 2013, Kurt J. Lauber became a Portfolio Co-Manager.
How did the Fund perform during the 12-month period ended October 31, 2013?
Thrivent Large Cap Stock Fund earned a return of 24.57%, compared with the median return of its peer group, the Lipper Large Cap Core Funds category, of 26.96%. The Fund’s market benchmark, the S&P 500 Index, earned a return of 27.18%.
What factors affected the Fund’s performance?
Stock selection was the primary factor in underperformance compared with the Fund’s benchmark, although absolute returns were quite strong. Early in the period, underperformance in select holdings in the materials, consumer discretionary and technology sectors limited the Fund’s participation in the market advance. Specifically, holdings in Sally Beauty and AutoZone in specialty retail, and Time Warner in media, underperformed. In health care, holdings in pharmaceutical companies Merck and Eli Lilly did not keep pace, but that was mitigated by good returns in the Fund’s holdings in Shire Pharmaceuticals and biotech companies Gilead and Biogen Idec. Commodity prices continued to be under pressure and our holdings in the materials sectors detracted from results. We experienced good returns in our holdings in the energy sector. In particular, our holding in Weatherford International performed quite well, as did a position in EOG Resources. In the industrial segment of the Fund, holdings in United Technologies and Honeywell International outperformed, as did Jacobs Engineering and Parker-Hannofin. Apple Computer in the technology sector underperformed as concerns emerged about competitive products and slowing organic growth. A timely purchase of Facebook in the second quarter prior to a significant improvement in earnings and subsequent surge in the stock significantly added to results late in the period. Fund performance improved significantly in the second half of the period.
What is your outlook?
The market has advanced strongly over the last 18 months, largely on the basis of expanding valuations in the form of higher P/E ratios. After recovering sharply from the financial crisis, earnings growth has advanced, and we believe will continue to do so, but at a more moderate pace, consistent with a tepid, but sustained, recovery. Economic growth could accelerate with employment growth, sustained recovery in housing, and moderation of the fiscal drag implicit in a declining deficit. Monetary policy is expected to remain accommodative well into 2014.
That said, valuations are full and profit margins have likely peaked for the cycle, so incremental growth will be challenging. There are signs of recovery in Europe, which could be an additional economic tailwind. Despite the challenges for growth, both domestically and globally, we must be invested and continue to emphasize companies with strong management, sound business models, organic growth and multiyear investment horizons as we believe those attributes are consistent with superior excess returns. Of late, we are finding a number of interesting investment opportunities in large-capitalization companies domiciled outside of the U.S., and are selectively taking positions in those situations.
Quoted Fund performance is for Class A shares and does not reflect a sales charge.
The returns shown do not reflect taxes a shareholder would pay on distributions or redemptions.
36
| | | | |
| Portfolio Composition | |
| (% of Portfolio) | |
Common Stock | | | 93.6 | % |
Short-Term Investments | | | 6.4 | % |
| | | | |
Total | | | 100.0 | % |
| | | | |
| Major Market Sectors | |
| (% of Net Assets) | |
Information Technology | | | 18.7 | % |
Financials | | | 15.8 | % |
Consumer Discretionary | | | 12.3 | % |
Health Care | | | 12.2 | % |
Energy | | | 10.5 | % |
Industrials | | | 9.4 | % |
Consumer Staples | | | 9.1 | % |
Utilities | | | 3.0 | % |
Materials | | | 2.3 | % |
| | | | |
| Top 10 Holdings | |
| (% of Net Assets) | |
Apple, Inc. | | | 4.8 | % |
J.P. Morgan Chase & Company | | | 3.5 | % |
Weatherford International, Ltd. | | | 3.4 | % |
Kimberly-Clark Corporation | | | 3.0 | % |
Merck & Company, Inc. | | | 3.0 | % |
Google, Inc. | | | 2.9 | % |
Boeing Company | | | 2.7 | % |
Philip Morris International, Inc. | | | 2.7 | % |
Las Vegas Sands Corporation | | | 2.6 | % |
Wells Fargo & Company | | | 2.5 | % |
These securities represent 31.1% of the total net assets of the Fund.
Quoted Major Market Sectors, Portfolio Composition and Top 10 Holdings are subject to change.
The lists of Major Market Sectors and Top 10 Holdings exclude short-term investments and collateral held for securities loaned.
The Portfolio Composition chart excludes collateral held for securities loaned.
Average Annual Total Returns1
As of October 31, 2013
| | | | | | | | | | | | |
Class A2 | | 1-Year | | | 5 Years | | | 10 Years | |
without sales charge | | | 24.57 | % | | | 11.46 | % | | | 5.04 | % |
with sales charge | | | 17.70 | % | | | 10.20 | % | | | 4.45 | % |
| | | |
Institutional Class3 | | 1-Year | | | 5 Years | | | 10 Years | |
Net Asset Value | | | 25.10 | % | | | 12.01 | % | | | 5.54 | % |
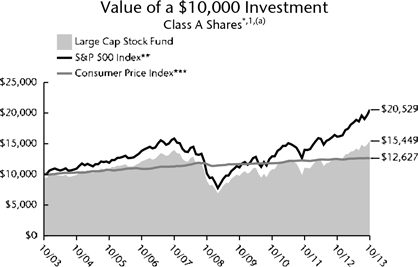
1 | Past performance is not an indication of future results. Average annual total returns represent past performance and reflect changes in share prices, the reinvestment of all dividends and capital gains, and the effects of compounding. The prospectus contains more complete information on the investment objectives, risks, charges and expenses of the investment company, which investors should read and consider carefully before investing. To obtain a prospectus, contact a registered representative or visit www.thrivent.com. At various times, the Fund’s adviser waived its management fee and/or reimbursed Fund expenses. Had the adviser not done so, the Fund’s total returns would have been lower. The returns shown do not reflect taxes a shareholder would pay on distributions or redemptions. Total investment return and principal value of your investment will fluctuate, and your shares, when redeemed, may be worth more or less than their original cost. Current performance may be higher or lower than the performance data quoted. Call 800-THRIVENT or visit www.thrivent.com for performance results current to the most recent month-end. |
2 | Class A performance with sales charge reflects the maximum sales charge of 5.5%. |
3 | Institutional Class shares have no sales load and are for institutional shareholders only. |
(a) | Performance of other classes will be greater or less than the line shown based on the differences in loads and fees paid by shareholders investing in the different classes. |
* | As you compare performance, please note that the Fund’s performance reflects the maximum 5.5% sales charge, while the S&P 500 Index and the Consumer Price Index do not reflect any such charges. If you were to purchase any of the above individual securities represented in the Index, any charges you would pay would reduce your total return as well. |
** | The S&P 500 Index is an index that represents the average performance of a group of 500 widely held, publicly traded stocks. “S&P 500®” is a trademark of The McGraw-Hill Companies, Inc. and has been licensed for use by Thrivent Financial for Lutherans. The product is not sponsored, endorsed or promoted by Standard & Poor’s and Standard & Poor’s makes no representation regarding the advisability of investing in the product. It is not possible to invest directly in the Index. The performance of the Index does not reflect deductions for fees, expenses or taxes. |
*** | The Consumer Price Index is an inflationary indicator that measures the change in the cost of a fixed basket of products and services, including housing, electricity, food and transportation. It is not possible to invest directly in the Index. |
37
Thrivent High Yield Fund
Paul J. Ocenasek, CFA, Portfolio Manager
The Fund seeks high current income and, secondarily, growth of capital.
The Fund primarily invests in high-yield, high-risk bonds, notes, debentures and other debt obligations, or preferred stocks. Credit risk is the risk that an issuer of a debt security may not pay its debt, and high yield securities are subject to increased credit risk as well as liquidity risk. Bond prices generally fall as interest rates rise. Leveraged loans are subject to numerous risks, including liquidity, credit, declines in the value of collateral underlying them, and detrimental legal actions against them. The value of the Fund is influenced by factors impacting the overall market, certain asset classes, certain investment styles, and specific issuers. The Fund may incur losses due to incorrect assessments of investments by its investment adviser. Foreign investments involve additional risks, including currency fluctuations, liquidity, political, economic and market instability, and different legal and accounting standards.
How did the Fund perform during the 12-month period ended October 31, 2013?
Thrivent High Yield Fund earned a return of 7.85%, compared with the median return of its peer group, the Lipper U.S. High Current Yield Funds category, of 8.06%. The Fund’s market benchmark, the Barclays U.S. Corporate High Yield Bond Index, earned a return of 8.87%.
What factors affected the Fund’s performance?
The fundamental backdrop for the high-yield market remained fairly strong during the period as the U.S. economy continued to grow, albeit slowly. Companies remained in good health as they continued to have easy access to capital markets. In addition, approximately 75% of the high-yield issuance during the period resulted from companies refinancing debt maturities in an effort to further improve their balance sheets. These trends, combined with investors’ continued quest for yield in the low interest-rate environment, helped keep the high-yield default rate at around 2.5%, well below the historical average of 4%.
In the period’s generally rising rate environment, the high-yield asset class held up better than other fixed-income segments due to spread compression. Within the fixed-income market, the yield spread between high-yield bonds and Treasuries narrowed from 5.43% at the beginning of the period to 4.15% by the end. Within the high-yield asset class, the high-yield segment experienced one significant sell off from mid-May through July caused by the Federal Reserve’s comments regarding a possible tapering of its monthly bond purchases. After widening out during this correction, spreads continued to tighten for the remainder of the period.
The various high-yield ratings categories experienced a significant divergence among returns, which created a strong headwind for our more conservatively positioned Fund. The CCC-rated segment strongly outperformed over the year with an average return of 14.54%, while B-rated and BB-rated securities returned 8.91% and 6.25%, respectively. Virtually all of the Fund’s shortfall compared to its benchmark and Lipper peers was the result of its approximately 4% underweighting to CCC-rated securities.
We offset some of the negative effects from ratings by remaining more fully invested than many of our peers with 1%–2% of assets in cash. Also, the Fund benefited from holdings in the metals and mining, media, and gaming industries. On balance, industry selection neither helped nor hurt performance over the period.
Successful underweightings in two poorly performing areas of the market—utilities and homebuilders—were cancelled out by under weightings in two of the stronger-performing sectors—technology and finance.
What is your outlook?
While we expect slowly improving economic growth, interest rates will likely continue to increase over the coming year, causing a headwind for fixed-income returns. However, high yield could hold up better than other fixed-income asset classes as there may be more room for spread tightening if defaults remain low as projected. We are positioning the Fund to protect against higher rates by adding floating-rate bank loans to its portfolio, which are typically higher-quality and lower-yielding; however, their coupons reset when rates go up so their prices tend not to drop like a regular bond.
We are also positioning the Fund with a slightly shorter duration, or level of interest-rate sensitivity, compared to its peers. Likewise, we will remain cautious with the Fund’s exposure to interest-rate sensitive sectors such as homebuilders, and building materials and supplies, while looking to add retail exposure as declining fuel prices may provide a boost for consumer spending. We intend to keep the Fund fully invested with a slight underweight in the lower-quality (CCC-rated) tier of the market.
Quoted Fund performance is for Class A shares and does not reflect a sales charge.
The returns shown do not reflect taxes a shareholder would pay on distributions or redemptions.
38
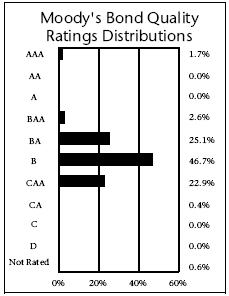
| | | | |
| Major Market Sectors | |
| (% of Net Assets) | |
Communications Services | | | 17.8 | % |
Consumer Cyclical | | | 14.2 | % |
Energy | | | 12.8 | % |
Consumer Non-Cyclical | | | 11.7 | % |
Financials | | | 8.3 | % |
Basic Materials | | | 7.9 | % |
Capital Goods | | | 7.7 | % |
Technology | | | 5.8 | % |
Utilities | | | 5.2 | % |
Transportation | | | 4.7 | % |
| | | | |
| Top 10 Holdings | |
| (% of Net Assets) | |
Sprint Nextel Corporation | | | 1.1 | % |
Tenet Healthcare Corporation | | | 0.9 | % |
Intelsat Jackson Holdings SA | | | 0.9 | % |
Clear Channel Communications, Inc., Term Loan | | | 0.9 | % |
Choice Hotels International, Inc. | | | 0.8 | % |
Hexion US Finance Corporation/Hexion Nova Scotia Finance ULC | | | 0.7 | % |
Omega Healthcare Investors, Inc. | | | 0.7 | % |
WideOpenWest Finance, LLC | | | 0.7 | % |
Studio City Finance, Ltd. | | | 0.7 | % |
Clear Channel Worldwide Holdings, Inc. | | | 0.7 | % |
These securities represent 8.1% of the total net assets of the Fund.
Quoted Major Market Sectors, Moody’s Bond Quality Ratings Distributions and Top 10 Holdings are subject to change.
The lists of Major Market Sectors and Top 10 Holdings exclude short-term investments and collateral held for securities loaned.
Average Annual Total Returns1
As of October 31, 2013
| | | | | | | | | | | | |
Class A2 | | 1-Year | | | 5 Years | | | 10 Years | |
without sales charge | | | 7.85 | % | | | 15.52 | % | | | 7.88 | % |
with sales charge | | | 2.92 | % | | | 14.46 | % | | | 7.38 | % |
| | | |
Institutional Class3 | | 1-Year | | | 5 Years | | | 10 Years | |
Net Asset Value | | | 8.42 | % | | | 16.01 | % | | | 8.34 | % |
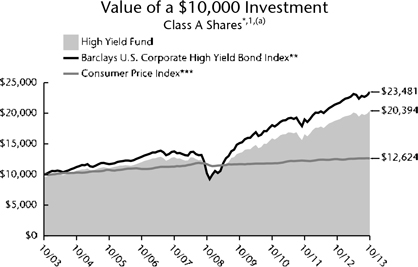
1 | Past performance is not an indication of future results. Average annual total returns represent past performance and reflect changes in share prices, the reinvestment of all dividends and capital gains, and the effects of compounding. The prospectus contains more complete information on the investment objectives, risks, charges and expenses of the investment company, which investors should read and consider carefully before investing. To obtain a prospectus, contact a registered representative or visit www.thrivent.com. At various times, the Fund’s adviser waived its management fee and/or reimbursed Fund expenses. Had the adviser not done so, the Fund’s total returns would have been lower. The returns shown do not reflect taxes a shareholder would pay on distributions or redemptions. Total investment return and principal value of your investment will fluctuate, and your shares, when redeemed, may be worth more or less than their original cost. Current performance may be higher or lower than the performance data quoted. Call 800-THRIVENT or visit www.thrivent.com for performance results current to the most recent month-end. |
2 | Class A performance with sales charge reflects the maximum sales charge of 4.5%. |
3 | Institutional Class shares have no sales load and are for institutional shareholders only. |
(a) | Performance of other classes will be greater or less than the line shown based on the differences in loads and fees paid by shareholders investing in the different classes. |
* | As you compare performance, please note that the Fund’s performance reflects the maximum 4.5% sales charge, while the Barclays U.S. Corporate High Yield Bond Index and the Consumer Price Index do not reflect any such charges. If you were to purchase any of the above individual securities represented in the Index, any charges you would pay would reduce your total return as well. |
** | The Barclays U.S. Corporate High Yield Bond Index is an index which measures the performance of fixed-rate non-investment grade bonds. It is not possible to invest directly in the Index. The performance of the Index does not reflect deductions for fees, expenses or taxes. |
*** | The Consumer Price Index is an inflationary indicator that measures the change in the cost of a fixed basket of products and services, including housing, electricity, food and transportation. It is not possible to invest directly in the Index. |
39
Thrivent Income Fund
Stephen D. Lowe, CFA, Portfolio Manager
The Fund seeks high current income while preserving principal and, secondarily, long-term growth of capital.
The Fund primarily invests in investment-grade corporate bonds, government bonds, asset-backed securities and mortgage-backed securities. The value of the Fund is influenced by factors impacting the overall market, certain asset classes, certain investment styles, and specific issuers. The Fund may incur losses due to incorrect assessments of investments by its investment adviser. Bond prices generally fall as interest rates rise. Credit risk is the risk that an issuer of a debt security may not pay its debt, and high yield securities are subject to increased credit risk as well as liquidity risk. The value of mortgage-related and other asset-backed securities will be influenced by the factors affecting the housing market and the assets underlying such securities. Foreign investments involve additional risks, including currency fluctuations, liquidity, political, economic and market instability, and different legal and accounting standards. The prices of futures contracts can be highly volatile and the loss from investing in them can exceed the initial investment.
How did the Fund perform during the 12-month period ended October 31, 2013?
Thrivent Income Fund earned a return of 0.23%, compared with the median return of its peer group, the Lipper Corporate Debt Funds BBB-Rated category, of -0.12%. The Fund’s market benchmark, the Barclays U.S. Aggregate Bond Index, earned a return of -1.08%.
What factors affected the Fund’s performance?
Interest rates rose substantially over the period as a whole, which dramatically impacted returns for Treasuries and investment-grade corporate bonds. During the period’s first half, rates stayed relatively range-bound as the third round of quantitative easing (QE3) by the Federal Reserve spurred a rally among risk assets, including corporate bonds. For example, 10-year Treasury yields started the fiscal year at 1.69% and hovered around the 1.90% level during the first part of May. Then, in late May, the Fed surprisingly announced a possible tapering of its QE3 purchases earlier than the market expected, causing rates to rise sharply to peak around 3.00% in early September. This caused a sell off in corporate bonds, particularly the high-yield segment. At its September meeting, Fed policymakers made an about-face and decided not to taper, which brought rates about halfway back to where they started. High-yield corporates performed the best overall for the period as the yield premium (spread) these bonds offered over Treasuries tightened significantly and the sector benefited from less interest-rate-sensitivity.
The Fund outperformed both the peer group and benchmark as several of our strategies to help lessen the impact of rising interest rates proved fruitful. For example, the Fund’s small weighting of around 5% in leveraged loans benefited returns. These securities have floating interest rates that adjust based on LIBOR (London Interbank Offered Rate), which makes their prices less sensitive to rate increases. Also, the Fund’s overweighted position in corporate bonds, particularly its average exposure of 13% in high-yield securities, aided results. In addition, the Fund benefited from its slightly shorter duration stance, which helped lessen its sensitivity to rising rates.
Within investment-grade corporates, the Fund benefited from an overweighting in the strongly performing financial sector, particularly banks and brokerage firms and, to a lesser extent, insurance companies. In the Fund’s securitized asset exposure, our underweighting in government-backed agency mortgages versus the peer group proved helpful as that segment underperformed. Also, the Fund’s very small weighting in nonagency residential mortgages aided results as these securities appreciated significantly due to improvements in the housing market.
Although the Fund’s overweighting to high yield was helpful, its emphasis on higher-quality securities within that segment detracted as lower-quality (CCC-rated) securities strongly outpaced B-rated and BB-rated securities. Therefore, the Fund’s slight overweighting in the upper (BB-rated) tier compared to its peers was a drag on results over the period.
What is your outlook?
Our outlook is modestly positive as the U.S. economy continues to grow moderately, the private sector looks stronger, and the housing market is improving. While the Fed will probably taper QE3 sometime in the next year, leading to upward pressure on long-term rates, policymakers will likely leave the federal funds rate unchanged.
With the potential for rising long-term rates and less room for spread compression, investors should anticipate the potential for more muted and possibly even negative total returns for corporate bonds in the coming year. As always, we intend to stay very focused on the fundamental analysis of companies and individual credits. We plan to maintain the Fund’s overweight in corporate bonds, especially high yield, while possibly adding even more to leveraged loans. These areas should hold up better in a rising rate environment.
Quoted Fund performance is for Class A shares and does not reflect a sales charge.
The returns shown do not reflect taxes a shareholder would pay on distributions or redemptions.
40
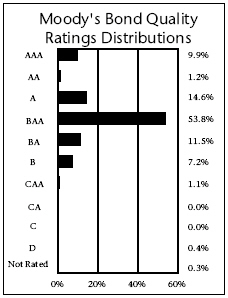
Major Market Sectors
(% of Net Assets)
| | | | |
Financials | | | 31.4 | % |
Communications Services | | | 10.1 | % |
Consumer Non-Cyclical | | | 8.5 | % |
Utilities | | | 8.1 | % |
Energy | | | 7.8 | % |
Consumer Cyclical | | | 7.3 | % |
Basic Materials | | | 4.6 | % |
U.S. Government and Agencies | | | 4.0 | % |
Mortgage-Backed Securities | | | 3.9 | % |
Transportation | | | 3.6 | % |
Top 10 Holdings
(% of Net Assets)
| | | | |
Federal National Mortgage Association Conventional 30-Yr. Pass Through | | | 1.4 | % |
Federal National Mortgage Association Conventional 30-Yr. Pass Through | | | 0.9 | % |
Federal National Mortgage Association Conventional 30-Yr. Pass Through | | | 0.5 | % |
U.S. Treasury Notes | | | 0.5 | % |
U.S. Treasury Notes | | | 0.5 | % |
U.S. Treasury Notes | | | 0.5 | % |
U.S. Treasury Notes, TIPS | | | 0.5 | % |
U.S. Treasury Notes | | | 0.4 | % |
U.S. Treasury Bonds | | | 0.4 | % |
Federal Home Loan Mortgage Corporation Gold 15-Yr. Pass Through | | | 0.4 | % |
These securities represent 6.0% of the total net assets of the Fund.
Quoted Major Market Sectors, Moody’s Bond Quality Ratings Distributions and Top 10 Holdings are subject to change.
The lists of Major Market Sectors and Top 10 Holdings exclude short-term investments and collateral held for securities loaned.
Average Annual Total Returns1
As of October 31, 2013
| | | | | | | | | | | | |
Class A2 | | 1-Year | | | 5 Years | | | 10 Years | |
without sales charge | | | 0.23 | % | | | 10.29 | % | | | 5.01 | % |
with sales charge | | | -4.26 | % | | | 9.26 | % | | | 4.53 | % |
| | | |
Institutional Class3 | | 1-Year | | | 5 Years | | | 10 Years | |
Net Asset Value | | | 0.60 | % | | | 10.73 | % | | | 5.42 | % |
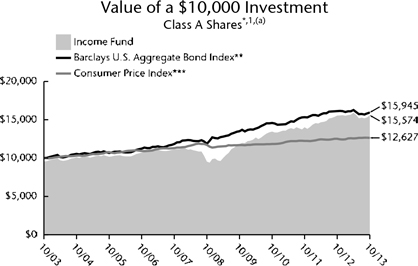
1 | Past performance is not an indication of future results. Average annual total returns represent past performance and reflect changes in share prices, the reinvestment of all dividends and capital gains, and the effects of compounding. The prospectus contains more complete information on the investment objectives, risks, charges and expenses of the investment company, which investors should read and consider carefully before investing. To obtain a prospectus, contact a registered representative or visit www.thrivent.com. At various times, the Fund’s adviser waived its management fee and/or reimbursed Fund expenses. Had the adviser not done so, the Fund’s total returns would have been lower. The returns shown do not reflect taxes a shareholder would pay on distributions or redemptions. Total investment return and principal value of your investment will fluctuate, and your shares, when redeemed, may be worth more or less than their original cost. Current performance may be higher or lower than the performance data quoted. Call 800-THRIVENT or visit www.thrivent.com for performance results current to the most recent month-end. |
2 | Class A performance with sales charge reflects the maximum sales charge of 4.5%. |
3 | Institutional Class shares have no sales load and are for institutional shareholders only. |
(a) | Performance of other classes will be greater or less than the line shown based on the differences in loads and fees paid by shareholders investing in the different classes. |
* | As you compare performance, please note that the Fund’s performance reflects the maximum 4.5% sales charge, while the Barclays U.S. Aggregate Bond Index and the Consumer Price Index do not reflect any such charges. If you were to purchase any of the above individual securities represented in the Index, any charges you would pay would reduce your total return as well. |
** | The Barclays U.S. Aggregate Bond Index is an index that measures the performance of U.S. investment grade bonds. It is not possible to invest directly in the Index. The performance of the Index does not reflect deductions for fees, expenses or taxes. |
*** | The Consumer Price Index is an inflationary indicator that measures the change in the cost of a fixed basket of products and services, including housing, electricity, food and transportation. It is not possible to invest directly in the Index. |
41
Thrivent Municipal Bond Fund
Janet I. Grangaard, CFA, Portfolio Manager
The Fund seeks a high level of current income exempt from federal income taxes, consistent with capital preservation.*
The Fund primarily invests in municipal bonds, the income of which is exempt from federal income taxation. Municipal bonds are subject to credit risk, which is the risk that an issuer of a bond to which the Fund is exposed may no longer be able to pay its debt. Bond prices generally fall as interest rates rise. Changes in federal income tax laws or rates may affect both the net asset value of the Fund and the taxable equivalent interest generated from securities in the Fund. The value of the Fund is influenced by factors impacting the overall market, municipal bonds, and specific issuers. The Fund may incur losses due to incorrect assessments of investments by its investment adviser.
How did the Fund perform during the 12-month period ended October 31, 2013?
Thrivent Municipal Bond Fund earned a return of -2.76%, compared with the median return of its peer group, the Lipper General Municipal Debt Funds category, of -3.04%. The Fund’s market benchmark, the Barclays Municipal Bond Index, earned a return of -1.72%.
What factors affected the Fund’s performance?
In a reversal from the previous fiscal year, the municipal market experienced heavy outflows, particularly in the second half of the period. Investors fled fixed-income markets en masse beginning in May after the Federal Reserve announced a possible tapering of its monthly QE3 bond purchases, which was sooner than expected. The broad-based sell off was exacerbated in the municipal market by news headlines that shook investor confidence, including Detroit’s bankruptcy and the severe financial woes of Puerto Rico, which led to a downgrade. Interest rates rose sharply and the municipal yield curve steepened, negatively impacting returns for bonds, particularly those with longer maturities.
While yields on AAA-rated, one-year securities in the municipal market remained virtually unchanged, yields for AAA-rated, 30-year municipal bonds rose from 2.82% to 4.04%. As a result of widening credit spreads, higher-credit quality municipal bonds generally outpaced lower-grade securities; in many cases, however, longer duration was an overriding factor to credit quality.
One element that aided the market during the period’s selling pressure was the dramatic decrease in new issue supply. Local governments and municipalities did not borrow heavily, but rather refinanced existing debt. The decreased new issue supply helped alleviate some of the pricing pressure resulting from the flood of securities available in the secondary market.
The Fund outperformed the Lipper category mainly due to its lower exposure to bonds from Puerto Rico compared to many of its peers. Our portfolio has less than 0.50% of its assets invested in Puerto Rico municipal bonds. For quite some time, we have been concerned that the trading levels of these bonds did not fully reflect the risks. The Fund’s performance fell short of the Barclays benchmark as our portfolio had a longer duration, or interest-rate sensitivity, than the index.
In terms of sectors, performance benefited from our overweighting in pre-refunded bonds. These older, higher coupon issues outperformed due to their higher quality and shorter durations as they have been escrowed with U.S. Treasuries to their first call dates. The Fund’s electric revenue and health care bonds also performed well. We benefited from owning Washington general obligation (GO) bonds—which we opportunistically added to this past summer—and California GOs, both of which performed well as credit spreads narrowed dramatically.
The Fund underperformed in the higher education and toll road sectors. Although the laggards in higher education are high-grade credits, they are noncallable bonds, which means they have long durations.
What is your outlook?
We expect much less fiscal drag on the economy as revenues and budgets are improving at both state and local levels. We continue to monitor carefully the above-mentioned issues overshadowing the markets as well as the progress of the Affordable Care Act, which could directly impact the health care sector, one of the Fund’s largest weights. We intend to stay focused on using our bottom-up process to select credits we can hold for the long term to generate consistent, competitive returns with a focus on tax-exempt income.
*Investors may be subject to state taxes, the federal alternative minimum tax and capital gains taxes.
Quoted Fund performance is for Class A shares and does not reflect a sales charge.
The returns shown do not reflect taxes a shareholder would pay on distributions or redemptions.
42
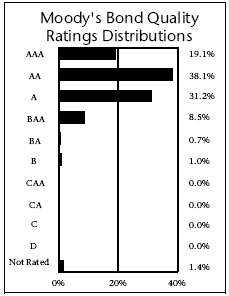
Major Market Sectors
(% of Net Assets)
| | | | |
General Obligation | | | 17.9 | % |
Other Revenue | | | 15.7 | % |
Transportation | | | 15.2 | % |
Health Care | | | 12.5 | % |
Education | | | 11.2 | % |
Escrowed/Pre-refunded | | | 9.4 | % |
Water & Sewer | | | 4.9 | % |
Tax Revenue | | | 4.9 | % |
Industrial Development Revenue | | | 3.8 | % |
Electric Revenue | | | 3.5 | % |
Top 10 States
(% of Net Assets)
| | | | |
California | | | 12.8 | % |
Texas | | | 10.4 | % |
Illinois | | | 8.5 | % |
New York | | | 7.1 | % |
Washington | | | 5.2 | % |
Ohio | | | 4.6 | % |
Florida | | | 4.5 | % |
Massachusetts | | | 4.1 | % |
Colorado | | | 3.9 | % |
Pennsylvania | | | 3.6 | % |
Investments in securities in these States represent 64.7% of the total net assets of the Fund.
Quoted Major Market Sectors, Moody’s Bond Quality Ratings Distributions and Top 10 States are subject to change.
The lists of Major Market Sectors and Top 10 States exclude short-term investments.
Average Annual Total Returns1
As of October 31, 2013
| | | | | | | | | | | | |
Class A2 | | 1-Year | | | 5 Years | | | 10 Years | |
without sales charge | | | -2.76 | % | | | 5.77 | % | | | 4.09 | % |
with sales charge | | | -7.12 | % | | | 4.80 | % | | | 3.61 | % |
| | | |
Institutional Class3 | | 1-Year | | | 5 Years | | | 10 Years | |
Net Asset Value | | | -2.51 | % | | | 6.07 | % | | | 4.38 | % |
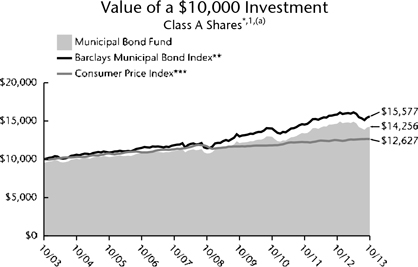
1 | Past performance is not an indication of future results. Average annual total returns represent past performance and reflect changes in share prices, the reinvestment of all dividends and capital gains, and the effects of compounding. The prospectus contains more complete information on the investment objectives, risks, charges and expenses of the investment company, which investors should read and consider carefully before investing. To obtain a prospectus, contact a registered representative or visit www.thrivent.com. At various times, the Fund’s adviser waived its management fee and/or reimbursed Fund expenses. Had the adviser not done so, the Fund’s total returns would have been lower. The returns shown do not reflect taxes a shareholder would pay on distributions or redemptions. Total investment return and principal value of your investment will fluctuate, and your shares, when redeemed, may be worth more or less than their original cost. Current performance may be higher or lower than the performance data quoted. Call 800-THRIVENT or visit www.thrivent.com for performance results current to the most recent month-end. |
2 | Class A performance with sales charge reflects the maximum sales charge of 4.5%. |
3 | Institutional Class shares have no sales load and are for institutional shareholders only. |
(a) | Performance of other classes will be greater or less than the line shown based on the differences in loads and fees paid by shareholders investing in the different classes. |
* | As you compare performance, please note that the Fund’s performance reflects the maximum 4.5% sales charge, while the Barclays Municipal Bond Index and the Consumer Price Index do not reflect any such charges. If you were to purchase any of the above individual securities represented in the Index, any charges you would pay would reduce your total return as well. |
** | The Barclays Municipal Bond Index is a market-value-weighted index of investment-grade municipal bonds with maturities of one year or more. It is not possible to invest directly in the Index. The performance of the Index does not reflect deductions for fees, expenses or taxes. |
*** | The Consumer Price Index is an inflationary indicator that measures the change in the cost of a fixed basket of products and services, including housing, electricity, food and transportation. It is not possible to invest directly in the Index. |
43
Thrivent Government Bond Fund
Michael G. Landreville, CFA and CPA (inactive), Portfolio Manager
The Fund seeks total return, consistent with preservation of capital.
The Fund primarily invests in securities issued or guaranteed by the U.S. government or its agencies and instrumentalities. The value of the Fund is influenced by factors impacting the overall market, debt securities in particular, and the U.S. government. The Fund may incur losses due to incorrect assessments of investments by its investment adviser. The value of U.S. government securities may be affected by changes in the credit rating of the U.S. government. Certain U.S. government securities are not backed by the full faith and credit of the U.S. government. Bond prices generally fall as interest rates rise. Inflation-linked debt securities, such as TIPS, are subject to the effects of changes in market interest rates caused by factors other than inflation (real interest rates). The value of mortgage-related and other asset-backed securities will be influenced by the factors affecting the housing market and the assets underlying such securities.
How did the Fund perform during the 12-month period ended October 31, 2013?
Thrivent Government Bond Fund earned a return of -2.51%, compared with the median return of its peer group, the Lipper General U.S. Government Funds category, of -2.02%. The Fund’s market benchmarks, the Barclays U.S. Agency Index and the Barclays U.S. Treasury Index, earned returns of -0.71% and -1.45%, respectively.
What factors affected the Fund’s performance?
Interest rates remained relatively range-bound for the first half of the reporting period. Then in May, the Federal Reserve (Fed) caught markets off guard by announcing a potential tapering of its monthly bond purchases, known as its QE3 program, which was earlier than expected. As a result of the Fed’s taper talk, intermediate and longer-term Treasury rates dramatically rose and market volatility greatly increased. Ten-year Treasury yields, which started the fiscal year at 1.69%, subsequently jumped from 1.92% in early May to peak at 3.00% in early September. Following its September meeting, the Fed surprised yet again by announcing that U.S. economic growth was not strong enough to warrant a slowdown in its QE3 purchases. This caused 10-year Treasuries to retrace more than one-third of their recent upward move in yield to end the period at 2.55%. Rates at the shorter end of the yield curve, however, were hardly impacted with two-year Treasuries starting the period at 0.28% and ending at 0.31%. When viewed as a whole, the period’s significant increase in intermediate and longer-term rates negatively impacted returns for Treasuries and other fixed-income assets as prices move in the opposite direction of rates. Treasury-Inflation Protected Securities (TIPS) experienced particularly poor results as commodity prices fell dramatically in the period’s second half, lowering inflation fears and putting additional pressure on this segment.
The main factor in the Fund’s underperformance versus the two Barclays indexes and the Lipper peer group was its higher weighting in longer-maturity Treasury securities. As rates rose, the yield curve steepened, meaning that rates went up more significantly for longer maturity bonds than they did for shorter maturities. In addition, the Fund’s larger exposure to TIPS hurt relative results due to that segment’s underperformance. However, our focus on longer-maturity TIPS offset some of the negative impact as they outperformed shorter-maturity TIPS, which are more sensitive to falling commodity prices.
What is your outlook?
We anticipate the U.S. economy will not accelerate as much as the Fed has predicted in the coming year. We believe economic growth will remain lackluster at around 2%, while inflation pressures will also remain subdued at around 1.5%. As a result, the Fed may need to further delay the tapering of its QE3 purchases until at least the second quarter of 2014, if not longer. Our outlook calls for Treasury rates to stay relatively range-bound without any major rallies or sell offs. For example, we believe rates on 10-year Treasuries will stay close to the 2.50% to 3.00% range. Of course there are always wild cards that could impact our forecast, including the end of Chairman Ben Bernanke’s term at the Fed on January 31. The markets will have to wait and see if the new chairperson, likely to be current nominee Janet Yellen, will continue the dovish policies enacted by Bernanke.
All that being said, we will not attempt to anticipate or time the markets, because this Fund is intended to serve as a conservative and defensive investment vehicle. We expect to maintain the Fund’s fairly constant investment profile as it serves as a low-risk investment option during somewhat uncertain times.
Quoted Fund performance is for Class A shares and does not reflect a sales charge.
The returns shown do not reflect taxes a shareholder would pay on distributions or redemptions.
44
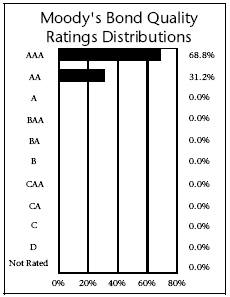
Major Market Sectors
(% of Net Assets)
| | | | |
U.S. Government and Agencies | | | 78.6 | % |
Financials | | | 5.9 | % |
Mortgage-Backed Securities | | | 5.7 | % |
Foreign Government | | | 4.6 | % |
Commercial Mortgage-Backed Securities | | | 1.7 | % |
Asset-Backed Securities | | | 1.1 | % |
Utilities | | | 0.9 | % |
Collateralized Mortgage Obligations | | | 0.5 | % |
Top 10 Holdings
(% of Net Assets)
| | | | |
U.S. Treasury Notes | | | 9.3 | % |
Federal Home Loan Bank | | | 7.2 | % |
Federal National Mortgage Association | | | 5.4 | % |
Federal Home Loan Mortgage Corporation Gold 30-Yr. Pass Through | | | 5.3 | % |
U.S. Treasury Notes | | | 5.2 | % |
U.S. Treasury Notes | | | 3.7 | % |
U.S. Treasury Notes | | | 3.6 | % |
U.S. Treasury Notes | | | 3.5 | % |
U.S. Treasury Notes | | | 3.5 | % |
U.S. Treasury Notes, TIPS | | | 3.4 | % |
These securities represent 50.1% of the total net assets of the Fund.
Quoted Major Market Sectors, Moody’s Bond Quality Ratings Distributions and Top 10 Holdings are subject to change.
The lists of Major Market Sectors and Top 10 Holdings exclude short-term investments and collateral held for securities loaned.
Average Annual Total Returns1
As of October 31, 2013
| | | | | | | | |
Class A2 | | 1-Year | | | From
Inception
2/26/2010 | |
without sales charge | | | -2.51 | % | | | 3.29 | % |
with sales charge | | | -4.46 | % | | | 2.73 | % |
| | |
Institutional Class3 | | 1-Year | | | From
Inception
2/26/2010 | |
Net Asset Value | | | -2.18 | % | | | 3.62 | % |
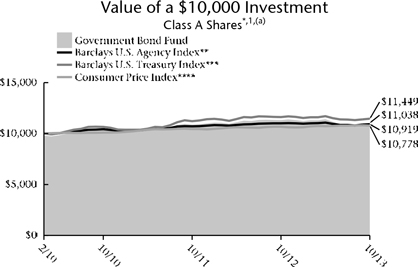
1 | Past performance is not an indication of future results. Average annual total returns represent past performance and reflect changes in share prices, the reinvestment of all dividends and capital gains, and the effects of compounding. The prospectus contains more complete information on the investment objectives, risks, charges and expenses of the investment company, which investors should read and consider carefully before investing. To obtain a prospectus, contact a registered representative or visit www.thrivent.com. At various times, the Fund’s adviser waived its management fee and/or reimbursed Fund expenses. Had the adviser not done so, the Fund’s total returns would have been lower. The returns shown do not reflect taxes a shareholder would pay on distributions or redemptions. Total investment return and principal value of your investment will fluctuate, and your shares, when redeemed, may be worth more or less than their original cost. Current performance may be higher or lower than the performance data quoted. Call 800-THRIVENT or visit www.thrivent.com for performance results current to the most recent month-end. |
2 | Class A performance with sales charge reflects the maximum sales charge of 2%. |
3 | Institutional Class shares have no sales load and are for institutional shareholders only. |
(a) | Performance of other classes will be greater or less than the line shown based on the differences in loads and fees paid by shareholders investing in the different classes. |
* | As you compare performance, please note that the Fund’s performance reflects the maximum 2.0% sales charge, while the Barclays U.S. Treasury Index, the Barclays U.S. Agency Index and the Consumer Price Index do not reflect any such charges. If you were to purchase any of the above individual securities represented in the Index, any charges you would pay would reduce your total return as well. |
** | The Barclays U.S. Agency Index is an index that measures the performance of the U.S. investment-grade fixed-income securities market. It is not possible to invest directly in the Index. The performance of the Index does not reflect deductions for fees, expenses or taxes. |
*** | The Barclays U.S. Treasury Index is an index that measures the performance of the U.S. Treasury bond market. It is not possible to invest directly in the Index. The performance of the Index does not reflect deductions for fees, expenses or taxes. |
**** | The Consumer Price Index is an inflationary indicator that measures the change in the cost of a fixed basket of products and services, including housing, electricity, food and transportation. It is not possible to invest directly in the Index. |
45
Thrivent Limited Maturity Bond Fund
Michael G. Landreville, CFA and CPA (inactive) and Gregory R. Anderson, CFA, Portfolio Co-Managers
The Fund seeks a high level of current income consistent with stability of principal.
The Fund primarily invests in investment-grade debt securities. The value of the Fund is influenced by factors impacting the overall market, debt securities in particular, and specific issuers. The Fund may incur losses due to incorrect assessments of investments by its investment adviser. Bond prices generally fall as interest rates rise. Credit risk is the risk that an issuer of a debt security may not pay its debt. The value of mortgage-related and other asset-backed securities will be influenced by the factors affecting the housing market and the assets underlying such securities. Foreign investments involve additional risks, including currency fluctuations, liquidity, political, economic and market instability, and different legal and accounting standards. The prices of futures contracts can be highly volatile and the loss from investing in them can exceed the initial investment.
How did the Fund perform during the 12-month period ended October 31, 2013?
Thrivent Limited Maturity Bond Fund earned a return of 0.46%, compared with the median return of its peer group, the Lipper Short Investment Grade Debt Funds category, of 0.63%. The Fund’s market benchmark, the Barclays Government/Credit 1-3 Year Bond Index, earned a return of 0.77%.
What factors affected the Fund’s performance?
At the beginning of the reporting period, the Federal Reserve (Fed) had just announced its third round of quantitative easing, dubbed QE3, which fueled a “risk-on” rally within investment markets where the riskiest bond sectors performed the best. Interest rates remained in a relatively tight band for the first half of the reporting period as three-year Treasury yields hovered around the 0.30% to 0.40% range. However, in May, the Fed caught markets off guard with talk of a potential tapering of its monthly QE3 bond purchases, causing investors to sell bonds. Interest rates rose sharply from May through the first part of September with longer-maturity bonds suffering the most. The three-year Treasury yield rose from 0.30% at the beginning of May to nearly 1.00% by early September, while 10-year Treasury yields jumped approximately 1.30% to end at 3.00% during the same period. At its September meeting, the Fed surprised investors again by electing not to taper its bond purchase levels, causing the “risk-on” rally to resume through the end of the period. Three-year Treasury yields retraced almost half of their upward move to end the period at 0.57%.
As the market embraced risk and interest rates were contained during the year’s first half, the Fund outpaced both the peer group and benchmark. Therefore, all of the Fund’s underperformance took place in the second half of its fiscal year. The main contributors to the Fund’s shortfall were its slightly longer duration—or interest-rate sensitivity—and modest exposure to securities with maturities longer than three years as interest rates went up more (and prices went down more) for longermaturity bonds. In addition, compared to its peers, the Fund had a slight overweighting to Treasuries, including Treasury Inflation Protected Securities (TIPS), which underperformed.
Partially offsetting some of these negative effects were the Fund’s overweighted positions in corporate bonds and nonagency residential mortgage-backed securities, which significantly outperformed Treasuries over the period. We took advantage of higher yields that occurred in the second half of the fiscal year to add to the Fund’s corporate bonds and securitized asset exposure, which increased from approximately 60% of assets at the beginning of the period to 74% by the end. Of that, corporate bonds totaled 44% and securitized assets were 30%. These segments comprise only around 20% of the Barclays index. The additional yield from these sectors provided the Fund with a significant yield advantage over both its peer group and benchmark.
What is your outlook?
We believe the U.S. economy will have an opportunity to grow at a faster rate in 2014 as some of the drag from the government sector fades. In the near term, we expect interest rates will stay range-bound with three-year Treasuries yielding around 0.50% to 0.70%; however, over the longer term, rates will likely move higher. In the coming months, we anticipate Fed policymakers will extend guidance about keeping rates low at the front end of the yield curve, while simultaneously announcing a tapering of QE3 bond buying, which will cause the yield curve to steepen further. This scenario would prove beneficial for shorter-maturity securities we own in the Fund. We intend to maintain the Fund’s overweights in corporate bonds and securitized assets.
Quoted Fund performance is for Class A shares.
The returns shown do not reflect taxes a shareholder would pay on distributions or redemptions.
46
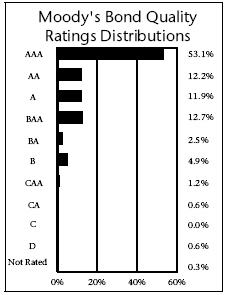
Major Market Sectors
(% of Net Assets)
| | | | |
Financials | | | 23.4 | % |
U.S. Government and Agencies | | | 19.0 | % |
Asset-Backed Securities | | | 12.9 | % |
Mortgage-Backed Securities | | | 7.6 | % |
Commercial Mortgage-Backed Securities | | | 6.4 | % |
Foreign Government | | | 5.6 | % |
Consumer Non-Cyclical | | | 4.6 | % |
Communications Services | | | 4.4 | % |
Consumer Cyclical | | | 3.3 | % |
Collateralized Mortgage Obligations | | | 3.0 | % |
Top 10 Holdings
(% of Net Assets)
| | | | |
U.S. Treasury Notes | | | 5.2 | % |
Federal Home Loan Mortgage Corporation Gold 15-Yr. Pass Through | | | 2.4 | % |
U.S. Treasury Notes | | | 2.3 | % |
U.S. Treasury Notes | | | 1.6 | % |
U.S. Treasury Notes | | | 1.6 | % |
U.S. Treasury Notes, TIPS | | | 1.5 | % |
Federal National Mortgage Association Conventional 15-Yr. Pass Through | | | 1.5 | % |
Federal National Mortgage Association | | | 1.3 | % |
Federal National Mortgage Association | | | 0.9 | % |
U.S. Treasury Notes, TIPS | | | 0.9 | % |
These securities represent 19.2% of the total net assets of the Fund.
Quoted Major Market Sectors, Moody’s Bond Quality Ratings Distributions and Top 10 Holdings are subject to change.
The lists of Major Market Sectors and Top 10 Holdings exclude short-term investments and collateral held for securities loaned.
Average Annual Total Returns1
As of October 31, 2013
| | | | | | | | | | | | |
Class A2 | | 1-Year | | | 5 Years | | | 10 Years | |
Net Asset Value | | | 0.46 | % | | | 4.34 | % | | | 2.78 | % |
| | | |
Institutional Class3 | | 1-Year | | | 5 Years | | | 10 Years | |
Net Asset Value | | | 0.70 | % | | | 4.63 | % | | | 3.13 | % |
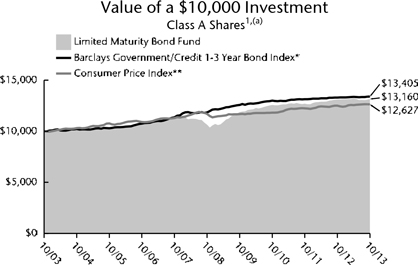
1 | Past performance is not an indication of future results. Average annual total returns represent past performance and reflect changes in share prices, the reinvestment of all dividends and capital gains, and the effects of compounding. The prospectus contains more complete information on the investment objectives, risks, charges and expenses of the investment company, which investors should read and consider carefully before investing. To obtain a prospectus, contact a registered representative or visit www.thrivent.com. At various times, the Fund’s adviser waived its management fee and/or reimbursed Fund expenses. Had the adviser not done so, the Fund’s total returns would have been lower. The returns shown do not reflect taxes a shareholder would pay on distributions or redemptions. Total investment return and principal value of your investment will fluctuate, and your shares, when redeemed, may be worth more or less than their original cost. Current performance may be higher or lower than the performance data quoted. Call 800-THRIVENT or visit www.thrivent.com for performance results current to the most recent month-end. |
2 | Class A shares have no sales load. |
3 | Institutional Class shares have no sales load and are for institutional shareholders only. |
(a) | Performance of other classes will be greater or less than the line shown based on the differences in loads and fees paid by shareholders investing in the different classes. |
* | The Barclays Government/Credit 1-3 Year Bond Index is an index that measures the performance of government and fixed-rate debt securities with maturities of 1-3 years. It is not possible to invest directly in the Index. The performance of the Index does not reflect deductions for fees, expenses or taxes. |
** | The Consumer Price Index is an inflationary indicator that measures the change in the cost of a fixed basket of products and services, including housing, electricity, food and transportation. It is not possible to invest directly in the Index. |
47
Thrivent Money Market Fund
William D. Stouten, Portfolio Manager
The Fund seeks a high level of current income, while maintaining liquidity and a constant net asset value of $1.00 per share.
The Fund invests in high quality, short-term money market instruments. Although the Fund seeks to preserve the value of your investment at $1.00 per share, it is possible to lose money by investing in the Fund. Credit risk is the risk that an issuer of a debt security may not pay its debt. Low or declining short-term interest rates can negatively impact the Fund. The financial services industry is particularly vulnerable to certain factors, such as the availability and cost of borrowing and raising additional capital, changes in interest rates, the rate of corporate and consumer debt defaults, and price competition. The Fund could experience a loss when selling portfolio securities to meet redemption requests.
How did the Fund perform during the 12-month period ended October 31, 2013?
Thrivent Money Market Fund earned a return of 0.00%, compared with the median net return of its peer group, the Lipper Money Market Funds category, of 0.01%.
What factors affected the Fund’s performance?
The fiscal year period continued to be characterized by the low-yield environment that has prevailed since 2009. Short-term interest rates remained near zero as a result of accommodative Federal Reserve (Fed) monetary policy and the continued decline in available money market securities. Since the financial crisis began in 2008, the supply of money market securities has dropped by approximately $3 trillion. This lack of supply contributes to keeping rates low as the competition for the remaining securities bids up prices. To manage the Fund’s return in this low-rate environment, we continued to waive certain fees and expenses.
We kept the Fund very conservatively positioned to help maintain its credit quality and liquidity. In the current environment, it does not benefit shareholders for us to take additional credit risk or extend maturities as the Fund’s yield will remain at 0% until short-term rates move higher. Therefore, we maintained significant exposure to U.S. government-supported securities and a shorter weighted average maturity (WAM) than our peers for most of the year. Also, the Fund had much more exposure to floating-rate agency notes than its industry peers, which tended to keep the Fund’s weighted average life (WAL) closer to the top end of the 120-day limit. We prefer floating-rate agency notes rather than shorter-term fixed-rate notes because their coupons will adjust higher if interest rates move higher. Higher concentrations of floating-rate notes limit our ability to extend the Fund’s WAM. However, twice during the fiscal year, we were still able to extend its WAM to take advantage of temporarily elevated short-term yields caused by European debt concerns in April and the U.S. budget crisis in October.
Given our commitment to a conservative posture, the Fund did not own repurchase agreements (repo) with maturities beyond seven days or backed by nongovernment securities. Many of its peers are increasingly using nontraditional repos, which are secured by assets other than government securities, to try to capture yield. We have avoided exposure to these transactions because they are illiquid, and nongovernment collateral carries more risk. We also continued to maintain a lower weighting versus our peers in foreign securities. The Fund’s foreign exposure is limited to 25% of assets, and it is typically much lower than that, whereas many of our competitors have much higher limits.
What is your outlook?
Various indicators suggest the U.S. economy will continue to grow moderately over the coming year. The Fed will probably taper its monthly QE3 bond purchases sometime in 2014, while likely leaving the federal funds rate unchanged. However, the Fed recently began entering into repo directly with money market funds in an attempt to put a floor on the fed funds rate. We believe the Fed may expand this program beyond the January expiration to better manage the Fed funds rate going forward. That being said, we anticipate money market yields will still remain close to 0% in the coming year. Therefore, our plan is to stay conservatively positioned until rates improve with stability and liquidity as our primary objectives.
The Securities and Exchange Commission is once again considering industry reforms after failing to enact any this past year. The new proposals, which are primarily aimed at institutional money market funds, include floating net asset values and/or redemption fees and gates. The new reforms may be announced as soon as the first quarter of 2014.
An investment in the Thrivent Money Market Fund is not insured
or guaranteed by the FDIC or any other government agency.
Although the Fund seeks to preserve the value of your investment at $1.00 per share,
it is possible to lose money by investing in the Fund.
Quoted Fund performance is for Class A shares.
The returns shown do not reflect taxes a shareholder would pay on distributions or redemptions.
48
Portfolio Composition
(% of Portfolio)
| | | | |
Government Agency Debt | | | 22.0 | % |
Other Note | | | 20.3 | % |
Asset Backed Commercial Paper | | | 17.1 | % |
Financial Company Commercial Paper | | | 11.7 | % |
Certificate of Deposit | | | 8.5 | % |
Investment Company | | | 7.3 | % |
Other Commercial Paper | | | 7.0 | % |
Treasury Debt | | | 4.3 | % |
Variable Rate Demand Note | | | 1.8 | % |
| | | | |
Total | | | 100.0 | % |
Quoted Portfolio Composition is subject to change.
Average Annual Total Returns1
As of October 31, 2013
| | | | | | | | | | | | |
Class A2 | | 1-Year | | | 5 Years | | | 10 Years | |
Net Asset Value | | | 0.00 | % | | | 0.12 | % | | | 1.54 | % |
| | | |
Institutional Class3 | | 1-Year | | | 5 Years | | | 10 Years | |
Net Asset Value | | | 0.00 | % | | | 0.16 | % | | | 1.71 | % |
Money Market Portfolio Yields*
As of October 31, 2013
| | | | | | | | |
| | | Class A | | | Institutional Class | |
7-Day Yield | | | 0.00 | % | | | 0.00 | % |
7-Day Yield Gross of Waivers | | | -0.73 | % | | | -0.36 | % |
7-Day Effective Yield | | | 0.00 | % | | | 0.00 | % |
7-Day Effective Yield Gross of Waivers | | | -0.73 | % | | | -0.36 | % |
1 | Past performance is not an indication of future results. Average annual total returns represent past performance and reflect changes in share prices, the reinvestment of all dividends and capital gains, and the effects of compounding. The prospectus contains more complete information on the investment objectives, risks, charges and expenses of the investment company, which investors should read and consider carefully before investing. To obtain a prospectus, contact a registered representative or visit www.thrivent.com. At various times, the Fund’s adviser waived its management fee and/or reimbursed Fund expenses. Had the adviser not done so, the Fund’s total returns would have been lower. The returns shown do not reflect taxes a shareholder would pay on distributions or redemptions. Total investment return and principal value of your investment will fluctuate, and your shares, when redeemed, may be worth more or less than their original cost. Current performance may be higher or lower than the performance data quoted. Call 800-THRIVENT or visit www.thrivent.com for performance results current to the most recent month-end. |
2 | Class A shares have no sales load. |
3 | Institutional Class shares have no sales load and are for institutional shareholders only. |
* | Seven-day yields of Thrivent Money Market Fund refer to the income generated by an investment in the Fund over a specified seven-day period. Effective yields reflect the reinvestment of income. A yield gross of waivers represents what the yield would have been if the Adviser were not waiving or reimbursing certain expenses associated with the Fund. Yields are subject to daily fluctuation and should not be considered an indication of future results. |
49
Shareholder Expense Example
(unaudited)
As a shareholder of a Fund, you incur, depending on the Fund and share class, two types of costs: (1) transaction costs, including sales charges (loads) on purchase payments; and (2) ongoing costs, including management fees, distribution (12b-1) fees and other Fund expenses. This Example is intended to help you understand your ongoing costs (in dollars) of investing in your Fund and to compare these costs with the ongoing costs of investing in other mutual funds. The Example is based on an investment of $1,000 invested at the beginning of the period and held for the entire period from May 1, 2013 through October 31, 2013.
Actual Expenses
In the table below, the first section, labeled “Actual,” provides information about actual account values and actual expenses. You may use the information in this section, together with the amount you invested, to estimate the expenses that you paid over the period. Simply divide your account value by $1,000 (for example, an $8,600 account value divided by $1,000 = 8.6), then multiply the result by the number from the appropriate Class line under the heading entitled “Expenses Paid During Period” to estimate the expenses you paid. A small account fee of $12 may be charged to Class A shareholder accounts if the value falls to an amount of $2,000 or less, in the case of a non-qualified account, and $1,000 or less, in the case of a qualified account. This fee is not included in the table below. If it were and you were assessed such a fee, the expenses you paid during the period would have been higher and the ending account value would have been lower.
Hypothetical Example for Comparison Purposes
In the table below, the second section, labeled “Hypothetical,” provides information about hypothetical account values and hypothetical expenses based on the Fund’s actual expense ratio and an assumed rate of return of 5% per year before expenses, which is not the Fund’s actual return. The hypothetical account values and expenses may not be used to estimate the actual ending account balance or expenses you paid for the period. You may use this information to compare the ongoing costs of investing in the Fund and other funds. To do so, compare this 5% hypothetical example with the 5% hypothetical examples that appear in the shareholder reports of the other funds. A small account fee of $12 may be charged to Class A shareholder accounts if the value falls to an amount of $2,000 or less, in the case of a non-qualified account, and $1,000 or less, in the case of a qualified account. This fee is not included in the table below. If it were and you were assessed such a fee, the expenses you paid during the period would have been higher and the ending account value would have been lower.
Please note that the expenses shown in the table are meant to highlight your ongoing costs only and do not reflect any transactional costs, such as sales charges (loads). Therefore, the second section of the table is useful in comparing ongoing costs only, and will not help you determine the relative total costs of owning different funds. In addition, if these transactional costs were included, your costs would have been higher.
| | | | | | | | |
| | | Beginning Account Value 5/1/2013 | | Ending Account Value
10/31/2013 | | Expenses Paid During Period 5/1/2013- 10/31/2013* | | Annualized Expense Ratio |
Thrivent Aggressive Allocation Fund |
| | | | |
Actual | | | | | | | | |
Class A | | $1,000 | | $1,118 | | $4.30 | | 0.81% |
Institutional Class | | $1,000 | | $1,120 | | $2.18 | | 0.41% |
| | | | |
Hypothetical** | | | | | | | | |
Class A | | $1,000 | | $1,021 | | $4.10 | | 0.81% |
Institutional Class | | $1,000 | | $1,023 | | $2.08 | | 0.41% |
Thrivent Moderately Aggressive Allocation Fund |
| | | | |
Actual | | | | | | | | |
Class A | | $1,000 | | $1,090 | | $3.79 | | 0.72% |
Institutional Class | | $1,000 | | $1,093 | | $1.99 | | 0.38% |
| | | | |
Hypothetical** | | | | | | | | |
Class A | | $1,000 | | $1,022 | | $3.67 | | 0.72% |
Institutional Class | | $1,000 | | $1,023 | | $1.92 | | 0.38% |
Thrivent Moderate Allocation Fund |
| | | | |
Actual | | | | | | | | |
Class A | | $1,000 | | $1,061 | | $3.52 | | 0.68% |
Institutional Class | | $1,000 | | $1,063 | | $1.94 | | 0.37% |
| | | | |
Hypothetical** | | | | | | | | |
Class A | | $1,000 | | $1,022 | | $3.46 | | 0.68% |
Institutional Class | | $1,000 | | $1,023 | | $1.91 | | 0.37% |
50
Shareholder Expense Example
(unaudited)
| | | | | | | | |
| | | Beginning Account Value 5/1/2013 | | Ending Account Value
10/31/2013 | | Expenses Paid During Period 5/1/2013- 10/31/2013* | | Annualized Expense Ratio |
Thrivent Moderately Conservative Allocation Fund |
| | | | |
Actual | | | | | | | | |
Class A | | $1,000 | | $1,033 | | $3.62 | | 0.71% |
Institutional Class | | $1,000 | | $1,034 | | $2.25 | | 0.44% |
| | | | |
Hypothetical** | | | | | | | | |
Class A | | $1,000 | | $1,022 | | $3.60 | | 0.71% |
Institutional Class | | $1,000 | | $1,023 | | $2.24 | | 0.44% |
Thrivent Balanced Income Plus Fund |
| | | | |
Actual | | | | | | | | |
Class A | | $1,000 | | $1,086 | | $5.70 | | 1.08% |
Institutional Class | | $1,000 | | $1,089 | | $3.50 | | 0.67% |
| | | | |
Hypothetical** | | | | | | | | |
Class A | | $1,000 | | $1,020 | | $5.52 | | 1.08% |
Institutional Class | | $1,000 | | $1,022 | | $3.39 | | 0.67% |
Thrivent Opportunity Income Plus Fund |
| | | | |
Actual | | | | | | | | |
Class A | | $1,000 | | $971 | | $4.22 | | 0.85% |
Institutional Class | | $1,000 | | $972 | | $2.68 | | 0.54% |
| | | | |
Hypothetical** | | | | | | | | |
Class A | | $1,000 | | $1,021 | | $4.33 | | 0.85% |
Institutional Class | | $1,000 | | $1,022 | | $2.75 | | 0.54% |
Thrivent Partner Emerging Markets Equity Fund |
| | | | |
Actual | | | | | | | | |
Class A | | $1,000 | | $1,006 | | $8.44 | | 1.67% |
Institutional Class | | $1,000 | | $1,008 | | $6.68 | | 1.32% |
| | | | |
Hypothetical** | | | | | | | | |
Class A | | $1,000 | | $1,017 | | $8.49 | | 1.67% |
Institutional Class | | $1,000 | | $1,019 | | $6.71 | | 1.32% |
Thrivent Partner Small Cap Growth Fund |
| | | | |
Actual | | | | | | | | |
Class A | | $1,000 | | $1,229 | | $7.86 | | 1.40% |
Institutional Class | | $1,000 | | $1,231 | | $5.81 | | 1.03% |
| | | | |
Hypothetical** | | | | | | | | |
Class A | | $1,000 | | $1,018 | | $7.12 | | 1.40% |
Institutional Class | | $1,000 | | $1,020 | | $5.26 | | 1.03% |
Thrivent Partner Small Cap Value Fund |
| | | | |
Actual | | | | | | | | |
Class A | | $1,000 | | $1,146 | | $7.08 | | 1.31% |
Institutional Class | | $1,000 | | $1,148 | | $4.54 | | 0.84% |
| | | | |
Hypothetical** | | | | | | | | |
Class A | | $1,000 | | $1,019 | | $6.66 | | 1.31% |
Institutional Class | | $1,000 | | $1,021 | | $4.27 | | 0.84% |
Thrivent Small Cap Stock Fund |
| | | | |
Actual | | | | | | | | |
Class A | | $1,000 | | $1,140 | | $6.87 | | 1.27% |
Institutional Class | | $1,000 | | $1,143 | | $4.09 | | 0.76% |
| | | | |
Hypothetical** | | | | | | | | |
Class A | | $1,000 | | $1,019 | | $6.48 | | 1.27% |
Institutional Class | | $1,000 | | $1,021 | | $3.86 | | 0.76% |
51
Shareholder Expense Example
(unaudited)
| | | | | | | | |
| | | Beginning Account Value 5/1/2013 | | Ending Account Value
10/31/2013 | | Expenses Paid During Period 5/1/2013- 10/31/2013* | | Annualized Expense Ratio |
Thrivent Mid Cap Growth Fund |
| | | | |
Actual | | | | | | | | |
Class A | | $1,000 | | $1,148 | | $5.35 | | 0.99% |
Institutional Class | | $1,000 | | $1,151 | | $2.79 | | 0.51% |
| | | | |
Hypothetical** | | | | | | | | |
Class A | | $1,000 | | $1,020 | | $5.03 | | 0.99% |
Institutional Class | | $1,000 | | $1,023 | | $2.62 | | 0.51% |
Thrivent Partner Mid Cap Value Fund |
| | | | |
Actual | | | | | | | | |
Class A | | $1,000 | | $1,105 | | $6.63 | | 1.25% |
Institutional Class | | $1,000 | | $1,107 | | $4.74 | | 0.89% |
| | | | |
Hypothetical** | | | | | | | | |
Class A | | $1,000 | | $1,019 | | $6.36 | | 1.25% |
Institutional Class | | $1,000 | | $1,021 | | $4.55 | | 0.89% |
Thrivent Mid Cap Stock Fund |
| | | | |
Actual | | | | | | | | |
Class A | | $1,000 | | $1,132 | | $6.11 | | 1.14% |
Institutional Class | | $1,000 | | $1,135 | | $3.82 | | 0.71% |
| | | | |
Hypothetical** | | | | | | | | |
Class A | | $1,000 | | $1,019 | | $5.78 | | 1.14% |
Institutional Class | | $1,000 | | $1,022 | | $3.62 | | 0.71% |
Thrivent Partner Worldwide Allocation Fund |
| | | | |
Actual | | | | | | | | |
Class A | | $1,000 | | $1,062 | | $7.28 | | 1.40% |
Institutional Class | | $1,000 | | $1,064 | | $5.05 | | 0.97% |
| | | | |
Hypothetical** | | | | | | | | |
Class A | | $1,000 | | $1,018 | | $7.12 | | 1.40% |
Institutional Class | | $1,000 | | $1,020 | | $4.94 | | 0.97% |
Thrivent Large Cap Growth Fund |
| | | | |
Actual | | | | | | | | |
Class A | | $1,000 | | $1,177 | | $6.59 | | 1.20% |
Institutional Class | | $1,000 | | $1,179 | | $4.47 | | 0.81% |
| | | | |
Hypothetical** | | | | | | | | |
Class A | | $1,000 | | $1,019 | | $6.11 | | 1.20% |
Institutional Class | | $1,000 | | $1,021 | | $4.15 | | 0.81% |
Thrivent Large Cap Value Fund |
| | | | |
Actual | | | | | | | | |
Class A | | $1,000 | | $1,108 | | $5.12 | | 0.96% |
Institutional Class | | $1,000 | | $1,110 | | $2.74 | | 0.51% |
| | | | |
Hypothetical** | | | | | | | | |
Class A | | $1,000 | | $1,020 | | $4.91 | | 0.96% |
Institutional Class | | $1,000 | | $1,023 | | $2.62 | | 0.51% |
Thrivent Large Cap Stock Fund |
| | | | |
Actual | | | | | | | | |
Class A | | $1,000 | | $1,119 | | $5.54 | | 1.04% |
Institutional Class | | $1,000 | | $1,121 | | $3.24 | | 0.61% |
| | | | |
Hypothetical** | | | | | | | | |
Class A | | $1,000 | | $1,020 | | $5.28 | | 1.04% |
Institutional Class | | $1,000 | | $1,022 | | $3.09 | | 0.61% |
52
Shareholder Expense Example
(unaudited)
| | | | | | | | |
| | | Beginning Account Value 5/1/2013 | | Ending Account Value
10/31/2013 | | Expenses Paid During Period 5/1/2013- 10/31/2013* | | Annualized Expense Ratio |
Thrivent High Yield Fund |
| | | | |
Actual | | | | | | | | |
Class A | | $1,000 | | $1,013 | | $4.10 | | 0.81% |
Institutional Class | | $1,000 | | $1,016 | | $2.44 | | 0.48% |
| | | | |
Hypothetical** | | | | | | | | |
Class A | | $1,000 | | $1,021 | | $4.11 | | 0.81% |
Institutional Class | | $1,000 | | $1,023 | | $2.45 | | 0.48% |
Thrivent Income Fund |
| | | | |
Actual | | | | | | | | |
Class A | | $1,000 | | $979 | | $3.83 | | 0.77% |
Institutional Class | | $1,000 | | $981 | | $2.00 | | 0.40% |
| | | | |
Hypothetical** | | | | | | | | |
Class A | | $1,000 | | $1,021 | | $3.91 | | 0.77% |
Institutional Class | | $1,000 | | $1,023 | | $2.04 | | 0.40% |
Thrivent Municipal Bond Fund |
| | | | |
Actual | | | | | | | | |
Class A | | $1,000 | | $956 | | $3.66 | | 0.74% |
Institutional Class | | $1,000 | | $957 | | $2.41 | | 0.49% |
| | | | |
Hypothetical** | | | | | | | | |
Class A | | $1,000 | | $1,021 | | $3.79 | | 0.74% |
Institutional Class | | $1,000 | | $1,023 | | $2.49 | | 0.49% |
Thrivent Government Bond Fund |
| | | | |
Actual | | | | | | | | |
Class A | | $1,000 | | $968 | | $4.47 | | 0.90% |
Institutional Class | | $1,000 | | $970 | | $2.81 | | 0.57% |
| | | | |
Hypothetical** | | | | | | | | |
Class A | | $1,000 | | $1,021 | | $4.58 | | 0.90% |
Institutional Class | | $1,000 | | $1,022 | | $2.89 | | 0.57% |
Thrivent Limited Maturity Bond Fund |
| | | | |
Actual | | | | | | | | |
Class A | | $1,000 | | $996 | | $3.03 | | 0.60% |
Institutional Class | | $1,000 | | $997 | | $1.85 | | 0.37% |
| | | | |
Hypothetical** | | | | | | | | |
Class A | | $1,000 | | $1,022 | | $3.07 | | 0.60% |
Institutional Class | | $1,000 | | $1,023 | | $1.87 | | 0.37% |
Thrivent Money Market Fund |
| | | | |
Actual | | | | | | | | |
Class A | | $1,000 | | $1,000 | | $1.11 | | 0.22% |
Institutional Class | | $1,000 | | $1,000 | | $1.11 | | 0.22% |
| | | | |
Hypothetical** | | | | | | | | |
Class A | | $1,000 | | $1,024 | | $1.12 | | 0.22% |
Institutional Class | | $1,000 | | $1,024 | | $1.12 | | 0.22% |
* | Expenses are equal to the Fund’s annualized expense ratio, multiplied by the average account value over the period, multiplied by 184/365 to reflect the one-half year period. |
** | Assuming 5% annualized total return before expenses. |
53
| | |

| | Report of Independent Registered Public Accounting Firm |
To the Shareholders and Trustees of the Thrivent Mutual Funds:
In our opinion, the accompanying statements of assets and liabilities, including the schedules of investments, and the related statements of operations and of changes in net assets and the financial highlights present fairly, in all material respects, the financial position of Thrivent Aggressive Allocation Fund, Thrivent Moderately Aggressive Allocation Fund, Thrivent Moderate Allocation Fund, Thrivent Moderately Conservative Allocation Fund, Thrivent Balanced Income Plus Fund, Thrivent Opportunity Income Plus Fund, Thrivent Partner Emerging Markets Equity Fund, Thrivent Partner Small Cap Growth Fund, Thrivent Partner Small Cap Value Fund, Thrivent Small Cap Stock Fund, Thrivent Mid Cap Growth Fund, Thrivent Partner Mid Cap Value Fund, Thrivent Mid Cap Stock Fund, Thrivent Partner Worldwide Allocation Fund, Thrivent Large Cap Growth Fund, Thrivent Large Cap Value Fund, Thrivent Large Cap Stock Fund, Thrivent High Yield Fund, Thrivent Income Fund, Thrivent Municipal Bond Fund, Thrivent Government Bond Fund, Thrivent Limited Maturity Bond Fund and Thrivent Money Market Fund (twenty-three of the Thrivent Mutual Funds, hereafter referred to as the “Funds”) at October 31, 2013, the results of each of their operations for the period then ended, the changes in each of their net assets and their financial highlights for each of the periods presented, in conformity with accounting principles generally accepted in the United States of America. These financial statements and financial highlights (hereafter referred to as “financial statements”) are the responsibility of the Fund’s management; our responsibility is to express an opinion on these financial statements based on our audits. We conducted our audits of these financial statements in accordance with the standards of the Public Company Accounting Oversight Board (United States). Those standards require that we plan and perform the audit to obtain reasonable assurance about whether the financial statements are free of material misstatement. An audit includes examining, on a test basis, evidence supporting the amounts and disclosures in the financial statements, assessing the accounting principles used and significant estimates made by management, and evaluating the overall financial statement presentation. We believe that our audits, which included confirmation of securities at October 31, 2013 by correspondence with the custodian, transfer agent and brokers provides a reasonable basis for our opinion.
December 17, 2013
PricewaterhouseCoopers LLP, Suite 1400, 225 South Sixth Street, Minneapolis, MN 55402 T: (612) 596 6000, F: (612) 373 7160, www.pwc.com/us
54
Aggressive Allocation Fund
Schedule of Investments as of October 31, 2013
| | | | | | | | |
| Shares | | | Mutual Funds (64.6%) | | Value | |
| Equity Mutual Funds (61.6%) | | | | |
| | 1,519,588 | | | Thrivent Natural Resources Fund | | | $15,606,171 | |
| | 3,346,085 | | | Thrivent Partner Small Cap Growth Fund | | | 58,790,709 | |
| | 676,465 | | | Thrivent Partner Small Cap Value Fund | | | 14,679,292 | |
| | 1,004,432 | | | Thrivent Small Cap Stock Funda | | | 21,072,973 | |
| | 1,434,577 | | | Thrivent Mid Cap Growth Fund | | | 35,434,050 | |
| | 1,513,206 | | | Thrivent Partner Mid Cap Value Fund | | | 24,710,652 | |
| | 1,835,837 | | | Thrivent Mid Cap Stock Fund | | | 40,553,646 | |
| | 10,327,769 | | | Thrivent Partner Worldwide Allocation Fund | | | 106,995,683 | |
| | 6,452,995 | | | Thrivent Large Cap Growth Fund | | | 49,365,412 | |
| | 2,323,933 | | | Thrivent Large Cap Value Fund | | | 43,527,269 | |
| | 884,902 | | | Thrivent Large Cap Stock Fund | | | 24,556,029 | |
| | | | | |
| | | | Total | | | 435,291,886 | |
| | | | | |
| |
| Fixed Income Mutual Funds (3.0%) | | | | |
| | 1,696,984 | | | Thrivent High Yield Fund | | | 8,654,617 | |
| | 645,299 | | | Thrivent Income Fund | | | 5,859,319 | |
| | 686,971 | | | Thrivent Opportunity Income Plus Fund | | | 7,089,536 | |
| | | | | |
| | | | Total | | | 21,603,472 | |
| | | | | |
| | | | | | | | |
| | | | | |
| | | | Total Mutual Funds (cost $347,489,795) | | | 456,895,358 | |
| | | | | |
| | |
| Shares | | | Common Stock (27.5%) | | Value | |
| Consumer Discretionary (4.4%) | | | | |
| | 4,550 | | | Amazon.com, Inc.a | | | 1,656,336 | |
| | 2,100 | | | AutoZone, Inc.a | | | 912,849 | |
| | 8,400 | | | Barnes & Noble, Inc.a | | | 118,692 | |
| | 3,300 | | | Best Buy Company, Inc. | | | 141,240 | |
| | 2,200 | | | BJ’s Restaurants, Inc.a | | | 59,532 | |
| | 17,300 | | | Cablevision Systems Corporation | | | 269,015 | |
| | 4,140 | | | CBS Corporation | | | 244,840 | |
| | 2,900 | | | Charter Communications, Inc.a | | | 389,296 | |
| | 22,600 | | | Cheesecake Factory, Inc. | | | 1,067,850 | |
| | 2,400 | | | Children’s Place Retail Stores, Inc.a | | | 131,016 | |
| | 72,100 | | | Comcast Corporation | | | 3,430,518 | |
| | 5,500 | | | Dana Holding Corporation | | | 107,800 | |
| | 12,748 | | | Delphi Automotive plc | | | 729,186 | |
| | 9,000 | | | DISH Network Corporation | | | 433,800 | |
| | 3,929 | | | Finish Line, Inc. | | | 98,382 | |
| | 3,206 | | | Foot Locker, Inc. | | | 111,248 | |
| | 49,400 | | | Ford Motor Company | | | 845,234 | |
| | 8,900 | | | Francesca’s Holdings Corporationa | | | 160,111 | |
| | 5,500 | | | Gannett Company, Inc. | | | 152,185 | |
| | 1,700 | | | General Motors Companya | | | 62,815 | |
| | 8,830 | | | GNC Holdings, Inc. | | | 519,381 | |
| | 7,200 | | | Harley-Davidson, Inc. | | | 461,088 | |
| | 2,238 | | | Hasbro, Inc. | | | 115,593 | |
| | 15,700 | | | Home Depot, Inc. | | | 1,222,873 | |
| | 27,517 | | | Ignite Restaurant Group, Inc.a | | | 441,923 | |
| | 2,100 | | | iRobot Corporationa | | | 71,127 | |
| | 25,487 | | | Las Vegas Sands Corporation | | | 1,789,697 | |
| | 6,724 | | | LifeLock, Inc.a | | | 108,189 | |
| | 20,550 | | | Lowe’s Companies, Inc. | | | 1,022,979 | |
| | 3,734 | | | M/I Homes, Inc.a | | | 76,435 | |
| | 8,100 | | | Macy’s, Inc. | | | 373,491 | |
| | 3,100 | | | Marriott International, Inc. | | | 139,748 | |
| | 3,200 | | | Marriott Vacations Worldwide Corporationa | | | 160,256 | |
| | 24,888 | | | MDC Partners, Inc. | | | 767,297 | |
| | 21,600 | | | Meredith Corporation | | | 1,108,080 | |
| | 4,100 | | | Michael Kors Holdings, Ltd.a | | | 315,495 | |
| | 1,900 | | | Multimedia Games Holding Company, Inc.a | | | 61,769 | |
| | 14,520 | | | News Corporation | | | 493,680 | |
| | 20,290 | | | Nexstar Broadcasting Group, Inc. | | | 900,673 | |
| | 17,650 | | | NIKE, Inc. | | | 1,337,164 | |
| | 6,100 | | | Omnicom Group, Inc. | | | 415,471 | |
| | 11,640 | | | Papa John’s International, Inc. | | | 880,799 | |
| | 5,600 | | | Penn National Gaming, Inc.a | | | 327,656 | |
| | 15,939 | | | Pier 1 Imports, Inc. | | | 332,806 | |
| | 900 | | | Priceline.com, Inc.a | | | 948,447 | |
| | 4,500 | | | Regal Entertainment Group | | | 85,545 | |
| | 4,900 | | | Scripps Networks Interactive, Inc. | | | 394,450 | |
| | 3,100 | | | Signet Jewelers, Ltd. | | | 231,446 | |
| | 21,900 | | | Smith & Wesson Holding Corporationa | | | 236,082 | |
| | 6,500 | | | Starwood Hotels & Resorts Worldwide, Inc. | | | 478,530 | |
| | 4,400 | | | Sturm, Ruger & Company, Inc. | | | 287,804 | |
| | 1,500 | | | Target Corporation | | | 97,185 | |
| | 6,800 | | | Tempur-Pedic International, Inc.a | | | 260,780 | |
| | 4,160 | | | Time Warner Cable, Inc. | | | 499,824 | |
| | 2,600 | | | TJX Companies, Inc. | | | 158,054 | |
| | 10,300 | | | Toll Brothers, Inc.a | | | 338,664 | |
| | 31,980 | | | Tuesday Morning Corporationa | | | 452,517 | |
| | 33,800 | | | Twenty-First Century Fox, Inc. | | | 1,151,904 | |
| | 2,100 | | | Urban Outfitters, Inc.a | | | 79,548 | |
| | 2,800 | | | Valassis Communications, Inc. | | | 76,608 | |
| | 7,400 | | | Viacom, Inc. | | | 616,346 | |
| | 7,800 | | | Wyndham Worldwide Corporation | | | 517,920 | |
| | | | | |
| | | | Total | | | 31,477,269 | |
| | | | | |
| |
| Consumer Staples (1.5%) | | | | |
| | 15,600 | | | Altria Group, Inc. | | | 580,788 | |
| | 1,410 | | | Andersons, Inc. | | | 104,594 | |
| | 6,000 | | | Anheuser-Busch InBev NV ADR | | | 622,380 | |
| | 14,865 | | | Annie’s, Inc.a | | | 702,371 | |
| | 7,477 | | | British American Tobacco plc ADR | | | 826,134 | |
| | 1,700 | | | Brown-Forman Corporation | | | 124,066 | |
| | 3,200 | | | Bunge, Ltd. | | | 262,816 | |
| | 1,300 | | | Campbell Soup Company | | | 55,341 | |
| | 8,500 | | | Colgate-Palmolive Company | | | 550,205 | |
| | 19,620 | | | CVS Caremark Corporation | | | 1,221,541 | |
| | 478 | | | Energizer Holdings, Inc. | | | 46,897 | |
| | 6,800 | | | Green Mountain Coffee Roasters, Inc.a | | | 427,108 | |
| | 700 | | | Herbalife, Ltd. | | | 45,374 | |
| | 10,242 | | | Ingredion, Inc. | | | 673,514 | |
| | 2,630 | | | Kimberly-Clark Corporation | | | 284,040 | |
| | 3,821 | | | Kraft Foods Group, Inc. | | | 207,786 | |
| | 13,200 | | | Kroger Company | | | 565,488 | |
| | 11,473 | | | Mondelez International, Inc. | | | 385,952 | |
| | 10,700 | | | Nestle SA | | | 772,368 | |
| | 2,903 | | | Philip Morris International, Inc. | | | 258,715 | |
| | 6,700 | | | Procter & Gamble Company | | | 541,025 | |
| | 4,600 | | | Wal-Mart Stores, Inc. | | | 353,050 | |
The accompanying Notes to Financial Statements are an integral part of this schedule.
55
Aggressive Allocation Fund
Schedule of Investments as of October 31, 2013
| | | | | | | | |
| Shares | | | Common Stock (27.5%) | | Value | |
| Consumer Staples (1.5%) - continued | | | | |
| | 44,360 | | | WhiteWave Foods Companya | | | $887,644 | |
| | | | | |
| | | | Total | | | 10,499,197 | |
| | | | | |
| |
| Energy (2.3%) | | | | |
| | 8,500 | | | Anadarko Petroleum Corporation | | | 809,965 | |
| | 1,400 | | | Atwood Oceanics, Inc.a | | | 74,382 | |
| | 1,135 | | | Cabot Oil & Gas Corporation | | | 40,088 | |
| | 1,250 | | | Cameron International Corporationa | | | 68,575 | |
| | 3,480 | | | Chevron Corporation | | | 417,461 | |
| | 550 | | | Cimarex Energy Company | | | 57,942 | |
| | 5,100 | | | Cloud Peak Energy, Inc.a | | | 79,611 | |
| | 650 | | | Concho Resources, Inc.a | | | 71,897 | |
| | 23,600 | | | Consol Energy, Inc. | | | 861,400 | |
| | 4,100 | | | Denbury Resources, Inc.a | | | 77,859 | |
| | 1,350 | | | Energy XXI, Ltd. | | | 39,231 | |
| | 1,000 | | | Ensco plc | | | 57,650 | |
| | 5,860 | | | EOG Resources, Inc. | | | 1,045,424 | |
| | 6,720 | | | EQT Corporation | | | 575,299 | |
| | 4,100 | | | Exterran Holdings, Inc.a | | | 117,055 | |
| | 16,000 | | | Exxon Mobil Corporation | | | 1,433,920 | |
| | 2,000 | | | Helix Energy Solutions Group, Inc.a | | | 47,320 | |
| | 1,000 | | | Helmerich & Payne, Inc. | | | 77,550 | |
| | 13,200 | | | HollyFrontier Corporation | | | 607,992 | |
| | 51,664 | | | Marathon Oil Corporation | | | 1,821,673 | |
| | 800 | | | Marathon Petroleum Corporation | | | 57,328 | |
| | 11,500 | | | Nabors Industries, Ltd. | | | 201,020 | |
| | 850 | | | National Oilwell Varco, Inc. | | | 69,003 | |
| | 1,800 | | | Newfield Exploration Companya | | | 54,810 | |
| | 1,650 | | | Noble Corporation | | | 62,205 | |
| | 1,100 | | | Noble Energy, Inc. | | | 82,423 | |
| | 9,810 | | | Oasis Petroleum, Inc.a | | | 522,383 | |
| | 4,550 | | | Oceaneering International, Inc. | | | 390,754 | |
| | 830 | | | Oil States International, Inc.a | | | 90,163 | |
| | 7,000 | | | Peabody Energy Corporation | | | 136,360 | |
| | 450 | | | Pioneer Natural Resources Company | | | 92,151 | |
| | 740 | | | Range Resources Corporation | | | 56,025 | |
| | 37,580 | | | Rex Energy Corporationa | | | 807,970 | |
| | 15,390 | | | Rosetta Resources, Inc.a | | | 922,477 | |
| | 1,500 | | | Rowan Companies plca | | | 54,120 | |
| | 15,830 | | | Schlumberger, Ltd. | | | 1,483,588 | |
| | 750 | | | SM Energy Company | | | 66,457 | |
| | 2,900 | | | Superior Energy Services, Inc.a | | | 77,807 | |
| | 6,800 | | | Tesoro Corporation | | | 332,452 | |
| | 11,600 | | | Total SA ADR | | | 709,688 | |
| | 92,300 | | | Weatherford International, Ltd.a | | | 1,517,412 | |
| | 950 | | | Whiting Petroleum Corporationa | | | 63,545 | |
| | | | | |
| | | | Total | | | 16,232,435 | |
| | | | | |
| |
| Financials (5.7%) | | | | |
| | 7,890 | | | ACE, Ltd. | | | 753,022 | |
| | 7,054 | | | Affiliated Managers Group, Inc.a | | | 1,392,742 | |
| | 3,300 | | | Allied World Assurance Company Holdings AG | | | 357,357 | |
| | 5,150 | | | Allstate Corporation | | | 273,259 | |
| | 7,600 | | | American Assets Trust, Inc. | | | 253,004 | |
| | 12,500 | | | American International Group, Inc. | | | 645,625 | |
| | 3,100 | | | AmTrust Financial Services, Inc. | | | 118,916 | |
| | 5,600 | | | Aspen Insurance Holdings, Ltd. | | | 218,456 | |
| | 7,000 | | | Axis Capital Holdings, Ltd. | | | 331,940 | |
| | 57,330 | | | Bank of America Corporation | | | 800,327 | |
| | 3,200 | | | Banner Corporation | | | 122,432 | |
| | 10,380 | | | BBCN Bancorp, Inc. | | | 153,935 | |
| | 11,600 | | | Berkshire Hathaway, Inc.a | | | 1,334,928 | |
| | 3,800 | | | Camden Property Trust | | | 243,960 | |
| | 32,870 | | | Citigroup, Inc. | | | 1,603,399 | |
| | 2,152 | | | CNA Financial Corporation | | | 87,350 | |
| | 21,460 | | | CNO Financial Group, Inc. | | | 334,347 | |
| | 6,030 | | | Columbia Banking System, Inc. | | | 154,911 | |
| | 4,000 | | | Comerica, Inc. | | | 173,200 | |
| | 25,950 | | | Credit Suisse Group ADRa | | | 807,823 | |
| | 31,600 | | | DCT Industrial Trust, Inc. | | | 244,900 | |
| | 5,200 | | | Deutsche Bank AG | | | 251,264 | |
| | 4,600 | | | Discover Financial Services | | | 238,648 | |
| | 2,700 | | | Evercore Partners, Inc. | | | 136,269 | |
| | 4,600 | | | Extra Space Storage, Inc. | | | 211,554 | |
| | 26,400 | | | Fifth Third Bancorp | | | 502,392 | |
| | 21,800 | | | First Horizon National Corporation | | | 232,170 | |
| | 5,800 | | | First Industrial Realty Trust, Inc. | | | 104,806 | |
| | 8,100 | | | First Republic Bank | | | 413,667 | |
| | 6,300 | | | Franklin Street Properties Corporation | | | 83,160 | |
| | 6,500 | | | Fulton Financial Corporation | | | 79,365 | |
| | 3,400 | | | FXCM, Inc. | | | 55,726 | |
| | 1,700 | | | Greenhill & Company, Inc. | | | 87,210 | |
| | 27,000 | | | Hanmi Financial Corporation | | | 471,960 | |
| | 13,941 | | | HCC Insurance Holdings, Inc. | | | 636,407 | |
| | 3,400 | | | Home Loan Servicing Solutions, Ltd. | | | 80,274 | |
| | 20,318 | | | Host Hotels & Resorts, Inc. | | | 376,899 | |
| | 59,100 | | | Huntington Bancshares, Inc. | | | 520,080 | |
| | 13,320 | | | Invesco, Ltd. | | | 449,550 | |
| | 13,470 | | | iShares Russell 2000 Index Fund | | | 1,471,328 | |
| | 29,951 | | | J.P. Morgan Chase & Company | | | 1,543,674 | |
| | 10,118 | | | Lazard, Ltd. | | | 391,061 | |
| | 3,000 | | | M&T Bank Corporation | | | 337,590 | |
| | 4,300 | | | Macerich Company | | | 254,603 | |
| | 2,800 | | | MasterCard, Inc. | | | 2,007,880 | |
| | 16,610 | | | MetLife, Inc. | | | 785,819 | |
| | 3,600 | | | Montpelier Re Holdings, Inc. | | | 99,396 | |
| | 18,120 | | | Morgan Stanley | | | 520,588 | |
| | 1,900 | | | MSCI, Inc.a | | | 77,463 | |
| | 13,800 | | | NASDAQ OMX Group, Inc. | | | 488,934 | |
| | 7,200 | | | Northern Trust Corporation | | | 406,224 | |
| | 12,400 | | | Parkway Properties, Inc. | | | 224,564 | |
| | 8,800 | | | Pebblebrook Hotel Trust | | | 265,760 | |
| | 15,800 | | | Piedmont Office Realty Trust, Inc. | | | 291,984 | |
| | 9,214 | | | Popular, Inc.a | | | 232,653 | |
| | 1,900 | | | Portfolio Recovery Associates, Inc.a | | | 112,955 | |
| | 3,100 | | | Progressive Corporation | | | 80,507 | |
| | 7,800 | | | Protective Life Corporation | | | 359,424 | |
| | 6,900 | | | Prudential Financial, Inc. | | | 561,591 | |
| | 5,700 | | | Raymond James Financial, Inc. | | | 260,205 | |
| | 20,000 | | | SLM Corporation | | | 507,400 | |
| | 24,750 | | | SPDR EURO STOXX 50 ETF | | | 1,009,552 | |
| | 30,700 | | | SPDR S&P 500 ETF Trust | | | 5,394,911 | |
| | 3,440 | | | SPDR S&P Biotech ETF | | | 409,326 | |
| | 5,950 | | | State Street Corporation | | | 416,916 | |
| | 3,327 | | | Stewart Information Services Corporation | | | 104,202 | |
| | 17,710 | | | SVB Financial Groupa | | | 1,696,264 | |
| | 2,680 | | | Taubman Centers, Inc. | | | 176,317 | |
| | 9,300 | | | TCF Financial Corporation | | | 141,174 | |
| | 19,440 | | | Terreno Realty Corporation | | | 345,643 | |
| | 9,890 | | | Texas Capital Bancshares, Inc.a | | | 514,774 | |
| | 6,350 | | | Visa, Inc. | | | 1,248,854 | |
The accompanying Notes to Financial Statements are an integral part of this schedule.
56
Aggressive Allocation Fund
Schedule of Investments as of October 31, 2013
| | | | | | | | |
| Shares | | | Common Stock (27.5%) | | Value | |
| Financials (5.7%) - continued | | | | |
| | 12,137 | | | W.R. Berkley Corporation | | | $532,936 | |
| | 11,110 | | | Wells Fargo & Company | | | 474,286 | |
| | 36,882 | | | Zions Bancorporationb | | | 1,046,342 | |
| | | | | |
| | | | Total | | | 40,130,334 | |
| | | | | |
| |
| Health Care (3.2%) | | | | |
| | 2,300 | | | Abbott Laboratories | | | 84,065 | |
| | 6,800 | | | Acorda Therapeutics, Inc.a | | | 208,148 | |
| | 29,000 | | | Akorn, Inc.a | | | 592,760 | |
| | 19,350 | | | Align Technology, Inc.a | | | 1,104,111 | |
| | 27,700 | | | Allscripts Healthcare Solutions, Inc.a | | | 383,091 | |
| | 1,800 | | | AmerisourceBergen Corporation | | | 117,594 | |
| | 9,150 | | | Baxter International, Inc. | | | 602,710 | |
| | 1,200 | | | Biogen Idec, Inc.a | | | 293,028 | |
| | 46,900 | | | BioScrip, Inc.a | | | 328,769 | |
| | 2,576 | | | C.R. Bard, Inc. | | | 350,903 | |
| | 1,000 | | | Catamaran Corporationa | | | 46,960 | |
| | 3,500 | | | Centene Corporationa | | | 196,560 | |
| | 1,500 | | | Charles River Laboratories International, Inc.a | | | 73,815 | |
| | 1,200 | | | Community Health Systems, Inc. | | | 52,356 | |
| | 36,290 | | | Covidien plc | | | 2,326,552 | |
| | 4,800 | | | DENTSPLY International, Inc. | | | 226,080 | |
| | 3,100 | | | Emeritus Corporationa | | | 59,396 | |
| | 26,663 | | | ExamWorks Group, Inc.a | | | 689,239 | |
| | 28,700 | | | Express Scripts Holding Companya | | | 1,794,324 | |
| | 37,300 | | | Gilead Sciences, Inc.a | | | 2,647,927 | |
| | 8,600 | | | Illumina, Inc.a | | | 804,186 | |
| | 5,400 | | | McKesson Corporation | | | 844,236 | |
| | 900 | | | Medidata Solutions, Inc.a | | | 99,279 | |
| | 20,520 | | | Merck & Company, Inc. | | | 925,247 | |
| | 16,500 | | | Neurocrine Biosciences, Inc.a | | | 155,760 | |
| | 23,828 | | | NuVasive, Inc.a | | | 757,254 | |
| | 3,300 | | | PAREXEL International Corporationa | | | 150,843 | |
| | 23,945 | | | PDL BioPharma, Inc. | | | 193,715 | |
| | 5,300 | | | PerkinElmer, Inc. | | | 201,612 | |
| | 1,700 | | | Pfizer, Inc. | | | 52,156 | |
| | 13,700 | | | ResMed, Inc. | | | 708,838 | |
| | 10,850 | | | Sanofi ADR | | | 580,258 | |
| | 5,500 | | | Seattle Genetics, Inc.a | | | 212,465 | |
| | 12,000 | | | Shire Pharmaceuticals Group plc ADR | | | 1,597,200 | |
| | 11,300 | | | Thoratec Corporationa | | | 488,047 | |
| | 4,300 | | | United Therapeutics Corporationa | | | 380,636 | |
| | 13,150 | | | UnitedHealth Group, Inc. | | | 897,619 | |
| | 300 | | | Veeva Systems, Inc.a | | | 11,673 | |
| | 5,000 | | | Waters Corporationa | | | 504,600 | |
| | 7,628 | | | Zimmer Holdings, Inc. | | | 667,221 | |
| | | | | |
| | | | Total | | | 22,411,233 | |
| | | | | |
| |
| Industrials (3.6%) | | | | |
| | 4,100 | | | 3M Company | | | 515,985 | |
| | 11,090 | | | Actuant Corporation | | | 416,540 | |
| | 6,640 | | | Acuity Brands, Inc. | | | 667,386 | |
| | 5,750 | | | ADT Corporation | | | 249,378 | |
| | 5,100 | | | AGCO Corporation | | | 297,738 | |
| | 4,300 | | | AMETEK, Inc. | | | 205,669 | |
| | 11,060 | | | Apogee Enterprises, Inc. | | | 345,957 | |
| | 1,300 | | | Armstrong World Industries, Inc.a | | | 69,459 | |
| | 5,500 | | | Avis Budget Group, Inc.a | | | 172,315 | |
| | 2,900 | | | Babcock & Wilcox Company | | | 93,409 | |
| | 11,000 | | | Boeing Company | | | 1,435,500 | |
| | 5,577 | | | Briggs & Stratton Corporation | | | 102,282 | |
| | 9,770 | | | CLARCOR, Inc. | | | 571,350 | |
| | 1,800 | | | Colfax Corporationa | | | 100,728 | |
| | 28,531 | | | CSX Corporation | | | 743,518 | |
| | 4,400 | | | Deluxe Corporation | | | 207,196 | |
| | 22,300 | | | DigitalGlobe, Inc.a | | | 709,586 | |
| | 4,900 | | | Dover Corporation | | | 449,771 | |
| | 26,553 | | | EMCOR Group, Inc. | | | 984,054 | |
| | 1,800 | | | EnerSys, Inc. | | | 119,430 | |
| | 900 | | | Esterline Technologies Corporationa | | | 72,144 | |
| | 8,800 | | | Exelis, Inc. | | | 145,112 | |
| | 5,600 | | | Flowserve Corporation | | | 389,032 | |
| | 4,100 | | | Fluor Corporation | | | 304,302 | |
| | 13,500 | | | Foster Wheeler AGa | | | 364,365 | |
| | 18,100 | | | GATX Corporation | | | 933,055 | |
| | 6,500 | | | General Electric Company | | | 169,910 | |
| | 26,800 | | | HNI Corporation | | | 1,041,180 | |
| | 19,539 | | | Honeywell International, Inc. | | | 1,694,617 | |
| | 1,600 | | | Huntington Ingalls Industries, Inc. | | | 114,480 | |
| | 2,000 | | | IHS, Inc.a | | | 218,100 | |
| | 13,100 | | | Ingersoll-Rand plc | | | 884,643 | |
| | 25,130 | | | Jacobs Engineering Group, Inc.a | | | 1,528,407 | |
| | 8,400 | | | KBR, Inc. | | | 290,136 | |
| | 3,430 | | | Korn/Ferry Internationala | | | 81,634 | |
| | 14,600 | | | Landstar System, Inc. | | | 807,234 | |
| | 800 | | | Lindsay Manufacturing Company | | | 60,808 | |
| | 1,700 | | | Lockheed Martin Corporation | | | 226,678 | |
| | 14,564 | | | Manitowoc Company, Inc. | | | 283,415 | |
| | 23,100 | | | Manpower, Inc. | | | 1,804,110 | |
| | 2,400 | | | Matson, Inc. | | | 65,016 | |
| | 5,000 | | | MRC Global, Inc.a | | | 139,750 | |
| | 2,600 | | | Old Dominion Freight Line, Inc.a | | | 121,940 | |
| | 20,112 | | | Oshkosh Corporationa | | | 957,130 | |
| | 3,432 | | | Parker Hannifin Corporation | | | 400,583 | |
| | 4,270 | | | Pentair, Ltd. | | | 286,474 | |
| | 4,900 | | | Quanta Services, Inc.a | | | 148,029 | |
| | 9,300 | | | Republic Airways Holdings, Inc.a | | | 109,554 | |
| | 600 | | | Rockwell Automation, Inc. | | | 66,246 | |
| | 27,100 | | | Southwest Airlines Company | | | 466,662 | |
| | 7,000 | | | Spirit Airlines, Inc.a | | | 302,050 | |
| | 7,720 | | | Tennant Company | | | 468,527 | |
| | 8,700 | | | Union Pacific Corporation | | | 1,317,180 | |
| | 6,400 | | | United Rentals, Inc.a | | | 413,376 | |
| | 2,086 | | | United Stationers, Inc. | | | 92,702 | |
| | 1,300 | | | United Technologies Corporation | | | 138,125 | |
| | 7,200 | | | Wabash National Corporationa | | | 83,952 | |
| | | | | |
| | | | Total | | | 25,447,909 | |
| | | | | |
| |
| Information Technology (4.9%) | | | | |
| | 11,800 | | | Accenture plc | | | 867,300 | |
| | 14,500 | | | Activision Blizzard, Inc. | | | 241,280 | |
| | 4,800 | | | Alliance Data Systems Corporationa | | | 1,137,888 | |
| | 5,200 | | | Ambarella, Inc.a | | | 106,860 | |
| | 5,500 | | | Amdocs, Ltd. | | | 211,475 | |
| | 6,127 | | | Apple, Inc.b | | | 3,200,438 | |
| | 33,294 | | | Applied Materials, Inc. | | | 594,298 | |
| | 6,400 | | | Arris Group, Inc.a | | | 114,304 | |
| | 1,400 | | | Aspen Technology, Inc.a | | | 53,522 | |
| | 130,500 | | | Atmel Corporationa | | | 950,040 | |
| | 8,800 | | | Autodesk, Inc.a | | | 351,208 | |
The accompanying Notes to Financial Statements are an integral part of this schedule.
57
Aggressive Allocation Fund
Schedule of Investments as of October 31, 2013
| | | | | | | | |
| Shares | | | Common Stock (27.5%) | | Value | |
| Information Technology (4.9%) - continued | | | | |
| | 5,400 | | | Avnet, Inc. | | | $214,380 | |
| | 30,600 | | | Brocade Communications Systems, Inc.a | | | 245,412 | |
| | 59,230 | | | Cisco Systems, Inc. | | | 1,332,675 | |
| | 8,809 | | | Citrix Systems, Inc.a | | | 500,175 | |
| | 800 | | | CommVault Systems, Inc.a | | | 62,464 | |
| | 25,736 | | | CoreLogic, Inc.a | | | 856,237 | |
| | 4,154 | | | DST Systems, Inc. | | | 352,135 | |
| | 17,971 | | | E2open, Inc.a | | | 404,348 | |
| | 6,024 | | | eBay, Inc.a | | | 317,525 | |
| | 2,400 | | | Ellie Mae, Inc.a | | | 69,360 | |
| | 30,800 | | | EMC Corporation | | | 741,356 | |
| | 38,300 | | | Facebook, Inc.a | | | 1,924,958 | |
| | 7,700 | | | Fairchild Semiconductor International, Inc.a | | | 97,559 | |
| | 1,200 | | | FEI Company | | | 106,896 | |
| | 2,600 | | | Fleetmatics Group plca | | | 82,550 | |
| | 2,200 | | | FLIR Systems, Inc. | | | 62,656 | |
| | 3,200 | | | Gartner, Inc.a | | | 188,640 | |
| | 3,175 | | | Google, Inc.a,b | | | 3,272,091 | |
| | 11,200 | | | Guidewire Software, Inc.a | | | 568,064 | |
| | 22,500 | | | Informatica Corporationa | | | 868,500 | |
| | 7,000 | | | InterDigital, Inc. | | | 271,250 | |
| | 2,100 | | | International Business Machines Corporation | | | 376,341 | |
| | 5,100 | | | InvenSense, Inc.a | | | 86,139 | |
| | 4,000 | | | Ixiaa | | | 56,720 | |
| | 4,900 | | | j2 Global, Inc. | | | 269,402 | |
| | 14,711 | | | Juniper Networks, Inc.a | | | 274,213 | |
| | 1,125 | | | Leidos Holdings, Inc. | | | 52,976 | |
| | 2,105 | | | Lexmark International, Inc. | | | 74,833 | |
| | 21,800 | | | Marvell Technology Group, Ltd. | | | 261,600 | |
| | 10,850 | | | Microsoft Corporation | | | 383,547 | |
| | 16,700 | | | Monster Worldwide, Inc.a | | | 72,144 | |
| | 31,600 | | | NetApp, Inc. | | | 1,226,396 | |
| | 3,400 | | | NeuStar, Inc.a | | | 156,128 | |
| | 41,848 | | | NVIDIA Corporation | | | 635,253 | |
| | 5,200 | | | OmniVision Technologies, Inc.a | | | 72,852 | |
| | 13,475 | | | Plantronics, Inc. | | | 578,616 | |
| | 20,600 | | | QUALCOMM, Inc.b | | | 1,431,082 | |
| | 8,100 | | | Red Hat, Inc.a | | | 350,487 | |
| | 2,920 | | | Salesforce.com, Inc.a | | | 155,811 | |
| | 2,800 | | | Sanmina Corporationa | | | 40,768 | |
| | 10,300 | | | SunPower Corporationa | | | 310,957 | |
| | 37,240 | | | Symantec Corporation | | | 846,838 | |
| | 5,400 | | | Teradata Corporationa | | | 237,978 | |
| | 52,516 | | | Teradyne, Inc.a | | | 918,505 | |
| | 27,150 | | | Texas Instruments, Inc. | | | 1,142,472 | |
| | 6,600 | | | Trimble Navigation, Ltd.a | | | 188,562 | |
| | 32,546 | | | TriQuint Semiconductor, Inc.a | | | 258,090 | |
| | 11,900 | | | Ubiquiti Networks, Inc. | | | 459,102 | |
| | 18,640 | | | Virtusa Corporationa | | | 579,331 | |
| | 42,700 | | | Vishay Intertechnology, Inc.a | | | 523,929 | |
| | 17,300 | | | VMware, Inc.a | | | 1,406,144 | |
| | 29 | | | Workday, Inc.a | | | 2,171 | |
| | 37,900 | | | Xerox Corporation | | | 376,726 | |
| | 17,469 | | | Xilinx, Inc. | | | 793,442 | |
| | | | | |
| | | | Total | | | 34,967,399 | |
| | | | | |
| |
| Materials (1.1%) | | | | |
| | 1,300 | | | AEP Industries, Inc.a | | | 77,246 | |
| | 8,420 | | | Celanese Corporation | | | 471,604 | |
| | 1,400 | | | CF Industries Holdings, Inc. | | | 301,840 | |
| | 6,650 | | | Dow Chemical Company | | | 262,475 | |
| | 8,600 | | | Eagle Materials, Inc. | | | 645,086 | |
| | 2,600 | | | Eastman Chemical Company | | | 204,854 | |
| | 21,340 | | | H.B. Fuller Company | | | 1,021,546 | |
| | 1,333 | | | Innophos Holdings, Inc. | | | 66,810 | |
| | 17,600 | | | Louisiana-Pacific Corporationa | | | 299,376 | |
| | 19,620 | | | Materials Select Sector SPDR Fund | | | 858,767 | |
| | 4,950 | | | Nucor Corporation | | | 256,261 | |
| | 10,500 | | | Owens-Illinois, Inc.a | | | 333,795 | |
| | 3,800 | | | Packaging Corporation of America | | | 236,664 | |
| | 2,300 | | | PPG Industries, Inc. | | | 419,934 | |
| | 3,500 | | | Schweitzer-Mauduit International, Inc. | | | 216,580 | |
| | 2,800 | | | Sigma-Aldrich Corporation | | | 242,004 | |
| | 6,894 | | | Silgan Holdings, Inc. | | | 310,713 | |
| | 5,230 | | | Southern Copper Corporation | | | 146,179 | |
| | 25,244 | | | Steel Dynamics, Inc. | | | 453,635 | |
| | 9,700 | | | Stillwater Mining Companya | | | 105,827 | |
| | 10,900 | | | Teck Resources, Ltd. | | | 291,466 | |
| | 2,000 | | | U.S. Silica Holdings, Inc. | | | 69,640 | |
| | 3,400 | | | Valspar Corporation | | | 237,898 | |
| | 2,100 | | | Worthington Industries, Inc. | | | 85,134 | |
| | | | | |
| | | | Total | | | 7,615,334 | |
| | | | | |
| |
| Telecommunications Services (0.2%) | | | | |
| | 19,600 | | | AT&T, Inc. | | | 709,520 | |
| | 7,330 | | | Cogent Communications Group, Inc. | | | 257,503 | |
| | 8,294 | | | Verizon Communications, Inc. | | | 418,930 | |
| | | | | |
| | | | Total | | | 1,385,953 | |
| | | | | |
| |
| Utilities (0.6%) | | | | |
| | 2,500 | | | Calpine Corporationa | | | 50,425 | |
| | 13,600 | | | CMS Energy Corporation | | | 373,456 | |
| | 15,610 | | | NiSource, Inc. | | | 492,027 | |
| | 13,000 | | | NorthWestern Corporation | | | 595,920 | |
| | 14,530 | | | PG&E Corporation | | | 608,080 | |
| | 24,850 | | | PNM Resources, Inc. | | | 594,412 | |
| | 9,100 | | | Public Service Enterprise Group, Inc. | | | 304,850 | |
| | 7,100 | | | Southern Company | | | 290,461 | |
| | 12,810 | | | Southwest Gas Corporation | | | 695,071 | |
| | 11,600 | | | Wisconsin Energy Corporation | | | 488,476 | |
| | | | | |
| | | | Total | | | 4,493,178 | |
| | | | | |
| | | | | | | | |
| | | | | |
| | | | Total Common Stock (cost $155,289,145) | | | 194,660,241 | |
| | | | | |
| | |
Principal
Amount | | | Long-Term Fixed Income (1.8%) | | Value | |
| Asset-Backed Securities (0.1%) | | | | |
| | | | Renaissance Home Equity Loan Trust | | | | |
| | 650,000 | | | 6.011%, 5/25/2036 | | | 473,666 | |
| | | | | |
| | | | Total | | | 473,666 | |
| | | | | |
| |
| Collateralized Mortgage Obligations (0.1%) | | | | |
| | | | MASTR Alternative Loans Trust | | | | |
| | 63,127 | | | 0.620%, 12/25/2035c | | | 34,517 | |
| | | | Residential Asset Securitization Trust | | | | |
| | 80,314 | | | 0.550%, 8/25/2037c | | | 25,020 | |
| | | | Sequoia Mortgage Trust | | | | |
| | 224,099 | | | 2.631%, 9/20/2046 | | | 153,965 | |
The accompanying Notes to Financial Statements are an integral part of this schedule.
58
Aggressive Allocation Fund
Schedule of Investments as of October 31, 2013
| | | | | | | | |
Principal Amount | | | Long-Term Fixed Income (1.8%) | | Value | |
| Collateralized Mortgage Obligations (0.1%) - continued | | | | |
| | | | WaMu Mortgage Pass Through Certificates | | | | |
| | $77,282 | | | 2.375%, 9/25/2036 | | | $67,526 | |
| | 112,538 | | | 2.425%, 10/25/2036 | | | 96,601 | |
| | | | | |
| | | | Total | | | 377,629 | |
| | | | | |
| |
| Commercial Mortgage-Backed Securities (<0.1%) | | | | |
| | | | Credit Suisse Mortgage Capital Certificates | | | | |
| | 250,000 | | | 5.509%, 9/15/2039 | | | 270,308 | |
| | | | | |
| | | | Total | | | 270,308 | |
| | | | | |
| |
| Mortgage-Backed Securities (0.6%) | | | | |
| | | | Federal Home Loan Mortgage Corporation Gold 15-Yr. Pass Through | | | | |
| | 475,000 | | | 3.000%, 12/1/2028d | | | 491,031 | |
| | | | Federal Home Loan Mortgage Corporation Gold 30-Yr. Pass Through | | | | |
| | 500,000 | | | 3.500%, 11/1/2043d | | | 511,015 | |
| | | | Federal National Mortgage Association Conventional 15- Yr. Pass Through | | | | |
| | 320,000 | | | 2.500%, 11/1/2028d | | | 323,350 | |
| | 155,000 | | | 3.500%, 11/1/2028d | | | 163,658 | |
| | | | Federal National Mortgage Association Conventional 30- Yr. Pass Through | | | | |
| | 950,000 | | | 3.500%, 11/1/2043d | | | 974,344 | |
| | 950,000 | | | 4.000%, 11/1/2043d | | | 1,000,766 | |
| | 493,000 | | | 4.500%, 11/1/2043d | | | 527,741 | |
| | | | | |
| | | | Total | | | 3,991,905 | |
| | | | | |
| |
| U.S. Government and Agencies (1.0%) | | | | |
| | | | U.S. Treasury Bonds | | | | |
| | 4,610,000 | | | 3.000%, 5/15/2042 | | | 4,087,051 | |
| | | | U.S. Treasury Notes | | | | |
| | 1,250,000 | | | 1.750%, 5/15/2023 | | | 1,167,480 | |
| | | | U.S. Treasury Notes, TIPS | | | | |
| | 2,023,418 | | | 0.125%, 4/15/2018 | | | 2,093,133 | |
| | | | | |
| | | | Total | | | 7,347,664 | |
| | | | | |
| | | | | | | | |
| | | | | |
| | | | Total Long-Term Fixed Income (cost $13,179,591) | | | 12,461,172 | |
| | | | | |
| | |
Shares or
Principal
Amount | | | Short-Term Investments (6.1%) | | Value | |
| | | | Fairway Finance, LLC | | | | |
| | 1,850,000 | | | 0.140%, 12/9/2013e,f | | | 1,849,727 | |
| | | | Federal Home Loan Bank Discount Notes | | | | |
| | 8,000,000 | | | 0.040%, 11/6/2013b,f | | | 7,999,955 | |
| | 2,000,000 | | | 0.020%, 11/20/2013f | | | 1,999,979 | |
| | 4,100,000 | | | 0.093%, 11/22/2013b,f | | | 4,099,778 | |
| | 3,000,000 | | | 0.040%, 11/27/2013f | | | 2,999,913 | |
| | 2,100,000 | | | 0.032%, 12/4/2013b,f | | | 2,099,939 | |
| | 6,000,000 | | | 0.045%, 1/3/2014b,f | | | 5,999,528 | |
| | 2,450,000 | | | 0.040%, 1/6/2014f | | | 2,449,820 | |
| | 2,500,000 | | | 0.050%, 1/24/2014f | | | 2,499,708 | |
| | | | Federal Home Loan Mortgage Corporation Discount Notes | | | | |
| | 300,000 | | | 0.095%, 12/2/2013b,f | | | 299,975 | |
| | | | Federal National Mortgage Association Discount Notes | | | | |
| | 1,200,000 | | | 0.100%, 12/4/2013b,f | | | 1,199,890 | |
| | 5,000,000 | | | 0.020%, 1/7/2014b,f | | | 4,999,814 | |
| | | | Novartis Finance Corporation | | | | |
| | 4,000,000 | | | 0.060%, 11/6/2013e,f | | | 3,999,967 | |
| | | | U.S. Treasury Bills | | | | |
| | 500,000 | | | 0.070%, 4/24/2014f,g | | | 499,831 | |
| | | | | |
| | | | Total Short-Term Investments (at amortized cost) | | | 42,997,824 | |
| | | | | |
| | | | Total Investments (cost $558,956,355) 100.0% | | $ | 707,014,595 | |
| | | | | |
| | | | Other Assets and Liabilities, Net (<0.1%) | | | (4,944 | ) |
| | | | | |
| | | | Total Net Assets 100.0% | | $ | 707,009,651 | |
| | | | | |
a | Non-income producing security. |
b | At October 31, 2013, $20,615,520 of investments were held on deposit with the counterparty and pledged as the initial margin deposit for open futures contracts. |
c | Denotes variable rate securities. Variable rate securities are securities whose yields vary with a designated market index or market rate. The rate shown is as of October 31, 2013. |
d | Denotes investments purchased on a when-issued or delayed delivery basis. |
e | Denotes securities sold under Rule 144A of the Securities Act of 1933, which exempts them from registration. These securities have been deemed liquid and may be resold to other dealers in the program or to other qualified institutional buyers. As of October 31, 2013, the value of these investments was $5,849,694 or 0.8% of total net assets. |
f | The interest rate shown reflects the yield, coupon rate or the discount rate at the date of purchase. |
g | At October 31, 2013, $199,932 of investments were pledged as collateral with the custodian under the agreement between the counterparty, the custodian and the fund for open swap contracts. |
The accompanying Notes to Financial Statements are an integral part of this schedule.
59
Aggressive Allocation Fund
Schedule of Investments as of October 31, 2013
Definitions:
| | | | |
ADR | | - | | American Depositary Receipt, which are certificates for an underlying foreign security’s shares held by an issuing U.S. depository bank. |
ETF | | - | | Exchange Traded Fund. |
TIPS | | - | | Treasury Inflation Protected Security. |
Unrealized Appreciation (Depreciation)
Gross unrealized appreciation and depreciation of investments, based on cost for federal income tax purposes, were as follows:
| | | | |
Gross unrealized appreciation | | $ | 145,446,202 | |
Gross unrealized depreciation | | | (2,263,704 | ) |
| | | | |
Net unrealized appreciation (depreciation) | | $ | 143,182,498 | |
| |
Cost for federal income tax purposes | | $ | 563,832,096 | |
Fair Valuation Measurements
The following table is a summary of the inputs used, as of October 31, 2013, in valuing Aggressive Allocation Fund’s assets carried at fair value.
| | | | | | | | | | | | | | | | |
Investments in Securities | | Total | | | Level 1 | | | Level 2 | | | Level 3 | |
| | | | |
Mutual Funds | | | | | | | | | | | | | | | | |
Equity Mutual Funds | | | 435,291,886 | | | | 435,291,886 | | | | – | | | | – | |
Fixed Income Mutual Funds | | | 21,603,472 | | | | 21,603,472 | | | | – | | | | – | |
| | | | |
Common Stock | | | | | | | | | | | | | | | | |
Consumer Discretionary | | | 31,477,269 | | | | 31,477,269 | | | | – | | | | – | |
Consumer Staples | | | 10,499,197 | | | | 9,726,829 | | | | 772,368 | | | | – | |
Energy | | | 16,232,435 | | | | 16,232,435 | | | | – | | | | – | |
Financials | | | 40,130,334 | | | | 40,130,334 | | | | – | | | | – | |
Health Care | | | 22,411,233 | | | | 22,411,233 | | | | – | | | | – | |
Industrials | | | 25,447,909 | | | | 25,447,909 | | | | – | | | | – | |
Information Technology | | | 34,967,399 | | | | 34,967,399 | | | | – | | | | – | |
Materials | | | 7,615,334 | | | | 7,615,334 | | | | – | | | | – | |
Telecommunications Services | | | 1,385,953 | | | | 1,385,953 | | | | – | | | | – | |
Utilities | | | 4,493,178 | | | | 4,493,178 | | | | – | | | | – | |
| | | | |
Long-Term Fixed Income | | | | | | | | | | | | | | | | |
Asset-Backed Securities | | | 473,666 | | | | – | | | | 473,666 | | | | – | |
Collateralized Mortgage Obligations | | | 377,629 | | | | – | | | | 377,629 | | | | – | |
Commercial Mortgage-Backed Securities | | | 270,308 | | | | – | | | | 270,308 | | | | – | |
Mortgage-Backed Securities | | | 3,991,905 | | | | – | | | | 3,991,905 | | | | – | |
U.S. Government and Agencies | | | 7,347,664 | | | | – | | | | 7,347,664 | | | | – | |
Short-Term Investments | | | 42,997,824 | | | | – | | | | 42,997,824 | | | | – | |
| |
Total | | | $707,014,595 | | | | $650,783,231 | | | | $56,231,364 | | | | $– | |
| |
| | | | |
Other Financial Instruments | | Total | | | Level 1 | | | Level 2 | | | Level 3 | |
| | | | |
Asset Derivatives | | | | | | | | | | | | | | | | |
Futures Contracts | | | 8,291,483 | | | | 5,083,336 | | | | 3,208,147 | | | | – | |
Credit Default Swaps | | | 5,670 | | | | – | | | | 5,670 | | | | – | |
| |
Total Asset Derivatives | | | $8,297,153 | | | | $5,083,336 | | | | $3,213,817 | | | | $– | |
| |
| | | | |
Liability Derivatives | | | | | | | | | | | | | | | | |
Futures Contracts | | | 6,613,199 | | | | 6,613,199 | | | | – | | | | – | |
| |
Total Liability Derivatives | | | $6,613,199 | | | | $6,613,199 | | | | $– | | | | $– | |
| |
There were no significant transfers between Levels during the period ended October 31, 2013. Transfers between Levels are identified as of the end of the period.
The accompanying Notes to Financial Statements are an integral part of this schedule.
60
Aggressive Allocation Fund
Schedule of Investments as of October 31, 2013
| | | | | | | | | | | | | | | | | | | | |
Futures Contracts | | Number of Contracts Long/(Short) | | | Expiration
Date | | | Notional Principal Amount | | | Value | | | Unrealized Gain/(Loss) | |
2-Yr. U.S. Treasury Bond Futures | | | (10 | ) | | | December 2013 | | | ($ | 2,196,845 | ) | | ($ | 2,204,219 | ) | | ($ | 7,374 | ) |
5-Yr. U.S. Treasury Bond Futures | | | (30 | ) | | | December 2013 | | | | (3,587,018 | ) | | | (3,650,625 | ) | | | (63,607 | ) |
10-Yr. U.S. Treasury Bond Futures | | | (50 | ) | | | December 2013 | | | | (6,202,973 | ) | | | (6,367,970 | ) | | | (164,997 | ) |
30-Yr. U.S. Treasury Bond Futures | | | 5 | | | | December 2013 | | | | 656,695 | | | | 674,062 | | | | 17,367 | |
Eurex EURO STOXX 50 Futures | | | 1,129 | | | | December 2013 | | | | 43,652,765 | | | | 46,860,912 | | | | 3,208,147 | |
Mini MSCI EAFE Index Futures | | | 58 | | | | December 2013 | | | | 5,169,532 | | | | 5,438,370 | | | | 268,838 | |
Russell 2000 Index Mini-Futures | | | (602 | ) | | | December 2013 | | | | (62,982,865 | ) | | | (66,087,560 | ) | | | (3,104,695 | ) |
S&P 400 Index Mini-Futures | | | (542 | ) | | | December 2013 | | | | (66,450,354 | ) | | | (69,722,880 | ) | | | (3,272,526 | ) |
S&P 500 Index Futures | | | 264 | | | | December 2013 | | | | 110,768,869 | | | | 115,566,000 | | | | 4,797,131 | |
Total Futures Contracts | | | | | | | | | | | | | | | | | | $ | 1,678,284 | |
| | | | | | | | | | | | | | | | | | |
Credit Default Swaps and Counterparty | | Buy/Sell Protection1 | | Termination
Date | | | Notional
Principal
Amount2 | | | Value3 | | | Unrealized Gain/(Loss) | |
CDX HY 21, 5 Year, at 5.00%; Bank of America | | Buy | | | 12/20/2018 | | | $ | 1,500,000 | | | $ | 2,826 | | | $ | 2,826 | |
CDX HY 21, 5 Year, at 5.00%; JP Morgan | | Buy | | | 12/20/2018 | | | | 1,500,000 | | | | 2,844 | | | | 2,844 | |
Total Credit Default Swaps | | | | | | | | | | | | $ | 5,670 | | | $ | 5,670 | |
1 | As the buyer of protection, Aggressive Allocation Fund pays periodic fees in return for payment by the seller which is contingent upon an adverse credit event occurring in the underlying issuer or reference entity. As the seller of protection, Aggressive Allocation Fund collects periodic fees from the buyer and profits if the credit of the underlying issuer or reference entity remains stable or improves while the swap is outstanding, but the seller in a credit default swap contract would be required to pay the amount of credit loss, determined as specified in the agreement, to the buyer in the event of an adverse credit event in the reference entity. |
2 | The maximum potential amount of future payments Aggressive Allocation Fund could be required to make as the seller or receive as the buyer of protection. |
3 | The values for credit indexes (CDX or LCDX) serve as an indicator of the current status of the payment/performance risk and represent the liability or profit for the credit default swap contract had the contract been closed as of the reporting date. When protection has been sold, the value of the swap will increase when the swap spread declines representing an improvement in the reference entity’s credit worthiness. The value of the swap will decrease when the swap spread increases representing a deterioration in the reference entity’s credit worthiness. When protection has been purchased, the value of the swap will increase when the swap spread increases representing a deterioration in the reference entity’s credit worthiness. The value of the swap will decrease when the swap spread declines representing an improvement in the reference entity’s credit worthiness. |
The accompanying Notes to Financial Statements are an integral part of this schedule.
61
Aggressive Allocation Fund
Schedule of Investments as of October 31, 2013
The following table summarizes the fair value and Statement of Assets and Liabilities location, as of October 31, 2013, for Aggressive Allocation Fund’s investments in financial derivative instruments by primary risk exposure as discussed under item (2) Significant Accounting Policies of the Notes to Financial Statements.
| | | | | | |
Derivatives by risk category | | Statement of Assets and Liabilities Location | | Fair Value | |
| | |
Asset Derivatives | | | | | | |
| | |
Interest Rate Contracts | | | | | | |
Futures* | | Net Assets - Net unrealized appreciation/(depreciation) on Futures contracts | | $ | 17,367 | |
Total Interest Rate Contracts | | | | | 17,367 | |
| | |
Equity Contracts | | | | | | |
Futures* | | Net Assets - Net unrealized appreciation/(depreciation) on Futures contracts | | | 8,274,116 | |
Total Equity Contracts | | | | | 8,274,116 | |
| | |
Credit Contracts | | | | | | |
Credit Default Swaps | | Receivable/Payable - Swap agreements, at value; Net Assets - Net unrealized
appreciation/(depreciation) on Swap agreements | | | 5,670 | |
Total Credit Contracts | | | | | 5,670 | |
| |
Total Asset Derivatives | | | | $ | 8,297,153 | |
| |
| | |
Liability Derivatives | | | | | | |
| | |
Interest Rate Contracts | | | | | | |
Futures* | | Net Assets - Net unrealized appreciation/(depreciation) on Futures contracts | | | 235,978 | |
Total Interest Rate Contracts | | | | | 235,978 | |
| | |
Equity Contracts | | | | | | |
Futures* | | Net Assets - Net unrealized appreciation/(depreciation) on Futures contracts | | | 6,377,221 | |
Total Equity Contracts | | | | | 6,377,221 | |
| |
Total Liability Derivatives | | | | $ | 6,613,199 | |
| |
* | Includes cumulative appreciation/depreciation of futures contracts as reported in the Schedule of Investments. Only current day’s variation margin is reported within the Statement of Assets and Liabilities. |
The following table summarizes the net realized gains/(losses) and Statement of Operations location, for the period ended October 31, 2013, for Aggressive Allocation Fund’s investments in financial derivative instruments by primary risk exposure.
| | | | | | |
Derivatives by risk category | | Statement of Operations Location | | Realized Gains/(Losses) recognized in Income | |
| | |
Interest Rate Contracts | | | | | | |
Futures | | Net realized gains/(losses) on Futures contracts | | | 235,255 | |
| | |
Total Interest Rate Contracts | | | | | 235,255 | |
| | |
Equity Contracts | | | | | | |
Futures | | Net realized gains/(losses) on Futures contracts | | | (3,641,164 | ) |
| | |
Total Equity Contracts | | | | | (3,641,164 | ) |
| | |
Foreign Exchange Contracts | | | | | | |
Forward Contracts | | Net realized gains/(losses) on Foreign currency transactions | | | (53,126 | ) |
| | |
Total Foreign Exchange Contracts | | | | | (53,126 | ) |
| | |
Credit Contracts | | | | | | |
Credit Default Swaps | | Net realized gains/(losses) on Swap agreements | | | (2,399 | ) |
| | |
Total Credit Contracts | | | | | (2,399 | ) |
| |
Total | | | | | ($3,461,434 | ) |
| |
The accompanying Notes to Financial Statements are an integral part of this schedule.
62
Aggressive Allocation Fund
Schedule of Investments as of October 31, 2013
The following table summarizes the change in net unrealized appreciation/(depreciation) and Statement of Operations location, for the period ended October 31, 2013, for Aggressive Allocation Fund’s investments in financial derivative instruments by primary risk exposure.
| | | | | | |
Derivatives by risk category | | Statement of Operations Location | | Change in unrealized
appreciation/(depreciation) recognized in Income | |
| | |
Interest Rate Contracts | | | | | | |
Futures | | Change in net unrealized appreciation/(depreciation) on Futures contracts | | | (209,931 | ) |
Total Interest Rate Contracts | | | | | (209,931 | ) |
| | |
Equity Contracts | | | | | | |
Futures | | Change in net unrealized appreciation/(depreciation) on Futures contracts | | | 789,905 | |
Total Equity Contracts | | | | | 789,905 | |
| | |
Credit Contracts | | | | | | |
Credit Default Swaps | | Change in net unrealized appreciation/(depreciation) on Swap agreements | | | 5,670 | |
Total Credit Contracts | | | | | 5,670 | |
| | |
Foreign Exchange Contracts | | | | | | |
Forward Contracts | | Change in net unrealized appreciation/(depreciation) on Foreign currency forward contracts | | | 15 | |
Total Foreign Exchange Contracts | | | | | 15 | |
| |
Total | | | | | $585,659 | |
| |
The following table presents Aggressive Allocation Fund’s average volume of derivative activity during the period ended October 31, 2013.
| | | | | | | | | | | | | | | | | | | | |
Derivative Risk Category | | Futures
(Notional)* | | | Futures
(Percentage
of Average
Net Assets) | | | Forwards (Notional)* | | | Forwards
(Percentage
of Average
Net Assets) | | | Swaps (Notional)* | |
Equity Contracts | | | $267,105,980 | | | | 42.5 | % | | | N/A | | | | N/A | | | | N/A | |
Interest Rate Contracts | | | 13,364,361 | | | | 2.1 | | | | N/A | | | | N/A | | | | N/A | |
Foreign Exchange Contracts | | | N/A | | | | N/A | | | | $3,659 | | | | <0.1 | % | | | N/A | |
Credit Contracts | | | N/A | | | | N/A | | | | N/A | | | | N/A | | | | $4,751 | |
* | Notional amount represents long or short, or both, derivative positions held by the Fund. |
The accompanying Notes to Financial Statements are an integral part of this schedule.
63
Aggressive Allocation Fund
Schedule of Investments as of October 31, 2013
Investment in Affiliates
Affiliated issuers, as defined under the Investment Company Act of 1940, include those in which the Fund’s holdings of an issuer represent 5% or more of the outstanding voting securities of an issuer, or any affiliated mutual fund.
A summary of transactions for the fiscal year to date, in Aggressive Allocation Fund, is as follows:
| | | | | | | | | | | | | | | | | | | | | | | | |
Fund | | Value October 31, 2012 | | | Gross Purchases | | | Gross Sales | | | Shares Held at October 31, 2013 | | | Value October 31, 2013 | | | Income Earned November 1, 2012 - October 31, 2013 | |
Growth and Income Plus^, ^^ | | | $4,482,114 | | | | $89,225 | | | | $5,218,501 | | | | – | | | | $– | | | | $89,225 | |
Opportunity Income Plus | | | – | | | | 7,021,043 | | | | – | | | | 686,971 | | | | 7,089,536 | | | | 20,884 | |
Natural Resources | | | 13,550,782 | | | | 124,396 | | | | – | | | | 1,519,588 | | | | 15,606,171 | | | | 124,396 | |
Partner Small Cap Growth | | | 45,911,513 | | | | 1,330,124 | | | | 4,500,000 | | | | 3,346,085 | | | | 58,790,709 | | | | – | |
Partner Small Cap Value | | | 11,793,236 | | | | 472,885 | | | | 1,000,000 | | | | 676,465 | | | | 14,679,292 | | | | 272,667 | |
Small Cap Stock | | | 16,161,303 | | | | – | | | | – | | | | 1,004,432 | | | | 21,072,973 | | | | – | |
Mid Cap Growth | | | 34,522,959 | | | | 2,274,642 | | | | 8,000,000 | | | | 1,434,577 | | | | 35,434,050 | | | | – | |
Partner Mid Cap Value | | | 20,587,471 | | | | 672,707 | | | | 2,000,000 | | | | 1,513,206 | | | | 24,710,652 | | | | 232,462 | |
Mid Cap Stock | | | 30,397,516 | | | | 135,007 | | | | – | | | | 1,835,837 | | | | 40,553,646 | | | | 135,007 | |
Partner Worldwide Allocation | | | 88,690,414 | | | | 2,142,999 | | | | – | | | | 10,327,769 | | | | 106,995,683 | | | | 2,142,999 | |
Large Cap Growth | | | 39,282,979 | | | | 258,696 | | | | 1,500,000 | | | | 6,452,995 | | | | 49,365,412 | | | | 258,696 | |
Large Cap Value | | | 33,592,812 | | | | 705,563 | | | | – | | | | 2,323,933 | | | | 43,527,269 | | | | 705,563 | |
Large Cap Stock | | | 19,629,570 | | | | 1,369,676 | | | | – | | | | 884,902 | | | | 24,556,029 | | | | 312,563 | |
High Yield | | | 16,189,902 | | | | 544,794 | | | | 8,235,112 | | | | 1,696,984 | | | | 8,654,617 | | | | 544,795 | |
Income | | | 11,880,506 | | | | 217,856 | | | | 6,050,000 | | | | 645,299 | | | | 5,859,319 | | | | 217,862 | |
Government Bond | | | 9,759,861 | | | | – | | | | 9,750,790 | | | | – | | | | – | | | | 429 | |
Limited Maturity Bond | | | 1,259,996 | | | | – | | | | 1,259,996 | | | | – | | | | – | | | | 56 | |
Cash Management Trust-Short Term Investment | | | 6,352,142 | | | | 73,146,524 | | | | 79,498,666 | | | | – | | | | – | | | | 12,188 | |
Total Value and Income Earned | | | 404,045,076 | | | | | | | | | | | | | | | | 456,895,358 | | | | 5,069,792 | |
^ | Prior to August 16, 2013, the Growth and Income Plus Fund was known as the Equity Income Plus Fund. |
^^ | On August 6, 2013, the Thrivent Asset Allocation Funds, as the shareholders of the Thrivent Growth and Income Plus Fund, redeemed their shares in-kind. The Growth and Income Plus Fund distributed fund securities rather than cash as payment for the redemption of these fund shares. These in-kind transactions were conducted at market value. |
The accompanying Notes to Financial Statements are an integral part of this schedule.
64
Moderately Aggressive Allocation Fund
Schedule of Investments as of October 31, 2013
| | | | | | | | |
Principal Amount | | | Bank Loans (2.2%)a | | Value | |
| Basic Materials (0.2%) | | | | |
| | | | FMG Resources August 2006 Pty., Ltd., Term Loan | | | | |
| | $2,054,250 | | | 5.250%, 10/18/2017 | | | $2,057,208 | |
| | | | Ineos Group Holdings, Ltd., Term Loan | | | | |
| | 630,777 | | | 4.000%, 5/4/2018 | | | 632,593 | |
| | | | MRC Global, Inc., Term Loan | | | | |
| | 361,350 | | | 6.000%, 11/8/2019 | | | 363,244 | |
| | | | Tronox Pigments BV, Term Loan | | | | |
| | 164,587 | | | 4.500%, 3/19/2020 | | | 165,954 | |
| | | | US Coatings Acquisition, Inc., Term Loan | | | | |
| | 378,100 | | | 4.750%, 2/1/2020 | | | 381,843 | |
| | | | | |
| | | | Total | | | 3,600,842 | |
| | | | | |
| |
| Capital Goods (0.1%) | | | | |
| | | | ADS Waste Holdings, Term Loan | | | | |
| | 684,825 | | | 4.250%, 10/9/2019 | | | 688,373 | |
| | | | Berry Plastics Group, Inc., Term Loan | | | | |
| | 820,875 | | | 3.500%, 2/8/2020 | | | 817,542 | |
| | | | Silver II Borrower, Term Loan | | | | |
| | 218,350 | | | 4.000%, 12/13/2019 | | | 218,116 | |
| | | | | |
| | | | Total | | | 1,724,031 | |
| | | | | |
| |
| Communications Services (0.7%) | | | | |
| | | | Atlantic Broadband Penn, LLC, Term Loan | | | | |
| | 292,050 | | | 3.250%, 11/30/2019 | | | 291,045 | |
| | | | Cequel Communications, LLC, Term Loan | | | | |
| | 268,636 | | | 3.500%, 2/14/2019 | | | 268,687 | |
| | | | Charter Communications Operating, LLC, Term Loan | | | | |
| | 109,725 | | | 3.000%, 7/1/2020 | | | 108,543 | |
| | | | Clear Channel Communications, Inc., Term Loan | | | | |
| | 219,264 | | | 3.818%, 1/29/2016 | | | 212,531 | |
| | 646,736 | | | 6.918%, 1/30/2019 | | | 614,483 | |
| | | | Cricket Communications, Inc., Term Loan | | | | |
| | 74,437 | | | 4.750%, 10/10/2019 | | | 74,717 | |
| | 463,838 | | | 4.750%, 3/8/2020 | | | 465,827 | |
| | | | Cumulus Media Holdings, Inc., Term Loan | | | | |
| | 416,638 | | | 4.500%, 9/17/2018 | | | 419,033 | |
| | | | Fairpoint Communications, Term Loan | | | | |
| | 547,250 | | | 7.500%, 2/14/2019 | | | 557,358 | |
| | | | Grande Communications Networks, LLC, Term Loan | | | | |
| | 329,175 | | | 4.500%, 5/29/2020 | | | 327,941 | |
| | | | Hargray Communications Group, Inc., Term Loan | | | | |
| | 453,863 | | | 4.750%, 6/26/2019 | | | 456,509 | |
| | | | Integra Telecom Holdings, Inc., Term Loan | | | | |
| | 323,375 | | | 5.250%, 2/22/2019 | | | 326,877 | |
| | 105,000 | | | 9.750%, 2/21/2020 | | | 107,865 | |
| | | | Intelsat Jackson Holdings SA, Term Loan | | | | |
| | 518,469 | | | 4.250%, 4/2/2018 | | | 520,953 | |
| | | | Level 3 Communications, Inc., Term Loan | | | | |
| | 715,000 | | | 4.000%, 1/15/2020 | | | 717,982 | |
| | | | Liberty Cablevision of Puerto Rico, Ltd., Term Loan | | | | |
| | 360,437 | | | 6.000%, 6/9/2017 | | | 361,339 | |
| | | | LTS Buyer, LLC, Term Loan | | | | |
| | 244,388 | | | 4.500%, 4/13/2020 | | | 245,101 | |
| | 27,000 | | | 8.000%, 4/12/2021 | | | 27,338 | |
| | | | McGraw-Hill Global Education Holdings, LLC, Term Loan | | | | |
| | 437,800 | | | 9.000%, 3/22/2019 | | | 445,190 | |
| | | | Mediacom Broadband, LLC, Term Loan | | | | |
| | 292,050 | | | 4.000%, 1/20/2020 | | | 292,234 | |
| | | | NEP Broadcasting, LLC, Term Loan | | | | |
| | 818,812 | | | 4.750%, 1/22/2020 | | | 820,860 | |
| | 31,429 | | | 9.500%, 7/22/2020 | | | 32,234 | |
| | | | NTelos, Inc., Term Loan | | | | |
| | 163,350 | | | 5.750%, 11/9/2019 | | | 163,963 | |
| | | | SBA Senior Finance II, LLC, Term Loan | | | | |
| | 78,813 | | | 3.750%, 9/28/2019 | | | 78,911 | |
| | | | Syniverse Holdings, Inc., Term Loan | | | | |
| | 426,589 | | | 4.000%, 4/23/2019 | | | 427,477 | |
| | | | TNS, Inc., Term Loan | | | | |
| | 332,222 | | | 5.000%, 2/14/2020 | | | 334,159 | |
| | | | Univision Communications, Inc., Term Loan | | | | |
| | 432,825 | | | 4.500%, 2/28/2020 | | | 434,898 | |
| | 230,682 | | | 4.500%, 3/1/2020 | | | 231,787 | |
| | 109,450 | | | 4.500%, 3/1/2020 | | | 109,997 | |
| | | | Virgin Media Investment Holdings, Ltd., Term Loan | | | | |
| | 675,000 | | | 3.500%, 6/8/2020 | | | 674,696 | |
| | | | Visant Corporation, Term Loan | | | | |
| | 708,643 | | | 5.250%, 12/22/2016 | | | 694,973 | |
| | | | WideOpenWest Finance, LLC, Term Loan | | | | |
| | 726,350 | | | 4.750%, 4/1/2019 | | | 732,103 | |
| | | | Yankee Cable Acquisition, LLC, Term Loan | | | | |
| | 430,739 | | | 5.250%, 3/1/2020 | | | 432,556 | |
| | | | Zayo Group, LLC, Term Loan | | | | |
| | 545,854 | | | 4.500%, 7/2/2019 | | | 548,245 | |
| | | | | |
| | | | Total | | | 12,558,412 | |
| | | | | |
| |
| Consumer Cyclical (0.3%) | | | | |
| | | | Bally Technologies, Inc., Term Loan | | | | |
| | 340,000 | | | 0.000%, 7/16/2021b,c | | | 340,850 | |
| | | | Burlington Coat Factory Warehouse Corporation, Term Loan | | | | |
| | 437,026 | | | 4.250%, 2/23/2017 | | | 439,893 | |
| | | | Cenveo Corporation, Term Loan | | | | |
| | 243,775 | | | 6.250%, 2/13/2017 | | | 245,908 | |
| | | | Ceridian Corporation, Term Loan | | | | |
| | 385,000 | | | 4.420%, 5/9/2017 | | | 386,829 | |
| | | | Chrysler Group, LLC, Term Loan | | | | |
| | 363,142 | | | 4.250%, 5/24/2017 | | | 366,229 | |
The accompanying Notes to Financial Statements are an integral part of this schedule.
65
Moderately Aggressive Allocation Fund
Schedule of Investments as of October 31, 2013
| | | | | | | | |
Principal Amount | | | Bank Loans (2.2%)a | | Value | |
| Consumer Cyclical (0.3%) - continued | | | | |
| | | | J.C. Penney Corporation, Inc., Term Loan | | | | |
| | $159,600 | | | 6.000%, 5/22/2018 | | | $154,236 | |
| | | | MGM Resorts International, Term Loan | | | | |
| | 347,375 | | | 3.500%, 12/20/2019 | | | 346,816 | |
| | | | ROC Finance, LLC, Term Loan | | | | |
| | 605,000 | | | 3.636%, 6/20/2019 | | | 591,387 | |
| | | | Seminole Indian Tribe of Florida, Term Loan | | | | |
| | 197,825 | | | 3.000%, 4/29/2020 | | | 197,289 | |
| | | | Seven Seas Cruises S de RL, LLC, Term Loan | | | | |
| | 652,000 | | | 4.750%, 12/21/2018 | | | 657,705 | |
| | | | Toys R Us, Inc., Term Loan | | | | |
| | 579,809 | | | 5.250%, 5/25/2018 | | | 522,732 | |
| | | | | |
| | | | Total | | | 4,249,874 | |
| | | | | |
| |
| Consumer Non-Cyclical (0.3%) | | | | |
| | | | Albertsons, LLC, Term Loan | | | | |
| | 250,000 | | | 0.000%, 3/21/2019b,c | | | 250,000 | |
| | 527,350 | | | 4.750%, 3/21/2019 | | | 528,658 | |
| | | | Biomet, Inc., Term Loan | | | | |
| | 498,750 | | | 3.690%, 7/25/2017 | | | 501,972 | |
| | | | CHS/Community Health Systems, Inc., Term Loan | | | | |
| | 365,000 | | | 3.760%, 1/25/2017 | | | 365,912 | |
| | | | Del Monte Corporation, Term Loan | | | | |
| | 67,885 | | | 4.000%, 3/8/2018 | | | 67,885 | |
| | | | DJO Finance, LLC, Term Loan | | | | |
| | 524,347 | | | 4.750%, 9/15/2017 | | | 529,370 | |
| | | | Grifols, Inc., Term Loan | | | | |
| | 359,057 | | | 4.250%, 6/1/2017 | | | 361,265 | |
| | | | Hologic, Inc., Term Loan | | | | |
| | 353,056 | | | 3.750%, 8/1/2019 | | | 354,644 | |
| | | | JBS USA, LLC, Term Loan | | | | |
| | 411,888 | | | 3.750%, 5/25/2018 | | | 410,858 | |
| | | | Reynolds Group Holdings, Inc., Term Loan | | | | |
| | 69,300 | | | 4.750%, 9/28/2018 | | | 69,841 | |
| | | | Rite Aid Corporation, Term Loan | | | | |
| | 84,575 | | | 4.000%, 2/21/2020 | | | 84,972 | |
| | 165,000 | | | 5.750%, 8/21/2020 | | | 168,772 | |
| | | | Roundy’s Supermarkets, Inc., Term Loan | | | | |
| | 650,825 | | | 5.750%, 2/13/2019 | | | 642,690 | |
| | | | Supervalu, Inc., Term Loan | | | | |
| | 506,532 | | | 5.000%, 3/21/2019 | | | 509,415 | |
| | | | Van Wagner Communications, LLC, Term Loan | | | | |
| | 293,525 | | | 6.250%, 8/3/2018 | | | 297,805 | |
| | | | | |
| | | | Total | | | 5,144,059 | |
| | | | | |
| |
| Energy (0.1%) | | | | |
| | | | Arch Coal, Inc., Term Loan | | | | |
| | 469,337 | | | 5.750%, 5/16/2018 | | | 454,768 | |
| | | | Chesapeake Energy Corporation, Term Loan | | | | |
| | 1,060,000 | | | 5.750%, 12/2/2017 | | | 1,082,525 | |
| | | | Offshore Group Investment, Ltd., Term Loan | | | | |
| | 457,700 | | | 5.750%, 3/28/2019 | | | 460,419 | |
| | | | Pacific Drilling SA, Term Loan | | | | |
| | 214,462 | | | 4.500%, 6/3/2018 | | | 215,177 | |
| | | | | |
| | | | Total | | | 2,212,889 | |
| | | | | |
| |
| Financials (0.1%) | | | | |
| | | | GEO Group, Inc., Term Loan | | | | |
| | 108,455 | | | 3.250%, 4/3/2020 | | | 108,862 | |
| | | | MoneyGram International, Inc., Term Loan | | | | |
| | 437,800 | | | 4.250%, 3/27/2020 | | | 439,004 | |
| | | | WaveDivision Holdings, LLC, Term Loan | | | | |
| | 674,900 | | | 4.000%, 10/12/2019 | | | 676,587 | |
| | | | | |
| | | | Total | | | 1,224,453 | |
| | | | | |
| |
| Technology (0.2%) | | | | |
| | | | First Data Corporation Extended, Term Loan | | | | |
| | 720,000 | | | 4.170%, 3/23/2018 | | | 720,259 | |
| | | | First Data Corporation, Term Loan | | | | |
| | 295,000 | | | 4.170%, 9/24/2018 | | | 295,277 | |
| | | | Freescale Semiconductor, Inc., Term Loan | | | | |
| | 398,000 | | | 5.000%, 3/1/2020 | | | 401,407 | |
| | 258,000 | | | 5.000%, 1/15/2021 | | | 260,257 | |
| | | | Infor US, Inc., Term Loan | | | | |
| | 386,487 | | | 5.250%, 4/5/2018 | | | 389,312 | |
| | | | SunGard Data Systems, Inc., Term Loan | | | | |
| | 540,912 | | | 4.500%, 1/31/2020 | | | 543,612 | |
| | | | | |
| | | | Total | | | 2,610,124 | |
| | | | | |
| |
| Transportation (0.1%) | | | | |
| | | | American Airlines, Inc., Term Loan | | | | |
| | 458,850 | | | 4.750%, 6/27/2019 | | | 461,241 | |
| | | | American Petroleum Tankers Parent, LLC, Term Loan | | | | |
| | 127,556 | | | 4.750%, 10/2/2019 | | | 127,556 | |
| | | | Delta Air Lines, Inc., Term Loan | | | | |
| | 596,679 | | | 4.250%, 4/20/2017 | | | 599,340 | |
| | | | United Air Lines, Inc., Term Loan | | | | |
| | 268,650 | | | 4.000%, 4/1/2019 | | | 269,926 | |
| | | | | |
| | | | Total | | | 1,458,063 | |
| | | | | |
| |
| Utilities (0.1%) | | | | |
| | | | Calpine Corporation, Term Loan | | | | |
| | 84,351 | | | 4.000%, 4/1/2018 | | | 84,688 | |
| | 579,150 | | | 4.000%, 10/9/2019 | | | 581,913 | |
| | | | Intergen NV, Term Loan | | | | |
| | 209,475 | | | 5.500%, 6/15/2020 | | | 208,951 | |
| | | | NGPL PipeCo, LLC, Term Loan | | | | |
| | 515,916 | | | 6.750%, 9/15/2017 | | | 482,164 | |
| | | | | |
| | | | Total | | | 1,357,716 | |
| | | | | |
| | | | | | | | |
| | | | | |
| | | | Total Bank Loans (cost $35,965,118) | | | 36,140,463 | |
| | | | | |
| | |
| Shares | | | Mutual Funds (63.0%) | | Value | |
| Equity Mutual Funds (52.7%) | | | | |
| | 3,069,650 | | | Thrivent Natural Resources Fund | | | 31,525,305 | |
The accompanying Notes to Financial Statements are an integral part of this schedule.
66
Moderately Aggressive Allocation Fund
Schedule of Investments as of October 31, 2013
| | | | | | | | |
| | |
| Shares | | | Mutual Funds (63.0%) | | Value | |
| Equity Mutual Funds (52.7%) - continued | | | | |
| | 2,992,538 | | | Thrivent Partner Small Cap Growth Fund | | | $52,578,884 | |
| | 1,577,393 | | | Thrivent Partner Small Cap Value Fund | | | 34,229,418 | |
| | 1,344,712 | | | Thrivent Small Cap Stock Fundd | | | 28,212,048 | |
| | 1,895,607 | | | Thrivent Mid Cap Growth Fund | | | 46,821,497 | |
| | 3,128,294 | | | Thrivent Partner Mid Cap Value Fund | | | 51,085,043 | |
| | 4,033,886 | | | Thrivent Mid Cap Stock Fund | | | 89,108,543 | |
| | 19,881,077 | | | Thrivent Partner Worldwide Allocation Fund | | | 205,967,957 | |
| | 14,356,555 | | | Thrivent Large Cap Growth Fund | | | 109,827,646 | |
| | 7,594,853 | | | Thrivent Large Cap Value Fund | | | 142,251,596 | |
| | 3,157,979 | | | Thrivent Large Cap Stock Fund | | | 87,633,904 | |
| | | | | |
| | | | Total | | | 879,241,841 | |
| | | | | |
| |
| Fixed Income Mutual Funds (10.3%) | | | | |
| | 11,107,563 | | | Thrivent High Yield Fund | | | 56,648,574 | |
| | 7,961,202 | | | Thrivent Income Fund | | | 72,287,718 | |
| | 2,326,434 | | | Thrivent Government Bond Fund | | | 23,310,870 | |
| | 1,507,894 | | | Thrivent Limited Maturity Bond Fund | | | 18,893,910 | |
| | | | | |
| | | | Total | | | 171,141,072 | |
| | | | | |
| | | | | | | | |
| | | | | |
| | | | Total Mutual Funds (cost $841,119,047) | | | 1,050,382,913 | |
| | | | | |
| | |
| Shares | | | Common Stock (19.5%) | | Value | |
| Consumer Discretionary (3.1%) | | | | |
| | 13,000 | | | 888 Holdings Public Company, Ltd. | | | 33,130 | |
| | 5,400 | | | Amazon.com, Inc.d | | | 1,965,762 | |
| | 2,400 | | | AutoZone, Inc.d | | | 1,043,256 | |
| | 14,800 | | | Barnes & Noble, Inc.d | | | 209,124 | |
| | 5,900 | | | Best Buy Company, Inc. | | | 252,520 | |
| | 3,800 | | | BJ’s Restaurants, Inc.d | | | 102,828 | |
| | 30,400 | | | Cablevision Systems Corporation | | | 472,720 | |
| | 8,710 | | | CBS Corporation | | | 515,109 | |
| | 5,000 | | | Charter Communications, Inc.d | | | 671,200 | |
| | 32,790 | | | Cheesecake Factory, Inc. | | | 1,549,327 | |
| | 4,200 | | | Children’s Place Retail Stores, Inc.d | | | 229,278 | |
| | 7,000 | | | Cineworld Group plc | | | 41,628 | |
| | 98,800 | | | Comcast Corporation | | | 4,700,904 | |
| | 900 | | | Continental AG | | | 164,581 | |
| | 9,600 | | | Dana Holding Corporation | | | 188,160 | |
| | 300 | | | Darden Restaurants, Inc. | | | 15,459 | |
| | 27,800 | | | David Jones, Ltd. | | | 71,447 | |
| | 25,502 | | | Delphi Automotive plc | | | 1,458,714 | |
| | 900 | | | Discovery Communications, Inc.d | | | 80,028 | |
| | 15,400 | | | DISH Network Corporation | | | 742,280 | |
| | 1,500 | | | Dollar Tree, Inc.d | | | 87,600 | |
| | 6,945 | | | Finish Line, Inc. | | | 173,903 | |
| | 4,258 | | | Foot Locker, Inc. | | | 147,753 | |
| | 86,900 | | | Ford Motor Company | | | 1,486,859 | |
| | 15,600 | | | Francesca’s Holdings Corporationd | | | 280,644 | |
| | 9,700 | | | Gannett Company, Inc. | | | 268,399 | |
| | 2,900 | | | General Motors Companyd | | | 107,155 | |
| | 12,470 | | | GNC Holdings, Inc. | | | 733,485 | |
| | 2,200 | | | Gtech SPA | | | 66,812 | |
| | 22,600 | | | Halfords Group plc | | | 153,069 | |
| | 12,700 | | | Harley-Davidson, Inc. | | | 813,308 | |
| | 3,974 | | | Hasbro, Inc. | | | 205,257 | |
| | 2,600 | | | Haseko Corporationd | | | 19,272 | |
| | 21,200 | | | Home Depot, Inc. | | | 1,651,268 | |
| | 600 | | | HomeAway, Inc.d | | | 17,790 | |
| | 36,524 | | | Ignite Restaurant Group, Inc.d | | | 586,575 | |
| | 3,700 | | | iRobot Corporationd | | | 125,319 | |
| | 53,700 | | | ITV plc | | | 164,193 | |
| | 5,400 | | | Kingfisher plc | | | 32,667 | |
| | 400 | | | L Brands, Inc. | | | 25,044 | |
| | 32,413 | | | Las Vegas Sands Corporation | | | 2,276,041 | |
| | 11,912 | | | LifeLock, Inc.d | | | 191,664 | |
| | 28,500 | | | Link REIT | | | 143,373 | |
| | 42,470 | | | Lowe’s Companies, Inc. | | | 2,114,157 | |
| | 6,541 | | | M/I Homes, Inc.d | | | 133,894 | |
| | 14,300 | | | Macy’s, Inc. | | | 659,373 | |
| | 6,100 | | | Marriott International, Inc. | | | 274,988 | |
| | |
| | 5,500 | | | Marriott Vacations Worldwide Corporationd | | | 275,440 | |
| | 33,052 | | | MDC Partners, Inc. | | | 1,018,993 | |
| | 33,700 | | | Mediaset SPAd | | | 168,288 | |
| | 28,320 | | | Meredith Corporation | | | 1,452,816 | |
| | 7,700 | | | Michael Kors Holdings, Ltd.d | | | 592,515 | |
| | 6,000 | | | Mitchells & Butlers plcd | | | 38,543 | |
| | 3,400 | | | Multimedia Games Holding Company, Inc.d | | | 110,534 | |
| | 5,400 | | | N Brown Group plc | | | 45,380 | |
| | 30,660 | | | News Corporation | | | 1,042,440 | |
| | 26,830 | | | Nexstar Broadcasting Group, Inc. | | | 1,190,984 | |
| | 3,400 | | | NH Hoteles SAd | | | 17,745 | |
| | 21,000 | | | NIKE, Inc. | | | 1,590,960 | |
| | 10,500 | | | Omnicom Group, Inc. | | | 715,155 | |
| | 200 | | | O’Reilly Automotive, Inc.d | | | 24,762 | |
| | 3,400 | | | Pandora AS | | | 162,101 | |
| | 15,380 | | | Papa John’s International, Inc. | | | 1,163,805 | |
| | 9,600 | | | Penn National Gaming, Inc.d | | | 561,696 | |
| | 400 | | | PetSmart, Inc. | | | 29,104 | |
| | 21,179 | | | Pier 1 Imports, Inc. | | | 442,218 | |
| | 1,500 | | | Priceline.com, Inc.d | | | 1,580,745 | |
| | 7,800 | | | Regal Entertainment Group | | | 148,278 | |
| | 2,000 | | | Renault SA | | | 174,501 | |
| | 400 | | | Ross Stores, Inc. | | | 30,940 | |
| | 5,000 | | | Safilo Group SPAd | | | 102,220 | |
| | 8,600 | | | Scripps Networks Interactive, Inc. | | | 692,300 | |
| | 6,200 | | | Seven West Media, Ltd. | | | 14,772 | |
| | 5,400 | | | Signet Jewelers, Ltd. | | | 403,164 | |
| | 52,000 | | | SJM Holdings, Ltd. | | | 168,135 | |
| | 38,500 | | | Smith & Wesson Holding Corporationd | | | 415,030 | |
| | 19,800 | | | Southern Cross Media Group, Ltd. | | | 35,333 | |
| | 11,400 | | | Starwood Hotels & Resorts Worldwide, Inc. | | | 839,268 | |
| | 7,800 | | | Sturm, Ruger & Company, Inc. | | | 510,198 | |
| | 1,700 | | | Takkt AG | | | 33,757 | |
| | 2,700 | | | Target Corporation | | | 174,933 | |
| | 11,600 | | | Tempur-Pedic International, Inc.d | | | 444,860 | |
| | 5,100 | | | The Restaurant Group plc | | | 47,065 | |
| | 57,400 | | | Thomas Cook Group plcd | | | 132,111 | |
| | 8,720 | | | Time Warner Cable, Inc. | | | 1,047,708 | |
| | 4,500 | | | TJX Companies, Inc. | | | 273,555 | |
| | 17,700 | | | Toll Brothers, Inc.d | | | 581,976 | |
| | 15,800 | | | TomTom NVd | | | 121,997 | |
| | 4,700 | | | Toyota Motor Corporation | | | 304,739 | |
| | 1,000 | | | Tractor Supply Company | | | 71,350 | |
| | 42,510 | | | Tuesday Morning Corporationd | | | 601,517 | |
The accompanying Notes to Financial Statements are an integral part of this schedule.
67
Moderately Aggressive Allocation Fund
Schedule of Investments as of October 31, 2013
| | | | | | | | |
| Shares | | | Common Stock (19.5%) | | Value | |
| Consumer Discretionary (3.1%) - continued | | | | |
| | 40,150 | | | Twenty-First Century Fox, Inc. | | | $1,368,312 | |
| | 200 | | | Under Armour, Inc.d | | | 16,230 | |
| | 3,700 | | | Urban Outfitters, Inc.d | | | 140,156 | |
| | 4,900 | | | USS Company, Ltd. | | | 71,758 | |
| | 4,800 | | | Valassis Communications, Inc. | | | 131,328 | |
| | 400 | | | Valeo SA | | | 39,572 | |
| | 100 | | | VF Corporation | | | 21,500 | |
| | 13,000 | | | Viacom, Inc. | | | 1,082,770 | |
| | 13,800 | | | Wyndham Worldwide Corporation | | | 916,320 | |
| | 200 | | | Wynn Resorts, Ltd. | | | 33,250 | |
| | | | | |
| | | | Total | | | 50,862,444 | |
| | | | | |
| |
| Consumer Staples (1.1%) | | | | |
| | 27,500 | | | Altria Group, Inc. | | | 1,023,825 | |
| | 2,505 | | | Andersons, Inc. | | | 185,821 | |
| | 7,200 | | | Anheuser-Busch InBev NV ADR | | | 746,856 | |
| | 19,653 | | | Annie’s, Inc.d | | | 928,604 | |
| | 400 | | | Beam, Inc. | | | 26,920 | |
| | 8,856 | | | British American Tobacco plc ADR | | | 978,499 | |
| | 2,900 | | | Brown-Forman Corporation | | | 211,642 | |
| | 5,700 | | | Bunge, Ltd. | | | 468,141 | |
| | 2,200 | | | Campbell Soup Company | | | 93,654 | |
| | 15,000 | | | Colgate-Palmolive Company | | | 970,950 | |
| | 1,600 | | | Cranswick plc | | | 27,509 | |
| | 38,030 | | | CVS Caremark Corporation | | | 2,367,748 | |
| | 904 | | | Energizer Holdings, Inc. | | | 88,691 | |
| | 12,000 | | | Green Mountain Coffee Roasters, Inc.d | | | 753,720 | |
| | 29,700 | | | Greencore Group plc | | | 85,766 | |
| | 500 | | | Hain Celestial Group, Inc.d | | | 41,615 | |
| | 1,600 | | | Henkel AG & Company KGaA | | | 172,753 | |
| | 1,300 | | | Herbalife, Ltd. | | | 84,266 | |
| | 1,300 | | | ICA Gruppen ABd | | | 39,289 | |
| | 15,152 | | | Ingredion, Inc. | | | 996,396 | |
| | 5,520 | | | Kimberly-Clark Corporation | | | 596,160 | |
| | 5,500 | | | Koninklijke (Royal) Ahold NV | | | 104,536 | |
| | 8,079 | | | Kraft Foods Group, Inc. | | | 439,336 | |
| | 23,200 | | | Kroger Company | | | 993,888 | |
| | 819 | | | Leroy Seafood Group ASA | | | 25,309 | |
| | 1,500 | | | Mandom Corporation | | | 51,496 | |
| | 24,347 | | | Mondelez International, Inc. | | | 819,033 | |
| | 600 | | | Monster Beverage Corporationd | | | 34,338 | |
| | 12,600 | | | Nestle SA | | | 909,518 | |
| | 6,179 | | | Philip Morris International, Inc.e | | | 550,672 | |
| | 11,800 | | | Procter & Gamble Company | | | 952,850 | |
| | 300 | | | Royal Unibrew AS | | | 38,502 | |
| | 8,000 | | | Wal-Mart Stores, Inc. | | | 614,000 | |
| | 64,360 | | | WhiteWave Foods Companyd | | | 1,287,844 | |
| | 1,000 | | | Whole Foods Market, Inc. | | | 63,130 | |
| | 5,300 | | | Woolworths, Ltd. | | | 174,776 | |
| | | | | |
| | | | Total | | | 17,948,053 | |
| | | | | |
| |
| Energy (1.6%) | | | | |
| | 4,000 | | | Alpha Natural Resources, Inc.d | | | 28,000 | |
| | 14,900 | | | Anadarko Petroleum Corporation | | | 1,419,821 | |
| | 2,500 | | | Atwood Oceanics, Inc.d | | | 132,825 | |
| | 27,036 | | | BW Offshore, Ltd. | | | 37,001 | |
| | 1,971 | | | Cabot Oil & Gas Corporation | | | 69,616 | |
| | 2,700 | | | Cameron International Corporationd | | | 148,122 | |
| | 7,210 | | | Chevron Corporation | | | 864,912 | |
| | 950 | | | Cimarex Energy Company | | | 100,082 | |
| | 9,000 | | | Cloud Peak Energy, Inc.d | | | 140,490 | |
| | 1,650 | | | Concho Resources, Inc.d | | | 182,507 | |
| | 27,900 | | | Consol Energy, Inc. | | | 1,018,350 | |
| | 7,200 | | | Denbury Resources, Inc.d | | | 136,728 | |
| | 2,350 | | | Energy XXI, Ltd. | | | 68,291 | |
| | 1,800 | | | Ensco plc | | | 103,770 | |
| | 9,298 | | | EOG Resources, Inc. | | | 1,658,763 | |
| | 13,840 | | | EQT Corporation | | | 1,184,842 | |
| | 7,200 | | | Exterran Holdings, Inc.d | | | 205,560 | |
| | 28,100 | | | Exxon Mobil Corporation | | | 2,518,322 | |
| | 1,711 | | | Fred Olsen Energy ASA | | | 71,903 | |
| | |
| | 3,550 | | | Helix Energy Solutions Group, Inc.d | | | 83,993 | |
| | 1,750 | | | Helmerich & Payne, Inc. | | | 135,712 | |
| | 23,150 | | | HollyFrontier Corporation | | | 1,066,289 | |
| | 5,600 | | | Hunting plc | | | 80,006 | |
| | 27,100 | | | JX Holdings, Inc. | | | 134,001 | |
| | 78,674 | | | Marathon Oil Corporation | | | 2,774,045 | |
| | 1,300 | | | Marathon Petroleum Corporation | | | 93,158 | |
| | 20,300 | | | Nabors Industries, Ltd. | | | 354,844 | |
| | 1,500 | | | National Oilwell Varco, Inc. | | | 121,770 | |
| | 3,200 | | | Newfield Exploration Companyd | | | 97,440 | |
| | 2,850 | | | Noble Corporation | | | 107,445 | |
| | 1,900 | | | Noble Energy, Inc. | | | 142,367 | |
| | 12,970 | | | Oasis Petroleum, Inc.d | | | 690,653 | |
| | 8,100 | | | Oceaneering International, Inc. | | | 695,628 | |
| | 1,400 | | | Oil States International, Inc.d | | | 152,082 | |
| | 13,300 | | | Peabody Energy Corporation | | | 259,084 | |
| | 800 | | | Pioneer Natural Resources Company | | | 163,824 | |
| | 1,450 | | | Range Resources Corporation | | | 109,780 | |
| | 51,060 | | | Rex Energy Corporationd | | | 1,097,790 | |
| | 20,450 | | | Rosetta Resources, Inc.d | | | 1,225,773 | |
| | 2,600 | | | Rowan Companies plcd | | | 93,808 | |
| | 23,760 | | | Schlumberger, Ltd. | | | 2,226,787 | |
| | 1,800 | | | SM Energy Company | | | 159,498 | |
| | 800 | | | Southwestern Energy Companyd | | | 29,776 | |
| | 5,100 | | | Superior Energy Services, Inc.d | | | 136,833 | |
| | 11,900 | | | Tesoro Corporation | | | 581,791 | |
| | 14,000 | | | TonenGeneral Sekiyu KK | | | 130,052 | |
| | 24,800 | | | Total SA ADR | | | 1,517,264 | |
| | 111,200 | | | Weatherford International, Ltd.d | | | 1,828,128 | |
| | 1,600 | | | Whiting Petroleum Corporationd | | | 107,024 | |
| | | | | |
| | | | Total | | | 26,486,550 | |
| | | | | |
| |
| Financials (4.3%) | | | | |
| | 15,510 | | | ACE, Ltd. | | | 1,480,274 | |
| | 4,300 | | | Aegon NV | | | 34,215 | |
| | 9,835 | | | Affiliated Managers Group, Inc.d | | | 1,941,822 | |
| | 4,770 | | | Allied World Assurance Company Holdings AG | | | 516,543 | |
| | 11,070 | | | Allstate Corporation | | | 587,374 | |
| | 10,010 | | | American Assets Trust, Inc. | | | 333,233 | |
| | 22,000 | | | American International Group, Inc. | | | 1,136,300 | |
| | 500 | | | Ameriprise Financial, Inc. | | | 50,270 | |
| | 5,500 | | | AmTrust Financial Services, Inc. | | | 210,980 | |
| | 7,320 | | | Aspen Insurance Holdings, Ltd. | | | 285,553 | |
| | 24,200 | | | Aviva plc | | | 173,731 | |
| | 8,300 | | | AXA SA | | | 206,799 | |
| | 12,300 | | | Axis Capital Holdings, Ltd. | | | 583,266 | |
| | 121,180 | | | Bank of America Corporation | | | 1,691,673 | |
The accompanying Notes to Financial Statements are an integral part of this schedule.
68
Moderately Aggressive Allocation Fund
Schedule of Investments as of October 31, 2013
| | | | | | | | |
| Shares | | | Common Stock (19.5%) | | Value | |
| Financials (4.3%) - continued | | | | |
| | 7,300 | | | Bankinter SA | | | $44,509 | |
| | 5,600 | | | Banner Corporation | | | 214,256 | |
| | 12,500 | | | Barclays plc | | | 52,594 | |
| | 13,800 | | | BBCN Bancorp, Inc. | | | 204,654 | |
| | 20,300 | | | Berkshire Hathaway, Inc.d | | | 2,336,124 | |
| | 3,100 | | | BNP Paribas SA | | | 228,698 | |
| | 6,800 | | | Camden Property Trust | | | 436,560 | |
| | 87,000 | | | CapitaMall Trust | | | 141,305 | |
| | 58,940 | | | Citigroup, Inc. | | | 2,875,093 | |
| | 3,759 | | | CNA Financial Corporation | | | 152,578 | |
| | 28,530 | | | CNO Financial Group, Inc. | | | 444,497 | |
| | 8,010 | | | Columbia Banking System, Inc. | | | 205,777 | |
| | 7,100 | | | Comerica, Inc. | | | 307,430 | |
| | 30,850 | | | Credit Suisse Group ADRd | | | 960,361 | |
| | 6,000 | | | Credit Suisse Group AGd | | | 186,648 | |
| | 1,100 | | | Daibiru Corporation | | | 14,018 | |
| | 41,810 | | | DCT Industrial Trust, Inc. | | | 324,028 | |
| | 11,000 | | | Deutsche Bank AG | | | 531,520 | |
| | 8,700 | | | Discover Financial Services | | | 451,356 | |
| | 6,625 | | | DnB ASA | | | 117,438 | |
| | 4,800 | | | Evercore Partners, Inc. | | | 242,256 | |
| | 6,080 | | | Extra Space Storage, Inc. | | | 279,619 | |
| | 46,400 | | | Fifth Third Bancorp | | | 882,992 | |
| | 38,400 | | | First Horizon National Corporation | | | 408,960 | |
| | 10,200 | | | First Industrial Realty Trust, Inc. | | | 184,314 | |
| | 15,200 | | | First Republic Bank | | | 776,264 | |
| | 11,100 | | | Franklin Street Properties Corporation | | | 146,520 | |
| | 11,400 | | | Fulton Financial Corporation | | | 139,194 | |
| | 6,000 | | | FXCM, Inc. | | | 98,340 | |
| | 7,500 | | | GAM Holding AGd | | | 140,144 | |
| | 10,400 | | | Grainger plc | | | 32,478 | |
| | 3,000 | | | Greenhill & Company, Inc. | | | 153,900 | |
| | 35,880 | | | Hanmi Financial Corporation | | | 627,182 | |
| | 21,962 | | | HCC Insurance Holdings, Inc. | | | 1,002,565 | |
| | 7,771 | | | Henderson Group plc | | | 26,674 | |
| | 19,000 | | | Henderson Land Development Company, Ltd. | | | 112,428 | |
| | 6,000 | | | Home Loan Servicing Solutions, Ltd. | | | 141,660 | |
| | 34,835 | | | Host Hotels & Resorts, Inc. | | | 646,189 | |
| | 101,100 | | | Huntington Bancshares, Inc. | | | 889,680 | |
| | 18,800 | | | Intermediate Capital Group plc | | | 144,265 | |
| | 3,600 | | | International Personal Finance plc | | | 33,270 | |
| | 28,090 | | | Invesco, Ltd. | | | 948,038 | |
| | 18,000 | | | iShares Barclays 1-3 Year Credit Bond Fund | | | 1,897,920 | |
| | 19,350 | | | iShares Russell 2000 Index Fund | | | 2,113,601 | |
| | 1,400 | | | iShares Russell 3000 Index Fund | | | 147,588 | |
| | 43,585 | | | J.P. Morgan Chase & Company | | | 2,246,371 | |
| | 3,800 | | | Japan Securities Finance Company, Ltd. | | | 27,871 | |
| | 3,100 | | | KBC Groep NV | | | 168,893 | |
| | 6,000 | | | Kerry Properties, Ltd. | | | 26,019 | |
| | 17,336 | | | Lazard, Ltd. | | | 670,036 | |
| | 159,400 | | | Lloyds TSB Group plcd | | | 197,147 | |
| | 5,500 | | | M&T Bank Corporation | | | 618,915 | |
| | 7,700 | | | Macerich Company | | | 455,917 | |
| | 4,100 | | | MasterCard, Inc. | | | 2,940,110 | |
| | 35,040 | | | MetLife, Inc. | | | 1,657,742 | |
| | 33,900 | | | Mitsubishi UFJ Financial Group, Inc. | | | 215,884 | |
| | 11,000 | | | Mitsui & Company, Ltd. | | | 157,145 | |
| | 3,000 | | | Mitsui Fudosan Company, Ltd. | | | 99,378 | |
| | 76,200 | | | Mizuho Financial Group, Inc. | | | 159,949 | |
| | 6,300 | | | Montpelier Re Holdings, Inc. | | | 173,943 | |
| | 38,240 | | | Morgan Stanley | | | 1,098,635 | |
| | 5,300 | | | MS and AD Insurance Group Holdings, Inc. | | | 137,044 | |
| | 3,300 | | | MSCI, Inc.d | | | 134,541 | |
| | 23,300 | | | NASDAQ OMX Group, Inc. | | | 825,519 | |
| | 4,300 | | | Nordea Bank AB | | | 55,004 | |
| | 28,700 | | | North Pacific Bank, Ltd. | | | 125,313 | |
| | 12,600 | | | Northern Trust Corporation | | | 710,892 | |
| | 8,000 | | | NTT Urban Development Corporation | | | 102,123 | |
| | 19,000 | | | Oversea-Chinese Banking Corporation, Ltd. | | | 158,944 | |
| | 16,480 | | | Parkway Properties, Inc. | | | 298,453 | |
| | 11,590 | | | Pebblebrook Hotel Trust | | | 350,018 | |
| | 27,100 | | | Piedmont Office Realty Trust, Inc. | | | 500,808 | |
| | 12,247 | | | Popular, Inc.d | | | 309,237 | |
| | 3,400 | | | Portfolio Recovery Associates, Inc.d | | | 202,130 | |
| | 5,500 | | | Progressive Corporation | | | 142,835 | |
| | 13,800 | | | Protective Life Corporation | | | 635,904 | |
| | 12,100 | | | Prudential Financial, Inc. | | | 984,819 | |
| | 7,800 | | | Prudential plc | | | 159,517 | |
| | 10,100 | | | Raymond James Financial, Inc. | | | 461,065 | |
| | 3,500 | | | SBI Holdings, Inc. | | | 42,357 | |
| | 6,000 | | | Shinsei Bank, Ltd. | | | 14,048 | |
| | 35,100 | | | SLM Corporation | | | 890,487 | |
| | 4,200 | | | Spar Nord Bank ASd | | | 37,521 | |
| | 29,400 | | | SPDR EURO STOXX 50 ETF | | | 1,199,226 | |
| | 53,700 | | | SPDR S&P 500 ETF Trust | | | 9,436,701 | |
| | 4,580 | | | SPDR S&P Biotech ETF | | | 544,974 | |
| | 12,600 | | | State Street Corporation | | | 882,882 | |
| | 5,890 | | | Stewart Information Services Corporation | | | 184,475 | |
| | 4,100 | | | Sumitomo Mitsui Financial Group, Inc. | | | 198,177 | |
| | 25,540 | | | SVB Financial Groupd | | | 2,446,221 | |
| | 400 | | | T. Rowe Price Group, Inc. | | | 30,964 | |
| | 3,542 | | | Taubman Centers, Inc. | | | 233,028 | |
| | 16,400 | | | TCF Financial Corporation | | | 248,952 | |
| | 27,110 | | | Terreno Realty Corporation | | | 482,016 | |
| | 13,150 | | | Texas Capital Bancshares, Inc.d | | | 684,458 | |
| | 5,500 | | | The Dai-Ichi Mutual Life Insurance Company, Ltd. | | | 78,517 | |
| | 16,900 | | | The Paragon Group Of Companies plc | | | 91,682 | |
| | 4,500 | | | Tokio Marine Holdings, Inc. | | | 147,530 | |
| | 3,000 | | | Tokyo Tatemono Company, Ltd. | | | 28,164 | |
| | 7,550 | | | Visa, Inc. | | | 1,484,859 | |
| | 21,073 | | | W.R. Berkley Corporation | | | 925,316 | |
| | 23,270 | | | Wells Fargo & Company | | | 993,396 | |
| | 55,938 | | | Zions Bancorporation | | | 1,586,961 | |
| | | | | |
| | | | Total | | | 71,778,551 | |
| | | | | |
| |
| Health Care (2.2%) | | | | |
| | 4,000 | | | Abbott Laboratories | | | 146,200 | |
| | 11,800 | | | Acorda Therapeutics, Inc.d | | | 361,198 | |
| | 200 | | | Actavis, Inc.d | | | 30,916 | |
| | 800 | | | Actelion, Ltd.d | | | 61,896 | |
| | 38,480 | | | Akorn, Inc.d | | | 786,531 | |
| | 25,580 | | | Align Technology, Inc.d | | | 1,459,595 | |
The accompanying Notes to Financial Statements are an integral part of this schedule.
69
Moderately Aggressive Allocation Fund
Schedule of Investments as of October 31, 2013
| | | | | | | | |
| Shares | | | Common Stock (19.5%) | | Value | |
| Health Care (2.2%) - continued | | | | |
| | 47,600 | | | Allscripts Healthcare Solutions, Inc.d | | | $658,308 | |
| | 3,700 | | | AmerisourceBergen Corporation | | | 241,721 | |
| | 19,630 | | | Baxter International, Inc. | | | 1,293,028 | |
| | 2,100 | | | Biogen Idec, Inc.d | | | 512,799 | |
| | 700 | | | BioMarin Pharmaceutical, Inc.d | | | 43,974 | |
| | 62,300 | | | BioScrip, Inc.d | | | 436,723 | |
| | 5,051 | | | C.R. Bard, Inc. | | | 688,047 | |
| | 2,100 | | | Catamaran Corporationd | | | 98,616 | |
| | 6,200 | | | Centene Corporationd | | | 348,192 | |
| | 600 | | | Cerner Corporationd | | | 33,618 | |
| | 2,600 | | | Charles River Laboratories International, Inc.d | | | 127,946 | |
| | 300 | | | CIGNA Corporation | | | 23,094 | |
| | 2,000 | | | Community Health Systems, Inc. | | | 87,260 | |
| | 57,670 | | | Covidien plc | | | 3,697,224 | |
| | 3,653 | | | Dechra Pharmaceuticals plc | | | 40,466 | |
| | 8,400 | | | DENTSPLY International, Inc. | | | 395,640 | |
| | 5,400 | | | Emeritus Corporationd | | | 103,464 | |
| | 600 | | | Envision Healthcare Holdings, Inc.d | | | 17,430 | |
| | 35,435 | | | ExamWorks Group, Inc.d | | | 915,995 | |
| | 37,700 | | | Express Scripts Holding Companyd | | | 2,357,004 | |
| | 44,300 | | | Gilead Sciences, Inc.d | | | 3,144,857 | |
| | 2,300 | | | GlaxoSmithKline plc | | | 60,634 | |
| | 6,100 | | | GN Store Nord AS | | | 139,158 | |
| | 400 | | | Hogy Medical Company, Ltd. | | | 23,274 | |
| | 700 | | | Hologic, Inc.d | | | 15,673 | |
| | 15,100 | | | Illumina, Inc.d | | | 1,412,001 | |
| | 9,400 | | | McKesson Corporation | | | 1,469,596 | |
| | 1,600 | | | Medidata Solutions, Inc.d | | | 176,496 | |
| | 43,240 | | | Merck & Company, Inc. | | | 1,949,692 | |
| | 900 | | | Merck KGaA | | | 149,716 | |
| | 200 | | | Mettler-Toledo International, Inc.d | | | 49,492 | |
| | 21,920 | | | Neurocrine Biosciences, Inc.d | | | 206,925 | |
| | 3,400 | | | Nobel Biocare Holding AGd | | | 56,091 | |
| | 5,100 | | | Novartis AG | | | 395,875 | |
| | 31,568 | | | NuVasive, Inc.d | | | 1,003,231 | |
| | 5,900 | | | PAREXEL International Corporationd | | | 269,689 | |
| | 42,080 | | | PDL BioPharma, Inc. | | | 340,427 | |
| | 9,400 | | | PerkinElmer, Inc. | | | 357,576 | |
| | 400 | | | Perrigo Company | | | 55,156 | |
| | 3,000 | | | Pfizer, Inc. | | | 92,040 | |
| | 24,000 | | | ResMed, Inc. | | | 1,241,760 | |
| | 1,400 | | | Roche Holding AG | | | 387,150 | |
| | 2,500 | | | Sanofi | | | 266,559 | |
| | 22,910 | | | Sanofi ADR | | | 1,225,227 | |
| | 9,700 | | | Seattle Genetics, Inc.d | | | 374,711 | |
| | 14,200 | | | Shire Pharmaceuticals Group plc ADR | | | 1,890,020 | |
| | 2,800 | | | Stada Arzneimittel AG | | | 160,950 | |
| | 2,600 | | | Terumo Corporation | | | 125,920 | |
| | 20,500 | | | Thoratec Corporationd | | | 885,395 | |
| | 7,600 | | | United Therapeutics Corporationd | | | 672,752 | |
| | 24,941 | | | UnitedHealth Group, Inc. | | | 1,702,473 | |
| | 550 | | | Veeva Systems, Inc.d | | | 21,400 | |
| | 9,700 | | | Waters Corporationd | | | 978,924 | |
| | 13,151 | | | Zimmer Holdings, Inc. | | | 1,150,318 | |
| | | | | |
| | | | Total | | | 37,418,043 | |
| | | | | |
| |
| Industrials (2.5%) | | | | |
| | 7,300 | | | 3M Company | | | 918,705 | |
| | 14,730 | | | Actuant Corporation | | | 553,259 | |
| | 8,820 | | | Acuity Brands, Inc. | | | 886,498 | |
| | 10,000 | | | ADT Corporation | | | 433,700 | |
| | 9,400 | | | AGCO Corporation | | | 548,772 | |
| | 8,900 | | | AMETEK, Inc. | | | 425,687 | |
| | 14,710 | | | Apogee Enterprises, Inc. | | | 460,129 | |
| | 1,800 | | | Arcadis NV | | | 56,517 | |
| | 2,300 | | | Armstrong World Industries, Inc.d | | | 122,889 | |
| | 13,200 | | | Ashtead Group plc | | | 138,709 | |
| | 9,600 | | | Avis Budget Group, Inc.d | | | 300,768 | |
| | 600 | | | B/E Aerospace, Inc.d | | | 48,696 | |
| | 5,000 | | | Babcock & Wilcox Company | | | 161,050 | |
| | 2,700 | | | Berendsen plc | | | 42,047 | |
| | 15,100 | | | Boeing Company | | | 1,970,550 | |
| | 9,746 | | | Briggs & Stratton Corporation | | | 178,742 | |
| | 14,800 | | | Carillion plc | | | 72,106 | |
| | 1,000 | | | Central Japan Railway Company | | | 129,672 | |
| | 12,700 | | | Chemring Group plc | | | 44,290 | |
| | 12,990 | | | CLARCOR, Inc. | | | 759,655 | |
| | 3,200 | | | Colfax Corporationd | | | 179,072 | |
| | 200 | | | Compagnie de Saint-Gobain | | | 10,498 | |
| | 700 | | | Cramo Oyj | | | 13,996 | |
| | 56,165 | | | CSX Corporation | | | 1,463,660 | |
| | 7,700 | | | Deluxe Corporation | | | 362,593 | |
| | 29,660 | | | DigitalGlobe, Inc.d | | | 943,781 | |
| | 8,600 | | | Dover Corporation | | | 789,394 | |
| | 35,063 | | | EMCOR Group, Inc. | | | 1,299,435 | |
| | 3,200 | | | EnerSys, Inc. | | | 212,320 | |
| | 1,700 | | | Esterline Technologies Corporationd | | | 136,272 | |
| | 1,600 | | | European Aeronautic Defence and Space Company | | | 109,640 | |
| | 15,500 | | | Exelis, Inc. | | | 255,595 | |
| | 900 | | | Expeditors International of Washington, Inc. | | | 40,761 | |
| | 400 | | | Fastenal Company | | | 19,920 | |
| | 8,200 | | | Ferrovial SA | | | 156,307 | |
| | 10,000 | | | Flowserve Corporation | | | 694,700 | |
| | 5,000 | | | Fluor Corporation | | | 371,100 | |
| | 800 | | | Fortune Brands Home and Security, Inc. | | | 34,464 | |
| | 23,000 | | | Foster Wheeler AGd | | | 620,770 | |
| | 24,410 | | | GATX Corporation | | | 1,258,335 | |
| | 11,400 | | | General Electric Company | | | 297,996 | |
| | 400 | | | Graco, Inc. | | | 30,904 | |
| | 35,420 | | | HNI Corporation | | | 1,376,067 | |
| | 28,266 | | | Honeywell International, Inc. | | | 2,451,510 | |
| | 2,900 | | | Huntington Ingalls Industries, Inc. | | | 207,495 | |
| | 1,000 | | | I.M.A. Industria Macchine Automatiche SPA | | | 34,270 | |
| | 3,500 | | | IHS, Inc.d | | | 381,675 | |
| | 25,100 | | | Ingersoll-Rand plc | | | 1,695,003 | |
| | 5,000 | | | ITE Group plc | | | 25,839 | |
| | 38,740 | | | Jacobs Engineering Group, Inc.d | | | 2,356,167 | |
| | 600 | | | JB Hunt Transport Services, Inc. | | | 45,018 | |
| | 5,000 | | | JM AB | | | 142,436 | |
| | 12,000 | | | Kamigumi Company, Ltd. | | | 104,380 | |
| | 400 | | | Kansas City Southern | | | 48,608 | |
| | 60,000 | | | Kawasaki Kisen Kaisha, Ltd. | | | 137,546 | |
| | 14,800 | | | KBR, Inc. | | | 511,192 | |
| | 5,000 | | | Keller Group plc | | | 84,259 | |
| | 5,300 | | | Koninklijke Philips NV | | | 187,307 | |
The accompanying Notes to Financial Statements are an integral part of this schedule.
70
Moderately Aggressive Allocation Fund
Schedule of Investments as of October 31, 2013
| | | | | | | | |
| Shares | | | Common Stock (19.5%) | | Value | |
| Industrials (2.5%) - continued | | | | |
| | 4,559 | | | Korn/Ferry Internationald | | | $108,504 | |
| | 3,000 | | | KUKA AG | | | 136,536 | |
| | 19,190 | | | Landstar System, Inc. | | | 1,061,015 | |
| | 1,400 | | | Lindsay Manufacturing Company | | | 106,414 | |
| | 2,900 | | | Lockheed Martin Corporation | | | 386,686 | |
| | 25,407 | | | Manitowoc Company, Inc. | | | 494,420 | |
| | 32,870 | | | Manpower, Inc. | | | 2,567,147 | |
| | 4,300 | | | Matson, Inc. | | | 116,487 | |
| | 12,400 | | | Mermaid Marine Australia, Ltd. | | | 43,930 | |
| | 1,200 | | | Mitsubishi Corporation | | | 24,277 | |
| | 8,800 | | | MRC Global, Inc.d | | | 245,960 | |
| | 600 | | | Nielsen Holdings NV | | | 23,664 | |
| | 3,800 | | | Northgate plc | | | 27,563 | |
| | 4,600 | | | Old Dominion Freight Line, Inc.d | | | 215,740 | |
| | 34,824 | | | Oshkosh Corporationd | | | 1,657,274 | |
| | 1,000 | | | Osterreichische Post Aktiengesellschaft | | | 46,893 | |
| | 6,764 | | | Parker Hannifin Corporation | | | 789,494 | |
| | 9,510 | | | Pentair, Ltd. | | | 638,026 | |
| | 9,700 | | | Quanta Services, Inc.d | | | 293,037 | |
| | 14,800 | | | Qube Holdings, Ltd. | | | 30,324 | |
| | 2,700 | | | Randstad Holding NV | | | 166,290 | |
| | 16,300 | | | Republic Airways Holdings, Inc.d | | | 192,014 | |
| | 1,000 | | | Robert Half International, Inc. | | | 38,530 | |
| | 1,000 | | | Rockwell Automation, Inc. | | | 110,410 | |
| | 400 | | | Roper Industries, Inc. | | | 50,724 | |
| | 6,800 | | | SAS ABd | | | 20,347 | |
| | 26,000 | | | Singapore Airport Terminal Services, Ltd. | | | 71,133 | |
| | 700 | | | SMC Corporation | | | 162,973 | |
| | 46,200 | | | Southwest Airlines Company | | | 795,564 | |
| | 12,300 | | | Spirit Airlines, Inc.d | | | 530,745 | |
| | 500 | | | Stericycle, Inc.d | | | 58,100 | |
| | 10,280 | | | Tennant Company | | | 623,893 | |
| | 20,000 | | | Tokyu Corporation | | | 136,201 | |
| | 10,400 | | | Union Pacific Corporation | | | 1,574,560 | |
| | 12,000 | | | United Rentals, Inc.d | | | 775,080 | |
| | 3,716 | | | United Stationers, Inc. | | | 165,139 | |
| | 2,200 | | | United Technologies Corporation | | | 233,750 | |
| | 12,600 | | | Wabash National Corporationd | | | 146,916 | |
| | | | | |
| | | | Total | | | 42,208,486 | |
| | | | | |
| |
| Information Technology (3.2%) | | | | |
| | 20,800 | | | Accenture plc | | | 1,528,800 | |
| | 25,600 | | | Activision Blizzard, Inc. | | | 425,984 | |
| | 1,100 | | | Agilent Technologies, Inc. | | | 55,836 | |
| | 8,300 | | | Alliance Data Systems Corporationd | | | 1,967,598 | |
| | 9,100 | | | Ambarella, Inc.d | | | 187,005 | |
| | 9,700 | | | Amdocs, Ltd. | | | 372,965 | |
| | 400 | | | Amphenol Corporation | | | 32,116 | |
| | 700 | | | ANSYS, Inc.d | | | 61,215 | |
| | 7,302 | | | Apple, Inc. | | | 3,814,200 | |
| | 57,478 | | | Applied Materials, Inc. | | | 1,025,982 | |
| | 11,200 | | | Arris Group, Inc.d | | | 200,032 | |
| | 2,400 | | | Aspen Technology, Inc.d | | | 91,752 | |
| | 172,540 | | | Atmel Corporationd | | | 1,256,091 | |
| | 16,200 | | | Autodesk, Inc.d | | | 646,542 | |
| | 9,500 | | | Avnet, Inc. | | | 377,150 | |
| | 53,900 | | | Brocade Communications Systems, Inc.d | | | 432,278 | |
| | 1,100 | | | Ciena Corporationd | | | 25,597 | |
| | 114,460 | | | Cisco Systems, Inc. | | | 2,575,350 | |
| | 10,483 | | | Citrix Systems, Inc.d | | | 595,225 | |
| | 1,500 | | | CommVault Systems, Inc.d | | | 117,120 | |
| | 44,581 | | | CoreLogic, Inc.d | | | 1,483,210 | |
| | 7,203 | | | DST Systems, Inc. | | | 610,598 | |
| | 23,934 | | | E2open, Inc.d | | | 538,515 | |
| | 10,249 | | | eBay, Inc.d | | | 540,225 | |
| | 500 | | | Ei Towers SPA | | | 20,903 | |
| | 4,200 | | | Ellie Mae, Inc.d | | | 121,380 | |
| | 36,400 | | | EMC Corporation | | | 876,148 | |
| | 550 | | | Euronet Worldwide, Inc.d | | | 23,870 | |
| | 400 | �� | | EVS Broadcast Equipment SA | | | 26,169 | |
| | 600 | | | F5 Networks, Inc.d | | | 48,906 | |
| | 45,300 | | | Facebook, Inc.d | | | 2,276,778 | |
| | 13,600 | | | Fairchild Semiconductor International, Inc.d | | | 172,312 | |
| | 2,100 | | | FEI Company | | | 187,068 | |
| | 4,600 | | | Fleetmatics Group plcd | | | 146,050 | |
| | 3,900 | | | FLIR Systems, Inc. | | | 111,072 | |
| | 6,100 | | | Gartner, Inc.d | | | 359,595 | |
| | 3,777 | | | Google, Inc.d | | | 3,892,501 | |
| | 14,820 | | | Guidewire Software, Inc.d | | | 751,670 | |
| | 100 | | | Inficon Holding AGd | | | 31,165 | |
| | 29,760 | | | Informatica Corporationd | | | 1,148,736 | |
| | 600 | | | Ingenico | | | 45,071 | |
| | 12,300 | | | InterDigital, Inc. | | | 476,625 | |
| | 3,800 | | | International Business Machines Corporation | | | 680,998 | |
| | 8,900 | | | InvenSense, Inc.d | | | 150,321 | |
| | 7,000 | | | Ixiad | | | 99,260 | |
| | 8,500 | | | j2 Global, Inc. | | | 467,330 | |
| | 25,221 | | | Juniper Networks, Inc.d | | | 470,119 | |
| | 10,000 | | | Laird plc | | | 40,004 | |
| | 900 | | | Lam Research Corporationd | | | 48,807 | |
| | 1,850 | | | Leidos Holdings, Inc. | | | 87,117 | |
| | 3,737 | | | Lexmark International, Inc. | | | 132,850 | |
| | 100 | | | LinkedIn Corporationd | | | 22,367 | |
| | 38,400 | | | Marvell Technology Group, Ltd. | | | 460,800 | |
| | 100 | | | Mercadolibre, Inc. | | | 13,464 | |
| | 3,876 | | | Micro Focus International plc | | | 50,802 | |
| | 1,000 | | | Microchip Technology, Inc. | | | 42,960 | |
| | 24,170 | | | Microsoft Corporation | | | 854,410 | |
| | 29,500 | | | Monster Worldwide, Inc.d | | | 127,440 | |
| | 4,200 | | | Morgan Advanced Materials plc | | | 20,488 | |
| | 49,980 | | | NetApp, Inc. | | | 1,939,724 | |
| | 6,000 | | | NeuStar, Inc.d | | | 275,520 | |
| | 300 | | | Nice Systems, Ltd. ADR | | | 11,754 | |
| | 600 | | | Nuance Communications, Inc.d | | | 9,336 | |
| | 75,507 | | | NVIDIA Corporation | | | 1,146,196 | |
| | 1,100 | | | NXP Semiconductors NVd | | | 46,332 | |
| | 9,100 | | | OmniVision Technologies, Inc.d | | | 127,491 | |
| | 17,930 | | | Plantronics, Inc. | | | 769,914 | |
| | 24,300 | | | QUALCOMM, Inc. | | | 1,688,121 | |
| | 14,300 | | | Red Hat, Inc.d | | | 618,761 | |
| | 3,478 | | | Salesforce.com, Inc.d | | | 185,586 | |
| | 5,000 | | | Sanmina Corporationd | | | 72,800 | |
| | 300 | | | ServiceNow, Inc.d | | | 16,383 | |
| | 19,100 | | | SunPower Corporationd | | | 576,629 | |
| | 73,950 | | | Symantec Corporation | | | 1,681,623 | |
| | 800 | | | Synopsys, Inc.d | | | 29,160 | |
| | 11,500 | | | Teradata Corporationd | | | 506,805 | |
| | 80,729 | | | Teradyne, Inc.d | | | 1,411,950 | |
| | 53,530 | | | Texas Instruments, Inc. | | | 2,252,542 | |
| | 11,600 | | | Trimble Navigation, Ltd.d | | | 331,412 | |
| | 56,625 | | | TriQuint Semiconductor, Inc.d | | | 449,036 | |
The accompanying Notes to Financial Statements are an integral part of this schedule.
71
Moderately Aggressive Allocation Fund
Schedule of Investments as of October 31, 2013
| | | | | | | | |
| Shares | | | Common Stock (19.5%) | | Value | |
| Information Technology (3.2%) - continued | | | | |
| | 15,810 | | | Ubiquiti Networks, Inc. | | | $609,950 | |
| | 700 | | | Unit4 NV | | | 32,999 | |
| | 800 | | | VeriFone Systems, Inc.d | | | 18,128 | |
| | 24,780 | | | Virtusa Corporationd | | | 770,162 | |
| | 56,630 | | | Vishay Intertechnology, Inc.d | | | 694,850 | |
| | 20,650 | | | VMware, Inc.d | | | 1,678,432 | |
| | 1,600 | | | Wincor Nixdorf AG | | | 105,790 | |
| | 54 | | | Workday, Inc.d | | | 4,043 | |
| | 1,800 | | | Xaar plc | | | 24,287 | |
| | 66,700 | | | Xerox Corporation | | | 662,998 | |
| | 34,161 | | | Xilinx, Inc. | | | 1,551,593 | |
| | | | | |
| | | | Total | | | 53,747,249 | |
| | | | | |
| |
| Materials (0.8%) | | | | |
| | 2,300 | | | AEP Industries, Inc.d | | | 136,666 | |
| | 400 | | | Airgas, Inc. | | | 43,628 | |
| | 300 | | | Albemarle Corporation | | | 19,857 | |
| | 4,600 | | | BHP Billiton, Ltd. | | | 162,626 | |
| | 16,940 | | | Celanese Corporation | | | 948,809 | |
| | 2,400 | | | CF Industries Holdings, Inc. | | | 517,440 | |
| | 14,160 | | | Dow Chemical Company | | | 558,895 | |
| | 7,300 | | | DS Smith plc | | | 35,383 | |
| | 11,400 | | | Eagle Materials, Inc. | | | 855,114 | |
| | 4,600 | | | Eastman Chemical Company | | | 362,434 | |
| | 400 | | | FMC Corporation | | | 29,104 | |
| | 28,390 | | | H.B. Fuller Company | | | 1,359,029 | |
| | 2,321 | | | Innophos Holdings, Inc. | | | 116,329 | |
| | 1,300 | | | JFE Holdings, Inc. | | | 29,555 | |
| | 30,900 | | | Louisiana-Pacific Corporationd | | | 525,609 | |
| | 26,080 | | | Materials Select Sector SPDR Fund | | | 1,141,522 | |
| | 4,900 | | | Nippon Paper Industries Company, Ltd. | | | 78,077 | |
| | 10,500 | | | Nucor Corporation | | | 543,585 | |
| | 18,000 | | | Owens-Illinois, Inc.d | | | 572,220 | |
| | 6,700 | | | Packaging Corporation of America | | | 417,276 | |
| | 4,000 | | | PPG Industries, Inc. | | | 730,320 | |
| | 4,700 | | | Schweitzer-Mauduit International, Inc. | | | 290,836 | |
| | 4,900 | | | Sigma-Aldrich Corporation | | | 423,507 | |
| | 12,050 | | | Silgan Holdings, Inc. | | | 543,093 | |
| | 500 | | | Silver Wheaton Corporation | | | 11,335 | |
| | 6,300 | | | Smurfit Kappa Group plc | | | 152,502 | |
| | 6,145 | | | Southern Copper Corporation | | | 171,753 | |
| | 42,188 | | | Steel Dynamics, Inc. | | | 758,118 | |
| | 17,000 | | | Stillwater Mining Companyd | | | 185,470 | |
| | 12,900 | | | Teck Resources, Ltd. | | | 344,946 | |
| | 3,500 | | | U.S. Silica Holdings, Inc. | | | 121,870 | |
| | 5,900 | | | Valspar Corporation | | | 412,823 | |
| | 3,600 | | | Worthington Industries, Inc. | | | 145,944 | |
| | | | | |
| | | | Total | | | 12,745,675 | |
| | | | | |
| |
| Telecommunications Services (0.2%) | | | | |
| | 34,500 | | | AT&T, Inc. | | | 1,248,900 | |
| | 33,052 | | | BT Group plc | | | 199,987 | |
| | 10,018 | | | Cogent Communications Group, Inc. | | | 351,932 | |
| | 5,700 | | | Freenet AGd | | | 148,057 | |
| | 16,200 | | | iiNet, Ltd. | | | 99,657 | |
| | 2,100 | | | Orange SA | | | 28,867 | |
| | 200 | | | SBA Communications Corporationd | | | 17,494 | |
| | 51,000 | | | Singapore Telecommunications, Ltd. | | | 154,876 | |
| | 33,900 | | | TalkTalk Telecom Group plc | | | 145,118 | |
| | 6,739 | | | Telenor ASA | | | 161,922 | |
| | 29,700 | | | Telstra Corporation, Ltd. | | | 145,331 | |
| | 700 | | | TW Telecom, Inc.d | | | 22,064 | |
| | 17,353 | | | Verizon Communications, Inc. | | | 876,500 | |
| | | | | |
| | | | Total | | | 3,600,705 | |
| | | | | |
| |
| Utilities (0.5%) | | | | |
| | 4,400 | | | Calpine Corporationd | | | 88,748 | |
| | 22,300 | | | CMS Energy Corporation | | | 612,358 | |
| | 40,200 | | | Electricidade de Portugal SA | | | 147,978 | |
| | 7,000 | | | Gas Natural SDG SA | | | 165,104 | |
| | 4,200 | | | Kansai Electric Power Company, Inc.d | | | 53,159 | |
| | 32,980 | | | NiSource, Inc. | | | 1,039,529 | |
| | 17,280 | | | NorthWestern Corporation | | | 792,115 | |
| | 30,720 | | | PG&E Corporation | | | 1,285,632 | |
| | 33,030 | | | PNM Resources, Inc. | | | 790,078 | |
| | 16,500 | | | Power Assets Holdings, Ltd. | | | 137,465 | |
| | 15,800 | | | Public Service Enterprise Group, Inc. | | | 529,300 | |
| | 12,500 | | | Southern Company | | | 511,375 | |
| | 17,022 | | | Southwest Gas Corporation | | | 923,614 | |
| | 113,200 | | | SP AusNet | | | 133,726 | |
| | 20,300 | | | Wisconsin Energy Corporation | | | 854,833 | |
| | | | | |
| | | | Total | | | 8,065,014 | |
| | | | | |
| | | | | | | | |
| | | | | |
| | | | Total Common Stock (cost $261,264,612) | | | 324,860,770 | |
| | | | | |
| | |
Principal
Amount | | | Long-Term Fixed Income (8.2%) | | Value | |
| Asset-Backed Securities (0.7%) | | | | |
| | | | Access Group, Inc. | | | | |
| | 276,308 | | | 0.670%, 2/25/2036f,g | | | 274,923 | |
| | | | Ally Auto Receivables Trust 2013- SN1 | | | | |
| | 360,000 | | | 0.720%, 5/20/2016 | | | 359,361 | |
| | | | Avis Budget Rental Car Funding AESOP, LLC | | | | |
| | 177,540 | | | 2.370%, 11/20/2014f | | | 179,939 | |
| | | | Countrywide Asset-Backed Certificates | | | | |
| | 330,336 | | | 5.530%, 4/25/2047 | | | 304,549 | |
| | | | DT Auto Owner Trust | | | | |
| | 109,256 | | | 0.750%, 5/16/2016f | | | 109,283 | |
| | | | Edlinc Student Loan Funding Trust | | | | |
| | 204,408 | | | 3.170%, 10/1/2025g,h | | | 202,363 | |
| | | | Enterprise Fleet Financing, LLC | | | | |
| | 150,000 | | | 1.060%, 3/20/2019f | | | 150,298 | |
| | | | Federal National Mortgage Association | | | | |
| | 286,700 | | | 0.595%, 8/25/2015 | | | 286,038 | |
| | | | FirstEnergy Ohio PIRB Special Purpose Trust 2013 | | | | |
| | 360,000 | | | 0.679%, 1/15/2019 | | | 359,848 | |
| | | | FNA Trust | | | | |
| | 231,134 | | | 1.980%, 1/10/2018h | | | 229,256 | |
The accompanying Notes to Financial Statements are an integral part of this schedule.
72
Moderately Aggressive Allocation Fund
Schedule of Investments as of October 31, 2013
| | | | | | | | |
Principal
Amount | | | Long-Term Fixed Income (8.2%) | | Value | |
| Asset-Backed Securities (0.7%) - continued | | | | |
| | | | GE Dealer Floorplan Master Note Trust | | | | |
| | $360,000 | | | 0.573%, 4/20/2018g | | | $359,236 | |
| | | | GE Equipment Transportation, LLC | | | | |
| | 300,000 | | | 0.690%, 11/25/2016 | | | 299,742 | |
| | | | Golden Credit Card Trust | | | | |
| | 240,000 | | | 0.424%, 2/15/2018f,g | | | 239,389 | |
| | 250,000 | | | 0.636%, 9/15/2018f,g | | | 250,000 | |
| | | | HLSS Servicer Advance Receivables Backed Notes | | | | |
| | 275,000 | | | 1.287%, 9/15/2044f | | | 275,138 | |
| | | | Hyundai Auto Receivables Trust | | | | |
| | 360,000 | | | 0.710%, 9/15/2017 | | | 360,551 | |
| | | | Hyundai Floorplan Master Owner Trust | | | | |
| | 405,000 | | | 0.524%, 5/15/2018f,g | | | 405,526 | |
| | | | Master Credit Card Trust | | | | |
| | 244,200 | | | 0.780%, 4/21/2017f | | | 243,977 | |
| | | | Morgan Stanley Capital, Inc. | | | | |
| | 585,626 | | | 0.320%, 2/25/2037g | | | 314,950 | |
| | | | Motor plc | | | | |
| | 448,000 | | | 0.670%, 2/15/2021f | | | 447,979 | |
| | | | Nationstar Mortgage Advance Receivable Trust | | | | |
| | 360,000 | | | 1.080%, 6/20/2044f | | | 359,759 | |
| | | | Nissan Master Owner Trust Receivables | | | | |
| | 400,000 | | | 0.474%, 2/15/2018g | | | 399,537 | |
| | | | Renaissance Home Equity Loan Trust | | | | |
| | 3,099,120 | | | 5.746%, 5/25/2036 | | | 2,326,116 | |
| | 1,780,000 | | | 6.011%, 5/25/2036 | | | 1,297,116 | |
| | | | Santander Drive Auto Receivables Trust | | | | |
| | 300,000 | | | 0.700%, 9/15/2017 | | | 299,786 | |
| | | | SLM Student Loan Trust | | | | |
| | 172,264 | | | 0.774%, 8/15/2022f,g | | | 171,733 | |
| | 200,000 | | | 1.224%, 5/17/2027f,g | | | 197,771 | |
| | | | Volvo Financial Equipment, LLC | | | | |
| | 300,000 | | | 0.740%, 3/15/2017f | | | 299,799 | |
| | | | World Financial Network Credit Card Master Trust | | | | |
| | 300,000 | | | 0.910%, 3/16/2020 | | | 298,435 | |
| | | | World Omni Automobile Lease Securitization Trust | | | | |
| | 275,000 | | | 1.400%, 2/15/2019 | | | 277,136 | |
| | | | World Omni Master Owner Trust | | | | |
| | 240,000 | | | 0.524%, 2/15/2018f,g | | | 239,723 | |
| | | | | |
| | | | Total | | | 11,819,257 | |
| | | | | |
| |
| Basic Materials (0.1%) | | | | |
| | | | Barrick Gold Corporation | | | | |
| | 30,000 | | | 2.900%, 5/30/2016 | | | 30,752 | |
| | | | FMG Resources Pty. Ltd. | | | | |
| | 548,154 | | | 6.875%, 2/1/2018f,i | | | 581,043 | |
| | | | Freeport-McMoRan Copper & Gold, Inc. | | | | |
| | 156,000 | | | 2.375%, 3/15/2018 | | | 155,574 | |
| | | | Glencore Funding, LLC | | | | |
| | 48,000 | | | 1.700%, 5/27/2016f | | | 47,801 | |
| | | | Hexion US Finance Corporation/Hexion Nova Scotia Finance ULC | | | | |
| | 275,000 | | | 8.875%, 2/1/2018 | | | 283,250 | |
| | | | Ineos Finance plc | | | | |
| | 275,000 | | | 7.500%, 5/1/2020f | | | 300,438 | |
| | | | Inmet Mining Corporation | | | | |
| | 275,000 | | | 7.500%, 6/1/2021f | | | 291,500 | |
| | | | International Paper Company | | | | |
| | 53,000 | | | 5.300%, 4/1/2015 | | | 56,175 | |
| | | | LyondellBasell Industries NV | | | | |
| | 80,000 | | | 6.000%, 11/15/2021 | | | 93,080 | |
| | | | Rio Tinto Finance USA plc | | | | |
| | 60,000 | | | 1.375%, 6/17/2016 | | | 60,368 | |
| | | | Xstrata Finance Canada, Ltd. | | | | |
| | 234,000 | | | 2.050%, 10/23/2015f | | | 235,853 | |
| | | | | |
| | | | Total | | | 2,135,834 | |
| | | | | |
| |
| Capital Goods (0.1%) | | | | |
| | | | BAE Systems plc | | | | |
| | 46,000 | | | 3.500%, 10/11/2016f | | | 48,135 | |
| | | | CNH Capital, LLC | | | | |
| | 275,000 | | | 3.625%, 4/15/2018 | | | 278,781 | |
| | | | Eaton Corporation | | | | |
| | 27,000 | | | 1.500%, 11/2/2017f | | | 26,730 | |
| | 40,000 | | | 4.000%, 11/2/2032f | | | 37,048 | |
| | | | John Deere Capital Corporation | | | | |
| | 180,000 | | | 0.314%, 1/12/2015g | | | 180,007 | |
| | | | Northrop Grumman Corporation | | | | |
| | 75,000 | | | 1.750%, 6/1/2018 | | | 73,890 | |
| | | | Reynolds Group Issuer, Inc. | | | | |
| | 273,154 | | | 5.750%, 10/15/2020 | | | 282,032 | |
| | | | Roper Industries, Inc. | | | | |
| | 70,000 | | | 2.050%, 10/1/2018 | | | 69,125 | |
| | | | RSC Equipment Rental, Inc. | | | | |
| | 275,000 | | | 8.250%, 2/1/2021 | | | 311,437 | |
| | | | Textron, Inc. | | | | |
| | 60,000 | | | 5.600%, 12/1/2017 | | | 66,688 | |
| | | | | |
| | | | Total | | | 1,373,873 | |
| | | | | |
| |
| Collateralized Mortgage Obligations (0.4%) | | | | |
| | | | Citigroup Mortgage Loan Trust, Inc. | | | | |
| | 313,430 | | | 5.500%, 11/25/2035 | | | 283,269 | |
| | | | CitiMortgage Alternative Loan Trust | | | | |
| | 1,020,377 | | | 5.750%, 4/25/2037 | | | 869,317 | |
| | | | Countrywide Alternative Loan Trust | | | | |
| | 321,843 | | | 5.064%, 10/25/2035 | | | 259,564 | |
| | 173,340 | | | 6.500%, 8/25/2036 | | | 118,814 | |
| | 197,768 | | | 6.000%, 1/25/2037 | | | 157,847 | |
| | 886,079 | | | 5.500%, 5/25/2037 | | | 737,291 | |
| | 682,374 | | | 7.000%, 10/25/2037 | | | 456,233 | |
| | | | Countrywide Home Loans, Inc. | | | | |
| | 391,572 | | | 5.750%, 4/25/2037 | | | 347,378 | |
| | | | Deutsche Alt-A Securities Mortgage Loan Trust | | | | |
| | 145,711 | | | 5.500%, 10/25/2021 | | | 139,581 | |
| | | | Deutsche Alt-A Securities, Inc. | | | | |
| | 315,573 | | | 6.000%, 10/25/2021 | | | 295,381 | |
The accompanying Notes to Financial Statements are an integral part of this schedule.
73
Moderately Aggressive Allocation Fund
Schedule of Investments as of October 31, 2013
| | | | | | | | |
Principal Amount | | | Long-Term Fixed Income (8.2%) | | Value | |
| Collateralized Mortgage Obligations (0.4%) - continued | | | | |
| | | | Federal Home Loan Mortgage Corporation | | | | |
| | $573,120 | | | 3.000%, 2/15/2033j | | | $90,298 | |
| | | | Federal National Mortgage Association | | | | |
| | 1,277,033 | | | 3.500%, 1/25/2033j | | | 217,502 | |
| | | | J.P. Morgan Mortgage Trust | | | | |
| | 91,417 | | | 2.679%, 10/25/2036 | | | 73,647 | |
| | 856,199 | | | 0.550%, 1/25/2037g | | | 560,811 | |
| | 902,914 | | | 6.250%, 8/25/2037 | | | 633,247 | |
| | | | MASTR Alternative Loans Trust | | | | |
| | 228,685 | | | 6.500%, 7/25/2034 | | | 228,852 | |
| | 462,929 | | | 0.620%, 12/25/2035g | | | 253,125 | |
| | | | Merrill Lynch Alternative Note Asset Trust | | | | |
| | 228,030 | | | 6.000%, 3/25/2037 | | | 192,820 | |
| | | | Residential Asset Securitization Trust | | | | |
| | 642,515 | | | 0.550%, 8/25/2037g | | | 200,156 | |
| | | | Sequoia Mortgage Trust | | | | |
| | 689,380 | | | 2.631%, 9/20/2046 | | | 488,530 | |
| | | | WaMu Mortgage Pass Through Certificates | | | | |
| | 151,052 | | | 2.375%, 9/25/2036 | | | 131,983 | |
| | 307,604 | | | 2.425%, 10/25/2036 | | | 264,043 | |
| | | | | |
| | | | Total | | | 6,999,689 | |
| | | | | |
| |
| Commercial Mortgage-Backed Securities (0.9%) | | | | |
| | | | Banc of America Commercial Mortgage, Inc. | | | | |
| | 1,400,000 | | | 5.623%, 4/10/2049 | | | 1,568,365 | |
| | 2,550,000 | | | 5.559%, 6/10/2049 | | | 2,841,417 | |
| | | | Bear Stearns Commercial Mortgage Securities, Inc. | | | | |
| | 1,500,000 | | | 5.331%, 2/11/2044 | | | 1,647,390 | |
| | | | CGBAM Commercial Mortgage Trust | | | | |
| | 210,000 | | | 1.283%, 5/15/2030f,g | | | 209,209 | |
| | | | Commercial Mortgage Pass-Through Certificates | | | | |
| | 360,000 | | | 1.224%, 6/8/2030f,g | | | 358,192 | |
| | | | Credit Suisse First Boston Mortgage Securities | | | | |
| | 1,300,000 | | | 5.542%, 1/15/2049 | | | 1,444,278 | |
| | | | Credit Suisse Mortgage Capital Certificates | | | | |
| | 1,625,000 | | | 5.509%, 9/15/2039 | | | 1,757,005 | |
| | | | Federal Home Loan Mortgage Corporation Multi Family Structured Pass Thru Certificates | | | | |
| | 388,966 | | | 0.727%, 12/25/2016 | | | 386,925 | |
| | | | Greenwich Capital Commercial Funding Corporation | | | | |
| | 900,000 | | | 5.867%, 12/10/2049 | | | 993,507 | |
| | | | J.P. Morgan Chase Commercial Mortgage Securities Corporation | | | | |
| | 240,000 | | | 0.874%, 4/15/2028f,g | | | 239,202 | |
| | 750,000 | | | 5.706%, 2/12/2049 | | | 807,722 | |
| | | | Morgan Stanley Capital, Inc. | | | | |
| | 450,000 | | | 5.406%, 3/15/2044 | | | 486,471 | |
| | | | Wachovia Bank Commercial Mortgage Trust | | | | |
| | 1,050,000 | | | 5.603%, 10/15/2048 | | | 1,142,313 | |
| | | | | |
| | | | Total | | | 13,881,996 | |
| | | | | |
| |
| Communications Services (0.3%) | | | | |
| | | | AMC Networks, Inc. | | | | |
| | 275,000 | | | 4.750%, 12/15/2022 | | | 266,063 | |
| | | | America Movil SAB de CV | | | | |
| | 72,000 | | | 1.256%, 9/12/2016g | | | 72,628 | |
| | 72,000 | | | 5.000%, 10/16/2019 | | | 79,414 | |
| | | | American Tower Corporation | | | | |
| | 48,000 | | | 5.050%, 9/1/2020 | | | 50,707 | |
| | | | AT&T, Inc. | | | | |
| | 48,000 | | | 2.400%, 8/15/2016 | | | 49,654 | |
| | 82,000 | | | 5.800%, 2/15/2019 | | | 95,206 | |
| | | | British Telecommunications plc | | | | |
| | 60,000 | | | 1.625%, 6/28/2016 | | | 60,794 | |
| | | | CBS Corporation | | | | |
| | 54,000 | | | 8.875%, 5/15/2019 | | | 69,347 | |
| | | | CC Holdings GS V, LLC | | | | |
| | 52,000 | | | 2.381%, 12/15/2017 | | | 51,476 | |
| | | | CCO Holdings, LLC | | | | |
| | 275,000 | | | 7.375%, 6/1/2020 | | | 300,437 | |
| | | | CenturyLink, Inc. | | | | |
| | 275,000 | | | 5.625%, 4/1/2020 | | | 279,469 | |
| | | | Comcast Corporation | | | | |
| | 35,000 | | | 4.650%, 7/15/2042 | | | 34,098 | |
| | | | Cox Communications, Inc. | | | | |
| | 70,000 | | | 9.375%, 1/15/2019f | | | 89,598 | |
| | | | Crown Castle Towers, LLC | | | | |
| | 45,000 | | | 4.174%, 8/15/2017f | | | 48,233 | |
| | | | DIRECTV Holdings, LLC | | | | |
| | 48,000 | | | 2.400%, 3/15/2017 | | | 48,823 | |
| | 54,000 | | | 1.750%, 1/15/2018 | | | 52,774 | |
| | 50,000 | | | 5.875%, 10/1/2019 | | | 56,595 | |
| | | | Hughes Satellite Systems Corporation | | | | |
| | 275,000 | | | 6.500%, 6/15/2019 | | | 294,937 | |
| | | | Intelsat Jackson Holdings SA | | | | |
| | 275,000 | | | 7.250%, 4/1/2019 | | | 296,312 | |
| | | | Level 3 Financing, Inc. | | | | |
| | 275,000 | | | 8.625%, 7/15/2020 | | | 311,438 | |
| | | | NBC Universal Enterprise, Inc. | | | | |
| | 180,000 | | | 0.929%, 4/15/2018f,g | | | 181,071 | |
| | | | NBC Universal Media, LLC | | | | |
| | 82,000 | | | 2.875%, 4/1/2016 | | | 86,013 | |
| | | | Nippon Telegraph & Telephone Corporation | | | | |
| | 51,000 | | | 1.400%, 7/18/2017 | | | 50,888 | |
| | | | SBA Tower Trust | | | | |
| | 50,000 | | | 5.101%, 4/17/2017f | | | 54,074 | |
| | | | Sprint Nextel Corporation | | | | |
| | 273,154 | | | 9.000%, 11/15/2018f | | | 331,199 | |
| | | | Telefonica Emisiones SAU | | | | |
| | 56,000 | | | 3.729%, 4/27/2015 | | | 57,903 | |
| | | | Univision Communications, Inc. | | | | |
| | 275,000 | | | 6.875%, 5/15/2019f | | | 296,312 | |
| | | | UPCB Finance V, Ltd. | | | | |
| | 275,000 | | | 7.250%, 11/15/2021f | | | 301,812 | |
The accompanying Notes to Financial Statements are an integral part of this schedule.
74
Moderately Aggressive Allocation Fund
Schedule of Investments as of October 31, 2013
| | | | | | | | |
Principal
Amount | | | Long-Term Fixed Income (8.2%) | | Value | |
| Communications Services (0.3%) - continued | | | | |
| | | | Verizon Communications, Inc. | | | | |
| | $96,000 | | | 2.500%, 9/15/2016 | | | $99,620 | |
| | 41,000 | | | 1.100%, 11/1/2017 | | | 39,883 | |
| | 46,000 | | | 5.500%, 2/15/2018 | | | 52,384 | |
| | 48,000 | | | 2.002%, 9/14/2018g | | | 50,678 | |
| | 24,000 | | | 3.650%, 9/14/2018 | | | 25,525 | |
| | 72,000 | | | 6.400%, 9/15/2033 | | | 81,495 | |
| | 24,000 | | | 6.550%, 9/15/2043 | | | 27,845 | |
| | | | Vodafone Group plc | | | | |
| | 33,000 | | | 0.648%, 2/19/2016g | | | 32,997 | |
| | | | Wind Acquisition Finance SA | | | | |
| | 275,000 | | | 11.750%, 7/15/2017f | | | 292,187 | |
| | | | | |
| | | | Total | | | 4,669,889 | |
| | | | | |
| |
| Consumer Cyclical (0.2%) | | | | |
| | | | Amazon.com, Inc. | | | | |
| | 27,000 | | | 1.200%, 11/29/2017 | | | 26,492 | |
| | | | Chrysler Group, LLC | | | | |
| | 275,000 | | | 8.000%, 6/15/2019 | | | 304,562 | |
| | | | Cinemark USA, Inc. | | | | |
| | 275,000 | | | 4.875%, 6/1/2023 | | | 261,937 | |
| | | | Daimler Finance North America, LLC | | | | |
| | 150,000 | | | 1.125%, 8/1/2018f,g | | | 150,832 | |
| | | | Federated Retail Holdings, Inc. | | | | |
| | 34,000 | | | 5.900%, 12/1/2016 | | | 38,348 | |
| | | | Ford Motor Company | | | | |
| | 31,000 | | | 7.450%, 7/16/2031 | | | 38,687 | |
| | | | Ford Motor Credit Company, LLC | | | | |
| | 83,000 | | | 12.000%, 5/15/2015 | | | 96,575 | |
| | 180,000 | | | 1.516%, 5/9/2016g | | | 182,455 | |
| | 50,000 | | | 1.700%, 5/9/2016 | | | 50,448 | |
| | 60,000 | | | 2.375%, 1/16/2018 | | | 60,343 | |
| | 50,000 | | | 5.000%, 5/15/2018 | | | 55,408 | |
| | | | Gap, Inc. | | | | |
| | 52,000 | | | 5.950%, 4/12/2021 | | | 57,712 | |
| | | | General Motors Company | | | | |
| | 72,000 | | | 3.500%, 10/2/2018f | | | 73,440 | |
| | 48,000 | | | 4.875%, 10/2/2023f | | | 48,600 | |
| | | | General Motors Financial Company, Inc. | | | | |
| | 42,000 | | | 2.750%, 5/15/2016f | | | 42,315 | |
| | 275,000 | | | 3.250%, 5/15/2018f | | | 273,969 | |
| | | | Home Depot, Inc. | | | | |
| | 48,000 | | | 4.875%, 2/15/2044 | | | 49,602 | |
| | | | Hyundai Capital America | | | | |
| | 54,000 | | | 1.625%, 10/2/2015f | | | 54,353 | |
| | | | Jaguar Land Rover Automotive plc | | | | |
| | 275,000 | | | 5.625%, 2/1/2023f | | | 272,937 | |
| | | | L Brands, Inc. | | | | |
| | 275,000 | | | 5.625%, 2/15/2022 | | | 283,250 | |
| | | | Lennar Corporation | | | | |
| | 275,000 | | | 4.125%, 12/1/2018 | | | 275,688 | |
| | | | Macy’s Retail Holdings, Inc. | | | | |
| | 27,000 | | | 3.875%, 1/15/2022 | | | 26,964 | |
| | 20,000 | | | 4.375%, 9/1/2023 | | | 20,331 | |
| | | | Toll Brothers Finance Corporation | | | | |
| | 42,000 | | | 8.910%, 10/15/2017 | | | 50,820 | |
| | 21,000 | | | 4.375%, 4/15/2023 | | | 19,792 | |
| | | | Toyota Motor Credit Corporation | | | | |
| | 240,000 | | | 0.553%, 5/17/2016g | | | 240,546 | |
| | 35,000 | | | 1.750%, 5/22/2017 | | | 35,543 | |
| | | | TRW Automotive, Inc. | | | | |
| | 28,000 | | | 7.250%, 3/15/2017f | | | 32,130 | |
| | | | Viacom, Inc. | | | | |
| | 36,000 | | | 2.500%, 9/1/2018 | | | 36,374 | |
| | | | Walgreen Company | | | | |
| | 80,000 | | | 5.250%, 1/15/2019 | | | 90,648 | |
| | | | Western Union Company | | | | |
| | 54,000 | | | 2.375%, 12/10/2015 | | | 55,257 | |
| | | | Wynn Las Vegas, LLC | | | | |
| | 275,000 | | | 5.375%, 3/15/2022i | | | 282,923 | |
| | | | | |
| | | | Total | | | 3,589,281 | |
| | | | | |
| |
| Consumer Non-Cyclical (0.3%) | | | | |
| | | | AbbVie, Inc. | | | | |
| | 27,000 | | | 1.750%, 11/6/2017 | | | 27,082 | |
| | | | Altria Group, Inc. | | | | |
| | 56,000 | | | 9.700%, 11/10/2018 | | | 75,200 | |
| | 72,000 | | | 4.000%, 1/31/2024 | | | 72,270 | |
| | | | Anheuser-Busch InBev Worldwide, Inc. | | | | |
| | 91,000 | | | 7.750%, 1/15/2019 | | | 115,244 | |
| | | | Avon Products, Inc. | | | | |
| | 21,000 | | | 2.375%, 3/15/2016 | | | 21,436 | |
| | | | Biomet, Inc. | | | | |
| | 275,000 | | | 6.500%, 8/1/2020 | | | 292,188 | |
| | | | Boston Scientific Corporation | | | | |
| | 57,000 | | | 6.000%, 1/15/2020 | | | 66,446 | |
| | | | Bunge Limited Finance Corporation | | | | |
| | 28,000 | | | 3.200%, 6/15/2017 | | | 29,154 | |
| | 33,000 | | | 8.500%, 6/15/2019 | | | 41,222 | |
| | | | Celgene Corporation | | | | |
| | 66,000 | | | 1.900%, 8/15/2017 | | | 66,575 | |
| | 24,000 | | | 2.300%, 8/15/2018 | | | 24,172 | |
| | | | CHS/Community Health Systems, Inc. | | | | |
| | 275,000 | | | 7.125%, 7/15/2020 | | | 289,438 | |
| | | | ConAgra Foods, Inc. | | | | |
| | 75,000 | | | 1.900%, 1/25/2018 | | | 74,483 | |
| | | | Coventry Health Care, Inc. | | | | |
| | 90,000 | | | 5.950%, 3/15/2017 | | | 102,313 | |
| | | | CVS Caremark Corporation | | | | |
| | 34,000 | | | 6.125%, 9/15/2039 | | | 39,263 | |
| | | | Edwards Lifesciences Corporation | | | | |
| | 48,000 | | | 2.875%, 10/15/2018 | | | 48,184 | |
| | | | Endo Pharmaceuticals Holdings, Inc. | | | | |
| | 275,000 | | | 7.000%, 7/15/2019 | | | 293,562 | |
| | | | Express Scripts Holding Company | | | | |
| | 56,000 | | | 3.125%, 5/15/2016 | | | 58,767 | |
| | | | Fresenius Medical Care US Finance II, Inc. | | | | |
| | 275,000 | | | 5.875%, 1/31/2022f | | | 291,500 | |
| | | | Gilead Sciences, Inc. | | | | |
| | 45,000 | | | 2.400%, 12/1/2014 | | | 45,841 | |
| | 49,000 | | | 3.050%, 12/1/2016 | | | 51,808 | |
| | | | Hawk Acquisition Sub, Inc. | | | | |
| | 273,154 | | | 4.250%, 10/15/2020f | | | 264,277 | |
| | | | Heineken NV | | | | |
| | 27,000 | | | 1.400%, 10/1/2017f | | | 26,674 | |
The accompanying Notes to Financial Statements are an integral part of this schedule.
75
Moderately Aggressive Allocation Fund
Schedule of Investments as of October 31, 2013
| | | | | | | | |
Principal
Amount | | | Long-Term Fixed Income (8.2%) | | Value | |
| Consumer Non-Cyclical (0.3%) - continued | | | | |
| | | | IMS Health, Inc. | | | | |
| | $360,000 | | | 6.000%, 11/1/2020f | | | $374,400 | |
| | | | Kraft Foods, Inc. | | | | |
| | 60,000 | | | 6.500%, 8/11/2017 | | | 70,006 | |
| | | | Lorillard Tobacco Company | | | | |
| | 56,000 | | | 2.300%, 8/21/2017i | | | 56,567 | |
| | 60,000 | | | 8.125%, 6/23/2019 | | | 74,035 | |
| | | | Mallinckrodt International Finance SA | | | | |
| | 45,000 | | | 3.500%, 4/15/2018f | | | 44,924 | |
| | | | Mattel, Inc. | | | | |
| | 44,000 | | | 1.700%, 3/15/2018 | | | 43,413 | |
| | | | Medco Health Solutions, Inc. | | | | |
| | 66,000 | | | 7.125%, 3/15/2018 | | | 79,472 | |
| | | | Merck & Company, Inc. | | | | |
| | 240,000 | | | 0.623%, 5/18/2018g | | | 240,755 | |
| | | | Mylan, Inc. | | | | |
| | 75,000 | | | 1.800%, 6/24/2016f | | | 75,547 | |
| | 54,000 | | | 7.875%, 7/15/2020f | | | 61,823 | |
| | | | PepsiCo, Inc. | | | | |
| | 180,000 | | | 0.472%, 2/26/2016g | | | 180,085 | |
| | | | Pernod Ricard SA | | | | |
| | 50,000 | | | 2.950%, 1/15/2017f | | | 52,170 | |
| | 37,000 | | | 5.750%, 4/7/2021f | | | 41,466 | |
| | | | Roche Holdings, Inc. | | | | |
| | 21,000 | | | 7.000%, 3/1/2039f | | | 28,312 | |
| | | | SABMiller Holdings, Inc. | | | | |
| | 69,000 | | | 2.450%, 1/15/2017f | | | 71,253 | |
| | 75,000 | | | 3.750%, 1/15/2022f | | | 76,897 | |
| | | | Safeway, Inc. | | | | |
| | 21,000 | | | 3.400%, 12/1/2016 | | | 21,671 | |
| | 63,000 | | | 5.000%, 8/15/2019 | | | 65,098 | |
| | | | Spectrum Brands Escrow Corporation | | | | |
| | 275,000 | | | 6.375%, 11/15/2020f | | | 292,187 | |
| | | | Tyson Foods, Inc. | | | | |
| | 70,000 | | | 4.500%, 6/15/2022 | | | 72,601 | |
| | | | Valeant Pharmaceuticals International | | | | |
| | 275,000 | | | 6.875%, 12/1/2014f | | | 293,906 | |
| | | | Watson Pharmaceuticals, Inc. | | | | |
| | 84,000 | | | 1.875%, 10/1/2017 | | | 83,792 | |
| | | | WM Wrigley Jr. Company | | | | |
| | 125,000 | | | 1.400%, 10/21/2016f | | | 125,775 | |
| | 60,000 | | | 2.000%, 10/20/2017f | | | 60,523 | |
| | | | | |
| | | | Total | | | 5,003,777 | |
| | | | | |
| |
| Energy (0.2%) | | | | |
| | | | BP Capital Markets plc | | | | |
| | 180,000 | | | 1.846%, 5/5/2017 | | | 183,098 | |
| | 81,000 | | | 1.375%, 11/6/2017 | | | 80,511 | |
| | 48,000 | | | 2.241%, 9/26/2018 | | | 48,489 | |
| | | | CNOOC, Ltd. | | | | |
| | 75,000 | | | 1.125%, 5/9/2016 | | | 74,555 | |
| | | | Concho Resources, Inc. | | | | |
| | 273,154 | | | 5.500%, 10/1/2022 | | | 284,763 | |
| | | | Continental Resources, Inc. | | | | |
| | 84,000 | | | 4.500%, 4/15/2023 | | | 84,735 | |
| | | | EQT Corporation | | | | |
| | 55,000 | | | 8.125%, 6/1/2019 | | | 67,740 | |
| | | | Hess Corporation | | | | |
| | 72,000 | | | 8.125%, 2/15/2019 | | | 90,721 | |
| | | | Linn Energy, LLC | | | | |
| | 273,154 | | | 7.000%, 11/1/2019f | | | 272,471 | |
| | | | MEG Energy Corporation | | | | |
| | 275,000 | | | 6.500%, 3/15/2021f | | | 287,031 | |
| | | | Murphy Oil Corporation | | | | |
| | 40,000 | | | 2.500%, 12/1/2017 | | | 40,292 | |
| | | | Oasis Petroleum, Inc. | | | | |
| | 275,000 | | | 6.875%, 1/15/2023 | | | 298,375 | |
| | | | Offshore Group Investment, Ltd. | | | | |
| | 275,000 | | | 7.500%, 11/1/2019 | | | 299,063 | |
| | | | Petrobras Global Finance BV | | | | |
| | 100,000 | | | 2.000%, 5/20/2016 | | | 99,370 | |
| | | | Petroleos Mexicanos | | | | |
| | 45,000 | | | 3.500%, 7/18/2018 | | | 46,013 | |
| | | | Pioneer Natural Resources Company | | | | |
| | 28,000 | | | 5.875%, 7/15/2016 | | | 31,249 | |
| | | | Range Resources Corporation | | | | |
| | 275,000 | | | 5.000%, 8/15/2022 | | | 274,656 | |
| | | | Suncor Energy, Inc. | | | | |
| | 49,000 | | | 6.100%, 6/1/2018 | | | 57,616 | |
| | | | Transocean, Inc. | | | | |
| | 28,000 | | | 5.050%, 12/15/2016 | | | 30,843 | |
| | 86,000 | | | 6.000%, 3/15/2018 | | | 97,292 | |
| | 21,000 | | | 6.375%, 12/15/2021 | | | 23,660 | |
| | | | Weatherford International, Ltd. | | | | |
| | 84,000 | | | 6.750%, 9/15/2040 | | | 90,272 | |
| | | | | |
| | | | Total | | | 2,862,815 | |
| | | | | |
| |
| Financials (0.7%) | | | | |
| | | | Abbey National Treasury Services plc | | | | |
| | 48,000 | | | 3.050%, 8/23/2018 | | | 49,690 | |
| | | | Aetna, Inc. | | | | |
| | 60,000 | | | 1.500%, 11/15/2017 | | | 59,440 | |
| | | | American Express Credit Corporation | | | | |
| | 35,000 | | | 2.375%, 3/24/2017 | | | 36,347 | |
| | | | American International Group, Inc. | | | | |
| | 99,000 | | | 2.375%, 8/24/2015 | | | 101,091 | |
| | 60,000 | | | 3.800%, 3/22/2017 | | | 64,099 | |
| | 48,000 | | | 8.250%, 8/15/2018 | | | 60,723 | |
| | | | American Tower Trust I | | | | |
| | 21,000 | | | 1.551%, 3/15/2018f | | | 20,597 | |
| | | | ANZ National International, Ltd. of London | | | | |
| | 83,000 | | | 3.125%, 8/10/2015f | | | 86,314 | |
| | | | Associated Banc Corporation | | | | |
| | 28,000 | | | 1.875%, 3/12/2014 | | | 28,104 | |
| | | | Aviation Capital Group Corporation | | | | |
| | 48,000 | | | 3.875%, 9/27/2016f | | | 48,591 | |
| | | | Bank Nederlandse Gemeenten NV | | | | |
| | 90,000 | | | 1.375%, 3/19/2018f | | | 89,334 | |
| | | | Bank of America Corporation | | | | |
| | 115,000 | | | 7.750%, 8/15/2015 | | | 127,349 | |
| | 55,000 | | | 5.750%, 8/15/2016 | | | 60,865 | |
| | 120,000 | | | 5.750%, 12/1/2017 | | | 137,204 | |
| | 263,000 | | | 1.320%, 3/22/2018g,i | | | 266,050 | |
| | 55,000 | | | 5.650%, 5/1/2018 | | | 62,737 | |
| | 72,000 | | | 2.600%, 1/15/2019 | | | 72,486 | |
The accompanying Notes to Financial Statements are an integral part of this schedule.
76
Moderately Aggressive Allocation Fund
Schedule of Investments as of October 31, 2013
| | | | | | | | |
Principal Amount | | | Long-Term Fixed Income (8.2%) | | Value | |
| Financials (0.7%) - continued | | | | |
| | | | Bank of Montreal | | | | |
| | $60,000 | | | 1.300%, 7/15/2016 | | | $60,499 | |
| | 180,000 | | | 0.843%, 4/9/2018g | | | 180,325 | |
| | | | Bank of Nova Scotia | | | | |
| | 180,000 | | | 0.654%, 3/15/2016g | | | 180,430 | |
| | 42,000 | | | 0.950%, 3/15/2016 | | | 42,004 | |
| | | | BB&T Corporation | | | | |
| | 30,000 | | | 1.114%, 6/15/2018g | | | 30,217 | |
| | 60,000 | | | 2.050%, 6/19/2018 | | | 60,101 | |
| | | | BBVA Banco Continental SA | | | | |
| | 69,000 | | | 2.250%, 7/29/2016f | | | 68,828 | |
| | | | BBVA US Senior SAU | | | | |
| | 88,000 | | | 4.664%, 10/9/2015 | | | 92,655 | |
| | | | Berkshire Hathaway Finance Corporation | | | | |
| | 60,000 | | | 1.600%, 5/15/2017 | | | 60,492 | |
| | 180,000 | | | 1.300%, 5/15/2018 | | | 177,100 | |
| | | | BNP Paribas SA | | | | |
| | 82,000 | | | 2.375%, 9/14/2017 | | | 83,839 | |
| | | | Capital One Financial Corporation | | | | |
| | 54,000 | | | 2.150%, 3/23/2015 | | | 54,905 | |
| | 120,000 | | | 0.700%, 3/22/2016g | | | 119,723 | |
| | 70,000 | | | 6.150%, 9/1/2016 | | | 78,513 | |
| | | | Chesapeake Funding, LLC | | | | |
| | 200,000 | | | 0.624%, 1/7/2025f,g | | | 199,468 | |
| | | | Citigroup, Inc. | | | | |
| | 80,000 | | | 5.000%, 9/15/2014 | | | 82,786 | |
| | 90,000 | | | 1.198%, 7/25/2016g | | | 90,826 | |
| | 134,000 | | | 6.000%, 8/15/2017 | | | 154,085 | |
| | 82,000 | | | 8.500%, 5/22/2019 | | | 106,098 | |
| | 44,000 | | | 4.050%, 7/30/2022 | | | 43,540 | |
| | | | CNA Financial Corporation | | | | |
| | 67,000 | | | 7.350%, 11/15/2019 | | | 82,583 | |
| | | | CoBank ACB | | | | |
| | 50,000 | | | 0.854%, 6/15/2022g,h | | | 45,750 | |
| | | | Cooperatieve Centrale Raiffeisen-Boerenleenbank BA | | | | |
| | 57,000 | | | 3.950%, 11/9/2022 | | | 55,717 | |
| | | | Credit Agricole SA | | | | |
| | 50,000 | | | 1.625%, 4/15/2016f | | | 50,380 | |
| | | | CyrusOne, LP | | | | |
| | 275,000 | | | 6.375%, 11/15/2022 | | | 277,063 | |
| | | | DDR Corporation | | | | |
| | 52,000 | | | 9.625%, 3/15/2016 | | | 61,541 | |
| | | | Discover Financial Services | | | | |
| | 101,000 | | | 6.450%, 6/12/2017 | | | 115,256 | |
| | | | DnB Boligkreditt AS | | | | |
| | 240,000 | | | 1.450%, 3/21/2018f | | | 237,840 | |
| | | | Eksportfinans ASA | | | | |
| | 35,000 | | | 3.000%, 11/17/2014 | | | 35,123 | |
| | 52,000 | | | 5.500%, 5/25/2016i | | | 54,444 | |
| | | | Fifth Third Bancorp | | | | |
| | 63,000 | | | 5.450%, 1/15/2017 | | | 69,731 | |
| | | | Fifth Third Capital Trust IV | | | | |
| | 48,000 | | | 6.500%, 4/15/2037 | | | 47,400 | |
| | | | General Electric Capital Corporation | | | | |
| | 20,000 | | | 1.136%, 5/9/2016g | | | 20,174 | |
| | 30,000 | | | 1.600%, 11/20/2017 | | | 30,057 | |
| | 21,000 | | | 0.959%, 4/2/2018g | | | 21,156 | |
| | 183,000 | | | 6.000%, 8/7/2019 | | | 216,579 | |
| | 180,000 | | | 1.254%, 3/15/2023g | | | 178,426 | |
| | 67,000 | | | 6.750%, 3/15/2032 | | | 82,018 | |
| | | | Genworth Financial, Inc. | | | | |
| | 48,000 | | | 6.515%, 5/22/2018i | | | 55,650 | |
| | | | Goldman Sachs Group, Inc. | | | | |
| | 84,000 | | | 3.700%, 8/1/2015 | | | 87,740 | |
| | 133,000 | | | 0.700%, 3/22/2016g | | | 132,319 | |
| | 42,000 | | | 2.375%, 1/22/2018 | | | 42,241 | |
| | 180,000 | | | 1.436%, 4/30/2018g | | | 180,797 | |
| | 61,000 | | | 7.500%, 2/15/2019 | | | 74,901 | |
| | 66,000 | | | 5.250%, 7/27/2021 | | | 72,849 | |
| | | | Hartford Financial Services Group, Inc. | | | | |
| | 81,000 | | | 4.000%, 10/15/2017 | | | 87,143 | |
| | 44,000 | | | 5.125%, 4/15/2022 | | | 49,210 | |
| | | | HCP, Inc. | | | | |
| | 30,000 | | | 6.000%, 1/30/2017 | | | 33,831 | |
| | 30,000 | | | 6.700%, 1/30/2018 | | | 35,177 | |
| | | | Health Care REIT, Inc. | | | | |
| | 66,000 | | | 4.700%, 9/15/2017 | | | 72,225 | |
| | 27,000 | | | 2.250%, 3/15/2018 | | | 26,954 | |
| | | | HSBC Bank plc | | | | |
| | 240,000 | | | 0.904%, 5/15/2018f,g | | | 240,535 | |
| | | | HSBC Finance Corporation | | | | |
| | 102,000 | | | 6.676%, 1/15/2021 | | | 118,542 | |
| | | | Huntington Bancshares, Inc. | | | | |
| | 24,000 | | | 2.600%, 8/2/2018 | | | 24,220 | |
| | | | Huntington National Bank | | | | |
| | 55,000 | | | 1.350%, 8/2/2016 | | | 55,091 | |
| | | | Icahn Enterprises, LP | | | | |
| | 273,154 | | | 8.000%, 1/15/2018 | | | 286,470 | |
| | | | ING Bank NV | | | | |
| | 54,000 | | | 3.750%, 3/7/2017f | | | 57,109 | |
| | | | ING Capital Funding Trust III | | | | |
| | 45,000 | | | 3.848%, 12/29/2049g,k | | | 44,438 | |
| | | | ING US, Inc. | | | | |
| | 64,000 | | | 2.900%, 2/15/2018 | | | 65,316 | |
| | | | International Lease Finance Corporation | | | | |
| | 114,000 | | | 2.204%, 6/15/2016g | | | 114,570 | |
| | | | Intesa Sanpaolo SPA | | | | |
| | 120,000 | | | 3.875%, 1/15/2019c | | | 120,477 | |
| | | | J.P. Morgan Chase & Company | | | | |
| | 120,000 | | | 0.689%, 4/23/2015g | | | 120,238 | |
| | 44,000 | | | 1.125%, 2/26/2016 | | | 44,189 | |
| | 94,000 | | | 3.450%, 3/1/2016 | | | 99,059 | |
| | 114,000 | | | 2.000%, 8/15/2017 | | | 115,450 | |
| | 89,000 | | | 1.138%, 1/25/2018g | | | 89,674 | |
| | 35,000 | | | 1.800%, 1/25/2018 | | | 34,758 | |
| | 91,000 | | | 6.300%, 4/23/2019 | | | 107,845 | |
| | 23,000 | | | 3.200%, 1/25/2023 | | | 22,084 | |
| | 80,000 | | | 7.900%, 4/29/2049k | | | 88,200 | |
| | | | J.P. Morgan Chase Bank NA | | | | |
| | 76,000 | | | 0.584%, 6/13/2016g | | | 75,280 | |
| | | | KeyBank NA | | | | |
| | 81,000 | | | 7.413%, 5/6/2015 | | | 88,374 | |
| | | | Liberty Mutual Group, Inc. | | | | |
| | 28,000 | | | 4.950%, 5/1/2022f | | | 29,603 | |
| | 25,000 | | | 6.500%, 5/1/2042f | | | 27,930 | |
| | | | Liberty Property, LP | | | | |
| | 59,000 | | | 5.500%, 12/15/2016 | | | 65,450 | |
| | | | Lloyds TSB Bank plc | | | | |
| | 54,000 | | | 6.500%, 9/14/2020f | | | 61,011 | |
| | | | Merrill Lynch & Company, Inc. | | | | |
| | 42,000 | | | 6.400%, 8/28/2017 | | | 48,807 | |
The accompanying Notes to Financial Statements are an integral part of this schedule.
77
Moderately Aggressive Allocation Fund
Schedule of Investments as of October 31, 2013
| | | | | | | | |
Principal Amount | | | Long-Term Fixed Income (8.2%) | | Value | |
| Financials (0.7%) - continued | | | | |
| | | | Morgan Stanley | | | | |
| | $56,000 | | | 4.750%, 4/1/2014 | | | $56,952 | |
| | 22,000 | | | 1.512%, 2/25/2016g | | | 22,231 | |
| | 22,000 | | | 1.750%, 2/25/2016 | | | 22,216 | |
| | 106,000 | | | 4.750%, 3/22/2017 | | | 116,169 | |
| | 45,000 | | | 6.250%, 8/28/2017 | | | 51,831 | |
| | 120,000 | | | 1.518%, 4/25/2018g | | | 120,946 | |
| | 50,000 | | | 4.875%, 11/1/2022 | | | 51,473 | |
| | 50,000 | | | 4.100%, 5/22/2023 | | | 48,297 | |
| | | | Murray Street Investment Trust I | | | | |
| | 136,000 | | | 4.647%, 3/9/2017 | | | 147,863 | |
| | | | National City Corporation | | | | |
| | 72,000 | | | 6.875%, 5/15/2019 | | | 86,394 | |
| | | | Nederlandse Waterschapsbank NV | | | | |
| | 120,000 | | | 0.750%, 3/29/2016f | | | 120,209 | |
| | | | Nomura Holdings, Inc. | | | | |
| | 180,000 | | | 1.704%, 9/13/2016g | | | 183,142 | |
| | 101,000 | | | 2.000%, 9/13/2016 | | | 101,738 | |
| | | | Nordea Eiendomskreditt AS | | | | |
| | 180,000 | | | 2.125%, 9/22/2016f | | | 186,126 | |
| | | | PNC Bank NA | | | | |
| | 72,000 | | | 1.150%, 11/1/2016 | | | 72,213 | |
| | | | Prologis, LP | | | | |
| | 69,000 | | | 7.375%, 10/30/2019 | | | 85,467 | |
| | | | Prudential Covered Trust | | | | |
| | 153,000 | | | 2.997%, 9/30/2015f | | | 158,311 | |
| | | | Realty Income Corporation | | | | |
| | 27,000 | | | 2.000%, 1/31/2018 | | | 26,630 | |
| | | | Regions Bank | | | | |
| | 123,000 | | | 7.500%, 5/15/2018 | | | 146,338 | |
| | | | Reinsurance Group of America, Inc. | | | | |
| | 50,000 | | | 5.625%, 3/15/2017 | | | 55,520 | |
| | 27,000 | | | 5.000%, 6/1/2021 | | | 29,034 | |
| | | | Royal Bank of Canada | | | | |
| | 250,000 | | | 1.125%, 7/22/2016 | | | 251,557 | |
| | 90,000 | | | 2.200%, 7/27/2018 | | | 91,006 | |
| | | | Royal Bank of Scotland Group plc | | | | |
| | 72,000 | | | 5.050%, 1/8/2015 | | | 74,427 | |
| | 44,000 | | | 2.550%, 9/18/2015 | | | 45,064 | |
| | 22,000 | | | 6.125%, 12/15/2022 | | | 22,745 | |
| | | | Santander US Debt SAU | | | | |
| | 100,000 | | | 3.724%, 1/20/2015f | | | 101,329 | |
| | | | Simon Property Group, LP | | | | |
| | 42,000 | | | 10.350%, 4/1/2019 | | | 57,682 | |
| | | | SLM Corporation | | | | |
| | 35,000 | | | 3.875%, 9/10/2015 | | | 36,225 | |
| | 27,000 | | | 6.250%, 1/25/2016 | | | 29,396 | |
| | | | SpareBank 1 Boligkreditt AS | | | | |
| | 240,000 | | | 1.250%, 5/2/2018f | | | 235,056 | |
| | | | Svensk Exportkredit AB | | | | |
| | 120,000 | | | 1.125%, 4/5/2018 | | | 118,364 | |
| | | | Svenska Handelsbanken AB | | | | |
| | 54,000 | | | 3.125%, 7/12/2016 | | | 56,774 | |
| | 17,000 | | | 1.625%, 3/21/2018 | | | 16,748 | |
| | | | Swedbank Hypotek AB | | | | |
| | 240,000 | | | 1.375%, 3/28/2018f,i | | | 237,408 | |
| | | | Swiss RE Capital I, LP | | | | |
| | 55,000 | | | 6.854%, 5/29/2049f,k | | | 58,575 | |
| | | | Toronto-Dominion Bank | | | | |
| | 85,000 | | | 0.716%, 9/9/2016g | | | 85,361 | |
| | | | UBS AG London | | | | |
| | 240,000 | | | 0.750%, 3/24/2016f | | | 238,798 | |
| | | | UBS AG/Stamford, Connecticut | | | | |
| | 54,000 | | | 5.875%, 12/20/2017 | | | 62,614 | |
| | | | Union Bank NA | | | | |
| | 96,000 | | | 1.500%, 9/26/2016 | | | 97,096 | |
| | | | Ventas Realty, LP | | | | |
| | 72,000 | | | 1.550%, 9/26/2016 | | | 72,517 | |
| | | | Wachovia Corporation | | | | |
| | 138,000 | | | 5.625%, 10/15/2016 | | | 155,159 | |
| | 180,000 | | | 0.524%, 6/15/2017g | | | 178,215 | |
| | | | Wells Fargo & Company | | | | |
| | 165,000 | | | 1.250%, 7/20/2016 | | | 165,983 | |
| | 78,000 | | | 2.100%, 5/8/2017 | | | 80,158 | |
| | 59,000 | | | 1.500%, 1/16/2018 | | | 58,783 | |
| | | | | |
| | | | Total | | | 12,730,590 | |
| | | | | |
| |
| Foreign Government (0.1%) | | | | |
| | | | Asian Development Bank | | | | |
| | 240,000 | | | 0.500%, 6/20/2016 | | | 239,928 | |
| | | | Denmark Government International Bond | | | | |
| | 240,000 | | | 0.375%, 4/25/2016f | | | 239,184 | |
| | | | Export-Import Bank of Korea | | | | |
| | 54,000 | | | 1.250%, 11/20/2015 | | | 54,112 | |
| | | | International Finance Corporation | | | | |
| | 180,000 | | | 0.500%, 5/16/2016 | | | 179,960 | |
| | | | Kommunalbanken AS | | | | |
| | 240,000 | | | 0.332%, 3/18/2016f,g | | | 239,841 | |
| | | | Kommuninvest i Sverige AB | | | | |
| | 240,000 | | | 0.500%, 6/15/2016f | | | 239,054 | |
| | | | Mexico Government International Bond | | | | |
| | 48,000 | | | 4.000%, 10/2/2023 | | | 48,744 | |
| | | | Province of Ontario | | | | |
| | 200,000 | | | 1.000%, 7/22/2016 | | | 201,307 | |
| | | | | |
| | | | Total | | | 1,442,130 | |
| | | | | |
| |
| Mortgage-Backed Securities (0.6%) | | | | |
| | | | Federal Home Loan Mortgage Corporation Gold 15-Yr. Pass Through | | | | |
| | 750,000 | | | 3.000%, 12/1/2028c | | | 775,313 | |
| | | | Federal Home Loan Mortgage Corporation Gold 30-Yr. Pass Through | | | | |
| | 297,169 | | | 1.967%, 6/1/2043g | | | 302,384 | |
| | 700,000 | | | 3.500%, 11/1/2043c | | | 715,422 | |
| | | | Federal National Mortgage Association | | | | |
| | 447,142 | | | 2.074%, 1/1/2043g | | | 456,647 | |
| | 785,252 | | | 2.060%, 3/1/2043g | | | 802,670 | |
| | 686,310 | | | 1.754%, 7/1/2043g | | | 692,143 | |
| | 682,252 | | | 1.760%, 7/1/2043g | | | 685,025 | |
| | | | Federal National Mortgage Association Conventional 15- Yr. Pass Through | | | | |
| | 470,000 | | | 2.500%, 11/1/2028c | | | 474,920 | |
| | 230,000 | | | 3.500%, 11/1/2028c | | | 242,848 | |
The accompanying Notes to Financial Statements are an integral part of this schedule.
78
Moderately Aggressive Allocation Fund
Schedule of Investments as of October 31, 2013
| | | | | | | | |
Principal
Amount | | | Long-Term Fixed Income (8.2%) | | Value | |
| Mortgage-Backed Securities (0.6%) - continued | | | | |
| | | | Federal National Mortgage Association Conventional 30-Yr. Pass Though | | | | |
| | $737,895 | | | 1.979%, 7/1/2043g | | | $750,594 | |
| | 509,449 | | | 2.023%, 7/1/2043g | | | 518,953 | |
| | 447,179 | | | 2.120%, 8/1/2043g | | | 456,924 | |
| | | | Federal National Mortgage Association Conventional 30-Yr. Pass Through | | | | |
| | 1,375,000 | | | 3.500%, 11/1/2043c | | | 1,410,234 | |
| | 1,275,000 | | | 4.000%, 11/1/2043c | | | 1,343,133 | |
| | 619,000 | | | 4.500%, 11/1/2043c | | | 662,620 | |
| | | | | |
| | | | Total | | | 10,289,830 | |
| | | | | |
| |
| Technology (0.1%) | | | | |
| | | | Apple, Inc. | | | | |
| | 240,000 | | | 0.516%, 5/3/2018g | | | 239,255 | |
| | 21,000 | | | 2.400%, 5/3/2023 | | | 19,190 | |
| | | | Computer Sciences Corporation | | | | |
| | 42,000 | | | 2.500%, 9/15/2015 | | | 43,012 | |
| | | | EMC Corporation | | | | |
| | 87,000 | | | 1.875%, 6/1/2018 | | | 87,319 | |
| | | | First Data Corporation | | | | |
| | 275,000 | | | 7.375%, 6/15/2019f | | | 295,969 | |
| | | | Hewlett-Packard Company | | | | |
| | 56,000 | | | 2.125%, 9/13/2015 | | | 56,971 | |
| | | | Intel Corporation | | | | |
| | 54,000 | | | 4.000%, 12/15/2032 | | | 50,784 | |
| | | | Iron Mountain, Inc. | | | | |
| | 275,000 | | | 6.000%, 8/15/2023 | | | 279,813 | |
| | | | Oracle Corporation | | | | |
| | 54,000 | | | 1.200%, 10/15/2017 | | | 53,298 | |
| | 105,000 | | | 0.824%, 1/15/2019g | | | 105,434 | |
| | | | Samsung Electronics America, Inc. | | | | |
| | 44,000 | | | 1.750%, 4/10/2017f | | | 44,527 | |
| | | | Tyco Electronics Group SA | | | | |
| | 105,000 | | | 6.550%, 10/1/2017 | | | 121,613 | |
| | | | Xerox Corporation | | | | |
| | 56,000 | | | 7.200%, 4/1/2016 | | | 63,276 | |
| | | | | |
| | | | Total | | | 1,460,461 | |
| | | | | |
| |
| Transportation (0.1%) | | | | |
| | | | American Airlines Pass Through Trust | | | | |
| | 60,000 | | | 4.950%, 1/15/2023f | | | 61,800 | |
| | | | Avis Budget Car Rental, LLC | | | | |
| | 275,000 | | | 8.250%, 1/15/2019 | | | 299,750 | |
| | | | Canadian National Railway Company | | | | |
| | 50,000 | | | 0.438%, 11/6/2015c,g | | | 49,980 | |
| | | | Canadian Pacific Railway Company | | | | |
| | 30,000 | | | 7.125%, 10/15/2031 | | | 36,739 | |
| | 36,000 | | | 5.750%, 3/15/2033 | | | 39,246 | |
| | | | Continental Airlines, Inc. | | | | |
| | 63,400 | | | 4.150%, 4/11/2024 | | | 62,608 | |
| | | | CSX Corporation | | | | |
| | 55,000 | | | 6.250%, 4/1/2015 | | | 59,199 | |
| | 42,000 | | | 3.700%, 11/1/2023 | | | 41,918 | |
| | | | Delta Air Lines, Inc. | | | | |
| | 83,000 | | | 6.750%, 5/23/2017 | | | 84,297 | |
| | 41,066 | | | 4.950%, 5/23/2019 | | | 44,043 | |
| | 13,500 | | | 4.750%, 5/7/2020 | | | 14,243 | |
| | | | ERAC USA Finance, LLC | | | | |
| | 54,000 | | | 1.400%, 4/15/2016f | | | 54,083 | |
| | 30,000 | | | 2.800%, 11/1/2018f | | | 30,404 | |
| | | | Kansas City Southern de Mexico SA de CV | | | | |
| | 116,000 | | | 0.937%, 10/28/2016f,g | | | 116,173 | |
| | 42,000 | | | 2.350%, 5/15/2020 | | | 40,057 | |
| | | | Virgin Australia Holdings, Ltd. | | | | |
| | 45,000 | | | 5.000%, 10/23/2023f | | | 46,125 | |
| | | | | |
| | | | Total | | | 1,080,665 | |
| | | | | |
| |
| U.S. Government and Agencies (2.4%) | | | | |
| | | | U.S. Treasury Bonds | | | | |
| | 550,000 | | | 5.250%, 11/15/2028 | | | 692,571 | |
| | 1,175,000 | | | 4.375%, 5/15/2040 | | | 1,344,457 | |
| | 7,730,000 | | | 3.000%, 5/15/2042 | | | 6,853,124 | |
| | 187,000 | | | 2.875%, 5/15/2043 | | | 160,440 | |
| | | | U.S. Treasury Notes | | | | |
| | 760,000 | | | 0.375%, 2/15/2016 | | | 759,822 | |
| | 2,250,000 | | | 1.000%, 5/31/2018 | | | 2,231,894 | |
| | 2,195,000 | | | 1.625%, 8/15/2022 | | | 2,061,928 | |
| | 200,000 | | | 1.750%, 5/15/2023 | | | 186,797 | |
| | | | U.S. Treasury Notes, TIPS | | | | |
| | 12,039,337 | | | 0.125%, 4/15/2018 | | | 12,454,141 | |
| | 14,286,106 | | | 0.125%, 1/15/2023 | | | 13,962,454 | |
| | | | | |
| | | | Total | | | 40,707,628 | |
| | | | | |
| |
| U.S. Municipals (0.9%) | | | | |
| | | | Buckeye Tobacco Settlement Financing Auth. Rev. | | | | |
| | 541,000 | | | 5.125%, 6/1/2024, Ser. A-2 | | | 462,095 | |
| | | | Dallas/Fort Worth Texas International Airport Joint Rev. Improvement | | | | |
| | 945,000 | | | 5.000%, 11/1/2038, Ser. A, AMT | | | 899,697 | |
| | | | Los Angeles Department Of Water and Power Power System Rev. | | | | |
| | 1,180,000 | | | 5.000%, 7/1/2043, Ser. B | | | 1,232,168 | |
| | | | Massachusetts Bay Transportation Auth. Assessment Rev. | | | | |
| | 703,000 | | | 5.000%, 7/1/2041, Ser. A | | | 742,902 | |
| | | | Massachusetts Development Finance Agency Rev. (Boston University) | | | | |
| | 673,000 | | | 5.000%, 10/1/2048 | | | 682,422 | |
| | | | Massachusetts School Building Auth. Sales Tax Rev. | | | | |
| | 945,000 | | | 5.000%, 5/15/2043, Ser. A | | | 994,745 | |
| | | | Metropolitan Transportation Auth. Transportation Rev. | | | | |
| | 944,000 | | | 5.000%, 11/15/2043, Ser. A | | | 958,283 | |
| | | | Miami-Dade County Expressway Auth. Toll System Rev. | | | | |
| | 401,000 | | | 5.000%, 7/1/2040, Ser. A | | | 404,589 | |
| | | | New Jersey Transportation Trust Fund Auth. Transportation System Rev. | | | | |
| | 1,180,000 | | | 5.000%, 6/15/2042, Ser. A | | | 1,200,591 | |
The accompanying Notes to Financial Statements are an integral part of this schedule.
79
Moderately Aggressive Allocation Fund
Schedule of Investments as of October 31, 2013
| | | | | | | | |
Principal
Amount | | | Long-Term Fixed Income (8.2%) | | Value | |
| U.S. Municipals (0.9%) - continued | | | | |
| | | | New Jersey Turnpike Auth. Turnpike Rev. | | | | |
| | $375,000 | | | 5.000%, 1/1/2043, Ser. A | | | $384,244 | |
| | | | New York City Municipal Water Finance Auth. Water and Sewer System Rev. | | | | |
| | 944,000 | | | 5.000%, 6/15/2047, Ser. EE | | | 981,949 | |
| | | | New York City Transitional Finance Auth. Future Tax Rev. | | | | |
| | 882,000 | | | 5.000%, 5/1/2042, Ser. I | | | 923,383 | |
| | | | New York State Dormitory Auth. Personal Income Tax Rev. | | | | |
| | 567,000 | | | 5.000%, 3/15/2042, Ser. B | | | 590,956 | |
| | | | North Texas Tollway Auth. Rev. | | | | |
| | 944,000 | | | 5.000%, 1/1/2042, Ser. B | | | 939,695 | |
| | | | San Diego County Regional Airport Auth. Airport Rev. | | | | |
| | 815,000 | | | 5.000%, 7/1/2038, Ser. B, AMT | | | 803,582 | |
| | | | South Carolina Public Service Auth. Rev. Obligations | | | | |
| | 944,000 | | | 5.000%, 12/1/2043, Ser. D | | | 957,820 | |
| | | | State of California Various Purpose G.O. | | | | |
| | 472,000 | | | 5.000%, 9/1/2036 | | | 489,695 | |
| | 236,000 | | | 5.000%, 4/1/2042 | | | 241,518 | |
| | 236,000 | | | 5.000%, 2/1/2043 | | | 241,773 | |
| | | | University of Massachusetts Building Auth. Proj. Rev. | | | | |
| | 755,000 | | | 5.000%, 11/1/2039, Ser. 2 | | | 792,908 | |
| | | | | |
| | | | Total | | | 14,925,015 | |
| | | | | |
| |
| Utilities (0.1%) | | | | |
| | | | AES Corporation | | | | |
| | 275,000 | | | 7.375%, 7/1/2021 | | | 311,437 | |
| | | | American Electric Power Company, Inc. | | | | |
| | 54,000 | | | 1.650%, 12/15/2017 | | | 53,339 | |
| | | | Atlas Pipeline Partners, LP | | | | |
| | 275,000 | | | 4.750%, 11/15/2021f | | | 258,500 | |
| | | | Dayton Power and Light Company | | | | |
| | 48,000 | | | 1.875%, 9/15/2016f | | | 48,440 | |
| | | | DCP Midstream Operating, LP | | | | |
| | 27,000 | | | 2.500%, 12/1/2017 | | | 27,030 | |
| | | | Duke Energy Corporation | | | | |
| | 75,000 | | | 2.100%, 6/15/2018 | | | 75,358 | |
| | | | Enel Finance International NV | | | | |
| | 66,000 | | | 3.875%, 10/7/2014f | | | 67,650 | |
| | 37,000 | | | 6.250%, 9/15/2017f | | | 41,580 | |
| | | | Energy Transfer Partners, LP | | | | |
| | 21,000 | | | 9.700%, 3/15/2019 | | | 27,564 | |
| | 84,000 | | | 4.650%, 6/1/2021 | | | 87,963 | |
| | | | Enterprise Products Operating, LLC | | | | |
| | 84,000 | | | 1.250%, 8/13/2015 | | | 84,460 | |
| | | | Exelon Corporation | | | | |
| | 67,000 | | | 4.900%, 6/15/2015 | | | 70,991 | |
| | | | Exelon Generation Company, LLC | | | | |
| | 63,000 | | | 5.200%, 10/1/2019 | | | 68,875 | |
| | | | ITC Holdings Corporation | | | | |
| | 72,000 | | | 5.875%, 9/30/2016f | | | 80,225 | |
| | 30,000 | | | 4.050%, 7/1/2023 | | | 30,015 | |
| | | | Korea Western Power Company, Ltd. | | | | |
| | 80,000 | | | 2.875%, 10/10/2018f | | | 80,307 | |
| | | | MidAmerican Energy Holdings Company | | | | |
| | 56,000 | | | 6.500%, 9/15/2037 | | | 66,172 | |
| | | | NextEra Energy Capital Holdings, Inc. | | | | |
| | 84,000 | | | 1.200%, 6/1/2015 | | | 84,554 | |
| | | | NiSource Finance Corporation | | | | |
| | 75,000 | | | 6.800%, 1/15/2019 | | | 88,566 | |
| | | | Northeast Utilities | | | | |
| | 31,000 | | | 1.450%, 5/1/2018 | | | 30,349 | |
| | | | NRG Energy, Inc. | | | | |
| | 275,000 | | | 6.625%, 3/15/2023 | | | 284,281 | |
| | | | ONEOK Partners, LP | | | | |
| | 51,000 | | | 8.625%, 3/1/2019 | | | 65,037 | |
| | 36,000 | | | 5.000%, 9/15/2023 | | | 38,474 | |
| | | | Pacific Gas & Electric Company | | | | |
| | 81,000 | | | 5.625%, 11/30/2017 | | | 93,135 | |
| | | | PPL Capital Funding, Inc. | | | | |
| | 105,000 | | | 1.900%, 6/1/2018 | | | 103,677 | |
| | 24,000 | | | 3.500%, 12/1/2022 | | | 22,929 | |
| | | | Sempra Energy | | | | |
| | 81,000 | | | 6.150%, 6/15/2018 | | | 94,990 | |
| | | | Spectra Energy Partners, LP | | | | |
| | 24,000 | | | 2.950%, 9/25/2018 | | | 24,551 | |
| | 24,000 | | | 4.750%, 3/15/2024 | | | 25,234 | |
| | | | Williams Partners, LP | | | | |
| | 28,000 | | | 7.250%, 2/1/2017 | | | 32,643 | |
| | | | | |
| | | | Total | | | 2,468,326 | |
| | | | | |
| | | | | | | | |
| | | | | |
| | | | Total Long-Term Fixed Income (cost $137,186,581) | | | 137,441,056 | |
| | | | | |
| | |
| Shares | | | Preferred Stock (<0.1%) | | Value | |
| Health Care (<0.1%) | | | | |
| | 400 | | | Draegerwerk AG & Company KGaA | | | 46,853 | |
| | | | | |
| | | | Total | | | 46,853 | |
| | | | | |
| | | | | | | | |
| | | | | |
| | | | Total Preferred Stock (cost $51,032) | | | 46,853 | |
| | | | | |
| | |
| Shares | | | Collateral Held for Securities Loaned (0.1%) | | Value | |
| | 1,305,947 | | | Thrivent Cash Management Trust | | | 1,305,947 | |
| | | | | |
| | | | Total Collateral Held for Securities Loaned (cost $1,305,947) | | | 1,305,947 | |
| | | | | |
The accompanying Notes to Financial Statements are an integral part of this schedule.
80
Moderately Aggressive Allocation Fund
Schedule of Investments as of October 31, 2013
| | | | | | | | |
Shares or
Principal
Amount | | | Short-Term Investments (7.2%) | | Value | |
| | | | Federal Home Loan Bank Discount Notes | | | | |
| | 15,000,000 | | | 0.050%, 11/1/2013l | | | $15,000,000 | |
| | 2,500,000 | | | 0.075%, 11/13/2013l | | | 2,499,938 | |
| | 11,000,000 | | | 0.020%, 11/20/2013l | | | 10,999,884 | |
| | 4,000,000 | | | 0.093%, 11/22/2013e,l | | | 3,999,783 | |
| | 7,000,000 | | | 0.036%, 11/27/2013l | | | 6,999,819 | |
| | 6,300,000 | | | 0.040%, 12/4/2013e,l | | | 6,299,768 | |
| | 2,000,000 | | | 0.160%, 12/11/2013l | | | 1,999,644 | |
| | 3,000,000 | | | 0.030%, 12/13/2013l | | | 2,999,895 | |
| | 6,000,000 | | | 0.050%, 12/26/2013l | | | 5,999,542 | |
| | 14,000,000 | | | 0.045%, 1/3/2014l | | | 13,998,898 | |
| | 2,000,000 | | | 0.040%, 1/6/2014l | | | 1,999,853 | |
| | 10,000,000 | | | 0.050%, 1/24/2014l | | | 9,998,833 | |
| | 500,000 | | | 0.090%, 2/21/2014e,l | | | 499,860 | |
| | | | Federal Home Loan Mortgage Corporation Discount Notes | | | | |
| | 1,000,000 | | | 0.095%, 12/2/2013e,l | | | 999,918 | |
| | | | Federal National Mortgage Association Discount Notes | | | | |
| | 3,700,000 | | | 0.100%, 12/4/2013e,l | | | 3,699,661 | |
| | 25,000,000 | | | 0.020%, 1/7/2014e,l | | | 24,999,069 | |
| | | | Novartis Finance Corporation | | | | |
| | 5,000,000 | | | 0.060%, 11/6/2013f,l | | | 4,999,958 | |
| | | | U.S. Treasury Bills | | | | |
| | 1,800,000 | | | 0.062%, 12/26/2013l,m | | | 1,799,829 | |
| | | | | |
| | | | Total Short-Term Investments (at amortized cost) | | | 119,794,152 | |
| | | | | |
| | | | Total Investments (cost $1,396,686,489) 100.2% | | | $1,669,972,154 | |
| | | | | |
| | | | Other Assets and Liabilities, Net (0.2%) | | | (3,526,276 | ) |
| | | | | |
| | | | Total Net Assets 100.0% | | | $1,666,445,878 | |
| | | | | |
a | The stated interest rate represents the weighted average of all contracts within the bank loan facility. |
b | All or a portion of the loan is unfunded. |
c | Denotes investments purchased on a when-issued or delayed delivery basis. |
d | Non-income producing security. |
e | At October 31, 2013, $15,033,783 of investments were held on deposit with the counterparty and pledged as the initial margin deposit for open futures contracts. |
f | Denotes securities sold under Rule 144A of the Securities Act of 1933, which exempts them from registration. These securities have been deemed liquid and may be resold to other dealers in the program or to other qualified institutional buyers. As of October 31, 2013, the value of these investments was $21,001,758 or 1.3% of total net assets. |
g | Denotes variable rate securities. Variable rate securities are securities whose yields vary with a designated market index or market rate. The rate shown is as of October 31, 2013. |
h | Denotes restricted securities. Restricted securities are investment securities which have been deemed illiquid and cannot be offered for public sale without first being registered under the Securities Act of 1933. The following table indicates the acquisition date and cost of restricted securities Moderately Aggressive Allocation Fund owned as of October 31, 2013. |
| | | | | | | | |
Security | | Acquisition
Date | | | Cost | |
CoBank ACB | | | 10/18/2013 | | | | $45,972 | |
Edlinc Student Loan Funding Trust | | | 3/7/2013 | | | | $206,119 | |
FNA Trust | | | 4/29/2013 | | | | $231,124 | |
i | All or a portion of the security is on loan. |
j | Denotes interest only security. Interest only securities represent the right to receive monthly interest payments on an underlying pool of mortgages or assets. The principal shown is the outstanding par amount of the pool as of the end of the period. The actual effective yield of the security is different than the stated coupon rate. |
k | Denotes perpetual securities. Perpetual securities pay an indefinite stream of interest, but may be called by the issuer at an earlier date. |
l | The interest rate shown reflects the yield, coupon rate or the discount rate at the date of purchase. |
m | At October 31, 2013, $899,914 of investments were pledged as collateral with the custodian under the agreement between the counterparty, the custodian and the fund for open swap contracts. |
Definitions:
| | |
| ADR | | - American Depositary Receipt, which are certificates for an underlying foreign security’s shares held by an issuing U.S. depository bank. |
| AMT | | - Subject to Alternative Minimum Tax |
| Auth. | | - Authority |
| ETF | | - Exchange Traded Fund. |
| G.O. | | - General Obligation |
| REIT | | - Real Estate Investment Trust is a company that buys, develops, manages and/or sells real estate assets. |
| Rev. | | - Revenue |
| Ser. | | - Series |
| TIPS | | - Treasury Inflation Protected Security. |
| | | | |
Unrealized Appreciation (Depreciation) | | | | |
Gross unrealized appreciation and depreciation of investments, based on cost for federal income tax purposes, were as follows: | | | | |
Gross unrealized appreciation | | | $265,313,748 | |
Gross unrealized depreciation | | | (4,900,425) | |
| | | | |
Net unrealized appreciation (depreciation) | | | $260,413,323 | |
| |
Cost for federal income tax purposes | | | $1,409,558,831 | |
The accompanying Notes to Financial Statements are an integral part of this schedule.
81
Moderately Aggressive Allocation Fund
Schedule of Investments as of October 31, 2013
Fair Valuation Measurements
The following table is a summary of the inputs used, as of October 31, 2013, in valuing Moderately Aggressive Allocation Fund’s assets carried at fair value.
| | | | | | | | | | | | | | | | |
Investments in Securities | | Total | | | Level 1 | | | Level 2 | | | Level 3 | |
| | | | |
Bank Loans | | | | | | | | | | | | | | | | |
Basic Materials | | | 3,600,842 | | | | – | | | | 3,600,842 | | | | – | |
Capital Goods | | | 1,724,031 | | | | – | | | | 1,724,031 | | | | – | |
Communications Services | | | 12,558,412 | | | | – | | | | 12,558,412 | | | | – | |
Consumer Cyclical | | | 4,249,874 | | | | – | | | | 4,249,874 | | | | – | |
Consumer Non-Cyclical | | | 5,144,059 | | | | – | | | | 5,144,059 | | | | – | |
Energy | | | 2,212,889 | | | | – | | | | 2,212,889 | | | | – | |
Financials | | | 1,224,453 | | | | – | | | | 1,224,453 | | | | – | |
Technology | | | 2,610,124 | | | | – | | | | 2,610,124 | | | | – | |
Transportation | | | 1,458,063 | | | | – | | | | 1,458,063 | | | | – | |
Utilities | | | 1,357,716 | | | | – | | | | 1,357,716 | | | | – | |
| | | | |
Mutual Funds | | | | | | | | | | | | | | | | |
Equity Mutual Funds | | | 879,241,841 | | | | 879,241,841 | | | | – | | | | – | |
Fixed Income Mutual Funds | | | 171,141,072 | | | | 171,141,072 | | | | – | | | | – | |
| | | | |
Common Stock | | | | | | | | | | | | | | | | |
Consumer Discretionary | | | 50,862,444 | | | | 48,294,255 | | | | 2,568,189 | | | | – | |
Consumer Staples | | | 17,948,053 | | | | 16,318,599 | | | | 1,629,454 | | | | – | |
Energy | | | 26,486,550 | | | | 26,033,587 | | | | 452,963 | | | | – | |
Financials | | | 71,778,551 | | | | 67,661,110 | | | | 4,117,441 | | | | – | |
Health Care | | | 37,418,043 | | | | 35,550,354 | | | | 1,867,689 | | | | – | |
Industrials | | | 42,208,486 | | | | 39,852,200 | | | | 2,356,286 | | | | – | |
Information Technology | | | 53,747,249 | | | | 53,349,571 | | | | 397,678 | | | | – | |
Materials | | | 12,745,675 | | | | 12,287,532 | | | | 458,143 | | | | – | |
Telecommunications Services | | | 3,600,705 | | | | 2,516,890 | | | | 1,083,815 | | | | – | |
Utilities | | | 8,065,014 | | | | 7,427,582 | | | | 637,432 | | | | – | |
| | | | |
Long-Term Fixed Income | | | | | | | | | | | | | | | | |
Asset-Backed Securities | | | 11,819,257 | | | | – | | | | 11,387,638 | | | | 431,619 | |
Basic Materials | | | 2,135,834 | | | | – | | | | 2,135,834 | | | | – | |
Capital Goods | | | 1,373,873 | | | | – | | | | 1,373,873 | | | | – | |
Collateralized Mortgage Obligations | | | 6,999,689 | | | | – | | | | 6,999,689 | | | | – | |
Commercial Mortgage-Backed Securities | | | 13,881,996 | | | | – | | | | 13,881,996 | | | | – | |
Communications Services | | | 4,669,889 | | | | – | | | | 4,669,889 | | | | – | |
Consumer Cyclical | | | 3,589,281 | | | | – | | | | 3,589,281 | | | | – | |
Consumer Non-Cyclical | | | 5,003,777 | | | | – | | | | 5,003,777 | | | | – | |
Energy | | | 2,862,815 | | | | – | | | | 2,862,815 | | | | – | |
Financials | | | 12,730,590 | | | | – | | | | 12,684,840 | | | | 45,750 | |
Foreign Government | | | 1,442,130 | | | | – | | | | 1,442,130 | | | | – | |
Mortgage-Backed Securities | | | 10,289,830 | | | | – | | | | 10,289,830 | | | | – | |
Technology | | | 1,460,461 | | | | – | | | | 1,460,461 | | | | – | |
Transportation | | | 1,080,665 | | | | – | | | | 1,080,665 | | | | – | |
U.S. Government and Agencies | | | 40,707,628 | | | | – | | | | 40,707,628 | | | | – | |
U.S. Municipals | | | 14,925,015 | | | | – | | | | 14,925,015 | | | | – | |
Utilities | | | 2,468,326 | | | | – | | | | 2,468,326 | | | | – | |
| | | | |
Preferred Stock | | | | | | | | | | | | | | | | |
Health Care | | | 46,853 | | | | – | | | | 46,853 | | | | – | |
Collateral Held for Securities Loaned | | | 1,305,947 | | | | 1,305,947 | | | | – | | | | – | |
Short-Term Investments | | | 119,794,152 | | | | – | | | | 119,794,152 | | | | – | |
| |
Total | | | $1,669,972,154 | | | | $1,360,980,540 | | | | $308,514,245 | | | | $477,369 | |
| |
The accompanying Notes to Financial Statements are an integral part of this schedule.
82
Moderately Aggressive Allocation Fund
Schedule of Investments as of October 31, 2013
| | | | | | | | | | | | | | | | |
Other Financial Instruments | | Total | | | Level 1 | | | Level 2 | | | Level 3 | |
| | | | |
Asset Derivatives | | | | | | | | | | | | | | | | |
Futures Contracts | | | 11,984,301 | | | | 11,984,301 | | | | – | | | | – | |
Credit Default Swaps | | | 39,687 | | | | – | | | | 39,687 | | | | – | |
| |
Total Asset Derivatives | | | $12,023,988 | | | | $11,984,301 | | | | $39,687 | | | | $– | |
| |
| | | | |
Liability Derivatives | | | | | | | | | | | | | | | | |
Futures Contracts | | | 7,225,771 | | | | 7,225,771 | | | | – | | | | – | |
| |
Total Liability Derivatives | | | $7,225,771 | | | | $7,225,771 | | | | $– | | | | $– | |
| |
There were no significant transfers between Levels during the period ended October 31, 2013. Transfers between Levels are identified as of the end of the period.
| | | | | | | | | | | | | | | | | | | | |
Futures Contracts | | Number of
Contracts
Long/(Short) | | | Expiration
Date | | | Notional
Principal
Amount | | | Value | | | Unrealized
Gain/(Loss) | |
2-Yr. U.S. Treasury Bond Futures | | | (60 | ) | | | December 2013 | | | | ($13,181,067 | ) | | | ($13,225,313 | ) | | | ($44,246 | ) |
5-Yr. U.S. Treasury Bond Futures | | | (225 | ) | | | December 2013 | | | | (26,902,634 | ) | | | (27,379,688 | ) | | | (477,054 | ) |
10-Yr. U.S. Treasury Bond Futures | | | (75 | ) | | | December 2013 | | | | (9,304,459 | ) | | | (9,551,954 | ) | | | (247,495 | ) |
30-Yr. U.S. Treasury Bond Futures | | | 120 | | | | December 2013 | | | | 15,760,679 | | | | 16,177,500 | | | | 416,821 | |
Eurex EURO STOXX 50 Futures | | | 2,152 | | | | December 2013 | | | | 83,207,042 | | | | 89,322,128 | | | | 6,115,086 | |
Mini MSCI EAFE Index Futures | | | 12 | | | | December 2013 | | | | 1,069,558 | | | | 1,125,180 | | | | 55,622 | |
Russell 2000 Index Mini-Futures | | | (484 | ) | | | December 2013 | | | | (50,637,387 | ) | | | (53,133,520 | ) | | | (2,496,133 | ) |
S&P 400 Index Mini-Futures | | | (656 | ) | | | December 2013 | | | | (80,426,997 | ) | | | (84,387,840 | ) | | | (3,960,843 | ) |
S&P 500 Index Futures | | | 297 | | | | December 2013 | | | | 124,614,978 | | | | 130,011,750 | | | | 5,396,772 | |
Total Futures Contracts | | | | | | | | | | | | | | | | | | | $4,758,530 | |
| | | | | | | | | | | | | | | | | | |
Credit Default Swaps and Counterparty | | Buy/Sell Protection1 | | Termination
Date | | | Notional
Principal
Amount2 | | | Value3 | | | Unrealized
Gain/(Loss) | |
CDX HY 21, 5 Year, at 5.00%; Bank of America | | Buy | | | 12/20/2018 | | | | $10,500,000 | | | | $19,782 | | | | $19,782 | |
CDX HY 21, 5 Year, at 5.00%; JP Morgan | | Buy | | | 12/20/2018 | | | | 10,500,000 | | | | 19,905 | | | | 19,905 | |
Total Credit Default Swaps | | | | | | | | | | | | | $39,687 | | | | $39,687 | |
1 | As the buyer of protection, Moderately Aggressive Allocation Fund pays periodic fees in return for payment by the seller which is contingent upon an adverse credit event occurring in the underlying issuer or reference entity. As the seller of protection, Moderately Aggressive Allocation Fund collects periodic fees from the buyer and profits if the credit of the underlying issuer or reference entity remains stable or improves while the swap is outstanding, but the seller in a credit default swap contract would be required to pay the amount of credit loss, determined as specified in the agreement, to the buyer in the event of an adverse credit event in the reference entity. |
2 | The maximum potential amount of future payments Moderately Aggressive Allocation Fund could be required to make as the seller or receive as the buyer of protection. |
3 | The values for credit indexes (CDX or LCDX) serve as an indicator of the current status of the payment/performance risk and represent the liability or profit for the credit default swap contract had the contract been closed as of the reporting date. When protection has been sold, the value of the swap will increase when the swap spread declines representing an improvement in the reference entity’s credit worthiness. The value of the swap will decrease when the swap spread increases representing a deterioration in the reference entity’s credit worthiness. When protection has been purchased, the value of the swap will increase when the swap spread increases representing a deterioration in the reference entity’s credit worthiness. The value of the swap will decrease when the swap spread declines representing an improvement in the reference entity’s credit worthiness. |
The accompanying Notes to Financial Statements are an integral part of this schedule.
83
Moderately Aggressive Allocation Fund
Schedule of Investments as of October 31, 2013
The following table summarizes the fair value and Statement of Assets and Liabilities location, as of October 31, 2013, for Moderately Aggressive Allocation Fund’s investments in financial derivative instruments by primary risk exposure as discussed under item (2) Significant Accounting Policies of the Notes to Financial Statements.
| | | | | | |
Derivatives by risk category | | Statement of Assets and Liabilities Location | | Fair Value | |
| | |
Asset Derivatives | | | | | | |
| | |
Interest Rate Contracts | | | | | | |
Futures* | | Net Assets - Net unrealized appreciation/(depreciation) on Futures contracts | | | $416,821 | |
Total Interest Rate Contracts | | | | | 416,821 | |
| | |
Equity Contracts | | | | | | |
Futures* | | Net Assets - Net unrealized appreciation/(depreciation) on Futures contracts | | | 11,567,480 | |
Total Equity Contracts | | | | | 11,567,480 | |
| | |
Credit Contracts | | | | | | |
Credit Default Swaps | | Receivable/Payable - Swap agreements, at value; Net Assets - Net unrealized appreciation/(depreciation) on Swap agreements | | | 39,687 | |
Total Credit Contracts | | | | | 39,687 | |
| |
Total Asset Derivatives | | | | | $12,023,988 | |
| |
| | |
Liability Derivatives | | | | | | |
| | |
Interest Rate Contracts | | | | | | |
Futures* | | Net Assets - Net unrealized appreciation/(depreciation) on Futures contracts | | | 768,795 | |
Total Interest Rate Contracts | | | | | 768,795 | |
| | |
Equity Contracts | | | | | | |
Futures* | | Net Assets - Net unrealized appreciation/(depreciation) on Futures contracts | | | 6,456,976 | |
Total Equity Contracts | | | | | 6,456,976 | |
| |
Total Liability Derivatives | | | | | $7,225,771 | |
| |
* | Includes cumulative appreciation/depreciation of futures contracts as reported in the Schedule of Investments. Only current day’s variation margin is reported within the Statement of Assets and Liabilities. |
The following table summarizes the net realized gains/(losses) and Statement of Operations location, for the period ended October 31, 2013, for Moderately Aggressive Allocation Fund’s investments in financial derivative instruments by primary risk exposure.
| | | | | | |
Derivatives by risk category | | Statement of Operations Location | | Realized Gains/(Losses)
recognized in Income | |
| | |
Interest Rate Contracts | | | | | | |
Futures | | Net realized gains/(losses) on Futures contracts | | | (1,893,527 | ) |
| | |
Total Interest Rate Contracts | | | | | (1,893,527 | ) |
| | |
Equity Contracts | | | | | | |
Options Written | | Net realized gains/(losses) on Written option contracts | | | 9,776 | |
Futures | | Net realized gains/(losses) on Futures contracts | | | 1,622,640 | |
| | |
Total Equity Contracts | | | | | 1,632,416 | |
| | |
Foreign Exchange Contracts | | | | | | |
Forward Contracts | | Net realized gains/(losses) on Foreign currency transactions | | | 130,169 | |
| | |
Total Foreign Exchange Contracts | | | | | 130,169 | |
| | |
Credit Contracts | | | | | | |
Credit Default Swaps | | Net realized gains/(losses) on Swap agreements | | | (1,037,709 | ) |
| | |
Total Credit Contracts | | | | | (1,037,709 | ) |
| |
Total | | | | | ($1,168,651 | ) |
| |
The accompanying Notes to Financial Statements are an integral part of this schedule.
84
Moderately Aggressive Allocation Fund
Schedule of Investments as of October 31, 2013
The following table summarizes the change in net unrealized appreciation/(depreciation) and Statement of Operations location, for the period ended October 31, 2013, for Moderately Aggressive Allocation Fund’s investments in financial derivative instruments by primary risk exposure.
| | | | | | |
Derivatives by risk category | | Statement of Operations Location | | Change in unrealized
appreciation/(depreciation)
recognized in Income | |
| | |
Interest Rate Contracts | | | | | | |
Futures | | Change in net unrealized appreciation/(depreciation) on Futures contracts | | | (343,757 | ) |
| | |
Total Interest Rate Contracts | | | | | (343,757 | ) |
| | |
Equity Contracts | | | | | | |
Futures | | Change in net unrealized appreciation/(depreciation) on Futures contracts | | | 4,744,858 | |
| | |
Total Equity Contracts | | | | | 4,744,858 | |
| | |
Credit Contracts | | | | | | |
Credit Default Swaps | | Change in net unrealized appreciation/(depreciation) on Swap agreements | | | 39,687 | |
| | |
Total Credit Contracts | | | | | 39,687 | |
| | |
Foreign Exchange Contracts | | | | | | |
Forward Contracts | | Change in net unrealized appreciation/(depreciation) on Foreign currency forward contracts | | | 39 | |
| | |
Total Foreign Exchange Contracts | | | | | 39 | |
| |
Total | | | | | $4,440,827 | |
| | |
The following table presents Moderately Aggressive Allocation Fund’s average volume of derivative activity during the period ended October 31, 2013.
| | | | | | | | | | | | | | | | | | | | | | | | | | | | |
Derivative Risk Category | | Futures
(Notional)* | | | Futures
(Percentage
of Average
Net Assets) | | | Forwards
(Notional)* | | | Forwards
(Percentage
of Average
Net Assets) | | | Swaps (Notional)* | | | Swaps
(Percentage
of Average
Net Assets) | | | Options
(Contracts) | |
Equity Contracts | | | $293,456,282 | | | | 19.6 | % | | | N/A | | | | N/A | | | | N/A | | | | N/A | | | | 5 | |
Interest Rate Contracts | | | 66,962,587 | | | | 4.5 | | | | N/A | | | | N/A | | | | N/A | | | | N/A | | | | N/A | |
Foreign Exchange Contracts | | | N/A | | | | N/A | | | | $64,485 | | | | <0.1 | % | | | N/A | | | | N/A | | | | N/A | |
Credit Contracts | | | N/A | | | | N/A | | | | N/A | | | | N/A | | | | $9,217,251 | | | | 0.6 | % | | | N/A | |
* | Notional amount represents long or short, or both, derivative positions held by the Fund. |
The accompanying Notes to Financial Statements are an integral part of this schedule.
85
Moderately Aggressive Allocation Fund
Schedule of Investments as of October 31, 2013
Investment in Affiliates
Affiliated issuers, as defined under the Investment Company Act of 1940, include those in which the Fund’s holdings of an issuer represent 5% or more of the outstanding voting securities of an issuer, or any affiliated mutual fund.
A summary of transactions for the fiscal year to date, in Moderately Aggressive Allocation Fund, is as follows:
| | | | | | | | | | | | | | | | | | | | | | | | |
Fund | | Value
October 31, 2012 | | | Gross
Purchases | | | Gross Sales | | | Shares Held at
October 31, 2013 | | | Value
October 31, 2013 | | | Income Earned November 1, 2012 - October 31, 2013 | |
Growth and Income Plus^, ^^ | | | $11,359,530 | | | | $226,134 | | | | $13,225,838 | | | | – | | | | $– | | | | $226,134 | |
Natural Resources | | | 27,373,309 | | | | 251,287 | | | | – | | | | 3,069,650 | | | | 31,525,305 | | | | 251,287 | |
Partner Small Cap Growth | | | 40,911,660 | | | | 1,185,346 | | | | 4,000,000 | | | | 2,992,538 | | | | 52,578,884 | | | | – | |
Partner Small Cap Value | | | 28,082,450 | | | | 1,126,050 | | | | 3,000,000 | | | | 1,577,393 | | | | 34,229,418 | | | | 649,284 | |
Small Cap Stock | | | 21,636,409 | | | | – | | | | – | | | | 1,344,712 | | | | 28,212,048 | | | | – | |
Mid Cap Growth | | | 36,659,156 | | | | 2,415,392 | | | | – | | | | 1,895,607 | | | | 46,821,497 | | | | – | |
Partner Mid Cap Value | | | 46,806,534 | | | | 1,529,430 | | | | 9,000,000 | | | | 3,128,294 | | | | 51,085,043 | | | | 528,513 | |
Mid Cap Stock | | | 66,792,476 | | | | 296,650 | | | | – | | | | 4,033,886 | | | | 89,108,543 | | | | 296,650 | |
Partner Worldwide Allocation | | | 170,730,097 | | | | 4,125,298 | | | | – | | | | 19,881,077 | | | | 205,967,957 | | | | 4,125,298 | |
Large Cap Growth | | | 84,291,204 | | | | 555,095 | | | | – | | | | 14,356,555 | | | | 109,827,646 | | | | 555,095 | |
Large Cap Value | | | 109,784,766 | | | | 2,305,852 | | | | – | | | | 7,594,853 | | | | 142,251,596 | | | | 2,305,852 | |
Large Cap Stock | | | 78,551,831 | | | | 5,481,045 | | | | 10,000,000 | | | | 3,157,979 | | | | 87,633,904 | | | | 1,250,788 | |
High Yield | | | 53,948,019 | | | | 3,478,089 | | | | 1,754,460 | | | | 11,107,563 | | | | 56,648,574 | | | | 3,476,810 | |
Income | | | 88,454,152 | | | | 2,818,751 | | | | 16,656,245 | | | | 7,961,202 | | | | 72,287,718 | | | | 2,818,824 | |
Government Bond | | | 24,538,470 | | | | 1,172,867 | | | | 701,784 | | | | 2,326,434 | | | | 23,310,870 | | | | 260,139 | |
Limited Maturity Bond | | | 26,345,273 | | | | 292,553 | | | | 7,603,568 | | | | 1,507,894 | | | | 18,893,910 | | | | 293,960 | |
Cash Management Trust- Collateral Investment | | | 1,331,953 | | | | 7,870,124 | | | | 7,896,130 | | | | 1,305,947 | | | | 1,305,947 | | | | 2,929 | |
Cash Management Trust- Short Term Investment | | | 52,425,026 | | | | 175,594,251 | | | | 228,019,277 | | | | – | | | | – | | | | 45,915 | |
Total Value and Income Earned | | | 970,022,315 | | | | | | | | | | | | | | | | 1,051,688,860 | | | | 17,087,478 | |
^ | Prior to August 16, 2013, the Growth and Income Plus Fund was known as the Equity Income Plus Fund. |
^^ | On August 6, 2013, the Thrivent Asset Allocation Funds, as the shareholders of the Thrivent Growth and Income Plus Fund, redeemed their shares in-kind. The Growth and Income Plus Fund distributed fund securities rather than cash as payment for the redemption of these fund shares. These in-kind transactions were conducted at market value. |
The accompanying Notes to Financial Statements are an integral part of this schedule.
86
Moderate Allocation Fund
Schedule of Investments as of October 31, 2013
| | | | | | | | |
Principal Amount | | | Bank Loans (4.0%)a | | Value | |
| Basic Materials (0.3%) | | | | |
| | | | FMG Resources August 2006 Pty., Ltd., Term Loan | | | | |
| $ | 2,772,000 | | | 5.250%, 10/18/2017 | | $ | 2,775,992 | |
| | | | Ineos Group Holdings, Ltd., Term Loan | | | | |
| | 966,549 | | | 4.000%, 5/4/2018 | | | 969,333 | |
| | | | MRC Global, Inc., Term Loan | | | | |
| | 490,050 | | | 6.000%, 11/8/2019 | | | 492,618 | |
| | | | Tronox Pigments BV, Term Loan | | | | |
| | 329,175 | | | 4.500%, 3/19/2020 | | | 331,907 | |
| | | | US Coatings Acquisition, Inc., Term Loan | | | | |
| | 771,125 | | | 4.750%, 2/1/2020 | | | 778,759 | |
| | | | | |
| | | | Total | | | 5,348,609 | |
| | | | | |
| |
| Capital Goods (0.2%) | | | | |
| | | | ADS Waste Holdings, Term Loan | | | | |
| | 506,175 | | | 4.250%, 10/9/2019 | | | 508,797 | |
| | | | Berry Plastics Group, Inc., Term Loan | | | | |
| | 1,651,700 | | | 3.500%, 2/8/2020 | | | 1,644,994 | |
| | | | Silver II Borrower, Term Loan | | | | |
| | 441,663 | | | 4.000%, 12/13/2019 | | | 441,190 | |
| | | | | |
| | | | Total | | | 2,594,981 | |
| | | | | |
| |
| Communications Services (1.7%) | | | | |
| | | | Atlantic Broadband Penn, LLC, Term Loan | | | | |
| | 391,050 | | | 3.250%, 11/30/2019 | | | 389,705 | |
| | | | Cequel Communications, LLC, Term Loan | | | | |
| | 547,222 | | | 3.500%, 2/14/2019 | | | 547,326 | |
| | | | Charter Communications Operating, LLC, Term Loan | | | | |
| | 219,450 | | | 3.000%, 7/1/2020 | | | 217,087 | |
| | | | Clear Channel Communications, Inc., Term Loan | | | | |
| | 331,175 | | | 3.818%, 1/29/2016 | | | 321,005 | |
| | 976,825 | | | 6.918%, 1/30/2019 | | | 928,111 | |
| | | | Cricket Communications, Inc., Term Loan | | | | |
| | 99,250 | | | 4.750%, 10/10/2019 | | | 99,622 | |
| | 1,431,412 | | | 4.750%, 3/8/2020 | | | 1,437,553 | |
| | | | Cumulus Media Holdings, Inc., Term Loan | | | | |
| | 837,854 | | | 4.500%, 9/17/2018 | | | 842,672 | |
| | | | Fairpoint Communications, Term Loan | | | | |
| | 1,104,450 | | | 7.500%, 2/14/2019 | | | 1,124,849 | |
| | | | Grande Communications Networks, LLC, Term Loan | | | | |
| | 648,375 | | | 4.500%, 5/29/2020 | | | 645,944 | |
| | | | Hargray Communications Group, Inc., Term Loan | | | | |
| | 912,713 | | | 4.750%, 6/26/2019 | | | 918,034 | |
| | | | Integra Telecom Holdings, Inc., Term Loan | | | | |
| | 646,750 | | | 5.250%, 2/22/2019 | | | 653,754 | |
| | 220,000 | | | 9.750%, 2/21/2020 | | | 226,004 | |
| | | | Intelsat Jackson Holdings SA, Term Loan | | | | |
| | 633,591 | | | 4.250%, 4/2/2018 | | | 636,625 | |
| | | | Level 3 Communications, Inc., Term Loan | | | | |
| | 960,000 | | | 4.000%, 1/15/2020 | | | 964,003 | |
| | | | Liberty Cablevision of Puerto Rico, Ltd., Term Loan | | | | |
| | 488,812 | | | 6.000%, 6/9/2017 | | | 490,035 | |
| | | | LTS Buyer, LLC, Term Loan | | | | |
| | 493,763 | | | 4.500%, 4/13/2020 | | | 495,204 | |
| | 55,000 | | | 8.000%, 4/12/2021 | | | 55,688 | |
| | | | McGraw-Hill Global Education Holdings, LLC, Term Loan | | | | |
| | 875,600 | | | 9.000%, 3/22/2019 | | | 890,380 | |
| | | | Mediacom Broadband, LLC, Term Loan | | | | |
| | 391,050 | | | 4.000%, 1/20/2020 | | | 391,296 | |
| | | | NEP Broadcasting, LLC, Term Loan | | | | |
| | 2,640,050 | | | 4.750%, 1/22/2020 | | | 2,646,650 | |
| | 62,857 | | | 9.500%, 7/22/2020 | | | 64,468 | |
| | | | NTelos, Inc., Term Loan | | | | |
| | 336,600 | | | 5.750%, 11/9/2019 | | | 337,862 | |
| | | | SBA Senior Finance II, LLC, Term Loan | | | | |
| | 108,138 | | | 3.750%, 9/28/2019 | | | 108,273 | |
| | | | Syniverse Holdings, Inc., Term Loan | | | | |
| | 862,874 | | | 4.000%, 4/23/2019 | | | 864,669 | |
| | | | TNS, Inc., Term Loan | | | | |
| | 669,259 | | | 5.000%, 2/14/2020 | | | 673,161 | |
| | | | Univision Communications, Inc., Term Loan | | | | |
| | 532,325 | | | 4.500%, 2/28/2020 | | | 534,875 | |
| | 310,228 | | | 4.500%, 3/1/2020 | | | 311,714 | |
| | 218,900 | | | 4.500%, 3/1/2020 | | | 219,995 | |
| | | | Virgin Media Investment Holdings, Ltd., Term Loan | | | | |
| | 2,355,000 | | | 3.500%, 6/8/2020 | | | 2,353,940 | |
| | | | Visant Corporation, Term Loan | | | | |
| | 1,038,721 | | | 5.250%, 12/22/2016 | | | 1,018,684 | |
| | | | WideOpenWest Finance, LLC, Term Loan | | | | |
| | 1,447,725 | | | 4.750%, 4/1/2019 | | | 1,459,191 | |
| | | | Yankee Cable Acquisition, LLC, Term Loan | | | | |
| | 861,477 | | | 5.250%, 3/1/2020 | | | 865,112 | |
| | | | Zayo Group, LLC, Term Loan | | | | |
| | 2,684,611 | | | 4.500%, 7/2/2019 | | | 2,696,369 | |
| | | | | |
| | | | Total | | | 26,429,860 | |
| | | | | |
| |
| Consumer Cyclical (0.4%) | | | | |
| | | | Bally Technologies, Inc., Term Loan | | | | |
| | 670,000 | | | 0.000%, 7/16/2021b,c | | | 671,675 | |
| | | | Burlington Coat Factory Warehouse Corporation, Term Loan | | | | |
| | 557,581 | | | 4.250%, 2/23/2017 | | | 561,239 | |
| | | | Cenveo Corporation, Term Loan | | | | |
| | 492,525 | | | 6.250%, 2/13/2017 | | | 496,835 | |
| | | | Ceridian Corporation, Term Loan | | | | |
| | 385,000 | | | 4.420%, 5/9/2017 | | | 386,829 | |
| | | | Chrysler Group, LLC, Term Loan | | | | |
| | 726,285 | | | 4.250%, 5/24/2017 | | | 732,458 | |
The accompanying Notes to Financial Statements are an integral part of this schedule.
87
Moderate Allocation Fund
Schedule of Investments as of October 31, 2013
| | | | | | | | |
Principal Amount | | | Bank Loans (4.0%)a | | Value | |
| Consumer Cyclical (0.4%) - continued | | | | |
| | | | J.C. Penney Corporation, Inc., Term Loan | | | | |
| | $324,188 | | | 6.000%, 5/22/2018 | | | $313,292 | |
| | | | MGM Resorts International, Term Loan | | | | |
| | 714,600 | | | 3.500%, 12/20/2019 | | | 713,449 | |
| | | | ROC Finance, LLC, Term Loan | | | | |
| | 1,210,000 | | | 5.000%, 6/20/2019 | | | 1,182,775 | |
| | | | Seminole Indian Tribe of Florida, Term Loan | | | | |
| | 395,650 | | | 3.000%, 4/29/2020 | | | 394,578 | |
| | | | Seven Seas Cruises S de RL, LLC, Term Loan | | | | |
| | 874,000 | | | 4.750%, 12/21/2018 | | | 881,647 | |
| | | | Toys R Us, Inc., Term Loan | | | | |
| | 732,032 | | | 5.250%, 5/25/2018 | | | 659,971 | |
| | | | | |
| | | | Total | | | 6,994,748 | |
| | | | | |
| |
| Consumer Non-Cyclical (0.5%) | | | | |
| | | | Albertsons, LLC, Term Loan | | | | |
| | 960,175 | | | 4.750%, 3/21/2019 | | | 962,556 | |
| | | | Biomet, Inc., Term Loan | | | | |
| | 698,250 | | | 3.690%, 7/25/2017 | | | 702,761 | |
| | | | CHS/Community Health Systems, Inc., Term Loan | | | | |
| | 495,000 | | | 3.760%, 1/25/2017 | | | 496,237 | |
| | | | Del Monte Corporation, Term Loan | | | | |
| | 140,620 | | | 4.000%, 3/8/2018 | | | 140,620 | |
| | | | DJO Finance, LLC, Term Loan | | | | |
| | 816,624 | | | 4.750%, 9/15/2017 | | | 824,447 | |
| | | | Grifols, Inc., Term Loan | | | | |
| | 486,940 | | | 4.250%, 6/1/2017 | | | 489,935 | |
| | | | Hologic, Inc., Term Loan | | | | |
| | 473,415 | | | 3.750%, 8/1/2019 | | | 475,546 | |
| | | | JBS USA, LLC, Term Loan | | | | |
| | 823,775 | | | 3.750%, 5/25/2018 | | | 821,716 | |
| | | | Reynolds Group Holdings, Inc., Term Loan | | | | |
| | 99,000 | | | 4.750%, 9/28/2018 | | | 99,773 | |
| | | | Rite Aid Corporation, Term Loan | | | | |
| | 164,175 | | | 4.000%, 2/21/2020 | | | 164,945 | |
| | 330,000 | | | 5.750%, 8/21/2020 | | | 337,544 | |
| | | | Roundy’s Supermarkets, Inc., Term Loan | | | | |
| | 808,676 | | | 5.750%, 2/13/2019 | | | 798,567 | |
| | | | Supervalu, Inc., Term Loan | | | | |
| | 1,018,031 | | | 5.000%, 3/21/2019 | | | 1,023,823 | |
| | | | Van Wagner Communications, LLC, Term Loan | | | | |
| | 582,075 | | | 6.250%, 8/3/2018 | | | 590,562 | |
| | | | | |
| | | | Total | | | 7,929,032 | |
| | | | | |
| |
| Energy (0.2%) | | | | |
| | | | Arch Coal, Inc., Term Loan | | | | |
| | 711,572 | | | 5.750%, 5/16/2018 | | | 689,485 | |
| | | | Chesapeake Energy Corporation, Term Loan | | | | |
| | 1,590,000 | | | 5.750%, 12/2/2017 | | | 1,623,788 | |
| | | | Offshore Group Investment, Ltd., Term Loan | | | | |
| | 865,650 | | | 5.750%, 3/28/2019 | | | 870,792 | |
| | | | Pacific Drilling SA, Term Loan | | | | |
| | 433,912 | | | 4.500%, 6/3/2018 | | | 435,357 | |
| | | | | |
| | | | Total | | | 3,619,422 | |
| | | | | |
| |
| Financials (0.1%) | | | | |
| | | | GEO Group, Inc., Term Loan | | | | |
| | 218,900 | | | 3.250%, 4/3/2020 | | | 219,721 | |
| | | | MoneyGram International, Inc., Term Loan | | | | |
| | 875,600 | | | 4.250%, 3/27/2020 | | | 878,008 | |
| | | | WaveDivision Holdings, LLC, Term Loan | | | | |
| | 1,012,350 | | | 4.000%, 10/12/2019 | | | 1,014,881 | |
| | | | | |
| | | | Total | | | 2,112,610 | |
| | | | | |
| |
| Technology (0.3%) | | | | |
| | | | First Data Corporation Extended, Term Loan | | | | |
| | 1,095,000 | | | 4.170%, 3/23/2018 | | | 1,095,394 | |
| | | | First Data Corporation, Term Loan | | | | |
| | 395,000 | | | 4.170%, 9/24/2018 | | | 395,371 | |
| | | | Freescale Semiconductor, Inc., Term Loan | | | | |
| | 800,975 | | | 5.000%, 3/1/2020 | | | 807,832 | |
| | 507,000 | | | 5.000%, 1/15/2021 | | | 511,436 | |
| | | | Infor US, Inc., Term Loan | | | | |
| | 466,471 | | | 5.250%, 4/5/2018 | | | 469,881 | |
| | | | SunGard Data Systems, Inc., Term Loan | | | | |
| | 1,022,275 | | | 4.500%, 1/31/2020 | | | 1,027,376 | |
| | | | | |
| | | | Total | | | 4,307,290 | |
| | | | | |
| |
| Transportation (0.2%) | | | | |
| | | | American Airlines, Inc., Term Loan | | | | |
| | 912,712 | | | 4.750%, 6/27/2019 | | | 917,468 | |
| | | | American Petroleum Tankers Parent, LLC, Term Loan | | | | |
| | 250,556 | | | 4.750%, 10/2/2019 | | | 250,555 | |
| | | | Delta Air Lines, Inc., Term Loan | | | | |
| | 853,622 | | | 4.250%, 4/20/2017 | | | 857,430 | |
| | | | United Air Lines, Inc., Term Loan | | | | |
| | 547,250 | | | 4.000%, 4/1/2019 | | | 549,849 | |
| | | | | |
| | | | Total | | | 2,575,302 | |
| | | | | |
| |
| Utilities (0.1%) | | | | |
| | | | Calpine Corporation, Term Loan | | | | |
| | 163,740 | | | 4.000%, 4/1/2018 | | | 164,395 | |
| | 777,150 | | | 4.000%, 10/9/2019 | | | 780,857 | |
| | | | Intergen NV, Term Loan | | | | |
| | 423,938 | | | 5.500%, 6/15/2020 | | | 422,878 | |
| | | | NGPL PipeCo, LLC, Term Loan | | | | |
| | 694,141 | | | 6.750%, 9/15/2017 | | | 648,730 | |
| | | | | |
| | | | Total | | | 2,016,860 | |
| | | | | |
| | | | | | | | |
| | | | | |
| | | | Total Bank Loans (cost $63,628,339) | | | 63,928,714 | |
| | | | | |
The accompanying Notes to Financial Statements are an integral part of this schedule.
88
Moderate Allocation Fund
Schedule of Investments as of October 31, 2013
| | | | | | | | |
| Shares | | | Mutual Funds (60.3%) | | Value | |
| Equity Mutual Funds (38.4%) | | | | |
| | 2,764,537 | | | Thrivent Natural Resources Fund | | | $28,391,795 | |
| | 1,972,795 | | | Thrivent Partner Small Cap Growth Fund | | | 34,662,005 | |
| | 1,500,337 | | | Thrivent Partner Small Cap Value Fund | | | 32,557,322 | |
| | 882,584 | | | Thrivent Small Cap Stock Fundd | | | 18,516,616 | |
| | 661,623 | | | Thrivent Mid Cap Growth Fund | | | 16,342,089 | |
| | 2,065,352 | | | Thrivent Partner Mid Cap Value Fund | | | 33,727,203 | |
| | 2,628,283 | | | Thrivent Mid Cap Stock Fund | | | 58,058,777 | |
| | 15,196,494 | | | Thrivent Partner Worldwide Allocation Fund | | | 157,435,673 | |
| | 11,301,004 | | | Thrivent Large Cap Growth Fund | | | 86,452,682 | |
| | 6,465,916 | | | Thrivent Large Cap Value Fund | | | 121,106,616 | |
| | 1,235,168 | | | Thrivent Large Cap Stock Fund | | | 34,275,906 | |
| | | | | |
| | | | Total | | | 621,526,684 | |
| | | | | |
| |
| Fixed Income Mutual Funds (21.9%) | | | | |
| | 9,458,322 | | | Thrivent High Yield Fund | | | 48,237,443 | |
| | 18,535,053 | | | Thrivent Income Fund | | | 168,298,285 | |
| | 2,367,882 | | | Thrivent Government Bond Fund | | | 23,726,175 | |
| | 9,111,526 | | | Thrivent Limited Maturity Bond Fund | | | 114,167,422 | |
| | | | | |
| | | | Total | | | 354,429,325 | |
| | | | | |
| | | | | | | | |
| | | | | |
| | | | Total Mutual Funds (cost $805,976,170) | | | 975,956,009 | |
| | | | | |
| | |
| Shares | | | Common Stock (15.4%) | | Value | |
| Consumer Discretionary (2.4%) | | | | |
| | 10,000 | | | 888 Holdings Public Company, Ltd. | | | 25,485 | |
| | 4,250 | | | Amazon.com, Inc.d | | | 1,547,128 | |
| | 2,200 | | | AutoZone, Inc.d | | | 956,318 | |
| | 12,100 | | | Barnes & Noble, Inc.d | | | 170,973 | |
| | 4,800 | | | Best Buy Company, Inc. | | | 205,440 | |
| | 3,100 | | | BJ’s Restaurants, Inc.d | | | 83,886 | |
| | 24,800 | | | Cablevision Systems Corporation | | | 385,640 | |
| | 9,110 | | | CBS Corporation | | | 538,765 | |
| | 3,000 | | | Charter Communications, Inc.d | | | 402,720 | |
| | 19,140 | | | Cheesecake Factory, Inc. | | | 904,365 | |
| | 3,400 | | | Children’s Place Retail Stores, Inc.d | | | 185,606 | |
| | 5,400 | | | Cineworld Group plc | | | 32,113 | |
| | 79,800 | | | Comcast Corporation | | | 3,796,884 | |
| | 700 | | | Continental AG | | | 128,007 | |
| | 7,800 | | | Dana Holding Corporation | | | 152,880 | |
| | 21,400 | | | David Jones, Ltd. | | | 54,999 | |
| | 24,812 | | | Delphi Automotive plc | | | 1,419,246 | |
| | 9,300 | | | DISH Network Corporation | | | 448,260 | |
| | 5,650 | | | Finish Line, Inc. | | | 141,476 | |
| | 2,496 | | | Foot Locker, Inc. | | | 86,611 | |
| | 70,900 | | | Ford Motor Company | | | 1,213,099 | |
| | 12,700 | | | Francesca’s Holdings Corporationd | | | 228,473 | |
| | 7,900 | | | Gannett Company, Inc. | | | 218,593 | |
| | 2,400 | | | General Motors Companyd | | | 88,680 | |
| | 6,780 | | | GNC Holdings, Inc. | | | 398,800 | |
| | 1,700 | | | Gtech SPA | | | 51,628 | |
| | 17,400 | | | Halfords Group plc | | | 117,849 | |
| | 10,300 | | | Harley-Davidson, Inc. | | | 659,612 | |
| | 3,283 | | | Hasbro, Inc. | | | 169,567 | |
| | 2,000 | | | Haseko Corporationd | | | 14,824 | |
| | 17,200 | | | Home Depot, Inc. | | | 1,339,708 | |
| | 21,409 | | | Ignite Restaurant Group, Inc.d | | | 343,829 | |
| | 3,000 | | | iRobot Corporationd | | | 101,610 | |
| | 41,400 | | | ITV plc | | | 126,585 | |
| | 4,200 | | | Kingfisher plc | | | 25,408 | |
| | 25,810 | | | Las Vegas Sands Corporation | | | 1,812,378 | |
| | 9,707 | | | LifeLock, Inc.d | | | 156,186 | |
| | 21,500 | | | Link REIT | | | 108,159 | |
| | 43,000 | | | Lowe’s Companies, Inc. | | | 2,140,540 | |
| | 5,307 | | | M/I Homes, Inc.d | | | 108,634 | |
| | 11,600 | | | Macy’s, Inc. | | | 534,876 | |
| | 4,400 | | | Marriott International, Inc. | | | 198,352 | |
| | 4,500 | | | Marriott Vacations Worldwide Corporationd | | | 225,360 | |
| | 19,361 | | | MDC Partners, Inc. | | | 596,900 | |
| | 25,900 | | | Mediaset SPAd | | | 129,337 | |
| | 16,460 | | | Meredith Corporation | | | 844,398 | |
| | 4,300 | | | Michael Kors Holdings, Ltd.d | | | 330,885 | |
| | 4,600 | | | Mitchells & Butlers plcd | | | 29,549 | |
| | 2,800 | | | Multimedia Games Holding Company, Inc.d | | | 91,028 | |
| | 4,100 | | | N Brown Group plc | | | 34,455 | |
| | 31,760 | | | News Corporation | | | 1,079,840 | |
| | 15,590 | | | Nexstar Broadcasting Group, Inc. | | | 692,040 | |
| | 2,600 | | | NH Hoteles SAd | | | 13,570 | |
| | 16,700 | | | NIKE, Inc. | | | 1,265,192 | |
| | 6,300 | | | Omnicom Group, Inc. | | | 429,093 | |
| | 2,600 | | | Pandora AS | | | 123,959 | |
| | 8,940 | | | Papa John’s International, Inc. | | | 676,490 | |
| | 5,700 | | | Penn National Gaming, Inc.d | | | 333,507 | |
| | 12,411 | | | Pier 1 Imports, Inc. | | | 259,142 | |
| | 1,200 | | | Priceline.com, Inc.d | | | 1,264,596 | |
| | 6,400 | | | Regal Entertainment Group | | | 121,664 | |
| | 1,500 | | | Renault SA | | | 130,876 | |
| | 3,800 | | | Safilo Group SPAd | | | 77,687 | |
| | 5,000 | | | Scripps Networks Interactive, Inc. | | | 402,500 | |
| | 4,700 | | | Seven West Media, Ltd. | | | 11,198 | |
| | 4,400 | | | Signet Jewelers, Ltd. | | | 328,504 | |
| | 40,000 | | | SJM Holdings, Ltd. | | | 129,334 | |
| | 31,400 | | | Smith & Wesson Holding Corporationd | | | 338,492 | |
| | 15,300 | | | Southern Cross Media Group, Ltd. | | | 27,303 | |
| | 9,300 | | | Starwood Hotels & Resorts Worldwide, Inc. | | | 684,666 | |
| | 6,400 | | | Sturm, Ruger & Company, Inc. | | | 418,624 | |
| | 1,300 | | | Takkt AG | | | 25,814 | |
| | 2,200 | | | Target Corporation | | | 142,538 | |
| | 6,900 | | | Tempur-Pedic International, Inc.d | | | 264,615 | |
| | 3,900 | | | The Restaurant Group plc | | | 35,991 | |
| | 44,200 | | | Thomas Cook Group plcd | | | 101,730 | |
| | 9,200 | | | Time Warner Cable, Inc. | | | 1,105,380 | |
| | 3,700 | | | TJX Companies, Inc. | | | 224,923 | |
| | 10,200 | | | Toll Brothers, Inc.d | | | 335,376 | |
| | 12,100 | | | TomTom NVd | | | 93,428 | |
| | 3,600 | | | Toyota Motor Corporation | | | 233,418 | |
| | 24,900 | | | Tuesday Morning Corporationd | | | 352,335 | |
| | 31,850 | | | Twenty-First Century Fox, Inc. | | | 1,085,448 | |
| | 3,000 | | | Urban Outfitters, Inc.d | | | 113,640 | |
| | 3,800 | | | USS Company, Ltd. | | | 55,649 | |
| | 4,000 | | | Valassis Communications, Inc. | | | 109,440 | |
| | 300 | | | Valeo SA | | | 29,679 | |
| | 10,600 | | | Viacom, Inc. | | | 882,874 | |
The accompanying Notes to Financial Statements are an integral part of this schedule.
89
Moderate Allocation Fund
Schedule of Investments as of October 31, 2013
| | | | | | | | |
| Shares | | | Common Stock (15.4%) | | Value | |
| Consumer Discretionary (2.4%) - continued | | | | |
| | 11,200 | | | Wyndham Worldwide Corporation | | | $743,680 | |
| | | | | |
| | | | Total | | | 38,850,339 | |
| | | | | |
| |
| Consumer Staples (0.9%) | | | | |
| | 22,400 | | | Altria Group, Inc. | | | 833,952 | |
| | 2,054 | | | Andersons, Inc. | | | 152,366 | |
| | 5,700 | | | Anheuser-Busch InBev NV ADR | | | 591,261 | |
| | 11,445 | | | Annie’s, Inc.d | | | 540,776 | |
| | 7,160 | | | British American Tobacco plc ADR | | | 791,108 | |
| | 2,400 | | | Brown-Forman Corporation | | | 175,152 | |
| | 4,600 | | | Bunge, Ltd. | | | 377,798 | |
| | 1,800 | | | Campbell Soup Company | | | 76,626 | |
| | 12,200 | | | Colgate-Palmolive Company | | | 789,706 | |
| | 1,200 | | | Cranswick plc | | | 20,632 | |
| | 35,700 | | | CVS Caremark Corporation | | | 2,222,682 | |
| | 806 | | | Energizer Holdings, Inc. | | | 79,077 | |
| | 9,800 | | | Green Mountain Coffee Roasters, Inc.d | | | 615,538 | |
| | 22,900 | | | Greencore Group plc | | | 66,129 | |
| | 1,200 | | | Henkel AG & Company KGaA | | | 129,565 | |
| | 1,100 | | | Herbalife, Ltd. | | | 71,302 | |
| | 1,000 | | | ICA Gruppen ABd | | | 30,222 | |
| | 8,913 | | | Ingredion, Inc. | | | 586,119 | |
| | 5,740 | | | Kimberly-Clark Corporation | | | 619,920 | |
| | 4,200 | | | Koninklijke (Royal) Ahold NV | | | 79,828 | |
| | 8,382 | | | Kraft Foods Group, Inc. | | | 455,813 | |
| | 18,900 | | | Kroger Company | | | 809,676 | |
| | 630 | | | Leroy Seafood Group ASA | | | 19,468 | |
| | 1,200 | | | Mandom Corporation | | | 41,197 | |
| | 25,247 | | | Mondelez International, Inc. | | | 849,309 | |
| | 10,200 | | | Nestle SA | | | 736,276 | |
| | 6,589 | | | Philip Morris International, Inc. | | | 587,212 | |
| | 9,600 | | | Procter & Gamble Company | | | 775,200 | |
| | 200 | | | Royal Unibrew AS | | | 25,668 | |
| | 6,600 | | | Wal-Mart Stores, Inc. | | | 506,550 | |
| | 37,900 | | | WhiteWave Foods Companyd | | | 758,379 | |
| | 4,100 | | | Woolworths, Ltd. | | | 135,204 | |
| | | | | |
| | | | Total | | | 14,549,711 | |
| | | | | |
| |
| Energy (1.3%) | | | | |
| | 12,200 | | | Anadarko Petroleum Corporation | | | 1,162,538 | |
| | 1,500 | | | Atwood Oceanics, Inc.d | | | 79,695 | |
| | 20,804 | | | BW Offshore, Ltd. | | | 28,472 | |
| | 1,182 | | | Cabot Oil & Gas Corporation | | | 41,748 | |
| | 1,300 | | | Cameron International Corporationd | | | 71,318 | |
| | 7,560 | | | Chevron Corporation | | | 906,898 | |
| | 550 | | | Cimarex Energy Company | | | 57,942 | |
| | 7,300 | | | Cloud Peak Energy, Inc.d | | | 113,953 | |
| | 700 | | | Concho Resources, Inc.d | | | 77,427 | |
| | 22,400 | | | Consol Energy, Inc. | | | 817,600 | |
| | 4,200 | | | Denbury Resources, Inc.d | | | 79,758 | |
| | 1,400 | | | Energy XXI, Ltd. | | | 40,684 | |
| | 1,100 | | | Ensco plc | | | 63,415 | |
| | 8,739 | | | EOG Resources, Inc. | | | 1,559,038 | |
| | 14,020 | | | EQT Corporation | | | 1,200,252 | |
| | 5,900 | | | Exterran Holdings, Inc.d | | | 168,445 | |
| | 22,900 | | | Exxon Mobil Corporation | | | 2,052,298 | |
| | 1,317 | | | Fred Olsen Energy ASA | | | 55,345 | |
| | 2,100 | | | Helix Energy Solutions Group, Inc.d | | | 49,686 | |
| | 1,050 | | | Helmerich & Payne, Inc. | | | 81,427 | |
| | 18,250 | | | HollyFrontier Corporation | | | 840,595 | |
| | 4,300 | | | Hunting plc | | | 61,434 | |
| | 20,800 | | | JX Holdings, Inc. | | | 102,849 | |
| | 72,585 | | | Marathon Oil Corporation | | | 2,559,347 | |
| | 1,100 | | | Marathon Petroleum Corporation | | | 78,826 | |
| | 16,500 | | | Nabors Industries, Ltd. | | | 288,420 | |
| | 900 | | | National Oilwell Varco, Inc. | | | 73,062 | |
| | 1,900 | | | Newfield Exploration Companyd | | | 57,855 | |
| | 1,700 | | | Noble Corporation | | | 64,090 | |
| | 1,100 | | | Noble Energy, Inc. | | | 82,423 | |
| | 7,540 | | | Oasis Petroleum, Inc.d | | | 401,505 | |
| | 6,300 | | | Oceaneering International, Inc. | | | 541,044 | |
| | 870 | | | Oil States International, Inc.d | | | 94,508 | |
| | 10,000 | | | Peabody Energy Corporation | | | 194,800 | |
| | 450 | | | Pioneer Natural Resources Company | | | 92,151 | |
| | 750 | | | Range Resources Corporation | | | 56,783 | |
| | 30,910 | | | Rex Energy Corporationd | | | 664,565 | |
| | 11,980 | | | Rosetta Resources, Inc.d | | | 718,081 | |
| | 1,600 | | | Rowan Companies plcd | | | 57,728 | |
| | 21,540 | | | Schlumberger, Ltd. | | | 2,018,729 | |
| | 770 | | | SM Energy Company | | | 68,230 | |
| | 3,000 | | | Superior Energy Services, Inc.d | | | 80,490 | |
| | 9,700 | | | Tesoro Corporation | | | 474,233 | |
| | 11,000 | | | TonenGeneral Sekiyu KK | | | 102,184 | |
| | 25,700 | | | Total SA ADR | | | 1,572,326 | |
| | 87,800 | | | Weatherford International, Ltd.d | | | 1,443,432 | |
| | 950 | | | Whiting Petroleum Corporationd | | | 63,545 | |
| | | | | |
| | | | Total | | | 21,561,174 | |
| | | | | |
| |
| Financials (3.4%) | | | | |
| | 14,750 | | | ACE, Ltd. | | | 1,407,740 | |
| | 3,300 | | | Aegon NV | | | 26,258 | |
| | 5,431 | | | Affiliated Managers Group, Inc.d | | | 1,072,297 | |
| | 3,260 | | | Allied World Assurance Company Holdings AG | | | 353,025 | |
| | 11,420 | | | Allstate Corporation | | | 605,945 | |
| | 5,820 | | | American Assets Trust, Inc. | | | 193,748 | |
| | 17,900 | | | American International Group, Inc. | | | 924,535 | |
| | 4,500 | | | AmTrust Financial Services, Inc. | | | 172,620 | |
| | 4,320 | | | Aspen Insurance Holdings, Ltd. | | | 168,523 | |
| | 18,600 | | | Aviva plc | | | 133,529 | |
| | 6,400 | | | AXA SA | | | 159,459 | |
| | 7,200 | | | Axis Capital Holdings, Ltd. | | | 341,424 | |
| | 125,740 | | | Bank of America Corporation | | | 1,755,330 | |
| | 5,600 | | | Bankinter SA | | | 34,144 | |
| | 4,600 | | | Banner Corporation | | | 175,996 | |
| | 9,600 | | | Barclays plc | | | 40,392 | |
| | 8,080 | | | BBCN Bancorp, Inc. | | | 119,826 | |
| | 16,600 | | | Berkshire Hathaway, Inc.d | | | 1,910,328 | |
| | 2,400 | | | BNP Paribas SA | | | 177,056 | |
| | 4,000 | | | Camden Property Trust | | | 256,800 | |
| | 67,000 | | | CapitaMall Trust | | | 108,821 | |
| | 58,000 | | | Citigroup, Inc. | | | 2,829,240 | |
| | 3,031 | | | CNA Financial Corporation | | | 123,028 | |
| | 16,710 | | | CNO Financial Group, Inc. | | | 260,342 | |
| | 4,690 | | | Columbia Banking System, Inc. | | | 120,486 | |
| | 5,800 | | | Comerica, Inc. | | | 251,140 | |
| | 24,400 | | | Credit Suisse Group ADRd | | | 759,572 | |
| | 4,600 | | | Credit Suisse Group AGd | | | 143,097 | |
| | 900 | | | Daibiru Corporation | | | 11,469 | |
The accompanying Notes to Financial Statements are an integral part of this schedule.
90
Moderate Allocation Fund
Schedule of Investments as of October 31, 2013
| | | | | | | | |
| Shares | | | Common Stock (15.4%) | | Value | |
| Financials (3.4%) - continued | | | | |
| | 24,280 | | | DCT Industrial Trust, Inc. | | | $188,170 | |
| | 11,400 | | | Deutsche Bank AG | | | 550,848 | |
| | 6,500 | | | Discover Financial Services | | | 337,220 | |
| | 5,098 | | | DnB ASA | | | 90,370 | |
| | 3,900 | | | Evercore Partners, Inc. | | | 196,833 | |
| | 3,530 | | | Extra Space Storage, Inc. | | | 162,345 | |
| | 37,900 | | | Fifth Third Bancorp | | | 721,237 | |
| | 31,300 | | | First Horizon National Corporation | | | 333,345 | |
| | 8,300 | | | First Industrial Realty Trust, Inc. | | | 149,981 | |
| | 8,400 | | | First Republic Bank | | | 428,988 | |
| | 9,000 | | | Franklin Street Properties Corporation | | | 118,800 | |
| | 9,300 | | | Fulton Financial Corporation | | | 113,553 | |
| | 4,900 | | | FXCM, Inc. | | | 80,311 | |
| | 5,800 | | | GAM Holding AGd | | | 108,378 | |
| | 8,000 | | | Grainger plc | | | 24,983 | |
| | 2,500 | | | Greenhill & Company, Inc. | | | 128,250 | |
| | 21,020 | | | Hanmi Financial Corporation | | | 367,430 | |
| | 13,131 | | | HCC Insurance Holdings, Inc. | | | 599,430 | |
| | 5,971 | | | Henderson Group plc | | | 20,496 | |
| | 14,000 | | | Henderson Land Development Company, Ltd. | | | 82,842 | |
| | 4,900 | | | Home Loan Servicing Solutions, Ltd. | | | 115,689 | |
| | 20,757 | | | Host Hotels & Resorts, Inc. | | | 385,042 | |
| | 60,000 | | | Huntington Bancshares, Inc. | | | 528,000 | |
| | 14,500 | | | Intermediate Capital Group plc | | | 111,268 | |
| | 2,800 | | | International Personal Finance plc | | | 25,877 | |
| | 29,090 | | | Invesco, Ltd. | | | 981,788 | |
| | 15,000 | | | iShares Barclays 1-3 Year Credit Bond Fund | | | 1,581,600 | |
| | 12,410 | | | iShares Russell 2000 Index Fund | | | 1,355,544 | |
| | 1,000 | | | iShares Russell 3000 Index Fund | | | 105,420 | |
| | 35,376 | | | J.P. Morgan Chase & Company | | | 1,823,279 | |
| | 2,900 | | | Japan Securities Finance Company, Ltd. | | | 21,270 | |
| | 2,400 | | | KBC Groep NV | | | 130,756 | |
| | 5,000 | | | Kerry Properties, Ltd. | | | 21,683 | |
| | 10,191 | | | Lazard, Ltd. | | | 393,882 | |
| | 122,700 | | | Lloyds TSB Group plcd | | | 151,756 | |
| | 3,200 | | | M&T Bank Corporation | | | 360,096 | |
| | 4,500 | | | Macerich Company | | | 266,445 | |
| | 3,400 | | | MasterCard, Inc. | | | 2,438,140 | |
| | 36,420 | | | MetLife, Inc. | | | 1,723,030 | |
| | 26,100 | | | Mitsubishi UFJ Financial Group, Inc. | | | 166,212 | |
| | 8,500 | | | Mitsui & Company, Ltd. | | | 121,430 | |
| | 2,000 | | | Mitsui Fudosan Company, Ltd. | | | 66,252 | |
| | 58,600 | | | Mizuho Financial Group, Inc. | | | 123,005 | |
| | 5,100 | | | Montpelier Re Holdings, Inc. | | | 140,811 | |
| | 39,650 | | | Morgan Stanley | | | 1,139,145 | |
| | 4,100 | | | MS and AD Insurance Group Holdings, Inc. | | | 106,015 | |
| | 2,700 | | | MSCI, Inc.d | | | 110,079 | |
| | 13,800 | | | NASDAQ OMX Group, Inc. | | | 488,934 | |
| | 3,300 | | | Nordea Bank AB | | | 42,212 | |
| | 22,100 | | | North Pacific Bank, Ltd. | | | 96,496 | |
| | 7,300 | | | Northern Trust Corporation | | | 411,866 | |
| | 6,200 | | | NTT Urban Development Corporation | | | 79,145 | |
| | 15,000 | | | Oversea-Chinese Banking Corporation, Ltd. | | | 125,482 | |
| | 9,650 | | | Parkway Properties, Inc. | | | 174,762 | |
| | 6,730 | | | Pebblebrook Hotel Trust | | | 203,246 | |
| | 15,900 | | | Piedmont Office Realty Trust, Inc. | | | 293,832 | |
| | 7,179 | | | Popular, Inc.d | | | 181,270 | |
| | 2,800 | | | Portfolio Recovery Associates, Inc.d | | | 166,460 | |
| | 4,500 | | | Progressive Corporation | | | 116,865 | |
| | 8,200 | | | Protective Life Corporation | | | 377,856 | |
| | 9,900 | | | Prudential Financial, Inc. | | | 805,761 | |
| | 6,000 | | | Prudential plc | | | 122,706 | |
| | 8,200 | | | Raymond James Financial, Inc. | | | 374,330 | |
| | 2,700 | | | SBI Holdings, Inc. | | | 32,675 | |
| | 4,000 | | | Shinsei Bank, Ltd. | | | 9,365 | |
| | 28,600 | | | SLM Corporation | | | 725,582 | |
| | 3,200 | | | Spar Nord Bank ASd | | | 28,587 | |
| | 23,300 | | | SPDR EURO STOXX 50 ETF | | | 950,407 | |
| | 38,800 | | | SPDR S&P 500 ETF Trust | | | 6,818,324 | |
| | 2,680 | | | SPDR S&P Biotech ETF | | | 318,893 | |
| | 13,190 | | | State Street Corporation | | | 924,223 | |
| | 4,818 | | | Stewart Information Services Corporation | | | 150,900 | |
| | 3,100 | | | Sumitomo Mitsui Financial Group, Inc. | | | 149,841 | |
| | 17,300 | | | SVB Financial Groupd | | | 1,656,994 | |
| | 2,061 | | | Taubman Centers, Inc. | | | 135,593 | |
| | 13,400 | | | TCF Financial Corporation | | | 203,412 | |
| | 17,064 | | | Terreno Realty Corporation | | | 303,398 | |
| | 7,700 | | | Texas Capital Bancshares, Inc.d | | | 400,785 | |
| | 4,200 | | | The Dai-Ichi Mutual Life Insurance Company, Ltd. | | | 59,958 | |
| | 13,000 | | | The Paragon Group Of Companies plc | | | 70,525 | |
| | 3,500 | | | Tokio Marine Holdings, Inc. | | | 114,746 | |
| | 2,000 | | | Tokyo Tatemono Company, Ltd. | | | 18,776 | |
| | 6,000 | | | Visa, Inc. | | | 1,180,020 | |
| | 13,982 | | | W.R. Berkley Corporation | | | 613,950 | |
| | 24,320 | | | Wells Fargo & Company | | | 1,038,221 | |
| | 32,926 | | | Zions Bancorporation | | | 934,111 | |
| | | | | |
| | | | Total | | | 54,834,003 | |
| | | | | |
| |
| Health Care (1.8%) | | | | |
| | 3,300 | | | Abbott Laboratories | | | 120,615 | |
| | 7,100 | | | Acorda Therapeutics, Inc.d | | | 217,331 | |
| | 600 | | | Actelion, Ltd.d | | | 46,422 | |
| | 22,410 | | | Akorn, Inc.d | | | 458,060 | |
| | 14,860 | | | Align Technology, Inc.d | | | 847,912 | |
| | 28,300 | | | Allscripts Healthcare Solutions, Inc.d | | | 391,389 | |
| | 2,600 | | | AmerisourceBergen Corporation | | | 169,858 | |
| | 20,470 | | | Baxter International, Inc. | | | 1,348,359 | |
| | 1,700 | | | Biogen Idec, Inc.d | | | 415,123 | |
| | 36,300 | | | BioScrip, Inc.d | | | 254,463 | |
| | 2,867 | | | C.R. Bard, Inc. | | | 390,543 | |
| | 1,500 | | | Catamaran Corporationd | | | 70,440 | |
| | 5,100 | | | Centene Corporationd | | | 286,416 | |
| | 2,100 | | | Charles River Laboratories International, Inc.d | | | 103,341 | |
| | 1,700 | | | Community Health Systems, Inc. | | | 74,171 | |
| | 50,380 | | | Covidien plc | | | 3,229,862 | |
| | 2,793 | | | Dechra Pharmaceuticals plc | | | 30,940 | |
| | 6,800 | | | DENTSPLY International, Inc. | | | 320,280 | |
| | 300 | | | Draegerwerk AG & Company KGaA | | | 35,139 | |
| | 4,400 | | | Emeritus Corporationd | | | 84,304 | |
| | 20,704 | | | ExamWorks Group, Inc.d | | | 535,198 | |
The accompanying Notes to Financial Statements are an integral part of this schedule.
91
Moderate Allocation Fund
Schedule of Investments as of October 31, 2013
| | | | | | | | |
| Shares | | | Common Stock (15.4%) | | Value | |
| Health Care (1.8%) - continued | | | | |
| | 32,200 | | | Express Scripts Holding Companyd | | | $2,013,144 | |
| | 35,400 | | | Gilead Sciences, Inc.d | | | 2,513,046 | |
| | 1,800 | | | GlaxoSmithKline plc | | | 47,453 | |
| | 4,700 | | | GN Store Nord AS | | | 107,220 | |
| | 300 | | | Hogy Medical Company, Ltd. | | | 17,456 | |
| | 9,900 | | | Illumina, Inc.d | | | 925,749 | |
| | 7,700 | | | McKesson Corporation | | | 1,203,818 | |
| | 1,300 | | | Medidata Solutions, Inc.d | | | 143,403 | |
| | 44,940 | | | Merck & Company, Inc. | | | 2,026,345 | |
| | 700 | | | Merck KGaA | | | 116,446 | |
| | 12,780 | | | Neurocrine Biosciences, Inc.d | | | 120,643 | |
| | 2,600 | | | Nobel Biocare Holding AGd | | | 42,893 | |
| | 3,900 | | | Novartis AG | | | 302,728 | |
| | 18,430 | | | NuVasive, Inc.d | | | 585,705 | |
| | 4,800 | | | PAREXEL International Corporationd | | | 219,408 | |
| | 34,275 | | | PDL BioPharma, Inc. | | | 277,285 | |
| | 7,600 | | | PerkinElmer, Inc. | | | 289,104 | |
| | 2,500 | | | Pfizer, Inc. | | | 76,700 | |
| | 17,100 | | | ResMed, Inc. | | | 884,754 | |
| | 1,100 | | | Roche Holding AG | | | 304,189 | |
| | 1,900 | | | Sanofi | | | 202,585 | |
| | 23,840 | | | Sanofi ADR | | | 1,274,963 | |
| | 7,900 | | | Seattle Genetics, Inc.d | | | 305,177 | |
| | 11,400 | | | Shire Pharmaceuticals Group plc ADR | | | 1,517,340 | |
| | 2,200 | | | Stada Arzneimittel AG | | | 126,460 | |
| | 2,000 | | | Terumo Corporation | | | 96,862 | |
| | 11,500 | | | Thoratec Corporationd | | | 496,685 | |
| | 6,200 | | | United Therapeutics Corporationd | | | 548,824 | |
| | 22,981 | | | UnitedHealth Group, Inc. | | | 1,568,683 | |
| | 400 | | | Veeva Systems, Inc.d | | | 15,564 | |
| | 6,300 | | | Waters Corporationd | | | 635,796 | |
| | 8,524 | | | Zimmer Holdings, Inc. | | | 745,594 | |
| | | | | |
| | | | Total | | | 29,182,188 | |
| | | | | |
| |
| Industrials (1.9%) | | | | |
| | 5,900 | | | 3M Company | | | 742,515 | |
| | 8,630 | | | Actuant Corporation | | | 324,143 | |
| | 5,170 | | | Acuity Brands, Inc. | | | 519,637 | |
| | 5,800 | | | ADT Corporation | | | 251,546 | |
| | 7,000 | | | AGCO Corporation | | | 408,660 | |
| | 6,100 | | | AMETEK, Inc. | | | 291,763 | |
| | 8,610 | | | Apogee Enterprises, Inc. | | | 269,321 | |
| | 1,400 | | | Arcadis NV | | | 43,957 | |
| | 1,900 | | | Armstrong World Industries, Inc.d | | | 101,517 | |
| | 10,100 | | | Ashtead Group plc | | | 106,133 | |
| | 7,800 | | | Avis Budget Group, Inc.d | | | 244,374 | |
| | 4,100 | | | Babcock & Wilcox Company | | | 132,061 | |
| | 2,100 | | | Berendsen plc | | | 32,703 | |
| | 13,200 | | | Boeing Company | | | 1,722,600 | |
| | 7,895 | | | Briggs & Stratton Corporation | | | 144,794 | |
| | 11,400 | | | Carillion plc | | | 55,541 | |
| | 700 | | | Central Japan Railway Company | | | 90,770 | |
| | 9,800 | | | Chemring Group plc | | | 34,177 | |
| | 7,610 | | | CLARCOR, Inc. | | | 445,033 | |
| | 2,600 | | | Colfax Corporationd | | | 145,496 | |
| | 200 | | | Compagnie de Saint-Gobain | | | 10,498 | |
| | 600 | | | Cramo Oyj | | | 11,996 | |
| | 50,109 | | | CSX Corporation | | | 1,305,841 | |
| | 6,300 | | | Deluxe Corporation | | | 296,667 | |
| | 17,350 | | | DigitalGlobe, Inc.d | | | 552,077 | |
| | 7,000 | | | Dover Corporation | | | 642,530 | |
| | 20,342 | | | EMCOR Group, Inc. | | | 753,874 | |
| | 2,600 | | | EnerSys, Inc. | | | 172,510 | |
| | 1,400 | | | Esterline Technologies Corporationd | | | 112,224 | |
| | 1,300 | | | European Aeronautic Defence and Space Company | | | 89,082 | |
| | 12,600 | | | Exelis, Inc. | | | 207,774 | |
| | 6,300 | | | Ferrovial SA | | | 120,090 | |
| | 5,500 | | | Flowserve Corporation | | | 382,085 | |
| | 3,900 | | | Fluor Corporation | | | 289,458 | |
| | 13,700 | | | Foster Wheeler AGd | | | 369,763 | |
| | 13,970 | | | GATX Corporation | | | 720,153 | |
| | 9,300 | | | General Electric Company | | | 243,102 | |
| | 20,530 | | | HNI Corporation | | | 797,590 | |
| | 25,346 | | | Honeywell International, Inc. | | | 2,198,259 | |
| | 2,400 | | | Huntington Ingalls Industries, Inc. | | | 171,720 | |
| | 800 | | | I.M.A. Industria Macchine Automatiche SPA | | | 27,416 | |
| | 2,800 | | | IHS, Inc.d | | | 305,340 | |
| | 23,400 | | | Ingersoll-Rand plc | | | 1,580,202 | |
| | 3,800 | | | ITE Group plc | | | 19,638 | |
| | 35,940 | | | Jacobs Engineering Group, Inc.d | | | 2,185,871 | |
| | 3,800 | | | JM AB | | | 108,252 | |
| | 9,000 | | | Kamigumi Company, Ltd. | | | 78,285 | |
| | 46,000 | | | Kawasaki Kisen Kaisha, Ltd. | | | 105,452 | |
| | 12,100 | | | KBR, Inc. | | | 417,934 | |
| | 3,900 | | | Keller Group plc | | | 65,722 | |
| | 4,100 | | | Koninklijke Philips NV | | | 144,897 | |
| | 2,672 | | | Korn/Ferry Internationald | | | 63,594 | |
| | 2,300 | | | KUKA AG | | | 104,678 | |
| | 11,220 | | | Landstar System, Inc. | | | 620,354 | |
| | 1,100 | | | Lindsay Manufacturing Company | | | 83,611 | |
| | 2,400 | | | Lockheed Martin Corporation | | | 320,016 | |
| | 15,160 | | | Manitowoc Company, Inc. | | | 295,014 | |
| | 19,100 | | | Manpower, Inc. | | | 1,491,710 | |
| | 3,500 | | | Matson, Inc. | | | 94,815 | |
| | 9,500 | | | Mermaid Marine Australia, Ltd. | | | 33,656 | |
| | 900 | | | Mitsubishi Corporation | | | 18,208 | |
| | 7,200 | | | MRC Global, Inc.d | | | 201,240 | |
| | 2,900 | | | Northgate plc | | | 21,035 | |
| | 3,700 | | | Old Dominion Freight Line, Inc.d | | | 173,530 | |
| | 23,316 | | | Oshkosh Corporationd | | | 1,109,608 | |
| | 800 | | | Osterreichische Post Aktiengesellschaft | | | 37,514 | |
| | 3,809 | | | Parker Hannifin Corporation | | | 444,586 | |
| | 9,360 | | | Pentair, Ltd. | | | 627,962 | |
| | 7,100 | | | Quanta Services, Inc.d | | | 214,491 | |
| | 11,400 | | | Qube Holdings, Ltd. | | | 23,358 | |
| | 2,100 | | | Randstad Holding NV | | | 129,337 | |
| | 13,300 | | | Republic Airways Holdings, Inc.d | | | 156,674 | |
| | 800 | | | Rockwell Automation, Inc. | | | 88,328 | |
| | 5,200 | | | SAS ABd | | | 15,559 | |
| | 20,000 | | | Singapore Airport Terminal Services, Ltd. | | | 54,718 | |
| | 500 | | | SMC Corporation | | | 116,409 | |
| | 27,500 | | | Southwest Airlines Company | | | 473,550 | |
| | 10,000 | | | Spirit Airlines, Inc.d | | | 431,500 | |
| | 5,920 | | | Tennant Company | | | 359,285 | |
| | 16,000 | | | Tokyu Corporation | | | 108,961 | |
| | 8,300 | | | Union Pacific Corporation | | | 1,256,620 | |
| | 9,200 | | | United Rentals, Inc.d | | | 594,228 | |
The accompanying Notes to Financial Statements are an integral part of this schedule.
92
Moderate Allocation Fund
Schedule of Investments as of October 31, 2013
| | | | | | | | |
| Shares | | | Common Stock (15.4%) | | Value | |
| Industrials (1.9%) - continued | | | | |
| | 3,091 | | | United Stationers, Inc. | | | $137,364 | |
| | 1,800 | | | United Technologies Corporation | | | 191,250 | |
| | 10,300 | | | Wabash National Corporationd | | | 120,098 | |
| | | | | |
| | | | Total | | | 30,805,904 | |
| | | | | |
| |
| Information Technology (2.5%) | | | | |
| | 17,000 | | | Accenture plc | | | 1,249,500 | |
| | 20,900 | | | Activision Blizzard, Inc. | | | 347,776 | |
| | 5,000 | | | Alliance Data Systems Corporationd | | | 1,185,300 | |
| | 7,400 | | | Ambarella, Inc.d | | | 152,070 | |
| | 7,900 | | | Amdocs, Ltd. | | | 303,755 | |
| | 5,802 | | | Apple, Inc. | | | 3,030,675 | |
| | 34,426 | | | Applied Materials, Inc. | | | 614,504 | |
| | 9,100 | | | Arris Group, Inc.d | | | 162,526 | |
| | 2,000 | | | Aspen Technology, Inc.d | | | 76,460 | |
| | 100,260 | | | Atmel Corporationd | | | 729,893 | |
| | 9,000 | | | Autodesk, Inc.d | | | 359,190 | |
| | 7,800 | | | Avnet, Inc. | | | 309,660 | |
| | 43,900 | | | Brocade Communications Systems, Inc.d | | | 352,078 | |
| | 107,140 | | | Cisco Systems, Inc. | | | 2,410,650 | |
| | 8,287 | | | Citrix Systems, Inc.d | | | 470,536 | |
| | 1,200 | | | CommVault Systems, Inc.d | | | 93,696 | |
| | 31,120 | | | CoreLogic, Inc.d | | | 1,035,362 | |
| | 5,934 | | | DST Systems, Inc. | | | 503,025 | |
| | 13,992 | | | E2open, Inc.d | | | 314,820 | |
| | 6,099 | | | eBay, Inc.d | | | 321,478 | |
| | 400 | | | Ei Towers SPA | | | 16,722 | |
| | 3,400 | | | Ellie Mae, Inc.d | | | 98,260 | |
| | 29,200 | | | EMC Corporation | | | 702,844 | |
| | 300 | | | EVS Broadcast Equipment SA | | | 19,626 | |
| | 36,300 | | | Facebook, Inc.d | | | 1,824,438 | |
| | 11,100 | | | Fairchild Semiconductor International, Inc.d | | | 140,637 | |
| | 1,700 | | | FEI Company | | | 151,436 | |
| | 3,800 | | | Fleetmatics Group plcd | | | 120,650 | |
| | 3,200 | | | FLIR Systems, Inc. | | | 91,136 | |
| | 4,700 | | | Gartner, Inc.d | | | 277,065 | |
| | 2,984 | | | Google, Inc.d | | | 3,075,251 | |
| | 8,630 | | | Guidewire Software, Inc.d | | | 437,714 | |
| | 100 | | | Inficon Holding AGd | | | 31,165 | |
| | 17,290 | | | Informatica Corporationd | | | 667,394 | |
| | 500 | | | Ingenico | | | 37,559 | |
| | 10,000 | | | InterDigital, Inc. | | | 387,500 | |
| | 3,100 | | | International Business Machines Corporation | | | 555,551 | |
| | 7,300 | | | InvenSense, Inc.d | | | 123,297 | |
| | 5,700 | | | Ixiad | | | 80,826 | |
| | 7,000 | | | j2 Global, Inc. | | | 384,860 | |
| | 15,014 | | | Juniper Networks, Inc.d | | | 279,861 | |
| | 7,700 | | | Laird plc | | | 30,803 | |
| | 1,400 | | | Leidos Holdings, Inc. | | | 65,926 | |
| | 3,108 | | | Lexmark International, Inc. | | | 110,489 | |
| | 31,300 | | | Marvell Technology Group, Ltd. | | | 375,600 | |
| | 2,953 | | | Micro Focus International plc | | | 38,705 | |
| | 23,620 | | | Microsoft Corporation | | | 834,967 | |
| | 24,000 | | | Monster Worldwide, Inc.d | | | 103,680 | |
| | 3,300 | | | Morgan Advanced Materials plc | | | 16,098 | |
| | 43,690 | | | NetApp, Inc. | | | 1,695,609 | |
| | 4,900 | | | NeuStar, Inc.d | | | 225,008 | |
| | 43,406 | | | NVIDIA Corporation | | | 658,903 | |
| | 7,400 | | | OmniVision Technologies, Inc.d | | | 103,674 | |
| | 10,454 | | | Plantronics, Inc. | | | 448,895 | |
| | 19,500 | | | QUALCOMM, Inc. | | | 1,354,665 | |
| | 11,600 | | | Red Hat, Inc.d | | | 501,932 | |
| | 2,752 | | | Salesforce.com, Inc.d | | | 146,847 | |
| | 4,100 | | | Sanmina Corporationd | | | 59,696 | |
| | 14,300 | | | SunPower Corporationd | | | 431,717 | |
| | 71,580 | | | Symantec Corporation | | | 1,627,729 | |
| | 12,000 | | | Teradata Corporationd | | | 528,840 | |
| | 48,108 | | | Teradyne, Inc.d | | | 841,409 | |
| | 51,280 | | | Texas Instruments, Inc. | | | 2,157,862 | |
| | 9,400 | | | Trimble Navigation, Ltd.d | | | 268,558 | |
| | 33,826 | | | TriQuint Semiconductor, Inc.d | | | 268,240 | |
| | 9,260 | | | Ubiquiti Networks, Inc. | | | 357,251 | |
| | 500 | | | Unit4 NV | | | 23,571 | |
| | 14,520 | | | Virtusa Corporationd | | | 451,281 | |
| | 33,140 | | | Vishay Intertechnology, Inc.d | | | 406,628 | |
| | 16,300 | | | VMware, Inc.d | | | 1,324,864 | |
| | 1,200 | | | Wincor Nixdorf AG | | | 79,342 | |
| | 39 | | | Workday, Inc.d | | | 2,920 | |
| | 1,400 | | | Xaar plc | | | 18,890 | |
| | 54,400 | | | Xerox Corporation | | | 540,736 | |
| | 28,997 | | | Xilinx, Inc. | | | 1,317,044 | |
| | | | | |
| | | | Total | | | 40,945,125 | |
| | | | | |
| |
| Materials (0.6%) | | | | |
| | 1,900 | | | AEP Industries, Inc.d | | | 112,898 | |
| | 3,500 | | | BHP Billiton, Ltd. | | | 123,737 | |
| | 15,480 | | | Celanese Corporation | | | 867,035 | |
| | 2,000 | | | CF Industries Holdings, Inc. | | | 431,200 | |
| | 14,760 | | | Dow Chemical Company | | | 582,577 | |
| | 5,600 | | | DS Smith plc | | | 27,143 | |
| | 6,570 | | | Eagle Materials, Inc. | | | 492,816 | |
| | 3,800 | | | Eastman Chemical Company | | | 299,402 | |
| | 16,700 | | | H.B. Fuller Company | | | 799,429 | |
| | 1,878 | | | Innophos Holdings, Inc. | | | 94,125 | |
| | 1,000 | | | JFE Holdings, Inc. | | | 22,735 | |
| | 25,200 | | | Louisiana-Pacific Corporationd | | | 428,652 | |
| | 15,280 | | | Materials Select Sector SPDR Fund | | | 668,806 | |
| | 3,800 | | | Nippon Paper Industries Company, Ltd. | | | 60,549 | |
| | 10,980 | | | Nucor Corporation | | | 568,435 | |
| | 10,600 | | | Owens-Illinois, Inc.d | | | 336,974 | |
| | 5,500 | | | Packaging Corporation of America | | | 342,540 | |
| | 3,300 | | | PPG Industries, Inc. | | | 602,514 | |
| | 2,700 | | | Schweitzer-Mauduit International, Inc. | | | 167,076 | |
| | 4,000 | | | Sigma-Aldrich Corporation | | | 345,720 | |
| | 7,568 | | | Silgan Holdings, Inc. | | | 341,090 | |
| | 4,900 | | | Smurfit Kappa Group plc | | | 118,612 | |
| | 4,952 | | | Southern Copper Corporation | | | 138,408 | |
| | 25,659 | | | Steel Dynamics, Inc. | | | 461,092 | |
| | 13,900 | | | Stillwater Mining Companyd | | | 151,649 | |
| | 10,300 | | | Teck Resources, Ltd. | | | 275,422 | |
| | 2,900 | | | U.S. Silica Holdings, Inc. | | | 100,978 | |
| | 4,800 | | | Valspar Corporation | | | 335,856 | |
| | 3,000 | | | Worthington Industries, Inc. | | | 121,620 | |
| | | | | |
| | | | Total | | | 9,419,090 | |
| | | | | |
| |
| Telecommunications Services (0.2%) | | | | |
| | 28,100 | | | AT&T, Inc. | | | 1,017,220 | |
| | 25,402 | | | BT Group plc | | | 153,699 | |
| | 5,637 | | | Cogent Communications Group, Inc. | | | 198,028 | |
The accompanying Notes to Financial Statements are an integral part of this schedule.
93
Moderate Allocation Fund
Schedule of Investments as of October 31, 2013
| | | | | | | | |
| Shares | | | Common Stock (15.4%) | | Value | |
| Telecommunications Services (0.2%) - continued | | | | |
| | 4,400 | | | Freenet AGd | | | $114,290 | |
| | 12,400 | | | iiNet, Ltd. | | | 76,281 | |
| | 1,600 | | | Orange SA | | | 21,994 | |
| | 39,000 | | | Singapore Telecommunications, Ltd. | | | 118,434 | |
| | 26,100 | | | TalkTalk Telecom Group plc | | | 111,728 | |
| | 5,185 | | | Telenor ASA | | | 124,583 | |
| | 22,800 | | | Telstra Corporation, Ltd. | | | 111,567 | |
| | 18,012 | | | Verizon Communications, Inc. | | | 909,786 | |
| | | | | |
| | | | Total | | | 2,957,610 | |
| | | | | |
| |
| Utilities (0.4%) | | | | |
| | 3,600 | | | Calpine Corporationd | | | 72,612 | |
| | 13,700 | | | CMS Energy Corporation | | | 376,202 | |
| | 30,900 | | | Electricidade de Portugal SA | | | 113,744 | |
| | 5,400 | | | Gas Natural SDG SA | | | 127,366 | |
| | 3,200 | | | Kansai Electric Power Company, Inc.d | | | 40,502 | |
| | 34,250 | | | NiSource, Inc. | | | 1,079,560 | |
| | 10,120 | | | NorthWestern Corporation | | | 463,901 | |
| | 31,910 | | | PG&E Corporation | | | 1,335,433 | |
| | 19,350 | | | PNM Resources, Inc. | | | 462,852 | |
| | 12,500 | | | Power Assets Holdings, Ltd. | | | 104,140 | |
| | 9,400 | | | Public Service Enterprise Group, Inc. | | | 314,900 | |
| | 10,200 | | | Southern Company | | | 417,282 | |
| | 9,973 | | | Southwest Gas Corporation | | | 541,135 | |
| | 87,100 | | | SP AusNet | | | 102,894 | |
| | 16,600 | | | Wisconsin Energy Corporation | | | 699,026 | |
| | | | | |
| | | | Total | | | 6,251,549 | |
| | | | | |
| | | | | | | | |
| | | | | |
| | | | Total Common Stock (cost $202,570,004) | | | 249,356,693 | |
| | | | | |
| | |
Principal Amount | | | Long-Term Fixed Income (14.1%) | | Value | |
| Asset-Backed Securities (0.6%) | | | | |
| | | | Access Group, Inc. | | | | |
| | 230,257 | | | 0.670%, 2/25/2036e,f | | | 229,103 | |
| | | | Ally Auto Receivables Trust 2013-SN1 | | | | |
| | 300,000 | | | 0.720%, 5/20/2016 | | | 299,467 | |
| | | | Avis Budget Rental Car Funding AESOP, LLC | | | | |
| | 147,950 | | | 2.370%, 11/20/2014e | | | 149,949 | |
| | | | Countrywide Asset-Backed Certificates | | | | |
| | 660,672 | | | 5.530%, 4/25/2047 | | | 609,098 | |
| | | | DT Auto Owner Trust | | | | |
| | 91,047 | | | 0.750%, 5/16/2016e | | | 91,069 | |
| | | | Edlinc Student Loan Funding Trust | | | | |
| | 78,356 | | | 3.170%, 10/1/2025f,g | | | 77,573 | |
| | | | Enterprise Fleet Financing, LLC | | | | |
| | 700,000 | | | 1.060%, 3/20/2019e | | | 701,392 | |
| | | | Federal National Mortgage Association | | | | |
| | 238,917 | | | 0.595%, 8/25/2015 | | | 238,365 | |
| | | | FirstEnergy Ohio PIRB Special Purpose Trust 2013 | | | | |
| | 300,000 | | | 0.679%, 1/15/2019 | | | 299,874 | |
| | | | FNA Trust | | | | |
| | 192,612 | | | 1.980%, 1/10/2018g | | | 191,047 | |
| | | | GE Dealer Floorplan Master Note Trust | | | | |
| | 300,000 | | | 0.573%, 4/20/2018f | | | 299,363 | |
| | | | GE Equipment Transportation, LLC | | | | |
| | 250,000 | | | 0.690%, 11/25/2016 | | | 249,785 | |
| | | | Golden Credit Card Trust | | | | |
| | 90,000 | | | 0.424%, 2/15/2018e,f | | | 89,771 | |
| | 100,000 | | | 0.636%, 9/15/2018e,f | | | 100,000 | |
| | | | HLSS Servicer Advance Receivables Backed Notes | | | | |
| | 450,000 | | | 1.287%, 9/15/2044e | | | 450,225 | |
| | | | Hyundai Auto Receivables Trust | | | | |
| | 300,000 | | | 0.710%, 9/15/2017 | | | 300,459 | |
| | | | Hyundai Floorplan Master Owner Trust | | | | |
| | 337,500 | | | 0.524%, 5/15/2018e,f | | | 337,938 | |
| | | | Master Credit Card Trust | | | | |
| | 203,500 | | | 0.780%, 4/21/2017e | | | 203,314 | |
| | | | Morgan Stanley Capital, Inc. | | | | |
| | 1,092,418 | | | 0.320%, 2/25/2037f | | | 587,502 | |
| | | | Motor plc | | | | |
| | 373,333 | | | 0.670%, 2/15/2021e | | | 373,316 | |
| | | | Nationstar Mortgage Advance Receivable Trust | | | | |
| | 300,000 | | | 1.080%, 6/20/2044e | | | 299,799 | |
| | | | Nissan Master Owner Trust Receivables | | | | |
| | 150,000 | | | 0.474%, 2/15/2018f | | | 149,826 | |
| | | | Ohio Phase-In-Recovery Funding, LLC | | | | |
| | 1,000,000 | | | 0.958%, 7/2/2018 | | | 1,002,554 | |
| | | | Renaissance Home Equity Loan Trust | | | | |
| | 2,280,000 | | | 6.011%, 5/25/2036 | | | 1,661,475 | |
| | | | Santander Drive Auto Receivables Trust | | | | |
| | 250,000 | | | 0.700%, 9/15/2017 | | | 249,822 | |
| | | | SLM Student Loan Trust | | | | |
| | 64,599 | | | 0.774%, 8/15/2022e,f | | | 64,400 | |
| | 75,000 | | | 1.224%, 5/17/2027e,f | | | 74,164 | |
| | | | Volvo Financial Equipment, LLC | | | | |
| | 250,000 | | | 0.740%, 3/15/2017e | | | 249,832 | |
| | | | World Financial Network Credit Card Master Trust | | | | |
| | 250,000 | | | 0.910%, 3/16/2020 | | | 248,696 | |
| | | | World Omni Automobile Lease Securitization Trust | | | | |
| | 450,000 | | | 1.400%, 2/15/2019 | | | 453,495 | |
| | | | World Omni Master Owner Trust | | | | |
| | 90,000 | | | 0.524%, 2/15/2018e,f | | | 89,896 | |
| | | | | |
| | | | Total | | | 10,422,569 | |
| | | | | |
| |
| Basic Materials (0.2%) | | | | |
| | | | Barrick Gold Corporation | | | | |
| | 84,000 | | | 2.900%, 5/30/2016 | | | 86,104 | |
| | | | FMG Resources Pty. Ltd. | | | | |
| | 539,675 | | | 6.875%, 2/1/2018e,h | | | 572,055 | |
| | | | Freeport-McMoRan Copper & Gold, Inc. | | | | |
| | 254,000 | | | 2.375%, 3/15/2018 | | | 253,307 | |
The accompanying Notes to Financial Statements are an integral part of this schedule.
94
Moderate Allocation Fund
Schedule of Investments as of October 31, 2013
| | | | | | | | |
Principal Amount | | | Long-Term Fixed Income (14.1%) | | Value | |
| Basic Materials (0.2%) - continued | | | | |
| | | | Glencore Funding, LLC | | | | |
| | $144,000 | | | 1.700%, 5/27/2016e | | | $143,404 | |
| | 150,000 | | | 1.604%, 1/15/2019e,f | | | 145,451 | |
| | | | Hexion US Finance Corporation/Hexion Nova Scotia Finance ULC | | | | |
| | 270,000 | | | 8.875%, 2/1/2018 | | | 278,100 | |
| | | | Ineos Finance plc | | | | |
| | 270,000 | | | 7.500%, 5/1/2020e | | | 294,975 | |
| | | | Inmet Mining Corporation | | | | |
| | 270,000 | | | 7.500%, 6/1/2021e | | | 286,200 | |
| | | | International Paper Company | | | | |
| | 162,000 | | | 5.300%, 4/1/2015 | | | 171,704 | |
| | | | LyondellBasell Industries NV | | | | |
| | 243,000 | | | 6.000%, 11/15/2021 | | | 282,731 | |
| | | | Rio Tinto Finance USA plc | | | | |
| | 168,000 | | | 1.375%, 6/17/2016 | | | 169,031 | |
| | | | Xstrata Finance Canada, Ltd. | | | | |
| | 312,000 | | | 2.050%, 10/23/2015e | | | 314,471 | |
| | | | | |
| | | | Total | | | 2,997,533 | |
| | | | | |
| |
| Capital Goods (0.1%) | | | | |
| | | | BAE Systems plc | | | | |
| | 144,000 | | | 3.500%, 10/11/2016e | | | 150,684 | |
| | | | CNH Capital, LLC | | | | |
| | 270,000 | | | 3.625%, 4/15/2018 | | | 273,713 | |
| | | | Eaton Corporation | | | | |
| | 80,000 | | | 1.500%, 11/2/2017e | | | 79,199 | |
| | 120,000 | | | 4.000%, 11/2/2032e | | | 111,144 | |
| | | | John Deere Capital Corporation | | | | |
| | 150,000 | | | 0.314%, 1/12/2015f | | | 150,006 | |
| | | | Northrop Grumman Corporation | | | | |
| | 216,000 | | | 1.750%, 6/1/2018 | | | 212,803 | |
| | | | Reynolds Group Issuer, Inc. | | | | |
| | 269,675 | | | 5.750%, 10/15/2020 | | | 278,439 | |
| | | | Roper Industries, Inc. | | | | |
| | 200,000 | | | 2.050%, 10/1/2018 | | | 197,499 | |
| | | | RSC Equipment Rental, Inc. | | | | |
| | 270,000 | | | 8.250%, 2/1/2021 | | | 305,775 | |
| | | | Textron, Inc. | | | | |
| | 190,000 | | | 5.600%, 12/1/2017 | | | 211,179 | |
| | | | | |
| | | | Total | | | 1,970,441 | |
| | | | | |
| |
| Collateralized Mortgage Obligations (0.9%) | | | | |
| | | | Alternative Loan Trust | | | | |
| | 405,520 | | | 6.000%, 6/25/2036 | | | 346,527 | |
| | | | Citigroup Mortgage Loan Trust, Inc. | | | | |
| | 587,681 | | | 5.500%, 11/25/2035 | | | 531,130 | |
| | | | CitiMortgage Alternative Loan Trust | | | | |
| | 1,984,067 | | | 5.750%, 4/25/2037 | | | 1,690,339 | |
| | | | Countrywide Alternative Loan Trust | | | | |
| | 764,377 | | | 5.064%, 10/25/2035 | | | 616,465 | |
| | 627,637 | | | 6.000%, 4/25/2036 | | | 517,618 | |
| | 370,815 | | | 6.000%, 1/25/2037 | | | 295,964 | |
| | 1,807,601 | | | 5.500%, 5/25/2037 | | | 1,504,072 | |
| | 1,416,443 | | | 7.000%, 10/25/2037 | | | 947,029 | |
| | | | Countrywide Home Loans, Inc. | | | | |
| | 783,144 | | | 5.750%, 4/25/2037 | | | 694,756 | |
| | | | Deutsche Alt-A Securities Mortgage Loan Trust | | | | |
| | 273,208 | | | 5.500%, 10/25/2021 | | | 261,715 | |
| | | | Deutsche Alt-A Securities, Inc. | | | | |
| | 631,146 | | | 6.000%, 10/25/2021 | | | 590,763 | |
| | | | Federal Home Loan Mortgage Corporation | | | | |
| | 1,289,521 | | | 3.000%, 2/15/2033i | | | 203,171 | |
| | | | Federal National Mortgage Association | | | | |
| | 2,837,850 | | | 3.500%, 1/25/2033i | | | 483,337 | |
| | | | GSR Mortgage Loan Trust | | | | |
| | 935,075 | | | 0.360%, 8/25/2046f | | | 920,178 | |
| | | | J.P. Morgan Mortgage Trust | | | | |
| | 357,218 | | | 2.772%, 6/25/2036 | | | 287,373 | |
| | 171,407 | | | 2.679%, 10/25/2036 | | | 138,088 | |
| | 1,369,919 | | | 0.550%, 1/25/2037 f | | | 897,297 | |
| | 1,593,378 | | | 6.250%, 8/25/2037 | | | 1,117,495 | |
| | | | MASTR Alternative Loans Trust | | | | |
| | 430,466 | | | 6.500%, 7/25/2034 | | | 430,779 | |
| | 841,688 | | | 0.620%, 12/25/2035f | | | 460,228 | |
| | | | Merrill Lynch Alternative Note Asset Trust | | | | |
| | 427,555 | | | 6.000%, 3/25/2037 | | | 361,537 | |
| | | | Residential Asset Securitization Trust | | | | |
| | 1,097,630 | | | 0.550%, 8/25/2037f | | | 341,932 | |
| | | | Sequoia Mortgage Trust | | | | |
| | 211,497 | | | 2.631%, 9/20/2046 | | | 15,690 | |
| | | | WaMu Mortgage Pass Through Certificates | | | | |
| | 151,052 | | | 2.375%, 9/25/2036 | | | 131,983 | |
| | 566,442 | | | 2.425%, 10/25/2036 | | | 486,226 | |
| | | | | |
| | | | Total | | | 14,271,692 | |
| | | | | |
| |
| Commercial Mortgage-Backed Securities (1.2%) | | | | |
| | | | Banc of America Commercial Mortgage, Inc. | | | | |
| | 2,400,000 | | | 5.623%, 4/10/2049 | | | 2,688,626 | |
| | 1,650,000 | | | 5.559%, 6/10/2049 | | | 1,838,564 | |
| | | | Bear Stearns Commercial Mortgage Securities, Inc. | | | | |
| | 1,500,000 | | | 5.331%, 2/11/2044 | | | 1,647,390 | |
| | | | CGBAM Commercial Mortgage Trust | | | | |
| | 980,000 | | | 1.283%, 5/15/2030e,f | | | 976,308 | |
| | | | Commercial Mortgage Pass- Through Certificates | | | | |
| | 300,000 | | | 1.224%, 6/8/2030e,f | | | 298,494 | |
| | | | Credit Suisse First Boston Mortgage Securities | | | | |
| | 2,400,000 | | | 5.542%, 1/15/2049 | | | 2,666,359 | |
| | | | Credit Suisse Mortgage Capital Certificates | | | | |
| | 3,000,000 | | | 5.509%, 9/15/2039 | | | 3,243,702 | |
| | | | Federal Home Loan Mortgage Corporation Multi Family Structured Pass Thru Certificates | | | | |
| | 145,862 | | | 0.727%, 12/25/2016 | | | 145,097 | |
The accompanying Notes to Financial Statements are an integral part of this schedule.
95
Moderate Allocation Fund
Schedule of Investments as of October 31, 2013
| | | | | | | | |
Principal
Amount | | | Long-Term Fixed Income (14.1%) | | Value | |
| Commercial Mortgage-Backed Securities (1.2%) - continued | | | | |
| | | | Greenwich Capital Commercial Funding Corporation | | | | |
| | $1,600,000 | | | 5.867%, 12/10/2049 | | | $1,766,235 | |
| | | | J.P. Morgan Chase Commercial Mortgage Securities Corporation | | | | |
| | 200,000 | | | 0.874%, 4/15/2028e,f | | | 199,335 | |
| | 1,200,000 | | | 5.706%, 2/12/2049 | | | 1,292,356 | |
| | | | Morgan Stanley Capital, Inc. | | | | |
| | 750,000 | | | 5.406%, 3/15/2044 | | | 810,785 | |
| | | | Wachovia Bank Commercial Mortgage Trust | | | | |
| | 1,800,000 | | | 5.603%, 10/15/2048 | | | 1,958,251 | |
| | | | | |
| | | | Total | | | 19,531,502 | |
| | | | | |
| |
| Communications Services (0.5%) | | | | |
| | | | AMC Networks, Inc. | | | | |
| | 270,000 | | | 4.750%, 12/15/2022 | | | 261,225 | |
| | | | America Movil SAB de CV | | | | |
| | 216,000 | | | 1.256%, 9/12/2016f | | | 217,885 | |
| | 216,000 | | | 5.000%, 10/16/2019 | | | 238,241 | |
| | | | American Tower Corporation | | | | |
| | 144,000 | | | 5.050%, 9/1/2020 | | | 152,120 | |
| | | | AT&T, Inc. | | | | |
| | 144,000 | | | 2.400%, 8/15/2016 | | | 148,961 | |
| | 238,000 | | | 5.800%, 2/15/2019 | | | 276,330 | |
| | | | British Telecommunications plc | | | | |
| | 168,000 | | | 1.625%, 6/28/2016 | | | 170,223 | |
| | | | CBS Corporation | | | | |
| | 160,000 | | | 8.875%, 5/15/2019 | | | 205,471 | |
| | | | CC Holdings GS V, LLC | | | | |
| | 150,000 | | | 2.381%, 12/15/2017 | | | 148,488 | |
| | | | CCO Holdings, LLC | | | | |
| | 270,000 | | | 7.375%, 6/1/2020 | | | 294,975 | |
| | | | CenturyLink, Inc. | | | | |
| | 270,000 | | | 5.625%, 4/1/2020 | | | 274,387 | |
| | | | Comcast Corporation | | | | |
| | 105,000 | | | 4.650%, 7/15/2042 | | | 102,294 | |
| | | | Cox Communications, Inc. | | | | |
| | 210,000 | | | 9.375%, 1/15/2019e | | | 268,794 | |
| | | | Crown Castle Towers, LLC | | | | |
| | 135,000 | | | 4.174%, 8/15/2017e | | | 144,698 | |
| | | | DIRECTV Holdings, LLC | | | | |
| | 144,000 | | | 2.400%, 3/15/2017 | | | 146,469 | |
| | 160,000 | | | 1.750%, 1/15/2018 | | | 156,367 | |
| | 144,000 | | | 5.875%, 10/1/2019 | | | 162,993 | |
| | | | Hughes Satellite Systems Corporation | | | | |
| | 270,000 | | | 6.500%, 6/15/2019 | | | 289,575 | |
| | | | Intelsat Jackson Holdings SA | | | | |
| | 270,000 | | | 7.250%, 4/1/2019 | | | 290,925 | |
| | | | Level 3 Financing, Inc. | | | | |
| | 270,000 | | | 8.625%, 7/15/2020 | | | 305,775 | |
| | | | NBC Universal Enterprise, Inc. | | | | |
| | 150,000 | | | 0.929%, 4/15/2018e,f | | | 150,893 | |
| | | | NBC Universal Media, LLC | | | | |
| | 249,000 | | | 2.875%, 4/1/2016 | | | 261,186 | |
| | | | Nippon Telegraph & Telephone Corporation | | | | |
| | 156,000 | | | 1.400%, 7/18/2017 | | | 155,657 | |
| | | | SBA Tower Trust | | | | |
| | 145,000 | | | 5.101%, 4/17/2017e | | | 156,814 | |
| | | | Sprint Nextel Corporation | | | | |
| | 269,675 | | | 9.000%, 11/15/2018e | | | 326,981 | |
| | | | Telefonica Emisiones SAU | | | | |
| | 166,000 | | | 3.729%, 4/27/2015 | | | 171,642 | |
| | | | Univision Communications, Inc. | | | | |
| | 270,000 | | | 6.875%, 5/15/2019e | | | 290,925 | |
| | | | UPCB Finance V, Ltd. | | | | |
| | 270,000 | | | 7.250%, 11/15/2021e | | | 296,325 | |
| | | | Verizon Communications, Inc. | | | | |
| | 288,000 | | | 2.500%, 9/15/2016 | | | 298,859 | |
| | 121,000 | | | 1.100%, 11/1/2017 | | | 117,704 | |
| | 144,000 | | | 5.500%, 2/15/2018 | | | 163,983 | |
| | 144,000 | | | 2.002%, 9/14/2018f | | | 152,034 | |
| | 72,000 | | | 3.650%, 9/14/2018 | | | 76,576 | |
| | 216,000 | | | 6.400%, 9/15/2033 | | | 244,486 | |
| | 72,000 | | | 6.550%, 9/15/2043 | | | 83,535 | |
| | | | Vodafone Group plc | | | | |
| | 96,000 | | | 0.648%, 2/19/2016f | | | 95,991 | |
| | | | Wind Acquisition Finance SA | | | | |
| | 270,000 | | | 11.750%, 7/15/2017e | | | 286,875 | |
| | | | | |
| | | | Total | | | 7,586,662 | |
| | | | | |
| |
| Consumer Cyclical (0.4%) | | | | |
| | | | Amazon.com, Inc. | | | | |
| | 80,000 | | | 1.200%, 11/29/2017 | | | 78,493 | |
| | | | American Honda Finance Corporation | | | | |
| | 200,000 | | | 0.637%, 5/26/2016e,f | | | 200,232 | |
| | | | Chrysler Group, LLC | | | | |
| | 275,000 | | | 8.000%, 6/15/2019 | | | 304,563 | |
| | | | Cinemark USA, Inc. | | | | |
| | 270,000 | | | 4.875%, 6/1/2023 | | | 257,175 | |
| | | | Daimler Finance North America, LLC | | | | |
| | 180,000 | | | 1.125%, 8/1/2018e,f | | | 180,999 | |
| | | | Federated Retail Holdings, Inc. | | | | |
| | 104,000 | | | 5.900%, 12/1/2016 | | | 117,299 | |
| | | | Ford Motor Company | | | | |
| | 96,000 | | | 7.450%, 7/16/2031 | | | 119,804 | |
| | | | Ford Motor Credit Company, LLC | | | | |
| | 222,000 | | | 12.000%, 5/15/2015 | | | 258,309 | |
| | 150,000 | | | 1.516%, 5/9/2016f | | | 152,046 | |
| | 160,000 | | | 1.700%, 5/9/2016 | | | 161,432 | |
| | 175,000 | | | 2.375%, 1/16/2018 | | | 176,002 | |
| | 155,000 | | | 5.000%, 5/15/2018 | | | 171,764 | |
| | | | Gap, Inc. | | | | |
| | 160,000 | | | 5.950%, 4/12/2021 | | | 177,576 | |
| | | | General Motors Company | | | | |
| | 216,000 | | | 3.500%, 10/2/2018e | | | 220,320 | |
| | 144,000 | | | 4.875%, 10/2/2023e | | | 145,800 | |
| | | | General Motors Financial Company, Inc. | | | | |
| | 128,000 | | | 2.750%, 5/15/2016e | | | 128,960 | |
| | 270,000 | | | 3.250%, 5/15/2018e | | | 268,988 | |
| | | | Home Depot, Inc. | | | | |
| | 144,000 | | | 4.875%, 2/15/2044 | | | 148,807 | |
| | | | Hyundai Capital America | | | | |
| | 162,000 | | | 1.625%, 10/2/2015e | | | 163,058 | |
| | | | Jaguar Land Rover Automotive plc | | | | |
| | 270,000 | | | 5.625%, 2/1/2023e | | | 267,975 | |
The accompanying Notes to Financial Statements are an integral part of this schedule.
96
Moderate Allocation Fund
Schedule of Investments as of October 31, 2013
| | | | | | | | |
Principal Amount | | | Long-Term Fixed Income (14.1%) | | Value | |
| Consumer Cyclical (0.4%) - continued | | | | |
| | | | L Brands, Inc. | | | | |
| | $270,000 | | | 5.625%, 2/15/2022 | | | $278,100 | |
| | | | Lennar Corporation | | | | |
| | 270,000 | | | 4.125%, 12/1/2018 | | | 270,675 | |
| | | | Macy’s Retail Holdings, Inc. | | | | |
| | 80,000 | | | 3.875%, 1/15/2022 | | | 79,895 | |
| | 57,000 | | | 4.375%, 9/1/2023 | | | 57,944 | |
| | | | Toll Brothers Finance Corporation | | | | |
| | 128,000 | | | 8.910%, 10/15/2017 | | | 154,880 | |
| | 64,000 | | | 4.375%, 4/15/2023 | | | 60,320 | |
| | | | Toyota Motor Credit Corporation | | | | |
| | 200,000 | | | 0.553%, 5/17/2016f | | | 200,455 | |
| | 105,000 | | | 1.750%, 5/22/2017 | | | 106,629 | |
| | | | TRW Automotive, Inc. | | | | |
| | 100,000 | | | 7.250%, 3/15/2017e | | | 114,750 | |
| | | | Viacom, Inc. | | | | |
| | 108,000 | | | 2.500%, 9/1/2018 | | | 109,121 | |
| | | | Walgreen Company | | | | |
| | 232,000 | | | 5.250%, 1/15/2019 | | | 262,878 | |
| | | | Western Union Company | | | | |
| | 160,000 | | | 2.375%, 12/10/2015 | | | 163,723 | |
| | | | Wynn Las Vegas, LLC | | | | |
| | 270,000 | | | 5.375%, 3/15/2022h | | | 277,779 | |
| | | | | |
| | | | Total | | | 5,836,751 | |
| | | | | |
| |
| Consumer Non-Cyclical (0.6%) | | | | |
| | | | AbbVie, Inc. | | | | |
| | 80,000 | | | 1.750%, 11/6/2017 | | | 80,244 | |
| | | | Altria Group, Inc. | | | | |
| | 164,000 | | | 9.700%, 11/10/2018 | | | 220,228 | |
| | 216,000 | | | 4.000%, 1/31/2024 | | | 216,810 | |
| | | | Anheuser-Busch InBev Worldwide, Inc. | | | | |
| | 275,000 | | | 7.750%, 1/15/2019 | | | 348,266 | |
| | | | Avon Products, Inc. | | | | |
| | 64,000 | | | 2.375%, 3/15/2016 | | | 65,328 | |
| | | | Biomet, Inc. | | | | |
| | 270,000 | | | 3.690%, 8/1/2020 | | | 286,875 | |
| | | | Boston Scientific Corporation | | | | |
| | 180,000 | | | 6.000%, 1/15/2020 | | | 209,831 | |
| | | | Bunge Limited Finance Corporation | | | | |
| | 83,000 | | | 3.200%, 6/15/2017 | | | 86,420 | |
| | 97,000 | | | 8.500%, 6/15/2019 | | | 121,167 | |
| | | | Celgene Corporation | | | | |
| | 202,000 | | | 1.900%, 8/15/2017 | | | 203,759 | |
| | 72,000 | | | 2.300%, 8/15/2018 | | | 72,516 | |
| | | | CHS/Community Health Systems, Inc. | | | | |
| | 270,000 | | | 7.125%, 7/15/2020 | | | 284,175 | |
| | | | ConAgra Foods, Inc. | | | | |
| | 228,000 | | | 1.900%, 1/25/2018 | | | 226,429 | |
| | | | Coventry Health Care, Inc. | | | | |
| | 252,000 | | | 5.950%, 3/15/2017 | | | 286,476 | |
| | | | CVS Caremark Corporation | | | | |
| | 101,000 | | | 6.125%, 9/15/2039 | | | 116,633 | |
| | | | Edwards Lifesciences Corporation | | | | |
| | 144,000 | | | 2.875%, 10/15/2018 | | | 144,552 | |
| | | | Endo Pharmaceuticals Holdings, Inc. | | | | |
| | 270,000 | | | 7.000%, 7/15/2019 | | | 288,225 | |
| | | | Express Scripts Holding Company | | | | |
| | 166,000 | | | 3.125%, 5/15/2016 | | | 174,203 | |
| | | | Fresenius Medical Care US Finance II, Inc. | | | | |
| | 270,000 | | | 5.875%, 1/31/2022e | | | 286,200 | |
| | | | Gilead Sciences, Inc. | | | | |
| | 133,000 | | | 2.400%, 12/1/2014 | | | 135,487 | |
| | 145,000 | | | 3.050%, 12/1/2016 | | | 153,309 | |
| | | | Hawk Acquisition Sub, Inc. | | | | |
| | 269,675 | | | 4.250%, 10/15/2020e | | | 260,911 | |
| | | | Heineken NV | | | | |
| | 80,000 | | | 1.400%, 10/1/2017e | | | 79,034 | |
| | | | IMS Health, Inc. | | | | |
| | 363,000 | | | 6.000%, 11/1/2020e | | | 377,520 | |
| | | | Kraft Foods, Inc. | | | | |
| | 180,000 | | | 6.500%, 8/11/2017 | | | 210,019 | |
| | | | Lorillard Tobacco Company | | | | |
| | 166,000 | | | 2.300%, 8/21/2017h | | | 167,681 | |
| | 180,000 | | | 8.125%, 6/23/2019 | | | 222,104 | |
| | | | Mallinckrodt International Finance SA | | | | |
| | 142,000 | | | 3.500%, 4/15/2018e | | | 141,761 | |
| | | | Mattel, Inc. | | | | |
| | 128,000 | | | 1.700%, 3/15/2018 | | | 126,292 | |
| | | | Medco Health Solutions, Inc. | | | | |
| | 192,000 | | | 7.125%, 3/15/2018 | | | 231,190 | |
| | | | Merck & Company, Inc. | | | | |
| | 200,000 | | | 0.623%, 5/18/2018f | | | 200,629 | |
| | | | Mylan, Inc. | | | | |
| | 210,000 | | | 1.800%, 6/24/2016e | | | 211,533 | |
| | 160,000 | | | 7.875%, 7/15/2020e | | | 183,181 | |
| | | | PepsiCo, Inc. | | | | |
| | 150,000 | | | 0.472%, 2/26/2016f | | | 150,071 | |
| | | | Pernod Ricard SA | | | | |
| | 144,000 | | | 2.950%, 1/15/2017e | | | 150,251 | |
| | 108,000 | | | 5.750%, 4/7/2021e | | | 121,036 | |
| | | | Roche Holdings, Inc. | | | | |
| | 64,000 | | | 7.000%, 3/1/2039e | | | 86,283 | |
| | | | SABMiller Holdings, Inc. | | | | |
| | 216,000 | | | 2.450%, 1/15/2017e | | | 223,052 | |
| | 210,000 | | | 3.750%, 1/15/2022e | | | 215,312 | |
| | | | Safeway, Inc. | | | | |
| | 64,000 | | | 3.400%, 12/1/2016 | | | 66,045 | |
| | 185,000 | | | 5.000%, 8/15/2019 | | | 191,159 | |
| | | | Spectrum Brands Escrow Corporation | | | | |
| | 270,000 | | | 6.375%, 11/15/2020e | | | 286,875 | |
| | | | Tyson Foods, Inc. | | | | |
| | 210,000 | | | 4.500%, 6/15/2022 | | | 217,804 | |
| | | | Valeant Pharmaceuticals International | | | | |
| | 270,000 | | | 6.875%, 12/1/2014e | | | 288,562 | |
| | | | Watson Pharmaceuticals, Inc. | | | | |
| | 252,000 | | | 1.875%, 10/1/2017 | | | 251,376 | |
| | | | WM Wrigley Jr. Company | | | | |
| | 210,000 | | | 1.400%, 10/21/2016e | | | 211,302 | |
| | 180,000 | | | 2.000%, 10/20/2017e | | | 181,569 | |
| | | | | |
| | | | Total | | | 9,059,685 | |
| | | | | |
| |
| Energy (0.3%) | | | | |
| | | | BP Capital Markets plc | | | | |
| | 150,000 | | | 1.846%, 5/5/2017 | | | 152,582 | |
The accompanying Notes to Financial Statements are an integral part of this schedule.
97
Moderate Allocation Fund
Schedule of Investments as of October 31, 2013
| | | | | | | | |
Principal
Amount | | | Long-Term Fixed Income (14.1%) | | Value | |
| Energy (0.3%) - continued | | | | |
| | $243,000 | | | 1.375%, 11/6/2017 | | | $241,534 | |
| | 144,000 | | | 2.241%, 9/26/2018 | | | 145,467 | |
| | | | CNOOC, Ltd. | | | | |
| | 250,000 | | | 1.125%, 5/9/2016 | | | 248,516 | |
| | | | Concho Resources, Inc. | | | | |
| | 269,675 | | | 5.500%, 10/1/2022 | | | 281,136 | |
| | | | Continental Resources, Inc. | | | | |
| | 252,000 | | | 4.500%, 4/15/2023 | | | 254,205 | |
| | | | EQT Corporation | | | | |
| | 160,000 | | | 8.125%, 6/1/2019 | | | 197,062 | |
| | | | Hess Corporation | | | | |
| | 216,000 | | | 8.125%, 2/15/2019 | | | 272,163 | |
| | | | Linn Energy, LLC | | | | |
| | 269,675 | | | 7.000%, 11/1/2019e | | | 269,001 | |
| | | | Lukoil International Finance BV | | | | |
| | 170,000 | | | 3.416%, 4/24/2018e | | | 171,275 | |
| | | | MEG Energy Corporation | | | | |
| | 270,000 | | | 6.500%, 3/15/2021e | | | 281,812 | |
| | | | Murphy Oil Corporation | | | | |
| | 120,000 | | | 2.500%, 12/1/2017 | | | 120,876 | |
| | | | Oasis Petroleum, Inc. | | | | |
| | 270,000 | | | 6.875%, 1/15/2023 | | | 292,950 | |
| | | | Offshore Group Investment, Ltd. | | | | |
| | 270,000 | | | 7.500%, 11/1/2019 | | | 293,625 | |
| | | | Petrobras Global Finance BV | | | | |
| | 288,000 | | | 2.000%, 5/20/2016 | | | 286,186 | |
| | | | Petroleos Mexicanos | | | | |
| | 126,000 | | | 3.500%, 7/18/2018 | | | 128,835 | |
| | | | Pioneer Natural Resources Company | | | | |
| | 83,000 | | | 5.875%, 7/15/2016 | | | 92,631 | |
| | | | Range Resources Corporation | | | | |
| | 270,000 | | | 5.000%, 8/15/2022 | | | 269,662 | |
| | | | Sinopec Capital 2013, Ltd. | | | | |
| | 200,000 | | | 1.250%, 4/24/2016e | | | 198,806 | |
| | | | Suncor Energy, Inc. | | | | |
| | 145,000 | | | 6.100%, 6/1/2018 | | | 170,497 | |
| | | | Transocean, Inc. | | | | |
| | 83,000 | | | 5.050%, 12/15/2016 | | | 91,426 | |
| | 236,000 | | | 6.000%, 3/15/2018 | | | 266,989 | |
| | 64,000 | | | 6.375%, 12/15/2021 | | | 72,107 | |
| | | | Weatherford International, Ltd. | | | | |
| | 249,000 | | | 6.750%, 9/15/2040 | | | 267,592 | |
| | | | | |
| | | | Total | | | 5,066,935 | |
| | | | | |
| |
| Financials (1.8%) | | | | |
| | | | Abbey National Treasury Services plc | | | | |
| | 144,000 | | | 3.050%, 8/23/2018 | | | 149,071 | |
| | | | Aetna, Inc. | | | | |
| | 168,000 | | | 1.500%, 11/15/2017 | | | 166,432 | |
| | | | American Express Credit Corporation | | | | |
| | 105,000 | | | 2.375%, 3/24/2017 | | | 109,042 | |
| | | | American International Group, Inc. | | | | |
| | 299,000 | | | 2.375%, 8/24/2015 | | | 305,314 | |
| | 180,000 | | | 3.800%, 3/22/2017 | | | 192,297 | |
| | 144,000 | | | 8.250%, 8/15/2018 | | | 182,169 | |
| | | | American Tower Trust I | | | | |
| | 64,000 | | | 1.551%, 3/15/2018e | | | 62,771 | |
| | | | ANZ National International, Ltd. of London | | | | |
| | 250,000 | | | 3.125%, 8/10/2015e | | | 259,983 | |
| | | | Associated Banc Corporation | | | | |
| | 83,000 | | | 1.875%, 3/12/2014 | | | 83,307 | |
| | | | Aviation Capital Group Corporation | | | | |
| | 144,000 | | | 3.875%, 9/27/2016e | | | 145,772 | |
| | | | Bank Nederlandse Gemeenten NV | | | | |
| | 75,000 | | | 1.375%, 3/19/2018e | | | 74,445 | |
| | | | Bank of America Corporation | | | | |
| | 352,000 | | | 7.750%, 8/15/2015 | | | 389,799 | |
| | 165,000 | | | 5.750%, 8/15/2016 | | | 182,595 | |
| | 340,000 | | | 5.750%, 12/1/2017 | | | 388,745 | |
| | 398,000 | | | 1.320%, 3/22/2018f,h | | | 402,616 | |
| | 165,000 | | | 5.650%, 5/1/2018 | | | 188,212 | |
| | 216,000 | | | 2.600%, 1/15/2019 | | | 217,459 | |
| | | | Bank of Montreal | | | | |
| | 168,000 | | | 1.300%, 7/15/2016 | | | 169,398 | |
| | 150,000 | | | 0.843%, 4/9/2018f | | | 150,271 | |
| | | | Bank of Nova Scotia | | | | |
| | 150,000 | | | 0.654%, 3/15/2016f | | | 150,358 | |
| | 128,000 | | | 0.950%, 3/15/2016 | | | 128,011 | |
| | | | BB&T Corporation | | | | |
| | 84,000 | | | 1.114%, 6/15/2018f | | | 84,609 | |
| | 168,000 | | | 2.050%, 6/19/2018 | | | 168,282 | |
| | | | BBVA Banco Continental SA | | | | |
| | 216,000 | | | 2.250%, 7/29/2016e | | | 215,460 | |
| | | | BBVA US Senior SAU | | | | |
| | 264,000 | | | 4.664%, 10/9/2015 | | | 277,965 | |
| | | | Berkshire Hathaway Finance Corporation | | | | |
| | 190,000 | | | 1.600%, 5/15/2017 | | | 191,559 | |
| | 150,000 | | | 1.300%, 5/15/2018 | | | 147,583 | |
| | | | BNP Paribas SA | | | | |
| | 243,000 | | | 2.375%, 9/14/2017 | | | 248,448 | |
| | | | Capital One Financial Corporation | | | | |
| | 162,000 | | | 2.150%, 3/23/2015 | | | 164,716 | |
| | 100,000 | | | 0.700%, 3/22/2016f | | | 99,769 | |
| | 208,000 | | | 6.150%, 9/1/2016 | | | 233,295 | |
| | | | Chesapeake Funding, LLC | | | | |
| | 500,000 | | | 0.624%, 1/7/2025e,f | | | 498,670 | |
| | | | Citigroup, Inc. | | | | |
| | 287,000 | | | 5.000%, 9/15/2014 | | | 296,995 | |
| | 252,000 | | | 1.198%, 7/25/2016f | | | 254,313 | |
| | 374,000 | | | 6.000%, 8/15/2017 | | | 430,059 | |
| | 242,000 | | | 8.500%, 5/22/2019 | | | 313,119 | |
| | 128,000 | | | 4.050%, 7/30/2022 | | | 126,663 | |
| | | | CNA Financial Corporation | | | | |
| | 201,000 | | | 7.350%, 11/15/2019 | | | 247,749 | |
| | | | CoBank ACB | | | | |
| | 85,000 | | | 0.854%, 6/15/2022f,g | | | 77,775 | |
| | | | Cooperatieve Centrale Raiffeisen- Boerenleenbank BA | | | | |
| | 172,000 | | | 3.950%, 11/9/2022 | | | 168,128 | |
| | | | Credit Agricole SA | | | | |
| | 160,000 | | | 1.625%, 4/15/2016e | | | 161,216 | |
| | | | CyrusOne, LP | | | | |
| | 270,000 | | | 6.375%, 11/15/2022 | | | 272,025 | |
| | | | DDR Corporation | | | | |
| | 160,000 | | | 9.625%, 3/15/2016 | | | 189,357 | |
The accompanying Notes to Financial Statements are an integral part of this schedule.
98
Moderate Allocation Fund
Schedule of Investments as of October 31, 2013
| | | | | | | | |
Principal Amount | | | Long-Term Fixed Income (14.1%) | | Value | |
| Financials (1.8%) - continued | | | | |
| | | | Discover Financial Services | | | | |
| | $282,000 | | | 6.450%, 6/12/2017 | | | $321,804 | |
| | | | DnB Boligkreditt AS | | | | |
| | 200,000 | | | 1.450%, 3/21/2018e | | | 198,200 | |
| | | | Eksportfinans ASA | | | | |
| | 104,000 | | | 3.000%, 11/17/2014 | | | 104,364 | |
| | 154,000 | | | 5.500%, 5/25/2016h | | | 161,238 | |
| | | | Fifth Third Bancorp | | | | |
| | 188,000 | | | 5.450%, 1/15/2017 | | | 208,086 | |
| | | | Fifth Third Capital Trust IV | | | | |
| | 144,000 | | | 6.500%, 4/15/2037 | | | 142,200 | |
| | | | General Electric Capital Corporation | | | | |
| | 90,000 | | | 1.136%, 5/9/2016f | | | 90,783 | |
| | 93,000 | | | 1.600%, 11/20/2017 | | | 93,178 | |
| | 64,000 | | | 0.959%, 4/2/2018f | | | 64,475 | |
| | 530,000 | | | 6.000%, 8/7/2019 | | | 627,252 | |
| | 150,000 | | | 1.254%, 3/15/2023f | | | 148,689 | |
| | 183,000 | | | 6.750%, 3/15/2032 | | | 224,019 | |
| | | | Genworth Financial, Inc. | | | | |
| | 144,000 | | | 6.515%, 5/22/2018h | | | 166,950 | |
| | | | Goldman Sachs Group, Inc. | | | | |
| | 250,000 | | | 3.700%, 8/1/2015 | | | 261,130 | |
| | 384,000 | | | 0.700%, 3/22/2016f | | | 382,034 | |
| | 128,000 | | | 2.375%, 1/22/2018 | | | 128,735 | |
| | 150,000 | | | 1.436%, 4/30/2018f | | | 150,664 | |
| | 179,000 | | | 7.500%, 2/15/2019 | | | 219,793 | |
| | 192,000 | | | 5.250%, 7/27/2021 | | | 211,924 | |
| | | | Hartford Financial Services Group, Inc. | | | | |
| | 245,000 | | | 4.000%, 10/15/2017 | | | 263,581 | |
| | 128,000 | | | 5.125%, 4/15/2022 | | | 143,157 | |
| | | | HCP, Inc. | | | | |
| | 84,000 | | | 6.000%, 1/30/2017 | | | 94,726 | |
| | 75,000 | | | 6.700%, 1/30/2018 | | | 87,943 | |
| | | | Health Care REIT, Inc. | | | | |
| | 200,000 | | | 4.700%, 9/15/2017 | | | 218,865 | |
| | 80,000 | | | 2.250%, 3/15/2018 | | | 79,864 | |
| | | | HSBC Bank plc | | | | |
| | 200,000 | | | 0.904%, 5/15/2018e,f | | | 200,445 | |
| | | | HSBC Finance Corporation | | | | |
| | 308,000 | | | 6.676%, 1/15/2021 | | | 357,950 | |
| | | | HSBC USA, Inc. | | | | |
| | 160,000 | | | 1.625%, 1/16/2018 | | | 158,801 | |
| | | | Huntington Bancshares, Inc. | | | | |
| | 72,000 | | | 2.600%, 8/2/2018 | | | 72,659 | |
| | | | Huntington National Bank | | | | |
| | 160,000 | | | 1.350%, 8/2/2016 | | | 160,265 | |
| | | | Icahn Enterprises, LP | | | | |
| | 269,675 | | | 8.000%, 1/15/2018 | | | 282,822 | |
| | | | ING Bank NV | | | | |
| | 162,000 | | | 3.750%, 3/7/2017e | | | 171,328 | |
| | | | ING Capital Funding Trust III | | | | |
| | 130,000 | | | 3.848%, 12/29/2049f,j | | | 128,375 | |
| | | | ING US, Inc. | | | | |
| | 180,000 | | | 2.900%, 2/15/2018 | | | 183,701 | |
| | | | International Lease Finance Corporation | | | | |
| | 147,000 | | | 2.204%, 6/15/2016f | | | 147,735 | |
| | | | Intesa Sanpaolo SPA | | | | |
| | 360,000 | | | 3.875%, 1/15/2019c | | | 361,430 | |
| | | | J.P. Morgan Chase & Company | | | | |
| | 100,000 | | | 0.689%, 4/23/2015f | | | 100,198 | |
| | 128,000 | | | 1.125%, 2/26/2016 | | | 128,550 | |
| | 302,000 | | | 3.450%, 3/1/2016 | | | 318,252 | |
| | 324,000 | | | 2.000%, 8/15/2017 | | | 328,122 | |
| | 274,000 | | | 1.138%, 1/25/2018f | | | 276,074 | |
| | 115,000 | | | 1.800%, 1/25/2018 | | | 114,206 | |
| | 242,000 | | | 6.300%, 4/23/2019 | | | 286,797 | |
| | 72,000 | | | 3.200%, 1/25/2023 | | | 69,134 | |
| | 244,000 | | | 7.900%, 4/29/2049j | | | 269,010 | |
| | | | J.P. Morgan Chase Bank NA | | | | |
| | 228,000 | | | 0.584%, 6/13/2016f | | | 225,840 | |
| | | | KeyBank NA | | | | |
| | 240,000 | | | 7.413%, 5/6/2015 | | | 261,848 | |
| | | | Liberty Mutual Group, Inc. | | | | |
| | 83,000 | | | 4.950%, 5/1/2022e | | | 87,750 | |
| | 72,000 | | | 6.500%, 5/1/2042e | | | 80,437 | |
| | | | Liberty Property, LP | | | | |
| | 193,000 | | | 5.500%, 12/15/2016 | | | 214,098 | |
| | | | Lloyds TSB Bank plc | | | | |
| | 160,000 | | | 6.500%, 9/14/2020e | | | 180,773 | |
| | | | Merrill Lynch & Company, Inc. | | | | |
| | 128,000 | | | 6.400%, 8/28/2017 | | | 148,745 | |
| | | | Morgan Stanley | | | | |
| | 166,000 | | | 4.750%, 4/1/2014h | | | 168,821 | |
| | 64,000 | | | 1.512%, 2/25/2016f | | | 64,672 | |
| | 64,000 | | | 1.750%, 2/25/2016 | | | 64,628 | |
| | 292,000 | | | 4.750%, 3/22/2017 | | | 320,013 | |
| | 135,000 | | | 6.250%, 8/28/2017 | | | 155,493 | |
| | 100,000 | | | 1.518%, 4/25/2018f | | | 100,789 | |
| | 144,000 | | | 4.875%, 11/1/2022 | | | 148,242 | |
| | 150,000 | | | 4.100%, 5/22/2023 | | | 144,892 | |
| | | | Murray Street Investment Trust I | | | | |
| | 402,000 | | | 4.647%, 3/9/2017 | | | 437,066 | |
| | | | National City Corporation | | | | |
| | 216,000 | | | 6.875%, 5/15/2019 | | | 259,181 | |
| | | | Nederlandse Waterschapsbank NV | | | | |
| | 100,000 | | | 0.750%, 3/29/2016e | | | 100,174 | |
| | | | Nomura Holdings, Inc. | | | | |
| | 150,000 | | | 1.704%, 9/13/2016f | | | 152,618 | |
| | 307,000 | | | 2.000%, 9/13/2016 | | | 309,244 | |
| | | | Nordea Eiendomskreditt AS | | | | |
| | 150,000 | | | 2.125%, 9/22/2016e | | | 155,105 | |
| | | | PNC Bank NA | | | | |
| | 216,000 | | | 1.150%, 11/1/2016 | | | 216,640 | |
| | | | Prologis, LP | | | | |
| | 216,000 | | | 7.375%, 10/30/2019 | | | 267,548 | |
| | | | Prudential Covered Trust | | | | |
| | 127,500 | | | 2.997%, 9/30/2015e | | | 131,926 | |
| | | | Realty Income Corporation | | | | |
| | 81,000 | | | 2.000%, 1/31/2018 | | | 79,891 | |
| | | | Regions Bank | | | | |
| | 369,000 | | | 7.500%, 5/15/2018 | | | 439,014 | |
| | | | Reinsurance Group of America, Inc. | | | | |
| | 150,000 | | | 5.625%, 3/15/2017 | | | 166,559 | |
| | 81,000 | | | 5.000%, 6/1/2021 | | | 87,103 | |
| | | | Royal Bank of Canada | | | | |
| | 300,000 | | | 1.125%, 7/22/2016 | | | 301,868 | |
| | 252,000 | | | 2.200%, 7/27/2018 | | | 254,818 | |
| | | | Royal Bank of Scotland Group plc | | | | |
| | 214,000 | | | 5.050%, 1/8/2015 | | | 221,214 | |
| | 128,000 | | | 2.550%, 9/18/2015 | | | 131,095 | |
| | 64,000 | | | 6.125%, 12/15/2022 | | | 66,168 | |
| | | | Santander US Debt SAU | | | | |
| | 210,000 | | | 3.724%, 1/20/2015e | | | 212,791 | |
The accompanying Notes to Financial Statements are an integral part of this schedule.
99
Moderate Allocation Fund
Schedule of Investments as of October 31, 2013
| | | | | | | | |
Principal Amount | | | Long-Term Fixed Income (14.1%) | | Value | |
| Financials (1.8%) - continued | |
| | | | Simon Property Group, LP | | | | |
| | $128,000 | | | 10.350%, 4/1/2019 | | | $175,794 | |
| | | | SLM Corporation | | | | |
| | 108,000 | | | 3.875%, 9/10/2015 | | | 111,780 | |
| | 80,000 | | | 6.250%, 1/25/2016 | | | 87,100 | |
| | | | SpareBank 1 Boligkreditt AS | | | | |
| | 200,000 | | | 1.250%, 5/2/2018e | | | 195,880 | |
| | | | Svensk Exportkredit AB | | | | |
| | 100,000 | | | 1.125%, 4/5/2018 | | | 98,637 | |
| | | | Svenska Handelsbanken AB | | | | |
| | 160,000 | | | 3.125%, 7/12/2016 | | | 168,219 | |
| | 51,000 | | | 1.625%, 3/21/2018 | | | 50,245 | |
| | | | Swedbank Hypotek AB | | | | |
| | 200,000 | | | 1.375%, 3/28/2018e,h | | | 197,840 | |
| | | | Swiss RE Capital I, LP | | | | |
| | 170,000 | | | 6.854%, 5/29/2049e,j | | | 181,050 | |
| | | | Toronto-Dominion Bank | | | | |
| | 140,000 | | | 0.716%, 9/9/2016f | | | 140,595 | |
| | | | UBS AG London | | | | |
| | 200,000 | | | 0.750%, 3/24/2016e | | | 198,998 | |
| | | | UBS AG/Stamford, Connecticut | | | | |
| | 162,000 | | | 5.875%, 12/20/2017 | | | 187,841 | |
| | | | Union Bank NA | | | | |
| | 288,000 | | | 1.500%, 9/26/2016 | | | 291,287 | |
| | | | Ventas Realty, LP | | | | |
| | 216,000 | | | 1.550%, 9/26/2016 | | | 217,550 | |
| | | | Wachovia Corporation | | | | |
| | 386,000 | | | 5.625%, 10/15/2016 | | | 433,996 | |
| | 150,000 | | | 0.524%, 6/15/2017f | | | 148,513 | |
| | | | Wells Fargo & Company | | | | |
| | 426,000 | | | 1.250%, 7/20/2016 | | | 428,539 | |
| | 215,000 | | | 2.100%, 5/8/2017 | | | 220,948 | |
| | 179,000 | | | 1.500%, 1/16/2018 | | | 178,340 | |
| | | | | |
| | | | Total | | | 27,945,546 | |
| | | | | |
| |
| Foreign Government (0.1%) | | | | |
| | | | Asian Development Bank | | | | |
| | 200,000 | | | 0.500%, 6/20/2016 | | | 199,940 | |
| | | | Denmark Government International Bond | | | | |
| | 200,000 | | | 0.375%, 4/25/2016e | | | 199,320 | |
| | | | Export-Import Bank of Korea | | | | |
| | 160,000 | | | 1.250%, 11/20/2015 | | | 160,331 | |
| | | | International Finance Corporation | | | | |
| | 125,000 | | | 0.500%, 5/16/2016 | | | 124,972 | |
| | | | Kommunalbanken AS | | | | |
| | 200,000 | | | 0.332%, 3/18/2016e,f | | | 199,868 | |
| | | | Kommuninvest i Sverige AB | | | | |
| | 200,000 | | | 0.500%, 6/15/2016e | | | 199,212 | |
| | | | Mexico Government International Bond | | | | |
| | 144,000 | | | 4.000%, 10/2/2023 | | | 146,232 | |
| | | | Province of Ontario | | | | |
| | 240,000 | | | 1.000%, 7/22/2016 | | | 241,568 | |
| | | | | |
| | | | Total | | | 1,471,443 | |
| | | | | |
| |
| Mortgage-Backed Securities (3.2%) | | | | |
| | | | Federal Home Loan Mortgage Corporation Gold 15-Yr. Pass Through | | | | |
| | 4,575,000 | | | 3.000%, 12/1/2028c | | | 4,729,406 | |
| | | | Federal Home Loan Mortgage Corporation Gold 30-Yr. Pass Through | | | | |
| | 1,386,789 | | | 1.967%, 6/1/2043f | | | 1,411,127 | |
| | 4,500,000 | | | 3.500%, 11/1/2043c | | | 4,599,141 | |
| | | | Federal National Mortgage Association | | | | |
| | 670,713 | | | 2.074%, 1/1/2043f | | | 684,970 | |
| | 1,181,926 | | | 2.060%, 3/1/2043f | | | 1,208,143 | |
| | 980,443 | | | 1.754%, 7/1/2043f | | | 988,776 | |
| | 3,183,839 | | | 1.760%, 7/1/2043f | | | 3,196,780 | |
| | | | Federal National Mortgage Association Conventional 15-Yr. Pass Through | | | | |
| | 2,750,000 | | | 2.500%, 11/1/2028c | | | 2,778,789 | |
| | 1,400,000 | | | 3.500%, 11/1/2028c | | | 1,478,203 | |
| | | | Federal National Mortgage Association Conventional 30-Yr. Pass Though | | | | |
| | 3,505,001 | | | 1.979%, 7/1/2043f | | | 3,565,320 | |
| | 2,425,948 | | | 2.023%, 7/1/2043f | | | 2,471,204 | |
| | 2,086,837 | | | 2.120%, 8/1/2043f | | | 2,132,314 | |
| | | | Federal National Mortgage Association Conventional 30-Yr. Pass Through | | | | |
| | 8,875,000 | | | 3.500%, 11/1/2043c | | | 9,102,422 | |
| | 8,300,000 | | | 4.000%, 11/1/2043c | | | 8,743,531 | |
| | 4,104,000 | | | 4.500%, 11/1/2043c | | | 4,393,204 | |
| | | | | |
| | | | Total | | | 51,483,330 | |
| | | | | |
| |
| Technology (0.1%) | | | | |
| | | | Apple, Inc. | | | | |
| | 200,000 | | | 0.516%, 5/3/2018f | | | 199,379 | |
| | 64,000 | | | 2.400%, 5/3/2023 | | | 58,485 | |
| | | | Computer Sciences Corporation | | | | |
| | 124,000 | | | 2.500%, 9/15/2015 | | | 126,987 | |
| | | | EMC Corporation | | | | |
| | 252,000 | | | 1.875%, 6/1/2018 | | | 252,925 | |
| | | | First Data Corporation | | | | |
| | 270,000 | | | 7.375%, 6/15/2019e | | | 290,587 | |
| | | | Hewlett-Packard Company | | | | |
| | 166,000 | | | 2.125%, 9/13/2015 | | | 168,878 | |
| | | | Intel Corporation | | | | |
| | 160,000 | | | 4.000%, 12/15/2032 | | | 150,472 | |
| | | | Iron Mountain, Inc. | | | | |
| | 270,000 | | | 6.000%, 8/15/2023 | | | 274,725 | |
| | | | Oracle Corporation | | | | |
| | 162,000 | | | 1.200%, 10/15/2017 | | | 159,894 | |
| | 170,000 | | | 0.824%, 1/15/2019f | | | 170,702 | |
| | | | Samsung Electronics America, Inc. | | | | |
| | 128,000 | | | 1.750%, 4/10/2017e | | | 129,534 | |
| | | | Tyco Electronics Group SA | | | | |
| | 294,000 | | | 6.550%, 10/1/2017 | | | 340,517 | |
| | | | Xerox Corporation | | | | |
| | 166,000 | | | 7.200%, 4/1/2016 | | | 187,569 | |
| | | | | |
| | | | Total | | | 2,510,654 | |
| | | | | |
| |
| Transportation (0.1%) | | | | |
| | | | American Airlines Pass Through Trust | | | | |
| | 160,000 | | | 4.950%, 1/15/2023e | | | 164,800 | |
The accompanying Notes to Financial Statements are an integral part of this schedule.
100
Moderate Allocation Fund
Schedule of Investments as of October 31, 2013
| | | | | | | | |
Principal Amount | | | Long-Term Fixed Income (14.1%) | | Value | |
| Transportation (0.1%) - continued | | | | |
| | | | Avis Budget Car Rental, LLC | | | | |
| | $270,000 | | | 8.250%, 1/15/2019 | | | $294,300 | |
| | | | Canadian National Railway Company | | | | |
| | 85,000 | | | 0.438%, 11/6/2015c,f | | | 84,966 | |
| | | | Canadian Pacific Railway Company | | | | |
| | 90,000 | | | 7.125%, 10/15/2031 | | | 110,216 | |
| | 104,000 | | | 5.750%, 3/15/2033 | | | 113,376 | |
| | | | Continental Airlines, Inc. | | | | |
| | 185,324 | | | 4.150%, 4/11/2024 | | | 183,008 | |
| | | | CSX Corporation | | | | |
| | 174,000 | | | 6.250%, 4/1/2015 | | | 187,285 | |
| | 126,000 | | | 3.700%, 11/1/2023 | | | 125,754 | |
| | | | Delta Air Lines, Inc. | | | | |
| | 250,000 | | | 6.750%, 5/23/2017 | | | 253,908 | |
| | 106,771 | | | 4.950%, 5/23/2019 | | | 114,512 | |
| | 41,465 | | | 4.750%, 5/7/2020 | | | 43,745 | |
| | | | ERAC USA Finance, LLC | | | | |
| | 162,000 | | | 1.400%, 4/15/2016e | | | 162,247 | |
| | 84,000 | | | 2.800%, 11/1/2018e | | | 85,132 | |
| | | | Kansas City Southern de Mexico SA de CV | | | | |
| | 283,000 | | | 0.937%, 10/28/2016e,f | | | 283,423 | |
| | 128,000 | | | 2.350%, 5/15/2020 | | | 122,079 | |
| | | | Virgin Australia Holdings, Ltd. | | | | |
| | 75,000 | | | 5.000%, 10/23/2023e | | | 76,875 | |
| | | | | |
| | | | Total | | | 2,405,626 | |
| | | | | |
| |
| U.S. Government and Agencies (1.8%) | | | | |
| | | | U.S. Treasury Bonds | | | | |
| | 550,000 | | | 5.250%, 11/15/2028 | | | 692,571 | |
| | 1,175,000 | | | 4.375%, 5/15/2040 | | | 1,344,457 | |
| | 2,130,000 | | | 3.000%, 5/15/2042 | | | 1,888,377 | |
| | 569,000 | | | 2.875%, 5/15/2043 | | | 488,184 | |
| | | | U.S. Treasury Notes | | | | |
| | 3,375,000 | | | 0.375%, 2/15/2016 | | | 3,374,210 | |
| | 6,250,000 | | | 1.000%, 5/31/2018 | | | 6,199,706 | |
| | 1,685,000 | | | 1.625%, 8/15/2022 | | | 1,582,847 | |
| | 200,000 | | | 1.750%, 5/15/2023 | | | 186,797 | |
| | | | U.S. Treasury Notes, TIPS | | | | |
| | 5,969,083 | | | 0.125%, 4/15/2018 | | | 6,174,742 | |
| | 6,991,073 | | | 0.125%, 1/15/2023 | | | 6,832,690 | |
| | | | | |
| | | | Total | | | 28,764,581 | |
| | | | | |
| |
| U.S. Municipals (1.8%) | | | | |
| | | | Buckeye Tobacco Settlement Financing Auth. Rev. | | | | |
| | 1,086,000 | | | 5.125%, 6/1/2024, Ser. A-2 | | | 927,607 | |
| | | | Dallas/Fort Worth Texas International Airport Joint Rev. Improvement | | | | |
| | 1,885,000 | | | 5.000%, 11/1/2038, Ser. A, AMT | | | 1,794,633 | |
| | | | Los Angeles Department Of Water and Power Power System Rev. | | | | |
| | 2,360,000 | | | 5.000%, 7/1/2043, Ser. B | | | 2,464,336 | |
| | | | Massachusetts Bay Transportation Auth. Assessment Rev. | | | | |
| | 1,405,000 | | | 5.000%, 7/1/2041, Ser. A | | | 1,484,748 | |
| | | | Massachusetts Development Finance Agency Rev. (Boston University) | | | | |
| | 1,346,000 | | | 5.000%, 10/1/2048 | | | 1,364,844 | |
| | | | Massachusetts School Building Auth. Sales Tax Rev. | | | | |
| | 1,885,000 | | | 5.000%, 5/15/2043, Ser. A | | | 1,984,226 | |
| | | | Metropolitan Transportation Auth. Transportation Rev. | | | | |
| | 1,888,000 | | | 5.000%, 11/15/2043, Ser. A | | | 1,916,565 | |
| | | | Miami-Dade County Expressway Auth. Toll System Rev. | | | | |
| | 803,000 | | | 5.000%, 7/1/2040, Ser. A | | | 810,187 | |
| | | | New Jersey Transportation Trust Fund Auth. Transportation System Rev. | | | | |
| | 2,361,000 | | | 5.000%, 6/15/2042, Ser. A | | | 2,402,199 | |
| | | | New Jersey Turnpike Auth. Turnpike Rev. | | | | |
| | 755,000 | | | 5.000%, 1/1/2043, Ser. A | | | 773,611 | |
| | | | New York City Municipal Water Finance Auth. Water and Sewer System Rev. | | | | |
| | 1,888,000 | | | 5.000%, 6/15/2047, Ser. EE | | | 1,963,898 | |
| | | | New York City Transitional Finance Auth. Future Tax Rev. | | | | |
| | 1,764,000 | | | 5.000%, 5/1/2042, Ser. I | | | 1,846,767 | |
| | | | New York State Dormitory Auth. Personal Income Tax Rev. | | | | |
| | 1,133,000 | | | 5.000%, 3/15/2042, Ser. B | | | 1,180,869 | |
| | | | North Texas Tollway Auth. Rev. | | | | |
| | 1,888,000 | | | 5.000%, 1/1/2042, Ser. B | | | 1,879,391 | |
| | | | San Diego County Regional Airport Auth. Airport Rev. | | | | |
| | 1,629,000 | | | 5.000%, 7/1/2038, Ser. B, AMT | | | 1,606,178 | |
| | | | South Carolina Public Service Auth. Rev. Obligations | | | | |
| | 1,888,000 | | | 5.000%, 12/1/2043, Ser. D | | | 1,915,640 | |
| | | | State of California Various Purpose G.O. | | | | |
| | 944,000 | | | 5.000%, 9/1/2036 | | | 979,391 | |
| | 472,000 | | | 5.000%, 4/1/2042 | | | 483,035 | |
| | 472,000 | | | 5.000%, 2/1/2043 | | | 483,545 | |
| | | | University of Massachusetts Building Auth. Proj. Rev. | | | | |
| | 1,511,000 | | | 5.000%, 11/1/2039, Ser. 2 | | | 1,586,867 | |
| | | | | |
| | | | Total | | | 29,848,537 | |
| | | | | |
| |
| Utilities (0.4%) | | | | |
| | | | AES Corporation | | | | |
| | 270,000 | | | 7.375%, 7/1/2021 | | | 305,775 | |
| | | | American Electric Power Company, Inc. | | | | |
| | 160,000 | | | 1.650%, 12/15/2017 | | | 158,043 | |
| | | | Atlas Pipeline Partners, LP | | | | |
| | 270,000 | | | 4.750%, 11/15/2021e | | | 253,800 | |
| | | | Dayton Power and Light Company | | | | |
| | 144,000 | | | 1.875%, 9/15/2016e | | | 145,319 | |
| | | | DCP Midstream Operating, LP | | | | |
| | 80,000 | | | 2.500%, 12/1/2017 | | | 80,089 | |
The accompanying Notes to Financial Statements are an integral part of this schedule.
101
Moderate Allocation Fund
Schedule of Investments as of October 31, 2013
| | | | | | | | |
Principal Amount | | | Long-Term Fixed Income (14.1%) | | Value | |
| Utilities (0.4%) - continued | | | | |
| | | | Duke Energy Corporation | | | | |
| | $216,000 | | | 2.100%, 6/15/2018 | | | $217,031 | |
| | | | Enel Finance International NV | | | | |
| | 192,000 | | | 3.875%, 10/7/2014e | | | 196,800 | |
| | 108,000 | | | 6.250%, 9/15/2017e | | | 121,369 | |
| | | | Energy Transfer Partners, LP | | | | |
| | 64,000 | | | 9.700%, 3/15/2019 | | | 84,004 | |
| | 249,000 | | | 4.650%, 6/1/2021 | | | 260,748 | |
| | | | Enterprise Products Operating, LLC | | | | |
| | 249,000 | | | 1.250%, 8/13/2015 | | | 250,365 | |
| | | | Exelon Corporation | | | | |
| | 183,000 | | | 4.900%, 6/15/2015 | | | 193,899 | |
| | | | Exelon Generation Company, LLC | | | | |
| | 192,000 | | | 5.200%, 10/1/2019 | | | 209,904 | |
| | | | Iberdrola Finance Ireland, Ltd. | | | | |
| | 210,000 | | | 3.800%, 9/11/2014e | | | 214,719 | |
| | | | ITC Holdings Corporation | | | | |
| | 214,000 | | | 5.875%, 9/30/2016e | | | 238,447 | |
| | 84,000 | | | 4.050%, 7/1/2023 | | | 84,041 | |
| | | | Korea Western Power Company, Ltd. | | | | |
| | 252,000 | | | 2.875%, 10/10/2018e | | | 252,966 | |
| | | | MidAmerican Energy Holdings Company | | | | |
| | 166,000 | | | 6.500%, 9/15/2037 | | | 196,153 | |
| | | | NextEra Energy Capital Holdings, Inc. | | | | |
| | 249,000 | | | 1.200%, 6/1/2015 | | | 250,642 | |
| | | | NiSource Finance Corporation | | | | |
| | 216,000 | | | 6.800%, 1/15/2019 | | | 255,071 | |
| | | | Northeast Utilities | | | | |
| | 96,000 | | | 1.450%, 5/1/2018 | | | 93,983 | |
| | | | NRG Energy, Inc. | | | | |
| | 270,000 | | | 6.625%, 3/15/2023 | | | 279,112 | |
| | | | ONEOK Partners, LP | | | | |
| | 141,000 | | | 8.625%, 3/1/2019 | | | 179,809 | |
| | 108,000 | | | 5.000%, 9/15/2023 | | | 115,422 | |
| | | | Pacific Gas & Electric Company | | | | |
| | 245,000 | | | 5.625%, 11/30/2017 | | | 281,704 | |
| | | | PPL Capital Funding, Inc. | | | | |
| | 304,000 | | | 1.900%, 6/1/2018 | | | 300,170 | |
| | 72,000 | | | 3.500%, 12/1/2022 | | | 68,788 | |
| | | | Sempra Energy | | | | |
| | 245,000 | | | 6.150%, 6/15/2018 | | | 287,314 | |
| | | | Spectra Energy Partners, LP | | | | |
| | 72,000 | | | 2.950%, 9/25/2018 | | | 73,652 | |
| | 72,000 | | | 4.750%, 3/15/2024 | | | 75,701 | |
| | | | Williams Partners, LP | | | | |
| | 83,000 | | | 7.250%, 2/1/2017 | | | 96,765 | |
| | | | | |
| | | | Total | | | 5,821,605 | |
| | | | | |
| | | | | | | | |
| | | | | |
| | | | Total Long-Term Fixed Income (cost $223,901,264) | | | 226,995,092 | |
| | | | | |
| | |
| Shares | | | Collateral Held for Securities Loaned (0.1%) | | Value | |
| | 2,115,760 | | | Thrivent Cash Management Trust | | | 2,115,760 | |
| | | | | |
| | | | Total Collateral Held for Securities Loaned (cost $2,115,760) | | | 2,115,760 | |
| | | | | |
| | |
Shares or Principal Amount | | | Short-Term Investments (8.2%) | | Value | |
| | | | Fairway Finance, LLC | | | | |
| | 2,000,000 | | | 0.140%, 12/9/2013e,k | | | 1,999,705 | |
| | | | Federal Home Loan Bank Discount Notes | | | | |
| | 34,575,000 | | | 0.078%, 11/6/2013k | | | 34,574,627 | |
| | 33,000,000 | | | 0.020%, 11/20/2013k | | | 32,999,651 | |
| | 7,600,000 | | | 0.093%, 11/22/2013k,l | | | 7,599,588 | |
| | 6,000,000 | | | 0.025%, 11/27/2013k | | | 5,999,892 | |
| | 9,000,000 | | | 0.033%, 12/4/2013k,l | | | 8,999,725 | |
| | 5,000,000 | | | 0.050%, 12/26/2013k | | | 4,999,618 | |
| | 17,500,000 | | | 0.048%, 1/3/2014k | | | 17,498,530 | |
| | 10,000,000 | | | 0.050%, 1/24/2014k | | | 9,998,833 | |
| | | | Federal National Mortgage Association Discount Notes | | | | |
| | 1,900,000 | | | 0.100%, 12/4/2013k,l | | | 1,899,826 | |
| | 100,000 | | | 0.080%, 12/16/2013k,l | | | 99,990 | |
| | | | Novartis Finance Corporation | | | | |
| | 2,500,000 | | | 0.060%, 11/6/2013e,k | | | 2,499,979 | |
| | | | U.S. Treasury Bills | | | | |
| | 3,000,000 | | | 0.062%, 12/26/2013k,m | | | 2,999,715 | |
| | | | | |
| | | | Total Short-Term Investments (at amortized cost) | | | 132,169,679 | |
| | | | | |
| | | | Total Investments (cost $1,430,361,216) 102.1% | | | $1,650,521,947 | |
| | | | | |
| | | | Other Assets and Liabilities, Net (2.1%) | | | (34,057,614 | ) |
| | | | | |
| | | | Total Net Assets 100.0% | | | $1,616,464,333 | |
| | | | | |
a | The stated interest rate represents the weighted average of all contracts within the bank loan facility. |
b | All or a portion of the loan is unfunded. |
c | Denotes investments purchased on a when-issued or delayed delivery basis. |
d | Non-income producing security. |
e | Denotes securities sold under Rule 144A of the Securities Act of 1933, which exempts them from registration. These securities have been deemed liquid and may be resold to other dealers in the program or to other qualified institutional buyers. As of October 31, 2013, the value of these investments was $26,339,667 or 1.6% of total net assets. |
f | Denotes variable rate securities. Variable rate securities are securities whose yields vary with a designated market index or market rate. The rate shown is as of October 31, 2013. |
The accompanying Notes to Financial Statements are an integral part of this schedule.
102
Moderate Allocation Fund
Schedule of Investments as of October 31, 2013
g | Denotes restricted securities. Restricted securities are investment securities which have been deemed illiquid and cannot be offered for public sale without first being registered under the Securities Act of 1933. The following table indicates the acquisition date and cost of restricted securities Moderate Allocation Fund owned as of October 31, 2013. |
| | | | | | | | |
Security | | Acquisition
Date | | | Cost | |
CoBank ACB | | | 10/18/2013 | | | | $78,178 | |
Edlinc Student Loan Funding Trust | | | 2/28/2013 | | | | $79,012 | |
FNA Trust | | | 4/29/2013 | | | | $192,603 | |
h | All or a portion of the security is on loan. |
i | Denotes interest only security. Interest only securities represent the right to receive monthly interest payments on an underlying pool of mortgages or assets. The principal shown is the outstanding par amount of the pool as of the end of the period. The actual effective yield of the security is different than the stated coupon rate. |
j | Denotes perpetual securities. Perpetual securities pay an indefinite stream of interest, but may be called by the issuer at an earlier date. |
k | The interest rate shown reflects the yield, coupon rate or the discount rate at the date of purchase. |
l | At October 31, 2013, $9,799,428 of investments were held on deposit with the counterparty and pledged as the initial margin deposit for open futures contracts. |
m | At October 31, 2013, $999,905 of investments were pledged as collateral with the custodian under the agreement between the counterparty, the custodian and the fund for open swap contracts. |
Definitions:
| | | | |
ADR | | - | | American Depositary Receipt, which are certificates for an underlying foreign security’s shares held by an issuing U.S. depository bank. |
AMT | | - | | Subject to Alternative Minimum Tax |
Auth. | | - | | Authority |
ETF | | - | | Exchange Traded Fund. |
G.O. | | - | | General Obligation |
REIT | | - | | Real Estate Investment Trust is a company that buys, develops, manages and/or sells real estate assets. |
Rev. | | - | | Revenue |
Ser. | | - | | Series |
TIPS | | - | | Treasury Inflation Protected Security. |
Unrealized Appreciation (Depreciation)
Gross unrealized appreciation and depreciation of investments, based on cost for federal income tax purposes, were as follows:
| | | | |
Gross unrealized appreciation | | | $212,229,768 | |
Gross unrealized depreciation | | | (3,696,374 | ) |
| | | | |
Net unrealized appreciation (depreciation) | | | $208,533,394 | |
| |
Cost for federal income tax purposes | | | $1,441,988,553 | |
The accompanying Notes to Financial Statements are an integral part of this schedule.
103
Moderate Allocation Fund
Schedule of Investments as of October 31, 2013
Fair Valuation Measurements
The following table is a summary of the inputs used, as of October 31, 2013, in valuing Moderate Allocation Fund’s assets carried at fair value.
| | | | | | | | | | | | | | | | |
Investments in Securities | | Total | | | Level 1 | | | Level 2 | | | Level 3 | |
| | | | |
Bank Loans | | | | | | | | | | | | | | | | |
Basic Materials | | | 5,348,609 | | | | – | | | | 5,348,609 | | | | – | |
Capital Goods | | | 2,594,981 | | | | – | | | | 2,594,981 | | | | – | |
Communications Services | | | 26,429,860 | | | | – | | | | 26,429,860 | | | | – | |
Consumer Cyclical | | | 6,994,748 | | | | – | | | | 6,994,748 | | | | – | |
Consumer Non-Cyclical | | | 7,929,032 | | | | – | | | | 7,929,032 | | | | – | |
Energy | | | 3,619,422 | | | | – | | | | 3,619,422 | | | | – | |
Financials | | | 2,112,610 | | | | – | | | | 2,112,610 | | | | – | |
Technology | | | 4,307,290 | | | | – | | | | 4,307,290 | | | | – | |
Transportation | | | 2,575,302 | | | | – | | | | 2,575,302 | | | | – | |
Utilities | | | 2,016,860 | | | | – | | | | 2,016,860 | | | | – | |
| | | | |
Mutual Funds | | | | | | | | | | | | | | | | |
Equity Mutual Funds | | | 621,526,684 | | | | 621,526,684 | | | | – | | | | – | |
Fixed Income Mutual Funds | | | 354,429,325 | | | | 354,429,325 | | | | – | | | | – | |
| | | | |
Common Stock | | | | | | | | | | | | | | | | |
Consumer Discretionary | | | 38,850,339 | | | | 36,882,305 | | | | 1,968,034 | | | | – | |
Consumer Staples | | | 14,549,711 | | | | 13,265,522 | | | | 1,284,189 | | | | – | |
Energy | | | 21,561,174 | | | | 21,210,890 | | | | 350,284 | | | | – | |
Financials | | | 54,834,003 | | | | 51,676,671 | | | | 3,157,332 | | | | – | |
Health Care | | | 29,182,188 | | | | 27,705,395 | | | | 1,476,793 | | | | – | |
Industrials | | | 30,805,904 | | | | 28,997,862 | | | | 1,808,042 | | | | – | |
Information Technology | | | 40,945,125 | | | | 40,632,644 | | | | 312,481 | | | | – | |
Materials | | | 9,419,090 | | | | 9,066,314 | | | | 352,776 | | | | – | |
Telecommunications Services | | | 2,957,610 | | | | 2,125,034 | | | | 832,576 | | | | – | |
Utilities | | | 6,251,549 | | | | 5,762,903 | | | | 488,646 | | | | – | |
| | | | |
Long-Term Fixed Income | | | | | | | | | | | | | | | | |
Asset-Backed Securities | | | 10,422,569 | | | | – | | | | 10,153,949 | | | | 268,620 | |
Basic Materials | | | 2,997,533 | | | | – | | | | 2,997,533 | | | | – | |
Capital Goods | | | 1,970,441 | | | | – | | | | 1,970,441 | | | | – | |
Collateralized Mortgage Obligations | | | 14,271,692 | | | | – | | | | 14,271,692 | | | | – | |
Commercial Mortgage-Backed | | | | | | | | | | | | | | | | |
Securities | | | 19,531,502 | | | | – | | | | 19,531,502 | | | | – | |
Communications Services | | | 7,586,662 | | | | – | | | | 7,586,662 | | | | – | |
Consumer Cyclical | | | 5,836,751 | | | | – | | | | 5,836,751 | | | | – | |
Consumer Non-Cyclical | | | 9,059,685 | | | | – | | | | 9,059,685 | | | | – | |
Energy | | | 5,066,935 | | | | – | | | | 5,066,935 | | | | – | |
Financials | | | 27,945,546 | | | | – | | | | 27,867,771 | | | | 77,775 | |
Foreign Government | | | 1,471,443 | | | | – | | | | 1,471,443 | | | | – | |
Mortgage-Backed Securities | | | 51,483,330 | | | | – | | | | 51,483,330 | | | | – | |
Technology | | | 2,510,654 | | | | – | | | | 2,510,654 | | | | – | |
Transportation | | | 2,405,626 | | | | – | | | | 2,405,626 | | | | – | |
U.S. Government and Agencies | | | 28,764,581 | | | | – | | | | 28,764,581 | | | | – | |
U.S. Municipals | | | 29,848,537 | | | | – | | | | 29,848,537 | | | | – | |
Utilities | | | 5,821,605 | | | | – | | | | 5,821,605 | | | | – | |
Collateral Held for Securities Loaned | | | 2,115,760 | | | | 2,115,760 | | | | – | | | | – | |
Short-Term Investments | | | 132,169,679 | | | | – | | | | 132,169,679 | | | | – | |
| |
Total | | | $1,650,521,947 | | | | $1,215,397,309 | | | | $434,778,243 | | | | $346,395 | |
| |
| | | | |
Other Financial Instruments | | Total | | | Level 1 | | | Level 2 | | | Level 3 | |
| | | | |
Asset Derivatives | | | | | | | | | | | | | | | | |
Futures Contracts | | | 8,645,010 | | | | 3,856,943 | | | | 4,788,067 | | | | – | |
Credit Default Swaps | | | 47,257 | | | | – | | | | 47,257 | | | | – | |
| |
Total Asset Derivatives | | | $8,692,267 | | | | $3,856,943 | | | | $4,835,324 | | | | $– | |
| |
| | | | |
Liability Derivatives | | | | | | | | | | | | | | | | |
Futures Contracts | | | 3,939,718 | | | | 3,939,718 | | | | – | | | | – | |
| |
Total Liability Derivatives | | | $3,939,718 | | | | $3,939,718 | | | | $– | | | | $– | |
| |
There were no significant transfers between Levels during the period ended October 31, 2013. Transfers between Levels are identified as of the end of the period.
The accompanying Notes to Financial Statements are an integral part of this schedule.
104
Moderate Allocation Fund
Schedule of Investments as of October 31, 2013
| | | | | | | | | | | | | | | | | | | | |
Futures Contracts | | Number of
Contracts
Long/(Short) | | | Expiration
Date | | | Notional
Principal
Amount | | | Value | | | Unrealized
Gain/(Loss) | |
2-Yr. U.S. Treasury Bond Futures | | | (100 | ) | | | December 2013 | | | | ($21,968,445 | ) | | | ($22,042,188 | ) | | | ($73,743 | ) |
5-Yr. U.S. Treasury Bond Futures | | | (250 | ) | | | December 2013 | | | | (29,891,815 | ) | | | (30,421,875 | ) | | | (530,060 | ) |
30-Yr. U.S. Treasury Bond Futures | | | 310 | | | | December 2013 | | | | 40,715,087 | | | | 41,791,875 | | | | 1,076,788 | |
Eurex EURO STOXX 50 Futures | | | 1,685 | | | | December 2013 | | | | 65,150,495 | | | | 69,938,562 | | | | 4,788,067 | |
Russell 2000 Index Mini-Futures | | | (168 | ) | | | December 2013 | | | | (17,576,614 | ) | | | (18,443,040 | ) | | | (866,426 | ) |
S&P 400 Index Mini-Futures | | | (409 | ) | | | December 2013 | | | | (50,144,271 | ) | | | (52,613,760 | ) | | | (2,469,489 | ) |
S&P 500 Index Futures | | | 153 | | | | December 2013 | | | | 64,195,595 | | | | 66,975,750 | | | | 2,780,155 | |
Total Futures Contracts | | | | | | | | | | | | | | | | | | | $4,705,292 | |
| | | | | | | | | | | | | | | | | | |
Credit Default Swaps and Counterparty | | Buy/Sell Protection1 | | Termination
Date | | | Notional
Principal
Amount2 | | | Value3 | | | Unrealized
Gain/(Loss) | |
CDX HY 21, 5 Year, at
5.00%; Bank of America | | Buy | | | 12/20/2018 | | | | $12,500,000 | | | | $23,550 | | | | $23,550 | |
CDX HY 21, 5 Year, at
5.00%; JP Morgan | | Buy | | | 12/20/2018 | | | | 12,503,000 | | | | 23,707 | | | | 23,707 | |
Total Credit Default Swaps | | | | | | | | | | | | | $47,257 | | | | $47,257 | |
1 | As the buyer of protection, Moderate Allocation Fund pays periodic fees in return for payment by the seller which is contingent upon an adverse credit event occurring in the underlying issuer or reference entity. As the seller of protection, Moderate Allocation Fund collects periodic fees from the buyer and profits if the credit of the underlying issuer or reference entity remains stable or improves while the swap is outstanding, but the seller in a credit default swap contract would be required to pay the amount of credit loss, determined as specified in the agreement, to the buyer in the event of an adverse credit event in the reference entity. |
2 | The maximum potential amount of future payments Moderate Allocation Fund could be required to make as the seller or receive as the buyer of protection. |
3 | The values for credit indexes (CDX or LCDX) serve as an indicator of the current status of the payment/performance risk and represent the liability or profit for the credit default swap contract had the contract been closed as of the reporting date. When protection has been sold, the value of the swap will increase when the swap spread declines representing an improvement in the reference entity’s credit worthiness. The value of the swap will decrease when the swap spread increases representing a deterioration in the reference entity’s credit worthiness. When protection has been purchased, the value of the swap will increase when the swap spread increases representing a deterioration in the reference entity’s credit worthiness. The value of the swap will decrease when the swap spread declines representing an improvement in the reference entity’s credit worthiness. |
The accompanying Notes to Financial Statements are an integral part of this schedule.
105
Moderate Allocation Fund
Schedule of Investments as of October 31, 2013
The following table summarizes the fair value and Statement of Assets and Liabilities location, as of October 31, 2013, for Moderate Allocation Fund’s investments in financial derivative instruments by primary risk exposure as discussed under item (2) Significant Accounting Policies of the Notes to Financial Statements.
| | | | | | |
Derivatives by risk category | | Statement of Assets and Liabilities Location | | Fair Value | |
| | |
Asset Derivatives | | | | | | |
| | |
Interest Rate Contracts | | | | | | |
Futures* | | Net Assets - Net unrealized appreciation/(depreciation) on Futures contracts | | | $1,076,788 | |
Total Interest Rate Contracts | | | | | 1,076,788 | |
| | |
Equity Contracts | | | | | | |
Futures* | | Net Assets - Net unrealized appreciation/(depreciation) on Futures contracts | | | 7,568,222 | |
Total Equity Contracts | | | | | 7,568,222 | |
| | |
Credit Contracts | | | | | | |
Credit Default Swaps | | Receivable/Payable - Swap agreements, at value; Net Assets - Net unrealized appreciation/(depreciation) on Swap agreements | | | 47,257 | |
Total Credit Contracts | | | | | 47,257 | |
| |
Total Asset Derivatives | | | | | $8,692,267 | |
| |
| | |
Liability Derivatives | | | | | | |
| | |
Interest Rate Contracts | | | | | | |
Futures* | | Net Assets - Net unrealized appreciation/(depreciation) on Futures contracts | | | 603,803 | |
Total Interest Rate Contracts | | | | | 603,803 | |
| | |
Equity Contracts | | | | | | |
Futures* | | Net Assets - Net unrealized appreciation/(depreciation) on Futures contracts | | | 3,335,915 | |
Total Equity Contracts | | | | | 3,335,915 | |
| |
Total Liability Derivatives | | | | | $3,939,718 | |
| |
* | Includes cumulative appreciation/depreciation of futures contracts as reported in the Schedule of Investments. Only current day’s variation margin is reported within the Statement of Assets and Liabilities. |
The following table summarizes the net realized gains/(losses) and Statement of Operations location, for the period ended October 31, 2013, for Moderate Allocation Fund’s investments in financial derivative instruments by primary risk exposure.
| | | | | | |
Derivatives by risk category | | Statement of Operations Location | | Realized Gains/(Losses)
recognized in Income | |
| | |
Interest Rate Contracts | | | | | | |
Futures | | Net realized gains/(losses) on Futures contracts | | | (3,826,144 | ) |
| | |
Total Interest Rate Contracts | | | | | (3,826,144 | ) |
| | |
Equity Contracts | | | | | | |
Options Written | | Net realized gains/(losses) on Written option contracts | | | 33,300 | |
Futures | | Net realized gains/(losses) on Futures contracts | | | 5,168,847 | |
| | |
Total Equity Contracts | | | | | 5,202,147 | |
| | |
Foreign Exchange Contracts | | | | | | |
Forward Contracts | | Net realized gains/(losses) on Foreign currency transactions | | | 100,179 | |
| | |
Total Foreign Exchange Contracts | | | | | 100,179 | |
| | |
Credit Contracts | | | | | | |
Credit Default Swaps | | Net realized gains/(losses) on Swap agreements | | | (1,003,660 | ) |
| | |
Total Credit Contracts | | | | | (1,003,660 | ) |
| |
Total | | | | | $472,522 | |
| | |
The accompanying Notes to Financial Statements are an integral part of this schedule.
106
Moderate Allocation Fund
Schedule of Investments as of October 31, 2013
The following table summarizes the change in net unrealized appreciation/(depreciation) and Statement of Operations location, for the period ended October 31, 2013, for Moderate Allocation Fund’s investments in financial derivative instruments by primary risk exposure.
| | | | | | |
Derivatives by risk category | | Statement of Operations Location | | Change in unrealized
appreciation/(depreciation)
recognized in Income | |
| | |
Interest Rate Contracts | | | | | | |
Futures | | Change in net unrealized appreciation/(depreciation) on Futures contracts | | | 467,631 | |
| | |
Total Interest Rate Contracts | | | | | 467,631 | |
| | |
Equity Contracts | | | | | | |
Futures | | Change in net unrealized appreciation/(depreciation) on Futures contracts | | | 4,621,892 | |
| | |
Total Equity Contracts | | | | | 4,621,892 | |
| | |
Credit Contracts | | | | | | |
Credit Default Swaps | | Change in net unrealized appreciation/(depreciation) on Swap agreements | | | 47,257 | |
| | |
Total Credit Contracts | | | | | 47,257 | |
| | |
Foreign Exchange Contracts | | | | | | |
Forward Contracts | | Change in net unrealized appreciation/(depreciation) on Foreign currency forward contracts | | | 39 | |
| | |
Total Foreign Exchange Contracts | | | | | 39 | |
| | |
Total | | | | | $5,136,819 | |
| | |
The following table presents Moderate Allocation Fund’s average volume of derivative activity during the period ended October 31, 2013.
| | | | | | | | | | | | | | | | | | | | | | | | | | | | |
Derivative Risk Category | | Futures
(Notional)* | | | Futures
(Percentage
of Average
Net Assets) | | | Forwards
(Notional)* | | | Forwards
(Percentage
of Average
Net Assets) | | | Swaps
(Notional)* | | | Swaps
(Percentage
of Average
Net Assets) | | | Options
(Contracts) | |
Equity Contracts | | | $192,930,715 | | | | 12.9 | % | | | N/A | | | | N/A | | | | N/A | | | | N/A | | | | 1 | |
Interest Rate Contracts | | | 103,148,751 | | | | 6.9 | | | | N/A | | | | N/A | | | | N/A | | | | N/A | | | | N/A | |
Foreign Exchange Contracts | | | N/A | | | | N/A | | | | $48,860 | | | | <0.1 | % | | | N/A | | | | N/A | | | | N/A | |
Credit Contracts | | | N/A | | | | N/A | | | | N/A | | | | N/A | | | | $9,223,561 | | | | 0.6 | % | | | N/A | |
* | Notional amount represents long or short, or both, derivative positions held by the Fund. |
The accompanying Notes to Financial Statements are an integral part of this schedule.
107
Moderate Allocation Fund
Schedule of Investments as of October 31, 2013
Investment in Affiliates
Affiliated issuers, as defined under the Investment Company Act of 1940, include those in which the Fund’s holdings of an issuer represent 5% or more of the outstanding voting securities of an issuer, or any affiliated mutual fund.
A summary of transactions for the fiscal year to date, in Moderate Allocation Fund, is as follows:
| | | | | | | | | | | | | | | | | | | | | | | | |
Fund | | Value October 31, 2012 | | | Gross
Purchases | | | Gross
Sales | | | Shares Held at
October 31, 2013 | | | Value
October 31, 2013 | | | Income Earned
November 1, 2012 -
October 31, 2013 | |
Growth and Income Plus^, ^^ | | | $11,094,557 | | | | $220,859 | | | | $12,917,331 | | | | – | | | | $– | | | | $220,859 | |
Natural Resources | | | 24,652,493 | | | | 226,310 | | | | – | | | | 2,764,537 | | | | 28,391,795 | | | | 226,310 | |
Partner Small Cap | | | | | | | | | | | | | | | | | | | | | | | | |
Growth | | | 28,058,568 | | | | 812,949 | | | | 4,000,000 | | | | 1,972,795 | | | | 34,662,005 | | | | – | |
Partner Small Cap Value | | | 26,582,148 | | | | 1,065,891 | | | | 3,000,000 | | | | 1,500,337 | | | | 32,557,322 | | | | 614,596 | |
Small Cap Stock | | | 14,200,780 | | | | – | | | | – | | | | 882,584 | | | | 18,516,616 | | | | – | |
Mid Cap Growth | | | 15,337,507 | | | | 1,010,555 | | | | 3,000,000 | | | | 661,623 | | | | 16,342,089 | | | | – | |
Partner Mid Cap Value | | | 28,335,335 | | | | 925,873 | | | | 3,000,000 | | | | 2,065,352 | | | | 33,727,203 | | | | 319,947 | |
Mid Cap Stock | | | 43,518,716 | | | | 193,283 | | | | – | | | | 2,628,283 | | | | 58,058,777 | | | | 193,283 | |
Partner Worldwide Allocation | | | 135,117,892 | | | | 3,264,811 | | | | 5,000,000 | | | | 15,196,494 | | | | 157,435,673 | | | | 3,264,811 | |
Large Cap Growth | | | 66,351,241 | | | | 436,953 | | | | – | | | | 11,301,004 | | | | 86,452,682 | | | | 436,953 | |
Large Cap Value | | | 99,845,770 | | | | 2,097,099 | | | | 7,000,000 | | | | 6,465,916 | | | | 121,106,616 | | | | 2,097,099 | |
Large Cap Stock | | | 34,198,749 | | | | 2,386,257 | | | | 8,000,000 | | | | 1,235,168 | | | | 34,275,906 | | | | 544,550 | |
High Yield | | | 46,137,766 | | | | 2,976,081 | | | | 1,709,108 | | | | 9,458,322 | | | | 48,237,443 | | | | 2,976,089 | |
Income | | | 191,596,078 | | | | 6,557,366 | | | | 24,385,501 | | | | 18,535,053 | | | | 168,298,285 | | | | 6,557,536 | |
Government Bond | | | 24,948,651 | | | | 1,196,153 | | | | 683,643 | | | | 2,367,882 | | | | 23,726,175 | | | | 265,318 | |
Limited Maturity Bond | | | 132,332,229 | | | | 1,713,554 | | | | 19,027,323 | | | | 9,111,526 | | | | 114,167,422 | | | | 1,714,232 | |
Cash Management Trust- Collateral Investment | | | 1,032,781 | | | | 9,648,123 | | | | 8,565,144 | | | | 2,115,760 | | | | 2,115,760 | | | | 4,950 | |
Cash Management Trust- Short Term Investment | | | 122,091,058 | | | | 166,221,954 | | | | 288,313,012 | | | | – | | | | – | | | | 79,970 | |
Total Value and Income Earned | | | 1,045,432,319 | | | | | | | | | | | | | | | | 978,071,769 | | | | 19,516,503 | |
^ | Prior to August 16, 2013, the Growth and Income Plus Fund was known as the Equity Income Plus Fund. |
^^ | On August 6, 2013, the Thrivent Asset Allocation Funds, as the shareholders of the Thrivent Growth and Income Plus Fund, redeemed their shares in-kind. The Growth and Income Plus Fund distributed fund securities rather than cash as payment for the redemption of these fund shares. These in-kind transactions were conducted at market value. |
The accompanying Notes to Financial Statements are an integral part of this schedule.
108
Moderately Conservative Allocation Fund
Schedule of Investments as of October 31, 2013
| | | | | | | | |
Principal Amount | | | Bank Loans (4.4%)a | | Value | |
| Basic Materials (0.4%) | | | | |
| | | | FMG Resources August 2006 Pty., Ltd., Term Loan | | | | |
| | $1,356,300 | | | 5.250%, 10/18/2017 | | | $1,358,253 | |
| | | | Ineos Group Holdings, Ltd., Term Loan | | | | |
| | 605,052 | | | 4.000%, 5/4/2018 | | | 606,795 | |
| | | | MRC Global, Inc., Term Loan | | | | |
| | 341,550 | | | 6.000%, 11/8/2019 | | | 343,340 | |
| | | | Tronox Pigments BV, Term Loan | | | | |
| | 154,613 | | | 4.500%, 3/19/2020 | | | 155,896 | |
| | | | US Coatings Acquisition, Inc., Term Loan | | | | |
| | 368,150 | | | 4.750%, 2/1/2020 | | | 371,794 | |
| | | | | |
| | | | Total | | | 2,836,078 | |
| | | | | |
| |
| Capital Goods (0.2%) | | | | |
| | | | ADS Waste Holdings, Term Loan | | | | |
| | 481,362 | | | 4.250%, 10/9/2019 | | | 483,856 | |
| | | | Berry Plastics Group, Inc., Term Loan | | | | |
| | 786,050 | | | 3.500%, 2/8/2020 | | | 782,858 | |
| | | | Silver II Borrower, Term Loan | | | | |
| | 208,425 | | | 4.000%, 12/13/2019 | | | 208,202 | |
| | | | | |
| | | | Total | | | 1,474,916 | |
| | | | | |
| |
| Communications Services (1.6%) | | | | |
| | | | Atlantic Broadband Penn, LLC, Term Loan | | | | |
| | 272,250 | | | 3.250%, 11/30/2019 | | | 271,313 | |
| | | | Cequel Communications, LLC, Term Loan | | | | |
| | 258,687 | | | 3.500%, 2/14/2019 | | | 258,736 | |
| | | | Charter Communications Operating, LLC, Term Loan | | | | |
| | 104,738 | | | 3.000%, 7/1/2020 | | | 103,609 | |
| | | | Clear Channel Communications, Inc., Term Loan | | | | |
| | 167,107 | | | 3.818%, 1/29/2016 | | | 161,975 | |
| | 492,893 | | | 6.918%, 1/30/2019 | | | 468,313 | |
| | | | Cricket Communications, Inc., Term Loan | | | | |
| | 69,475 | | | 4.750%, 10/10/2019 | | | 69,736 | |
| | 443,887 | | | 4.750%, 3/8/2020 | | | 445,792 | |
| | | | Cumulus Media Holdings, Inc., Term Loan | | | | |
| | 398,324 | | | 4.500%, 9/17/2018 | | | 400,614 | |
| | | | Fairpoint Communications, Term Loan | | | | |
| | 522,375 | | | 7.500%, 2/14/2019 | | | 532,023 | |
| | | | Grande Communications Networks, LLC, Term Loan | | | | |
| | 304,238 | | | 4.500%, 5/29/2020 | | | 303,097 | |
| | | | Hargray Communications Group, Inc., Term Loan | | | | |
| | 428,925 | | | 4.750%, 6/26/2019 | | | 431,426 | |
| | | | Integra Telecom Holdings, Inc., Term Loan | | | | |
| | 303,475 | | | 5.250%, 2/22/2019 | | | 306,762 | |
| | 105,000 | | | 9.750%, 2/21/2020 | | | 107,865 | |
| | | | Intelsat Jackson Holdings SA, Term Loan | | | | |
| | 336,057 | | | 4.250%, 4/2/2018 | | | 337,667 | |
| | | | Level 3 Communications, Inc., Term Loan | | | | |
| | 675,000 | | | 4.000%, 1/15/2020 | | | 677,815 | |
| | | | Liberty Cablevision of Puerto Rico, Ltd., Term Loan | | | | |
| | 340,687 | | | 6.000%, 6/9/2017 | | | 341,539 | |
| | | | LTS Buyer, LLC, Term Loan | | | | |
| | 229,425 | | | 4.500%, 4/13/2020 | | | 230,095 | |
| | 26,000 | | | 8.000%, 4/12/2021 | | | 26,325 | |
| | | | McGraw-Hill Global Education Holdings, LLC, Term Loan | | | | |
| | 412,925 | | | 9.000%, 3/22/2019 | | | 419,895 | |
| | | | Mediacom Broadband, LLC, Term Loan | | | | |
| | 272,250 | | | 4.000%, 1/20/2020 | | | 272,422 | |
| | | | NEP Broadcasting, LLC, Term Loan | | | | |
| | 779,112 | | | 4.750%, 1/22/2020 | | | 781,060 | |
| | 31,429 | | | 9.500%, 7/22/2020 | | | 32,234 | |
| | | | NTelos, Inc., Term Loan | | | | |
| | 163,350 | | | 5.750%, 11/9/2019 | | | 163,963 | |
| | | | SBA Senior Finance II, LLC, Term Loan | | | | |
| | 76,980 | | | 3.750%, 9/28/2019 | | | 77,076 | |
| | | | Syniverse Holdings, Inc., Term Loan | | | | |
| | 407,199 | | | 4.000%, 4/23/2019 | | | 408,046 | |
| | | | TNS, Inc., Term Loan | | | | |
| | 312,963 | | | 5.000%, 2/14/2020 | | | 314,788 | |
| | | | Univision Communications, Inc., Term Loan | | | | |
| | 442,775 | | | 4.500%, 2/28/2020 | | | 444,896 | |
| | 222,728 | | | 4.500%, 3/1/2020 | | | 223,795 | |
| | 104,475 | | | 4.500%, 3/1/2020 | | | 104,997 | |
| | | | Virgin Media Investment Holdings, Ltd., Term Loan | | | | |
| | 640,000 | | | 3.500%, 6/8/2020 | | | 639,712 | |
| | | | Visant Corporation, Term Loan | | | | |
| | 586,972 | | | 5.250%, 12/22/2016 | | | 575,649 | |
| | | | WideOpenWest Finance, LLC, Term Loan | | | | |
| | 686,550 | | | 4.750%, 4/1/2019 | | | 691,987 | |
| | | | Yankee Cable Acquisition, LLC, Term Loan | | | | |
| | 406,265 | | | 5.250%, 3/1/2020 | | | 407,979 | |
| | | | Zayo Group, LLC, Term Loan | | | | |
| | 516,080 | | | 4.500%, 7/2/2019 | | | 518,341 | |
| | | | | |
| | | | Total | | | 11,551,542 | |
| | | | | |
| |
| Consumer Cyclical (0.5%) | | | | |
| | | | Bally Technologies, Inc., Term Loan | | | | |
| | 310,000 | | | 0.000%, 7/16/2021b,c | | | 310,775 | |
| | | | Burlington Coat Factory Warehouse Corporation, Term Loan | | | | |
| | 328,035 | | | 4.250%, 2/23/2017 | | | 330,187 | |
| | | | Cenveo Corporation, Term Loan | | | | |
| | 228,850 | | | 6.250%, 2/13/2017 | | | 230,852 | |
| | | | Ceridian Corporation, Term Loan | | | | |
| | 550,000 | | | 4.420%, 5/9/2017 | | | 552,613 | |
| | | | Chrysler Group, LLC, Term Loan | | | | |
| | 338,270 | | | 4.250%, 5/24/2017 | | | 341,145 | |
The accompanying Notes to Financial Statements are an integral part of this schedule.
109
Moderately Conservative Allocation Fund
Schedule of Investments as of October 31, 2013
| | | | | | | | |
Principal
Amount | | | Bank Loans (4.4%)a | | Value | |
| Consumer Cyclical (0.5%) - continued | | | | |
| | | | J.C. Penney Corporation, Inc., Term Loan | | | | |
| | $149,625 | | | 6.000%, 5/22/2018 | | | $144,596 | |
| | | | MGM Resorts International, Term Loan | | | | |
| | 332,488 | | | 3.500%, 12/20/2019 | | | 331,952 | |
| | | | ROC Finance, LLC, Term Loan | | | | |
| | 570,000 | | | 3.640%, 6/20/2019 | | | 557,175 | |
| | | | Seminole Indian Tribe of Florida, Term Loan | | | | |
| | 188,175 | | | 3.000%, 4/29/2020 | | | 187,665 | |
| | | | Seven Seas Cruises S de RL, LLC, Term Loan | | | | |
| | 613,000 | | | 4.750%, 12/21/2018 | | | 618,364 | |
| | | | Toys R Us, Inc., Term Loan | | | | |
| | 428,317 | | | 5.250%, 5/25/2018 | | | 386,154 | |
| | | | | |
| | | | Total | | | 3,991,478 | |
| | | | | |
| |
| Consumer Non-Cyclical (0.6%) | | | | |
| | | | Albertsons, LLC, Term Loan | | | | |
| | 467,650 | | | 4.750%, 3/21/2019 | | | 468,810 | |
| | | | Biomet, Inc., Term Loan | | | | |
| | 399,000 | | | 3.690%, 7/25/2017 | | | 401,578 | |
| | | | CHS/Community Health Systems, Inc., Term Loan | | | | |
| | 345,000 | | | 3.760%, 1/25/2017 | | | 345,863 | |
| | | | Del Monte Corporation, Term Loan | | | | |
| | 63,036 | | | 4.000%, 3/8/2018 | | | 63,036 | |
| | | | DJO Finance, LLC, Term Loan | | | | |
| | 494,658 | | | 4.750%, 9/15/2017 | | | 499,397 | |
| | | | Grifols, Inc., Term Loan | | | | |
| | 339,383 | | | 4.250%, 6/1/2017 | | | 341,470 | |
| | | | Hologic, Inc., Term Loan | | | | |
| | 328,984 | | | 3.750%, 8/1/2019 | | | 330,464 | |
| | | | JBS USA, LLC, Term Loan | | | | |
| | 387,075 | | | 3.750%, 5/25/2018 | | | 386,107 | |
| | | | Reynolds Group Holdings, Inc., Term Loan | | | | |
| | 69,300 | | | 4.750%, 9/28/2018 | | | 69,841 | |
| | | | Rite Aid Corporation, Term Loan | | | | |
| | 79,600 | | | 4.000%, 2/21/2020 | | | 79,973 | |
| | 160,000 | | | 5.750%, 8/21/2020 | | | 163,658 | |
| | | | Roundy’s Supermarkets, Inc., Term Loan | | | | |
| | 458,757 | | | 5.750%, 2/13/2019 | | | 453,022 | |
| | | | Supervalu, Inc., Term Loan | | | | |
| | 476,736 | | | 5.000%, 3/21/2019 | | | 479,449 | |
| | | | Van Wagner Communications, LLC, Term Loan | | | | |
| | 268,650 | | | 6.250%, 8/3/2018 | | | 272,567 | |
| | | | | |
| | | | Total | | | 4,355,235 | |
| | | | | |
| |
| Energy (0.3%) | | | | |
| | | | Arch Coal, Inc., Term Loan | | | | |
| | 454,524 | | | 5.750%, 5/16/2018 | | | 440,415 | |
| | | | Chesapeake Energy Corporation, Term Loan | | | | |
| | 1,015,000 | | | 5.750%, 12/2/2017 | | | 1,036,569 | |
| | | | Offshore Group Investment, Ltd., Term Loan | | | | |
| | 427,850 | | | 5.750%, 3/28/2019 | | | 430,392 | |
| | | | Pacific Drilling SA, Term Loan | | | | |
| | 204,487 | | | 4.500%, 6/3/2018 | | | 205,168 | |
| | | | | |
| | | | Total | | | 2,112,544 | |
| | | | | |
| |
| Financials (0.1%) | | | | |
| | | | GEO Group, Inc., Term Loan | | | | |
| | 103,480 | | | 3.250%, 4/3/2020 | | | 103,868 | |
| | | | MoneyGram International, Inc., Term Loan | | | | |
| | 412,925 | | | 4.250%, 3/27/2020 | | | 414,060 | |
| | | | WaveDivision Holdings, LLC, Term Loan | | | | |
| | 635,200 | | | 4.000%, 10/12/2019 | | | 636,788 | |
| | | | | |
| | | | Total | | | 1,154,716 | |
| | | | | |
| |
| Technology (0.3%) | | | | |
| | | | First Data Corporation Extended, Term Loan | | | | |
| | 530,000 | | | 4.170%, 3/23/2018 | | | 530,191 | |
| | | | First Data Corporation, Term Loan | | | | |
| | 275,000 | | | 4.170%, 9/24/2018 | | | 275,258 | |
| | | | Freescale Semiconductor, Inc., Term Loan | | | | |
| | 378,100 | | | 5.000%, 3/1/2020 | | | 381,337 | |
| | 233,000 | | | 5.000%, 1/15/2021 | | | 235,039 | |
| | | | Infor US, Inc., Term Loan | | | | |
| | 244,381 | | | 5.250%, 4/5/2018 | | | 246,167 | |
| | | | SunGard Data Systems, Inc., Term Loan | | | | |
| | 540,912 | | | 4.500%, 1/31/2020 | | | 543,612 | |
| | | | | |
| | | | Total | | | 2,211,604 | |
| | | | | |
| |
| Transportation (0.2%) | | | | |
| | | | American Airlines, Inc., Term Loan | | | | |
| | 428,925 | | | 4.750%, 6/27/2019 | | | 431,160 | |
| | | | American Petroleum Tankers Parent, LLC, Term Loan | | | | |
| | 118,445 | | | 4.750%, 10/2/2019 | | | 118,444 | |
| | | | Delta Air Lines, Inc., Term Loan | | | | |
| | 414,475 | | | 4.250%, 4/20/2017 | | | 416,324 | |
| | | | United Air Lines, Inc., Term Loan | | | | |
| | 258,700 | | | 4.000%, 4/1/2019 | | | 259,929 | |
| | | | | |
| | | | Total | | | 1,225,857 | |
| | | | | |
| |
| Utilities (0.2%) | | | | |
| | | | Calpine Corporation, Term Loan | | | | |
| | 79,389 | | | 4.000%, 4/1/2018 | | | 79,707 | |
| | 549,450 | | | 4.000%, 10/9/2019 | | | 552,071 | |
| | | | Intergen NV, Term Loan | | | | |
| | 199,500 | | | 5.500%, 6/15/2020 | | | 199,002 | |
| | | | NGPL PipeCo, LLC, Term Loan | | | | |
| | 487,775 | | | 6.750%, 9/15/2017 | | | 455,864 | |
| | | | | |
| | | | Total | | | 1,286,644 | |
| | | | | |
| | | | | | | | |
| | | | | |
| | | | Total Bank Loans (cost $32,046,466) | | | 32,200,614 | |
| | | | | |
The accompanying Notes to Financial Statements are an integral part of this schedule.
110
Moderately Conservative Allocation Fund
Schedule of Investments as of October 31, 2013
| | | | | | | | |
| Shares | | | Mutual Funds (47.8%) | | Value | |
| Equity Mutual Funds (21.5%) | | | | |
| | 1,208,229 | | | Thrivent Natural Resources Fund | | | $12,408,513 | |
| | 359,189 | | | Thrivent Partner Small Cap Value Fund | | | 7,794,407 | |
| | 167,827 | | | Thrivent Small Cap Stock Fundd | | | 3,521,013 | |
| | 1,127,070 | | | Thrivent Partner Mid Cap Value Fund | | | 18,405,047 | |
| | 428,044 | | | Thrivent Mid Cap Stock Fund | | | 9,455,498 | |
| | 4,497,042 | | | Thrivent Partner Worldwide Allocation Fund | | | 46,589,353 | |
| | 2,262,092 | | | Thrivent Large Cap Growth Fund | | | 17,305,001 | |
| | 2,184,223 | | | Thrivent Large Cap Value Fund | | | 40,910,501 | |
| | 32,064 | | | Thrivent Large Cap Stock Fund | | | 889,787 | |
| | | | | |
| | | | Total | | | 157,279,120 | |
| | | | | |
| |
| Fixed Income Mutual Funds (26.3%) | | | | |
| | 4,959,061 | | | Thrivent High Yield Fund | | | 25,291,209 | |
| | 7,247,218 | | | Thrivent Income Fund | | | 65,804,736 | |
| | 1,135,354 | | | Thrivent Government Bond Fund | | | 11,376,247 | |
| | 7,212,770 | | | Thrivent Limited Maturity Bond Fund | | | 90,376,014 | |
| | | | Total | | | 192,848,206 | |
| | | | | |
| | | | | | | | |
| | | | | |
| | | | Total Mutual Funds (cost $299,918,216) | | | 350,127,326 | |
| | | | | |
| | |
Principal
Amount | | | Long-Term Fixed Income (28.5%) | | Value | |
| Asset-Backed Securities (1.9%) | | | | |
| | | | Access Group, Inc. | | | | |
| | 414,462 | | | 0.670%, 2/25/2036e,f | | | 412,385 | |
| | | | Ally Auto Receivables Trust 2013- SN1 | | | | |
| | 540,000 | | | 0.720%, 5/20/2016 | | | 539,041 | |
| | | | Avis Budget Rental Car Funding AESOP, LLC | | | | |
| | 266,310 | | | 2.370%, 11/20/2014e | | | 269,908 | |
| | | | Countrywide Asset-Backed Certificates | | | | |
| | 660,672 | | | 5.530%, 4/25/2047 | | | 609,098 | |
| | | | DT Auto Owner Trust | | | | |
| | 163,884 | | | 0.750%, 5/16/2016e | | | 163,925 | |
| | | | Edlinc Student Loan Funding Trust | | | | |
| | 313,425 | | | 3.170%, 10/1/2025f,g | | | 310,291 | |
| | | | Federal National Mortgage Association | | | | |
| | 430,050 | | | 0.595%, 8/25/2015 | | | 429,058 | |
| | | | FirstEnergy Ohio PIRB Special Purpose Trust 2013 | | | | |
| | 540,000 | | | 0.679%, 1/15/2019 | | | 539,773 | |
| | | | FNA Trust | | | | |
| | 346,701 | | | 1.980%, 1/10/2018g | | | 343,884 | |
| | | | GE Dealer Floorplan Master Note Trust | | | | |
| | 540,000 | | | 0.573%, 4/20/2018f | | | 538,854 | |
| | | | GE Equipment Transportation, LLC | | | | |
| | 450,000 | | | 0.690%, 11/25/2016 | | | 449,613 | |
| | | | Golden Credit Card Trust | | | | |
| | 360,000 | | | 0.424%, 2/15/2018e,f | | | 359,084 | |
| | 400,000 | | | 0.636%, 9/15/2018e,f | | | 400,000 | |
| | | | HLSS Servicer Advance Receivables Backed Notes | | | | |
| | 450,000 | | | 1.287%, 9/15/2044e | | | 450,225 | |
| | | | Hyundai Auto Receivables Trust | | | | |
| | 540,000 | | | 0.710%, 9/15/2017 | | | 540,827 | |
| | | | Hyundai Floorplan Master Owner Trust | | | | |
| | 607,500 | | | 0.524%, 5/15/2018e,f | | | 608,288 | |
| | | | Master Credit Card Trust | | | | |
| | 366,300 | | | 0.780%, 4/21/2017e | | | 365,965 | |
| | | | Morgan Stanley Capital, Inc. | | | | |
| | 754,557 | | | 0.320%, 2/25/2037f | | | 405,801 | |
| | | | Motor plc | | | | |
| | 672,000 | | | 0.670%, 2/15/2021e | | | 671,968 | |
| | | | Nationstar Mortgage Advance Receivable Trust | | | | |
| | 540,000 | | | 1.080%, 6/20/2044e | | | 539,638 | |
| | | | Nissan Master Owner Trust Receivables | | | | |
| | 600,000 | | | 0.474%, 2/15/2018f | | | 599,306 | |
| | | | Renaissance Home Equity Loan Trust | | | | |
| | 2,300,000 | | | 6.011%, 5/25/2036 | | | 1,676,049 | |
| | | | Santander Drive Auto Receivables Trust | | | | |
| | 450,000 | | | 0.700%, 9/15/2017 | | | 449,680 | |
| | | | SLM Student Loan Trust | | | | |
| | 258,395 | | | 0.774%, 8/15/2022e,f | | | 257,600 | |
| | 300,000 | | | 1.224%, 5/17/2027e,f | | | 296,656 | |
| | | | Volvo Financial Equipment, LLC | | | | |
| | 450,000 | | | 0.740%, 3/15/2017e | | | 449,698 | |
| | | | World Financial Network Credit Card Master Trust | | | | |
| | 450,000 | | | 0.910%, 3/16/2020 | | | 447,653 | |
| | | | World Omni Automobile Lease Securitization Trust | | | | |
| | 425,000 | | | 1.400%, 2/15/2019 | | | 428,301 | |
| | | | World Omni Master Owner Trust | | | | |
| | 360,000 | | | 0.524%, 2/15/2018e,f | | | 359,584 | |
| | | | | |
| | | | Total | | | 13,912,153 | |
| | | | | |
| |
| Basic Materials (0.4%) | | | | |
| | | | Barrick Gold Corporation | | | | |
| | 66,000 | | | 2.900%, 5/30/2016 | | | 67,653 | |
| | | | FMG Resources Pty. Ltd. | | | | |
| | 629,086 | | | 6.875%, 2/1/2018e,h | | | 666,831 | |
| | | | Freeport-McMoRan Copper & Gold, Inc. | | | | |
| | 284,000 | | | 2.375%, 3/15/2018 | | | 283,225 | |
| | | | Glencore Funding, LLC | | | | |
| | 109,000 | | | 1.700%, 5/27/2016e | | | 108,549 | |
| | 270,000 | | | 1.604%, 1/15/2019e,f | | | 261,812 | |
| | | | Hexion US Finance Corporation/Hexion Nova Scotia Finance ULC | | | | |
| | 315,000 | | | 8.875%, 2/1/2018 | | | 324,450 | |
| | | | Ineos Finance plc | | | | |
| | 315,000 | | | 7.500%, 5/1/2020e | | | 344,138 | |
| | | | Inmet Mining Corporation | | | | |
| | 315,000 | | | 7.500%, 6/1/2021e | | | 333,900 | |
| | | | International Paper Company | | | | |
| | 127,000 | | | 5.300%, 4/1/2015 | | | 134,607 | |
| | | | LyondellBasell Industries NV | | | | |
| | 190,000 | | | 6.000%, 11/15/2021 | | | 221,066 | |
The accompanying Notes to Financial Statements are an integral part of this schedule.
111
Moderately Conservative Allocation Fund
Schedule of Investments as of October 31, 2013
| | | | | | | | |
Principal
Amount | | | Long-Term Fixed Income (28.5%) | | Value | |
| Basic Materials (0.4%) - continued | | | | |
| | | | Rio Tinto Finance USA plc | | | | |
| | $132,000 | | | 1.375%, 6/17/2016 | | | $132,810 | |
| | | | Xstrata Finance Canada, Ltd. | | | | |
| | 394,000 | | | 2.050%, 10/23/2015e | | | 397,120 | |
| | | | | |
| | | | Total | | | 3,276,161 | |
| | | | | |
| |
| Capital Goods (0.3%) | | | | |
| | | | BAE Systems plc | | | | |
| | 100,000 | | | 3.500%, 10/11/2016e | | | 104,642 | |
| | | | CNH Capital, LLC | | | | |
| | 315,000 | | | 3.625%, 4/15/2018 | | | 319,331 | |
| | | | Eaton Corporation | | | | |
| | 61,000 | | | 1.500%, 11/2/2017e | | | 60,389 | |
| | 92,000 | | | 4.000%, 11/2/2032e | | | 85,210 | |
| | | | John Deere Capital Corporation | | | | |
| | 270,000 | | | 0.314%, 1/12/2015f | | | 270,010 | |
| | | | Northrop Grumman Corporation | | | | |
| | 168,000 | | | 1.750%, 6/1/2018 | | | 165,514 | |
| | | | Reynolds Group Issuer, Inc. | | | | |
| | 314,086 | | | 5.750%, 10/15/2020 | | | 324,294 | |
| | | | Roper Industries, Inc. | | | | |
| | 155,000 | | | 2.050%, 10/1/2018 | | | 153,062 | |
| | | | RSC Equipment Rental, Inc. | | | | |
| | 315,000 | | | 8.250%, 2/1/2021 | | | 356,737 | |
| | | | Textron, Inc. | | | | |
| | 135,000 | | | 5.600%, 12/1/2017 | | | 150,049 | |
| | | | | |
| | | | Total | | | 1,989,238 | |
| | | | | |
| |
| Collateralized Mortgage Obligations (1.4%) | | | | |
| | | | Alternative Loan Trust | | | | |
| | 439,314 | | | 6.000%, 6/25/2036 | | | 375,404 | |
| | | | Citigroup Mortgage Loan Trust, Inc. | | | | |
| | 313,430 | | | 5.500%, 11/25/2035 | | | 283,269 | |
| | | | CitiMortgage Alternative Loan Trust | | | | |
| | 1,020,377 | | | 5.750%, 4/25/2037 | | | 869,317 | |
| | | | Countrywide Alternative Loan Trust | | | | |
| | 744,262 | | | 5.064%, 10/25/2035 | | | 600,243 | |
| | 346,681 | | | 6.500%, 8/25/2036 | | | 237,627 | |
| | 197,768 | | | 6.000%, 1/25/2037 | | | 157,847 | |
| | 1,205,068 | | | 5.500%, 5/25/2037 | | | 1,002,715 | |
| | 940,849 | | | 7.000%, 10/25/2037 | | | 629,049 | |
| | | | Countrywide Home Loans, Inc. | | | | |
| | 391,572 | | | 5.750%, 4/25/2037 | | | 347,378 | |
| | | | Deutsche Alt-A Securities Mortgage Loan Trust | | | | |
| | 145,711 | | | 5.500%, 10/25/2021 | | | 139,581 | |
| | | | Deutsche Alt-A Securities, Inc. | | | | |
| | 344,261 | | | 6.000%, 10/25/2021 | | | 322,234 | |
| | | | Federal Home Loan Mortgage Corporation | | | | |
| | 1,886,735 | | | 3.000%, 4/15/2028i | | | 241,922 | |
| | 1,337,281 | | | 3.000%, 2/15/2033i | | | 210,696 | |
| | | | Federal National Mortgage Association | | | | |
| | 2,932,445 | | | 3.500%, 1/25/2033i | | | 499,448 | |
| | | | Greenpoint Mortgage Funding Trust | | | | |
| | 974,763 | | | 0.370%, 10/25/2045f | | | 705,449 | |
| | | | J.P. Morgan Mortgage Trust | | | | |
| | 91,417 | | | 2.679%, 10/25/2036 | | | 73,647 | |
| | 941,819 | | | 0.550%, 1/25/2037f | | | 616,892 | |
| | 1,062,252 | | | 6.250%, 8/25/2037 | | | 744,997 | |
| | | | MASTR Alternative Loans Trust | | | | |
| | 228,685 | | | 6.500%, 7/25/2034 | | | 228,852 | |
| | 631,266 | | | 0.620%, 12/25/2035f | | | 345,171 | |
| | | | Merrill Lynch Alternative Note Asset Trust | | | | |
| | 228,030 | | | 6.000%, 3/25/2037 | | | 192,820 | |
| | | | Residential Accredit Loans, Inc. | | | | |
| | 209,733 | | | 5.750%, 9/25/2035 | | | 184,794 | |
| | | | Residential Asset Securitization Trust | | | | |
| | 829,915 | | | 0.550%, 8/25/2037f | | | 258,534 | |
| | | | Sequoia Mortgage Trust | | | | |
| | 1,610,494 | | | 2.631%, 9/20/2046 | | | 1,294,592 | |
| | | | WaMu Mortgage Pass Through Certificates | | | | |
| | 224,822 | | | 2.375%, 9/25/2036 | | | 196,440 | |
| | 202,419 | | | 2.425%, 10/25/2036 | | | 173,753 | |
| | | | | |
| | | | Total | | | 10,932,671 | |
| | | | | |
| |
| Commercial Mortgage-Backed Securities (2.0%) | | | | |
| | | | Banc of America Commercial Mortgage, Inc. | | | | |
| | 1,600,000 | | | 5.623%, 4/10/2049 | | | 1,792,418 | |
| | 2,450,000 | | | 5.559%, 6/10/2049 | | | 2,729,988 | |
| | | | Bear Stearns Commercial Mortgage Securities, Inc. | | | | |
| | 1,000,000 | | | 5.331%, 2/11/2044 | | | 1,098,260 | |
| | | | Commercial Mortgage Pass- Through Certificates | | | | |
| | 540,000 | | | 1.224%, 6/8/2030e,f | | | 537,289 | |
| | | | Credit Suisse First Boston Mortgage Securities | | | | |
| | 1,700,000 | | | 5.542%, 1/15/2049 | | | 1,888,671 | |
| | | | Credit Suisse Mortgage Capital Certificates | | | | |
| | 1,850,000 | | | 5.509%, 9/15/2039 | | | 2,000,283 | |
| | | | Federal Home Loan Mortgage Corporation Multi Family Structured Pass Thru Certificates | | | | |
| | 583,449 | | | 0.727%, 12/25/2016 | | | 580,387 | |
| | | | Greenwich Capital Commercial Funding Corporation | | | | |
| | 1,000,000 | | | 5.867%, 12/10/2049 | | | 1,103,897 | |
| | | | J.P. Morgan Chase Commercial Mortgage Securities Corporation | | | | |
| | 360,000 | | | 0.874%, 4/15/2028e,f | | | 358,803 | |
| | 800,000 | | | 5.706%, 2/12/2049 | | | 861,570 | |
| | | | Morgan Stanley Capital, Inc. | | | | |
| | 500,000 | | | 5.406%, 3/15/2044 | | | 540,523 | |
| | | | Wachovia Bank Commercial Mortgage Trust | | | | |
| | 1,200,000 | | | 5.603%, 10/15/2048 | | | 1,305,500 | |
| | | | | |
| | | | Total | | | 14,797,589 | |
| | | | | |
The accompanying Notes to Financial Statements are an integral part of this schedule.
112
Moderately Conservative Allocation Fund
Schedule of Investments as of October 31, 2013
| | | | | | | | |
Principal
Amount | | | Long-Term Fixed Income (28.5%) | | Value | |
| Communications Services (1.0%) | | | | |
| | | | AMC Networks, Inc. | | | | |
| | $315,000 | | | 4.750%, 12/15/2022 | | | $304,763 | |
| | | | America Movil SAB de CV | | | | |
| | 168,000 | | | 1.256%, 9/12/2016f | | | 169,466 | |
| | 168,000 | | | 5.000%, 10/16/2019 | | | 185,299 | |
| | | | American Tower Corporation | | | | |
| | 112,000 | | | 5.050%, 9/1/2020 | | | 118,316 | |
| | | | AT&T, Inc. | | | | |
| | 112,000 | | | 2.400%, 8/15/2016 | | | 115,859 | |
| | 185,000 | | | 5.800%, 2/15/2019 | | | 214,794 | |
| | | | British Telecommunications plc | | | | |
| | 132,000 | | | 1.625%, 6/28/2016 | | | 133,746 | |
| | | | CBS Corporation | | | | |
| | 122,000 | | | 8.875%, 5/15/2019 | | | 156,672 | |
| | | | CC Holdings GS V, LLC | | | | |
| | 116,000 | | | 2.381%, 12/15/2017 | | | 114,831 | |
| | | | CCO Holdings, LLC | | | | |
| | 315,000 | | | 7.375%, 6/1/2020 | | | 344,138 | |
| | | | CenturyLink, Inc. | | | | |
| | 315,000 | | | 5.625%, 4/1/2020 | | | 320,119 | |
| | | | Comcast Corporation | | | | |
| | 85,000 | | | 4.650%, 7/15/2042 | | | 82,809 | |
| | | | Cox Communications, Inc. | | | | |
| | 160,000 | | | 9.375%, 1/15/2019e | | | 204,796 | |
| | | | Crown Castle Towers, LLC | | | | |
| | 100,000 | | | 4.174%, 8/15/2017e | | | 107,183 | |
| | | | DIRECTV Holdings, LLC | | | | |
| | 110,000 | | | 2.400%, 3/15/2017 | | | 111,886 | |
| | 122,000 | | | 1.750%, 1/15/2018 | | | 119,230 | |
| | 112,000 | | | 5.875%, 10/1/2019 | | | 126,772 | |
| | | | Hughes Satellite Systems Corporation | | | | |
| | 315,000 | | | 6.500%, 6/15/2019 | | | 337,837 | |
| | | | Intelsat Jackson Holdings SA | | | | |
| | 315,000 | | | 7.250%, 4/1/2019 | | | 339,413 | |
| | | | Level 3 Financing, Inc. | | | | |
| | 315,000 | | | 8.625%, 7/15/2020 | | | 356,738 | |
| | | | NBC Universal Enterprise, Inc. | | | | |
| | 270,000 | | | 0.929%, 4/15/2018e,f | | | 271,607 | |
| | | | NBC Universal Media, LLC | | | | |
| | 196,000 | | | 2.875%, 4/1/2016 | | | 205,592 | |
| | | | Nippon Telegraph & Telephone Corporation | | | | |
| | 120,000 | | | 1.400%, 7/18/2017 | | | 119,736 | |
| | | | SBA Tower Trust | | | | |
| | 110,000 | | | 5.101%, 4/17/2017e | | | 118,962 | |
| | | | Sprint Nextel Corporation | | | | |
| | 314,086 | | | 9.000%, 11/15/2018e | | | 380,829 | |
| | | | Telefonica Emisiones SAU | | | | |
| | 130,000 | | | 3.729%, 4/27/2015 | | | 134,418 | |
| | | | Univision Communications, Inc. | | | | |
| | 315,000 | | | 6.875%, 5/15/2019e | | | 339,412 | |
| | | | UPCB Finance V, Ltd. | | | | |
| | 315,000 | | | 7.250%, 11/15/2021e | | | 345,713 | |
| | | | Verizon Communications, Inc. | | | | |
| | 224,000 | | | 2.500%, 9/15/2016 | | | 232,446 | |
| | 93,000 | | | 1.100%, 11/1/2017 | | | 90,467 | |
| | 100,000 | | | 5.500%, 2/15/2018 | | | 113,877 | |
| | 112,000 | | | 2.002%, 9/14/2018f | | | 118,248 | |
| | 56,000 | | | 3.650%, 9/14/2018 | | | 59,559 | |
| | 168,000 | | | 6.400%, 9/15/2033 | | | 190,156 | |
| | 56,000 | | | 6.550%, 9/15/2043 | | | 64,972 | |
| | | | Vodafone Group plc | | | | |
| | 70,000 | | | 0.648%, 2/19/2016f | | | 69,993 | |
| | | | Wind Acquisition Finance SA | | | | |
| | 315,000 | | | 11.750%, 7/15/2017e | | | 334,687 | |
| | | | | |
| | | | Total | | | 7,155,341 | |
| | | | | |
| |
| Consumer Cyclical (0.8%) | | | | |
| | | | Amazon.com, Inc. | | | | |
| | 61,000 | | | 1.200%, 11/29/2017 | | | 59,851 | |
| | | | American Honda Finance Corporation | | | | |
| | 360,000 | | | 0.637%, 5/26/2016e,f | | | 360,418 | |
| | | | Chrysler Group, LLC | | | | |
| | 320,000 | | | 8.000%, 6/15/2019 | | | 354,400 | |
| | | | Cinemark USA, Inc. | | | | |
| | 315,000 | | | 4.875%, 6/1/2023 | | | 300,037 | |
| | | | Daimler Finance North America, LLC | | | | |
| | 270,000 | | | 1.125%, 8/1/2018e,f | | | 271,498 | |
| | | | Federated Retail Holdings, Inc. | | | | |
| | 81,000 | | | 5.900%, 12/1/2016 | | | 91,358 | |
| | | | Ford Motor Company | | | | |
| | 75,000 | | | 7.450%, 7/16/2031 | | | 93,597 | |
| | | | Ford Motor Credit Company, LLC | | | | |
| | 182,000 | | | 12.000%, 5/15/2015 | | | 211,767 | |
| | 270,000 | | | 1.516%, 5/9/2016f | | | 273,682 | |
| | 125,000 | | | 1.700%, 5/9/2016 | | | 126,119 | |
| | 135,000 | | | 2.375%, 1/16/2018 | | | 135,773 | |
| | 115,000 | | | 5.000%, 5/15/2018 | | | 127,438 | |
| | | | Gap, Inc. | | | | |
| | 125,000 | | | 5.950%, 4/12/2021 | | | 138,732 | |
| | | | General Motors Company | | | | |
| | 168,000 | | | 3.500%, 10/2/2018e | | | 171,360 | |
| | 112,000 | | | 4.875%, 10/2/2023e | | | 113,400 | |
| | | | General Motors Financial Company, Inc. | | | | |
| | 100,000 | | | 2.750%, 5/15/2016e | | | 100,750 | |
| | 315,000 | | | 3.250%, 5/15/2018e | | | 313,819 | |
| | | | Home Depot, Inc. | | | | |
| | 112,000 | | | 4.875%, 2/15/2044 | | | 115,739 | |
| | | | Hyundai Capital America | | | | |
| | 124,000 | | | 1.625%, 10/2/2015e | | | 124,810 | |
| | | | Jaguar Land Rover Automotive plc | | | | |
| | 315,000 | | | 5.625%, 2/1/2023e | | | 312,637 | |
| | | | L Brands, Inc. | | | | |
| | 315,000 | | | 5.625%, 2/15/2022 | | | 324,450 | |
| | | | Lennar Corporation | | | | |
| | 315,000 | | | 4.125%, 12/1/2018 | | | 315,788 | |
| | | | Macy’s Retail Holdings, Inc. | | | | |
| | 60,000 | | | 3.875%, 1/15/2022 | | | 59,921 | |
| | 45,000 | | | 4.375%, 9/1/2023 | | | 45,746 | |
| | | | Toll Brothers Finance Corporation | | | | |
| | 100,000 | | | 8.910%, 10/15/2017 | | | 121,000 | |
| | 50,000 | | | 4.375%, 4/15/2023 | | | 47,125 | |
| | | | Toyota Motor Credit Corporation | | | | |
| | 360,000 | | | 0.553%, 5/17/2016f | | | 360,818 | |
| | 80,000 | | | 1.750%, 5/22/2017 | | | 81,241 | |
| | | | TRW Automotive, Inc. | | | | |
| | 70,000 | | | 7.250%, 3/15/2017e | | | 80,325 | |
| | | | Viacom, Inc. | | | | |
| | 84,000 | | | 2.500%, 9/1/2018 | | | 84,872 | |
| | | | Walgreen Company | | | | |
| | 183,000 | | | 5.250%, 1/15/2019 | | | 207,356 | |
The accompanying Notes to Financial Statements are an integral part of this schedule.
113
Moderately Conservative Allocation Fund
Schedule of Investments as of October 31, 2013
| | | | | | | | |
Principal
Amount | | | Long-Term Fixed Income (28.5%) | | Value | |
| Consumer Cyclical (0.8%) - continued | | | | |
| | | | Western Union Company | | | | |
| | $122,000 | | | 2.375%, 12/10/2015 | | | $124,839 | |
| | | | Wynn Las Vegas, LLC | | | | |
| | 315,000 | | | 5.375%, 3/15/2022h | | | 324,075 | |
| | | | | |
| | | | Total | | | 5,974,741 | |
| | | | | |
| |
| Consumer Non-Cyclical (1.1%) | | | | |
| | | | AbbVie, Inc. | | | | |
| | 61,000 | | | 1.750%, 11/6/2017 | | | 61,186 | |
| | | | Altria Group, Inc. | | | | |
| | 121,000 | | | 9.700%, 11/10/2018 | | | 162,485 | |
| | 168,000 | | | 4.000%, 1/31/2024 | | | 168,630 | |
| | | | Anheuser-Busch InBev Worldwide, Inc. | | | | |
| | 214,000 | | | 7.750%, 1/15/2019 | | | 271,014 | |
| | | | Avon Products, Inc. | | | | |
| | 50,000 | | | 2.375%, 3/15/2016 | | | 51,038 | |
| | | | Biomet, Inc. | | | | |
| | 315,000 | | | 6.500%, 8/1/2020 | | | 334,688 | |
| | | | Boston Scientific Corporation | | | | |
| | 145,000 | | | 6.000%, 1/15/2020 | | | 169,030 | |
| | | | Bunge Limited Finance Corporation | | | | |
| | 65,000 | | | 3.200%, 6/15/2017 | | | 67,678 | |
| | 70,000 | | | 8.500%, 6/15/2019 | | | 87,440 | |
| | | | Celgene Corporation | | | | |
| | 156,000 | | | 1.900%, 8/15/2017 | | | 157,358 | |
| | 56,000 | | | 2.300%, 8/15/2018 | | | 56,401 | |
| | | | CHS/Community Health Systems, Inc. | | | | |
| | 315,000 | | | 7.125%, 7/15/2020 | | | 331,538 | |
| | | | ConAgra Foods, Inc. | | | | |
| | 174,000 | | | 1.900%, 1/25/2018 | | | 172,801 | |
| | | | Coventry Health Care, Inc. | | | | |
| | 198,000 | | | 5.950%, 3/15/2017 | | | 225,088 | |
| | | | CVS Caremark Corporation | | | | |
| | 77,000 | | | 6.125%, 9/15/2039 | | | 88,918 | |
| | | | Edwards Lifesciences Corporation | | | | |
| | 112,000 | | | 2.875%, 10/15/2018 | | | 112,430 | |
| | | | Endo Pharmaceuticals Holdings, Inc. | | | | |
| | 315,000 | | | 7.000%, 7/15/2019 | | | 336,262 | |
| | | | Express Scripts Holding Company | | | | |
| | 130,000 | | | 3.125%, 5/15/2016 | | | 136,424 | |
| | | | Fresenius Medical Care US Finance II, Inc. | | | | |
| | 315,000 | | | 5.875%, 1/31/2022e | | | 333,900 | |
| | | | Gilead Sciences, Inc. | | | | |
| | 104,000 | | | 2.400%, 12/1/2014 | | | 105,944 | |
| | 114,000 | | | 3.050%, 12/1/2016 | | | 120,533 | |
| | | | Hawk Acquisition Sub, Inc. | | | | |
| | 314,086 | | | 4.250%, 10/15/2020e | | | 303,878 | |
| | | | Heineken NV | | | | |
| | 61,000 | | | 1.400%, 10/1/2017e | | | 60,263 | |
| | | | IMS Health, Inc. | | | | |
| | 413,000 | | | 6.000%, 11/1/2020e | | | 429,520 | |
| | | | Kraft Foods, Inc. | | | | |
| | 140,000 | | | 6.500%, 8/11/2017 | | | 163,348 | |
| | | | Lorillard Tobacco Company | | | | |
| | 130,000 | | | 2.300%, 8/21/2017h | | | 131,317 | |
| | 140,000 | | | 8.125%, 6/23/2019 | | | 172,748 | |
| | | | Mallinckrodt International Finance SA | | | | |
| | 110,000 | | | 3.500%, 4/15/2018e | | | 109,815 | |
| | | | Mattel, Inc. | | | | |
| | 94,000 | | | 1.700%, 3/15/2018 | | | 92,746 | |
| | | | Medco Health Solutions, Inc. | | | | |
| | 141,000 | | | 7.125%, 3/15/2018 | | | 169,780 | |
| | | | Merck & Company, Inc. | | | | |
| | 360,000 | | | 0.623%, 5/18/2018f | | | 361,133 | |
| | | | Mylan, Inc. | | | | |
| | 165,000 | | | 1.800%, 6/24/2016e | | | 166,204 | |
| | 122,000 | | | 7.875%, 7/15/2020e | | | 139,675 | |
| | | | PepsiCo, Inc. | | | | |
| | 270,000 | | | 0.472%, 2/26/2016f | | | 270,127 | |
| | | | Pernod Ricard SA | | | | |
| | 112,000 | | | 2.950%, 1/15/2017e | | | 116,862 | |
| | 84,000 | | | 5.750%, 4/7/2021e | | | 94,139 | |
| | | | Roche Holdings, Inc. | | | | |
| | 50,000 | | | 7.000%, 3/1/2039e | | | 67,409 | |
| | | | SABMiller Holdings, Inc. | | | | |
| | 150,000 | | | 2.450%, 1/15/2017e | | | 154,898 | |
| | 165,000 | | | 3.750%, 1/15/2022e | | | 169,174 | |
| | | | Safeway, Inc. | | | | |
| | 50,000 | | | 3.400%, 12/1/2016 | | | 51,597 | |
| | 142,000 | | | 5.000%, 8/15/2019 | | | 146,728 | |
| | | | Spectrum Brands Escrow Corporation | | | | |
| | 315,000 | | | 6.375%, 11/15/2020e | | | 334,688 | |
| | | | Tyson Foods, Inc. | | | | |
| | 160,000 | | | 4.500%, 6/15/2022 | | | 165,946 | |
| | | | Valeant Pharmaceuticals International | | | | |
| | 315,000 | | | 6.875%, 12/1/2014e | | | 336,656 | |
| | | | Watson Pharmaceuticals, Inc. | | | | |
| | 196,000 | | | 1.875%, 10/1/2017 | | | 195,515 | |
| | | | WM Wrigley Jr. Company | | | | |
| | 195,000 | | | 1.400%, 10/21/2016e | | | 196,209 | |
| | 140,000 | | | 2.000%, 10/20/2017e | | | 141,220 | |
| | | | | |
| | | | Total | | | 8,292,381 | |
| | | | | |
| |
| Energy (0.7%) | | | | |
| | | | BP Capital Markets plc | | | | |
| | 270,000 | | | 1.846%, 5/5/2017 | | | 274,647 | |
| | 186,000 | | | 1.375%, 11/6/2017 | | | 184,878 | |
| | 112,000 | | | 2.241%, 9/26/2018 | | | 113,141 | |
| | | | CNOOC, Ltd. | | | | |
| | 200,000 | | | 1.125%, 5/9/2016 | | | 198,813 | |
| | | | Concho Resources, Inc. | | | | |
| | 314,086 | | | 5.500%, 10/1/2022 | | | 327,435 | |
| | | | Continental Resources, Inc. | | | | |
| | 196,000 | | | 4.500%, 4/15/2023 | | | 197,715 | |
| | | | EQT Corporation | | | | |
| | 118,000 | | | 8.125%, 6/1/2019 | | | 145,333 | |
| | | | Hess Corporation | | | | |
| | 165,000 | | | 8.125%, 2/15/2019 | | | 207,903 | |
| | | | Linn Energy, LLC | | | | |
| | 314,086 | | | 7.000%, 11/1/2019e | | | 313,301 | |
| | | | Lukoil International Finance BV | | | | |
| | 140,000 | | | 3.416%, 4/24/2018e | | | 141,050 | |
| | | | MEG Energy Corporation | | | | |
| | 315,000 | | | 6.500%, 3/15/2021e | | | 328,781 | |
| | | | Murphy Oil Corporation | | | | |
| | 91,000 | | | 2.500%, 12/1/2017 | | | 91,664 | |
The accompanying Notes to Financial Statements are an integral part of this schedule.
114
Moderately Conservative Allocation Fund
Schedule of Investments as of October 31, 2013
| | | | | | | | |
Principal
Amount | | | Long-Term Fixed Income (28.5%) | | Value | |
| Energy (0.7%) - continued | | | | |
| | | | Oasis Petroleum, Inc. | | | | |
| | $315,000 | | | 6.875%, 1/15/2023 | | | $341,775 | |
| | | | Offshore Group Investment, Ltd. | | | | |
| | 315,000 | | | 7.500%, 11/1/2019h | | | 342,562 | |
| | | | Petrobras Global Finance BV | | | | |
| | 224,000 | | | 2.000%, 5/20/2016 | | | 222,589 | |
| | | | Petroleos Mexicanos | | | | |
| | 99,000 | | | 3.500%, 7/18/2018 | | | 101,228 | |
| | | | Pioneer Natural Resources Company | | | | |
| | 65,000 | | | 5.875%, 7/15/2016 | | | 72,542 | |
| | | | Range Resources Corporation | | | | |
| | 315,000 | | | 5.000%, 8/15/2022 | | | 314,606 | |
| | | | Sinopec Capital 2013, Ltd. | | | | |
| | 170,000 | | | 1.250%, 4/24/2016e | | | 168,985 | |
| | | | Suncor Energy, Inc. | | | | |
| | 114,000 | | | 6.100%, 6/1/2018 | | | 134,046 | |
| | | | Transocean, Inc. | | | | |
| | 65,000 | | | 5.050%, 12/15/2016 | | | 71,599 | |
| | 180,000 | | | 6.000%, 3/15/2018 | | | 203,635 | |
| | 50,000 | | | 6.375%, 12/15/2021 | | | 56,333 | |
| | | | Weatherford International, Ltd. | | | | |
| | 195,000 | | | 6.750%, 9/15/2040 | | | 209,560 | |
| | | | | |
| | | | Total | | | 4,764,121 | |
| | | | | |
| |
| Financials (3.5%) | | | | |
| | | | Abbey National Treasury Services plc | | | | |
| | 112,000 | | | 3.050%, 8/23/2018 | | | 115,944 | |
| | | | Aetna, Inc. | | | | |
| | 132,000 | | | 1.500%, 11/15/2017 | | | 130,768 | |
| | | | American Express Credit Corporation | | | | |
| | 80,000 | | | 2.375%, 3/24/2017 | | | 83,080 | |
| | | | American International Group, Inc. | | | | |
| | 250,000 | | | 2.375%, 8/24/2015 | | | 255,279 | |
| | 140,000 | | | 3.800%, 3/22/2017 | | | 149,565 | |
| | 112,000 | | | 8.250%, 8/15/2018 | | | 141,687 | |
| | | | American Tower Trust I | | | | |
| | 50,000 | | | 1.551%, 3/15/2018e | | | 49,040 | |
| | | | ANZ National International, Ltd. of London | | | | |
| | 197,000 | | | 3.125%, 8/10/2015e,h | | | 204,866 | |
| | | | Associated Banc Corporation | | | | |
| | 65,000 | | | 1.875%, 3/12/2014 | | | 65,241 | |
| | | | Aviation Capital Group Corporation | | | | |
| | 112,000 | | | 3.875%, 9/27/2016e | | | 113,378 | |
| | | | Bank Nederlandse Gemeenten NV | | | | |
| | 135,000 | | | 1.375%, 3/19/2018e | | | 134,001 | |
| | | | Bank of America Corporation | | | | |
| | 275,000 | | | 7.750%, 8/15/2015 | | | 304,531 | |
| | 130,000 | | | 5.750%, 8/15/2016 | | | 143,862 | |
| | 270,000 | | | 5.750%, 12/1/2017 | | | 308,710 | |
| | 457,000 | | | 1.320%, 3/22/2018f,h | | | 462,300 | |
| | 130,000 | | | 5.650%, 5/1/2018 | | | 148,288 | |
| | 168,000 | | | 2.600%, 1/15/2019 | | | 169,135 | |
| | | | Bank of Montreal | | | | |
| | 132,000 | | | 1.300%, 7/15/2016 | | | 133,098 | |
| | 270,000 | | | 0.843%, 4/9/2018f | | | 270,487 | |
| | | | Bank of Nova Scotia | | | | |
| | 270,000 | | | 0.654%, 3/15/2016f | | | 270,645 | |
| | 100,000 | | | 0.950%, 3/15/2016 | | | 100,009 | |
| | | | BB&T Corporation | | | | |
| | 66,000 | | | 1.114%, 6/15/2018f | | | 66,478 | |
| | 132,000 | | | 2.050%, 6/19/2018 | | | 132,222 | |
| | | | BBVA Banco Continental SA | | | | |
| | 150,000 | | | 2.250%, 7/29/2016e | | | 149,625 | |
| | | | BBVA US Senior SAU | | | | |
| | 203,000 | | | 4.664%, 10/9/2015 | | | 213,738 | |
| | | | Berkshire Hathaway Finance Corporation | | | | |
| | 150,000 | | | 1.600%, 5/15/2017 | | | 151,231 | |
| | 270,000 | | | 1.300%, 5/15/2018 | | | 265,649 | |
| | | | BNP Paribas SA | | | | |
| | 187,000 | | | 2.375%, 9/14/2017 | | | 191,193 | |
| | | | Capital One Financial Corporation | | | | |
| | 124,000 | | | 2.150%, 3/23/2015 | | | 126,079 | |
| | 180,000 | | | 0.700%, 3/22/2016f | | | 179,585 | |
| | 159,000 | | | 6.150%, 9/1/2016 | | | 178,336 | |
| | | | Chesapeake Funding, LLC | | | | |
| | 500,000 | | | 0.624%, 1/7/2025e,f | | | 498,669 | |
| | | | Citigroup, Inc. | | | | |
| | 232,000 | | | 5.000%, 9/15/2014 | | | 240,079 | |
| | 198,000 | | | 1.198%, 7/25/2016f | | | 199,818 | |
| | 290,000 | | | 6.000%, 8/15/2017 | | | 333,468 | |
| | 185,000 | | | 8.500%, 5/22/2019 | | | 239,368 | |
| | 94,000 | | | 4.050%, 7/30/2022 | | | 93,018 | |
| | | | CNA Financial Corporation | | | | |
| | 152,000 | | | 7.350%, 11/15/2019 | | | 187,352 | |
| | | | CoBank ACB | | | | |
| | 80,000 | | | 0.854%, 6/15/2022f,g | | | 73,200 | |
| | | | Cooperatieve Centrale Raiffeisen- Boerenleenbank BA | | | | |
| | 133,000 | | | 3.950%, 11/9/2022 | | | 130,006 | |
| | | | Credit Agricole SA | | | | |
| | 125,000 | | | 1.625%, 4/15/2016e | | | 125,950 | |
| | | | CyrusOne, LP | | | | |
| | 315,000 | | | 6.375%, 11/15/2022 | | | 317,363 | |
| | | | DDR Corporation | | | | |
| | 125,000 | | | 9.625%, 3/15/2016 | | | 147,935 | |
| | | | Discover Financial Services | | | | |
| | 211,000 | | | 6.450%, 6/12/2017 | | | 240,782 | |
| | | | DnB Boligkreditt AS | | | | |
| | 360,000 | | | 1.450%, 3/21/2018e | | | 356,760 | |
| | | | Eksportfinans ASA | | | | |
| | 81,000 | | | 3.000%, 11/17/2014 | | | 81,283 | |
| | 120,000 | | | 5.500%, 5/25/2016h | | | 125,640 | |
| | | | Fifth Third Bancorp | | | | |
| | 147,000 | | | 5.450%, 1/15/2017 | | | 162,705 | |
| | | | Fifth Third Capital Trust IV | | | | |
| | 112,000 | | | 6.500%, 4/15/2037 | | | 110,600 | |
| | | | General Electric Capital Corporation | | | | |
| | 85,000 | | | 1.136%, 5/9/2016f | | | 85,740 | |
| | 62,000 | | | 1.600%, 11/20/2017 | | | 62,119 | |
| | 50,000 | | | 0.959%, 4/2/2018f | | | 50,371 | |
| | 411,000 | | | 6.000%, 8/7/2019 | | | 486,416 | |
| | 270,000 | | | 1.254%, 3/15/2023f | | | 267,639 | |
| | 149,000 | | | 6.750%, 3/15/2032 | | | 182,398 | |
| | | | Genworth Financial, Inc. | | | | |
| | 112,000 | | | 6.515%, 5/22/2018h | | | 129,850 | |
| | | | Goldman Sachs Group, Inc. | | | | |
| | 195,000 | | | 3.700%, 8/1/2015 | | | 203,682 | |
| | 305,000 | | | 0.700%, 3/22/2016f | | | 303,439 | |
The accompanying Notes to Financial Statements are an integral part of this schedule.
115
Moderately Conservative Allocation Fund
Schedule of Investments as of October 31, 2013
| | | | | | | | |
Principal
Amount | | | Long-Term Fixed Income (28.5%) | | Value | |
| Financials (3.5%) - continued | | | | |
| | $100,000 | | | 2.375%, 1/22/2018 | | | $100,575 | |
| | 270,000 | | | 1.436%, 4/30/2018f | | | 271,196 | |
| | 134,000 | | | 7.500%, 2/15/2019 | | | 164,538 | |
| | 141,000 | | | 5.250%, 7/27/2021 | | | 155,631 | |
| | | | Hartford Financial Services Group, Inc. | | | | |
| | 191,000 | | | 4.000%, 10/15/2017 | | | 205,486 | |
| | 94,000 | | | 5.125%, 4/15/2022 | | | 105,131 | |
| | | | HCP, Inc. | | | | |
| | 66,000 | | | 6.000%, 1/30/2017 | | | 74,428 | |
| | 55,000 | | | 6.700%, 1/30/2018 | | | 64,491 | |
| | | | Health Care REIT, Inc. | | | | |
| | 155,000 | | | 4.700%, 9/15/2017 | | | 169,620 | |
| | 61,000 | | | 2.250%, 3/15/2018 | | | 60,896 | |
| | | | HSBC Bank plc | | | | |
| | 360,000 | | | 0.904%, 5/15/2018e,f | | | 360,802 | |
| | | | HSBC Finance Corporation | | | | |
| | 240,000 | | | 6.676%, 1/15/2021 | | | 278,922 | |
| | | | HSBC USA, Inc. | | | | |
| | 122,000 | | | 1.625%, 1/16/2018 | | | 121,086 | |
| | | | Huntington Bancshares, Inc. | | | | |
| | 56,000 | | | 2.600%, 8/2/2018 | | | 56,513 | |
| | | | Huntington National Bank | | | | |
| | 130,000 | | | 1.350%, 8/2/2016 | | | 130,216 | |
| | | | Icahn Enterprises, LP | | | | |
| | 314,086 | | | 8.000%, 1/15/2018 | | | 329,398 | |
| | | | ING Bank NV | | | | |
| | 124,000 | | | 3.750%, 3/7/2017e | | | 131,140 | |
| | | | ING Capital Funding Trust III | | | | |
| | 100,000 | | | 3.848%, 12/29/2049f,j | | | 98,750 | |
| | | | ING US, Inc. | | | | |
| | 134,000 | | | 2.900%, 2/15/2018 | | | 136,755 | |
| | | | International Lease Finance Corporation | | | | |
| | 190,000 | | | 2.204%, 6/15/2016f | | | 190,950 | |
| | | | Intesa Sanpaolo SPA | | | | |
| | 280,000 | | | 3.875%, 1/15/2019c | | | 281,112 | |
| | | | J.P. Morgan Chase & Company | | | | |
| | 180,000 | | | 0.689%, 4/23/2015f | | | 180,357 | |
| | 94,000 | | | 1.125%, 2/26/2016 | | | 94,404 | |
| | 229,000 | | | 3.450%, 3/1/2016 | | | 241,323 | |
| | 255,000 | | | 2.000%, 8/15/2017 | | | 258,244 | |
| | 195,000 | | | 1.138%, 1/25/2018f | | | 196,476 | |
| | 80,000 | | | 1.800%, 1/25/2018 | | | 79,448 | |
| | 191,000 | | | 6.300%, 4/23/2019 | | | 226,356 | |
| | 50,000 | | | 3.200%, 1/25/2023 | | | 48,009 | |
| | 189,000 | | | 7.900%, 4/29/2049j | | | 208,372 | |
| | | | J.P. Morgan Chase Bank NA | | | | |
| | 178,000 | | | 0.584%, 6/13/2016f | | | 176,314 | |
| | | | KeyBank NA | | | | |
| | 183,000 | | | 7.413%, 5/6/2015 | | | 199,659 | |
| | | | Liberty Mutual Group, Inc. | | | | |
| | 65,000 | | | 4.950%, 5/1/2022e | | | 68,720 | |
| | 56,000 | | | 6.500%, 5/1/2042e | | | 62,562 | |
| | | | Liberty Property, LP | | | | |
| | 149,000 | | | 5.500%, 12/15/2016 | | | 165,288 | |
| | | | Lloyds TSB Bank plc | | | | |
| | 112,000 | | | 6.500%, 9/14/2020e | | | 126,541 | |
| | | | Merrill Lynch & Company, Inc. | | | | |
| | 100,000 | | | 6.400%, 8/28/2017 | | | 116,207 | |
| | | | Mizuho Corporate Bank, Ltd. | | | | |
| | 200,000 | | | 1.850%, 3/21/2018e | | | 197,414 | |
| | | | Morgan Stanley | | | | |
| | 130,000 | | | 4.750%, 4/1/2014h | | | 132,209 | |
| | 47,000 | | | 1.512%, 2/25/2016f | | | 47,493 | |
| | 47,000 | | | 1.750%, 2/25/2016 | | | 47,461 | |
| | 221,000 | | | 4.750%, 3/22/2017 | | | 242,202 | |
| | 105,000 | | | 6.250%, 8/28/2017 | | | 120,939 | |
| | 180,000 | | | 1.518%, 4/25/2018f | | | 181,419 | |
| | 112,000 | | | 4.875%, 11/1/2022 | | | 115,299 | |
| | 110,000 | | | 4.100%, 5/22/2023 | | | 106,254 | |
| | | | Murray Street Investment Trust I | | | | |
| | 319,000 | | | 4.647%, 3/9/2017 | | | 346,826 | |
| | | | National City Corporation | | | | |
| | 168,000 | | | 6.875%, 5/15/2019 | | | 201,586 | |
| | | | Nederlandse Waterschapsbank NV | | | | |
| | 180,000 | | | 0.750%, 3/29/2016e | | | 180,314 | |
| | | | Nomura Holdings, Inc. | | | | |
| | 270,000 | | | 1.704%, 9/13/2016f | | | 274,712 | |
| | 240,000 | | | 2.000%, 9/13/2016 | | | 241,754 | |
| | | | Nordea Eiendomskreditt AS | | | | |
| | 270,000 | | | 2.125%, 9/22/2016e | | | 279,189 | |
| | | | PNC Bank NA | | | | |
| | 168,000 | | | 1.150%, 11/1/2016 | | | 168,498 | |
| | | | Prologis, LP | | | | |
| | 150,000 | | | 7.375%, 10/30/2019 | | | 185,797 | |
| | | | Prudential Covered Trust | | | | |
| | 229,500 | | | 2.997%, 9/30/2015e | | | 237,466 | |
| | | | Realty Income Corporation | | | | |
| | 62,000 | | | 2.000%, 1/31/2018 | | | 61,151 | |
| | | | Regions Bank | | | | |
| | 295,000 | | | 7.500%, 5/15/2018 | | | 350,973 | |
| | | | Reinsurance Group of America, Inc. | | | | |
| | 110,000 | | | 5.625%, 3/15/2017 | | | 122,143 | |
| | 62,000 | | | 5.000%, 6/1/2021 | | | 66,671 | |
| | | | Royal Bank of Canada | | | | |
| | 450,000 | | | 1.125%, 7/22/2016 | | | 452,802 | |
| | 198,000 | | | 2.200%, 7/27/2018 | | | 200,214 | |
| | | | Royal Bank of Scotland Group plc | | | | |
| | 167,000 | | | 5.050%, 1/8/2015 | | | 172,630 | |
| | 94,000 | | | 2.550%, 9/18/2015 | | | 96,273 | |
| | 47,000 | | | 6.125%, 12/15/2022 | | | 48,592 | |
| | | | Santander US Debt SAU | | | | |
| | 170,000 | | | 3.724%, 1/20/2015e | | | 172,259 | |
| | 55,000 | | | 3.781%, 10/7/2015e | | | 56,662 | |
| | | | Simon Property Group, LP | | | | |
| | 100,000 | | | 10.350%, 4/1/2019 | | | 137,339 | |
| | | | SLM Corporation | | | | |
| | 75,000 | | | 3.875%, 9/10/2015 | | | 77,625 | |
| | 61,000 | | | 6.250%, 1/25/2016 | | | 66,414 | |
| | | | SpareBank 1 Boligkreditt AS | | | | |
| | 360,000 | | | 1.250%, 5/2/2018e | | | 352,584 | |
| | | | Svensk Exportkredit AB | | | | |
| | 180,000 | | | 1.125%, 4/5/2018h | | | 177,547 | |
| | | | Svenska Handelsbanken AB | | | | |
| | 120,000 | | | 3.125%, 7/12/2016 | | | 126,164 | |
| | 40,000 | | | 1.625%, 3/21/2018 | | | 39,408 | |
| | | | Swedbank Hypotek AB | | | | |
| | 360,000 | | | 1.375%, 3/28/2018e,h | | | 356,112 | |
| | | | Swiss RE Capital I, LP | | | | |
| | 125,000 | | | 6.854%, 5/29/2049e,j | | | 133,125 | |
| | | | Toronto-Dominion Bank | | | | |
| | 130,000 | | | 0.716%, 9/9/2016f | | | 130,552 | |
The accompanying Notes to Financial Statements are an integral part of this schedule.
116
Moderately Conservative Allocation Fund
Schedule of Investments as of October 31, 2013
| | | | | | | | |
Principal
Amount | | | Long-Term Fixed Income (28.5%) | | Value | |
| Financials (3.5%) - continued | | | | |
| | | | UBS AG London | | | | |
| | $360,000 | | | 0.750%, 3/24/2016e | | | $358,197 | |
| | | | UBS AG/Stamford, Connecticut | | | | |
| | 124,000 | | | 5.875%, 12/20/2017 | | | 143,779 | |
| | | | Union Bank NA | | | | |
| | 224,000 | | | 1.500%, 9/26/2016 | | | 226,557 | |
| | | | Ventas Realty, LP | | | | |
| | 168,000 | | | 1.550%, 9/26/2016 | | | 169,206 | |
| | | | Wachovia Corporation | | | | |
| | 288,000 | | | 5.625%, 10/15/2016 | | | 323,811 | |
| | 270,000 | | | 0.524%, 6/15/2017f | | | 267,323 | |
| | | | Wells Fargo & Company | | | | |
| | 364,000 | | | 1.250%, 7/20/2016 | | | 366,169 | |
| | 166,000 | | | 2.100%, 5/8/2017 | | | 170,592 | |
| | 140,000 | | | 1.500%, 1/16/2018 | | | 139,484 | |
| | | | | |
| | | | Total | | | 25,648,806 | |
| | | | | |
| |
| Foreign Government (0.3%) | | | | |
| | | | Asian Development Bank | | | | |
| | 360,000 | | | 0.500%, 6/20/2016 | | | 359,892 | |
| | | | Denmark Government International Bond | | | | |
| | 360,000 | | | 0.375%, 4/25/2016e | | | 358,776 | |
| | | | Export-Import Bank of Korea | | | | |
| | 122,000 | | | 1.250%, 11/20/2015 | | | 122,252 | |
| | | | International Finance Corporation | | | | |
| | 270,000 | | | 0.500%, 5/16/2016 | | | 269,940 | |
| | | | Kommunalbanken AS | | | | |
| | 360,000 | | | 0.332%, 3/18/2016e,f | | | 359,762 | |
| | | | Kommuninvest i Sverige AB | | | | |
| | 360,000 | | | 0.500%, 6/15/2016e | | | 358,582 | |
| | | | Mexico Government International Bond | | | | |
| | 112,000 | | | 4.000%, 10/2/2023 | | | 113,736 | |
| | | | Province of Ontario | | | | |
| | 360,000 | | | 1.000%, 7/22/2016 | | | 362,352 | |
| | | | | |
| | | | Total | | | 2,305,292 | |
| | | | | |
| |
| Mortgage-Backed Securities (8.3%) | | | | |
| | | | Federal Home Loan Mortgage Corporation Gold 15-Yr. Pass Through | | | | |
| | 6,675,000 | | | 3.000%, 12/1/2028c | | | 6,900,281 | |
| | | | Federal Home Loan Mortgage Corporation Gold 30-Yr. Pass Through | | | | |
| | 6,600,000 | | | 3.500%, 11/1/2043c | | | 6,745,406 | |
| | | | Federal National Mortgage Association | | | | |
| | 1,771,694 | | | 2.074%, 1/1/2043f | | | 1,809,354 | |
| | 3,157,198 | | | 2.060%, 3/1/2043f | | | 3,227,231 | |
| | 2,696,219 | | | 1.754%, 7/1/2043f | | | 2,719,135 | |
| | | | Federal National Mortgage Association Conventional 15-Yr. Pass Through | | | | |
| | 4,200,000 | | | 2.500%, 11/1/2028c | | | 4,243,969 | |
| | 2,050,000 | | | 3.500%, 11/1/2028c | | | 2,164,512 | |
| | | | Federal National Mortgage Association Conventional 30-Yr. Pass Through | | | | |
| | 13,025,000 | | | 3.500%, 11/1/2043c | | | 13,358,766 | |
| | 12,400,000 | | | 4.000%, 11/1/2043c | | | 13,062,625 | |
| | 6,012,000 | | | 4.500%, 11/1/2043c | | | 6,435,658 | |
| | | | | |
| | | | Total | | | 60,666,937 | |
| | | | | |
| |
| Technology (0.3%) | | | | |
| | | | Apple, Inc. | | | | |
| | 360,000 | | | 0.516%, 5/3/2018f | | | 358,882 | |
| | 50,000 | | | 2.400%, 5/3/2023 | | | 45,691 | |
| | | | Computer Sciences Corporation | | | | |
| | 98,000 | | | 2.500%, 9/15/2015 | | | 100,361 | |
| | | | EMC Corporation | | | | |
| | 196,000 | | | 1.875%, 6/1/2018 | | | 196,719 | |
| | | | First Data Corporation | | | | |
| | 315,000 | | | 7.375%, 6/15/2019e | | | 339,019 | |
| | | | Hewlett-Packard Company | | | | |
| | 130,000 | | | 2.125%, 9/13/2015 | | | 132,254 | |
| | | | Intel Corporation | | | | |
| | 122,000 | | | 4.000%, 12/15/2032 | | | 114,735 | |
| | | | Iron Mountain, Inc. | | | | |
| | 315,000 | | | 6.000%, 8/15/2023 | | | 320,513 | |
| | | | Oracle Corporation | | | | |
| | 124,000 | | | 1.200%, 10/15/2017 | | | 122,388 | |
| | 160,000 | | | 0.824%, 1/15/2019f | | | 160,661 | |
| | | | Samsung Electronics America, Inc. | | | | |
| | 94,000 | | | 1.750%, 4/10/2017e | | | 95,126 | |
| | | | Tyco Electronics Group SA | | | | |
| | 231,000 | | | 6.550%, 10/1/2017 | | | 267,549 | |
| | | | Xerox Corporation | | | | |
| | 130,000 | | | 7.200%, 4/1/2016 | | | 146,891 | |
| | | | | |
| | | | Total | | | 2,400,789 | |
| | | | | |
| |
| Transportation (0.3%) | | | | |
| | | | American Airlines Pass Through Trust | | | | |
| | 130,000 | | | 4.950%, 1/15/2023e | | | 133,900 | |
| | | | Avis Budget Car Rental, LLC | | | | |
| | 315,000 | | | 8.250%, 1/15/2019 | | | 343,350 | |
| | | | Canadian National Railway Company | | | | |
| | 80,000 | | | 0.438%, 11/6/2015c,f | | | 79,968 | |
| | | | Canadian Pacific Railway Company | | | | |
| | 65,000 | | | 7.125%, 10/15/2031 | | | 79,601 | |
| | 76,000 | | | 5.750%, 3/15/2033 | | | 82,852 | |
| | | | Continental Airlines, Inc. | | | | |
| | 141,431 | | | 4.150%, 4/11/2024 | | | 139,664 | |
| | | | CSX Corporation | | | | |
| | 126,000 | | | 6.250%, 4/1/2015 | | | 135,620 | |
| | 98,000 | | | 3.700%, 11/1/2023 | | | 97,809 | |
| | | | Delta Air Lines, Inc. | | | | |
| | 196,000 | | | 6.750%, 5/23/2017 | | | 199,063 | |
| | 90,345 | | | 4.950%, 5/23/2019 | | | 96,895 | |
| | 31,822 | | | 4.750%, 5/7/2020 | | | 33,572 | |
| | | | ERAC USA Finance, LLC | | | | |
| | 124,000 | | | 1.400%, 4/15/2016e | | | 124,189 | |
| | 66,000 | | | 2.800%, 11/1/2018e | | | 66,889 | |
| | | | Kansas City Southern de Mexico SA de CV | | | | |
| | 234,000 | | | 0.937%, 10/28/2016e,f | | | 234,350 | |
| | 100,000 | | | 2.350%, 5/15/2020 | | | 95,374 | |
The accompanying Notes to Financial Statements are an integral part of this schedule.
117
Moderately Conservative Allocation Fund
Schedule of Investments as of October 31, 2013
| | | | | | | | |
Principal
Amount | | | Long-Term Fixed Income (28.5%) | | Value | |
| Transportation (0.3%) - continued | | | | |
| | | | Virgin Australia Holdings, Ltd. | | | | |
| | $70,000 | | | 5.000%, 10/23/2023e | | | $71,750 | |
| | | | | |
| | | | Total | | | 2,014,846 | |
| | | | | |
| |
| U.S. Government and Agencies (2.6%) | | | | |
| | | | U.S. Treasury Bonds | | | | |
| | 550,000 | | | 4.375%, 5/15/2040 | | | 629,321 | |
| | 730,000 | | | 3.000%, 5/15/2042 | | | 647,190 | |
| | 431,000 | | | 2.875%, 5/15/2043 | | | 369,785 | |
| | | | U.S. Treasury Notes | | | | |
| | 1,030,000 | | | 0.375%, 2/15/2016 | | | 1,029,759 | |
| | 3,250,000 | | | 1.000%, 5/31/2018 | | | 3,223,847 | |
| | 1,200,000 | | | 1.375%, 1/31/2020 | | | 1,174,031 | |
| | 2,610,000 | | | 1.625%, 8/15/2022 | | | 2,451,769 | |
| | 200,000 | | | 1.750%, 5/15/2023 | | | 186,797 | |
| | | | U.S. Treasury Notes, TIPS | | | | |
| | 5,867,912 | | | 0.125%, 4/15/2018 | | | 6,070,085 | |
| | 3,546,197 | | | 0.125%, 1/15/2023 | | | 3,465,857 | |
| | | | | |
| | | | Total | | | 19,248,441 | |
| | | | | |
| |
| U.S. Municipals (2.9%) | | | | |
| | | | Buckeye Tobacco Settlement Financing Auth. Rev. | | | | |
| | 765,000 | | | 5.125%, 6/1/2024, Ser. A-2 | | | 653,425 | |
| | | | Dallas/Fort Worth Texas International Airport Joint Rev. Improvement | | | | |
| | 1,335,000 | | | 5.000%, 11/1/2038, Ser. A, AMT | | | 1,271,000 | |
| | | | Los Angeles Department Of Water and Power Power System Rev. | | | | |
| | 1,669,000 | | | 5.000%, 7/1/2043, Ser. B | | | 1,742,786 | |
| | | | Massachusetts Bay Transportation Auth. Assessment Rev. | | | | |
| | 993,000 | | | 5.000%, 7/1/2041, Ser. A | | | 1,049,363 | |
| | | | Massachusetts Development Finance Agency Rev. (Boston University) | | | | |
| | 951,000 | | | 5.000%, 10/1/2048 | | | 964,314 | |
| | | | Massachusetts School Building Auth. Sales Tax Rev. | | | | |
| | 1,335,000 | | | 5.000%, 5/15/2043, Ser. A | | | 1,405,274 | |
| | | | Metropolitan Transportation Auth. Transportation Rev. | | | | |
| | 1,335,000 | | | 5.000%, 11/15/2043, Ser. A | | | 1,355,199 | |
| | | | Miami-Dade County Expressway Auth. Toll System Rev. | | | | |
| | 567,000 | | | 5.000%, 7/1/2040, Ser. A | | | 572,075 | |
| | | | New Jersey Transportation Trust Fund Auth. Transportation System Rev. | | | | |
| | 1,668,000 | | | 5.000%, 6/15/2042, Ser. A | | | 1,697,107 | |
| | | | New Jersey Turnpike Auth. Turnpike Rev. | | | | |
| | 535,000 | | | 5.000%, 1/1/2043, Ser. A | | | 548,188 | |
| | | | New York City Municipal Water Finance Auth. Water and Sewer System Rev. | | | | |
| | 1,335,000 | | | 5.000%, 6/15/2047, Ser. EE | | | 1,388,667 | |
| | | | New York City Transitional Finance Auth. Future Tax Rev. | | | | |
| | 1,246,000 | | | 5.000%, 5/1/2042, Ser. I | | | 1,304,462 | |
| | | | New York State Dormitory Auth. Personal Income Tax Rev. | | | | |
| | 801,000 | | | 5.000%, 3/15/2042, Ser. B | | | 834,842 | |
| | | | North Texas Tollway Auth. Rev. | | | | |
| | 1,335,000 | | | 5.000%, 1/1/2042, Ser. B | | | 1,328,912 | |
| | | | San Diego County Regional Airport Auth. Airport Rev. | | | | |
| | 1,151,000 | | | 5.000%, 7/1/2038, Ser. B, AMT | | | 1,134,875 | |
| | | | South Carolina Public Service Auth. Rev. Obligations | | | | |
| | 1,335,000 | | | 5.000%, 12/1/2043, Ser. D | | | 1,354,544 | |
| | | | State of California Various Purpose G.O. | | | | |
| | 667,000 | | | 5.000%, 9/1/2036 | | | 692,006 | |
| | 334,000 | | | 5.000%, 4/1/2042 | | | 341,809 | |
| | 334,000 | | | 5.000%, 2/1/2043 | | | 342,170 | |
| | | | University of Massachusetts Building Auth. Proj. Rev. | | | | |
| | 1,068,000 | | | 5.000%, 11/1/2039, Ser. 2 | | | 1,121,624 | |
| | | | | |
| | | | Total | | | 21,102,642 | |
| | | | | |
| |
| Utilities (0.7%) | | | | |
| | | | AES Corporation | | | | |
| | 315,000 | | | 7.375%, 7/1/2021 | | | 356,737 | |
| | | | American Electric Power Company, Inc. | | | | |
| | 122,000 | | | 1.650%, 12/15/2017 | | | 120,508 | |
| | | | Atlas Pipeline Partners, LP | | | | |
| | 315,000 | | | 4.750%, 11/15/2021e | | | 296,100 | |
| | | | Dayton Power and Light Company | | | | |
| | 112,000 | | | 1.875%, 9/15/2016e | | | 113,026 | |
| | | | DCP Midstream Operating, LP | | | | |
| | 61,000 | | | 2.500%, 12/1/2017 | | | 61,068 | |
| | | | Duke Energy Corporation | | | | |
| | 168,000 | | | 2.100%, 6/15/2018 | | | 168,802 | |
| | | | Enel Finance International NV | | | | |
| | 137,000 | | | 3.875%, 10/7/2014e | | | 140,425 | |
| | 84,000 | | | 6.250%, 9/15/2017e | | | 94,398 | |
| | | | Energy Transfer Partners, LP | | | | |
| | 50,000 | | | 9.700%, 3/15/2019 | | | 65,628 | |
| | 195,000 | | | 4.650%, 6/1/2021 | | | 204,200 | |
| | | | Enterprise Products Operating, LLC | | | | |
| | 195,000 | | | 1.250%, 8/13/2015 | | | 196,069 | |
| | | | Exelon Corporation | | | | |
| | 140,000 | | | 4.900%, 6/15/2015 | | | 148,338 | |
| | | | Exelon Generation Company, LLC | | | | |
| | 150,000 | | | 5.200%, 10/1/2019 | | | 163,988 | |
| | | | Iberdrola Finance Ireland, Ltd. | | | | |
| | 80,000 | | | 3.800%, 9/11/2014e | | | 81,798 | |
| | | | ITC Holdings Corporation | | | | |
| | 169,000 | | | 5.875%, 9/30/2016e | | | 188,307 | |
| | 66,000 | | | 4.050%, 7/1/2023 | | | 66,032 | |
| | | | Korea Western Power Company, Ltd. | | | | |
| | 200,000 | | | 2.875%, 10/10/2018e | | | 200,767 | |
| | | | MidAmerican Energy Holdings Company | | | | |
| | 130,000 | | | 6.500%, 9/15/2037 | | | 153,614 | |
The accompanying Notes to Financial Statements are an integral part of this schedule.
118
Moderately Conservative Allocation Fund
Schedule of Investments as of October 31, 2013
| | | | | | | | |
Principal
Amount | | | Long-Term Fixed Income (28.5%) | | Value | |
| Utilities (0.7%) - continued | | | | |
| | | | NextEra Energy Capital Holdings, Inc. | | | | |
| | $195,000 | | | 1.200%, 6/1/2015 | | | $196,286 | |
| | | | NiSource Finance Corporation | | | | |
| | 168,000 | | | 6.800%, 1/15/2019 | | | 198,388 | |
| | | | Northeast Utilities | | | | |
| | 75,000 | | | 1.450%, 5/1/2018 | | | 73,424 | |
| | | | NRG Energy, Inc. | | | | |
| | 315,000 | | | 6.625%, 3/15/2023 | | | 325,631 | |
| | | | ONEOK Partners, LP | | | | |
| | 109,000 | | | 8.625%, 3/1/2019 | | | 139,001 | |
| | 84,000 | | | 5.000%, 9/15/2023 | | | 89,772 | |
| | | | Pacific Gas & Electric Company | | | | |
| | 191,000 | | | 5.625%, 11/30/2017 | | | 219,614 | |
| | | | PPL Capital Funding, Inc. | | | | |
| | 230,000 | | | 1.900%, 6/1/2018 | | | 227,102 | |
| | 55,000 | | | 3.500%, 12/1/2022 | | | 52,547 | |
| | | | Sempra Energy | | | | |
| | 191,000 | | | 6.150%, 6/15/2018 | | | 223,988 | |
| | | | Spectra Energy Partners, LP | | | | |
| | 56,000 | | | 2.950%, 9/25/2018 | | | 57,285 | |
| | 56,000 | | | 4.750%, 3/15/2024 | | | 58,879 | |
| | | | Williams Partners, LP | | | | |
| | 65,000 | | | 7.250%, 2/1/2017 | | | 75,779 | |
| | | | | |
| | | | Total | | | 4,757,501 | |
| | | | | |
| | | | | | | | |
| | | | | |
| | | | Total Long-Term Fixed Income (cost $206,575,643) | | | 209,239,650 | |
| | | | | |
| | |
| Shares | | | Common Stock (12.2%) | | Value | |
| Consumer Discretionary (1.8%) | | | | |
| | 1,925 | | | Amazon.com, Inc.d | | | 700,758 | |
| | 875 | | | AutoZone, Inc.d | | | 380,354 | |
| | 4,000 | | | Barnes & Noble, Inc.d | | | 56,520 | |
| | 1,600 | | | Best Buy Company, Inc. | | | 68,480 | |
| | 1,000 | | | BJ’s Restaurants, Inc.d | | | 27,060 | |
| | 8,200 | | | Cablevision Systems Corporation | | | 127,510 | |
| | 4,210 | | | CBS Corporation | | | 248,979 | |
| | 600 | | | Charter Communications, Inc.d | | | 80,544 | |
| | 4,920 | | | Cheesecake Factory, Inc. | | | 232,470 | |
| | 1,100 | | | Children’s Place Retail Stores, Inc.d | | | 60,049 | |
| | 32,000 | | | Comcast Corporation | | | 1,522,560 | |
| | 2,600 | | | Dana Holding Corporation | | | 50,960 | |
| | 10,838 | | | Delphi Automotive plc | | | 619,934 | |
| | 1,400 | | | DISH Network Corporation | | | 67,480 | |
| | 1,877 | | | Finish Line, Inc. | | | 47,000 | |
| | 804 | | | Foot Locker, Inc. | | | 27,899 | |
| | 23,500 | | | Ford Motor Company | | | 402,085 | |
| | 4,200 | | | Francesca’s Holdings Corporationd | | | 75,558 | |
| | 2,600 | | | Gannett Company, Inc. | | | 71,942 | |
| | 800 | | | General Motors Companyd | | | 29,560 | |
| | 2,170 | | | GNC Holdings, Inc. | | | 127,639 | |
| | 3,400 | | | Harley-Davidson, Inc. | | | 217,736 | |
| | 1,124 | | | Hasbro, Inc. | | | 58,055 | |
| | 6,900 | | | Home Depot, Inc. | | | 537,441 | |
| | 6,757 | | | Ignite Restaurant Group, Inc.d | | | 108,517 | |
| | 1,000 | | | iRobot Corporationd | | | 33,870 | |
| | 10,908 | | | Las Vegas Sands Corporation | | | 765,960 | |
| | 3,251 | | | LifeLock, Inc.d | | | 52,309 | |
| | 19,810 | | | Lowe’s Companies, Inc. | | | 986,142 | |
| | 1,786 | | | M/I Homes, Inc.d | | | 36,559 | |
| | 3,900 | | | Macy’s, Inc. | | | 179,829 | |
| | 1,500 | | | Marriott International, Inc. | | | 67,620 | |
| | 1,500 | | | Marriott Vacations Worldwide Corporationd | | | 75,120 | |
| | 6,179 | | | MDC Partners, Inc. | | | 190,498 | |
| | 5,280 | | | Meredith Corporation | | | 270,864 | |
| | 700 | | | Michael Kors Holdings, Ltd.d | | | 53,865 | |
| | 900 | | | Multimedia Games Holding Company, Inc.d | | | 29,259 | |
| | 14,960 | | | News Corporation | | | 508,640 | |
| | 4,900 | | | Nexstar Broadcasting Group, Inc. | | | 217,511 | |
| | 7,600 | | | NIKE, Inc. | | | 575,776 | |
| | 900 | | | Omnicom Group, Inc. | | | 61,299 | |
| | 2,810 | | | Papa John’s International, Inc. | | | 212,633 | |
| | |
| | 800 | | | Penn National Gaming, Inc.d | | | 46,808 | |
| | 3,969 | | | Pier 1 Imports, Inc. | | | 82,873 | |
| | 400 | | | Priceline.com, Inc.d | | | 421,532 | |
| | 2,100 | | | Regal Entertainment Group | | | 39,921 | |
| | 800 | | | Scripps Networks Interactive, Inc. | | | 64,400 | |
| | 1,500 | | | Signet Jewelers, Ltd. | | | 111,990 | |
| | 10,400 | | | Smith & Wesson Holding Corporationd | | | 112,112 | |
| | 3,100 | | | Starwood Hotels & Resorts Worldwide, Inc. | | | 228,222 | |
| | 2,100 | | | Sturm, Ruger & Company, Inc. | | | 137,361 | |
| | 700 | | | Target Corporation | | | 45,353 | |
| | 1,200 | | | Tempur-Pedic International, Inc.d | | | 46,020 | |
| | 4,250 | | | Time Warner Cable, Inc. | | | 510,637 | |
| | 1,200 | | | TJX Companies, Inc. | | | 72,948 | |
| | 1,400 | | | Toll Brothers, Inc.d | | | 46,032 | |
| | 7,950 | | | Tuesday Morning Corporationd | | | 112,492 | |
| | 14,400 | | | Twenty-First Century Fox, Inc. | | | 490,752 | |
| | 1,000 | | | Urban Outfitters, Inc.d | | | 37,880 | |
| | 1,300 | | | Valassis Communications, Inc. | | | 35,568 | |
| | 3,500 | | | Viacom, Inc. | | | 291,515 | |
| | 3,700 | | | Wyndham Worldwide Corporation | | | 245,680 | |
| | | | | |
| | | | Total | | | 13,444,940 | |
| | | | | |
| |
| Consumer Staples (0.7%) | | | | |
| | 7,500 | | | Altria Group, Inc. | | | 279,225 | |
| | 652 | | | Andersons, Inc. | | | 48,365 | |
| | 2,500 | | | Anheuser-Busch InBev NV ADR | | | 259,325 | |
| | 3,578 | | | Annie’s, Inc.d | | | 169,061 | |
| | 3,250 | | | British American Tobacco plc ADR | | | 359,092 | |
| | 800 | | | Brown-Forman Corporation | | | 58,384 | |
| | 1,500 | | | Bunge, Ltd. | | | 123,195 | |
| | 600 | | | Campbell Soup Company | | | 25,542 | |
| | 4,000 | | | Colgate-Palmolive Company | | | 258,920 | |
| | 14,730 | | | CVS Caremark Corporation | | | 917,090 | |
| | 305 | | | Energizer Holdings, Inc. | | | 29,924 | |
| | 3,200 | | | Green Mountain Coffee Roasters, Inc.d | | | 200,992 | |
| | 400 | | | Herbalife, Ltd. | | | 25,928 | |
| | 2,302 | | | Ingredion, Inc. | | | 151,380 | |
| | 2,660 | | | Kimberly-Clark Corporation | | | 287,280 | |
| | 3,973 | | | Kraft Foods Group, Inc. | | | 216,052 | |
| | 6,300 | | | Kroger Company | | | 269,892 | |
| | 11,841 | | | Mondelez International, Inc. | | | 398,331 | |
| | 4,600 | | | Nestle SA | | | 332,046 | |
| | 2,953 | | | Philip Morris International, Inc. | | | 263,171 | |
The accompanying Notes to Financial Statements are an integral part of this schedule.
119
Moderately Conservative Allocation Fund
Schedule of Investments as of October 31, 2013
| | | | | | | | |
| Shares | | | Common Stock (12.2%) | | Value | |
| Consumer Staples (0.7%) - continued | | | | |
| | 3,200 | | | Procter & Gamble Company | | | $258,400 | |
| | 2,200 | | | Wal-Mart Stores, Inc. | | | 168,850 | |
| | 9,800 | | | WhiteWave Foods Companyd | | | 196,098 | |
| | | | | |
| | | | Total | | | 5,296,543 | |
| | | | | |
| |
| Energy (1.1%) | | | | |
| | 4,000 | | | Anadarko Petroleum Corporation | | | 381,160 | |
| | 250 | | | Atwood Oceanics, Inc.d | | | 13,282 | |
| | 197 | | | Cabot Oil & Gas Corporation | | | 6,958 | |
| | 220 | | | Cameron International Corporationd | | | 12,069 | |
| | 3,600 | | | Chevron Corporation | | | 431,856 | |
| | 100 | | | Cimarex Energy Company | | | 10,535 | |
| | 2,400 | | | Cloud Peak Energy, Inc.d | | | 37,464 | |
| | 120 | | | Concho Resources, Inc.d | | | 13,273 | |
| | 10,100 | | | Consol Energy, Inc. | | | 368,650 | |
| | 700 | | | Denbury Resources, Inc.d | | | 13,293 | |
| | 240 | | | Energy XXI, Ltd. | | | 6,974 | |
| | 200 | | | Ensco plc | | | 11,530 | |
| | 3,993 | | | EOG Resources, Inc. | | | 712,351 | |
| | 6,430 | | | EQT Corporation | | | 550,472 | |
| | 1,900 | | | Exterran Holdings, Inc.d | | | 54,245 | |
| | 7,600 | | | Exxon Mobil Corporation | | | 681,112 | |
| | 350 | | | Helix Energy Solutions Group, Inc.d | | | 8,281 | |
| | 175 | | | Helmerich & Payne, Inc. | | | 13,571 | |
| | 5,775 | | | HollyFrontier Corporation | | | 265,997 | |
| | 33,211 | | | Marathon Oil Corporation | | | 1,171,020 | |
| | 400 | | | Marathon Petroleum Corporation | | | 28,664 | |
| | 5,500 | | | Nabors Industries, Ltd. | | | 96,140 | |
| | 150 | | | National Oilwell Varco, Inc. | | | 12,177 | |
| | 325 | | | Newfield Exploration Companyd | | | 9,896 | |
| | 290 | | | Noble Corporation | | | 10,933 | |
| | 200 | | | Noble Energy, Inc. | | | 14,986 | |
| | 2,410 | | | Oasis Petroleum, Inc.d | | | 128,333 | |
| | 1,950 | | | Oceaneering International, Inc. | | | 167,466 | |
| | 145 | | | Oil States International, Inc.d | | | 15,751 | |
| | 3,300 | | | Peabody Energy Corporation | | | 64,284 | |
| | 75 | | | Pioneer Natural Resources Company | | | 15,359 | |
| | 125 | | | Range Resources Corporation | | | 9,464 | |
| | 9,810 | | | Rex Energy Corporationd | | | 210,915 | |
| | 3,820 | | | Rosetta Resources, Inc.d | | | 228,971 | |
| | 275 | | | Rowan Companies plcd | | | 9,922 | |
| | 9,830 | | | Schlumberger, Ltd. | | | 921,268 | |
| | 130 | | | SM Energy Company | | | 11,519 | |
| | 500 | | | Superior Energy Services, Inc.d | | | 13,415 | |
| | 3,200 | | | Tesoro Corporation | | | 156,448 | |
| | 12,000 | | | Total SA ADR | | | 734,160 | |
| | 39,700 | | | Weatherford International, Ltd.d | | | 652,668 | |
| | 175 | | | Whiting Petroleum Corporationd | | | 11,706 | |
| | | | | |
| | | | Total | | | 8,288,538 | |
| | | | | |
| |
| Financials (2.9%) | | | | |
| | 6,110 | | | ACE, Ltd. | | | 583,138 | |
| | 1,666 | | | Affiliated Managers Group, Inc.d | | | 328,935 | |
| | 990 | | | Allied World Assurance Company Holdings AG | | | 107,207 | |
| | 5,330 | | | Allstate Corporation | | | 282,810 | |
| | 1,820 | | | American Assets Trust, Inc. | | | 60,588 | |
| | 5,900 | | | American International Group, Inc. | | | 304,735 | |
| | 1,500 | | | AmTrust Financial Services, Inc. | | | 57,540 | |
| | 1,400 | | | Aspen Insurance Holdings, Ltd. | | | 54,614 | |
| | 1,100 | | | Axis Capital Holdings, Ltd. | | | 52,162 | |
| | 59,230 | | | Bank of America Corporation | | | 826,851 | |
| | 1,500 | | | Banner Corporation | | | 57,390 | |
| | 2,580 | | | BBCN Bancorp, Inc. | | | 38,261 | |
| | 5,500 | | | Berkshire Hathaway, Inc.d | | | 632,940 | |
| | 600 | | | Camden Property Trust | | | 38,520 | |
| | 26,960 | | | Citigroup, Inc. | | | 1,315,109 | |
| | 1,011 | | | CNA Financial Corporation | | | 41,037 | |
| | 5,330 | | | CNO Financial Group, Inc. | | | 83,041 | |
| | 1,490 | | | Columbia Banking System, Inc. | | | 38,278 | |
| | 1,900 | | | Comerica, Inc. | | | 82,270 | |
| | 11,050 | | | Credit Suisse Group ADRd | | | 343,987 | |
| | 7,630 | | | DCT Industrial Trust, Inc. | | | 59,133 | |
| | 5,300 | | | Deutsche Bank AG | | | 256,096 | |
| | 2,200 | | | Discover Financial Services | | | 114,136 | |
| | 1,300 | | | Evercore Partners, Inc. | | | 65,611 | |
| | 1,130 | | | Extra Space Storage, Inc. | | | 51,969 | |
| | 12,600 | | | Fifth Third Bancorp | | | 239,778 | |
| | 10,400 | | | First Horizon National Corporation | | | 110,760 | |
| | 2,800 | | | First Industrial Realty Trust, Inc. | | | 50,596 | |
| | 1,300 | | | First Republic Bank | | | 66,391 | |
| | 3,000 | | | Franklin Street Properties Corporation | | | 39,600 | |
| | 3,100 | | | Fulton Financial Corporation | | | 37,851 | |
| | 1,600 | | | FXCM, Inc. | | | 26,224 | |
| | 800 | | | Greenhill & Company, Inc. | | | 41,040 | |
| | 6,710 | | | Hanmi Financial Corporation | | | 117,291 | |
| | 2,840 | | | HCC Insurance Holdings, Inc. | | | 129,646 | |
| | 1,600 | | | Home Loan Servicing Solutions, Ltd. | | | 37,776 | |
| | 3,639 | | | Host Hotels & Resorts, Inc. | | | 67,503 | |
| | 10,800 | | | Huntington Bancshares, Inc. | | | 95,040 | |
| | 13,750 | | | Invesco, Ltd. | | | 464,063 | |
| | 27,000 | | | iShares Barclays 1-3 Year Credit Bond Fund | | | 2,846,880 | |
| | 4,440 | | | iShares Russell 2000 Index Fund | | | 484,981 | |
| | 13,545 | | | J.P. Morgan Chase & Company | | | 698,109 | |
| | 1,673 | | | Lazard, Ltd. | | | 64,661 | |
| | 500 | | | M&T Bank Corporation | | | 56,265 | |
| | 700 | | | Macerich Company | | | 41,447 | |
| | 1,300 | | | MasterCard, Inc. | | | 932,230 | |
| | 17,030 | | | MetLife, Inc. | | | 805,689 | |
| | 1,700 | | | Montpelier Re Holdings, Inc. | | | 46,937 | |
| | 18,700 | | | Morgan Stanley | | | 537,251 | |
| | 900 | | | MSCI, Inc.d | | | 36,693 | |
| | 2,500 | | | NASDAQ OMX Group, Inc. | | | 88,575 | |
| | 1,100 | | | Northern Trust Corporation | | | 62,062 | |
| | 3,080 | | | Parkway Properties, Inc. | | | 55,779 | |
| | 2,100 | | | Pebblebrook Hotel Trust | | | 63,420 | |
| | 2,800 | | | Piedmont Office Realty Trust, Inc. | | | 51,744 | |
| | 2,293 | | | Popular, Inc.d | | | 57,898 | |
| | 900 | | | Portfolio Recovery Associates, Inc.d | | | 53,505 | |
| | 1,500 | | | Progressive Corporation | | | 38,955 | |
| | 1,300 | | | Protective Life Corporation | | | 59,904 | |
| | 3,300 | | | Prudential Financial, Inc. | | | 268,587 | |
| | 2,700 | | | Raymond James Financial, Inc. | | | 123,255 | |
| | 9,500 | | | SLM Corporation | | | 241,015 | |
| | 10,500 | | | SPDR EURO STOXX 50 ETF | | | 428,295 | |
| | 15,200 | | | SPDR S&P 500 ETF Trust | | | 2,671,096 | |
| | 870 | | | SPDR S&P Biotech ETF | | | 103,521 | |
| | 6,200 | | | State Street Corporation | | | 434,434 | |
| | 1,609 | | | Stewart Information Services Corporation | | | 50,394 | |
The accompanying Notes to Financial Statements are an integral part of this schedule.
120
Moderately Conservative Allocation Fund
Schedule of Investments as of October 31, 2013
| | | | | | | | |
| Shares | | | Common Stock (12.2%) | | Value | |
| Financials (2.9%) - continued | | | | |
| | 6,250 | | | SVB Financial Groupd | | | $598,625 | |
| | 593 | | | Taubman Centers, Inc. | | | 39,013 | |
| | 4,400 | | | TCF Financial Corporation | | | 66,792 | |
| | 6,166 | | | Terreno Realty Corporation | | | 109,632 | |
| | 2,460 | | | Texas Capital Bancshares, Inc.d | | | 128,043 | |
| | 2,700 | | | Visa, Inc. | | | 531,009 | |
| | 3,146 | | | W.R. Berkley Corporation | | | 138,141 | |
| | 11,400 | | | Wells Fargo & Company | | | 486,666 | |
| | 8,400 | | | Zions Bancorporation | | | 238,308 | |
| | | | | |
| | | | Total | | | 21,139,728 | |
| | | | | |
| |
| Health Care (1.4%) | | | | |
| | 1,100 | | | Abbott Laboratories | | | 40,205 | |
| | 1,100 | | | Acorda Therapeutics, Inc.d | | | 33,671 | |
| | 7,060 | | | Akorn, Inc.d | | | 144,306 | |
| | 4,690 | | | Align Technology, Inc.d | | | 267,611 | |
| | 4,800 | | | Allscripts Healthcare Solutions, Inc.d | | | 66,384 | |
| | 800 | | | AmerisourceBergen Corporation | | | 52,264 | |
| | 9,560 | | | Baxter International, Inc. | | | 629,717 | |
| | 600 | | | Biogen Idec, Inc.d | | | 146,514 | |
| | 11,500 | | | BioScrip, Inc.d | | | 80,615 | |
| | 392 | | | C.R. Bard, Inc. | | | 53,398 | |
| | 500 | | | Catamaran Corporationd | | | 23,480 | |
| | 1,700 | | | Centene Corporationd | | | 95,472 | |
| | 700 | | | Charles River Laboratories International, Inc.d | | | 34,447 | |
| | 600 | | | Community Health Systems, Inc. | | | 26,178 | |
| | 20,700 | | | Covidien plc | | | 1,327,077 | |
| | 2,200 | | | DENTSPLY International, Inc. | | | 103,620 | |
| | 1,500 | | | Emeritus Corporationd | | | 28,740 | |
| | 6,611 | | | ExamWorks Group, Inc.d | | | 170,894 | |
| | 14,600 | | | Express Scripts Holding Companyd | | | 912,792 | |
| | 16,000 | | | Gilead Sciences, Inc.d | | | 1,135,840 | |
| | 2,200 | | | Illumina, Inc.d | | | 205,722 | |
| | 2,600 | | | McKesson Corporation | | | 406,484 | |
| | 400 | | | Medidata Solutions, Inc.d | | | 44,124 | |
| | 21,140 | | | Merck & Company, Inc. | | | 953,203 | |
| | 4,040 | | | Neurocrine Biosciences, Inc.d | | | 38,138 | |
| | 5,783 | | | NuVasive, Inc.d | | | 183,784 | |
| | 1,600 | | | PAREXEL International Corporationd | | | 73,136 | |
| | 11,384 | | | PDL BioPharma, Inc. | | | 92,097 | |
| | 2,500 | | | PerkinElmer, Inc. | | | 95,100 | |
| | 800 | | | Pfizer, Inc. | | | 24,544 | |
| | 4,400 | | | ResMed, Inc. | | | 227,656 | |
| | 11,140 | | | Sanofi ADR | | | 595,767 | |
| | 2,600 | | | Seattle Genetics, Inc.d | | | 100,438 | |
| | 5,100 | | | Shire Pharmaceuticals Group plc ADR | | | 678,810 | |
| | 1,900 | | | Thoratec Corporationd | | | 82,061 | |
| | 2,100 | | | United Therapeutics Corporationd | | | 185,892 | |
| | 9,140 | | | UnitedHealth Group, Inc. | | | 623,897 | |
| | 150 | | | Veeva Systems, Inc.d | | | 5,837 | |
| | 1,600 | | | Waters Corporationd | | | 161,472 | |
| | 1,809 | | | Zimmer Holdings, Inc. | | | 158,233 | |
| | | | | |
| | | | Total | | | 10,309,620 | |
| | | | | |
| |
| Industrials (1.4%) | | | | |
| | 2,000 | | | 3M Company | | | 251,700 | |
| | 2,760 | | | Actuant Corporation | | | 103,666 | |
| | 1,660 | | | Acuity Brands, Inc. | | | 166,847 | |
| | 800 | | | ADT Corporation | | | 34,696 | |
| | 1,700 | | | AGCO Corporation | | | 99,246 | |
| | 2,000 | | | AMETEK, Inc. | | | 95,660 | |
| | 2,750 | | | Apogee Enterprises, Inc. | | | 86,020 | |
| | 600 | | | Armstrong World Industries, Inc.d | | | 32,058 | |
| | 2,600 | | | Avis Budget Group, Inc.d | | | 81,458 | |
| | 1,400 | | | Babcock & Wilcox Company | | | 45,094 | |
| | 5,900 | | | Boeing Company | | | 769,950 | |
| | 2,622 | | | Briggs & Stratton Corporation | | | 48,088 | |
| | 2,430 | | | CLARCOR, Inc. | | | 142,106 | |
| | 900 | | | Colfax Corporationd | | | 50,364 | |
| | 20,078 | | | CSX Corporation | | | 523,233 | |
| | 2,100 | | | Deluxe Corporation | | | 98,889 | |
| | |
| | 5,570 | | | DigitalGlobe, Inc.d | | | 177,237 | |
| | 2,300 | | | Dover Corporation | | | 211,117 | |
| | 6,471 | | | EMCOR Group, Inc. | | | 239,815 | |
| | 900 | | | EnerSys, Inc. | | | 59,715 | |
| | 500 | | | Esterline Technologies Corporationd | | | 40,080 | |
| | 4,200 | | | Exelis, Inc. | | | 69,258 | |
| | 800 | | | Flowserve Corporation | | | 55,576 | |
| | 1,700 | | | Fluor Corporation | | | 126,174 | |
| | 2,300 | | | Foster Wheeler AGd | | | 62,077 | |
| | 4,410 | | | GATX Corporation | | | 227,336 | |
| | 3,100 | | | General Electric Company | | | 81,034 | |
| | 6,440 | | | HNI Corporation | | | 250,194 | |
| | 11,439 | | | Honeywell International, Inc. | | | 992,104 | |
| | 800 | | | Huntington Ingalls Industries, Inc. | | | 57,240 | |
| | 900 | | | IHS, Inc.d | | | 98,145 | |
| | 9,700 | | | Ingersoll-Rand plc | | | 655,041 | |
| | 16,600 | | | Jacobs Engineering Group, Inc.d | | | 1,009,612 | |
| | 4,000 | | | KBR, Inc. | | | 138,160 | |
| | 851 | | | Korn/Ferry Internationald | | | 20,254 | |
| | 3,570 | | | Landstar System, Inc. | | | 197,385 | |
| | 400 | | | Lindsay Manufacturing Company | | | 30,404 | |
| | 800 | | | Lockheed Martin Corporation | | | 106,672 | |
| | 2,493 | | | Manitowoc Company, Inc. | | | 48,514 | |
| | 5,080 | | | Manpower, Inc. | | | 396,748 | |
| | 1,200 | | | Matson, Inc. | | | 32,508 | |
| | 2,400 | | | MRC Global, Inc.d | | | 67,080 | |
| | 1,200 | | | Old Dominion Freight Line, Inc.d | | | 56,280 | |
| | 5,604 | | | Oshkosh Corporationd | | | 266,694 | |
| | 477 | | | Parker Hannifin Corporation | | | 55,675 | |
| | 4,370 | | | Pentair, Ltd. | | | 293,183 | |
| | 2,400 | | | Quanta Services, Inc.d | | | 72,504 | |
| | 4,400 | | | Republic Airways Holdings, Inc.d | | | 51,832 | |
| | 300 | | | Rockwell Automation, Inc. | | | 33,123 | |
| | 4,900 | | | Southwest Airlines Company | | | 84,378 | |
| | 3,300 | | | Spirit Airlines, Inc.d | | | 142,395 | |
| | 1,850 | | | Tennant Company | | | 112,277 | |
| | 3,700 | | | Union Pacific Corporation | | | 560,180 | |
| | 3,000 | | | United Rentals, Inc.d | | | 193,770 | |
| | 1,025 | | | United Stationers, Inc. | | | 45,551 | |
| | 600 | | | United Technologies Corporation | | | 63,750 | |
| | 3,400 | | | Wabash National Corporationd | | | 39,644 | |
| | | | | |
| | | | Total | | | 10,149,791 | |
| | | | | |
| |
| Information Technology (2.1%) | | | | |
| | 5,600 | | | Accenture plc | | | 411,600 | |
| | 6,900 | | | Activision Blizzard, Inc. | | | 114,816 | |
| | 700 | | | Alliance Data Systems Corporationd | | | 165,942 | |
| | 2,500 | | | Ambarella, Inc.d | | | 51,375 | |
| | 2,600 | | | Amdocs, Ltd. | | | 99,970 | |
The accompanying Notes to Financial Statements are an integral part of this schedule.
121
Moderately Conservative Allocation Fund
Schedule of Investments as of October 31, 2013
| | | | | | | | |
| Shares | | | Common Stock (12.2%) | | Value | |
| Information Technology (2.1%) - continued | | | | |
| | 2,667 | | | Apple, Inc. | | | $1,393,108 | |
| | 5,932 | | | Applied Materials, Inc. | | | 105,886 | |
| | 3,000 | | | Arris Group, Inc.d | | | 53,580 | |
| | 600 | | | Aspen Technology, Inc.d | | | 22,938 | |
| | 31,550 | | | Atmel Corporationd | | | 229,684 | |
| | 1,400 | | | Autodesk, Inc.d | | | 55,874 | |
| | 2,600 | | | Avnet, Inc. | | | 103,220 | |
| | 14,600 | | | Brocade Communications Systems, Inc.d | | | 117,092 | |
| | 44,170 | | | Cisco Systems, Inc. | | | 993,825 | |
| | 3,786 | | | Citrix Systems, Inc.d | | | 214,969 | |
| | 500 | | | CommVault Systems, Inc.d | | | 39,040 | |
| | 7,977 | | | CoreLogic, Inc.d | | | 265,395 | |
| | 1,932 | | | DST Systems, Inc. | | | 163,776 | |
| | 4,512 | | | E2open, Inc.d | | | 101,520 | |
| | 875 | | | eBay, Inc.d | | | 46,121 | |
| | 1,100 | | | Ellie Mae, Inc.d | | | 31,790 | |
| | 13,100 | | | EMC Corporation | | | 315,317 | |
| | 16,400 | | | Facebook, Inc.d | | | 824,264 | |
| | 3,700 | | | Fairchild Semiconductor International, Inc.d | | | 46,879 | |
| | 600 | | | FEI Company | | | 53,448 | |
| | 1,300 | | | Fleetmatics Group plcd | | | 41,275 | |
| | 1,000 | | | FLIR Systems, Inc. | | | 28,480 | |
| | 1,500 | | | Gartner, Inc.d | | | 88,425 | |
| | 1,352 | | | Google, Inc.d | | | 1,393,344 | |
| | 2,710 | | | Guidewire Software, Inc.d | | | 137,451 | |
| | 5,460 | | | Informatica Corporationd | | | 210,756 | |
| | 3,300 | | | InterDigital, Inc. | | | 127,875 | |
| | 1,100 | | | International Business Machines Corporation | | | 197,131 | |
| | 2,400 | | | InvenSense, Inc.d | | | 40,536 | |
| | 1,900 | | | Ixiad | | | 26,942 | |
| | 2,300 | | | j2 Global, Inc. | | | 126,454 | |
| | 2,804 | | | Juniper Networks, Inc.d | | | 52,267 | |
| | 475 | | | Leidos Holdings, Inc. | | | 22,368 | |
| | 1,068 | | | Lexmark International, Inc. | | | 37,967 | |
| | 10,400 | | | Marvell Technology Group, Ltd. | | | 124,800 | |
| | 11,360 | | | Microsoft Corporation | | | 401,576 | |
| | 8,000 | | | Monster Worldwide, Inc.d | | | 34,560 | |
| | 18,420 | | | NetApp, Inc. | | | 714,880 | |
| | 1,600 | | | NeuStar, Inc.d | | | 73,472 | |
| | 7,352 | | | NVIDIA Corporation | | | 111,603 | |
| | 2,500 | | | OmniVision Technologies, Inc.d | | | 35,025 | |
| | 3,324 | | | Plantronics, Inc. | | | 142,733 | |
| | 8,800 | | | QUALCOMM, Inc. | | | 611,336 | |
| | 3,900 | | | Red Hat, Inc.d | | | 168,753 | |
| | 1,241 | | | Salesforce.com, Inc.d | | | 66,220 | |
| | 1,300 | | | Sanmina Corporationd | | | 18,928 | |
| | 3,800 | | | SunPower Corporationd | | | 114,722 | |
| | 30,780 | | | Symantec Corporation | | | 699,937 | |
| | 5,600 | | | Teradata Corporationd | | | 246,792 | |
| | 11,110 | | | Teradyne, Inc.d | | | 194,314 | |
| | 21,940 | | | Texas Instruments, Inc. | | | 923,235 | |
| | 3,100 | | | Trimble Navigation, Ltd.d | | | 88,567 | |
| | 5,671 | | | TriQuint Semiconductor, Inc.d | | | 44,971 | |
| | 2,950 | | | Ubiquiti Networks, Inc. | | | 113,811 | |
| | 4,630 | | | Virtusa Corporationd | | | 143,900 | |
| | 10,540 | | | Vishay Intertechnology, Inc.d | | | 129,326 | |
| | 7,350 | | | VMware, Inc.d | | | 597,408 | |
| | 10 | | | Workday, Inc.d | | | 749 | |
| | 18,100 | | | Xerox Corporation | | | 179,914 | |
| | 11,046 | | | Xilinx, Inc. | | | 501,709 | |
| | | | | |
| | | | Total | | | 15,035,941 | |
| | | | | |
| |
| Materials (0.4%) | | | | |
| | 600 | | | AEP Industries, Inc.d | | | 35,652 | |
| | 6,530 | | | Celanese Corporation | | | 365,745 | |
| | 700 | | | CF Industries Holdings, Inc. | | | 150,920 | |
| | 6,870 | | | Dow Chemical Company | | | 271,159 | |
| | 2,030 | | | Eagle Materials, Inc. | | | 152,270 | |
| | 1,300 | | | Eastman Chemical Company | | | 102,427 | |
| | 5,350 | | | H.B. Fuller Company | | | 256,104 | |
| | 643 | | | Innophos Holdings, Inc. | | | 32,227 | |
| | 8,400 | | | Louisiana-Pacific Corporationd | | | 142,884 | |
| | 4,880 | | | Materials Select Sector SPDR Fund | | | 213,598 | |
| | 5,110 | | | Nucor Corporation | | | 264,545 | |
| | 1,700 | | | Owens-Illinois, Inc.d | | | 54,043 | |
| | 1,800 | | | Packaging Corporation of America | | | 112,104 | |
| | 1,100 | | | PPG Industries, Inc. | | | 200,838 | |
| | 800 | | | Schweitzer-Mauduit International, Inc. | | | 49,504 | |
| | 1,300 | | | Sigma-Aldrich Corporation | | | 112,359 | |
| | 1,448 | | | Silgan Holdings, Inc. | | | 65,261 | |
| | 2,181 | | | Southern Copper Corporation | | | 60,959 | |
| | 5,115 | | | Steel Dynamics, Inc. | | | 91,917 | |
| | 4,600 | | | Stillwater Mining Companyd | | | 50,186 | |
| | 4,700 | | | Teck Resources, Ltd. | | | 125,678 | |
| | 900 | | | U.S. Silica Holdings, Inc. | | | 31,338 | |
| | 1,600 | | | Valspar Corporation | | | 111,952 | |
| | 1,000 | | | Worthington Industries, Inc. | | | 40,540 | |
| | | | | |
| | | | Total | | | 3,094,210 | |
| | | | | |
| |
| Telecommunications Services (0.1%) | | | | |
| | 9,300 | | | AT&T, Inc. | | | 336,660 | |
| | 1,724 | | | Cogent Communications Group, Inc. | | | 60,564 | |
| | 8,563 | | | Verizon Communications, Inc. | | | 432,517 | |
| | | | | |
| | | | Total | | | 829,741 | |
| | | | | |
| |
| Utilities (0.3%) | | | | |
| | 1,200 | | | Calpine Corporationd | | | 24,204 | |
| | 2,900 | | | CMS Energy Corporation | | | 79,634 | |
| | 16,170 | | | NiSource, Inc. | | | 509,678 | |
| | 3,230 | | | NorthWestern Corporation | | | 148,063 | |
| | 14,980 | | | PG&E Corporation | | | 626,913 | |
| | 6,180 | | | PNM Resources, Inc. | | | 147,826 | |
| | 1,400 | | | Public Service Enterprise Group, Inc. | | | 46,900 | |
| | 3,400 | | | Southern Company | | | 139,094 | |
| | 3,192 | | | Southwest Gas Corporation | | | 173,198 | |
| | 5,500 | | | Wisconsin Energy Corporation | | | 231,605 | |
| | | | | |
| | | | Total | | | 2,127,115 | |
| | | | | |
| | | | | | | | |
| | | | | |
| | | | Total Common Stock (cost $72,697,166) | | | 89,716,167 | |
| | | | | |
| | |
| Shares | | | Collateral Held for Securities Loaned (0.4%) | | Value | |
| | 3,018,707 | | | Thrivent Cash Management Trust | | | 3,018,707 | |
| | | | | |
| | | | Total Collateral Held for Securities Loaned (cost $3,018,707) | | | 3,018,707 | |
| | | | | |
The accompanying Notes to Financial Statements are an integral part of this schedule.
122
Moderately Conservative Allocation Fund
Schedule of Investments as of October 31, 2013
| | | | | | | | |
Shares or
Principal
Amount | | | Short-Term Investments (13.6%) | | Value | |
| | | | Fairway Finance, LLC | | | | |
| | 2,000,000 | | | 0.140%, 12/9/2013e,k | | | $1,999,704 | |
| | | | Federal Home Loan Bank Discount Notes | | | | |
| | 2,000,000 | | | 0.040%, 11/6/2013k | | | 1,999,989 | |
| | 12,100,000 | | | 0.070%, 11/20/2013k | | | 12,099,553 | |
| | 1,800,000 | | | 0.093%, 11/22/2013k,l | | | 1,799,902 | |
| | 2,000,000 | | | 0.025%, 11/27/2013k | | | 1,999,964 | |
| | 8,300,000 | | | 0.035%, 12/4/2013k,l | | | 8,299,735 | |
| | 2,000,000 | | | 0.160%, 12/11/2013k | | | 1,999,644 | |
| | 24,000,000 | | | 0.025%, 12/18/2013k | | | 23,999,217 | |
| | 9,000,000 | | | 0.050%, 12/26/2013k | | | 8,999,313 | |
| | 7,000,000 | | | 0.045%, 1/3/2014k | | | 6,999,449 | |
| | 2,000,000 | | | 0.040%, 1/6/2014k | | | 1,999,853 | |
| | 21,000,000 | | | 0.040%, 1/22/2014k | | | 20,998,087 | |
| | | | Federal National Mortgage Association Discount Notes | | | | |
| | 2,200,000 | | | 0.100%, 12/4/2013k,l | | | 2,199,798 | |
| | | | U.S. Treasury Bills | | | | |
| | 3,900,000 | | | 0.062%, 12/26/2013k,m | | | 3,899,630 | |
| | | | | |
| | | | Total Short-Term Investments (at amortized cost) | | | 99,293,838 | |
| | | | | |
| | | | Total Investments (cost $713,550,036) 106.9% | | | $783,596,302 | |
| | | | | |
| | | | Other Assets and Liabilities, Net (6.9%) | | | (50,658,347 | ) |
| | | | | |
| | | | Total Net Assets 100.0% | | | $732,937,955 | |
| | | | | |
a | The stated interest rate represents the weighted average of all contracts within the bank loan facility. |
b | All or a portion of the loan is unfunded. |
c | Denotes investments purchased on a when-issued or delayed delivery basis. |
d | Non-income producing security. |
e | Denotes securities sold under Rule 144A of the Securities Act of 1933, which exempts them from registration. These securities have been deemed liquid and may be resold to other dealers in the program or to other qualified institutional buyers. As of October 31, 2013, the value of these investments was $26,884,684 or 3.7% of total net assets. |
f | Denotes variable rate securities. Variable rate securities are securities whose yields vary with a designated market index or market rate. The rate shown is as of October 31, 2013. |
g | Denotes restricted securities. Restricted securities are investment securities which have been deemed illiquid and cannot be offered for public sale without first being registered under the Securities Act of 1933. The following table indicates the acquisition date and cost of restricted securities Moderately Conservative Allocation Fund owned as of October 31, 2013. |
| | | | | | | | |
Security | | Acquisition
Date | | | Cost | |
CoBank ACB | | | 10/18/2013 | | | | $73,579 | |
Edlinc Student Loan Funding Trust | | | 2/28/2013 | | | | 316,050 | |
FNA Trust | | | 4/29/2013 | | | | 346,686 | |
h | All or a portion of the security is on loan. |
i | Denotes interest only security. Interest only securities represent the right to receive monthly interest payments on an underlying pool of mortgages or assets. The principal shown is the outstanding par amount of the pool as of the end of the period. The actual effective yield of the security is different than the stated coupon rate. |
j | Denotes perpetual securities. Perpetual securities pay an indefinite stream of interest, but may be called by the issuer at an earlier date. |
k | The interest rate shown reflects the yield, coupon rate or the discount rate at the date of purchase. |
l | At October 31, 2013, $3,499,757 of investments were held on deposit with the counterparty and pledged as the initial margin deposit for open futures contracts. |
m | At October 31, 2013, $599,943 of investments were pledged as collateral with the custodian under the agreement between the counterparty, the custodian and the fund for open swap contracts. |
Definitions:
| | |
| ADR | | - American Depositary Receipt, which are certificates for an underlying foreign security’s shares held by an issuing U.S. depository bank. |
| AMT | | - Subject to Alternative Minimum Tax |
| Auth. | | - Authority |
| ETF | | - Exchange Traded Fund. |
| G.O. | | - General Obligation |
| REIT | | - Real Estate Investment Trust is a company that buys, develops, manages and/or sells real estate assets. |
| Rev. | | - Revenue |
| Ser. | | - Series |
| TIPS | | - Treasury Inflation Protected Security. |
| | | | |
Unrealized Appreciation (Depreciation) | | | | |
Gross unrealized appreciation and depreciation of investments, based on cost for federal income tax purposes, were as follows: | | | | |
Gross unrealized appreciation | | | $68,069,170 | |
Gross unrealized depreciation | | | (1,850,806 | ) |
| | | | |
Net unrealized appreciation (depreciation) | | | $66,218,364 | |
| |
Cost for federal income tax purposes | | | $717,377,938 | |
The accompanying Notes to Financial Statements are an integral part of this schedule.
123
Moderately Conservative Allocation Fund
Schedule of Investments as of October 31, 2013
Fair Valuation Measurements
The following table is a summary of the inputs used, as of October 31, 2013, in valuing Moderately Conservative Allocation Fund’s assets carried at fair value.
| | | | | | | | | | | | | | | | |
Investments in Securities | | Total | | | Level 1 | | | Level 2 | | | Level 3 | |
| | | | |
Bank Loans | | | | | | | | | | | | | | | | |
Basic Materials | | | 2,836,078 | | | | – | | | | 2,836,078 | | | | – | |
Capital Goods | | | 1,474,916 | | | | – | | | | 1,474,916 | | | | – | |
Communications Services | | | 11,551,542 | | | | – | | | | 11,551,542 | | | | – | |
Consumer Cyclical | | | 3,991,478 | | | | – | | | | 3,991,478 | | | | – | |
Consumer Non-Cyclical | | | 4,355,235 | | | | – | | | | 4,355,235 | | | | – | |
Energy | | | 2,112,544 | | | | – | | | | 2,112,544 | | | | – | |
Financials | | | 1,154,716 | | | | – | | | | 1,154,716 | | | | – | |
Technology | | | 2,211,604 | | | | – | | | | 2,211,604 | | | | – | |
Transportation | | | 1,225,857 | | | | – | | | | 1,225,857 | | | | – | |
Utilities | | | 1,286,644 | | | | – | | | | 1,286,644 | | | | – | |
| | | | |
Mutual Funds | | | | | | | | | | | | | | | | |
Equity Mutual Funds | | | 157,279,120 | | | | 157,279,120 | | | | – | | | | – | |
Fixed Income Mutual Funds | | | 192,848,206 | | | | 192,848,206 | | | | – | | | | – | |
| | | | |
Long-Term Fixed Income | | | | | | | | | | | | | | | | |
Asset-Backed Securities | | | 13,912,153 | | | | – | | | | 13,257,978 | | | | 654,175 | |
Basic Materials | | | 3,276,161 | | | | – | | | | 3,276,161 | | | | – | |
Capital Goods | | | 1,989,238 | | | | – | | | | 1,989,238 | | | | – | |
Collateralized Mortgage Obligations | | | 10,932,671 | | | | – | | | | 10,932,671 | | | | – | |
Commercial Mortgage-Backed Securities | | | 14,797,589 | | | | – | | | | 14,797,589 | | | | – | |
Communications Services | | | 7,155,341 | | | | – | | | | 7,155,341 | | | | – | |
Consumer Cyclical | | | 5,974,741 | | | | – | | | | 5,974,741 | | | | – | |
Consumer Non-Cyclical | | | 8,292,381 | | | | – | | | | 8,292,381 | | | | – | |
Energy | | | 4,764,121 | | | | – | | | | 4,764,121 | | | | – | |
Financials | | | 25,648,806 | | | | – | | | | 25,575,606 | | | | 73,200 | |
Foreign Government | | | 2,305,292 | | | | – | | | | 2,305,292 | | | | – | |
Mortgage-Backed Securities | | | 60,666,937 | | | | – | | | | 60,666,937 | | | | – | |
Technology | | | 2,400,789 | | | | – | | | | 2,400,789 | | | | – | |
Transportation | | | 2,014,846 | | | | – | | | | 2,014,846 | | | | – | |
U.S. Government and Agencies | | | 19,248,441 | | | | – | | | | 19,248,441 | | | | – | |
U.S. Municipals | | | 21,102,642 | | | | – | | | | 21,102,642 | | | | – | |
Utilities | | | 4,757,501 | | | | – | | | | 4,757,501 | | | | – | |
| | | | |
Common Stock | | | | | | | | | | | | | | | | |
Consumer Discretionary | | | 13,444,940 | | | | 13,444,940 | | | | – | | | | – | |
Consumer Staples | | | 5,296,543 | | | | 4,964,497 | | | | 332,046 | | | | – | |
Energy | | | 8,288,538 | | | | 8,288,538 | | | | – | | | | – | |
Financials | | | 21,139,728 | | | | 21,139,728 | | | | – | | | | – | |
Health Care | | | 10,309,620 | | | | 10,309,620 | | | | – | | | | – | |
Industrials | | | 10,149,791 | | | | 10,149,791 | | | | – | | | | – | |
Information Technology | | | 15,035,941 | | | | 15,035,941 | | | | – | | | | – | |
Materials | | | 3,094,210 | | | | 3,094,210 | | | | – | | | | – | |
Telecommunications Services | | | 829,741 | | | | 829,741 | | | | – | | | | – | |
Utilities | | | 2,127,115 | | | | 2,127,115 | | | | – | | | | – | |
Collateral Held for Securities Loaned | | | 3,018,707 | | | | 3,018,707 | | | | – | | | | – | |
Short-Term Investments | | | 99,293,838 | | | | – | | | | 99,293,838 | | | | – | |
| |
Total | | | $783,596,302 | | | | $442,530,154 | | | | $340,338,773 | | | | $727,375 | |
| |
The accompanying Notes to Financial Statements are an integral part of this schedule.
124
Moderately Conservative Allocation Fund
Schedule of Investments as of October 31, 2013
| | | | | | | | | | | | | | | | |
Other Financial Instruments | | Total | | | Level 1 | | | Level 2 | | | Level 3 | |
| | | | |
Asset Derivatives | | | | | | | | | | | | | | | | |
Futures Contracts | | | 3,228,173 | | | | 1,347,045 | | | | 1,881,128 | | | | – | |
Credit Default Swaps | | | 26,448 | | | | – | | | | 26,448 | | | | – | |
| |
Total Asset Derivatives | | | $3,254,621 | | | | $1,347,045 | | | | $1,907,576 | | | | $– | |
| |
| | | | |
Liability Derivatives | | | | | | | | | | | | | | | | |
Futures Contracts | | | 670,853 | | | | 670,853 | | | | – | | | | – | |
| |
Total Liability Derivatives | | | $670,853 | | | | $670,853 | | | | $– | | | | $– | |
| |
There were no significant transfers between Levels during the period ended October 31, 2013. Transfers between Levels are identified as of the end of the period.
| | | | | | | | | | | | | | | | | | | | |
Futures Contracts | | Number of
Contracts
Long/(Short) | | | Expiration
Date | | | Notional
Principal
Amount | | | Value | | | Unrealized
Gain/(Loss) | |
2-Yr. U.S. Treasury Bond Futures | | | (80 | ) | | | December 2013 | | | | ($17,574,756 | ) | | | ($17,633,751 | ) | | | ($58,995 | ) |
5-Yr. U.S. Treasury Bond Futures | | | (75 | ) | | | December 2013 | | | | (8,967,545 | ) | | | (9,126,563 | ) | | | (159,018 | ) |
30-Yr. U.S. Treasury Bond Futures | | | 185 | | | | December 2013 | | | | 24,297,713 | | | | 24,940,312 | | | | 642,599 | |
Eurex EURO STOXX 50 Futures | | | 662 | | | | December 2013 | | | | 25,596,218 | | | | 27,477,346 | | | | 1,881,128 | |
Mini MSCI EAFE Index Futures | | | 49 | | | | December 2013 | | | | 4,367,364 | | | | 4,594,485 | | | | 227,121 | |
Russell 2000 Index Mini-Futures | | | 8 | | | | December 2013 | | | | 837,018 | | | | 878,240 | | | | 41,222 | |
S&P 400 Index Mini-Futures | | | (75 | ) | | | December 2013 | | | | (9,195,160 | ) | | | (9,648,000 | ) | | | (452,840 | ) |
S&P 500 Index Futures | | | 24 | | | | December 2013 | | | | 10,069,897 | | | | 10,506,000 | | | | 436,103 | |
Total Futures Contracts | | | | | | | | | | | | | | | | | | | $2,557,320 | |
| | | | | | | | | | | | | | | | | | |
Credit Default Swaps and Counterparty | | Buy/Sell Protection1 | | Termination
Date | | | Notional
Principal
Amount2 | | | Value3 | | | Unrealized
Gain/(Loss) | |
CDX HY 21, 5 Year, at 5.00%; Bank of America | | Buy | | | 12/20/2018 | | | | $7,000,000 | | | | $13,188 | | | | $13,188 | |
CDX HY 21, 5 Year, at 5.00%; JP Morgan | | Buy | | | 12/20/2018 | | | | 6,997,000 | | | | 13,260 | | | | 13,260 | |
Total Credit Default Swaps | | | | | | | | | | | | | $26,448 | | | | $26,448 | |
1 | As the buyer of protection, Moderately Conservative Allocation Fund pays periodic fees in return for payment by the seller which is contingent upon an adverse credit event occurring in the underlying issuer or reference entity. As the seller of protection, Moderately Conservative Allocation Fund collects periodic fees from the buyer and profits if the credit of the underlying issuer or reference entity remains stable or improves while the swap is outstanding, but the seller in a credit default swap contract would be required to pay the amount of credit loss, determined as specified in the agreement, to the buyer in the event of an adverse credit event in the reference entity. |
2 | The maximum potential amount of future payments Moderately Conservative Allocation Fund could be required to make as the seller or receive as the buyer of protection. |
3 | The values for credit indexes (CDX or LCDX) serve as an indicator of the current status of the payment/performance risk and represent the liability or profit for the credit default swap contract had the contract been closed as of the reporting date. When protection has been sold, the value of the swap will increase when the swap spread declines representing an improvement in the reference entity’s credit worthiness. The value of the swap will decrease when the swap spread increases representing a deterioration in the reference entity’s credit worthiness. When protection has been purchased, the value of the swap will increase when the swap spread increases representing a deterioration in the reference entity’s credit worthiness. The value of the swap will decrease when the swap spread declines representing an improvement in the reference entity’s credit worthiness. |
The accompanying Notes to Financial Statements are an integral part of this schedule.
125
Moderately Conservative Allocation Fund
Schedule of Investments as of October 31, 2013
The following table summarizes the fair value and Statement of Assets and Liabilities location, as of October 31, 2013, for Moderately Conservative Allocation Fund’s investments in financial derivative instruments by primary risk exposure as discussed under item (2) Significant Accounting Policies of the Notes to Financial Statements.
| | | | | | |
Derivatives by risk category | | Statement of Assets and Liabilities Location | | Fair Value | |
| | |
Asset Derivatives | | | | | | |
| | |
Interest Rate Contracts | | | | | | |
Futures* | | Net Assets - Net unrealized appreciation/(depreciation) on Futures contracts | | | $642,599 | |
Total Interest Rate Contracts | | | 642,599 | |
| | |
Equity Contracts | | | | | | |
Futures* | | Net Assets - Net unrealized appreciation/(depreciation) on Futures contracts | | | 2,585,574 | |
Total Equity Contracts | | | | | 2,585,574 | |
| | |
Credit Contracts | | | | | | |
Credit Default Swaps | | Receivable/Payable - Swap agreements, at value; Net Assets - Net unrealized appreciation/(depreciation) on Swap agreements | | | 26,448 | |
Total Credit Contracts | | | | | 26,448 | |
| |
Total Asset Derivatives | | | | | $3,254,621 | |
| |
| | |
Liability Derivatives | | | | | | |
| | |
Interest Rate Contracts | | | | | | |
Futures* | | Net Assets - Net unrealized appreciation/(depreciation) on Futures contracts | | | 218,013 | |
Total Interest Rate Contracts | | | 218,013 | |
| | |
Equity Contracts | | | | | | |
Futures* | | Net Assets - Net unrealized appreciation/(depreciation) on Futures contracts | | | 452,840 | |
Total Equity Contracts | | | | | 452,840 | |
| |
Total Liability Derivatives | | | | | $670,853 | |
| |
* | Includes cumulative appreciation/depreciation of futures contracts as reported in the Schedule of Investments. Only current day’s variation margin is reported within the Statement of Assets and Liabilities. |
The following table summarizes the net realized gains/(losses) and Statement of Operations location, for the period ended October 31, 2013, for Moderately Conservative Allocation Fund’s investments in financial derivative instruments by primary risk exposure.
| | | | | | |
Derivatives by risk category | | Statement of Operations Location | | Realized Gains/(Losses)
recognized in Income | |
Interest Rate Contracts | | | | | | |
Futures | | Net realized gains/(losses) on Futures contracts | | | (3,031,459 | ) |
Total Interest Rate Contracts | | | (3,031,459 | ) |
| | |
Equity Contracts | | | | | | |
Options Written | | Net realized gains/(losses) on Written option contracts | | | 35,127 | |
Futures | | Net realized gains/(losses) on Futures contracts | | | 3,831,297 | |
Total Equity Contracts | | | | | 3,866,424 | |
| | |
Foreign Exchange Contracts | | | | | | |
Forward Contracts | | Net realized gains/(losses) on Foreign currency transactions | | | (28,845 | ) |
Total Foreign Exchange Contracts | | | (28,845 | ) |
| | |
Credit Contracts | | | | | | |
Credit Default Swaps | | Net realized gains/(losses) on Swap agreements | | | (731,065 | ) |
Total Credit Contracts | | | | | (731,065 | ) |
| |
Total | | | | | $75,055 | |
| |
The accompanying Notes to Financial Statements are an integral part of this schedule.
126
Moderately Conservative Allocation Fund
Schedule of Investments as of October 31, 2013
The following table summarizes the change in net unrealized appreciation/(depreciation) and Statement of Operations location, for the period ended October 31, 2013, for Moderately Conservative Allocation Fund’s investments in financial derivative instruments by primary risk exposure.
| | | | | | |
Derivatives by risk category | | Statement of Operations Location | | Change in unrealized
appreciation/(depreciation)
recognized in Income | |
| | |
Interest Rate Contracts | | | | | | |
Futures | | Change in net unrealized appreciation/(depreciation) on Futures contracts | | | 460,661 | |
Total Interest Rate Contracts | | | 460,661 | |
| | |
Equity Contracts | | | | | | |
Futures | | Change in net unrealized appreciation/(depreciation) on Futures contracts | | | 2,411,444 | |
Total Equity Contracts | | | 2,411,444 | |
| | |
Credit Contracts | | | | | | |
Credit Default Swaps | | Change in net unrealized appreciation/(depreciation) on Swap agreements | | | 26,448 | |
Total Credit Contracts | | | 26,448 | |
| | |
Foreign Exchange Contracts | | | | | | |
Forward Contracts | | Change in net unrealized appreciation/(depreciation) on Foreign currency forward contracts | | | 21 | |
Total Foreign Exchange Contracts | | | 21 | |
| |
Total | | | | | $2,898,574 | |
| |
The following table presents Moderately Conservative Allocation Fund’s average volume of derivative activity during the period ended October 31, 2013.
| | | | | | | | | | | | | | | | | | | | | | | | | | | | |
Derivative Risk Category | | Futures (Notional)* | | | Futures (Percentage of Average Net Assets) | | | Forwards (Notional)* | | | Forwards (Percentage of Average Net Assets) | | | Swaps (Notional)* | | | Swaps (Percentage of Average Net Assets) | | | Options
(Contracts) | |
Equity Contracts | | | $53,935,247 | | | | 7.7 | % | | | N/A | | | | N/A | | | | N/A | | | | N/A | | | | 1 | |
Interest Rate Contracts | | | 58,655,037 | | | | 8.4 | | | | N/A | | | | N/A | | | | N/A | | | | N/A | | | | N/A | |
Foreign Exchange Contracts | | | N/A | | | | N/A | | | | $1,316 | | | | <0.1 | % | | | N/A | | | | N/A | | | | N/A | |
Credit Contracts | | | N/A | | | | N/A | | | | N/A | | | | N/A | | | | $7,090,198 | | | | 1.0 | % | | | N/A | |
* | Notional amount represents long or short, or both, derivative positions held by the Fund. |
The accompanying Notes to Financial Statements are an integral part of this schedule.
127
Moderately Conservative Allocation Fund
Schedule of Investments as of October 31, 2013
Investment in Affiliates
Affiliated issuers, as defined under the Investment Company Act of 1940, include those in which the Fund’s holdings of an issuer represent 5% or more of the outstanding voting securities of an issuer, or any affiliated mutual fund.
A summary of transactions for the fiscal year to date, in Moderately Conservative Allocation Fund, is as follows:
| | | | | | | | | | | | | | | | | | | | | | | | |
Fund | | Value October 31, 2012 | | | Gross Purchases | | | Gross Sales | | | Shares Held at
October 31, 2013 | | | Value October 31, 2013 | | | Income Earned
November 1, 2012 -
October 31, 2013 | |
Growth and Income Plus^, ^^ | | | $4,580,526 | | | | $91,184 | | | | $5,333,082 | | | | – | | | | $– | | | | $91,184 | |
Natural Resources | | | 10,774,267 | | | | 98,908 | | | | – | | | | 1,208,229 | | | | 12,408,513 | | | | 98,908 | |
Partner Small Cap Value | | | 10,519,404 | | | | 421,807 | | | | 6,000,000 | | | | 359,189 | | | | 7,794,407 | | | | 243,215 | |
Small Cap Stock | | | 2,700,338 | | | | – | | | | – | | | | 167,827 | | | | 3,521,013 | | | | – | |
Partner Mid Cap Value | | | 14,034,157 | | | | 458,574 | | | | – | | | | 1,127,070 | | | | 18,405,047 | | | | 158,466 | |
Mid Cap Stock | | | 7,087,492 | | | | 31,478 | | | | – | | | | 428,044 | | | | 9,455,498 | | | | 31,478 | |
Partner Worldwide Allocation | | | 38,618,651 | | | | 933,130 | | | | – | | | | 4,497,042 | | | | 46,589,353 | | | | 933,130 | |
Large Cap Growth | | | 14,211,821 | | | | 93,591 | | | | 1,000,000 | | | | 2,262,092 | | | | 17,305,001 | | | | 93,591 | |
Large Cap Value | | | 35,218,971 | | | | 739,718 | | | | 4,000,000 | | | | 2,184,223 | | | | 40,910,501 | | | | 739,718 | |
Large Cap Stock | | | 711,277 | | | | 49,630 | | | | – | | | | 32,064 | | | | 889,787 | | | | 11,326 | |
High Yield | | | 24,865,728 | | | | 1,588,973 | | | | 1,606,798 | | | | 4,959,061 | | | | 25,291,209 | | | | 1,588,977 | |
Income | | | 77,051,939 | | | | 2,681,286 | | | | 11,677,674 | | | | 7,247,218 | | | | 65,804,736 | | | | 2,681,353 | |
Government Bond | | | 12,284,114 | | | | 587,384 | | | | 642,719 | | | | 1,135,354 | | | | 11,376,247 | | | | 129,376 | |
Limited Maturity Bond | | | 111,436,908 | | | | 1,414,539 | | | | 21,762,145 | | | | 7,212,770 | | | | 90,376,014 | | | | 1,415,085 | |
Cash Management Trust-Collateral Investment | | | 2,059,172 | | | | 10,382,106 | | | | 9,422,571 | | | | 3,018,707 | | | | 3,018,707 | | | | 5,901 | |
Cash Management Trust-Short Term Investment | | | 65,969,481 | | | | 146,671,824 | | | | 212,641,305 | | | | – | | | | – | | | | 62,497 | |
Total Value and Income Earned | | | 432,124,246 | | | | | | | | | | | | | | | | 353,146,033 | | | | 8,284,205 | |
^ | Prior to August 16, 2013, the Growth and Income Plus Fund was known as the Equity Income Plus Fund. |
^^ | On August 6, 2013, the Thrivent Asset Allocation Funds, as the shareholders of the Thrivent Growth and Income Plus Fund, redeemed their shares in-kind. The Growth and Income Plus Fund distributed fund securities rather than cash as payment for the redemption of these fund shares. These in-kind transactions were conducted at market value. |
The accompanying Notes to Financial Statements are an integral part of this schedule.
128
Balanced Income Plus Fund
Schedule of Investments as of October 31, 2013
| | | | | | | | |
Principal Amount | | | Bank Loans (15.6%)a | | Value | |
| Basic Materials (0.9%) | | | | |
| | | | FMG Resources August 2006 Pty., Ltd., Term Loan | | | | |
| | $633,400 | | | 5.250%, 10/18/2017 | | | $634,313 | |
| | | | HCA, Inc., Term Loan | | | | |
| | 440,000 | | | 2.998%, 3/31/2017 | | | 440,550 | |
| | | | Ineos Group Holdings, Ltd., Term Loan | | | | |
| | 573,468 | | | 4.000%, 5/4/2018b,c | | | 575,119 | |
| | | | MRC Global, Inc., Term Loan | | | | |
| | 438,892 | | | 6.000%, 11/8/2019 | | | 441,191 | |
| | | | | |
| | | | Total | | | 2,091,173 | |
| | | | | |
| |
| Capital Goods (0.9%) | | | | |
| | | | ADS Waste Holdings, Term Loan | | | | |
| | 533,332 | | | 4.250%, 10/9/2019 | | | 536,094 | |
| | | | Berry Plastics Group, Inc., Term Loan | | | | |
| | 503,572 | | | 3.500%, 2/8/2020 | | | 501,528 | |
| | | | Rexnord, LLC, Term Loan | | | | |
| | 510,000 | | | 4.000%, 8/21/2020 | | | 510,255 | |
| | | | Silver II Borrower, Term Loan | | | | |
| | 498,744 | | | 4.000%, 12/13/2019 | | | 498,210 | |
| | | | | |
| | | | Total | | | 2,046,087 | |
| | | | | |
| |
| Communications Services (5.5%) | | | | |
| | | | Charter Communications Operating, LLC, Term Loan | | | | |
| | 498,750 | | | 3.000%, 12/31/2020 | | | 493,428 | |
| | | | Cincinnati Bell, Inc., Term Loan | | | | |
| | 425,000 | | | 4.000%, 9/10/2020 | | | 423,007 | |
| | | | Clear Channel Communications, Inc., Term Loan | | | | |
| | 15,192 | | | 3.818%, 1/29/2016 | | | 14,725 | |
| | 519,808 | | | 6.918%, 1/30/2019 | | | 493,886 | |
| | | | Cricket Communications, Inc., Term Loan | | | | |
| | 498,750 | | | 4.750%, 3/8/2020 | | | 500,890 | |
| | | | Cumulus Media Holdings, Inc., Term Loan | | | | |
| | 480,579 | | | 4.500%, 9/17/2018 | | | 483,342 | |
| | | | Fairpoint Communications, Term Loan | | | | |
| | 508,722 | | | 7.500%, 2/14/20109b,c | | | 518,118 | |
| | | | Grande Communications Networks, LLC, Term Loan | | | | |
| | 573,562 | | | 4.500%, 5/29/2020 | | | 571,412 | |
| | | | Hargray Communications Group, Inc., Term Loan | | | | |
| | 493,762 | | | 4.750%, 6/26/2019 | | | 496,641 | |
| | | | Integra Telecom Holdings, Inc., Term Loan | | | | |
| | 543,472 | | | 5.250%, 2/22/2019 | | | 549,358 | |
| | | | Intelsat Jackson Holdings SA, Term Loan | | | | |
| | 502,409 | | | 4.250%, 4/2/2018 | | | 504,815 | |
| | | | Level 3 Communications, Inc., Term Loan | | | | |
| | 490,000 | | | 4.000%, 8/1/2019b,c | | | 492,043 | |
| | | | LTS Buyer, LLC, Term Loan | | | | |
| | 548,625 | | | 4.500%, 4/13/2020 | | | 550,227 | |
| | | | McGraw-Hill Global Education Holdings, LLC, Term Loan | | | | |
| | 558,522 | | | 9.000%, 3/22/2019 | | | 567,950 | |
| | | | NEP Broadcasting, LLC, Term Loan | | | | |
| | 503,407 | | | 4.750%, 1/22/2020 | | | 504,665 | |
| | | | NTelos, Inc., Term Loan | | | | |
| | 299,244 | | | 5.750%, 11/9/2019 | | | 300,367 | |
| | | | Puerto Rico Cable Acquisition Company, Inc., Term Loan | | | | |
| | 580,084 | | | 5.500%, 7/31/2018 | | | 579,359 | |
| | | | TNS, Inc., Term Loan | | | | |
| | 458,783 | | | 5.000%, 2/14/2020 | | | 461,458 | |
| | | | Univision Communications, Inc., Term Loan | | | | |
| | 49,875 | | | 4.500%, 2/28/2020 | | | 50,114 | |
| | 493,597 | | | 4.500%, 3/1/2020 | | | 496,065 | |
| | | | Virgin Media Investment Holdings, Ltd., Term Loan | | | | |
| | 535,000 | | | 3.500%, 6/8/2020 | | | 534,759 | |
| | | | Visant Corporation, Term Loan | | | | |
| | 550,000 | | | 5.250%, 12/22/2016 | | | 539,390 | |
| | | | WideOpenWest Finance, LLC, Term Loan | | | | |
| | 553,447 | | | 4.750%, 4/1/2019 | | | 557,830 | |
| | | | WMG Acquisition Corporation, Term Loan | | | | |
| | 465,000 | | | 3.750%, 7/1/2020 | | | 465,144 | |
| | | | Yankee Cable Acquisition, LLC, Term Loan | | | | |
| | 552,404 | | | 5.250%, 3/1/2020 | | | 554,735 | |
| | | | Zayo Group, LLC, Term Loan | | | | |
| | 553,273 | | | 4.500%, 7/2/2019 | | | 555,696 | |
| | | | | |
| | | | Total | | | 12,259,424 | |
| | | | | |
| |
| Consumer Cyclical (2.7%) | | | | |
| | | | Bally Technologies, Inc., Term Loan | | | | |
| | 575,000 | | | 0.000%, 7/16/2021b,c | | | 576,438 | |
| | | | Booz Allen Hamilton, Inc., Term Loan | | | | |
| | 339,144 | | | 3.750%, 7/31/2019 | | | 338,933 | |
| | | | Burlington Coat Factory Warehouse Corporation, Term Loan | | | | |
| | 490,000 | | | 4.250%, 2/23/2017 | | | 493,214 | |
| | | | Cenveo Corporation, Term Loan | | | | |
| | 511,714 | | | 6.250%, 2/13/2017 | | | 516,192 | |
| | | | Ceridian Corporation, Term Loan | | | | |
| | 510,000 | | | 4.420%, 5/9/2017 | | | 512,422 | |
| | | | Chrysler Group, LLC, Term Loan | | | | |
| | 64,669 | | | 4.250%, 5/24/2017 | | | 65,219 | |
| | | | Hilton Worldwide Finance, LLC, Term Loan | | | | |
| | 700,000 | | | 0.000%, 10/26/2020b,c | | | 703,864 | |
| | | | J.C. Penney Corporation, Inc., Term Loan | | | | |
| | 553,613 | | | 6.000%, 5/22/2018 | | | 535,006 | |
| | | | MGM Resorts International, Term Loan | | | | |
| | 448,869 | | | 3.500%, 12/20/2019 | | | 448,147 | |
| | | | ROC Finance, LLC, Term Loan | | | | |
| | 565,000 | | | 5.000%, 6/20/2019 | | | 552,287 | |
| | | | Scientific Games International, Inc., Term Loan | | | | |
| | 555,000 | | | 4.250%, 10/18/2020b,c | | | 555,000 | |
The accompanying Notes to Financial Statements are an integral part of this schedule.
129
Balanced Income Plus Fund
Schedule of Investments as of October 31, 2013
| | | | | | | | |
Principal
Amount | | | Bank Loans (15.6%)a | | Value | |
| Consumer Cyclical (2.7%) - continued | | | | |
| | | | Seminole Hard Rock Entertainment, Inc., Term Loan | | | | |
| | $29,925 | | | 3.500%, 5/14/2020 | | | $29,757 | |
| | | | Seminole Indian Tribe of Florida, Term Loan | | | | |
| | 357,381 | | | 3.000%, 4/29/2020 | | | 356,413 | |
| | | | Toys R Us, Inc., Term Loan | | | | |
| | 488,713 | | | 5.250%, 5/25/2018 | | | 440,604 | |
| | | | | |
| | | | Total | | | 6,123,496 | |
| | | | | |
| |
| Consumer Non-Cyclical (2.1%) | | | | |
| | | | Albertsons, LLC, Term Loan | | | | |
| | 200,000 | | | 0.000%, 3/21/2019 b,c | | | 200,000 | |
| | 568,422 | | | 4.750%, 3/21/2019 b,c | | | 569,831 | |
| | | | Biomet, Inc., Term Loan | | | | |
| | 399,000 | | | 3.690%, 7/25/2017 | | | 401,578 | |
| | | | CHS/Community Health Systems, Inc., Term Loan | | | | |
| | 500,000 | | | 3.760%, 1/25/2017 | | | 501,250 | |
| | | | Del Monte Corporation, Term Loan | | | | |
| | 449,698 | | | 4.000%, 3/8/2018 | | | 449,698 | |
| | | | DJO Finance, LLC, Term Loan | | | | |
| | 438,894 | | | 4.750%, 9/15/2017 | | | 443,099 | |
| | | | JBS USA, LLC, Term Loan | | | | |
| | 498,744 | | | 3.750%, 5/25/2018 | | | 497,497 | |
| | | | Roundy’s Supermarkets, Inc., Term Loan | | | | |
| | 508,709 | | | 5.750%, 2/13/2019 | | | 502,350 | |
| | | | Supervalu, Inc., Term Loan | | | | |
| | 547,675 | | | 5.000%, 3/21/2019 | | | 550,792 | |
| | | | Van Wagner Communications, LLC, Term Loan | | | | |
| | 447,750 | | | 6.250%, 8/3/2018 | | | 454,278 | |
| | | | | |
| | | | Total | | | 4,570,373 | |
| | | | | |
| |
| Energy (0.5%) | | | | |
| | | | Arch Coal, Inc., Term Loan | | | | |
| | 498,738 | | | 5.750%, 5/16/2018 | | | 483,257 | |
| | | | Offshore Group Investment, Ltd., Term Loan | | | | |
| | 29,850 | | | 5.750%, 3/28/2019 | | | 30,027 | |
| | | | Pacific Drilling SA, Term Loan | | | | |
| | 543,637 | | | 4.500%, 6/3/2018 b,c | | | 545,448 | |
| | | | | |
| | | | Total | | | 1,058,732 | |
| | | | | |
| |
| Financials (0.6%) | | | | |
| | | | Harland Clarke Holdings Corporation, Term Loan | | | | |
| | 541,594 | | | 7.000%, 5/22/2018 | | | 543,354 | |
| | | | Interactive Data Corporation, Term Loan | | | | |
| | 299,337 | | | 3.750%, 2/11/2018 b,c | | | 298,963 | |
| | | | WaveDivision Holdings, LLC, Term Loan | | | | |
| | 563,256 | | | 4.000%, 10/12/2019 | | | 564,664 | |
| | | | | |
| | | | Total | | | 1,406,981 | |
| | | | | |
| |
| Technology (1.0%) | | | | |
| | | | BMC Software, Inc., Term Loan | | | | |
| | 450,000 | | | 5.000%, 9/10/2020 | | | 454,275 | |
| | | | First Data Corporation Extended, Term Loan | | | | |
| | 595,000 | | | 4.170%, 3/23/2018 | | | 595,214 | |
| | | | Freescale Semiconductor, Inc., Term Loan | | | | |
| | 573,397 | | | 5.000%, 3/1/2020 | | | 578,305 | |
| | | | Infor US, Inc., Term Loan | | | | |
| | 498,742 | | | 3.750%, 6/3/2020 b,c | | | 497,186 | |
| | | | SunGard Data Systems, Inc., Term Loan | | | | |
| | 29,850 | | | 4.000%, 3/8/2020 | | | 30,052 | |
| | | | | |
| | | | Total | | | 2,155,032 | |
| | | | | |
| |
| Transportation (0.9%) | | | | |
| | | | American Airlines, Inc., Term Loan | | | | |
| | 942,638 | | | 4.750%, 6/27/2019 | | | 947,549 | |
| | | | American Petroleum Tankers Parent, LLC, Term Loan | | | | |
| | 438,735 | | | 4.750%, 10/2/2019 | | | 438,735 | |
| | | | U.S. Airways, Inc., Term Loan | | | | |
| | 545,000 | | | 4.250%, 5/23/2019 | | | 545,229 | |
| | | | | |
| | | | Total | | | 1,931,513 | |
| | | | | |
| |
| Utilities (0.5%) | | | | |
| | | | Calpine Corporation, Term Loan | | | | |
| | 503,379 | | | 4.000%, 4/1/2018 | | | 505,392 | |
| | | | Intergen NV, Term Loan | | | | |
| | 543,637 | | | 6.447%, 6/15/2020 | | | 542,278 | |
| | | | | |
| | | | Total | | | 1,047,670 | |
| | | | | |
| | | | | | | | |
| | | | | |
| | | | Total Bank Loans (cost $34,749,449) | | | 34,690,481 | |
| | | | | |
| | |
| Shares | | | Common Stock (51.4%) | | Value | |
| Consumer Discretionary (7.5%) | | | | |
| | 3,500 | | | Amazon.com, Inc.d | | | 1,274,105 | |
| | 2,500 | | | AutoZone, Inc.d | | | 1,086,725 | |
| | 96,768 | | | Comcast Corporatione | | | 4,604,221 | |
| | 7,472 | | | Dollar Tree, Inc.d | | | 436,365 | |
| | 19,200 | | | Foot Locker, Inc. | | | 666,240 | |
| | 13,900 | | | GNC Holdings, Inc. | | | 817,598 | |
| | 58,800 | | | Las Vegas Sands Corporation | | | 4,128,936 | |
| | 12,300 | | | Marriott International, Inc. | | | 554,484 | |
| | 15,100 | | | NIKE, Inc. | | | 1,143,976 | |
| | 13,400 | | | Toll Brothers, Inc.d | | | 440,592 | |
| | 23,057 | | | Tuesday Morning Corporationd | | | 326,257 | |
| | 33,000 | | | Twenty-First Century Fox, Inc. | | | 1,124,640 | |
| | | | | |
| | | | Total | | | 16,604,139 | |
| | | | | |
| |
| Consumer Staples (5.4%) | | | | |
| | 26,829 | | | Anheuser-Busch InBev NV ADR | | | 2,782,972 | |
| | 8,600 | | | Beam, Inc. | | | 578,780 | |
| | 26,236 | | | British American Tobacco plc ADR | | | 2,898,816 | |
| | 6,900 | | | Hain Celestial Group, Inc.d | | | 574,287 | |
| | 36,900 | | | Nestle SA | | | 2,663,588 | |
| | 31,500 | | | PepsiCo, Inc. | | | 2,648,835 | |
| | | | | |
| | | | Total | | | 12,147,278 | |
| | | | | |
| |
| Energy (5.3%) | | | | |
| | 4,900 | | | Concho Resources, Inc.d | | | 541,989 | |
| | 6,200 | | | EOG Resources, Inc. | | | 1,106,080 | |
| | 65,900 | | | Marathon Oil Corporation | | | 2,323,634 | |
| | 12,100 | | | Schlumberger, Ltd. | | | 1,134,012 | |
| | 7,100 | | | SM Energy Company | | | 629,131 | |
| | 79,250 | | | Total SA ADR | | | 4,848,515 | �� |
The accompanying Notes to Financial Statements are an integral part of this schedule.
130
Balanced Income Plus Fund
Schedule of Investments as of October 31, 2013
| | | | | | | | |
| Shares | | | Common Stock (51.4%) | | Value | |
| Energy (5.3%) - continued | | | | |
| | 70,600 | | | Weatherford International, Ltd.d | | | $1,160,664 | |
| | | | | |
| | | | Total | | | 11,744,025 | |
| | | | | |
| |
| Financials (9.3%) | | | | |
| | 3,100 | | | Affiliated Managers Group, Inc.d | | | 612,064 | |
| | 10,300 | | | Axis Capital Holdings, Ltd. | | | 488,426 | |
| | 102,600 | | | Bank of America Corporation | | | 1,432,296 | |
| | 3,800 | | | Boston Properties, Inc. | | | 393,300 | |
| | 7,200 | | | Camden Property Trust | | | 462,240 | |
| | 30,400 | | | Citigroup, Inc. | | | 1,482,912 | |
| | 29,100 | | | Credit Suisse Group ADRd | | | 905,883 | |
| | 28,700 | | | DDR Corporation | | | 486,465 | |
| | 2,600 | | | Equity Residential | | | 136,136 | |
| | 12,100 | | | HCC Insurance Holdings, Inc. | | | 552,365 | |
| | 7,900 | | | Host Hotels & Resorts, Inc. | | | 146,545 | |
| | 80,900 | | | Invesco, Ltd. | | | 2,730,375 | |
| | 18,300 | | | iShares J.P. Morgan USD Emerging Markets Bond ETF | | | 2,037,705 | |
| | 14,481 | | | Lazard, Ltd. | | | 559,691 | |
| | 19,050 | | | Macerich Company | | | 1,127,950 | |
| | 2,800 | | | MasterCard, Inc. | | | 2,007,880 | |
| | 15,199 | | | Popular, Inc.d | | | 383,775 | |
| | 3,700 | | | Prologis, Inc. | | | 147,815 | |
| | 2,700 | | | Public Storage, Inc. | | | 450,819 | |
| | 3,250 | | | Simon Property Group, Inc. | | | 502,287 | |
| | 13,900 | | | Tanger Factory Outlet Centers, Inc. | | | 484,415 | |
| | 9,650 | | | Vanguard Dividend Appreciation Index Fund ETF | | | 699,722 | |
| | 9,700 | | | Visa, Inc. | | | 1,907,699 | |
| | 1,600 | | | Vornado Realty Trust | | | 142,496 | |
| | 16,025 | | | Zions Bancorporation | | | 454,629 | |
| | | | | |
| | | | Total | | | 20,735,890 | |
| | | | | |
| |
| Health Care (5.8%) | | | | |
| | 4,048 | | | Actavis, Inc.d | | | 625,740 | |
| | 20,000 | | | Baxter International, Inc. | | | 1,317,400 | |
| | 43,462 | | | Covidien plc | | | 2,786,349 | |
| | 21,800 | | | Express Scripts Holding Companyd | | | 1,362,936 | |
| | 29,600 | | | Gilead Sciences, Inc.d | | | 2,101,304 | |
| | 20,800 | | | Hologic, Inc.d | | | 465,712 | |
| | 6,300 | | | Illumina, Inc.d | | | 589,113 | |
| | 32,300 | | | Sanofi ADR | | | 1,727,404 | |
| | 10,800 | | | Shire Pharmaceuticals Group plc ADR | | | 1,437,480 | |
| | 4,700 | | | Waters Corporationd | | | 474,324 | |
| | | | | |
| | | | Total | | | 12,887,762 | |
| | | | | |
| |
| Industrials (6.7%) | | | | |
| | 12,200 | | | Actuant Corporation | | | 458,232 | |
| | 7,810 | | | B/E Aerospace, Inc.d | | | 633,859 | |
| | 21,900 | | | Boeing Company | | | 2,857,950 | |
| | 12,088 | | | EMCOR Group, Inc. | | | 447,981 | |
| | 7,800 | | | Flowserve Corporation | | | 541,866 | |
| | 12,200 | | | HNI Corporation | | | 473,970 | |
| | 33,200 | | | Honeywell International, Inc. | | | 2,879,436 | |
| | 16,800 | | | Ingersoll-Rand plc | | | 1,134,504 | |
| | 33,634 | | | Jacobs Engineering Group, Inc.d | | | 2,045,620 | |
| | 5,888 | | | Manpower, Inc. | | | 459,853 | |
| | 3,900 | | | Stericycle, Inc.d | | | 453,180 | |
| | 16,700 | | | Union Pacific Corporation | | | 2,528,380 | |
| | | | | |
| | | | Total | | | 14,914,831 | |
| | | | | |
| |
| Information Technology (8.4%) | | | | |
| | 9,419 | | | Apple, Inc. | | | 4,920,015 | |
| | 7,900 | | | Autodesk, Inc.d | | | 315,289 | |
| | 29,485 | | | E2open, Inc.d | | | 663,412 | |
| | 62,800 | | | EMC Corporation | | | 1,511,596 | |
| | 16,000 | | | Facebook, Inc.d | | | 804,160 | |
| | 1,050 | | | Google, Inc.d | | | 1,082,109 | |
| | 11,500 | | | Informatica Corporationd | | | 443,900 | |
| | 21,600 | | | Jabil Circuit, Inc. | | | 450,576 | |
| | 29,800 | | | Juniper Networks, Inc.d | | | 555,472 | |
| | 14,400 | | | NetApp, Inc. | | | 558,864 | |
| | 7,800 | | | Rackspace Hosting, Inc.d | | | 399,594 | |
| | 9,300 | | | Skyworks Solutions, Inc.d | | | 239,754 | |
| | 112,400 | | | Symantec Corporation | | | 2,555,976 | |
| | 14,100 | | | Teradata Corporationd | | | 621,387 | |
| | 15,200 | | | VMware, Inc.d | | | 1,235,456 | |
| | 50,371 | | | Xilinx, Inc. | | | 2,287,851 | |
| | | | | |
| | | | Total | | | 18,645,411 | |
| | | | | |
| |
| Materials (1.7%) | | | | |
| | 1,700 | | | Airgas, Inc. | | | 185,419 | |
| | 2,100 | | | Ashland, Inc. | | | 194,355 | |
| | 4,400 | | | Crown Holdings, Inc.d | | | 191,840 | |
| | 4,200 | | | Domtar Corporation | | | 355,782 | |
| | 2,600 | | | FMC Corporation | | | 189,176 | |
| | 45,500 | | | Materials Select Sector SPDR Fund | | | 1,991,535 | |
| | 6,100 | | | Owens-Illinois, Inc.d | | | 193,919 | |
| | 1,100 | | | PPG Industries, Inc. | | | 200,838 | |
| | 10,800 | | | Steel Dynamics, Inc. | | | 194,076 | |
| | | | | |
| | | | Total | | | 3,696,940 | |
| | | | | |
| |
| Utilities (1.3%) | | | | |
| | 19,200 | | | MDU Resources Group, Inc. | | | 571,776 | |
| | 8,858 | | | Southwest Gas Corporation | | | 480,635 | |
| | 46,100 | | | Utilities Select Sector SPDR Fund | | | 1,788,219 | |
| | | | | |
| | | | Total | | | 2,840,630 | |
| | | | | |
| | | | | | | | |
| | | | | |
| | | | Total Common Stock (cost $93,761,951) | | | 114,216,906 | |
| | | | | |
| | |
Principal
Amount | | | Long-Term Fixed Income (29.9%) | | Value | |
| Asset-Backed Securities (1.0%) | | | | |
| | | | Conseco Financial Corporation | | | | |
| | 155,859 | | | 6.330%, 11/1/2029 | | | 162,523 | |
| | | | Countrywide Asset-Backed Certificates | | | | |
| | 96,651 | | | 5.859%, 10/25/2046 | | | 65,625 | |
| | | | First Horizon ABS Trust | | | | |
| | 285,716 | | | 0.300%, 10/25/2026f,g | | | 263,409 | |
| | | | GMAC Mortgage Corporation Loan Trust | | | | |
| | 396,969 | | | 0.350%, 8/25/2035f,g | | | 330,906 | |
| | 368,310 | | | 0.350%, 12/25/2036f,g | | | 314,603 | |
| | | | Popular ABS Mortgage Pass- Through Trust | | | | |
| | 250,000 | | | 5.297%, 11/25/2035 | | | 212,557 | |
| | | | Renaissance Home Equity Loan Trust | | | | |
| | 348,174 | | | 5.608%, 5/25/2036 | | | 247,173 | |
| | 491,393 | | | 5.285%, 1/25/2037 | | | 269,057 | |
| | | | Wachovia Asset Securitization, Inc. | | | | |
| | 511,118 | | | 0.310%, 7/25/2037f,g,h | | | 442,169 | |
| | | | | |
| | | | Total | | | 2,308,022 | |
| | | | | |
The accompanying Notes to Financial Statements are an integral part of this schedule.
131
Balanced Income Plus Fund
Schedule of Investments as of October 31, 2013
| | | | | | | | |
Principal
Amount | | | Long-Term Fixed Income (29.9%) | | Value | |
| Basic Materials (0.8%) | | | | |
| | | | Barrick Gold Corporation | | | | |
| | $102,000 | | | 2.900%, 5/30/2016 | | | $104,555 | |
| | | | BHP Billiton Finance USA, Ltd. | | | | |
| | 212,000 | | | 2.050%, 9/30/2018 | | | 213,074 | |
| | | | FMG Resources Pty. Ltd. | | | | |
| | 187,750 | | | 6.875%, 2/1/2018i | | | 199,015 | |
| | | | Hexion US Finance Corporation/Hexion Nova Scotia Finance ULC | | | | |
| | 187,750 | | | 8.875%, 2/1/2018 | | | 193,382 | |
| | | | Ineos Finance plc | | | | |
| | 204,000 | | | 7.500%, 5/1/2020i | | | 222,870 | |
| | | | Inmet Mining Corporation | | | | |
| | 187,750 | | | 8.750%, 6/1/2020i | | | 207,464 | |
| | | | LyondellBasell Industries NV | | | | |
| | 158,000 | | | 5.000%, 4/15/2019 | | | 176,869 | |
| | | | NOVA Chemicals Corporation | | | | |
| | 281,626 | | | 5.250%, 8/1/2023i | | | 287,259 | |
| | | | Xstrata Finance Canada, Ltd. | | | | |
| | 105,000 | | | 2.050%, 10/23/2015i | | | 105,832 | |
| | 167,000 | | | 2.700%, 10/25/2017i | | | 167,794 | |
| | | | | |
| | | | Total | | | 1,878,114 | |
| | | | | |
| |
| Capital Goods (0.8%) | | | | |
| | | | BAE Systems plc | | | | |
| | 102,000 | | | 3.500%, 10/11/2016i | | | 106,734 | |
| | | | Cemex Finance, LLC | | | | |
| | 187,750 | | | 9.375%, 10/12/2017i | | | 210,749 | |
| | | | CNH Capital, LLC | | | | |
| | 187,750 | | | 3.625%, 4/15/2018 | | | 190,332 | |
| | | | Eaton Corporation | | | | |
| | 106,000 | | | 1.500%, 11/2/2017i | | | 104,938 | |
| | | | John Deere Capital Corporation | | | | |
| | 204,000 | | | 1.050%, 10/11/2016 | | | 204,729 | |
| | | | Nortek, Inc. | | | | |
| | 187,750 | | | 8.500%, 4/15/2021 | | | 205,821 | |
| | | | Reynolds Group Issuer, Inc. | | | | |
| | 187,750 | | | 9.875%, 8/15/2019 | | | 207,698 | |
| | | | Roper Industries, Inc. | | | | |
| | 234,000 | | | 1.850%, 11/15/2017 | | | 233,991 | |
| | | | Textron, Inc. | | | | |
| | 102,000 | | | 4.625%, 9/21/2016 | | | 109,996 | |
| | | | United Rentals North America, Inc. | | | | |
| | 211,000 | | | 7.375%, 5/15/2020 | | | 235,265 | |
| | | | | |
| | | | Total | | | 1,810,253 | |
| | | | | |
| |
| Collateralized Mortgage Obligations (3.2%) | | | | |
| | | | Banc of America Alternative Loan Trust 2005-10 | | | | |
| | 766,884 | | | 6.000%, 11/25/2035 | | | 632,075 | |
| | | | Countrywide Alternative Loan Trust | | | | |
| | 624,025 | | | 6.500%, 8/25/2036 | | | 427,728 | |
| | | | Credit Suisse First Boston Mortgage Securities | | | | |
| | | | Corporation | | | | |
| | 515,698 | | | 5.250%, 10/25/2035 | | | 500,380 | |
| | | | HomeBanc Mortgage Trust | | | | |
| | 440,313 | | | 2.408%, 4/25/2037 | | | 305,741 | |
| | | | J.P. Morgan Alternative Loan Trust | | | | |
| | 365,574 | | | 2.679%, 3/25/2036 | | | 282,238 | |
| | 856,661 | | | 6.500%, 3/25/2036 | | | 749,422 | |
| | | | J.P. Morgan Mortgage Trust | | | | |
| | 695,726 | | | 2.651%, 1/25/2037 | | | 603,195 | |
| | | | Lehman Mortgage Trust | | | | |
| | 92,532 | | | 6.000%, 1/25/2036 | | | 83,383 | |
| | | | Master Asset Securitization Trust | | | | |
| | 138,645 | | | 0.670%, 6/25/2036g | | | 87,674 | |
| | | | MortgageIT Trust | | | | |
| | 734,569 | | | 0.430%, 12/25/2035g | | | 662,206 | |
| | | | Residential Accredit Loans, Inc. | | | | |
| | 198,617 | | | 5.750%, 9/25/2035 | | | 175,000 | |
| | | | RFMSI Series 2007-S7 Trust | | | | |
| | 1,018,879 | | | 6.000%, 7/25/2037 | | | 910,425 | |
| | | | Structured Adjustable Rate | | | | |
| | | | Mortgage Loan Trust | | | | |
| | 505,752 | | | 2.701%, 9/25/2035 | | | 431,558 | |
| | | | Wells Fargo Mortgage Backed Securities Trust | | | | |
| | 647,642 | | | 2.634%, 7/25/2036 | | | 600,301 | |
| | 638,991 | | | 6.000%, 7/25/2037 | | | 605,766 | |
| | | | | |
| | | | Total | | | 7,057,092 | |
| | | | | |
| |
| Commercial Mortgage-Backed Securities (0.5%) | | | | |
| | | | Commercial Mortgage Pass- Through Certificates | | | | |
| | 283,585 | | | 0.304%, 12/15/2020g,i | | | 279,537 | |
| | | | Credit Suisse Mortgage Capital Certificates | | | | |
| | 554,565 | | | 0.344%, 10/15/2021g,i | | | 552,373 | |
| | | | Government National Mortgage Association | | | | |
| | 80,396 | | | 3.214%, 1/16/2040 | | | 81,600 | |
| | | | Wachovia Bank Commercial Mortgage Trust | | | | |
| | 317,813 | | | 5.765%, 7/15/2045 | | | 342,966 | |
| | | | | |
| | | | Total | | | 1,256,476 | |
| | | | | |
| |
| Communications Services (2.3%) | | | | |
| | | | AMC Networks, Inc. | | | | |
| | 187,750 | | | 7.750%, 7/15/2021 | | | 211,219 | |
| | | | America Movil SAB de CV | | | | |
| | 68,000 | | | 5.000%, 10/16/2019 | | | 75,002 | |
| | | | American Tower Corporation | | | | |
| | 101,000 | | | 7.000%, 10/15/2017 | | | 117,264 | |
| | | | AT&T, Inc. | | | | |
| | 216,000 | | | 2.400%, 8/15/2016 | | | 223,442 | |
| | | | British Telecommunications plc | | | | |
| | 106,000 | | | 1.625%, 6/28/2016 | | | 107,402 | |
| | | | CC Holdings GS V, LLC | | | | |
| | 153,000 | | | 2.381%, 12/15/2017 | | | 151,458 | |
| | | | CCO Holdings, LLC | | | | |
| | 187,750 | | | 7.000%, 1/15/2019 | | | 199,015 | |
| | | | CenturyLink, Inc. | | | | |
| | 187,750 | | | 5.625%, 4/1/2020 | | | 190,801 | |
| | | | Digicel, Ltd. | | | | |
| | 187,750 | | | 6.000%, 4/15/2021i | | | 182,117 | |
| | | | DIRECTV Holdings, LLC | | | | |
| | 122,000 | | | 3.500%, 3/1/2016 | | | 127,786 | |
| | 125,000 | | | 1.750%, 1/15/2018 | | | 122,162 | |
| | | | Hughes Satellite Systems Corporation | | | | |
| | 211,000 | | | 6.500%, 6/15/2019 | | | 226,297 | |
The accompanying Notes to Financial Statements are an integral part of this schedule.
132
Balanced Income Plus Fund
Schedule of Investments as of October 31, 2013
| | | | | | | | |
Principal
Amount | | | Long-Term Fixed Income (29.9%) | | Value | |
| Communications Services (2.3%) - continued | | | | |
| | | | Intelsat Jackson Holdings SA | | | | |
| | $187,750 | | | 7.250%, 10/15/2020 | | | $203,709 | |
| | | | Level 3 Financing, Inc. | | | | |
| | 211,000 | | | 8.625%, 7/15/2020 | | | 238,957 | |
| | | | NBC Universal Enterprise, Inc. | | | | |
| | 125,000 | | | 1.662%, 4/15/2018i | | | 123,785 | |
| | | | Qwest Communications International, Inc. | | | | |
| | 150,000 | | | 7.125%, 4/1/2018 | | | 155,625 | |
| | | | SBA Tower Trust | | | | |
| | 200,000 | | | 5.101%, 4/17/2017i | | | 216,295 | |
| | | | Sprint Nextel Corporation | | | | |
| | 187,750 | | | 9.000%, 11/15/2018i | | | 227,647 | |
| | | | Telefonica Emisiones SAU | | | | |
| | 106,000 | | | 3.729%, 4/27/2015 | | | 109,603 | |
| | | | T-Mobile USA, Inc. | | | | |
| | 210,000 | | | 6.633%, 4/28/2021 | | | 222,075 | |
| | | | Univision Communications, Inc. | | | | |
| | 245,000 | | | 7.875%, 11/1/2020i | | | 271,950 | |
| | | | UPCB Finance V, Ltd. | | | | |
| | 245,000 | | | 7.250%, 11/15/2021i | | | 268,887 | |
| | | | Verizon Communications, Inc. | | | | |
| | 318,000 | | | 2.500%, 9/15/2016 | | | 329,990 | |
| | 106,000 | | | 2.002%, 9/14/2018g | | | 111,914 | |
| | 220,000 | | | 3.650%, 9/14/2018 | | | 233,982 | |
| | | | WideOpenWest Finance, LLC | | | | |
| | 245,000 | | | 10.250%, 7/15/2019 | | | 270,725 | |
| | | | Wind Acquisition Finance SA | | | | |
| | 187,750 | | | 11.750%, 7/15/2017i | | | 199,484 | |
| | | | | |
| | | | Total | | | 5,118,593 | |
| | | | | |
| |
| Consumer Cyclical (1.3%) | | | | |
| | | | Amazon.com, Inc. | | | | |
| | 147,000 | | | 1.200%, 11/29/2017 | | | 144,232 | |
| | | | Chrysler Group, LLC | | | | |
| | 187,750 | | | 8.250%, 6/15/2021 | | | 212,392 | |
| | | | Cinemark USA, Inc. | | | | |
| | 204,000 | | | 4.875%, 6/1/2023 | | | 194,310 | |
| | | | Ford Motor Credit Company, LLC | | | | |
| | 233,000 | | | 3.984%, 6/15/2016 | | | 248,157 | |
| | 133,000 | | | 3.000%, 6/12/2017 | | | 138,443 | |
| | 100,000 | | | 5.000%, 5/15/2018 | | | 110,815 | |
| | | | General Motors Company | | | | |
| | 212,000 | | | 3.500%, 10/2/2018i | | | 216,240 | |
| | | | General Motors Financial Company, Inc. | | | | |
| | 187,750 | | | 3.250%, 5/15/2018i | | | 187,046 | |
| | | | Jaguar Land Rover Automotive plc | | | | |
| | 211,000 | | | 5.625%, 2/1/2023i | | | 209,418 | |
| | | | L Brands, Inc. | | | | |
| | 211,000 | | | 6.625%, 4/1/2021 | | | 232,100 | |
| | | | Macy’s Retail Holdings, Inc. | | | | |
| | 182,000 | | | 7.450%, 7/15/2017 | | | 216,138 | |
| | | | Royal Caribbean Cruises, Ltd. | | | | |
| | 187,750 | | | 5.250%, 11/15/2022 | | | 187,750 | |
| | | | Toyota Motor Credit Corporation | | | | |
| | 101,000 | | | 2.000%, 10/24/2018 | | | 101,472 | |
| | | | West Corporation | | | | |
| | 187,750 | | | 8.625%, 10/1/2018 | | | 204,648 | |
| | | | Wynn Las Vegas, LLC | | | | |
| | 211,000 | | | 5.375%, 3/15/2022 | | | 217,079 | |
| | | | | |
| | | | Total | | | 2,820,240 | |
| | | | | |
| |
| Consumer Non-Cyclical (2.2%) | | | | |
| | | | AbbVie, Inc. | | | | |
| | 213,000 | | | 1.750%, 11/6/2017 | | | 213,649 | |
| | | | Altria Group, Inc. | | | | |
| | 102,000 | | | 9.700%, 11/10/2018 | | | 136,971 | |
| | | | Anheuser-Busch InBev Worldwide, Inc. | | | | |
| | 204,000 | | | 7.750%, 1/15/2019 | | | 258,350 | |
| | | | Biomet, Inc. | | | | |
| | 187,750 | | | 6.500%, 8/1/2020 | | | 199,484 | |
| | | | Boston Scientific Corporation | | | | |
| | 122,000 | | | 2.650%, 10/1/2018 | | | 122,997 | |
| | | | Celgene Corporation | | | | |
| | 128,000 | | | 1.900%, 8/15/2017 | | | 129,115 | |
| | | | CHS/Community Health Systems, Inc. | | | | |
| | 211,000 | | | 7.125%, 7/15/2020 | | | 222,078 | |
| | | | Edwards Lifesciences Corporation | | | | |
| | 106,000 | | | 2.875%, 10/15/2018 | | | 106,407 | |
| | | | Emergency Medical Services Corporation | | | | |
| | 187,750 | | | 8.125%, 6/1/2019 | | | 203,953 | |
| | | | Endo Health Solutions, Inc. | | | | |
| | 187,750 | | | 7.250%, 1/15/2022 | | | 199,954 | |
| | | | Express Scripts Holding Company | | | | |
| | 122,000 | | | 3.125%, 5/15/2016 | | | 128,029 | |
| | | | Fresenius Medical Care US Finance, Inc. | | | | |
| | 187,750 | | | 5.750%, 2/15/2021i | | | 198,546 | |
| | | | Gilead Sciences, Inc. | | | | |
| | 122,000 | | | 3.050%, 12/1/2016 | | | 128,991 | |
| | | | Hawk Acquisition Sub, Inc. | | | | |
| | 211,000 | | | 4.250%, 10/15/2020i | | | 204,142 | |
| | | | HCA, Inc. | | | | |
| | 187,750 | | | 4.750%, 5/1/2023 | | | 180,944 | |
| | | | Health Management Associates, Inc. | | | | |
| | 187,750 | | | 7.375%, 1/15/2020 | | | 209,341 | |
| | | | Heineken NV | | | | |
| | 56,000 | | | 1.400%, 10/1/2017i | | | 55,324 | |
| | | | IMS Health, Inc. | | | | |
| | 193,000 | | | 6.000%, 11/1/2020i | | | 200,720 | |
| | | | JBS Finance II, Ltd. | | | | |
| | 187,750 | | | 8.250%, 1/29/2018h | | | 196,668 | |
| | | | Lorillard Tobacco Company | | | | |
| | 102,000 | | | 8.125%, 6/23/2019 | | | 125,859 | |
| | | | Medtronic, Inc. | | | | |
| | 125,000 | | | 1.375%, 4/1/2018 | | | 123,067 | |
| | | | Pernod Ricard SA | | | | |
| | 106,000 | | | 2.950%, 1/15/2017i | | | 110,601 | |
| | | | Revlon Consumer Products Corporation | | | | |
| | 187,750 | | | 5.750%, 2/15/2021i | | | 185,403 | |
| | | | Safeway, Inc. | | | | |
| | 204,000 | | | 3.400%, 12/1/2016 | | | 210,518 | |
| | | | Sanofi | | | | |
| | 125,000 | | | 1.250%, 4/10/2018 | | | 123,078 | |
| | | | Spectrum Brands Escrow Corporation | | | | |
| | 211,000 | | | 6.375%, 11/15/2020i | | | 224,187 | |
| | | | Valeant Pharmaceuticals International | | | | |
| | 187,750 | | | 7.250%, 7/15/2022i | | | 204,178 | |
| | | | Watson Pharmaceuticals, Inc. | | | | |
| | 152,000 | | | 1.875%, 10/1/2017 | | | 151,624 | |
The accompanying Notes to Financial Statements are an integral part of this schedule.
133
Balanced Income Plus Fund
Schedule of Investments as of October 31, 2013
| | | | | | | | |
Principal
Amount | | | Long-Term Fixed Income (29.9%) | | Value | |
| Consumer Non-Cyclical (2.2%) - continued | | | | |
| | | | WM Wrigley Jr. Company | | | | |
| | $102,000 | | | 2.000%, 10/20/2017i | | | $102,889 | |
| | | | | |
| | | | Total | | | 4,857,067 | |
| | | | | |
| |
| Energy (1.3%) | | | | |
| | | | BP Capital Markets plc | | | | |
| | 212,000 | | | 2.241%, 9/26/2018 | | | 214,160 | |
| | | | Concho Resources, Inc. | | | | |
| | 187,750 | | | 6.500%, 1/15/2022 | | | 205,117 | |
| | | | Energy Transfer Partners, LP | | | | |
| | 68,000 | | | 6.700%, 7/1/2018 | | | 80,014 | |
| | | | Harvest Operations Corporation | | | | |
| | 187,750 | | | 6.875%, 10/1/2017 | | | 201,597 | |
| | | | Hess Corporation | | | | |
| | 122,000 | | | 8.125%, 2/15/2019 | | | 153,722 | |
| | | | Kodiak Oil & Gas Corporation | | | | |
| | 187,750 | | | 5.500%, 1/15/2021i | | | 192,444 | |
| | | | Linn Energy, LLC | | | | |
| | 187,750 | | | 8.625%, 4/15/2020 | | | 199,954 | |
| | | | Marathon Oil Corporation | | | | |
| | 100,000 | | | 2.800%, 11/1/2022 | | | 94,320 | |
| | | | MEG Energy Corporation | | | | |
| | 211,000 | | | 6.375%, 1/30/2023i | | | 212,319 | |
| | | | Oasis Petroleum, Inc. | | | | |
| | 211,000 | | | 6.875%, 1/15/2023 | | | 228,935 | |
| | | | Offshore Group Investment, Ltd. | | | | |
| | 245,000 | | | 7.500%, 11/1/2019 | | | 266,437 | |
| | | | Petrobras Global Finance BV | | | | |
| | 159,000 | | | 2.000%, 5/20/2016 | | | 157,998 | |
| | | | Range Resources Corporation | | | | |
| | 264,728 | | | 5.000%, 8/15/2022 | | | 264,397 | |
| | | | Suncor Energy, Inc. | | | | |
| | 101,000 | | | 6.100%, 6/1/2018 | | | 118,760 | |
| | | | Transocean, Inc. | | | | |
| | 122,000 | | | 5.050%, 12/15/2016 | | | 134,385 | |
| | | | Weatherford International, Ltd. | | | | |
| | 101,000 | | | 6.000%, 3/15/2018 | | | 113,908 | |
| | | | | |
| | | | Total | | | 2,838,467 | |
| | | | | |
| |
| Financials (5.6%) | | | | |
| | | | Ally Financial, Inc. | | | | |
| | 245,000 | | | 4.750%, 9/10/2018 | | | 255,034 | |
| | | | American International Group, Inc. | | | | |
| | 204,000 | | | 8.250%, 8/15/2018 | | | 258,073 | |
| | | | Aviation Capital Group Corporation | | | | |
| | 106,000 | | | 3.875%, 9/27/2016i | | | 107,304 | |
| | | | Bank of America Corporation | | | | |
| | 212,000 | | | 5.750%, 8/15/2016 | | | 234,606 | |
| | 200,000 | | | 5.750%, 12/1/2017 | | | 228,674 | |
| | 212,000 | | | 1.320%, 3/22/2018g | | | 214,459 | |
| | 200,000 | | | 5.650%, 5/1/2018 | | | 228,136 | |
| | 101,000 | | | 2.600%, 1/15/2019 | | | 101,682 | |
| | 100,000 | | | 5.625%, 7/1/2020 | | | 114,601 | |
| | | | Bank of New York Mellon Corporation | | | | |
| | 40,000 | | | 4.500%, 12/31/2049j | | | 36,500 | |
| | | | Barclays Bank plc | | | | |
| | 111,000 | | | 5.140%, 10/14/2020 | | | 118,440 | |
| | | | BB&T Corporation | | | | |
| | 101,000 | | | 2.050%, 6/19/2018 | | | 101,170 | |
| | | | BBVA Banco Continental SA | | | | |
| | 101,000 | | | 2.250%, 7/29/2016i | | | 100,747 | |
| | | | BBVA US Senior SAU | | | | |
| | 212,000 | | | 4.664%, 10/9/2015 | | | 223,214 | |
| | | | Bear Stearns Companies, LLC | | | | |
| | 202,000 | | | 6.400%, 10/2/2017 | | | 236,238 | |
| | | | BNP Paribas SA | | | | |
| | 152,000 | | | 2.375%, 9/14/2017 | | | 155,408 | |
| | | | Capital One Financial Corporation | | | | |
| | 102,000 | | | 6.150%, 9/1/2016 | | | 114,404 | |
| | | | Citigroup, Inc. | | | | |
| | 212,000 | | | 5.000%, 9/15/2014 | | | 219,383 | |
| | 106,000 | | | 1.198%, 7/25/2016g | | | 106,973 | |
| | 201,000 | | | 6.000%, 8/15/2017 | | | 231,128 | |
| | | | CNA Financial Corporation | | | | |
| | 51,000 | | | 7.350%, 11/15/2019 | | | 62,862 | |
| | | | CyrusOne, LP | | | | |
| | 187,750 | | | 6.375%, 11/15/2022 | | | 189,158 | |
| | | | Denali Borrower, LLC | | | | |
| | 355,000 | | | 5.625%, 10/15/2020i | | | 351,450 | |
| | | | Discover Financial Services | | | | |
| | 106,000 | | | 6.450%, 6/12/2017 | | | 120,962 | |
| | | | Fifth Third Bancorp | | | | |
| | 192,000 | | | 5.450%, 1/15/2017 | | | 212,513 | |
| | | | Fifth Third Capital Trust IV | | | | |
| | 159,000 | | | 6.500%, 4/15/2037 | | | 157,012 | |
| | | | General Electric Capital Corporation | | | | |
| | 607,000 | | | 5.625%, 9/15/2017 | | | 697,106 | |
| | 47,000 | | | 1.625%, 4/2/2018 | | | 46,928 | |
| | | | Goldman Sachs Group, Inc. | | | | |
| | 159,000 | | | 0.700%, 3/22/2016g | | | 158,186 | |
| | 156,000 | | | 6.250%, 9/1/2017 | | | 180,456 | |
| | 102,000 | | | 7.500%, 2/15/2019 | | | 125,245 | |
| | | | HCP, Inc. | | | | |
| | 51,000 | | | 3.750%, 2/1/2016 | | | 53,671 | |
| | | | HSBC Finance Corporation | | | | |
| | 202,000 | | | 6.676%, 1/15/2021 | | | 234,760 | |
| | | | HSBC USA, Inc. | | | | |
| | 35,000 | | | 1.625%, 1/16/2018 | | | 34,738 | |
| | | | Icahn Enterprises, LP | | | | |
| | 187,750 | | | 8.000%, 1/15/2018 | | | 196,903 | |
| | | | ING Bank NV | | | | |
| | 81,000 | | | 3.750%, 3/7/2017i | | | 85,664 | |
| | | | ING Capital Funding Trust III | | | | |
| | 156,000 | | | 3.848%, 12/29/2049g,j | | | 154,050 | |
| | | | International Lease Finance Corporation | | | | |
| | 100,000 | | | 8.625%, 9/15/2015 | | | 111,250 | |
| | | | Intesa Sanpaolo SPA | | | | |
| | 102,000 | | | 3.625%, 8/12/2015i | | | 104,581 | |
| | 204,000 | | | 3.875%, 1/15/2019c | | | 204,810 | |
| | | | J.P. Morgan Chase & Company | | | | |
| | 159,000 | | | 3.450%, 3/1/2016 | | | 167,556 | |
| | 75,000 | | | 1.138%, 1/25/2018g | | | 75,568 | |
| | 106,000 | | | 6.300%, 4/23/2019 | | | 125,622 | |
| | 175,000 | | | 7.900%, 4/29/2049j | | | 192,937 | |
| | 50,000 | | | 6.000%, 12/29/2049j | | | 48,375 | |
| | | | J.P. Morgan Chase Bank NA | | | | |
| | 212,000 | | | 0.584%, 6/13/2016g | | | 209,992 | |
| | | | Liberty Mutual Group, Inc. | | | | |
| | 27,000 | | | 5.000%, 6/1/2021i | | | 29,126 | |
| | | | Liberty Property, LP | | | | |
| | 112,000 | | | 5.500%, 12/15/2016 | | | 124,243 | |
The accompanying Notes to Financial Statements are an integral part of this schedule.
134
Balanced Income Plus Fund
Schedule of Investments as of October 31, 2013
| | | | | | | | |
Principal
Amount | | | Long-Term Fixed Income (29.9%) | | Value | |
| Financials (5.6%) - continued | | | | |
| | | | Lloyds TSB Bank plc | | | | |
| | $122,000 | | | 6.500%, 9/14/2020i | | | $137,839 | |
| | | | Macquarie Bank, Ltd. | | | | |
| | 142,000 | | | 5.000%, 2/22/2017i | | | 155,717 | |
| | | | Morgan Stanley | | | | |
| | 153,000 | | | 4.750%, 4/1/2014 | | | 155,600 | |
| | 233,000 | | | 1.750%, 2/25/2016 | | | 235,286 | |
| | 153,000 | | | 6.250%, 8/28/2017 | | | 176,225 | |
| | | | Murray Street Investment Trust I | | | | |
| | 212,000 | | | 4.647%, 3/9/2017 | | | 230,493 | |
| | | | National City Corporation | | | | |
| | 203,000 | | | 6.875%, 5/15/2019 | | | 243,583 | |
| | | | Nomura Holdings, Inc. | | | | |
| | 153,000 | | | 2.000%, 9/13/2016 | | | 154,118 | |
| | | | Omega Healthcare Investors, Inc. | | | | |
| | 187,750 | | | 5.875%, 3/15/2024 | | | 192,444 | |
| | | | PNC Bank NA | | | | |
| | 202,000 | | | 1.150%, 11/1/2016 | | | 202,599 | |
| | | | Prologis, LP | | | | |
| | 160,000 | | | 6.625%, 5/15/2018 | | | 188,897 | |
| | | | Rabobank Capital Funding Trust II | | | | |
| | 101,000 | | | 5.260%, 12/29/2049i,j | | | 101,333 | |
| | | | Realty Income Corporation | | | | |
| | 125,000 | | | 2.000%, 1/31/2018 | | | 123,289 | |
| | | | Regions Bank | | | | |
| | 159,000 | | | 7.500%, 5/15/2018 | | | 189,169 | |
| | | | Reinsurance Group of America, Inc. | | | | |
| | 300,000 | | | 5.625%, 3/15/2017 | | | 333,117 | |
| | | | Royal Bank of Scotland Group plc | | | | |
| | 149,000 | | | 5.050%, 1/8/2015 | | | 154,023 | |
| | | | Santander US Debt SAU | | | | |
| | 159,000 | | | 3.781%, 10/7/2015i | | | 163,804 | |
| | | | SLM Corporation | | | | |
| | 106,000 | | | 6.250%, 1/25/2016 | | | 115,407 | |
| | 30,000 | | | 4.625%, 9/25/2017 | | | 31,125 | |
| | | | Svenska Handelsbanken AB | | | | |
| | 102,000 | | | 3.125%, 7/12/2016 | | | 107,240 | |
| | | | Swedbank Hypotek AB | | | | |
| | 122,000 | | | 1.375%, 3/28/2018i | | | 120,682 | |
| | | | Swiss RE Capital I, LP | | | | |
| | 479,000 | | | 6.854%, 5/29/2049i,j | | | 510,135 | |
| | | | UnitedHealth Group, Inc. | | | | |
| | 125,000 | | | 1.400%, 10/15/2017 | | | 125,043 | |
| | | | Ventas Realty, LP | | | | |
| | 204,000 | | | 1.550%, 9/26/2016 | | | 205,464 | |
| | | | Wells Fargo & Company | | | | |
| | 159,000 | | | 1.250%, 7/20/2016 | | | 159,947 | |
| | 202,000 | | | 2.150%, 1/15/2019 | | | 202,983 | |
| | | | | |
| | | | Total | | | 12,557,460 | |
| | | | | |
| |
| Foreign Government (<0.1%) | | | | |
| | | | Eksportfinans ASA | | | | |
| | 100,000 | | | 2.375%, 5/25/2016 | | | 97,450 | |
| | | | | |
| | | | Total | | | 97,450 | |
| | | | | |
| |
| Mortgage-Backed Securities (6.6%) | | | | |
| | | | Federal Home Loan Mortgage Corporation Gold 15-Yr. Pass Through | | | | |
| | 1,700,000 | | | 3.000%, 12/1/2028c | | | 1,757,375 | |
| | | | Federal Home Loan Mortgage Corporation Gold 30-Yr. Pass Through | | | | |
| | 1,850,000 | | | 3.500%, 11/1/2043c | | | 1,890,758 | |
| | | | Federal National Mortgage Association Conventional 15- Yr. Pass Through | | | | |
| | 525,000 | | | 3.500%, 11/1/2028c | | | 554,326 | |
| | | | Federal National Mortgage Association Conventional 30- Yr. Pass Through | | | | |
| | 4,200,000 | | | 3.500%, 11/1/2043c | | | 4,307,625 | |
| | 3,925,000 | | | 4.000%, 11/1/2043c | | | 4,134,742 | |
| | 1,950,000 | | | 4.500%, 11/1/2043c | | | 2,087,414 | |
| | | | | |
| | | | Total | | | 14,732,240 | |
| | | | | |
| |
| Technology (0.9%) | | | | |
| | | | Alliance Data Systems Corporation | | | | |
| | 187,750 | | | 6.375%, 4/1/2020i | | | 195,729 | |
| | | | BMC Software Finance, Inc. | | | | |
| | 187,750 | | | 8.125%, 7/15/2021i | | | 198,546 | |
| | | | CommScope, Inc. | | | | |
| | 204,000 | | | 8.250%, 1/15/2019i | | | 223,890 | |
| | | | Computer Sciences Corporation | | | | |
| | 101,000 | | | 2.500%, 9/15/2015 | | | 103,433 | |
| | | | EMC Corporation | | | | |
| | 101,000 | | | 1.875%, 6/1/2018 | | | 101,371 | |
| | | | First Data Corporation | | | | |
| | 187,750 | | | 7.375%, 6/15/2019i | | | 202,066 | |
| | | | Freescale Semiconductor, Inc. | | | | |
| | 200,000 | | | 6.000%, 1/15/2022c,i | | | 202,250 | |
| | | | Hewlett-Packard Company | | | | |
| | 106,000 | | | 3.300%, 12/9/2016 | | | 110,645 | |
| | | | Iron Mountain, Inc. | | | | |
| | 187,750 | | | 6.000%, 8/15/2023 | | | 191,036 | |
| | | | Oracle Corporation | | | | |
| | 201,000 | | | 1.200%, 10/15/2017 | | | 198,387 | |
| | | | Tyco Electronics Group SA | | | | |
| | 101,000 | | | 6.550%, 10/1/2017 | | | 116,980 | |
| | | | Xerox Corporation | | | | |
| | 101,000 | | | 7.200%, 4/1/2016 | | | 114,123 | |
| | | | | |
| | | | Total | | | 1,958,456 | |
| | | | | |
| |
| Transportation (0.5%) | | | | |
| | | | Avis Budget Car Rental, LLC | | | | |
| | 187,750 | | | 8.250%, 1/15/2019 | | | 204,647 | |
| | | | Continental Airlines, Inc. | | | | |
| | 178,235 | | | 6.250%, 4/11/2020 | | | 184,474 | |
| | 121,924 | | | 4.150%, 4/11/2024 | | | 120,400 | |
| | | | Delta Air Lines, Inc. | | | | |
| | 82,132 | | | 4.950%, 5/23/2019 | | | 88,086 | |
| | 65,572 | | | 4.750%, 5/7/2020 | | | 69,178 | |
| | | | ERAC USA Finance, LLC | | | | |
| | 57,000 | | | 1.400%, 4/15/2016i | | | 57,087 | |
| | | | Hertz Corporation | | | | |
| | 211,000 | | | 6.750%, 4/15/2019 | | | 227,616 | |
| | | | Kansas City Southern de Mexico SA de CV | | | | |
| | 101,000 | | | 0.937%, 10/28/2016 g,i | | | 101,151 | |
The accompanying Notes to Financial Statements are an integral part of this schedule.
135
Balanced Income Plus Fund
Schedule of Investments as of October 31, 2013
| | | | | | | | |
Principal
Amount | | | Long-Term Fixed Income (29.9%) | | Value | |
| Transportation (0.5%) - continued | | | | |
| | | | US Airways Pass Through Trust | | | | |
| | $100,000 | | | 3.950%, 11/15/2025 | | | $94,813 | |
| | | | | |
| | | | Total | | | 1,147,452 | |
| | | | | |
| |
| U.S. Government and Agencies (1.8%) | | | | |
| | | | U.S. Treasury Notes | | | | |
| | 4,000,000 | | | 0.250%, 9/30/2015 | | | 3,996,408 | |
| | | | | |
| | | | Total | | | 3,996,408 | |
| | | | | |
| |
| Utilities (1.1%) | | | | |
| | | | Access Midstream Partners, LP | | | | |
| | 245,000 | | | 4.875%, 5/15/2023 | | | 243,775 | |
| | | | AES Corporation | | | | |
| | 187,750 | | | 7.375%, 7/1/2021 | | | 212,627 | |
| | | | Atlas Pipeline Partners, LP | | | | |
| | 211,000 | | | 4.750%, 11/15/2021i | | | 198,340 | |
| | | | Cleveland Electric Illuminating Company | | | | |
| | 127,000 | | | 5.700%, 4/1/2017 | | | 140,006 | |
| | | | Constellation Energy Group, Inc. | | | | |
| | 101,000 | | | 5.150%, 12/1/2020 | | | 109,167 | |
| | | | Dayton Power and Light Company | | | | |
| | 101,000 | | | 1.875%, 9/15/2016i | | | 101,925 | |
| | | | Electricite de France SA | | | | |
| | 100,000 | | | 5.250%, 1/29/2049i,j | | | 98,300 | |
| | | | Enel Finance International NV | | | | |
| | 102,000 | | | 3.875%, 10/7/2014i | | | 104,550 | |
| | | | Energy Transfer Partners, LP | | | | |
| | 153,000 | | | 5.950%, 2/1/2015 | | | 162,226 | |
| | | | Enterprise Products Operating, LLC | | | | |
| | 102,000 | | | 1.250%, 8/13/2015 | | | 102,559 | |
| | | | ITC Holdings Corporation | | | | |
| | 125,000 | | | 6.050%, 1/31/2018i | | | 142,235 | |
| | | | Korea Western Power Company, Ltd. | | | | |
| | 204,000 | | | 2.875%, 10/10/2018i | | | 204,782 | |
| | | | National Rural Utilities Cooperative Finance Corporation | | | | |
| | 70,000 | | | 4.750%, 4/30/2043 | | | 65,363 | |
| | | | NRG Energy, Inc. | | | | |
| | 187,750 | | | 6.625%, 3/15/2023 | | | 194,087 | |
| | | | ONEOK Partners, LP | | | | |
| | 204,000 | | | 6.150%, 10/1/2016 | | | 229,835 | |
| | 68,000 | | | 2.000%, 10/1/2017 | | | 67,819 | |
| | | | Total | | | 2,377,596 | |
| | | | | |
| | | | | | | | |
| | | | | |
| | | | Total Long-Term Fixed Income (cost $66,593,765) | | | 66,811,386 | |
| | | | | |
| | |
| Shares | | | Preferred Stock (0.1%) | | Value | |
| Financials (0.1%) | | | | |
| | 2,600 | | | Discover Financial Services, 6.500%j | | | 62,192 | |
| | 675 | | | Farm Credit Bank of Texas, 6.750%i,j | | | 67,479 | |
| | 1,000 | | | The Allstate Corporation, 5.100% | | | 24,160 | |
| | 1,400 | | | The Goldman Sachs Group, Inc., 5.500%j | | | 31,962 | |
| | | | Total | | | 185,793 | |
| | | | | |
| | | | | | | | |
| | | | | |
| | | | Total Preferred Stock (cost $192,396) | | | 185,793 | |
| | | | | |
| | |
Shares or
Principal
Amount | | | Short-Term Investments (11.3%) | | Value | |
| | | | Federal Home Loan Bank Discount Notes | | | | |
| | 100,000 | | | 0.093%, 11/22/2013e,k | | | 99,995 | |
| | 100,000 | | | 0.090%, 4/4/2014e,k | | | 99,961 | |
| | | | Federal Home Loan Mortgage Corporation Discount Notes | | | | |
| | 600,000 | | | 0.055%, 2/4/2014e,k | | | 599,913 | |
| | | | Thrivent Cash Management Trust | | | | |
| | 24,239,009 | | | 0.070% | | | 24,239,009 | |
| | | | | |
| | | | Total Short-Term Investments (at amortized cost) | | | 25,038,878 | |
| | | | | |
| | | | Total Investments (cost $220,336,439) 108.3% | | | $240,943,444 | |
| | | | | |
| | | | Other Assets and Liabilities, Net (8.3%) | | | (18,529,762 | ) |
| | | | | |
| | | | Total Net Assets 100.0% | | | $222,413,682 | |
| | | | | |
a | The stated interest rate represents the weighted average of all contracts within the bank loan facility. |
b | All or a portion of the loan is unfunded. |
c | Denotes investments purchased on a when-issued or delayed delivery basis. |
d | Non-income producing security. |
e | At October 31, 2013, $775,742 of investments were held on deposit with the counterparty and pledged as the initial margin deposit for open futures contracts. |
f | All or a portion of the security is insured or guaranteed. |
g | Denotes variable rate securities. Variable rate securities are securities whose yields vary with a designated market index or market rate. The rate shown is as of October 31, 2013. |
h | Denotes restricted securities. Restricted securities are investment securities which have been deemed illiquid and cannot be offered for public sale without first being registered under the Securities Act of 1933. The following table indicates the acquisition date and cost of restricted securities Balanced Income Plus Fund owned as of October 31, 2013. |
| | | | | | | | |
Security | | Acquisition
Date | | | Cost | |
JBS Finance II, Ltd. | | | 8/19/2013 | | | $ | 195,806 | |
Wachovia Asset Securitization, Inc. | | | 3/16/2007 | | | | 502,316 | |
i | Denotes securities sold under Rule 144A of the Securities Act of 1933, which exempts them from registration. These securities have been deemed liquid and may be resold to other dealers in the program or to other qualified institutional buyers. As of October 31, 2013, the value of these investments was $10,504,899 or 4.7% of total net assets. |
j | Denotes perpetual securities. Perpetual securities pay an indefinite stream of interest, but may be called by the issuer at an earlier date. |
The accompanying Notes to Financial Statements are an integral part of this schedule.
136
Balanced Income Plus Fund
Schedule of Investments as of October 31, 2013
k | The interest rate shown reflects the yield, coupon rate or the discount rate at the date of purchase. |
Definitions:
| | |
ADR | | - American Depositary Receipt, which are certificates for an underlying foreign security’s shares held by an issuing U.S. depository bank. |
ETF | | - Exchange Traded Fund. |
Unrealized Appreciation (Depreciation)
Gross unrealized appreciation and depreciation of investments, based on cost for federal income tax purposes, were as follows:
| | | | |
Gross unrealized appreciation | | $ | 21,912,151 | |
Gross unrealized depreciation | | | (1,663,032 | ) |
| | | | |
Net unrealized appreciation (depreciation) | | $ | 20,249,119 | |
Cost for federal income tax purposes | | $ | 220,694,325 | |
The accompanying Notes to Financial Statements are an integral part of this schedule.
137
Balanced Income Plus Fund
Schedule of Investments as of October 31, 2013
Fair Valuation Measurements
The following table is a summary of the inputs used, as of October 31, 2013, in valuing Balanced Income Plus Fund’s assets carried at fair value.
| | | | | | | | | | | | | | | | |
Investments in Securities | | Total | | | Level 1 | | | Level 2 | | | Level 3 | |
| | | | |
Bank Loans | | | | | | | | | | | | | | | | |
Basic Materials | | | 2,091,173 | | | | – | | | | 2,091,173 | | | | – | |
Capital Goods | | | 2,046,087 | | | | – | | | | 2,046,087 | | | | – | |
Communications Services | | | 12,259,424 | | | | – | | | | 12,259,424 | | | | – | |
Consumer Cyclical | | | 6,123,496 | | | | – | | | | 6,123,496 | | | | – | |
Consumer Non-Cyclical | | | 4,570,373 | | | | – | | | | 4,570,373 | | | | – | |
Energy | | | 1,058,732 | | | | – | | | | 1,058,732 | | | | – | |
Financials | | | 1,406,981 | | | | – | | | | 1,406,981 | | | | – | |
Technology | | | 2,155,032 | | | | – | | | | 2,155,032 | | | | – | |
Transportation | | | 1,931,513 | | | | – | | | | 1,931,513 | | | | – | |
Utilities | | | 1,047,670 | | | | – | | | | 1,047,670 | | | | – | |
| | | | |
Common Stock | | | | | | | | | | | | | | | | |
Consumer Discretionary | | | 16,604,139 | | | | 16,604,139 | | | | – | | | | – | |
Consumer Staples | | | 12,147,278 | | | | 9,483,690 | | | | 2,663,588 | | | | – | |
Energy | | | 11,744,025 | | | | 11,744,025 | | | | – | | | | – | |
Financials | | | 20,735,890 | | | | 20,735,890 | | | | – | | | | – | |
Health Care | | | 12,887,762 | | | | 12,887,762 | | | | – | | | | – | |
Industrials | | | 14,914,831 | | | | 14,914,831 | | | | – | | | | – | |
Information Technology | | | 18,645,411 | | | | 18,645,411 | | | | – | | | | – | |
Materials | | | 3,696,940 | | | | 3,696,940 | | | | – | | | | – | |
Utilities | | | 2,840,630 | | | | 2,840,630 | | | | – | | | | – | |
| | | | |
Long-Term Fixed Income | | | | | | | | | | | | | | | | |
Asset-Backed Securities | | | 2,308,022 | | | | – | | | | 2,308,022 | | | | – | |
Basic Materials | | | 1,878,114 | | | | – | | | | 1,878,114 | | | | – | |
Capital Goods | | | 1,810,253 | | | | – | | | | 1,810,253 | | | | – | |
Collateralized Mortgage Obligations | | | 7,057,092 | | | | – | | | | 7,057,092 | | | | – | |
Commercial Mortgage-Backed | | | | | | | | | | | | | | | | |
Securities | | | 1,256,476 | | | | – | | | | 1,256,476 | | | | – | |
Communications Services | | | 5,118,593 | | | | – | | | | 5,118,593 | | | | – | |
Consumer Cyclical | | | 2,820,240 | | | | – | | | | 2,820,240 | | | | – | |
Consumer Non-Cyclical | | | 4,857,067 | | | | – | | | | 4,857,067 | | | | – | |
Energy | | | 2,838,467 | | | | – | | | | 2,838,467 | | | | – | |
Financials | | | 12,557,460 | | | | – | | | | 12,557,460 | | | | – | |
Foreign Government | | | 97,450 | | | | – | | | | 97,450 | | | | – | |
Mortgage-Backed Securities | | | 14,732,240 | | | | – | | | | 14,732,240 | | | | – | |
Technology | | | 1,958,456 | | | | – | | | | 1,958,456 | | | | – | |
Transportation | | | 1,147,452 | | | | – | | | | 1,147,452 | | | | – | |
U.S. Government and Agencies | | | 3,996,408 | | | | – | | | | 3,996,408 | | | | – | |
Utilities | | | 2,377,596 | | | | – | | | | 2,377,596 | | | | – | |
| | | | |
Preferred Stock | | | | | | | | | | | | | | | | |
Financials | | | 185,793 | | | | 118,314 | | | | 67,479 | | | | – | |
Short-Term Investments | | | 25,038,878 | | | | 24,239,009 | | | | 799,869 | | | | – | |
| |
Total | | | $240,943,444 | | | | $135,910,641 | | | | $105,032,803 | | | | $– | |
| |
| | | | |
Other Financial Instruments | | | Total | | | | Level 1 | | | | Level 2 | | | | Level 3 | |
| |
Asset Derivatives | | | | | | | | | | | | | | | | |
Futures Contracts | | | 93,940 | | | | 93,940 | | | | – | | | | – | |
| |
Total Asset Derivatives | | | $93,940 | | | | $93,940 | | | | $– | | | | $– | |
| |
There were no significant transfers between Levels during the period ended October 31, 2013. Transfers between Levels are identified as of the end of the period.
| | | | | | | | | | | | | | | | | | | | |
Futures Contracts | | Number of
Contracts Long/(Short) | | | Expiration Date | | | Notional
Principal
Amount | | | Value | | | Unrealized
Gain/(Loss) | |
30-Yr. U.S. Treasury Bond Futures | | | 10 | | | | December 2013 | | | | $1,313,390 | | | | $1,348,125 | | | | $34,735 | |
S&P 500 Index Futures | | | 5 | | | | December 2013 | | | | 2,129,545 | | | | 2,188,750 | | | | 59,205 | |
Total Futures Contracts | | | | | | | | | | | | | | | | | | | $93,940 | |
The accompanying Notes to Financial Statements are an integral part of this schedule.
138
Balanced Income Plus Fund
Schedule of Investments as of October 31, 2013
The following table summarizes the fair value and Statement of Assets and Liabilities location, as of October 31, 2013, for Balanced Income Plus Fund’s investments in financial derivative instruments by primary risk exposure as discussed under item (2) Significant Accounting Policies of the Notes to Financial Statements.
| | | | | | |
Derivatives by risk category | | Statement of Assets and Liabilities Location | | Fair Value | |
| | |
Asset Derivatives | | | | | | |
| | |
Interest Rate Contracts | | | | | | |
Futures* | | Net Assets - Net unrealized appreciation/(depreciation) on Futures contracts | | | 34,735 | |
Total Interest Rate Contracts | | | | | 34,735 | |
| | |
Equity Contracts | | | | | | |
Futures* | | Net Assets - Net unrealized appreciation/(depreciation) on Futures contracts | | | 59,205 | |
Total Equity Contracts | | | | | 59,205 | |
Total Asset Derivatives | | | | | $93,940 | |
| |
* | Includes cumulative appreciation/depreciation of futures contracts as reported in the Schedule of Investments. Only current day’s variation margin is reported within the Statement of Assets and Liabilities. |
The following table summarizes the net realized gains/(losses) and Statement of Operations location, for the period ended October 31, 2013, for Balanced Income Plus Fund’s investments in financial derivative instruments by primary risk exposure.
| | | | | | |
Derivatives by risk category | | Statement of Operations Location | | Realized Gains/(Losses)
recognized in Income | |
| | |
Interest Rate Contracts | | | | | | |
Futures | | Net realized gains/(losses) on Futures contracts | | | 138,286 | |
| | |
Total Interest Rate Contracts | | | | | 138,286 | |
| | |
Equity Contracts | | | | | | |
Futures | | Net realized gains/(losses) on Futures contracts | | | 332,838 | |
| | |
Total Equity Contracts | | | | | 332,838 | |
| | |
Foreign Exchange Contracts | | | | | | |
Forward Contracts | | Net realized gains/(losses) on Foreign currency transactions | | | 7,330 | |
| | |
Total Foreign Exchange Contracts | | | | | 7,330 | |
| | |
Credit Contracts | | | | | | |
Credit Default Swaps | | Net realized gains/(losses) on Swap agreements | | | (109,168 | ) |
Total Credit Contracts | | | (109,168 | ) |
| |
Total | | | $369,286 | |
| |
The accompanying Notes to Financial Statements are an integral part of this schedule.
139
Balanced Income Plus Fund
Schedule of Investments as of October 31, 2013
The following table summarizes the change in net unrealized appreciation/(depreciation) and Statement of Operations location, for the period ended October 31, 2013, for Balanced Income Plus Fund’s investments in financial derivative instruments by primary risk exposure.
| | | | | | |
Derivatives by risk category | | Statement of Operations Location | | Change in unrealized
appreciation/(depreciation)
recognized in Income | |
| | |
Interest Rate Contracts | | | | | | |
Futures | | Change in net unrealized appreciation/(depreciation) on Futures contracts | | | 39,337 | |
| | |
Total Interest Rate Contracts | | | | | 39,337 | |
| | |
Equity Contracts | | | | | | |
Futures | | Change in net unrealized appreciation/(depreciation) on Futures contracts | | | 59,205 | |
| | |
Total Equity Contracts | | | | | 59,205 | |
| | |
Credit Contracts | | | | | | |
Credit Default Swaps | | Change in net unrealized appreciation/(depreciation) on Swap agreements | | | 38,580 | |
Total Credit Contracts | | | | | 38,580 | |
| |
Total | | | $137,122 | |
| |
The following table presents Balanced Income Plus Fund’s average volume of derivative activity during the period ended October 31, 2013.
| | | | | | | | | | | | | | | | | | | | | | | | |
Derivative Risk Category | | Futures
(Notional)* | | | Futures
(Percentage
of Average
Net Assets) | | | Forwards
(Notional)* | | | Forwards
(Percentage
of Average
Net Assets) | | | Swaps
(Notional)* | | | Swaps
(Percentage
of Average
Net Assets) | |
Equity Contracts | | | $1,472,963 | | | | 0.7% | | | | N/A | | | | N/A | | | | N/A | | | | N/A | |
Interest Rate Contracts | | | 10,536,179 | | | | 5.2 | | | | N/A | | | | N/A | | | | N/A | | | | N/A | |
Foreign Exchange Contracts | | | N/A | | | | N/A | | | | $12,948 | | | | <0.1% | | | | N/A | | | | N/A | |
Credit Contracts | | | N/A | | | | N/A | | | | N/A | | | | N/A | | | | $1,063,151 | | | | 0.5% | |
* | Notional amount represents long or short, or both, derivative positions held by the Fund. |
Investment in Affiliates
Affiliated issuers, as defined under the Investment Company Act of 1940, include those in which the Fund’s holdings of an issuer represent 5% or more of the outstanding voting securities of an issuer, or any affiliated mutual fund.
A summary of transactions for the fiscal year to date, in Balanced Income Plus Fund, is as follows:
| | | | | | | | | | | | | | | | | | | | | | | | |
Fund | | Value
October 31, 2012 | | | Gross
Purchases | | | Gross Sales | | | Shares Held at
October 31, 2013 | | | Value
October 31, 2013 | | | Income Earned
November 1, 2012 -
October 31, 2013 | |
High Yield | | | $1,834,321 | | | | $– | | | | $1,824,463 | | | | – | | | | $– | | | | $85,870 | |
Cash Management Trust- Collateral Investment | | | 1,067,718 | | | | 30,769,615 | | | | 31,837,333 | | | | – | | | | – | | | | 6,921 | |
Cash Management Trust- Short Term Investment | | | 13,922,888 | | | | 127,598,748 | | | | 117,282,627 | | | | 24,239,009 | | | | 24,239,009 | | | | 18,867 | |
Total Value and Income Earned | | | 16,824,927 | | | | | | | | | | | | | | | | 24,239,009 | | | | 111,658 | |
The accompanying Notes to Financial Statements are an integral part of this schedule.
140
Opportunity Income Plus Fund
Schedule of Investments as of October 31, 2013
| | | | | | | | |
Principal
Amount | | | Bank Loans (39.3%)a | | Value | |
| Basic Materials (1.8%) | | | | |
| | | | FMG Resources August 2006 Pty., Ltd., Term Loan | | | | |
| $ | 2,294,207 | | | 5.250%, 10/18/2017 | | $ | 2,297,510 | |
| | | | Ineos Group Holdings, Ltd., Term Loan | | | | |
| | 2,278,908 | | | 4.000%, 5/4/2018b,c | | | 2,285,472 | |
| | | | | |
| | | | Total | | | 4,582,982 | |
| | | | | |
| |
| Capital Goods (2.8%) | | | | |
| | | | ADS Waste Holdings, Term Loan | | | | |
| | 2,253,025 | | | 4.250%, 10/9/2019 | | | 2,264,695 | |
| | | | Berry Plastics Group, Inc., Term Loan | | | | |
| | 258,700 | | | 3.500%, 2/8/2020 | | | 257,650 | |
| | | | Rexnord, LLC, Term Loan | | | | |
| | 2,250,000 | | | 4.000%, 8/21/2020 | | | 2,251,125 | |
| | | | Silver II Borrower, Term Loan | | | | |
| | 2,244,346 | | | 4.000%, 12/13/2019 | | | 2,241,945 | |
| | | | | |
| | | | Total | | | 7,015,415 | |
| | | | | |
| |
| Communications Services (14.7%) | | | | |
| | | | Cincinnati Bell, Inc., Term Loan | | | | |
| | 1,125,000 | | | 4.000%, 9/10/2020 | | | 1,119,724 | |
| | | | Clear Channel Communications, Inc., Term Loan | | | | |
| | 65,830 | | | 3.836%, 1/29/2016 | | | 63,808 | |
| | 2,219,170 | | | 6.918%, 1/30/2019 | | | 2,108,500 | |
| | | | Fairpoint Communications, Term Loan | | | | |
| | 2,019,925 | | | 7.500%, 2/14/2019b,c | | | 2,057,233 | |
| | | | Grande Communications Networks, LLC, Term Loan | | | | |
| | 2,279,287 | | | 4.500%, 5/29/2020 | | | 2,270,740 | |
| | | | Hargray Communications Group, Inc., Term Loan | | | | |
| | 2,279,288 | | | 4.750%, 6/26/2019 | | | 2,292,576 | |
| | | | Integra Telecom Holdings, Inc., Term Loan | | | | |
| | 2,278,625 | | | 5.250%, 2/22/2019 | | | 2,303,302 | |
| | | | Level 3 Communications, Inc., Term Loan | | | | |
| | 2,250,000 | | | 4.000%, 8/1/2019 | | | 2,259,382 | |
| | | | LTS Buyer, LLC, Term Loan | | | | |
| | 2,244,375 | | | 4.500%, 4/13/2020 | | | 2,250,929 | |
| | | | McGraw-Hill Global Education Holdings, LLC, Term Loan | | | | |
| | 2,283,936 | | | 9.000%, 3/22/2019 | | | 2,322,489 | |
| | | | NEP Broadcasting, LLC, Term Loan | | | | |
| | 258,050 | | | 4.750%, 1/22/2020 | | | 258,695 | |
| | | | NTelos, Inc., Term Loan | | | | |
| | 2,244,332 | | | 5.750%, 11/9/2019 | | | 2,252,749 | |
| | | | Puerto Rico Cable Acquisition Company, Inc., Term Loan | | | | |
| | 2,246,597 | | | 5.500%, 7/31/2018 | | | 2,243,788 | |
| | | | TNS, Inc., Term Loan | | | | |
| | 250,370 | | | 5.000%, 2/14/2020 | | | 251,830 | |
| | | | Univision Communications, Inc., Term Loan | | | | |
| | 2,278,625 | | | 4.500%, 3/1/2020 | | | 2,290,018 | |
| | | | Virgin Media Investment Holdings, Ltd., Term Loan | | | | |
| | 2,285,000 | | | 3.500%, 6/8/2020 | | | 2,283,972 | |
| | | | Visant Corporation, Term Loan | | | | |
| | 1,575,000 | | | 5.250%, 12/22/2016 | | | 1,544,618 | |
| | | | WideOpenWest Finance, LLC, Term Loan | | | | |
| | 2,278,625 | | | 4.750%, 4/1/2019 | | | 2,296,672 | |
| | | | WMG Acquisition Corporation, Term Loan | | | | |
| | 260,000 | | | 3.750%, 7/1/2020 | | | 260,081 | |
| | | | Yankee Cable Acquisition, LLC, Term Loan | | | | |
| | 2,274,452 | | | 5.250%, 3/1/2020 | | | 2,284,050 | |
| | | | Zayo Group, LLC, Term Loan | | | | |
| | 2,277,927 | | | 4.500%, 7/2/2019 | | | 2,287,904 | |
| | | | | |
| | | | Total | | | 37,303,060 | |
| | | | | |
| |
| Consumer Cyclical (5.6%) | | | | |
| | | | Bally Technologies, Inc., Term Loan | | | | |
| | 1,170,000 | | | 0.000%, 7/16/2021b,c | | | 1,172,925 | |
| | | | Booz Allen Hamilton, Inc., Term Loan | | | | |
| | 1,122,166 | | | 3.750%, 7/31/2019 | | | 1,121,470 | |
| | | | Burlington Coat Factory Warehouse Corporation, Term Loan | | | | |
| | 2,250,000 | | | 4.250%, 2/23/2017 | | | 2,264,760 | |
| | | | Ceridian Corporation, Term Loan | | | | |
| | 2,250,000 | | | 4.420%, 5/9/2017 | | | 2,260,687 | |
| | | | Chrysler Group, LLC, Term Loan | | | | |
| | 258,677 | | | 4.250%, 5/24/2017 | | | 260,876 | |
| | | | J.C. Penney Corporation, Inc., Term Loan | | | | |
| | 2,279,287 | | | 6.000%, 5/22/2018 | | | 2,202,681 | |
| | | | ROC Finance, LLC, Term Loan | | | | |
| | 260,000 | | | 5.000%, 6/20/2019 | | | 254,150 | |
| | | | Scientific Games International, Inc., Term Loan | | | | |
| | 2,285,000 | | | 4.250%, 10/18/2020b,c | | | 2,285,000 | |
| | | | Seminole Hard Rock Entertainment, Inc., Term Loan | | | | |
| | 129,675 | | | 3.500%, 5/14/2020 | | | 128,946 | |
| | | | Seminole Indian Tribe of Florida, Term Loan | | | | |
| | 250,900 | | | 3.000%, 4/29/2020 | | | 250,220 | |
| | | | Toys R Us, Inc., Term Loan | | | | |
| | 2,244,090 | | | 5.250%, 5/25/2018 | | | 2,023,182 | |
| | | | | |
| | | | Total | | | 14,224,897 | |
| | | | | |
| |
| Consumer Non-Cyclical (3.7%) | | | | |
| | | | Albertsons, LLC, Term Loan | | | | |
| | 2,503,061 | | | 4.750%, 3/21/2019 | | | 2,509,268 | |
| | | | Del Monte Corporation, Term Loan | | | | |
| | 38,792 | | | 4.000%, 3/8/2018 | | | 38,792 | |
| | | | Roundy’s Supermarkets, Inc., Term Loan | | | | |
| | 2,244,304 | | | 5.750%, 2/13/2019 | | | 2,216,250 | |
| | | | Supervalu, Inc., Term Loan | | | | |
| | 2,310,280 | | | 5.000%, 3/21/2019 | | | 2,323,426 | |
The accompanying Notes to Financial Statements are an integral part of this schedule.
141
Opportunity Income Plus Fund
Schedule of Investments as of October 31, 2013
| | | | | | | | |
Principal
Amount | | | Bank Loans (39.3%)a | | Value | |
| Consumer Non-Cyclical (3.7%) - continued | | | | |
| | | | Van Wagner Communications, LLC, Term Loan | | | | |
| | $2,238,750 | | | 6.250%, 8/3/2018 | | | $2,271,391 | |
| | | | | |
| | | | Total | | | 9,359,127 | |
| | | | | |
| |
| Energy (1.8%) | | | | |
| | | | Arch Coal, Inc., Term Loan | | | | |
| | 2,244,320 | | | 5.750%, 5/16/2018 | | | 2,174,657 | |
| | | | Offshore Group Investment, Ltd., Term Loan | | | | |
| | 129,350 | | | 5.750%, 3/28/2019 | | | 130,118 | |
| | | | Pacific Drilling SA, Term Loan | | | | |
| | 2,279,288 | | | 4.500%, 6/3/2018 | | | 2,286,878 | |
| | | | | |
| | | | Total | | | 4,591,653 | |
| | | | | |
| |
| Financials (1.0%) | | | | |
| | | | Harland Clarke Holdings Corporation, Term Loan | | | | |
| | 2,270,719 | | | 7.000%, 5/22/2018 | | | 2,278,099 | |
| | | | WaveDivision Holdings, LLC, Term Loan | | | | |
| | 258,050 | | | 4.000%, 10/12/2019 | | | 258,695 | |
| | | | | |
| | | | Total | | | 2,536,794 | |
| | | | | |
| |
| Technology (2.8%) | | | | |
| | | | BMC Software, Inc., Term Loan | | | | |
| | 2,250,000 | | | 5.000%, 9/10/2020 | | | 2,271,375 | |
| | | | First Data Corporation Extended, Term Loan | | | | |
| | 2,285,000 | | | 4.170%, 3/23/2018 | | | 2,285,823 | |
| | | | Freescale Semiconductor, Inc., Term Loan | | | | |
| | 2,278,625 | | | 5.000%, 3/1/2020 | | | 2,298,130 | |
| | | | SunGard Data Systems, Inc., Term Loan | | | | |
| | 129,350 | | | 4.000%, 3/8/2020 | | | 130,223 | |
| | | | | |
| | | | Total | | | 6,985,551 | |
| | | | | |
| |
| Transportation (3.5%) | | | | |
| | | | American Airlines, Inc., Term Loan | | | | |
| | 4,523,662 | | | 4.750%, 6/27/2019 | | | 4,547,231 | |
| | | | American Petroleum Tankers Parent, LLC, Term Loan | | | | |
| | 2,034,406 | | | 4.750%, 10/2/2019 | | | 2,034,406 | |
| | | | U.S. Airways, Inc., Term Loan | | | | |
| | 2,235,000 | | | 4.250%, 5/23/2019 | | | 2,235,938 | |
| | | | | |
| | | | Total | | | 8,817,575 | |
| | | | | |
| |
| Utilities (1.6%) | | | | |
| | | | Calpine Corporation, Term Loan | | | | |
| | 258,015 | | | 4.000%, 4/1/2018 | | | 259,048 | |
| | 1,500,000 | | | 4.000%, 10/30/2020b,c | | | 1,505,385 | |
| | | | Intergen NV, Term Loan | | | | |
| | 2,279,288 | | | 5.500%, 6/15/2020 | | | 2,273,589 | |
| | | | | |
| | | | Total | | | 4,038,022 | |
| | | | | |
| | | | | | | | |
| | | | | |
| | | | Total Bank Loans (cost $99,586,888) | | | 99,455,076 | |
| | | | | |
| | |
Principal
Amount | | | Long-Term Fixed Income (57.7%) | | Value | |
| Asset-Backed Securities (4.1%) | | | | |
| | | | Asset Backed Securities Corporation Home Equity Loan Trust | | | | |
| | 1,005,125 | | | 0.310%, 7/25/2036d | | | 894,864 | |
| | | | Countrywide Asset-Backed Certificates | | | | |
| | 652,395 | | | 5.859%, 10/25/2046 | | | 442,968 | |
| | | | Credit Based Asset Servicing and Securitization, LLC | | | | |
| | 701,971 | | | 3.939%, 12/25/2036 | | | 460,070 | |
| | | | First Horizon ABS Trust | | | | |
| | 1,142,866 | | | 0.300%, 10/25/2026d,e | | | 1,053,638 | |
| | 1,104,943 | | | 0.330%, 10/25/2034d,e | | | 912,722 | |
| | | | GMAC Mortgage Corporation Loan Trust | | | | |
| | 1,804,405 | | | 0.350%, 8/25/2035d,e | | | 1,504,120 | |
| | 1,473,242 | | | 0.350%, 12/25/2036d,e | | | 1,258,412 | |
| | | | Popular ABS Mortgage Pass-Through Trust | | | | |
| | 900,000 | | | 5.297%, 11/25/2035 | | | 765,206 | |
| | | | Renaissance Home Equity Loan Trust | | | | |
| | 1,419,777 | | | 5.608%, 5/25/2036 | | | 1,007,918 | |
| | 982,786 | | | 5.285%, 1/25/2037 | | | 538,113 | |
| | | | Wachovia Asset Securitization, Inc. | | | | |
| | 1,855,051 | | | 0.310%, 7/25/2037d,e,f | | | 1,604,807 | |
| | | | | |
| | | | Total | | | 10,442,838 | |
| | | | | |
| |
| Basic Materials (1.6%) | | | | |
| | | | Barrick Gold Corporation | | | | |
| | 202,000 | | | 2.900%, 5/30/2016 | | | 207,060 | |
| | | | BHP Billiton Finance USA, Ltd. | | | | |
| | 408,000 | | | 2.050%, 9/30/2018 | | | 410,068 | |
| | | | FMG Resources Pty. Ltd. | | | | |
| | 469,079 | | | 6.875%, 2/1/2018g | | | 497,224 | |
| | | | Hexion US Finance Corporation/Hexion Nova Scotia Finance ULC | | | | |
| | 469,079 | | | 8.875%, 2/1/2018 | | | 483,151 | |
| | | | Ineos Finance plc | | | | |
| | 394,000 | | | 7.500%, 5/1/2020g | | | 430,445 | |
| | | | Inmet Mining Corporation | | | | |
| | 469,079 | | | 8.750%, 6/1/2020g | | | 518,332 | |
| | | | LyondellBasell Industries NV | | | | |
| | 314,000 | | | 5.000%, 4/15/2019 | | | 351,499 | |
| | | | NOVA Chemicals Corporation | | | | |
| | 703,617 | | | 5.250%, 8/1/2023g | | | 717,689 | |
| | | | Xstrata Finance Canada, Ltd. | | | | |
| | 208,000 | | | 2.050%, 10/23/2015g | | | 209,647 | |
| | 332,000 | | | 2.700%, 10/25/2017g | | | 333,579 | |
| | | | | |
| | | | Total | | | 4,158,694 | |
| | | | | |
| |
| Capital Goods (1.6%) | | | | |
| | | | BAE Systems plc | | | | |
| | 202,000 | | | 3.500%, 10/11/2016g | | | 211,376 | |
| | | | Cemex Finance, LLC | | | | |
| | 469,079 | | | 9.375%, 10/12/2017g | | | 526,541 | |
| | | | CNH Capital, LLC | | | | |
| | 469,079 | | | 3.625%, 4/15/2018 | | | 475,529 | |
| | | | Eaton Corporation | | | | |
| | 200,000 | | | 1.500%, 11/2/2017g | | | 197,997 | |
| | | | John Deere Capital Corporation | | | | |
| | 404,000 | | | 1.050%, 10/11/2016 | | | 405,443 | |
The accompanying Notes to Financial Statements are an integral part of this schedule.
142
Opportunity Income Plus Fund
Schedule of Investments as of October 31, 2013
| | | | | | | | |
Principal
Amount | | | Long-Term Fixed Income (57.7%) | | Value | |
| Capital Goods (1.6%) - continued | | | | |
| | | | Nortek, Inc. | | | | |
| | $469,079 | | | 8.500%, 4/15/2021 | | | $514,228 | |
| | | | Reynolds Group Issuer, Inc. | | | | |
| | 469,079 | | | 9.875%, 8/15/2019 | | | 518,919 | |
| | | | Roper Industries, Inc. | | | | |
| | 500,000 | | | 1.850%, 11/15/2017 | | | 499,980 | |
| | | | Textron, Inc. | | | | |
| | 202,000 | | | 4.625%, 9/21/2016 | | | 217,834 | |
| | | | United Rentals North America, Inc. | | | | |
| | 376,000 | | | 7.375%, 5/15/2020 | | | 419,240 | |
| | | | | |
| | | | Total | | | 3,987,087 | |
| | | | | |
| |
| Collateralized Mortgage Obligations (4.5%) | | | | |
| | | | Banc of America Alternative Loan Trust 2005-10 | | | | |
| | 1,077,784 | | | 6.000%, 11/25/2035 | | | 888,321 | |
| | | | Countrywide Alternative Loan Trust | | | | |
| | 624,025 | | | 6.500%, 8/25/2036 | | | 427,728 | |
| | 986,985 | | | 6.000%, 1/25/2037 | | | 787,757 | |
| | 708,863 | | | 5.500%, 5/25/2037 | | | 589,832 | |
| | | | Credit Suisse First Boston Mortgage Securities Corporation | | | | |
| | 515,697 | | | 5.250%, 10/25/2035 | | | 500,380 | |
| | | | GMAC Mortgage Corporation Loan Trust | | | | |
| | 573,141 | | | 5.340%, 9/19/2035 | | | 561,364 | |
| | | | HomeBanc Mortgage Trust | | | | |
| | 1,541,097 | | | 2.408%, 4/25/2037 | | | 1,070,095 | |
| | | | J.P. Morgan Alternative Loan Trust | | | | |
| | 1,827,872 | | | 2.679%, 3/25/2036 | | | 1,411,188 | |
| | 611,823 | | | 6.500%, 3/25/2036 | | | 535,233 | |
| | | | J.P. Morgan Mortgage Trust | | | | |
| | 662,596 | | | 2.651%, 1/25/2037 | | | 574,472 | |
| | | | Lehman Mortgage Trust | | | | |
| | 370,127 | | | 6.000%, 1/25/2036 | | | 333,530 | |
| | | | Master Asset Securitization Trust | | | | |
| | 554,581 | | | 0.670%, 6/25/2036d | | | 350,695 | |
| | | | MortgageIT Trust | | | | |
| | 1,101,853 | | | 0.430%, 12/25/2035d | | | 993,309 | |
| | | | Residential Accredit Loans, Inc. | | | | |
| | 449,524 | | | 3.526%, 9/25/2035 | | | 368,789 | |
| | | | RFMSI Series 2007-S7 Trust | | | | |
| | 1,018,879 | | | 6.000%, 7/25/2037 | | | 910,425 | |
| | | | WaMu Mortgage Pass Through Certificates | | | | |
| | 281,853 | | | 2.394%, 8/25/2046 | | | 234,401 | |
| | | | Wells Fargo Mortgage Backed Securities Trust | | | | |
| | 681,011 | | | 2.634%, 7/25/2036 | | | 631,232 | |
| | 399,369 | | | 6.000%, 7/25/2037 | | | 378,604 | |
| | | | | |
| | | | Total | | | 11,547,355 | |
| | | | | |
| |
| Commercial Mortgage-Backed Securities (2.6%) | | | | |
| | | | Commercial Mortgage Pass-Through Certificates | | | | |
| | 1,134,342 | | | 0.304%, 12/15/2020d,g | | | 1,118,146 | |
| | | | Credit Suisse Mortgage Capital Certificates | | | | |
| | 1,478,840 | | | 0.344%, 10/15/2021d,g | | | 1,472,995 | |
| | 1,126,472 | | | 5.467%, 9/15/2039 | | | 1,232,681 | |
| | | | Government National Mortgage Association | | | | |
| | 287,130 | | | 3.214%, 1/16/2040 | | | 291,429 | |
| | | | LB-UBS Commercial Mortgage Trust | | | | |
| | 531,470 | | | 5.866%, 9/15/2045 | | | 595,651 | |
| | | | Wachovia Bank Commercial Mortgage Trust | | | | |
| | 1,695,000 | | | 5.765%, 7/15/2045 | | | 1,829,153 | |
| | | | | |
| | | | Total | | | 6,540,055 | |
| | | | | |
| |
| Communications Services (3.9%) | | | | |
| | | | AMC Networks, Inc. | | | | |
| | 469,079 | | | 7.750%, 7/15/2021 | | | 527,714 | |
| | | | America Movil SAB de CV | | | | |
| | 500,000 | | | 1.256%, 9/12/2016d | | | 504,363 | |
| | 134,000 | | | 5.000%, 10/16/2019 | | | 147,798 | |
| | | | American Tower Corporation | | | | |
| | 202,000 | | | 7.000%, 10/15/2017 | | | 234,528 | |
| | | | AT&T, Inc. | | | | |
| | 425,000 | | | 2.400%, 8/15/2016 | | | 439,642 | |
| | | | British Telecommunications plc | | | | |
| | 200,000 | | | 1.625%, 6/28/2016 | | | 202,646 | |
| | | | CC Holdings GS V, LLC | | | | |
| | 303,000 | | | 2.381%, 12/15/2017 | | | 299,946 | |
| | | | CCO Holdings, LLC | | | | |
| | 469,079 | | | 7.000%, 1/15/2019 | | | 497,224 | |
| | | | CenturyLink, Inc. | | | | |
| | 469,079 | | | 5.625%, 4/1/2020 | | | 476,702 | |
| | | | Digicel, Ltd. | | | | |
| | 469,079 | | | 6.000%, 4/15/2021g | | | 455,007 | |
| | | | DIRECTV Holdings, LLC | | | | |
| | 241,000 | | | 3.500%, 3/1/2016 | | | 252,429 | |
| | | | Hughes Satellite Systems Corporation | | | | |
| | 376,000 | | | 6.500%, 6/15/2019 | | | 403,260 | |
| | | | Intelsat Jackson Holdings SA | | | | |
| | 469,079 | | | 7.250%, 10/15/2020 | | | 508,951 | |
| | | | Level 3 Financing, Inc. | | | | |
| | 376,000 | | | 8.625%, 7/15/2020 | | | 425,820 | |
| | | | NBC Universal Enterprise, Inc. | | | | |
| | 500,000 | | | 1.662%, 4/15/2018g | | | 495,140 | |
| | | | Qwest Communications International, Inc. | | | | |
| | 450,000 | | | 7.125%, 4/1/2018 | | | 466,875 | |
| | | | SBA Tower Trust | | | | |
| | 406,000 | | | 5.101%, 4/17/2017g | | | 439,078 | |
| | | | Sprint Nextel Corporation | | | | |
| | 469,079 | | | 9.000%, 11/15/2018g | | | 568,758 | |
| | | | Telefonica Emisiones SAU | | | | |
| | 200,000 | | | 3.729%, 4/27/2015 | | | 206,797 | |
| | | | T-Mobile USA, Inc. | | | | |
| | 525,000 | | | 6.633%, 4/28/2021 | | | 555,188 | |
| | | | Verizon Communications, Inc. | | | | |
| | 600,000 | | | 2.500%, 9/15/2016 | | | 622,623 | |
| | 200,000 | | | 2.002%, 9/14/2018d | | | 211,158 | |
| | 380,000 | | | 3.650%, 9/14/2018 | | | 404,150 | |
The accompanying Notes to Financial Statements are an integral part of this schedule.
143
Opportunity Income Plus Fund
Schedule of Investments as of October 31, 2013
| | | | | | | | |
Principal
Amount | | | Long-Term Fixed Income (57.7%) | | Value | |
| Communications Services (3.9%) - continued | | | | |
| | | | Wind Acquisition Finance SA | | | | |
| | $469,079 | | | 11.750%, 7/15/2017g | | | $498,396 | |
| | | | | |
| | | | Total | | | 9,844,193 | |
| | | | | |
| |
| Consumer Cyclical (2.3%) | | | | |
| | | | Amazon.com, Inc. | | | | |
| | 292,000 | | | 1.200%, 11/29/2017 | | | 286,501 | |
| | | | Chrysler Group, LLC | | | | |
| | 469,079 | | | 8.250%, 6/15/2021 | | | 530,646 | |
| | | | Cinemark USA, Inc. | | | | |
| | 394,000 | | | 4.875%, 6/1/2023 | | | 375,285 | |
| | | | Ford Motor Credit Company, LLC | | | | |
| | 462,000 | | | 3.984%, 6/15/2016 | | | 492,054 | |
| | 265,000 | | | 3.000%, 6/12/2017 | | | 275,845 | |
| | 203,000 | | | 5.000%, 5/15/2018 | | | 224,955 | |
| | | | General Motors Company | | | | |
| | 408,000 | | | 3.500%, 10/2/2018g | | | 416,160 | |
| | | | General Motors Financial Company, Inc. | | | | |
| | 469,079 | | | 3.250%, 5/15/2018g | | | 467,320 | |
| | | | Jaguar Land Rover Automotive plc | | | | |
| | 376,000 | | | 5.625%, 2/1/2023g | | | 373,180 | |
| | | | L Brands, Inc. | | | | |
| | 376,000 | | | 6.625%, 4/1/2021 | | | 413,600 | |
| | | | Macy’s Retail Holdings, Inc. | | | | |
| | 362,000 | | | 7.450%, 7/15/2017 | | | 429,901 | |
| | | | Royal Caribbean Cruises, Ltd. | | | | |
| | 469,079 | | | 5.250%, 11/15/2022 | | | 469,079 | |
| | | | Toyota Motor Credit Corporation | | | | |
| | 202,000 | | | 2.000%, 10/24/2018 | | | 202,944 | |
| | | | West Corporation | | | | |
| | 469,079 | | | 8.625%, 10/1/2018 | | | 511,296 | |
| | | | Wynn Las Vegas, LLC | | | | |
| | 376,000 | | | 5.375%, 3/15/2022 | | | 386,833 | |
| | | | | |
| | | | Total | | | 5,855,599 | |
| | | | | |
| |
| Consumer Non-Cyclical (3.9%) | | | | |
| | | | AbbVie, Inc. | | | | |
| | 422,000 | | | 1.750%, 11/6/2017 | | | 423,286 | |
| | | | Altria Group, Inc. | | | | |
| | 202,000 | | | 9.700%, 11/10/2018 | | | 271,257 | |
| | | | Anheuser-Busch InBev Worldwide, Inc. | | | | |
| | 404,000 | | | 7.750%, 1/15/2019 | | | 511,634 | |
| | | | Biomet, Inc. | | | | |
| | 469,079 | | | 6.500%, 8/1/2020 | | | 498,397 | |
| | | | Boston Scientific Corporation | | | | |
| | 241,000 | | | 2.650%, 10/1/2018 | | | 242,970 | |
| | | | Celgene Corporation | | | | |
| | 255,000 | | | 1.900%, 8/15/2017 | | | 257,221 | |
| | | | CHS/Community Health Systems, Inc. | | | | |
| | 376,000 | | | 7.125%, 7/15/2020 | | | 395,740 | |
| | | | Edwards Lifesciences Corporation | | | | |
| | 204,000 | | | 2.875%, 10/15/2018 | | | 204,782 | |
| | | | Emergency Medical Services Corporation | | | | |
| | 469,079 | | | 8.125%, 6/1/2019 | | | 509,561 | |
| | | | Endo Health Solutions, Inc. | | | | |
| | 469,079 | | | 7.250%, 1/15/2022 | | | 499,569 | |
| | | | Express Scripts Holding Company | | | | |
| | 241,000 | | | 3.125%, 5/15/2016 | | | 252,909 | |
| | | | Fresenius Medical Care US Finance, Inc. | | | | |
| | 469,079 | | | 5.750%, 2/15/2021g | | | 496,051 | |
| | | | Gilead Sciences, Inc. | | | | |
| | 241,000 | | | 3.050%, 12/1/2016 | | | 254,810 | |
| | | | Hawk Acquisition Sub, Inc. | | | | |
| | 376,000 | | | 4.250%, 10/15/2020g | | | 363,780 | |
| | | | HCA, Inc. | | | | |
| | 469,079 | | | 4.750%, 5/1/2023 | | | 452,075 | |
| | | | Health Management Associates, Inc. | | | | |
| | 469,079 | | | 7.375%, 1/15/2020 | | | 523,023 | |
| | | | Heineken NV | | | | |
| | 111,000 | | | 1.400%, 10/1/2017g | | | 109,659 | |
| | | | IMS Health, Inc. | | | | |
| 375,000 | | | 6.000%, 11/1/2020g | | | 390,000 | |
| | | | JBS Finance II, Ltd. | | | | |
| | 469,079 | | | 8.250%, 1/29/2018f | | | 491,360 | |
| | | | Lorillard Tobacco Company | | | | |
| | 202,000 | | | 8.125%, 6/23/2019 | | | 249,250 | |
| | | | Pernod Ricard SA | | | | |
| | 200,000 | | | 2.950%, 1/15/2017g | | | 208,682 | |
| | | | Revlon Consumer Products Corporation | | | | |
| | 469,079 | | | 5.750%, 2/15/2021g | | | 463,216 | |
| | | | Safeway, Inc. | | | | |
| | 404,000 | | | 3.400%, 12/1/2016 | | | 416,907 | |
| | | | Spectrum Brands Escrow Corporation | | | | |
| | 376,000 | | | 6.375%, 11/15/2020g | | | 399,500 | |
| | | | Valeant Pharmaceuticals International | | | | |
| | 469,079 | | | 7.250%, 7/15/2022g | | | 510,123 | |
| | | | Watson Pharmaceuticals, Inc. | | | | |
| | 303,000 | | | 1.875%, 10/1/2017 | | | 302,250 | |
| | | | WM Wrigley Jr. Company | | | | |
| | 202,000 | | | 2.000%, 10/20/2017g | | | 203,761 | |
| | | | | |
| | | | Total | | | 9,901,773 | |
| | | | | |
| |
| Energy (2.1%) | | | | |
| | | | BP Capital Markets plc | | | | |
| | 408,000 | | | 2.241%, 9/26/2018 | | | 412,158 | |
| | | | Concho Resources, Inc. | | | | |
| | 469,079 | | | 6.500%, 1/15/2022 | | | 512,469 | |
| | | | Energy Transfer Partners, LP | | | | |
| | 134,000 | | | 6.700%, 7/1/2018 | | | 157,674 | |
| | | | Harvest Operations Corporation | | | | |
| | 469,079 | | | 6.875%, 10/1/2017 | | | 503,674 | |
| | | | Hess Corporation | | | | |
| | 241,000 | | | 8.125%, 2/15/2019 | | | 303,664 | |
| | | | Kodiak Oil & Gas Corporation | | | | |
| | 469,079 | | | 5.500%, 1/15/2021g | | | 480,806 | |
| | | | Linn Energy, LLC | | | | |
| | 469,079 | | | 8.625%, 4/15/2020 | | | 499,569 | |
| | | | MEG Energy Corporation | | | | |
| | 376,000 | | | 6.375%, 1/30/2023g | | | 378,350 | |
| | | | Oasis Petroleum, Inc. | | | | |
| | 376,000 | | | 6.875%, 1/15/2023 | | | 407,960 | |
| | | | Petrobras Global Finance BV | | | | |
| | 300,000 | | | 2.000%, 5/20/2016 | | | 298,110 | |
| | | | Range Resources Corporation | | | | |
| | 661,400 | | | 5.000%, 8/15/2022 | | | 660,573 | |
| | | | Suncor Energy, Inc. | | | | |
| | 202,000 | | | 6.100%, 6/1/2018 | | | 237,519 | |
The accompanying Notes to Financial Statements are an integral part of this schedule.
144
Opportunity Income Plus Fund
Schedule of Investments as of October 31, 2013
| | | | | | | | |
Principal
Amount | | | Long-Term Fixed Income (57.7%) | | Value | |
| Energy (2.1%) - continued | | | | |
| | | | Transocean, Inc. | | | | |
| $ | 241,000 | | | 5.050%, 12/15/2016 | | | $265,466 | |
| | | | Weatherford International, Ltd. | | | | |
| | 202,000 | | | 6.000%, 3/15/2018 | | | 227,816 | |
| | | | | |
| | | | Total | | | 5,345,808 | |
| | | | | |
| |
| Financials (10.1%) | | | | |
| | | | American International Group, Inc. | | | | |
| | 404,000 | | | 8.250%, 8/15/2018 | | | 511,085 | |
| | | | Aviation Capital Group Corporation | | | | |
| | 204,000 | | | 3.875%, 9/27/2016g | | | 206,510 | |
| | | | Bank of America Corporation | | | | |
| | 400,000 | | | 5.750%, 8/15/2016 | | | 442,654 | |
| | 405,000 | | | 5.750%, 12/1/2017 | | | 463,064 | |
| | 400,000 | | | 1.320%, 3/22/2018d | | | 404,639 | |
| | 400,000 | | | 5.650%, 5/1/2018 | | | 456,272 | |
| | 202,000 | | | 2.600%, 1/15/2019 | | | 203,365 | |
| | 200,000 | | | 5.625%, 7/1/2020 | | | 229,202 | |
| | | | Bank of New York Mellon Corporation | | | | |
| | 160,000 | | | 4.500%, 12/31/2049h | | | 146,000 | |
| | | | Barclays Bank plc | | | | |
| | 221,000 | | | 5.140%, 10/14/2020 | | | 235,813 | |
| | | | BB&T Corporation | | | | |
| | 202,000 | | | 2.050%, 6/19/2018 | | | 202,339 | |
| | | | BBVA Banco Continental SA | | | | |
| | 202,000 | | | 2.250%, 7/29/2016g | | | 201,495 | |
| | | | BBVA US Senior SAU | | | | |
| | 400,000 | | | 4.664%, 10/9/2015 | | | 421,159 | |
| | | | Bear Stearns Companies, LLC | | | | |
| | 404,000 | | | 6.400%, 10/2/2017 | | | 472,476 | |
| | | | BNP Paribas SA | | | | |
| | 303,000 | | | 2.375%, 9/14/2017 | | | 309,794 | |
| | | | Capital One Financial Corporation | | | | |
| | 202,000 | | | 6.150%, 9/1/2016 | | | 226,565 | |
| | | | Citigroup, Inc. | | | | |
| | 400,000 | | | 5.000%, 9/15/2014 | | | 413,930 | |
| | 200,000 | | | 1.198%, 7/25/2016d | | | 201,836 | |
| | 404,000 | | | 6.000%, 8/15/2017 | | | 464,556 | |
| | | | CNA Financial Corporation | | | | |
| | 101,000 | | | 7.350%, 11/15/2019 | | | 124,491 | |
| | | | Cooperatieve Centrale Raiffeisen- Boerenleenbank BA | | | | |
| | 500,000 | | | 11.000%, 12/29/2049g,h | | | 657,500 | |
| | | | CyrusOne, LP | | | | |
| | 469,079 | | | 6.375%, 11/15/2022 | | | 472,597 | |
| | | | Discover Financial Services | | | | |
| | 204,000 | | | 6.450%, 6/12/2017 | | | 232,794 | |
| | | | Fifth Third Bancorp | | | | |
| | 382,000 | | | 5.450%, 1/15/2017 | | | 422,812 | |
| | | | Fifth Third Capital Trust IV | | | | |
| | 300,000 | | | 6.500%, 4/15/2037 | | | 296,250 | |
| | | | General Electric Capital Corporation | | | | |
| | 1,212,000 | | | 5.625%, 9/15/2017 | | | 1,391,914 | |
| | 94,000 | | | 1.625%, 4/2/2018 | | | 93,856 | |
| | | | Goldman Sachs Group, Inc. | | | | |
| | 300,000 | | | 0.700%, 3/22/2016d | | | 298,464 | |
| | 308,000 | | | 6.250%, 9/1/2017 | | | 356,285 | |
| | 202,000 | | | 7.500%, 2/15/2019 | | | 248,034 | |
| | | | HCP, Inc. | | | | |
| | 100,000 | | | 3.750%, 2/1/2016 | | | 105,237 | |
| | | | HSBC Finance Corporation | | | | |
| | 404,000 | | | 6.676%, 1/15/2021 | | | 469,519 | |
| | | | HSBC USA, Inc. | | | | |
| | 70,000 | | | 1.625%, 1/16/2018 | | | 69,476 | |
| | | | Icahn Enterprises, LP | | | | |
| | 469,079 | | | 8.000%, 1/15/2018 | | | 491,947 | |
| | | | ING Bank NV | | | | |
| | 161,000 | | | 3.750%, 3/7/2017g | | | 170,270 | |
| | | | ING Capital Funding Trust III | | | | |
| | 400,000 | | | 3.848%, 12/29/2049d,h | | | 395,000 | |
| | | | International Lease Finance Corporation | | | | |
| | 300,000 | | | 8.625%, 9/15/2015 | | | 333,750 | |
| | | | Intesa Sanpaolo SPA | | | | |
| | 202,000 | | | 3.625%, 8/12/2015g | | | 207,111 | |
| | 402,000 | | | 3.875%, 1/15/2019c | | | 403,596 | |
| | | | J.P. Morgan Chase & Company | | | | |
| | 300,000 | | | 3.450%, 3/1/2016 | | | 316,144 | |
| | 400,000 | | | 1.138%, 1/25/2018d | | | 403,028 | |
| | 200,000 | | | 6.300%, 4/23/2019 | | | 237,022 | |
| | 350,000 | | | 7.900%, 4/29/2049h | | | 385,875 | |
| | 200,000 | | | 6.000%, 12/29/2049h | | | 193,500 | |
| | | | J.P. Morgan Chase Bank NA | | | | |
| | 400,000 | | | 0.584%, 6/13/2016d | | | 396,211 | |
| | | | Liberty Mutual Group, Inc. | | | | |
| | 54,000 | | | 5.000%, 6/1/2021g | | | 58,252 | |
| | | | Liberty Property, LP | | | | |
| | 223,000 | | | 5.500%, 12/15/2016 | | | 247,377 | |
| | | | Lloyds TSB Bank plc | | | | |
| | 241,000 | | | 6.500%, 9/14/2020g | | | 272,290 | |
| | | | Macquarie Bank, Ltd. | | | | |
| | 281,000 | | | 5.000%, 2/22/2017g | | | 308,145 | |
| | | | Morgan Stanley | | | | |
| | 303,000 | | | 4.750%, 4/1/2014 | | | 308,149 | |
| | 462,000 | | | 1.750%, 2/25/2016 | | | 466,533 | |
| | 303,000 | | | 6.250%, 8/28/2017 | | | 348,995 | |
| | | | Murray Street Investment Trust I | | | | |
| | 400,000 | | | 4.647%, 3/9/2017 | | | 434,892 | |
| | | | National City Corporation | | | | |
| | 404,000 | | | 6.875%, 5/15/2019 | | | 484,765 | |
| | | | Nomura Holdings, Inc. | | | | |
| | 303,000 | | | 2.000%, 9/13/2016 | | | 305,215 | |
| | | | Omega Healthcare Investors, Inc. | | | | |
| | 469,079 | | | 5.875%, 3/15/2024 | | | 480,806 | |
| | | | PNC Bank NA | | | | |
| | 404,000 | | | 1.150%, 11/1/2016 | | | 405,197 | |
| | | | Prologis, LP | | | | |
| | 320,000 | | | 6.625%, 5/15/2018 | | | 377,794 | |
| | | | Rabobank Capital Funding Trust II | | | | |
| | 205,000 | | | 5.260%, 12/29/2049g,h | | | 205,676 | |
| | | | Realty Income Corporation | | | | |
| | 255,000 | | | 2.000%, 1/31/2018 | | | 251,509 | |
| | | | Regions Bank | | | | |
| | 306,000 | | | 7.500%, 5/15/2018 | | | 364,060 | |
| | | | Reinsurance Group of America, Inc. | | | | |
| | 950,000 | | | 5.625%, 3/15/2017 | | | 1,054,871 | |
| | | | Royal Bank of Scotland Group plc | | | | |
| | 295,000 | | | 5.050%, 1/8/2015 | | | 304,945 | |
| | | | Santander US Debt SAU | | | | |
| | 306,000 | | | 3.781%, 10/7/2015g | | | 315,245 | |
| | | | SLM Corporation | | | | |
| | 204,000 | | | 6.250%, 1/25/2016 | | | 222,105 | |
| | 150,000 | | | 4.625%, 9/25/2017 | | | 155,625 | |
The accompanying Notes to Financial Statements are an integral part of this schedule.
145
Opportunity Income Plus Fund
Schedule of Investments as of October 31, 2013
| | | | | | | | |
Principal
Amount | | | Long-Term Fixed Income (57.7%) | | Value | |
| Financials (10.1%) - continued | |
| | | | Svenska Handelsbanken AB | | | | |
| $ | 202,000 | | | 3.125%, 7/12/2016 | | | $212,377 | |
| | | | Swedbank Hypotek AB | | | | |
| | 241,000 | | | 1.375%, 3/28/2018g | | | 238,397 | |
| | | | Swiss RE Capital I, LP | | | | |
| | 1,254,000 | | | 6.854%, 5/29/2049g,h | | | 1,335,510 | |
| | | | Ventas Realty, LP | | | | |
| | 404,000 | | | 1.550%, 9/26/2016 | | | 406,899 | |
| | | | Wells Fargo & Company | | | | |
| | 306,000 | | | 1.250%, 7/20/2016 | | | 307,823 | |
| | 404,000 | | | 2.150%, 1/15/2019 | | | 405,967 | |
| | | | | |
| | | | Total | | | 25,664,856 | |
| | | | | |
|
Foreign Government (0.2%) | |
| | | | Eksportfinans ASA | | | | |
| | 500,000 | | | 2.375%, 5/25/2016 | | | 487,250 | |
| | | | | |
| | | | Total | | | 487,250 | |
| | | | | |
|
Mortgage-Backed Securities (12.9%) | |
| | | | Federal Home Loan Mortgage Corporation Gold 15-Yr. Pass Through | | | | |
| | 3,850,000 | | | 3.000%, 12/1/2028c | | | 3,979,937 | |
| | | | Federal Home Loan Mortgage Corporation Gold 30-Yr. Pass Through | | | | |
| | 6,750,000 | | | 3.500%, 11/1/2043c | | | 6,898,711 | |
| | | | Federal National Mortgage Association Conventional 15- Yr. Pass Through | | | | |
| | 3,550,000 | | | 3.500%, 11/1/2028c | | | 3,748,301 | |
| | | | Federal National Mortgage Association Conventional 30- Yr. Pass Through | | | | |
| | 7,600,000 | | | 3.500%, 11/1/2043c | | | 7,794,750 | |
| | 8,112,500 | | | 4.000%, 11/1/2043c | | | 8,546,012 | |
| | 1,650,000 | | | 4.500%, 11/1/2043c | | | 1,766,273 | |
| | | | | |
| | | | Total | | | 32,733,984 | |
| | | | | |
|
Technology (1.7%) | |
| | | | Alliance Data Systems Corporation | | | | |
| | 469,079 | | | 6.375%, 4/1/2020g | | | 489,015 | |
| | | | BMC Software Finance, Inc. | | | | |
| | 469,079 | | | 8.125%, 7/15/2021g | | | 496,051 | |
| | | | CommScope, Inc. | | | | |
| | 394,000 | | | 8.250%, 1/15/2019g | | | 432,415 | |
| | | | Computer Sciences Corporation | | | | |
| | 202,000 | | | 2.500%, 9/15/2015 | | | 206,866 | |
| | | | EMC Corporation | | | | |
| | 202,000 | | | 1.875%, 6/1/2018 | | | 202,741 | |
| | | | First Data Corporation | | | | |
| | 469,079 | | | 7.375%, 6/15/2019g | | | 504,846 | |
| | | | Freescale Semiconductor, Inc. | | | | |
| | 500,000 | | | 6.000%, 1/15/2022c,g | | | 505,625 | |
| | | | Hewlett-Packard Company | | | | |
| | 200,000 | | | 3.300%, 12/9/2016 | | | 208,765 | |
| | | | Iron Mountain, Inc. | | | | |
| | 469,079 | | | 6.000%, 8/15/2023 | | | 477,288 | |
| | | | Oracle Corporation | | | | |
| | 202,000 | | | 1.200%, 10/15/2017 | | | 199,374 | |
| | | | Tyco Electronics Group SA | | | | |
| | 202,000 | | | 6.550%, 10/1/2017 | | | 233,961 | |
| | | | Xerox Corporation | | | | |
| | 202,000 | | | 7.200%, 4/1/2016 | | | 228,246 | |
| | | | | |
| | | | Total | | | 4,185,193 | |
| | | | | |
|
Transportation (1.0%) | |
| | | | Avis Budget Car Rental, LLC | | | | |
| | 469,079 | | | 8.250%, 1/15/2019 | | | 511,296 | |
| | | | Continental Airlines, Inc. | | | | |
| | 445,308 | | | 6.250%, 4/11/2020 | | | 460,893 | |
| | 241,897 | | | 4.150%, 4/11/2024 | | | 238,873 | |
| | | | Delta Air Lines, Inc. | | | | |
| | 166,727 | | | 4.950%, 5/23/2019 | | | 178,815 | |
| | 129,215 | | | 4.750%, 5/7/2020 | | | 136,322 | |
| | | | ERAC USA Finance, LLC | | | | |
| | 113,000 | | | 1.400%, 4/15/2016g | | | 113,173 | |
| | | | Hertz Corporation | | | | |
| | 376,000 | | | 6.750%, 4/15/2019 | | | 405,610 | |
| | | | Kansas City Southern de Mexico SA de CV | | | | |
| | 202,000 | | | 0.937%, 10/28/2016d,g | | | 202,302 | |
| | | | US Airways Pass Through Trust | | | | |
| | 400,000 | | | 3.950%, 11/15/2025 | | | 379,250 | |
| | | | | |
| | | | Total | | | 2,626,534 | |
| | | | | |
|
U.S. Government and Agencies (3.1%) | |
| | | | U.S. Treasury Notes | | | | |
| | 6,250,000 | | | 0.250%, 9/30/2015 | | | 6,244,387 | |
| | 1,500,000 | | | 0.875%, 9/15/2016 | | | 1,514,063 | |
| | | | | |
| | | | Total | | | 7,758,450 | |
| | | | | |
|
Utilities (2.1%) | |
| | | | AES Corporation | | | | |
| | 469,079 | | | 7.375%, 7/1/2021 | | | 531,232 | |
| | | | Atlas Pipeline Partners, LP | | | | |
| | 376,000 | | | 4.750%, 11/15/2021g | | | 353,440 | |
| | | | Cleveland Electric Illuminating Company | | | | |
| | 429,000 | | | 5.700%, 4/1/2017 | | | 472,934 | |
| | | | Constellation Energy Group, Inc. | | | | |
| | 202,000 | | | 5.150%, 12/1/2020 | | | 218,334 | |
| | | | Dayton Power and Light Company | | | | |
| | 202,000 | | | 1.875%, 9/15/2016g | | | 203,851 | |
| | | | Electricite de France SA | | | | |
| | 400,000 | | | 5.250%, 1/29/2049g,h | | | 393,200 | |
| | | | Enel Finance International NV | | | | |
| | 202,000 | | | 3.875%, 10/7/2014g | | | 207,050 | |
| | | | Energy Transfer Partners, LP | | | | |
| | 303,000 | | | 5.950%, 2/1/2015 | | | 321,271 | |
| | | | Enterprise Products Operating, LLC | | | | |
| | 202,000 | | | 1.250%, 8/13/2015 | | | 203,107 | |
| | | | ITC Holdings Corporation | | | | |
| | 500,000 | | | 6.050%, 1/31/2018g | | | 568,941 | |
| | | | Korea Western Power Company, Ltd. | | | | |
| | 404,000 | | | 2.875%, 10/10/2018g | | | 405,549 | |
| | | | National Rural Utilities Cooperative Finance Corporation | | | | |
| | 280,000 | | | 4.750%, 4/30/2043 | | | 261,450 | |
| | | | NRG Energy, Inc. | | | | |
| | 469,079 | | | 6.625%, 3/15/2023 | | | 484,911 | |
The accompanying Notes to Financial Statements are an integral part of this schedule.
146
Opportunity Income Plus Fund
Schedule of Investments as of October 31, 2013
| | | | | | | | |
Principal Amount | | | Long-Term Fixed Income (57.7%) | | Value | |
| Utilities (2.1%) - continued | |
| | | | ONEOK Partners, LP | | | | |
| | $404,000 | | | 6.150%, 10/1/2016 | | | $455,163 | |
| | 134,000 | | | 2.000%, 10/1/2017 | | | 133,644 | |
| | | | | |
| | | | Total | | | 5,214,077 | |
| | | | | |
| | | | | | | | |
| | | | | |
| | | | Total Long-Term Fixed Income (cost $146,221,928) | | | 146,293,746 | |
| | | | | |
| | |
| Shares | | | Common Stock (1.9%) | | Value | |
| Financials (1.9%) | |
| | 42,000 | | | iShares J.P. Morgan USD Emerging Markets Bond ETF | | | 4,676,700 | |
| | | | | |
| | | | Total | | | 4,676,700 | |
| | | | | |
| | | | | | | | |
| | | | | |
| | | | Total Common Stock (cost $4,547,214) | | | 4,676,700 | |
| | | | | |
| | |
| Shares | | | Preferred Stock (0.3%) | | Value | |
| Financials (0.3%) | |
| | 10,000 | | | Discover Financial Services, 6.500%h | | | 239,200 | |
| | 3,350 | | | Farm Credit Bank of Texas, 6.750%g,h | | | 334,895 | |
| | 4,400 | | | The Allstate Corporation, 5.100% | | | 106,304 | |
| | 5,600 | | | The Goldman Sachs Group, Inc., 5.500%h | | | 127,848 | |
| | | | | |
| | | | Total | | | 808,247 | |
| | | | | |
| | | | | | | | |
| | | | | |
| | | | Total Preferred Stock (cost $834,600) | | | 808,247 | |
| | | | | |
| | |
Shares or
Principal
Amount | | | Short-Term Investments (16.1%) | | Value | |
| | | | Federal Home Loan Bank Discount Notes | | | | |
| | 200,000 | | | 0.093%, 11/22/2013i,j | | | 199,989 | |
| | 300,000 | | | 0.105%, 12/4/2013i | | | 299,971 | |
| | | | Federal National Mortgage Association Discount Notes | | | | |
| | 100,000 | | | 0.110%, 12/2/2013i,j | | | 99,991 | |
| | 100,000 | | | 0.100%, 12/4/2013i,j | | | 99,991 | |
| | | | Thrivent Cash Management Trust | | | | |
| | 40,150,617 | | | 0.070% | | | 40,150,617 | |
| | | | | |
| | | | Total Short-Term Investments (at amortized cost) | | | 40,850,559 | |
| | | | | |
| | | | Total Investments (cost $292,041,189) 115.3% | | | $292,084,328 | |
| | | | | |
| | | | Other Assets and Liabilities, Net (15.3%) | | | (38,850,345 | ) |
| | | | | |
| | | | Total Net Assets 100.0% | | | $253,233,983 | |
| | | | | |
a | The stated interest rate represents the weighted average of all contracts within the bank loan facility. |
b | All or a portion of the loan is unfunded. |
c | Denotes investments purchased on a when-issued or delayed delivery basis. |
d | Denotes variable rate securities. Variable rate securities are securities whose yields vary with a designated market index or market rate. The rate shown is as of October 31, 2013. |
e | All or a portion of the security is insured or guaranteed. |
f | Denotes restricted securities. Restricted securities are investment securities which have been deemed illiquid and cannot be offered for public sale without first being registered under the Securities Act of 1933. The following table indicates the acquisition date and cost of restricted securities Opportunity Income Plus Fund owned as of October 31, 2013. |
| | | | | | | | |
| | | Acquisition | | | | |
Security | | Date | | | Cost | |
JBS Finance II, Ltd. | | | 8/19/2013 | | | | $489,206 | |
Wachovia Asset Securitization, Inc. | | | 3/16/2007 | | | | $1,855,051 | |
g | Denotes securities sold under Rule 144A of the Securities Act of 1933, which exempts them from registration. These securities have been deemed liquid and may be resold to other dealers in the program or to other qualified institutional buyers. As of October 31, 2013, the value of these investments was $23,337,692 or 9.2% of total net assets. |
h | Denotes perpetual securities. Perpetual securities pay an indefinite stream of interest, but may be called by the issuer at an earlier date. |
i | The interest rate shown reflects the yield, coupon rate or the discount rate at the date of purchase. |
j | At October 31, 2013, $399,971 of investments were held on deposit with the counterparty and pledged as the initial margin deposit for open futures contracts. |
Definitions:
| | | | | | |
ETF | | | - | | | Exchange Traded Fund. |
| | | | |
| |
Unrealized Appreciation (Depreciation) | | | | |
Gross unrealized appreciation and depreciation of investments, based on cost for federal income tax purposes, were as follows: | | | | |
Gross unrealized appreciation | | | $3,607,692 | |
Gross unrealized depreciation | | | (3,572,675 | ) |
| | | | |
Net unrealized appreciation (depreciation) | | | $35,017 | |
| |
Cost for federal income tax purposes | | | $292,049,311 | |
The accompanying Notes to Financial Statements are an integral part of this schedule.
147
Opportunity Income Plus Fund
Schedule of Investments as of October 31, 2013
Fair Valuation Measurements
The following table is a summary of the inputs used, as of October 31, 2013, in valuing Opportunity Income Plus Fund’s assets carried at fair value.
| | | | | | | | | | | | | | | | |
Investments in Securities | | Total | | | Level 1 | | | Level 2 | | | Level 3 | |
| | | | |
Bank Loans | | | | | | | | | | | | | | | | |
Basic Materials | | | 4,582,982 | | | | – | | | | 4,582,982 | | | | – | |
Capital Goods | | | 7,015,415 | | | | – | | | | 7,015,415 | | | | – | |
Communications Services | | | 37,303,060 | | | | – | | | | 37,303,060 | | | | – | |
Consumer Cyclical | | | 14,224,897 | | | | – | | | | 14,224,897 | | | | – | |
Consumer Non-Cyclical | | | 9,359,127 | | | | – | | | | 9,359,127 | | | | – | |
Energy | | | 4,591,653 | | | | – | | | | 4,591,653 | | | | – | |
Financials | | | 2,536,794 | | | | – | | | | 2,536,794 | | | | – | |
Technology | | | 6,985,551 | | | | – | | | | 6,985,551 | | | | – | |
Transportation | | | 8,817,575 | | | | – | | | | 8,817,575 | | | | – | |
Utilities | | | 4,038,022 | | | | – | | | | 4,038,022 | | | | – | |
| | | | |
Long-Term Fixed Income | | | | | | | | | | | | | | | | |
Asset-Backed Securities | | | 10,442,838 | | | | – | | | | 10,442,838 | | | | – | |
Basic Materials | | | 4,158,694 | | | | – | | | | 4,158,694 | | | | – | |
Capital Goods | | | 3,987,087 | | | | – | | | | 3,987,087 | | | | – | |
Collateralized Mortgage Obligations | | | 11,547,355 | | | | – | | | | 11,547,355 | | | | – | |
Commercial Mortgage-Backed Securities | | | 6,540,055 | | | | – | | | | 6,540,055 | | | | – | |
Communications Services | | | 9,844,193 | | | | – | | | | 9,844,193 | | | | – | |
Consumer Cyclical | | | 5,855,599 | | | | – | | | | 5,855,599 | | | | – | |
Consumer Non-Cyclical | | | 9,901,773 | | | | – | | | | 9,901,773 | | | | – | |
Energy | | | 5,345,808 | | | | – | | | | 5,345,808 | | | | – | |
Financials | | | 25,664,856 | | | | – | | | | 25,664,856 | | | | – | |
Foreign Government | | | 487,250 | | | | – | | | | 487,250 | | | | – | |
Mortgage-Backed Securities | | | 32,733,984 | | | | – | | | | 32,733,984 | | | | – | |
Technology | | | 4,185,193 | | | | – | | | | 4,185,193 | | | | – | |
Transportation | | | 2,626,534 | | | | – | | | | 2,626,534 | | | | – | |
U.S. Government and Agencies | | | 7,758,450 | | | | – | | | | 7,758,450 | | | | – | |
Utilities | | | 5,214,077 | | | | – | | | | 5,214,077 | | | | – | |
| | | | |
Common Stock | | | | | | | | | | | | | | | | |
Financials | | | 4,676,700 | | | | 4,676,700 | | | | – | | | | – | |
| | | | |
Preferred Stock | | | | | | | | | | | | | | | | |
Financials | | | 808,247 | | | | 473,352 | | | | 334,895 | | | | – | |
Short-Term Investments | | | 40,850,559 | | | | 40,150,617 | | | | 699,942 | | | | – | |
| |
Total | | | $292,084,328 | | | | $45,300,669 | | | | $246,783,659 | | | | $– | |
| |
| | | | |
Other Financial Instruments | | Total | | | Level 1 | | | Level 2 | | | Level 3 | |
| | | | |
Asset Derivatives | | | | | | | | | | | | | | | | |
Futures Contracts | | | 138,940 | | | | 138,940 | | | | – | | | | – | |
| |
Total Asset Derivatives | | | $138,940 | | | | $138,940 | | | | $– | | | | $– | |
| |
There were no significant transfers between Levels during the period ended October 31, 2013. Transfers between Levels are identified as of the end of the period.
| | | | | | | | | | | | | | | | | | | | |
Futures Contracts | | Number of
Contracts
Long/(Short) | | | Expiration
Date | | | Notional
Principal
Amount | | | Value | | | Unrealized
Gain/(Loss) | |
30-Yr. U.S. Treasury Bond Futures | | | 40 | | | | December 2013 | | | $ | 5,253,560 | | | $ | 5,392,500 | | | $ | 138,940 | |
Total Futures Contracts | | | | | | | | | | | | | | | | | | $ | 138,940 | |
The accompanying Notes to Financial Statements are an integral part of this schedule.
148
Opportunity Income Plus Fund
Schedule of Investments as of October 31, 2013
The following table summarizes the fair value and Statement of Assets and Liabilities location, as of October 31, 2013, for Opportunity Income Plus Fund’s investments in financial derivative instruments by primary risk exposure as discussed under item (2) Significant Accounting Policies of the Notes to Financial Statements.
| | | | | | |
Derivatives by risk category | | Statement of Assets and Liabilities Location | | Fair Value | |
| | |
Asset Derivatives | | | | | | |
Interest Rate Contracts | | | | | | |
Futures* | | Net Assets - Net unrealized appreciation/(depreciation) on Futures contracts | | | $138,940 | |
Total Interest Rate Contracts | | | | | 138,940 | |
| |
Total Asset Derivatives | | | | | $138,940 | |
| |
* | Includes cumulative appreciation/depreciation of futures contracts as reported in the Schedule of Investments. Only current day’s variation margin is reported within the Statement of Assets and Liabilities. |
The following table summarizes the net realized gains/(losses) and Statement of Operations location, for the period ended October 31, 2013, for Opportunity Income Plus Fund’s investments in financial derivative instruments by primary risk exposure.
| | | | | | |
Derivatives by risk category | | Statement of Operations Location | | Realized Gains/(Losses)
recognized in Income | |
| | |
Interest Rate Contracts | | | | | | |
Futures | | Net realized gains/(losses) on Futures contracts | | | 754,815 | |
| | |
Total Interest Rate Contracts | | | | | 754,815 | |
| | |
Credit Contracts | | | | | | |
Credit Default Swaps | | Net realized gains/(losses) on Swap agreements | | | (873,334 | ) |
| | |
Total Credit Contracts | | | | | (873,334 | ) |
| |
Total | | | | | ($118,519 | ) |
| |
The following table summarizes the change in net unrealized appreciation/(depreciation) and Statement of Operations location, for the period ended October 31, 2013, for Opportunity Income Plus Fund’s investments in financial derivative instruments by primary risk exposure.
| | | | | | |
Derivatives by risk category | | Statement of Operations Location | | Change in unrealized
appreciation/(depreciation)
recognized in Income | |
| | |
Interest Rate Contracts | | | | | | |
Futures | | Change in net unrealized appreciation/(depreciation) on Futures contracts | | | 151,659 | |
Total Interest Rate Contracts | | | | | 151,659 | |
| | |
Credit Contracts | | | | | | |
Credit Default Swaps | | Change in net unrealized appreciation/(depreciation) on Swap agreements | | | 308,639 | |
Total Credit Contracts | | | | | 308,639 | |
| |
Total | | | | | $460,298 | |
| |
The following table presents Opportunity Income Plus Fund’s average volume of derivative activity during the period ended October 31, 2013.
| | | | | | | | |
Derivative Risk Category | | Futures
(Notional)* | | Futures
(Percentage of
Average Net
Assets) | | Swaps (Notional)* | | Swaps
(Percentage
of Average
Net Assets) |
Interest Rate Contracts | | $52,017,641 | | 19.0% | | N/A | | N/A |
Credit Contracts | | N/A | | N/A | | $8,505,208 | | 3.1% |
* | Notional amount represents long or short, or both, derivative positions held by the Fund. |
The accompanying Notes to Financial Statements are an integral part of this schedule.
149
Opportunity Income Plus Fund
Schedule of Investments as of October 31, 2013
Investment in Affiliates
Affiliated issuers, as defined under the Investment Company Act of 1940, include those in which the Fund’s holdings of an issuer represent 5% or more of the outstanding voting securities of an issuer, or any affiliated mutual fund.
A summary of transactions for the fiscal year to date, in Opportunity Income Plus Fund, is as follows:
| | | | | | | | | | | | | | | | | | | | | | | | |
Fund | | Value
October 31, 2012 | | | Gross
Purchases | | | Gross Sales | | | Shares Held at
October 31, 2013 | | | Value
October 31, 2013 | | | Income Earned
November 1, 2012 -
October 31, 2013 | |
High Yield | | | $13,256,528 | | | | $– | | | | $13,169,837 | | | | – | | | | $– | | | | $648,354 | |
Cash Management Trust-Collateral Investment | | | – | | | | 4,514,831 | | | | 4,514,831 | | | | – | | | | – | | | | 2,894 | |
Cash Management Trust-Short Term Investment | | | 43,110,519 | | | | 289,584,391 | | | | 292,544,293 | | | | 40,150,617 | | | | 40,150,617 | | | | 49,032 | |
Total Value and Income Earned | | | 56,367,047 | | | | | | | | | | | | | | | | 40,150,617 | | | | 700,280 | |
The accompanying Notes to Financial Statements are an integral part of this schedule.
150
Partner Emerging Markets Equity Fund
Schedule of Investments as of October 31, 2013
| | | | | | | | |
| Shares | | | Common Stock (96.5%) | | Value | |
| Bermuda (0.8%) | | | | |
| | 182,000 | | | Pacific Basin Shipping, Ltd. | | | $130,241 | |
| | | | | |
| | | | Total | | | 130,241 | |
| | | | | |
| |
| Brazil (3.5%) | | | | |
| | 1,904 | | | Autometal SA | | | 14,959 | |
| | 15,600 | | | BR Properties SA | | | 132,310 | |
| | 10,800 | | | Cia Paranaense de Energia | | | 150,608 | |
| | 24,600 | | | Embraer SA | | | 179,541 | |
| | 18,500 | | | Even Construtora e Incorporadora SA | | | 68,956 | |
| | | | | |
| | | | Total | | | 546,374 | |
| | | | | |
| |
| Chile (0.6%) | | | | |
| | 128,826 | | | Aguas Andinas SA | | | 86,913 | |
| | | | | |
| | | | Total | | | 86,913 | |
| | | | | |
| |
| China (8.3%) | | | | |
| | 33,000 | | | Anhui Conch Cement Company, Ltd. | | | 115,162 | |
| | 268,000 | | | China Construction Bank Corporation | | | 208,511 | |
| | 356,000 | | | China Petroleum & Chemical Corporation | | | 288,185 | |
| | 100,000 | | | China Shenhua Energy Company, Ltd. | | | 304,188 | |
| | 266,000 | | | Dongfeng Motor Group Company, Ltd. | | | 376,076 | |
| | | | | |
| | | | Total | | | 1,292,122 | |
| | | | | |
| |
| Colombia (2.0%) | | | | |
| | 21,557 | | | Bancolombia SA | | | 297,322 | |
| | 367 | | | Bancolumbia SA | | | 20,600 | |
| | | | | |
| | | | Total | | | 317,922 | |
| | | | | |
| |
| Czech Republic (3.3%) | | | | |
| | 2,069 | | | Komercni Banka AS | | | 512,508 | |
| | | | | |
| | | | Total | | | 512,508 | |
| | | | | |
| |
| Hong Kong (6.2%) | | | | |
| | 31,000 | | | China Merchants Holdings International Company, Ltd. | | | 109,894 | |
| | 56,500 | | | China Mobile, Ltd. | | | 587,128 | |
| | 151,000 | | | Sinotruk Hong Kong, Ltd. | | | 79,072 | |
| | 48,000 | | | Weichai Power Company, Ltd. | | | 192,126 | |
| | | | | |
| | | | Total | | | 968,220 | |
| | | | | |
| |
| India (1.6%) | | | | |
| | 1,270 | | | Infosys, Ltd. ADR | | | 67,386 | |
| | 6,202 | | | Reliance Industries, Ltd. GDRa | | | 184,868 | |
| | | | | |
| | | | Total | | | 252,254 | |
| | | | | |
| |
| Indonesia (4.3%) | | | | |
| | 237,000 | | | AKR Corporindo Tbk PTb | | | 101,857 | |
| | 9,719 | | | Bank Rakyat Indonesia Persero Tbk PT | | | 135,872 | |
| | 192,500 | | | Tambang Batubara Bukit Asam Persero Tbk PT | | | 207,507 | |
| | 142,500 | | | United Tractors Tbk PT | | | 221,170 | |
| | | | | |
| | | | Total | | | 666,406 | |
| | | | | |
| |
| Luxembourg (2.6%) | | | | |
| | 15,707 | | | Ternium SA ADR | | | 409,639 | |
| | | | | |
| | | | Total | | | 409,639 | |
| | | | | |
| |
| Malaysia (2.2%) | | | | |
| | 73,000 | | | Genting Berhad | | | 242,362 | |
| | 33,690 | | | Malayan Banking Berhad | | | 104,426 | |
| | | | | |
| | | | Total | | | 346,788 | |
| | | | | |
| |
| Mexico (3.7%) | | | | |
| | 533,000 | | | America Movil SAB de CV | | | 570,696 | |
| | | | | |
| | | | Total | | | 570,696 | |
| | | | | |
| |
| Panama (0.4%) | | | | |
| | 395 | | | Copa Holdings SA | | | 59,068 | |
| | | | | |
| | | | Total | | | 59,068 | |
| | | | | |
| |
| Peru (0.6%) | | | | |
| | 6,913 | | | Cia de Minas Buenaventura SA ADR | | | 100,239 | |
| | | | | |
| | | | Total | | | 100,239 | |
| | | | | |
| |
| Poland (6.1%) | | | | |
| | 5,704 | | | Bank Handlowy w Warszawie SA | | | 219,230 | |
| | 7,103 | | | Bank Pekao SA | | | 444,733 | |
| | 8,363 | | | Grupa Lotos SAc | | | 102,016 | |
| | 56,983 | | | Telekomunikacja Polska SA | | | 184,619 | |
| | | | | |
| | | | Total | | | 950,598 | |
| | | | | |
| |
| Russia (6.5%) | | | | |
| | 21,715 | | | Gazprom OAO ADR | | | 202,601 | |
| | 26,518 | | | Novolipetsk Steel OJSC GDR | | | 451,834 | |
| | 6,416 | | | Phosagro OAO | | | 64,644 | |
| | 23,146 | | | Sberbank of Russia GDR | | | 295,167 | |
| | | | | |
| | | | Total | | | 1,014,246 | |
| | | | | |
| |
| South Africa (6.7%) | | | | |
| | 2,961 | | | Anglo American Platinum, Ltd.c | | | 119,699 | |
| | 25,208 | | | Gold Fields, Ltd. ADR | | | 115,957 | |
| | 17,584 | | | MTN Group, Ltd. | | | 349,520 | |
| | 10,403 | | | Nedbank Group, Ltd. | | | 226,180 | |
| | 20,607 | | | PPC, Ltd. | | | 65,175 | |
| | 14,880 | | | Reunert, Ltd. | | | 104,499 | |
| | 20,197 | | | Sappi, Ltd.c | | | 59,472 | |
| | | | | |
| | | | Total | | | 1,040,502 | |
| | | | | |
| |
| South Korea (23.4%) | | | | |
| | 1,168 | | | Hyundai Department Store Company, Ltd. | | | 185,984 | |
| | 2,271 | | | Hyundai Heavy Industries Company, Ltd. | | | 542,308 | |
| | 1,458 | | | Hyundai Mobis | | | 411,273 | |
| | 2,858 | | | Hyundai Motor Company | | | 680,900 | |
| | 5,260 | | | Kangwon Land, Inc. | | | 144,549 | |
| | 1,066 | | | LG Chem, Ltd. | | | 300,700 | |
| | 5,218 | | | POSCO ADR | | | 388,532 | |
| | 68 | | | Samsung Electronics Company, Ltd. | | | 93,776 | |
| | 2,920 | | | Samsung Heavy Industries Company, Ltd. | | | 107,069 | |
| | 13,706 | | | Shinhan Financial Group Company, Ltd. | | | 597,632 | |
| | 837 | | | Shinsegae Company, Ltd. | | | 210,718 | |
| | | | | |
| | | | Total | | | 3,663,441 | |
| | | | | |
| |
| Taiwan (4.9%) | | | | |
| | 112,000 | | | Advanced Semiconductor Engineering, Inc. | | | 110,281 | |
| | 50,000 | | | Chipbond Technology Corporation | | | 101,038 | |
The accompanying Notes to Financial Statements are an integral part of this schedule.
151
Partner Emerging Markets Equity Fund
Schedule of Investments as of October 31, 2013
| | | | | | | | |
| Shares | | | Common Stock (96.5%) | | Value | |
| Taiwan (4.9%) - continued | | | | |
| | 400,000 | | | Compal Electronics, Inc. | | | $312,981 | |
| | 55,000 | | | Novatek Microelectronics Corporation | | | 217,879 | |
| | 3,000 | | | TPK Holding Company, Ltd. | | | 21,058 | |
| | | | | |
| | | | Total | | | 763,237 | |
| | | | | |
| |
| Thailand (3.7%) | | | | |
| | 34,900 | | | Kasikornbank pcl | | | 213,786 | |
| | 36,000 | | | PTT pcl | | | 366,487 | |
| | | | | |
| | | | Total | | | 580,273 | |
| | | | | |
| |
| Turkey (0.6%) | | | | |
| | 11,405 | | | Turkiye Halk Bankasi A.S. | | | 91,642 | |
| | | | | |
| | | | Total | | | 91,642 | |
| | | | | |
| |
| United Kingdom (0.4%) | | | | |
| | 3,175 | | | Hikma Pharmaceuticals plc | | | 61,081 | |
| | | | | |
| | | | Total | | | 61,081 | |
| | | | | |
| |
| United States (4.1%) | | | | |
| | 15,001 | | | iShares MSCI Emerging Markets Index Fund | | | 636,942 | |
| | | | | |
| | | | Total | | | 636,942 | |
| | | | | |
| | | | | | | | |
| | | | | |
| | | | Total Common Stock (cost $14,268,970) | | | 15,061,352 | |
| | | | | |
| | |
| Shares | | | Preferred Stock (2.0%) | | Value | |
| Brazil (2.0%) | | | | |
| | 21,700 | | | Vale SA | | | 318,109 | |
| | | | | |
| | | | Total | | | 318,109 | |
| | | | | |
| | | | | | | | |
| | | | | |
| | | | Total Preferred Stock (cost $362,448) | | | 318,109 | |
| | | | | |
| | |
Shares or
Principal
Amount | | | Short-Term Investments (1.6%) | | Value | |
| | | | Thrivent Cash Management Trust | | | | |
| | 257,720 | | | 0.070% | | | 257,720 | |
| | | | | |
| | | | Total Short-Term Investments (at amortized cost) | | | 257,720 | |
| | | | | |
| | | | Total Investments (cost $14,889,138) 100.1% | | | $15,637,181 | |
| | | | | |
| | | | Other Assets and Liabilities, Net (0.1%) | | | (14,730 | ) |
| | | | | |
| | | | Total Net Assets 100.0% | | | $15,622,451 | |
| | | | | |
a | Denotes securities sold under Rule 144A of the Securities Act of 1933, which exempts them from registration. These securities have been deemed liquid and may be resold to other dealers in the program or to other qualified institutional buyers. As of October 31, 2013, the value of these investments was $184,868 or 1.2% of total net assets. |
b | Denotes investments purchased on a when-issued or delayed delivery basis. |
c | Non-income producing security. |
Definitions:
| | | | |
ADR | | - | | American Depositary Receipt, which are certificates for an underlying foreign security’s shares held by an issuing U.S. depository bank. |
GDR | | - | | Global Depository Receipts, which are certificates for shares of an underlying foreign security’s shares held by an issuing depository bank from more than one country. |
Unrealized Appreciation (Depreciation)
Gross unrealized appreciation and depreciation of investments, based on cost for federal income tax purposes, were as follows:
| | | | |
Gross unrealized appreciation | | | $1,105,440 | |
Gross unrealized depreciation | | | (424,390 | ) |
| | | | |
Net unrealized appreciation (depreciation) | | | $681,050 | |
| |
Cost for federal income tax purposes | | | $14,956,131 | |
The accompanying Notes to Financial Statements are an integral part of this schedule.
152
Partner Emerging Markets Equity Fund
Schedule of Investments as of October 31, 2013
Fair Valuation Measurements
The following table is a summary of the inputs used, as of October 31, 2013, in valuing Partner Emerging Markets Equity Fund’s assets carried at fair value.
| | | | | | | | | | | | | | | | |
Investments in Securities | | Total | | | Level 1 | | | Level 2 | | | Level 3 | |
| | | | |
Common Stock | | | | | | | | | | | | | | | | |
Consumer Discretionary | | | 2,527,903 | | | | – | | | | 2,527,903 | | | | – | |
Energy | | | 1,655,852 | | | | 202,601 | | | | 1,453,251 | | | | – | |
Financials | | | 4,136,861 | | | | 793,414 | | | | 3,343,447 | | | | – | |
Health Care | | | 61,081 | | | | – | | | | 61,081 | | | | – | |
Industrials | | | 1,947,700 | | | | 59,068 | | | | 1,888,632 | | | | – | |
Information Technology | | | 611,418 | | | | 67,386 | | | | 544,032 | | | | – | |
Materials | | | 2,191,053 | | | | 1,079,011 | | | | 1,112,042 | | | | – | |
Telecommunications Services | | | 1,691,963 | | | | – | | | | 1,691,963 | | | | – | |
Utilities | | | 237,521 | | | | – | | | | 237,521 | | | | – | |
| | | | |
Preferred Stock | | | | | | | | | | | | | | | | |
Materials | | | 318,109 | | | | – | | | | 318,109 | | | | – | |
Short-Term Investments | | | 257,720 | | | | 257,720 | | | | – | | | | – | |
| |
Total | | | $15,637,181 | | | | $2,459,200 | | | | $13,177,981 | | | | $– | |
| |
| | | | |
Other Financial Instruments | | Total | | | Level 1 | | | Level 2 | | | Level 3 | |
| | | | |
Asset Derivatives | | | | | | | | | | | | | | | | |
Foreign Currency Forward Contracts | | | 263 | | | | – | | | | 263 | | | | – | |
| |
Total Asset Derivatives | | | $263 | | | | $– | | | | $263 | | | | $– | |
| |
| | | | |
Liability Derivatives | | | | | | | | | | | | | | | | |
Foreign Currency Forward Contracts | | | 31 | | | | – | | | | 31 | | | | – | |
| |
Total Liability Derivatives | | | $31 | | | | $– | | | | $31 | | | | $– | |
| |
There were no significant transfers between Levels during the period ended October 31, 2013. Transfers between Levels are identified as of the end of the period.
| | | | | | | | | | | | | | | | | | | | |
Foreign Currency
Forward Contracts | | Counterparty | | Contracts to
Deliver/Receive | | | Settlement Date | | Value on
Settlement Date | | | Value | | | Unrealized Gain/(Loss) | |
| | | | | | |
Purchases | | | | | | | | | | | | | | | | | | | | |
Indonesian Rupiah | | SSB | | | 51,589,562 | | | 11/1/2013 - 11/4/2013 | | | $4,608 | | | | $4,577 | | | | ($31 | ) |
Total Purchases | | | | | | | | | | | $4,608 | | | | $4,577 | | | | ($31 | ) |
| | | | | | |
Sales | | | | | | | | | | | | | | | | | | | | |
Brazilian Real | | SSB | | | 17,811 | | | 11/1/2013 | | | $8,080 | | | | $7,950 | | | | $130 | |
Brazilian Real | | RBS | | | 10,989 | | | 11/1/2013 - 11/4/2013 | | | 5,002 | | | | 4,906 | | | | 96 | |
Polish Zloty | | RBS | | | 22,273 | | | 11/4/2013 | | | 7,268 | | | | 7,231 | | | | 37 | |
Total Sales | | | | | | | | | | | $20,350 | | | | $20,087 | | | | $263 | |
| | |
Net Unrealized Gain/(Loss) on Foreign Currency Forward Contracts | | | | | | | | $232 | |
| | | | | | |
Counterparty |
RBS | | | - | | | The Royal Bank of Scotland |
SSB | | | - | | | State Street Bank |
The accompanying Notes to Financial Statements are an integral part of this schedule.
153
Partner Emerging Markets Equity Fund
Schedule of Investments as of October 31, 2013
The following table summarizes the fair value and Statement of Assets and Liabilities location, as of October 31, 2013, for Partner Emerging Markets Equity Fund’s investments in financial derivative instruments by primary risk exposure as discussed under item (2) Significant Accounting Policies of the Notes to Financial Statements.
| | | | | | |
Derivatives by risk category | | Statement of Assets and Liabilities Location | | Fair Value | |
| | |
Asset Derivatives | | | | | | |
| | |
Foreign Exchange Contracts | | | | | | |
Forward Contracts | | Receivable/Payable for forward contracts, Net Assets - Net unrealized appreciation/(depreciation) on Foreign currency forward contracts | | | 263 | |
Total Foreign Exchange Contracts | | | | | 263 | |
| |
Total Asset Derivatives | | | | | $263 | |
| |
| | |
Liability Derivatives | | | | | | |
| | |
Foreign Exchange Contracts | | | | | | |
Forward Contracts | | Receivable/Payable for forward contracts, Net Assets - Net unrealized appreciation/(depreciation) on Foreign currency forward contracts | | | 31 | |
Total Foreign Exchange Contracts | | | | | 31 | |
| |
Total Liability Derivatives | | | | | $31 | |
| |
The following table summarizes the net realized gains/(losses) and Statement of Operations location, for the period ended October 31, 2013, for Partner Emerging Markets Equity Fund’s investments in financial derivative instruments by primary risk exposure.
| | | | | | |
Derivatives by risk category | | Statement of Operations Location | | Realized Gains/(Losses)
recognized in Income | |
| | |
Foreign Exchange Contracts | | | | | | |
Forward Contracts | | Net realized gains/(losses) on Foreign currency transactions | | | 10,502 | |
| | |
Total Foreign Exchange Contracts | | | | | 10,502 | |
| |
Total | | | | | $10,502 | |
| |
The following table summarizes the change in net unrealized appreciation/(depreciation) and Statement of Operations location, for the period ended October 31, 2013, for Partner Emerging Markets Equity Fund’s investments in financial derivative instruments by primary risk exposure.
| | | | | | |
Derivatives by risk category | | Statement of Operations Location | | Change in unrealized
appreciation/(depreciation)
recognized in Income | |
| | |
Foreign Exchange Contracts | | | | | | |
Forward Contracts | | Change in net unrealized appreciation/(depreciation) on Foreign currency forward contracts | | | 247 | |
| | |
Total Foreign Exchange Contracts | | | | | 247 | |
| |
Total | | | | | $247 | |
| |
The following table presents Partner Emerging Markets Equity Fund’s average volume of derivative activity during the period ended October 31, 2013.
| | | | | | |
Derivative Risk Category | | Forwards (Notional*) | | Forwards
(Percentage
of Average
Net Assets) | |
Foreign Exchange Contracts | | $29,252 | | | 0.2% | |
* | Notional amount represents long or short, or both, derivative positions held by the Fund. |
The accompanying Notes to Financial Statements are an integral part of this schedule.
154
Partner Emerging Markets Equity Fund
Schedule of Investments as of October 31, 2013
Investment in Affiliates
Affiliated issuers, as defined under the Investment Company Act of 1940, include those in which the Fund’s holdings of an issuer represent 5% or more of the outstanding voting securities of an issuer, or any affiliated mutual fund.
A summary of transactions for the fiscal year to date, in Partner Emerging Markets Equity Fund, is as follows:
| | | | | | | | | | | | | | | | | | | | | | | | |
Fund | | Value
October 31, 2012 | | | Gross
Purchases | | | Gross
Sales | | | Shares Held at
October 31, 2013 | | | Value
October 31, 2013 | | | Income Earned
November 1, 2012 -
October 31, 2013 | |
Cash Management Trust-Short Term Investment | | | $124,811 | | | | $6,229,449 | | | | $6,096,540 | | | | 257,720 | | | | $257,720 | | | | $249 | |
Total Value and Income Earned | | | 124,811 | | | | | | | | | | | | | | | | 257,720 | | | | 249 | |
The accompanying Notes to Financial Statements are an integral part of this schedule.
155
Partner Small Cap Growth Fund
Schedule of Investments as of October 31, 2013
| | | | | | | | |
| Shares | | | Common Stock (96.8%) | | Value | |
| Consumer Discretionary (17.6%) | | | | |
| | 17,760 | | | American Axle & Manufacturing Holdings, Inc.a | | | $330,514 | |
| | 32,790 | | | American Public Education, Inc.a | | | 1,312,584 | |
| | 53,810 | | | ANN, Inc.a | | | 1,902,722 | |
| | 15,430 | | | Arctic Cat, Inc. | | | 808,532 | |
| | 7,800 | | | Asbury Automotive Group, Inc.a | | | 374,790 | |
| | 9,610 | | | Boyd Gaming Corporationa | | | 101,482 | |
| | 34,350 | | | Brunswick Corporation | | | 1,550,215 | |
| | 2,410 | | | Buffalo Wild Wings, Inc.a | | | 343,618 | |
| | 29,940 | | | Chuy’s Holdings, Inc.a | | | 1,125,744 | |
| | 9,010 | | | Cracker Barrel Old Country Store, Inc. | | | 989,929 | |
| | 2,220 | | | Dorman Products, Inc. | | | 107,914 | |
| | 11,210 | | | E.W. Scripps Companya | | | 222,182 | |
| | 53,780 | | | Fifth & Pacific Companies, Inc.a | | | 1,424,632 | |
| | 29,000 | | | Five Below, Inc.a,b | | | 1,399,540 | |
| | 16,580 | | | Fox Factory Holding Corporationa | | | 288,824 | |
| | 38,120 | | | HomeAway, Inc.a,b | | | 1,130,258 | |
| | 40,560 | | | Imax Corporationa,b | | | 1,182,324 | |
| | 5,630 | | | ITT Educational Services, Inc.a,b | | | 225,876 | |
| | 7,710 | | | Krispy Kreme Doughnuts, Inc.a | | | 187,045 | |
| | 4,510 | | | Lithia Motors, Inc. | | | 283,453 | |
| | 27,400 | | | Meritage Homes Corporationa | | | 1,243,686 | |
| | 2,480 | | | Modine Manufacturing Companya | | | 33,034 | |
| | 10,620 | | | Multimedia Games Holding Company, Inc.a | | | 345,256 | |
| | 8,200 | | | Nexstar Broadcasting Group, Inc. | | | 363,998 | |
| | 5,400 | | | Oxford Industries, Inc. | | | 387,558 | |
| | 63,980 | | | Pier 1 Imports, Inc. | | | 1,335,902 | |
| | 4,590 | | | Red Robin Gourmet Burgers, Inc.a | | | 349,666 | |
| | 35,300 | | | Shutterfly, Inc.a | | | 1,734,642 | |
| | 33,900 | | | Sotheby’s Holdings, Inc. | | | 1,759,410 | |
| | 3,940 | | | Stamps.com, Inc.a | | | 179,034 | |
| | 33,530 | | | Tenneco, Inc.a | | | 1,779,437 | |
| | 52,670 | | | Texas Roadhouse, Inc. | | | 1,444,211 | |
| | 21,090 | | | Vail Resorts, Inc. | | | 1,485,790 | |
| | 38,210 | | | Vitamin Shoppe, Inc.a | | | 1,792,431 | |
| | 23,210 | | | Zumiez, Inc.a | | | 687,944 | |
| | | | | |
| | | | Total | | | 30,214,177 | |
| | | | | |
| |
| Consumer Staples (5.9%) | | | | |
| | 55,720 | | | B&G Foods, Inc. | | | 1,886,122 | |
| | 1,690 | | | Boston Beer Company, Inc.a,b | | | 388,007 | |
| | 12,130 | | | Hain Celestial Group, Inc.a | | | 1,009,580 | |
| | 1,940 | | | Natural Grocers by Vitamin Cottage, Inc.a | | | 77,406 | |
| | 37,240 | | | Prestige Brands Holdings, Inc.a | | | 1,163,005 | |
| | 322,370 | | | Rite Aid Corporationa | | | 1,718,232 | |
| | 26,160 | | | Susser Holdings Corporationa | | | 1,434,614 | |
| | 1,530 | | | TreeHouse Foods, Inc.a | | | 112,088 | |
| | 33,350 | | | United Natural Foods, Inc.a | | | 2,382,858 | |
| | | | | |
| | | | Total | | | 10,171,912 | |
| | | | | |
| |
| Energy (4.9%) | | | | |
| | 6,940 | | | Bonanza Creek Energy, Inc.a | | | 350,748 | |
| | 20,860 | | | Callon Petroleum Companya | | | 142,474 | |
| | 9,200 | | | Diamondback Energy, Inc.a | | | 475,180 | |
| | 9,870 | | | Dril-Quip, Inc.a | | | 1,158,935 | |
| | 8,410 | | | EPL Oil & Gas, Inc.a | | | 268,111 | |
| | 19,480 | | | Goodrich Petroleum Corporationa,b | | | 455,637 | |
| | 123,150 | | | Kodiak Oil & Gas Corporationa | | | 1,597,255 | |
| | 2,160 | | | PDC Energy, Inc.a | | | 146,470 | |
| | 31,460 | | | Rex Energy Corporationa | | | 676,390 | |
| | 33,100 | | | Rosetta Resources, Inc.a | | | 1,984,014 | |
| | 2,620 | | | Sanchez Energy Corporationa | | | 74,696 | |
| | 18,580 | | | SemGroup Corporation | | | 1,122,046 | |
| | | | | |
| | | | Total | | | 8,451,956 | |
| | | | | |
| |
| Financials (6.9%) | | | | |
| | 29,090 | | | Bank of the Ozarks, Inc. | | | 1,439,373 | |
| | 35,440 | | | Corporate Office Properties Trust | | | 871,824 | |
| | 99,770 | | | Education Realty Trust, Inc. | | | 911,898 | |
| | 23,810 | | | eHealth, Inc.a | | | 1,014,782 | |
| | 14,180 | | | Financial Engines, Inc. | | | 792,237 | |
| | 10,570 | | | Hanmi Financial Corporation | | | 184,763 | |
| | 115,310 | | | Hersha Hospitality Trust | | | 653,808 | |
| | 14,480 | | | Home Loan Servicing Solutions, Ltd. | | | 341,873 | |
| | 13,830 | | | Independent Bank Corporationa | | | 134,428 | |
| | 11,200 | | | Infinity Property & Casualty Corporation | | | 768,096 | |
| | 15,620 | | | OFG Bancorp | | | 231,332 | |
| | 30,730 | | | Portfolio Recovery Associates, Inc.a,b | | | 1,826,898 | |
| | 5,790 | | | Stewart Information Services Corporation | | | 181,343 | |
| | 333,160 | | | Synovus Financial Corporation | | | 1,082,770 | |
| | 16,200 | | | Umpqua Holdings Corporation | | | 265,194 | |
| | 90,090 | | | WisdomTree Investments, Inc.a | | | 1,252,251 | |
| | | | | |
| | | | Total | | | 11,952,870 | |
| | | | | |
| |
| Health Care (16.2%) | | | | |
| | 35,450 | | | Acadia Healthcare Company, Inc.a | | | 1,537,112 | |
| | 34,480 | | | ACADIA Pharmaceuticals, Inc.a,b | | | 783,730 | |
| | 20,500 | | | Aegerion Pharmaceuticals, Inc.a | | | 1,697,810 | |
| | 3,710 | | | Agios Pharmaceuticals, Inc.a,b | | | 85,924 | |
| | 41,620 | | | Air Methods Corporationb | | | 1,819,627 | |
| | 77,710 | | | Akorn, Inc.a,b | | | 1,588,392 | |
| | 35,820 | | | Align Technology, Inc.a | | | 2,043,889 | |
| | 3,410 | | | Analogic Corporation | | | 314,504 | |
| | 11,780 | | | ArthroCare Corporationa | | | 441,043 | |
| | 14,000 | | | BioScrip, Inc.a | | | 98,140 | |
| | 27,430 | | | Biotelemetry, Inc.a | | | 250,710 | |
| | 46,260 | | | Bruker Corporationa | | | 946,017 | |
| | 4,770 | | | Cardiovascular Systems, Inc.a | | | 144,770 | |
| | 29,250 | | | Cepheid, Inc.a,b | | | 1,191,060 | |
| | 21,900 | | | Cubist Pharmaceuticals, Inc.a | | | 1,357,800 | |
| | 23,670 | | | Cyberonics, Inc.a | | | 1,367,179 | |
| | 7,280 | | | Enanta Pharmaceuticals, Inc.a,b | | | 145,309 | |
| | 4,800 | | | Endologix, Inc.a | | | 86,736 | |
| | 2,820 | | | Furiex Pharmaceuticals, Inc.a | | | 110,262 | |
| | 46,370 | | | Impax Laboratories, Inc.a | | | 939,456 | |
| | 9,960 | | | Lannett Company, Inc.a | | | 235,156 | |
| | 5,870 | | | Molina Healthcare, Inc.a | | | 185,727 | |
| | 53,430 | | | Neurocrine Biosciences, Inc.a | | | 504,379 | |
| | 76,520 | | | NPS Pharmaceuticals, Inc.a | | | 2,202,246 | |
| | 24,850 | | | PAREXEL International Corporationa | | | 1,135,894 | |
| | 8,040 | | | Receptos, Inc.a | | | 205,502 | |
| | 17,210 | | | Santarus, Inc.a | | | 401,509 | |
| | 13,080 | | | Sarepta Therapeutics, Inc.a,b | | | 509,335 | |
| | 25,360 | | | Team Health Holdings, Inc.a | | | 1,101,638 | |
| | 16,410 | | | Teleflex, Inc. | | | 1,512,674 | |
| | 33,750 | | | Viropharma, Inc.a | | | 1,310,175 | |
| | 34,600 | | | West Pharmaceutical Services, Inc. | | | 1,672,910 | |
| | | | | |
| | | | Total | | | 27,926,615 | |
| | | | | |
The accompanying Notes to Financial Statements are an integral part of this schedule.
156
Partner Small Cap Growth Fund
Schedule of Investments as of October 31, 2013
| | | | | | | | |
| Shares | | | Common Stock (96.8%) | | Value | |
| Industrials (17.6%) | | | | |
| | 11,150 | | | Acuity Brands, Inc. | | | $1,120,686 | |
| | 51,310 | | | CAI International, Inc.a | | | 1,123,176 | |
| | 10,210 | | | Chart Industries, Inc.a | | | 1,097,269 | |
| | 18,900 | | | Clean Harbors, Inc.a | | | 1,167,075 | |
| | 4,430 | | | Copa Holdings SA | | | 662,462 | |
| | 11,220 | | | Energy Recovery, Inc.a | | | 65,525 | |
| | 5,190 | | | EnPro Industries, Inc.a | | | 309,687 | |
| | 35,120 | | | Generac Holdings, Inc. | | | 1,733,172 | |
| | 5,030 | | | Genesee & Wyoming, Inc.a | | | 502,195 | |
| | 28,812 | | | Heico Corporation | | | 1,543,747 | |
| | 40,530 | | | Hexcel Corporationa | | | 1,714,824 | |
| | 17,630 | | | Huron Consulting Group, Inc.a | | | 1,032,589 | |
| | 670 | | | Hyster-Yale Materials Handling, Inc. | | | 52,555 | |
| | 49,840 | | | MasTec, Inc.a | | | 1,593,385 | |
| | 4,670 | | | Middleby Corporationa | | | 1,063,125 | |
| | 24,170 | | | Old Dominion Freight Line, Inc.a | | | 1,133,573 | |
| | 47,010 | | | On Assignment, Inc.a | | | 1,588,468 | |
| | 15,810 | | | PGT, Inc.a | | | 165,215 | |
| | 8,120 | | | Primoris Services Corporation | | | 211,445 | |
| | 20,800 | | | Proto Labs, Inc.a,b | | | 1,744,288 | |
| | 8,630 | | | Roadrunner Transportation Systems, Inc.a | | | 228,695 | |
| | 47,150 | | | Saia, Inc.a | | | 1,533,789 | |
| | 22,010 | | | Spirit Airlines, Inc.a | | | 949,732 | |
| | 31,290 | | | Swift Transportation Companya | | | 681,809 | |
| �� | 50,410 | | | Thermon Group Holdings, Inc.a | | | 1,185,139 | |
| | 58,760 | | | US Airways Group, Inc.a,b | | | 1,290,957 | |
| | 50,140 | | | USG Corporationa,b | | | 1,369,323 | |
| | 4,760 | | | WageWorks, Inc.a | | | 243,760 | |
| | 13,240 | | | Watsco, Inc. | | | 1,261,640 | |
| | 14,770 | | | Watts Water Technologies, Inc. | | | 853,411 | |
| | 27,300 | | | Woodward, Inc. | | | 1,094,457 | |
| | | | | |
| | | | Total | | | 30,317,173 | |
| | | | | |
| |
| Information Technology (24.2%) | | | | |
| | 16,830 | | | Ambarella, Inc.a | | | 345,857 | |
| | 4,260 | | | ANSYS, Inc.a | | | 372,537 | |
| | 49,280 | | | Aspen Technology, Inc.a | | | 1,883,974 | |
| | 19,490 | | | Belden, Inc. | | | 1,310,897 | |
| | 49,070 | | | Bottomline Technologies, Inc.a | | | 1,541,779 | |
| | 8,100 | | | CalAmp Corporationa | | | 190,593 | |
| | 19,300 | | | Callidus Software, Inc.a | | | 199,755 | |
| | 10,790 | | | Canadian Solar, Inc.a,b | | | 248,170 | |
| | 51,040 | | | Cardtronics, Inc.a | | | 2,003,320 | |
| | 41,110 | | | Cavium, Inc.a | | | 1,657,144 | |
| | 67,980 | | | Ciena Corporationa,b | | | 1,581,895 | |
| | 42,170 | | | Cognex Corporation | | | 1,317,813 | |
| | 4,560 | | | Coherent, Inc. | | | 301,827 | |
| | 19,330 | | | CommVault Systems, Inc.a | | | 1,509,286 | |
| | 30,490 | | | Cornerstone OnDemand, Inc.a | | | 1,444,311 | |
| | 8,310 | | | Diodes, Inc.a | | | 201,268 | |
| | 19,310 | | | Electronics for Imaging, Inc.a | | | 662,526 | |
| | 41,650 | | | Ellie Mae, Inc.a | | | 1,203,685 | |
| | 29,080 | | | Guidewire Software, Inc.a | | | 1,474,938 | |
| | 6,620 | | | Heartland Payment Systems, Inc.b | | | 267,779 | |
| | 4,450 | | | Immersion Corporationa | | | 56,604 | |
| | 6,700 | | | Imperva, Inc.a | | | 256,878 | |
| | 31,140 | | | Infoblox, Inc.a | | | 1,384,173 | |
| | 3,520 | | | Interactive Intelligence Groupa | | | 216,304 | |
| | 46,180 | | | Ixiaa | | | 654,832 | |
| | 5,290 | | | Manhattan Associates, Inc.a | | | 563,438 | |
| | 26,100 | | | MAXIMUS, Inc. | | | 1,264,545 | |
| | 8,210 | | | Methode Electronics, Inc. | | | 210,012 | |
| | 66,240 | | | Monolithic Power Systems, Inc. | | | 2,109,082 | |
| | 8,640 | | | Monotype Imaging Holdings, Inc. | | | 243,821 | |
| | 7,720 | | | NETGEAR, Inc.a | | | 222,027 | |
| | 26,360 | | | OSI Systems, Inc.a | | | 1,920,062 | |
| | 1,920 | | | QIWI plc ADR | | | 77,722 | |
| | 31,470 | | | QLIK Technologies, Inc.a | | | 797,450 | |
| | 169,160 | | | RF Micro Devices, Inc.a | | | 888,090 | |
| | 45,530 | | | Semtech Corporationa | | | 1,416,438 | |
| | 2,220 | | | SPS Commerce, Inc.a | | | 151,293 | |
| | 12,380 | | | SunPower Corporationa,b | | | 373,752 | |
| | 18,550 | | | Synaptics, Inc.a,b | | | 862,575 | |
| | 47,770 | | | Synchronoss Technologies, Inc.a | | | 1,653,797 | |
| | 78,510 | | | Take-Two Interactive Software, Inc.a | | | 1,406,114 | |
| | 2,900 | | | Trulia, Inc.a,b | | | 115,913 | |
| | 8,940 | | | Tyler Technologies, Inc.a | | | 864,587 | |
| | 10,120 | | | Ultimate Software Group, Inc.a | | | 1,563,338 | |
| | 3,620 | | | Web.com Group, Inc.a | | | 97,559 | |
| | 12,600 | | | WEX, Inc.a | | | 1,176,210 | |
| | 20,430 | | | Yelp, Inc.a | | | 1,384,133 | |
| | | | | |
| | | | Total | | | 41,650,103 | |
| | | | | |
| |
| Materials (3.4%) | | | | |
| | 59,620 | | | Chemtura Corporationa | | | 1,460,690 | |
| | 60,340 | | | Commercial Metals Company | | | 1,107,843 | |
| | 10,000 | | | KapStone Paper and Packaging Corporation | | | 519,600 | |
| | 80,610 | | | Louisiana-Pacific Corporationa | | | 1,371,176 | |
| | 44,680 | | | PolyOne Corporation | | | 1,353,804 | |
| | | | | |
| | | | Total | | | 5,813,113 | |
| | | | | |
| |
| Utilities (0.1%) | | | | |
| | 4,340 | | | Artesian Resources Corporation | | | 99,386 | |
| | | | | |
| | | | Total | | | 99,386 | |
| | | | | |
| | | | | | | | |
| | | | | |
| | | | Total Common Stock (cost $123,401,046) | | | 166,597,305 | |
| | | | | |
| | |
| Shares | | | Collateral Held for Securities Loaned (10.1%) | | Value | |
| | 17,412,554 | | | Thrivent Cash Management Trust | | | 17,412,554 | |
| | | | | |
| | | | Total Collateral Held for Securities Loaned (cost $17,412,554) | | | 17,412,554 | |
| | | | | |
| | |
Shares or
Principal
Amount | | | Short-Term Investments (4.7%) | | Value | |
| | 8,052,231 | | | Thrivent Cash Management Trust 0.070% | | | 8,052,231 | |
| | | | | |
| | | | Total Short-Term Investments (at amortized cost) | | | 8,052,231 | |
| | | | | |
| | | | Total Investments (cost $148,865,831) 111.6% | | $ | 192,062,090 | |
| | | | | |
| | | | Other Assets and Liabilities, Net (11.6%) | | | (19,900,026 | ) |
| | | | | |
| | | | Total Net Assets 100.0% | | $ | 172,162,064 | |
| | | | | |
The accompanying Notes to Financial Statements are an integral part of this schedule.
157
Partner Small Cap Growth Fund
Schedule of Investments as of October 31, 2013
a | Non-income producing security. |
b | All or a portion of the security is on loan. |
Definitions:
| | | | |
ADR - | | | | American Depositary Receipt, which are certificates for an underlying foreign security’s shares held by an issuing U.S. depository bank. |
Unrealized Appreciation (Depreciation)
Gross unrealized appreciation and depreciation of investments, based on cost for federal income tax purposes, were as follows:
| | | | |
Gross unrealized appreciation | | | $43,848,481 | |
Gross unrealized depreciation | | | (981,492 | ) |
| | | | |
Net unrealized appreciation (depreciation) | | | $42,866,989 | |
| |
Cost for federal income tax purposes | | | $149,195,101 | |
Fair Valuation Measurements
The following table is a summary of the inputs used, as of October 31, 2013, in valuing Partner Small Cap Growth Fund’s assets carried at fair value.
| | | | | | | | | | | | | | | | |
Investments in Securities | | Total | | | Level 1 | | | Level 2 | | | Level 3 | |
| | | | |
Common Stock | | | | | | | | | | | | | | | | |
Consumer Discretionary | | | 30,214,177 | | | | 30,214,177 | | | | – | | | | – | |
Consumer Staples | | | 10,171,912 | | | | 10,171,912 | | | | – | | | | – | |
Energy | | | 8,451,956 | | | | 8,451,956 | | | | – | | | | – | |
Financials | | | 11,952,870 | | | | 11,952,870 | | | | – | | | | – | |
Health Care | | | 27,926,615 | | | | 27,926,615 | | | | – | | | | – | |
Industrials | | | 30,317,173 | | | | 30,317,173 | | | | – | | | | – | |
Information Technology | | | 41,650,103 | | | | 41,650,103 | | | | – | | | | – | |
Materials | | | 5,813,113 | | | | 5,813,113 | | | | – | | | | – | |
Utilities | | | 99,386 | | | | 99,386 | | | | – | | | | – | |
Collateral Held for Securities Loaned | | | 17,412,554 | | | | 17,412,554 | | | | – | | | | – | |
Short-Term Investments | | | 8,052,231 | | | | 8,052,231 | | | | – | | | | – | |
| |
Total | | | $192,062,090 | | | | $192,062,090 | | | | $– | | | | $– | |
| |
There were no significant transfers between Levels during the period ended October 31, 2013. Transfers between Levels are identified as of the end of the period.
Investment in Affiliates
Affiliated issuers, as defined under the Investment Company Act of 1940, include those in which the Fund’s holdings of an issuer represent 5% or more of the outstanding voting securities of an issuer, or any affiliated mutual fund.
A summary of transactions for the fiscal year to date, in Partner Small Cap Growth Fund, is as follows:
| | | | | | | | | | | | | | | | | | | | | | | | |
Fund | | Value
October 31, 2012 | | | Gross
Purchases | | | Gross
Sales | | | Shares Held at
October 31, 2013 | | | Value
October 31, 2013 | | | Income Earned
November 1, 2012 -
October 31, 2013 | |
Cash Management Trust-Collateral Investment | | | $14,689,588 | | | | $90,234,985 | | | | $87,512,019 | | | | 17,412,554 | | | | $17,412,554 | | | | $130,238 | |
Cash Management Trust-Short Term Investment | | | 3,459,124 | | | | 56,351,856 | | | | 51,758,749 | | | | 8,052,231 | | | | 8,052,231 | | | | 3,393 | |
Total Value and Income Earned | | | 18,148,712 | | | | | | | | | | | | | | | | 25,464,785 | | | | 133,631 | |
The accompanying Notes to Financial Statements are an integral part of this schedule.
158
Partner Small Cap Value Fund
Schedule of Investments as of October 31, 2013
| | | | | | | | |
| Shares | | | Common Stock (97.0%) | | Value | |
| Consumer Discretionary (15.2%) | |
| | 163,500 | | | Aaron’s, Inc. | | | $4,638,495 | |
| | 23,100 | | | Ascent Capital Group, Inc.a | | | 1,950,102 | |
| | 43,700 | | | CSS Industries, Inc. | | | 1,131,393 | |
| | 72,000 | | | Dorman Products, Inc. | | | 3,499,920 | |
| | 79,400 | | | Drew Industries, Inc. | | | 3,990,644 | |
| | 49,400 | | | Ethan Allen Interiors, Inc.b | | | 1,316,016 | |
| | 106,000 | | | Fifth & Pacific Companies, Inc.a | | | 2,807,940 | |
| | 57,500 | | | Fred’s, Inc. | | | 931,500 | |
| | 76,000 | | | Haverty Furniture Companies, Inc. | | | 2,113,560 | |
| | 34,300 | | | Hooker Furniture Corporation | | | 541,940 | |
| | 51,400 | | | M/I Homes, Inc.a | | | 1,052,158 | |
| | 78,000 | | | MarineMax, Inc.a | | | 1,148,940 | |
| | 46,200 | | | Matthews International Corporation | | | 1,875,720 | |
| | 25,840 | | | Men’s Wearhouse, Inc. | | | 1,093,032 | |
| | 80,000 | | | Meritage Homes Corporationa | | | 3,631,200 | |
| | 136,800 | | | Modine Manufacturing Companya | | | 1,822,176 | |
| | 146,100 | | | Orient-Express Hotels, Ltd.a | | | 1,944,591 | |
| | 12,800 | | | Red Robin Gourmet Burgers, Inc.a | | | 975,104 | |
| | 120,800 | | | Shiloh Industries, Inc. | | | 1,983,536 | |
| | 17,520 | | | Stanley Furniture Company, Inc.a | | | 68,153 | |
| | 133,200 | | | Stein Mart, Inc. | | | 1,967,364 | |
| | 33,150 | | | Steven Madden, Ltd.a | | | 1,215,942 | |
| | | | | |
| | | | Total | | | 41,699,426 | |
| | | | | |
| |
| Consumer Staples (0.6%) | | | | |
| | 203,500 | | | Alliance One International, Inc.a | | | 604,395 | |
| | 29,800 | | | Nash Finch Company | | | 836,188 | |
| | 11,000 | | | Spartan Stores, Inc. | | | 258,830 | |
| | | | | |
| | | | Total | | | 1,699,413 | |
| | | | | |
| |
| Energy (3.9%) | | | | |
| | 44,900 | | | C&J Energy Services, Inc.a,b | | | 1,034,496 | |
| | 6,200 | | | CARBO Ceramics, Inc.b | | | 777,108 | |
| | 80,700 | | | Cloud Peak Energy, Inc.a | | | 1,259,727 | |
| | 17,900 | | | Contango Oil & Gas Company | | | 767,015 | |
| | 72,300 | | | Gulf Island Fabrication, Inc. | | | 1,823,406 | |
| | 156,200 | | | Hercules Offshore, Inc.a | | | 1,062,160 | |
| | 32,300 | | | PDC Energy, Inc.a | | | 2,190,263 | |
| | 196,800 | | | Teekay Tankers, Ltd.b | | | 513,648 | |
| | 106,800 | | | Tetra Technologies, Inc.a | | | 1,385,196 | |
| | | | | |
| | | | Total | | | 10,813,019 | |
| | | | | |
| |
| Financials (23.9%) | | | | |
| | 156,000 | | | Ares Capital Corporation | | | 2,709,720 | |
| | 27,000 | | | Assured Guaranty, Ltd. | | | 553,500 | |
| | 122,800 | | | CBL & Associates Properties, Inc. | | | 2,432,668 | |
| | 136,500 | | | Cedar Realty Trust, Inc. | | | 779,415 | |
| | 313,800 | | | CoBiz Financial, Inc. | | | 3,404,730 | |
| | 57,200 | | | Columbia Banking System, Inc. | | | 1,469,468 | |
| | 55,400 | | | Compass Diversified Holdings | | | 1,062,572 | |
| | 107,700 | | | Cousins Properties, Inc. | | | 1,220,241 | |
| | 132,513 | | | East West Bancorp, Inc. | | | 4,464,363 | |
| | 38,900 | | | Employers Holdings, Inc. | | | 1,169,723 | |
| | 98,900 | | | First Potomac Realty Trust | | | 1,215,481 | |
| | 73,400 | | | Glacier Bancorp, Inc. | | | 2,028,042 | |
| | 74,000 | | | Golub Capital BDC, Inc. | | | 1,302,400 | |
| | 49,500 | | | Hatteras Financial Corporation | | | 900,900 | |
| | 150,500 | | | Hercules Technology Growth Capital, Inc. | | | 2,323,720 | |
| | 135,900 | | | Home Bancshares, Inc. | | | 4,604,292 | |
| | 19,500 | | | iShares Russell 2000 Value Index Fund | | | 1,844,310 | |
| | 49,800 | | | JMP Group, Inc. | | | 319,218 | |
| | 41,000 | | | Kilroy Realty Corporation | | | 2,179,560 | |
| | 281,300 | | | Kite Realty Group Trust | | | 1,800,320 | |
| | 68,500 | | | LaSalle Hotel Properties | | | 2,126,925 | |
| | 3,350 | | | Markel Corporationa | | | 1,774,394 | |
| | 150,700 | | | Meadowbrook Insurance Group, Inc. | | | 1,000,648 | |
| | 62,900 | | | National Interstate Corporation | | | 1,643,577 | |
| | 15,100 | | | Piper Jaffray Companiesa | | | 541,939 | |
| | 13,800 | | | Potlatch Corporation | | | 563,454 | |
| | 106,500 | | | ProAssurance Corporation | | | 4,826,580 | |
| | 8,800 | | | PS Business Parks, Inc. | | | 717,112 | |
| | 82,400 | | | Radian Group, Inc.b | | | 1,200,568 | |
| | 161,800 | | | Redwood Trust, Inc. | | | 2,834,736 | |
| | 105,600 | | | Safeguard Scientifics, Inc.a | | | 1,842,720 | |
| | 95,400 | | | Sandy Spring Bancorp, Inc. | | | 2,336,346 | |
| | 42,900 | | | SVB Financial Groupa | | | 4,108,962 | |
| | 51,600 | | | Wintrust Financial Corporation | | | 2,245,116 | |
| | | | | |
| | | | Total | | | 65,547,720 | |
| | | | | |
| |
| Health Care (3.6%) | | | | |
| | 11,200 | | | Analogic Corporation | | | 1,032,976 | |
| | 5,500 | | | Atrion Corporation | | | 1,469,490 | |
| | 31,600 | | | National Healthcare Corporation | | | 1,528,808 | |
| | 74,200 | | | Triple-S Management Corporationa | | | 1,321,502 | |
| | 96,000 | | | West Pharmaceutical Services, Inc. | | | 4,641,600 | |
| | | | | |
| | | | Total | | | 9,994,376 | |
| | | | | |
| |
| Industrials (25.2%) | | | | |
| | 95,000 | | | A.O. Smith Corporation | | | 4,906,750 | |
| | 77,000 | | | Aegion Corporationa | | | 1,578,500 | |
| | 68,000 | | | Alaska Air Group, Inc. | | | 4,804,880 | |
| | 31,200 | | | Applied Industrial Technologies, Inc. | | | 1,476,072 | |
| | 32,400 | | | Astec Industries, Inc. | | | 1,095,444 | |
| | 110,800 | | | Beacon Roofing Supply, Inc.a | | | 3,845,868 | |
| | 31,600 | | | Circor International, Inc. | | | 2,331,132 | |
| | 72,300 | | | Comfort Systems USA, Inc. | | | 1,346,949 | |
| | 68,700 | | | Dolan Companya | | | 176,559 | |
| | 42,500 | | | Franklin Electric Company, Inc. | | | 1,608,625 | |
| | 18,700 | | | FTI Consulting, Inc.a | | | 758,846 | |
| | 50,400 | | | G & K Services, Inc. | | | 3,144,960 | |
| | 49,500 | | | Genesee & Wyoming, Inc.a | | | 4,942,080 | |
| | 88,400 | | | Gibraltar Industries, Inc.a | | | 1,415,284 | |
| | 83,700 | | | Greenbrier Companies, Inc.a | | | 2,221,398 | |
| | 33,600 | | | Hub Group, Inc.a | | | 1,234,128 | |
| | 37,200 | | | IDEX Corporation | | | 2,572,380 | |
| | 39,000 | | | Kaman Corporation | | | 1,450,020 | |
| | 112,900 | | | Kforce, Inc. | | | 2,223,001 | |
| | 59,400 | | | Kirby Corporationa | | | 5,256,306 | |
| | 105,600 | | | Kratos Defense & Security Solutions, Inc.a | | | 895,488 | |
| | 22,600 | | | Landstar System, Inc. | | | 1,249,554 | |
| | 92,700 | | | McGrath Rentcorp | | | 3,306,609 | |
| | 32,800 | | | Mine Safety Appliances Company | | | 1,579,648 | |
| | 97,900 | | | Navigant Consulting, Inc.a | | | 1,698,565 | |
| | 33,000 | | | Nordson Corporation | | | 2,378,970 | |
| | 66,200 | | | Pike Electric Corporation | | | 715,622 | |
| | 11,500 | | | RBC Bearings, Inc.a | | | 791,085 | |
| | 35,700 | | | Sun Hydraulics Corporationb | | | 1,416,576 | |
| | 23,800 | | | Universal Forest Products, Inc. | | | 1,259,496 | |
| | 62,000 | | | Universal Truckload Services, Inc. | | | 1,652,920 | |
| | 41,300 | | | Waste Connections, Inc. | | | 1,765,162 | |
The accompanying Notes to Financial Statements are an integral part of this schedule.
159
Partner Small Cap Value Fund
Schedule of Investments as of October 31, 2013
| | | | | | | | |
| Shares | | | Common Stock (97.0%) | | Value | |
| Industrials (25.2%) - continued | |
| | 53,200 | | | Woodward, Inc. | | | $2,132,788 | |
| | | | | |
| | | | Total | | | 69,231,665 | |
| | | | | |
| |
| Information Technology (10.7%) | | | | |
| | 60,000 | | | Accelrys, Inc.a | | | 561,000 | |
| | 62,500 | | | Advanced Energy Industries, Inc.a | | | 1,305,000 | |
| | 37,500 | | | ATMI, Inc.a | | | 1,025,250 | |
| | 45,500 | | | Belden, Inc. | | | 3,060,330 | |
| | 84,100 | | | Brooks Automation, Inc. | | | 810,724 | |
| | 50,900 | | | Cabot Microelectronics Corporationa | | | 2,081,301 | |
| | 44,200 | | | Cognex Corporation | | | 1,381,250 | |
| | 52,700 | | | Cohu, Inc. | | | 503,812 | |
| | 101,700 | | | Electro Rent Corporation | | | 1,844,838 | |
| | 94,500 | | | Electro Scientific Industries, Inc. | | | 1,132,110 | |
| | 136,500 | | | Intevac, Inc.a | | | 696,150 | |
| | 13,800 | | | Littelfuse, Inc. | | | 1,173,414 | |
| | 72,800 | | | Methode Electronics, Inc. | | | 1,862,224 | |
| | 53,200 | | | Monotype Imaging Holdings, Inc. | | | 1,501,304 | |
| | 31,000 | | | Newport Corporationa | | | 491,970 | |
| | 85,700 | | | Progress Software Corporationa | | | 2,224,772 | |
| | 169,700 | | | ShoreTel, Inc.a | | | 1,349,115 | |
| | 256,700 | | | Sonus Networks, Inc.a | | | 770,100 | |
| | 52,000 | | | Synnex Corporationa | | | 3,187,600 | |
| | 61,000 | | | Teradyne, Inc.a | | | 1,066,890 | |
| | 52,300 | | | Xyratex, Ltd. | | | 519,862 | |
| | 63,700 | | | Zygo Corporationa | | | 983,528 | |
| | | | | |
| | | | Total | | | 29,532,544 | |
| | | | | |
| |
| Materials (8.8%) | | | | |
| | 41,400 | | | AMCOL International Corporation | | | 1,328,112 | |
| | 23,200 | | | American Vanguard Corporation | | | 605,520 | |
| | 55,500 | | | AptarGroup, Inc. | | | 3,560,880 | |
| | 21,200 | | | Carpenter Technology Corporation | | | 1,257,796 | |
| | 63,000 | | | Clearwater Paper Corporationa | | | 3,289,860 | |
| | 46,000 | | | Franco-Nevada Corporation | | | 2,069,592 | |
| | 19,200 | | | Haynes International, Inc. | | | 1,034,880 | |
| | 79,800 | | | Innospec, Inc. | | | 3,675,588 | |
| | 38,800 | | | Minerals Technologies, Inc. | | | 2,197,244 | |
| | 96,800 | | | Myers Industries, Inc. | | | 1,724,976 | |
| | 57,100 | | | Stillwater Mining Companya | | | 622,961 | |
| | 14,700 | | | Texas Industries, Inc.a,b | | | 789,390 | |
| | 167,400 | | | Wausau Paper Corporation | | | 1,958,580 | |
| | | | | |
| | | | Total | | | 24,115,379 | |
| | | | | |
| |
| Telecommunications Services (0.3%) | | | | |
| | 79,000 | | | Premiere Global Services, Inc.a | | | 711,790 | |
| | | | | |
| | | | Total | | | 711,790 | |
| | | | | |
| |
| Utilities (4.8%) | | | | |
| | 24,800 | | | Black Hills Corporation | | | 1,257,856 | |
| | 79,800 | | | Cleco Corporation | | | 3,697,932 | |
| | 53,900 | | | El Paso Electric Company | | | 1,895,663 | |
| | 43,700 | | | NorthWestern Corporation | | | 2,003,208 | |
| | 47,400 | | | PNM Resources, Inc. | | | 1,133,808 | |
| | 52,500 | | | Southwest Gas Corporation | | | 2,848,650 | |
| | 6,500 | | | UNS Energy Corporation | | | 321,620 | |
| | | | | |
| | | | Total | | | 13,158,737 | |
| | | | | |
| | | | | | | | |
| | | | | |
| | | | Total Common Stock (cost $147,903,910) | | | 266,504,069 | |
| | | | | |
| | |
| Shares | | | Preferred Stock (0.2%) | | Value | |
| Health Care (0.2%) | |
| | 34,446 | | | National Healthcare Corporation, Convertiblec | | | 492,578 | |
| | | | | |
| | | | Total | | | 492,578 | |
| | | | | |
| | | | | | | | |
| | | | | |
| | | | Total Preferred Stock (cost $464,753) | | | 492,578 | |
| | | | | |
| | |
| Shares | | | Collateral Held for Securities Loaned (1.7%) | | Value | |
| | 4,609,450 | | | Thrivent Cash Management Trust | | | 4,609,450 | |
| | | | | |
| | | | Total Collateral Held for Securities Loaned (cost $4,609,450) | | | 4,609,450 | |
| | | | | |
| | |
Shares or Principal Amount | | | Short-Term Investments (2.9%) | | Value | |
| | 7,881,847 | | | Thrivent Cash Management Trust 0.070% | | | 7,881,847 | |
| | | | | |
| | | | Total Short-Term Investments (at amortized cost) | | | 7,881,847 | |
| | | | | |
| | | | Total Investments (cost $160,859,960) 101.8% | | | $279,487,944 | |
| | | | | |
| | | | Other Assets and Liabilities, Net (1.8%) | | | (4,935,681 | ) |
| | | | | |
| | | | Total Net Assets 100.0% | | | $274,552,263 | |
| | | | | |
a | Non-income producing security. |
b | All or a portion of the security is on loan. |
c | Denotes perpetual securities. Perpetual securities pay an indefinite stream of interest, but may be called by the issuer at an earlier date. |
Unrealized Appreciation (Depreciation)
Gross unrealized appreciation and depreciation of investments, based on cost for federal income tax purposes, were as follows:
| | | | |
Gross unrealized appreciation | | | $120,955,520 | |
Gross unrealized depreciation | | | (3,248,201 | ) |
| | | | |
Net unrealized appreciation (depreciation) | | | $117,707,319 | |
| |
Cost for federal income tax purposes | | | $161,780,625 | |
The accompanying Notes to Financial Statements are an integral part of this schedule.
160
Partner Small Cap Value Fund
Schedule of Investments as of October 31, 2013
Fair Valuation Measurements
The following table is a summary of the inputs used, as of October 31, 2013, in valuing Partner Small Cap Value Fund’s assets carried at fair value.
| | | | | | | | | | | | | | | | |
Investments in Securities | | Total | | | Level 1 | | | Level 2 | | | Level 3 | |
| | | | |
Common Stock | | | | | | | | | | | | | | | | |
Consumer Discretionary | | | 41,699,426 | | | | 41,699,426 | | | | – | | | | – | |
Consumer Staples | | | 1,699,413 | | | | 1,699,413 | | | | – | | | | – | |
Energy | | | 10,813,019 | | | | 10,813,019 | | | | – | | | | – | |
Financials | | | 65,547,720 | | | | 65,547,720 | | | | – | | | | – | |
Health Care | | | 9,994,376 | | | | 9,994,376 | | | | – | | | | – | |
Industrials | | | 69,231,665 | | | | 69,231,665 | | | | – | | | | – | |
Information Technology | | | 29,532,544 | | | | 29,532,544 | | | | – | | | | – | |
Materials | | | 24,115,379 | | | | 22,045,787 | | | | 2,069,592 | | | | – | |
Telecommunications Services | | | 711,790 | | | | 711,790 | | | | – | | | | – | |
Utilities | | | 13,158,737 | | | | 13,158,737 | | | | – | | | | – | |
| | | | |
Preferred Stock | | | | | | | | | | | | | | | | |
Health Care | | | 492,578 | | | | 492,578 | | | | – | | | | – | |
Collateral Held for Securities Loaned | | | 4,609,450 | | | | 4,609,450 | | | | – | | | | – | |
Short-Term Investments | | | 7,881,847 | | | | 7,881,847 | | | | – | | | | – | |
| |
Total | | | $279,487,944 | | | | $277,418,352 | | | | $2,069,592 | | | | $– | |
| |
There were no significant transfers between Levels during the period ended October 31, 2013. Transfers between Levels are identified as of the end of the period.
The following table summarizes the net realized gains/(losses) and Statement of Operations location, for the period ended October 31, 2013, for Partner Small Cap Value Fund’s investments in financial derivative instruments by primary risk exposure.
| | | | | | |
Derivatives by risk category | | Statement of Operations Location | | Realized Gains/(Losses) recognized in Income | |
| | |
Foreign Exchange Contracts | | | | | | |
Forward Contracts | | Net realized gains/(losses) on Foreign currency transactions | | | (144 | ) |
| | |
Total Foreign Exchange Contracts | | | | | (144 | ) |
| |
Total | | | | | ($144 | ) |
| | |
The following table presents Partner Small Cap Value Fund’s average volume of derivative activity during the period ended October 31, 2013.
| | | | | | | | |
Derivative Risk Category | | Forwards (Notional)* | | | Forwards (Percentage of Average Net Assets) | |
Foreign Exchange Contracts | | | $292 | | | | <0.1 | % |
* | Notional amount represents long or short, or both, derivative positions held by the Fund. |
The accompanying Notes to Financial Statements are an integral part of this schedule.
161
Partner Small Cap Value Fund
Schedule of Investments as of October 31, 2013
Investment in Affiliates
Affiliated issuers, as defined under the Investment Company Act of 1940, include those in which the Fund’s holdings of an issuer represent 5% or more of the outstanding voting securities of an issuer, or any affiliated mutual fund.
A summary of transactions for the fiscal year to date, in Partner Small Cap Value Fund, is as follows:
| | | | | | | | | | | | | | | | | | | | | | | | |
Fund | | Value October 31, 2012 | | | Gross Purchases | | | Gross Sales | | | Shares Held at October 31, 2013 | | | Value October 31, 2013 | | | Income Earned November 1, 2012 - October 31, 2013 | |
Cash Management Trust-Collateral Investment | | | $4,654,850 | | | | $65,517,768 | | | | $65,563,168 | | | | 4,609,450 | | | | $4,609,450 | | | | $64,223 | |
Cash Management Trust-Short Term Investment | | | 3,272,308 | | | | 25,301,688 | | | | 20,692,149 | | | | 7,881,847 | | | | 7,881,847 | | | | 4,269 | |
Total Value and Income Earned | | | 7,927,158 | | | | | | | | | | | | | | | | 12,491,297 | | | | 68,492 | |
The accompanying Notes to Financial Statements are an integral part of this schedule.
162
Small Cap Stock Fund
Schedule of Investments as of October 31, 2013
| | | | | | | | |
| Shares | | | Common Stock (92.2%) | | Value | |
| Consumer Discretionary (14.5%) | |
| | 97,900 | | | Cheesecake Factory, Inc. | | | $4,625,775 | |
| | 23,267 | | | Foot Locker, Inc. | | | 807,365 | |
| | 70,580 | | | GNC Holdings, Inc. | | | 4,151,516 | |
| | 235,722 | | | Ignite Restaurant Group, Inc.a | | | 3,785,695 | |
| | 216,025 | | | MDC Partners, Inc. | | | 6,660,051 | |
| | 158,500 | | | Meredith Corporationb | | | 8,131,050 | |
| | 163,340 | | | Nexstar Broadcasting Group, Inc. | | | 7,250,663 | |
| | 94,150 | | | Papa John’s International, Inc. | | | 7,124,330 | |
| | 123,640 | | | Pier 1 Imports, Inc. | | | 2,581,603 | |
| | 247,500 | | | Tuesday Morning Corporationa | | | 3,502,125 | |
| | | | | |
| | | | Total | | | 48,620,173 | |
| | | | | |
| |
| Consumer Staples (3.6%) | | | | |
| | 85,092 | | | Annie’s, Inc.a,b | | | 4,020,597 | |
| | 44,092 | | | Ingredion, Inc. | | | 2,899,490 | |
| | 260,490 | | | WhiteWave Foods Companya | | | 5,212,405 | |
| | | | | |
| | | | Total | | | 12,132,492 | |
| | | | | |
| |
| Energy (5.2%) | | | | |
| | 78,350 | | | Oasis Petroleum, Inc.a | | | 4,172,137 | |
| | 272,350 | | | Rex Energy Corporationa | | | 5,855,525 | |
| | 122,900 | | | Rosetta Resources, Inc.a | | | 7,366,626 | |
| | | | | |
| | | | Total | | | 17,394,288 | |
| | | | | |
| |
| Financials (19.2%) | | | | |
| | 47,932 | | | Affiliated Managers Group, Inc.a | | | 9,463,694 | |
| | 17,630 | | | Allied World Assurance Company Holdings AG | | | 1,909,153 | |
| | 74,800 | | | American Assets Trust, Inc. | | | 2,490,092 | |
| | 45,160 | | | Aspen Insurance Holdings, Ltd. | | | 1,761,692 | |
| | 79,200 | | | BBCN Bancorp, Inc. | | | 1,174,536 | |
| | 186,100 | | | CNO Financial Group, Inc. | | | 2,899,438 | |
| | 46,800 | | | Columbia Banking System, Inc. | | | 1,202,292 | |
| | 376,300 | | | DCT Industrial Trust, Inc. | | | 2,916,325 | |
| | 36,560 | | | Extra Space Storage, Inc. | | | 1,681,394 | |
| | 208,780 | | | Hanmi Financial Corporation | | | 3,649,474 | |
| | 97,600 | | | HCC Insurance Holdings, Inc. | | | 4,455,440 | |
| | 103,400 | | | Parkway Properties, Inc. | | | 1,872,574 | |
| | 94,000 | | | Pebblebrook Hotel Trust | | | 2,838,800 | |
| | 69,409 | | | Popular, Inc.a | | | 1,752,577 | |
| | 27,580 | | | SPDR S&P Biotech ETF | | | 3,281,744 | |
| | 97,400 | | | SVB Financial Groupa | | | 9,328,972 | |
| | 21,294 | | | Taubman Centers, Inc. | | | 1,400,932 | |
| | 150,490 | | | Terreno Realty Corporation | | | 2,675,712 | |
| | 76,590 | | | Texas Capital Bancshares, Inc.a | | | 3,986,510 | |
| | 130,437 | | | Zions Bancorporation | | | 3,700,498 | |
| | | | | |
| | | | Total | | | 64,441,849 | |
| | | | | |
| |
| Health Care (8.7%) | | | | |
| | 245,700 | | | Akorn, Inc.a,b | | | 5,022,108 | |
| | 142,330 | | | Align Technology, Inc.a | | | 8,121,350 | |
| | 401,000 | | | BioScrip, Inc.a | | | 2,811,010 | |
| | 231,672 | | | ExamWorks Group, Inc.a,b | | | 5,988,721 | |
| | 130,900 | | | Neurocrine Biosciences, Inc.a | | | 1,235,696 | |
| | 190,723 | | | NuVasive, Inc.a | | | 6,061,177 | |
| | | | | |
| | | | Total | | | 29,240,062 | |
| | | | | |
| |
| Industrials (18.7%) | | | | |
| | 88,050 | | | Actuant Corporation | | | 3,307,158 | |
| | 50,800 | | | Acuity Brands, Inc. | | | 5,105,908 | |
| | 86,570 | | | Apogee Enterprises, Inc. | | | 2,707,910 | |
| | 75,900 | | | CLARCOR, Inc. | | | 4,438,632 | |
| | 195,000 | | | DigitalGlobe, Inc.a | | | 6,204,900 | |
| | 241,711 | | | EMCOR Group, Inc. | | | 8,957,810 | |
| | 162,200 | | | GATX Corporation | | | 8,361,410 | |
| | 143,800 | | | HNI Corporation | | | 5,586,630 | |
| | 26,641 | | | Korn/Ferry Internationala | | | 634,056 | |
| | 115,800 | | | Landstar System, Inc. | | | 6,402,582 | |
| | 95,900 | | | Manpower, Inc. | | | 7,489,790 | |
| | 61,750 | | | Tennant Company | | | 3,747,607 | |
| | | | | |
| | | | Total | | | 62,944,393 | |
| | | | | |
| |
| Information Technology (11.3%) | | | | |
| | 405,100 | | | Atmel Corporationa | | | 2,949,128 | |
| | 157,068 | | | E2open, Inc.a,b | | | 3,534,030 | |
| | 98,100 | | | Guidewire Software, Inc.a | | | 4,975,632 | |
| | 163,620 | | | Informatica Corporationa | | | 6,315,732 | |
| | 104,736 | | | Plantronics, Inc. | | | 4,497,364 | |
| | 198,519 | | | Teradyne, Inc.a | | | 3,472,097 | |
| | 90,900 | | | Ubiquiti Networks, Inc.b | | | 3,506,922 | |
| | 145,850 | | | Virtusa Corporationa | | | 4,533,018 | |
| | 335,600 | | | Vishay Intertechnology, Inc.a,b | | | 4,117,812 | |
| | | | | |
| | | | Total | | | 37,901,735 | |
| | | | | |
| |
| Materials (5.9%) | | | | |
| | 44,400 | | | Eagle Materials, Inc. | | | 3,330,444 | |
| | 162,580 | | | H.B. Fuller Company | | | 7,782,704 | |
| | 155,770 | | | Materials Select Sector SPDR Fund | | | 6,818,053 | |
| | 31,000 | | | Schweitzer-Mauduit International, Inc. | | | 1,918,280 | |
| | | | | |
| | | | Total | | | 19,849,481 | |
| | | | | |
| |
| Telecommunications Services (0.7%) | | | | |
| | 62,813 | | | Cogent Communications Group, Inc. | | | 2,206,621 | |
| | | | | |
| | | | Total | | | 2,206,621 | |
| | | | | |
| |
| Utilities (4.4%) | | | | |
| | 103,220 | | | NorthWestern Corporation | | | 4,731,605 | |
| | 197,230 | | | PNM Resources, Inc. | | | 4,717,742 | |
| | 101,621 | | | Southwest Gas Corporation | | | 5,513,955 | |
| | | | | |
| | | | Total | | | 14,963,302 | |
| | | | | |
| | | | | | | | |
| | | | | |
| | | | Total Common Stock (cost $245,567,960) | | | 309,694,396 | |
| | | | | |
| | |
| Shares | | | Collateral Held for Securities Loaned (7.8%) | | Value | |
| | 26,183,357 | | | Thrivent Cash Management Trust | | | 26,183,357 | |
| | | | | |
| | | | Total Collateral Held for Securities Loaned (cost $26,183,357) | | | 26,183,357 | |
| | | | | |
| | |
Shares or
Principal
Amount | | | Short-Term Investments (7.9%) | | Value | |
| | | | Federal National Mortgage Association Discount Notes | | | | |
| | 1,500,000 | | | 0.100%, 12/4/2013c,d | | | 1,499,863 | |
| | | | Thrivent Cash Management Trust | | | | |
| | 24,933,198 | | | 0.070% | | | 24,933,198 | |
| | | | | |
| | | | Total Short-Term Investments (at amortized cost) | | | 26,433,061 | |
| | | | | |
| | | | Total Investments (cost $298,184,378) 107.9% | | $ | 362,310,814 | |
| | | | | |
| | | | Other Assets and Liabilities, Net (7.9%) | | | (26,565,257 | ) |
| | | | | |
| | | | Total Net Assets 100.0% | | $ | 335,745,557 | |
| | | | | |
The accompanying Notes to Financial Statements are an integral part of this schedule.
163
Small Cap Stock Fund
Schedule of Investments as of October 31, 2013
a | Non-income producing security. |
b | All or a portion of the security is on loan. |
c | The interest rate shown reflects the yield, coupon rate or the discount rate at the date of purchase. |
d | At October 31, 2013, $1,499,863 of investments were held on deposit with the counterparty and pledged as the initial margin deposit for open futures contracts. |
Definitions:
| | |
ETF | | - Exchange Traded Fund. |
Unrealized Appreciation (Depreciation)
Gross unrealized appreciation and depreciation of investments, based on cost for federal income tax purposes, were as follows:
| | | | |
Gross unrealized appreciation | | | $67,488,273 | |
Gross unrealized depreciation | | | (3,362,044 | ) |
| | | | |
Net unrealized appreciation (depreciation) | | | $64,126,229 | |
| |
Cost for federal income tax purposes | | | $298,184,585 | |
Fair Valuation Measurements
The following table is a summary of the inputs used, as of October 31, 2013, in valuing Small Cap Stock Fund’s assets carried at fair value.
| | | | | | | | | | | | | | | | |
Investments in Securities | | Total | | | Level 1 | | | Level 2 | | | Level 3 | |
| | | | |
Common Stock | | | | | | | | | | | | | | | | |
Consumer Discretionary | | | 48,620,173 | | | | 48,620,173 | | | | – | | | | – | |
Consumer Staples | | | 12,132,492 | | | | 12,132,492 | | | | – | | | | – | |
Energy | | | 17,394,288 | | | | 17,394,288 | | | | – | | | | – | |
Financials | | | 64,441,849 | | | | 64,441,849 | | | | – | | | | – | |
Health Care | | | 29,240,062 | | | | 29,240,062 | | | | – | | | | – | |
Industrials | | | 62,944,393 | | | | 62,944,393 | | | | – | | | | – | |
Information Technology | | | 37,901,735 | | | | 37,901,735 | | | | – | | | | – | |
Materials | | | 19,849,481 | | | | 19,849,481 | | | | – | | | | – | |
Telecommunications Services | | | 2,206,621 | | | | 2,206,621 | | | | – | | | | – | |
Utilities | | | 14,963,302 | | | | 14,963,302 | | | | – | | | | – | |
Collateral Held for Securities Loaned | | | 26,183,357 | | | | 26,183,357 | | | | – | | | | – | |
Short-Term Investments | | | 26,433,061 | | | | 24,933,198 | | | | 1,499,863 | | | | – | |
| |
Total | | | $362,310,814 | | | | $360,810,951 | | | | $1,499,863 | | | | $– | |
| |
| | | | |
Other Financial Instruments | | Total | | | Level 1 | | | Level 2 | | | Level 3 | |
| | | | |
Asset Derivatives | | | | | | | | | | | | | | | | |
Futures Contracts | | | 870,806 | | | | 870,806 | | | | – | | | | – | |
| |
Total Asset Derivatives | | | $870,806 | | | | $870,806 | | | | $– | | | | $– | |
| |
There were no significant transfers between Levels during the period ended October 31, 2013. Transfers between Levels are identified as of the end of the period.
| | | | | | | | | | | | | | | | | | | | |
Futures Contracts | | Number of
Contracts
Long/(Short) | | | Expiration
Date | | | Notional
Principal
Amount | | | Value | | | Unrealized
Gain/(Loss) | |
Russell 2000 Index Mini-Futures | | | 169 | | | | December 2013 | | | | $17,682,014 | | | | $18,552,820 | | | | $870,806 | |
Total Futures Contracts | | | | | | | | | | | | | | | | | | | $870,806 | |
The following table summarizes the fair value and Statement of Assets and Liabilities location, as of October 31, 2013, for Small Cap Stock Fund’s investments in financial derivative instruments by primary risk exposure as discussed under item (2) Significant Accounting Policies of the Notes to Financial Statements.
| | | | | | |
Derivatives by risk category | | Statement of Assets and Liabilities Location | | Fair Value | |
| | |
Asset Derivatives | | | | | | |
| | |
Equity Contracts | | | | | | |
Futures* | | Net Assets - Net unrealized appreciation/(depreciation) on Futures contracts | | | 870,806 | |
Total Equity Contracts | | | | | 870,806 | |
| |
Total Asset Derivatives | | | | | $870,806 | |
| |
* | Includes cumulative appreciation/depreciation of futures contracts as reported in the Schedule of Investments. Only current day’s variation margin is reported within the Statement of Assets and Liabilities. |
The accompanying Notes to Financial Statements are an integral part of this schedule.
164
Small Cap Stock Fund
Schedule of Investments as of October 31, 2013
The following table summarizes the net realized gains/(losses) and Statement of Operations location, for the period ended October 31, 2013, for Small Cap Stock Fund’s investments in financial derivative instruments by primary risk exposure.
| | | | | | |
Derivatives by risk category | | Statement of Operations Location | | Realized Gains/(Losses)
recognized in Income | |
| | |
Equity Contracts | | | | | | |
Futures | | Net realized gains/(losses) on Futures contracts | | | 6,567,940 | |
| | |
Total Equity Contracts | | | | | 6,567,940 | |
| | |
Foreign Exchange Contracts | | | | | | |
Forward Contracts | | Net realized gains/(losses) on Foreign currency transactions | | | (19,092) | |
| | |
Total Foreign Exchange Contracts | | | | | (19,092) | |
| |
Total | | | | | $6,548,848 | |
| |
The following table summarizes the change in net unrealized appreciation/(depreciation) and Statement of Operations location, for the period ended October 31, 2013, for Small Cap Stock Fund’s investments in financial derivative instruments by primary risk exposure.
| | | | | | |
Derivatives by risk category | | Statement of Operations Location | | Change in unrealized
appreciation/(depreciation)
recognized in Income | |
| | |
Equity Contracts | | | | | | |
Futures | | Change in net unrealized appreciation/(depreciation) on Futures contracts | | | 2,504,223 | |
Total Equity Contracts | | | | | 2,504,223 | |
| |
Total | | | | | $2,504,223 | |
| |
The following table presents Small Cap Stock Fund’s average volume of derivative activity during the period ended October 31, 2013.
| | | | | | | | | | | | | | | | |
Derivative Risk Category | | Futures
(Notional)* | | | Futures
(Percentage
of Average
Net Assets) | | | Forwards
(Notional)* | | | Forwards
(Percentage
of Average
Net Assets) | |
Equity Contracts | | | $28,401,721 | | | | 9.3 | % | | | N/A | | | | N/A | |
Foreign Exchange Contracts | | | N/A | | | | N/A | | | | $43,864 | | | | <0.1 | % |
* | Notional amount represents long or short, or both, derivative positions held by the Fund. |
Investment in Affiliates
Affiliated issuers, as defined under the Investment Company Act of 1940, include those in which the Fund’s holdings of an issuer represent 5% or more of the outstanding voting securities of an issuer, or any affiliated mutual fund.
A summary of transactions for the fiscal year to date, in Small Cap Stock Fund, is as follows:
| | | | | | | | | | | | | | | | | | | | | | | | |
Fund | | Value
October 31, 2012 | | | Gross
Purchases | | | Gross
Sales | | | Shares Held at
October 31, 2013 | | | Value
October 31, 2013 | | | Income Earned
November 1, 2012 -
October 31, 2013 | |
Cash Management Trust-Collateral Investment | | | $18,604,753 | | | | $163,149,855 | | | | $155,571,251 | | | | 26,183,357 | | | | $26,183,357 | | | | $122,696 | |
Cash Management Trust-Short Term Investment | | | 29,007,394 | | | | 94,882,232 | | | | 98,956,428 | | | | 24,933,198 | | | | 24,933,198 | | | | 30,604 | |
Total Value and Income Earned | | | 47,612,147 | | | | | | | | | | | | | | | | 51,116,555 | | | | 153,300 | |
The accompanying Notes to Financial Statements are an integral part of this schedule.
165
Mid Cap Growth Fund
Schedule of Investments as of October 31, 2013
| | | | | | | | |
| Shares | | | Common Stock (95.5%) | | Value | |
| Consumer Discretionary (16.7%) | |
| | 33,100 | | | Darden Restaurants, Inc. | | | $1,705,643 | |
| | 122,550 | | | Discovery Communications, Inc.a | | | 10,897,146 | |
| | 193,800 | | | Dollar Tree, Inc.a | | | 11,317,920 | |
| | 99,185 | | | GNC Holdings, Inc. | | | 5,834,062 | |
| | 82,000 | | | HomeAway, Inc.a,b | | | 2,431,300 | |
| | 54,100 | | | L Brands, Inc. | | | 3,387,201 | |
| | 87,400 | | | Marriott International, Inc. | | | 3,939,992 | |
| | 32,800 | | | Michael Kors Holdings, Ltd.a | | | 2,523,960 | |
| | 31,300 | | | O’Reilly Automotive, Inc.a | | | 3,875,253 | |
| | 46,300 | | | PetSmart, Inc. | | | 3,368,788 | |
| | 50,300 | | | Ross Stores, Inc. | | | 3,890,705 | |
| | 124,000 | | | Tractor Supply Company | | | 8,847,400 | |
| | 29,400 | | | Under Armour, Inc.a | | | 2,385,810 | |
| | 7,800 | | | VF Corporation | | | 1,677,000 | |
| | 23,700 | | | Wynn Resorts, Ltd. | | | 3,940,125 | |
| | | | | |
| | | | Total | | | 70,022,305 | |
| | | | | |
| |
| Consumer Staples (5.2%) | | | | |
| | 55,700 | | | Beam, Inc. | | | 3,748,610 | |
| | 65,100 | | | Hain Celestial Group, Inc.a | | | 5,418,273 | |
| | 79,400 | | | Monster Beverage Corporationa | | | 4,544,062 | |
| | 128,098 | | | Whole Foods Market, Inc. | | | 8,086,827 | |
| | | | | |
| | | | Total | | | 21,797,772 | |
| | | | | |
| |
| Energy (7.5%) | | | | |
| | 522,600 | | | Alpha Natural Resources, Inc.a | | | 3,658,200 | |
| | 59,700 | | | Cameron International Corporationa | | | 3,275,142 | |
| | 60,700 | | | Concho Resources, Inc.a | | | 6,714,027 | |
| | 126,800 | | | Peabody Energy Corporation | | | 2,470,064 | |
| | 21,900 | | | Range Resources Corporation | | | 1,658,049 | |
| | 67,700 | | | SM Energy Company | | | 5,998,897 | |
| | 99,900 | | | Southwestern Energy Companya | | | 3,718,278 | |
| | 246,200 | | | Weatherford International, Ltd.a | | | 4,047,528 | |
| | | | | |
| | | | Total | | | 31,540,185 | |
| | | | | |
| |
| Financials (8.8%) | | | | |
| | 63,320 | | | Affiliated Managers Group, Inc.a | | | 12,501,901 | |
| | 66,100 | | | Ameriprise Financial, Inc. | | | 6,645,694 | |
| | 92,000 | | | Discover Financial Services | | | 4,772,960 | |
| | 134,800 | | | First Republic Bank | | | 6,884,236 | |
| | 55,500 | | | T. Rowe Price Group, Inc. | | | 4,296,255 | |
| | 61,300 | | | Zions Bancorporation | | | 1,739,081 | |
| | | | | |
| | | | Total | | | 36,840,127 | |
| | | | | |
| |
| Health Care (11.3%) | | | | |
| | 27,900 | | | Actavis, Inc.a | | | 4,312,782 | |
| | 63,927 | | | AmerisourceBergen Corporation | | | 4,176,351 | |
| | 84,800 | | | BioMarin Pharmaceutical, Inc.a | | | 5,327,136 | |
| | 35,152 | | | Catamaran Corporationa | | | 1,650,738 | |
| | 72,300 | | | Cerner Corporationa | | | 4,050,969 | |
| | 45,100 | | | CIGNA Corporation | | | 3,471,798 | |
| | 74,400 | | | Envision Healthcare Holdings, Inc.a | | | 2,161,320 | |
| | 86,900 | | | Hologic, Inc.a | | | 1,945,691 | |
| | 28,400 | | | Mettler-Toledo International, Inc.a | | | 7,027,864 | |
| | 54,700 | | | Perrigo Companyb | | | 7,542,583 | |
| | 134,100 | | | Thoratec Corporationa | | | 5,791,779 | |
| | | | | |
| | | | Total | | | 47,459,011 | |
| | | | | |
| |
| Industrials (20.9%) | | | | |
| | 175,177 | | | AMETEK, Inc. | | | 8,378,716 | |
| | 73,400 | | | B/E Aerospace, Inc.a | | | 5,957,144 | |
| | 115,400 | | | Expeditors International of Washington, Inc. | | | 5,226,466 | |
| | 57,600 | | | Fastenal Company | | | 2,868,480 | |
| | 52,165 | | | Flowserve Corporation | | | 3,623,902 | |
| | 107,500 | | | Fortune Brands Home and Security, Inc. | | | 4,631,100 | |
| | 46,200 | | | GATX Corporation | | | 2,381,610 | |
| | 58,800 | | | Graco, Inc. | | | 4,542,888 | |
| | 83,500 | | | JB Hunt Transport Services, Inc. | | | 6,265,005 | |
| | 55,400 | | | Kansas City Southern | | | 6,732,208 | |
| | 71,600 | | | Nielsen Holdings NV | | | 2,823,904 | |
| | 69,200 | | | Pentair, Ltd. | | | 4,642,628 | |
| | 132,200 | | | Quanta Services, Inc.a | | | 3,993,762 | |
| | 128,100 | | | Robert Half International, Inc. | | | 4,935,693 | |
| | 53,500 | | | Roper Industries, Inc. | | | 6,784,335 | |
| | 67,100 | | | Stericycle, Inc.a | | | 7,797,020 | |
| | 93,700 | | | United Rentals, Inc.a,b | | | 6,052,083 | |
| | | | | |
| | | | Total | | | 87,636,944 | |
| | | | | |
| |
| Information Technology (19.4%) | | | | |
| | 140,779 | | | Agilent Technologies, Inc. | | | 7,145,942 | |
| | 50,100 | | | Amphenol Corporation | | | 4,022,529 | |
| | 91,600 | | | ANSYS, Inc.a | | | 8,010,420 | |
| | 136,986 | | | Autodesk, Inc.a | | | 5,467,111 | |
| | 148,700 | | | Ciena Corporationa,b | | | 3,460,249 | |
| | 68,374 | | | Euronet Worldwide, Inc.a | | | 2,967,432 | |
| | 74,400 | | | F5 Networks, Inc.a | | | 6,064,344 | |
| | 48,600 | | | Gartner, Inc.a | | | 2,864,970 | |
| | 111,500 | | | Lam Research Corporationa | | | 6,046,645 | |
| | 11,300 | | | LinkedIn Corporationa | | | 2,527,471 | |
| | 16,000 | | | Mercadolibre, Inc.b | | | 2,154,160 | |
| | 124,419 | | | Microchip Technology, Inc.b | | | 5,345,040 | |
| | 43,400 | | | Nice Systems, Ltd. ADR | | | 1,700,412 | |
| | 83,919 | | | Nuance Communications, Inc.a | | | 1,305,780 | |
| | 401,700 | | | NVIDIA Corporation | | | 6,097,806 | |
| | 141,600 | | | NXP Semiconductors NVa | | | 5,964,192 | |
| | 39,500 | | | ServiceNow, Inc.a | | | 2,157,095 | |
| | 103,700 | | | Synopsys, Inc.a | | | 3,779,865 | |
| | 104,629 | | | VeriFone Systems, Inc.a | | | 2,370,893 | |
| | 43,600 | | | Xilinx, Inc. | | | 1,980,312 | |
| | | | | |
| | | | Total | | | 81,432,668 | |
| | | | | |
| |
| Materials (4.2%) | | | | |
| | 53,900 | | | Airgas, Inc. | | | 5,878,873 | |
| | 36,300 | | | Albemarle Corporation | | | 2,402,697 | |
| | 69,500 | | | Celanese Corporation | | | 3,892,695 | |
| | 54,000 | | | FMC Corporation | | | 3,929,040 | |
| | 67,800 | | | Silver Wheaton Corporation | | | 1,537,026 | |
| | | | | |
| | | | Total | | | 17,640,331 | |
| | | | | |
| |
| Telecommunications Services (1.5%) | | | | |
| | 38,000 | | | Cogent Communications Group, Inc. | | | 1,334,940 | |
| | 24,600 | | | SBA Communications Corporationa,b | | | 2,151,762 | |
| | 91,300 | | | TW Telecom, Inc.a | | | 2,877,776 | |
| | | | | |
| | | | Total | | | 6,364,478 | |
| | | | | |
| | | | | | | | |
| | | | | |
| | | | Total Common Stock (cost $274,691,020) | | | 400,733,821 | |
| | | | | |
The accompanying Notes to Financial Statements are an integral part of this schedule.
166
Mid Cap Growth Fund
Schedule of Investments as of October 31, 2013
| | | | | | | | |
| Shares | | | Collateral Held for Securities Loaned (4.6%) | | Value | |
| | 19,138,554 | | | Thrivent Cash Management Trust | | | $19,138,554 | |
| | | | | |
| | | | Total Collateral Held for Securities Loaned (cost $19,138,554) | | | 19,138,554 | |
| | | | | |
| | |
Shares or
Principal
Amount | | | Short-Term Investments (4.4%) | | Value | |
| | 18,686,520 | | | Thrivent Cash Management Trust 0.070% | | | 18,686,520 | |
| | | | | |
| | | | Total Short-Term Investments (at amortized cost) | | | 18,686,520 | |
| | | | | |
| | | | Total Investments (cost $312,516,094) 104.5% | | $ | 438,558,895 | |
| | | | | |
| | | | Other Assets and Liabilities, Net (4.5%) | | | (18,766,676 | ) |
| | | | | |
| | | | Total Net Assets 100.0% | | $ | 419,792,219 | |
| | | | | |
a | Non-income producing security. |
b | All or a portion of the security is on loan. |
Definitions:
| | |
ADR | | - American Depositary Receipt, which are certificates for an underlying foreign security’s shares held by an issuing U.S. depository bank. |
Unrealized Appreciation (Depreciation)
Gross unrealized appreciation and depreciation of investments, based on cost for federal income tax purposes, were as follows:
| | | | |
Gross unrealized appreciation | | | $131,527,921 | |
Gross unrealized depreciation | | | (5,569,610 | ) |
| | | | |
Net unrealized appreciation (depreciation) | | | $125,958,311 | |
| |
Cost for federal income tax purposes | | | $312,600,584 | |
Fair Valuation Measurements
The following table is a summary of the inputs used, as of October 31, 2013, in valuing Mid Cap Growth Fund’s assets carried at fair value.
| | | | | | | | | | | | | | | | |
Investments in Securities | | Total | | | Level 1 | | | Level 2 | | | Level 3 | |
| | | | |
Common Stock | | | | | | | | | | | | | | | | |
Consumer Discretionary | | | 70,022,305 | | | | 70,022,305 | | | | – | | | | – | |
Consumer Staples | | | 21,797,772 | | | | 21,797,772 | | | | – | | | | – | |
Energy | | | 31,540,185 | | | | 31,540,185 | | | | – | | | | – | |
Financials | | | 36,840,127 | | | | 36,840,127 | | | | – | | | | – | |
Health Care | | | 47,459,011 | | | | 47,459,011 | | | | – | | | | – | |
Industrials | | | 87,636,944 | | | | 87,636,944 | | | | – | | | | – | |
Information Technology | | | 81,432,668 | | | | 81,432,668 | | | | – | | | | – | |
Materials | | | 17,640,331 | | | | 17,640,331 | | | | – | | | | – | |
Telecommunications Services | | | 6,364,478 | | | | 6,364,478 | | | | – | | | | – | |
Collateral Held for Securities Loaned | | | 19,138,554 | | | | 19,138,554 | | | | – | | | | – | |
Short-Term Investments | | | 18,686,520 | | | | 18,686,520 | | | | – | | | | – | |
| |
Total | | | $438,558,895 | | | | $438,558,895 | | | | $– | | | | $– | |
| |
There were no significant transfers between Levels during the period ended October 31, 2013. Transfers between Levels are identified as of the end of the period.
The accompanying Notes to Financial Statements are an integral part of this schedule.
167
Mid Cap Growth Fund
Schedule of Investments as of October 31, 2013
Investment in Affiliates
Affiliated issuers, as defined under the Investment Company Act of 1940, include those in which the Fund’s holdings of an issuer represent 5% or more of the outstanding voting securities of an issuer, or any affiliated mutual fund.
A summary of transactions for the fiscal year to date, in Mid Cap Growth Fund, is as follows:
| | | | | | | | | | | | | | | | | | | | | | | | |
Fund | | Value
October 31, 2012 | | | Gross
Purchases | | | Gross
Sales | | | Shares Held at
October 31, 2013 | | | Value
October 31, 2013 | | | Income Earned
November 1, 2012 -
October 31, 2013 | |
Cash Management Trust-Collateral Investment | | | $12,303,975 | | | | $141,248,201 | | | | $134,413,622 | | | | 19,138,554 | | | | $19,138,554 | | | | $18,324 | |
Cash Management Trust- Short Term Investment | | | 19,928,389 | | | | 94,626,096 | | | | 95,867,965 | | | | 18,686,520 | | | | 18,686,520 | | | | 15,309 | |
Total Value and Income Earned | | | 32,232,364 | | | | | | | | | | | | | | | | 37,825,074 | | | | 33,633 | |
The accompanying Notes to Financial Statements are an integral part of this schedule.
168
Partner Mid Cap Value Fund
Schedule of Investments as of October 31, 2013
| | | | | | | | |
| Shares | | | Common Stock (98.8%) | | Value | |
| Consumer Discretionary (11.1%) | |
| | 29,029 | | | Delphi Automotive plc | | | $1,660,459 | |
| | 26,505 | | | Lennar Corporation | | | 942,253 | |
| | 91,646 | | | Liberty Interactive Corporationa | | | 2,470,776 | |
| | 12,028 | | | Liberty Media Corporationa | | | 1,839,201 | |
| | 20,032 | | | Macy’s, Inc. | | | 923,676 | |
| | 85,956 | | | MGM Resorts Internationala | | | 1,636,602 | |
| | 11,336 | | | PVH Corporation | | | 1,412,126 | |
| | 10,573 | | | Scripps Networks Interactive, Inc. | | | 851,127 | |
| | 30,850 | | | Starwood Hotels & Resorts Worldwide, Inc. | | | 2,271,177 | |
| | 43,963 | | | Toll Brothers, Inc.a | | | 1,445,503 | |
| | 13,413 | | | TRW Automotive Holdings Corporationa | | | 1,007,450 | |
| | 9,881 | | | Whirlpool Corporation | | | 1,442,725 | |
| | | | | |
| | | | Total | | | 17,903,075 | |
| | | | | |
|
| Consumer Staples (3.5%) | |
| | 20,154 | | | Constellation Brands, Inc.a | | | 1,316,056 | |
| | 20,648 | | | Ingredion, Inc. | | | 1,357,812 | |
| | 19,970 | | | Monster Beverage Corporationa | | | 1,142,883 | |
| | 22,574 | | | Safeway, Inc. | | | 787,833 | |
| | 39,072 | | | Tyson Foods, Inc. | | | 1,081,122 | |
| | | | | |
| | | | Total | | | 5,685,706 | |
| | | | | |
|
| Energy (9.2%) | |
| | 38,713 | | | Cameron International Corporationa | | | 2,123,795 | |
| | 108,087 | | | Chesapeake Energy Corporation | | | 3,022,112 | |
| | 24,982 | | | Cimarex Energy Company | | | 2,631,854 | |
| | 7,361 | | | Concho Resources, Inc.a | | | 814,200 | |
| | 12,084 | | | Oil States International, Inc.a | | | 1,312,685 | |
| | 9,221 | | | Pioneer Natural Resources Company | | | 1,888,276 | |
| | 19,180 | | | Range Resources Corporation | | | 1,452,118 | |
| | 32,704 | | | Tesoro Corporation | | | 1,598,899 | |
| | | | | |
| | | | Total | | | 14,843,939 | |
| | | | | |
|
| Financials (31.6%) | |
| | 16,889 | | | Alexandria Real Estate Equities, Inc. | | | 1,110,958 | |
| | 18,938 | | | AvalonBay Communities, Inc. | | | 2,368,197 | |
| | 28,539 | | | Camden Property Trust | | | 1,832,204 | |
| | 31,649 | | | CIT Group, Inc.a | | | 1,524,216 | |
| | 89,669 | | | DDR Corporation | | | 1,519,890 | |
| | 13,801 | | | Digital Realty Trust, Inc. | | | 657,756 | |
| | 14,054 | | | Everest Re Group, Ltd. | | | 2,160,662 | |
| | 27,286 | | | First Republic Bank | | | 1,393,496 | |
| | 112,910 | | | Genworth Financial, Inc.a | | | 1,640,582 | |
| | 44,399 | | | Hartford Financial Services Group, Inc. | | | 1,496,246 | |
| | 192,961 | | | Huntington Bancshares, Inc. | | | 1,698,057 | |
| | 62,106 | | | ING U.S., Inc. | | | 1,926,528 | |
| | 82,748 | | | Invesco, Ltd. | | | 2,792,745 | |
| | 24,168 | | | iShares Russell Midcap Value Index Fund | | | 1,539,502 | |
| | 45,154 | | | Lincoln National Corporation | | | 2,050,443 | |
| | 25,792 | | | M&T Bank Corporation | | | 2,902,374 | |
| | 107,233 | | | MFA Financial, Inc. | | | 794,597 | |
| | 55,790 | | | NASDAQ OMX Group, Inc. | | | 1,976,640 | |
| | 62,060 | | | Principal Financial Group, Inc. | | | 2,945,368 | |
| | 37,481 | | | Raymond James Financial, Inc. | | | 1,711,008 | |
| | 9,520 | | | Signature Banka | | | 969,326 | |
| | 76,285 | | | SLM Corporation | | | 1,935,350 | |
| | 63,274 | | | Starwood Property Trust, Inc. | | | 1,625,509 | |
| | 32,078 | | | Tanger Factory Outlet Centers, Inc. | | | 1,117,918 | |
| | 23,908 | | | Taubman Centers, Inc. | | | 1,572,907 | |
| | 101,037 | | | Two Harbors Investment Corporation | | | 942,675 | |
| | 20,650 | | | Validus Holdings, Ltd. | | | 815,262 | |
| | 27,061 | | | W.R. Berkley Corporation | | | 1,188,248 | |
| | 35,155 | | | Willis Group Holdings plc | | | 1,584,436 | |
| | 64,153 | | | XL Group plc | | | 1,961,157 | |
| | 38,005 | | | Zions Bancorporation | | | 1,078,202 | |
| | | | | |
| | | | Total | | | 50,832,459 | |
| | | | | |
|
| Health Care (8.9%) | |
| | 37,623 | | | Aetna, Inc. | | | 2,358,962 | |
| | 16,278 | | | C.R. Bard, Inc. | | | 2,217,389 | |
| | 52,647 | | | Cardinal Health, Inc. | | | 3,088,273 | |
| | 46,556 | | | CareFusion Corporationa | | | 1,804,976 | |
| | 25,539 | | | Humana, Inc. | | | 2,353,419 | |
| | 25,432 | | | Mylan, Inc.a | | | 963,110 | |
| | 32,872 | | | Tenet Healthcare Corporationa | | | 1,551,230 | |
| | | | | |
| | | | Total | | | 14,337,359 | |
| | | | | |
|
| Industrials (9.4%) | |
| | 23,753 | | | Carlisle Companies, Inc. | | | 1,726,368 | |
| | 11,393 | | | KBR, Inc. | | | 393,514 | |
| | 5,548 | | | Owens Corning, Inc.a | | | 199,340 | |
| | 4,535 | | | Parker Hannifin Corporation | | | 529,325 | |
| | 11,077 | | | Regal-Beloit Corporation | | | 812,276 | |
| | 20,598 | | | Stanley Black & Decker, Inc. | | | 1,629,096 | |
| | 43,896 | | | Terex Corporationa | | | 1,534,165 | |
| | 77,148 | | | Textron, Inc. | | | 2,221,091 | |
| | 29,019 | | | Timken Company | | | 1,532,493 | |
| | 23,064 | | | Triumph Group, Inc. | | | 1,652,536 | |
| | 44,398 | | | Tyco International, Ltd. | | | 1,622,747 | |
| | 28,475 | | | Waste Connections, Inc. | | | 1,217,022 | |
| | | | | |
| | | | Total | | | 15,069,973 | |
| | | | | |
|
| Information Technology (12.7%) | |
| | 47,346 | | | Agilent Technologies, Inc. | | | 2,403,283 | |
| | 67,250 | | | Altera Corporation | | | 2,259,600 | |
| | 71,493 | | | Applied Materials, Inc. | | | 1,276,150 | |
| | 20,836 | | | Citrix Systems, Inc.a | | | 1,183,068 | |
| | 17,202 | | | Computer Sciences Corporation | | | 847,371 | |
| | 32,392 | | | Fidelity National Information Services, Inc. | | | 1,579,110 | |
| | 13,353 | | | Global Payments, Inc. | | | 794,236 | |
| | 102,071 | | | Juniper Networks, Inc.a | | | 1,902,603 | |
| | 28,869 | | | Lam Research Corporationa | | | 1,565,566 | |
| | 36,461 | | | Maxim Integrated Products, Inc. | | | 1,082,892 | |
| | 30,487 | | | NetApp, Inc. | | | 1,183,201 | |
| | 60,640 | | | NVIDIA Corporation | | | 920,515 | |
| | 117,383 | | | Polycom, Inc.a | | | 1,220,783 | |
| | 41,837 | | | PTC, Inc.a | | | 1,159,722 | |
| | 21,677 | | | Teradata Corporationa | | | 955,305 | |
| | | | | |
| | | | Total | | | 20,333,405 | |
| | | | | |
|
| Materials (5.1%) | |
| | 10,556 | | | Ashland, Inc. | | | 976,958 | |
| | 13,409 | | | Carpenter Technology Corporation | | | 795,556 | |
| | 20,929 | | | Celanese Corporation | | | 1,172,233 | |
| | 18,006 | | | International Paper Company | | | 803,248 | |
| | 20,934 | | | Packaging Corporation of America | | | 1,303,769 | |
The accompanying Notes to Financial Statements are an integral part of this schedule.
169
Partner Mid Cap Value Fund
Schedule of Investments as of October 31, 2013
| | | | | | | | |
| Shares | | | Common Stock (98.8%) | | Value | |
| Materials (5.1%) - continued | |
| | 18,411 | | | Reliance Steel & Aluminum Company | | | $1,349,342 | |
| | 9,837 | | | Sealed Air Corporation | | | 296,881 | |
| | 20,306 | | | Valspar Corporation | | | 1,420,811 | |
| | | | | |
| | | | Total | | | 8,118,798 | |
| | | | | |
| |
| Utilities (7.3%) | | | | |
| | 68,315 | | | Calpine Corporationa | | | 1,377,914 | |
| | 44,418 | | | Edison International, Inc. | | | 2,177,814 | |
| | 45,316 | | | FirstEnergy Corporation | | | 1,716,117 | |
| | 20,294 | | | NiSource, Inc. | | | 639,667 | |
| | 24,353 | | | SCANA Corporation | | | 1,135,580 | |
| | 26,126 | | | Sempra Energy | | | 2,381,124 | |
| | 76,551 | | | Xcel Energy, Inc. | | | 2,209,262 | |
| | | | | |
| | | | Total | | | 11,637,478 | |
| | | | | |
| | | | | | | | |
| | | | | |
| | | | Total Common Stock (cost $133,701,610) | | | 158,762,192 | |
| | | | | |
| | |
Shares or
Principal
Amount | | | Short-Term Investments (1.6%) | | Value | |
| | | | Thrivent Cash Management Trust | | | | |
| | 2,568,093 | | | 0.070% | | | 2,568,093 | |
| | | | | |
| | | | Total Short-Term Investments (at amortized cost) | | | 2,568,093 | |
| | | | | |
| | | | Total Investments (cost $136,269,703) 100.4% | | $ | 161,330,285 | |
| | | | | |
| | | | Other Assets and Liabilities, Net (0.4%) | | | (634,957 | ) |
| | | | | |
| | | | Total Net Assets 100.0% | | $ | 160,695,328 | |
| | | | | |
a | Non-income producing security. |
Unrealized Appreciation (Depreciation)
Gross unrealized appreciation and depreciation of investments, based on cost for federal income tax purposes, were as follows:
| | | | |
Gross unrealized appreciation | | | $26,467,146 | |
Gross unrealized depreciation | | | (1,869,556 | ) |
| | | | |
Net unrealized appreciation (depreciation) | | | $24,597,590 | |
| |
Cost for federal income tax purposes | | | $136,732,695 | |
The accompanying Notes to Financial Statements are an integral part of this schedule.
170
Partner Mid Cap Value Fund
Schedule of Investments as of October 31, 2013
Fair Valuation Measurements
The following table is a summary of the inputs used, as of October 31, 2013, in valuing Partner Mid Cap Value Fund’s assets carried at fair value.
| | | | | | | | | | | | | | | | |
Investments in Securities | | Total | | | Level 1 | | | Level 2 | | | Level 3 | |
| | | | |
Common Stock | | | | | | | | | | | | | | | | |
Consumer Discretionary | | | 17,903,075 | | | | 17,903,075 | | | | – | | | | – | |
Consumer Staples | | | 5,685,706 | | | | 5,685,706 | | | | – | | | | – | |
Energy | | | 14,843,939 | | | | 14,843,939 | | | | – | | | | – | |
Financials | | | 50,832,459 | | | | 50,832,459 | | | | – | | | | – | |
Health Care | | | 14,337,359 | | | | 14,337,359 | | | | – | | | | – | |
Industrials | | | 15,069,973 | | | | 15,069,973 | | | | – | | | | – | |
Information Technology | | | 20,333,405 | | | | 20,333,405 | | | | – | | | | – | |
Materials | | | 8,118,798 | | | | 8,118,798 | | | | – | | | | – | |
Utilities | | | 11,637,478 | | | | 11,637,478 | | | | – | | | | – | |
Short-Term Investments | | | 2,568,093 | | | | 2,568,093 | | | | – | | | | – | |
| |
Total | | | $161,330,285 | | | | $161,330,285 | | | | $– | | | | $– | |
| |
There were no significant transfers between Levels during the period ended October 31, 2013. Transfers between Levels are identified as of the end of the period.
Investment in Affiliates
Affiliated issuers, as defined under the Investment Company Act of 1940, include those in which the Fund’s holdings of an issuer represent 5% or more of the outstanding voting securities of an issuer, or any affiliated mutual fund.
A summary of transactions for the fiscal year to date, in Partner Mid Cap Value Fund, is as follows:
| | | | | | | | | | | | | | | | | | | | | | | | |
Fund | | Value
October 31, 2012 | | | Gross
Purchases | | | Gross
Sales | | | Shares Held at
October 31, 2013 | | | Value
October 31, 2013 | | | Income Earned
November 1, 2012 -
October 31, 2013 | |
Cash Management Trust-Collateral Investment | | | $4,042,325 | | | | $30,501,692 | | | | $34,544,017 | | | | – | | | | $– | | | | $7,233 | |
Cash Management Trust-Short Term Investment | | | 2,762,894 | | | | 48,470,409 | | | | 48,665,210 | | | | 2,568,093 | | | | 2,568,093 | | | | 2,275 | |
Total Value and Income Earned | | | 6,805,219 | | | | | | | | | | | | | | | | 2,568,093 | | | | 9,508 | |
The accompanying Notes to Financial Statements are an integral part of this schedule.
171
Mid Cap Stock Fund
Schedule of Investments as of October 31, 2013
| | | | | | | | |
| Shares | | | Common Stock (96.1%) | | Value | |
| Consumer Discretionary (12.3%) | |
| | 101,900 | | | Charter Communications, Inc.a | | | $13,679,056 | |
| | 238,300 | | | Cheesecake Factory, Inc. | | | 11,259,675 | |
| | 311,500 | | | DISH Network Corporation | | | 15,014,300 | |
| | 150,500 | | | Michael Kors Holdings, Ltd.a | | | 11,580,975 | |
| | 210,700 | | | Omnicom Group, Inc. | | | 14,350,777 | |
| | 195,200 | | | Penn National Gaming, Inc.a | | | 11,421,152 | |
| | 173,900 | | | Scripps Networks Interactive, Inc. | | | 13,998,950 | |
| | 236,200 | | | Tempur-Pedic International, Inc.a,b | | | 9,058,270 | |
| | 368,200 | | | Toll Brothers, Inc.a | | | 12,106,416 | |
| | | | | |
| | | | Total | | | 112,469,571 | |
| | | | | |
| |
| Consumer Staples (2.1%) | | | | |
| | 139,600 | | | Ingredion, Inc. | | | 9,180,096 | |
| | 482,000 | | | WhiteWave Foods Companya,b | | | 9,644,820 | |
| | | | | |
| | | | Total | | | 18,824,916 | |
| | | | | |
| |
| Energy (6.2%) | | | | |
| | 52,000 | | | Atwood Oceanics, Inc.a | | | 2,762,760 | |
| | 41,291 | | | Cabot Oil & Gas Corporation | | | 1,458,398 | |
| | 45,100 | | | Cameron International Corporationa | | | 2,474,186 | |
| | 19,600 | | | Cimarex Energy Company | | | 2,064,860 | |
| | 23,850 | | | Concho Resources, Inc.a | | | 2,638,049 | |
| | 147,000 | | | Denbury Resources, Inc.a | | | 2,791,530 | |
| | 49,050 | | | Energy XXI, Ltd. | | | 1,425,393 | |
| | 35,100 | | | Ensco plc | | | 2,023,515 | |
| | 21,150 | | | EQT Corporation | | | 1,810,651 | |
| | 72,700 | | | Helix Energy Solutions Group, Inc.a | | | 1,720,082 | |
| | 36,000 | | | Helmerich & Payne, Inc.b | | | 2,791,800 | |
| | 57,050 | | | HollyFrontier Corporation | | | 2,627,723 | |
| | 30,900 | | | National Oilwell Varco, Inc. | | | 2,508,462 | |
| | 65,600 | | | Newfield Exploration Companya | | | 1,997,520 | |
| | 58,900 | | | Noble Corporation | | | 2,220,530 | |
| | 40,300 | | | Noble Energy, Inc. | | | 3,019,679 | |
| | 31,000 | | | Oceaneering International, Inc. | | | 2,662,280 | |
| | 29,600 | | | Oil States International, Inc.a | | | 3,215,448 | |
| | 17,000 | | | Pioneer Natural Resources Company | | | 3,481,260 | |
| | 25,850 | | | Range Resources Corporation | | | 1,957,104 | |
| | 55,300 | | | Rowan Companies plca | | | 1,995,224 | |
| | 26,900 | | | SM Energy Company | | | 2,383,609 | |
| | 106,200 | | | Superior Energy Services, Inc.a | | | 2,849,346 | |
| | 34,300 | | | Whiting Petroleum Corporationa | | | 2,294,327 | |
| | | | | |
| | | | Total | | | 57,173,736 | |
| | | | | |
| |
| Financials (21.7%) | | | | |
| | 250,400 | | | Axis Capital Holdings, Ltd. | | | 11,873,968 | |
| | 138,100 | | | Camden Property Trust | | | 8,866,020 | |
| | 290,300 | | | First Republic Bank | | | 14,825,621 | |
| | 309,426 | | | HCC Insurance Holdings, Inc. | | | 14,125,297 | |
| | 694,509 | | | Host Hotels & Resorts, Inc. | | | 12,883,142 | |
| | 2,037,500 | | | Huntington Bancshares, Inc. | | | 17,930,000 | |
| | 346,882 | | | Lazard, Ltd. | | | 13,406,989 | |
| | 114,000 | | | M&T Bank Corporationb | | | 12,828,420 | |
| | 156,300 | | | Macerich Company | | | 9,254,523 | |
| | 459,900 | | | NASDAQ OMX Group, Inc. | | | 16,294,257 | |
| | 251,990 | | | Northern Trust Corporation | | | 14,217,276 | |
| | 536,100 | | | Piedmont Office Realty Trust, Inc. | | | 9,907,128 | |
| | 273,300 | | | Protective Life Corporation | | | 12,593,664 | |
| | 300,112 | | | W.R. Berkley Corporation | | | 13,177,918 | |
| | 591,002 | | | Zions Bancorporation | | | 16,766,726 | |
| | | | | |
| | | | Total | | | 198,950,949 | |
| | | | | |
| |
| Health Care (12.1%) | | | | |
| | 240,500 | | | Acorda Therapeutics, Inc.a | | | 7,361,705 | |
| | 954,900 | | | Allscripts Healthcare Solutions, Inc.a | | | 13,206,267 | |
| | 104,314 | | | C.R. Bard, Inc. | | | 14,209,653 | |
| | 200,800 | | | Illumina, Inc.a,b | | | 18,776,808 | |
| | 225,400 | | | ResMed, Inc.b | | | 11,662,196 | |
| | 394,700 | | | Thoratec Corporationa | | | 17,047,093 | |
| | 10,750 | | | Veeva Systems, Inc.a,b | | | 418,282 | |
| | 112,700 | | | Waters Corporationa | | | 11,373,684 | |
| | 193,063 | | | Zimmer Holdings, Inc. | | | 16,887,221 | |
| | | | | |
| | | | Total | | | 110,942,909 | |
| | | | | |
| |
| Industrials (14.5%) | | | | |
| | 206,241 | | | ADT Corporationb | | | 8,944,672 | |
| | 177,200 | | | AGCO Corporation | | | 10,344,936 | |
| | 370,717 | | | CSX Corporation | | | 9,660,885 | |
| | 205,800 | | | Flowserve Corporation | | | 14,296,926 | |
| | 460,700 | | | Foster Wheeler AGa | | | 12,434,293 | |
| | 511,230 | | | Manitowoc Company, Inc. | | | 9,948,536 | |
| | 170,098 | | | Manpower, Inc. | | | 13,284,654 | |
| | 455,344 | | | Oshkosh Corporationa | | | 21,669,821 | |
| | 136,818 | | | Parker Hannifin Corporation | | | 15,969,397 | |
| | 931,200 | | | Southwest Airlines Company | | | 16,035,264 | |
| | | | | |
| | | | Total | | | 132,589,384 | |
| | | | | |
| |
| Information Technology (20.8%) | | | | |
| | 166,100 | | | Alliance Data Systems Corporationa,b | | | 39,375,666 | |
| | 1,171,690 | | | Applied Materials, Inc. | | | 20,914,666 | |
| | 310,700 | | | Autodesk, Inc.a | | | 12,400,037 | |
| | 484,388 | | | CoreLogic, Inc.a | | | 16,115,589 | |
| | 214,153 | | | eBay, Inc.a | | | 11,288,005 | |
| | 499,050 | | | Juniper Networks, Inc.a | | | 9,302,292 | |
| | 222,600 | | | NetApp, Inc. | | | 8,639,106 | |
| | 1,471,562 | | | NVIDIA Corporation | | | 22,338,311 | |
| | 356,900 | | | SunPower Corporationa,b | | | 10,774,811 | |
| | 971,451 | | | Teradyne, Inc.a | | | 16,990,678 | |
| | 1,140,292 | | | TriQuint Semiconductor, Inc.a | | | 9,042,516 | |
| | 1,069 | | | Workday, Inc.a | | | 80,036 | |
| | 283,382 | | | Xilinx, Inc. | | | 12,871,210 | |
| | | | | |
| | | | Total | | | 190,132,923 | |
| | | | | |
| |
| Materials (3.9%) | | | | |
| | 362,600 | | | Owens-Illinois, Inc.a | | | 11,527,054 | |
| | 206,464 | | | Silgan Holdings, Inc. | | | 9,305,333 | |
| | 842,294 | | | Steel Dynamics, Inc. | | | 15,136,023 | |
| | | | | |
| | | | Total | | | 35,968,410 | |
| | | | | |
| |
| Utilities (2.5%) | | | | |
| | 429,600 | | | CMS Energy Corporation | | | 11,796,816 | |
| | 326,600 | | | Public Service Enterprise Group, Inc. | | | 10,941,100 | |
| | | | | |
| | | | Total | | | 22,737,916 | |
| | | | | |
| | | | | | | | |
| | | | | |
| | | | Total Common Stock (cost $632,258,124) | | | 879,790,714 | |
| | | | | |
| | |
| Shares | | | Collateral Held for Securities Loaned (10.5%) | | Value | |
| | 96,425,470 | | | Thrivent Cash Management Trust | | | 96,425,470 | |
| | | | | |
| | | | Total Collateral Held for Securities Loaned (cost $96,425,470) | | | 96,425,470 | |
| | | | | |
The accompanying Notes to Financial Statements are an integral part of this schedule.
172
Mid Cap Stock Fund
Schedule of Investments as of October 31, 2013
| | | | | | | | |
Shares or
Principal
Amount | | | Short-Term Investments (4.1%) | | Value | |
| | | | Thrivent Cash Management Trust | | | | |
| | 37,146,950 | | | 0.070% | | | $37,146,950 | |
| | | | | |
| | | | Total Short-Term Investments (at amortized cost) | | | 37,146,950 | |
| | | | | |
| | | | Total Investments (cost $765,830,544) 110.7% | | | $1,013,363,134 | |
| | | | | |
| | | | Other Assets and Liabilities, Net (10.7%) | | | (97,973,417 | ) |
| | | | | |
| | | | Total Net Assets 100.0% | | | $915,389,717 | |
| | | | | |
a | Non-income producing security. |
b | All or a portion of the security is on loan. |
Unrealized Appreciation (Depreciation)
Gross unrealized appreciation and depreciation of investments, based on cost for federal income tax purposes, were as follows:
| | | | |
Gross unrealized appreciation | | | $251,048,222 | |
Gross unrealized depreciation | | | (3,918,796 | ) |
| | | | |
Net unrealized appreciation (depreciation) | | | $247,129,426 | |
| |
Cost for federal income tax purposes | | | $766,233,708 | |
Fair Valuation Measurements
The following table is a summary of the inputs used, as of October 31, 2013, in valuing Mid Cap Stock Fund’s assets carried at fair value.
| | | | | | | | | | | | | | | | |
Investments in Securities | | Total | | | Level 1 | | | Level 2 | | | Level 3 | |
| | | | |
Common Stock | | | | | | | | | | | | | | | | |
Consumer Discretionary | | | 112,469,571 | | | | 112,469,571 | | | | – | | | | – | |
Consumer Staples | | | 18,824,916 | | | | 18,824,916 | | | | – | | | | – | |
Energy | | | 57,173,736 | | | | 57,173,736 | | | | – | | | | – | |
Financials | | | 198,950,949 | | | | 198,950,949 | | | | – | | | | – | |
Health Care | | | 110,942,909 | | | | 110,942,909 | | | | – | | | | – | |
Industrials | | | 132,589,384 | | | | 132,589,384 | | | | – | | | | – | |
Information Technology | | | 190,132,923 | | | | 190,132,923 | | | | – | | | | – | |
Materials | | | 35,968,410 | | | | 35,968,410 | | | | – | | | | – | |
Utilities | | | 22,737,916 | | | | 22,737,916 | | | | – | | | | – | |
Collateral Held for Securities Loaned | | | 96,425,470 | | | | 96,425,470 | | | | – | | | | – | |
Short-Term Investments | | | 37,146,950 | | | | 37,146,950 | | | | – | | | | – | |
| |
Total | | | $1,013,363,134 | | | | $1,013,363,134 | | | | $– | | | | $– | |
| |
There were no significant transfers between Levels during the period ended October 31, 2013. Transfers between Levels are identified as of the end of the period.
The accompanying Notes to Financial Statements are an integral part of this schedule.
173
Mid Cap Stock Fund
Schedule of Investments as of October 31, 2013
Investment in Affiliates
Affiliated issuers, as defined under the Investment Company Act of 1940, include those in which the Fund’s holdings of an issuer represent 5% or more of the outstanding voting securities of an issuer, or any affiliated mutual fund.
A summary of transactions for the fiscal year to date, in Mid Cap Stock Fund, is as follows:
| | | | | | | | | | | | | | | | | | | | | | | | |
Fund | | Value
October 31, 2012 | | | Gross
Purchases | | | Gross
Sales | | | Shares Held at
October 31, 2013 | | | Value
October 31, 2013 | | | Income Earned
November 1, 2012 -
October 31, 2013 | |
Cash Management Trust-Collateral Investment | | | $66,998,025 | | | | $520,693,095 | | | | $491,265,650 | | | | 96,425,470 | | | | $96,425,470 | | | | $180,927 | |
Cash Management Trust-Short Term Investment | | | 8,537,682 | | | | 128,973,186 | | | | 100,363,918 | | | | 37,146,950 | | | | 37,146,950 | | | | 30,073 | |
Total Value and Income Earned | | | 75,535,707 | | | | | | | | | | | | | | | | 133,572,420 | | | | 211,000 | |
The accompanying Notes to Financial Statements are an integral part of this schedule.
174
Partner Worldwide Allocation Fund
Schedule of Investments as of October 31, 2013
| | | | | | | | |
| Shares | | | Common Stock (89.1%) | | Value | |
| Australia (3.8%) | |
| | 97,202 | | | Abacus Property Group | | | $214,254 | |
| | 234,388 | | | Amcor, Ltd. | | | 2,401,169 | |
| | 795,662 | | | Arrium, Ltd. | | | 1,039,591 | |
| | 46,527 | | | Australand Holdings, Ltd. | | | 163,993 | |
| | 72,179 | | | BC Iron, Ltd. | | | 335,876 | |
| | 556,110 | | | Beach Energy, Ltd. | | | 751,139 | |
| | 134,333 | | | BHP Billiton, Ltd. | | | 4,749,141 | |
| | 43,402 | | | BlueScope Steel, Ltd.a | | | 204,723 | |
| | 213,064 | | | Breville Group, Ltd. | | | 1,621,093 | |
| | 13,729 | | | BT Investment Management, Ltd. | | | 64,848 | |
| | 39,469 | | | Carsales.com, Ltd. | | | 391,942 | |
| | 185,387 | | | Challenger, Ltd. | | | 1,051,714 | |
| | 40,125 | | | CSL, Ltd. | | | 2,637,620 | |
| | 312,598 | | | DuluxGroup, Ltd. | | | 1,522,269 | |
| | 42,246 | | | Flight Centre, Ltd. | | | 2,074,002 | |
| | 599,241 | | | Fortescue Metals Group, Ltd.b | | | 2,938,923 | |
| | 199,073 | | | Goodman Fielder, Ltd. | | | 143,079 | |
| | 146,925 | | | iiNet, Ltd. | | | 903,835 | |
| | 28,262 | | | JB Hi-Fi, Ltd. | | | 582,422 | |
| | 21,017 | | | M2 Telecommunications Group, Ltd. | | | 125,920 | |
| | 535,691 | | | Mount Gibson Iron, Ltd. | | | 449,324 | |
| | 50,308 | | | Ramsay Health Care, Ltd. | | | 1,846,803 | |
| | 226,268 | | | Seven West Media, Ltd. | | | 539,110 | |
| | 18,832 | | | Sims Metal Management, Ltd.a | | | 178,382 | |
| | 200,954 | | | Slater & Gordon, Ltd. | | | 735,038 | |
| | 60,403 | | | Super Retial Group, Ltd. | | | 765,126 | |
| | 19,531 | | | The Reject Shop Limited | | | 329,549 | |
| | 102,086 | | | TPG Telecom, Ltd. | | | 450,058 | |
| | 109,858 | | | Woolworths, Ltd. | | | 3,622,736 | |
| | | | | |
| | | | Total | | | 32,833,679 | |
| | | | | |
|
| Austria (0.3%) | |
| | 7,901 | | | CAT Oil AG | | | 192,796 | |
| | 25,073 | | | OMV AG | | | 1,196,055 | |
| | 1,018 | | | Osterreichische Post Aktiengesellschaft | | | 47,737 | |
| | 29,619 | | | Voestalpine AG | | | 1,397,298 | |
| | 3,197 | | | Zumtobel AGc | | | 57,051 | |
| | | | | |
| | | | Total | | | 2,890,937 | |
| | | | | |
|
| Belgium (0.6%) | |
| | 18,662 | | | Anheuser-Busch InBev NV | | | 1,934,580 | |
| | 13,622 | | | Arseus NV | | | 420,697 | |
| | 34,403 | | | Colruyt SA | | | 1,919,265 | |
| | 217 | | | EVS Broadcast Equipment SA | | | 14,197 | |
| | 9,214 | | | Mobistar SA | | | 159,716 | |
| | 16,403 | | | NV Bekaert SA | | | 686,843 | |
| | | | | |
| | | | Total | | | 5,135,298 | |
| | | | | |
|
| Bermuda (0.1%) | |
| | 16,873 | | | Catlin Group, Ltd. | | | 138,613 | |
| | 139,647 | | | Golden Ocean Group, Ltd. | | | 210,434 | |
| | 19,105 | | | Hiscox, Ltd. | | | 202,827 | |
| | 177,000 | | | Pacific Basin Shipping, Ltd. | | | 126,663 | |
| | | | | |
| | | | Total | | | 678,537 | |
| | | | | |
|
| Brazil (2.0%) | |
| | 1,823 | | | Autometal SA | | | 14,322 | |
| | 233,399 | | | Banco Bradesco SA ADR | | | 3,365,613 | |
| | 15,100 | | | BR Properties SA | | | 128,069 | |
| | 10,700 | | | Cia Paranaense de Energia | | | 149,213 | |
| | 24,000 | | | Embraer SA | | | 175,163 | |
| | 18,100 | | | Even Construtora e Incorporadora SA | | | 67,465 | |
| | 37,000 | | | Lojas Renner SA | | | 1,114,856 | |
| | 42,707 | | | Multiplan Empreendimentos Imobiliarios SA | | | 1,002,572 | |
| | 165,050 | | | Petroleo Brasileiro SA ADR | | | 2,876,821 | |
| | 691,702 | | | Rossi Residencial SA | | | 852,200 | |
| | 96,500 | | | Souza Cruz SA | | | 1,043,744 | |
| | 106,412 | | | Ultrapar Participacoes SA | | | 2,835,817 | |
| | 40,282 | | | Vale SA ADR | | | 589,728 | |
| | 153,032 | | | Vale SA ADRb | | | 2,450,043 | |
| | | | | |
| | | | Total | | | 16,665,626 | |
| | | | | |
|
| Canada (3.3%) | |
| | 146,201 | | | Bellatrix Exploration, Ltd.a | | | 1,095,123 | |
| | 259,556 | | | Bombardier, Inc. | | | 1,179,970 | |
| | 68,194 | | | Brookfield Asset Management, Inc. | | | 2,699,898 | |
| | 29,224 | | | Canadian National Railway Company | | | 3,210,674 | |
| | 86,700 | | | Canadian Natural Resources, Ltd. | | | 2,751,549 | |
| | 90,554 | | | Canadian Oil Sands, Ltd. | | | 1,764,789 | |
| | 35,817 | | | CGI Group, Inc.a | | | 1,201,629 | |
| | 17,327 | | | Empire Company, Ltd. | | | 1,275,948 | |
| | 257,100 | | | Encana Corporation | | | 4,607,232 | |
| | 55,140 | | | Husky Energy, Inc. | | | 1,567,496 | |
| | 17,950 | | | Magna International, Inc. | | | 1,520,323 | |
| | 17,751 | | | Methanex Corporation | | | 1,029,495 | |
| | 35,130 | | | Pembina Pipeline Corporation | | | 1,152,637 | |
| | 14,798 | | | West Fraser Timber Company, Ltd. | | | 1,356,395 | |
| | 169,833 | | | Whitecap Resources, Inc. | | | 1,972,548 | |
| | | | | |
| | | | Total | | | 28,385,706 | |
| | | | | |
|
| Cayman Islands (0.4%) | |
| | 448,000 | | | MGM China Holdings Limited | | | 1,544,721 | |
| | 1,736,000 | | | NagaCorp, Ltd. | | | 1,603,102 | |
| | | | | |
| | | | Total | | | 3,147,823 | |
| | | | | |
|
| Chile (0.2%) | |
| | 126,119 | | | Aguas Andinas SA | | | 85,086 | |
| | 56,106 | | | Banco Santander Chile SA ADRb | | | 1,377,964 | |
| | | | | |
| | | | Total | | | 1,463,050 | |
| | | | | |
|
| China (0.5%) | |
| | 33,000 | | | Anhui Conch Cement Company, Ltd. | | | 115,162 | |
| | 261,000 | | | China Construction Bank Corporation | | | 203,065 | |
| | 94,000 | | | China Shenhua Energy Company, Ltd. | | | 285,936 | |
| | 262,000 | | | Dongfeng Motor Group Company, Ltd. | | | 370,421 | |
| | 325,000 | | | FIH Mobile, Ltd.a | | | 183,071 | |
| | 2,339,000 | | | PetroChina Company, Ltd. | | | 2,663,610 | |
| | 28,000 | | | Yanzhou Coal Mining Company, Ltd. | | | 28,973 | |
| | | | | |
| | | | Total | | | 3,850,238 | |
| | | | | |
|
| Colombia (<0.1%) | |
| | 5,264 | | | Bancolumbia SA | | | 295,468 | |
| | | | | |
| | | | Total | | | 295,468 | |
| | | | | |
|
| Cyprus (0.2%) | |
| | 184,736 | | | Prosafe SE | | | 1,583,362 | |
| | | | | |
| | | | Total | | | 1,583,362 | |
| | | | | |
The accompanying Notes to Financial Statements are an integral part of this schedule.
175
Partner Worldwide Allocation Fund
Schedule of Investments as of October 31, 2013
| | | | | | | | |
| Shares | | | Common Stock (89.1%) | | Value | |
| Czech Republic (0.1%) | |
| | 2,046 | | | Komercni Banka AS | | | $506,811 | |
| | | | | |
| | | | Total | | | 506,811 | |
| | | | | |
|
| Denmark (1.5%) | |
| | 16,415 | | | D/S Norden AS | | | 721,996 | |
| | 230,500 | | | Danske Bank ASa | | | 5,385,816 | |
| | 1,241 | | | DFDS AS | | | 90,252 | |
| | 5,489 | | | Genmab ASa | | | 238,482 | |
| | 57,153 | | | GN Store Nord AS | | | 1,303,821 | |
| | 19,688 | | | Jyske Bank ASa | | | 1,113,155 | |
| | 51,243 | | | Matas ASa | | | 1,291,978 | |
| | 353 | | | Rockwool International AS | | | 55,523 | |
| | 7,426 | | | Royal Unibrew AS | | | 953,048 | |
| | 11,587 | | | SimCorp AS | | | 379,338 | |
| | 31,424 | | | Sydbank ASa | | | 929,198 | |
| | 4,488 | | | Topdanmark ASa | | | 122,154 | |
| | | | | |
| | | | Total | | | 12,584,761 | |
| | | | | |
|
| Finland (0.3%) | |
| | 104,924 | | | Kemira Oyj | | | 1,684,676 | |
| | 54,388 | | | Ramirent Oyj | | | 653,543 | |
| | 2,380 | | | Uponor Oyj | | | 47,010 | |
| | 32,493 | | | YIT Oyj | | | 421,474 | |
| | | | | |
| | | | Total | | | 2,806,703 | |
| | | | | |
|
| France (6.3%) | |
| | 364,729 | | | AXA SA | | | 9,087,418 | |
| | 96,275 | | | Cap Gemini SA | | | 6,313,548 | |
| | 19,125 | | | Christian Dior SA | | | 3,628,728 | |
| | 125,898 | | | Compagnie de Saint-Gobain | | | 6,608,422 | |
| | 13,324 | | | Eiffage SA | | | 789,627 | |
| | 213,500 | | | GDF Suez | | | 5,291,358 | |
| | 27,934 | | | Ingenicob | | | 2,098,370 | |
| | 72,316 | | | Peugeot SAa | | | 951,320 | |
| | 23,173 | | | Publicis Groupe SA | | | 1,927,062 | |
| | 44,928 | | | Safran SA | | | 2,864,531 | |
| | 49,623 | | | Societe Television Francaise 1 | | | 956,136 | |
| | 40,149 | | | Technicolor SAa | | | 216,642 | |
| | 5,265 | | | Teleperformance | | | 278,704 | |
| | 31,903 | | | Thales SA | | | 1,953,934 | |
| | 86,750 | | | Total SA | | | 5,322,390 | |
| | 9,320 | | | Valeo SA | | | 922,024 | |
| | 40,553 | | | Vinci SA | | | 2,594,843 | |
| | 91,490 | | | Vivendi SA | | | 2,316,512 | |
| | | | | |
| | | | Total | | | 54,121,569 | |
| | | | | |
|
| Germany (5.5%) | |
| | 14,415 | | | Allianz SE | | | 2,420,324 | |
| | 41,032 | | | Bayer AG | | | 5,090,133 | |
| | 17,392 | | | Carl Zeiss Meditec AG | | | 549,376 | |
| | 6,515 | | | Comdirect Bank AG | | | 74,046 | |
| | 8,191 | | | Continental AG | | | 1,497,869 | |
| | 1,363 | | | CTS Eventim AG | | | 66,450 | |
| | 112,653 | | | Daimler AG | | | 9,223,485 | |
| | 73,850 | | | Deutsche Boerse AG | | | 5,555,540 | |
| | 39,645 | | | Deutsche Post AG | | | 1,338,872 | |
| | 13,978 | | | Drillisch Aktiengesellschaft | | | 360,224 | |
| | 34,005 | | | Duerr AG | | | 2,976,085 | |
| | 7,362 | | | Gerresheimer AG | | | 486,990 | |
| | 15,381 | | | KUKA AG | | | 700,020 | |
| | 5,385 | | | Leoni AG | | | 364,479 | |
| | 10,550 | | | Morphosys AGa | | | 816,073 | |
| | 13,594 | | | Nordex SEa | | | 238,258 | |
| | 34,201 | | | Norma Group SE | | | 1,710,407 | |
| | 27,430 | | | ProSiebenSat.1 Media AG | | | 1,304,083 | |
| | 72,757 | | | QSC AG | | | 452,556 | |
| | 14,049 | | | SAF-Holland SAa | | | 199,720 | |
| | 4,224 | | | SAP AG ADR | | | 330,539 | |
| | 12,783 | | | Siemens AG | | | 1,633,575 | |
| | 2,317 | | | Sixt SE | | | 55,423 | |
| | 1,801 | | | SMA Solar Technology AG | | | 73,415 | |
| | 23,593 | | | Symrise AG | | | 998,916 | |
| | 186,250 | | | ThyssenKrupp AGa | | | 4,751,883 | |
| | 38,646 | | | United Internet AG | | | 1,524,443 | |
| | 26,081 | | | Wincor Nixdorf AG | | | 1,724,437 | |
| | 1,721 | | | XING AG | | | 173,554 | |
| | | | | |
| | | | Total | | | 46,691,175 | |
| | | | | |
|
| Hong Kong (3.1%) | |
| | 572,400 | | | AIA Group, Ltd. | | | 2,906,552 | |
| | 31,000 | | | China Merchants Holdings International Company, Ltd. | | | 109,895 | |
| | 401,000 | | | China Mobile, Ltd. | | | 4,167,052 | |
| | 45,600 | | | Dah Sing Financial Holdings, Ltd. | | | 283,664 | |
| | 2,414,050 | | | Guangzhou Automobile Group Company, Ltd. | | | 2,862,034 | |
| | 393,000 | | | Hang Lung Group, Ltd. | | | 2,078,979 | |
| | 468,300 | | | Hutchison Whampoa, Ltd. | | | 5,835,332 | |
| | 137,000 | | | Luk Fook Holdings International, Ltd. | | | 489,085 | |
| | 42,000 | | | Man Wah Holdings, Ltd. | | | 72,386 | |
| | 2,205,433 | | | New World Development Company, Ltd. | | | 3,051,010 | |
| | 27,567 | | | NW Hotel Investments Company, Ltd.a,d | | | 0 | |
| | 148,000 | | | Sinotruk Hong Kong, Ltd. | | | 77,501 | |
| | 150,500 | | | Swire Pacific, Ltd., Class A | | | 1,739,404 | |
| | 270,000 | | | Swire Pacific, Ltd., Class B | | | 608,483 | |
| | 166,950 | | | Swire Properties, Ltd. | | | 452,204 | |
| | 20,800 | | | VTech Holdings, Ltd. | | | 298,627 | |
| | 47,000 | | | Weichai Power Company, Ltd. | | | 188,123 | |
| | 217,000 | | | Wheelock and Company, Ltd. | | | 1,107,420 | |
| | 18,000 | | | Wing Hang Bank, Ltd. | | | 256,442 | |
| | | | | |
| | | | Total | | | 26,584,193 | |
| | | | | |
|
| Hungary (0.2%) | |
| | 90,010 | | | Richter Gedeon Nyrt | | | 1,711,571 | |
| | | | | |
| | | | Total | | | 1,711,571 | |
| | | | | |
|
| India (1.5%) | |
| | 22,800 | | | GlaxoSmithKline Pharmaceuticals, Ltd. | | | 901,589 | |
| | 9,500 | | | Grasim Industries, Ltd. | | | 435,369 | |
| | 40,779 | | | Hero Motocorp, Ltd. | | | 1,378,032 | |
| | 140,000 | | | Hindustan Unilever, Ltd. | | | 1,387,886 | |
| | 183,191 | | | Housing Development Finance Corporation | | | 2,545,496 | |
| | 65,000 | | | ICICI Bank, Ltd. | | | 1,178,037 | |
| | 53,800 | | | Infosys, Ltd. | | | 2,875,046 | |
| | 1,269 | | | Infosys, Ltd. ADR | | | 67,333 | |
| | 218,864 | | | ITC, Ltd. | | | 1,191,250 | |
| | 6,208 | | | Reliance Industries, Ltd. GDRe | | | 185,046 | |
| | 31,428 | | | Ultra Tech Cement, Ltd. | | | 1,004,740 | |
| | | | | |
| | | | Total | | | 13,149,824 | |
| | | | | |
|
| Indonesia (0.4%) | |
| | 234,000 | | | AKR Corporindo Tbk PTc | | | 100,567 | |
| | 210,500 | | | Bank Rakyat Indonesia Persero Tbk PT | | | 147,735 | |
| | 76,500 | | | Indo Tambangraya Megah Tbk PT | | | 202,842 | |
The accompanying Notes to Financial Statements are an integral part of this schedule.
176
Partner Worldwide Allocation Fund
Schedule of Investments as of October 31, 2013
| | | | | | | | |
| Shares | | | Common Stock (89.1%) | | Value | |
| Indonesia (0.4%) - continued | |
| | 4,126,000 | | | PT Astra International Tbk | | | $2,432,643 | |
| | 166,000 | | | United Tractors Tbk PT | | | 257,645 | |
| | 424,000 | | | Vale Indonesia Tbk PT | | | 92,856 | |
| | | | | |
| | | | Total | | | 3,234,288 | |
| | | | | |
|
| Ireland (0.4%) | |
| | 83,828 | | | Beazley plc | | | 307,285 | |
| | 5,593 | | | FBD Holdings plc | | | 120,743 | |
| | 11,092 | | | Grafton Group plc | | | 105,353 | |
| | 29,208 | | | Ryanair Holdings plc ADR | | | 1,466,533 | |
| | 71,675 | | | Smurfit Kappa Group plc | | | 1,735,010 | |
| | | | | |
| | | | Total | | | 3,734,924 | |
| | | | | |
|
| Israel (0.1%) | |
| | 69,367 | | | Mizrahi Tefahot Bank, Ltd. | | | 813,112 | |
| | | | | |
| | | | Total | | | 813,112 | |
| | | | | |
|
| Italy (3.0%) | |
| | 20,628 | | | Ansaldo STS SPA | | | 218,892 | |
| | 114,275 | | | Assicurazioni Generali SPA | | | 2,671,645 | |
| | 73,558 | | | Azimut Holding SPA | | | 1,865,967 | |
| | 64,934 | | | Banca Generali SPA | | | 1,695,128 | |
| | 4,320 | | | Banca IFIS SPA | | | 64,845 | |
| | 1,201,392 | | | Banca Popolare di Milano SCRLa | | | 802,535 | |
| | 6,341 | | | Brunello Cucinelli SPA | | | 197,635 | |
| | 229,125 | | | Eni SPA | | | 5,816,806 | |
| | 7,322 | | | I.M.A. Industria Macchine Automatiche SPA | | | 250,923 | |
| | 3,255,075 | | | Intesa Sanpaolo SPA | | | 8,075,464 | |
| | 460,086 | | | Mediaset SPAa | | | 2,297,535 | |
| | 53,874 | | | Recordati SPA | | | 707,665 | |
| | 1,505 | | | Reply SPA | | | 97,880 | |
| | 17,316 | | | Sogefi SPA | | | 98,476 | |
| | 47,619 | | | Unipol Gruppo Finanziario SPA | | | 213,687 | |
| | 2,954 | | | Yoox SPAa | | | 106,269 | |
| | | | | |
| | | | Total | | | 25,181,352 | |
| | | | | |
|
| Japan (15.9%) | |
| | 10,000 | | | 77 Bank, Ltd. | | | 49,459 | |
| | 65,700 | | | Aderans Company, Ltd. | | | 804,906 | |
| | 31,000 | | | Aichi Steel Corporation | | | 158,901 | |
| | 7,100 | | | Aisan Industry Company, Ltd. | | | 71,523 | |
| | 37,700 | | | Aoyama Trading Company, Ltd. | | | 961,262 | |
| | 68,200 | | | Asics Corporation | | | 1,202,408 | |
| | 22,700 | | | Avex Group Holdings, Inc. | | | 575,208 | |
| | 146,475 | | | Bridgestone Corporation | | | 5,021,561 | |
| | 5,900 | | | CKD Corporation | | | 54,770 | |
| | 12,600 | | | Cookpad, Inc. | | | 404,363 | |
| | 9,000 | | | Daido Metal Company, Ltd. | | | 94,412 | |
| | 26,000 | | | Daifuku Company, Ltd. | | | 334,344 | |
| | 2,200 | | | Daikoku Denki Co., Ltd. | | | 48,245 | |
| | 693,264 | | | Daiwa Securities Group, Inc. | | | 6,332,119 | |
| | 247,600 | | | DMG Mori Seiki Company, Ltd. | | | 4,016,570 | |
| | 27,300 | | | East Japan Railway Company | | | 2,371,570 | |
| | 187,000 | | | Ebara Corporation | | | 1,005,374 | |
| | 54,000 | | | EDION Corporation | | | 270,320 | |
| | 33,500 | | | Electric Power Development Company, Ltd. | | | 1,070,588 | |
| | 46,100 | | | Fancl Corporation | | | 548,229 | |
| | 3,100 | | | Fields Corporation | | | 54,928 | |
| | 107,000 | | | Fuji Heavy Industries, Ltd. | | | 2,925,544 | |
| | 6,500 | | | Fuji Machine Manufacturing Company, Ltd. | | | 58,547 | |
| | 182,000 | | | Furukawa Company, Ltd. | | | 379,428 | |
| | 10,700 | | | Futaba Industrial Company, Ltd.a | | | 39,866 | |
| | 27 | | | Global One Real Estate Investment Corporation | | | 159,118 | |
| | 65,300 | | | GMO Internet, Inc. | | | 742,335 | |
| | 5,000 | | | GNI Group, Ltd.a | | | 23,547 | |
| | 170,000 | | | Godo Steel, Ltd. | | | 312,529 | |
| | 87,300 | | | Gulliver International Company, Ltd. | | | 520,525 | |
| | 15 | | | Hankyu REIT, Inc. | | | 86,344 | |
| | 13,000 | | | Heiwa Real Estate Company, Ltd. | | | 235,464 | |
| | 87,000 | | | Hino Motors, Ltd. | | | 1,229,272 | |
| | 8,900 | | | Hitachi Capital Corporation | | | 239,368 | |
| | 278,000 | | | Hitachi, Ltd. | | | 1,944,640 | |
| | 2,300 | | | IBJ Leasing Company, Ltd. | | | 64,764 | |
| | 40,300 | | | Iino Kaiun Kaisha, Ltd. | | | 265,404 | |
| | 357 | | | Ikyu Corporation | | | 548,488 | |
| | 49 | | | Industrial & Infrastructure Fund Investment Corporation | | | 453,374 | |
| | 11,000 | | | Jaccs Company, Ltd. | | | 52,556 | |
| | 2,400 | | | Jafco Company, Ltd. | | | 120,361 | |
| | 82 | | | Japan Rental Housing Investments, Inc. | | | 59,793 | |
| | 15,200 | | | Japan Securities Finance Company, Ltd. | | | 111,482 | |
| | 105,600 | | | Japan Tobacco, Inc. | | | 3,820,996 | |
| | 64,000 | | | Japan Vilene Company, Ltd. | | | 369,288 | |
| | 93,100 | | | JTEKT Corporation | | | 1,195,243 | |
| | 50,100 | | | Kakaku.com, Inc. | | | 969,001 | |
| | 106,000 | | | Kandenko Company, Ltd. | | | 669,790 | |
| | 393,000 | | | Kawasaki Kisen Kaisha, Ltd. | | | 900,924 | |
| | 48,900 | | | KDDI Corporation | | | 2,648,252 | |
| | 165,800 | | | Kenedix, Inc.a | | | 856,690 | |
| | 4,600 | | | Komori Corporation | | | 72,335 | |
| | 31,000 | | | Kurimoto, Ltd. | | | 88,351 | |
| | 143,000 | | | KYB Company, Ltd. | | | 828,019 | |
| | 11,700 | | | Kyoei Steel, Ltd. | | | 242,120 | |
| | 9,300 | | | Kyoritsu Maintenance Company, Ltd. | | | 357,950 | |
| | 112,025 | | | LIXIL Group Corporationc | | | 2,629,527 | |
| | 7,000 | | | Maeda Corporation | | | 50,364 | |
| | 29,000 | | | Maeda Road Construction Company, Ltd. | | | 515,648 | |
| | 158,000 | | | Marubeni Corporation | | | 1,237,052 | |
| | 1,300 | | | Maruwa Company, Ltd. | | | 47,192 | |
| | 32,900 | | | Matsumotokiyoshi Holdings Company, Ltd. | | | 1,110,124 | |
| | 43 | | | MID Reit, Inc. | | | 99,159 | |
| | 7,000 | | | Mito Securities Company, Ltd. | | | 33,614 | |
| | 59,600 | | | Mitsubishi Corporation | | | 1,205,772 | |
| | 181,100 | | | Mitsubishi UFJ Financial Group, Inc. | | | 1,153,293 | |
| | 387,000 | | | Mitsui Engineering & Shipbuilding Company, Ltd. | | | 759,673 | |
| | 54,000 | | | Mitsui Fudosan Company, Ltd. | | | 1,788,799 | |
| | 400 | | | Mochida Pharmaceutical Company, Ltd. | | | 25,318 | |
| | 21,500 | | | MonotaRO Company, Ltd. | | | 505,442 | |
| | 287,757 | | | MS and AD Insurance Group Holdings, Inc. | | | 7,440,636 | |
| | 64,800 | | | Namco Bandai Holdings, Inc. | | | 1,221,506 | |
| | 4,800 | | | NEC Capital Solutions, Ltd. | | | 118,963 | |
| | 5,000 | | | Neturen Company, Ltd. | | | 44,101 | |
| | 106,000 | | | Nikkiso Company, Ltd. | | | 1,311,374 | |
| | 49,000 | | | NIPPO Corporation | | | 919,287 | |
| | 58,900 | | | Nippon Paper Industries Company, Ltd. | | | 938,513 | |
| | 2,088,000 | | | Nippon Sheet Glass Companya | | | 2,708,054 | |
The accompanying Notes to Financial Statements are an integral part of this schedule.
177
Partner Worldwide Allocation Fund
Schedule of Investments as of October 31, 2013
| | | | | | | | |
| Shares | | | Common Stock (89.1%) | | Value | |
| Japan (15.9%) - continued | |
| | 11,400 | | | Nippon Telegraph & Telephone Corporation | | | $592,576 | |
| | 464,000 | | | Nippon Yusen Kabushiki Kaisha | | | 1,417,751 | |
| | 560,750 | | | Nissan Motor Company, Ltd. | | | 5,630,638 | |
| | 10,200 | | | Nissha Printing Company, Ltd.a | | | 166,691 | |
| | 17,100 | | | Nisshin Steel Holdings Company, Ltd. | | | 228,010 | |
| | 9,000 | | | Nisshinbo Holdings, Inc. | | | 79,490 | |
| | 19,000 | | | Nissin Electric Company, Ltd. | | | 120,864 | |
| | 71,000 | | | NS United Kaiun Kaisha, Ltd.a | | | 215,334 | |
| | 132,000 | | | NSK, Ltd. | | | 1,410,068 | |
| | 31,000 | | | Okuma Corporation | | | 261,867 | |
| | 35,000 | | | Omron Corporation | | | 1,335,643 | |
| | 27,602 | | | Pigeon Corporation | | | 1,424,075 | |
| | 26,300 | | | Relo Holdings, Inc. | | | 1,219,361 | |
| | 2,200 | | | Ryoyo Electro Corporation | | | 20,157 | |
| | 82,000 | | | Sanden Corporation | | | 331,778 | |
| | 60,000 | | | Sanyo Special Steel Company, Ltd. | | | 323,557 | |
| | 59,700 | | | Seiko Epson Corporation | | | 974,518 | |
| | 89,000 | | | Sekisui House, Ltd. | | | 1,277,494 | |
| | 24,100 | | | Shinko Electric Industries Company, Ltd. | | | 214,848 | |
| | 58,400 | | | Softbank Corporation | | | 4,361,249 | |
| | 2,900 | | | Start Today Company, Ltd. | | | 80,852 | |
| | 37,000 | | | Sumitomo Bakelite Company, Ltd | | | 133,417 | |
| | 462,650 | | | Sumitomo Corporation | | | 6,020,607 | |
| | 26,100 | | | Sumitomo Mitsui Financial Group, Inc. | | | 1,261,567 | |
| | 1,408,250 | | | Sumitomo Mitsui Trust Holdings, Inc. | | | 6,955,472 | |
| | 28,000 | | | Sumitomo Realty & Development Company, Ltd. | | | 1,324,860 | |
| | 98,000 | | | Tadano, Ltd. | | | 1,347,625 | |
| | 17,000 | | | Taikisha, Ltd. | | | 395,163 | |
| | 2,500 | | | Taiyo Yuden Company, Ltd. | | | 32,045 | |
| | 8,900 | | | Takata Corporation | | | 224,475 | |
| | 40,900 | | | Tatsuta Electric Wire and Cable Company, Ltd. | | | 288,781 | |
| | 9,000 | | | Toei Company, Ltd. | | | 54,130 | |
| | 1,250 | | | Token Corporation | | | 66,398 | |
| | 61,800 | | | Tokio Marine Holdings, Inc. | | | 2,026,080 | |
| | 16,400 | | | Tokyo Seimitsu Company, Ltd. | | | 313,144 | |
| | 181,000 | | | Tokyotokeiba Company, Ltd. | | | 737,610 | |
| | 72,200 | | | Totetsu Kogyo Company, Ltd. | | | 1,626,104 | |
| | 122,000 | | | Toyo Kanetsu KK | | | 358,787 | |
| | 31,000 | | | Toyo Suisan Kaisha, Ltd. | | | 985,894 | |
| | 136,500 | | | Toyota Motor Corporation | | | 8,850,412 | |
| | 21,900 | | | TPR Company, Ltd. | | | 416,247 | |
| | 23,000 | | | Tsubakimoto Chain Company | | | 152,373 | |
| | 72,100 | | | Tsukui Corporation | | | 799,118 | |
| | 17,900 | | | Tsuruha Holdings, Inc. | | | 1,625,120 | |
| | 17,600 | | | ULVAC, Inc.a | | | 179,979 | |
| | 8,800 | | | Unipres Corporation | | | 177,568 | |
| | 12,700 | | | Universal Entertainment Corporation | | | 252,916 | |
| | 38,000 | | | Zenkoku Hosho Company, Ltd. | | | 1,635,403 | |
| | 17,900 | | | ZUIKO Corporation | | | 1,171,198 | |
| | | | | |
| | | | Total | | | 136,005,493 | |
| | | | | |
| |
| Jersey (0.9%) | | | | |
| | 362,850 | | | WPP plc | | | 7,707,330 | |
| | | | | |
| | | | Total | | | 7,707,330 | |
| | | | | |
|
| Luxembourg (0.5%) | |
| | 50,501 | | | APERAM | | | 862,792 | |
| | 15,313 | | | AZ Electronic Materials SA | | | 70,348 | |
| | 12,552 | | | Oriflame Cosmetics SA | | | 396,104 | |
| | 59,000 | | | Tenaris SA ADR | | | 2,761,790 | |
| | 15,286 | | | Ternium SA ADR | | | 398,659 | |
| | | | | |
| | | | Total | | | 4,489,693 | |
| | | | | |
| |
| Malaysia (0.2%) | | | | |
| | 251,589 | | | CIMB Group Holdings Berhad | | | 598,034 | |
| | 71,300 | | | Genting Berhad | | | 236,718 | |
| | 33,108 | | | Malayan Banking Berhad | | | 102,622 | |
| | 135,500 | | | Public Bank Berhad | | | 786,614 | |
| | | | | |
| | | | Total | | | 1,723,988 | |
| | | | | |
| |
| Mexico (1.0%) | | | | |
| | 565,300 | | | America Movil SAB de CV | | | 605,280 | |
| | 168,000 | | | Consorcio ARA SAB de CVa | | | 65,540 | |
| | 28,000 | | | Fomento Economico Mexicano SAB de CV ADR | | | 2,612,400 | |
| | 11,100 | | | Grupo Aeroportuario del Sureste SAB de CV ADR | | | 1,321,011 | |
| | 437,813 | | | Grupo Financiero Banorte SAB de CV ADR | | | 2,802,593 | |
| | 271,000 | | | Organizacion Soriana SAB de CVa | | | 876,938 | |
| | | | | |
| | | | Total | | | 8,283,762 | |
| | | | | |
| |
| Netherlands (2.8%) | | | | |
| | 1,121,000 | | | Aegon NV | | | 8,919,698 | |
| | 65,871 | | | Arcelor Mittal | | | 1,037,514 | |
| | 19,984 | | | ASM International NV | | | 656,409 | |
| | 68,754 | | | BE Semiconductor Industries NV | | | 747,113 | |
| | 55,446 | | | European Aeronautic Defence and Space Company | | | 3,799,428 | |
| | 89,150 | | | Koninklijke DSM NV | | | 6,739,104 | |
| | 83,368 | | | TomTom NVa | | | 643,712 | |
| | 23,421 | | | Unilever NV | | | 928,540 | |
| | 36,612 | | | USG People NV | | | 483,981 | |
| | | | | |
| | | | Total | | | 23,955,499 | |
| | | | | |
| |
| New Zealand (<0.1%) | | | | |
| | 93,645 | | | Fisher & Paykel Healthcare Corporation, Ltd. | | | 284,652 | |
| | | | | |
| | | | Total | | | 284,652 | |
| | | | | |
| |
| Norway (0.6%) | | | | |
| | 13,332 | | | Algeta ASAa | | | 529,647 | |
| | 777,422 | | | BW Offshore, Ltd. | | | 1,063,964 | |
| | 63,814 | | | DnB ASA | | | 1,131,200 | |
| | 12,293 | | | Norwegian Air Shuttle ASAa | | | 504,672 | |
| | 26,274 | | | Tomra Systems ASA | | | 241,641 | |
| | 36,663 | | | Yara International ASA | | | 1,578,978 | |
| | | | | |
| | | | Total | | | 5,050,102 | |
| | | | | |
| |
| Panama (<0.1%) | | | | |
| | 391 | | | Copa Holdings SA | | | 58,470 | |
| | | | | |
| | | | Total | | | 58,470 | |
| | | | | |
| |
| Peru (<0.1%) | | | | |
| | 6,912 | | | Cia de Minas Buenaventura SA ADR | | | 100,224 | |
| | | | | |
| | | | Total | | | 100,224 | |
| | | | | |
| |
| Philippines (0.4%) | | | | |
| | 2,575,500 | | | Ayala Land, Inc. | | | 1,753,325 | |
The accompanying Notes to Financial Statements are an integral part of this schedule.
178
Partner Worldwide Allocation Fund
Schedule of Investments as of October 31, 2013
| | | | | | | | |
| Shares | | | Common Stock (89.1%) | | Value | |
| Philippines (0.4%) - continued | |
| | 675,966 | | | Bank of the Philippine Islands | | | $1,564,185 | |
| | | | | |
| | | | Total | | | 3,317,510 | |
| | | | | |
| |
| Poland (0.4%) | | | | |
| | 5,603 | | | Bank Handlowy w Warszawie SA | | | 215,348 | |
| | 43,093 | | | Bank Pekao SA | | | 2,698,143 | |
| | 8,208 | | | Grupa Lotos SAa | | | 100,125 | |
| | 55,364 | | | Telekomunikacja Polska SA | | | 179,373 | |
| | | | | |
| | | | Total | | | 3,192,989 | |
| | | | | |
| |
| Portugal (0.7%) | | | | |
| | 3,917,175 | | | Banco Espirito Santo SAa | | | 5,147,098 | |
| | 69,488 | | | Mota - Engil, SGPS SA | | | 318,492 | |
| | 53,948 | | | Semapa - Sociedade de Investimento e Gestao, SGPS SA | | | 529,511 | |
| | 42,301 | | | Sonaecom- SGPS SA | | | 137,161 | |
| | | | | |
| | | | Total | | | 6,132,262 | |
| | | | | |
| |
| Russia (0.6%) | | | | |
| | 21,194 | | | Gazprom OAO ADR | | | 197,740 | |
| | 45,500 | | | Lukoil ADR | | | 2,979,971 | |
| | 4,800 | | | Magnit OJSCd | | | 1,292,365 | |
| | 26,032 | | | Novolipetsk Steel OJSC GDR | | | 443,553 | |
| | 6,294 | | | Phosagro OAO | | | 63,415 | |
| | 23,077 | | | Sberbank of Russia GDR | | | 294,287 | |
| | | | | |
| | | | Total | | | 5,271,331 | |
| | | | | |
| |
| Singapore (1.3%) | | | | |
| | 502,800 | | | ARA Asset Management, Ltd. | | | 743,353 | |
| | 153,000 | | | DBS Group Holdings, Ltd. | | | 2,062,665 | |
| | 717,000 | | | Ezion Holdings, Ltd. | | | 1,290,501 | |
| | 540,785 | | | Keppel Corporation, Ltd. | | | 4,719,058 | |
| | 17,000 | | | M1, Ltd. | | | 46,586 | |
| | 346,000 | | | Osim International, Ltd. | | | 587,542 | |
| | 164,000 | | | Raffles Medical Group, Ltd. | | | 421,125 | |
| | 259,000 | | | Super Group, Ltd. | | | 875,735 | |
| | | | | |
| | | | Total | | | 10,746,565 | |
| | | | | |
| |
| South Africa (0.5%) | | | | |
| | 8,343 | | | AngloGold Ashanti, Ltd. ADR | | | 125,979 | |
| | 16,256 | | | Barclays Africa Group | | | 251,077 | |
| | 13,982 | | | Impala Platinum Holdings, Ltd. | | | 169,835 | |
| | 67,890 | | | Massmart Holdings, Ltd. | | | 1,088,454 | |
| | 16,933 | | | MTN Group, Ltd. | | | 336,580 | |
| | 20,174 | | | PPC, Ltd. | | | 63,805 | |
| | 17,994 | | | Reunert, Ltd. | | | 126,368 | |
| | 19,922 | | | Sappi, Ltd.a | | | 58,662 | |
| | 214,000 | | | Truworths International, Ltd. | | | 2,045,130 | |
| | | | | |
| | | | Total | | | 4,265,890 | |
| | | | | |
| |
| South Korea (2.5%) | | | | |
| | 6,003 | | | E-Mart Company, Ltd. | | | 1,436,495 | |
| | 1,153 | | | Hyundai Department Store Company, Ltd. | | | 183,596 | |
| | 2,212 | | | Hyundai Heavy Industries Company, Ltd. | | | 528,220 | |
| | 1,420 | | | Hyundai Mobis | | | 400,554 | |
| | 2,784 | | | Hyundai Motor Company | | | 663,271 | |
| | 5,280 | | | Kangwon Land, Inc. | | | 145,099 | |
| | 1,042 | | | LG Chem, Ltd. | | | 293,930 | |
| | 17,050 | | | POSCO | | | 5,090,126 | |
| | 5,288 | | | POSCO ADR | | | 393,744 | |
| | 6,018 | | | Samsung Electronics Company, Ltd. | | | 5,829,393 | |
| | 2,810 | | | Samsung Heavy Industries Company, Ltd. | | | 103,035 | |
| | 13,480 | | | Shinhan Financial Group Company, Ltd. | | | 587,777 | |
| | 817 | | | Shinsegae Company, Ltd. | | | 205,683 | |
| | 4,830 | | | SK Telecom Company, Ltd. | | | 1,052,555 | |
| | 179,376 | | | SK Telecom Company, Ltd. ADRb | | | 4,391,124 | |
| | | | | |
| | | | Total | | | 21,304,602 | |
| | | | | |
| |
| Spain (1.9%) | | | | |
| | 57,114 | | | Atresmedia Corporacion de Medios de Comunicacion SA | | | 954,204 | |
| | 488,080 | | | Banco Popular Espanol SAa | | | 2,768,583 | |
| | 174,170 | | | Bankinter SA | | | 1,061,940 | |
| | 41,920 | | | Ebro Foods SA | | | 945,619 | |
| | 81,089 | | | Ence Energia y Celulosa SA | | | 325,670 | |
| | 100,517 | | | Gamesa Corporacion Tecnologia SAa | | | 970,705 | |
| | 50,019 | | | Gas Natural SDG SA | | | 1,179,761 | |
| | 13,220 | | | Grupo Catalana Occidente SA | | | 447,260 | |
| | 1,071,687 | | | Iberdrola SA | | | 6,726,844 | |
| | 11,440 | | | Mediaset Espana Comunicacion SAa | | | 139,618 | |
| | 12,437 | | | Papeles y Cartones de Europa SA | | | 66,683 | |
| | 81,877 | | | Tubacex SA | | | 315,216 | |
| | 35,308 | | | Zeltia SAa | | | 121,646 | |
| | | | | |
| | | | Total | | | 16,023,749 | |
| | | | | |
| |
| Sweden (1.4%) | | | | |
| | 32,156 | | | Haldex AB | | | 232,880 | |
| | 4,648 | | | ICA Gruppen ABa | | | 140,474 | |
| | 46,497 | | | Intrum Justitia AB | | | 1,236,326 | |
| | 61,833 | | | Investor AB | | | 1,982,502 | |
| | 28,927 | | | Loomis AB | | | 693,403 | |
| | 14,695 | | | Medivir ABa | | | 192,757 | |
| | 31,982 | | | NCC AB | | | 983,744 | |
| | 2,133 | | | Net Entertainment NE ABa | | | 41,275 | |
| | 69,265 | | | Nordea Bank AB | | | 886,004 | |
| | 190,497 | | | Skandinaviska Enskilda Banken AB | | | 2,304,073 | |
| | 86,586 | | | Svenska Cellulosa AB SCA | | | 2,454,817 | |
| | 41,194 | | | Swedbank AB | | | 1,072,129 | |
| | | | | |
| | | | Total | | | 12,220,384 | |
| | | | | |
| |
| Switzerland (8.1%) | | | | |
| | 33,416 | | | Actelion, Ltd.a | | | 2,585,416 | |
| | 79,800 | | | Adecco SAa | | | 5,884,753 | |
| | 1,324 | | | AFG Arbonia-Forster-Holding AGa | | | 45,892 | |
| | 3,517 | | | Ascom Holding AGa | | | 51,871 | |
| | 294 | | | Autoneum Holding AGa | | | 39,143 | |
| | 455 | | | Basilea Pharmaceutica AGa | | | 49,553 | |
| | 6,153 | | | Bucher Industries AG | | | 1,703,952 | |
| | 37,837 | | | Compagnie Financiere Richemont SA | | | 3,868,823 | |
| | 196,853 | | | Credit Suisse Group AGa | | | 6,123,696 | |
| | 73,611 | | | Ferrexpo plc | | | 213,753 | |
| | 152 | | | Forbo Holding AGa | | | 119,188 | |
| | 57,295 | | | GAM Holding AGa | | | 1,070,607 | |
| | 514 | | | Georg Fischer AGa | | | 354,068 | |
| | 3,333 | | | Givaudan SAa | | | 4,726,822 | |
| | 341,531 | | | Glencore Xstrata plca | | | 1,858,701 | |
| | 65,595 | | | Holcim, Ltd.a | | | 4,878,924 | |
| | 17,556 | | | Implenia AGa | | | 1,182,302 | |
| | 3,091 | | | Kuoni Reisen Holding AGa | | | 1,306,551 | |
| | 112,534 | | | Nestle SA | | | 8,123,149 | |
The accompanying Notes to Financial Statements are an integral part of this schedule.
179
Partner Worldwide Allocation Fund
Schedule of Investments as of October 31, 2013
| | | | | | | | |
| Shares | | | Common Stock (89.1%) | | Value | |
| Switzerland (8.1%) - continued | |
| | 114,038 | | | Novartis AG | | | $8,851,925 | |
| | 5,608 | | | Panalpina Welttransport Holding AG | | | 838,126 | |
| | 54,313 | | | Roche Holding AG | | | 15,019,469 | |
| | 3,167 | | | U-Blox AGa | | | 285,731 | |
| | 10 | | | Vetropack Holding AG | | | 19,970 | |
| | 2,077 | | | Vontobel Holding AG | | | 83,136 | |
| | | | | |
| | | | Total | | | 69,285,521 | |
| | | | | |
| |
| Taiwan (0.7%) | | | | |
| | 115,000 | | | Advanced Semiconductor Engineering, Inc. | | | 113,235 | |
| | 49,000 | | | Chipbond Technology Corporation | | | 99,017 | |
| | 394,000 | | | Compal Electronics, Inc. | | | 308,286 | |
| | 55,000 | | | Novatek Microelectronics Corporation | | | 217,879 | |
| | 314,100 | | | Taiwan Mobile Company, Ltd. | | | 1,071,362 | |
| | 1,108,362 | | | Taiwan Semiconductor Manufacturing Company, Ltd. | | | 4,084,940 | |
| | 8,000 | | | TPK Holding Company, Ltd. | | | 56,155 | |
| | | | | |
| | | | Total | | | 5,950,874 | |
| | | | | |
| |
| Thailand (2.1%) | | | | |
| | 355,800 | | | Bangkok Bank pcl | | | 2,361,593 | |
| | 34,500 | | | Kasikornbank pcl | | | 211,335 | |
| | 7,620,700 | | | Krung Thai Bank pcl | | | 4,984,364 | |
| | 266,000 | | | PTT Exploration & Production pcl | | | 1,439,300 | |
| | 447,750 | | | PTT pcl | | | 4,558,191 | |
| | 130,800 | | | Siam Cement pcl | | | 1,846,533 | |
| | 353,400 | | | Siam Commercial Bank pcl | | | 1,873,779 | |
| | 199,700 | | | Thai Oil pcl | | | 404,233 | |
| | | | | |
| | | | Total | | | 17,679,328 | |
| | | | | |
| |
| Turkey (0.6%) | | | | |
| | 516,258 | | | Akbank TAS | | | 2,017,857 | |
| | 70,796 | | | BIM Birlesik Magazalar AS | | | 1,481,187 | |
| | 376,000 | | | Turkiye Garanti Bankasi AS | | | 1,507,697 | |
| | 11,435 | | | Turkiye Halk Bankasi A.S. | | | 91,883 | |
| | | | | |
| | | | Total | | | 5,098,624 | |
| | | | | |
| |
| United Kingdom (12.0%) | | | | |
| | 128,733 | | | African Minerals, Ltd.a | | | 384,126 | |
| | 176,740 | | | ARM Holdings plc | | | 2,769,470 | |
| | 80,797 | | | Ashmore Group plc | | | 523,577 | |
| | 9,431 | | | ASOS plca | | | 857,349 | |
| | 48,304 | | | Associated British Foods plc | | | 1,756,105 | |
| | 10,629 | | | Avanti Communications Group plca | | | 37,579 | |
| | 78,932 | | | Babcock International Group plc | | | 1,614,095 | |
| | 1,301,174 | | | BAE Systems plc | | | 9,491,482 | |
| | 2,322 | | | Bank of Georgia Holdings plc | | | 73,413 | |
| | 91,646 | | | Bellway plc | | | 2,207,439 | |
| | 32,763 | | | Berkeley Group Holdings plc | | | 1,228,134 | |
| | 34,000 | | | BHP Billiton plc | | | 1,045,228 | |
| | 9,282 | | | Big Yellow Group plc | | | 69,548 | |
| | 686,242 | | | Blinkx plca | | | 1,803,451 | |
| | 86,165 | | | British American Tobacco plc | | | 4,753,956 | |
| | 216,986 | | | Britvic plc | | | 2,174,487 | |
| | 133,752 | | | Cable & Wireless Communications plc | | | 100,346 | |
| | 20,624 | | | Chemring Group plc | | | 71,925 | |
| | 51,309 | | | Chesnara plc | | | 240,227 | |
| | 122,830 | | | Cineworld Group plc | | | 730,446 | |
| | 2,647 | | | Clarkson plc | | | 85,564 | |
| | 141,646 | | | CSR plc | | | 1,247,690 | |
| | 11,791 | | | Daily Mail and General Trust plc | | | 153,789 | |
| | 20,149 | | | Diageo plc | | | 642,304 | |
| | 94,880 | | | easyJet plc | | | 1,987,481 | |
| | 114,641 | | | EnQuest plca | | | 245,100 | |
| | 19,134 | | | Essentra plc | | | 240,572 | |
| | 35,785 | | | Fenner plc | | | 229,274 | |
| | 3,936 | | | Galliford Try plc | | | 72,462 | |
| | 109,128 | | | GlaxoSmithKline plc | | | 2,876,895 | |
| | 2,400 | | | Go-Ahead Group plc | | | 64,695 | |
| | 29,223 | | | Grainger plc | | | 91,260 | |
| | 37,594 | | | Halfords Group plc | | | 254,622 | |
| | 205,792 | | | Halma plc | | | 1,807,596 | |
| | 3,129 | | | Hikma Pharmaceuticals plc | | | 60,196 | |
| | 311,508 | | | Howden Joinery Group plc | | | 1,611,030 | |
| | 94,500 | | | HSBC Holdings plc ADRb | | | 5,201,281 | |
| | 108,418 | | | IG Group Holdings plc | | | 1,065,541 | |
| | 133,644 | | | Intermediate Capital Group plc | | | 1,025,541 | |
| | 7,909 | | | International Personal Finance plc | | | 73,092 | |
| | 804,331 | | | ITV plc | | | 2,459,328 | |
| | 247,795 | | | J Sainsbury plc | | | 1,567,447 | |
| | 265,034 | | | Jupiter Fund Management plc | | | 1,694,701 | |
| | 12,019 | | | Keller Group plc | | | 202,543 | |
| | 33,186 | | | Lancashire Holdings, Ltd. | | | 432,072 | |
| | 1,144,497 | | | Lloyds TSB Group plca | | | 1,415,523 | |
| | 67,603 | | | London Stock Exchange Group plc | | | 1,776,889 | |
| | 702,398 | | | Man Group plc | | | 999,675 | |
| | 34,087 | | | Michael Page International plc | | | 264,592 | |
| | 5,627 | | | Micro Focus International plc | | | 73,752 | |
| | 79,000 | | | Mondi plc | | | 1,410,630 | |
| | 119,547 | | | Moneysupermarket.com Group plc | | | 293,593 | |
| | 165,526 | | | Monitise plca | | | 147,456 | |
| | 22,308 | | | N Brown Group plc | | | 187,468 | |
| | 15,188 | | | Next plc | | | 1,326,332 | |
| | 62,347 | | | Ocado Group plca | | | 433,861 | |
| | 410,698 | | | Pace plc | | | 2,005,846 | |
| | 98,870 | | | Persimmon plca | | | 2,001,758 | |
| | 256,277 | | | Premier Foods plca | | | 618,431 | |
| | 177,584 | | | Prudential plc | | | 3,631,756 | |
| | 41,331 | | | SABMiller plc | | | 2,146,495 | |
| | 24,852 | | | Shaftesbury plc | | | 236,644 | |
| | 76,659 | | | Shire plc | | | 3,399,120 | |
| | 39,070 | | | Spirax-Sarco Engineering plc | | | 1,827,065 | |
| | 252,725 | | | Spirent Communications plc | | | 447,831 | |
| | 80,860 | | | Sports Direct International plca | | | 908,719 | |
| | 103,854 | | | Standard Chartered plc | | | 2,493,554 | |
| | 40,238 | | | Synergy Health plc | | | 668,033 | |
| | 229,884 | | | TalkTalk Telecom Group plc | | | 984,079 | |
| | 683,288 | | | Taylor Wimpey plc | | | 1,205,580 | |
| | 74,337 | | | Telecity Group plc | | | 908,809 | |
| | 946,450 | | | Tesco plc | | | 5,520,819 | |
| | 125,560 | | | TUI Travel plc | | | 774,077 | |
| | 44,377 | | | Unilever plc | | | 1,799,549 | |
| | 11,450 | | | Vesuvius plc | | | 89,015 | |
| | 1,425,887 | | | Vodafone Group plc | | | 5,222,724 | |
| | | | | |
| | | | Total | | | 102,544,134 | |
| | | | | |
| |
| United States (0.2%) | | | | |
| | 12,601 | | | iShares MSCI Emerging Markets Index Fund | | | 535,038 | |
The accompanying Notes to Financial Statements are an integral part of this schedule.
180
Partner Worldwide Allocation Fund
Schedule of Investments as of October 31, 2013
| | | | | | | | |
| Shares | | | Common Stock (89.1%) | | Value | |
| United States (0.2%) - continued | |
| | 14,600 | | | Yum! Brands, Inc. | | | $987,252 | |
| | | | | |
| | | | Total | | | 1,522,290 | |
| | | | | |
| | | | | | | | |
| | | | | |
| | | | Total Common Stock (cost $646,164,607) | | | 760,265,273 | |
| | | | | |
| | |
Principal
Amount | | | Long-Term Fixed Income (8.4%) | | Value | |
| Angola (<0.1%) | |
| | | | Republic of Angola Via Northern Lights III BV | | | | |
| | 250,000 | | | 7.000%, 8/16/2019 | | | 270,625 | |
| | | | | |
| | | | Total | | | 270,625 | |
| | | | | |
| |
| Argentina (0.2%) | | | | |
| | | | Arcos Dorados BV | | | | |
| | 193,000 | | | 7.500%, 10/1/2019e | | | 196,378 | |
| | | | Argentina Government International Bond | | | | |
| | 312,797 | | | 7.820%, 12/31/2033f | | | 294,106 | |
| | 166,159 | | | 8.280%, 12/31/2033 | | | 119,219 | |
| | 41,540 | | | 8.280%, 12/31/2033 | | | 29,078 | |
| | 1,070,000 | | | 0.000%, 12/15/2035 | | | 92,555 | |
| | 2,774,000 | | | 0.000%, 12/15/2035f,g | | | 310,729 | |
| | 70,000 | | | 2.260%, 12/31/2038f,h | | | 34,463 | |
| | 1,000,000 | | | 2.500%, 12/31/2038h | | | 365,000 | |
| | | | | |
| | | | Total | | | 1,441,528 | |
| | | | | |
| |
| Azerbaijan (<0.1%) | | | | |
| | | | State Oil Company of Azerbaijan Republic | | | | |
| | 200,000 | | | 5.450%, 2/9/2017 | | | 213,700 | |
| | | | | |
| | | | Total | | | 213,700 | |
| | | | | |
| |
| Belarus (<0.1%) | | | | |
| | | | Belarus Government International Bond | | | | |
| | 216,000 | | | 8.750%, 8/3/2015 | | | 216,270 | |
| | | | | |
| | | | Total | | | 216,270 | |
| | | | | |
| |
| Belize (<0.1%) | | | | |
| | | | Belize Government International Bond | | | | |
| | 135,900 | | | 5.000%, 2/20/2038h,i | | | 83,579 | |
| | | | | |
| | | | Total | | | 83,579 | |
| | | | | |
| |
| Bermuda (<0.1%) | | | | |
| | | | Bermuda Government International Bond | | | | |
| | 200,000 | | | 4.854%, 2/6/2024e | | | 199,000 | |
| | | | | |
| | | | Total | | | 199,000 | |
| | | | | |
| |
| Brazil (0.6%) | | | | |
| | | | Banco do Estado do Rio Grande do Sul SA | | | | |
| | 460,000 | | | 7.375%, 2/2/2022e | | | 474,950 | |
| | | | Brazil Government International Bond | | | | |
| | 566,000 | | | 6.000%, 8/15/2050j | | | 611,513 | |
| | 210,000 | | | 4.875%, 1/22/2021 | | | 227,850 | |
| | 260,000 | | | 7.125%, 1/20/2037 | | | 312,000 | |
| | 340,000 | | | 11.000%, 8/17/2040 | | | 396,610 | |
| | | | Brazil Loan Trust 1 | | | | |
| | 640,000 | | | 5.477%, 7/24/2023e | | | 663,360 | |
| | | | Brazil Minas SPE via State of Minas Gerais | | | | |
| | 1,190,001 | | | 5.333%, 2/15/2028e | | | 1,166,199 | |
| | | | Independencia International, Ltd. | | | | |
| | 95,246 | | | 12.000%, 12/30/2016d,i,k | | | 0 | |
| | | | Marfrig Holdings Europe BV | | | | |
| | 200,000 | | | 11.250%, 9/20/2021e | | | 198,750 | |
| | | | | |
| | | | Total | | | 4,051,232 | |
| | | | | |
| |
| Canada (0.1%) | | | | |
| | | | PTTEP Canada International Finance, Ltd. | | | | |
| | 200,000 | | | 5.692%, 4/5/2021e | | | 219,329 | |
| | 200,000 | | | 5.692%, 4/5/2021 | | | 219,330 | |
| | | | | |
| | | | Total | | | 438,659 | |
| | | | | |
| |
| Cayman Islands (0.1%) | | | | |
| | | | Cementos Progreso Trust | | | | |
| | 200,000 | | | 7.125%, 11/6/2023c,d,i | | | 196,506 | |
| | | | Dubai Holding Commercial Operations MTN, Ltd. | | | | |
| | 100,000 | | | 4.750%, 1/30/2014f | | | 135,775 | |
| | 50,000 | | | 6.000%, 2/1/2017l | | | 82,576 | |
| | | | Raizen Fuels Finance, Ltd. | | | | |
| | 330,000 | | | 9.500%, 8/15/2014 | | | 348,150 | |
| | | | Sun Hung Kai Properties Capital Market, Ltd. | | | | |
| | 220,000 | | | 4.500%, 2/14/2022 | | | 223,740 | |
| | | | | |
| | | | Total | | | 986,747 | |
| | | | | |
| |
| Chile (0.3%) | | | | |
| | | | AES Gener SA | | | | |
| | 280,000 | | | 5.250%, 8/15/2021 | | | 284,023 | |
| | 70,000 | | | 5.250%, 8/15/2021e | | | 71,006 | |
| | | | Automotores Gildemeister SA | | | | |
| | 100,000 | | | 8.250%, 5/24/2021 | | | 91,500 | |
| | | | Banco de Credito e Inversiones | | | | |
| | 380,000 | | | 3.000%, 9/13/2017e | | | 377,650 | |
| | | | Banco del Estado de Chile | | | | |
| | 100,000 | | | 4.125%, 10/7/2020e | | | 102,675 | |
| | 290,000 | | | 4.125%, 10/7/2020 | | | 297,757 | |
| | | | Chile Government International Bond | | | | |
| | 380,000 | | | 3.250%, 9/14/2021 | | | 385,225 | |
| | 450,000 | | | 3.625%, 10/30/2042 | | | 379,125 | |
| | | | E-CL SA | | | | |
| | 120,000 | | | 5.625%, 1/15/2021e | | | 125,780 | |
| | | | Empresa Nacional de Telecomunicaciones SA | | | | |
| | 540,000 | | | 4.875%, 10/30/2024e | | | 540,073 | |
| | | | Sociedad Quimica y Minera de Chile SA | | | | |
| | 200,000 | | | 3.625%, 4/3/2023 | | | 172,951 | |
| | | | | |
| | | | Total | | | 2,827,765 | |
| | | | | |
| |
| China (0.2%) | | | | |
| | | | CNOOC Curtis Funding | | | | |
| | 720,000 | | | 4.500%, 10/3/2023e | | | 736,560 | |
| | | | Evergrande Real Estate Group, Ltd. | | | | |
| | 200,000 | | | 8.750%, 10/30/2018e | | | 202,240 | |
| | | | Sinopec Group Overseas Development 2013, Ltd. | | | | |
| | 810,000 | | | 4.375%, 10/17/2023e | | | 812,690 | |
The accompanying Notes to Financial Statements are an integral part of this schedule.
181
Partner Worldwide Allocation Fund
Schedule of Investments as of October 31, 2013
| | | | | | | | |
Principal
Amount | | | Long-Term Fixed Income (8.4%) | | Value | |
| China (0.2%) - continued | |
| | | | Sparkle Assets, Ltd. | | | | |
| | $200,000 | | | 6.875%, 1/30/2020 | | | $190,327 | |
| | | | | |
| | | | Total | | | 1,941,817 | |
| | | | | |
| |
| Colombia (0.6%) | | | | |
| | | | Banco de Bogota SA | | | | |
| | 400,000 | | | 5.000%, 1/15/2017 | | | 421,400 | |
| | | | Bancolombia SA | | | | |
| | 130,000 | | | 6.125%, 7/26/2020 | | | 137,150 | |
| | 100,000 | | | 5.950%, 6/3/2021 | | | 105,600 | |
| | | | Colombia Government International Bond | | | | |
| | 20,000 | | | 8.250%, 12/22/2014 | | | 21,550 | |
| | 450,000 | | | 7.375%, 1/27/2017 | | | 525,825 | |
| | 540,000 | | | 7.375%, 3/18/2019 | | | 660,149 | |
| | 290,000 | | | 2.625%, 3/15/2023 | | | 262,305 | |
| | 250,000 | | | 4.000%, 2/26/2024 | | | 249,375 | |
| | 400,000 | | | 7.375%, 9/18/2037 | | | 516,000 | |
| | 520,000 | | | 6.125%, 1/18/2041 | | | 588,900 | |
| | | | Ecopetrol SA | | | | |
| | 100,000 | | | 5.875%, 9/18/2023 | | | 108,550 | |
| | 70,000 | | | 7.375%, 9/18/2043 | | | 80,238 | |
| | | | Empresa de Energia de Bogota SA | | | | |
| | 320,000 | | | 6.125%, 11/10/2021e | | | 336,000 | |
| | | | Empresas Publicas de Medellin ESP | | | | |
| | 100,000 | | | 7.625%, 7/29/2019 | | | 119,000 | |
| | | | Pacific Rubiales Energy Corporation | | | | |
| | 230,000 | | | 5.125%, 3/28/2023e | | | 220,225 | |
| | | | Transportadora de Gas del Internacional SA ESP | | | | |
| | 200,000 | | | 5.700%, 3/20/2022e | | | 208,500 | |
| | | | | |
| | | | Total | | | 4,560,767 | |
| | | | | |
| |
| Costa Rica (0.4%) | | | | |
| | | | Banco de Costa Rica | | | | |
| | 220,000 | | | 5.250%, 8/12/2018e | | | 222,200 | |
| | | | Banco Nacional de Costa Rica | | | | |
| | 220,000 | | | 4.875%, 11/1/2018c,e | | | 218,350 | |
| | 480,000 | | | 6.250%, 11/1/2023c,e | | | 477,600 | |
| | | | Costa Rica Government International Bond | | | | |
| | 30,000 | | | 9.995%, 8/1/2020 | | | 39,000 | |
| | 510,000 | | | 4.250%, 1/26/2023e | | | 484,500 | |
| | 210,000 | | | 4.250%, 1/26/2023 | | | 199,500 | |
| | 410,000 | | | 4.375%, 4/30/2025 | | | 377,200 | |
| | 400,000 | | | 5.625%, 4/30/2043 | | | 355,000 | |
| | 410,000 | | | 5.625%, 4/30/2043e | | | 363,875 | |
| | | | | |
| | | | Total | | | 2,737,225 | |
| | | | | |
| |
| Croatia (0.1%) | | | | |
| | | | Croatia Government International Bond | | | | |
| | 430,000 | | | 6.375%, 3/24/2021 | | | 456,338 | |
| | 210,000 | | | 5.500%, 4/4/2023 | | | 208,425 | |
| | | | | |
| | | | Total | | | 664,763 | |
| | | | | |
| |
| Dominican Republic (0.3%) | | | | |
| | | | Dominican Republic Government International Bond | | | | |
| | 118,041 | | | 9.040%, 1/23/2018 | | | 129,669 | |
| | 840,000 | | | 7.500%, 5/6/2021 | | | 929,460 | |
| | 1,400,000 | | | 14.500%, 2/10/2023m | | | 33,130 | |
| | 580,000 | | | 6.600%, 1/28/2024e | | | 599,720 | |
| | 110,000 | | | 5.875%, 4/18/2024 | | | 108,185 | |
| | 410,000 | | | 5.875%, 4/18/2024e | | | 403,235 | |
| | 290,000 | | | 8.625%, 4/20/2027 | | | 325,235 | |
| | 9,200,000 | | | 18.500%, 2/4/2028i,m | | | 249,427 | |
| | 400,000 | | | 18.500%, 2/4/2028m | | | 10,845 | |
| | | | | |
| | | | Total | | | 2,788,906 | |
| | | | | |
| |
| Egypt (<0.1%) | | | | |
| | | | Egypt Government International Bond | | | | |
| | 450,000 | | | 5.750%, 4/29/2020 | | | 414,000 | |
| | | | | |
| | | | Total | | | 414,000 | |
| | | | | |
| |
| Gabon (0.1%) | | | | |
| | | | Gabon Government International Bond | | | | |
| | 425,000 | | | 8.200%, 12/12/2017 | | | 494,063 | |
| | | | | |
| | | | Total | | | 494,063 | |
| | | | | |
| |
| Ghana (<0.1%) | | | | |
| | | | Ghana Government International Bond | | | | |
| | 190,000 | | | 8.500%, 10/4/2017 | | | 207,575 | |
| | | | | |
| | | | Total | | | 207,575 | |
| | | | | |
| |
| Guatemala (<0.1%) | | | | |
| | | | Guatemala Government International Bond | | | | |
| | 190,000 | | | 5.750%, 6/6/2022e | | | 201,590 | |
| | 210,000 | | | 4.875%, 2/13/2028e | | | 197,820 | |
| | | | | |
| | | | Total | | | 399,410 | |
| | | | | |
| |
| Honduras (0.1%) | | | | |
| | | | Honduras Government International Bond | | | | |
| | 570,000 | | | 7.500%, 3/15/2024e | | | 507,300 | |
| | | | | |
| | | | Total | | | 507,300 | |
| | | | | |
| |
| Hong Kong (<0.1%) | | | | |
| | | | Metropolitan Light International, Ltd. | | | | |
| | 200,000 | | | 5.250%, 1/17/2018 | | | 199,760 | |
| | | | | |
| | | | Total | | | 199,760 | |
| | | | | |
| |
| Hungary (<0.1%) | | | | |
| | | | Hungary Government International Bond | | | | |
| | 190,000 | | | 4.375%, 7/4/2017f | | | 263,105 | |
| | | | | |
| | | | Total | | | 263,105 | |
| | | | | |
| |
| Indonesia (0.6%) | | | | |
| | | | Indonesia Government International Bond | | | | |
| | 100,000 | | | 6.750%, 3/10/2014 | | | 101,250 | |
| | 1,700,000 | | | 11.625%, 3/4/2019 | | | 2,324,749 | |
| | 590,000 | | | 8.500%, 10/12/2035 | | | 764,050 | |
| | 280,000 | | | 6.625%, 2/17/2037 | | | 305,200 | |
| | 260,000 | | | 7.750%, 1/17/2038 | | | 316,875 | |
| | | | PT Pertamina Persero | | | | |
| | 570,000 | | | 5.625%, 5/20/2043e | | | 478,800 | |
| | | | | |
| | | | Total | | | 4,290,924 | |
| | | | | |
The accompanying Notes to Financial Statements are an integral part of this schedule.
182
Partner Worldwide Allocation Fund
Schedule of Investments as of October 31, 2013
| | | | | | | | |
Principal
Amount | | | Long-Term Fixed Income (8.4%) | | Value | |
| Iraq (0.1%) | | | | |
| | | | Iraq Government International Bond | | | | |
| | $500,000 | | | 5.800%, 1/15/2028 | | | $435,000 | |
| | | | | |
| | | | Total | | | 435,000 | |
| | | | | |
| |
| Ireland (0.1%) | | | | |
| | | | MTS International Funding, Ltd. | | | | |
| | 320,000 | | | 8.625%, 6/22/2020 | | | 385,600 | |
| | | | Sibur Securities, Ltd. | | | | |
| | 280,000 | | | 3.914%, 1/31/2018e | | | 273,700 | |
| | | | Vimpel Communications Via VIP Finance Ireland, Ltd. OJSC | | | | |
| | 170,000 | | | 9.125%, 4/30/2018 | | | 198,475 | |
| | | | | |
| | | | Total | | | 857,775 | |
| | | | | |
| |
| Ivory Coast (0.1%) | | | | |
| | | | Ivory Coast Government International Bond | | | | |
| | 1,328,000 | | | 7.100%, 12/31/2032h | | | 1,195,466 | |
| | | | | |
| | | | Total | | | 1,195,466 | |
| | | | | |
| |
| Kazakhstan (0.2%) | | | | |
| | | | Kazatomprom Natsionalnaya Atomnaya Kompaniya AO | | | | |
| | 100,000 | | | 6.250%, 5/20/2015 | | | 105,500 | |
| | | | KazMunayGas National Company | | | | |
| | 240,000 | | | 11.750%, 1/23/2015 | | | 268,200 | |
| | 200,000 | | | 6.375%, 4/9/2021e | | | 221,750 | |
| | 1,240,000 | | | 5.750%, 4/30/2043i | | | 1,125,176 | |
| | | | | |
| | | | Total | | | 1,720,626 | |
| | | | | |
| |
| Luxembourg (0.2%) | | | | |
| | | | Millicom International Cellular SA | | | | |
| | 390,000 | | | 4.750%, 5/22/2020e | | | 365,625 | |
| | | | Telefonica Celular del Paraguay SA | | | | |
| | 200,000 | | | 6.750%, 12/13/2022 | | | 202,000 | |
| | | | TNK-BP Finance SA | | | | |
| | 490,000 | | | 7.875%, 3/13/2018 | | | 569,012 | |
| | 223,000 | | | 7.250%, 2/2/2020 | | | 254,778 | |
| | | | Wind Acquisition Holdings Finance SA | | | | |
| | 80,000 | | | 12.250%, 7/15/2017f | | | 109,707 | |
| | | | | |
| | | | Total | | | 1,501,122 | |
| | | | | |
| |
| Malaysia (<0.1%) | | | | |
| | | | Wakala Global Sukuk Bhd | | | | |
| | 360,000 | | | 4.646%, 7/6/2021 | | | 380,736 | |
| | | | | |
| | | | Total | | | 380,736 | |
| | | | | |
| |
| Mexico (0.6%) | | | | |
| | | | Grupo KUO SAB de CV | | | | |
| | 200,000 | | | 6.250%, 12/4/2022e | | | 203,000 | |
| | | | Metalsa SA de CV | | | | |
| | 190,000 | | | 4.900%, 4/24/2023e | | | 178,600 | |
| | | | Mexican Bonos | | | | |
| | 1,167,800 | | | 6.500%, 6/10/2021n | | | 93,749 | |
| | 233,500 | | | 8.000%, 12/7/2023n | | | 20,442 | |
| | 4,492,600 | | | 7.500%, 6/3/2027n | | | 376,022 | |
| | 733,900 | | | 8.500%, 5/31/2029n | | | 65,221 | |
| | 59,600 | | | 10.000%, 11/20/2036n | | | 5,915 | |
| | 113,200 | | | 8.500%, 11/18/2038n | | | 9,810 | |
| | | | Mexico Government International Bond | | | | |
| | 540,000 | | | 5.875%, 1/15/2014 | | | 545,400 | |
| | 10,000 | | | 6.625%, 3/3/2015 | | | 10,775 | |
| | 146,000 | | | 3.625%, 3/15/2022 | | | 148,190 | |
| | 160,000 | | | 4.000%, 10/2/2023 | | | 162,480 | |
| | 190,000 | | | 6.750%, 9/27/2034 | | | 232,750 | |
| | 436,000 | | | 6.050%, 1/11/2040 | | | 493,770 | |
| | 1,160,000 | | | 4.750%, 3/8/2044 | | | 1,087,499 | |
| | 60,000 | | | 5.750%, 10/12/2110 | | | 58,050 | |
| | | | Offshore Drilling Holding SA | | | | |
| | 250,000 | | | 8.375%, 9/20/2020e | | | 265,625 | |
| | | | Pemex Project Funding Master Trust | | | | |
| | 280,000 | | | 6.625%, 6/15/2035 | | | 303,800 | |
| | | | Petroleos Mexicanos | | | | |
| | 200,000 | | | 5.500%, 1/21/2021 | | | 218,000 | |
| | 430,000 | | | 4.875%, 1/18/2024 | | | 438,600 | |
| | 47,000 | | | 6.500%, 6/2/2041 | | | 50,055 | |
| | | | | |
| | | | Total | | | 4,967,753 | |
| | | | | |
| |
| Netherlands (<0.1%) | | | | |
| | | | Ajecorp BV | | | | |
| | 150,000 | | | 6.500%, 5/14/2022 | | | 151,500 | |
| | | | Listrindo Capital BV | | | | |
| | 200,000 | | | 6.950%, 2/21/2019 | | | 209,000 | |
| | | | VimpelCom Holdings BV | | | | |
| | 200,000 | | | 7.504%, 3/1/2022e | | | 214,500 | |
| | | | | |
| | | | Total | | | 575,000 | |
| | | | | |
| |
| Nigeria (0.1%) | | | | |
| | | | Nigeria Government International Bond | | | | |
| | 460,000 | | | 6.750%, 1/28/2021 | | | 507,150 | |
| | 200,000 | | | 6.375%, 7/12/2023 | | | 211,500 | |
| | 390,000 | | | 6.375%, 7/12/2023e | | | 412,425 | |
| | | | | |
| | | | Total | | | 1,131,075 | |
| | | | | |
| |
| Pakistan (<0.1%) | | | | |
| | | | Pakistan Government International Bond | | | | |
| | 100,000 | | | 6.875%, 6/1/2017 | | | 98,250 | |
| | 120,000 | | | 7.875%, 3/31/2036 | | | 99,600 | |
| | | | | |
| | | | Total | | | 197,850 | |
| | | | | |
| |
| Panama (0.2%) | | | | |
| | | | Panama Government International Bond | | | | |
| | 527,000 | | | 8.875%, 9/30/2027 | | | 730,554 | |
| | 230,000 | | | 9.375%, 4/1/2029 | | | 332,350 | |
| | 470,000 | | | 6.700%, 1/26/2036 | | | 555,775 | |
| | | | | |
| | | | Total | | | 1,618,679 | |
| | | | | |
| |
| Paraguay (0.1%) | | | | |
| | | | Banco Continental SAECA | | | | |
| | 150,000 | | | 8.875%, 10/15/2017e | | | 159,750 | |
| | | | Paraguay Government International Bond | | | | |
| | 210,000 | | | 4.625%, 1/25/2023 | | | 198,450 | |
| | 300,000 | | | 4.625%, 1/25/2023e | | | 283,500 | |
| | | | | |
| | | | Total | | | 641,700 | |
| | | | | |
The accompanying Notes to Financial Statements are an integral part of this schedule.
183
Partner Worldwide Allocation Fund
Schedule of Investments as of October 31, 2013
| | | | | | | | |
Principal
Amount | | | Long-Term Fixed Income (8.4%) | | Value | |
| Peru (0.3%) | | | | |
| | | | Ajecorp BV | | | | |
| | $150,000 | | | 6.500%, 5/14/2022e | | | $151,500 | |
| | | | Banco de Credito del Peru | | | | |
| | 160,000 | | | 6.125%, 4/24/2027e | | | 167,200 | |
| | | | Corporacion Financiera de Desarrollo SA | | | | |
| | 200,000 | | | 4.750%, 2/8/2022e | | | 201,000 | |
| | | | Corporacion Lindley SA | | | | |
| | 40,000 | | | 6.750%, 11/23/2021 | | | 43,500 | |
| | 90,000 | | | 6.750%, 11/23/2021e | | | 97,875 | |
| | 80,000 | | | 4.625%, 4/12/2023e | | | 76,400 | |
| | | | Peru Government International Bond | | | | |
| | 380,000 | | | 5.625%, 11/18/2050 | | | 399,380 | |
| | 260,000 | | | 7.350%, 7/21/2025 | | | 335,140 | |
| | 445,000 | | | 8.750%, 11/21/2033 | | | 648,810 | |
| | 40,000 | | | 6.550%, 3/14/2037 | | | 47,660 | |
| | | | San Miguel Industrias Pet SA | | | | |
| | 150,000 | | | 7.750%, 11/6/2020c,d,i | | | 150,000 | |
| | | | | |
| | | | Total | | | 2,318,465 | |
| | | | | |
| |
| Philippines (0.1%) | | | | |
| | | | Energy Development Corporation | | | | |
| | 200,000 | | | 6.500%, 1/20/2021 | | | 210,000 | |
| | | | Philippines Government International Bond | | | | |
| | 470,000 | | | 7.500%, 9/25/2024 | | | 601,600 | |
| | | | | |
| | | | Total | | | 811,600 | |
| | | | | |
| |
| Romania (<0.1%) | | | | |
| | | | Cable Communications Systems NV | | | | |
| | 100,000 | | | 7.500%, 11/1/2020c,e,f | | | 139,333 | |
| | | | Romania Government International Bond | | | | |
| | 27,000 | | | 6.500%, 6/18/2018f | | | 41,462 | |
| | 70,000 | | | 6.750%, 2/7/2022 | | | 80,850 | |
| | 160,000 | | | 6.750%, 2/7/2022e | | | 184,800 | |
| | | | | |
| | | | Total | | | 446,445 | |
| | | | | |
| |
| Russia (0.7%) | | | | |
| | | | AHML Finance, Ltd. | | | | |
| | 5,700,000 | | | 7.750%, 2/13/2018e,o | | | 174,304 | |
| | | | EDC Finance, Ltd. | | | | |
| | 200,000 | | | 4.875%, 4/17/2020e | | | 198,500 | |
| | | | Gazprom Neft Capital SA | | | | |
| | 230,000 | | | 4.375%, 9/19/2022e | | | 216,488 | |
| | | | Lukoil International Finance BV | | | | |
| | 200,000 | | | 4.563%, 4/24/2023e | | | 191,250 | |
| | | | Phosagro OAO Via Phosagro Bond Funding, Ltd. | | | | |
| | 200,000 | | | 4.204%, 2/13/2018e | | | 200,500 | |
| | | | Rosneft Oil Company via Rosneft International Finance, Ltd. | | | | |
| | 280,000 | | | 4.199%, 3/6/2022e | | | 262,499 | |
| | | | Russian Government International Bond | | | | |
| | 1,000,000 | | | 3.500%, 1/16/2019e | | | 1,026,460 | |
| | 100,000 | | | 5.000%, 4/29/2020 | | | 109,000 | |
| | 1,200,000 | | | 4.500%, 4/4/2022e | | | 1,246,499 | |
| | 2,070,000 | | | 7.000%, 8/16/2023c,o | | | 63,803 | |
| | 600,000 | | | 4.875%, 9/16/2023e | | | 629,400 | |
| | 575,575 | | | 7.500%, 3/31/2030 | | | 684,963 | |
| | 200,000 | | | 5.875%, 9/16/2043e | | | 212,500 | |
| | | | Uralkali OJSC | | | | |
| | 270,000 | | | 3.723%, 4/30/2018e | | | 259,875 | |
| | | | | |
| | | | Total | | | 5,476,041 | |
| | | | | |
| |
| Slovenia (0.2%) | | | | |
| | | | Slovenia Government International Bond | | | | |
| | 480,000 | | | 5.500%, 10/26/2022 | | | 459,000 | |
| | 1,230,000 | | | 5.500%, 10/26/2022e | | | 1,176,188 | |
| | 210,000 | | | 5.850%, 5/10/2023e | | | 204,750 | |
| | | | | |
| | | | Total | | | 1,839,938 | |
| | | | | |
| |
| South Africa (0.1%) | | | | |
| | | | Peermont Global Proprietary, Ltd. | | | | |
| | 140,000 | | | 7.750%, 4/30/2014f | | | 189,135 | |
| | | | South Africa Government International Bond | | | | |
| | 1,010,000 | | | 5.875%, 9/16/2025 | | | 1,077,115 | |
| | | | | |
| | | | Total | | | 1,266,250 | |
| | | | | |
| |
| Spain (<0.1%) | | | | |
| | | | BC Luxco 1 SA | | | | |
| | 150,000 | | | 7.375%, 1/29/2020 | | | 144,000 | |
| | | | | |
| | | | Total | | | 144,000 | |
| | | | | |
| |
| Sri Lanka (0.1%) | | | | |
| | | | National Savings Bank | | | | |
| | 240,000 | | | 8.875%, 9/18/2018e | | | 253,800 | |
| | | | Sri Lanka Government Internation Bond | | | | |
| | 100,000 | | | 6.250%, 10/4/2020 | | | 101,375 | |
| | 210,000 | | | 6.250%, 7/27/2021 | | | 211,050 | |
| | | | | |
| | | | Total | | | 566,225 | |
| | | | | |
| |
| Supranational (0.1%) | | | | |
| | | | Corporacion Andina de Fomento | | | | |
| | 599,000 | | | 3.750%, 1/15/2016 | | | 626,689 | |
| | 424,000 | | | 4.375%, 6/15/2022 | | | 429,810 | |
| | | | | |
| | | | Total | | | 1,056,499 | |
| | | | | |
| |
| Turkey (0.2%) | | | | |
| | | | Coca-Cola Icecek AS | | | | |
| | 200,000 | | | 4.750%, 10/1/2018e | | | 207,680 | |
| | | | Export Credit Bank of Turkey | | | | |
| | 200,000 | | | 5.875%, 4/24/2019 | | | 209,700 | |
| | | | Hazine Mustesarligi Varlik Kiralama AS | | | | |
| | 400,000 | | | 2.803%, 3/26/2018 | | | 382,500 | |
| | 200,000 | | | 4.557%, 10/10/2018e | | | 203,940 | |
| | | | Turkey Government International Bond | | | | |
| | 230,000 | | | 5.625%, 3/30/2021 | | | 245,525 | |
| | 200,000 | | | 6.250%, 9/26/2022 | | | 220,500 | |
| | 100,000 | | | 7.375%, 2/5/2025 | | | 117,000 | |
| | 50,000 | | | 8.000%, 2/14/2034 | | | 61,830 | |
| | 80,000 | | | 6.875%, 3/17/2036 | | | 88,400 | |
| | 180,000 | | | 7.250%, 3/5/2038 | | | 207,000 | |
| | 260,000 | | | 6.000%, 1/14/2041 | | | 261,300 | |
| | | | Turkiye Vakiflar Bankasi Tao | | | | |
| | 260,000 | | | 3.750%, 4/15/2018e | | | 247,650 | |
| | | | | |
| | | | Total | | | 2,453,025 | |
| | | | | |
The accompanying Notes to Financial Statements are an integral part of this schedule.
184
Partner Worldwide Allocation Fund
Schedule of Investments as of October 31, 2013
| | | | | | | | |
Principal
Amount | | | Long-Term Fixed Income (8.4%) | | Value | |
| Ukraine (0.3%) | | | | |
| | | | State Export-Import Bank of Ukraine JSC Via Biz Finance plc | | | | |
| | $200,000 | | | 8.750%, 1/22/2018 | | | $167,500 | |
| | | | Ukraine Government International Bond | | | | |
| | 680,000 | | | 9.250%, 7/24/2017 | | | 650,250 | |
| | 240,000 | | | 8.375%, 11/3/2017 | | | 210,000 | |
| | 260,000 | | | 9.000%, 12/7/2017e | | | 233,675 | |
| | 380,000 | | | 7.750%, 9/23/2020 | | | 343,900 | |
| | 270,000 | | | 7.950%, 2/23/2021e | | | 244,688 | |
| | 400,000 | | | 7.800%, 11/28/2022 | | | 348,000 | |
| | | | Ukreximbank Via Biz Finance plc | | | | |
| | 160,000 | | | 8.375%, 4/27/2015 | | | 147,200 | |
| | | | | |
| | | | Total | | | 2,345,213 | |
| | | | | |
| |
| United Arab Emirates (0.2%) | | | | |
| | | | ADCB Finance Cayman, Ltd. | | | | |
| | 300,000 | | | 4.500%, 3/6/2023 | | | 294,750 | |
| | | | Dolphin Energy, Ltd. | | | | |
| | 170,712 | | | 5.888%, 6/15/2019 | | | 188,295 | |
| | 210,000 | | | 5.500%, 12/15/2021 | | | 232,838 | |
| | | | Ruwais Power Company | | | | |
| | 360,000 | | | 6.000%, 8/31/2036e | | | 380,284 | |
| | | | | |
| | | | Total | | | 1,096,167 | |
| | | | | |
| |
| United States (0.1%) | | | | |
| | | | HSBC Bank USA NA/New York | | | | |
| | 600,000 | | | 17.276%, 8/15/2040d,p | | | 647,975 | |
| | | | HSBC USA, Inc. | | | | |
| | 901,000 | | | 10.000%, 1/5/2017d,q | | | 400,632 | |
| | | | U.S. Treasury Bonds | | | | |
| | 200,000 | | | 3.625%, 8/15/2043 | | | 199,750 | |
| | | | | |
| | | | Total | | | 1,248,357 | |
| | | | | |
| |
| Uruguay (0.2%) | | | | |
| | | | Uruguay Government International Bond | | | | |
| | 683,764 | | | 4.500%, 8/14/2024 | | | 705,986 | |
| | 707,000 | | | 7.625%, 3/21/2036 | | | 906,728 | |
| | | | | |
| | | | Total | | | 1,612,714 | |
| | | | | |
| |
| Venezuela (0.3%) | | | | |
| | | | Petroleos de Venezuela SA | | | | |
| | 718,400 | | | 5.250%, 4/12/2017 | | | 576,516 | |
| | 370,000 | | | 9.000%, 11/17/2021 | | | 303,400 | |
| | 270,000 | | | 5.375%, 4/12/2027 | | | 166,050 | |
| | 10,000 | | | 5.500%, 4/12/2037 | | | 5,875 | |
| | | | Venezuela Government International Bond | | | | |
| | 50,000 | | | 13.625%, 8/15/2018 | | | 51,625 | |
| | 170,000 | | | 6.000%, 12/9/2020 | | | 124,100 | |
| | 580,000 | | | 9.000%, 5/7/2023 | | | 471,250 | |
| | 190,000 | | | 8.250%, 10/13/2024 | | | 144,875 | |
| | 100,000 | | | 7.650%, 4/21/2025 | | | 73,150 | |
| | 1,030,000 | | | 11.950%, 8/5/2031 | | | 952,749 | |
| | | | | |
| | | | Total | | | 2,869,590 | |
| | | | | |
| |
| Vietnam (<0.1%) | | | | |
| | | | Vietnam Government International Bond | | | | |
| | 220,000 | | | 6.875%, 1/15/2016 | | | 237,600 | |
| | | | | |
| | | | Total | | | 237,600 | |
| | | | | |
| |
| Virgin Islands, British (<0.1%) | | | | |
| | | | Central American Bottling Corporation | | | | |
| | 20,000 | | | 6.750%, 2/9/2022 | | | 20,600 | |
| | 150,000 | | | 6.750%, 2/9/2022e | | | 154,500 | |
| | | | | |
| | | | Total | | | 175,100 | |
| | | | | |
| |
| Zambia (0.1%) | | | | |
| | | | Zambia Government International Bond | | | | |
| | 210,000 | | | 5.375%, 9/20/2022e | | | 189,525 | |
| | 600,000 | | | 5.375%, 9/20/2022 | | | 541,500 | |
| | | | | |
| | | | Total | | | 731,025 | |
| | | | | |
| | | | | | | | |
| | | | | |
| | | | Total Long-Term Fixed Income (cost $73,244,184) | | | 72,115,756 | |
| | | | | |
| | |
| Shares | | | Preferred Stock (0.4%) | | Value | |
| Brazil (0.4%) | | | | |
| | 159,000 | | | Petroleo Brasileiro SA ADR | | | 2,887,440 | |
| | 24,800 | | | Vale SA | | | 363,553 | |
| | | | | |
| | | | Total | | | 3,250,993 | |
| | | | | |
| | | | | | | | |
| | | | | |
| | | | Total Preferred Stock (cost $4,412,799) | | | 3,250,993 | |
| | | | | |
| | |
| Shares | | | Collateral Held for Securities Loaned (1.6%) | | Value | |
| | 13,655,850 | | | Thrivent Cash Management Trust | | | 13,655,850 | |
| | | | | |
| | | | Total Collateral Held for Securities Loaned (cost $13,655,850) | | | 13,655,850 | |
| | | | | |
| | |
Shares or
Principal
Amount | | | Short-Term Investments (1.6%) | | Value | |
| | | | Federal Home Loan Bank Discount Notes | | | | |
| | 200,000 | | | 0.093%, 11/22/2013r,s | | | 199,989 | |
| | 100,000 | | | 0.110%, 12/4/2013r,s | | | 99,990 | |
| | | | Thrivent Cash Management Trust | | | | |
| | 13,243,347 | | | 0.070% | | | 13,243,347 | |
| | | | | |
| | | | Total Short-Term Investments (at amortized cost) | | | 13,543,326 | |
| | | | | |
| | | | Total Investments (cost $751,020,766) 101.1% | | $ | 862,831,198 | |
| | | | | |
| | | | Other Assets and Liabilities, Net (1.1%) | | | (9,695,958 | ) |
| | | | | |
| | | | Total Net Assets 100.0% | | $ | 853,135,240 | |
| | | | | |
a | Non-income producing security. |
b | All or a portion of the security is on loan. |
c | Denotes investments purchased on a when-issued or delayed delivery basis. |
d | Security is fair valued. |
The accompanying Notes to Financial Statements are an integral part of this schedule.
185
Partner Worldwide Allocation Fund
Schedule of Investments as of October 31, 2013
e | Denotes securities sold under Rule 144A of the Securities Act of 1933, which exempts them from registration. These securities have been deemed liquid and may be resold to other dealers in the program or to other qualified institutional buyers. As of October 31, 2013, the value of these investments was $22,902,939 or 2.7% of total net assets. |
f | Principal amount is displayed in Euros. |
g | Denotes variable rate securities. Variable rate securities are securities whose yields vary with a designated market index or market rate. The rate shown is as of October 31, 2013. |
h | Denotes step coupon securities. Step coupon securities pay an initial coupon rate for the first period and then different coupon rates for following periods. The rate shown is as of October 31, 2013. |
i | Denotes restricted securities. Restricted securities are investment securities which have been deemed illiquid and cannot be offered for public sale without first being registered under the Securities Act of 1933. The following table indicates the acquisition date and cost of restricted securities Partner Worldwide Allocation Fund owned as of October 31, 2013. |
| | | | | | | | |
Security | | Acquisition
Date | | | Cost | |
Belize Government International Bond | | | 3/20/2013 | | | | $99,244 | |
Cementos Progreso Trust | | | 10/30/2013 | | | | $196,506 | |
Dominican Republic Government International Bond | | | 3/7/2013 | | | | $265,794 | |
Independencia International, Ltd. | | | 3/29/2010 | | | | $100,627 | |
KazMunayGas National Company | | | 4/24/2013 | | | | $1,234,615 | |
San Miguel Industrias Pet SA | | | 10/30/2013 | | | | $150,000 | |
j | Principal amount is displayed in Brazilian Real. |
k | Defaulted security. Interest is not being accrued. |
l | Principal amount is displayed in British Pounds. |
m | Principal amount is displayed in Dominican Republic Pesos. |
n | Principal amount is displayed in Mexican Pesos. |
o | Principal amount is displayed in Russian Rubles. |
p | Principal amount is displayed in Brazilian Real. Security is linked to Brazilian Government Bonds due August 15, 2040. |
q | Principal amount is displayed in Brazilian Real. Security is linked to Brazilian Government Bonds due January 1, 2017. |
r | The interest rate shown reflects the yield, coupon rate or the discount rate at the date of purchase. |
s | At October 31, 2013, $299,979 of investments were held on deposit with the counterparty and pledged as the initial margin deposit for open futures contracts. |
Definitions:
| | | | |
ADR | | - | | American Depositary Receipt, which are certificates for an underlying foreign security’s shares held by an issuing U.S. depository bank. |
GDR | | - | | Global Depository Receipts, which are certificates for shares of an underlying foreign security’s shares held by an issuing depository bank from more than one country. |
REIT | | | | Real Estate Investment Trust is a company that buys, develops, manages and/or sells real estate assets. |
Unrealized Appreciation (Depreciation)
Gross unrealized appreciation and depreciation of investments, based on cost for federal income tax purposes, were as follows:
| | | | |
Gross unrealized appreciation | | $ | 131,225,359 | |
Gross unrealized depreciation | | | (21,486,710 | ) |
| | | | |
Net unrealized appreciation (depreciation) | | $ | 109,738,649 | |
| |
Cost for federal income tax purposes | | $ | 753,092,549 | |
The accompanying Notes to Financial Statements are an integral part of this schedule.
186
Partner Worldwide Allocation Fund
Schedule of Investments as of October 31, 2013
Fair Valuation Measurements
The following table is a summary of the inputs used, as of October 31, 2013, in valuing Partner Worldwide Allocation Fund’s assets carried at fair value.
| | | | | | | | | | | | | | | | |
Investments in Securities | | Total | | | Level 1 | | | Level 2 | | | Level 3 | |
| | | | |
Common Stock | | | | | | | | | | | | | | | | |
Communications Services | | | 1,249,860 | | | | – | | | | 1,249,860 | | | | – | |
Consumer Discretionary | | | 119,758,299 | | | | 987,252 | | | | 118,771,047 | | | | – | |
Consumer Staples | | | 68,412,064 | | | | 2,612,400 | | | | 64,507,299 | | | | 1,292,365 | |
Energy | | | 58,315,802 | | | | 10,443,583 | | | | 47,872,219 | | | | – | |
Financials | | | 181,149,642 | | | | 11,069,651 | | | | 170,079,991 | | | | – | |
Health Care | | | 47,042,114 | | | | – | | | | 47,042,114 | | | | – | |
Industrials^ | | | 145,483,716 | | | | 2,846,014 | | | | 142,637,702 | | | | 0 | |
Information Technology | | | 46,450,707 | | | | 67,333 | | | | 46,383,374 | | | | – | |
Materials | | | 62,782,094 | | | | 4,121,792 | | | | 58,660,302 | | | | – | |
Telecommunications Services | | | 27,136,327 | | | | 4,391,124 | | | | 22,745,203 | | | | – | |
Utilities | | | 2,484,648 | | | | – | | | | 2,484,648 | | | | – | |
| | | | |
Long-Term Fixed Income | | | | | | | | | | | | | | | | |
Basic Materials | | | 633,326 | | | | – | | | | 633,326 | | | | – | |
Capital Goods | | | 743,087 | | | | – | | | | 743,087 | | | | – | |
Communications Services | | | 2,155,313 | | | | – | | | | 2,155,313 | | | | – | |
Consumer Cyclical | | | 799,613 | | | | – | | | | 799,613 | | | | – | |
Consumer Non-Cyclical^ | | | 1,450,455 | | | | – | | | | 1,450,455 | | | | 0 | |
Energy | | | 9,147,405 | | | | – | | | | 9,147,405 | | | | – | |
Financials | | | 6,788,508 | | | | – | | | | 5,739,901 | | | | 1,048,607 | |
Foreign Government | | | 47,876,782 | | | | – | | | | 47,583,380 | | | | 293,402 | |
U.S. Government and Agencies | | | 638,350 | | | | – | | | | 638,350 | | | | – | |
Utilities | | �� | 1,882,917 | | | | – | | | | 1,882,917 | | | | – | |
| | | | |
Preferred Stock | | | | | | | | | | | | | | | | |
Energy | | | 2,887,440 | | | | 2,887,440 | | | | – | | | | – | |
Materials | | | 363,553 | | | | – | | | | 363,553 | | | | – | |
Collateral Held for Securities Loaned | | | 13,655,850 | | | | 13,655,850 | | | | – | | | | – | |
Short-Term Investments | | | 13,543,326 | | | | 13,243,347 | | | | 299,979 | | | | – | |
| |
Total | | | $862,831,198 | | | | $66,325,786 | | | | $793,871,038 | | | | $2,634,374 | |
| |
| | | | |
Other Financial Instruments | | Total | | | Level 1 | | | Level 2 | | | Level 3 | |
| | | | |
Asset Derivatives | | | | | | | | | | | | | | | | |
Futures Contracts | | | 26,816 | | | | 26,816 | | | | – | | | | – | |
Foreign Currency Forward Contracts | | | 421,439 | | | | – | | | | 421,439 | | | | – | |
| |
Total Asset Derivatives | | | $448,255 | | | | $26,816 | | | | $421,439 | | | | $– | |
| |
| | | | |
Liability Derivatives | | | | | | | | | | | | | | | | |
Futures Contracts | | | 104,602 | | | | 104,602 | | | | – | | | | – | |
Foreign Currency Forward Contracts | | | 346,746 | | | | – | | | | 346,746 | | | | – | |
| |
Total Liability Derivatives | | | $451,348 | | | | $104,602 | | | | $346,746 | | | | $– | |
| |
There were no significant transfers between Levels during the period ended October 31, 2013. Transfers between Levels are identified as of the end of the period.
^Level 3 security in this section is fair valued at <$1.
| | | | | | | | | | | | | | | | | | | | |
Futures Contracts | | Number of
Contracts
Long/(Short) | | | Expiration
Date | | | Notional
Principal
Amount | | | Value | | | Unrealized
Gain/(Loss) | |
2-Yr. U.S. Treasury Bond Futures | | | 14 | | | | December 2013 | | | | $3,074,992 | | | | $3,085,906 | | | | $10,914 | |
5-Yr. U.S. Treasury Bond Futures | | | 33 | | | | December 2013 | | | | 4,009,192 | | | | 4,015,687 | | | | 6,495 | |
10-Yr. U.S. Treasury Bond Futures | | | (16 | ) | | | December 2013 | | | | (2,036,538 | ) | | | (2,037,750 | ) | | | (1,212 | ) |
30-Yr. U.S. Treasury Bond Futures | | | (40 | ) | | | December 2013 | | | | (5,289,110 | ) | | | (5,392,500 | ) | | | (103,390 | ) |
Mini MSCI EAFE Index Futures | | | 19 | | | | December 2013 | | | | 1,780,451 | | | | 1,781,535 | | | | 1,084 | |
Ultra Long Term U.S. Treasury Bond Futures | | | 3 | | | | December 2013 | | | | 423,958 | | | | 432,281 | | | | 8,323 | |
Total Futures Contracts | | | | | | | | | | | | | | | | | | | ($77,786 | ) |
The accompanying Notes to Financial Statements are an integral part of this schedule.
187
Partner Worldwide Allocation Fund
Schedule of Investments as of October 31, 2013
| | | | | | | | | | | | | | | | | | | | |
Foreign Currency
Forward Contracts | | Counterparty | | Contracts to
Deliver/Receive | | | Settlement
Date | | Value on
Settlement Date | | | Value | | | Unrealized
Gain/(Loss) | |
| | | | | | |
Purchases | | | | | | | | | | | | | | | | | | | | |
Australian Dollar | | WBC | | | 459,000 | | | 12/18/2013 | | | $417,814 | | | | $432,291 | | | | $14,477 | |
Australian Dollar | | DB | | | 84,000 | | | 11/1/2013 | | | 79,627 | | | | 79,393 | | | | (234 | ) |
Australian Dollar | | SSB | | | 278,285 | | | 11/1/2013 | | | 264,329 | | | | 263,022 | | | | (1,307 | ) |
Australian Dollar | | DB | | | 151,000 | | | 12/18/2013 | | | 140,196 | | | | 142,213 | | | | 2,017 | |
Brazilian Real | | HSBC | | | 418,942 | | | 11/4/2013 | | | 192,043 | | | | 186,843 | | | | (5,200 | ) |
Brazilian Real | | UBS | | | 221,000 | | | 11/4/2013 | | | 100,812 | | | | 98,563 | | | | (2,249 | ) |
Brazilian Real | | MSC | | | 322,400 | | | 11/25/2013 | | | 147,000 | | | | 143,108 | | | | (3,892 | ) |
Brazilian Real | | RBS | | | 328,189 | | | 11/29/2013 | | | 147,000 | | | | 145,546 | | | | (1,454 | ) |
British Pound | | SSB | | | 115,220 | | | 11/1/2013 | | | 184,719 | | | | 184,745 | | | | 26 | |
Chilean Peso | | CSFB | | | 71,730,720 | | | 11/25/2013 | | | 143,347 | | | | 139,532 | | | | (3,815 | ) |
Chilean Peso | | SB | | | 73,806,000 | | | 11/19/2013 | | | 147,347 | | | | 143,692 | | | | (3,655 | ) |
Chinese Yuan | | BOA | | | 3,274,853 | | | 12/18/2013 | | | 536,000 | | | | 536,325 | | | | 325 | |
Chinese Yuan | | SB | | | 3,546,029 | | | 1/8/2014 | | | 581,000 | | | | 580,351 | | | | (649 | ) |
Colombian Peso | | CSFB | | | 271,512,670 | | | 11/5/2013 | | | 143,000 | | | | 143,420 | | | | 420 | |
Colombian Peso | | SB | | | 271,512,670 | | | 12/6/2013 | | | 143,798 | | | | 143,076 | | | | (722 | ) |
Czech Republic Koruna | | BOA | | | 8,197,305 | | | 12/18/2013 | | | 432,160 | | | | 431,814 | | | | (346 | ) |
Czech Republic Koruna | | DB | | | 2,702,709 | | | 12/18/2013 | | | 143,604 | | | | 142,372 | | | | (1,232 | ) |
Danish Krone | | DB | | | 1,024,000 | | | 11/1/2013 | | | 188,740 | | | | 186,411 | | | | (2,329 | ) |
Euro | | BB | | | 105,000 | | | 12/18/2013 | | | 139,883 | | | | 142,559 | | | | 2,676 | |
Euro | | BOA | | | 891,350 | | | 12/18/2013 | | | 1,202,571 | | | | 1,210,187 | | | | 7,616 | |
Euro | | BNP | | | 213,203 | | | 12/18/2013 | | | 287,697 | | | | 289,467 | | | | 1,770 | |
Euro | | DB | | | 107,000 | | | 12/18/2013 | | | 147,601 | | | | 145,274 | | | | (2,327 | ) |
Euro | | BIO | | | 171,697 | | | 11/5/2013 | | | 233,326 | | | | 233,122 | | | | (204 | ) |
Euro | | BIO | | | 678,467 | | | 11/4/2013 | | | 931,773 | | | | 921,193 | | | | (10,580 | ) |
Euro | | WBC | | | 102,750 | | | 11/4/2013 | | | 140,408 | | | | 139,509 | | | | (899 | ) |
Euro | | DB | | | 579,000 | | | 11/1/2013 - 11/5/2013 | | | 785,752 | | | | 786,139 | | | | 387 | |
Euro | | SSB | | | 989,348 | | | 11/1/2013 | | | 1,360,067 | | | | 1,343,293 | | | | (16,774 | ) |
Euro | | JPM | | | 214,500 | | | 12/18/2013 | | | 291,795 | | | | 291,227 | | | | (568 | ) |
Hungarian Forint | | DB | | | 62,859,010 | | | 12/18/2013 | | | 285,899 | | | | 288,007 | | | | 2,108 | |
Hungarian Forint | | BB | | | 31,575,705 | | | 12/18/2013 | | | 139,430 | | | | 144,673 | | | | 5,243 | |
Hungarian Forint | | MSC | | | 31,584,000 | | | 12/18/2013 | | | 139,467 | | | | 144,711 | | | | 5,244 | |
Hungarian Forint | | BOA | | | 102,098,079 | | | 12/18/2013 | | | 465,038 | | | | 467,791 | | | | 2,753 | |
Indonesian Rupiah | | HSBC | | | 578,532,901 | | | 11/19/2013 | | | 53,076 | | | | 51,189 | | | | (1,887 | ) |
Indonesian Rupiah | | SSB | | | 31,434,909 | | | 11/1/2013 | | | 2,814 | | | | 2,789 | | | | (25 | ) |
Indonesian Rupiah | | SSB | | | 22,673,984 | | | 11/4/2013 | | | 2,019 | | | | 2,011 | | | | (8 | ) |
Indonesian Rupiah | | SB | | | 1,981,440,000 | | | 11/4/2013 | | | 172,000 | | | | 175,678 | | | | 3,678 | |
Israeli Shekel | | DB | | | 1,504,710 | | | 12/18/2013 | | | 427,000 | | | | 426,562 | | | | (438 | ) |
Japanese Yen | | BIO | | | 48,019,821 | | | 11/5/2013 | | | 488,934 | | | | 488,354 | | | | (580 | ) |
Japanese Yen | | BOA | | | 27,813,198 | | | 12/18/2013 | | | 287,000 | | | | 283,006 | | | | (3,994 | ) |
Japanese Yen | | JPM | | | 14,193,072 | | | 12/18/2013 | | | 144,000 | | | | 144,418 | | | | 418 | |
Japanese Yen | | SSB | | | 195,377,360 | | | 11/1/2013 | | | 1,994,645 | | | | 1,986,957 | | | | (7,688 | ) |
Japanese Yen | | BNP | | | 13,759,477 | | | 12/18/2013 | | | 141,480 | | | | 140,006 | | | | (1,474 | ) |
Japanese Yen | | SSB | | | 13,979,179 | | | 12/18/2013 | | | 143,000 | | | | 142,242 | | | | (758 | ) |
Malaysian Ringgit | | BOA | | | 464,704 | | | 11/29/2013 | | | 148,000 | | | | 147,034 | | | | (966 | ) |
Malaysian Ringgit | | DB | | | 1,850,208 | | | 11/7/2013 - 11/29/2013 | | | 586,000 | | | | 585,585 | | | | (415 | ) |
Malaysian Ringgit | | CITI | | | 458,158 | | | 11/7/2013 | | | 143,000 | | | | 145,136 | | | | 2,136 | |
Malaysian Ringgit | | WBC | | | 459,455 | | | 12/13/2013 | | | 145,729 | | | | 145,238 | | | | (491 | ) |
Malaysian Ringgit | | SB | | | 458,443 | | | 11/14/2013 | | | 143,089 | | | | 145,171 | | | | 2,082 | |
Malaysian Ringgit | | BB | | | 917,598 | | | 11/8/2013 - 11/14/2013 | | | 289,879 | | | | 290,614 | | | | 735 | |
Mexican Peso | | DB | | | 529,622 | | | 12/11/2013 | | | 40,899 | | | | 40,466 | | | | (433 | ) |
Mexican Peso | | RBC | | | 1,843,061 | | | 12/18/2013 | | | 139,000 | | | | 140,740 | | | | 1,740 | |
Mexican Peso | | BB | | | 1,814,513 | | | 12/18/2013 | | | 142,000 | | | | 138,560 | | | | (3,440 | ) |
Mexican Peso | | MSC | | | 1,822,000 | | | 12/18/2013 | | | 143,018 | | | | 139,132 | | | | (3,886 | ) |
Mexican Peso | | UBS | | | 9,565,106 | | | 12/18/2013 | | | 733,000 | | | | 730,412 | | | | (2,588 | ) |
Mexican Peso | | SSB | | | 7,385,243 | | | 12/18/2013 | | | 566,000 | | | | 563,952 | | | | (2,048 | ) |
Mexican Peso | | CITI | | | 7,696,453 | | | 12/18/2013 | | | 580,545 | | | | 587,717 | | | | 7,172 | |
Mexican Peso | | JPM | | | 9,204,196 | | | 12/18/2013 | | | 706,000 | | | | 702,852 | | | | (3,148 | ) |
New Taiwan Dollar | | HSBC | | | 8,429,521 | | | 12/6/2013 | | | 287,403 | | | | 287,209 | | | | (194 | ) |
New Taiwan Dollar | | DB | | | 8,256,029 | | | 11/8/2013 | | | 281,152 | | | | 281,078 | | | | (74 | ) |
New Taiwan Dollar | | BB | | | 8,429,521 | | | 11/4/2013 | | | 286,000 | | | | 286,952 | | | | 952 | |
New Taiwan Dollar | | SB | | | 4,151,924 | | | 11/18/2013 | | | 141,390 | | | | 141,394 | | | | 4 | |
Philippines Peso | | DB | | | 12,337,848 | | | 11/18/2013 - 11/25/2013 | | | 287,322 | | | | 285,818 | | | | (1,504 | ) |
Philippines Peso | | BNP | | | 3,683,729 | | | 11/7/2013 | | | 85,311 | | | | 85,279 | | | | (32 | ) |
The accompanying Notes to Financial Statements are an integral part of this schedule.
188
Partner Worldwide Allocation Fund
Schedule of Investments as of October 31, 2013
| | | | | | | | | | | | | | | | | | | | |
Foreign Currency
Forward Contracts | | Counterparty | | Contracts to
Deliver/Receive | | | Settlement
Date | | Value on
Settlement Date | | | Value | | | Unrealized
Gain/(Loss) | |
| | | | | | |
Purchases | | | | | | | | | | | | | | | | | | | | |
Philippines Peso | | SB | | | 12,658,220 | | | 11/7/2013 - 12/6/2013 | | | $294,288 | | | | $293,213 | | | | ($1,075 | ) |
Philippines Peso | | UBS | | | 1,859,000 | | | 11/21/2013 | | | 43,152 | | | | 43,064 | | | | (88 | ) |
Polish Zloty | | SSB | | | 894,345 | | | 12/18/2013 | | | 286,539 | | | | 289,600 | | | | 3,061 | |
Polish Zloty | | BB | | | 488,962 | | | 12/18/2013 | | | 160,095 | | | | 158,332 | | | | (1,763 | ) |
Polish Zloty | | BOA | | | 3,113,337 | | | 12/18/2013 | | | 994,920 | | | | 1,008,137 | | | | 13,217 | |
Russian Ruble | | CSFB | | | 23,554,409 | | | 11/18/2013 - 11/29/2013 | | | 734,607 | | | | 731,907 | | | | (2,700 | ) |
Russian Ruble | | CITI | | | 14,210,525 | | | 11/12/2013 - 11/14/2013 | | | 438,298 | | | | 442,327 | | | | 4,029 | |
Russian Ruble | | UBS | | | 4,696,658 | | | 11/15/2013 | | | 144,313 | | | | 146,145 | | | | 1,832 | |
Russian Ruble | | DB | | | 4,638,641 | | | 11/18/2013 | | | 142,670 | | | | 144,280 | | | | 1,610 | |
Russian Ruble | | HSBC | | | 4,411,893 | | | 11/21/2013 | | | 136,102 | | | | 137,171 | | | | 1,069 | |
Singapore Dollar | | SB | | | 177,787 | | | 12/18/2013 | | | 141,000 | | | | 143,163 | | | | 2,163 | |
South African Rand | | SB | | | 1,393,619 | | | 12/18/2013 | | | 143,000 | | | | 137,953 | | | | (5,047 | ) |
South African Rand | | UBS | | | 5,673,582 | | | 12/18/2013 | | | 568,000 | | | | 561,622 | | | | (6,378 | ) |
South African Rand | | BB | | | 8,723,704 | | | 12/18/2013 | | | 868,000 | | | | 863,551 | | | | (4,449 | ) |
South Korean Won | | BOA | | | 154,570,703 | | | 11/12/2013 | | | 145,000 | | | | 145,655 | | | | 655 | |
South Korean Won | | JPM | | | 152,660,700 | | | 11/12/2013 | | | 142,911 | | | | 143,855 | | | | 944 | |
Swedish Krona | | SSB | | | 307,183 | | | 11/1/2013 | | | 48,125 | | | | 47,404 | | | | (721 | ) |
Swiss Franc | | DB | | | 96,000 | | | 11/1/2013 | | | 106,810 | | | | 105,803 | | | | (1,007 | ) |
Thai Baht | | DB | | | 9,083,828 | | | 11/25/2013 | | | 292,000 | | | | 291,596 | | | | (404 | ) |
Turkish Lira | | JPM | | | 288,608 | | | 12/18/2013 | | | 144,000 | | | | 143,418 | | | | (582 | ) |
Turkish Lira | | RBS | | | 2,068,036 | | | 12/18/2013 | | | 1,034,303 | | | | 1,027,669 | | | | (6,634 | ) |
Turkish Lira | | BOA | | | 566,469 | | | 12/18/2013 | | | 284,000 | | | | 281,496 | | | | (2,504 | ) |
Turkish Lira | | CITI | | | 281,340 | | | 12/18/2013 | | | 142,000 | | | | 139,807 | | | | (2,193 | ) |
Total Purchases | | | | | | | | | | | $27,848,081 | | | $ | 27,810,588 | | | | ($37,493 | ) |
| | | | | | |
Sales | | | | | | | | | | | | | | | | | | | | |
Australian Dollar | | SSB | | | 148,000 | | | 12/18/2013 | | | $136,270 | | | | $139,388 | | | | ($3,118 | ) |
Australian Dollar | | WBC | | | 462,000 | | | 12/18/2013 | | | 428,508 | | | | 435,117 | | | | (6,609 | ) |
Brazilian Real | | MSC | | | 1,623,231 | | | 11/4/2013 - 12/2/2013 | | | 733,000 | | | | 720,485 | | | | 12,515 | |
Brazilian Real | | HSBC | | | 418,942 | | | 1/17/2014 | | | 188,764 | | | | 183,681 | | | | 5,083 | |
Brazilian Real | | CSFB | | | 567,385 | | | 1/17/2014 | | | 254,615 | | | | 248,765 | | | | 5,850 | |
Brazilian Real | | SSB | | | 19,042 | | | 11/1/2013 | | | 8,638 | | | | 8,500 | | | | 138 | |
Brazilian Real | | CITI | | | 623,465 | | | 1/17/2014 | | | 276,358 | | | | 273,352 | | | | 3,006 | |
Brazilian Real | | RBC | | | 1,229,028 | | | 11/29/2013 - 1/17/2014 | | | 551,453 | | | | 542,150 | | | | 9,303 | |
Brazilian Real | | JPM | | | 1,617,000 | | | 1/17/2014 | | | 715,328 | | | | 708,958 | | | | 6,370 | |
Brazilian Real | | RBS | | | 18,304 | | | 11/1/2013 - 11/4/2013 | | | 8,337 | | | | 8,171 | | | | 166 | |
Brazilian Real | | UBS | | | 954,477 | | | 11/4/2013 - 11/25/2013 | | | 435,000 | | | | 424,564 | | | | 10,436 | |
British Pound | | JPM | | | 50,000 | | | 12/9/2013 | | | 80,619 | | | | 80,136 | | | | 483 | |
British Pound | | SSB | | | 347,793 | | | 11/1/2013 | | | 557,579 | | | | 557,656 | | | | (77 | ) |
Canadian Dollar | | SSB | | | 815,326 | | | 11/1/2013 | | | 778,682 | | | | 781,974 | | | | (3,292 | ) |
Chinese Yuan | | DB | | | 6,825,496 | | | 12/18/2013 - 1/8/2014 | | | 1,104,519 | | | | 1,117,651 | | | | (13,132 | ) |
Colombian Peso | | BOA | | | 271,512,670 | | | 12/6/2013 | | | 143,376 | | | | 143,076 | | | | 300 | |
Colombian Peso | | SB | | | 271,512,670 | | | 11/5/2013 | | | 144,230 | | | | 143,420 | | | | 810 | |
Czech Republic Koruna | | BOA | | | 2,756,823 | | | 12/18/2013 | | | 146,194 | | | | 145,223 | | | | 971 | |
Czech Republic Koruna | | BNP | | | 5,473,013 | | | 12/18/2013 | | | 287,697 | | | | 288,305 | | | | (608 | ) |
Czech Republic Koruna | | JPM | | | 2,762,213 | | | 12/18/2013 | | | 145,061 | | | | 145,507 | | | | (446 | ) |
Czech Republic Koruna | | SSB | | | 5,427,000 | | | 12/18/2013 | | | 279,836 | | | | 285,881 | | | | (6,045 | ) |
Euro | | MSC | | | 105,000 | | | 12/18/2013 | | | 139,467 | | | | 142,559 | | | | (3,092 | ) |
Euro | | CITI | | | 305,000 | | | 12/18/2013 | | | 406,075 | | | | 414,099 | | | | (8,024 | ) |
Euro | | JPM | | | 107,000 | | | 12/18/2013 | | | 144,117 | | | | 145,274 | | | | (1,157 | ) |
Euro | | BOA | | | 211,000 | | | 12/18/2013 | | | 287,594 | | | | 286,486 | | | | 1,108 | |
Euro | | SSB | | | 211,000 | | | 12/18/2013 | | | 286,539 | | | | 286,475 | | | | 64 | |
Euro | | BOA | | | 982,917 | | | 12/18/2013 | | | 1,336,946 | | | | 1,334,509 | | | | 2,437 | |
Euro | | UBS | | | 629,960 | | | 12/13/2013 - 12/18/2013 | | | 866,367 | | | | 855,295 | | | | 11,072 | |
Euro | | WBC | | | 305,750 | | | 12/13/2013 - 12/18/2013 | | | 414,705 | | | | 415,117 | | | | (412 | ) |
Euro | | DB | | | 317,000 | | | 12/18/2013 | | | 429,503 | | | | 430,392 | | | | (889 | ) |
Euro | | BB | | | 222,000 | | | 12/18/2013 | | | 299,525 | | | | 301,410 | | | | (1,885 | ) |
Hong Kong Dollar | | RBS | | | 64,065 | | | 11/1/2013 | | | 8,263 | | | | 8,263 | | | | – | |
Hungarian Forint | | DB | | | 31,423,600 | | | 12/18/2013 | | | 147,601 | | | | 143,976 | | | | 3,625 | |
The accompanying Notes to Financial Statements are an integral part of this schedule.
189
Partner Worldwide Allocation Fund
Schedule of Investments as of October 31, 2013
| | | | | | | | | | | | | | | | | | | | |
Foreign Currency
Forward Contracts | | Counterparty | | Contracts to
Deliver/Receive | | | Settlement
Date | | Value on
Settlement Date | | | Value | | | Unrealized
Gain/(Loss) | |
| | | | | | |
Sales | | | | | | | | | | | | | | | | | | | | |
Hungarian Forint | | JPM | | | 133,748,959 | | | 12/18/2013 | | | $587,507 | | | | $612,808 | | | | ($25,301 | ) |
Indonesian Rupiah | | BB | | | 1,588,980,000 | | | 11/19/2013 | | | 142,000 | | | | 140,593 | | | | 1,407 | |
Indonesian Rupiah | | HSBC | | | 578,532,901 | | | 11/4/2013 | | | 53,321 | | | | 51,294 | | | | 2,027 | |
Indonesian Rupiah | | DB | | | 1,402,907,099 | | | 11/4/2013 | | | 121,569 | | | | 124,385 | | | | (2,816 | ) |
Indonesian Rupiah | | UBS | | | 3,093,732,700 | | | 11/19/2013 | | | 284,000 | | | | 273,733 | | | | 10,267 | |
Israeli Shekel | | DB | | | 517,247 | | | 12/18/2013 | | | 146,612 | | | | 146,632 | | | | (20 | ) |
Israeli Shekel | | MSC | | | 987,463 | | | 12/18/2013 | | | 276,585 | | | | 279,930 | | | | (3,345 | ) |
Japanese Yen | | MSC | | | 14,138,136 | | | 12/18/2013 | | | 143,018 | | | | 143,859 | | | | (841 | ) |
Japanese Yen | | CSFB | | | 27,555,082 | | | 12/18/2013 | | | 278,000 | | | | 280,380 | | | | (2,380 | ) |
Japanese Yen | | SSB | | | 174,169,674 | | | 11/1/2013 | | | 1,778,131 | | | | 1,771,276 | | | | 6,855 | |
Japanese Yen | | SSB | | | 13,714,522 | | | 12/18/2013 | | | 137,000 | | | | 139,549 | | | | (2,549 | ) |
Japanese Yen | | HSBC | | | 14,337,186 | | | 12/18/2013 | | | 145,000 | | | | 145,884 | | | | (884 | ) |
Malaysian Ringgit | | BB | | | 457,403 | | | 11/7/2013 | | | 145,000 | | | | 144,897 | | | | 103 | |
Malaysian Ringgit | | WBC | | | 459,455 | | | 11/7/2013 | | | 145,975 | | | | 145,547 | | | | 428 | |
Mexican Peso | | SSB | | | 11,341,793 | | | 12/18/2013 | | | 863,000 | | | | 866,084 | | | | (3,084 | ) |
Mexican Peso | | MSC | | | 5,650,938 | | | 12/18/2013 | | | 436,000 | | | | 431,518 | | | | 4,482 | |
Mexican Peso | | RBC | | | 13,620,886 | | | 12/11/2013 | | | 1,054,330 | | | | 1,040,716 | | | | 13,614 | |
Mexican Peso | | CITI | | | 1,718,795 | | | 12/18/2013 | | | 130,000 | | | | 131,251 | | | | (1,251 | ) |
Mexican Peso | | DB | | | 3,767,860 | | | 12/18/2013 | | | 288,000 | | | | 287,722 | | | | 278 | |
New Taiwan Dollar | | HSBC | | | 8,429,521 | | | 11/4/2013 | | | 286,816 | | | | 286,952 | | | | (136 | ) |
Norwegian Krone | | DB | | | 3,354,000 | | | 11/1/2013 - 11/4/2013 | | | 568,352 | | | | 563,409 | | | | 4,943 | |
Polish Zloty | | RBS | | | 22,313 | | | 11/4/2013 | | | 7,282 | | | | 7,244 | | | | 38 | |
Polish Zloty | | DB | | | 878,630 | | | 12/18/2013 | | | 275,774 | | | | 284,511 | | | | (8,737 | ) |
Polish Zloty | | BOA | | | 1,503,745 | | | 12/18/2013 | | | 626,099 | | | | 486,931 | | | | 139,168 | |
Russian Ruble | | CITI | | | 10,298,526 | | | 11/12/2013 - 1/17/2014 | | | 317,972 | | | | 318,639 | | | | (667 | ) |
Russian Ruble | | CSFB | | | 16,138,038 | | | 11/15/2013 - 1/17/2014 | | | 503,386 | | | | 501,211 | | | | 2,175 | |
Singapore Dollar | | SB | | | 169,000 | | | 12/18/2013 | | | 132,404 | | | | 136,087 | | | | (3,683 | ) |
South African Rand | | HSBC | | | 1,458,821 | | | 12/18/2013 | | | 148,000 | | | | 144,408 | | | | 3,592 | |
South African Rand | | UBS | | | 8,670,492 | | | 12/18/2013 | | | 860,000 | | | | 858,285 | | | | 1,715 | |
South African Rand | | BB | | | 5,661,592 | | | 12/18/2013 | | | 559,549 | | | | 560,437 | | | | (888 | ) |
South Korean Won | | CSFB | | | 157,412,800 | | | 11/29/2013 | | | 148,000 | | | | 148,242 | | | | (242 | ) |
South Korean Won | | BB | | | 155,512,800 | | | 11/12/2013 | | | 144,000 | | | | 146,543 | | | | (2,543 | ) |
South Korean Won | | DB | | | 468,987,293 | | | 11/12/2013 - 11/29/2013 | | | 439,000 | | | | 441,755 | | | | (2,755 | ) |
Turkish Lira | | JPM | | | 1,610,074 | | | 12/18/2013 | | | 781,083 | | | | 800,095 | | | | (19,012 | ) |
Turkish Lira | | DB | | | 145,395 | | | 12/18/2013 | | | 71,500 | | | | 72,251 | | | | (751 | ) |
Turkish Lira | | MSC | | | 590,633 | | | 12/18/2013 | | | 294,000 | | | | 293,504 | | | | 496 | |
Turkish Lira | | SB | | | 871,858 | | | 12/18/2013 | | | 423,726 | | | | 433,253 | | | | (9,527 | ) |
Turkish Lira | | BB | | | 577,344 | | | 12/18/2013 | | | 284,000 | | | | 286,899 | | | | (2,899 | ) |
Turkish Lira | | RBS | | | 580,753 | | | 12/18/2013 | | | 285,000 | | | | 288,594 | | | | (3,594 | ) |
Turkish Lira | | CITI | | | 292,692 | | | 12/18/2013 | | | 139,000 | | | | 145,448 | | | | (6,448 | ) |
Total Sales | | | | | | | | | | | $26,620,757 | | | | $26,508,571 | | | | $112,186 | |
| | |
Net Unrealized Gain/(Loss) on Foreign Currency Forward Contracts | | | | | | | | $74,693 | |
| | | | | | |
Counterparty |
BOA | | | - | | | Bank of America |
BB | | | - | | | Barclays Bank |
BNP | | | - | | | BNP Paribas |
BIO | | | - | | | Brown Brothers Harriman |
CITI | | | - | | | Citibank |
CSFB | | | - | | | CS First Boston Corporation |
DB | | | - | | | Deutsche Bank |
HSBC | | | - | | | HSBC Securities, Inc. |
JPM | | | - | | | J.P. Morgan |
MSC | | | - | | | Morgan Stanley & Company |
RBC | | | - | | | The Royal Bank of Canada |
RBS | | | - | | | The Royal Bank of Scotland |
SB | | | - | | | Standard Bank plc |
SSB | | | - | | | State Street Bank |
UBS | | | - | | | UBS Securities, Ltd. |
WBC | | | - | | | Westpac Banking Corporation |
The accompanying Notes to Financial Statements are an integral part of this schedule.
190
Partner Worldwide Allocation Fund
Schedule of Investments as of October 31, 2013
The following table summarizes the fair value and Statement of Assets and Liabilities location, as of October 31, 2013, for Partner Worldwide Allocation Fund’s investments in financial derivative instruments by primary risk exposure as discussed under item (2) Significant Accounting Policies of the Notes to Financial Statements.
| | | | | | |
Derivatives by risk category | | Statement of Assets and Liabilities Location | | Fair Value | |
| | |
Asset Derivatives | | | | | | |
| | |
Interest Rate Contracts | | | | | | |
Futures* | | Net Assets - Net unrealized appreciation/(depreciation) on Futures contracts | | | $25,732 | |
Total Interest Rate Contracts | | | | | 25,732 | |
| | |
Equity Contracts | | | | | | |
Futures* | | Net Assets - Net unrealized appreciation/(depreciation) on Futures contracts | | | 1,084 | |
Total Equity Contracts | | | | | 1,084 | |
| | |
Foreign Exchange Contracts | | | | | | |
Forward Contracts | | Receivable/Payable for forward contracts, Net Assets - Net unrealized appreciation/(depreciation) on Foreign currency forward contracts | | | 421,439 | |
Total Foreign Exchange Contracts | | | | | 421,439 | |
| |
Total Asset Derivatives | | | | | $448,255 | |
| |
| | |
Liability Derivatives | | | | | | |
| | |
Interest Rate Contracts | | | | | | |
Futures* | | Net Assets - Net unrealized appreciation/(depreciation) on Futures contracts | | | 104,602 | |
Total Interest Rate Contracts | | | | | 104,602 | |
| | |
Foreign Exchange Contracts | | | | | | |
Forward Contracts | | Receivable/Payable for forward contracts, Net Assets - Net unrealized appreciation/(depreciation) on Foreign currency forward contracts | | | 346,746 | |
Total Foreign Exchange Contracts | | | | | 346,746 | |
| |
Total Liability Derivatives | | | | | $451,348 | |
| |
* | Includes cumulative appreciation/depreciation of futures contracts as reported in the Schedule of Investments. Only current day’s variation margin is reported within the Statement of Assets and Liabilities. |
The following table summarizes the net realized gains/(losses) and Statement of Operations location, for the period ended October 31, 2013, for Partner Worldwide Allocation Fund’s investments in financial derivative instruments by primary risk exposure.
| | | | | | |
Derivatives by risk category | | Statement of Operations Location | | Realized Gains/(Losses)
recognized in Income | |
| | |
Interest Rate Contracts | | | | | | |
Futures | | Net realized gains/(losses) on Futures contracts | | | (172,692 | ) |
| | |
Total Interest Rate Contracts | | | | | (172,692 | ) |
| | |
Equity Contracts | | | | | | |
Futures | | Net realized gains/(losses) on Futures contracts | | | 653,341 | |
| | |
Total Equity Contracts | | | | | 653,341 | |
| | |
Foreign Exchange Contracts | | | | | | |
Forward Contracts | | Net realized gains/(losses) on Foreign currency transactions | | | 25,077 | |
| | |
Total Foreign Exchange Contracts | | | | | 25,077 | |
| |
Total | | | | | $505,726 | |
| |
The accompanying Notes to Financial Statements are an integral part of this schedule.
191
Partner Worldwide Allocation Fund
Schedule of Investments as of October 31, 2013
The following table summarizes the change in net unrealized appreciation/(depreciation) and Statement of Operations location, for the period ended October 31, 2013, for Partner Worldwide Allocation Fund’s investments in financial derivative instruments by primary risk exposure.
| | | | | | |
Derivatives by risk category | | Statement of Operations Location | | Change in unrealized
appreciation/(depreciation)
recognized in Income | |
| | |
Interest Rate Contracts | | | | | | |
Futures | | Change in net unrealized appreciation/(depreciation) on Futures contracts | | | (71,678 | ) |
Total Interest Rate Contracts | | | | | (71,678 | ) |
| | |
Equity Contracts | | | | | | |
Futures | | Change in net unrealized appreciation/(depreciation) on Futures contracts | | | 3,024 | |
Total Equity Contracts | | | | | 3,024 | |
| | |
Foreign Exchange Contracts | | | | | | |
Forward Contracts | | Change in net unrealized appreciation/(depreciation) on Foreign currency forward contracts | | | 202,668 | |
Total Foreign Exchange Contracts | | | | | 202,668 | |
| |
Total | | | | | $134,014 | |
| |
The following table presents Partner Worldwide Allocation Fund’s average volume of derivative activity during the period ended October 31, 2013.
| | | | | | | | | | | | | | | | |
Derivative Risk Category | | Futures
(Notional)* | | | Futures
(Percentage
of Average
Net Assets) | | | Forwards
(Notional)* | | | Forwards
(Percentage
of Average
Net Assets) | |
Equity Contracts | | | $2,694,610 | | | | 0.3 | % | | | N/A | | | | N/A | |
Interest Rate Contracts | | | 16,773,772 | | | | 2.1 | | | | N/A | | | | N/A | |
Foreign Exchange Contracts | | | N/A | | | | N/A | | | | $78,521,430 | | | | 10.0 | % |
* | Notional amount represents long or short, or both, derivative positions held by the Fund. |
Investment in Affiliates
Affiliated issuers, as defined under the Investment Company Act of 1940, include those in which the Fund’s holdings of an issuer represent 5% or more of the outstanding voting securities of an issuer, or any affiliated mutual fund.
A summary of transactions for the fiscal year to date, in Partner Worldwide Allocation Fund, is as follows:
| | | | | | | | | | | | | | | | | | | | | | | | |
Fund | | Value
October 31, 2012 | | | Gross
Purchases | | | Gross
Sales | | | Shares Held at
October 31, 2013 | | | Value
October 31, 2013 | | | Income Earned
November 1, 2012 -
October 31, 2013 | |
Cash Management Trust-Collateral Investment | | | $4,431,715 | | | | $94,629,490 | | | | $85,405,355 | | | | 13,655,850 | | | | $13,655,850 | | | | $113,247 | |
Cash Management Trust-Short Term Investment | | | 8,450,079 | | | | 234,908,622 | | | | 230,115,354 | | | | 13,243,347 | | | | 13,243,347 | | | | 15,527 | |
Total Value and Income Earned | | | 12,881,794 | | | | | | | | | | | | | | | | 26,899,197 | | | | 128,774 | |
The accompanying Notes to Financial Statements are an integral part of this schedule.
192
Large Cap Growth Fund
Schedule of Investments as of October 31, 2013
| | | | | | | | |
| Shares | | | Common Stock (95.4%) | | Value | |
| Consumer Discretionary (19.1%) | | | | |
| | 51,541 | | | Amazon.com, Inc.a | | | $18,762,470 | |
| | 17,350 | | | AutoZone, Inc.a | | | 7,541,872 | |
| | 314,100 | | | Comcast Corporation | | | 14,944,878 | |
| | 107,700 | | | Home Depot, Inc. | | | 8,388,753 | |
| | 182,100 | | | Las Vegas Sands Corporation | | | 12,787,062 | |
| | 162,400 | | | NIKE, Inc. | | | 12,303,424 | |
| | 297,150 | | | Twenty-First Century Fox, Inc. | | | 10,126,872 | |
| | | | | |
| | | | Total | | | 84,855,331 | |
| | | | | |
| |
| Consumer Staples (3.1%) | | | | |
| | 54,700 | | | Anheuser-Busch InBev NV ADR | | | 5,674,031 | |
| | 37,297 | | | British American Tobacco plc ADR | | | 4,120,945 | |
| | 52,500 | | | Nestle SA | | | 3,789,658 | |
| | | | | |
| | | | Total | | | 13,584,634 | |
| | | | | |
| |
| Energy (8.3%) | | | | |
| | 59,400 | | | Consol Energy, Inc. | | | 2,168,100 | |
| | 37,000 | | | EOG Resources, Inc. | | | 6,600,800 | |
| | 135,200 | | | Marathon Oil Corporation | | | 4,767,152 | |
| | 105,500 | | | Schlumberger, Ltd. | | | 9,887,460 | |
| | 825,400 | | | Weatherford International, Ltd.a | | | 13,569,576 | |
| | | | | |
| | | | Total | | | 36,993,088 | |
| | | | | |
| |
| Financials (9.5%) | | | | |
| | 165,950 | | | Citigroup, Inc. | | | 8,095,041 | |
| | 130,450 | | | Credit Suisse Group ADRa | | | 4,060,909 | |
| | 160,939 | | | J.P. Morgan Chase & Company | | | 8,294,796 | |
| | 16,200 | | | MasterCard, Inc. | | | 11,617,020 | |
| | 50,700 | | | Visa, Inc. | | | 9,971,169 | |
| | | | | |
| | | | Total | | | 42,038,935 | |
| | | | | |
| |
| Health Care (14.0%) | | | | |
| | 174,900 | | | Covidien plc | | | 11,212,839 | |
| | 190,000 | | | Express Scripts Holding Companya | | | 11,878,800 | |
| | 314,500 | | | Gilead Sciences, Inc.a | | | 22,326,355 | |
| | 49,600 | | | Perrigo Companyb | | | 6,839,344 | |
| | 72,700 | | | Shire Pharmaceuticals Group plc ADR | | �� | 9,676,370 | |
| | | | | |
| | | | Total | | | 61,933,708 | |
| | | | | |
| |
| Industrials (10.6%) | | | | |
| | 64,900 | | | Boeing Company | | | 8,469,450 | |
| | 45,700 | | | Fluor Corporation | | | 3,391,854 | |
| | 151,500 | | | Honeywell International, Inc. | | | 13,139,595 | |
| | 222,800 | | | Jacobs Engineering Group, Inc.a | | | 13,550,696 | |
| | 57,200 | | | Union Pacific Corporation | | | 8,660,080 | |
| | | | | |
| | | | Total | | | 47,211,675 | |
| | | | | |
| |
| Information Technology (28.9%) | | | | |
| | 68,852 | | | Apple, Inc. | | | 35,964,842 | |
| | 75,765 | | | Citrix Systems, Inc.a | | | 4,301,937 | |
| | 275,900 | | | EMC Corporation | | | 6,640,913 | |
| | 336,600 | | | Facebook, Inc.a | | | 16,917,516 | |
| | 30,653 | | | Google, Inc.a | | | 31,590,369 | |
| | 104,600 | | | NetApp, Inc. | | | 4,059,526 | |
| | 262,850 | | | QUALCOMM, Inc. | | | 18,260,189 | |
| | 25,801 | | | Salesforce.com, Inc.a | | | 1,376,741 | |
| | 113,600 | | | VMware, Inc.a | | | 9,233,408 | |
| | | | | |
| | | | Total | | | 128,345,441 | |
| | | | | |
| |
| Materials (1.9%) | | | | |
| | 61,900 | | | Monsanto Company | | | 6,492,072 | |
| | 18,124 | | | Southern Copper Corporation | | | 506,566 | |
| | 59,500 | | | Teck Resources, Ltd. | | | 1,591,030 | |
| | | | | |
| | | | Total | | | 8,589,668 | |
| | | | | |
| | | | | | | | |
| | | | | |
| | | | Total Common Stock (cost $328,891,022) | | | 423,552,480 | |
| | | | | |
| | |
| Shares | | | Collateral Held for Securities Loaned (1.5%) | | Value | |
| | 6,510,000 | | | Thrivent Cash Management Trust | | | 6,510,000 | |
| | | | | |
| | | | Total Collateral Held for Securities Loaned (cost $6,510,000) | | | 6,510,000 | |
| | | | | |
| | |
Shares or
Principal
Amount | | | Short-Term Investments (4.1%) | | Value | |
| | | | Federal Home Loan Mortgage Corporation Discount Notes | | | | |
| | 200,000 | | | 0.065%, 2/24/2014c,d | | | 199,958 | |
| | | | Federal National Mortgage Association Discount Notes | | | | |
| | 500,000 | | | 0.075%, 2/12/2014c,d | | | 499,893 | |
| | | | Thrivent Cash Management Trust | | | | |
| | 17,617,000 | | | 0.070% | | | 17,617,000 | |
| | | | | |
| | | | Total Short-Term Investments (at amortized cost) | | | 18,316,851 | |
| | | | | |
| | | | Total Investments (cost $353,717,873) 101.0% | | $ | 448,379,331 | |
| | | | | |
| | | | Other Assets and Liabilities, Net (1.0%) | | | (4,523,453 | ) |
| | | | | |
| | | | Total Net Assets 100.0% | | $ | 443,855,878 | |
| | | | | |
a | Non-income producing security. |
b | All or a portion of the security is on loan. |
c | The interest rate shown reflects the yield, coupon rate or the discount rate at the date of purchase. |
d | At October 31, 2013, $699,851 of investments were held on deposit with the counterparty and pledged as the initial margin deposit for open futures contracts. |
Definitions:
| | | | |
ADR | | - American Depositary Receipt, which are certificates for an underlying foreign security’s shares held by an issuing U.S. depository bank. |
Unrealized Appreciation (Depreciation)
Gross unrealized appreciation and depreciation of investments, based on cost for federal income tax purposes, were as follows:
| | | | |
Gross unrealized appreciation | | | $98,275,791 | |
Gross unrealized depreciation | | | (3,622,381 | ) |
| | | | |
Net unrealized appreciation (depreciation) | | | $94,653,410 | |
| |
Cost for federal income tax purposes | | | $353,725,921 | |
The accompanying Notes to Financial Statements are an integral part of this schedule.
193
Large Cap Growth Fund
Schedule of Investments as of October 31, 2013
Fair Valuation Measurements
The following table is a summary of the inputs used, as of October 31, 2013, in valuing Large Cap Growth Fund’s assets carried at fair value.
| | | | | | | | | | | | | | | | |
Investments in Securities | | Total | | | Level 1 | | | Level 2 | | | Level 3 | |
| | | | |
Common Stock | | | | | | | | | | | | | | | | |
Consumer Discretionary | | | 84,855,331 | | | | 84,855,331 | | | | – | | | | – | |
Consumer Staples | | | 13,584,634 | | | | 9,794,976 | | | | 3,789,658 | | | | – | |
Energy | | | 36,993,088 | | | | 36,993,088 | | | | – | | | | – | |
Financials | | | 42,038,935 | | | | 42,038,935 | | | | – | | | | – | |
Health Care | | | 61,933,708 | | | | 61,933,708 | | | | – | | | | – | |
Industrials | | | 47,211,675 | | | | 47,211,675 | | | | – | | | | – | |
Information Technology | | | 128,345,441 | | | | 128,345,441 | | | | – | | | | – | |
Materials | | | 8,589,668 | | | | 8,589,668 | | | | – | | | | – | |
Collateral Held for Securities Loaned | | | 6,510,000 | | | | 6,510,000 | | | | – | | | | – | |
Short-Term Investments | | | 18,316,851 | | | | 17,617,000 | | | | 699,851 | | | | – | |
| |
Total | | | $448,379,331 | | | | $443,889,822 | | | | $4,489,509 | | | | $– | |
| |
| | | | |
Other Financial Instruments | | Total | | | Level 1 | | | Level 2 | | | Level 3 | |
| | | | |
Asset Derivatives | | | | | | | | | | | | | | | | |
Futures Contracts | | | 460,057 | | | | – | | | | 460,057 | | | | – | |
| |
Total Asset Derivatives | | | $460,057 | | | | $– | | | | $460,057 | | | | $– | |
| |
There were no significant transfers between Levels during the period ended October 31, 2013. Transfers between Levels are identified as of the end of the period.
| | | | | | | | | | | | | | | | | | | | |
Futures Contracts | | Number of
Contracts
Long/(Short) | | | Expiration
Date | | | Notional
Principal
Amount | | | Value | | | Unrealized
Gain/(Loss) | |
Eurex EURO STOXX 50 Futures | | | 217 | | | | December 2013 | | | | $8,546,868 | | | | $9,006,925 | | | | $460,057 | |
Total Futures Contracts | | | | | | | | | | | | | | | | | | | $460,057 | |
The following table summarizes the fair value and Statement of Assets and Liabilities location, as of October 31, 2013, for Large Cap Growth Fund’s investments in financial derivative instruments by primary risk exposure as discussed under item (2) Significant Accounting Policies of the Notes to Financial Statements.
| | | | | | |
Derivatives by risk category | | Statement of Assets and Liabilities Location | | Fair Value | |
| | |
Asset Derivatives | | | | | | |
| | |
Equity Contracts | | | | | | |
Futures* | | Net Assets - Net unrealized appreciation/(depreciation) on Futures contracts | | | 460,057 | |
Total Equity Contracts | | | | | 460,057 | |
| |
Total Asset Derivatives | | | | | $460,057 | |
| |
The following table summarizes the net realized gains/(losses) and Statement of Operations location, for the period ended October 31, 2013, for Large Cap Growth Fund’s investments in financial derivative instruments by primary risk exposure.
| | | | | | |
Derivatives by risk category | | Statement of Operations Location | | Realized Gains/(Losses)
recognized in Income | |
| | |
Foreign Exchange Contracts | | | | | | |
Forward Contracts | | Net realized gains/(losses) on Foreign currency transactions | | | 8,706 | |
| | |
Total Foreign Exchange Contracts | | | | | 8,706 | |
| |
Total | | | | | $8,706 | |
| |
The accompanying Notes to Financial Statements are an integral part of this schedule.
194
Large Cap Growth Fund
Schedule of Investments as of October 31, 2013
The following table summarizes the change in net unrealized appreciation/(depreciation) and Statement of Operations location, for the period ended October 31, 2013, for Large Cap Growth Fund’s investments in financial derivative instruments by primary risk exposure.
| | | | | | |
Derivatives by risk category | | Statement of Operations Location | | Change in unrealized
appreciation/(depreciation)
recognized in Income | |
| | |
Equity Contracts | | | | | | |
Futures | | Change in net unrealized appreciation/(depreciation) on Futures contracts | | | 460,057 | |
Total Equity Contracts | | | | | 460,057 | |
| |
Total | | | | | $460,057 | |
| |
The following table presents Large Cap Growth Fund’s average volume of derivative activity during the period ended October 31, 2013.
| | | | | | | | | | | | | | | | |
Derivative Risk Category | | Futures
(Notional)* | | | Futures
(Percentage
of Average
Net Assets) | | | Forwards
(Notional)* | | | Forwards
(Percentage
of Average
Net Assets) | |
Equity Contracts | | | $742,798 | | | | 0.2 | % | | | N/A | | | | N/A | |
Foreign Exchange Contracts | | | N/A | | | | N/A | | | | $13,792 | | | | <0.1 | % |
* | Notional amount represents long or short, or both, derivative positions held by the Fund. |
Investment in Affiliates
Affiliated issuers, as defined under the Investment Company Act of 1940, include those in which the Fund’s holdings of an issuer represent 5% or more of the outstanding voting securities of an issuer, or any affiliated mutual fund.
A summary of transactions for the fiscal year to date, in Large Cap Growth Fund, is as follows:
| | | | | | | | | | | | | | | | | | | | | | | | |
Fund | | Value
October 31, 2012 | | | Gross
Purchases | | | Gross
Sales | | | Shares Held at
October 31, 2013 | | | Value
October 31, 2013 | | | Income Earned
November 1, 2012 -
October 31, 2013 | |
Cash Management Trust-Collateral Investment | | | $– | | | | $36,744,114 | | | | $30,234,114 | | | | 6,510,000 | | | | $6,510,000 | | | | $3,339 | |
Cash Management Trust-Short Term Investment | | | 7,293,093 | | | | 55,001,962 | | | | 44,678,055 | | | | 17,617,000 | | | | 17,617,000 | | | | 12,323 | |
Total Value and Income Earned | | | 7,293,093 | | | | | | | | | | | | | | | | 24,127,000 | | | | 15,662 | |
The accompanying Notes to Financial Statements are an integral part of this schedule.
195
Large Cap Value Fund
Schedule of Investments as of October 31, 2013
| | | | | | | | |
| Shares | | | Common Stock (97.4%) | | Value | |
| Consumer Discretionary (10.4%) | |
| | 115,720 | | | CBS Corporation | | | $6,843,681 | |
| | 244,064 | | | Delphi Automotive plc | | | 13,960,461 | |
| | 517,631 | | | Lowe’s Companies, Inc. | | | 25,767,671 | |
| | 417,650 | | | News Corporation | | | 14,200,100 | |
| | 119,690 | | | Time Warner Cable, Inc. | | | 14,380,753 | |
| | | | | |
| | | | Total | | | 75,152,666 | |
| | | | | |
| |
| Consumer Staples (7.0%) | | | | |
| | 282,240 | | | CVS Caremark Corporation | | | 17,572,262 | |
| | 75,050 | | | Kimberly-Clark Corporation | | | 8,105,400 | |
| | 111,158 | | | Kraft Foods Group, Inc. | | | 6,044,772 | |
| | 333,476 | | | Mondelez International, Inc. | | | 11,218,133 | |
| | 84,337 | | | Philip Morris International, Inc. | | | 7,516,114 | |
| | | | | |
| | | | Total | | | 50,456,681 | |
| | | | | |
| |
| Energy (13.0%) | | | | |
| | 98,259 | | | Chevron Corporation | | | 11,787,149 | |
| | 72,747 | | | EOG Resources, Inc. | | | 12,978,065 | |
| | 178,290 | | | EQT Corporation | | | 15,263,407 | |
| | 546,111 | | | Marathon Oil Corporation | | | 19,255,874 | |
| | 150,300 | | | Schlumberger, Ltd. | | | 14,086,116 | |
| | 339,000 | | | Total SA ADR | | | 20,740,020 | |
| | | | | |
| | | | Total | | | 94,110,631 | |
| | | | | |
| |
| Financials (22.5%) | | | | |
| | 122,967 | | | ACE, Ltd. | | | 11,735,971 | |
| | 150,490 | | | Allstate Corporation | | | 7,984,999 | |
| | 1,641,610 | | | Bank of America Corporation | | | 22,916,876 | |
| | 614,940 | | | Citigroup, Inc. | | | 29,996,773 | |
| | 150,400 | | | Deutsche Bank AG | | | 7,267,328 | |
| | 382,660 | | | Invesco, Ltd. | | | 12,914,775 | |
| | 477,920 | | | MetLife, Inc. | | | 22,610,395 | |
| | 518,180 | | | Morgan Stanley | | | 14,887,311 | |
| | 170,420 | | | State Street Corporation | | | 11,941,329 | |
| | 70,763 | | | SVB Financial Groupa | | | 6,777,680 | |
| | 318,205 | | | Wells Fargo & Company | | | 13,584,172 | |
| | | | | |
| | | | Total | | | 162,617,609 | |
| | | | | |
| |
| Health Care (12.7%) | | | | |
| | 269,940 | | | Baxter International, Inc. | | | 17,780,948 | |
| | 211,976 | | | Covidien plc | | | 13,589,781 | |
| | 116,700 | | | Express Scripts Holding Companya | | | 7,296,084 | |
| | 583,310 | | | Merck & Company, Inc. | | | 26,301,448 | |
| | 310,140 | | | Sanofi ADRb | | | 16,586,287 | |
| | 152,353 | | | UnitedHealth Group, Inc. | | | 10,399,616 | |
| | | | | |
| | | | Total | | | 91,954,164 | |
| | | | | |
| |
| Industrials (9.8%) | | | | |
| | 66,500 | | | Boeing Company | | | 8,678,250 | |
| | 509,000 | | | CSX Corporation | | | 13,264,540 | |
| | 137,726 | | | Honeywell International, Inc. | | | 11,944,976 | |
| | 177,800 | | | Ingersoll-Rand plc | | | 12,006,834 | |
| | 273,490 | | | Jacobs Engineering Group, Inc.a | | | 16,633,662 | |
| | 122,440 | | | Pentair, Ltd. | | | 8,214,500 | |
| | | | | |
| | | | Total | | | 70,742,762 | |
| | | | | |
| |
| Information Technology (13.0%) | | | | |
| | 828,230 | | | Cisco Systems, Inc. | | | 18,635,175 | |
| | 326,981 | | | Microsoft Corporation | | | 11,558,778 | |
| | 245,550 | | | NetApp, Inc. | | | 9,529,796 | |
| | 683,560 | | | Symantec Corporation | | | 15,544,154 | |
| | 158,000 | | | Teradata Corporationa | | | 6,963,060 | |
| | 459,950 | | | Texas Instruments, Inc. | | | 19,354,696 | |
| | 269,233 | | | Xilinx, Inc. | | | 12,228,563 | |
| | | | | |
| | | | Total | | | 93,814,222 | |
| | | | | |
| |
| Materials (3.0%) | | | | |
| | 127,610 | | | Celanese Corporation | | | 7,147,436 | |
| | 191,300 | | | Dow Chemical Company | | | 7,550,611 | |
| | 142,350 | | | Nucor Corporation | | | 7,369,460 | |
| | | | | |
| | | | Total | | | 22,067,507 | |
| | | | | |
| |
| Telecommunications Services (1.6%) | | | | |
| | 236,749 | | | Verizon Communications, Inc. | | | 11,958,192 | |
| | | | | |
| | | | Total | | | 11,958,192 | |
| | | | | |
| |
| Utilities (4.4%) | | | | |
| | 452,840 | | | NiSource, Inc. | | | 14,273,517 | |
| | 418,090 | | | PG&E Corporation | | | 17,497,066 | |
| | | | | |
| | | | Total | | | 31,770,583 | |
| | | | | |
| | | | | | | | |
| | | | | |
| | | | Total Common Stock (cost $523,836,058) | | | 704,645,017 | |
| | | | | |
| | |
| Shares | | | Collateral Held for Securities Loaned (1.4%) | | Value | |
| | 9,844,200 | | | Thrivent Cash Management Trust | | | 9,844,200 | |
| | | | | |
| | | | Total Collateral Held for Securities Loaned (cost $9,844,200) | | | 9,844,200 | |
| | | | | |
| | |
Shares or
Principal
Amount | | | Short-Term Investments (2.5%) | | Value | |
| | | | Thrivent Cash Management Trust | | | | |
| | 18,459,046 | | | 0.070% | | | 18,459,046 | |
| | | | | |
| | | | Total Short-Term Investments (at amortized cost) | | | 18,459,046 | |
| | | | | |
| | | | Total Investments (cost $552,139,304) 101.3% | | $ | 732,948,263 | |
| | | | | |
| | | | Other Assets and Liabilities, Net (1.3%) | | | (9,393,360 | ) |
| | | | | |
| | | | Total Net Assets 100.0% | | $ | 723,554,903 | |
| | | | | |
a | Non-income producing security. |
b | All or a portion of the security is on loan. |
Definitions:
| | |
ADR | | - American Depositary Receipt, which are certificates for an underlying foreign security’s shares held by an issuing U.S. depository bank. |
Unrealized Appreciation (Depreciation)
Gross unrealized appreciation and depreciation of investments, based on cost for federal income tax purposes, were as follows:
| | | | |
Gross unrealized appreciation | | $ | 181,329,151 | |
Gross unrealized depreciation | | | (905,942 | ) |
| | | | |
Net unrealized appreciation (depreciation) | | $ | 180,423,209 | |
| |
Cost for federal income tax purposes | | $ | 552,525,054 | |
The accompanying Notes to Financial Statements are an integral part of this schedule.
196
Large Cap Value Fund
Schedule of Investments as of October 31, 2013
Fair Valuation Measurements
The following table is a summary of the inputs used, as of October 31, 2013, in valuing Large Cap Value Fund’s assets carried at fair value.
| | | | | | | | | | | | | | | | |
Investments in Securities | | Total | | | Level 1 | | | Level 2 | | | Level 3 | |
| | | | |
Common Stock | | | | | | | | | | | | | | | | |
Consumer Discretionary | | | 75,152,666 | | | | 75,152,666 | | | | – | | | | – | |
Consumer Staples | | | 50,456,681 | | | | 50,456,681 | | | | – | | | | – | |
Energy | | | 94,110,631 | | | | 94,110,631 | | | | – | | | | – | |
Financials | | | 162,617,609 | | | | 162,617,609 | | | | – | | | | – | |
Health Care | | | 91,954,164 | | | | 91,954,164 | | | | – | | | | – | |
Industrials | | | 70,742,762 | | | | 70,742,762 | | | | – | | | | – | |
Information Technology | | | 93,814,222 | | | | 93,814,222 | | | | – | | | | – | |
Materials | | | 22,067,507 | | | | 22,067,507 | | | | – | | | | – | |
Telecommunications Services | | | 11,958,192 | | | | 11,958,192 | | | | – | | | | – | |
Utilities | | | 31,770,583 | | | | 31,770,583 | | | | – | | | | – | |
Collateral Held for Securities Loaned | | | 9,844,200 | | | | 9,844,200 | | | | – | | | | – | |
Short-Term Investments | | | 18,459,046 | | | | 18,459,046 | | | | – | | | | – | |
| |
Total | | | $732,948,263 | | | | $732,948,263 | | | | $– | | | | $– | |
| |
There were no significant transfers between Levels during the period ended October 31, 2013. Transfers between Levels are identified as of the end of the period.
Investment in Affiliates
Affiliated issuers, as defined under the Investment Company Act of 1940, include those in which the Fund’s holdings of an issuer represent 5% or more of the outstanding voting securities of an issuer, or any affiliated mutual fund.
A summary of transactions for the fiscal year to date, in Large Cap Value Fund, is as follows:
| | | | | | | | | | | | | | | | | | | | | | | | |
Fund | | Value
October 31, 2012 | | | Gross
Purchases | | | Gross
Sales | | | Shares Held at
October 31, 2013 | | | Value
October 31, 2013 | | | Income Earned
November 1, 2012 -
October 31, 2013 | |
Cash Management Trust- Collateral Investment | | | $7,650,413 | | | | $96,333,450 | | | | $94,139,663 | | | | 9,844,200 | | | | $9,844,200 | | | | $26,119 | |
Cash Management Trust- Short Term Investment | | | 19,252,997 | | | | 77,099,972 | | | | 77,893,923 | | | | 18,459,046 | | | | 18,459,046 | | | | 17,019 | |
Total Value and Income Earned | | | 26,903,410 | | | | | | | | | | | | | | | | 28,303,246 | | | | 43,138 | |
The accompanying Notes to Financial Statements are an integral part of this schedule.
197
Large Cap Stock Fund
Schedule of Investments as of October 31, 2013
| | | | | | | | |
| Shares | | | Common Stock (93.3%) | | Value | |
| Consumer Discretionary (12.3%) | |
| | 121,800 | | | Amazon.com, Inc.a | | | $44,338,854 | |
| | 79,950 | | | AutoZone, Inc.a | | | 34,753,465 | |
| | 240,300 | | | CBS Corporation | | | 14,211,342 | |
| | 813,150 | | | Comcast Corporation | | | 38,689,677 | |
| | 657,880 | | | Las Vegas Sands Corporation | | | 46,196,334 | |
| | 1,061,000 | | | Twenty-First Century Fox, Inc. | | | 36,158,880 | |
| | | | | |
| | | | Total | | | 214,348,552 | |
| | | | | |
|
| Consumer Staples (9.1%) | |
| | 226,050 | | | Anheuser-Busch InBev NV ADR | | | 23,448,167 | |
| | 157,150 | | | British American Tobacco plc ADR | | | 17,363,503 | |
| | 299,600 | | | CVS Caremark Corporation | | | 18,653,096 | |
| | 485,700 | | | Kimberly-Clark Corporation | | | 52,455,600 | |
| | 521,500 | | | Philip Morris International, Inc. | | | 46,476,080 | |
| | | | | |
| | | | Total | | | 158,396,446 | |
| | | | | |
|
| Energy (10.5%) | |
| | 175,965 | | | EOG Resources, Inc. | | | 31,392,156 | |
| | 1,107,900 | | | Marathon Oil Corporation | | | 39,064,554 | |
| | 292,570 | | | Schlumberger, Ltd. | | | 27,419,660 | |
| | 444,750 | | | Total SA ADR | | | 27,209,805 | |
| | 3,569,200 | | | Weatherford International, Ltd.a | | | 58,677,648 | |
| | | | | |
| | | | Total | | | 183,763,823 | |
| | | | | |
|
| Financials (15.8%) | |
| | 280,400 | | | ACE, Ltd. | | | 26,761,376 | |
| | 671,067 | | | Bank of America Corporation | | | 9,368,095 | |
| | 890,750 | | | Citigroup, Inc. | | | 43,450,785 | |
| | 354,050 | | | Deutsche Bank AG | | | 17,107,696 | |
| | 796,900 | | | Invesco, Ltd. | | | 26,895,375 | |
| | 1,182,124 | | | J.P. Morgan Chase & Company | | | 60,926,671 | |
| | 22,400 | | | MasterCard, Inc. | | | 16,063,040 | |
| | 457,106 | | | State Street Corporation | | | 32,029,417 | |
| | 1,040,750 | | | Wells Fargo & Company | | | 44,429,618 | |
| | | | | |
| | | | Total | | | 277,032,073 | |
| | | | | |
|
| Health Care (12.2%) | |
| | 185,660 | | | Baxter International, Inc. | | | 12,229,425 | |
| | 269,620 | | | Covidien plc | | | 17,285,338 | |
| | 469,950 | | | Express Scripts Holding Companya | | | 29,381,274 | |
| | 520,500 | | | Gilead Sciences, Inc.a | | | 36,950,295 | |
| | 1,163,320 | | | Merck & Company, Inc. | | | 52,454,099 | |
| | 261,400 | | | Shire Pharmaceuticals Group plc ADR | | | 34,792,340 | |
| | 445,770 | | | UnitedHealth Group, Inc. | | | 30,428,260 | |
| | | | | |
| | | | Total | | | 213,521,031 | |
| | | | | |
|
| Industrials (9.4%) | |
| | 357,500 | | | Boeing Company | | | 46,653,750 | |
| | 129,800 | | | Fluor Corporation | | | 9,633,756 | |
| | 339,820 | | | Honeywell International, Inc. | | | 29,472,588 | |
| | 610,280 | | | Jacobs Engineering Group, Inc.a | | | 37,117,230 | |
| | 270,700 | | | Union Pacific Corporation | | | 40,983,980 | |
| | | | | |
| | | | Total | | | 163,861,304 | |
| | | | | |
|
| Information Technology (18.7%) | |
| | 161,478 | | | Apple, Inc. | | | 84,348,033 | |
| | 160,861 | | | Citrix Systems, Inc.a | | | 9,133,688 | |
| | 1,420,000 | | | EMC Corporation | | | 34,179,400 | |
| | 326,300 | | | Facebook, Inc.a | | | 16,399,838 | |
| | 49,342 | | | Google, Inc.a | | | 50,850,878 | |
| | 244,478 | | | Microsoft Corporation | | | 8,642,297 | |
| | 565,800 | | | NetApp, Inc. | | | 21,958,698 | |
| | 491,350 | | | QUALCOMM, Inc. | | | 34,134,085 | |
| | 54,251 | | | Salesforce.com, Inc.a | | | 2,894,833 | |
| | 491,600 | | | Symantec Corporation | | | 11,178,984 | |
| | 281,400 | | | Teradata Corporationa | | | 12,401,298 | |
| | 266,800 | | | VMware, Inc.a | | | 21,685,504 | |
| | 424,030 | | | Xilinx, Inc. | | | 19,259,443 | |
| | | | | |
| | | | Total | | | 327,066,979 | |
| | | | | |
|
| Materials (2.3%) | |
| | 363,750 | | | Celanese Corporation | | | 20,373,638 | |
| | 438,800 | | | Dow Chemical Company | | | 17,319,436 | |
| | 112,056 | | | Southern Copper Corporation | | | 3,131,965 | |
| | | | | |
| | | | Total | | | 40,825,039 | |
| | | | | |
|
| Utilities (3.0%) | |
| | 877,780 | | | NiSource, Inc. | | | 27,667,626 | |
| | 613,100 | | | PG&E Corporation | | | 25,658,235 | |
| | | | | |
| | | | Total | | | 53,325,861 | |
| | | | | |
| | | | | | | | |
| | | | | |
| | | | Total Common Stock (cost $1,269,325,187) | | | 1,632,141,108 | |
| | | | | |
| | |
Shares or
Principal
Amount | | | Short-Term Investments (6.4%) | | Value | |
| | | | Federal Home Loan Bank Discount Notes | | | | |
| | 750,000 | | | 0.050%, 12/4/2013b,c | | | 749,966 | |
| | 5,000,000 | | | 0.110%, 12/11/2013b,c | | | 4,999,389 | |
| | 300,000 | | | 0.065%, 2/14/2014b,c | | | 299,943 | |
| | | | Federal Home Loan Mortgage Corporation Discount Notes | | | | |
| | 500,000 | | | 0.050%, 2/18/2014b,c | | | 499,924 | |
| | 100,000 | | | 0.065%, 2/24/2014b,c | | | 99,979 | |
| | | | Thrivent Cash Management Trust | | | | |
| | 104,494,057 | | | 0.070% | | | 104,494,057 | |
| | | | | |
| | | | Total Short-Term Investments (at amortized cost) | | | 111,143,258 | |
| | | | | |
| | | | Total Investments (cost $1,380,468,445) 99.7% | | | $1,743,284,366 | |
| | | | | |
| | | | Other Assets and Liabilities, Net 0.3% | | | 6,041,816 | |
| | | | | |
| | | | Total Net Assets 100.0% | | | $1,749,326,182 | |
| | | | | |
a | Non-income producing security. |
b | The interest rate shown reflects the yield, coupon rate or the discount rate at the date of purchase. |
c | At October 31, 2013, $6,599,203 of investments were held on deposit with the counterparty and pledged as the initial margin deposit for open futures contracts. |
Definitions:
| | | | |
| | ADR | | - American Depositary Receipt, which are certificates for an underlying foreign security’s shares held by an issuing U.S. depository bank. |
The accompanying Notes to Financial Statements are an integral part of this schedule.
198
Large Cap Stock Fund
Schedule of Investments as of October 31, 2013
Unrealized Appreciation (Depreciation)
Gross unrealized appreciation and depreciation of investments, based on cost for federal income tax purposes, were as follows:
| | | | |
Gross unrealized appreciation | | | $363,815,342 | |
Gross unrealized depreciation | | | (8,746,040 | ) |
| | | | |
Net unrealized appreciation (depreciation) | | | $355,069,302 | |
| |
Cost for federal income tax purposes | | | $1,388,215,064 | |
Fair Valuation Measurements
The following table is a summary of the inputs used, as of October 31, 2013, in valuing Large Cap Stock Fund’s assets carried at fair value.
| | | | | | | | | | | | | | | | |
Investments in Securities | | Total | | | Level 1 | | | Level 2 | | | Level 3 | |
| | | | |
Common Stock | | | | | | | | | | | | | | | | |
Consumer Discretionary | | | 214,348,552 | | | | 214,348,552 | | | | – | | | | – | |
Consumer Staples | | | 158,396,446 | | | | 158,396,446 | | | | – | | | | – | |
Energy | | | 183,763,823 | | | | 183,763,823 | | | | – | | | | – | |
Financials | | | 277,032,073 | | | | 277,032,073 | | | | – | | | | – | |
Health Care | | | 213,521,031 | | | | 213,521,031 | | | | – | | | | – | |
Industrials | | | 163,861,304 | | | | 163,861,304 | | | | – | | | | – | |
Information Technology | | | 327,066,979 | | | | 327,066,979 | | | | – | | | | – | |
Materials | | | 40,825,039 | | | | 40,825,039 | | | | – | | | | – | |
Utilities | | | 53,325,861 | | | | 53,325,861 | | | | – | | | | – | |
Short-Term Investments | | | 111,143,258 | | | | 104,494,057 | | | | 6,649,201 | | | | – | |
| |
Total | | | $1,743,284,366 | | | | $1,736,635,165 | | | | $6,649,201 | | | | $– | |
| |
| | | | |
Other Financial Instruments | | Total | | | Level 1 | | | Level 2 | | | Level 3 | |
| | | | |
Asset Derivatives | | | | | | | | | | | | | | | | |
Futures Contracts | | | 4,296,646 | | | | – | | | | 4,296,646 | | | | – | |
| |
Total Asset Derivatives | | | $4,296,646 | | | | $– | | | | $4,296,646 | | | | $– | |
| |
There were no significant transfers between Levels during the period ended October 31, 2013. Transfers between Levels are identified as of the end of the period.
| | | | | | | | | | | | | | | | | | | | |
Futures Contracts | | Number of
Contracts
Long/(Short) | | | Expiration
Date | | | Notional
Principal
Amount | | | Value | | | Unrealized
Gain/(Loss) | |
Eurex EURO STOXX 50 Futures | | | 2,066 | | | | December 2013 | | | | $81,455,917 | | | | $85,752,563 | | | | $4,296,646 | |
Total Futures Contracts | | | | | | | | | | | | | | | | | | | $4,296,646 | |
The following table summarizes the fair value and Statement of Assets and Liabilities location, as of October 31, 2013, for Large Cap Stock Fund’s investments in financial derivative instruments by primary risk exposure as discussed under item (2) Significant Accounting Policies of the Notes to Financial Statements.
| | | | | | |
Derivatives by risk category | | Statement of Assets and Liabilities Location | | Fair Value | |
| | |
Asset Derivatives | | | | | | |
| | |
Equity Contracts | | | | | | |
Futures* | | Net Assets – Net unrealized appreciation/(depreciation) on Futures contracts | | | 4,296,646 | |
Total Equity Contracts | | | | | 4,296,646 | |
| |
Total Asset Derivatives | | | | $ | 4,296,646 | |
| |
* | Includes cumulative appreciation/depreciation of futures contracts as reported in the Schedule of Investments. Only current day’s variation margin is reported within the Statement of Assets and Liabilities. |
The accompanying Notes to Financial Statements are an integral part of this schedule.
199
Large Cap Stock Fund
Schedule of Investments as of October 31, 2013
The following table summarizes the net realized gains/(losses) and Statement of Operations location, for the period ended October 31, 2013, for Large Cap Stock Fund’s investments in financial derivative instruments by primary risk exposure.
| | | | | | |
Derivatives by risk category | | Statement of Operations Location | | Realized Gains/(Losses)
recognized in Income | |
| | |
Equity Contracts | | | | | | |
Futures | | Net realized gains/(losses) on Futures contracts | | | 15,407,355 | |
| | |
Total Equity Contracts | | | | | 15,407,355 | |
| | |
Foreign Exchange Contracts | | | | | | |
Forward Contracts | | Net realized gains/(losses) on Foreign currency transactions | | | 34,073 | |
| | |
Total Foreign Exchange Contracts | | | | | 34,073 | |
| |
Total | | | | | $15,441,428 | |
| |
The following table summarizes the change in net unrealized appreciation/(depreciation) and Statement of Operations location, for the period ended October 31, 2013, for Large Cap Stock Fund’s investments in financial derivative instruments by primary risk exposure.
| | | | | | |
Derivatives by risk category | | Statement of Operations Location | | Change in unrealized
appreciation/(depreciation)
recognized in Income | |
| | |
Equity Contracts | | | | | | |
Futures | | Change in net unrealized appreciation/(depreciation) on Futures contracts | | | 8,078,088 | |
Total Equity Contracts | | | | | 8,078,088 | |
| |
Total | | | | | $8,078,088 | |
| |
The following table presents Large Cap Stock Fund’s average volume of derivative activity during the period ended October 31, 2013.
| | | | | | | | | | | | | | | | |
Derivative Risk Category | | Futures
(Notional)* | | | Futures
(Percentage
of Average
Net Assets) | | | Forwards
(Notional)* | | | Forwards
(Percentage
of Average
Net Assets) | |
Equity Contracts | | | $93,544,291 | | | | 5.7 | % | | | N/A | | | | N/A | |
Foreign Exchange Contracts | | | N/A | | | | N/A | | | | $135,511 | | | | <0.1 | % |
* | Notional amount represents long or short, or both, derivative positions held by the Fund. |
Investment in Affiliates
Affiliated issuers, as defined under the Investment Company Act of 1940, include those in which the Fund’s holdings of an issuer represent 5% or more of the outstanding voting securities of an issuer, or any affiliated mutual fund.
A summary of transactions for the fiscal year to date, in Large Cap Stock Fund, is as follows:
| | | | | | | | | | | | | | | | | | | | | | | | |
Fund | | Value
October 31, 2012 | | | Gross
Purchases | | | Gross
Sales | | | Shares Held at
October 31, 2013 | | | Value
October 31, 2013 | | | Income Earned
November 1, 2012 -
October 31, 2013 | |
Cash Management Trust-Collateral Investment | | | $10,379,100 | | | | $265,241,102 | | | | $275,620,202 | | | | – | | | | $– | | | | $21,700 | |
Cash Management Trust-Short Term Investment | | | 100,658,452 | | | | 277,052,124 | | | | 273,216,519 | | | | 104,494,057 | | | | 104,494,057 | | | | 119,451 | |
Total Value and Income Earned | | | 111,037,552 | | | | | | | | | | | | | | | | 104,494,057 | | | | 141,151 | |
The accompanying Notes to Financial Statements are an integral part of this schedule.
200
High Yield Fund
Schedule of Investments as of October 31, 2013
| | | | | | | | |
Principal
Amount | | | Bank Loans (3.6%)a | | Value | |
| Communications Services (1.5%) | | | | |
| | | | Clear Channel Communications, Inc., Term Loan | | | | |
| $ | 2,442,038 | | | 3.818%, 1/29/2016 | | | $2,367,042 | |
| | 7,202,962 | | | 6.918%, 1/30/2019 | | | 6,843,751 | |
| | | | McGraw-Hill Global Education Holdings, LLC, Term Loan | | | | |
| | 2,338,250 | | | 9.000%, 3/22/2019 | | | 2,377,720 | |
| | | | | |
| | | | Total | | | 11,588,513 | |
| | | | | |
| |
| Consumer Non-Cyclical (1.3%) | | | | |
| | | | Albertsons, LLC, Term Loan | | | | |
| | 2,985,000 | | | 4.750%, 3/21/2019 | | | 2,992,403 | |
| | | | DJO Finance, LLC, Term Loan | | | | |
| | 2,926,777 | | | 4.750%, 9/15/2017 | | | 2,954,815 | |
| | | | HCA, Inc., Term Loan | | | | |
| | 4,270,454 | | | 2.929%, 5/1/2018 | | | 4,275,280 | |
| | | | | |
| | | | Total | | | 10,222,498 | |
| | | | | |
| |
| Financials (0.3%) | | | | |
| | | | Nuveen Investments, Inc., Term Loan | | | | |
| | 2,350,000 | | | 6.500%, 2/28/2019 | | | 2,303,000 | |
| | | | | |
| | | | Total | | | 2,303,000 | |
| | | | | |
| |
| Technology (0.5%) | | | | |
| | | | First Data Corporation Extended, Term Loan | | | | |
| | 3,809,215 | | | 4.170%, 3/23/2018 | | | 3,810,586 | |
| | | | | |
| | | | Total | | | 3,810,586 | |
| | | | | |
| | | | | | | | |
| | | | | |
| | | | Total Bank Loans (cost $27,331,938) | | | 27,924,597 | |
| | | | | |
| | |
Principal
Amount | | | Long-Term Fixed Income (92.5%) | | Value | |
| Asset-Backed Securities (0.4%) | | | | |
| | | | Renaissance Home Equity Loan Trust | | | | |
| | 2,066,080 | | | 5.746%, 5/25/2036 | | | 1,550,744 | |
| | 1,600,000 | | | 6.011%, 5/25/2036 | | | 1,165,947 | |
| | | | | |
| | | | Total | | | 2,716,691 | |
| | | | | |
| |
| Basic Materials (7.9%) | | | | |
| | | | APERAM | | | | |
| | 2,355,000 | | | 7.750%, 4/1/2018b | | | 2,390,325 | |
| | | | Bluescope Steel, Ltd. | | | | |
| | 1,410,000 | | | 7.125%, 5/1/2018b | | | 1,455,825 | |
| | | | CONSOL Energy, Inc. | | | | |
| | 1,700,000 | | | 8.000%, 4/1/2017 | | | 1,802,000 | |
| | 2,430,000 | | | 8.250%, 4/1/2020 | | | 2,657,812 | |
| | | | FMG Resources Pty. Ltd. | | | | |
| | 2,370,000 | | | 7.000%, 11/1/2015b,c | | | 2,458,875 | |
| | 1,410,000 | | | 6.000%, 4/1/2017b,c | | | 1,473,450 | |
| | 2,800,000 | | | 6.875%, 2/1/2018b,c | | | 2,968,000 | |
| | 3,860,000 | | | 8.250%, 11/1/2019b,c | | | 4,284,600 | |
| | | | Graphic Packaging International, Inc. | | | | |
| | 1,400,000 | | | 7.875%, 10/1/2018 | | | 1,522,500 | |
| | 710,000 | | | 4.750%, 4/15/2021 | | | 701,125 | |
| | | | Hexion US Finance Corporation/Hexion Nova Scotia Finance ULC | | | | |
| | 5,630,000 | | | 8.875%, 2/1/2018 | | | 5,798,900 | |
| | | | INEOS Group Holdings SA | | | | |
| | 2,755,000 | | | 6.125%, 8/15/2018b | | | 2,782,550 | |
| | | | Inmet Mining Corporation | | | | |
| | 2,900,000 | | | 8.750%, 6/1/2020b | | | 3,204,500 | |
| | 2,600,000 | | | 7.500%, 6/1/2021b | | | 2,756,000 | |
| | | | Magnetation, LLC | | | | |
| | 2,360,000 | | | 11.000%, 5/15/2018b | | | 2,430,800 | |
| | | | Midwest Vanadium, Pty. Ltd. | | | | |
| | 3,070,000 | | | 11.500%, 2/15/2018d | | | 2,578,800 | |
| | | | Novelis, Inc. | | | | |
| | 3,550,000 | | | 8.750%, 12/15/2020 | | | 3,949,375 | |
| | | | Resolute Forest Products, Inc. | | | | |
| | 2,830,000 | | | 5.875%, 5/15/2023b | | | 2,575,300 | |
| | | | Ryerson, Inc. | | | | |
| | 1,900,000 | | | 9.000%, 10/15/2017 | | | 1,985,500 | |
| | | | Sappi Papier Holding GmbH | | | | |
| | 2,355,000 | | | 8.375%, 6/15/2019b | | | 2,490,413 | |
| | | | Severstal Columbus, LLC | | | | |
| | 3,400,000 | | | 10.250%, 2/15/2018 | | | 3,604,000 | |
| | | | Tembec Industries, Inc. | | | | |
| | 2,820,000 | | | 11.250%, 12/15/2018 | | | 3,080,850 | |
| | | | Westmoreland Coal Company | | | | |
| | 2,360,000 | | | 10.750%, 2/1/2018 | | | 2,560,600 | |
| | | | | |
| | | | Total | | | 61,512,100 | |
| | | | | |
| |
| Capital Goods (7.7%) | | | | |
| | | | Case New Holland, Inc. | | | | |
| | 2,210,000 | | | 7.875%, 12/1/2017 | | | 2,616,087 | |
| | | | Cemex Finance, LLC | | | | |
| | 1,870,000 | | | 9.375%, 10/12/2017b | | | 2,099,075 | |
| | | | Cemex SAB de CV | | | | |
| | 2,370,000 | | | 9.000%, 1/11/2018b | | | 2,577,375 | |
| | 3,220,000 | | | 4.999%, 10/15/2018b,c,e | | | 3,308,550 | |
| | | | CNH Capital, LLC | | | | |
| | 1,850,000 | | | 3.625%, 4/15/2018 | | | 1,875,438 | |
| | | | EnergySolutions, Inc. | | | | |
| | 2,350,000 | | | 10.750%, 8/15/2018 | | | 2,535,063 | |
| | | | Liberty Tire Recycling | | | | |
| | 1,870,000 | | | 11.000%, 10/1/2016d | | | 1,907,400 | |
| | | | Manitowoc Company, Inc. | | | | |
| | 4,270,000 | | | 8.500%, 11/1/2020 | | | 4,846,450 | |
| | | | Milacron, LLC | | | | |
| | 2,360,000 | | | 7.750%, 2/15/2021b | | | 2,466,200 | |
| | | | Nortek, Inc. | | | | |
| | 2,840,000 | | | 10.000%, 12/1/2018 | | | 3,131,100 | |
| | 3,360,000 | | | 8.500%, 4/15/2021 | | | 3,683,400 | |
| | | | Owens-Illinois, Inc. | | | | |
| | 3,030,000 | | | 7.800%, 5/15/2018 | | | 3,495,862 | |
| | | | Reynolds Group Issuer, Inc. | | | | |
| | 1,420,000 | | | 9.000%, 4/15/2019 | | | 1,519,400 | |
| | 1,840,000 | | | 9.875%, 8/15/2019 | | | 2,035,500 | |
| | 1,900,000 | | | 5.750%, 10/15/2020 | | | 1,961,750 | |
| | 2,370,000 | | | 8.250%, 2/15/2021c | | | 2,464,800 | |
| | | | RSC Equipment Rental, Inc. | | | | |
| | 2,780,000 | | | 8.250%, 2/1/2021 | | | 3,148,350 | |
| | | | Safeway Group Holding, LLC | | | | |
| | 2,825,000 | | | 7.000%, 5/15/2018b | | | 2,923,875 | |
| | | | Silgan Holdings, Inc. | | | | |
| | 3,530,000 | | | 5.000%, 4/1/2020 | | | 3,512,350 | |
| | | | Tekni-Plex, Inc. | | | | |
| | 2,388,000 | | | 9.750%, 6/1/2019b | | | 2,698,440 | |
| | | | United Rentals North America, Inc. | | | | |
| | 930,000 | | | 7.375%, 5/15/2020 | | | 1,036,950 | |
The accompanying Notes to Financial Statements are an integral part of this schedule.
201
High Yield Fund
Schedule of Investments as of October 31, 2013
| | | | | | | | |
Principal
Amount | | | Long-Term Fixed Income (92.5%) | | Value | |
| Capital Goods (7.7%) - continued | | | | |
| | | | UR Financing Escrow Corporation | | | | |
| $ | 3,750,000 | | | 7.625%, 4/15/2022 | | | $4,200,000 | |
| | | | | |
| | | | Total | | | 60,043,415 | |
| | | | | |
| |
| Communications Services (16.3%) | | | | |
| | | | Altice Finco SA | | | | |
| | 950,000 | | | 9.875%, 12/15/2020b,c | | | 1,061,625 | |
| | | | AMC Networks, Inc. | | | | |
| | 4,190,000 | | | 7.750%, 7/15/2021 | | | 4,713,750 | |
| | | | CCO Holdings, LLC | | | | |
| | 3,750,000 | | | 7.250%, 10/30/2017 | | | 3,965,625 | |
| | 1,390,000 | | | 7.000%, 1/15/2019 | | | 1,473,400 | |
| | 700,000 | | | 7.375%, 6/1/2020 | | | 764,750 | |
| | | | CenturyLink, Inc. | | | | |
| | 570,000 | | | 5.625%, 4/1/2020 | | | 579,262 | |
| | | | Cequel Communications Escrow 1, LLC | | | | |
| | 3,180,000 | | | 6.375%, 9/15/2020b | | | 3,299,250 | |
| | | | Clear Channel Worldwide Holdings, Inc. | | | | |
| | 5,000,000 | | | 6.500%, 11/15/2022 | | | 5,250,000 | |
| | | | Digicel, Ltd. | | | | |
| | 3,790,000 | | | 8.250%, 9/1/2017b | | | 3,947,285 | |
| | 1,470,000 | | | 7.000%, 2/15/2020b | | | 1,492,050 | |
| | 4,210,000 | | | 6.000%, 4/15/2021b | | | 4,083,700 | |
| | | | DISH DBS Corporation | | | | |
| | 2,355,000 | | | 5.125%, 5/1/2020 | | | 2,384,438 | |
| | | | Eileme 2 AB | | | | |
| | 3,740,000 | | | 11.625%, 1/31/2020d | | | 4,366,450 | |
| | | | Frontier Communications Corporation | | | | |
| | 2,810,000 | | | 8.250%, 4/15/2017 | | | 3,249,062 | |
| | | | Gray Television, Inc. | | | | |
| | 2,290,000 | | | 7.500%, 10/1/2020b | | | 2,398,775 | |
| | | | Hughes Satellite Systems Corporation | | | | |
| | 4,400,000 | | �� | 6.500%, 6/15/2019 | | | 4,719,000 | |
| | | | Intelsat Jackson Holdings SA | | | | |
| | 6,530,000 | | | 7.250%, 10/15/2020 | | | 7,085,050 | |
| | 1,420,000 | | | 6.625%, 12/15/2022 | | | 1,448,400 | |
| | | | Intelsat Luxembourg SA | | | | |
| | 3,290,000 | | | 7.750%, 6/1/2021b | | | 3,470,950 | |
| | | | Level 3 Financing, Inc. | | | | |
| | 3,700,000 | | | 8.625%, 7/15/2020 | | | 4,190,250 | |
| | 1,380,000 | | | 6.125%, 1/15/2021b,f | | | 1,404,150 | |
| | | | McGraw-Hill Global Education Holdings, LLC | | | | |
| | 4,705,000 | | | 9.750%, 4/1/2021b | | | 5,081,400 | |
| | | | MDC Partners, Inc. | | | | |
| | 2,350,000 | | | 6.750%, 4/1/2020b | | | 2,444,000 | |
| | | | NII International Telecom Sarl | | | | |
| | 2,360,000 | | | 7.875%, 8/15/2019b | | | 2,053,200 | |
| | 1,375,000 | | | 11.375%, 8/15/2019b | | | 1,306,250 | |
| | | | Satmex Escrow SA de CV | | | | |
| | 4,770,000 | | | 9.500%, 5/15/2017 | | | 5,163,525 | |
| | | | Sprint Nextel Corporation | | | | |
| | 7,120,000 | | | 9.000%, 11/15/2018b | | | 8,633,000 | |
| | 2,530,000 | | | 7.000%, 3/1/2020b | | | 2,808,300 | |
| | | | T-Mobile USA, Inc. | | | | |
| | 3,210,000 | | | 6.542%, 4/28/2020 | | | 3,402,600 | |
| | 690,000 | | | 6.633%, 4/28/2021 | | | 729,675 | |
| | 690,000 | | | 6.731%, 4/28/2022 | | | 728,813 | |
| | | | Unitymedia Hessen GmbH & Company KG | | | | |
| | 4,650,000 | | | 5.500%, 1/15/2023b | | | 4,591,875 | |
| | | | Univision Communications, Inc. | | | | |
| | 3,000,000 | | | 6.750%, 9/15/2022b | | | 3,270,000 | |
| | | | UPC Holding BV | | | | |
| | 4,000,000 | | | 9.875%, 4/15/2018b | | | 4,330,000 | |
| | | | UPCB Finance V, Ltd. | | | | |
| | 1,400,000 | | | 7.250%, 11/15/2021b | | | 1,536,500 | |
| | | | Verizon Communications, Inc. | | | | |
| | 1,440,000 | | | 5.150%, 9/15/2023 | | | 1,562,383 | |
| | | | Virgin Media Finance plc | | | | |
| | 1,042,000 | | | 8.375%, 10/15/2019 | | | 1,137,082 | |
| | | | WideOpenWest Finance, LLC | | | | |
| | 4,880,000 | | | 10.250%, 7/15/2019 | | | 5,392,400 | |
| | | | Wind Acquisition Finance SA | | | | |
| | 4,240,000 | | | 11.750%, 7/15/2017b | | | 4,505,000 | |
| | | | Zayo Group, LLC | | | | |
| | 3,075,000 | | | 8.125%, 1/1/2020 | | | 3,367,125 | |
| | | | | |
| | | | Total | | | 127,390,350 | |
| | | | | |
| |
| Consumer Cyclical (14.2%) | | | | |
| | | | Algeco Scotsman Global Finance plc | | | | |
| | 3,320,000 | | | 8.500%, 10/15/2018b,c | | | 3,560,700 | |
| | | | Beazer Homes USA, Inc. | | | | |
| | 950,000 | | | 9.125%, 6/15/2018 | | | 1,014,125 | |
| | 3,470,000 | | | 9.125%, 5/15/2019 | | | 3,704,225 | |
| | | | Best Buy Company, Inc. | | | | |
| | 2,360,000 | | | 5.000%, 8/1/2018 | | | 2,475,050 | |
| | | | Brookfield Residential Properties, Inc. | | | | |
| | 2,370,000 | | | 6.500%, 12/15/2020b | | | 2,441,100 | |
| | 1,890,000 | | | 6.125%, 7/1/2022b | | | 1,875,825 | |
| | | | Burlington Coat Factory Warehouse Corporation | | | | |
| | 3,350,000 | | | 10.000%, 2/15/2019 | | | 3,752,000 | |
| | | | Choice Hotels International, Inc. | | | | |
| | 5,721,000 | | | 5.750%, 7/1/2022 | | | 6,021,352 | |
| | | | Chrysler Group, LLC | | | | |
| | 2,230,000 | | | 8.000%, 6/15/2019 | | | 2,469,725 | |
| | 1,900,000 | | | 8.250%, 6/15/2021c | | | 2,149,375 | |
| | | | Cinemark USA, Inc. | | | | |
| | 4,205,000 | | | 4.875%, 6/1/2023 | | | 4,005,263 | |
| | | | CST Brands, Inc. | | | | |
| | 1,890,000 | | | 5.000%, 5/1/2023b | | | 1,828,575 | |
| | | | DineEquity, Inc. | | | | |
| | 3,800,000 | | | 9.500%, 10/30/2018c | | | 4,227,500 | |
| | | | Eldorado Resorts, LLC | | | | |
| | 4,330,000 | | | 8.625%, 6/15/2019d | | | 4,557,325 | |
| | | | General Motors Financial Company, Inc. | | | | |
| | 2,600,000 | | | 4.750%, 8/15/2017b | | | 2,749,500 | |
| | 1,480,000 | | | 3.250%, 5/15/2018b | | | 1,474,450 | |
| | 1,190,000 | | | 6.750%, 6/1/2018 | | | 1,347,675 | |
| | | | GLP Capital, LP | | | | |
| | 2,755,000 | | | 5.375%, 11/1/2023b | | | 2,782,550 | |
| | | | Hilton Worldwide Finance, LLC | | | | |
| | 2,420,000 | | | 5.625%, 10/15/2021b | | | 2,486,550 | |
| | | | Jaguar Land Rover Automotive plc | | | | |
| | 950,000 | | | 5.625%, 2/1/2023b,c | | | 942,875 | |
| | | | KB Home | | | | |
| | 930,000 | | | 7.250%, 6/15/2018 | | | 1,013,700 | |
The accompanying Notes to Financial Statements are an integral part of this schedule.
202
High Yield Fund
Schedule of Investments as of October 31, 2013
| | | | | | | | |
Principal
Amount | | | Long-Term Fixed Income (92.5%) | | Value | |
| Consumer Cyclical (14.2%) - continued | | | | |
| | $1,750,000 | | | 8.000%, 3/15/2020c | | | $1,925,000 | |
| | 1,420,000 | | | 7.500%, 9/15/2022 | | | 1,487,450 | |
| | | | L Brands, Inc. | | | | |
| | 1,430,000 | | | 6.625%, 4/1/2021 | | | 1,573,000 | |
| | 1,640,000 | | | 5.625%, 2/15/2022 | | | 1,689,200 | |
| | | | Lear Corporation | | | | |
| | 1,560,000 | | | 7.875%, 3/15/2018 | | | 1,653,600 | |
| | 1,560,000 | | | 8.125%, 3/15/2020 | | | 1,739,400 | |
| | 990,000 | | | 4.750%, 1/15/2023b | | | 957,825 | |
| | | | LKQ Corporation | | | | |
| | 2,590,000 | | | 4.750%, 5/15/2023b | | | 2,466,975 | |
| | | | MCE Finance, Ltd. | | | | |
| | 2,130,000 | | | 5.000%, 2/15/2021b | | | 2,108,700 | |
| | | | Mohegan Tribal Gaming Authority | | | | |
| | 4,180,000 | | | 9.750%, 9/1/2021b,c | | | 4,503,950 | |
| | | | New Cotai, LLC | | | | |
| | 3,295,000 | | | 10.625%, 5/1/2019d | | | 3,327,950 | |
| | | | Rite Aid Corporation | | | | |
| | 2,835,000 | | | 6.750%, 6/15/2021c | | | 2,998,013 | |
| | | | ROC Finance, LLC | | | | |
| | 4,220,000 | | | 12.125%, 9/1/2018b | | | 4,557,600 | |
| | | | Seminole Indian Tribe of Florida | | | | |
| | 3,775,000 | | | 7.804%, 10/1/2020b | | | 4,077,000 | |
| | | | Seven Seas Cruises S de RL, LLC | | | | |
| | 4,730,000 | | | 9.125%, 5/15/2019b | | | 5,197,087 | |
| | | | Studio City Finance, Ltd. | | | | |
| | 4,760,000 | | | 8.500%, 12/1/2020b | | | 5,259,800 | |
| | | | Tunica-Biloxi Gaming Authority | | | | |
| | 4,230,000 | | | 9.000%, 11/15/2015d | | | 3,828,150 | |
| | | | West Corporation | | | | |
| | 3,850,000 | | | 8.625%, 10/1/2018 | | | 4,196,500 | |
| | | | | |
| | | | Total | | | 110,426,640 | |
| | | | | |
| |
| Consumer Non-Cyclical (10.4%) | | | | |
| | | | Aviv Healthcare Properties, LP | | | | |
| | 1,300,000 | | | 6.000%, 10/15/2021b | | | 1,332,500 | |
| | | | B&G Foods, Inc. | | | | |
| | 3,300,000 | | | 4.625%, 6/1/2021 | | | 3,221,625 | |
| | | | Biomet, Inc. | | | | |
| | 2,725,000 | | | 6.500%, 8/1/2020 | | | 2,895,313 | |
| | 1,885,000 | | | 6.500%, 10/1/2020 | | | 1,960,400 | |
| | | | CHS/Community Health Systems, Inc. | | | | |
| | 1,415,000 | | | 7.125%, 7/15/2020 | | | 1,489,288 | |
| | | | Emergency Medical Services Corporation | | | | |
| | 4,130,000 | | | 8.125%, 6/1/2019 | | | 4,486,419 | |
| | | | Endo Health Solutions, Inc. | | | | |
| | 3,740,000 | | | 7.250%, 1/15/2022 | | | 3,983,100 | |
| | | | Fresenius Medical Care US Finance, Inc. | | | | |
| | 2,340,000 | | | 6.500%, 9/15/2018b | | | 2,626,650 | |
| | 1,850,000 | | | 5.750%, 2/15/2021b | | | 1,956,375 | |
| | | | HCA, Inc. | | | | |
| | 2,355,000 | | | 6.500%, 2/15/2020 | | | 2,619,937 | |
| | 2,360,000 | | | 5.875%, 3/15/2022 | | | 2,483,900 | |
| | 1,640,000 | | | 4.750%, 5/1/2023 | | | 1,580,550 | |
| | | | Health Management Associates, Inc. | | | | |
| | 3,845,000 | | | 7.375%, 1/15/2020 | | | 4,287,175 | |
| | | | Healthcare Technology Intermediate, Inc. | | | | |
| | 2,076,000 | | | 7.375%, 9/1/2018b | | | 2,146,065 | |
| | | | JBS Finance II, Ltd. | | | | |
| | 3,950,000 | | | 8.250%, 1/29/2018d | | | 4,137,625 | |
| | | | JBS USA, LLC | | | | |
| | 2,100,000 | | | 7.250%, 6/1/2021b | | | 2,152,500 | |
| | | | Libbey Glass, Inc. | | | | |
| | 2,979,000 | | | 6.875%, 5/15/2020 | | | 3,202,425 | |
| | | | Michael Foods Holding, Inc. | | | | |
| | 2,268,000 | | | 8.500%, 7/15/2018b | | | 2,387,070 | |
| | | | Revlon Consumer Products Corporation | | | | |
| | 4,240,000 | | | 5.750%, 2/15/2021b | | | 4,187,000 | |
| | | | Spectrum Brands Escrow Corporation | | | | |
| | 1,930,000 | | | 6.375%, 11/15/2020b | | | 2,050,625 | |
| | 1,820,000 | | | 6.625%, 11/15/2022b | | | 1,942,850 | |
| | | | Teleflex, Inc. | | | | |
| | 3,790,000 | | | 6.875%, 6/1/2019 | | | 3,960,550 | |
| | | | Tenet Healthcare Corporation | | | | |
| | 6,700,000 | | | 8.125%, 4/1/2022b | | | 7,336,500 | |
| | | | Valeant Pharmaceuticals International | | | | |
| | 2,400,000 | | | 7.250%, 7/15/2022b | | | 2,610,000 | |
| | | | Visant Corporation | | | | |
| | 4,360,000 | | | 10.000%, 10/1/2017 | | | 4,011,200 | |
| | | | VPII Escrow Corporation | | | | |
| | 1,650,000 | | | 7.500%, 7/15/2021b | | | 1,831,500 | |
| | | | Warner Chilcott Company, LLC | | | | |
| | 4,115,000 | | | 7.750%, 9/15/2018 | | | 4,485,350 | |
| | | | | |
| | | | Total | | | 81,364,492 | |
| | | | | |
| |
| Energy (12.8%) | | | | |
| | | | Bonanza Creek Energy, Inc. | | | | |
| | 2,125,000 | | | 6.750%, 4/15/2021 | | | 2,252,500 | |
| | | | Bristow Group, Inc. | | | | |
| | 3,580,000 | | | 6.250%, 10/15/2022 | | | 3,759,000 | |
| | | | Chaparral Energy, Inc. | | | | |
| | 3,850,000 | | | 7.625%, 11/15/2022 | | | 4,158,000 | |
| | | | Concho Resources, Inc. | | | | |
| | 4,260,000 | | | 6.500%, 1/15/2022 | | | 4,654,050 | |
| | | | Continental Resources, Inc. | | | | |
| | 1,880,000 | | | 5.000%, 9/15/2022 | | | 1,957,550 | |
| | 2,585,000 | | | 4.500%, 4/15/2023 | | | 2,607,619 | |
| | | | Crestwood Midstream Partners, LP | | | | |
| | 2,065,000 | | | 6.125%, 3/1/2022b,f | | | 2,111,463 | |
| | | | Diamondback Energy, Inc. | | | | |
| | 2,510,000 | | | 7.625%, 10/1/2021b | | | 2,622,950 | |
| | | | Energy XXI Gulf Coast, Inc. | | | | |
| | 1,890,000 | | | 9.250%, 12/15/2017 | | | 2,107,350 | |
| | 1,420,000 | | | 7.750%, 6/15/2019 | | | 1,519,400 | |
| | | | Exterran Partners, LP | | | | |
| | 3,720,000 | | | 6.000%, 4/1/2021b | | | 3,701,400 | |
| | | | Halcon Resources Corporation | | | | |
| | 4,750,000 | | | 8.875%, 5/15/2021 | | | 4,945,937 | |
| | | | Harvest Operations Corporation | | | | |
| | 4,210,000 | | | 6.875%, 10/1/2017 | | | 4,520,487 | |
| | | | Hornbeck Offshore Services, Inc. | | | | |
| | 1,410,000 | | | 5.000%, 3/1/2021 | | | 1,385,325 | |
| | | | Kodiak Oil & Gas Corporation | | | | |
| | 2,820,000 | | | 5.500%, 1/15/2021b,c | | | 2,890,500 | |
| | 1,420,000 | | | 5.500%, 2/1/2022b | | | 1,448,400 | |
| | | | Linn Energy, LLC | | | | |
| | 1,750,000 | | | 8.625%, 4/15/2020 | | | 1,863,750 | |
| | 1,930,000 | | | 7.750%, 2/1/2021 | | | 1,992,725 | |
The accompanying Notes to Financial Statements are an integral part of this schedule.
203
High Yield Fund
Schedule of Investments as of October 31, 2013
| | | | | | | | |
Principal
Amount | | | Long-Term Fixed Income (92.5%) | | Value | |
| Energy (12.8%) - continued | | | | |
| | | | Markwest Energy Partners, LP | | | | |
| $ | 1,521,000 | | | 6.250%, 6/15/2022 | | | $1,650,285 | |
| | | | MEG Energy Corporation | | | | |
| | 945,000 | | | 6.500%, 3/15/2021b | | | 986,344 | |
| | 2,840,000 | | | 6.375%, 1/30/2023b | | | 2,857,750 | |
| | 1,200,000 | | | 7.000%, 3/31/2024b | | | 1,227,000 | |
| | | | Memorial Production Partners, LP | | | | |
| | 2,830,000 | | | 7.625%, 5/1/2021 | | | 2,872,450 | |
| | | | Northern Oil and Gas, Inc. | | | | |
| | 3,535,000 | | | 8.000%, 6/1/2020 | | | 3,658,725 | |
| | | | Northern Tier Energy, LLC | | | | |
| | 2,980,000 | | | 7.125%, 11/15/2020b | | | 3,039,600 | |
| | | | Oasis Petroleum, Inc. | | | | |
| | 2,430,000 | | | 7.250%, 2/1/2019 | | | 2,612,250 | |
| | 1,410,000 | | | 6.500%, 11/1/2021 | | | 1,526,325 | |
| | 1,000,000 | | | 6.875%, 3/15/2022b | | | 1,080,000 | |
| | | | Offshore Group Investment, Ltd. | | | | |
| | 3,770,000 | | | 7.125%, 4/1/2023 | | | 3,835,975 | |
| | | | Pacific Drilling V, Ltd. | | | | |
| | 3,190,000 | | | 7.250%, 12/1/2017b | | | 3,469,125 | |
| | | | Plains Exploration & Production Company | | | | |
| | 1,500,000 | | | 6.750%, 2/1/2022 | | | 1,649,475 | |
| | | | Precision Drilling Corporation | | | | |
| | 2,200,000 | | | 6.625%, 11/15/2020 | | | 2,343,000 | |
| | 940,000 | | | 6.500%, 12/15/2021 | | | 1,001,100 | |
| | | | QEP Resources, Inc. | | | | |
| | 3,165,000 | | | 6.875%, 3/1/2021 | | | 3,386,550 | |
| | | | Range Resources Corporation | | | | |
| | 3,760,000 | | | 5.000%, 3/15/2023 | | | 3,750,600 | |
| | | | SESI, LLC | | | | |
| | 1,550,000 | | | 6.375%, 5/1/2019 | | | 1,643,000 | |
| | 2,800,000 | | | 7.125%, 12/15/2021 | | | 3,097,500 | |
| | | | United Refining Company | | | | |
| | 2,789,000 | | | 10.500%, 2/28/2018 | | | 3,109,735 | |
| | | | Western Refining, Inc. | | | | |
| | 940,000 | | | 6.250%, 4/1/2021 | | | 942,350 | |
| | | | | |
| | | | Total | | | 100,237,545 | |
| | | | | |
| |
| Financials (7.3%) | | | | |
| | | | Ally Financial, Inc. | | | | |
| | 2,910,000 | | | 7.500%, 9/15/2020 | | | 3,404,700 | |
| | | | Aviv Healthcare Properties, LP | | | | |
| | 4,730,000 | | | 7.750%, 2/15/2019 | | | 5,102,488 | |
| | | | Banco do Brasil SA/Cayman Islands | | | | |
| | 1,250,000 | | | 6.250%, 12/31/2049b,g | | | 1,050,000 | |
| | | | BBVA International Preferred SA Unipersonal | | | | |
| | 1,415,000 | | | 5.919%, 12/29/2049g | | | 1,330,100 | |
| | | | Citigroup, Inc. | | | | |
| | 1,500,000 | | | 5.350%, 4/29/2049g | | | 1,350,000 | |
| | | | Community Choice Financial, Inc. | | | | |
| | 2,380,000 | | | 10.750%, 5/1/2019 | | | 2,261,000 | |
| | | | CyrusOne, LP | | | | |
| | 3,460,000 | | | 6.375%, 11/15/2022 | | | 3,485,950 | |
| | | | DDR Corporation | | | | |
| | 720,000 | | | 4.625%, 7/15/2022 | | | 745,530 | |
| | | | Denali Borrower, LLC | | | | |
| | 4,890,000 | | | 5.625%, 10/15/2020b | | | 4,841,100 | |
| | | | Developers Diversified Realty Corporation | | | | |
| | 2,810,000 | | | 7.875%, 9/1/2020 | | | 3,489,705 | |
| | | | Icahn Enterprises, LP | | | | |
| | 4,720,000 | | | 6.000%, 8/1/2020b | | | 4,838,000 | |
| | | | International Lease Finance Corporation | | | | |
| | 2,250,000 | | | 8.625%, 9/15/2015 | | | 2,503,125 | |
| | 1,400,000 | | | 8.875%, 9/1/2017 | | | 1,660,750 | |
| | | | Jefferies Finance, LLC | | | | |
| | 2,350,000 | | | 7.375%, 4/1/2020d | | | 2,414,625 | |
| | | | Mariposa Borrower, Inc. | | | | |
| | 2,760,000 | | | 8.000%, 10/15/2021b | | | 2,825,550 | |
| | 1,840,000 | | | 8.750%, 10/15/2021b | | | 1,890,600 | |
| | | | Omega Healthcare Investors, Inc. | | | | |
| | 5,600,000 | | | 5.875%, 3/15/2024 | | | 5,740,000 | |
| | | | PNC Financial Services Group, Inc. | | | | |
| | 480,000 | | | 4.850%, 5/29/2049c,g | | | 438,000 | |
| | | | Royal Bank of Scotland Group plc | | | | |
| | 1,885,000 | | | 7.640%, 3/29/2049g | | | 1,804,887 | |
| | | | Speedy Cash Intermediate Holdings Corporation | | | | |
| | 2,720,000 | | | 10.750%, 5/15/2018b | | | 2,910,400 | |
| | | | TMX Finance, LLC | | | | |
| | 1,415,000 | | | 8.500%, 9/15/2018b | | | 1,503,438 | |
| | | | XL Group plc | | | | |
| | 1,500,000 | | | 6.500%, 12/31/2049g | | | 1,471,500 | |
| | | | | |
| | | | Total | | | 57,061,448 | |
| | | | | |
| |
| Foreign Government (0.3%) | | | | |
| | | | Eksportfinans ASA | | | | |
| | 2,330,000 | | | 2.375%, 5/25/2016 | | | 2,270,585 | |
| | | | | |
| | | | Total | | | 2,270,585 | |
| | | | | |
| |
| Technology (5.3%) | | | | |
| | | | Alliance Data Systems Corporation | | | | |
| | 3,810,000 | | | 5.250%, 12/1/2017b | | | 3,929,063 | |
| | 3,035,000 | | | 6.375%, 4/1/2020b | | | 3,163,987 | |
| | | | Amkor Technology, Inc. | | | | |
| | 2,870,000 | | | 6.625%, 6/1/2021c | | | 2,870,000 | |
| | | | BMC Software Finance, Inc. | | | | |
| | 4,220,000 | | | 8.125%, 7/15/2021b | | | 4,462,650 | |
| | | | Brocade Communications Systems, Inc. | | | | |
| | 3,410,000 | | | 4.625%, 1/15/2023b | | | 3,188,350 | |
| | | | First Data Corporation | | | | |
| | 3,304,000 | | | 11.250%, 3/31/2016c | | | 3,320,520 | |
| | 500,000 | | | 7.375%, 6/15/2019b | | | 538,125 | |
| | 1,629,000 | | | 12.625%, 1/15/2021 | | | 1,879,459 | |
| | 460,000 | | | 11.750%, 8/15/2021b,f | | | 468,050 | |
| | | | Flextronics International, Ltd. | | | | |
| | 2,000,000 | | | 4.625%, 2/15/2020 | | | 2,005,000 | |
| | | | Freescale Semiconductor, Inc. | | | | |
| | 1,890,000 | | | 8.050%, 2/1/2020c | | | 2,036,475 | |
| | 2,089,000 | | | 10.750%, 8/1/2020 | | | 2,376,237 | |
| | | | Infor US, Inc. | | | | |
| | 2,910,000 | | | 9.375%, 4/1/2019 | | | 3,288,300 | |
| | | | NXP BV/NXP Funding, LLC | | | | |
| | 3,285,000 | | | 5.750%, 3/15/2023b | | | 3,383,550 | |
| | | | Sensata Technologies BV | | | | |
| | 1,900,000 | | | 6.500%, 5/15/2019b | | | 2,052,000 | |
| | 2,350,000 | | | 4.875%, 10/15/2023b | | | 2,279,500 | |
| | | | | |
| | | | Total | | | 41,241,266 | |
| | | | | |
The accompanying Notes to Financial Statements are an integral part of this schedule.
204
High Yield Fund
Schedule of Investments as of October 31, 2013
| | | | | | | | |
Principal
Amount | | | Long-Term Fixed Income (92.5%) | | Value | |
| Transportation (4.7%) | |
| | | | Avis Budget Car Rental, LLC | | | | |
| | $4,170,000 | | | 8.250%, 1/15/2019 | | | $4,545,300 | |
| | | | Avis Budget Group, Inc. | | | | |
| | 3,150,000 | | | 5.500%, 4/1/2023 | | | 3,087,000 | |
| | | | Continental Airlines, Inc. | | | | |
| | 2,750,000 | | | 6.750%, 9/15/2015b | | | 2,832,500 | |
| | 1,440,000 | | | 6.125%, 4/29/2018 | | | 1,486,800 | |
| | | | Delta Air Lines 2012-1 Class B Pass Through Trust | | | | |
| | 2,570,459 | | | 6.875%, 5/7/2019b | | | 2,705,408 | |
| | | | HDTFS, Inc. | | | | |
| | 710,000 | | | 6.250%, 10/15/2022 | | | 743,725 | |
| | | | Hornbeck Offshore Services, Inc. | | | | |
| | 1,885,000 | | | 5.875%, 4/1/2020 | | | 1,936,838 | |
| | | | Navios Maritime Acquisition Corporation | | | | |
| | 1,430,000 | | | 8.625%, 11/1/2017 | | | 1,499,355 | |
| | | | Navios Maritime Holdings, Inc. | | | | |
| | 2,590,000 | | | 8.875%, 11/1/2017 | | | 2,709,787 | |
| | 2,030,000 | | | 8.125%, 2/15/2019c | | | 2,060,450 | |
| | 1,605,000 | | | 8.125%, 11/15/2021b,f | | | 1,621,050 | |
| | | | Navios South American Logistics, Inc. | | | | |
| | 2,180,000 | | | 9.250%, 4/15/2019 | | | 2,359,850 | |
| | | | Ultrapetrol Bahamas, Ltd. | | | | |
| | 920,000 | | | 8.875%, 6/15/2021b | | | 978,650 | |
| | 2,360,000 | | | 8.875%, 6/15/2021b | | | 2,525,200 | |
| | | | United Air Lines, Inc. | | | | |
| | 1,251,862 | | | 9.750%, 1/15/2017 | | | 1,439,641 | |
| | | | United Airlines 2013-1 Class B Pass Through Trust | | | | |
| | 1,440,000 | | | 5.375%, 8/15/2021 | | | 1,432,800 | |
| | | | United Continental Holdings, Inc. | | | | |
| | 470,000 | | | 6.375%, 6/1/2018c | | | 487,625 | |
| | | | US Airways Group, Inc. | | | | |
| | 2,400,000 | | | 6.125%, 6/1/2018 | | | 2,361,000 | |
| | | | | |
| | | | Total | | | 36,812,979 | |
| | | | | |
|
| Utilities (5.2%) | |
| | | | Access Midstream Partners, LP | | | | |
| | 1,280,000 | | | 4.875%, 5/15/2023 | | | 1,273,600 | |
| | | | AES Corporation | | | | |
| | 2,350,000 | | | 7.375%, 7/1/2021 | | | 2,661,375 | |
| | | | Atlas Pipeline Partners, LP | | | | |
| | 3,770,000 | | | 4.750%, 11/15/2021b | | | 3,543,800 | |
| | | | Calpine Corporation | | | | |
| | 1,540,000 | | | 5.875%, 1/15/2024b | | | 1,543,850 | |
| | | | Chesapeake Midstream Partners, LP | | | | |
| | 810,000 | | | 6.125%, 7/15/2022 | | | 868,725 | |
| | | | Covanta Holding Corporation | | | | |
| | 2,400,000 | | | 7.250%, 12/1/2020 | | | 2,596,236 | |
| | 1,650,000 | | | 6.375%, 10/1/2022 | | | 1,705,095 | |
| | | | Crosstex Energy, LP/Crosstex Energy Finance Corporation | | | | |
| | 3,270,000 | | | 8.875%, 2/15/2018 | | | 3,482,550 | |
| | 940,000 | | | 7.125%, 6/1/2022 | | | 1,078,650 | |
| | | | Electricite de France SA | | | | |
| | 2,500,000 | | | 5.250%, 1/29/2049b,g | | | 2,457,500 | |
| | | | Energy Future Intermediate Holding Company, LLC | | | | |
| | 2,360,000 | | | 12.250%, 3/1/2022b,c | | | 2,714,000 | |
| | | | Holly Energy Partners, LP | | | | |
| | 1,870,000 | | | 8.250%, 3/15/2018 | | | 1,982,200 | |
| | 820,000 | | | 6.500%, 3/1/2020 | | | 858,950 | |
| | | | National Rural Utilities Cooperative Finance Corporation | | | | |
| | 1,150,000 | | | 4.750%, 4/30/2043 | | | 1,073,813 | |
| | | | NRG Energy, Inc. | | | | |
| | 4,240,000 | | | 6.625%, 3/15/2023 | | | 4,383,100 | |
| | | | Regency Energy Partners, LP | | | | |
| | 3,330,000 | | | 6.875%, 12/1/2018 | | | 3,596,400 | |
| | 760,000 | | | 5.500%, 4/15/2023 | | | 758,100 | |
| | | | Targa Resources Partners, LP | | | | |
| | 4,280,000 | | | 5.250%, 5/1/2023 | | | 4,280,000 | |
| | | | | |
| | | | Total | | | 40,857,944 | |
| | | | | |
| | | | | | | | |
| | | | | |
| | | | Total Long-Term Fixed Income (cost $690,287,553) | | | 721,935,455 | |
| | | | | |
| | |
| Shares | | | Preferred Stock (0.6%) | | Value | |
| Financials (0.6%) | |
| | 48,000 | | | Discover Financial Services, 6.500%g | | | 1,148,160 | |
| | 46,179 | | | The Goldman Sachs Group, Inc., 5.500%g | | | 1,054,266 | |
| | 47,128 | | | Ventas Realty, LP, 5.450% | | | 1,065,093 | |
| | 1,440 | | | Wells Fargo & Company, Convertible, 7.500%g | | | 1,640,160 | |
| | | | | |
| | | | Total | | | 4,907,679 | |
| | | | | |
| | | | | | | | |
| | | | | |
| | | | Total Preferred Stock (cost $5,523,373) | | | 4,907,679 | |
| | | | | |
| | |
| Shares | | | Common Stock (0.1%) | | Value | |
| Consumer Discretionary (<0.1%) | |
| | 1,370 | | | Lear Corporation | | | 106,024 | |
| | | | Lear Corporation Warrants, | | | | |
| | 153 | | | $0.01, expires 11/9/2014h | | | 23,228 | |
| | 36,330 | | | TVMAX Holdings, Inc.h,i | | | 4 | |
| | | | | |
| | | | Total | | | 129,256 | |
| | | | | |
|
| Financials (0.1%) | |
| | 10 | | | New Cotai, LLCh,i | | | 375,706 | |
| | | | | |
| | | | Total | | | 375,706 | |
| | | | | |
| | | | | | | | |
| | | | | |
| | | | Total Common Stock (cost $2,643,077) | | | 504,962 | |
| | | | | |
| | | | | | | | |
| | |
| Shares | | | Collateral Held for Securities Loaned (5.9%) | | Value | |
| | 46,006,909 | | | Thrivent Cash Management Trust | | | 46,006,909 | |
| | | | | |
| | | | Total Collateral Held for Securities Loaned (cost $46,006,909) | | | 46,006,909 | |
| | | | | |
| | |
Shares or
Principal
Amount | | | Short-Term Investments (2.2%) | | Value | |
| | | | Federal Home Loan Bank Discount Notes | | | | |
| | 200,000 | | | 0.093%, 11/22/2013j | | | 199,989 | |
| | 300,000 | | | 0.105%, 12/4/2013j | | | 299,971 | |
| | | | Thrivent Cash Management Trust | | | | |
| | 16,048,038 | | | 0.070% | | | 16,048,038 | |
The accompanying Notes to Financial Statements are an integral part of this schedule.
205
High Yield Fund
Schedule of Investments as of October 31, 2013
| | | | | | | | |
Shares or
Principal
Amount | | | Short-Term Investments (2.2%) | | Value | |
| | | | U.S. Treasury Bills | | | | |
| | 700,000 | | | 0.062%, 12/26/2013j | | | $699,934 | |
| | | | | |
| | | | Total Short-Term Investments (at amortized cost) | | | 17,247,932 | |
| | | | | |
| | | | Total Investments (cost $789,040,782) 104.9% | | | $818,527,534 | |
| | | | | |
| | | | Other Assets and Liabilities, Net (4.9%) | | | (37,869,431 | ) |
| | | | | |
| | | | Total Net Assets 100.0% | | | $780,658,103 | |
| | | | | |
a | The stated interest rate represents the weighted average of all contracts within the bank loan facility. |
b | Denotes securities sold under Rule 144A of the Securities Act of 1933, which exempts them from registration. These securities have been deemed liquid and may be resold to other dealers in the program or to other qualified institutional buyers. As of October 31, 2013, the value of these investments was $280,573,013 or 35.9% of total net assets. |
c | All or a portion of the security is on loan. |
d | Denotes restricted securities. Restricted securities are investment securities which have been deemed illiquid and cannot be offered for public sale without first being registered under the Securities Act of 1933. The following table indicates the acquisition date and cost of restricted securities High Yield Fund owned as of October 31, 2013. |
| | | | | | | | |
Security | | Acquisition
Date | | | Cost | |
Eileme 2 AB | | | 1/19/2012 | | | $ | 3,668,940 | |
Eldorado Resorts, LLC | | | 5/19/2011 | | | | 4,251,997 | |
JBS Finance II, Ltd. | | | 7/22/2010 | | | | 3,896,043 | |
Jefferies Finance, LLC | | | 3/19/2013 | | | | 2,350,000 | |
Liberty Tire Recycling | | | 9/23/2010 | | | | 1,849,972 | |
Midwest Vanadium, Pty. Ltd. | | | 2/9/2011 | | | | 2,901,338 | |
New Cotai, LLC | | | 4/12/2013 | | | | 3,023,729 | |
Tunica-Biloxi Gaming Authority | | | 11/8/2005 | | | | 4,219,694 | |
e | Denotes variable rate securities. Variable rate securities are securities whose yields vary with a designated market index or market rate. The rate shown is as of October 31, 2013. |
f | Denotes investments purchased on a when-issued or delayed delivery basis. |
g | Denotes perpetual securities. Perpetual securities pay an indefinite stream of interest, but may be called by the issuer at an earlier date. |
h | Non-income producing security. |
i | Security is fair valued. |
j | The interest rate shown reflects the yield, coupon rate or the discount rate at the date of purchase. |
Unrealized Appreciation (Depreciation)
Gross unrealized appreciation and depreciation of investments, based on cost for federal income tax purposes, were as follows:
| | | | |
Gross unrealized appreciation | | | $37,123,021 | |
Gross unrealized depreciation | | | (7,739,369 | ) |
| | | | |
Net unrealized appreciation (depreciation) | | | $29,383,652 | |
| |
Cost for federal income tax purposes | | | $789,143,882 | |
The accompanying Notes to Financial Statements are an integral part of this schedule.
206
High Yield Fund
Schedule of Investments as of October 31, 2013
Fair Valuation Measurements
The following table is a summary of the inputs used, as of October 31, 2013, in valuing High Yield Fund’s assets carried at fair value.
| | | | | | | | | | | | | | | | |
Investments in Securities | | Total | | | Level 1 | | | Level 2 | | | Level 3 | |
| | | | |
Bank Loans | | | | | | | | | | | | | | | | |
Communications Services | | | 11,588,513 | | | | – | | | | 11,588,513 | | | | – | |
Consumer Non-Cyclical | | | 10,222,498 | | | | – | | | | 10,222,498 | | | | – | |
Financials | | | 2,303,000 | | | | – | | | | 2,303,000 | | | | – | |
Technology | | | 3,810,586 | | | | – | | | | 3,810,586 | | | | – | |
| | | | |
Long-Term Fixed Income | | | | | | | | | | | | | | | | |
Asset-Backed Securities | | | 2,716,691 | | | | – | | | | 2,716,691 | | | | – | |
Basic Materials | | | 61,512,100 | | | | – | | | | 61,512,100 | | | | – | |
Capital Goods | | | 60,043,415 | | | | – | | | | 60,043,415 | | | | – | |
Communications Services | | | 127,390,350 | | | | – | | | | 127,390,350 | | | | – | |
Consumer Cyclical | | | 110,426,640 | | | | – | | | | 110,426,640 | | | | – | |
Consumer Non-Cyclical | | | 81,364,492 | | | | – | | | | 81,364,492 | | | | – | |
Energy | | | 100,237,545 | | | | – | | | | 100,237,545 | | | | – | |
Financials | | | 57,061,448 | | | | – | | | | 57,061,448 | | | | – | |
Foreign Government | | | 2,270,585 | | | | – | | | | 2,270,585 | | | | – | |
Technology | | | 41,241,266 | | | | – | | | | 41,241,266 | | | | – | |
Transportation | | | 36,812,979 | | | | – | | | | 36,812,979 | | | | – | |
Utilities | | | 40,857,944 | | | | – | | | | 40,857,944 | | | | – | |
| | | | |
Preferred Stock | | | | | | | | | | | | | | | | |
Financials | | | 4,907,679 | | | | 4,907,679 | | | | – | | | | – | |
| | | | |
Common Stock | | | | | | | | | | | | | | | | |
Consumer Discretionary | | | 129,256 | | | | 129,252 | | | | – | | | | 4 | |
Financials | | | 375,706 | | | | – | | | | – | | | | 375,706 | |
Collateral Held for Securities Loaned | | | 46,006,909 | | | | 46,006,909 | | | | – | | | | – | |
Short-Term Investments | | | 17,247,932 | | | | 16,048,038 | | | | 1,199,894 | | | | – | |
| |
Total | | | $818,527,534 | | | | $67,091,878 | | | | $751,059,946 | | | | $375,710 | |
| |
There were no significant transfers between Levels during the period ended October 31, 2013. Transfers between Levels are identified as of the end of the period.
The following table summarizes the net realized gains/(losses) and Statement of Operations location, for the period ended October 31, 2013, for High Yield Fund’s investments in financial derivative instruments by primary risk exposure.
| | | | | | |
Derivatives by risk category | | Statement of Operations Location | | Realized Gains/(Losses)
recognized in Income | |
| | |
Interest Rate Contracts | | | | | | |
Futures | | Net realized gains/(losses) on Futures contracts | | | 257,415 | |
| | |
Total Interest Rate Contracts | | | | | 257,415 | |
| | |
Credit Contracts | | | | | | |
Credit Default Swaps | | Net realized gains/(losses) on Swap agreements | | | (1,635,457 | ) |
| | |
Total Credit Contracts | | | | | (1,635,457 | ) |
| |
Total | | | | | ($1,378,042 | ) |
| |
The accompanying Notes to Financial Statements are an integral part of this schedule.
207
High Yield Fund
Schedule of Investments as of October 31, 2013
The following table summarizes the change in net unrealized appreciation/(depreciation) and Statement of Operations location, for the period ended October 31, 2013, for High Yield Fund’s investments in financial derivative instruments by primary risk exposure.
| | | | | | |
Derivatives by risk category | | Statement of Operations Location | | Change in unrealized
appreciation/(depreciation)
recognized in Income | |
| | |
Credit Contracts | | | | | | |
Credit Default Swaps | | Change in net unrealized appreciation/(depreciation) on Swap agreements | | | 290,057 | |
| | |
Total Credit Contracts | | | | | 290,057 | |
| |
Total | | | | | $290,057 | |
| |
The following table presents High Yield Fund’s average volume of derivative activity during the period ended October 31, 2013.
| | | | | | | | | | |
Derivative Risk Category | | Futures
(Notional*) | | | Futures
(Percentage
of Average
Net Assets) | | Swaps
(Notional*) | | Swaps
(Percentage
of Average
Net Assets) |
Interest Rate Contracts | | | $1,188,964 | | | 0.1% | | N/A | | N/A |
Credit Contracts | | | N/A | | | N/A | | $4,906,043 | | 0.6% |
* | Notional amount represents long or short, or both, derivative positions held by the Fund. |
Investment in Affiliates
Affiliated issuers, as defined under the Investment Company Act of 1940, include those in which the Fund’s holdings of an issuer represent 5% or more of the outstanding voting securities of an issuer, or any affiliated mutual fund.
A summary of transactions for the fiscal year to date, in High Yield Fund, is as follows:
| | | | | | | | | | | | | | | | | | | | | | | | |
Fund | | Value
October 31, 2012 | | | Gross
Purchases | | | Gross
Sales | | | Shares Held at
October 31, 2013 | | | Value
October 31, 2013 | | | Income Earned
November 1, 2012 -
October 31, 2013 | |
Cash Management Trust-Collateral Investment | | | $64,588,487 | | | | $160,228,235 | | | | $178,809,813 | | | | 46,006,909 | | | | $46,006,909 | | | | $154,778 | |
Cash Management Trust-Short Term Investment | | | 31,101,499 | | | | 277,534,124 | | | | 292,587,585 | | | | 16,048,038 | | | | 16,048,038 | | | | 26,765 | |
Total Value and Income Earned | | | 95,689,986 | | | | | | | | | | | | | | | | 62,054,947 | | | | 181,543 | |
The accompanying Notes to Financial Statements are an integral part of this schedule.
208
Income Fund
Schedule of Investments as of October 31, 2013
| | | | | | | | |
Principal
Amount | | | Bank Loans (4.8%)a | | Value | |
| Basic Materials (0.3%) | | | | |
| | | | FMG Resources August 2006 Pty., Ltd., Term Loan | | | | |
| | $1,336,500 | | | 5.250%, 10/18/2017 | | | $1,338,425 | |
| | | | Ineos Group Holdings, Ltd., Term Loan | | | | |
| | 882,323 | | | 4.000%, 5/4/2018 | | | 884,864 | |
| | | | MRC Global, Inc., Term Loan | | | | |
| | 369,068 | | | 6.000%, 11/8/2019 | | | 371,002 | |
| | | | | |
| | | | Total | | | 2,594,291 | |
| | | | | |
| |
| Capital Goods (0.2%) | | | | |
| | | | ADS Waste Holdings, Term Loan | | | | |
| | 893,250 | | | 4.250%, 10/9/2019 | | | 897,877 | |
| | | | Berry Plastics Group, Inc., Term Loan | | | | |
| | 895,500 | | | 3.500%, 2/8/2020 | | | 891,864 | |
| | | | | |
| | | | Total | | | 1,789,741 | |
| | | | | |
| |
| Communications Services (1.5%) | | | | |
| | | | Charter Communications Operating, LLC, Term Loan | | | | |
| | 538,650 | | | 3.000%, 12/31/2020 | | | 532,903 | |
| | | | Clear Channel Communications, Inc., Term Loan | | | | |
| | 227,873 | | | 3.818%, 1/29/2016 | | | 220,875 | |
| | 672,127 | | | 6.918%, 1/30/2019 | | | 638,608 | |
| | | | Cumulus Media Holdings, Inc., Term Loan | | | | |
| | 824,119 | | | 4.500%, 9/17/2018 | | | 828,857 | |
| | | | Hargray Communications Group, Inc., Term Loan | | | | |
| | 917,700 | | | 4.750%, 6/26/2019 | | | 923,050 | |
| | | | Intelsat Jackson Holdings SA, Term Loan | | | | |
| | 1,051,101 | | | 4.250%, 4/2/2018 | | | 1,056,136 | |
| | | | Level 3 Communications, Inc., Term Loan | | | | |
| | 900,000 | | | 4.000%, 1/15/2020 | | | 903,753 | |
| | | | McGraw-Hill Global Education Holdings, LLC, Term Loan | | | | |
| | 447,750 | | | 9.000%, 3/22/2019 | | | 455,308 | |
| | | | NEP Broadcasting, LLC, Term Loan | | | | |
| | 893,250 | | | 4.750%, 1/22/2020 | | | 895,483 | |
| | | | TNS, Inc., Term Loan | | | | |
| | 857,037 | | | 5.000%, 2/14/2020 | | | 862,034 | |
| | | | Univision Communications, Inc., Term Loan | | | | |
| | 358,200 | | | 4.500%, 2/28/2020 | | | 359,916 | |
| | 572,729 | | | 4.500%, 3/1/2020 | | | 575,472 | |
| | | | Virgin Media Investment Holdings, Ltd., Term Loan | | | | |
| | 900,000 | | | 3.500%, 6/8/2020 | | | 899,595 | |
| | | | Visant Corporation, Term Loan | | | | |
| | 689,445 | | | 5.250%, 12/22/2016 | | | 676,146 | |
| | | | WideOpenWest Finance, LLC, Term Loan | | | | |
| | 895,500 | | | 4.750%, 4/1/2019 | | | 902,592 | |
| | | | Yankee Cable Acquisition, LLC, Term Loan | | | | |
| | 881,056 | | | 5.250%, 3/1/2020 | | | 884,774 | |
| | | | Zayo Group, LLC, Term Loan | | | | |
| | 893,216 | | | 4.500%, 7/2/2019 | | | 897,128 | |
| | | | | |
| | | | Total | | | 12,512,630 | |
| | | | | |
| |
| Consumer Cyclical (0.6%) | | | | |
| | | | Bally Technologies, Inc., Term Loan | | | | |
| | 480,000 | | | 0.000%, 7/16/2021b,c | | | 481,200 | |
| | | | Burlington Coat Factory Warehouse Corporation, Term Loan | | | | |
| | 813,520 | | | 4.250%, 2/23/2017 | | | 818,857 | |
| | | | Cenveo Corporation, Term Loan | | | | |
| | 458,847 | | | 6.250%, 2/13/2017 | | | 462,862 | |
| | | | Chrysler Group, LLC, Term Loan | | | | |
| | 915,318 | | | 4.250%, 5/24/2017 | | | 923,098 | |
| | | | MGM Resorts International, Term Loan | | | | |
| | 535,950 | | | 3.500%, 12/20/2019 | | | 535,087 | |
| | | | ROC Finance, LLC, Term Loan | | | | |
| | 900,000 | | | 5.000%, 6/20/2019 | | | 879,750 | |
| | | | Toys R Us, Inc., Term Loan | | | | |
| | 830,630 | | | 5.250%, 5/25/2018 | | | 748,863 | |
| | | | | |
| | | | Total | | | 4,849,717 | |
| | | | | |
| |
| Consumer Non-Cyclical (0.6%) | | | | |
| | | | Albertsons, LLC, Term Loan | | | | |
| | 1,015,199 | | | 4.750%, 3/21/2019 | | | 1,017,717 | |
| | | | Biomet, Inc., Term Loan | | | | |
| | 847,875 | | | 3.690%, 7/25/2017 | | | 853,352 | |
| | | | CHS/Community Health Systems, Inc., Term Loan | | | | |
| | 900,000 | | | 3.760%, 1/25/2017 | | | 902,250 | |
| | | | Michael Foods, Inc., Term Loan | | | | |
| | 675,655 | | | 4.250%, 2/25/2018 | | | 679,540 | |
| | | | Roundy’s Supermarkets, Inc., Term Loan | | | | |
| | 976,012 | | | 5.750%, 2/13/2019 | | | 963,812 | |
| | | | Van Wagner Communications, LLC, Term Loan | | | | |
| | 572,125 | | | 6.250%, 8/3/2018 | | | 580,467 | |
| | | | | |
| | | | Total | | | 4,997,138 | |
| | | | | |
| |
| Energy (0.3%) | | | | |
| | | | Arch Coal, Inc., Term Loan | | | | |
| | 883,816 | | | 5.750%, 5/16/2018 | | | 856,382 | |
| | | | Chesapeake Energy Corporation, Term Loan | | | | |
| | 1,070,000 | | | 5.750%, 12/2/2017 | | | 1,092,737 | |
| | | | Offshore Group Investment, Ltd., Term Loan | | | | |
| | 447,750 | | | 5.750%, 3/28/2019 | | | 450,410 | |
| | | | | |
| | | | Total | | | 2,399,529 | |
| | | | | |
| |
| Financials (0.1%) | | | | |
| | | | WaveDivision Holdings, LLC, Term Loan | | | | |
| | 893,250 | | | 4.000%, 10/12/2019 | | | 895,483 | |
| | | | | |
| | | | Total | | | 895,483 | |
| | | | | |
| |
| Technology (0.6%) | | | | |
| | | | BMC Software, Inc., Term Loan | | | | |
| | 910,000 | | | 5.000%, 9/10/2020 | | | 918,645 | |
The accompanying Notes to Financial Statements are an integral part of this schedule.
209
Income Fund
Schedule of Investments as of October 31, 2013
| | | | | | | | |
Principal
Amount | | | Bank Loans (4.8%)a | | Value | |
| Technology (0.6%) - continued | | | | |
| | | | First Data Corporation Extended, Term Loan | | | | |
| | $900,000 | | | 4.170%, 3/23/2018 | | | $900,324 | |
| | | | Freescale Semiconductor, Inc., Term Loan | | | | |
| | 895,500 | | | 5.000%, 3/1/2020 | | | 903,165 | |
| | | | Infor US, Inc., Term Loan | | | | |
| | 555,057 | | | 5.250%, 4/5/2018 | | | 559,115 | |
| | | | SunGard Data Systems, Inc., Term Loan | | | | |
| | 873,400 | | | 4.500%, 1/31/2020 | | | 877,758 | |
| | 258,700 | | | 4.000%, 3/8/2020 | | | 260,446 | |
| | | | Syniverse Holdings, Inc., Term Loan | | | | |
| | 345,538 | | | 4.000%, 4/23/2019 | | | 346,229 | |
| | | | | |
| | | | Total | | | 4,765,682 | |
| | | | | |
| |
| Transportation (0.3%) | | | | |
| | | | American Airlines, Inc., Term Loan | | | | |
| | 917,700 | | | 4.750%, 6/27/2019 | | | 922,481 | |
| | | | American Petroleum Tankers Parent, LLC, Term Loan | | | | |
| | 410,000 | | | 4.750%, 10/2/2019 | | | 410,000 | |
| | | | Delta Air Lines, Inc., Term Loan | | | | |
| | 1,417,375 | | | 4.250%, 4/20/2017 | | | 1,423,697 | |
| | | | | |
| | | | Total | | | 2,756,178 | |
| | | | | |
| |
| Utilities (0.3%) | | | | |
| | | | Calpine Corporation, Term Loan | | | | |
| | 703,699 | | | 4.000%, 4/1/2018 | | | 706,513 | |
| | 693,000 | | | 4.000%, 10/9/2019 | | | 696,306 | |
| | | | NGPL PipeCo, LLC, Term Loan | | | | |
| | 844,225 | | | 6.750%, 9/15/2017 | | | 788,996 | |
| | | | | |
| | | | Total | | | 2,191,815 | |
| | | | | |
| | | | | | | | |
| | | | | |
| | | | Total Bank Loans (cost $39,619,144) | | | 39,752,204 | |
| | | | | |
| | |
Principal
Amount | | | Long-Term Fixed Income (92.5%) | | Value | |
| Asset-Backed Securities (1.0%) | | | | |
| | | | First Horizon ABS Trust | | | | |
| | 828,708 | | | 0.330%, 10/25/2034d,e | | | 684,541 | |
| | | | GMAC Mortgage Corporation Loan Trust | | | | |
| | 2,165,286 | | | 0.350%, 8/25/2035d,e | | | 1,804,944 | |
| | 2,394,018 | | | 0.350%, 12/25/2036d,e | | | 2,044,919 | |
| | | | IndyMac Seconds Asset-Backed Trust | | | | |
| | 1,432,327 | | | 0.340%, 10/25/2036d,e | | | 746,009 | |
| | | | Renaissance Home Equity Loan Trust | | | | |
| | 1,807,820 | | | 5.746%, 5/25/2036 | | | 1,356,901 | |
| | 1,400,000 | | | 6.011%, 5/25/2036 | | | 1,020,204 | |
| | | | | |
| | | | Total | | | 7,657,518 | |
| | | | | |
| |
| Basic Materials (4.3%) | | | | |
| | | | Agrium, Inc. | | | | |
| | 1,090,000 | | | 3.500%, 6/1/2023 | | | 1,050,917 | |
| | | | ArcelorMittal | | | | |
| | 1,000,000 | | | 6.125%, 6/1/2018 | | | 1,085,000 | |
| | 2,250,000 | | | 5.750%, 8/5/2020 | | | 2,373,750 | |
| | | | Barrick Gold Corporation | | | | |
| | 1,080,000 | | | 4.100%, 5/1/2023 | | | 979,558 | |
| | | | Cliffs Natural Resources, Inc. | | | | |
| | 1,470,000 | | | 4.875%, 4/1/2021 | | | 1,445,895 | |
| | | | Dow Chemical Company | | | | |
| | 1,430,000 | | | 4.250%, 11/15/2020 | | | 1,526,296 | |
| | 880,000 | | | 5.250%, 11/15/2041 | | | 892,046 | |
| | | | Freeport-McMoRan Copper & Gold, Inc. | | | | |
| | 2,525,000 | | | 3.100%, 3/15/2020 | | | 2,436,514 | |
| | 1,825,000 | | | 3.875%, 3/15/2023 | | | 1,727,417 | |
| | | | Georgia-Pacific, LLC | | | | |
| | 1,310,000 | | | 5.400%, 11/1/2020f | | | 1,481,035 | |
| | 1,100,000 | | | 3.734%, 7/15/2023f | | | 1,086,770 | |
| | | | Glencore Funding, LLC | | | | |
| | 1,820,000 | | | 4.125%, 5/30/2023f | | | 1,730,150 | |
| | | | Hexion US Finance Corporation/Hexion Nova Scotia Finance ULC | | | | |
| | 1,100,000 | | | 8.875%, 2/1/2018 | | | 1,133,000 | |
| | | | Inmet Mining Corporation | | | | |
| | 1,080,000 | | | 7.500%, 6/1/2021f | | | 1,144,800 | |
| | | | International Paper Company | | | | |
| | 750,000 | | | 7.300%, 11/15/2039 | | | 936,098 | |
| | | | LYB International Finance BV | | | | |
| | 365,000 | | | 4.000%, 7/15/2023 | | | 367,516 | |
| | | | LyondellBasell Industries NV | | | | |
| | 1,830,000 | | | 6.000%, 11/15/2021 | | | 2,129,212 | |
| | | | Rio Tinto Finance USA, Ltd. | | | | |
| | 1,965,000 | | | 6.500%, 7/15/2018 | | | 2,347,484 | |
| | | | Teck Resources, Ltd. | | | | |
| | 2,130,000 | | | 3.750%, 2/1/2023g | | | 2,006,626 | |
| | | | Vale Overseas, Ltd. | | | | |
| | 1,100,000 | | | 4.625%, 9/15/2020 | | | 1,138,622 | |
| | | | Vale SA | | | | |
| | 1,070,000 | | | 5.625%, 9/11/2042 | | | 965,747 | |
| | | | Weyerhaeuser Company | | | | |
| | 735,000 | | | 4.625%, 9/15/2023 | | | 765,813 | |
| | 1,430,000 | | | 7.375%, 3/15/2032 | | | 1,778,119 | |
| | | | Xstrata Finance Canada, Ltd. | | | | |
| | 1,440,000 | | | 2.700%, 10/25/2017f | | | 1,446,847 | |
| | 1,440,000 | | | 4.250%, 10/25/2022f | | | 1,396,751 | |
| | | | | |
| | | | Total | | | 35,371,983 | |
| | | | | |
| |
| Capital Goods (2.3%) | | | | |
| | | | BAE Systems plc | | | | |
| | 2,120,000 | | | 4.750%, 10/11/2021f | | | 2,241,402 | |
| | | | Case New Holland, Inc. | | | | |
| | 865,000 | | | 7.875%, 12/1/2017 | | | 1,023,944 | |
| | | | CNH Capital, LLC | | | | |
| | 250,000 | | | 6.250%, 11/1/2016 | | | 274,375 | |
| | | | Eaton Corporation | | | | |
| | 2,865,000 | | | 2.750%, 11/2/2022f | | | 2,687,069 | |
| | | | L-3 Communications Corporation | | | | |
| | 478,000 | | | 5.200%, 10/15/2019 | | | 521,503 | |
| | | | Masco Corporation | | | | |
| | 875,000 | | | 5.950%, 3/15/2022 | | | 927,500 | |
| | | | Republic Services, Inc. | | | | |
| | 370,000 | | | 5.500%, 9/15/2019 | | | 421,689 | |
| | 900,000 | | | 5.000%, 3/1/2020 | | | 988,600 | |
| | 1,300,000 | | | 5.250%, 11/15/2021 | | | 1,439,469 | |
| | 1,830,000 | | | 3.550%, 6/1/2022 | | | 1,804,226 | |
The accompanying Notes to Financial Statements are an integral part of this schedule.
210
Income Fund
Schedule of Investments as of October 31, 2013
| | | | | | | | |
Principal
Amount | | | Long-Term Fixed Income (92.5%) | | Value | |
| Capital Goods (2.3%) - continued | | | | |
| | | | Reynolds Group Issuer, Inc. | | | | |
| | $1,060,000 | | | 9.875%, 8/15/2019 | | | $1,172,625 | |
| | | | Roper Industries, Inc. | | | | |
| | 1,515,000 | | | 2.050%, 10/1/2018 | | | 1,496,056 | |
| | | | Textron, Inc. | | | | |
| | 1,500,000 | | | 6.200%, 3/15/2015 | | | 1,602,257 | |
| | 1,311,000 | | | 5.600%, 12/1/2017 | | | 1,457,138 | |
| | | | United Rentals North America, Inc. | | | | |
| | 700,000 | | | 5.750%, 7/15/2018 | | | 750,750 | |
| | 180,000 | | | 6.125%, 6/15/2023 | | | 184,950 | |
| | | | | |
| | | | Total | | | 18,993,553 | |
| | | | | |
| |
| Collateralized Mortgage Obligations (0.9%) | | | | |
| | | | CitiMortgage Alternative Loan Trust | | | | |
| | 1,434,197 | | | 5.750%, 4/25/2037 | | | 1,221,874 | |
| | | | Countrywide Alternative Loan Trust | | | | |
| | 1,854,073 | | | 6.000%, 1/25/2037 | | | 1,479,819 | |
| | | | HomeBanc Mortgage Trust | | | | |
| | 1,541,097 | | | 2.408%, 4/25/2037 | | | 1,070,095 | |
| | | | Wachovia Mortgage Loan Trust, LLC | | | | |
| | 1,675,932 | | | 3.027%, 5/20/2036 | | | 1,416,343 | |
| | | | WaMu Mortgage Pass Through Certificates | | | | |
| | 1,119,134 | | | 0.460%, 10/25/2045e | | | 1,035,864 | |
| | | | Washington Mutual Alternative Mortgage Pass Through Certificates | | | | |
| | 2,616,621 | | | 0.899%, 2/25/2047e | | | 1,726,648 | |
| | | | | |
| | | | Total | | | 7,950,643 | |
| | | | | |
| |
| Commercial Mortgage-Backed Securities (1.4%) | | | | |
| | | | Bear Stearns Commercial Mortgage Securities, Inc. | | | | |
| | 2,500,000 | | | 5.331%, 2/11/2044 | | | 2,745,650 | |
| | | | Citigroup/Deutsche Bank Commercial Mortgage | | | | |
| | 1,300,000 | | | 5.322%, 12/11/2049 | | | 1,440,424 | |
| | | | Commercial Mortgage Pass-Through Certificates | | | | |
| | 1,134,342 | | | 0.304%, 12/15/2020e,f | | | 1,118,146 | |
| | | | Credit Suisse First Boston Mortgage Securities | | | | |
| | 1,800,000 | | | 5.542%, 1/15/2049 | | | 1,999,769 | |
| | | | Credit Suisse Mortgage Capital Certificates | | | | |
| | 1,478,840 | | | 0.344%, 10/15/2021e,f | | | 1,472,995 | |
| | 2,346,816 | | | 5.467%, 9/15/2039 | | | 2,568,086 | |
| | | | | |
| | | | Total | | | 11,345,070 | |
| | | | | |
| |
| Communications Services (8.6%) | | | | |
| | | | AMC Networks, Inc. | | | | |
| | 350,000 | | | 4.750%, 12/15/2022 | | | 338,625 | |
| | | | America Movil SAB de CV | | | | |
| | 2,400,000 | | | 1.256%, 9/12/2016e | | | 2,420,942 | |
| | 2,570,000 | | | 5.000%, 3/30/2020 | | | 2,813,505 | |
| | | | American Tower Corporation | | | | |
| | 2,180,000 | | | 4.500%, 1/15/2018 | | | 2,345,229 | |
| | 720,000 | | | 5.900%, 11/1/2021 | | | 784,830 | |
| | 610,000 | | | 3.500%, 1/31/2023 | | | 562,398 | |
| | | | AT&T, Inc. | | | | |
| | 1,440,000 | | | 1.400%, 12/1/2017 | | | 1,420,773 | |
| | 1,830,000 | | | 3.000%, 2/15/2022 | | | 1,721,399 | |
| | | | CC Holdings GS V, LLC | | | | |
| | 720,000 | | | 3.849%, 4/15/2023 | | | 683,535 | |
| | | | CenturyLink, Inc. | | | | |
| | 900,000 | | | 6.150%, 9/15/2019 | | | 951,750 | |
| | 1,080,000 | | | 5.625%, 4/1/2020 | | | 1,097,550 | |
| | 1,400,000 | | | 5.800%, 3/15/2022 | | | 1,386,000 | |
| | | | Clear Channel Worldwide Holdings, Inc. | | | | |
| | 1,430,000 | | | 6.500%, 11/15/2022 | | | 1,501,500 | |
| | | | Comcast Corporation | | | | |
| | 1,100,000 | | | 6.300%, 11/15/2017 | | | 1,298,010 | |
| | 1,100,000 | | | 5.700%, 5/15/2018 | | | 1,284,635 | |
| | 1,430,000 | | | 3.125%, 7/15/2022 | | | 1,411,889 | |
| | 1,300,000 | | | 6.400%, 5/15/2038 | | | 1,577,343 | |
| | | | Cox Communications, Inc. | | | | |
| | 1,100,000 | | | 9.375%, 1/15/2019f | | | 1,407,971 | |
| | 1,000,000 | | | 3.250%, 12/15/2022f | | | 918,425 | |
| | 1,500,000 | | | 8.375%, 3/1/2039f | | | 1,843,285 | |
| | | | Crown Castle Towers, LLC | | | | |
| | 2,950,000 | | | 4.174%, 8/15/2017f | | | 3,161,913 | |
| | | | DIRECTV Holdings, LLC | | | | |
| | 3,225,000 | | | 5.000%, 3/1/2021 | | | 3,381,167 | |
| | 1,095,000 | | | 3.800%, 3/15/2022 | | | 1,049,904 | |
| | | | Discovery Communications, LLC | | | | |
| | 1,080,000 | | | 4.375%, 6/15/2021 | | | 1,139,429 | |
| | 1,075,000 | | | 3.300%, 5/15/2022 | | | 1,042,003 | |
| | | | Hughes Satellite Systems Corporation | | | | |
| | 1,780,000 | | | 6.500%, 6/15/2019 | | | 1,909,050 | |
| | | | Intelsat Jackson Holdings SA | | | | |
| | 710,000 | | | 7.250%, 4/1/2019 | | | 765,025 | |
| | 1,100,000 | | | 7.500%, 4/1/2021 | | | 1,199,000 | |
| | | | NBC Universal Enterprise, Inc. | | | | |
| | 1,080,000 | | | 1.974%, 4/15/2019f | | | 1,065,294 | |
| | | | NBCUniversal Media, LLC | | | | |
| | 2,250,000 | | | 5.150%, 4/30/2020 | | | 2,572,619 | |
| | 2,490,000 | | | 4.375%, 4/1/2021 | | | 2,713,490 | |
| | | | News America, Inc. | | | | |
| | 460,000 | | | 4.000%, 10/1/2023f | | | 467,396 | |
| | 1,100,000 | | | 7.625%, 11/30/2028 | | | 1,379,792 | |
| | 1,350,000 | | | 6.400%, 12/15/2035 | | | 1,542,680 | |
| | | | Omnicom Group, Inc. | | | | |
| | 2,380,000 | | | 4.450%, 8/15/2020 | | | 2,511,838 | |
| | | | Qwest Corporation | | | | |
| | 1,800,000 | | | 6.500%, 6/1/2017 | | | 2,019,580 | |
| | | | SBA Tower Trust | | | | |
| | 2,000,000 | | | 5.101%, 4/17/2017f | | | 2,162,948 | |
| | | | Sprint Nextel Corporation | | | | |
| | 350,000 | | | 7.000%, 3/1/2020f | | | 388,500 | |
| | | | Telefonica Emisiones SAU | | | | |
| | 1,440,000 | | | 5.462%, 2/16/2021 | | | 1,525,700 | |
| | | | Time Warner Cable, Inc. | | | | |
| | 1,500,000 | | | 8.250%, 4/1/2019 | | | 1,758,444 | |
| | | | T-Mobile USA, Inc. | | | | |
| | 730,000 | | | 6.633%, 4/28/2021 | | | 771,975 | |
| | | | UPCB Finance VI, Ltd. | | | | |
| | 1,400,000 | | | 6.875%, 1/15/2022f | | | 1,508,500 | |
| | | | Verizon Communications, Inc. | | | | |
| | 900,000 | | | 3.650%, 9/14/2018 | | | 957,198 | |
| | 2,935,000 | | | 5.150%, 9/15/2023 | | | 3,184,440 | |
The accompanying Notes to Financial Statements are an integral part of this schedule.
211
Income Fund
Schedule of Investments as of October 31, 2013
| | | | | | | | |
Principal
Amount | | | Long-Term Fixed Income (92.5%) | | Value | |
| Communications Services (8.6%) - continued | | | | |
| $ | 1,090,000 | | | 6.400%, 9/15/2033 | | | $1,233,748 | |
| | 1,100,000 | | | 6.550%, 9/15/2043 | | | 1,276,232 | |
| | | | | |
| | | | Total | | | 70,457,459 | |
| | | | | |
| |
| Consumer Cyclical (6.7%) | | | | |
| | | | American Honda Finance Corporation | | | | |
| | 2,600,000 | | | 3.875%, 9/21/2020f | | | 2,748,106 | |
| | | | Choice Hotels International, Inc. | | | | |
| | 1,090,000 | | | 5.750%, 7/1/2022 | | | 1,147,225 | |
| | | | Chrysler Group, LLC | | | | |
| | 1,100,000 | | | 8.000%, 6/15/2019 | | | 1,218,250 | |
| | | | Cinemark USA, Inc. | | | | |
| | 1,090,000 | | | 4.875%, 6/1/2023 | | | 1,038,225 | |
| | | | Daimler Finance North America, LLC | | | | |
| | 1,240,000 | | | 3.875%, 9/15/2021f | | | 1,280,006 | |
| | | | Ford Motor Credit Company, LLC | | | | |
| | 1,440,000 | | | 1.516%, 5/9/2016e | | | 1,459,639 | |
| | 1,800,000 | | | 3.984%, 6/15/2016 | | | 1,917,094 | |
| | 1,750,000 | | | 4.250%, 2/3/2017 | | | 1,889,613 | |
| | 370,000 | | | 6.625%, 8/15/2017 | | | 431,792 | |
| | 1,830,000 | | | 2.875%, 10/1/2018 | | | 1,863,088 | |
| | 1,425,000 | | | 4.250%, 9/20/2022 | | | 1,466,017 | |
| | | | General Motors Company | | | | |
| | 1,830,000 | | | 3.500%, 10/2/2018f | | | 1,866,600 | |
| | | | General Motors Financial Company, Inc. | | | | |
| | 1,340,000 | | | 4.750%, 8/15/2017f | | | 1,417,050 | |
| | | | GLP Capital, LP | | | | |
| | 640,000 | | | 4.875%, 11/1/2020f | | | 644,800 | |
| | | | Home Depot, Inc. | | | | |
| | 900,000 | | | 2.700%, 4/1/2023 | | | 852,890 | |
| | 1,835,000 | | | 3.750%, 2/15/2024 | | | 1,877,710 | |
| | | | Hyundai Capital America | | | | |
| | 1,185,000 | | | 2.875%, 8/9/2018f | | | 1,205,286 | |
| | | | Hyundai Motor Manufacturing Czech | | | | |
| | 1,475,000 | | | 4.500%, 4/15/2015f | | | 1,537,397 | |
| | | | Johnson Controls, Inc. | | | | |
| | 1,850,000 | | | 5.250%, 12/1/2041 | | | 1,872,568 | |
| | | | KIA Motors Corporation | | | | |
| | 1,740,000 | | | 3.625%, 6/14/2016f | | | 1,818,439 | |
| | | | L Brands, Inc. | | | | |
| | 1,100,000 | | | 5.625%, 2/15/2022 | | | 1,133,000 | |
| | | | Macy’s Retail Holdings, Inc. | | | | |
| | 1,790,000 | | | 7.450%, 7/15/2017 | | | 2,125,756 | |
| | 1,930,000 | | | 3.875%, 1/15/2022 | | | 1,927,456 | |
| | 1,075,000 | | | 2.875%, 2/15/2023 | | | 976,260 | |
| | | | Marriott International, Inc. | | | | |
| | 1,750,000 | | | 3.000%, 3/1/2019 | | | 1,777,977 | |
| | | | QVC, Inc. | | | | |
| | 1,265,000 | | | 4.375%, 3/15/2023 | | | 1,202,463 | |
| | | | Royal Caribbean Cruises, Ltd. | | | | |
| | 710,000 | | | 5.250%, 11/15/2022g | | | 710,000 | |
| | | | Sheraton Holding Corporation | | | | |
| | 710,000 | | | 7.375%, 11/15/2015 | | | 793,953 | |
| | | | Starwood Hotels & Resorts Worldwide, Inc. | | | | |
| | 1,150,000 | | | 6.750%, 5/15/2018 | | | 1,361,186 | |
| | 1,790,000 | | | 3.125%, 2/15/2023 | | | 1,657,245 | |
| | | | Time Warner, Inc. | | | | |
| | 1,400,000 | | | 7.700%, 5/1/2032 | | | 1,789,782 | |
| | | | Toll Brothers Finance Corporation | | | | |
| | 1,000,000 | | | 6.750%, 11/1/2019 | | | 1,127,500 | |
| | 540,000 | | | 4.375%, 4/15/2023g | | | 508,950 | |
| | | | Toys R Us Property Company II, LLC | | | | |
| | 1,430,000 | | | 8.500%, 12/1/2017 | | | 1,476,475 | |
| | | | Viacom, Inc. | | | | |
| | 2,000,000 | | | 4.250%, 9/1/2023 | | | 2,043,648 | |
| | | | Western Union Company | | | | |
| | 1,070,000 | | | 2.875%, 12/10/2017 | | | 1,105,322 | |
| | | | Wyndham Worldwide Corporation | | | | |
| | 1,080,000 | | | 2.500%, 3/1/2018 | | | 1,080,379 | |
| | 730,000 | | | 5.625%, 3/1/2021 | | | 795,263 | |
| | 1,780,000 | | | 4.250%, 3/1/2022 | | | 1,774,562 | |
| | | | | |
| | | | Total | | | 54,918,972 | |
| | | | | |
| |
| Consumer Non-Cyclical (7.9%) | | | | |
| | | | Altria Group, Inc. | | | | |
| | 905,000 | | | 4.750%, 5/5/2021 | | | 975,138 | |
| | 1,825,000 | | | 4.000%, 1/31/2024 | | | 1,831,846 | |
| | 1,500,000 | | | 9.950%, 11/10/2038 | | | 2,342,455 | |
| | | | Anheuser-Busch InBev Worldwide, Inc. | | | | |
| | 1,450,000 | | | 5.375%, 1/15/2020 | | | 1,675,795 | |
| | 1,475,000 | | | 5.000%, 4/15/2020 | | | 1,677,841 | |
| | | | Biomet, Inc. | | | | |
| | 1,370,000 | | | 6.500%, 8/1/2020 | | | 1,455,625 | |
| | | | Boston Scientific Corporation | | | | |
| | 1,820,000 | | | 2.650%, 10/1/2018 | | | 1,834,880 | |
| | | | Bunge Limited Finance Corporation | | | | |
| | 1,470,000 | | | 8.500%, 6/15/2019 | | | 1,836,236 | |
| | | | Celgene Corporation | | | | |
| | 1,250,000 | | | 1.900%, 8/15/2017 | | | 1,260,885 | |
| | 2,230,000 | | | 3.950%, 10/15/2020 | | | 2,320,210 | |
| | 630,000 | | | 4.000%, 8/15/2023 | | | 634,876 | |
| | | | ConAgra Foods, Inc. | | | | |
| | 1,105,000 | | | 2.100%, 3/15/2018 | | | 1,104,486 | |
| | 1,170,000 | | | 3.200%, 1/25/2023 | | | 1,116,361 | |
| | | | Edwards Lifesciences Corporation | | | | |
| | 1,375,000 | | | 2.875%, 10/15/2018 | | | 1,380,273 | |
| | | | Energizer Holdings, Inc. | | | | |
| | 800,000 | | | 4.700%, 5/24/2022 | | | 812,752 | |
| | | | Express Scripts Holding Company | | | | |
| | 1,265,000 | | | 3.125%, 5/15/2016 | | | 1,327,511 | |
| | 1,765,000 | | | 4.750%, 11/15/2021 | | | 1,906,262 | |
| | | | Fresenius Medical Care US Finance, Inc. | | | | |
| | 710,000 | | | 6.500%, 9/15/2018f | | | 796,975 | |
| | | | Gilead Sciences, Inc. | | | | |
| | 1,800,000 | | | 4.400%, 12/1/2021 | | | 1,944,146 | |
| | | | HCA, Inc. | | | | |
| | 1,440,000 | | | 4.750%, 5/1/2023 | | | 1,387,800 | |
| | | | Health Management Associates, Inc. | | | | |
| | 1,470,000 | | | 7.375%, 1/15/2020 | | | 1,639,050 | |
| | | | Heineken NV | | | | |
| | 1,430,000 | | | 2.750%, 4/1/2023f | | | 1,323,609 | |
| | | | Hospira, Inc. | | | | |
| | 1,460,000 | | | 5.200%, 8/12/2020 | | | 1,508,357 | |
| | | | IMS Health, Inc. | | | | |
| | 730,000 | | | 6.000%, 11/1/2020f | | | 759,200 | |
The accompanying Notes to Financial Statements are an integral part of this schedule.
212
Income Fund
Schedule of Investments as of October 31, 2013
| | | | | | | | |
Principal
Amount | | | Long-Term Fixed Income (92.5%) | | Value | |
| Consumer Non-Cyclical (7.9%) - continued | | | | |
| | | | Koninklijke Philips Electronics NV | | | | |
| $ | 1,485,000 | | | 3.750%, 3/15/2022 | | | $1,509,149 | |
| | | | Lorillard Tobacco Company | | | | |
| | 1,830,000 | | | 8.125%, 6/23/2019 | | | 2,258,061 | |
| | | | Mallinckrodt International Finance SA | | | | |
| | 1,440,000 | | | 3.500%, 4/15/2018f | | | 1,437,572 | |
| | | | Mondelez International, Inc. | | | | |
| | 1,460,000 | | | 5.375%, 2/10/2020 | | | 1,657,201 | |
| | | | Mylan, Inc. | | | | |
| | 2,155,000 | | | 7.875%, 7/15/2020f | | | 2,467,214 | |
| | | | Pernod Ricard SA | | | | |
| | 2,870,000 | | | 5.750%, 4/7/2021f | | | 3,216,429 | |
| | 1,090,000 | | | 4.450%, 1/15/2022f | | | 1,126,755 | |
| | | | Reynolds American, Inc. | | | | |
| | 1,820,000 | | | 3.250%, 11/1/2022 | | | 1,719,980 | |
| | | | SABMiller Holdings, Inc. | | | | |
| | 885,000 | | | 2.450%, 1/15/2017f | | | 913,895 | |
| | 2,575,000 | | | 3.750%, 1/15/2022f | | | 2,640,132 | |
| | | | Safeway, Inc. | | | | |
| | 890,000 | | | 5.000%, 8/15/2019 | | | 919,632 | |
| | 1,100,000 | | | 4.750%, 12/1/2021g | | | 1,093,171 | |
| | | | Spectrum Brands Escrow Corporation | | | | |
| | 840,000 | | | 6.375%, 11/15/2020f | | | 892,500 | |
| | | | Tenet Healthcare Corporation | | | | |
| | 550,000 | | | 6.000%, 10/1/2020f | | | 581,625 | |
| | | | Thermo Fisher Scientific, Inc. | | | | |
| | 1,450,000 | | | 3.600%, 8/15/2021 | | | 1,445,723 | |
| | | | Tyson Foods, Inc. | | | | |
| | 1,795,000 | | | 4.500%, 6/15/2022 | | | 1,861,704 | |
| | | | Valeant Pharmaceuticals International | | | | |
| | 1,440,000 | | | 6.375%, 10/15/2020f | | | 1,537,200 | |
| | | | Watson Pharmaceuticals, Inc. | | | | |
| | 1,820,000 | | | 3.250%, 10/1/2022 | | | 1,731,836 | |
| | | | Whirlpool Corporation | | | | |
| | 720,000 | | | 3.700%, 3/1/2023 | | | 706,415 | |
| | | | WM Wrigley Jr. Company | | | | |
| | 730,000 | | | 2.400%, 10/21/2018f | | | 737,702 | |
| | | | | |
| | | | Total | | | 65,306,465 | |
| | | | | |
| |
| Energy (7.5%) | | | | |
| | | | Cameron International Corporation | | | | |
| | 1,440,000 | | | 3.600%, 4/30/2022 | | | 1,450,951 | |
| | | | Canadian Oil Sands, Ltd. | | | | |
| | 1,400,000 | | | 4.500%, 4/1/2022f | | | 1,424,144 | |
| | | | CNOOC Finance 2013, Ltd. | | | | |
| | 1,800,000 | | | 3.000%, 5/9/2023 | | | 1,639,575 | |
| | | | CNPC HK Overseas Capital, Ltd. | | | | |
| | 1,630,000 | | | 5.950%, 4/28/2041f | | | 1,806,120 | |
| | | | Concho Resources, Inc. | | | | |
| | 1,070,000 | | | 6.500%, 1/15/2022 | | | 1,168,975 | |
| | | | Ecopetrol SA | | | | |
| | 1,100,000 | | | 5.875%, 9/18/2023 | | | 1,194,050 | |
| | | | El Paso Pipeline Partners Operating Company, LLC | | | | |
| | 2,150,000 | | | 5.000%, 10/1/2021 | | | 2,291,578 | |
| | | | Enbridge Energy Partners, LP | | | | |
| | 1,270,000 | | | 5.200%, 3/15/2020 | | | 1,388,833 | |
| | 298,000 | | | 4.200%, 9/15/2021 | | | 306,364 | |
| | | | Encana Corporation | | | | |
| | 720,000 | | | 5.150%, 11/15/2041 | | | 679,649 | |
| | | | Energy Transfer Partners, LP | | | | |
| | 2,385,000 | | | 6.700%, 7/1/2018 | | | 2,806,367 | |
| | | | Harvest Operations Corporation | | | | |
| | 1,080,000 | | | 6.875%, 10/1/2017 | | | 1,159,650 | |
| | | | Hess Corporation | | | | |
| | 1,820,000 | | | 5.600%, 2/15/2041 | | | 1,948,550 | |
| | | | Key Energy Services, Inc. | | | | |
| | 1,175,000 | | | 6.750%, 3/1/2021 | | | 1,195,563 | |
| | | | Linn Energy, LLC | | | | |
| | 1,030,000 | | | 7.750%, 2/1/2021 | | | 1,063,475 | |
| | | | Lukoil International Finance BV | | | | |
| | 2,165,000 | | | 3.416%, 4/24/2018f | | | 2,181,238 | |
| | | | Marathon Oil Corporation | | | | |
| | 1,273,000 | | | 5.900%, 3/15/2018 | | | 1,466,605 | |
| | 1,080,000 | | | 2.800%, 11/1/2022 | | | 1,018,660 | |
| | | | Marathon Petroleum Corporation | | | | |
| | 1,080,000 | | | 6.500%, 3/1/2041 | | | 1,224,444 | |
| | | | Markwest Energy Partners, LP | | | | |
| | 455,000 | | | 6.250%, 6/15/2022 | | | 493,675 | |
| | | | MEG Energy Corporation | | | | |
| | 1,080,000 | | | 6.375%, 1/30/2023f | | | 1,086,750 | |
| | | | Newfield Exploration Company | | | | |
| | 625,000 | | | 5.625%, 7/1/2024 | | | 637,500 | |
| | | | Nexen, Inc. | | | | |
| | 1,080,000 | | | 6.400%, 5/15/2037 | | | 1,240,851 | |
| | | | Noble Energy, Inc. | | | | |
| | 1,900,000 | | | 8.250%, 3/1/2019 | | | 2,391,344 | |
| | | | Noble Holding International, Ltd. | | | | |
| | 1,440,000 | | | 3.950%, 3/15/2022g | | | 1,427,468 | |
| | | | Petroleos Mexicanos | | | | |
| | 1,740,000 | | | 3.500%, 7/18/2018 | | | 1,779,150 | |
| | | | Pioneer Natural Resources Company | | | | |
| | 1,500,000 | | | 6.875%, 5/1/2018 | | | 1,788,196 | |
| | 1,440,000 | | | 3.950%, 7/15/2022 | | | 1,467,641 | |
| | | | Range Resources Corporation | | | | |
| | 720,000 | | | 5.000%, 3/15/2023 | | | 718,200 | |
| | | | Rowan Companies, Inc. | | | | |
| | 1,830,000 | | | 5.000%, 9/1/2017 | | | 1,985,907 | |
| | 1,175,000 | | | 4.875%, 6/1/2022 | | | 1,214,113 | |
| | | | Southwestern Energy Company | | | | |
| | 1,500,000 | | | 4.100%, 3/15/2022 | | | 1,516,544 | |
| | | | Spectra Energy Partners, LP | | | | |
| | 1,800,000 | | | 4.600%, 6/15/2021 | | | 1,901,246 | |
| | | | Suncor Energy, Inc. | | | | |
| | 1,060,000 | | | 6.850%, 6/1/2039 | | | 1,308,180 | |
| | | | Sunoco Logistics Partners Operations, LP | | | | |
| | 1,800,000 | | | 3.450%, 1/15/2023 | | | 1,698,714 | |
| | | | Talisman Energy, Inc. | | | | |
| | 1,460,000 | | | 3.750%, 2/1/2021 | | | 1,383,097 | |
| | | | The Williams Companies, Inc. | | | | |
| | 1,440,000 | | | 3.700%, 1/15/2023 | | | 1,323,959 | |
| | | | Transocean, Inc. | | | | |
| | 1,300,000 | | | 5.050%, 12/15/2016 | | | 1,431,975 | |
| | 1,080,000 | | | 7.375%, 4/15/2018 | | | 1,263,395 | |
| | 720,000 | | | 6.375%, 12/15/2021 | | | 811,202 | |
| | | | Valero Energy Corporation | | | | |
| | 1,080,000 | | | 6.625%, 6/15/2037 | | | 1,240,059 | |
| | | | Weatherford International, Inc. | | | | |
| | 1,300,000 | | | 6.350%, 6/15/2017 | | | 1,476,038 | |
The accompanying Notes to Financial Statements are an integral part of this schedule.
213
Income Fund
Schedule of Investments as of October 31, 2013
| | | | | | | | |
Principal
Amount | | | Long-Term Fixed Income (92.5%) | | Value | |
| Energy (7.5%) - continued | | | | |
| | | | Weatherford International, Ltd. | | | | |
| $ | 2,500,000 | | | 6.000%, 3/15/2018 | | | $2,819,505 | |
| | | | | |
| | | | Total | | | 61,819,500 | |
| | | | | |
| |
| Financials (29.8%) | | | | |
| | | | Abbey National Treasury Services plc | | | | |
| | 1,650,000 | | | 3.050%, 8/23/2018 | | | 1,708,110 | |
| | | | Aegon NV | | | | |
| | 1,400,000 | | | 2.956%, 7/29/2049e,h | | | 1,099,140 | |
| | | | American International Group, Inc. | | | | |
| | 1,050,000 | | | 3.800%, 3/22/2017 | | | 1,121,735 | |
| | 2,555,000 | | | 3.375%, 8/15/2020 | | | 2,599,958 | |
| | 1,750,000 | | | 6.400%, 12/15/2020 | | | 2,099,472 | |
| | 625,000 | | | 4.125%, 2/15/2024 | | | 642,514 | |
| | | | American Tower Trust I | | | | |
| | 1,800,000 | | | 1.551%, 3/15/2018f | | | 1,765,440 | |
| | | | Associated Banc Corporation | | | | |
| | 1,820,000 | | | 5.125%, 3/28/2016 | | | 1,963,163 | |
| | | | Associates Corporation of North America | | | | |
| | 2,200,000 | | | 6.950%, 11/1/2018 | | | 2,629,024 | |
| | | | AXA SA | | | | |
| | 1,420,000 | | | 8.600%, 12/15/2030 | | | 1,728,481 | |
| | | | Axis Specialty Finance, LLC | | | | |
| | 1,430,000 | | | 5.875%, 6/1/2020 | | | 1,597,280 | |
| | | | Banco do Brasil SA | | | | |
| | 1,050,000 | | | 9.250%, 10/31/2049f,h | | | 1,144,500 | |
| | | | Banco Santander Mexico SA Institucion de Banca Multiple Grupo Financiero Santand | | | | |
| | 805,000 | | | 4.125%, 11/9/2022f | | | 769,781 | |
| | | | Bank of America Corporation | | | | |
| | 1,700,000 | | | 5.750%, 12/1/2017 | | | 1,943,727 | |
| | 2,160,000 | | | 1.320%, 3/22/2018e | | | 2,185,050 | |
| | 2,220,000 | | | 7.625%, 6/1/2019 | | | 2,767,596 | |
| | 1,440,000 | | | 3.300%, 1/11/2023 | | | 1,382,050 | |
| | 1,100,000 | | | 4.100%, 7/24/2023 | | | 1,114,638 | |
| | 1,050,000 | | | 5.875%, 2/7/2042 | | | 1,206,296 | |
| | | | BBVA Bancomer SA/Texas | | | | |
| | 1,965,000 | | | 6.750%, 9/30/2022f | | | 2,132,025 | |
| | | | BBVA US Senior SAU | | | | |
| | 1,440,000 | | | 4.664%, 10/9/2015 | | | 1,516,173 | |
| | | | Berkshire Hathaway, Inc. | | | | |
| | 1,785,000 | | | 3.750%, 8/15/2021 | | | 1,878,043 | |
| | 900,000 | | | 3.000%, 2/11/2023 | | | 879,038 | |
| | | | Boston Properties, LP | | | | |
| | 2,250,000 | | | 5.875%, 10/15/2019 | | | 2,622,267 | |
| | | | BPCE SA | | | | |
| | 2,185,000 | | | 5.700%, 10/22/2023f | | | 2,240,870 | |
| | | | Capital One Financial Corporation | | | | |
| | 1,930,000 | | | 6.150%, 9/1/2016 | | | 2,164,707 | |
| | | | CIT Group, Inc. | | | | |
| | 980,000 | | | 5.250%, 3/15/2018 | | | 1,059,625 | |
| | | | Citigroup, Inc. | | | | |
| | 1,790,000 | | | 6.000%, 8/15/2017 | | | 2,058,305 | |
| | 2,170,000 | | | 8.500%, 5/22/2019 | | | 2,807,717 | |
| | 1,440,000 | | | 4.050%, 7/30/2022 | | | 1,424,961 | |
| | 2,525,000 | | | 3.500%, 5/15/2023 | | | 2,343,447 | |
| | 1,465,000 | | | 5.500%, 9/13/2025 | | | 1,553,624 | |
| | 2,160,000 | | | 5.950%, 12/29/2049h | | | 2,060,100 | |
| | | | CNA Financial Corporation | | | | |
| | 2,225,000 | | | 7.350%, 11/15/2019 | | | 2,742,495 | |
| | 700,000 | | | 5.875%, 8/15/2020 | | | 812,167 | |
| | | | Commerzbank AG | | | | |
| | 1,465,000 | | | 8.125%, 9/19/2023f | | | 1,563,888 | |
| | | | Cooperatieve Centrale Raiffeisen- Boerenleenbank BA | | | | |
| | 710,000 | | | 11.000%, 12/29/2049f,h | | | 933,650 | |
| | | | Credit Suisse Group AG | | | | |
| | 1,110,000 | | | 6.500%, 8/8/2023f | | | 1,184,814 | |
| | | | CyrusOne, LP | | | | |
| | 1,080,000 | | | 6.375%, 11/15/2022 | | | 1,088,100 | |
| | | | DDR Corporation | | | | |
| | 1,255,000 | | | 4.625%, 7/15/2022 | | | 1,299,500 | |
| | | | Denali Borrower, LLC | | | | |
| | 1,100,000 | | | 5.625%, 10/15/2020f | | | 1,089,000 | |
| | | | Deutsche Bank AG | | | | |
| | 1,820,000 | | | 4.296%, 5/24/2028 | | | 1,669,368 | |
| | | | Developers Diversified Realty Corporation | | | | |
| | 710,000 | | | 7.875%, 9/1/2020 | | | 881,741 | |
| | | | Discover Bank | | | | |
| | 1,300,000 | | | 7.000%, 4/15/2020 | | | 1,534,690 | |
| | 1,095,000 | | | 4.200%, 8/8/2023 | | | 1,110,432 | |
| | | | Discover Financial Services | | | | |
| | 1,080,000 | | | 6.450%, 6/12/2017 | | | 1,232,440 | |
| | | | Duke Realty, LP | | | | |
| | 1,780,000 | | | 3.875%, 10/15/2022 | | | 1,725,144 | |
| | | | Essex Portfolio, LP | | | | |
| | 1,440,000 | | | 3.250%, 5/1/2023 | | | 1,340,988 | |
| | | | Fairfax Financial Holdings, Ltd. | | | | |
| | 1,085,000 | | | 5.800%, 5/15/2021f | | | 1,122,152 | |
| | | | Fifth Third Bancorp | | | | |
| | 1,790,000 | | | 0.673%, 12/20/2016e | | | 1,769,263 | |
| | | | Fifth Third Capital Trust IV | | | | |
| | 1,050,000 | | | 6.500%, 4/15/2037 | | | 1,036,875 | |
| | | | GE Capital Trust I | | | | |
| | 2,500,000 | | | 6.375%, 11/15/2067 | | | 2,687,500 | |
| | | | General Electric Capital Corporation | | | | |
| | 1,775,000 | | | 3.800%, 6/18/2019f | | | 1,876,988 | |
| | 1,100,000 | | | 6.000%, 8/7/2019 | | | 1,301,843 | |
| | 900,000 | | | 5.300%, 2/11/2021 | | | 1,002,288 | |
| | 1,800,000 | | | 1.254%, 3/15/2023e | | | 1,784,263 | |
| | 925,000 | | | 6.750%, 3/15/2032 | | | 1,132,334 | |
| | 1,800,000 | | | 7.125%, 12/15/2049h | | | 2,007,000 | |
| | | | Goldman Sachs Group, Inc. | | | | |
| | 1,750,000 | | | 6.250%, 9/1/2017 | | | 2,024,344 | |
| | 1,440,000 | | | 2.375%, 1/22/2018 | | | 1,448,274 | |
| | 1,830,000 | | | 2.900%, 7/19/2018 | | | 1,868,728 | |
| | 1,600,000 | | | 5.375%, 3/15/2020 | | | 1,799,448 | |
| | 1,750,000 | | | 5.250%, 7/27/2021 | | | 1,931,596 | |
| | 740,000 | | | 6.750%, 10/1/2037 | | | 808,315 | |
| | | | Hartford Financial Services Group, Inc. | | | | |
| | 1,800,000 | | | 5.125%, 4/15/2022 | | | 2,013,149 | |
| | | | HBOS Capital Funding, LP | | | | |
| | 1,100,000 | | | 6.071%, 6/29/2049f,h | | | 1,094,500 | |
| | | | HCP, Inc. | | | | |
| | 1,900,000 | | | 5.625%, 5/1/2017 | | | 2,130,238 | |
| | 1,250,000 | | | 2.625%, 2/1/2020 | | | 1,208,693 | |
| | | | Health Care REIT, Inc. | | | | |
| | 720,000 | | | 6.125%, 4/15/2020 | | | 829,377 | |
| | 1,850,000 | | | 4.950%, 1/15/2021 | | | 1,991,980 | |
The accompanying Notes to Financial Statements are an integral part of this schedule.
214
Income Fund
Schedule of Investments as of October 31, 2013
| | | | | | | | |
Principal
Amount | | | Long-Term Fixed Income (92.5%) | | Value | |
| Financials (29.8%) - continued | |
| | | | HSBC Finance Corporation | | | | |
| | $1,790,000 | | | 6.676%, 1/15/2021 | | | $2,080,295 | |
| | | | HSBC Holdings plc | | | | |
| | 1,800,000 | | | 4.875%, 1/14/2022 | | | 1,974,418 | |
| | 1,400,000 | | | 4.000%, 3/30/2022 | | | 1,449,169 | |
| | | | HSBC USA, Inc. | | | | |
| | 1,465,000 | | | 2.625%, 9/24/2018 | | | 1,505,270 | |
| | 1,100,000 | | | 5.000%, 9/27/2020 | | | 1,193,715 | |
| | | | Huntington Bancshares, Inc. | | | | |
| | 1,650,000 | | | 7.000%, 12/15/2020 | | | 1,966,785 | |
| | | | Icahn Enterprises, LP | | | | |
| | 340,000 | | | 8.000%, 1/15/2018 | | | 356,575 | |
| | 1,460,000 | | | 6.000%, 8/1/2020f | | | 1,496,500 | |
| | | | INB Bank NV | | | | |
| | 1,835,000 | | | 5.800%, 9/25/2023f | | | 1,924,480 | |
| | | | ING Bank NV | | | | |
| | 1,080,000 | | | 3.750%, 3/7/2017f | | | 1,142,186 | |
| | | | ING US, Inc. | | | | |
| | 540,000 | | | 5.650%, 5/15/2053 | | | 513,882 | |
| | 990,000 | | | 2.900%, 2/15/2018 | | | 1,010,355 | |
| | 1,785,000 | | | 5.500%, 7/15/2022 | | | 1,960,178 | |
| | | | International Lease Finance Corporation | | | | |
| | 1,050,000 | | | 4.875%, 4/1/2015 | | | 1,090,688 | |
| | 900,000 | | | 5.750%, 5/15/2016 | | | 961,875 | |
| | 720,000 | | | 2.204%, 6/15/2016e | | | 723,600 | |
| | 1,125,000 | | | 6.750%, 9/1/2016f | | | 1,250,156 | |
| | | | Intesa Sanpaolo SPA | | | | |
| | 2,190,000 | | | 3.875%, 1/15/2019c | | | 2,198,697 | |
| | | | J.P. Morgan Chase & Company | | | | |
| | 2,160,000 | | | 1.138%, 1/25/2018e | | | 2,176,351 | |
| | 1,800,000 | | | 3.375%, 5/1/2023 | | | 1,687,003 | |
| | 1,850,000 | | | 5.500%, 10/15/2040 | | | 2,016,102 | |
| | 1,150,000 | | | 5.150%, 5/29/2049h | | | 1,040,750 | |
| | 1,440,000 | | | 6.000%, 12/29/2049g,h | | | 1,393,200 | |
| | | | J.P. Morgan Chase Bank NA | | | | |
| | 1,420,000 | | | 6.000%, 10/1/2017 | | | 1,636,909 | |
| | | | LBG Capital No. 1 plc | | | | |
| | 1,100,000 | | | 8.000%, 12/29/2049f,h | | | 1,168,750 | |
| | | | Liberty Mutual Group, Inc. | | | | |
| | 1,080,000 | | | 5.000%, 6/1/2021f | | | 1,165,050 | |
| | 1,965,000 | | | 4.950%, 5/1/2022f | | | 2,077,465 | |
| | | | Liberty Property, LP | | | | |
| | 1,830,000 | | | 5.500%, 12/15/2016 | | | 2,030,046 | |
| | 1,125,000 | | | 4.750%, 10/1/2020 | | | 1,206,252 | |
| | | | Lincoln National Corporation | | | | |
| | 1,640,000 | | | 4.000%, 9/1/2023 | | | 1,662,097 | |
| | | | Macquarie Bank, Ltd. | | | | |
| | 1,785,000 | | | 5.000%, 2/22/2017f | | | 1,957,431 | |
| | | | Merrill Lynch & Company, Inc. | | | | |
| | 1,950,000 | | | 6.875%, 4/25/2018 | | | 2,316,027 | |
| | 2,000,000 | | | 7.750%, 5/14/2038 | | | 2,554,936 | |
| | | | MetLife Capital Trust IV | | | | |
| | 300,000 | | | 7.875%, 12/15/2037f | | | 345,750 | |
| | | | MetLife Capital Trust X | | | | |
| | 750,000 | | | 9.250%, 4/8/2038f | | | 969,375 | |
| | | | Mizuho Corporate Bank, Ltd. | | | | |
| | 1,775,000 | | | 2.550%, 3/17/2017f | | | 1,812,960 | |
| | 1,440,000 | | | 3.500%, 3/21/2023f | | | 1,394,798 | |
| | | | Morgan Stanley | | | | |
| | 1,420,000 | | | 5.375%, 10/15/2015 | | | 1,532,247 | |
| | 2,270,000 | | | 6.625%, 4/1/2018 | | | 2,662,297 | |
| | 1,805,000 | | | 2.125%, 4/25/2018g | | | 1,794,612 | |
| | 1,820,000 | | | 5.625%, 9/23/2019 | | | 2,076,802 | |
| | 1,600,000 | | | 5.500%, 1/26/2020 | | | 1,805,814 | |
| | 1,795,000 | | | 4.875%, 11/1/2022 | | | 1,847,879 | |
| | | | Murray Street Investment Trust I | | | | |
| | 700,000 | | | 4.647%, 3/9/2017 | | | 761,061 | |
| | | | Nationwide Building Society | | | | |
| | 1,600,000 | | | 6.250%, 2/25/2020f | | | 1,836,928 | |
| | | | Nordea Bank AB | | | | |
| | 1,830,000 | | | 4.875%, 5/13/2021f | | | 1,927,854 | |
| | | | Omega Healthcare Investors, Inc. | | | | |
| | 1,640,000 | | | 5.875%, 3/15/2024 | | | 1,681,000 | |
| | | | ORIX Corporation | | | | |
| | 2,550,000 | | | 5.000%, 1/12/2016 | | | 2,734,546 | |
| | | | PNC Bank NA | | | | |
| | 1,820,000 | | | 4.200%, 11/1/2025 | | | 1,839,865 | |
| | | | Preferred Term Securities XXIII, Ltd. | | | | |
| | 2,345,199 | | | 0.454%, 12/22/2036e,i | | | 1,741,873 | |
| | | | ProLogis, LP | | | | |
| | 1,800,000 | | | 6.875%, 3/15/2020 | | | 2,146,702 | |
| | | | Prudential Financial, Inc. | | | | |
| | 825,000 | | | 6.200%, 11/15/2040 | | | 975,508 | |
| | 1,070,000 | | | 5.875%, 9/15/2042 | | | 1,086,050 | |
| | 1,435,000 | | | 5.625%, 6/15/2043 | | | 1,429,619 | |
| | | | QBE Capital Funding III, Ltd. | | | | |
| | 1,260,000 | | | 7.250%, 5/24/2041f | | | 1,326,150 | |
| | | | Rabobank Capital Funding Trust II | | | | |
| | 1,249,000 | | | 5.260%, 12/29/2049f,h | | | 1,253,122 | |
| | | | RBS Capital Trust III | | | | |
| | 1,260,000 | | | 5.512%, 9/29/2049g,h | | | 1,197,000 | |
| | | | Regions Bank | | | | |
| | 1,090,000 | | | 7.500%, 5/15/2018 | | | 1,296,817 | |
| | | | Reinsurance Group of America, Inc. | | | | |
| | 1,030,000 | | | 5.625%, 3/15/2017 | | | 1,143,703 | |
| | 1,070,000 | | | 6.450%, 11/15/2019 | | | 1,257,271 | |
| | 1,465,000 | | | 4.700%, 9/15/2023 | | | 1,530,428 | |
| | | | Royal Bank of Scotland Group plc | | | | |
| | 1,460,000 | | | 6.990%, 10/29/2049f,h | | | 1,529,350 | |
| | | | Santander Holdings USA, Inc. | | | | |
| | 2,145,000 | | | 3.000%, 9/24/2015 | | | 2,208,760 | |
| | | | Santander UK plc | | | | |
| | 540,000 | | | 5.000%, 11/7/2023c,f,j | | | 538,277 | |
| | | | Simon Property Group, LP | | | | |
| | 750,000 | | | 10.350%, 4/1/2019 | | | 1,030,044 | |
| | 575,000 | | | 2.750%, 2/1/2023 | | | 541,046 | |
| | | | SLM Corporation | | | | |
| | 1,370,000 | | | 6.250%, 1/25/2016 | | | 1,491,588 | |
| | 2,485,000 | | | 6.000%, 1/25/2017 | | | 2,702,438 | |
| | 576,000 | | | 4.625%, 9/25/2017 | | | 597,600 | |
| | | | Swiss RE Capital I, LP | | | | |
| | 2,600,000 | | | 6.854%, 5/29/2049f,h | | | 2,769,000 | |
| | | | TD Ameritrade Holding Corporation | | | | |
| | 2,225,000 | | | 5.600%, 12/1/2019 | | | 2,601,617 | |
| | | | U.S. Bank National Association | | | | |
| | 1,800,000 | | | 3.778%, 4/29/2020 | | | 1,874,032 | |
| | | | Union Bank NA | | | | |
| | 1,465,000 | | | 2.625%, 9/26/2018 | | | 1,499,258 | |
| | | | UnionBanCal Corporation | | | | |
| | 1,420,000 | | | 3.500%, 6/18/2022 | | | 1,425,923 | |
| | | | UnitedHealth Group, Inc. | | | | |
| | 1,500,000 | | | 6.500%, 6/15/2037 | | | 1,836,833 | |
| | | | Unum Group | | | | |
| | 1,500,000 | | | 7.125%, 9/30/2016 | | | 1,714,968 | |
The accompanying Notes to Financial Statements are an integral part of this schedule.
215
Income Fund
Schedule of Investments as of October 31, 2013
| | | | | | | | |
Principal
Amount | | | Long-Term Fixed Income (92.5%) | | Value | |
| Financials (29.8%) - continued | |
| | | | Ventas Realty, LP | | | | |
| | $1,800,000 | | | 4.000%, 4/30/2019 | | | $1,908,086 | |
| | 1,080,000 | | | 2.700%, 4/1/2020 | | | 1,047,786 | |
| | | | Vesey Street Investment Trust I | | | | |
| | 700,000 | | | 4.404%, 9/1/2016 | | | 755,627 | |
| | | | WEA Finance, LLC | | | | |
| | 720,000 | | | 6.750%, 9/2/2019f | | | 863,662 | |
| | 1,710,000 | | | 7.125%, 10/12/2019f | | | 2,049,375 | |
| | | | WellPoint, Inc. | | | | |
| | 1,450,000 | | | 4.650%, 1/15/2043 | | | 1,358,418 | |
| | | | Wells Fargo & Company | | | | |
| | 1,715,000 | | | 3.450%, 2/13/2023 | | | 1,631,785 | |
| | 1,780,000 | | | 7.980%, 2/28/2049h | | | 2,006,950 | |
| | | | ZFS Finance USA Trust II | | | | |
| | 1,500,000 | | | 6.450%, 12/15/2065f | | | 1,605,000 | |
| | | | | |
| | | | Total | | | 245,169,069 | |
| | | | | |
| |
| Foreign Government (1.7%) | | | | |
| | | | Brazilian Government International Bond | | | | |
| | 1,275,000 | | | 4.250%, 1/7/2025c | | | 1,245,675 | |
| | | | Colombia Government International Bond | | | | |
| | 1,780,000 | | | 2.625%, 3/15/2023 | | | 1,610,010 | |
| | | | Corporacion Andina de Fomento | | | | |
| | 1,226,000 | | | 4.375%, 6/15/2022 | | | 1,242,800 | |
| | | | Costa Rica Government International Bond | | | | |
| | 1,440,000 | | | 4.375%, 4/30/2025f | | | 1,324,800 | |
| | | | Eksportfinans ASA | | | | |
| | 1,750,000 | | | 2.375%, 5/25/2016 | | | 1,705,375 | |
| | | | Export-Import Bank of Korea | | | | |
| | 1,420,000 | | | 4.375%, 9/15/2021 | | | 1,512,402 | |
| | | | Korea Development Bank | | | | |
| | 1,500,000 | | | 4.375%, 8/10/2015 | | | 1,584,012 | |
| | | | Mexico Government International Bond | | | | |
| | 1,850,000 | | | 5.125%, 1/15/2020 | | | 2,085,875 | |
| | 2,020,000 | | | 4.000%, 10/2/2023 | | | 2,051,310 | |
| | | | | |
| | | | Total | | | 14,362,259 | |
| | | | | |
| |
| Mortgage-Backed Securities (3.9%) | | | | |
| | | | Federal Home Loan Mortgage Corporation Gold 15-Yr. Pass Through | | | | |
| | 3,350,000 | | | 3.000%, 12/1/2028c | | | 3,463,062 | |
| | | | Federal Home Loan Mortgage Corporation Gold 30-Yr. Pass Through | | | | |
| | 3,300,000 | | | 3.500%, 11/1/2043c | | | 3,372,703 | |
| | | | Federal National Mortgage Association Conventional 15- Yr. Pass Through | | | | |
| | 1,450,000 | | | 2.500%, 11/1/2028c | | | 1,465,180 | |
| | 700,000 | | | 3.500%, 11/1/2028c | | | 739,102 | |
| | | | Federal National Mortgage Association Conventional 30- Yr. Pass Through | | | | |
| | 7,275,000 | | | 3.500%, 11/1/2043c | | | 7,461,422 | |
| | 10,550,000 | | | 4.000%, 11/1/2043c | | | 11,113,766 | |
| | 4,075,000 | | | 4.500%, 11/1/2043c | | | 4,362,160 | |
| | | | | |
| | | | Total | | | 31,977,395 | |
| | | | | |
| |
| Technology (1.2%) | | | | |
| | | | Apple, Inc. | | | | |
| | 1,800,000 | | | 2.400%, 5/3/2023 | | | 1,644,881 | |
| | | | Computer Sciences Corporation | | | | |
| | 1,250,000 | | | 2.500%, 9/15/2015 | | | 1,280,110 | |
| | | | Hewlett-Packard Company | | | | |
| | 1,410,000 | | | 4.650%, 12/9/2021 | | | 1,427,664 | |
| | | | Motorola Solutions, Inc. | | | | |
| | 2,500,000 | | | 3.750%, 5/15/2022 | | | 2,407,295 | |
| | | | Oracle Corporation | | | | |
| | 1,800,000 | | | 2.500%, 10/15/2022 | | | 1,687,459 | |
| | 460,000 | | | 3.625%, 7/15/2023 | | | 464,174 | |
| | | | Xerox Corporation | | | | |
| | 750,000 | | | 6.400%, 3/15/2016 | | | 833,880 | |
| | | | | |
| | | | Total | | | 9,745,463 | |
| | | | | |
| |
| Transportation (3.3%) | | | | |
| | | | American Airlines Pass Through Trust | | | | |
| | 1,460,000 | | | 4.950%, 1/15/2023f | | | 1,503,800 | |
| | 1,440,000 | | | 4.000%, 7/15/2025f | | | 1,378,800 | |
| | | | Avis Budget Group, Inc. | | | | |
| | 1,080,000 | | | 5.500%, 4/1/2023 | | | 1,058,400 | |
| | | | British Airways plc | | | | |
| | 2,520,000 | | | 4.625%, 6/20/2024f | | | 2,620,800 | |
| | | | Canadian Pacific Railway Company | | | | |
| | 1,440,000 | | | 7.125%, 10/15/2031 | | | 1,763,459 | |
| | | | Continental Airlines, Inc. | | | | |
| | 1,300,000 | | | 6.750%, 9/15/2015f | | | 1,339,000 | |
| | 574,667 | | | 7.250%, 11/10/2019 | | | 655,120 | |
| | 785,000 | | | 4.000%, 10/29/2024 | | | 774,010 | |
| | | | CSX Corporation | | | | |
| | 1,275,000 | | | 3.700%, 11/1/2023 | | | 1,272,515 | |
| | 1,107,000 | | | 6.220%, 4/30/2040 | | | 1,286,717 | |
| | | | Delta Air Lines, Inc. | | | | |
| | 1,149,842 | | | 4.950%, 5/23/2019 | | | 1,233,206 | |
| | 689,469 | | | 4.750%, 5/7/2020 | | | 727,390 | |
| | | | ERAC USA Finance, LLC | | | | |
| | 2,050,000 | | | 5.250%, 10/1/2020f | | | 2,289,186 | |
| | 1,085,000 | | | 4.500%, 8/16/2021f | | | 1,143,668 | |
| | | | Hertz Corporation | | | | |
| | 1,430,000 | | | 6.750%, 4/15/2019 | | | 1,542,612 | |
| | | | Kansas City Southern de Mexico SA de CV | | | | |
| | 1,080,000 | | | 2.350%, 5/15/2020 | | | 1,030,045 | |
| | | | Navios Maritime Holdings, Inc. | | | | |
| | 990,000 | | | 8.875%, 11/1/2017 | | | 1,035,787 | |
| | | | Navios South American Logistics, Inc. | | | | |
| | 270,000 | | | 9.250%, 4/15/2019 | | | 292,275 | |
| | | | Penske Truck Leasing Company, LP | | | | |
| | 1,055,000 | | | 2.500%, 3/15/2016f | | | 1,078,232 | |
| | | | US Airways Pass Through Trust | | | | |
| | 1,800,000 | | | 3.950%, 11/15/2025 | | | 1,706,625 | |
| | | | Virgin Australia Holdings, Ltd. | | | | |
| | 1,640,000 | | | 5.000%, 10/23/2023f | | | 1,681,000 | |
| | | | | |
| | | | Total | | | 27,412,647 | |
| | | | | |
| |
| U.S. Government and Agencies (4.0%) | | | | |
| | | | U.S. Treasury Bonds | | | | |
| | 980,000 | | | 3.125%, 11/15/2041 | | | 893,944 | |
| | 3,920,000 | | | 3.000%, 5/15/2042 | | | 3,475,323 | |
The accompanying Notes to Financial Statements are an integral part of this schedule.
216
Income Fund
Schedule of Investments as of October 31, 2013
| | | | | | | | |
Principal
Amount | | | Long-Term Fixed Income (92.5%) | | Value | |
| U.S. Government and Agencies (4.0%) - continued | |
| | | | U.S. Treasury Notes | | | | |
| | $3,590,000 | | | 2.875%, 3/31/2018 | | | $3,859,530 | |
| | 368,000 | | | 1.000%, 5/31/2018 | | | 365,038 | |
| | 2,840,000 | | | 3.625%, 2/15/2020 | | | 3,169,264 | |
| | 3,980,000 | | | 2.625%, 11/15/2020 | | | 4,161,898 | |
| | 2,000,000 | | | 2.125%, 8/15/2021 | | | 1,996,876 | |
| | 4,410,000 | | | 2.000%, 2/15/2022 | | | 4,319,732 | |
| | 3,759,500 | | | 1.750%, 5/15/2023 | | | 3,511,313 | |
| | 2,940,000 | | | 2.500%, 8/15/2023 | | | 2,928,975 | |
| | | | U.S. Treasury Notes, TIPS | | | | |
| | 3,662,865 | | | 0.625%, 7/15/2021 | | | 3,827,127 | |
| | | | | |
| | | | Total | | | 32,509,020 | |
| | | | | |
|
| U.S. Municipals (0.2%) | |
| | | | Denver, CO City & County Airport Rev. | | | | |
| | 1,450,000 | | | 5.250%, 11/15/2022, Ser. A, AMT | | | 1,646,881 | |
| | | | | |
| | | | Total | | | 1,646,881 | |
| | | | | |
|
| Utilities (7.8%) | |
| | | | Access Midstream Partners, LP | | | | |
| | 1,080,000 | | | 4.875%, 5/15/2023 | | | 1,074,600 | |
| | | | AES Corporation | | | | |
| | 526,000 | | | 7.750%, 10/15/2015 | | | 585,175 | |
| | | | Ameren Illinois Company | | | | |
| | 1,800,000 | | | 6.125%, 11/15/2017 | | | 2,082,852 | |
| | | | American Electric Power Company, Inc. | | | | |
| | 1,435,000 | | | 2.950%, 12/15/2022 | | | 1,342,476 | |
| | | | Arizona Public Service Company | | | | |
| | 1,620,000 | | | 8.750%, 3/1/2019 | | | 2,103,596 | |
| | | | Atlas Pipeline Partners, LP | | | | |
| | 720,000 | | | 4.750%, 11/15/2021f | | | 676,800 | |
| | | | Buckeye Partners, LP | | | | |
| | 1,090,000 | | | 4.150%, 7/1/2023 | | | 1,074,302 | |
| | | | Calpine Corporation | | | | |
| | 1,090,000 | | | 5.875%, 1/15/2024f | | | 1,092,725 | |
| | | | Cleveland Electric Illuminating Company | | | | |
| | 554,000 | | | 5.700%, 4/1/2017 | | | 610,735 | |
| | | | Commonwealth Edison Company | | | | |
| | 1,000,000 | | | 6.150%, 9/15/2017 | | | 1,170,872 | |
| | | | DCP Midstream Operating, LP | | | | |
| | 1,440,000 | | | 3.875%, 3/15/2023 | | | 1,343,193 | |
| | | | DCP Midstream, LLC | | | | |
| | 1,000,000 | | | 5.850%, 5/21/2043f | | | 935,000 | |
| | | | DPL, Inc. | | | | |
| | 1,770,000 | | | 6.500%, 10/15/2016 | | | 1,907,175 | |
| | | | DTE Energy Company | | | | |
| | 1,960,000 | | | 6.375%, 4/15/2033 | | | 2,274,852 | |
| | | | El Paso Pipeline Partners Operating Company, LLC | | | | |
| | 720,000 | | | 4.700%, 11/1/2042 | | | 635,457 | |
| | | | Electricite de France SA | | | | |
| | 1,800,000 | | | 5.250%, 1/29/2049f,h | | | 1,769,400 | |
| | | | Energy Transfer Partners, LP | | | | |
| | 1,995,000 | | | 4.650%, 6/1/2021 | | | 2,089,128 | |
| | 1,000,000 | | | 5.200%, 2/1/2022 | | | 1,076,161 | |
| | | | Enterprise Products Operating, LLC | | | | |
| | 1,400,000 | | | 7.034%, 1/15/2068 | | | 1,547,000 | |
| | 1,070,000 | | | 6.650%, 4/15/2018 | | | 1,267,002 | |
| | | | Exelon Generation Company, LLC | | | | |
| | 600,000 | | | 5.200%, 10/1/2019 | | | 655,951 | |
| | 1,500,000 | | | 4.000%, 10/1/2020 | | | 1,510,470 | |
| | | | Florida Power Corporation | | | | |
| | 1,000,000 | | | 6.400%, 6/15/2038 | | | 1,252,091 | |
| | | | ITC Holdings Corporation | | | | |
| | 2,000,000 | | | 5.875%, 9/30/2016f | | | 2,228,480 | |
| | 1,830,000 | | | 4.050%, 7/1/2023 | | | 1,830,895 | |
| | | | Kinder Morgan Energy Partners, LP | | | | |
| | 710,000 | | | 6.850%, 2/15/2020 | | | 852,116 | |
| | 1,450,000 | | | 5.800%, 3/1/2021 | | | 1,643,340 | |
| | 1,110,000 | | | 4.150%, 2/1/2024 | | | 1,103,238 | |
| | 1,065,000 | | | 5.000%, 8/15/2042 | | | 1,008,063 | |
| | | | Markwest Energy Partners, LP | | | | |
| | 709,000 | | | 6.500%, 8/15/2021 | | | 769,265 | |
| | | | National Rural Utilities Cooperative Finance Corporation | | | | |
| | 1,440,000 | | | 4.750%, 4/30/2043 | | | 1,344,600 | |
| | | | Nevada Power Company | | | | |
| | 1,700,000 | | | 6.750%, 7/1/2037 | | | 2,169,516 | |
| | | | NiSource Finance Corporation | | | | |
| | 1,700,000 | | | 6.400%, 3/15/2018 | | | 1,982,902 | |
| | 1,800,000 | | | 5.450%, 9/15/2020 | | | 2,013,145 | |
| | | | Ohio Edison Company | | | | |
| | 950,000 | | | 6.875%, 7/15/2036 | | | 1,114,466 | |
| | | | Ohio Power Company | | | | |
| | 1,600,000 | | | 6.050%, 5/1/2018 | | | 1,855,173 | |
| | | | ONEOK Partners, LP | | | | |
| | 365,000 | | | 3.200%, 9/15/2018 | | | 377,619 | |
| | 1,100,000 | | | 5.000%, 9/15/2023g | | | 1,175,590 | |
| | | | Pennsylvania Electric Company | | | | |
| | 2,300,000 | | | 5.200%, 4/1/2020 | | | 2,482,378 | |
| | | | PPL Capital Funding, Inc. | | | | |
| | 1,795,000 | | | 3.500%, 12/1/2022 | | | 1,714,929 | |
| | | | PPL Energy Supply, Inc. | | | | |
| | 1,100,000 | | | 4.600%, 12/15/2021 | | | 1,082,171 | |
| | | | PSEG Power, LLC | | | | |
| | 700,000 | | | 5.320%, 9/15/2016 | | | 773,848 | |
| | | | Southern California Edison Company | | | | |
| | 1,415,000 | | | 6.250%, 8/1/2049h | | | 1,478,675 | |
| | | | Southern Star Central Corporation | | | | |
| | 2,400,000 | | | 6.750%, 3/1/2016 | | | 2,436,000 | |
| | | | Southwestern Public Service Company | | | | |
| | 1,730,000 | | | 6.000%, 10/1/2036 | | | 1,960,109 | |
| | | | Spectra Energy Partners, LP | | | | |
| | 735,000 | | | 2.950%, 9/25/2018 | | | 751,865 | |
| | | | | |
| | | | Total | | | 64,225,396 | |
| | | | | |
| | | | | |
| | | | | |
| | | | Total Long-Term Fixed Income (cost $735,137,462) | | | 760,869,293 | |
| | | | | |
| | |
| Shares | | | Preferred Stock (1.5%) | | Value | |
| Financials (1.5%) | |
| | 52,000 | | | Annaly Capital Management, Inc., 7.500%h | | | 1,242,800 | |
| | 12,500 | | | Cobank ACB, 6.250%f,h | | | 1,238,281 | |
The accompanying Notes to Financial Statements are an integral part of this schedule.
217
Income Fund
Schedule of Investments as of October 31, 2013
| | | | | | | | |
| Shares | | | Preferred Stock (1.5%) | | Value | |
| Financials (1.5%) - continued | |
| | 36,000 | | | DDR Corporation, 6.250%h | | | $754,920 | |
| | 72,000 | | | Discover Financial Services, | | | | |
| | | | 6.500%h | | | 1,722,240 | |
| | 43,750 | | | HSBC Holdings plc, 8.000%h | | | 1,196,562 | |
| | 51,800 | | | Morgan Stanley, 7.125%h,k | | | 1,344,210 | |
| | 36,389 | | | RBS Capital Funding Trust VII, | | | | |
| | | | 6.080%h | | | 796,919 | |
| | 44,925 | | | The Allstate Corporation, 5.100% | | | 1,085,388 | |
| | 54,060 | | | The Goldman Sachs Group, Inc., | | | | |
| | | | 5.500%h | | | 1,234,190 | |
| | 16,125 | | | U.S. Bancorp, 6.500%h | | | 432,473 | |
| | 58,500 | | | Wells Fargo & Company, 5.850%h | | | 1,422,720 | |
| | | | | |
| | | | Total | | | 12,470,703 | |
| | | | | |
| | | | | |
| | | | | |
| | | | Total Preferred Stock (cost $12,800,604) | | | 12,470,703 | |
| | | | | |
| | |
| Shares | | | Collateral Held for Securities Loaned (1.7%) | | Value | |
| | 14,088,307 | | | Thrivent Cash Management Trust | | | 14,088,307 | |
| | | | | |
| | | | Total Collateral Held for Securities Loaned (cost $14,088,307) | | | 14,088,307 | |
| | | | | |
| | |
Shares or
Principal
Amount | | | Short-Term Investments (4.2%) | | Value | |
| | | | Federal Home Loan Bank Discount Notes | | | | |
| | 900,000 | | | 0.093%, 11/22/2013l,m | | | 899,951 | |
| | | | Federal National Mortgage Association Discount Notes | | | | |
| | 200,000 | | | 0.100%, 12/4/2013l,m | | | 199,982 | |
| | | | Thrivent Cash Management Trust | | | | |
| | 32,571,966 | | | 0.070% | | | 32,571,966 | |
| | | | U.S. Treasury Bills | | | | |
| | 500,000 | | | 0.070%, 4/24/2014l,n | | | 499,831 | |
| | | | | |
| | | | Total Short-Term Investments (at amortized cost) | | | 34,171,730 | |
| | | | | |
| | | | Total Investments (cost $835,817,247) 104.7% | | | $861,352,237 | |
| | | | | |
| | | | Other Assets and Liabilities, Net (4.7%) | | | (38,566,652 | ) |
| | | | | |
| | | | Total Net Assets 100.0% | | | $822,785,585 | |
| | | | | |
a | The stated interest rate represents the weighted average of all contracts within the bank loan facility. |
b | All or a portion of the loan is unfunded. |
c | Denotes investments purchased on a when-issued or delayed delivery basis. |
d | All or a portion of the security is insured or guaranteed. |
e | Denotes variable rate securities. Variable rate securities are securities whose yields vary with a designated market index or market rate. The rate shown is as of October 31, 2013. |
f | Denotes securities sold under Rule 144A of the Securities Act of 1933, which exempts them from registration. These securities have been deemed liquid and may be resold to other dealers in the program or to other qualified institutional buyers. As of October 31, 2013, the value of these investments was $137,798,140 or 16.7% of total net assets. |
g | All or a portion of the security is on loan. |
h | Denotes perpetual securities. Perpetual securities pay an indefinite stream of interest, but may be called by the issuer at an earlier date. |
i | Denotes restricted securities. Restricted securities are investment securities which have been deemed illiquid and cannot be offered for public sale without first being registered under the Securities Act of 1933. The following table indicates the acquisition date and cost of restricted securities Income Fund owned as of October 31, 2013. |
| | | | | | | | |
Security | | Acquisition
Date | | | Cost | |
Preferred Term Securities XXIII, Ltd. | | | 9/14/2006 | | | $ | 2,345,199 | |
j | Security is fair valued. |
k | Non-income producing security. |
l | The interest rate shown reflects the yield, coupon rate or the discount rate at the date of purchase. |
m | At October 31, 2013, $699,955 of investments were held on deposit with the counterparty and pledged as the initial margin deposit for open futures contracts. |
n | At October 31, 2013, $299,899 of investments were pledged as collateral with the custodian under the agreement between the counterparty, the custodian and the fund for open swap contracts. |
Definitions:
| | | | |
| | AMT | | - Subject to Alternative Minimum Tax |
| | REIT | | - Real Estate Investment Trust is a company that buys, develops, manages and/or sells real estate assets. |
| | Rev. | | - Revenue |
| | Ser. | | - Series |
| | TIPS | | - Treasury Inflation Protected Security. |
Unrealized Appreciation (Depreciation)
Gross unrealized appreciation and depreciation of investments, based on cost for federal income tax purposes, were as follows:
| | | | |
Gross unrealized appreciation | | | $38,220,202 | |
Gross unrealized depreciation | | | (12,735,905 | ) |
| | | | |
Net unrealized appreciation (depreciation) | | | $25,484,297 | |
| |
Cost for federal income tax purposes | | | $835,867,940 | |
The accompanying Notes to Financial Statements are an integral part of this schedule.
218
Income Fund
Schedule of Investments as of October 31, 2013
Fair Valuation Measurements
The following table is a summary of the inputs used, as of October 31, 2013, in valuing Income Fund’s assets carried at fair value.
| | | | | | | | | | | | | | | | |
Investments in Securities | | Total | | | Level 1 | | | Level 2 | | | Level 3 | |
| | | | |
Bank Loans | | | | | | | | | | | | | | | | |
Basic Materials | | | 2,594,291 | | | | – | | | | 2,594,291 | | | | – | |
Capital Goods | | | 1,789,741 | | | | – | | | | 1,789,741 | | | | – | |
Communications Services | | | 12,512,630 | | | | – | | | | 12,512,630 | | | | – | |
Consumer Cyclical | | | 4,849,717 | | | | – | | | | 4,849,717 | | | | – | |
Consumer Non-Cyclical | | | 4,997,138 | | | | – | | | | 4,997,138 | | | | – | |
Energy | | | 2,399,529 | | | | – | | | | 2,399,529 | | | | – | |
Financials | | | 895,483 | | | | – | | | | 895,483 | | | | – | |
Technology | | | 4,765,682 | | | | – | | | | 4,765,682 | | | | – | |
Transportation | | | 2,756,178 | | | | – | | | | 2,756,178 | | | | – | |
Utilities | | | 2,191,815 | | | | – | | | | 2,191,815 | | | | – | |
| | | | |
Long-Term Fixed Income | | | | | | | | | | | | | | | | |
Asset-Backed Securities | | | 7,657,518 | | | | – | | | | 7,657,518 | | | | – | |
Basic Materials | | | 35,371,983 | | | | – | | | | 35,371,983 | | | | – | |
Capital Goods | | | 18,993,553 | | | | – | | | | 18,993,553 | | | | – | |
Collateralized Mortgage Obligations | | | 7,950,643 | | | | – | | | | 7,950,643 | | | | – | |
Commercial Mortgage-Backed Securities | | | 11,345,070 | | | | – | | | | 11,345,070 | | | | – | |
Communications Services | | | 70,457,459 | | | | – | | | | 70,457,459 | | | | – | |
Consumer Cyclical | | | 54,918,972 | | | | – | | | | 54,918,972 | | | | – | |
Consumer Non-Cyclical | | | 65,306,465 | | | | – | | | | 65,306,465 | | | | – | |
Energy | | | 61,819,500 | | | | – | | | | 61,819,500 | | | | – | |
Financials | | | 245,169,069 | | | | – | | | | 243,427,196 | | | | 1,741,873 | |
Foreign Government | | | 14,362,259 | | | | – | | | | 14,362,259 | | | | – | |
Mortgage-Backed Securities | | | 31,977,395 | | | | – | | | | 31,977,395 | | | | – | |
Technology | | | 9,745,463 | | | | – | | | | 9,745,463 | | | | – | |
Transportation | | | 27,412,647 | | | | – | | | | 27,412,647 | | | | – | |
U.S. Government and Agencies | | | 32,509,020 | | | | – | | | | 32,509,020 | | | | – | |
U.S. Municipals | | | 1,646,881 | | | | – | | | | 1,646,881 | | | | – | |
Utilities | | | 64,225,396 | | | | – | | | | 64,225,396 | | | | – | |
| | | | |
Preferred Stock | | | | | | | | | | | | | | | | |
Financials | | | 12,470,703 | | | | 11,232,422 | | | | 1,238,281 | | | | – | |
Collateral Held for Securities Loaned | | | 14,088,307 | | | | 14,088,307 | | | | – | | | | – | |
Short-Term Investments | | | 34,171,730 | | | | 32,571,966 | | | | 1,599,764 | | | | – | |
| |
Total | | | $861,352,237 | | | | $57,892,695 | | | | $801,717,669 | | | | $1,741,873 | |
| |
| | | | |
Other Financial Instruments | | Total | | | Level 1 | | | Level 2 | | | Level 3 | |
| | | | |
Asset Derivatives | | | | | | | | | | | | | | | | |
Futures Contracts | | | 1,358,976 | | | | 1,358,976 | | | | – | | | | – | |
Credit Default Swaps | | | 13,918 | | | | – | | | | 13,918 | | | | – | |
| |
Total Asset Derivatives | | | $1,372,894 | | | | $1,358,976 | | | | $13,918 | | | | $– | |
| |
| | | | |
Liability Derivatives | | | | | | | | | | | | | | | | |
Futures Contracts | | | 2,645,972 | | | | 2,645,972 | | | | – | | | | – | |
| |
Total Liability Derivatives | | | $2,645,972 | | | | $2,645,972 | | | | $– | | | | $– | |
| |
There were no significant transfers between Levels during the period ended October 31, 2013. Transfers between Levels are identified as of the end of the period.
The accompanying Notes to Financial Statements are an integral part of this schedule.
219
Income Fund
Schedule of Investments as of October 31, 2013
| | | | | | | | | | | | | | | | | | | | |
Futures Contracts | | Number of
Contracts
Long/(Short) | | | Expiration
Date | | | Notional
Principal
Amount | | | Value | | | Unrealized
Gain/(Loss) | |
2-Yr. U.S. Treasury Bond Futures | | | 155 | | | | December 2013 | | | | $34,056,879 | | | | $34,165,391 | | | | $108,512 | |
5-Yr. U.S. Treasury Bond Futures | | | (335 | ) | | | December 2013 | | | | (40,049,799 | ) | | | (40,765,312 | ) | | | (715,513 | ) |
10-Yr. U.S. Treasury Bond Futures | | | (585 | ) | | | December 2013 | | | | (72,574,778 | ) | | | (74,505,237 | ) | | | (1,930,459 | ) |
30-Yr. U.S. Treasury Bond Futures | | | 360 | | | | December 2013 | | | | 47,282,036 | | | | 48,532,500 | | | | 1,250,464 | |
Total Futures Contracts | | | | | | | | | | | | | | | | | | | ($1,286,996 | ) |
| | | | | | | | | | | | | | | | | | |
Credit Default Swaps and Counterparty | | Buy/Sell Protection1 | | Termination
Date | | | Notional
Principal
Amount2 | | | Value3 | | | Unrealized
Gain/(Loss) | |
CDX HY 21, 5 Year, at 5.00%; Bank of America | | Buy | | | 12/20/2018 | | | | $5,500,000 | | | | $13,918 | | | | $13,918 | |
Total Credit Default Swaps | | | | | | | | | | | | | $13,918 | | | | $13,918 | |
1 | As the buyer of protection, Income Fund pays periodic fees in return for payment by the seller which is contingent upon an adverse credit event occurring in the underlying issuer or reference entity. As the seller of protection, Income Fund collects periodic fees from the buyer and profits if the credit of the underlying issuer or reference entity remains stable or improves while the swap is outstanding, but the seller in a credit default swap contract would be required to pay the amount of credit loss, determined as specified in the agreement, to the buyer in the event of an adverse credit event in the reference entity. |
2 | The maximum potential amount of future payments Income Fund could be required to make as the seller or receive as the buyer of protection. |
3 | The values for credit indexes (CDX or LCDX) serve as an indicator of the current status of the payment/performance risk and represent the liability or profit for the credit default swap contract had the contract been closed as of the reporting date. When protection has been sold, the value of the swap will increase when the swap spread declines representing an improvement in the reference entity’s credit worthiness. The value of the swap will decrease when the swap spread increases representing a deterioration in the reference entity’s credit worthiness. When protection has been purchased, the value of the swap will increase when the swap spread increases representing a deterioration in the reference entity’s credit worthiness. The value of the swap will decrease when the swap spread declines representing an improvement in the reference entity’s credit worthiness. |
The following table summarizes the fair value and Statement of Assets and Liabilities location, as of October 31, 2013, for Income Fund’s investments in financial derivative instruments by primary risk exposure as discussed under item (2) Significant Accounting Policies of the Notes to Financial Statements.
| | | | | | |
Derivatives by risk category | | Statement of Assets and Liabilities Location | | Fair Value | |
| | |
Asset Derivatives | | | | | | |
| | |
Interest Rate Contracts | | | | | | |
Futures* | | Net Assets - Net unrealized appreciation/(depreciation) on Futures contracts | | | 1,358,976 | |
Total Interest Rate Contracts | | | | | 1,358,976 | |
| | |
Credit Contracts | | | | | | |
Credit Default Swaps | | Receivable/Payable - Swap agreements, at value; Net Assets - Net unrealized appreciation/(depreciation) on Swap agreements | | | 13,918 | |
Total Credit Contracts | | | | | 13,918 | |
| |
Total Asset Derivatives | | | | $ | 1,372,894 | |
| |
| | |
Liability Derivatives | | | | | | |
| | |
Interest Rate Contracts | | | | | | |
Futures* | | Net Assets - Net unrealized appreciation/(depreciation) on Futures contracts | | | 2,645,972 | |
Total Interest Rate Contracts | | | | | 2,645,972 | |
| |
Total Liability Derivatives | | | | $ | 2,645,972 | |
| |
* | Includes cumulative appreciation/depreciation of futures contracts as reported in the Schedule of Investments. Only current day’s variation margin is reported within the Statement of Assets and Liabilities. |
The accompanying Notes to Financial Statements are an integral part of this schedule.
220
Income Fund
Schedule of Investments as of October 31, 2013
The following table summarizes the net realized gains/(losses) and Statement of Operations location, for the period ended October 31, 2013, for Income Fund’s investments in financial derivative instruments by primary risk exposure.
| | | | | | |
Derivatives by risk category | | Statement of Operations Location | | Realized Gains/(Losses)
recognized in Income | |
| | |
Interest Rate Contracts | | | | | | |
Futures | | Net realized gains/(losses) on Futures contracts | | | (328,413 | ) |
| | |
Total Interest Rate Contracts | | | | | (328,413 | ) |
| | |
Credit Contracts | | | | | | |
Credit Default Swaps | | Net realized gains/(losses) on Swap agreements | | | (1,371,080 | ) |
| | |
Total Credit Contracts | | | | | (1,371,080 | ) |
| |
Total | | | | | ($1,699,493 | ) |
| |
The following table summarizes the change in net unrealized appreciation/(depreciation) and Statement of Operations location, for the period ended October 31, 2013, for Income Fund’s investments in financial derivative instruments by primary risk exposure.
| | | | | | |
Derivatives by risk category | | Statement of Operations Location | | Change in unrealized
appreciation/(depreciation)
recognized in Income | |
| | |
Interest Rate Contracts | | | | | | |
Futures | | Change in net unrealized appreciation/(depreciation) on Futures contracts | | | (976,799 | ) |
| | |
Total Interest Rate Contracts | | | | | (976,799 | ) |
| | |
Credit Contracts | | | | | | |
Credit Default Swaps | | Change in net unrealized appreciation/(depreciation) on Swap agreements | | | 264,971 | |
| | |
Total Credit Contracts | | | | | 264,971 | |
| |
Total | | | | | ($711,828 | ) |
| |
The following table presents Income Fund’s average volume of derivative activity during the period ended October 31, 2013.
| | | | | | | | | | | | | | | | |
Derivative Risk Category | | Futures
(Notional)* | | | Futures
(Percentage
of Average
Net Assets) | | | Swaps
(Notional)* | | | Swaps
(Percentage
of Average
Net Assets) | |
Interest Rate Contracts | | | $220,150,751 | | | | 25.6 | % | | | N/A | | | | N/A | |
Credit Contracts | | | N/A | | | | N/A | | | | $3,037,863 | | | | 0.4 | % |
* | Notional amount represents long or short, or both, derivative positions held by the Fund. |
Investment in Affiliates
Affiliated issuers, as defined under the Investment Company Act of 1940, include those in which the Fund’s holdings of an issuer represent 5% or more of the outstanding voting securities of an issuer, or any affiliated mutual fund.
A summary of transactions for the fiscal year to date, in Income Fund, is as follows:
| | | | | | | | | | | | | | | | | | | | | | | | |
Fund | | Value
October 31, 2012 | | | Gross
Purchases | | | Gross
Sales | | | Shares Held at
October 31, 2013 | | | Value
October 31, 2013 | | | Income Earned
November 1, 2012 -
October 31, 2013 | |
Cash Management Trust- Collateral Investment | | | $7,306,530 | | | | $107,858,677 | | | | $101,076,900 | | | | 14,088,307 | | | | $14,088,307 | | | | $21,156 | |
Cash Management Trust- Short Term Investment | | | 67,355,631 | | | | 203,765,182 | | | | 238,548,847 | | | | 32,571,966 | | | | 32,571,966 | | | | 48,048 | |
Total Value and Income Earned | | | 74,662,161 | | | | | | | | | | | | | | | | 46,660,273 | | | | 69,204 | |
The accompanying Notes to Financial Statements are an integral part of this schedule.
221
Municipal Bond Fund
Schedule of Investments as of October 31, 2013
| | | | | | | | |
Principal
Amount | | | Long-Term Fixed Income (99.3%) | | Value | |
| Alabama (0.1%) | | | | |
| | | | Alabama Public School and College Auth. Capital Improvement Rev. Refg. | | | | |
| | $1,500,000 | | | 5.000%, 5/1/2029, Ser. Aa | | | $1,795,740 | |
| | | | | |
| | | | Total | | | 1,795,740 | |
| | | | | |
| |
| Alaska (0.3%) | | | | |
| | | | Valdez, AK Marine Terminal Rev. (Exxon Pipeline Company) | | | | |
| | 2,330,000 | | | 0.070%, 10/1/2025b | | | 2,330,000 | |
| | | | Valdez, AK Marine Terminal Rev. (ExxonMobil) | | | | |
| | 1,650,000 | | | 0.070%, 12/1/2029b | | | 1,650,000 | |
| | | | | |
| | | | Total | | | 3,980,000 | |
| | | | | |
| |
| Arizona (1.1%) | | | | |
| | | | Arizona Health Fac. Auth. Rev. (Blood Systems, Inc.) | | | | |
| | 1,000,000 | | | 5.000%, 4/1/2017 | | | 1,012,240 | |
| | 1,200,000 | | | 5.000%, 4/1/2018 | | | 1,214,388 | |
| | | | Arizona Transportation Board Highway Rev. | | | | |
| | 1,500,000 | | | 5.000%, 7/1/2036, Ser. A | | | 1,583,820 | |
| | | | Glendale, AZ Industrial Development Auth. Rev. (Midwestern University) | | | | |
| | 2,500,000 | | | 5.000%, 5/15/2031 | | | 2,539,875 | |
| | 1,000,000 | | | 5.000%, 5/15/2035 | | | 1,003,300 | |
| | | | Northern Arizona University Refg. C.O.P. | | | | |
| | 1,000,000 | | | 5.000%, 9/1/2022 | | | 1,135,710 | |
| | | | Phoenix, AZ Civic Improvement Corporation Airport Rev. | | | | |
| | 3,060,000 | | | 5.250%, 7/1/2033, Ser. A | | | 3,181,635 | |
| | | | Phoenix, AZ Civic Improvement Corporation Airport Rev. Refg. | | | | |
| | 3,000,000 | | | 5.000%, 7/1/2021, AMT | | | 3,445,170 | |
| | | | Phoenix-Mesa Gateway Airport Auth. Special Fac. Rev. | | | | |
| | 700,000 | | | 5.000%, 7/1/2038, AMT | | | 674,968 | |
| | | | | |
| | | | Total | | | 15,791,106 | |
| | | | | |
| |
| Arkansas (0.3%) | | | | |
| | | | Rogers, AR Sales and Use Tax Refg. and Improvement | | | | |
| | 2,975,000 | | | 4.000%, 11/1/2027, Ser. 2011 | | | 3,114,944 | |
| | 1,000,000 | | | 4.125%, 11/1/2031, Ser. 2011 | | | 1,039,090 | |
| | | | | |
| | | | Total | | | 4,154,034 | |
| | | | | |
| |
| California (12.8%) | | | | |
| | | | Anaheim Public Financing Auth. Lease Rev. (Anaheim Public Improvements) (AGM Insured) | | | | |
| | 3,950,000 | | | 6.000%, 9/1/2024, Ser. Ac | | | 4,623,870 | |
| | | | Beverly Hills Unified School District, Los Angeles County, CA G.O. | | | | |
| | 10,000,000 | | | Zero Coupon, 8/1/2031 | | | 4,207,800 | |
| | | | California Educational Fac. Auth. Rev. (Stanford University) | | | | |
| | 6,000,000 | | | 5.250%, 4/1/2040 | | | 7,215,840 | |
| | | | California G.O. Refg. | | | | |
| | 2,765,000 | | | 5.000%, 9/1/2015 | | | 2,999,914 | |
| | | | California Health Fac. Financing Auth. Rev. | | | | |
| | 3,840,000 | | | 1.450%, 8/15/2033, Ser. Ab | | | 3,860,122 | |
| | | | California Infrastructure and Economic Development Bank Bay Area Toll Bridges Seismic Retrofit Rev. (FGIC Insured) | | | | |
| | 5,000,000 | | | 5.000%, 7/1/2025, Ser. Aa,c | | | 6,109,600 | |
| | | | California Infrastructure and Economic Development Bank Rev. (California Independent System Operator Corporation) | | | | |
| | 3,025,000 | | | 6.250%, 2/1/2039, Ser. Aa | | | 3,250,151 | |
| | | | California Municipal Finance Auth. Ref. Rev. (Biola University) | | | | |
| | 1,500,000 | | | 5.875%, 10/1/2034 | | | 1,550,640 | |
| | | | California Municipal Finance Auth. Refg. Rev. (Biola University) | | | | |
| | 1,250,000 | | | 5.000%, 10/1/2042 | | | 1,163,387 | |
| | | | California State Department of Water Resources Supply Rev. | | | | |
| | 6,250,000 | | | 5.000%, 5/1/2016, Ser. M | | | 6,967,937 | |
| | | | California Various Purpose G.O. | | | | |
| | 2,000,000 | | | 5.250%, 11/1/2021a | | | 2,000,000 | |
| | 6,065,000 | | | 5.500%, 4/1/2024 | | | 7,006,045 | |
| | 10,000 | | | 5.250%, 4/1/2029 | | | 10,173 | |
| | 3,990,000 | | | 5.250%, 4/1/2029a | | | 4,072,314 | |
| | 10,000,000 | | | 5.250%, 3/1/2038 | | | 10,414,500 | |
| | 10,000,000 | | | 6.000%, 4/1/2038 | | | 11,400,700 | |
| | 5,000,000 | | | 6.000%, 11/1/2039 | | | 5,754,550 | |
| | | | California Various Purpose G.O. (NATL-RE Insured) | | | | |
| | 300,000 | | | 6.000%, 8/1/2016c | | | 304,188 | |
| | | | Chula Vista Industrial Development Rev. Refg. (San Diego Gas & Electric Company) | | | | |
| | 2,010,000 | | | 5.875%, 2/15/2034, Ser. C | | | 2,179,805 | |
| | | | Contra Costa County, CA Home Mortgage Rev. (GNMA Collateralized) | | | | |
| | 4,030,000 | | | 7.500%, 5/1/2014a,c | | | 4,174,516 | |
| | | | East Bay Municipal Utility District, Alameda and Contra Costa Counties, CA Water System Rev. Refg. (NATL-RE Insured) | | | | |
| | 10,000,000 | | | 5.000%, 6/1/2037, Ser. Ac | | | 10,526,800 | |
| | | | El Camino Community College District G.O. (Election of 2002) | | | | |
| | 6,480,000 | | | Zero Coupon, 8/1/2034, Ser. C | | | 2,230,157 | |
| | | | Foothill-De Anza CA Community College District G.O. | | | | |
| | 5,000,000 | | | 5.000%, 8/1/2040, Ser. C | | | 5,194,650 | |
| | | | Golden West Schools Financing Auth. Rev. (NATL-RE Insured) | | | | |
| | 420,000 | | | 5.800%, 2/1/2022, Ser. Ac | | | 477,960 | |
The accompanying Notes to Financial Statements are an integral part of this schedule.
222
Municipal Bond Fund
Schedule of Investments as of October 31, 2013
| | | | | | | | |
Principal
Amount | | | Long-Term Fixed Income (99.3%) | | Value | |
| California (12.8%) - continued | | | | |
| | | | Los Angeles Community College District, Los Angeles County, CA G.O. (Election 2008) | | | | |
| | $10,050,000 | | | 6.000%, 8/1/2033, Ser. A | | | $11,446,246 | |
| | | | Los Angeles Department of Airports Rev. (Los Angeles International Airport) | | | | |
| | 8,000,000 | | | 5.000%, 5/15/2040, Ser. A | | | 8,160,480 | |
| | | | Los Angeles Unified School District, Los Angeles County, CA G.O. | | | | |
| | 5,000,000 | | | 5.000%, 1/1/2034, Ser. I | | | 5,214,550 | |
| | | | Pittsburg, CA Redevelopment Agency Tax Allocation (Los Medanos Community Development) (AMBAC Insured) | | | | |
| | 5,000,000 | | | Zero Coupon, 8/1/2024c | | | 3,007,500 | |
| | | | Pomona, CA Single Family Mortgage Rev. Refg. (GNMA/FNMA Collateralized) | | | | |
| | 3,030,000 | | | 7.600%, 5/1/2023, Ser. Aa,c | | | 3,910,124 | |
| | | | San Bernardino, CA Single Family Mortgage Rev. Refg. (FHA/VA MTGS GNMA Collateralized) | | | | |
| | 1,080,000 | | | 7.500%, 5/1/2023, Ser. Aa,c | | | 1,393,978 | |
| | | | San Diego Community College District, San Diego County, CA G.O. (AGM Insured) | | | | |
| | 10,000,000 | | | 5.000%, 5/1/2030a,c | | | 10,708,600 | |
| | | | San Diego County, CA C.O.P. | | | | |
| | 5,000,000 | | | 5.250%, 7/1/2030 | | | 5,213,300 | |
| | | | San Diego Unified School District G.O. | | | | |
| | 10,000,000 | | | Zero Coupon, 7/1/2033, Ser. Ad | | | 7,627,700 | |
| | | | San Francisco, CA City & County Airport Commission Rev. (San Francisco International Airport) | | | | |
| | 4,000,000 | | | 5.500%, 5/1/2028, Ser. A, AMT | | | 4,410,080 | |
| | 7,030,000 | | | 6.000%, 5/1/2039, Ser. E | | | 7,904,462 | |
| | | | San Jose, CA Redevelopment Agency Tax Allocation Refg. (Merged Area Redevelopment) (NATL-RE Insured) | | | | |
| | 2,760,000 | | | 5.000%, 8/1/2025, Ser. Ac | | | 2,820,665 | |
| | | | Santa Monica Community College District, Los Angeles County, CA G.O. | | | | |
| | 5,000,000 | | | Zero Coupon, 8/1/2025, Ser. C | | | 3,133,700 | |
| | | | Tuolumne Wind Project Auth. Rev. (Tuolumne Company) | | | | |
| | 2,000,000 | | | 5.625%, 1/1/2029, Ser. A | | | 2,203,740 | |
| | | | University of California General Rev. | | | | |
| | 5,000,000 | | | 5.250%, 5/15/2039, Ser. O | | | 5,271,650 | |
| | | | | |
| | | | Total | | | 190,122,394 | |
| | | | | |
| |
| Colorado (3.9%) | | | | |
| | | | Colorado Educational and Cultural Fac. Auth. Charter School Refg. Rev. (Pinnacle Charter School, Inc. K-8 Facility) | | | | |
| | 500,000 | | | 5.000%, 6/1/2019 | | | 542,930 | |
| | 200,000 | | | 5.000%, 6/1/2021 | | | 214,706 | |
| | | | Colorado Educational and Cultural Fac. Auth. Charter School Rev. (Cheyenne Mountain Charter Academy) | | | | |
| | 475,000 | | | 5.125%, 6/15/2032, Ser. A | | | 434,221 | |
| | 1,000,000 | | | 5.375%, 6/15/2038, Ser. A | | | 903,460 | |
| | | | Colorado Educational and Cultural Fac. Auth. Charter School Rev. (Crown Pointe Academy of Westminster) | | | | |
| | 1,000,000 | | | 5.000%, 7/15/2039 | | | 885,220 | |
| | | | Colorado Educational and Cultural Fac. Auth. Charter School Rev. (Pinnacle Charter School, Inc.) | | | | |
| | 3,000,000 | | | 5.125%, 12/1/2039 | | | 2,725,620 | |
| | | | Colorado Health Fac. Auth. Health Fac. Rev. (Evangelical Lutheran Good Samaritan Society) | | | | |
| | 2,110,000 | | | 5.000%, 12/1/2024 | | | 2,196,468 | |
| | 1,000,000 | | | 6.125%, 6/1/2038, Ser. Aa | | | 1,033,810 | |
| | 500,000 | | | 5.625%, 6/1/2043 | | | 505,320 | |
| | | | Colorado Health Fac. Auth. Hospital Rev. Refg. (Valley View Hospital Association) | | | | |
| | 3,000,000 | | | 5.750%, 5/15/2036 | | | 3,066,960 | |
| | | | Colorado Higher Education Capital Construction Lease Purchase Financing Program C.O.P | | | | |
| | 1,180,000 | | | 5.500%, 11/1/2027 | | | 1,322,709 | |
| | | | Colorado Higher Education Capital Construction Lease Purchase Financing Program C.O.P. | | | | |
| | 405,000 | | | 5.500%, 11/1/2027a | | | 493,035 | |
| | | | Denver, CO Airport System Rev. (XLCA Insured) | | | | |
| | 5,000,000 | | | 5.000%, 11/15/2022, Ser. Ac | | | 5,360,700 | |
| | | | Denver, CO Health and Hospital Auth. Healthcare Rev. | | | | |
| | 5,000,000 | | | 5.500%, 12/1/2030 | | | 5,069,900 | |
| | 2,000,000 | | | 5.250%, 12/1/2031, Ser. A | | | 2,019,660 | |
| | | | Jefferson County School District No. R-1, Jefferson and Broomfield Counties, CO G.O. Refg. (AGM Insured) | | | | |
| | 10,000,000 | | | 5.000%, 12/15/2016, Ser. Ac | | | 10,906,100 | |
| | | | Larimer County, CO Poudre School District R-1 G.O. Improvement (NATL-RE-IBC Insured) | | | | |
| | 2,620,000 | | | 7.000%, 12/15/2016c | | | 2,904,323 | |
| | | | Northwest Parkway Public Highway Auth. Rev. (AMBAC Insured) | | | | |
| | 4,000,000 | | | 5.700%, 6/15/2021, Ser. Ca,c | | | 4,527,720 | |
The accompanying Notes to Financial Statements are an integral part of this schedule.
223
Municipal Bond Fund
Schedule of Investments as of October 31, 2013
| | | | | | | | |
Principal
Amount | | | Long-Term Fixed Income (99.3%) | | Value | |
| Colorado (3.9%) - continued | |
| | | | Plaza Metropolitan District No. 1 Revenue Refg. (City of Lakewood) | | | | |
| | $1,000,000 | | | 5.000%, 12/1/2021 | | | $1,042,430 | |
| | 500,000 | | | 5.000%, 12/1/2022 | | | 517,685 | |
| | | | University of Colorado University Enterprise Rev. | | | | |
| | 1,250,000 | | | 5.375%, 6/1/2032, Ser. A | | | 1,373,662 | |
| | 9,790,000 | | | 5.000%, 6/1/2033 | | | 10,377,890 | |
| | | | | |
| | | | Total | | | 58,424,529 | |
| | | | | |
|
| District of Columbia (1.2%) | |
| | | | District of Columbia Income Tax Secured Rev. Refg. | | | | |
| | 2,325,000 | | | 5.000%, 12/1/2017, Ser. A | | | 2,696,186 | |
| | 5,225,000 | | | 5.000%, 12/1/2028, Ser. C | | | 5,746,246 | |
| | | | District of Columbia Tobacco Settlement Financing Corporation Tobacco Settlement Rev. | | | | |
| | 3,065,000 | | | 6.250%, 5/15/2024 | | | 3,080,969 | |
| | | | Metropolitan Washington DC Airports Auth. Airport System Rev. | | | | |
| | 6,000,000 | | | 5.000%, 10/1/2038, Ser. A, AMT | | | 6,079,260 | |
| | | | | |
| | | | Total | | | 17,602,661 | |
| | | | | |
|
| Florida (4.5%) | |
| | | | Broward County, FL Water and Sewer Utility Rev. | | | | |
| | 3,115,000 | | | 5.250%, 10/1/2034, Ser. A | | | 3,357,191 | |
| | | | CityPlace Community Development District Special Assessment and Rev. Refg. | | | | |
| | 500,000 | | | 5.000%, 5/1/2017 | | | 547,155 | |
| | 2,000,000 | | | 5.000%, 5/1/2026 | | | 2,150,220 | |
| | | | County of Broward, FL Fuel System Rev. (Fort Lauderdale Fuel Fac.) (AGM Insured) | | | | |
| | 575,000 | | | 5.000%, 4/1/2021, Ser. A, AMTc | | | 639,538 | |
| | 605,000 | | | 5.000%, 4/1/2022, Ser. A, AMTc | | | 670,570 | |
| | 700,000 | | | 5.000%, 4/1/2025, Ser. A, AMTc | | | 756,679 | |
| | | | Greater Orlando Aviation Auth. Airport Fac. Rev. | | | | |
| | 1,500,000 | | | 5.000%, 10/1/2039, Ser. C | | | 1,548,660 | |
| | | | Gulf Breeze FL Rev. Refg. | | | | |
| | 2,020,000 | | | 5.000%, 12/1/2033 | | | 2,067,026 | |
| | | | Hillsborough County, FL Community Investment Tax Refg. Rev. | | | | |
| | 4,025,000 | | | 5.000%, 11/1/2017, Ser. B | | | 4,607,136 | |
| | | | Jacksonville FL Port Auth. Rev. | | | | |
| | 2,265,000 | | | 5.000%, 11/1/2038, Ser. A, AMT | | | 2,242,667 | |
| | | | Leon County Educational Fac. Auth. C.O.P. (Southgate Residence Hall) | | | | |
| | 1,145,000 | | | 8.500%, 9/1/2017a | | | 1,476,214 | |
| | | | Miami-Dade County, FL Aviation Rev. (Miami International Airport-Hub of the Americas) | | | | |
| | 7,500,000 | | | 5.500%, 10/1/2036, Ser. B | | | 7,872,900 | |
| | | | Miami-Dade County, FL Aviation Rev. (Miami International Airport-Hub of the Americas) | | | | |
| | 8,000,000 | | | 5.500%, 10/1/2041, Ser. A | | | 8,389,360 | |
| | | | Miami-Dade County, FL Public Fac. Rev. (Jackson Health System) (AGM Insured) | | | | |
| | 2,000,000 | | | 5.625%, 6/1/2034c | | | 2,077,780 | |
| | | | Orange County Health Fac. Auth. Hospital Rev. (Orlando Regional Healthcare System) (NATL-RE Insured) | | | | |
| | 2,700,000 | | | 6.250%, 10/1/2018, Ser. Ac | | | 3,226,608 | |
| | | | Orange County, FL Health Fac. Auth. Hospital Rev. (Orlando Health, Inc.) | | | | |
| | 5,010,000 | | | 5.125%, 10/1/2026 | | | 5,276,732 | |
| | | | Orange County, Orlando Expressway Auth. Rev. | | | | |
| | 3,600,000 | | | 5.000%, 7/1/2030, Ser. A | | | 3,780,432 | |
| | 4,095,000 | | | 5.000%, 7/1/2035, Ser. C | | | 4,201,920 | |
| | | | St. Johns County Industrial Development Auth. Rev. (Presbyterian Retirement Communities) | | | | |
| | 6,490,000 | | | 5.875%, 8/1/2040, Ser. A | | | 6,584,754 | |
| | | | Tallahassee, FL Consolidated Utility Systems Rev. | | | | |
| | 4,535,000 | | | 5.000%, 10/1/2032 | | | 4,861,611 | |
| | | | | |
| | | | Total | | | 66,335,153 | |
| | | | | |
|
| Georgia (1.3%) | |
| | | | Atlanta, GA Airport General Rev. | | | | |
| | 1,000,000 | | | 5.000%, 1/1/2033, Ser. C, AMT | | | 1,018,710 | |
| | 500,000 | | | 5.000%, 1/1/2034, Ser. C, AMT | | | 507,665 | |
| | 500,000 | | | 5.000%, 1/1/2037, Ser. C, AMT | | | 504,635 | |
| | | | Brunswick, GA Water and Sewer Rev. Refg. and Improvement (NATL-RE Insured) | | | | |
| | 1,500,000 | | | 6.100%, 10/1/2019a,c | | | 1,775,430 | |
| | | | Burke County Development Auth. Pollution Control Rev. (Oglethorpe Power Corporation Vogtle) | | | | |
| | 6,000,000 | | | 5.700%, 1/1/2043, Ser. C | | | 6,290,580 | |
| | | | Chatham County Hospital Auth., Savannah, GA Hospital Rev. Improvement (Memorial Health University Medical Center, Inc.) | | | | |
| | 1,560,000 | | | 5.750%, 1/1/2029, Ser. Aa | | | 1,573,385 | |
| | | | Cherokee County, GA Water and Sewerage (NATL-RE Insured) | | | | |
| | 4,875,000 | | | 5.500%, 8/1/2018c | | | 5,389,849 | |
The accompanying Notes to Financial Statements are an integral part of this schedule.
224
Municipal Bond Fund
Schedule of Investments as of October 31, 2013
| | | | | | | | |
Principal
Amount | | | Long-Term Fixed Income (99.3%) | | Value | |
| Georgia (1.3%) - continued | |
| | | | Milledgeville and Baldwin County Development Auth. Rev. (Georgia College and State University Foundation Property III, LLC Student Housing System) | | | | |
| | $2,500,000 | | | 5.500%, 9/1/2024a | | | $2,633,525 | |
| | | | | |
| | | | Total | | | 19,693,779 | |
| | | | | |
| |
| Hawaii (1.6%) | | | | |
| | | | Hawaii Airports System Rev. | | | | |
| | 3,040,000 | | | 5.250%, 7/1/2030, Ser. A | | | 3,259,974 | |
| | | | Hawaii State Department of Budget and Finance Special Purpose Senior Living Rev. Refg. | | | | |
| | 1,000,000 | | | 5.125%, 11/15/2032 | | | 998,180 | |
| | 5,395,000 | | | 5.250%, 11/15/2037 | | | 5,315,262 | |
| | | | Hawaii State Harbor System Rev. | | | | |
| | 6,000,000 | | | 5.250%, 7/1/2030, Ser. A | | | 6,423,300 | |
| | | | Honolulu, HI Board of Water Supply Water System Rev. (NATL-RE Insured) | | | | |
| | 5,000,000 | | | 5.000%, 7/1/2036, Ser. Ac | | | 5,202,550 | |
| | | | Honolulu, HI G.O. (NATL-RE-IBC Insured) | | | | |
| | 2,555,000 | | | 6.250%, 4/1/2014, Ser. Ac | | | 2,618,160 | |
| | | | | |
| | | | Total | | | 23,817,426 | |
| | | | | |
| |
| Illinois (8.5%) | | | | |
| | | | Broadview, Cook County, IL Tax Increment Rev Rev. | | | | |
| | 685,000 | | | 5.375%, 7/1/2015 | | | 685,370 | |
| | | | Chicago Metropolitan Water Reclamation District G.O. Refg. | | | | |
| | 7,950,000 | | | 5.250%, 12/1/2032, Ser. C | | | 8,805,022 | |
| | | | Chicago Tax Increment Allocation (Near South Redevelopment) (ACA Insured) | | | | |
| | 7,200,000 | | | Zero Coupon, 11/15/2014, Ser. Ac | | | 6,915,600 | |
| | | | Chicago, IL Midway Airport Rev. | | | | |
| | 2,000,000 | | | 5.000%, 1/1/2034, Ser. Bb | | | 2,098,260 | |
| | | | Cook County, IL Community Consolidated School District No. 15 Limited Tax Capital Appreciation School G.O. (NATL-RE Insured) | | | | |
| | 1,000,000 | | | Zero Coupon, 12/1/2014a,c | | | 976,710 | |
| | | | Cook County, IL School District No. 99 (Cicero) G.O. School (NATL-RE Insured) | | | | |
| | 1,565,000 | | | 8.500%, 12/1/2014c | | | 1,675,818 | |
| | 1,815,000 | | | 8.500%, 12/1/2016c | | | 2,151,047 | |
| | | | Illinois Educational Fac. Auth. Rev. (Northwestern University) | | | | |
| | 4,900,000 | | | 5.250%, 11/1/2032a,b | | | 5,382,650 | |
| | | | Illinois Finance Auth. Rev. (DePaul University) | | | | |
| | 4,075,000 | | | 6.000%, 10/1/2032, Ser. A | | | 4,496,599 | |
| | | | Illinois Finance Auth. Rev. (Northwestern Memorial HealthCare) | | | | |
| | 1,630,000 | | | 5.000%, 8/15/2037 | | | 1,634,466 | |
| | | | Illinois Finance Auth. Rev. (Rush University Medical Center) | | | | |
| | 5,000,000 | | | 7.250%, 11/1/2038, Ser. A | | | 5,814,200 | |
| | | | Illinois Finance Auth. Rev. (The Art Institute of Chicago) | | | | |
| | 2,390,000 | | | 5.000%, 3/1/2034, Ser. A | | | 2,470,352 | |
| | | | Illinois Finance Auth. Rev. Refg. (Rush University Medical Center) (NATL-RE Insured ) | | | | |
| | 2,020,000 | | | 5.250%, 11/1/2035, Ser. Bc | | | 2,071,591 | |
| | | | Illinois G.O. | | | | |
| | 5,000,000 | | | 5.000%, 3/1/2027 | | | 5,023,300 | |
| | 1,000,000 | | | 5.500%, 7/1/2033 | | | 1,014,890 | |
| | 1,750,000 | | | 5.500%, 7/1/2038 | | | 1,742,843 | |
| | | | Illinois Health Fac. Auth. Rev. Refg. (Lutheran General Health System) (AGM-CR Insured) | | | | |
| | 2,045,000 | | | 6.000%, 4/1/2018, Ser. Cc | | | 2,305,962 | |
| | | | Illinois Health Fac. Auth. Rev. Refg. (Thorek Hospital and Medical Center) | | | | |
| | 2,620,000 | | | 5.250%, 8/15/2018 | | | 2,627,441 | |
| | | | Illinois Sales Tax Rev. (Build Illinois ) | | | | |
| | 2,000,000 | | | 5.000%, 6/15/2028a | | | 2,058,480 | |
| | | | Illinois Sales Tax Rev. (Build Illinois Bonds) (NATL-RE Insured) | | | | |
| | 7,975,000 | | | 5.750%, 6/15/2018, 2nd Ser.c | | | 9,491,207 | |
| | | | Joliet Regional Port District, IL Marine Terminal Rev. Refg. (Exxon) | | | | |
| | 4,000,000 | | | 0.070%, 10/1/2024b | | | 4,000,000 | |
| | | | McHenry and Lake Counties G.O. School (AGM Insured) | | | | |
| | 840,000 | | | 9.000%, 12/1/2017c | | | 998,088 | |
| | 2,195,000 | | | 9.000%, 12/1/2017a,c | | | 2,653,009 | |
| | | | Metropolitan Pier and Exposition Auth., IL Refg. (McCormick Place Expansion) (NATL-RE Insured) | | | | |
| | 885,000 | | | 5.500%, 6/15/2015, Ser. Ac | | | 944,357 | |
| | 17,605,000 | | | Zero Coupon, 6/15/2020, Ser. Ac | | | 14,188,750 | |
| | 7,000,000 | | | 5.500%, 6/15/2020, Ser. Bc | | | 7,766,640 | |
| | 3,100,000 | | | Zero Coupon, 6/15/2024, Ser. Ac | | | 1,953,403 | |
| | 2,000,000 | | | Zero Coupon, 12/15/2024, Ser. Ac | | | 1,213,200 | |
| | | | Railsplitter Tobacco Settlement Auth. Tobacco Settlement Rev. | | | | |
| | 6,340,000 | | | 5.000%, 6/1/2017 | | | 7,083,111 | |
| | | | Regional Transportation Auth., Cook, DuPage, Kane, Lake, McHenry and Will Counties, IL Rev. (NATL-RE Insured) | | | | |
| | 2,780,000 | | | 6.700%, 11/1/2021, Ser. Ac | | | 3,263,442 | |
| | | | State of Illinois G.O. Refg. | | | | |
| | 9,000,000 | | | 5.000%, 8/1/2017 | | | 9,981,450 | |
| | | | University of Illinois Auxiliary Fac. System Rev. | | | | |
| | 2,500,000 | | | 5.750%, 4/1/2038, Ser. A | | | 2,724,625 | |
| | | | | |
| | | | Total | | | 126,211,883 | |
| | | | | |
The accompanying Notes to Financial Statements are an integral part of this schedule.
225
Municipal Bond Fund
Schedule of Investments as of October 31, 2013
| | | | | | | | |
Principal
Amount | | | Long-Term Fixed Income (99.3%) | | Value | |
| Indiana (2.3%) | | | | |
| | | | East Chicago Elementary School Building Corporation, Lake County, IN First Mortgage Refg. | | | | |
| | $475,000 | | | 6.250%, 1/5/2016 | | | $497,467 | |
| | | | Indiana Bond Bank Special Program (Clark Memorial Hospital) | | | | |
| | 7,000,000 | | | 5.500%, 8/1/2029, Ser. D | | | 7,420,070 | |
| | | | Indiana Finance Auth. Hospital Rev. (Deaconess Hospital) | | | | |
| | 1,500,000 | | | 6.750%, 3/1/2039, Ser. A | | | 1,650,585 | |
| | | | Indiana Finance Auth. Private Activity (Ohio River Bridges East End Crossing) | | | | |
| | 1,000,000 | | | 5.000%, 1/1/2019, Ser. B, AMT | | | 1,062,850 | |
| | | | Indiana Health and Educational Fac. Financing Auth. Health System Rev. Refg. (Sisters of St. Francis Health Services, Inc.) (AGM Insured) | | | | |
| | 450,000 | | | 5.250%, 5/15/2041, Ser. Ec | | | 454,649 | |
| | | | Indiana Municipal Power Agency Power Supply System Rev. | | | | |
| | 4,155,000 | | | 5.000%, 1/1/2042, Ser. A | | | 4,194,182 | |
| | | | Indiana Municipal Power Agency Rev. | | | | |
| | 1,750,000 | | | 5.250%, 1/1/2034, Ser. Ae | | | 1,844,745 | |
| | | | Indiana Transportation Finance Auth. Highway Rev. | | | | |
| | 160,000 | | | 6.800%, 12/1/2016, Ser. A | | | 175,077 | |
| | | | Indiana Transportation Finance Auth. Highway Rev. (NATL-RE- IBC Insured) | | | | |
| | 1,520,000 | | | 7.250%, 6/1/2015, Ser. Ac | | | 1,624,333 | |
| | | | Indianapolis Local Public Improvement Bond Bank Rev. (Waterworks) | | | | |
| | 5,000,000 | | | 5.750%, 1/1/2038, Ser. A | | | 5,319,850 | |
| | | | Knox County, IN Economic Development Rev. and Refg. | | | | |
| | 2,850,000 | | | 5.000%, 4/1/2037, Ser. A | | | 2,788,297 | |
| | 6,965,000 | | | 5.000%, 4/1/2042, Ser. A | | | 6,699,146 | |
| | | | | |
| | | | Total | | | 33,731,251 | |
| | | | | |
| |
| Iowa (0.6%) | | | | |
| | | | Cedar Falls Community School District, Black Hawk County School Infrastructure Sales, Services and Use Tax Rev. | | | | |
| | 3,165,000 | | | 5.400%, 6/1/2029 | | | 3,295,999 | |
| | | | Des Moines, IA Airport Auth. Rev. Refg. | | | | |
| | 1,205,000 | | | 5.000%, 6/1/2024, AMT | | | 1,314,523 | |
| | | | Waterloo, IA Community School District Tax Rev. Refg. (School Infrastructure Sales, Services, and Use) | | | | |
| | 3,560,000 | | | 5.000%, 7/1/2029, Ser. A | | | 3,738,427 | |
| | | | | |
| | | | Total | | | 8,348,949 | |
| | | | | |
| |
| Kansas (0.2%) | | | | |
| | | | Kansas Development Finance Auth. Rev. | | | | |
| | 3,500,000 | | | 5.000%, 5/15/2030, Ser. S | | | 3,505,740 | |
| | | | Sedgwick and Shawnee Counties, KS Single Family Mortgage Rev. (GNMA Collateralized) | | | | |
| | 65,000 | | | 6.700%, 6/1/2029, Ser. A-2c | | | 65,222 | |
| | | | | |
| | | | Total | | | 3,570,962 | |
| | | | | |
| |
| Kentucky (1.4%) | | | | |
| | | | Kentucky Economic Development Finance Auth. Hospital Rev. (Owensboro Medical Health System, Inc.) | | | | |
| | 8,615,000 | | | 6.375%, 6/1/2040, Ser. A | | | 9,088,739 | |
| | | | Kentucky State Turnpike Auth. Economic Development Road Rev. | | | | |
| | 5,000,000 | | | 5.000%, 7/1/2028, Ser. A | | | 5,492,950 | |
| | | | Paducah, KY Electric Plant Board Rev. (AGM Insured) | | | | |
| | 2,500,000 | | | 5.250%, 10/1/2035, Ser. Ac | | | 2,656,700 | |
| | | | Pikeville, KY Hospital Rev. (Pikeville Medical Center, Inc.) | | | | |
| | 3,540,000 | | | 6.500%, 3/1/2041 | | | 3,884,654 | |
| | | | | |
| | | | Total | | | 21,123,043 | |
| | | | | |
| |
| Louisiana (2.3%) | | | | |
| | | | City of Alexandria, LA Utilities Rev. | | | | |
| | 5,000,000 | | | 5.000%, 5/1/2043, Ser. Ae | | | 5,045,100 | |
| | | | Lafayette Public Power Auth. Electric Rev. | | | | |
| | 375,000 | | | 5.000%, 11/1/2022 | | | 439,833 | |
| | 1,520,000 | | | 5.000%, 11/1/2031 | | | 1,607,917 | |
| | | | Louisiana Public Fac. Auth. Rev. (Tulane University of Louisiana) | | | | |
| | 1,000,000 | | | 5.000%, 10/1/2037 | | | 1,027,140 | |
| | | | Louisiana Public Fac. Auth. Rev. (University of New Orleans Research and Technology Foundation, Inc.-Student Housing) (NATL-RE Insured) | | | | |
| | 4,745,000 | | | 5.250%, 3/1/2031c | | | 4,914,349 | |
| | | | Louisiana State Gas and Fuels Tax Rev. | | | | |
| | 5,000,000 | | | 5.000%, 5/1/2033, Ser. B | | | 5,324,400 | |
| | 7,000,000 | | | 5.000%, 5/1/2045, Ser. B | | | 7,206,920 | |
| | | | Louisiana Utilities Rev. (Parish of St. Tammany) | | | | |
| | 2,000,000 | | | 5.500%, 8/1/2035, Ser. B | | | 2,103,140 | |
| | | | Port of New Orleans Board of Commissioners Port Fac. Refg. Rev. | | | | |
| | 750,000 | | | 5.000%, 4/1/2030, Ser. B, AMT | | | 743,340 | |
| | 1,500,000 | | | 5.000%, 4/1/2031, Ser. B, AMT | | | 1,484,460 | |
| | | | Tobacco Settlement Financing Corporation Rev. | | | | |
| | 3,620,000 | | | 5.000%, 5/15/2024, Ser. A | | | 3,752,601 | |
| | | | | |
| | | | Total | | | 33,649,200 | |
| | | | | |
The accompanying Notes to Financial Statements are an integral part of this schedule.
226
Municipal Bond Fund
Schedule of Investments as of October 31, 2013
| | | | | | | | |
Principal
Amount | | | Long-Term Fixed Income (99.3%) | | Value | |
| Maryland (0.1%) | | | | |
| | | | Morgan State University Academic Fees and Auxiliary Fac. Fees Rev. Refg. (NATL-RE Insured) | | | | |
| | $1,965,000 | | | 6.050%, 7/1/2015c | | | $2,031,948 | |
| | | | | |
| | | | Total | | | 2,031,948 | |
| | | | | |
| |
| Massachusetts (4.1%) | | | | |
| | | | Massachusetts Bay Transportation Auth. Sales Tax Rev. | | | | |
| | 6,000,000 | | | 5.250%, 7/1/2031, Ser. A | | | 6,926,340 | |
| | | | Massachusetts Bay Transportation Auth. Sales Tax Rev. (NATL-RE Insured) | | | | |
| | 5,000,000 | | | 5.500%, 7/1/2025, Ser. Bc | | | 6,204,900 | |
| | | | Massachusetts Development Finance Agency Rev. | | | | |
| | 3,000,000 | | | 5.000%, 7/1/2042, Ser. J | | | 3,154,710 | |
| | | | Massachusetts Development Finance Agency Rev. (Northeastern University) | | | | |
| | 750,000 | | | 5.000%, 10/1/2031 | | | 782,827 | |
| | | | Massachusetts Health and Educational Fac. Auth. Rev. (Massachusetts Institute of Technology) | | | | |
| | 15,295,000 | | | 5.250%, 7/1/2033, Ser. L | | | 18,110,504 | |
| | | | Massachusetts Health and Educational Fac. Auth. Rev. (Tufts University) | | | | |
| | 5,400,000 | | | 5.500%, 2/15/2028, Ser. M | | | 6,450,300 | |
| | | | Massachusetts Port Auth. Rev. | | | | |
| | 8,300,000 | | | 5.000%, 7/1/2042, Ser. A, AMT | | | 8,357,436 | |
| | | | Massachusetts School Building Auth. Sales Tax Refg. | | | | |
| | 5,000,000 | | | 5.000%, 8/15/2029, Ser. B | | | 5,514,650 | |
| | | | Massachusetts Water Pollution Abatement Trust Pool Program Refg. | | | | |
| | 5,000,000 | | | 5.000%, 8/1/2024 | | | 6,050,100 | |
| | | | | |
| | | | Total | | | 61,551,767 | |
| | | | | |
| |
| Michigan (2.1%) | | | | |
| | | | East Lansing Building Auth., Ingham and Clinton Counties, MI Building Auth. Rev. (G.O. Limited Tax) | | | | |
| | 2,000,000 | | | 5.700%, 4/1/2020 | | | 2,275,240 | |
| | | | Flint Hospital Building Auth. Rev. Refg. (Hurley Medical Center) | | | | |
| | 3,000,000 | | | 5.000%, 7/1/2019, Ser. B | | | 3,111,900 | |
| | | | Grand Valley State University General Rev. | | | | |
| | 1,045,000 | | | 5.750%, 12/1/2034 | | | 1,121,400 | |
| | | | Kalamazoo Hospital Finance Auth. Hospital Rev. (AGM Insured) | | | | |
| | 4,000,000 | | | 5.250%, 5/15/2036c | | | 4,077,360 | |
| | | | Kalamazoo Hospital Finance Auth. Hospital Rev. Refg. (Bronson Methodist Hospital) (AGM Insured) | | | | |
| | 3,250,000 | | | 5.000%, 5/15/2026, Ser. Ac | | | 3,402,522 | |
| | | | Kent County, MI G.O. | | | | |
| | 2,775,000 | | | 5.000%, 1/1/2024, AMT | | | 3,060,131 | |
| | | | Michigan Financing Auth. Hospital Rev. and Refg. (Crittenton Hospital Medical Center) | | | | |
| | 3,230,000 | | | 5.000%, 6/1/2039, Ser. A | | | 3,095,018 | |
| | | | Michigan State Hospital Finance Auth. Hospital Rev. and Refg. (Sisters of Mercy Health Corporation) (NATL-RE Insured) | | | | |
| | 525,000 | | | 5.375%, 8/15/2014, Ser. Pa,c | | | 529,452 | |
| | 20,000 | | | 5.375%, 8/15/2014, Ser. Pa,c | | | 20,170 | |
| | | | Michigan State Trunk Line Fund Refg. (AGM Insured) | | | | |
| | 5,000,000 | | | 5.000%, 11/1/2022c | | | 5,390,800 | |
| | | | Rochester Community School District, Oakland and Macomb Counties, Michigan School Building and Site G.O. (NATL-RE Q-SBLF Insured) | | | | |
| | 4,560,000 | | | 5.000%, 5/1/2019c | | | 5,319,377 | |
| | | | | |
| | | | Total | | | 31,403,370 | |
| | | | | |
| |
| Minnesota (2.2%) | | | | |
| | | | Baytown Township, MN Lease Rev. (St.Croix Preparatory Academy) | | | | |
| | 1,000,000 | | | 7.000%, 8/1/2038, Ser. A | | | 1,009,090 | |
| | | | Minneapolis and St. Paul, MN Housing and Redevelopment Auth. Healthcare Fac. Rev. (HealthPartners) | | | | |
| | 800,000 | | | 6.000%, 12/1/2021 | | | 802,488 | |
| | | | Minnesota Agricultural and Economic Development Board Health Care System Rev. (Fairview Hospital and Healthcare Services) (NATL-RE Insured) | | | | |
| | 85,000 | | | 5.750%, 11/15/2026, Ser. Ac | | | 85,218 | |
| | | | Minnesota Higher Education Fac. Auth. Rev. | | | | |
| | 1,575,000 | | | 5.250%, 12/1/2035, Ser. H | | | 1,612,721 | |
| | | | Minnesota Higher Education Fac. Auth. Rev. (College of St. Scholastica, Inc.) | | | | |
| | 1,800,000 | | | 6.300%, 12/1/2040, Ser. 7J | | | 1,901,880 | |
| | | | Minnesota Higher Education Fac. Auth. Rev. (University of St. Thomas) | | | | |
| | 530,000 | | | 5.250%, 10/1/2019, Ser. 5-Y | | | 550,988 | |
| | | | North Oaks, MN Senior Housing Rev. (Presbyterian Homes of North Oaks, Inc.) | | | | |
| | 2,000,000 | | | 6.125%, 10/1/2039 | | | 2,040,460 | |
The accompanying Notes to Financial Statements are an integral part of this schedule.
227
Municipal Bond Fund
Schedule of Investments as of October 31, 2013
| | | | | | | | |
Principal
Amount | | | Long-Term Fixed Income (99.3%) | | Value | |
| Minnesota (2.2%) - continued | | | | |
| | | | Northern Municipal Power Agency, MN Electric System Rev. (AMBAC Insured) | | | | |
| | $2,000,000 | | | 5.000%, 1/1/2026, Ser. Ac | | | $2,141,380 | |
| | | | Rochester MN Health Care Fac. Rev. Olmsted Medical Center | | | | |
| | 1,000,000 | | | 5.875%, 7/1/2030 | | | 1,121,580 | |
| | | | Shakopee Independent School District No. 720 G.O. School Building Crossover Refg. | | | | |
| | 1,425,000 | | | 5.000%, 2/1/2018 | | | 1,654,525 | |
| | | | St. Cloud, MN Health Care Refg. Rev. (CentraCare Health System) | | | | |
| | 2,040,000 | | | 5.125%, 5/1/2030, Ser. A | | | 2,167,622 | |
| | | | St. Louis Park, MN Health Care Fac. Rev. Refg. (Park Nicollet Health Services ) | | | | |
| | 2,000,000 | | | 5.250%, 7/1/2030, Ser. Ba | | | 2,065,320 | |
| | 1,000,000 | | | 5.750%, 7/1/2030, Ser. C | | | 1,067,480 | |
| | 5,745,000 | | | 5.750%, 7/1/2039 | | | 6,061,550 | |
| | | | St. Paul, MN Housing and Redevelopment Auth. Educational Fac. Rev. Refg. (Saint Paul Academy and Summit School) | | | | |
| | 4,000,000 | | | 5.000%, 10/1/2024 | | | 4,188,840 | |
| | | | St. Paul, MN Housing and Redevelopment Auth. Health Care Fac. Rev. (HealthPartners) | | | | |
| | 230,000 | | | 5.250%, 5/15/2019 | | | 249,242 | |
| | 1,500,000 | | | 5.250%, 5/15/2036 | | | 1,528,515 | |
| | | | University of Minnesota Rev. (State Supported Biomedical Science Research Fac. Funding) | | | | |
| | 1,655,000 | | | 5.000%, 8/1/2030, Ser. B | | | 1,803,189 | |
| | | | Wiona, MN Health Care Fac. Rev. | | | | |
| | 500,000 | | | 5.000%, 7/1/2034 | | | 480,055 | |
| | | | | |
| | | | Total | | | 32,532,143 | |
| | | | | |
| |
| Mississippi (0.1%) | | | | |
| | | | D’Iberville Tax Increment Refg. (Gulf Coast Promenade) | | | | |
| | 1,750,000 | | | 5.000%, 4/1/2033 | | | 1,650,320 | |
| | | | | |
| | | | Total | | | 1,650,320 | |
| | | | | |
| |
| Missouri (1.3%) | | | | |
| | | | Jackson County, MO Special Obligation Rev. (Harry S. Truman Sports Complex) (AMBAC Insured) | | | | |
| | 7,500,000 | | | 5.000%, 12/1/2027c | | | 8,085,600 | |
| | | | Missouri State Environmental Improvement and Energy Resources Auth. Water Pollution Rev. | | | | |
| | 175,000 | | | 5.250%, 1/1/2018 | | | 175,492 | |
| | | | Missouri State Health and Educational Fac. Auth. Health Fac. Rev. (Barnes-Jewish, Inc./Christian Health Services) | | | | |
| | 1,465,000 | | | 5.250%, 5/15/2014, Ser. A | | | 1,501,229 | |
| | | | Missouri State Health and Educational Fac. Auth. Health Fac. Rev. (BJC Health System) | | | | |
| | 2,500,000 | | | 5.000%, 5/15/2020, Ser. A | | | 2,610,750 | |
| | | | Missouri State Health and Educational Fac. Auth. Health Fac. Rev. (Lake Regional Health System) | | | | |
| | 810,000 | | | 5.000%, 2/15/2019 | | | 879,020 | |
| | 925,000 | | | 5.000%, 2/15/2022 | | | 986,226 | |
| | 1,500,000 | | | 5.600%, 2/15/2025a | | | 1,522,350 | |
| | 1,680,000 | | | 5.000%, 2/15/2034 | | | 1,656,698 | |
| | | | St. Louis, MO Airport Rev. Refg. (Lambert-St. Louis International Airport) | | | | |
| | 900,000 | | | 5.000%, 7/1/2016, AMT | | | 987,129 | |
| | 1,000,000 | | | 5.000%, 7/1/2032, AMT | | | 984,440 | |
| | | | | |
| | | | Total | | | 19,388,934 | |
| | | | | |
| |
| Montana (0.5%) | | | | |
| | | | Montana Fac. Finance Auth. Hospital Fac. Rev. (St. Peter’s Hospital) | | | | |
| | 3,860,000 | | | 5.250%, 6/1/2018a | | | 3,971,206 | |
| | | | Montana Fac. Finance Auth. Rev. (Providence Health & Services) | | | | |
| | 2,830,000 | | | 5.000%, 10/1/2024 | | | 3,046,835 | |
| | | | | |
| | | | Total | | | 7,018,041 | |
| | | | | |
| |
| Nebraska (1.5%) | | | | |
| | | | Douglas County, NE Hospital Auth. No. 3 Health Fac. Refg. and Rev. (Nebraska Methodist Health System) | | | | |
| | 2,000,000 | | | 5.750%, 11/1/2048 | | | 2,050,420 | |
| | | | Lincoln, NE Lincoln Electric System Rev. Refg. | | | | |
| | 2,500,000 | | | 5.000%, 9/1/2037 | | | 2,653,600 | |
| | | | Nebraska Public Power District Rev. | | | | |
| | 1,325,000 | | | 5.000%, 1/1/2033, Ser. Ae | | | 1,384,453 | |
| | | | Omaha, NE Public Power District Electric System Rev. | | | | |
| | 5,780,000 | | | 5.000%, 2/1/2046, Ser. Aa | | | 5,846,470 | |
| | | | University of Nebraska Lincoln Student Fees and Fac. Rev. | | | | |
| | 5,000,000 | | | 5.000%, 7/1/2023, Ser. Ba | | | 5,013,450 | |
| | | | University of Nebraska Lincoln Student Fees and Fac. Rev. Refg. | | | | |
| | 3,050,000 | | | 5.000%, 7/1/2038 | | | 3,211,803 | |
| | | | University of Nebraska Student Fees and Fac. Rev. | | | | |
| | 1,000,000 | | | 5.000%, 7/1/2037 | | | 1,061,800 | |
| | | | University of Nebraska Student Housing Rev. | | | | |
| | 1,680,000 | | | 5.000%, 5/15/2040, Ser. B | | | 1,752,122 | |
| | | | | |
| | | | Total | | | 22,974,118 | |
| | | | | |
| |
| New Hampshire (0.2%) | | | | |
| | | | New Hampshire State Turnpike System Revenue Bonds | | | | |
| | 1,000,000 | | | 5.000%, 2/1/2017, Ser. B | | | 1,121,360 | |
The accompanying Notes to Financial Statements are an integral part of this schedule.
228
Municipal Bond Fund
Schedule of Investments as of October 31, 2013
| | | | | | | | |
Principal
Amount | | | Long-Term Fixed Income (99.3%) | | Value | |
| New Hampshire (0.2%) - continued | | | | |
| | | | New Hampshire State Turnpike System Revenue Refunding Bonds | | | | |
| | $2,000,000 | | | 5.000%, 10/1/2019 | | | $2,331,400 | |
| | | | | |
| | | | Total | | | 3,452,760 | |
| | | | | |
| |
| New Jersey (1.3%) | | | | |
| | | | Hudson County, NJ Refg. C.O.P. (NATL-RE Insured) | | | | |
| | 2,000,000 | | | 6.250%, 12/1/2015c | | | 2,163,160 | |
| | | | New Jersey Educational Fac. Auth. Rev. Refg. (Kean University) | | | | |
| | 1,000,000 | | | 5.500%, 9/1/2036, Ser. A | | | 1,077,160 | |
| | | | New Jersey G.O. (AMBAC Insured ) | | | | |
| | 1,000,000 | | | 5.250%, 7/15/2018, Ser. Lc | | | 1,187,840 | |
| | | | New Jersey Transportation Trust Fund Auth. Rev. | | | | |
| | 1,500,000 | | | 5.000%, 6/15/2026, Ser. A | | | 1,638,660 | |
| | | | New Jersey Transportation Trust Fund Auth. Transportation System Rev. (AGM Insured) | | | | |
| | 5,000,000 | | | 5.500%, 12/15/2016, Ser. Ac | | | 5,725,600 | |
| | | | New Jersey Turnpike Auth. Turnpike Rev. (AMBAC-TCRS Insured) | | | | |
| | 485,000 | | | 6.500%, 1/1/2016, Ser. Cc | | | 545,407 | |
| | 260,000 | | | 6.500%, 1/1/2016, Ser. Ca,c | | | 293,644 | |
| | 2,305,000 | | | 6.500%, 1/1/2016, Ser. Ca,c | | | 2,414,879 | |
| | 260,000 | | | 6.500%, 1/1/2016, Ser. Ca,c | | | 293,943 | |
| | | | Ocean County, NJ Utilities Auth. Waste Water Rev. (NATL-RE Insured) | | | | |
| | 3,180,000 | | | 5.250%, 1/1/2025c | | | 3,867,453 | |
| | | | | |
| | | | Total | | | 19,207,746 | |
| | | | | |
| |
| New Mexico (0.9%) | | | | |
| | | | Jicarilla, NM Apache Nation Rev. | | | | |
| | 3,500,000 | | | 5.500%, 9/1/2023, Ser. A | | | 3,501,085 | |
| | | | Sandoval County, NM Incentive Payment Refg. Rev. | | | | |
| | 9,000,000 | | | 5.000%, 6/1/2020 | | | 9,282,600 | |
| | | | | |
| | | | Total | | | 12,783,685 | |
| | | | | |
| |
| New York (7.1%) | | | | |
| | | | Metropolitan Transportation Auth. State Service Contract Refg. | | | | |
| | 5,000,000 | | | 5.500%, 7/1/2017, Ser. A | | | 5,829,150 | |
| | | | New York City G.O. | | | | |
| | 2,080,000 | | | 4.900%, 12/15/2028, Ser. Fa,b | | | 2,080,000 | |
| | 2,920,000 | | | 4.900%, 12/15/2028, Ser. Fb | | | 2,920,000 | |
| | 5,000 | | | 5.250%, 8/1/2017a | | | 5,185 | |
| | 11,995,000 | | | 5.250%, 8/1/2017 | | | 12,425,500 | |
| | | | New York City Municipal Water Finance Auth. Water and Sewer System Rev. | | | | |
| | 11,155,000 | | | 5.750%, 6/15/2040, Ser. A | | | 12,334,865 | |
| | 3,250,000 | | | 5.375%, 6/15/2043, Ser. EE | | | 3,461,965 | |
| | | | New York City Transitional Finance Auth. Future Tax Secured Rev. | | | | |
| | 12,505,000 | | | 5.000%, 11/1/2021 | | | 14,895,831 | |
| | 15,000,000 | | | 5.000%, 11/1/2033, Ser. D-1 | | | 15,943,200 | |
| | | | New York City Trust for Cultural Resources Refg. Rev. (The Museum of Modern Art) | | | | |
| | 2,030,000 | | | 5.000%, 4/1/2017, Ser. A | | | 2,306,303 | |
| | | | New York State Dormitory Auth. State Personal Income Tax Rev. | | | | |
| | 5,125,000 | | | 5.000%, 2/15/2029, Ser. A | | | 5,592,861 | |
| | | | New York State Dormitory Auth. State University Educational Fac. Rev. | | | | |
| | 5,000,000 | | | 5.875%, 5/15/2017, Ser. A | | | 5,661,800 | |
| | | | New York State Liberty Development Corporation Liberty Rev. | | | | |
| | 10,000,000 | | | 5.250%, 12/15/2043 | | | 10,469,900 | |
| | | | New York State Local Government Assistance Corporation Refg. (NATL-RE IBC Insured) | | | | |
| | 2,000,000 | | | 5.250%, 4/1/2016, Ser. Ec | | | 2,186,220 | |
| | | | New York State Urban Development Corporation State Personal Income Tax Rev. (State Facilities and Equipment) | | | | |
| | 3,870,000 | | | 5.000%, 3/15/2036, Ser. B-1 | | | 4,133,779 | |
| | | | Port Auth. of NY and NJ Rev. (AGM Insured) | | | | |
| | 5,000,000 | | | 4.750%, 12/15/2022, AMTc | | | 5,061,100 | |
| | | | | |
| | | | Total | | | 105,307,659 | |
| | | | | |
| |
| North Carolina (2.3%) | | | | |
| | | | North Carolina Capital Fac. Finance Agency Rev. Refg. (Johnson and Wales University) | | | | |
| | 1,000,000 | | | 5.000%, 4/1/2032 | | | 1,037,180 | |
| | 1,000,000 | | | 5.000%, 4/1/2033 | | | 1,032,530 | |
| | | | North Carolina Eastern Municipal Power Agency Power System Rev. | | | | |
| | 5,000,000 | | | 5.500%, 1/1/2014, Ser. D | | | 5,041,200 | |
| | 7,190,000 | | | 5.250%, 1/1/2020, Ser. A | | | 8,089,613 | |
| | 2,580,000 | | | 5.000%, 1/1/2021, Ser. A | | | 2,969,116 | |
| | 2,000,000 | | | 5.000%, 1/1/2026, Ser. B | | | 2,154,000 | |
| | 1,475,000 | | | 6.000%, 1/1/2026, Ser. Aa | | | 1,896,407 | |
| | | | North Carolina Eastern Municipal Power Agency Power System Rev. Refg. | | | | |
| | 2,500,000 | | | 5.000%, 1/1/2017, Ser. D | | | 2,814,825 | |
| | | | North Carolina Municipal Power Agency No. 1 Catawba Electric Rev. | | | | |
| | 3,200,000 | | | 5.000%, 1/1/2025, Ser. A | | | 3,495,488 | |
| | 1,250,000 | | | 5.000%, 1/1/2030, Ser. A | | | 1,310,612 | |
| | | | Raleigh Durham, NC Airport Auth. Rev. | | | | |
| | 4,895,000 | | | 5.000%, 5/1/2036, Ser. A | | | 5,112,583 | |
| | | | | |
| | | | Total | | | 34,953,554 | |
| | | | | |
The accompanying Notes to Financial Statements are an integral part of this schedule.
229
Municipal Bond Fund
Schedule of Investments as of October 31, 2013
| | | | | | | | |
Principal
Amount | | | Long-Term Fixed Income (99.3%) | | Value | |
| North Dakota (0.7%) | |
| | | | North Dakota Public Finance Auth. Rev. (State Revolving Fund) | | | | |
| | $1,495,000 | | | 5.000%, 10/1/2031, Ser. A | | | $1,624,975 | |
| | | | South Central Regional Water District, ND Utility System Rev. (Refg. and Northern Burleigh County Expansion) | | | | |
| | 2,945,000 | | | 5.650%, 10/1/2029, Ser. Aa | | | 3,088,481 | |
| | | | Ward County, ND Health Care Fac. Refg. Rev. (Trinity) | | | | |
| | 2,570,000 | | | 6.250%, 7/1/2021, Ser. B | | | 2,573,572 | |
| | | | Ward County, ND Health Care Fac. Rev. (Trinity) | | | | |
| | 2,895,000 | | | 5.125%, 7/1/2025 | | | 2,946,878 | |
| | | | | |
| | | | Total | | | 10,233,906 | |
| | | | | |
|
| Ohio (4.6%) | |
| | | | AMP Fremont Energy Center Rev. | | | | |
| | 3,000,000 | | | 5.000%, 2/15/2037, Ser. B | | | 3,034,230 | |
| | | | Buckeye Tobacco Settlement Financing Auth. Rev. | | | | |
| | 16,920,000 | | | 5.125%, 6/1/2024, Ser. A-2 | | | 14,452,218 | |
| | | | City of Toledo, OH Water System Rev. Improvements and Refg. | | | | |
| | 2,500,000 | | | 5.000%, 11/15/2038 | | | 2,594,000 | |
| | | | County of Fairfield, OH Hospital Rev. Refg. and Improvement (Fairfield Medical Center) | | | | |
| | 3,470,000 | | | 5.250%, 6/15/2043 | | | 3,333,907 | |
| | | | Cuyahoga County G.O. Capital Improvement and Refg. | | | | |
| | 2,540,000 | | | 5.000%, 12/1/2021, Ser. A | | | 2,970,759 | |
| | | | Kent State University General Receipts Rev. | | | | |
| | 350,000 | | | 5.000%, 5/1/2017, Ser. A | | | 392,756 | |
| | 1,500,000 | | | 5.000%, 5/1/2037, Ser. A | | | 1,533,300 | |
| | | | Lucas County, OH Health Care System Refg. Rev. (Sunset Retirement Communities) | | | | |
| | 1,250,000 | | | 5.125%, 8/15/2025 | | | 1,280,912 | |
| | 1,750,000 | | | 5.500%, 8/15/2030 | | | 1,798,633 | |
| | | | Miami University OH Rev. | | | | |
| | 1,600,000 | | | 5.000%, 9/1/2036 | | | 1,674,720 | |
| | | | Ohio Higher Educational Fac. Commission Rev. (Case Western Reserve University) | | | | |
| | 2,000,000 | | | 6.500%, 10/1/2020, Ser. B | | | 2,378,980 | |
| | | | Ohio Higher Educational Fac. Commission Rev. (Kenyon College) | | | | |
| | 4,740,000 | | | 5.250%, 7/1/2044 | | | 4,827,548 | |
| | | | Ohio Hospital Rev. (Cleveland Clinic Health System Obligated Group) | | | | |
| | 5,000,000 | | | 5.000%, 1/1/2034 | | | 5,137,850 | |
| | | | Ohio State Turnpike Commission | | | | |
| | 8,000,000 | | | Zero Coupon, 2/15/2034d | | | 4,912,880 | |
| | | | Ohio Turnpike Commission Turnpike Rev. Refg. (NATL-RE Insured) | | | | |
| | 2,000,000 | | | 5.500%, 2/15/2024, Ser. Ac | | | 2,441,280 | |
| | 10,000,000 | | | 5.500%, 2/15/2026, Ser. Ac | | | 12,081,800 | |
| | | | Port of Greater Cincinnati Development Auth. Economic Development Rev. (Sisters of Mercy of the Americas, Regional Community of Cincinnati) | | | | |
| | 1,750,000 | | | 5.000%, 10/1/2025 | | | 1,793,137 | |
| | | | University of Cincinnati General Receipts Rev. (AMBAC Insured) | | | | |
| | 2,545,000 | | | 5.000%, 6/1/2016, Ser. Da,c | | | 2,614,682 | |
| | | | | |
| | | | Total | | | 69,253,592 | |
| | | | | |
|
| Oklahoma (0.4%) | |
| | | | Oklahoma Agricultural and Mechanical Colleges General Rev. | | | | |
| | 3,000,000 | | | 5.000%, 8/1/2038, Ser. C | | | 3,081,270 | |
| | | | Oklahoma Municipal Power Auth. Power Supply System Rev. | | | | |
| | 1,620,000 | | | 6.000%, 1/1/2038, Ser. A | | | 1,773,317 | |
| | | | Oklahoma State Turnpike Auth. | | | | |
| | 500,000 | | | 5.000%, 1/1/2028, Ser. A | | | 551,415 | |
| | | | | |
| | | | Total | | | 5,406,002 | |
| | | | | |
|
| Oregon (0.3%) | |
| | | | Clackamas County, OR Hospital Fac. Auth. Rev. (Legacy Health Systems) | | | | |
| | 300,000 | | | 5.500%, 7/15/2035, Ser. A | | | 312,150 | |
| | | | Oregon Health and Science University Rev. | | | | |
| | 2,000,000 | | | 5.000%, 7/1/2030, Ser. E | | | 2,132,940 | |
| | | | Salem-Keizer School District No. 24J, Marion and Polk Counties, OR G.O. | | | | |
| | 5,000,000 | | | Zero Coupon, 6/15/2028, Ser. B | | | 2,731,850 | |
| | | | | |
| | | | Total | | | 5,176,940 | |
| | | | | |
|
| Pennsylvania (3.6%) | |
| | | | Allegheny County Hospital Development Auth. Rev. (University of Pittsburgh Medical Center) | | | | |
| | 3,000,000 | | | 5.000%, 6/15/2018, Ser. B | | | 3,454,500 | |
| | 2,100,000 | | | 5.625%, 8/15/2039 | | | 2,222,157 | |
| | | | Beaver County Industrial Development Auth. Pollution Control Rev. Refg. (FirstEnergy Generation) | | | | |
| | 5,000,000 | | | 2.500%, 12/1/2041, Ser. Bb | | | 4,964,450 | |
| | | | Beaver County Industrial Development Auth. Pollution Control Rev. Refg. (FirstEnergy Nuclear Generation) | | | | |
| | 3,000,000 | | | 2.700%, 4/1/2035, Ser. Ab | | | 2,971,620 | |
| | | | Cornwall-Lebanon School District, Lebanon County, G.O. Notes (AGM Insured) | | | | |
| | 2,000,000 | | | Zero Coupon, 3/15/2016c | | | 1,922,540 | |
| | 1,520,000 | | | Zero Coupon, 3/15/2017c | | | 1,426,870 | |
The accompanying Notes to Financial Statements are an integral part of this schedule.
230
Municipal Bond Fund
Schedule of Investments as of October 31, 2013
| | | | | | | | |
Principal
Amount | | | Long-Term Fixed Income (99.3%) | | Value | |
| Pennsylvania (3.6%) - continued | | | | |
| | | | Cumberland County Municipal Auth. Rev. (Diakon Lutheran Social Ministries) | | | | |
| | $2,750,000 | | | 5.000%, 1/1/2027 | | | $2,779,397 | |
| | 2,065,000 | | | 6.125%, 1/1/2029 | | | 2,188,508 | |
| | 2,455,000 | | | 5.000%, 1/1/2036 | | | 2,375,016 | |
| | | | Lycoming County Auth. Health System Rev. (Susquehanna Health System) | | | | |
| | 6,820,000 | | | 5.750%, 7/1/2039, Ser. A | | | 6,984,430 | |
| | | | Pennsylvania Economic Development Financing Auth. Unemployment Compensation Rev. | | | | |
| | 3,000,000 | | | 5.000%, 7/1/2020, Ser. B | | | 3,512,190 | |
| | | | Pennsylvania Turnpike Commission Turnpike Rev. (AGM Insured) | | | | |
| | 8,000,000 | | | Zero Coupon, 6/1/2033, Ser. Cc,d | | | 7,841,600 | |
| | 10,070,000 | | | 6.250%, 6/1/2038, Ser. Cc | | | 11,003,388 | |
| | | | | |
| | | | Total | | | 53,646,666 | |
| | | | | |
| |
| Puerto Rico (0.5%) | | | | |
| | | | Puerto Rico Industrial, Tourist, Educational, Medical, and Environmental Control Facilities Financing Auth. Cogeneration Fac. Rev. (AES Puerto Rico) | | | | |
| | 7,655,000 | | | 6.625%, 6/1/2026, AMT | | | 6,785,162 | |
| | | | | |
| | | | Total | | | 6,785,162 | |
| | | | | |
| |
| South Carolina (2.4%) | | | | |
| | | | Charleston County, SC Airport System Rev. | | | | |
| | 6,215,000 | | | 5.500%, 7/1/2031, Ser. A, AMT | | | 6,532,897 | |
| | | | County of Charleston, SC G.O. Transportation Sales Tax Refg. | | | | |
| | 10,005,000 | | | 5.000%, 11/1/2021 | | | 12,120,457 | |
| | | | Greenwood County, SC Hospital Fac. Refg. Rev. | | | | |
| | 1,120,000 | | | 5.000%, 10/1/2024, Ser. B | | | 1,226,019 | |
| | 2,890,000 | | | 5.000%, 10/1/2031, Ser. B | | | 3,006,496 | |
| | | | Greenwood County, SC Hospital Fac. Rev. (Self Regional Healthcare) | | | | |
| | 2,250,000 | | | 5.375%, 10/1/2039 | | | 2,318,063 | |
| | | | Piedmont, SC Municipal Power Agency Electric Rev. (NATL-RE Insured) | | | | |
| | 4,000,000 | | | 6.250%, 1/1/2021c | | | 4,932,840 | |
| | | | South Carolina Public Service Auth. Rev. Obligations (Santee Cooper) | | | | |
| | 3,855,000 | | | 5.500%, 1/1/2038, Ser. A | | | 4,166,523 | |
| | | | Spartanburg, SC Water System Rev. (FGIC Insured) | | | | |
| | 2,000,000 | | | 5.250%, 6/1/2028a,c | | | 2,057,620 | |
| | | | | |
| | | | Total | | | 36,360,915 | |
| | | | | |
| |
| South Dakota (0.2%) | | | | |
| | | | South Dakota Health and Educational Fac. Auth. Rev. (Regional Health) | | | | |
| | 1,000,000 | | | 5.000%, 9/1/2023 | | | 1,090,920 | |
| | 820,000 | | | 5.000%, 9/1/2025 | | | 871,004 | |
| | | | South Dakota Health and Educational Fac. Auth. Rev. (Sanford Health) | | | | |
| | 1,250,000 | | | 5.500%, 11/1/2040 | | | 1,301,000 | |
| | | | | |
| | | | Total | | | 3,262,924 | |
| | | | | |
| |
| Tennessee (0.4%) | | | | |
| | | | Jackson, TN Hospital Rev. Refg. and Improvement (Jackson- Madison County General Hospital) | | | | |
| | 2,060,000 | | | 5.625%, 4/1/2038 | | | 2,157,459 | |
| | 3,450,000 | | | 5.750%, 4/1/2041 | | | 3,623,259 | |
| | | | | |
| | | | Total | | | 5,780,718 | |
| | | | | |
| |
| Texas (10.4%) | | | | |
| | | | Alliance Airport Auth., Inc. Special Fac. Rev. Refg. (Federal Express Corporation) | | | | |
| | 10,425,000 | | | 4.850%, 4/1/2021, AMT | | | 10,800,300 | |
| | | | Amarillo Health Fac. Corporation Hospital Rev. (Baptist St. Anthony’s Hospital Corporation) (AGM Insured) | | | | |
| | 2,000,000 | | | 5.500%, 1/1/2017a,c | | | 2,309,260 | |
| | | | Austin, TX Combined Utility Systems Rev. Refg. (NATL-RE-IBC Insured) | | | | |
| | 40,000 | | | 6.000%, 11/15/2013c | | | 40,011 | |
| | | | Bexar County Housing Finance Corporation Multifamily Housing Rev. (Dymaxion and Marbach Park Apartments) (NATL-RE Insured) | | | | |
| | 1,930,000 | | | 6.000%, 8/1/2023, Ser. Ac | | | 1,934,670 | |
| | | | Clifton Higher Education Finance Corporation Education Rev. (Uplift Education) | | | | |
| | 4,000,000 | | | 6.250%, 12/1/2045, Ser. A | | | 4,142,840 | |
| | | | Clifton TX Higher Education Finance Corporation Education Rev. (IDEA Public Schools) | | | | |
| | 1,000,000 | | | 5.000%, 8/15/2042 | | | 910,660 | |
| | 2,000,000 | | | 6.000%, 8/15/2043 | | | 2,050,320 | |
| | | | Dallas and Fort Worth, TX International Airport Rev. Refg. | | | | |
| | 4,000,000 | | | 5.250%, 11/1/2033, Ser. F | | | 4,206,320 | |
| | | | Dallas Independent School District, Dallas County, TX Unlimited Tax School Building G.O. (PSF-GTD Insured) | | | | |
| | 10,000,000 | | | 6.375%, 2/15/2034c | | | 11,584,400 | |
| | | | Gulf Coast Waste Disposal Auth., TX Pollution Control Rev. Refg. (Exxon) | | | | |
| | 3,000,000 | | | 0.070%, 6/1/2020b | | | 3,000,000 | |
| | 1,600,000 | | | 0.070%, 10/1/2024b | | | 1,600,000 | |
The accompanying Notes to Financial Statements are an integral part of this schedule.
231
Municipal Bond Fund
Schedule of Investments as of October 31, 2013
| | | | | | | | |
Principal
Amount | | | Long-Term Fixed Income (99.3%) | | Value | |
| Texas (10.4%) - continued | | | | |
| | | | Harris County Health Fac. Development Corporation Hospital Rev. Refg. (Memorial Hermann Healthcare System) | | | | |
| | $2,015,000 | | | 7.250%, 12/1/2035, Ser. Ba | | | $2,615,450 | |
| | | | Harris County, TX G.O. and Rev. Refg. (NATL-RE Insured) | | | | |
| | 7,000,000 | | | Zero Coupon, 8/15/2024c | | | 5,062,190 | |
| | | | Harris County, TX Toll Road Rev. and Refg. | | | | |
| | 6,500,000 | | | 5.250%, 8/15/2047, Ser. B | | | 6,650,930 | |
| | | | Houston, TX Water and Sewer System Rev. Refg. (AGM Insured) | | | | |
| | 10,000,000 | | | 5.750%, 12/1/2032, Ser. Aa,c | | | 12,628,300 | |
| | | | Lewisville Independent School District, Denton County, TX Unlimited Tax School Building and Refg. (PSF-GTD Insured) | |
| | 5,315,000 | | | Zero Coupon, 8/15/2019c | | | 4,762,134 | |
| | | | Lower Colorado River Auth. Rev. Refg. (AGM Insured) | | | | |
| | 215,000 | | | 5.875%, 5/15/2015, Ser. Ac | | | 215,847 | |
| | | | North East Independent School District, Bexar County, TX Unlimited Tax Refg. (PSF-GTD Insured) | | | | |
| | 5,000,000 | | | 5.250%, 2/1/2028c | | | 6,011,800 | |
| | 2,000,000 | | | 5.250%, 2/1/2029c | | | 2,402,640 | |
| | | | North Texas Education Finance Corporation Education Rev. (Uplift Education) | | | | |
| | 2,500,000 | | | 5.125%, 12/1/2042, Ser. A | | | 2,337,200 | |
| | | | North Texas Tollway Auth. Rev. | | | | |
| | 5,000,000 | | | 5.000%, 1/1/2042, Ser. B | | | 4,977,200 | |
| | | | North Texas Tollway Auth. Rev. (Special Proj. System) | | | | |
| | 15,000,000 | | | 5.000%, 9/1/2030, Ser. D | | | 16,133,850 | |
| | | | North Texas Tollway Auth. System Rev. Refg. | | | | |
| | 1,000,000 | | | 5.625%, 1/1/2033, Ser. A | | | 1,053,760 | |
| | | | North Texas Tollway Auth. System Rev. Refg. (AGM Insured) | | | | |
| | 5,000,000 | | | Zero Coupon, 1/1/2028, Ser. Dc | | | 2,597,600 | |
| | | | Northside Independent School District School Building G.O. (PSF-GTD Insured) | | | | |
| | 5,000,000 | | | 1.350%, 6/1/2033b,c | | | 4,934,200 | |
| | | | Pharr, TX Higher Education Finance Auth. Education Rev. (Idea Public Schools) | | | | |
| | 2,500,000 | | | 6.250%, 8/15/2029, Ser. A | | | 2,678,200 | |
| | 2,000,000 | | | 6.500%, 8/15/2039, Ser. A | | | 2,136,340 | |
| | | | San Juan, TX Higher Education Finance Auth. Education Rev. (IDEA Public Schools) | | | | |
| | 2,000,000 | | | 6.700%, 8/15/2040, Ser. A | | | 2,172,880 | |
| | | | San Leanna Education Fac. Corporation Higher Education Rev. (Saint Edward’s University) | | | | |
| | 1,160,000 | | | 5.125%, 6/1/2024 | | | 1,182,875 | |
| | 1,000,000 | | | 5.125%, 6/1/2027 | | | 1,004,980 | |
| | | | Socorro, TX Independent School District G.O. Refg. (PSF-GTD Insured) | | | | |
| | 2,000,000 | | | 5.000%, 8/15/2034c | | | 2,117,600 | |
| | | | Southeast Texas Housing Finance Corporation Single Family Mortgage Rev. (NATL-RE Insured) | | | | |
| | 11,615,000 | | | Zero Coupon, 9/1/2017a,c | | | 11,180,483 | |
| | | | Southwest Higher Education Authority, Inc., Higher Education Rev. (Southern Methodist University) | | | | |
| | 1,700,000 | | | 5.000%, 10/1/2041 | | | 1,819,629 | |
| | | | Tarrant County Cultural Education Fac. Finance Corporation Hospital Rev. (Hendrick Medical Center) (AGM Insured) | | | | |
| | 1,250,000 | | | 5.250%, 9/1/2026, Ser. Bc | | | 1,335,725 | |
| | 2,000,000 | | | 5.250%, 9/1/2027, Ser. Bc | | | 2,120,060 | |
| | 1,000,000 | | | 5.250%, 9/1/2028, Ser. Bc | | | 1,051,560 | |
| | | | Tarrant County Cultural Education Fac. Finance Corporation Refg. Rev. (Texas Health Resources System) | | | | |
| | 2,000,000 | | | 5.000%, 2/15/2023, Ser. A | | | 2,141,340 | |
| | | | Texas College Student Loan G.O. | | | | |
| | 1,900,000 | | | 5.000%, 8/1/2017, AMT | | | 2,177,438 | |
| | | | Texas Transportation Commission Central Texas Turnpike System Rev. Refg. | | | | |
| | 2,000,000 | | | 1.250%, 8/15/2042, Ser. Bb | | | 2,005,560 | |
| | | | Westlake, TX Certificates of Obligation G.O. | | | | |
| | 350,000 | | | 6.500%, 5/1/2015a | | | 360,804 | |
| | 335,000 | | | 6.500%, 5/1/2017a | | | 345,341 | |
| | 1,650,000 | | | 5.750%, 5/1/2024a | | | 1,694,897 | |
| | 2,000,000 | | | 5.800%, 5/1/2032a | | | 2,054,900 | |
| | | | | |
| | | | Total | | | 154,542,494 | |
| | | | | |
| |
| Utah (0.9%) | | | | |
| | | | Riverton, UT Hospital Rev. | | | | |
| | 3,010,000 | | | 5.000%, 8/15/2041 | | | 3,077,936 | |
| | | | Utah Associated Municipal Power Systems Rev. and Refg. (Central-St. George Transmission) | | | | |
| | 6,000,000 | | | 5.250%, 12/1/2027 | | | 6,291,780 | |
| | | | Utah County, UT Hospital Rev. (IHC Health Services, Inc.) | | | | |
| | 3,175,000 | | | 5.000%, 5/15/2043 | | | 3,261,106 | |
| | | | Utah State Charter School Finance Auth. Charter School Rev. (North Davis Preparatory) | | | | |
| | 1,000,000 | | | 6.250%, 7/15/2030 | | | 1,031,830 | |
| | | | | |
| | | | Total | | | 13,662,652 | |
| | | | | |
| |
| Virginia (1.4%) | | | | |
| | | | Fairfax County, VA Industrial Development Auth. Health Care Rev. (Inova Health System) | | | | |
| | 1,000,000 | | | 5.000%, 5/15/2025, Ser. C | | | 1,090,530 | |
The accompanying Notes to Financial Statements are an integral part of this schedule.
232
Municipal Bond Fund
Schedule of Investments as of October 31, 2013
| | | | | | | | |
Principal
Amount | | | Long-Term Fixed Income (99.3%) | | Value | |
| Virginia (1.4%) - continued | | | | |
| | | | Fairfax County, VA Industrial Development Auth. Hospital Rev. Refg. (Inova Health System Hospitals) | | | | |
| $ | 2,510,000 | | | 5.250%, 8/15/2019 | | | $2,870,712 | |
| | | | Virginia Commonwealth Transportation Board Rev. | | | | |
| | 10,000,000 | | | 5.000%, 5/15/2034 | | | 10,657,800 | |
| | | | Virginia Port Auth. Port Fac. Rev. | | | | |
| | 2,000,000 | | | 5.000%, 7/1/2040 | | | 2,063,440 | |
| | | | Virginia Small Business Financing Auth. Rev. (Elizabeth River Crossings Opco, LLC) | | | | |
| | 4,500,000 | | | 6.000%, 1/1/2037, AMT | | | 4,665,465 | |
| | | | | |
| | | | Total | | | 21,347,947 | |
| | | | | |
| |
| Washington (5.2%) | | | | |
| | | | Franklin County, WA Pasco School District No. 1 U.T.G.O. (NATL-RE Insured) | | | | |
| | 6,000,000 | | | 5.250%, 12/1/2022a,c | | | 6,727,440 | |
| | | | FYI Properties Lease Rev. (State of Washington DIS) | | | | |
| | 2,555,000 | | | 5.500%, 6/1/2034 | | | 2,721,024 | |
| | | | Port of Seattle Special Fac. Rev. Refg. (Seatac Fuel Fac., LLC) | | | | |
| | 670,000 | | | 5.000%, 6/1/2019, AMT | | | 758,474 | |
| | 1,000,000 | | | 5.000%, 6/1/2020, AMT | | | 1,125,460 | |
| | | | State of Washington Various Purpose G.O. | | | | |
| | 5,390,000 | | | 5.000%, 8/1/2021, Ser. A | | | 6,454,147 | |
| | 12,095,000 | | | 5.000%, 8/1/2030, Ser. A | | | 13,266,522 | |
| | | | Tobacco Settlement Auth. Tobacco Settlement Rev. | | | | |
| | 6,265,000 | | | 6.500%, 6/1/2026 | | | 6,279,472 | |
| | | | Tobacco Settlement Auth. WA Rev. Refg. | | | | |
| | 5,000,000 | | | 5.000%, 6/1/2024 | | | 5,112,050 | |
| | | | Washington Economic Development Finance Auth. Lease Rev. (Washington Biomedical Research Properties II) (NATL-RE Insured) | | | | |
| | 5,620,000 | | | 5.000%, 6/1/2030c | | | 5,811,979 | |
| | | | Washington G.O. | | | | |
| | 2,205,000 | | | 6.750%, 2/1/2015, Ser. A | | | 2,302,549 | |
| | | | Washington G.O. (AGM Insured) | | | | |
| | 5,000,000 | | | 5.000%, 7/1/2021, Ser. Aa,c | | | 5,592,800 | |
| | | | Washington Health Care Fac. Auth. Rev. | | | | |
| | 2,500,000 | | | 5.250%, 12/1/2030 | | | 2,439,350 | |
| | 5,000,000 | | | 5.250%, 10/1/2032, Ser. A | | | 5,344,100 | |
| | | | Washington Health Care Fac. Auth. Rev. (Seattle Cancer Care Alliance) | | | | |
| | 5,010,000 | | | 7.375%, 3/1/2038 | | | 5,952,932 | |
| | | | Washington Higher Education Fac. Auth. Refg. Rev. (Gonzaga University) | | | | |
| | 5,325,000 | | | 5.000%, 4/1/2029, Ser. B | | | 5,423,140 | |
| | | | Washington Higher Education Fac. Auth. Rev. and Refg. Rev. (Whitworth University) | | | | |
| | 1,290,000 | | | 5.875%, 10/1/2034 | | | 1,333,060 | |
| | 1,000,000 | | | 5.625%, 10/1/2040 | | | 1,009,180 | |
| | | | | |
| | | | Total | | | 77,653,679 | |
| | | | | |
| |
| Wisconsin (1.2%) | | | | |
| | | | Kaukauna, WI Electric System Rev. (AGM Insured) | | | | |
| | 3,000,000 | | | 5.000%, 12/15/2035, Ser. Ac | | | 3,079,140 | |
| | | | Monroe, WI Redevelopment Auth. Rev. (Monroe Clinic, Inc.) | | | | |
| | 3,520,000 | | | 5.875%, 2/15/2039 | | | 3,674,282 | |
| | | | University of Wisconsin Hospitals and Clinics Auth. Rev. | | | | |
| | 2,000,000 | | | 5.000%, 4/1/2038, Ser. A | | | 2,001,400 | |
| | | | Wisconsin Health and Educational Fac. Auth. Rev. (Blood Center of Southeastern Wisconsin, Inc.) | | | | |
| | 2,000,000 | | | 5.750%, 6/1/2034 | | | 2,023,960 | |
| | | | Wisconsin Health and Educational Fac. Auth. Rev. (Thedacare, Inc.) | | | | |
| | 5,310,000 | | | 5.500%, 12/15/2038, Ser. A | | | 5,547,410 | |
| | | | Wisconsin Health and Educational Fac. Auth. Rev. Refg. (Marquette University) | | | | |
| | 1,125,000 | | | 5.000%, 10/1/2033, Ser. B-1 | | | 1,170,697 | |
| | | | | |
| | | | Total | | | 17,496,889 | |
| | | | | |
| |
| Wyoming (1.0%) | | | | |
| | | | Kemmerer, WY Pollution Control Rev. (Exxon) | | | | |
| | 1,600,000 | | | 0.070%, 11/1/2014b | | | 1,600,000 | |
| | | | Lincoln County, WY Pollution Control Rev. (Exxon) | | | | |
| | 4,185,000 | | | 0.070%, 11/1/2014, Ser. Db | | | 4,185,000 | |
| | | | Wyoming Municipal Power Agency Power Supply System Rev. | | | | |
| | 3,270,000 | | | 5.375%, 1/1/2042, Ser. A | | | 3,435,266 | |
| | | | Wyoming State Farm Loan Board Capital Fac. Refg. Rev. | | | | |
| | 5,175,000 | | | 5.750%, 10/1/2020 | | | 5,796,362 | |
| | | | | |
| | | | Total | | | 15,016,628 | |
| | | | | |
| | | | Total Long-Term Fixed Income (cost $1,415,930,881) | | | 1,478,235,269 | |
| | | | | |
| | | | | | | | |
| | | | | |
| | | | Total Investments (cost $1,415,930,881) 99.3% | | | $1,478,235,269 | |
| | | | | |
| | | | Other Assets and Liabilities, Net 0.7% | | | 10,772,682 | |
| | | | | |
| | | | Total Net Assets 100.0% | | | $1,489,007,951 | |
| | | | | |
The accompanying Notes to Financial Statements are an integral part of this schedule.
233
Municipal Bond Fund
Schedule of Investments as of October 31, 2013
a | Denotes securities that have been pre-refunded or escrowed to maturity. Under such an arrangement, money is deposited into an irrevocable escrow account and is used to purchase U.S. Treasury securities or government agency securities with maturing principal and interest earnings sufficient to pay all debt service requirements of the pre-refunded bonds. |
b | Denotes variable rate securities. Variable rate securities are securities whose yields vary with a designated market index or market rate. The rate shown is as of October 31, 2013. |
c | To reduce certain risks associated with securities issued by municipalities, which may include but are not limited to economic development in a specific industry or municipality, the principal and/or interest payments are guaranteed by the bond insurance company or government agency identified. |
d | Denotes step coupon securities. Step coupon securities pay an initial coupon rate for the first period and then different coupon rates for following periods. The rate shown is as of October 31, 2013. |
e | Denotes investments purchased on a when-issued or delayed delivery basis. |
Definitions:
| | | | | | |
| | ACA | | - | | American Capital Access Holding, Ltd. |
| | AGM | | - | | Assured Guaranty Municipal Corporation |
| | AMBAC | | - | | American Municipal Bond Insurance Corporation |
| | AMT | | - | | Subject to Alternative Minimum Tax |
| | Auth. | | - | | Authority |
| | BNY | | - | | The Bank of New York Mellon Corporation |
| | CR | | - | | Custodial Receipts |
| | C.O.P. | | - | | Certificate of Participation |
| | Fac. | | - | | Facility/Facilities |
| | FGIC | | - | | Financial Guaranty Insurance Company |
| | FHA | | - | | Federal Housing Administration |
| | FNMA | | - | | Federal National Mortgage Association |
| | FSA | | - | | Financial Security Assurance, Inc. |
| | GNMA | | - | | Government National Mortgage Association |
| | G.O. | | - | | General Obligation |
| | IBC | | - | | Insured Bond Certificate |
| | NATL-RE | | - | | National Public Finance Guarantee Corporation |
| | Proj. | | - | | Project |
| | PSF-GTD | | - | | Permanent School Fund Guarantee Program |
| | Q-SBLF | | - | | Qualified School Bond Loan Fund |
| | Refg. | | - | | Refunding |
| | Rev. | | - | | Revenue |
| | Ser. | | - | | Series |
| | TCRS | | - | | Temporary Custodial Receipts |
| | U.T.G.O. | | - | | Unlimited Tax General Obligation |
| | VA MTGS | | - | | Department of Veterans’ Affairs - Mortgages |
| | XLCA | | - | | XL Capital Assurance |
Unrealized Appreciation (Depreciation)
Gross unrealized appreciation and depreciation of investments, based on cost for federal income tax purposes, were as follows:
| | | | |
Gross unrealized appreciation | | | $74,400,311 | |
Gross unrealized depreciation | | | (12,095,923 | ) |
| | | | |
Net unrealized appreciation (depreciation) | | | $62,304,388 | |
| |
Cost for federal income tax purposes | | | $1,415,930,881 | |
The accompanying Notes to Financial Statements are an integral part of this schedule.
234
Municipal Bond Fund
Schedule of Investments as of October 31, 2013
Fair Valuation Measurements
The following table is a summary of the inputs used, as of October 31, 2013, in valuing Municipal Bond Fund’s assets carried at fair value.
| | | | | | | | | | | | | | | | |
Investments in Securities | | Total | | | Level 1 | | | Level 2 | | | Level 3 | |
| | | | |
Long-Term Fixed Income | | | | | | | | | | | | | | | | |
Education | | | 167,123,548 | | | | – | | | | 167,123,548 | | | | – | |
Electric Revenue | | | 52,200,601 | | | | – | | | | 52,200,601 | | | | – | |
Escrowed/Pre-refunded | | | 139,141,925 | | | | – | | | | 139,141,925 | | | | – | |
General Obligation | | | 266,789,828 | | | | – | | | | 266,789,828 | | | | – | |
Health Care | | | 186,531,656 | | | | – | | | | 186,531,656 | | | | – | |
Housing Finance | | | 4,537,819 | | | | – | | | | 4,537,819 | | | | – | |
Industrial Development Revenue | | | 56,120,596 | | | | – | | | | 56,120,596 | | | | – | |
Other Revenue | | | 233,889,088 | | | | – | | | | 233,889,088 | | | | – | |
Tax Revenue | | | 72,227,939 | | | | – | | | | 72,227,939 | | | | – | |
Transportation | | | 226,109,241 | | | | – | | | | 226,109,241 | | | | – | |
Water & Sewer | | | 73,563,028 | | | | – | | | | 73,563,028 | | | | – | |
| |
Total | | | $1,478,235,269 | | | | $– | | | | $1,478,235,269 | | | | $– | |
| |
There were no significant transfers between Levels during the period ended October 31, 2013. Transfers between Levels are identified as of the end of the period.
The accompanying Notes to Financial Statements are an integral part of this schedule.
235
Government Bond Fund
Schedule of Investments as of October 31, 2013
| | | | | | | | |
Principal
Amount | | | Long-Term Fixed Income (99.0%) | | Value | |
| Asset-Backed Securities (1.1%) | | | | |
| | | | Education Loan Asset-Backed Trust I | | | | |
| | $268,875 | | | 0.620%, 6/25/2022a,b | | | $268,759 | |
| | | | Northstar Education Finance, Inc. | | | | |
| | 879,049 | | | 0.870%, 12/26/2031a,b | | | 877,972 | |
| | | | | |
| | | | Total | | | 1,146,731 | |
| | | | | |
| |
| Collateralized Mortgage Obligations (0.5%) | | | | |
| | | | NCUA Guaranteed Notes | | | | |
| | 568,863 | | | 0.624%, 10/7/2020b | | | 571,885 | |
| | | | | |
| | | | Total | | | 571,885 | |
| | | | | |
| |
| Commercial Mortgage-Backed Securities (1.7%) | | | | |
| | | | Federal Home Loan Mortgage Corporation Multi Family Structured Pass Thru Certificates | | | | |
| | 486,208 | | | 0.727%, 12/25/2016 | | | 483,656 | |
| | | | Federal National Mortgage Association | | | | |
| | 968,638 | | | 0.953%, 11/25/2015 | | | 972,662 | |
| | | | Government National Mortgage Association | | | | |
| | 281,679 | | | 2.164%, 3/16/2033 | | | 283,408 | |
| | 114,852 | | | 3.214%, 1/16/2040 | | | 116,571 | |
| | | | | |
| | | | Total | | | 1,856,297 | |
| | | | | |
| |
| Financials (5.9%) | | | | |
| | | | Achmea Hypotheekbank NV | | | | |
| | 608,000 | | | 3.200%, 11/3/2014a | | | 625,109 | |
| | | | Bank of Montreal | | | | |
| | 750,000 | | | 2.625%, 1/25/2016a | | | 782,925 | |
| | | | Canadian Imperial Bank of Commerce | | | | |
| | 1,000,000 | | | 2.600%, 7/2/2015a | | | 1,035,100 | |
| | | | National Bank of Canada | | | | |
| | 500,000 | | | 2.200%, 10/19/2016a | | | 519,350 | |
| | | | North American Development Bank | | | | |
| | 500,000 | | | 2.300%, 10/10/2018 | | | 501,750 | |
| | | | Private Export Funding Corporation | | | | |
| | 1,000,000 | | | 1.375%, 2/15/2017 | | | 1,012,853 | |
| | 1,000,000 | | | 2.050%, 11/15/2022 | | | 914,938 | |
| | | | SpareBank 1 Boligkreditt AS | | | | |
| | 500,000 | | | 1.250%, 5/2/2018a | | | 489,700 | |
| | | | Toronto-Dominion Bank | | | | |
| | 500,000 | | | 2.200%, 7/29/2015a | | | 514,800 | |
| | | | | |
| | | | Total | | | 6,396,525 | |
| | | | | |
| |
| Foreign Government (4.6%) | | | | |
| | | | Denmark Government International Bond | | | | |
| | 1,000,000 | | | 0.375%, 4/25/2016a | | | 996,600 | |
| | | | Export Development Canada | | | | |
| | 1,000,000 | | | 0.750%, 12/15/2017c | | | 986,010 | |
| | | | Hashemite Kingdom of Jordan | | | | |
| | 500,000 | | | 2.503%, 10/30/2020 | | | 500,000 | |
| | | | Inter-American Development Bank | | | | |
| | 1,000,000 | | | 0.875%, 3/15/2018 | | | 986,597 | |
| | 500,000 | | | 3.000%, 10/4/2023 | | | 503,904 | |
| | | | International Finance Corporation | | | | |
| | 500,000 | | | 0.500%, 5/16/2016 | | | 499,888 | |
| | | | Kommunalbanken AS | | | | |
| | 500,000 | | | 2.750%, 5/5/2015a | | | 517,690 | |
| | | | | |
| | | | Total | | | 4,990,689 | |
| | | | | |
| |
| Mortgage-Backed Securities (5.7%) | | | | |
| | | | Federal Home Loan Mortgage Corporation Gold 15-Yr. Pass Through | | | | |
| | 1,350,000 | | | 3.000%, 12/1/2028d | | | 1,395,563 | |
| | | | Federal Home Loan Mortgage Corporation Gold 30-Yr. Pass Through | | | | |
| | 600,000 | | | 3.500%, 11/1/2043d | �� | | 613,219 | |
| | | | Federal National Mortgage Association Conventional 15- Yr. Pass Through | | | | |
| | 350,000 | | | 2.500%, 11/1/2028d | | | 353,664 | |
| | 175,000 | | | 3.500%, 11/1/2028d | | | 184,775 | |
| | | | Federal National Mortgage Association Conventional 30- Yr. Pass Through | | | | |
| | 1,400,000 | | | 3.500%, 11/1/2043d | | | 1,435,875 | |
| | 1,125,000 | | | 4.000%, 11/1/2043d | | | 1,185,117 | |
| | 950,000 | | | 4.500%, 11/1/2043d | | | 1,016,945 | |
| | | | | |
| | | | Total | | | 6,185,158 | |
| | | | | |
| |
| U.S. Government and Agencies (78.6%) | | | | |
| | | | FDIC Structured Sale Guaranteed Notes | | | | |
| | 400,000 | | | Zero Coupon, 1/7/2014a | | | 399,746 | |
| | | | Federal Agricultural Mortgage Corporation | | | | |
| | 1,000,000 | | | 2.125%, 9/15/2015 | | | 1,032,577 | |
| | 1,000,000 | | | 2.000%, 7/27/2016 | | | 1,034,887 | |
| | | | Federal Farm Credit Bank | | | | |
| | 500,000 | | | 2.210%, 8/1/2024 | | | 453,334 | |
| | | | Federal Home Loan Bank | | | | |
| | 7,810,000 | | | 0.375%, 6/24/2016 | | | 7,798,433 | |
| | | | Federal Home Loan Mortgage Corporation | | | | |
| | 1,000,000 | | | 1.250%, 8/1/2019 | | | 967,018 | |
| | 1,000,000 | | | 1.250%, 10/2/2019 | | | 962,300 | |
| | 3,000,000 | | | 2.375%, 1/13/2022 | | | 2,940,954 | |
| | | | Federal Home Loan Mortgage Corporation Gold 30-Yr. Pass Through | | | | |
| | 6,000,000 | | | 1.375%, 5/1/2020c | | | 5,740,578 | |
| | | | Federal National Mortgage Association | | | | |
| | 175,000 | | | 0.375%, 7/5/2016 | | | 174,049 | |
| | 500,000 | | | 1.375%, 11/15/2016 | | | 510,421 | |
| | 5,950,000 | | | 0.875%, 5/21/2018 | | | 5,815,137 | |
| | 1,250,000 | | | 6.250%, 5/15/2029 | | | 1,610,023 | |
| | | | Tennessee Valley Authority | | | | |
| | 1,225,000 | | | 5.250%, 9/15/2039 | | | 1,348,240 | |
| | | | U.S. Treasury Bonds | | | | |
| | 2,125,000 | | | 7.625%, 2/15/2025 | | | 3,152,969 | |
| | 850,000 | | | 6.500%, 11/15/2026 | | | 1,183,625 | |
| | 2,450,000 | | | 3.000%, 5/15/2042 | | | 2,172,077 | |
| | | | U.S. Treasury Bonds, TIPS | | | | |
| | 341,192 | | | 2.375%, 1/15/2025 | | | 408,391 | |
The accompanying Notes to Financial Statements are an integral part of this schedule.
236
Government Bond Fund
Schedule of Investments as of October 31, 2013
| | | | | | | | |
Principal
Amount | | | Long-Term Fixed Income (99.0%) | | Value | |
| U.S. Government and Agencies (78.6%) - continued | | | | |
| | $351,656 | | | 2.125%, 2/15/2040 | | | $419,488 | |
| | 517,495 | | | 0.750%, 2/15/2042 | | | 447,107 | |
| | | | U.S. Treasury Notes | | | | |
| | 200,000 | | | 0.375%, 2/15/2016 | | | 199,953 | |
| | 1,500,000 | | | 0.875%, 2/28/2017 | | | 1,507,032 | |
| | 3,500,000 | | | 3.250%, 3/31/2017 | | | 3,793,125 | |
| | 4,000,000 | | | 0.625%, 5/31/2017 | | | 3,971,248 | |
| | 50,000 | | | 0.750%, 6/30/2017 | | | 49,813 | |
| | 4,000,000 | | | 0.750%, 2/28/2018 | | | 3,940,936 | |
| | 1,000,000 | | | 2.375%, 6/30/2018 | | | 1,052,891 | |
| | 3,100,000 | | | 1.375%, 9/30/2018 | | | 3,112,350 | |
| | 5,770,000 | | | 1.375%, 1/31/2020 | | | 5,645,132 | |
| | 2,000,000 | | | 1.125%, 4/30/2020 | | | 1,914,376 | |
| | 10,000,000 | | | 2.000%, 7/31/2020 | | | 10,084,380 | |
| | 2,830,000 | | | 1.625%, 8/15/2022 | | | 2,658,431 | |
| | 4,000,000 | | | 1.750%, 5/15/2023 | | | 3,735,936 | |
| | | | U.S. Treasury Notes, TIPS | | | | |
| | 904,119 | | | 0.125%, 1/15/2022 | | | 896,774 | |
| | 3,794,430 | | | 0.125%, 1/15/2023 | | | 3,708,467 | |
| | | | | |
| | | | Total | | | 84,842,198 | |
| | | | | |
| |
| Utilities (0.9%) | | | | |
| | | | John Sevier Combined Cycle Generation, LLC | | | | |
| | 980,535 | | | 4.626%, 1/15/2042 | | | 986,437 | |
| | | | | |
| | | | Total | | | 986,437 | |
| | | | | |
| | | | | | | | |
| | | | | |
| | | | Total Long-Term Fixed Income (cost $106,820,961) | | | 106,975,920 | |
| | | | | |
| | |
| Shares | | | Collateral Held for Securities Loaned (6.4%) | | Value | |
| | 6,897,500 | | | Thrivent Cash Management Trust | | | 6,897,500 | |
| | | | | |
| | | | Total Collateral Held for Securities Loaned (cost $6,897,500) | | | 6,897,500 | |
| | | | | |
| | |
Shares or
Principal
Amount | | | Short-Term Investments (5.3%) | | Value | |
| | | | Thrivent Cash Management Trust | | | | |
| | 5,744,452 | | | 0.070% | | | 5,744,452 | |
| | | | | |
| | | | Total Short-Term Investments (at amortized cost) | | | 5,744,452 | |
| | | | | |
| | | | Total Investments (cost $119,462,913) 110.7% | | $ | 119,617,872 | |
| | | | | |
| | | | Other Assets and Liabilities, Net (10.7%) | | | (11,604,699 | ) |
| | | | | |
| | | | Total Net Assets 100.0% | | $ | 108,013,173 | |
| | | | | |
a | Denotes securities sold under Rule 144A of the Securities Act of 1933, which exempts them from registration. These securities have been deemed liquid and may be resold to other dealers in the program or to other qualified institutional buyers. As of October 31, 2013, the value of these investments was $7,027,751 or 6.5% of total net assets. |
b | Denotes variable rate securities. Variable rate securities are securities whose yields vary with a designated market index or market rate. The rate shown is as of October 31, 2013. |
c | All or a portion of the security is on loan. |
d | Denotes investments purchased on a when-issued or delayed delivery basis. |
Definitions:
|
TIPS - Treasury Inflation Protected Security. |
Unrealized Appreciation (Depreciation)
Gross unrealized appreciation and depreciation of investments, based on cost for federal income tax purposes, were as follows:
| | | | |
Gross unrealized appreciation | | | $1,809,171 | |
Gross unrealized depreciation | | | (1,668,208 | ) |
| | | | |
Net unrealized appreciation (depreciation) | | | $140,963 | |
| |
Cost for federal income tax purposes | | | $119,476,909 | |
The accompanying Notes to Financial Statements are an integral part of this schedule.
237
Government Bond Fund
Schedule of Investments as of October 31, 2013
Fair Valuation Measurements
The following table is a summary of the inputs used, as of October 31, 2013, in valuing Government Bond Fund’s assets carried at fair value.
| | | | | | | | | | | | | | | | |
Investments in Securities | | Total | | | Level 1 | | | Level 2 | | | Level 3 | |
| | | | |
Long-Term Fixed Income | | | | | | | | | | | | | | | | |
Asset-Backed Securities | | | 1,146,731 | | | | – | | | | 1,146,731 | | | | – | |
Collateralized Mortgage Obligations | | | 571,885 | | | | – | | | | 571,885 | | | | – | |
Commercial Mortgage-Backed Securities | | | 1,856,297 | | | | – | | | | 1,856,297 | | | | – | |
Financials | | | 6,396,525 | | | | – | | | | 6,396,525 | | | | – | |
Foreign Government | | | 4,990,689 | | | | – | | | | 4,990,689 | | | | – | |
Mortgage-Backed Securities | | | 6,185,158 | | | | – | | | | 6,185,158 | | | | – | |
U.S. Government and Agencies | | | 84,842,198 | | | | – | | | | 84,842,198 | | | | – | |
Utilities | | | 986,437 | | | | – | | | | 986,437 | | | | – | |
Collateral Held for Securities Loaned | | | 6,897,500 | | | | 6,897,500 | | | | – | | | | – | |
Short-Term Investments | | | 5,744,452 | | | | 5,744,452 | | | | – | | | | – | |
| |
Total | | $ | 119,617,872 | | | $ | 12,641,952 | | | $ | 106,975,920 | | | | $– | |
| |
There were no significant transfers between Levels during the period ended October 31, 2013. Transfers between Levels are identified as of the end of the period.
Investment in Affiliates
Affiliated issuers, as defined under the Investment Company Act of 1940, include those in which the Fund’s holdings of an issuer represent 5% or more of the outstanding voting securities of an issuer, or any affiliated mutual fund.
A summary of transactions for the fiscal year to date, in Government Bond Fund, is as follows:
| | | | | | | | | | | | | | | | | | | | | | | | |
Fund | | Value
October 31, 2012 | | | Gross
Purchases | | | Gross
Sales | | | Shares Held at
October 31, 2013 | | | Value
October 31, 2013 | | | Income Earned
November 1, 2012 -
October 31, 2013 | |
Cash Management Trust-Collateral Investment | | | $– | | | | $85,893,105 | | | | $78,995,605 | | | | 6,897,500 | | | | $6,897,500 | | | | $48,293 | |
Cash Management Trust-Short Term Investment | | | 4,848,944 | | | | 43,165,870 | | | | 42,270,362 | | | | 5,744,452 | | | | 5,744,452 | | | | 6,511 | |
Total Value and Income Earned | | | 4,848,944 | | | | | | | | | | | | | | | | 12,641,952 | | | | 54,804 | |
The accompanying Notes to Financial Statements are an integral part of this schedule.
238
Limited Maturity Bond Fund
Schedule of Investments as of October 31, 2013
| | | | | | | | |
Principal
Amount | | | Bank Loans (5.3%)a | | Value | |
| Basic Materials (0.2%) | | | | |
| | | | FMG Resources August 2006 Pty., Ltd., Term Loan | | | | |
| | $877,783 | | | 5.250%, 10/18/2017 | | | $879,047 | |
| | | | Ineos Group Holdings, Ltd., Term Loan | | | | |
| | 931,762 | | | 4.000%, 5/4/2018 b,c | | | 934,446 | |
| | | | | |
| | | | Total | | | 1,813,493 | |
| | | | | |
| |
| Capital Goods (0.3%) | | | | |
| | | | ADS Waste Holdings, Term Loan | | | | |
| | 929,110 | | | 4.250%, 10/9/2019 | | | 933,922 | |
| | | | Berry Plastics Group, Inc., Term Loan | | | | |
| | 706,450 | | | 3.500%, 2/8/2020 | | | 703,582 | |
| | | | Rexnord, LLC, Term Loan | | | | |
| | 560,000 | | | 4.000%, 8/21/2020 | | | 560,280 | |
| | | | Silver II Borrower, Term Loan | | | | |
| | 558,593 | | | 4.000%, 12/13/2019 | | | 557,995 | |
| | | | | |
| | | | Total | | | 2,755,779 | |
| | | | | |
| |
| Communications Services (1.9%) | | | | |
| | | | Cincinnati Bell, Inc., Term Loan | | | | |
| | 280,000 | | | 4.000%, 9/10/2020 | | | 278,687 | |
| | | | Clear Channel Communications, Inc., Term Loan | | | | |
| | 179,766 | | | 3.818%, 1/29/2016 | | | 174,246 | |
| | 755,234 | | | 6.918%, 1/30/2019 | | | 717,570 | |
| | | | Cricket Communications, Inc., Term Loan | | | | |
| | 558,600 | | | 4.750%, 3/8/2020 | | | 560,996 | |
| | | | Fairpoint Communications, Term Loan | | | | |
| | 224,436 | | | 7.500%, 2/14/2019b,c | | | 228,581 | |
| | | | Grande Communications Networks, LLC, Term Loan | | | | |
| | 708,225 | | | 4.500%, 5/29/2020 | | | 705,569 | |
| | | | Hargray Communications Group, Inc., Term Loan | | | | |
| | 932,663 | | | 4.750%, 6/26/2019 | | | 938,100 | |
| | | | Integra Telecom Holdings, Inc., Term Loan | | | | |
| | 905,949 | | | 5.250%, 2/22/2019 | | | 915,760 | |
| | | | Intelsat Jackson Holdings SA, Term Loan | | | | |
| | 826,076 | | | 4.250%, 4/2/2018 | | | 830,033 | |
| | | | Level 3 Communications, Inc., Term Loan | | | | |
| | 225,000 | | | 4.000%, 8/1/2019 | | | 225,938 | |
| | 340,000 | | | 4.000%, 1/15/2020 | | | 341,418 | |
| | | | LTS Buyer, LLC, Term Loan | | | | |
| | 558,600 | | | 4.500%, 4/13/2020 | | | 560,231 | |
| | | | McGraw-Hill Global Education Holdings, LLC, Term Loan | | | | |
| | 752,210 | | | 9.000%, 3/22/2019 | | | 764,907 | |
| | | | NEP Broadcasting, LLC, Term Loan | | | | |
| | 704,675 | | | 4.750%, 1/22/2020 | | | 706,437 | |
| | | | NTelos, Inc., Term Loan | | | | |
| | 558,589 | | | 5.750%, 11/9/2019 | | | 560,684 | |
| | | | Puerto Rico Cable Acquisition Company, Inc., Term Loan | | | | |
| | 1,292,899 | | | 5.500%, 7/31/2018 | | | 1,291,283 | |
| | | | TNS, Inc., Term Loan | | | | |
| | 881,799 | | | 5.000%, 2/14/2020 | | | 886,940 | |
| | | | Univision Communications, Inc., Term Loan | | | | |
| | 905,949 | | | 4.500%, 3/1/2020 | | | 910,479 | |
| | | | Virgin Media Investment Holdings, Ltd., Term Loan | | | | |
| | 910,000 | | | 3.500%, 6/8/2020 | | | 909,591 | |
| | | | Visant Corporation, Term Loan | | | | |
| | 395,000 | | | 5.250%, 12/22/2016 | | | 387,381 | |
| | | | WideOpenWest Finance, LLC, Term Loan | | | | |
| | 905,949 | | | 4.750%, 4/1/2019 | | | 913,124 | |
| | | | WMG Acquisition Corporation, Term Loan | | | | |
| | 710,000 | | | 3.750%, 7/1/2020 | | | 710,220 | |
| | | | Yankee Cable Acquisition, LLC, Term Loan | | | | |
| | 894,554 | | | 5.250%, 3/1/2020 | | | 898,329 | |
| | | | Zayo Group, LLC, Term Loan | | | | |
| | 904,143 | | | 4.500%, 7/2/2019 | | | 908,103 | |
| | | | | |
| | | | Total | | | 16,324,607 | |
| | | | | |
| |
| Consumer Cyclical (0.9%) | | | | |
| | | | Bally Technologies, Inc., Term Loan | | | | |
| | 290,000 | | | 0.000%, 7/16/2021b,c | | | 290,725 | |
| | | | Booz Allen Hamilton, Inc., Term Loan | | | | |
| | 339,144 | | | 3.750%, 7/31/2019 | | | 338,933 | |
| | | | Burlington Coat Factory Warehouse Corporation, Term Loan | | | | |
| | 560,000 | | | 4.250%, 2/23/2017 | | | 563,674 | |
| | | | Cenveo Corporation, Term Loan | | | | |
| | 237,404 | | | 6.250%, 2/13/2017 | | | 239,481 | |
| | | | Ceridian Corporation, Term Loan | | | | |
| | 1,125,000 | | | 4.420%, 5/9/2017 | | | 1,130,344 | |
| | | | Chrysler Group, LLC, Term Loan | | | | |
| | 706,387 | | | 4.250%, 5/24/2017 | | | 712,391 | |
| | | | J.C. Penney Corporation, Inc., Term Loan | | | | |
| | 932,663 | | | 6.000%, 5/22/2018 | | | 901,316 | |
| | | | MGM Resorts International, Term Loan | | | | |
| | 785,471 | | | 3.500%, 12/20/2019 | | | 784,207 | |
| | | | ROC Finance, LLC, Term Loan | | | | |
| | 710,000 | | | 5.000%, 6/20/2019 | | | 694,025 | |
| | | | Scientific Games International, Inc., Term Loan | | | | |
| | 935,000 | | | 4.250%, 10/18/2020b,c | | | 935,000 | |
| | | | Seminole Hard Rock Entertainment, Inc., Term Loan | | | | |
| | 354,112 | | | 3.500%, 5/14/2020 | | | 352,122 | |
| | | | Seminole Indian Tribe of Florida, Term Loan | | | | |
| | 685,150 | | | 3.000%, 4/29/2020 | | | 683,293 | |
| | | | Toys R Us, Inc., Term Loan | | | | |
| | 558,529 | | | 5.250%, 5/25/2018 | | | 503,547 | |
| | | | | |
| | | | Total | | | 8,129,058 | |
| | | | | |
| |
| Consumer Non-Cyclical (0.7%) | | | | |
| | | | Albertsons, LLC, Term Loan | | | | |
| | 940,836 | | | 4.750%, 3/21/2019 | | | 943,169 | |
The accompanying Notes to Financial Statements are an integral part of this schedule.
239
Limited Maturity Bond Fund
Schedule of Investments as of October 31, 2013
| | | | | | | | |
Principal
Amount | | | Bank Loans (5.3%)a | | Value | |
| Consumer Non-Cyclical (0.7%) - continued | | | | |
| | | | Biomet, Inc., Term Loan | | | | |
| | $1,122,188 | | | 3.690%, 7/25/2017 | | | $1,129,437 | |
| | | | Del Monte Corporation, Term Loan | | | | |
| | 111,526 | | | 4.000%, 3/8/2018 | | | 111,526 | |
| | | | JBS USA, LLC, Term Loan | | | | |
| | 558,593 | | | 3.750%, 5/25/2018 | | | 557,197 | |
| | | | Roundy’s Supermarkets, Inc., Term Loan | | | | |
| | 558,582 | | | 5.750%, 2/13/2019 | | | 551,600 | |
| | | | Supervalu, Inc., Term Loan | | | | |
| | 1,410,763 | | | 5.000%, 3/21/2019 | | | 1,418,790 | |
| | | | Van Wagner Communications, LLC, Term Loan | | | | |
| | 835,800 | | | 6.250%, 8/3/2018 | | | 847,986 | |
| | | | | |
| | | | Total | | | 5,559,705 | |
| | | | | |
| |
| Energy (0.2%) | | | | |
| | | | Arch Coal, Inc., Term Loan | | | | |
| | 558,586 | | | 5.750%, 5/16/2018 | | | 541,248 | |
| | | | Offshore Group Investment, Ltd., Term Loan | | | | |
| | 353,225 | | | 5.750%, 3/28/2019 | | | 355,323 | |
| | | | Pacific Drilling SA, Term Loan | | | | |
| | 907,725 | | | 4.500%, 6/3/2018 | | | 910,748 | |
| | | | | |
| | | | Total | | | 1,807,319 | |
| | | | | |
| |
| Financials (0.2%) | | | | |
| | | | Harland Clarke Holdings Corporation, Term Loan | | | | |
| | 929,156 | | | 7.000%, 5/22/2018 | | | 932,176 | |
| | | | WaveDivision Holdings, LLC, Term Loan | | | | |
| | 704,675 | | | 4.000%, 10/12/2019 | | | 706,437 | |
| | | | | |
| | | | Total | | | 1,638,613 | |
| | | | | |
| |
| Technology (0.4%) | | | | |
| | | | BMC Software, Inc., Term Loan | | | | |
| | 1,125,000 | | | 5.000%, 9/10/2020 | | | 1,135,687 | |
| | | | First Data Corporation Extended, Term Loan | | | | |
| | 935,000 | | | 4.170%, 3/23/2018 | | | 935,336 | |
| | | | Freescale Semiconductor, Inc., Term Loan | | | | |
| | 905,949 | | | 5.000%, 3/1/2020 | | | 913,704 | |
| | | | SunGard Data Systems, Inc., Term Loan | | | | |
| | 348,250 | | | 4.000%, 3/8/2020 | | | 350,601 | |
| | | | | |
| | | | Total | | | 3,335,328 | |
| | | | | |
| |
| Transportation (0.3%) | | | | |
| | | | American Airlines, Inc., Term Loan | | | | |
| | 1,047,375 | | | 4.750%, 6/27/2019 | | | 1,052,832 | |
| | | | American Petroleum Tankers Parent, LLC, Term Loan | | | | |
| | 697,175 | | | 4.750%, 10/2/2019 | | | 697,175 | |
| | | | U.S. Airways, Inc., Term Loan | | | | |
| | 910,000 | | | 4.250%, 5/23/2019 | | | 910,382 | |
| | | | | |
| | | | Total | | | 2,660,389 | |
| | | | | |
| |
| Utilities (0.2%) | | | | |
| | | | Calpine Corporation, Term Loan | | | | |
| | 704,580 | | | 4.000%, 4/1/2018 | | | 707,399 | |
| | 160,000 | | | 4.000%, 10/30/2020b,c | | | 160,574 | |
| | | | Intergen NV, Term Loan | | | | |
| | 907,725 | | | 5.500%, 6/15/2020 | | | 905,456 | |
| | | | | |
| | | | Total | | | 1,773,429 | |
| | | | | |
| | | | | | | | |
| | | | | |
| | | | Total Bank Loans (cost $45,730,737) | | | 45,797,720 | |
| | | | | |
| | |
Principal
Amount | | | Long-Term Fixed Income (93.1%) | | Value | |
| Asset-Backed Securities (12.9%) | | | | |
| | | | Avis Budget Rental Car Funding AESOP, LLC | | | | |
| | 6,000,000 | | | 2.370%, 11/20/2014d | | | 6,081,072 | |
| | | | Citibank Omni Master Trust | | | | |
| | 4,000,000 | | | 4.900%, 11/15/2018d | | | 4,174,804 | |
| | | | Countrywide Home Loans, Inc. | | | | |
| | 631,038 | | | 6.085%, 6/25/2021e | | | 744,734 | |
| | | | Credit Based Asset Servicing and Securitization, LLC | | | | |
| | 737,069 | | | 3.939%, 12/25/2036 | | | 483,074 | |
| | | | Edlinc Student Loan Funding Trust | | | | |
| | 2,384,755 | | | 3.170%, 10/1/2025f,g | | | 2,360,907 | |
| | | | Education Loan Asset-Backed Trust I | | | | |
| | 3,764,247 | | | 0.620%, 6/25/2022d,g | | | 3,762,632 | |
| | | | Enterprise Fleet Financing, LLC | | | | |
| | 725,864 | | | 1.430%, 10/20/2016d | | | 726,277 | |
| | 1,716,110 | | | 0.720%, 4/20/2018d | | | 1,716,198 | |
| | | | First Franklin Mortgage Loan Asset-Backed Certificates | | | | |
| | 86,028 | | | 5.500%, 3/25/2036f,h | | | 1 | |
| | | | First Horizon ABS Trust | | | | |
| | 300,486 | | | 0.300%, 9/25/2029e,g | | | 279,044 | |
| | | | Fosse Master Issuer plc | | | | |
| | 2,500,856 | | | 1.646%, 10/18/2054d,g | | | 2,517,727 | |
| | | | FRS, LLC | | | | |
| | 3,499,730 | | | 1.800%, 4/15/2043d | | | 3,487,558 | |
| | | | GE Dealer Floorplan Master Note Trust | | | | |
| | 4,000,000 | | | 0.613%, 10/20/2017g | | | 4,000,800 | |
| | 5,500,000 | | | 0.573%, 4/20/2018g | | | 5,488,329 | |
| | | | GMAC Mortgage Corporation Loan Trust | | | | |
| | 541,322 | | | 0.350%, 8/25/2035e,g | | | 451,236 | |
| | 674,911 | | | 5.750%, 10/25/2036e | | | 658,628 | |
| | 1,104,931 | | | 0.350%, 12/25/2036e,g | | | 943,809 | |
| | | | Golden Credit Card Trust | | | | |
| | 4,800,000 | | | 0.424%, 2/15/2018d,g | | | 4,787,789 | |
| | 1,500,000 | | | 0.636%, 9/15/2018d,g | | | 1,500,000 | |
| | | | Great America Leasing Receivables | | | | |
| | 2,000,000 | | | 0.780%, 6/15/2016d | | | 2,000,424 | |
| | | | Hyundai Auto Receivables Trust | | | | |
| | 2,000,000 | | | 0.710%, 9/15/2017 | | | 2,003,062 | |
| | | | J.P. Morgan Mortgage Trust | | | | |
| | 1,037,930 | | | 2.807%, 2/25/2036 | | | 912,730 | |
| | | | Master Credit Card Trust | | | | |
| | 7,000,000 | | | 0.780%, 4/21/2017d | | | 6,993,602 | |
| | | | Montana Higher Education Student Assistance Corporation | | | | |
| | 1,016,063 | | | 0.773%, 9/20/2022g | | | 1,016,697 | |
The accompanying Notes to Financial Statements are an integral part of this schedule.
240
Limited Maturity Bond Fund
Schedule of Investments as of October 31, 2013
| | | | | | | | |
Principal
Amount | | | Long-Term Fixed Income (93.1%) | | Value | |
| Asset-Backed Securities (12.9%) - continued | | | | |
| | | | Mortgage Equity Conversion Asset Trust | | | | |
| | $2,342,168 | | | 0.600%, 1/25/2042f,g | | | $1,709,782 | |
| | 2,306,250 | | | 0.600%, 2/25/2042f,g | | | 1,683,562 | |
| | | | Nationstar Agency Advance Funding Trust | | | | |
| | 2,800,000 | | | 0.997%, 2/15/2045d | | | 2,783,340 | |
| | | | Nissan Master Owner Trust Receivables | | | | |
| | 6,000,000 | | | 0.474%, 2/15/2018g | | | 5,993,058 | |
| | | | Northstar Education Finance, Inc. | | | | |
| | 3,516,197 | | | 0.870%, 12/26/2031d,g | | | 3,511,886 | |
| | | | Renaissance Home Equity Loan Trust | | | | |
| | 1,547,441 | | | 5.608%, 5/25/2036 | | | 1,098,548 | |
| | 737,090 | | | 5.285%, 1/25/2037 | | | 403,585 | |
| | | | Santander Drive Auto Receivables Trust | | | | |
| | 4,000,000 | | | 0.700%, 9/15/2017 | | | 3,997,152 | |
| | | | SLM Student Loan Trust | | | | |
| | 3,346,440 | | | 0.308%, 4/27/2020g | | | 3,341,373 | |
| | 1,680,595 | | | 1.274%, 1/18/2022d,g | | | 1,685,365 | |
| | 3,430,770 | | | 0.308%, 4/25/2022g | | | 3,419,754 | |
| | 1,894,897 | | | 0.774%, 8/15/2022d,g | | | 1,889,065 | |
| | 776,952 | | | 0.318%, 4/25/2023g | | | 776,781 | |
| | 2,975,747 | | | 0.924%, 10/16/2023d,g | | | 2,971,682 | |
| | 1,745,789 | | | 0.570%, 3/25/2025g | | | 1,740,061 | |
| | 4,837,501 | | | 0.690%, 3/25/2026g | | | 4,840,428 | |
| | 1,800,000 | | | 1.224%, 5/17/2027d,g | | | 1,779,935 | |
| | | | Wachovia Asset Securitization, Inc. | | | | |
| | 695,644 | | | 0.310%, 7/25/2037e,f,g | | | 601,803 | |
| | | | Wachovia Student Loan Trust | | | | |
| | 1,300,985 | | | 0.348%, 7/27/2020g | | | 1,299,393 | |
| | | | World Financial Network Credit Card Master Trust | | | | |
| | 4,000,000 | | | 0.910%, 3/16/2020 | | | 3,979,136 | |
| | | | World Omni Auto Receivables Trust | | | | |
| | 1,250,000 | | | 1.330%, 1/15/2018 | | | 1,267,064 | |
| | | | World Omni Master Owner Trust | | | | |
| | 3,600,000 | | | 0.524%, 2/15/2018d,g | | | 3,595,838 | |
| | | | | |
| | | | Total | | | 111,459,725 | |
| | | | | |
| |
| Basic Materials (0.8%) | | | | |
| | | | Dow Chemical Company | | | | |
| | 1,500,000 | | | 2.500%, 2/15/2016 | | | 1,553,419 | |
| | | | Freeport-McMoRan Copper & Gold, Inc. | | | | |
| | 1,000,000 | | | 2.375%, 3/15/2018 | | | 997,272 | |
| | | | Glencore Funding, LLC | | | | |
| | 1,170,000 | | | 1.604%, 1/15/2019d,g | | | 1,134,519 | |
| | | | Xstrata Finance Canada, Ltd. | | | | |
| | 1,250,000 | | | 2.050%, 10/23/2015d | | | 1,259,899 | |
| | 1,950,000 | | | 2.700%, 10/25/2017d | | | 1,959,272 | |
| | | | | |
| | | | Total | | | 6,904,381 | |
| | | | | |
| |
| Capital Goods (0.8%) | | | | |
| | | | Eaton Corporation | | | | |
| | 2,000,000 | | | 1.500%, 11/2/2017d | | | 1,979,966 | |
| | | | Precision Castparts Corporation | | | | |
| | 1,600,000 | | | 1.250%, 1/15/2018 | | | 1,568,347 | |
| | | | Roper Industries, Inc. | | | | |
| | 1,600,000 | | | 1.850%, 11/15/2017 | | | 1,599,938 | |
| | | | Textron, Inc. | | | | |
| | 1,300,000 | | | 6.200%, 3/15/2015 | | | 1,388,622 | |
| | | | | |
| | | | Total | | | 6,536,873 | |
| | | | | |
| |
| Collateralized Mortgage Obligations (3.0%) | | | | |
| | | | American Home Mortgage Assets Trust | | | | |
| | 1,366,918 | | | 1.073%, 11/25/2046g | | | 772,531 | |
| | | | Bear Stearns Adjustable Rate Mortgage Trust | | | | |
| | 672,976 | | | 2.430%, 10/25/2035g | | | 651,939 | |
| | | | Countrywide Alternative Loan Trust | | | | |
| | 543,366 | | | 5.500%, 11/25/2035 | | | 541,385 | |
| | 432,327 | | | 5.500%, 2/25/2036 | | | 385,807 | |
| | 618,024 | | | 6.000%, 1/25/2037 | | | 493,273 | |
| | | | Countrywide Home Loans, Inc. | | | | |
| | 845,478 | | | 2.634%, 3/20/2036 | | | 667,757 | |
| | 836,967 | | | 2.609%, 9/20/2036 | | | 588,171 | |
| | | | Deutsche Alt-A Securities Mortgage Loan Trust | | | | |
| | 1,513,038 | | | 0.919%, 4/25/2047g | | | 1,282,551 | |
| | | | GSR Mortgage Loan Trust | | | | |
| | 1,758,322 | | | 0.360%, 8/25/2046g | | | 1,730,308 | |
| | | | HarborView Mortgage Loan Trust | | | | |
| | 1,718,483 | | | 2.382%, 6/19/2034 | | | 1,715,819 | |
| | | | HomeBanc Mortgage Trust | | | | |
| | 880,627 | | | 2.408%, 4/25/2037 | | | 611,483 | |
| | | | Impac CMB Trust | | | | |
| | 657,390 | | | 0.810%, 8/25/2035g | | | 560,514 | |
| | | | J.P. Morgan Alternative Loan Trust | | | | |
| | 1,369,076 | | | 2.679%, 3/25/2036 | | | 1,056,980 | |
| | | | J.P. Morgan Mortgage Trust | | | | |
| | 554,103 | | | 2.679%, 10/25/2036 | | | 446,394 | |
| | | | Master Asset Securitization Trust | | | | |
| | 1,053,704 | | | 0.670%, 6/25/2036g | | | 666,320 | |
| | | | NCUA Guaranteed Notes | | | | |
| | 3,458,688 | | | 0.624%, 10/7/2020g | | | 3,477,062 | |
| | | | Residential Accredit Loans, Inc. | | | | |
| | 781,781 | | | 3.526%, 9/25/2035 | | | 641,372 | |
| | | | Sequoia Mortgage Trust | | | | |
| | 1,115,299 | | | 0.765%, 9/20/2034g | | | 1,096,927 | |
| | | | Wachovia Mortgage Loan Trust, LLC | | | | |
| | 638,450 | | | 3.027%, 5/20/2036 | | | 539,559 | |
| | | | WaMu Mortgage Pass Through Certificates | | | | |
| | 508,697 | | | 0.460%, 10/25/2045g | | | 470,847 | |
| | 1,298,171 | | | 1.029%, 10/25/2046g | | | 1,065,825 | |
| | 1,606,508 | | | 0.969%, 12/25/2046g | | | 1,335,220 | |
| | 1,526,150 | | | 0.889%, 1/25/2047g | | | 1,259,917 | |
| | | | Washington Mutual Alternative Mortgage Pass Through Certificates | | | | |
| | 1,047,612 | | | 1.069%, 9/25/2046g | | | 616,465 | |
| | 1,726,970 | | | 0.899%, 2/25/2047g | | | 1,139,588 | |
| | | | Wells Fargo Mortgage Backed Securities Trust | | | | |
| | 1,097,727 | | | 2.633%, 3/25/2036 | | | 1,095,239 | |
The accompanying Notes to Financial Statements are an integral part of this schedule.
241
Limited Maturity Bond Fund
Schedule of Investments as of October 31, 2013
| | | | | | | | |
Principal
Amount | | | Long-Term Fixed Income (93.1%) | | Value | |
| Collateralized Mortgage Obligations (3.0%) - continued | | | | |
| | $937,168 | | | 2.690%, 3/25/2036 | | | $917,185 | |
| | | | | |
| | | | Total | | | 25,826,438 | |
| | | | | |
| |
| Commercial Mortgage-Backed Securities (6.4%) | | | | |
| | | | Bear Stearns Commercial Mortgage Securities, Inc. | | | | |
| | 365,837 | | | 5.656%, 6/11/2040 | | | 366,389 | |
| | 1,700,000 | | | 5.331%, 2/11/2044 | | | 1,867,042 | |
| | | | Citigroup Commercial Mortgage Trust | | | | |
| | 750,000 | | | 5.705%, 12/10/2049 | | | 848,855 | |
| | | | Citigroup/Deutsche Bank Commercial Mortgage | | | | |
| | 1,595,000 | | | 5.322%, 12/11/2049 | | | 1,767,289 | |
| | | | Commercial Mortgage Pass- Through Certificates | | | | |
| | 283,585 | | | 0.304%, 12/15/2020d,g | | | 279,536 | |
| | 4,000,000 | | | 1.224%, 6/8/2030d,g | | | 3,979,916 | |
| | 1,000,000 | | | 5.306%, 12/10/2046 | | | 1,097,331 | |
| | | | Credit Suisse First Boston Mortgage Securities Corporation | | | | |
| | 3,068,420 | | | 4.691%, 4/15/2037 | | | 3,121,421 | |
| | | | Credit Suisse Mortgage Capital Certificates | | | | |
| | 554,565 | | | 0.344%, 10/15/2021d,g | | | 552,373 | |
| | 1,642,772 | | | 5.467%, 9/15/2039 | | | 1,797,660 | |
| | | | Federal Home Loan Mortgage Corporation Multi Family Structured Pass Thru Certificates | | | | |
| | 4,087,062 | | | 0.727%, 12/25/2016 | | | 4,065,609 | |
| | | | Federal National Mortgage Association | | | | |
| | 3,874,551 | | | 0.953%, 11/25/2015 | | | 3,890,646 | |
| | | | Government National Mortgage Association | | | | |
| | 518,115 | | | 2.870%, 3/16/2051 | | | 523,353 | |
| | 1,463,560 | | | 1.864%, 8/16/2031 | | | 1,469,252 | |
| | 1,929,501 | | | 2.164%, 3/16/2033 | | | 1,941,348 | |
| | 746,537 | | | 3.214%, 1/16/2040 | | | 757,715 | |
| | | | Greenwich Capital Commercial Funding Corporation | | | | |
| | 1,993,957 | | | 5.074%, 1/5/2036 | | | 1,993,573 | |
| | 4,500,000 | | | 5.224%, 4/10/2037 | | | 4,774,172 | |
| | | | GS Mortgage Securities Corporation II | | | | |
| | 3,200,000 | | | 1.023%, 11/8/2029d,g | | | 3,163,904 | |
| | | | J.P. Morgan Chase Commercial Mortgage Securities Corporation | | | | |
| | 3,800,000 | | | 0.874%, 4/15/2028d,g | | | 3,787,361 | |
| | 3,500,000 | | | 5.429%, 12/12/2043 | | | 3,822,021 | |
| | | | Morgan Stanley Capital I | | | | |
| | 2,350,000 | | | 3.224%, 7/15/2049 | | | 2,463,571 | |
| | | | Morgan Stanley Capital, Inc. | | | | |
| | 1,976,824 | | | 5.579%, 4/12/2049 | | | 2,009,145 | |
| | | | NCUA Guaranteed Notes | | | | |
| | 3,192,360 | | | 1.600%, 10/29/2020 | | | 3,220,408 | |
| | | | Wachovia Bank Commercial Mortgage Trust | | | | |
| | 1,271,250 | | | 5.765%, 7/15/2045 | | | 1,371,865 | |
| | | | | |
| | | | Total | | | 54,931,755 | |
| | | | | |
| |
| Communications Services (2.5%) | | | | |
| | | | America Movil SAB de CV | | | | |
| | 4,500,000 | | | 1.256%, 9/12/2016g | | | 4,539,267 | |
| | | | American Tower Corporation | | | | |
| | 1,000,000 | | | 3.500%, 1/31/2023 | | | 921,964 | |
| | | | AT&T, Inc. | | | | |
| | 1,625,000 | | | 1.400%, 12/1/2017 | | | 1,603,303 | |
| | | | British Telecommunications plc | | | | |
| | 1,500,000 | | | 1.625%, 6/28/2016 | | | 1,519,845 | |
| | | | Crown Castle Towers, LLC | | | | |
| | 1,500,000 | | | 3.214%, 8/15/2015d | | | 1,533,177 | |
| | 850,000 | | | 4.174%, 8/15/2017d | | | 911,060 | |
| | | | DIRECTV Holdings, LLC | | | | |
| | 1,500,000 | | | 1.750%, 1/15/2018 | | | 1,465,940 | |
| | | | GTP Acquisition Partners I, LLC | | | | |
| | 1,500,000 | | | 4.347%, 6/15/2016d | | | 1,586,554 | |
| | | | NBC Universal Enterprise, Inc. | | | | |
| | 1,750,000 | | | 1.662%, 4/15/2018d | | | 1,732,990 | |
| | | | Qwest Communications International, Inc. | | | | |
| | 1,000,000 | | | 7.125%, 4/1/2018 | | | 1,037,500 | |
| | | | SBA Tower Trust | | | | |
| | 3,500,000 | | | 4.254%, 4/15/2015d | | | 3,563,794 | |
| | | | Verizon Communications, Inc. | | | | |
| | 1,350,000 | | | 1.782%, 9/15/2016g | | | 1,384,250 | |
| | | | | |
| | | | Total | | | 21,799,644 | |
| | | | | |
| |
| Consumer Cyclical (2.4%) | | | | |
| | | | Amazon.com, Inc. | | | | |
| | 1,500,000 | | | 1.200%, 11/29/2017 | | | 1,471,752 | |
| | | | American Honda Finance Corporation | | | | |
| | 3,000,000 | | | 1.850%, 9/19/2014d | | | 3,038,436 | |
| | 760,000 | | | 0.637%, 5/26/2016d,g | | | 760,882 | |
| | | | Daimler Finance North America, LLC | | | | |
| | 3,000,000 | | | 0.858%, 3/28/2014d,g | | | 3,005,307 | |
| | | | Ford Motor Credit Company, LLC | | | | |
| | 1,250,000 | | | 4.207%, 4/15/2016 | | | 1,334,139 | |
| | 1,300,000 | | | 3.984%, 6/15/2016 | | | 1,384,568 | |
| | 500,000 | | | 3.000%, 6/12/2017 | | | 520,462 | |
| | | | Home Depot, Inc. | | | | |
| | 1,600,000 | | | 2.250%, 9/10/2018 | | | 1,634,861 | |
| | | | Hyundai Capital America | | | | |
| | 2,250,000 | | | 1.875%, 8/9/2016d | | | 2,269,291 | |
| | | | Toyota Motor Credit Corporation | | | | |
| | 1,000,000 | | | 0.553%, 5/17/2016g | | | 1,002,273 | |
| | | | Viacom, Inc. | | | | |
| | 1,000,000 | | | 2.500%, 9/1/2018 | | | 1,010,384 | |
| | | | Volkswagen International Finance NV | | | | |
| | 3,000,000 | | | 1.625%, 3/22/2015d | | | 3,036,420 | |
| | | | | |
| | | | Total | | | 20,468,775 | |
| | | | | |
| |
| Consumer Non-Cyclical (3.9%) | | | | |
| | | | AbbVie, Inc. | | | | |
| | 1,500,000 | | | 1.200%, 11/6/2015 | | | 1,510,488 | |
| | 1,250,000 | | | 1.750%, 11/6/2017 | | | 1,253,810 | |
The accompanying Notes to Financial Statements are an integral part of this schedule.
242
Limited Maturity Bond Fund
Schedule of Investments as of October 31, 2013
| | | | | | | | |
Principal
Amount | | | Long-Term Fixed Income (93.1%) | | Value | |
| Consumer Non-Cyclical (3.9%) - continued | | | | |
| | | | Allergan, Inc. | | | | |
| | $1,250,000 | | | 1.350%, 3/15/2018 | | | $1,232,148 | |
| | | | Altria Group, Inc. | | | | |
| | 500,000 | | | 2.850%, 8/9/2022 | | | 464,395 | |
| | | | Anheuser-Busch InBev Worldwide, Inc. | | | | |
| | 2,450,000 | | | 1.375%, 7/15/2017 | | | 2,452,982 | |
| | | | Boston Scientific Corporation | | | | |
| | 2,250,000 | | | 2.650%, 10/1/2018 | | | 2,268,396 | |
| | | | Cargill, Inc. | | | | |
| | 1,073,000 | | | 4.307%, 5/14/2021d | | | 1,146,441 | |
| | | | Celgene Corporation | | | | |
| | 1,500,000 | | | 2.450%, 10/15/2015 | | | 1,543,326 | |
| | | | Coca-Cola Enterprises, Inc. | | | | |
| | 2,000,000 | | | 3.500%, 9/15/2020 | | | 2,056,122 | |
| | | | ConAgra Foods, Inc. | | | | |
| | 1,400,000 | | | 1.300%, 1/25/2016 | | | 1,404,704 | |
| | | | Dr Pepper Snapple Group, Inc. | | | | |
| | 500,000 | | | 2.000%, 1/15/2020 | | | 478,400 | |
| | | | Edwards Lifesciences Corporation | | | | |
| | 1,100,000 | | | 2.875%, 10/15/2018 | | | 1,104,219 | |
| | | | Express Scripts Holding Company | | | | |
| | 2,000,000 | | | 2.650%, 2/15/2017 | | | 2,075,818 | |
| | | | Heineken NV | | | | |
| | 2,000,000 | | | 1.400%, 10/1/2017d | | | 1,975,844 | |
| | | | Howard Hughes Medical Institute | | | | |
| | 1,500,000 | | | 3.500%, 9/1/2023 | | | 1,504,437 | |
| | | | Japan Tobacco, Inc. | | | | |
| | 2,500,000 | | | 2.100%, 7/23/2018d | | | 2,521,000 | |
| | | | Medtronic, Inc. | | | | |
| | 1,500,000 | | | 1.375%, 4/1/2018 | | | 1,476,810 | |
| | | | SABMiller Holdings, Inc. | | | | |
| | 2,000,000 | | | 2.450%, 1/15/2017d | | | 2,065,300 | |
| | | | Sanofi | | | | |
| | 1,500,000 | | | 1.250%, 4/10/2018 | | | 1,476,933 | |
| | | | Teva Pharmaceutical Finance III BV | | | | |
| | 2,000,000 | | | 0.750%, 3/21/2014g | | | 2,001,682 | |
| | | | Unilever Capital Corporation | | | | |
| | 2,000,000 | | | 2.200%, 3/6/2019 | | | 2,030,190 | |
| | | | | |
| | | | Total | | | 34,043,445 | |
| | | | | |
| |
| Energy (1.7%) | | | | |
| | | | BP Capital Markets plc | | | | |
| | 2,000,000 | | | 1.846%, 5/5/2017 | | | 2,034,424 | |
| | | | Cameron International Corporation | | | | |
| | 2,000,000 | | | 1.191%, 6/2/2014g | | | 2,007,362 | |
| | | | Chevron Corporation | | | | |
| | 3,000,000 | | | 1.718%, 6/24/2018 | | | 3,004,842 | |
| | | | International Petroleum Investment Company, Ltd. | | | | |
| | 1,000,000 | | | 3.125%, 11/15/2015d | | | 1,035,000 | |
| | | | Kinder Morgan Energy Partners, LP | | | | |
| | 3,000,000 | | | 2.650%, 2/1/2019 | | | 3,010,029 | |
| | | | Petroleos Mexicanos | | | | |
| | 1,500,000 | | | 2.266%, 7/18/2018g | | | 1,546,875 | |
| | 750,000 | | | 3.500%, 7/18/2018 | | | 766,875 | |
| | | | Weatherford International, Ltd. | | | | |
| | 1,000,000 | | | 6.000%, 3/15/2018 | | | 1,127,802 | |
| | | | | |
| | | | Total | | | 14,533,209 | |
| | | | | |
| |
| Financials (22.8%) | | | | |
| | | | Achmea Hypotheekbank NV | | | | |
| | 443,000 | | | 3.200%, 11/3/2014d | | | 455,466 | |
| | | | American International Group, Inc. | | | | |
| | 1,500,000 | | | 5.050%, 10/1/2015 | | | 1,615,935 | |
| | | | American Tower Trust I | | | | |
| | 1,000,000 | | | 1.551%, 3/15/2018d | | | 980,800 | |
| | | | Australia and New Zealand Banking Group, Ltd. | | | | |
| | 3,500,000 | | | 2.400%, 11/23/2016d | | | 3,643,500 | |
| | | | Aviation Capital Group Corporation | | | | |
| | 1,100,000 | | | 3.875%, 9/27/2016d | | | 1,113,533 | |
| | | | Bank Nederlandse Gemeenten NV | | | | |
| | 1,000,000 | | | 1.375%, 3/19/2018d | | | 992,600 | |
| | | | Bank of America Corporation | | | | |
| | 1,125,000 | | | 1.500%, 10/9/2015 | | | 1,134,695 | |
| | 1,000,000 | | | 5.625%, 10/14/2016 | | | 1,120,836 | |
| | 1,000,000 | | | 1.320%, 3/22/2018g,i | | | 1,011,597 | |
| | | | Bank of Montreal | | | | |
| | 3,250,000 | | | 2.625%, 1/25/2016d | | | 3,392,675 | |
| | 1,500,000 | | | 0.843%, 4/9/2018g | | | 1,502,708 | |
| | | | Bank of New York Mellon Corporation | | | | |
| | 1,600,000 | | | 1.112%, 11/24/2014g | | | 1,612,128 | |
| | 1,600,000 | | | 1.700%, 11/24/2014 | | | 1,621,461 | |
| | 500,000 | | | 4.500%, 12/31/2049j | | | 456,250 | |
| | | | Bank of Nova Scotia | | | | |
| | 2,000,000 | | | 2.150%, 8/3/2016d | | | 2,074,454 | |
| | | | Barclays Bank plc | | | | |
| | 3,000,000 | | | 2.500%, 9/21/2015d | | | 3,101,853 | |
| | | | BBVA Banco Continental SA | | | | |
| | 2,000,000 | | | 2.250%, 7/29/2016d | | | 1,995,000 | |
| | | | Bear Stearns Companies, LLC | | | | |
| | 1,500,000 | | | 6.400%, 10/2/2017 | | | 1,754,241 | |
| | | | Berkshire Hathaway Finance Corporation | | | | |
| | 2,000,000 | | | 2.450%, 12/15/2015 | | | 2,078,048 | |
| | | | Caisse Centrale Desjardins du Quebec | | | | |
| | 2,000,000 | | | 2.550%, 3/24/2016d,i | | | 2,087,400 | |
| | | | Canadian Imperial Bank of Commerce | | | | |
| | 3,500,000 | | | 0.900%, 9/19/2014d | | | 3,519,600 | |
| | 1,500,000 | | | 2.600%, 7/2/2015d | | | 1,552,650 | |
| | | | Capital One Financial Corporation | | | | |
| | 2,000,000 | | | 1.394%, 7/15/2014g | | | 2,009,726 | |
| | | | CDP Financial, Inc. | | | | |
| | 4,000,000 | | | 3.000%, 11/25/2014d | | | 4,107,928 | |
| | | | Chesapeake Funding, LLC | | | | |
| | 2,000,000 | | | 0.624%, 5/7/2024d,g | | | 1,996,456 | |
| | 2,000,000 | | | 0.624%, 1/7/2025d,g | | | 1,994,678 | |
| | | | CNA Financial Corporation | | | | |
| | 2,000,000 | | | 6.500%, 8/15/2016 | | | 2,261,878 | |
| | | | CoBank ACB | | | | |
| | 1,635,000 | | | 0.854%, 6/15/2022f,g | | | 1,496,025 | |
| | | | Commonwealth Bank of Australia | | | | |
| | 3,500,000 | | | 0.750%, 1/15/2016d | | | 3,498,950 | |
| | | | Cooperatieve Centrale Raiffeisen- Boerenleenbank BA | | | | |
| | 2,000,000 | | | 3.200%, 3/11/2015d | | | 2,069,330 | |
| | | | Credit Agricole Home Loan SFH | | | | |
| | 3,500,000 | | | 0.992%, 7/21/2014d,g | | | 3,512,421 | |
The accompanying Notes to Financial Statements are an integral part of this schedule.
243
Limited Maturity Bond Fund
Schedule of Investments as of October 31, 2013
| | | | | | | | |
Principal
Amount | | | Long-Term Fixed Income (93.1%) | | Value | |
| Financials (22.8%) - continued | | | | |
| | | | Credit Suisse AG Guernsey | | | | |
| $ | 1,000,000 | | | 1.625%, 3/6/2015d | | $ | 1,014,600 | |
| | 1,000,000 | | | 2.600%, 5/27/2016d | | | 1,043,983 | |
| | | | Credit Suisse Group AG | | | | |
| | 1,500,000 | | | 6.500%, 8/8/2023d | | | 1,601,100 | |
| | | | DnB Boligkreditt AS | | | | |
| | 3,500,000 | | | 1.450%, 3/21/2018d | | | 3,468,500 | |
| | | | General Electric Capital Corporation | | | | |
| | 3,500,000 | | | 1.254%, 3/15/2023g | | | 3,469,400 | |
| | | | Goldman Sachs Group, Inc. | | | | |
| | 2,750,000 | | | 2.375%, 1/22/2018 | | | 2,765,801 | |
| | | | HCP, Inc. | | | | |
| | 2,000,000 | | | 2.700%, 2/1/2014 | | | 2,009,530 | |
| | | | HSBC Bank plc | | | | |
| | 4,000,000 | | | 1.625%, 7/7/2014d,i | | | 4,036,852 | |
| | | | ING Bank NV | | | | |
| | 3,500,000 | | | 2.500%, 1/14/2016d | | | 3,617,250 | |
| | 500,000 | | | 2.625%, 12/5/2022d | | | 471,734 | |
| | | | ING Capital Funding Trust III | | | | |
| | 715,000 | | | 3.848%, 12/29/2049g,j | | | 706,062 | |
| | | | ING US, Inc. | | | | |
| | 500,000 | | | 5.650%, 5/15/2053 | | | 475,817 | |
| | 1,500,000 | | | 2.900%, 2/15/2018 | | | 1,530,842 | |
| | | | International Lease Finance Corporation | | | | |
| | 700,000 | | | 8.625%, 9/15/2015 | | | 778,750 | |
| | | | J.P. Morgan Chase & Company | | | | |
| | 1,000,000 | | | 0.689%, 4/23/2015g | | | 1,001,982 | |
| | 3,100,000 | | | 1.138%, 1/25/2018g | | | 3,123,467 | |
| | 1,075,000 | | | 7.900%, 4/29/2049j | | | 1,185,187 | |
| | 375,000 | | | 6.000%, 12/29/2049i,j | | | 362,813 | |
| | | | J.P. Morgan Chase Bank NA | | | | |
| | 1,000,000 | | | 5.875%, 6/13/2016 | | | 1,118,017 | |
| | | | Kilroy Realty, LP | | | | |
| | 700,000 | | | 3.800%, 1/15/2023 | | | 666,278 | |
| | | | Landwirtschaftliche Rentenbank | | | | |
| | 5,000,000 | | | 0.454%, 3/15/2016d,g | | | 5,018,000 | |
| | | | Lloyds TSB Bank plc | | | | |
| | 300,000 | | | 6.500%, 9/14/2020d | | | 338,950 | |
| | | | Macquarie Bank, Ltd. | | | | |
| | 1,750,000 | | | 5.000%, 2/22/2017d | | | 1,919,050 | |
| | | | MassMutual Global Funding II | | | | |
| | 2,500,000 | | | 2.000%, 4/5/2017d | | | 2,538,040 | |
| | | | Metropolitan Life Global Funding I | | | | |
| | 2,250,000 | | | 3.650%, 6/14/2018d | | | 2,410,477 | |
| | | | Morgan Stanley | | | | |
| | 825,000 | | | 4.100%, 5/22/2023 | | | 796,908 | |
| | | | Morgan Stanley Mortgage Loan Trust | | | | |
| | 2,000,000 | | | 5.750%, 10/18/2016 | | | 2,243,594 | |
| | | | National Australia Bank, Ltd. | | | | |
| | 1,750,000 | | | 0.541%, 1/22/2015d,g | | | 1,754,459 | |
| | 2,750,000 | | | 2.000%, 6/20/2017d | | | 2,819,850 | |
| | | | National Bank of Canada | | | | |
| | 1,750,000 | | | 2.200%, 10/19/2016d | | | 1,817,725 | |
| | | | NCUA Guaranteed Notes | | | | |
| | 2,527,462 | | | 0.524%, 12/7/2020g | | | 2,534,496 | |
| | | | Nederlandse Waterschapsbank NV | | | | |
| | 1,750,000 | | | 0.750%, 3/29/2016d | | | 1,753,052 | |
| | | | Network Rail Infrastructure Finance plc | | | | |
| | 4,000,000 | | | 0.875%, 5/15/2018d | | | 3,911,480 | |
| | | | New York Life Global Funding | | | | |
| | 4,000,000 | | | 3.000%, 5/4/2015d | | | 4,146,100 | |
| | | | Norddeutsche Landesbank Girozentrale | | | | |
| | 3,000,000 | | | 0.875%, 10/16/2015d | | | 3,011,400 | |
| | | | Nordea Bank AB | | | | |
| | 2,000,000 | | | 3.125%, 3/20/2017d | | | 2,103,200 | |
| | | | North American Development Bank | | | | |
| | 1,750,000 | | | 2.300%, 10/10/2018 | | | 1,756,125 | |
| | | | Principal Life Global Funding II | | | | |
| | 2,250,000 | | | 1.000%, 12/11/2015d | | | 2,254,799 | |
| | | | Private Export Funding Corporation | | | | |
| | 3,000,000 | | | 2.125%, 7/15/2016 | | | 3,126,435 | |
| | | | Prudential Covered Trust | | | | |
| | 2,337,500 | | | 2.997%, 9/30/2015d | | | 2,418,639 | |
| | | | Rabobank Capital Funding Trust II | | | | |
| | 1,012,000 | | | 5.260%, 12/29/2049d,j | | | 1,015,340 | |
| | | | Realty Income Corporation | | | | |
| | 1,000,000 | | | 2.000%, 1/31/2018 | | | 986,311 | |
| | | | Royal Bank of Canada | | | | |
| | 3,000,000 | | | 1.200%, 9/19/2017 | | | 2,992,506 | |
| | | | Royal Bank of Scotland Group plc | | | | |
| | 700,000 | | | 6.125%, 12/15/2022 | | | 723,712 | |
| | | | Santander UK plc | | | | |
| | 500,000 | | | 5.000%, 11/7/2023c,d,k | | | 498,405 | |
| | | | Skandinaviska Enskilda Banken AB | | | | |
| | 1,700,000 | | | 1.750%, 3/19/2018d | | | 1,677,968 | |
| | 2,500,000 | | | 1.375%, 5/29/2018d | | | 2,466,750 | |
| | | | SLM Corporation | | | | |
| | 500,000 | | | 4.625%, 9/25/2017 | | | 518,750 | |
| | | | SpareBank 1 Boligkreditt AS | | | | |
| | 2,500,000 | | | 1.250%, 5/2/2018d | | | 2,448,500 | |
| | | | Stadshypotek AB | | | | |
| | 2,000,000 | | | 1.875%, 10/2/2019d | | | 1,961,870 | |
| | | | Standard Chartered plc | | | | |
| | 1,000,000 | | | 3.950%, 1/11/2023d | | | 959,435 | |
| | | | Svensk Exportkredit AB | | | | |
| | 2,500,000 | | | 0.539%, 1/23/2017g | | | 2,508,300 | |
| | 1,500,000 | | | 1.125%, 4/5/2018i | | | 1,479,555 | |
| | | | Svenska Handelsbanken AB | | | | |
| | 2,250,000 | | | 0.700%, 3/21/2016g | | | 2,257,016 | |
| | | | Swedbank AB | | | | |
| | 1,750,000 | | | 1.750%, 3/12/2018d | | | 1,731,153 | |
| | | | Swedbank Hypotek AB | | | | |
| | 3,500,000 | | | 0.698%, 3/28/2014d,g | | | 3,506,198 | |
| | | | Toronto-Dominion Bank | | | | |
| | 2,500,000 | | | 2.200%, 7/29/2015d | | | 2,574,000 | |
| | 2,500,000 | | | 0.716%, 9/9/2016g | | | 2,510,623 | |
| | | | U.S. Bank National Association | | | | |
| | 3,000,000 | | | 3.778%, 4/29/2020 | | | 3,123,387 | |
| | | | UBS AG/London | | | | |
| | 3,500,000 | | | 1.875%, 1/23/2015d | | | 3,558,450 | |
| | | | Union Bank NA | | | | |
| | 1,550,000 | | | 1.500%, 9/26/2016 | | | 1,567,692 | |
| | | | UnitedHealth Group, Inc. | | | | |
| | 1,800,000 | | | 1.400%, 10/15/2017 | | | 1,800,617 | |
| | | | Ventas Realty, LP | | | | |
| | 1,000,000 | | | 2.700%, 4/1/2020 | | | 970,172 | |
| | | | Wachovia Corporation | | | | |
| | 1,000,000 | | | 0.524%, 6/15/2017g | | | 990,085 | |
The accompanying Notes to Financial Statements are an integral part of this schedule.
244
Limited Maturity Bond Fund
Schedule of Investments as of October 31, 2013
| | | | | | | | |
Principal
Amount | | | Long-Term Fixed Income (93.1%) | | Value | |
| Financials (22.8%) - continued | | | | |
| | | | WEA Finance, LLC/WT Finance Australia, Pty, Ltd. | | | | |
| | $1,650,000 | | | 5.750%, 9/2/2015d | | | $1,791,450 | |
| | | | Wells Fargo & Company | | | | |
| | 2,500,000 | | | 2.625%, 12/15/2016 | | | 2,618,922 | |
| | 925,000 | | | 3.450%, 2/13/2023 | | | 880,117 | |
| | | | Westpac Banking Corporation | | | | |
| | 2,500,000 | | | 1.250%, 12/15/2017d | | | 2,476,250 | |
| | | | | |
| | | | Total | | | 197,479,100 | |
| | | | | |
| |
| Foreign Government (5.6%) | | | | |
| | | | Asian Development Bank | | | | |
| | 1,000,000 | | | 0.500%, 6/20/2016 | | | 999,700 | |
| | | | Canada Government International Bond | | | | |
| | 5,500,000 | | | 0.875%, 2/14/2017 | | | 5,521,153 | |
| | | | Eksportfinans ASA | | | | |
| | 1,500,000 | | | 2.375%, 5/25/2016 | | | 1,461,750 | |
| | | | European Investment Bank | | | | |
| | 4,000,000 | | | 1.750%, 3/15/2017 | | | 4,114,140 | |
| | | | Export Development Canada | | | | |
| | 3,500,000 | | | 0.750%, 12/15/2017i | | | 3,451,035 | |
| | | | Hydro Quebec | | | | |
| | 2,000,000 | | | 2.000%, 6/30/2016 | | | 2,063,800 | |
| | | | Inter-American Development Bank | | | | |
| | 2,750,000 | | | 0.217%, 2/11/2016g | | | 2,749,318 | |
| | | | International Finance Corporation | | | | |
| | 3,000,000 | | | 0.500%, 5/16/2016 | | | 2,999,328 | |
| | | | Japan Bank for International Cooperation | | | | |
| | 3,000,000 | | | 1.750%, 7/31/2018 | | | 3,007,320 | |
| | | | Kommunalbanken AS | | | | |
| | 4,000,000 | | | 2.750%, 5/5/2015d | | | 4,141,520 | |
| | | | Kommuninvest I Sverige AB | | | | |
| | 2,500,000 | | | 1.000%, 10/24/2017d | | | 2,484,000 | |
| | | | Mexico Government International Bond | | | | |
| | 750,000 | | | 5.125%, 1/15/2020 | | | 845,625 | |
| | | | Province of British Columbia | | | | |
| | 3,500,000 | | | 2.100%, 5/18/2016 | | | 3,632,650 | |
| | | | Province of Manitoba | | | | |
| | 3,000,000 | | | 1.300%, 4/3/2017 | | | 3,035,577 | |
| | | | Province of Ontario | | | | |
| | 2,500,000 | | | 0.315%, 8/13/2015g | | | 2,498,243 | |
| | 2,000,000 | | | 1.000%, 7/22/2016 | | | 2,013,068 | |
| | | | Sweden Government International Bond | | | | |
| | 3,150,000 | | | 0.375%, 3/29/2016d | | | 3,143,385 | |
| | | | | |
| | | | Total | | | 48,161,612 | |
| | | | | |
| |
| MM-Other Note (0.3%) | | | | |
| | | | John Deere Capital Corporation | | | | |
| | 3,000,000 | | | 0.343%, 10/8/2014g | | | 3,001,938 | |
| | | | | |
| | | | Total | | | 3,001,938 | |
| | | | | |
| |
| Mortgage-Backed Securities (7.6%) | | | | |
| | | | Federal Home Loan Mortgage Corporation Gold 15-Yr. Pass Through | | | | |
| | 19,840,000 | | | 3.000%, 12/1/2028c | | | 20,509,600 | |
| | | | Federal Home Loan Mortgage Corporation Gold 30-Yr. Pass Through | | | | |
| | 612,276 | | | 6.500%, 9/1/2037 | | | 689,270 | |
| | | | Federal National Mortgage Association | | | | |
| | 4,471,418 | | | 2.074%, 1/1/2043g | | | 4,566,466 | |
| | 7,852,520 | | | 2.060%, 3/1/2043g | | | 8,026,702 | |
| | 6,765,059 | | | 1.754%, 7/1/2043g | | | 6,822,557 | |
| | | | Federal National Mortgage Association Conventional 15- Yr. Pass Through | | | | |
| | 3,983,899 | | | 2.250%, 6/25/2025 | | | 4,066,637 | |
| | 6,000,000 | | | 2.500%, 11/1/2028c | | | 6,062,813 | |
| | 11,900,000 | | | 3.500%, 11/1/2028c | | | 12,564,727 | |
| | | | Federal National Mortgage Association Conventional 20- Yr. Pass Through | | | | |
| | 985,492 | | | 6.000%, 8/1/2024 | | | 1,088,138 | |
| | | | Federal National Mortgage Association Conventional 30- Yr. Pass Through | | | | |
| | 834,654 | | | 5.825%, 9/1/2037g | | | 898,623 | |
| | 452,050 | | | 5.560%, 10/1/2037g | | | 486,167 | |
| | | | | |
| | | | Total | | | 65,781,700 | |
| | | | | |
| |
| Technology (1.0%) | | | | |
| | | | Affiliated Computer Services, Inc. | | | | |
| | 1,000,000 | | | 5.200%, 6/1/2015 | | | 1,058,923 | |
| | | | Apple, Inc. | | | | |
| | 2,500,000 | | | 1.000%, 5/3/2018 | | | 2,427,662 | |
| | 500,000 | | | 2.400%, 5/3/2023 | | | 456,912 | |
| | | | Oracle Corporation | | | | |
| | 325,000 | | | 1.200%, 10/15/2017 | | | 320,774 | |
| | 2,250,000 | | | 2.375%, 1/15/2019 | | | 2,285,719 | |
| | | | Xerox Corporation | | | | |
| | 2,000,000 | | | 1.083%, 5/16/2014g | | | 2,002,870 | |
| | | | | |
| | | | Total | | | 8,552,860 | |
| | | | | |
| |
| Transportation (1.6%) | | | | |
| | | | American Airlines Pass Through Trust | | | | |
| | 1,500,000 | | | 4.950%, 1/15/2023d | | | 1,545,000 | |
| | | | British Airways plc | | | | |
| | 1,500,000 | | | 4.625%, 6/20/2024d | | | 1,560,000 | |
| | | | Canadian National Railway Company | | | | |
| | 1,670,000 | | | 0.438%, 11/6/2015c,g | | | 1,669,334 | |
| | | | Continental Airlines, Inc. | | | | |
| | 1,950,781 | | | 4.150%, 4/11/2024 | | | 1,926,397 | |
| | | | CSX Corporation | | | | |
| | 1,500,000 | | | 6.250%, 4/1/2015 | | | 1,614,524 | |
| | 400,000 | | | 3.700%, 11/1/2023 | | | 399,220 | |
| | | | Delta Air Lines, Inc. | | | | |
| | 723,219 | | | 4.750%, 5/7/2020 | | | 762,996 | |
| | | | Kansas City Southern de Mexico SA de CV | | | | |
| | 1,555,000 | | | 0.937%, 10/28/2016d,g | | | 1,557,324 | |
| | | | TTX Company | | | | |
| | 650,000 | | | 4.125%, 10/1/2023d | | | 662,253 | |
| | | | US Airways Pass Through Trust | | | | |
| | 1,000,000 | | | 3.950%, 11/15/2025 | | | 948,125 | |
The accompanying Notes to Financial Statements are an integral part of this schedule.
245
Limited Maturity Bond Fund
Schedule of Investments as of October 31, 2013
| | | | | | | | |
Principal
Amount | | | Long-Term Fixed Income (93.1%) | | Value | |
| Transportation (1.6%) - continued | | | | |
| | | | Virgin Australia Holdings, Ltd. | | | | |
| | $1,475,000 | | | 5.000%, 10/23/2023d | | | $1,511,875 | |
| | | | | |
| | | | Total | | | 14,157,048 | |
| | | | | |
| |
| U.S. Government and Agencies (19.0%) | | | | |
| | | | Federal Agricultural Mortgage Corporation | | | | |
| | 2,500,000 | | | 2.125%, 9/15/2015 | | | 2,581,442 | |
| | 2,500,000 | | | 2.000%, 7/27/2016 | | | 2,587,217 | |
| | | | Federal Home Loan Mortgage Corporation | | | | |
| | 750,000 | | | 1.250%, 8/1/2019 | | | 725,264 | |
| | 3,050,000 | | | 1.250%, 10/2/2019 | | | 2,935,015 | |
| | | | Federal National Mortgage Association | | | | |
| | 11,600,000 | | | 0.375%, 7/5/2016 | | | 11,536,977 | |
| | 3,000,000 | | | 0.875%, 2/8/2018 | | | 2,952,861 | |
| | | | U.S. Treasury Bonds | | | | |
| | 1,790,000 | | | 3.000%, 5/15/2042 | | | 1,586,946 | |
| | | | U.S. Treasury Bonds, TIPS | | | | |
| | 3,104,967 | | | 0.750%, 2/15/2042 | | | 2,682,644 | |
| | | | U.S. Treasury Notes | | | | |
| | 13,950,000 | | | 0.250%, 10/31/2014 | | | 13,967,438 | |
| | 19,575,000 | | | 0.375%, 2/15/2016 | | | 19,570,419 | |
| | 5,000,000 | | | 0.625%, 10/15/2016 | | | 5,008,595 | |
| | 115,000 | | | 1.000%, 10/31/2016 | | | 116,366 | |
| | 13,590,000 | | | 0.625%, 5/31/2017 | | | 13,492,315 | |
| | 45,400,000 | | | 0.875%, 1/31/2018 | | | 45,013,374 | |
| | 6,400,000 | | | 2.375%, 6/30/2018 | | | 6,738,502 | |
| | 2,715,000 | | | 1.375%, 1/31/2020 | | | 2,656,245 | |
| | 500,000 | | | 1.625%, 8/15/2022 | | | 469,688 | |
| | 1,050,000 | | | 1.750%, 5/15/2023 | | | 980,683 | |
| | | | U.S. Treasury Notes, TIPS | | | | |
| | 1,264,636 | | | 0.125%, 4/15/2018 | | | 1,308,208 | |
| | 6,949,144 | | | 1.125%, 1/15/2021 | | | 7,508,341 | |
| | 6,716,320 | | | 0.125%, 1/15/2022 | | | 6,661,750 | |
| | 13,171,587 | | | 0.125%, 1/15/2023 | | | 12,873,184 | |
| | | | | |
| | | | Total | | | 163,953,474 | |
| | | | | |
| |
| Utilities (0.8%) | | | | |
| | | | American Electric Power Company, Inc. | | | | |
| | 500,000 | | | 1.650%, 12/15/2017 | | | 493,884 | |
| | | | Dayton Power and Light Company | | | | |
| | 900,000 | | | 1.875%, 9/15/2016d | | | 908,245 | |
| | | | Electricite de France SA | | | | |
| | 1,000,000 | | | 5.250%, 1/29/2049d,j | | | 983,000 | |
| | | | Kansas City Power & Light Company | | | | |
| | 175,000 | | | 3.150%, 3/15/2023 | | | 166,194 | |
| | | | National Rural Utilities Cooperative Finance Corporation | | | | |
| | 850,000 | | | 4.750%, 4/30/2043 | | | 793,687 | |
| | | | Northeast Utilities | | | | |
| | 1,250,000 | | | 1.450%, 5/1/2018 | | | 1,223,739 | |
| | | | Sempra Energy | | | | |
| | 1,750,000 | | | 2.300%, 4/1/2017 | | | 1,793,893 | |
| | | | Spectra Energy Partners, LP | | | | |
| | 720,000 | | | 2.950%, 9/25/2018 | | | 736,521 | |
| | | | | |
| | | | Total | | | 7,099,163 | |
| | | | | |
| | | | | | | | |
| | | | | |
| | | | Total Long-Term Fixed Income (cost $805,543,350) | | | 804,691,140 | |
| | | | | |
| | |
| Shares | | | Preferred Stock (0.6%) | | Value | |
| Financials (0.4%) | | | | |
| | 26,000 | | | Discover Financial Services, | | | | |
| | | | 6.500%j | | | 621,920 | |
| | 7,350 | | | Farm Credit Bank of Texas, | | | | |
| | | | 6.750%d,j | | | 734,771 | |
| | 39,000 | | | HSBC Holdings plc, 8.000%j | | | 1,066,650 | |
| | 14,000 | | | The Allstate Corporation, 5.100% | | | 338,240 | |
| | 17,000 | | | The Goldman Sachs Group, Inc., | | | | |
| | | | 5.500%j | | | 388,110 | |
| | | | | |
| | | | Total | | | 3,149,691 | |
| | | | | |
| |
| Utilities (0.2%) | | | | |
| | 16,250 | | | Southern California Edison Company, 4.320%j | | | 1,640,743 | |
| | | | | |
| | | | Total | | | 1,640,743 | |
| | | | | |
| | | | | | | | |
| | | | | |
| | | | Total Preferred Stock (cost $4,746,772) | | | 4,790,434 | |
| | | | | |
| | |
| Contracts | | | Options Purchased (<0.1%) | | Value | |
| | | | 10-Yr. U.S. Treasury Bond Future Put Option | | | | |
| | 350 | | | $127.00, expires 11/22/2013 | | | 164,063 | |
| | | | | |
| | | | Total Options Purchased (cost $159,646) | | | 164,063 | |
| | | | | |
| | |
| Shares | | | Collateral Held for Securities Loaned (1.0%) | | Value | |
| | 8,269,685 | | | Thrivent Cash Management Trust | | | 8,269,685 | |
| | | | | |
| | | | Total Collateral Held for Securities Loaned (cost $8,269,685) | | | 8,269,685 | |
| | | | | |
| | |
Shares or
Principal
Amount | | | Short-Term Investments (5.3%) | | Value | |
| | | | Federal Home Loan Bank Discount Notes | | | | |
| | 900,000 | | | 0.093%, 11/22/2013l,m | | | 899,951 | |
| | | | Federal Home Loan Mortgage Corporation Discount Notes | | | | |
| | 900,000 | | | 0.045%, 12/16/2013l,m | | | 899,949 | |
| | | | Thrivent Cash Management Trust | | | | |
| | 42,812,455 | | | 0.070% | | | 42,812,455 | |
| | | | U.S. Treasury Bills | | | | |
| | 1,000,000 | | | 0.070%, 4/24/2014l,n | | | 999,662 | |
| | | | | |
| | | | Total Short-Term | | | | |
| | | | | |
| | | | Investments (at amortized cost) | | | 45,612,017 | |
| | | | | |
| | | | Total Investments (cost $910,062,207) 105.3% | | $ | 909,325,059 | |
| | | | | |
| | | | Other Assets and Liabilities, Net (5.3%) | | | (45,626,440 | ) |
| | | | | |
| | | | Total Net Assets 100.0% | | $ | 863,698,619 | |
| | | | | |
The accompanying Notes to Financial Statements are an integral part of this schedule.
246
Limited Maturity Bond Fund
Schedule of Investments as of October 31, 2013
a | The stated interest rate represents the weighted average of all contracts within the bank loan facility. |
b | All or a portion of the loan is unfunded. |
c | Denotes investments purchased on a when-issued or delayed delivery basis. |
d | Denotes securities sold under Rule 144A of the Securities Act of 1933, which exempts them from registration. These securities have been deemed liquid and may be resold to other dealers in the program or to other qualified institutional buyers. As of October 31, 2013, the value of these investments was $245,699,112 or 28.4% of total net assets. |
e | All or a portion of the security is insured or guaranteed. |
f | Denotes restricted securities. Restricted securities are investment securities which have been deemed illiquid and cannot be offered for public sale without first being registered under the Securities Act of 1933. The following table indicates the acquisition date and cost of restricted securities Limited Maturity Bond Fund owned as of October 31, 2013. |
| | | | | | | | |
Security | | Acquisition
Date | | | Cost | |
CoBank ACB | | | 10/18/2013 | | | | $1,503,770 | |
Edlinc Student Loan Funding Trust | | | 11/30/2012 | | | | $2,405,805 | |
First Franklin Mortgage Loan Asset-Backed Certificates | | | 4/19/2006 | | | | $85,895 | |
Mortgage Equity Conversion Asset Trust | | | 2/14/2007 | | | | $2,306,250 | |
Mortgage Equity Conversion Asset Trust | | | 1/18/2007 | | | | $2,342,168 | |
Wachovia Asset Securitization, Inc. | | | 3/16/2007 | | | | $695,644 | |
g | Denotes variable rate securities. Variable rate securities are securities whose yields vary with a designated market index or market rate. The rate shown is as of October 31, 2013. |
h | Defaulted security. Interest is not being accrued. |
i | All or a portion of the security is on loan. |
j | Denotes perpetual securities. Perpetual securities pay an indefinite stream of interest, but may be called by the issuer at an earlier date. |
k | Security is fair valued. |
l | The interest rate shown reflects the yield, coupon rate or the discount rate at the date of purchase. |
m | At October 31, 2013, $1,499,917 of investments were held on deposit with the counterparty and pledged as the initial margin deposit for open futures contracts. |
n | At October 31, 2013, $699,763 of investments were pledged as collateral with the custodian under the agreement between the counterparty, the custodian and the fund for open swap contracts. |
Definitions:
| | | | |
| | TIPS | | - Treasury Inflation Protected Security. |
Unrealized Appreciation (Depreciation)
Gross unrealized appreciation and depreciation of investments, based on cost for federal income tax purposes, were as follows:
| | | | |
Gross unrealized appreciation | | | $11,028,942 | |
Gross unrealized depreciation | | | (11,775,098 | ) |
| | | | |
Net unrealized appreciation (depreciation) | | | ($746,156 | ) |
| |
Cost for federal income tax purposes | | $ | 910,071,215 | |
The accompanying Notes to Financial Statements are an integral part of this schedule.
247
Limited Maturity Bond Fund
Schedule of Investments as of October 31, 2013
Fair Valuation Measurements
The following table is a summary of the inputs used, as of October 31, 2013, in valuing Limited Maturity Bond Fund’s assets carried at fair value.
| | | | | | | | | | | | | | | | |
Investments in Securities | | Total | | | Level 1 | | | Level 2 | | | Level 3 | |
| | | | |
Bank Loans | | | | | | | | | | | | | | | | |
Basic Materials | | | 1,813,493 | | | | – | | | | 1,813,493 | | | | – | |
Capital Goods | | | 2,755,779 | | | | – | | | | 2,755,779 | | | | – | |
Communications Services | | | 16,324,607 | | | | – | | | | 16,324,607 | | | | – | |
Consumer Cyclical | | | 8,129,058 | | | | – | | | | 8,129,058 | | | | – | |
Consumer Non-Cyclical | | | 5,559,705 | | | | – | | | | 5,559,705 | | | | – | |
Energy | | | 1,807,319 | | | | – | | | | 1,807,319 | | | | – | |
Financials | | | 1,638,613 | | | | – | | | | 1,638,613 | | | | – | |
Technology | | | 3,335,328 | | | | – | | | | 3,335,328 | | | | – | |
Transportation | | | 2,660,389 | | | | – | | | | 2,660,389 | | | | – | |
Utilities | | | 1,773,429 | | | | – | | | | 1,773,429 | | | | – | |
| | | | |
Long-Term Fixed Income | | | | | | | | | | | | | | | | |
Asset-Backed Securities | | | 111,459,725 | | | | – | | | | 102,922,134 | | | | 8,537,591 | |
Basic Materials | | | 6,904,381 | | | | – | | | | 6,904,381 | | | | – | |
Capital Goods | | | 6,536,873 | | | | – | | | | 6,536,873 | | | | – | |
Collateralized Mortgage Obligations | | | 25,826,438 | | | | – | | | | 25,826,438 | | | | – | |
Commercial Mortgage-Backed Securities | | | 54,931,755 | | | | – | | | | 54,931,755 | | | | – | |
Communications Services | | | 21,799,644 | | | | – | | | | 21,799,644 | | | | – | |
Consumer Cyclical | | | 20,468,775 | | | | – | | | | 20,468,775 | | | | – | |
Consumer Non-Cyclical | | | 34,043,445 | | | | – | | | | 34,043,445 | | | | – | |
Energy | | | 14,533,209 | | | | – | | | | 14,533,209 | | | | – | |
Financials | | | 197,479,100 | | | | – | | | | 195,983,075 | | | | 1,496,025 | |
Foreign Government | | | 48,161,612 | | | | – | | | | 48,161,612 | | | | – | |
MM-Other Note | | | 3,001,938 | | | | – | | | | 3,001,938 | | | | – | |
Mortgage-Backed Securities | | | 65,781,700 | | | | – | | | | 65,781,700 | | | | – | |
Technology | | | 8,552,860 | | | | – | | | | 8,552,860 | | | | – | |
Transportation | | | 14,157,048 | | | | – | | | | 14,157,048 | | | | – | |
U.S. Government and Agencies | | | 163,953,474 | | | | – | | | | 163,953,474 | | | | – | |
Utilities | | | 7,099,163 | | | | – | | | | 7,099,163 | | | | – | |
| | | | |
Preferred Stock | | | | | | | | | | | | | | | | |
Financials | | | 3,149,691 | | | | 2,414,920 | | | | 734,771 | | | | – | |
Utilities | | | 1,640,743 | | | | – | | | | 1,640,743 | | | | – | |
Options Purchased | | | 164,063 | | | | – | | | | 164,063 | | | | – | |
Collateral Held for Securities Loaned | | | 8,269,685 | | | | 8,269,685 | | | | – | | | | – | |
Short-Term Investments | | | 45,612,017 | | | | 42,812,455 | | | | 2,799,562 | | | | – | |
| |
Total | | | $909,325,059 | | | | $53,497,060 | | | | $845,794,383 | | | | $10,033,616 | |
| |
| | | | |
Other Financial Instruments | | Total | | | Level 1 | | | Level 2 | | | Level 3 | |
| | | | |
Asset Derivatives | | | | | | | | | | | | | | | | |
Futures Contracts | | | 34,735 | | | | 34,735 | | | | – | | | | – | |
Credit Default Swaps | | | 39,945 | | | | – | | | | 39,945 | | | | – | |
| |
Total Asset Derivatives | | | $74,680 | | | | $34,735 | | | | $39,945 | | | | $– | |
| |
| | | | |
Liability Derivatives | | | | | | | | | | | | | | | | |
Futures Contracts | | | 2,133,409 | | | | 2,133,409 | | | | – | | | | – | |
| |
Total Liability Derivatives | | | $2,133,409 | | | | $2,133,409 | | | | $– | | | | $– | |
| |
There were no significant transfers between Levels during the period ended October 31, 2013. Transfers between Levels are identified as of the end of the period.
The accompanying Notes to Financial Statements are an integral part of this schedule.
248
Limited Maturity Bond Fund
Schedule of Investments as of October 31, 2013
| | | | | | | | | | | | | | | | | | | | |
Futures Contracts | | Number of
Contracts
Long/(Short) | | | Expiration
Date | | | Notional
Principal
Amount | | | Value | | | Unrealized
Gain/(Loss) | |
5-Yr. U.S. Treasury Bond Futures | | | (730 | ) | | | December 2013 | | | | ($87,272,697 | ) | | | ($88,831,875 | ) | | | ($1,559,178 | ) |
10-Yr. U.S. Treasury Bond Futures | | | (260 | ) | | | December 2013 | | | | (32,539,207 | ) | | | (33,113,438 | ) | | | (574,231 | ) |
30-Yr. U.S. Treasury Bond Futures | | | 10 | | | | December 2013 | | | | 1,313,390 | | | | 1,348,125 | | | | 34,735 | |
Total Futures Contracts | | | | | | | | | | | | | | | | | | | ($2,098,674 | ) |
| | | | | | | | | | | | | | | | | | |
Credit Default Swaps and Counterparty | | Buy/Sell Protection1 | | Termination
Date | | | Notional
Principal Amount2 | | | Value3 | | | Unrealized Gain/(Loss) | |
CDX HY 21, 5 Year, at 5.00%; JP Morgan | | Buy | | | 12/20/2018 | | | | $18,000,000 | | | | $39,945 | | | | $39,945 | |
Total Credit Default Swaps | | | | | | | | | | | | | $39,945 | | | | $39,945 | |
1 | As the buyer of protection, Limited Maturity Bond Fund pays periodic fees in return for payment by the seller which is contingent upon an adverse credit event occurring in the underlying issuer or reference entity. As the seller of protection, Limited Maturity Bond Fund collects periodic fees from the buyer and profits if the credit of the underlying issuer or reference entity remains stable or improves while the swap is outstanding, but the seller in a credit default swap contract would be required to pay the amount of credit loss, determined as specified in the agreement, to the buyer in the event of an adverse credit event in the reference entity. |
2 | The maximum potential amount of future payments Limited Maturity Bond Fund could be required to make as the seller or receive as the buyer of protection. |
3 | The values for credit indexes (CDX or LCDX) serve as an indicator of the current status of the payment/performance risk and represent the liability or profit for the credit default swap contract had the contract been closed as of the reporting date. When protection has been sold, the value of the swap will increase when the swap spread declines representing an improvement in the reference entity’s credit worthiness. The value of the swap will decrease when the swap spread increases representing a deterioration in the reference entity’s credit worthiness. When protection has been purchased, the value of the swap will increase when the swap spread increases representing a deterioration in the reference entity’s credit worthiness. The value of the swap will decrease when the swap spread declines representing an improvement in the reference entity’s credit worthiness. |
The following table summarizes the fair value and Statement of Assets and Liabilities location, as of October 31, 2013, for Limited Maturity Bond Fund’s investments in financial derivative instruments by primary risk exposure as discussed under item (2) Significant Accounting Policies of the Notes to Financial Statements.
| | | | | | |
Derivatives by risk category | | Statement of Assets and Liabilities Location | | Fair Value | |
| | |
Asset Derivatives | | | | | | |
| | |
Interest Rate Contracts | | | | | | |
Futures* | | Net Assets - Net unrealized appreciation/(depreciation) on Futures contracts | | | 34,735 | |
Options Purchased | | Investments in securities at value, Net Assets - Net unrealized appreciation/(depreciation) on Investments | | | 164,063 | |
| | |
Total Interest Rate Contracts | | | | | 198,798 | |
| | |
Credit Contracts | | | | | | |
Credit Default Swaps | | Receivable/Payable - Swap agreements, at value; Net Assets - Net unrealized appreciation/(depreciation) on Swap agreements | | | 39,945 | |
| | |
Total Credit Contracts | | | | | 39,945 | |
| |
Total Asset Derivatives | | | | | $238,743 | |
| |
| | |
Liability Derivatives | | | | | | |
| | |
Interest Rate Contracts | | | | | | |
Futures* | | Net Assets - Net unrealized appreciation/(depreciation) on Futures contracts | | | 2,133,409 | |
| | |
Total Interest Rate Contracts | | | | | 2,133,409 | |
| |
Total Liability Derivatives | | | | | $2,133,409 | |
| |
* | Includes cumulative appreciation/depreciation of futures contracts as reported in the Schedule of Investments. Only current day’s variation margin is reported within the Statement of Assets and Liabilities. |
The accompanying Notes to Financial Statements are an integral part of this schedule.
249
Limited Maturity Bond Fund
Schedule of Investments as of October 31, 2013
The following table summarizes the net realized gains/(losses) and Statement of Operations location, for the period ended October 31, 2013, for Limited Maturity Bond Fund’s investments in financial derivative instruments by primary risk exposure.
| | | | | | |
Derivatives by risk category | | Statement of Operations Location | | Realized Gains/(Losses)
recognized in Income | |
| | |
Interest Rate Contracts | | | | | | |
Futures | | Net realized gains/(losses) on Futures contracts | | | 3,214,074 | |
| | |
Total Interest Rate Contracts | | | | | 3,214,074 | |
| | |
Equity Contracts | | | | | | |
Options Purchased | | Net realized gains/(losses) on Investments | | | (95,071 | ) |
| | |
Total Equity Contracts | | | | | (95,071 | ) |
| | |
Credit Contracts | | | | | | |
Credit Default Swaps | | Net realized gains/(losses) on Swap agreements | | | (959,559 | ) |
| | |
Total Credit Contracts | | | | | (959,559 | ) |
| |
Total | | | | | $2,159,444 | |
| |
The following table summarizes the change in net unrealized appreciation/(depreciation) and Statement of Operations location, for the period ended October 31, 2013, for Limited Maturity Bond Fund’s investments in financial derivative instruments by primary risk exposure.
| | | | | | |
Derivatives by risk category | | Statement of Operations Location | | Change in unrealized
appreciation/(depreciation)
recognized in Income | |
| | |
Interest Rate Contracts | | | | | | |
Options Purchased | | Change in net unrealized appreciation/(depreciation) on Investments | | | 4,417 | |
Futures | | Change in net unrealized appreciation/(depreciation) on Futures contracts | | | (1,875,574 | ) |
| | |
Total Interest Rate Contracts | | | | | (1,871,157 | ) |
| | |
Credit Contracts | | | | | | |
Credit Default Swaps | | Change in net unrealized appreciation/(depreciation) on Swap agreements | | | 374,305 | |
| | |
Total Credit Contracts | | | | | 374,305 | |
| |
Total | | | | | ($1,496,852 | ) |
| |
The following table presents Limited Maturity Bond Fund’s average volume of derivative activity during the period ended October 31, 2013.
| | | | | | | | | | | | | | | | | | | | |
Derivative Risk Category | | Futures
(Notional*) | | | Futures
(Percentage
of Average
Net Assets) | | | Swaps
(Notional*) | | | Swaps
(Percentage
of Average
Net Assets) | | | Options
(Contracts) | |
Equity Contracts | | | N/A | | | | N/A | % | | | N/A | | | | N/A | | | | 13 | |
Interest Rate Contracts | | | $157,852,760 | | | | 17.7 | | | | N/A | | | | N/A | | | | N/A | |
Credit Contracts | | | N/A | | | | N/A | | | | $9,240,759 | | | | 1.0 | % | | | N/A | |
* | Notional amount represents long or short, or both, derivative positions held by the Fund. |
The accompanying Notes to Financial Statements are an integral part of this schedule.
250
Limited Maturity Bond Fund
Schedule of Investments as of October 31, 2013
Investment in Affiliates
Affiliated issuers, as defined under the Investment Company Act of 1940, include those in which the Fund’s holdings of an issuer represent 5% or more of the outstanding voting securities of an issuer, or any affiliated mutual fund.
A summary of transactions for the fiscal year to date, in Limited Maturity Bond Fund, is as follows:
| | | | | | | | | | | | | | | | | | | | | | | | |
Fund | | Value
October 31, 2012 | | | Gross
Purchases | | | Gross
Sales | | | Shares Held at
October 31, 2013 | | | Value
October 31, 2013 | | | Income Earned
November 1, 2012 -
October 31, 2013 | |
High Yield | | | $11,258,614 | | | | $– | | | | $11,237,011 | | | | – | | | | $– | | | | $440,544 | |
Cash Management Trust-Collateral Investment | | | 6,949,000 | | | | 137,878,965 | | | | 136,558,280 | | | | 8,269,685 | | | | 8,269,685 | | | | 41,447 | |
Cash Management Trust-Short Term Investment | | | 26,939,653 | | | | 335,804,047 | | | | 319,931,245 | | | | 42,812,455 | | | | 42,812,455 | | | | 37,324 | |
Total Value and Income Earned | | | 45,147,267 | | | | | | | | | | | | | | | | 51,082,140 | | | | 519,315 | |
The accompanying Notes to Financial Statements are an integral part of this schedule.
251
Money Market Fund
Schedule of Investments as of October 31, 2013
| | | | | | | | |
Principal
Amount | | | Asset Backed Commercial Paper (17.4%)a | | Value | |
| | | | Dealers Capital Access Trust, LLC | | | | |
| | $4,800,000 | | | 0.360%, 11/15/2013b | | | $4,799,328 | |
| | 4,820,000 | | | 0.300%, 11/20/2013b | | | 4,819,237 | |
| | 4,730,000 | | | 0.290%, 11/25/2013b | | | 4,729,086 | |
| | 2,620,000 | | | 0.340%, 12/3/2013b | | | 2,619,208 | |
| | 4,780,000 | | | 0.350%, 12/10/2013b | | | 4,778,188 | |
| | | | Golden Funding Corporation | | | | |
| | 3,237,000 | | | 0.170%, 11/4/2013b,c | | | 3,236,954 | |
| | 4,898,000 | | | 0.100%, 11/5/2013b,c | | | 4,897,946 | |
| | 4,800,000 | | | 0.190%, 11/18/2013b,c | | | 4,799,569 | |
| | 4,790,000 | | | 0.200%, 12/19/2013b,c | | | 4,788,723 | |
| | | | Nieuw Amsterdam Receivables | | | | |
| | 4,600,000 | | | 0.160%, 11/18/2013b,c | | | 4,599,652 | |
| | 4,700,000 | | | 0.200%, 1/8/2014b,c | | | 4,698,224 | |
| | | | Old Line Funding, LLC | | | | |
| | 4,755,000 | | | 0.190%, 11/14/2013b,c | | | 4,754,674 | |
| | 4,750,000 | | | 0.220%, 12/30/2013 | | | 4,748,287 | |
| | 4,640,000 | | | 0.240%, 3/10/2014b,c | | | 4,640,000 | |
| | | | Starbird Funding Corporation | | | | |
| | 5,500,000 | | | 0.100%, 11/1/2013b,c | | | 5,500,000 | |
| | | | Sydney Capital Corporation | | | | |
| | 4,760,000 | | | 0.230%, 12/12/2013b,c | | | 4,758,753 | |
| | 4,780,000 | | | 0.250%, 12/20/2013b,c | | | 4,778,374 | |
| | 4,800,000 | | | 0.240%, 1/24/2014b,c | | | 4,797,312 | |
| | | | | |
| | | | Total | | | 82,743,515 | |
| | | | | |
| | |
Principal
Amount | | | Certificate of Deposit (8.7%)a | | Value | |
| | | | Bank of Montreal Chicago | | | | |
| | 4,630,000 | | | 0.418%, 7/24/2014d | | | 4,635,320 | |
| | | | Bank of Nova Scotia/Houston | | | | |
| | 4,815,000 | | | 0.260%, 10/24/2014d | | | 4,815,000 | |
| | | | Kells Funding, LLC | | | | |
| | 4,600,000 | | | 0.242%, 10/8/2014b,c | | | 4,600,000 | |
| | | | Rabobank Nederland | | | | |
| | 4,640,000 | | | 0.272%, 4/29/2014d | | | 4,640,327 | |
| | 3,860,000 | | | 0.284%, 7/10/2014d | | | 3,860,000 | |
| | 4,620,000 | | | 0.328%, 12/1/2014d | | | 4,620,000 | |
| | | | Royal Bank of Canada | | | | |
| | 4,650,000 | | | 0.300%, 2/28/2014d | | | 4,650,000 | |
| | | | Wells Fargo Bank NA | | | | |
| | 4,750,000 | | | 0.180%, 12/11/2013 | | | 4,750,000 | |
| | 4,600,000 | | | 0.222%, 4/17/2014d | | | 4,600,000 | |
| | | | | |
| | | | Total | | | 41,170,647 | |
| | | | | |
| | |
Principal
Amount | | | Financial Company Commercial Paper (11.8%)a | | Value | |
| | | | AllianceBernstein, LP | | | | |
| | 4,805,000 | | | 0.320%, 1/21/2014c | | | 4,801,540 | |
| | | | BNP Paribas Canada | | | | |
| | 23,000,000 | | | 0.100%, 11/1/2013 | | | 23,000,000 | |
| | | | Skandinaviska Enskilda Banken AB | | | | |
| | 3,850,000 | | | 0.250%, 11/12/2013c | | | 3,849,706 | |
| | 4,730,000 | | | 0.275%, 4/1/2014c | | | 4,724,544 | |
| | 4,620,000 | | | 0.304%, 9/16/2014d | | | 4,620,000 | |
| | | | US Bank NA | | | | |
| | 12,115,000 | | | 0.100%, 11/1/2013 | | | 12,115,000 | |
| | 1,166,938 | | | 0.200%, 12/11/2013 | | | 1,166,679 | |
| | 2,414,616 | | | 0.200%, 12/23/2013 | | | 2,413,918 | |
| | | | | |
| | | | Total | | | 56,691,387 | |
| | | | | |
| | |
Principal
Amount | | | Government Agency Debt (22.4%)a | | Value | |
| | | | Federal Agricultural Mortgage Corporation | | | | |
| | 4,800,000 | | | 0.340%, 7/1/2015d | | | 4,812,935 | |
| | | | Federal Home Loan Bank | | | | |
| | 5,340,000 | | | 0.160%, 12/20/2013d | | | 5,339,781 | |
| | 5,260,000 | | | 0.170%, 2/24/2014d | | | 5,260,000 | |
| | 4,640,000 | | | 0.683%, 4/8/2014 | | | 4,648,968 | |
| | 5,120,000 | | | 0.220%, 6/4/2014d | | | 5,122,139 | |
| | | | Federal Home Loan Mortgage Corporation | | | | |
| | 1,800,000 | | | 0.370%, 11/18/2013d | | | 1,800,151 | |
| | | | Federal National Mortgage Association | | | | |
| | 5,330,000 | | | 0.153%, 6/20/2014d | | | 5,329,316 | |
| | 5,330,000 | | | 0.350%, 8/25/2014d | | | 5,336,165 | |
| | | | Overseas Private Investment Corporation | | | | |
| | 386,204 | | | 0.120%, 11/6/2013d | | | 386,204 | |
| | 6,160,000 | | | 0.120%, 11/6/2013d | | | 6,160,000 | |
| | 3,771,934 | | | 0.120%, 11/6/2013d | | | 3,771,934 | |
| | 1,293,102 | | | 0.120%, 11/6/2013d | | | 1,293,102 | |
| | 5,275,000 | | | 0.130%, 11/6/2013d | | | 5,275,000 | |
| | 7,700,000 | | | 0.130%, 11/7/2013d | | | 7,700,000 | |
| | 4,855,000 | | | 0.140%, 11/7/2013d | | | 4,855,000 | |
| | 13,465,000 | | | 0.531%, 12/9/2013 | | | 13,528,897 | |
| | 4,312,940 | | | 0.294%, 4/15/2014 | | | 5,826,443 | |
| | 7,730,000 | | | 0.400%, 5/2/2014 | | | 7,745,487 | |
| | 9,030,000 | | | 0.400%, 5/2/2014 | | | 9,048,091 | |
| | 3,432,000 | | | 0.176%, 9/7/2014 | | | 3,434,639 | |
| | | | | |
| | | | Total | | | 106,674,252 | |
| | | | | |
| | |
| Shares | | | Investment Company (7.5%) | | Value | |
| | | | AIM Investments Institutional Government and Agency Portfolio | | | | |
| | 100,000 | | | 0.030% | | | 100,000 | |
| | | | BlackRock Cash Funds | | | | |
| | 22,978,000 | | | 0.090% | | | 22,978,000 | |
| | | | Dreyfus Institutional Cash Advantage Fund | | | | |
| | 315,000 | | | 0.060% | | | 315,000 | |
| | | | DWS Money Market Series | | | | |
| | 12,182,024 | | | 0.050% | | | 12,182,025 | |
| | | | | |
| | | | Total | | | 35,575,025 | |
| | | | | |
| | |
Principal
Amount | | | Other Commercial Paper (7.2%)a | | Value | |
| | | | BHP Billiton Finance USA, Ltd. | | | | |
| | 4,620,000 | | | 0.130%, 12/17/2013c | | | 4,619,232 | |
| | | | Caisse d’Amortissement de la Dette Sociale | | | | |
| | 9,600,000 | | | 0.100%, 11/4/2013c | | | 9,599,920 | |
| | | | Caisse des Depots et Consignations | | | | |
| | 4,750,000 | | | 0.180%, 1/29/2014c | | | 4,747,886 | |
| | | | COFCO Capital Corporation | | | | |
| | 4,800,000 | | | 0.200%, 11/21/2013 | | | 4,799,467 | |
The accompanying Notes to Financial Statements are an integral part of this schedule.
252
Money Market Fund
Schedule of Investments as of October 31, 2013
| | | | | | | | |
Principal
Amount | | | Other Commercial Paper (7.2%)a | | Value | |
| | | | Reckitt Benckiser Treasury Services plc | | | | |
| | $3,080,000 | | | 0.220%, 3/18/2014c | | | $3,077,421 | |
| | 4,750,000 | | | 0.350%, 9/12/2014c | | | 4,735,453 | |
| | | | Schlumberger Investment SA | | | | |
| | 2,390,000 | | | 0.230%, 1/28/2014c | | | 2,388,656 | |
| | | | | |
| | | | Total | | | 33,968,035 | |
| | | | | |
| | |
Principal
Amount | | | Other Note (20.6%)a | | Value | |
| | | | Bank of Montreal | | | | |
| | 4,070,000 | | | 1.750%, 4/29/2014 | | | 4,098,495 | |
| | | | Bank of New York Mellon Corporation | | | | |
| | 6,311,000 | | | 0.508%, 7/28/2014d | | | 6,323,983 | |
| | | | BHP Billiton Finance USA, Ltd. | | | | |
| | 3,800,000 | | | 6.750%, 11/1/2013 | | | 3,800,000 | |
| | 3,000,000 | | | 0.533%, 2/18/2014d | | | 3,002,578 | |
| | | | General Electric Capital Corporation | | | | |
| | 4,930,000 | | | 1.093%, 1/7/2014d | | | 4,937,833 | |
| | 2,940,000 | | | 0.383%, 3/20/2014d | | | 2,941,340 | |
| | 4,900,000 | | | 0.873%, 4/7/2014d | | | 4,913,712 | |
| | | | John Deere Capital Corporation | | | | |
| | 3,850,000 | | | 0.343%, 10/8/2014d | | | 3,853,135 | |
| | | | KFW | | | | |
| | 4,650,000 | | | 0.424%, 1/17/2014d | | | 4,652,398 | |
| | | | Nederlandse Waterschapsbank NV | | | | |
| | 4,720,000 | | | 0.288%, 10/27/2014c,d | | | 4,721,482 | |
| | | | Nordea Bank AB | | | | |
| | 4,700,000 | | | 2.125%, 1/14/2014c | | | 4,716,477 | |
| | | | Novartis Capital Corporation | | | | |
| | 4,896,000 | | | 4.125%, 2/10/2014 | | | 4,946,188 | |
| | | | Novartis Finance Corporation | | | | |
| | 4,000,000 | | | 0.060%, 11/6/2013c | | | 3,999,967 | |
| | | | Royal Bank of Canada | | | | |
| | 4,800,000 | | | 0.346%, 7/3/2014d | | | 4,800,000 | |
| | 2,300,000 | | | 0.293%, 10/7/2014c,d | | | 2,300,000 | |
| | | | SSIF Nevada, LP | | | | |
| | 4,600,000 | | | 0.944%, 4/14/2014c,d | | | 4,613,350 | |
| | | | Target Corporation | | | | |
| | 2,400,000 | | | 0.416%, 7/18/2014d | | | 2,403,936 | |
| | | | Total Capital Canada, Ltd. | | | | |
| | 4,560,000 | | | 0.624%, 1/17/2014d | | | 4,564,073 | |
| | 4,620,000 | | | 1.625%, 1/28/2014 | | | 4,635,679 | |
| | | | United Technologies Corporation | | | | |
| | 2,520,000 | | | 0.530%, 12/2/2013d | | | 2,520,658 | |
| | | | Wells Fargo Bank NA | | | | |
| | 4,600,000 | | | 0.304%, 7/15/2019d | | | 4,600,000 | |
| | | | Westpac Banking Corporation | | | | |
| | 2,300,000 | | | 0.988%, 12/9/2013d | | | 2,301,802 | |
| | 3,890,000 | | | 1.192%, 2/24/2014c,d | | | 3,901,303 | |
| | 4,620,000 | | | 0.233%, 9/19/2014c | | | 4,619,634 | |
| | | | | |
| | | | Total | | | 98,168,023 | |
| | | | | |
| | |
Principal
Amount | | | Treasury Debt (4.4%)a | | Value | |
| | | | U.S. Treasury Bill | | | | |
| | 8,000,000 | | | 0.195%, 11/7/2013 | | | 7,999,740 | |
| | 6,000,000 | | | 4.250%, 11/15/2013 | | | 6,009,339 | |
| | 6,600,000 | | | 0.250%, 4/30/2014 | | | 6,602,762 | |
| | | | | |
| | | | Total | | | 20,611,841 | |
| | | | | |
| | |
Principal
Amount | | | Variable Rate Demand Note (1.8%)a | | Value | |
| | | | Louisiana Housing Finance Agency Qualified Gulf Opportunity Zone Bonds (Canterbury House Apartments - Sherwood) | | | | |
| | 8,730,000 | | | 0.080%, 11/7/2013d | | | 8,730,000 | |
| | | | | |
| | | | Total | | | 8,730,000 | |
| | | | | |
| | | | Total Investments (at amortized cost) 101.8% | | | $484,332,725 | |
| | | | | |
| | | | Other Assets and Liabilities, Net (1.8)% | | | (8,785,637 | ) |
| | | | | |
| | | | Total Net Assets 100.0% | | | $475,547,088 | |
| | | | | |
a | The interest rate shown reflects the yield, coupon rate or the discount rate at the date of purchase. |
b | Denotes investments that benefit from credit enhancement or liquidity support provided by a third party bank, institution or government. |
c | Denotes securities sold under Rule 144A of the Securities Act of 1933, which exempts them from registration. These securities have been deemed liquid and may be resold to other dealers in the program or to other qualified institutional buyers. As of October 31, 2013, the value of these investments was $132,266,752 or 27.8% of total net assets. |
d | Denotes variable rate securities. Variable rate securities are securities whose yields vary with a designated market index or market rate. The rate shown is as of October 31, 2013. |
| | | | |
Cost for federal income tax purposes | | $ | 484,332,725 | |
The accompanying Notes to Financial Statements are an integral part of this schedule.
253
Money Market Fund
Schedule of Investments as of October 31, 2013
Fair Valuation Measurements
The following table is a summary of the inputs used, as of October 31, 2013, in valuing Money Market Fund’s assets carried at fair value or amortized cost, which approximates fair value.
| | | | | | | | | | | | | | | | |
Investments in Securities | | Total | | | Level 1 | | | Level 2 | | | Level 3 | |
Asset Backed Commercial Paper | | | 82,743,515 | | | | – | | | | 82,743,515 | | | | – | |
Certificate of Deposit | | | 41,170,647 | | | | – | | | | 41,170,647 | | | | – | |
Financial Company Commercial Paper | | | 56,691,387 | | | | – | | | | 56,691,387 | | | | – | |
Government Agency Debt | | | 106,674,252 | | | | – | | | | 106,674,252 | | | | – | |
Investment Company | | | 35,575,025 | | | | 35,575,025 | | | | – | | | | – | |
Other Commercial Paper | | | 33,968,035 | | | | – | | | | 33,968,035 | | | | – | |
Other Note | | | 98,168,023 | | | | – | | | | 98,168,023 | | | | – | |
Treasury Debt | | | 20,611,841 | | | | – | | | | 20,611,841 | | | | – | |
Variable Rate Demand Note | | | 8,730,000 | | | | – | | | | 8,730,000 | | | | – | |
| |
Total | | | $484,332,725 | | | | $35,575,025 | | | | $448,757,700 | | | | $– | |
| |
There were no significant transfers between Levels during the period ended October 31, 2013. Transfers between Levels are identified as of the end of the period.
The accompanying Notes to Financial Statements are an integral part of this schedule.
254
THIS PAGE INTENTIONALLY LEFT BLANK
255
Thrivent Mutual Funds
Statement of Assets and Liabilities
| | | | | | | | | | | | | | | | |
As of October 31, 2013 | | Aggressive
Allocation
Fund | | | Moderately
Aggressive
Allocation Fund | | | Moderate
Allocation Fund | | | Moderately
Conservative
Allocation
Fund | |
Assets | | | | | | | | | | | | | | | | |
Investments at cost | | | $558,956,355 | | | | $1,396,686,489 | | | | $1,430,361,216 | | | | $713,550,036 | |
Investments in securities at value | | | 250,119,237 | | | | 618,283,294 | | | | 672,450,178 | | | | 430,450,269 | |
Investments in affiliates at value | | | 456,895,358 | | | | 1,051,688,860 | | | | 978,071,769 | | | | 353,146,033 | |
Investments at Value | | | 707,014,595 | | | | 1,669,972,154 | | | | 1,650,521,947 | | | | 783,596,302 | |
| | | | |
Cash | | | 970,175 | (a) | | | – | (b) | | | – | (c) | | | 2,947,699 | (d) |
Dividends and interest receivable | | | 189,686 | | | | 1,356,032 | | | | 2,015,671 | | | | 1,469,063 | |
Prepaid expenses | | | 14,341 | | | | 19,305 | | | | 20,227 | | | | 15,180 | |
Receivable for investments sold | | | 2,662,418 | | | | 4,620,149 | | | | 9,598,979 | | | | 11,020,709 | |
Receivable for fund shares sold | | | 637,542 | | | | 1,085,565 | | | | 940,633 | | | | 290,638 | |
Unrealized gain on forward contracts | | | – | | | | – | | | | – | | | | – | |
Receivable for foreign currency | | | 2,048,986 | | | | 3,905,596 | | | | 3,058,053 | | | | 1,201,443 | |
Receivable for variation margin | | | 1,234,665 | | | | 1,621,929 | | | | 1,036,841 | | | | 314,957 | |
Total Assets | | | 714,772,408 | | | | 1,682,580,730 | | | | 1,667,192,351 | | | | 800,855,991 | |
| | | | |
Liabilities | | | | | | | | | | | | | | | | |
Distributions payable | | | – | | | | – | | | | – | | | | – | |
Accrued expenses | | | 100,807 | | | | 178,310 | | | | 160,694 | | | | 92,746 | |
Other liabilities | | | – | | | | 1,838,747 | (b) | | | 672,922 | (c) | | | – | |
Payable for investments purchased | | | 6,197,609 | | | | 9,998,450 | | | | 45,288,921 | | | | 63,365,422 | |
Payable upon return of collateral for securities loaned | | | – | | | | 1,305,947 | | | | 2,115,760 | | | | 3,018,707 | |
Payable for fund shares redeemed | | | 282,729 | | | | 711,043 | | | | 693,838 | | | | 560,248 | |
Unrealized loss on forward contracts | | | – | | | | – | | | | – | | | | – | |
Payable for variation margin | | | 762,694 | | | | 945,569 | | | | 585,658 | | | | 183,347 | |
Payable to affiliate | | | 414,435 | | | | 1,140,255 | | | | 1,169,118 | | | | 616,761 | |
Mortgage dollar roll deferred revenue | | | 4,483 | | | | 16,531 | | | | 41,107 | | | | 80,805 | |
Total Liabilities | | | 7,762,757 | | | | 16,134,852 | | | | 50,728,018 | | | | 67,918,036 | |
| | | | |
Net Assets | | | | | | | | | | | | | | | | |
Capital stock (beneficial interest) | | | 538,075,375 | | | | 1,348,773,090 | | | | 1,369,785,179 | | | | 652,353,600 | |
Accumulated undistributed net investment income/(loss) | | | (955,659 | ) | | | 4,825,376 | | | | 862,425 | | | | 600,563 | |
Accumulated undistributed net realized gain/(loss) | | | 20,144,974 | | | | 34,758,087 | | | | 20,899,228 | | | | 7,352,146 | |
Net unrealized appreciation/(depreciation) on: | | | | | | | | | | | | | | | | |
Investments | | | 38,652,677 | | | | 64,021,799 | | | | 50,180,892 | | | | 19,837,156 | |
Affiliated investments | | | 109,405,563 | | | | 209,263,866 | | | | 169,979,839 | | | | 50,209,110 | |
Futures contracts | | | 1,678,284 | | | | 4,758,530 | | | | 4,705,292 | | | | 2,557,320 | |
Foreign currency forward contracts | | | – | | | | – | | | | – | | | | – | |
Foreign currency transactions | | | 2,767 | | | | 5,443 | | | | 4,221 | | | | 1,612 | |
Swap agreements | | | 5,670 | | | | 39,687 | | | | 47,257 | | | | 26,448 | |
Total Net Assets | | | $707,009,651 | | | | $1,666,445,878 | | | | $1,616,464,333 | | | | $732,937,955 | |
| | | | |
Class A Share Capital | | | $612,362,395 | | | | $1,558,928,683 | | | | $1,541,273,993 | | | | $701,286,610 | |
Shares of beneficial interest outstanding (Class A) | | | 43,272,175 | | | | 113,883,091 | | | | 119,677,907 | | | | 58,549,268 | |
Net asset value per share | | | $14.15 | | | | $13.69 | | | | $12.88 | | | | $11.98 | |
Maximum public offering price | | | $14.97 | | | | $14.49 | | | | $13.63 | | | | $12.68 | |
Institutional Class Share Capital | | | $94,647,256 | | | | $107,517,195 | | | | $75,190,340 | | | | $31,651,345 | |
Shares of beneficial interest outstanding (Institutional Class) | | | 6,633,499 | | | | 7,794,173 | | | | 5,824,968 | | | | 2,635,438 | |
Net asset value per share | | | $14.27 | | | | $13.79 | | | | $12.91 | | | | $12.01 | |
(a) | Includes foreign currency holdings of $-2,048,986 (cost $-2,048,986). |
(b) | Includes foreign currency holdings of $-3,897,044 (cost $-3,897,027). |
(c) | Includes foreign currency holdings of $-3,051,545 (cost $-3,051,532). |
(d) | Includes foreign currency holdings of $-1,201,443 (cost $-1,201,443). |
The accompanying Notes to Financial Statements are an integral part of this schedule.
256
Thrivent Mutual Funds
Statement of Assets and Liabilities – continued
| | | | | | | | | | | | | | | | | | | | | | | | | | |
Balanced
Income Plus
Fund | | | Opportunity
Income Plus
Fund | | | Partner
Emerging
Markets Equity
Fund | | | Partner Small
Cap Growth
Fund | | | Partner Small
Cap Value Fund | | | Small Cap
Stock Fund | | | Mid Cap
Growth Fund | |
| | | | | | | | | | | | | | | | | | | | | | | | | | |
| | $220,336,439 | | | | $292,041,189 | | | | $14,889,138 | | | | $148,865,831 | | | | $160,859,960 | | | | $298,184,378 | | | | $312,516,094 | |
| | 216,704,435 | | | | 251,933,711 | | | | 15,379,461 | | | | 166,597,305 | | | | 266,996,647 | | | | 311,194,259 | | | | 400,733,821 | |
| | 24,239,009 | | | | 40,150,617 | | | | 257,720 | | | | 25,464,785 | | | | 12,491,297 | | | | 51,116,555 | | | | 37,825,074 | |
| | 240,943,444 | | | | 292,084,328 | | | | 15,637,181 | | | | 192,062,090 | | | | 279,487,944 | | | | 362,310,814 | | | | 438,558,895 | |
| | | | | | |
| | 875 | | | | 4,375 | | | | 8,139 | (e) | | | – | | | | 2,332 | (f) | | | – | | | | – | |
| | 649,641 | | | | 1,375,905 | | | | 1,931 | | | | 33,667 | | | | 85,276 | | | | 60,801 | | | | 108,808 | |
| | 8,683 | | | | 11,972 | | | | 15,862 | | | | 10,132 | | | | 12,109 | | | | 8,876 | | | | 12,468 | |
| | 4,570,064 | | | | 6,744,656 | | | | 111,877 | | | | 2,333,527 | | | | 1,044,090 | | | | 3,651,241 | | | | 1,091,275 | |
| | 188,973 | | | | 116,511 | | | | 22,974 | | | | 16,886 | | | | 282,279 | | | | 38,590 | | | | 118,410 | |
| | – | | | | – | | | | 263 | | | | – | | | | – | | | | – | | | | – | |
| | – | | | | – | | | | – | | | | – | | | | – | | | | – | | | | – | |
| | – | | | | – | | | | – | | | | – | | | | – | | | | – | | | | – | |
| | 246,361,680 | | | | 300,337,747 | | | | 15,798,227 | | | | 194,456,302 | | | | 280,914,030 | | | | 366,070,322 | | | | 439,889,856 | |
| | | | | | |
| | | | | | | | | | | | | | | | | | | | | | | | | | |
| | – | | | | 70,824 | | | | – | | | | – | | | | – | | | | – | | | | – | |
| | 105,920 | | | | 131,290 | | | | 21,589 | | | | 39,389 | | | | 68,381 | | | | 131,128 | | | | 122,006 | |
| | – | | | | – | | | | – | | | | 907,365 | | | | – | | | | – | | | | – | |
| | 23,389,683 | | | | 46,521,874 | | | | 118,287 | | | | 3,781,268 | | | | 1,289,478 | | | | 3,318,128 | | | | 420,148 | |
| | – | | | | – | | | | – | | | | 17,412,554 | | | | 4,609,450 | | | | 26,183,357 | | | | 19,138,554 | |
| | 263,459 | | | | 193,553 | | | | 16,323 | | | | 7,764 | | | | 191,122 | | | | 269,429 | | | | 197,752 | |
| | – | | | | – | | | | 31 | | | | – | | | | – | | | | – | | | | – | |
| | 13,563 | | | | 6,250 | | | | – | | | | – | | | | – | | | | 145,340 | | | | – | |
| | 156,003 | | | | 139,115 | | | | 19,546 | | | | 145,898 | | | | 203,336 | | | | 277,383 | | | | 219,177 | |
| | 19,370 | | | | 40,858 | | | | – | | | | – | | | | – | | | | – | | | | – | |
| | 23,947,998 | | | | 47,103,764 | | | | 175,776 | | | | 22,294,238 | | | | 6,361,767 | | | | 30,324,765 | | | | 20,097,637 | |
| | | | | | |
| | | | | | | | | | | | | | | | | | | | | | | | | | |
| | 178,245,641 | | | | 261,178,836 | | | | 14,816,763 | | | | 106,024,544 | | | | 149,090,382 | | | | 269,785,460 | | | | 243,548,682 | |
| | (73,010 | ) | | | 62,530 | | | | 150,744 | | | | (70,035 | ) | | | (959,385 | ) | | | (560,955 | ) | | | (65,150 | ) |
| | 23,539,786 | | | | (8,189,462 | ) | | | (93,010 | ) | | | 23,011,296 | | | | 7,793,282 | | | | 1,523,810 | | | | 50,265,886 | |
| | | | | | | | | | | | | | | | | | | | | | | | | | |
| | 20,607,005 | | | | 43,139 | | | | 748,043 | | | | 43,196,259 | | | | 118,627,984 | | | | 64,126,436 | | | | 126,042,801 | |
| | – | | | | – | | | | – | | | | – | | | | – | | | | – | | | | – | |
| | 93,940 | | | | 138,940 | | | | – | | | | – | | | | – | | | | 870,806 | | | | – | |
| | – | | | | – | | | | 232 | | | | – | | | | – | | | | – | | | | – | |
| | 320 | | | | – | | | | (321 | ) | | | – | | | | – | | | | – | | | | – | |
| | – | | | | – | | | | – | | | | – | | | | – | | | | – | | | | – | |
| | $222,413,682 | | | | $253,233,983 | | | | $15,622,451 | | | | $172,162,064 | | | | $274,552,263 | | | | $335,745,557 | | | | $419,792,219 | |
| | | | | | |
| | $167,762,219 | | | | $228,437,045 | | | | $14,645,160 | | | | $26,025,811 | | | | $95,973,346 | | | | $255,555,684 | | | | $265,669,281 | |
| | 11,802,772 | | | | 22,133,694 | | | | 1,393,144 | | | | 1,528,043 | | | | 4,653,308 | | | | 13,795,982 | | | | 12,295,943 | |
| | $14.21 | | | | $10.32 | | | | $10.51 | | | | $17.03 | | | | $20.62 | | | | $18.52 | | | | $21.61 | |
| | $15.04 | | | | $10.81 | | | | $11.12 | | | | $18.02 | | | | $21.82 | | | | $19.60 | | | | $22.87 | |
| | $54,651,463 | | | | $24,796,938 | | | | $977,291 | | | | $146,136,253 | | | | $178,578,917 | | | | $80,189,873 | | | | $154,122,938 | |
| | 3,851,033 | | | | 2,402,391 | | | | 92,631 | | | | 8,318,725 | | | | 8,229,912 | | | | 3,822,204 | | | | 6,240,117 | |
| | $14.19 | | | | $10.32 | | | | $10.55 | | | | $17.57 | | | | $21.70 | | | | $20.98 | | | | $24.70 | |
(e) | Includes foreign currency holdings of $8,139 (cost $8,139). |
(f) | Includes foreign currency holdings of $2,332 (cost $2,332). |
The accompanying Notes to Financial Statements are an integral part of this schedule.
257
Thrivent Mutual Funds
Statement of Assets and Liabilities – continued
| | | | | | | | | | | | | | | | |
As of October 31, 2013 | | Partner Mid
Cap Value Fund | | | Mid Cap Stock
Fund | | | Partner
Worldwide
Allocation
Fund | | | Large Cap
Growth
Fund | |
Assets | | | | | | | | | | | | | | | | |
Investments at cost | | | $136,269,703 | | | | $765,830,544 | | | | $751,020,766 | | | | $353,717,873 | |
Investments in securities at value | | | 158,762,192 | | | | 879,790,714 | | | | 835,932,001 | | | | 424,252,331 | |
Investments in affiliates at value | | | 2,568,093 | | | | 133,572,420 | | | | 26,899,197 | | | | 24,127,000 | |
Investments at Value | | | 161,330,285 | | | | 1,013,363,134 | | | | 862,831,198 | | | | 448,379,331 | |
| | | | |
Cash | | | – | | | | – | | | | 1,670,699 | (a) | | | – | (b) |
Initial margin deposit on open future contracts | | | – | | | | – | | | | 79,874 | | | | – | |
Dividends and interest receivable | | | 42,801 | | | | 338,722 | | | | 2,864,213 | | | | 92,681 | |
Prepaid expenses | | | 10,105 | | | | 11,901 | | | | 9,805 | | | | 12,810 | |
Receivable for investments sold | | | 2,867,691 | | | | – | | | | 11,083,325 | | | | 5,533,075 | |
Receivable for fund shares sold | | | 37,112 | | | | 68,469 | | | | 153,335 | | | | 157,555 | |
Unrealized gain on forward contracts | | | – | | | | – | | | | 421,439 | | | | – | |
Receivable for foreign currency | | | – | | | | – | | | | 593,307 | | | | 422,163 | |
Receivable for variation margin | | | – | | | | – | | | | 10,259 | | | | 91,336 | |
Total Assets | | | 164,287,994 | | | | 1,013,782,226 | | | | 879,717,454 | | | | 454,688,951 | |
| | | | |
Liabilities | | | | | | | | | | | | | | | | |
Distributions payable | | | – | | | | – | | | | – | | | | – | |
Accrued expenses | | | 42,029 | | | | 238,949 | | | | 240,395 | | | | 114,123 | |
Other liabilities | | | – | | | | – | | | | – | | | | 422,163 | (b) |
Payable for investments purchased | | | 3,410,535 | | | | 302,405 | | | | 11,560,770 | | | | 3,368,274 | |
Payable upon return of collateral for securities loaned | | | – | | | | 96,425,470 | | | | 13,655,850 | | | | 6,510,000 | |
Payable for fund shares redeemed | | | 23,018 | | | | 719,856 | | | | 116,597 | | | | 94,697 | |
Unrealized loss on forward contracts | | | – | | | | – | | | | 346,746 | | | | – | |
Payable for variation margin | | | – | | | | – | | | | 7,790 | | | | 19,668 | |
Payable to affiliate | | | 117,084 | | | | 705,829 | | | | 654,066 | | | | 304,148 | |
Mortgage dollar roll deferred revenue | | | – | | | | – | | | | – | | | | – | |
Total Liabilities | | | 3,592,666 | | | | 98,392,509 | | | | 26,582,214 | | | | 10,833,073 | |
| | | | |
Net Assets | | | | | | | | | | | | | | | | |
Capital stock (beneficial interest) | | | 105,784,559 | | | | 685,992,136 | | | | 829,478,917 | | | | 388,697,361 | |
Accumulated undistributed net investment income/(loss) | | | 722,753 | | | | 348,182 | | | | 14,765,864 | | | | 1,019,085 | |
Accumulated undistributed net realized gain/(loss) | | | 29,127,434 | | | | (18,483,191 | ) | | | (102,944,625 | ) | | | (40,983,209 | ) |
Net unrealized appreciation/(depreciation) on: | | | | | | | | | | | | | | | | |
Investments | | | 25,060,582 | | | | 247,532,590 | | | | 111,810,432 | | | | 94,661,458 | |
Futures contracts | | | – | | | | – | | | | (77,786 | ) | | | 460,057 | |
Foreign currency forward contracts | | | – | | | | – | | | | 74,693 | | | | – | |
Foreign currency transactions | | | – | | | | – | | | | 27,745 | | | | 1,126 | |
Swap agreements | | | – | | | | – | | | | – | | | | – | |
Total Net Assets | | | $160,695,328 | | | | $915,389,717 | | | | $853,135,240 | | | | $443,855,878 | |
| | | | |
Class A Share Capital | | | $31,050,623 | | | | $625,368,514 | | | | $181,614,855 | | | | $156,988,079 | |
Shares of beneficial interest outstanding (Class A) | | | 1,909,526 | | | | 30,690,182 | | | | 17,652,039 | | | | 22,098,359 | |
Net asset value per share | | | $16.26 | | | | $20.38 | | | | $10.29 | | | | $7.10 | |
Maximum public offering price | | | $17.21 | | | | $21.57 | | | | $10.89 | | | | $7.51 | |
Institutional Class Share Capital | | | $129,644,705 | | | | $290,021,203 | | | | $671,520,385 | | | | $286,867,799 | |
Shares of beneficial interest outstanding (Institutional Class) | | | 7,938,941 | | | | 13,128,663 | | | | 64,817,013 | | | | 37,475,650 | |
Net asset value per share | | | $16.33 | | | | $22.09 | | | | $10.36 | | | | $7.65 | |
(a) | Includes foreign currency holdings of $156,085 (cost $174,131). |
(b) | Includes foreign currency holdings of $-422,163 (cost $-422,163). |
The accompanying Notes to Financial Statements are an integral part of this schedule.
258
Thrivent Mutual Funds
Statement of Assets and Liabilities – continued
| | | | | | | | | | | | | | | | | | | | | | | | | | |
Large Cap
Value Fund | | | Large Cap Stock
Fund | | | High Yield
Fund | | | Income Fund | | | Municipal
Bond Fund | | | Government
Bond Fund | | | Limited
Maturity Bond
Fund | |
| | | | | | | | | | | | | | | | | | | | | | | | | | |
| | $552,139,304 | | | | $1,380,468,445 | | | | $789,040,782 | | | | $835,817,247 | | | | $1,415,930,881 | | | | $119,462,913 | | | | $910,062,207 | |
| | 704,645,017 | | | | 1,638,790,309 | | | | 756,472,587 | | | | 814,691,964 | | | | 1,478,235,269 | | | | 106,975,920 | | | | 858,242,919 | |
| | 28,303,246 | | | | 104,494,057 | | | | 62,054,947 | | | | 46,660,273 | | | | – | | | | 12,641,952 | | | | 51,082,140 | |
| | 732,948,263 | | | | 1,743,284,366 | | | | 818,527,534 | | | | 861,352,237 | | | | 1,478,235,269 | | | | 119,617,872 | | | | 909,325,059 | |
| | | | | | |
| | – | | | | – | (c) | | | – | | | | – | | | | 30,296 | | | | – | | | | 1,089 | |
| | – | | | | – | | | | – | | | | – | | | | – | | | | – | | | | – | |
| | 777,768 | | | | 459,889 | | | | 13,554,285 | | | | 8,398,928 | | | | 21,228,612 | | | | 503,328 | | | | 2,649,338 | |
| | 10,443 | | | | 17,005 | | | | 16,803 | | | | 17,427 | | | | 24,240 | | | | 5,277 | | | | 32,182 | |
| | 14,423,929 | | | | 51,694,287 | | | | 2,015,830 | | | | 13,176,686 | | | | 5,320,336 | | | | 2,585,658 | | | | 26,500,650 | |
| | 499,414 | | | | 128,953 | | | | 491,873 | | | | 235,074 | | | | 668,623 | | | | 69,283 | | | | 1,156,624 | |
| | – | | | | – | | | | – | | | | – | | | | – | | | | – | | | | – | |
| | – | | | | 3,301,244 | | | | – | | | | – | | | | – | | | | – | | | | – | |
| | – | | | | 866,234 | | | | – | | | | 97,849 | | | | – | | | | – | | | | 45,858 | |
| | 748,659,817 | | | | 1,799,751,978 | | | | 834,606,325 | | | | 883,278,201 | | | | 1,505,507,376 | | | | 122,781,418 | | | | 939,710,800 | |
| | | | | | |
| | | | | | | | | | | | | | | | | | | | | | | | | | |
| | – | | | | – | | | | 764,649 | | | | 193,741 | | | | 732,148 | | | | 1,138 | | | | 18,592 | |
| | 147,850 | | | | 726,983 | | | | 180,987 | | | | 177,807 | | | | 326,787 | | | | 23,101 | | | | 158,366 | |
| | – | | | | 2,990,503 | (c) | | | – | | | | – | | | | – | | | | – | | | | – | |
| | 14,505,997 | | | | 44,558,077 | | | | 5,914,659 | | | | 44,954,245 | | | | 13,489,207 | | | | 7,741,138 | | | | 65,729,824 | |
| | 9,844,200 | | | | – | | | | 46,006,909 | | | | 14,088,307 | | | | – | | | | 6,897,500 | | | | 8,269,685 | |
| | 252,627 | | | | 740,271 | | | | 671,475 | | | | 605,042 | | | | 1,082,200 | | | | 50,240 | | | | 1,437,268 | |
| | – | | | | – | | | | – | | | | – | | | | – | | | | – | | | | – | |
| | – | | | | 185,361 | | | | – | | | | 61,478 | | | | – | | | | – | | | | 15,810 | |
| | 354,240 | | | | 1,224,601 | | | | 409,543 | | | | 365,169 | | | | 869,083 | | | | 46,879 | | | | 306,901 | |
| | – | | | | – | | | | – | | | | 46,827 | | | | – | | | | 8,249 | | | | 75,735 | |
| | 25,104,914 | | | | 50,425,796 | | | | 53,948,222 | | | | 60,492,616 | | | | 16,499,425 | | | | 14,768,245 | | | | 76,012,181 | |
| | | | | | |
| | | | | | | | | | | | | | | | | | | | | | | | | | |
| | 554,315,618 | | | | 1,232,001,734 | | | | 796,619,836 | | | | 812,264,907 | | | | 1,435,031,000 | | | | 106,649,331 | | | | 861,513,768 | |
| | 6,844,473 | | | | 6,551,507 | | | | 69,740 | | | | (105,936 | ) | | | (17,489 | ) | | | (5,541 | ) | | | 287,004 | |
| | (18,414,147 | ) | | | 143,655,930 | | | | (45,518,225 | ) | | | (13,635,298 | ) | | | (8,309,948 | ) | | | 1,214,424 | | | | 4,693,724 | |
| | | | | | | | | | | | | | | | | | | | | | | | | | |
| | 180,808,959 | | | | 362,815,921 | | | | 29,486,752 | | | | 25,534,990 | | | | 62,304,388 | | | | 154,959 | | | | (737,148 | ) |
| | – | | | | 4,296,646 | | | | – | | | | (1,286,996 | ) | | | – | | | | – | | | | (2,098,674 | ) |
| | – | | | | – | | | | – | | | | – | | | | – | | | | – | | | | – | |
| | – | | | | 4,444 | | | | – | | | | – | | | | – | | | | – | | | | – | |
| | – | | | | – | | | | – | | | | 13,918 | | | | – | | | | – | | | | 39,945 | |
| | $723,554,903 | | | | $1,749,326,182 | | | | $780,658,103 | | | | $822,785,585 | | | | $1,489,007,951 | | | | $108,013,173 | | | | $863,698,619 | |
| | | | | | |
| | $214,614,322 | | | | $1,556,490,928 | | | | $539,985,937 | | | | $419,450,097 | | | | $1,397,169,298 | | | | $12,950,634 | | | | $415,550,372 | |
| | 11,538,718 | | | | 56,521,225 | | | | 106,003,106 | | | | 46,147,468 | | | | 124,985,144 | | | | 1,293,056 | | | | 33,163,781 | |
| | $18.60 | | | | $27.54 | | | | $5.09 | | | | $9.09 | | | | $11.18 | | | | $10.02 | | | | $12.53 | |
| | $19.68 | | | | $29.14 | | | | $5.33 | | | | $9.52 | | | | $11.71 | | | | $10.22 | | | | $12.53 | |
| | $508,940,581 | | | | $192,835,254 | | | | $240,672,166 | | | | $403,335,488 | | | | $91,838,653 | | | | $95,062,539 | | | | $448,148,247 | |
| | 27,173,699 | | | | 6,947,825 | | | | 47,218,206 | | | | 44,411,123 | | | | 8,215,589 | | | | 9,489,746 | | | | 35,772,756 | |
| | $18.73 | | | | $27.75 | | | | $5.10 | | | | $9.08 | | | | $11.18 | | | | $10.02 | | | | $12.53 | |
(c) | Includes foreign currency holdings of $-3,301,244 (cost $-3,301,244). |
The accompanying Notes to Financial Statements are an integral part of this schedule.
259
Thrivent Mutual Funds
Statement of Assets and Liabilities – continued
| | | | |
As of October 31, 2013 | | Money Market
Fund | |
Assets | | | | |
Investments at cost | | | $484,332,725 | |
Investments in securities at value | | | 484,332,725 | |
Investments at Value | | | 484,332,725 | 1 |
| |
Cash | | | 3,395 | |
Dividends and interest receivable | | | 403,830 | |
Prepaid expenses | | | 17,341 | |
Receivable for fund shares sold | | | 2,305,752 | |
Receivable from affiliate | | | 20,136 | |
Total Assets | | | 487,083,179 | |
| |
Liabilities | | | | |
Accrued expenses | | | 81,724 | |
Payable for investments purchased | | | 9,220,000 | |
Payable for fund shares redeemed | | | 2,234,367 | |
Total Liabilities | | | 11,536,091 | |
| |
Net Assets | | | | |
Capital stock (beneficial interest) | | | 475,547,088 | |
Accumulated undistributed net investment income/(loss) | | | – | |
Accumulated undistributed net realized gain/(loss) | | | – | |
Total Net Assets | | | $475,547,088 | |
| |
Class A Share Capital | | | $469,015,144 | |
Shares of beneficial interest outstanding (Class A) | | | 469,015,143 | |
Net asset value per share | | | $1.00 | |
Maximum public offering price | | | $1.00 | |
Institutional Class Share Capital | | | $6,531,944 | |
Shares of beneficial interest outstanding (Institutional Class) | | | 6,531,944 | |
Net asset value per share | | | $1.00 | |
1 | Securities held by this fund are valued on the basis of amortized cost, which approximates market value. |
The accompanying Notes to Financial Statements are an integral part of this schedule.
260
THIS PAGE INTENTIONALLY LEFT BLANK
261
Thrivent Mutual Funds
Statement of Operations
| | | | | | | | | | | | | | | | |
For the year ended October 31, 2013 | | Aggressive
Allocation
Fund | | | Moderately
Aggressive
Allocation
Fund | | | Moderate
Allocation
Fund | | | Moderately
Conservative
Allocation
Fund | |
Investment Income | | | | | | | | | | | | | | | | |
Dividends | | | $3,024,915 | | | | $5,274,220 | | | | $3,959,664 | | | | $1,546,980 | |
Taxable interest | | | 253,788 | | | | 5,195,981 | | | | 7,828,580 | | | | 5,703,512 | |
Income from mortgage dollar rolls | | | 84,827 | | | | 335,969 | | | | 1,206,800 | | | | 1,354,303 | |
Income from securities loaned | | | – | | | | 2,929 | | | | 4,950 | | | | 5,901 | |
Income from affiliated investments | | | 5,069,792 | | | | 17,084,549 | | | | 19,511,553 | | | | 8,278,304 | |
Foreign tax withholding | | | (13,081 | ) | | | (25,812 | ) | | | (19,636 | ) | | | (7,877 | ) |
Total Investment Income | | | 8,420,241 | | | | 27,867,836 | | | | 32,491,911 | | | | 16,881,123 | |
| | | | |
Expenses | | | | | | | | | | | | | | | | |
Adviser fees | | | 2,137,155 | | | | 4,641,363 | | | | 4,479,723 | | | | 2,407,393 | |
Sub-Adviser fees | | | – | | | | – | | | | – | | | | – | |
Administrative service fees | | | 187,835 | | | | 349,722 | | | | 349,091 | | | | 200,950 | |
Amortization of offering costs | | | – | | | | – | | | | – | | | | – | |
Audit and legal fees | | | 28,220 | | | | 39,589 | | | | 39,989 | | | | 29,471 | |
Custody fees | | | 58,674 | | | | 94,241 | | | | 94,960 | | | | 73,708 | |
Distribution expenses Class A | | | 1,359,013 | | | | 3,489,354 | | | | 3,548,442 | | | | 1,669,365 | |
Insurance expenses | | | 7,144 | | | | 11,806 | | | | 11,775 | | | | 7,486 | |
Printing and postage expenses Class A | | | 190,271 | | | | 370,175 | | | | 297,781 | | | | 127,307 | |
Printing and postage expenses Institutional Class | | | 390 | | | | 343 | | | | 466 | | | | 432 | |
SEC and state registration expenses | | | 50,120 | | | | 84,524 | | | | 88,719 | | | | 60,859 | |
Transfer agent fees Class A | | | 767,986 | | | | 1,498,325 | | | | 1,164,993 | | | | 476,431 | |
Transfer agent fees Institutional Class | | | 365 | | | | 410 | | | | 692 | | | | 791 | |
Trustees’ fees | | | 14,936 | | | | 24,982 | | | | 24,481 | | | | 17,351 | |
Other expenses | | | 13,221 | | | | 38,417 | | | | 38,540 | | | | 34,689 | |
Total Expenses Before Reimbursement | | | 4,815,330 | | | | 10,643,251 | | | | 10,139,652 | | | | 5,106,233 | |
Less: | | | | | | | | | | | | | | | | |
Reimbursement from adviser | | | (55,087 | ) | | | (256,008 | ) | | | (314,446 | ) | | | (229,090 | ) |
Custody earnings credit | | | (265 | ) | | | (305 | ) | | | (323 | ) | | | (399 | ) |
Total Net Expenses | | | 4,759,978 | | | | 10,386,938 | | | | 9,824,883 | | | | 4,876,744 | |
| | | | | | | | | | | | | | | | |
Net Investment Income/(Loss) | | | 3,660,263 | | | | 17,480,898 | | | | 22,667,028 | | | | 12,004,379 | |
Realized and Unrealized Gains/(Losses) | | | | | | | | | | | | | | | | |
Net realized gains/(losses) on: | | | | | | | | | | | | | | | | |
Investments | | | 18,453,199 | | | | 34,612,962 | | | | 22,791,153 | | | | 7,524,330 | |
Affiliated investments | | | 7,253,724 | | | | 7,857,956 | | | | 6,971,155 | | | | 4,194,200 | |
Distributions of realized capital gains from affiliated investments | | | 5,302,349 | | | | 10,221,472 | | | | 5,653,354 | | | | 975,064 | |
Written option contracts | | | – | | | | 9,775 | | | | 33,300 | | | | 35,127 | |
Futures contracts | | | (3,405,909 | ) | | | (270,887 | ) | | | 1,342,703 | | | | 799,838 | |
Foreign currency transactions | | | 50,872 | | | | 131,196 | | | | 102,806 | | | | 34,856 | |
Swap agreements | | | (2,399 | ) | | | (1,037,709 | ) | | | (1,003,660 | ) | | | (731,065 | ) |
Change in net unrealized appreciation/(depreciation) on: | | | | | | | | | | | | | | | | |
Investments | | | 25,782,550 | | | | 38,940,660 | | | | 28,906,290 | | | | 9,765,193 | |
Affiliated investments | | | 82,103,485 | | | | 164,941,677 | | | | 113,315,285 | | | | 24,669,746 | |
Futures contracts | | | 579,974 | | | | 4,401,101 | | | | 5,089,523 | | | | 2,872,105 | |
Foreign currency forward contracts | | | 15 | | | | 39 | | | | 39 | | | | 21 | |
Foreign currency transactions | | | 2,849 | | | | 5,532 | | | | 4,244 | | | | 1,612 | |
Swap agreements | | | 5,670 | | | | 39,687 | | | | 47,257 | | | | 26,448 | |
Net Realized and Unrealized Gains/(Losses) | | | 136,126,379 | | | | 259,853,461 | | | | 183,253,449 | | | | 50,167,475 | |
| | | | | | | | | | | | | | | | |
Net Increase/(Decrease) in Net Assets Resulting From Operations | | | $139,786,642 | | | | $277,334,359 | | | | $205,920,477 | | | | $62,171,854 | |
The accompanying Notes to Financial Statements are an integral part of this schedule.
262
Thrivent Mutual Funds
Statement of Operations – continued
| | | | | | | | | | | | | | | | | | | | | | | | | | |
Balanced Income Plus Fund | | | Opportunity
Income Plus Fund | | | Partner Emerging
Markets Equity
Fund | | | Partner Small
Cap Growth Fund | | | Partner Small
Cap Value Fund | | | Small Cap Stock Fund | | | Mid Cap Growth
Fund | |
| | | | | | | | | | | | | | | | | | | | | | | | | | |
| | $2,257,221 | | | | $86,741 | | | | $432,318 | | | | $1,054,025 | | | | $5,138,326 | | | | $3,309,756 | | | | $3,356,672 | |
| | 1,661,677 | | | | 6,715,748 | | | | 77 | | | | 365 | | | | 546 | | | | 1,736 | | | | 954 | |
| | 408,446 | | | | 1,425,029 | | | | – | | | | – | | | | – | | | | – | | | | – | |
| | 6,921 | | | | 2,894 | | | | – | | | | 130,238 | | | | 64,223 | | | | 122,696 | | | | 18,324 | |
| | 104,737 | | | | 697,386 | | | | 249 | | | | 3,393 | | | | 4,269 | | | | 30,604 | | | | 15,309 | |
| | (28,269 | ) | | | – | | | | (53,598 | ) | | | (847 | ) | | | (4,953 | ) | | | (32,703 | ) | | | (6,585 | ) |
| | 4,410,733 | | | | 8,927,798 | | | | 379,046 | | | | 1,187,174 | | | | 5,202,411 | | | | 3,432,089 | | | | 3,384,674 | |
| | | | | | |
| | | | | | | | | | | | | | | | | | | | | | | | | | |
| | 1,113,777 | | | | 1,234,878 | | | | 79,243 | | | | 421,443 | | | | 247,644 | | | | 2,081,844 | | | | 1,563,157 | |
| | – | | | | – | | | | 106,314 | | | | 927,175 | | | | 1,479,525 | | | | – | | | | – | |
| | 107,939 | | | | 121,484 | | | | 72,900 | | | | 98,051 | | | | 116,196 | | | | 127,100 | | | | 144,318 | |
| | – | | | | – | | | | 34,567 | | | | – | | | | – | | | | – | | | | – | |
| | 22,657 | | | | 24,020 | | | | 18,864 | | | | 21,822 | | | | 23,118 | | | | 23,925 | | | | 25,369 | |
| | 30,364 | | | | 25,164 | | | | 121,635 | | | | 28,342 | | | | 12,617 | | | | 16,560 | | | | 12,334 | |
| | 377,725 | | | | 601,128 | | | | 36,106 | | | | 50,756 | | | | 206,535 | | | | 583,522 | | | | 606,192 | |
| | 4,854 | | | | 5,333 | | | | 3,780 | | | | 4,524 | | | | 5,075 | | | | 5,451 | | | | 6,011 | |
| | 51,643 | | | | 70,418 | | | | 2,314 | | | | 9,413 | | | | 40,816 | | | | 109,964 | | | | 132,537 | |
| | 336 | | | | 609 | | | | 125 | | | | 524 | | | | 13,067 | | | | 348 | | | | 13,954 | |
| | 30,254 | | | | 39,179 | | | | 18,249 | | | | 28,227 | | | | 31,200 | | | | 31,345 | | | | 34,828 | |
| | 219,553 | | | | 286,377 | | | | 9,423 | | | | 43,726 | | | | 195,149 | | | | 546,510 | | | | 566,424 | |
| | 365 | | | | 1,693 | | | | 386 | | | | 278 | | | | 76,914 | | | | 790 | | | | 81,645 | |
| | 17,967 | | | | 21,324 | | | | 5,293 | | | | 12,682 | | | | 17,481 | | | | 22,829 | | | | 25,166 | |
| | 21,637 | | | | 21,798 | | | | 15,876 | | | | 10,165 | | | | 10,503 | | | | 10,219 | | | | 10,728 | |
| | 1,999,071 | | | | 2,453,405 | | | | 525,075 | | | | 1,657,128 | | | | 2,475,840 | | | | 3,560,407 | | | | 3,222,663 | |
| | | | | | | | | | | | | | | | | | | | | | | | | | |
| | (5,192 | ) | | | (228,387 | ) | | | (274,212 | ) | | | (29,975 | ) | | | (101 | ) | | | – | | | | – | |
| | (164 | ) | | | (238 | ) | | | (78 | ) | | | (348 | ) | | | (202 | ) | | | (183 | ) | | | (104 | ) |
| | 1,993,715 | | | | 2,224,780 | | | | 250,785 | | | | 1,626,805 | | | | 2,475,537 | | | | 3,560,224 | | | | 3,222,559 | |
| | | | | | | | | | | | | | | | | | | | | | | | | | |
| | 2,417,018 | | | | 6,703,018 | | | | 128,261 | | | | (439,631 | ) | | | 2,726,874 | | | | (128,135 | ) | | | 162,115 | |
| | | | | | | | | | | | | | | | | | | | | | | | | | |
| | | | | | | | | | | | | | | | | | | | | | | | | | |
| | 22,974,312 | | | | (2,797,699 | ) | | | (91,229 | ) | | | 24,746,221 | | | | 8,309,561 | | | | 14,518,060 | | | | 51,306,317 | |
| | 424,463 | | | | 3,369,836 | | | | – | | | | – | | | | – | | | | – | | | | – | |
| | 4 | | | | 13 | | | | – | | | | 5 | | | | 3 | | | | 17 | | | | 8 | |
| | – | | | | – | | | | – | | | | – | | | | – | | | | – | | | | – | |
| | 471,124 | | | | 754,815 | | | | – | | | | – | | | | – | | | | 6,567,940 | | | | – | |
| | (1,973 | ) | | | – | | | | (11,679 | ) | | | – | | | | 70 | | | | (18,208 | ) | | | – | |
| | (109,168 | ) | | | (873,334 | ) | | | – | | | | – | | | | – | | | | – | | | | – | |
| | | | | | | | | | | | | | | | | | | | | | | | | | |
| | 11,171,923 | | | | (8,223,233 | ) | | | 481,709 | | | | 26,134,824 | | | | 61,737,279 | | | | 56,241,934 | | | | 44,497,684 | |
| | (434,321 | ) | | | (3,456,527 | ) | | | – | | | | – | | | | – | | | | – | | | | – | |
| | 98,542 | | | | 151,659 | | | | – | | | | – | | | | – | | | | 2,504,223 | | | | – | |
| | – | | | | – | | | | 247 | | | | – | | | | – | | | | – | | | | – | |
| | 320 | | | | – | | | | (325 | ) | | | – | | | | – | | | | – | | | | – | |
| | 38,580 | | | | 308,639 | | | | – | | | | – | | | | – | | | | – | | | | – | |
| | 34,633,806 | | | | (10,765,831 | ) | | | 378,723 | | | | 50,881,050 | | | | 70,046,913 | | | | 79,813,966 | | | | 95,804,009 | |
| | | | | | | | | | | | | | | | | | | | | | | | | | |
| | $37,050,824 | | | | $ | (4,062,813) | | | $506,984 | | | | $50,441,419 | | | | $72,773,787 | | | | $79,685,831 | | | | $95,966,124 | |
The accompanying Notes to Financial Statements are an integral part of this schedule.
263
Thrivent Mutual Funds
Statement of Operations – continued
| | | | | | | | | | | | | | | | |
For the year ended October 31, 2013 | | Partner Mid
Cap Value Fund | | | Mid Cap Stock
Fund | | | Partner
Worldwide
Allocation
Fund | | | Large Cap
Growth Fund | |
Investment Income | | | | | | | | | | | | | | | | |
Dividends | | | $2,554,550 | | | | $9,752,700 | | | | $20,435,772 | | | | $5,188,056 | |
Taxable interest | | | 313 | | | | 2,526 | | | | 4,455,497 | | | | 1,275 | |
Tax-Exempt interest | | | – | | | | – | | | | – | | | | – | |
Income from mortgage dollar rolls | | | – | | | | – | | | | – | | | | – | |
Income from securities loaned | | | 7,233 | | | | 180,927 | | | | 113,247 | | | | 3,339 | |
Income from affiliated investments | | | 2,275 | | | | 30,073 | | | | 15,527 | | | | 12,323 | |
Foreign tax withholding | | | 748 | | | | – | | | | (1,800,780 | ) | | | (19,809 | ) |
Total Investment Income | | | 2,565,119 | | | | 9,966,226 | | | | 23,219,263 | | | | 5,185,184 | |
| | | | |
Expenses | | | | | | | | | | | | | | | | |
Adviser fees | | | 401,694 | | | | 5,435,901 | | | | 2,953,273 | | | | 2,905,759 | |
Sub-Adviser fees | | | 684,653 | | | | – | | | | 3,815,379 | | | | – | |
Administrative service fees | | | 97,127 | | | | 223,715 | | | | 216,406 | | | | 142,557 | |
Audit and legal fees | | | 21,794 | | | | 30,500 | | | | 38,773 | | | | 24,956 | |
Custody fees | | | 33,511 | | | | 25,906 | | | | 446,869 | | | | 13,079 | |
Distribution expenses Class A | | | 61,795 | | | | 1,418,548 | | | | 421,249 | | | | 341,316 | |
Insurance expenses | | | 4,475 | | | | 8,322 | | | | 7,926 | | | | 5,811 | |
Printing and postage expenses Class A | | | 12,709 | | | | 181,015 | | | | 119,833 | | | | 82,839 | |
Printing and postage expenses Institutional Class | | | 373 | | | | 1,345 | | | | 3,152 | | | | 356 | |
SEC and state registration expenses | | | 29,491 | | | | 42,077 | | | | 42,817 | | | | 34,446 | |
Transfer agent fees Class A | | | 58,069 | | | | 894,306 | | | | 504,070 | | | | 392,110 | |
Transfer agent fees Institutional Class | | | 1,692 | | | | 6,098 | | | | 8,185 | | | | 1,043 | |
Trustees’ fees | | | 12,565 | | | | 48,468 | | | | 43,099 | | | | 25,959 | |
Other expenses | | | 9,771 | | | | 13,051 | | | | 66,130 | | | | 10,367 | |
Total Expenses Before Reimbursement | | | 1,429,719 | | | | 8,329,252 | | | | 8,687,161 | | | | 3,980,598 | |
| | | | |
Less: | | | | | | | | | | | | | | | | |
Reimbursement from adviser | | | (44,671 | ) | | | – | | | | (384,635 | ) | | | (292,474 | ) |
Custody earnings credit | | | (201 | ) | | | (175 | ) | | | (897 | ) | | | (112 | ) |
Total Net Expenses | | | 1,384,847 | | | | 8,329,077 | | | | 8,301,629 | | | | 3,688,012 | |
| | | | | | | | | | | | | | | | |
Net Investment Income/(Loss) | | | 1,180,272 | | | | 1,637,149 | | | | 14,917,634 | | | | 1,497,172 | |
| | | | |
Realized and Unrealized Gains/(Losses) | | | | | | | | | | | | | | | | |
Net realized gains/(losses) on: | | | | | | | | | | | | | | | | |
Investments | | | 29,517,830 | | | | 88,843,173 | | | | 37,719,573 | | | | 29,928,705 | |
Affiliated investments | | | – | | | | – | | | | – | | | | – | |
Distributions of realized capital gains from affiliated investments | | | 2 | | | | 28 | | | | 7 | | | | 5 | |
Futures contracts | | | – | | | | – | | | | 480,649 | | | | – | |
Foreign currency transactions | | | – | | | | – | | | | (475,553 | ) | | | 254 | |
Swap agreements | | | – | | | | – | | | | – | | | | – | |
Change in net unrealized appreciation/(depreciation) on: | | | | | | | | | | | | | | | | |
Investments | | | 8,215,225 | | | | 143,065,706 | | | | 93,681,924 | | | | 72,224,078 | |
Affiliated investments | | | – | | | | – | | | | – | | | | – | |
Futures contracts | | | – | | | | – | | | | (68,654 | ) | | | 460,057 | |
Foreign currency forward contracts | | | – | | | | – | | | | 202,668 | | | | – | |
Foreign currency transactions | | | – | | | | – | | | | 55,974 | | | | 1,126 | |
Swap agreements | | | – | | | | – | | | | – | | | | – | |
Net Realized and Unrealized Gains/(Losses) | | | 37,733,057 | | | | 231,908,907 | | | | 131,596,588 | | | | 102,614,225 | |
Net Increase/(Decrease) in Net Assets Resulting | | | | | | | | | | | | | | | | |
| | | | | | | | | | | | | | | | |
From Operations | | | $38,913,329 | | | | $233,546,056 | | | | $146,514,222 | | | | $104,111,397 | |
The accompanying Notes to Financial Statements are an integral part of this schedule.
264
Thrivent Mutual Funds
Statement of Operations – continued
| | | | | | | | | | | | | | | | | | | | | | | | | | |
Large Cap
Value Fund | | | Large Cap Stock
Fund | | | High Yield
Fund | | | Income Fund | | | Municipal
Bond Fund | | | Government
Bond Fund | | | Limited
Maturity Bond
Fund | |
| | | | | | | | | | | | | | | | | | | | | | | | | | |
| | $14,661,306 | | | | $30,398,760 | | | | $246,388 | | | | $696,556 | | | | $– | | | | $– | | | | $250,729 | |
| | 1,441 | | | | 9,856 | | | | 54,864,328 | | | | 34,135,571 | | | | 375,825 | | | | 1,491,366 | | | | 14,613,483 | |
| | – | | | | – | | | | – | | | | – | | | | 69,915,757 | | | | – | | | | – | |
| | – | | | | – | | | | – | | | | 972,098 | | | | – | | | | 128,055 | | | | 772,434 | |
| | 26,119 | | | | 21,700 | | | | 154,778 | | | | 21,156 | | | | – | | | | 48,293 | | | | 41,447 | |
| | 17,019 | | | | 119,451 | | | | 26,765 | | | | 48,048 | | | | – | | | | 6,511 | | | | 477,868 | |
| | (134,605 | ) | | | (28,658 | ) | | | – | | | | – | | | | – | | | | – | | | | – | |
| | 14,571,280 | | | | 30,521,109 | | | | 55,292,259 | | | | 35,873,429 | | | | 70,291,582 | | | | 1,674,225 | | | | 16,155,961 | |
| | | | | | |
| | | | | | | | | | | | | | | | | | | | | | | | | | | |
| | 2,935,324 | | | | 9,326,270 | | | | 3,078,876 | | | | 2,920,815 | | | | 6,345,754 | | | | 413,609 | | | | 2,583,223 | |
| | – | | | | – | | | | – | | | | – | | | | – | | | | – | | | | – | |
| | 192,114 | | | | 377,285 | | | | 221,547 | | | | 231,378 | | | | 369,907 | | | | 89,391 | | | | 237,585 | |
| | 28,198 | | | | 42,169 | | | | 31,485 | | | | 32,927 | | | | 43,401 | | | | 21,212 | | | | 32,540 | |
| | 16,290 | | | | 35,835 | | | | 25,673 | | | | 32,866 | | | | 38,889 | | | | 9,652 | | | | 31,568 | |
| | 480,984 | | | | 3,640,413 | | | | 1,349,310 | | | | 1,103,731 | | | | 3,755,459 | | | | 17,412 | | | | 549,019 | |
| | 7,173 | | | | 13,039 | | | | 8,118 | | | | 8,567 | | | | 12,733 | | | | 4,313 | | | | 8,896 | |
| | 77,893 | | | | 545,941 | | | | 144,310 | | | | 116,880 | | | | 177,026 | | | | 9,490 | | | | 135,318 | |
| | 10,749 | | | | 583 | | | | 16,531 | | | | 5,354 | | | | 6,321 | | | | 494 | | | | 16,826 | |
| | 40,258 | | | | 57,842 | | | | 57,448 | | | | 55,958 | | | | 83,535 | | | | 26,303 | | | | 94,344 | |
| | 363,006 | | | | 2,247,828 | | | | 524,317 | | | | 436,663 | | | | 581,852 | | | | 38,128 | | | | 466,128 | |
| | 63,052 | | | | 1,457 | | | | 96,285 | | | | 26,828 | | | | 36,329 | | | | 831 | | | | 99,674 | |
| | 37,119 | | | | 103,316 | | | | 43,472 | | | | 46,506 | | | | 85,018 | | | | 6,715 | | | | 45,809 | |
| | 11,862 | | | | 17,333 | | | | 40,875 | | | | 39,847 | | | | 94,593 | | | | 12,642 | | | | 33,248 | |
| | 4,264,022 | | | | 16,409,311 | | | | 5,638,247 | | | | 5,058,320 | | | | 11,630,817 | | | | 650,192 | | | | 4,334,178 | |
| | | | | | |
| | | | | | | | | | | | | | | | | | | | | | | | | | | |
| | – | | | | – | | | | – | | | | – | | | | – | | | | (18,311 | ) | | | (26,622 | ) |
| | (185 | ) | | | (137 | ) | | | (253 | ) | | | (202 | ) | | | (89 | ) | | | (227 | ) | | | (183 | ) |
| | 4,263,837 | | | | 16,409,174 | | | | 5,637,994 | | | | 5,058,118 | | | | 11,630,728 | | | | 631,654 | | | | 4,307,373 | |
| | | | | | | | | | | | | | | | | | | | | | | | | | | |
| | 10,307,443 | | | | 14,111,935 | | | | 49,654,265 | | | | 30,815,311 | | | | 58,660,854 | | | | 1,042,571 | | | | 11,848,588 | |
| | | | | | |
| | | | | | | | | | | | | | | | | | | | | | | | | | | |
| | | | | | | | | | | | | | | | | | | | | | | | | | | |
| | 34,214,009 | | | | 144,819,765 | | | | 21,533,628 | | | | 17,244,594 | | | | (8,035,549 | ) | | | 1,214,423 | | | | 1,563,539 | |
| | – | | | | – | | | | – | | | | – | | | | – | | | | – | | | | 2,937,011 | |
| | | | | | | | | | | | | | | | | | | | | | | | | | | |
| | 6 | | | | 43 | | | | 25 | | | | 21 | | | | – | | | | 1 | | | | 13 | |
| | – | | | | 15,407,355 | | | | 257,415 | | | | (328,413 | ) | | | – | | | | – | | | | 3,214,074 | |
| | – | | | | (7,370 | ) | | | – | | | | – | | | | – | | | | – | | | | – | |
| | – | | | | – | | | | (1,635,457 | ) | | | (1,371,080 | ) | | | – | | | | – | | | | (959,559 | ) |
| | | | | | | | | | | | | | | | | | | | | | | | | | | |
| | 120,540,096 | | | | 179,008,676 | | | | (8,076,798 | ) | | | (42,659,863 | ) | | | (97,358,879 | ) | | | (4,373,218 | ) | | | (9,520,517 | ) |
| | – | | | | – | | | | – | | | | – | | | | – | | | | – | | | | (2,958,614 | ) |
| | – | | | | 8,078,088 | | | | – | | | | (976,799 | ) | | | – | | | | – | | | | (1,875,574 | ) |
| | – | | | | – | | | | – | | | | – | | | | – | | | | – | | | | – | |
| | – | | | | 4,444 | | | | – | | | | – | | | | – | | | | – | | | | – | |
| | – | | | | – | | | | 290,057 | | | | 264,971 | | | | – | | | | – | | | | 374,305 | |
| | 154,754,111 | | | | 347,311,001 | | | | 12,368,870 | | | | (27,826,569 | ) | | | (105,394,428 | ) | | | (3,158,794 | ) | | | (7,225,322 | ) |
| | | | | | | | | | | | | | | | | | | | | | | | | | | |
| | $165,061,554 | | | | $361,422,936 | | | | $62,023,135 | | | | $2,988,742 | | | | $(46,733,574) | | | | $(2,116,223) | | | | $4,623,266 | |
The accompanying Notes to Financial Statements are an integral part of this schedule.
265
Thrivent Mutual Funds
Statement of Operations – continued
| | | | |
For the year ended October 31, 2013 | | Money Market
Fund | |
Investment Income | | | | |
Dividends | | | $45,367 | |
Taxable interest | | | 1,059,647 | |
Total Investment Income | | | 1,105,014 | |
| |
Expenses | | | | |
Adviser fees | | | 2,416,802 | |
Administrative service fees | | | 160,731 | |
Audit and legal fees | | | 26,424 | |
Custody fees | | | 25,230 | |
Distribution expenses Class A | | | 592,085 | |
Insurance expenses | | | 6,635 | |
Printing and postage expenses Class A | | | 289,416 | |
Printing and postage expenses Institutional Class | | | 540 | |
SEC and state registration expenses | | | 99,350 | |
Transfer agent fees Class A | | | 868,242 | |
Transfer agent fees Institutional Class | | | 1,543 | |
Trustees’ fees | | | 22,403 | |
Other expenses | | | 17,780 | |
Total Expenses Before Reimbursement | | | 4,527,181 | |
Less: | | | | |
Reimbursement from adviser | | | (3,414,439 | ) |
Custody earnings credit | | | (122 | ) |
Total Net Expenses | | | 1,112,620 | |
| | | | |
Net Investment Income/(Loss) | | | (7,606 | ) |
Realized and Unrealized Gains/(Losses) | | | | |
Net realized gains/(losses) on: | | | | |
Investments | | | 7,606 | |
Net Realized and Unrealized Gains/(Losses) | | | 7,606 | |
| | | | |
Net Increase/(Decrease) in Net Assets Resulting From Operations | | | $– | |
The accompanying Notes to Financial Statements are an integral part of this schedule.
266
THIS PAGE INTENTIONALLY LEFT BLANK
267
Thrivent Mutual Funds
Statement of Changes in Net Assets
| | | | | | | | | | | | | | | | |
| | | Aggressive Allocation Fund | | | Moderately Aggressive
Allocation Fund | |
For the periods ended | | 10/31/2013 | | | 10/31/2012 | | | 10/31/2013 | | | 10/31/2012 | |
Operations | | | | | | | | | | | | | | | | |
Net investment income/(loss) | | | $3,660,263 | | | | $2,182,320 | | | | $17,480,898 | | | | $13,375,503 | |
Net realized gains/(losses) | | | 27,651,836 | | | | 10,268,719 | | | | 51,524,765 | | | | 23,411,598 | |
Change in net unrealized appreciation/(depreciation) | | | 108,474,543 | | | | 33,691,968 | | | | 208,328,696 | | | | 74,379,476 | |
Net Change in Net Assets Resulting From Operations | | | 139,786,642 | | | | 46,143,007 | | | | 277,334,359 | | | | 111,166,577 | |
Distributions to Shareholders | | | | | | | | | | | | | | | | |
From net investment income Class A | | | (4,035,207 | ) | | | (2,362,528 | ) | | | (18,716,141 | ) | | | (15,228,935 | ) |
From net investment income Institutional Class | | | (974,138 | ) | | | (687,226 | ) | | | (1,621,402 | ) | | | (1,430,963 | ) |
Total From Net Investment Income | | | (5,009,345 | ) | | | (3,049,754 | ) | | | (20,337,543 | ) | | | (16,659,898 | ) |
From net realized gains Class A | | | (4,065,813 | ) | | | – | | | | (9,895,481 | ) | | | – | |
From net realized gains Institutional Class | | | (652,519 | ) | | | – | | | | (687,285 | ) | | | – | |
Total From Net Realized Gains | | | (4,718,332 | ) | | | – | | | | (10,582,766 | ) | | | – | |
Total Distributions to Shareholders | | | (9,727,677 | ) | | | (3,049,754 | ) | | | (30,920,309 | ) | | | (16,659,898 | ) |
Capital Stock Transactions | | | | | | | | | | | | | | | | |
| | | | |
Class A | | | | | | | | | | | | | | | | |
Sold | | | 64,770,567 | | | | 55,000,663 | | | | 176,333,831 | | | | 140,815,765 | |
Distributions reinvested | | | 8,084,704 | | | | 2,358,027 | | | | 28,517,101 | | | | 15,171,749 | |
Redeemed | | | (67,143,466 | ) | | | (61,838,154 | ) | | | (144,355,914 | ) | | | (144,482,829 | ) |
Total Class A Capital Stock Transactions | | | 5,711,805 | | | | (4,479,464 | ) | | | 60,495,018 | | | | 11,504,685 | |
| | | | |
Institutional Class | | | | | | | | | | | | | | | | |
Sold | | | 15,041,868 | | | | 15,664,364 | | | | 16,165,902 | | | | 11,803,770 | |
Distributions reinvested | | | 1,626,656 | | | | 687,225 | | | | 2,307,031 | | | | 1,429,891 | |
Redeemed | | | (20,912,544 | ) | | | (21,638,126 | ) | | | (17,265,702 | ) | | | (14,598,328 | ) |
Total Institutional Class Capital Stock Transactions | | | (4,244,020 | ) | | | (5,286,537 | ) | | | 1,207,231 | | | | (1,364,667 | ) |
Capital Stock Transactions | | | 1,467,785 | | | | (9,766,001 | ) | | | 61,702,249 | | | | 10,140,018 | |
| | | | | | | | | | | | | | | | |
Net Increase/(Decrease) in Net Assets | | | 131,526,750 | | | | 33,327,252 | | | | 308,116,299 | | | | 104,646,697 | |
Net Assets, Beginning of Period | | | 575,482,901 | | | | 542,155,649 | | | | 1,358,329,579 | | | | 1,253,682,882 | |
Net Assets, End of Period | | | $707,009,651 | | | | $575,482,901 | | | | $1,666,445,878 | | | | $1,358,329,579 | |
Accumulated Undistributed Net Investment Income/(Loss) | | | $(955,659) | | | | $132,214 | | | | $4,825,376 | | | | $6,761,916 | |
| | | | |
Capital Stock Share Transactions | | | | | | | | | | | | | | | | |
| | | | |
Class A shares | | | | | | | | | | | | | | | | |
Sold | | | 5,126,052 | | �� | | 4,938,608 | | | | 14,095,887 | | | | 12,578,142 | |
Distributions reinvested | | | 697,566 | | | | 225,003 | | | | 2,447,007 | | | | 1,439,445 | |
Redeemed | | | (5,369,893 | ) | | | (5,541,047 | ) | | | (11,648,960 | ) | | | (12,889,713 | ) |
Total Class A shares | | | 453,725 | | | | (377,436 | ) | | | 4,893,934 | | | | 1,127,874 | |
| | | | |
Institutional Class shares | | | | | | | | | | | | | | | | |
Sold | | | 1,193,640 | | | | 1,407,797 | | | | 1,287,242 | | | | 1,051,797 | |
Distributions reinvested | | | 139,459 | | | | 65,326 | | | | 196,902 | | | | 135,023 | |
Redeemed | | | (1,678,319 | ) | | | (1,916,314 | ) | | | (1,380,109 | ) | | | (1,289,591 | ) |
Total Institutional Class shares | | | (345,220 | ) | | | (443,191 | ) | | | 104,035 | | | | (102,771 | ) |
The accompanying Notes to Financial Statements are an integral part of this schedule.
268
Thrivent Mutual Funds
Statement of Changes in Net Assets – continued
| | | | | | | | | | | | | | | | | | | | | | | | | | | | | | |
| Moderate Allocation Fund | | | Moderately Conservative
Allocation Fund | | | Balanced Income Plus Fund | | | Opportunity Income Plus Fund | |
| 10/31/2013 | | | 10/31/2012 | | | 10/31/2013 | | | 10/31/2012 | | | 10/31/2013 | | | 10/31/2012 | | | 10/31/2013 | | | 10/31/2012 | |
| | | | | | | | | | | | | | | | | | | | | | | | | | | | | | |
| | $22,667,028 | | | | $19,616,676 | | | | $12,004,379 | | | | $10,622,842 | | | | $2,417,018 | | | | $2,296,157 | | | | $6,703,018 | | | | $7,469,413 | |
| | 35,890,811 | | | | 24,785,908 | | | | 12,832,350 | | | | 14,032,483 | | | | 23,758,762 | | | | 9,857,391 | | | | 453,631 | | | | 7,424,574 | |
| | 147,362,638 | | | | 65,903,613 | | | | 37,335,125 | | | | 22,764,119 | | | | 10,875,044 | | | | 3,510,461 | | | | (11,219,462 | ) | | | 6,419,440 | |
| | 205,920,477 | | | | 110,306,197 | | | | 62,171,854 | | | | 47,419,444 | | | | 37,050,824 | | | | 15,664,009 | | | | (4,062,813 | ) | | | 21,313,427 | |
| | | | | | | | | | | | | | | | | | | | | | | | | | | | | | |
| | (22,192,737 | ) | | | (18,540,380 | ) | | | (11,592,083 | ) | | | (10,200,483 | ) | | | (1,708,602 | ) | | | (1,466,431 | ) | | | (5,586,159 | ) | | | (5,834,738 | ) |
| | (1,322,825 | ) | | | (1,162,146 | ) | | | (636,600 | ) | | | (517,656 | ) | | | (798,573 | ) | | | (777,933 | ) | | | (838,594 | ) | | | (1,334,789 | ) |
| | (23,515,562 | ) | | | (19,702,526 | ) | | | (12,228,683 | ) | | | (10,718,139 | ) | | | (2,507,175 | ) | | | (2,244,364 | ) | | | (6,424,753 | ) | | | (7,169,527 | ) |
| | (16,357,946 | ) | | | (1,435,970 | ) | | | (10,560,721 | ) | | | (3,065,524 | ) | | | (7,202,125 | ) | | | (3,512,172 | ) | | | – | | | | – | |
| | (812,294 | ) | | | (72,960 | ) | | | (485,386 | ) | | | (123,672 | ) | | | (2,491,936 | ) | | | (1,317,538 | ) | | | – | | | | – | |
| | (17,170,240 | ) | | | (1,508,930 | ) | | | (11,046,107 | ) | | | (3,189,196 | ) | | | (9,694,061 | ) | | | (4,829,710 | ) | | | – | | | | – | |
| | (40,685,802 | ) | | | (21,211,456 | ) | | | (23,274,790 | ) | | | (13,907,335 | ) | | | (12,201,236 | ) | | | (7,074,074 | ) | | | (6,424,753 | ) | | | (7,169,527 | ) |
| | | | | | | | | | | | | | | | | | | | | | | | | | | | | | |
| | | | | | | |
| | | | | | | | | | | | | | | | | | | | | | | | | | | | | | |
| | 203,404,011 | | | | 168,819,869 | | | | 113,743,617 | | | | 111,972,893 | | | | 16,695,910 | | | | 7,056,563 | | | | 28,357,443 | | | | 28,424,145 | |
| | 38,277,439 | | | | 19,811,801 | | | | 21,931,411 | | | | 13,135,303 | | | | 8,720,430 | | | | 4,875,836 | | | | 5,026,252 | | | | 5,243,953 | |
| | (174,335,354 | ) | | | (164,531,041 | ) | | | (104,514,093 | ) | | | (83,973,451 | ) | | | (17,244,645 | ) | | | (18,182,481 | ) | | | (45,358,825 | ) | | | (32,556,065 | ) |
| | 67,346,096 | | | | 24,100,629 | | | | 31,160,935 | | | | 41,134,745 | | | | 8,171,695 | | | | (6,250,082 | ) | | | (11,975,130 | ) | | | 1,112,033 | |
| | | | | | | |
| | | | | | | | | | | | | | | | | | | | | | | | | | | | | | |
| | 14,190,738 | | | | 13,467,649 | | | | 12,617,179 | | | | 9,336,950 | | | | 453,568 | | | | 382,949 | | | | 32,750,456 | | | | 19,240,418 | |
| | 2,109,660 | | | | 1,220,635 | | | | 1,110,469 | | | | 629,456 | | | | 3,283,026 | | | | 2,091,209 | | | | 717,873 | | | | 1,251,147 | |
| | (14,912,776 | ) | | | (12,626,406 | ) | | | (11,792,210 | ) | | | (5,748,174 | ) | | | (5,255,854 | ) | | | (7,621,983 | ) | | | (44,045,496 | ) | | | (42,211,397 | ) |
| | 1,387,622 | | | | 2,061,878 | | | | 1,935,438 | | | | 4,218,232 | | | | (1,519,260 | ) | | | (5,147,825 | ) | | | (10,577,167 | ) | | | (21,719,832 | ) |
| | 68,733,718 | | | | 26,162,507 | | | | 33,096,373 | | | | 45,352,977 | | | | 6,652,435 | | | | (11,397,907 | ) | | | (22,552,297 | ) | | | (20,607,799 | ) |
| | | | | | | | | | | | | | | | | | | | | | | | | | | | | | |
| | 233,968,393 | | | | 115,257,248 | | | | 71,993,437 | | | | 78,865,086 | | | | 31,502,023 | | | | (2,807,972 | ) | | | (33,039,863 | ) | | | (6,463,899 | ) |
| | 1,382,495,940 | | | | 1,267,238,692 | | | | 660,944,518 | | | | 582,079,432 | | | | 190,911,659 | | | | 193,719,631 | | | | 286,273,846 | | | | 292,737,745 | |
| | $1,616,464,333 | | | | $1,382,495,940 | | | | $732,937,955 | | | | $660,944,518 | | | | $222,413,682 | | | | $190,911,659 | | | | $253,233,983 | | | | $286,273,846 | |
| | $862,425 | | | | $1,145,709 | | | | $600,563 | | | | $773,764 | | | | $(73,010 | ) | | | $(76,130 | ) | | | $62,530 | | | | $(57,231 | ) |
| | | | | | | |
| | | | | | | | | | | | | | | | | | | | | | | | | | | | | | |
| | | | | | | |
| | | | | | | | | | | | | | | | | | | | | | | | | | | | | | |
| | 16,840,431 | | | | 15,129,103 | | | | 9,859,568 | | | | 10,178,876 | | | | 1,241,470 | | | | 573,850 | | | | 2,695,883 | | | | 2,728,733 | |
| | 3,275,507 | | | | 1,803,430 | | | | 1,935,275 | | | | 1,212,494 | | | | 711,310 | | | | 420,251 | | | | 480,534 | | | | 504,491 | |
| | (14,462,545 | ) | | | (14,768,857 | ) | | | (9,050,828 | ) | | | (7,639,901 | ) | | | (1,312,698 | ) | | | (1,475,757 | ) | | | (4,325,991 | ) | | | (3,134,100 | ) |
| | 5,653,393 | | | | 2,163,676 | | | | 2,744,015 | | | | 3,751,469 | | | | 640,082 | | | | (481,656 | ) | | | (1,149,574 | ) | | | 99,124 | |
| | | | | | | |
| | | | | | | | | | | | | | | | | | | | | | | | | | | | | | |
| | 1,169,002 | | | | 1,208,900 | | | | 1,094,679 | | | | 847,571 | | | | 33,212 | | | | 31,574 | | | | 3,136,192 | | | | 1,857,729 | |
| | 179,655 | | | | 110,637 | | | | 97,651 | | | | 57,811 | | | | 267,181 | | | | 179,362 | | | | 68,105 | | | | 120,709 | |
| | (1,229,944 | ) | | | (1,129,919 | ) | | | (1,020,151 | ) | | | (522,458 | ) | | | (405,146 | ) | | | (616,929 | ) | | | (4,261,035 | ) | | | (4,061,141 | ) |
| | 118,713 | | | | 189,618 | | | | 172,179 | | | | 382,924 | | | | (104,753 | ) | | | (405,993 | ) | | | (1,056,738 | ) | | | (2,082,703 | ) |
The accompanying Notes to Financial Statements are an integral part of this schedule.
269
Thrivent Mutual Funds
Statement of Changes in Net Assets – continued
| | | | | | | | | | | | | | | | |
| | | Partner Emerging Markets Equity Fund | | | Partner Small Cap Growth Fund | |
For the periods ended | | 10/31/2013 | | | 10/31/2012(a) | | | 10/31/2013 | | | 10/31/2012 | |
Operations | | | | | | | | | | | | | | | | |
Net investment income/(loss) | | | $128,261 | | | | $16,129 | | | | $(439,631 | ) | | | $(756,248 | ) |
Net realized gains/(losses) | | | (102,908 | ) | | | 118,861 | | | | 24,746,226 | | | | 9,426,892 | |
Change in net unrealized appreciation/(depreciation) | | | 481,631 | | | | 266,323 | | | | 26,134,824 | | | | 1,426,438 | |
Net Change in Net Assets Resulting From Operations | | | 506,984 | | | | 401,313 | | | | 50,441,419 | | | | 10,097,082 | |
Distributions to Shareholders | | | | | | | | | | | | | | | | |
From net investment income Class A | | | – | | | | – | | | | – | | | | – | |
From net investment income Institutional Class | | | – | | | | – | | | | – | | | | – | |
Total From Net Investment Income | | | – | | | | – | | | | – | | | | – | |
From net realized gains Class A | | | (134,310 | ) | | | – | | | | (513,408 | ) | | | – | |
From net realized gains Institutional Class | | | (9,537 | ) | | | – | | | | (3,332,064 | ) | | | – | |
Total From Net Realized Gains | | | (143,847 | ) | | | – | | | | (3,845,472 | ) | | | – | |
Total Distributions to Shareholders | | | (143,847 | ) | | | – | | | | (3,845,472 | ) | | | – | |
Capital Stock Transactions | | | | | | | | | | | | | | | | |
| | | | |
Class A | | | | | | | | | | | | | | | | |
Sold | | | 4,705,192 | | | | 14,304,841 | | | | 3,734,163 | | | | 1,789,864 | |
Distributions reinvested | | | 134,309 | | | | – | | | | 510,885 | | | | – | |
Redeemed | | | (4,926,003 | ) | | | (286,520 | ) | | | (1,744,641 | ) | | | (5,750,627 | ) |
Total Class A Capital Stock Transactions | | | (86,502 | ) | | | 14,018,321 | | | | 2,500,407 | | | | (3,960,763 | ) |
| | | | |
Institutional Class | | | | | | | | | | | | | | | | |
Sold | | | 590,036 | | | | 1,005,000 | | | | 6,600 | | | | 3,788,480 | |
Distributions reinvested | | | 9,537 | | | | – | | | | 3,332,063 | | | | – | |
Redeemed | | | (668,391 | ) | | | (10,000 | ) | | | (12,546,105 | ) | | | (2,057,440 | ) |
Total Institutional Class Capital Stock Transactions | | | (68,818 | ) | | | 995,000 | | | | (9,207,442 | ) | | | 1,731,040 | |
Capital Stock Transactions | | | (155,320 | ) | | | 15,013,321 | | | | (6,707,035 | ) | | | (2,229,723 | ) |
| | | | | | | | | | | | | | | | |
Net Increase/(Decrease) in Net Assets | | | 207,817 | | | | 15,414,634 | | | | 39,888,912 | | | | 7,867,359 | |
Net Assets, Beginning of Period | | | 15,414,634 | | | | – | | | | 132,273,152 | | | | 124,405,793 | |
Net Assets, End of Period | | | $15,622,451 | | | | $15,414,634 | | | | $172,162,064 | | | | $132,273,152 | |
Accumulated Undistributed Net Investment Income/(Loss) | | | $150,744 | | | | $ | (395) | | | $(70,035 | ) | | | $(638,357 | ) |
| | | | |
Capital Stock Share Transactions | | | | | | | | | | | | | | | | |
| | | | |
Class A shares | | | | | | | | | | | | | | | | |
Sold | | | 448,247 | | | | 1,429,301 | | | | 248,681 | | | | 143,788 | |
Distributions reinvested | | | 12,611 | | | | – | | | | 41,621 | | | | – | |
Redeemed | | | (469,521 | ) | | | (27,494 | ) | | | (126,516 | ) | | | (484,264 | ) |
Total Class A shares | | | (8,663 | ) | | | 1,401,807 | | | | 163,786 | | | | (340,476 | ) |
| | | | |
Institutional Class shares | | | | | | | | | | | | | | | | |
Sold | | | 56,137 | | | | 100,487 | | | | 483 | | | | 317,524 | |
Distributions reinvested | | | 895 | | | | – | | | | 264,134 | | | | – | |
Redeemed | | | (63,924 | ) | | | (964 | ) | | | (806,356 | ) | | | (167,122 | ) |
Total Institutional Class shares | | | (6,892 | ) | | | 99,523 | | | | (541,739 | ) | | | 150,402 | |
(a) | For the period from August 31, 2012 (inception) through October 31, 2012 |
The accompanying Notes to Financial Statements are an integral part of this schedule.
270
Thrivent Mutual Funds
Statement of Changes in Net Assets – continued
| | | | | | | | | | | | | | | | | | | | | | | | | | | | | | |
| Partner Small Cap Value Fund | | | Small Cap Stock Fund | | | Mid Cap Growth Fund | | | Partner Mid Cap Value Fund | |
| 10/31/2013 | | | 10/31/2012 | | | 10/31/2013 | | | 10/31/2012 | | | 10/31/2013 | | | 10/31/2012 | | | 10/31/2013 | | | 10/31/2012 | |
| | | | | | | | | | | | | | | | | | | | | | | | | | | | | | |
| | $2,726,874 | | | | $2,052,457 | | | | $ | (128,135) | | | $ | (521,135) | | | $162,115 | | | | $(659,828 | ) | | | $1,180,272 | | | | $1,422,035 | |
| | 8,309,634 | | | | 3,862,388 | | | | 21,067,809 | | | | 18,086,422 | | | | 51,306,325 | | | | 27,994,939 | | | | 29,517,832 | | | | 3,228,750 | |
| | 61,737,279 | | | | 19,436,689 | | | | 58,746,157 | | | | 2,341,194 | | | | 44,497,684 | | | | (8,378,199 | ) | | | 8,215,225 | | | | 9,120,146 | |
| | 72,773,787 | | | | 25,351,534 | | | | 79,685,831 | | | | 19,906,481 | | | | 95,966,124 | | | | 18,956,912 | | | | 38,913,329 | | | | 13,770,931 | |
| | | | | | | | | | | | | | | | | | | | | | | | | | | | | | |
| | (1,353,499 | ) | | | (72,063 | ) | | | – | | | | – | | | | – | | | | – | | | | (154,671 | ) | | | (78,552 | ) |
| | (3,382,127 | ) | | | (937,645 | ) | | | – | | | | – | | | | – | | | | – | | | | (1,253,387 | ) | | | (808,554 | ) |
| | (4,735,626 | ) | | | (1,009,708 | ) | | | – | | | | – | | | | – | | | | – | | | | (1,408,058 | ) | | | (887,106 | ) |
| | (1,262,964 | ) | | | (756,922 | ) | | | – | | | | – | | | | (16,658,130 | ) | | | (1,969,401 | ) | | | (416,818 | ) | | | – | |
| | (2,497,826 | ) | | | (1,493,501 | ) | | | – | | | | – | | | | (9,707,644 | ) | | | (1,129,905 | ) | | | (2,374,599 | ) | | | – | |
| | (3,760,790 | ) | | | (2,250,423 | ) | | | – | | | | – | | | | (26,365,774 | ) | | | (3,099,306 | ) | | | (2,791,417 | ) | | | – | |
| | (8,496,416 | ) | | | (3,260,131 | ) | | | – | | | | – | | | | (26,365,774 | ) | | | (3,099,306 | ) | | | (4,199,475 | ) | | | (887,106 | ) |
| | | | | | | | | | | | | | | | | | | | | | | | | | | | | | |
| | | | | | | |
| | | | | | | | | | | | | | | | | | | | | | | | | | | | | | |
| | 11,562,595 | | | | 5,763,763 | | | | 8,423,992 | | | | 7,602,804 | | | | 11,045,500 | | | | 11,101,603 | | | | 7,918,395 | | | | 1,585,359 | |
| | 2,584,648 | | | | 820,196 | | | | – | | | | – | | | | 16,413,167 | | | | 1,943,741 | | | | 565,544 | | | | 77,568 | |
| | (11,471,235 | ) | | | (11,122,924 | ) | | | (30,180,020 | ) | | | (32,732,800 | ) | | | (32,656,945 | ) | | | (31,100,462 | ) | | | (2,659,808 | ) | | | (1,903,254 | ) |
| | 2,676,008 | | | | (4,538,965 | ) | | | (21,756,028 | ) | | | (25,129,996 | ) | | | (5,198,278 | ) | | | (18,055,118 | ) | | | 5,824,131 | | | | (240,327 | ) |
| | | | | | | |
| | | | | | | | | | | | | | | | | | | | | | | | | | | | | | |
| | 19,261,067 | | | | 14,023,979 | | | | 242,014 | | | | 724,705 | | | | 11,031,998 | | | | 16,031,070 | | | | 453,391 | | | | 281,240 | |
| | 5,879,952 | | | | 2,431,146 | | | | – | | | | – | | | | 9,670,232 | | | | 1,125,713 | | | | 3,627,984 | | | | 808,554 | |
| | (38,462,728 | ) | | | (25,795,278 | ) | | | (2,456,365 | ) | | | (2,085,560 | ) | | | (45,021,488 | ) | | | (26,025,910 | ) | | | (14,435,380 | ) | | | (1,361,626 | ) |
| | (13,321,709 | ) | | | (9,340,153 | ) | | | (2,214,351 | ) | | | (1,360,855 | ) | | | (24,319,258 | ) | | | (8,869,127 | ) | | | (10,354,005 | ) | | | (271,832 | ) |
| | (10,645,701 | ) | | | (13,879,118 | ) | | | (23,970,379 | ) | | | (26,490,851 | ) | | | (29,517,536 | ) | | | (26,924,245 | ) | | | (4,529,874 | ) | | | (512,159 | ) |
| | | | | | | | | | | | | | | | | | | | | | | | | | | | | | |
| | 53,631,670 | | | | 8,212,285 | | | | 55,715,452 | | | | (6,584,370 | ) | | | 40,082,814 | | | | (11,066,639 | ) | | | 30,183,980 | | | | 12,371,666 | |
| | 220,920,593 | | | | 212,708,308 | | | | 280,030,105 | | | | 286,614,475 | | | | 379,709,405 | | | | 390,776,044 | | | | 130,511,348 | | | | 118,139,682 | |
| | $274,552,263 | | | | $220,920,593 | | | | $335,745,557 | | | | $280,030,105 | | | | $419,792,219 | | | | $379,709,405 | | | | $160,695,328 | | | | $130,511,348 | |
| | $(959,385 | ) | | | $760,871 | | | | $ | (560,955) | | | $ | (414,612) | | | $ | (65,150) | | | $(55,225 | ) | | | $722,753 | | | | $1,002,117 | |
| | | | | | | |
| | | | | | | | | | | | | | | | | | | | | | | | | | | | | | |
| | | | | | | |
| | | | | | | | | | | | | | | | | | | | | | | | | | | | | | |
| | 633,044 | | | | 375,943 | | | | 516,592 | | | | 542,602 | | | | 577,983 | | | | 609,758 | | | | 530,880 | | | | 130,008 | |
| | 163,505 | | | | 57,957 | | | | – | | | | – | | | | 950,937 | | | | 117,802 | | | | 44,241 | | | | 6,834 | |
| | (644,251 | ) | | | (721,876 | ) | | | (1,885,147 | ) | | | (2,327,430 | ) | | | (1,719,881 | ) | | | (1,710,760 | ) | | | (183,802 | ) | | | (157,207 | ) |
| | 152,298 | | | | (287,976 | ) | | | (1,368,555 | ) | | | (1,784,828 | ) | | | (190,961 | ) | | | (983,200 | ) | | | 391,319 | | | | (20,365 | ) |
| | | | | | | |
| | | | | | | | | | | | | | | | | | | | | | | | | | | | | | |
| | 1,012,613 | | | | 870,204 | | | | 12,412 | | | | 46,917 | | | | 506,007 | | | | 787,890 | | | | 31,236 | | | | 23,193 | |
| | 354,513 | | | | 161,594 | | | | – | | | | – | | | | 492,124 | | | | 60,784 | | | | 282,966 | | | | 71,176 | |
| | (2,004,239 | ) | | | (1,604,851 | ) | | | (132,413 | ) | | | (134,487 | ) | | | (2,047,604 | ) | | | (1,270,759 | ) | | | (1,011,008 | ) | | | (111,417 | ) |
| | (637,113 | ) | | | (573,053 | ) | | | (120,001 | ) | | | (87,570 | ) | | | (1,049,473 | ) | | | (422,085 | ) | | | (696,806 | ) | | | (17,048 | ) |
The accompanying Notes to Financial Statements are an integral part of this schedule.
271
Thrivent Mutual Funds
Statement of Changes in Net Assets – continued
| | | | | | | | | | | | | | | | |
| | | Mid Cap Stock Fund | | | Partner Worldwide
Allocation Fund | |
For the periods ended | | 10/31/2013 | | | 10/31/2012 | | | 10/31/2013 | | | 10/31/2012 | |
Operations | | | | | | | | | | | | | | | | |
Net investment income/(loss) | | | $1,637,149 | | | | $428,880 | | | | $14,917,634 | | | | $14,890,250 | |
Net realized gains/(losses) | | | 88,843,201 | | | | 60,824,551 | | | | 37,724,676 | | | | (550,430 | ) |
Change in net unrealized appreciation/(depreciation) | | | 143,065,706 | | | | (7,148,855 | ) | | | 93,871,912 | | | | 28,836,837 | |
Net Change in Net Assets Resulting From Operations | | | 233,546,056 | | | | 54,104,576 | | | | 146,514,222 | | | | 43,176,657 | |
Distributions to Shareholders | | | | | | | | | | | | | | | | |
From net investment income Class A | | | (29,944 | ) | | | – | | | | (3,225,457 | ) | | | (1,608,097 | ) |
From net investment income Institutional Class | | | (970,124 | ) | | | – | | | | (13,459,680 | ) | | | (5,022,998 | ) |
Total From Net Investment Income | | | (1,000,068 | ) | | | – | | | | (16,685,137 | ) | | | (6,631,095 | ) |
From net realized gains Class A | | | – | | | | – | | | | – | | | | – | |
From net realized gains Institutional Class | | | – | | | | – | | | | – | | | | – | |
Total From Net Realized Gains | | | – | | | | – | | | | – | | | | – | |
Total Distributions to Shareholders | | | (1,000,068 | ) | | | – | | | | (16,685,137 | ) | | | (6,631,095 | ) |
Capital Stock Transactions | | | | | | | | | | | | | | | | |
| | | | |
Class A | | | | | | | | | | | | | | | | |
Sold | | | 18,456,958 | | | | 14,058,207 | | | | 14,773,299 | | | | 10,087,585 | |
Distributions reinvested | | | 29,576 | | | | (1,305 | ) | | | 3,174,570 | | | | 1,586,088 | |
Redeemed | | | (71,349,629 | ) | | | (72,900,438 | ) | | | (23,655,967 | ) | | | (39,668,003 | ) |
Total Class A Capital Stock Transactions | | | (52,863,095 | ) | | | (58,843,536 | ) | | | (5,708,098 | ) | | | (27,994,330 | ) |
| | | | |
Institutional Class | | | | | | | | | | | | | | | | |
Sold | | | 8,927,276 | | | | 7,740,246 | | | | 27,875,874 | | | | 40,496,317 | |
Distributions reinvested | | | 964,440 | | | | – | | | | 13,394,077 | | | | 4,998,295 | |
Redeemed | | | (12,128,253 | ) | | | (19,446,120 | ) | | | (16,423,607 | ) | | | (7,701,083 | ) |
Total Institutional Class Capital Stock Transactions | | | (2,236,537 | ) | | | (11,705,874 | ) | | | 24,846,344 | | | | 37,793,529 | |
Capital Stock Transactions | | | (55,099,632 | ) | | | (70,549,410 | ) | | | 19,138,246 | | | | 9,799,199 | |
| | | | | | | | | | | | | | | | |
Net Increase/(Decrease) in Net Assets | | | 177,446,356 | | | | (16,444,834 | ) | | | 148,967,331 | | | | 46,344,761 | |
Net Assets, Beginning of Period | | | 737,943,361 | | | | 754,388,195 | | | | 704,167,909 | | | | 657,823,148 | |
Net Assets, End of Period | | | $915,389,717 | | | | $737,943,361 | | | | $853,135,240 | | | | $704,167,909 | |
Accumulated Undistributed Net Investment Income/(Loss) | | | $348,182 | | | | $(45,558 | ) | | | $14,765,864 | | | | $14,470,995 | |
| | | | |
Capital Stock Share Transactions | | | | | | | | | | | | | | | | |
| | | | |
Class A shares | | | | | | | | | | | | | | | | |
Sold | | | 1,031,695 | | | | 946,125 | | | | 1,559,831 | | | | 1,211,715 | |
Distributions reinvested | | | 1,883 | | | | (91 | ) | | | 353,516 | | | | 204,130 | |
Redeemed | | | (4,084,043 | ) | | | (4,886,042 | ) | | | (2,531,950 | ) | | | (4,808,833 | ) |
Total Class A shares | | | (3,050,465 | ) | | | (3,940,008 | ) | | | (618,603 | ) | | | (3,392,988 | ) |
| | | | |
Institutional Class shares | | | | | | | | | | | | | | | | |
Sold | | | 461,543 | | | | 486,111 | | | | 3,082,665 | | | | 4,960,787 | |
Distributions reinvested | | | 56,899 | | | | – | | | | 1,486,579 | | | | 641,630 | |
Redeemed | | | (646,471 | ) | | | (1,207,389 | ) | | | (1,738,618 | ) | | | (916,945 | ) |
Total Institutional Class shares | | | (128,029 | ) | | | (721,278 | ) | | | 2,830,626 | | | | 4,685,472 | |
The accompanying Notes to Financial Statements are an integral part of this schedule.
272
Thrivent Mutual Funds
Statement of Changes in Net Assets – continued
| | | | | | | | | | | | | | | | | | | | | | | | | | | | | | |
| Large Cap Growth Fund | | | Large Cap Value Fund | | | Large Cap Stock Fund | | | High Yield Fund | |
| 10/31/2013 | | | 10/31/2012 | | | 10/31/2013 | | | 10/31/2012 | | | 10/31/2013 | | | 10/31/2012 | | | 10/31/2013 | | | 10/31/2012 | |
| | | | | | | | | | | | | | | | | | | | | | | | | | | | | | |
| | $1,497,172 | | | | $1,469,258 | | | | $10,307,443 | | | | $9,634,332 | | | | $14,111,935 | | | | $13,814,421 | | | | $49,654,265 | | | | $51,788,925 | |
| | 29,928,964 | | | | 25,811,938 | | | | 34,214,015 | | | | 34,221,609 | | | | 160,219,793 | | | | 87,831,573 | | | | 20,155,611 | | | | 5,003,403 | |
| | 72,685,261 | | | | 10,068,813 | | | | 120,540,096 | | | | 33,858,232 | | | | 187,091,208 | | | | 72,574,809 | | | | (7,786,741 | ) | | | 38,886,156 | |
| | 104,111,397 | | | | 37,350,009 | | | | 165,061,554 | | | | 77,714,173 | | | | 361,422,936 | | | | 174,220,803 | | | | 62,023,135 | | | | 95,678,484 | |
| | | | | | | | | | | | | | | | | | | | | | | | | | | | | | |
| | (404,216 | ) | | | – | | | | (2,688,302 | ) | | | (2,169,450 | ) | | | (15,271,693 | ) | | | (9,327,896 | ) | | | (32,344,516 | ) | | | (32,753,321 | ) |
| | (1,479,199 | ) | | | (13,488 | ) | | | (8,417,513 | ) | | | (6,836,912 | ) | | | (2,714,556 | ) | | | (1,875,088 | ) | | | (16,976,987 | ) | | | (18,753,112 | ) |
| | (1,883,415 | ) | | | (13,488 | ) | | | (11,105,815 | ) | | | (9,006,362 | ) | | | (17,986,249 | ) | | | (11,202,984 | ) | | | (49,321,503 | ) | | | (51,506,433 | ) |
| | – | | | | – | | | | – | | | | – | | | | (73,722,998 | ) | | | – | | | | – | | | | – | |
| | – | | | | – | | | | – | | | | – | | | | (9,153,189 | ) | | | – | | | | – | | | | – | |
| | – | | | | – | | | | – | | | | – | | | | (82,876,187 | ) | | | – | | | | – | | | | – | |
| | (1,883,415 | ) | | | (13,488 | ) | | | (11,105,815 | ) | | | (9,006,362 | ) | | | (100,862,436 | ) | | | (11,202,984 | ) | | | (49,321,503 | ) | | | (51,506,433 | ) |
| | | | | | | | | | | | | | | | | | | | | | | | | | | | | | |
| | | | | | | |
| | | | | | | | | | | | | | | | | | | | | | | | | | | | | | |
| | 16,054,379 | | | | 12,362,061 | | | | 21,329,399 | | | | 8,777,138 | | | | 36,786,359 | | | | 31,996,054 | | | | 70,014,924 | | | | 76,377,949 | |
| | 398,326 | | | | – | | | �� | 2,608,342 | | | | 2,110,852 | | | | 87,422,326 | | | | 9,174,488 | | | | 23,378,734 | | | | 23,331,994 | |
| | (20,401,935 | ) | | | (18,151,402 | ) | | | (25,765,830 | ) | | | (25,305,098 | ) | | | (181,201,142 | ) | | | (198,360,312 | ) | | | (82,362,996 | ) | | | (53,561,522 | ) |
| | (3,949,230 | ) | | | (5,789,341 | ) | | | (1,828,089 | ) | | | (14,417,108 | ) | | | (56,992,457 | ) | | | (157,189,770 | ) | | | 11,030,662 | | | | 46,148,421 | |
| | | | | | | |
| | | | | | | | | | | | | | | | | | | | | | | | | | | | | | |
| | 549,797 | | | | 1,219,731 | | | | 36,419,442 | | | | 21,350,756 | | | | 6,505,878 | | | | 5,003,328 | | | | 39,509,667 | | | | 46,507,732 | |
| | 1,469,664 | | | | 13,397 | | | | 8,390,885 | | | | 6,815,490 | | | | 11,805,198 | | | | 1,862,179 | | | | 14,565,046 | | | | 15,061,146 | |
| | (6,327,076 | ) | | | (4,911,445 | ) | | | (47,570,098 | ) | | | (28,853,618 | ) | | | (25,319,710 | ) | | | (23,667,338 | ) | | | (102,888,237 | ) | | | (34,843,781 | ) |
| | (4,307,615 | ) | | | (3,678,317 | ) | | | (2,759,771 | ) | | | (687,372 | ) | | | (7,008,634 | ) | | | (16,801,831 | ) | | | (48,813,524 | ) | | | 26,725,097 | |
| | (8,256,845 | ) | | | (9,467,658 | ) | | | (4,587,860 | ) | | | (15,104,480 | ) | | | (64,001,091 | ) | | | (173,991,601 | ) | | | (37,782,862 | ) | | | 72,873,518 | |
| | | | | | | | | | | | | | | | | | | | | | | | | | | | | | |
| | 93,971,137 | | | | 27,868,863 | | | | 149,367,879 | | | | 53,603,331 | | | | 196,559,409 | | | | (10,973,782 | ) | | | (25,081,230 | ) | | | 117,045,569 | |
| | 349,884,741 | | | | 322,015,878 | | | | 574,187,024 | | | | 520,583,693 | | | | 1,552,766,773 | | | | 1,563,740,555 | | | | 805,739,333 | | | | 688,693,764 | |
| | $443,855,878 | | | | $349,884,741 | | | | $723,554,903 | | | | $574,187,024 | | | | $1,749,326,182 | | | | $1,552,766,773 | | | | $780,658,103 | | | | $805,739,333 | |
| | $1,019,085 | | | | $1,394,354 | | | | $6,844,473 | | | | $7,418,453 | | | | $6,551,507 | | | | $10,294,234 | | | | $69,740 | | | | $(40,750 | ) |
| | | | | | | |
| | | | | | | | | | | | | | | | | | | | | | | | | | | | | | |
| | | | | | | |
| | | | | | | | | | | | | | | | | | | | | | | | | | | | | | |
| | 2,591,348 | | | | 2,322,784 | | | | 1,246,055 | | | | 636,502 | | | | 1,486,083 | | | | 1,411,090 | | | | 13,814,258 | | | | 15,686,279 | |
| | 72,423 | | | | – | | | | 177,922 | | | | 162,749 | | | | 3,906,794 | | | | 436,257 | | | | 4,619,204 | | | | 4,806,324 | |
| | (3,362,021 | ) | | | (3,459,864 | ) | | | (1,561,202 | ) | | | (1,842,703 | ) | | | (7,354,688 | ) | | | (8,794,470 | ) | | | (16,295,729 | ) | | | (11,082,025 | ) |
| | (698,250 | ) | | | (1,137,080 | ) | | | (137,225 | ) | | | (1,043,452 | ) | | | (1,961,811 | ) | | | (6,947,123 | ) | | | 2,137,733 | | | | 9,410,578 | |
| | | | | | | |
| | | | | | | | | | | | | | | | | | | | | | | | | | | | | | |
| | 81,133 | | | | 227,497 | | | | 2,146,274 | | | | 1,544,526 | | | | 260,982 | | | | 221,930 | | | | 7,785,866 | | | | 9,550,400 | |
| | 249,096 | | | | 2,612 | | | | 570,808 | | | | 523,865 | | | | 524,234 | | | | 88,213 | | | | 2,875,606 | | | | 3,101,077 | |
| | (937,745 | ) | | | (883,140 | ) | | | (2,842,955 | ) | | | (2,077,997 | ) | | | (987,156 | ) | | | (1,087,231 | ) | | | (20,475,127 | ) | | | (7,234,550 | ) |
| | (607,516 | ) | | | (653,031 | ) | | | (125,873 | ) | | | (9,606 | ) | | | (201,940 | ) | | | (777,088 | ) | | | (9,813,655 | ) | | | 5,416,927 | |
The accompanying Notes to Financial Statements are an integral part of this schedule.
273
Thrivent Mutual Funds
Statement of Changes in Net Assets – continued
| | | | | | | | | | | | | | | | |
| | | Income Fund | | | Municipal Bond Fund | |
For the periods ended | | 10/31/2013 | | | 10/31/2012 | | | 10/31/2013 | | | 10/31/2012 | |
Operations | | | | | | | | | | | | | | | | |
Net investment income/(loss) | | | $30,815,311 | | | | $32,375,832 | | | | $58,660,854 | | | | $58,148,095 | |
Net realized gains/(losses) | | | 15,545,122 | | | | 6,682,760 | | | | (8,035,549 | ) | | | 1,165,769 | |
Change in net unrealized appreciation/(depreciation) | | | (43,371,691 | ) | | | 50,096,331 | | | | (97,358,879 | ) | | | 80,759,589 | |
Net Change in Net Assets Resulting From Operations | | | 2,988,742 | | | | 89,154,923 | | | | (46,733,574 | ) | | | 140,073,453 | |
Distributions to Shareholders | | | | | | | | | | | | | | | | |
From net investment income Class A | | | (14,879,564 | ) | | | (15,152,431 | ) | | | (54,842,160 | ) | | | (54,235,793 | ) |
From net investment income Institutional Class | | | (15,646,286 | ) | | | (16,888,569 | ) | | | (3,773,232 | ) | | | (3,912,302 | ) |
Total From Net Investment Income | | | (30,525,850 | ) | | | (32,041,000 | ) | | | (58,615,392 | ) | | | (58,148,095 | ) |
From net realized gains Class A | | | – | | | | – | | | | (547,348 | ) | | | – | |
From net realized gains Institutional Class | | | – | | | | – | | | | (36,124 | ) | | | – | |
Total From Net Realized Gains | | | – | | | | – | | | | (583,472 | ) | | | – | |
Total Distributions to Shareholders | | | (30,525,850 | ) | | | (32,041,000 | ) | | | (59,198,864 | ) | | | (58,148,095 | ) |
Capital Stock Transactions | | | | | | | | | | | | | | | | |
| | | | |
Class A | | | | | | | | | | | | | | | | |
Sold | | | 48,916,747 | | | | 54,132,265 | | | | 140,091,779 | | | | 186,898,390 | |
Distributions reinvested | | | 12,699,603 | | | | 12,828,346 | | | | 46,416,103 | | | | 45,255,062 | |
Redeemed | | | (75,677,530 | ) | | | (45,329,117 | ) | | | (221,700,298 | ) | | | (116,539,725 | ) |
Total Class A Capital Stock Transactions | | | (14,061,180 | ) | | | 21,631,494 | | | | (35,192,416 | ) | | | 115,613,727 | |
| | | | |
Institutional Class | | | | | | | | | | | | | | | | |
Sold | | | 38,561,466 | | | | 60,999,457 | | | | 29,774,716 | | | | 37,413,504 | |
Distributions reinvested | | | 15,396,482 | | | | 16,641,954 | | | | 3,476,664 | | | | 3,569,918 | |
Redeemed | | | (93,699,471 | ) | | | (51,287,785 | ) | | | (37,618,353 | ) | | | (30,129,328 | ) |
Total Institutional Class Capital Stock Transactions | | | (39,741,523 | ) | | | 26,353,626 | | | | (4,366,973 | ) | | | 10,854,094 | |
Capital Stock Transactions | | | (53,802,703 | ) | | | 47,985,120 | | | | (39,559,389 | ) | | | 126,467,821 | |
| | | | | | | | | | | | | | | | |
Net Increase/(Decrease) in Net Assets | | | (81,339,811 | ) | | | 105,099,043 | | | | (145,491,827 | ) | | | 208,393,179 | |
Net Assets, Beginning of Period | | | 904,125,396 | | | | 799,026,353 | | | | 1,634,499,778 | | | | 1,426,106,599 | |
Net Assets, End of Period | | | $822,785,585 | | | | $904,125,396 | | | | $1,489,007,951 | | | | $1,634,499,778 | |
Accumulated Undistributed Net Investment Income/(Loss) | | | $(105,936) | | | | $(125,835) | | | | $(17,489) | | | | $(62,577) | |
| | | | |
Capital Stock Share Transactions | | | | | | | | | | | | | | | | |
| | | | |
Class A shares | | | | | | | | | | | | | | | | |
Sold | | | 5,276,778 | | | | 5,985,753 | | | | 11,932,896 | | | | 15,932,923 | |
Distributions reinvested | | | 1,382,689 | | | | 1,421,324 | | | | 4,011,775 | | | | 3,853,694 | |
Redeemed | | | (8,265,779 | ) | | | (5,042,251 | ) | | | (19,357,370 | ) | | | (9,949,435 | ) |
Total Class A shares | | | (1,606,312 | ) | | | 2,364,826 | | | | (3,412,699 | ) | | | 9,837,182 | |
| | | | |
Institutional Class shares | | | | | | | | | | | | | | | | |
Sold | | | 4,222,489 | | | | 6,782,001 | | | | 2,590,468 | | | | 3,199,745 | |
Distributions reinvested | | | 1,676,541 | | | | 1,844,971 | | | | 300,402 | | | | 303,961 | |
Redeemed | | | (10,151,692 | ) | | | (5,748,876 | ) | | | (3,267,521 | ) | | | (2,566,745 | ) |
Total Institutional Class shares | | | (4,252,662 | ) | | | 2,878,096 | | | | (376,651 | ) | | | 936,961 | |
The accompanying Notes to Financial Statements are an integral part of this schedule.
274
Thrivent Mutual Funds
Statement of Changes in Net Assets – continued
| | | | | | | | | | | | | | | | | | | | | | |
| Government Bond Fund | | | Limited Maturity Bond Fund | | | Money Market Fund | |
| 10/31/2013 | | | 10/31/2012 | | | 10/31/2013 | | | 10/31/2012 | | | 10/31/2013 | | | 10/31/2012 | |
| | | | | | | | | | | | | | | | | | | | | | |
| | $1,042,571 | | | | $1,474,305 | | | | $11,848,588 | | | | $15,037,950 | | | | $(7,606) | | | | $(1,271 | ) |
| | 1,214,424 | | | | 3,955,281 | | | | 6,755,078 | | | | 3,040,338 | | | | 7,606 | | | | 1,271 | |
| | (4,373,218 | ) | | | (742,442 | ) | | | (13,980,400 | ) | | | 12,005,342 | | | | – | | | | – | |
| | (2,116,223 | ) | | | 4,687,144 | | | | 4,623,266 | | | | 30,083,630 | | | | – | | | | – | |
| | | | | | | | | | | | | | | | | | | | | | |
| | (104,571 | ) | | | (119,305 | ) | | | (5,161,696 | ) | | | (5,306,573 | ) | | | – | | | | – | |
| | (979,000 | ) | | | (1,355,000 | ) | | | (6,417,807 | ) | | | (9,221,678 | ) | | | – | | | | – | |
| | (1,083,571 | ) | | | (1,474,305 | ) | | | (11,579,503 | ) | | | (14,528,251 | ) | | | – | | | | – | |
| | (561,671 | ) | | | (211,872 | ) | | | – | | | | – | | | | – | | | | – | |
| | (3,340,936 | ) | | | (2,209,175 | ) | | | – | | | | – | | | | – | | | | – | |
| | (3,902,607 | ) | | | (2,421,047 | ) | | | – | | | | – | | | | – | | | | – | |
| | (4,986,178 | ) | | | (3,895,352 | ) | | | (11,579,503 | ) | | | (14,528,251 | ) | | | – | | | | – | |
| | | | | | | | | | | | | | | | | | | | | | |
| | | | | |
| | | | | | | | | | | | | | | | | | | | | | |
| | 6,322,053 | | | | 10,297,214 | | | | 258,503,473 | | | | 206,880,185 | | | | 569,755,513 | | | | 505,037,332 | |
| | 655,868 | | | | 322,703 | | | | 4,977,407 | | | | 5,128,349 | | | | (66 | ) | | | – | |
| | (7,528,860 | ) | | | (3,483,749 | ) | | | (252,539,425 | ) | | | (155,039,162 | ) | | | (594,636,284 | ) | | | (599,026,272 | ) |
| | (550,939 | ) | | | 7,136,168 | | | | 10,941,455 | | | | 56,969,372 | | | | (24,880,837 | ) | | | (93,988,940 | ) |
| | | | | |
| | | | | | | | | | | | | | | | | | | | | | |
| | 22,720,675 | | | | 12,162,989 | | | | 89,771,765 | | | | 83,075,844 | | | | 3,561,959 | | | | 6,176,252 | |
| | 4,285,753 | | | | 3,540,589 | | | | 6,369,137 | | | | 9,168,683 | | | | – | | | | – | |
| | (23,917,684 | ) | | | (12,928,987 | ) | | | (117,298,195 | ) | | | (213,356,680 | ) | | | (9,556,929 | ) | | | (5,211,686 | ) |
| | 3,088,744 | | | | 2,774,591 | | | | (21,157,293 | ) | | | (121,112,153 | ) | | | (5,994,970 | ) | | | 964,566 | |
| | 2,537,805 | | | | 9,910,759 | | | | (10,215,838 | ) | | | (64,142,781 | ) | | | (30,875,807 | ) | | | (93,024,374 | ) |
| | | | | | | | | | | | | | | | | | | | | | |
| | (4,564,596 | ) | | | 10,702,551 | | | | (17,172,075 | ) | | | (48,587,402 | ) | | | (30,875,807 | ) | | | (93,024,374 | ) |
| | 112,577,769 | | | | 101,875,218 | | | | 880,870,694 | | | | 929,458,096 | | | | 506,422,895 | | | | 599,447,269 | |
| | $108,013,173 | | | | $112,577,769 | | | | $863,698,619 | | | | $880,870,694 | | | | $475,547,088 | | | | $506,422,895 | |
| | $(5,541 | ) | | | $67,870 | | | | $287,004 | | | | $33,418 | | | | $– | | | | $– | |
| | | | | |
| | | | | | | | | | | | | | | | | | | | | | |
| | | | | |
| | | | | | | | | | | | | | | | | | | | | | |
| | 616,692 | | | | 965,428 | | | | 20,522,700 | | | | 16,553,075 | | | | 569,755,511 | | | | 505,037,329 | |
| | 63,475 | | | | 30,503 | | | | 396,101 | | | | 410,636 | | | | (66 | ) | | | – | |
| | (738,898 | ) | | | (327,092 | ) | | | (20,096,511 | ) | | | (12,417,077 | ) | | | (594,636,282 | ) | | | (599,026,270 | ) |
| | (58,731 | ) | | | 668,839 | | | | 822,290 | | | | 4,546,634 | | | | (24,880,837 | ) | | | (93,988,941 | ) |
| | | | | |
| | | | | | | | | | | | | | | | | | | | | | |
| | 2,269,773 | | | | 1,135,462 | | | | 7,141,565 | | | | 6,650,362 | | | | 3,561,959 | | | | 6,176,252 | |
| | 415,357 | | | | 334,592 | | | | 506,916 | | | | 734,882 | | | | – | | | | – | |
| | (2,305,247 | ) | | | (1,205,506 | ) | | | (9,326,704 | ) | | | (17,074,059 | ) | | | (9,556,929 | ) | | | (5,211,686 | ) |
| | 379,883 | | | | 264,548 | | | | (1,678,223 | ) | | | (9,688,815 | ) | | | (5,994,970 | ) | | | 964,566 | |
The accompanying Notes to Financial Statements are an integral part of this schedule.
275
Thrivent Mutual Funds
Notes to Financial Statements
October 31, 2013
(1) ORGANIZATION
Thrivent Mutual Funds (the “Trust”) was organized as a Massachusetts Business Trust on March 10, 1987 and is registered as an open-end management investment company under the Investment Company Act of 1940 (the “1940 Act”). The Trust is divided into twenty-six separate series (each, a “Fund” and, collectively, the “Funds”), each with its own investment objective and policies. The Trust currently consists of four allocation funds, twelve equity funds, four hybrid funds, five fixed-income funds and one money market fund. Thrivent Natural Resources Fund, Thrivent Growth and Income Plus Fund (formerly Equity Income Plus Fund) and Thrivent Diversified Income Plus Fund have a fiscal year end on a calendar-year basis and are presented under a separate shareholder report.
(A) Share Classes – As of October 31, 2013, the Trust includes two classes of shares: Class A and Institutional Class. The classes of shares differ principally in their respective distribution expenses and other class-specific expenses and arrangements. Class A shares have a 0.25% annual 12b-1 fee and a maximum front-end sales load of 5.50% for equity funds and 4.50% for fixed-income funds, although some of the fixed-income funds have reduced 12b-1 fees and either a reduced or no front-end sales load. Institutional Class shares are offered at net asset value and have no annual 12b-1 fees. The share classes have identical rights to earnings, assets and voting privileges, except for class-specific expenses and exclusive rights to vote on matters affecting only individual classes. All 26 Funds of the Trust offer Class A and Institutional Class shares.
(B) Other – Under the Trust’s organizational documents, its officers and trustees are indemnified against certain liabilities arising out of the performance of their duties to the Trust. In addition, in the normal course of business, the Trust enters into contracts with vendors and others that provide general damage clauses. The Trust’s maximum exposure under these contracts is unknown, as this would involve future claims that may be made against the Trust. However, based on experience, the Trust expects the risk of loss to be remote.
(2) SIGNIFICANT ACCOUNTING POLICIES
(A) Valuation of Investments – Securities traded on U.S. or foreign securities exchanges or included in a national market system are valued at the official closing price at the close of each business day unless otherwise stated below. Over-the-counter securities and listed securities for which no price is readily available are valued at the current bid price considered best to represent the value at that time. Swap agreements are valued at the fair value of the contract as furnished by an independent pricing service. Security prices are based on quotes that are obtained from an independent pricing service approved by the Trust’s Board of Trustees (“Board”). The pricing service, in determining values of fixed-income securities, takes into consideration such factors as current quotations by broker/dealers, coupon, maturity, quality, type of issue, trading characteristics, and other yield and risk factors it deems relevant in determining valuations. Securities which cannot be valued by the approved pricing service are valued using valuations obtained from dealers that make markets in the securities. Exchange-listed options and futures contracts are valued at the last quoted sales price. Investments in mutual funds are valued at the net asset value at the close of each business day. Short-term securities are valued at amortized cost (which approximates market value) to the extent it is not materially different than market value.
Securities held by Money Market Fund are valued on the basis of amortized cost (which approximates market value), whereby a portfolio security is valued at its cost initially and thereafter valued to reflect a constant amortization to maturity of any discount or premium. Money Market Fund and the Trust’s investment adviser, Thrivent Asset Management, LLC (“Thrivent Asset Mgt.” or the “Adviser”), follow procedures designed to help maintain a constant net asset value of $1.00 per share.
The Board has delegated responsibility for daily valuation to the Adviser. The Adviser has formed a Valuation Committee (“Committee”) that is responsible for overseeing the Fund valuation policies in accordance with Valuation Policies and Procedures. The Committee meets on a monthly and on an as-needed basis to review price challenges, price overrides, stale prices, shadow prices, manual prices, money market pricing, international fair valuation, and other securities requiring fair valuation.
The Committee monitors for significant events occurring prior to the close of trading on the New York Stock Exchange that could have a material impact on the value of any securities that are held by the Funds. Examples of such events include trading halts, national news/events, and issuer-specific developments. If the Committee decides that such events warrant using fair value estimates, the Committee will take such events into consideration in determining the fair value of such securities. If market quotations or prices are not readily available or determined to be unreliable, the securities will be valued at fair value as determined in good faith pursuant to procedures adopted by the Board.
Financial Accounting Standards Board (FASB) guidelines require increased fair value disclosure intended to improve the consistency and comparability of fair value measurements used in financial reporting. The guidelines define fair value, establish a framework for measuring fair value in U.S. Generally Accepted Accounting Principles (“GAAP”) and expand disclosures about fair value requirements. The various inputs used to determine the fair value of the Funds’ investments are summarized in three broad levels: Level 1 includes quoted prices in active markets for identical securities, typically included in this level are U.S. equity securities, futures, options and registered investment company funds; Level 2 includes other significant observable inputs such as quoted prices for similar securities, interest rates, prepayment speeds and credit risk, typically included
276
Thrivent Mutual Funds
Notes to Financial Statements
October 31, 2013
in this level are fixed income securities, international securities, swaps and forward contracts; and Level 3 includes significant unobservable inputs such as the Adviser’s own assumptions and broker evaluations in determining the fair value of investments. Of the Level 3 securities, those for which market values were not readily available or were deemed unreliable were fair valued as determined in good faith under procedures established by the Board. As of October 31, 2013, the following funds held these types of Level 3 securities:
| | | | |
Fund | | Number of
Securities | | Percent of Fund’s
Net Assets |
Partner Worldwide Allocation | | 5 | | 0.27% |
High Yield | | 2 | | 0.05% |
Valuation of International Securities – Because many foreign markets close before the U.S. markets, events may occur between the close of the foreign markets and the close of the U.S. markets that could have a material impact on the valuation of foreign securities. The Funds, under the supervision of the Board, evaluate the impacts of these events and may adjust the valuation of foreign securities to reflect fair value as of the close of the U.S. markets. The Board has authorized the Adviser to make fair valuation determinations pursuant to policies approved by the Board.
(B) Foreign Currency Translation – The accounting records of each Fund are maintained in U.S. dollars. Securities and other assets and liabilities that are denominated in foreign currencies are translated into U.S. dollars at the daily closing rates of exchange.
Foreign currency amounts related to the purchase or sale of securities and income and expenses are translated at the exchange rate on the transaction date. Net realized and unrealized currency gains and losses are recorded from sales of foreign currency, exchange gains or losses between the trade date and settlement date on securities transactions, and other translation gains or losses on dividends, interest income and foreign withholding taxes. The Funds do not separately report the effect of changes in foreign exchange rates from changes in market prices on securities held. Such changes are included in net realized and unrealized gain or loss from investments in the Statement of Operations.
For federal income tax purposes, the Funds treat the effect of changes in foreign exchange rates arising from actual foreign currency transactions and the changes in foreign exchange rates between the trade date and settlement date as ordinary income.
(C) Foreign Currency Forward Contracts – In connection with purchases and sales of securities denominated in foreign currencies, all Funds, except Money Market Fund, may enter into foreign currency forward contracts. Additionally, the Funds may enter into such contracts to hedge certain other foreign-currency-denominated investments. These contracts are recorded at value and the related realized and unrealized foreign exchange gains and losses are included in the Statement of Operations. In the event that counterparties fail to settle these forward contracts, the Funds could be exposed to foreign currency fluctuations. Foreign currency contracts are valued daily and unrealized appreciation or depreciation is recorded daily as the difference between the contract exchange rate and the closing forward rate applied to the face amount of the contract. A realized gain or loss is recorded at the time a forward contract is closed. These contracts are over-the-counter and the Fund is exposed to counterparty risk equal to the discounted net amount of payments to the Fund. This risk is partially mitigated by the Fund’s collateral posting requirements.
(D) Foreign Denominated Investments – Foreign denominated assets and currency contracts may involve more risks than domestic transactions including currency risk, political and economic risk, regulatory risk, and market risk. Certain Funds may also invest in securities of companies located in emerging markets. Future economic or political developments could adversely affect the liquidity or value, or both, of such securities.
(E) Federal Income Taxes – No provision has been made for income taxes because each Fund’s policy is to qualify as a regulated investment company under the Internal Revenue Code and distribute substantially all investment company taxable income and net capital gain on a timely basis. It is also the intention of each Fund to distribute an amount sufficient to avoid imposition of any federal excise tax. The Funds, accordingly, anticipate paying no federal taxes and no federal tax provision was recorded. Each Fund is treated as a separate taxable entity for federal income tax purposes. Certain Funds may utilize earnings and profits distributed to shareholders on the redemption of shares as part of the dividends paid deduction.
Foreign Income Taxes – Certain Funds are subject to foreign income taxes imposed by certain countries in which they invest. Withholding taxes on foreign dividends have been provided for in accordance with the applicable country’s tax rules and rates. These amounts are shown as foreign dividend tax withholding on the Statement of Operations. The Funds pay tax on foreign capital gains, where applicable.
GAAP requires management of the Funds (i.e., the Adviser) to make additional tax disclosures with respect to the tax effects of certain income tax positions, whether those positions were taken on previously filed tax returns or are expected to be taken on future returns. These positions must meet a “more likely than not” standard that, based on the technical merits of the position, would have a greater than 50 percent likelihood of being sustained upon examination. In evaluating whether a tax position has met the more-likely-than-not recognition threshold, the Adviser must presume that the position will be examined by the appropriate taxing authority that has full knowledge of all relevant information.
277
Thrivent Mutual Funds
Notes to Financial Statements
October 31, 2013
The Adviser analyzed all open tax years, as defined by the statute of limitations, for all major jurisdictions. Open tax years are those that are open for examination by taxing authorities. Major jurisdictions for the Funds include U.S. Federal, Minnesota, Wisconsin, and Massachusetts as well as certain foreign countries. As of October 31, 2013, open U.S. Federal, Minnesota, Wisconsin and Massachusetts tax years include the tax years ended October 31, 2010 through 2013. Additionally, as of October 31, 2013, the tax year ended October 31, 2009 is open for Wisconsin. The Funds have no examinations in progress and none are expected at this time.
As of October 31, 2013, the Adviser has reviewed all open tax years and major jurisdictions and concluded that there is no effect to the Funds’ tax liability, financial position or results of operations. There is no tax liability resulting from unrecognized tax benefits related to uncertain income tax positions taken or expected to be taken in future tax returns. The Funds are also not aware of any tax positions for which it is reasonably possible that the total amounts of unrecognized tax benefits will significantly change in the next 12 months.
(F) Expenses and Income – Estimated expenses are accrued daily. The Funds are charged for those expenses that are directly attributable to them. Expenses that are not directly attributable to a Fund are allocated among all appropriate Funds in proportion to their respective net assets, number of shareholder accounts or other reasonable basis. Net investment income, expenses which are not class-specific, and realized and unrealized gains and losses are allocated directly to each class based upon the relative net asset value of outstanding shares.
Interest income is accrued daily and is determined on the basis of interest or discount earned on all debt securities, including accretion of market discount and original issue discount and amortization of premium. Paydown gains and losses on mortgage- and asset-backed securities are recorded as components of interest income. Dividend income is recorded on the ex-dividend date.
For certain securities, including real estate investment trusts, the Trust records distributions received in excess of income as a reduction of cost of investments and/or realized gain. Such amounts are based on estimates if actual amounts are not available. Actual amounts of income, realized gain and return of capital may differ from the estimated amounts. The Trust adjusts the estimated amounts of the components of distributions as adjustments to investment income, unrealized appreciation/depreciation and realized gain/loss on investments as necessary, once the issuers provide information about the actual composition of the distributions.
(G) Custody Earnings Credit – The Funds have a deposit arrangement with the custodian whereby interest earned on uninvested cash balances is used to pay a portion of custodian fees. This deposit arrangement is an alternative to overnight investments. Earnings credits are shown as a reduction of total expenses on the Statement of Operations.
(H) Distributions to Shareholders – Dividend and capital gain distributions are recorded on the ex-dividend date. With the exception of Money Market Fund, net realized gains from securities transactions, if any, are paid at least annually after the close of the fiscal year.
| | | | | | | | |
Fund | | Dividends
Declared | | | Dividends
Paid | |
Aggressive Allocation | | | Annually | | | | Annually | |
Moderately Aggressive Allocation | | | Annually | | | | Annually | |
Moderate Allocation | | | Quarterly | | | | Quarterly | |
Moderately Conservative Allocation | | | Quarterly | | | | Quarterly | |
Balanced Income Plus | | | Quarterly | | | | Quarterly | |
Opportunity Income Plus | | | Daily | | | | Monthly | |
Partner Emerging Markets Equity | | | Annually | | | | Annually | |
Partner Small Cap Growth | | | Annually | | | | Annually | |
Partner Small Cap Value | | | Annually | | | | Annually | |
Small Cap Stock | | | Annually | | | | Annually | |
Mid Cap Growth | | | Annually | | | | Annually | |
Partner Mid Cap Value | | | Annually | | | | Annually | |
Mid Cap Stock | | | Annually | | | | Annually | |
Partner Worldwide Allocation | | | Annually | | | | Annually | |
Large Cap Growth | | | Annually | | | | Annually | |
Large Cap Value | | | Annually | | | | Annually | |
Large Cap Stock | | | Annually | | | | Annually | |
High Yield | | | Daily | | | | Monthly | |
Income | | | Daily | | | | Monthly | |
Municipal Bond | | | Daily | | | | Monthly | |
Government Bond | | | Daily | | | | Monthly | |
Limited Maturity Bond | | | Daily | | | | Monthly | |
Money Market* | | | Daily | | | | Monthly | |
* | Dividends are net of any short-term realized gains or losses on the sale of securities. |
(I) Options – All Funds, with the exception of Money Market Fund, may buy put and call options and write put and covered call options. The Funds intend to use such derivative instruments as hedges to facilitate buying or selling securities or to provide protection against adverse movements in security prices or interest rates. The Funds may also enter into options contracts to protect against adverse foreign exchange rate fluctuations. Option contracts are valued daily and unrealized appreciation or depreciation is recorded. A Fund will realize a gain or loss upon expiration or closing of the option transaction. When an option is exercised, the proceeds upon sale for a written call option or the cost of a security for purchased put and call options is adjusted by the amount of premium received or paid.
Buying put options tends to decrease a Fund’s exposure to the underlying security while buying call options tends to increase a Fund’s exposure to the underlying security. The
278
Thrivent Mutual Funds
Notes to Financial Statements
October 31, 2013
risk associated with purchasing put and call options is limited to the premium paid. There is no significant counterparty risk on exchange-traded options as the exchange guarantees the contract against default. Writing put options tends to increase a Fund’s exposure to the underlying security while writing call options tends to decrease a Fund’s exposure to the underlying security. The writer of an option has no control over whether the underlying security may be bought or sold, and therefore bears the market risk of an unfavorable change in the price of the underlying security. The counterparty risk for purchased options arises when a Fund has purchased an option, exercises that option, and the counterparty doesn’t buy from the Fund or sell to the Fund the underlying asset as required. In the case where a Fund has written an option, the Fund doesn’t have counterparty risk. Counterparty risk on purchased over-the-counter options is partially mitigated by the Fund’s collateral posting requirements. As the option increases in value to the Fund, the Fund receives collateral from the counterparty. Risks of loss may exceed amounts recognized on the Statement of Assets and Liabilities.
(J) Futures Contracts – Certain Funds may use futures contracts to manage the exposure to interest rate and market or currency fluctuations. Gains or losses on futures contracts can offset changes in the yield of securities. When a futures contract is opened, cash or other investments equal to the required “initial margin deposit” are held on deposit with and pledged to the broker. Additional securities held by the Funds may be earmarked to cover open futures contracts. The futures contract’s daily change in value (“variation margin”) is either paid to or received from the broker, and is recorded as an unrealized gain or loss. When the contract is closed, realized gain or loss is recorded equal to the difference between the value of the contract when opened and the value of the contract when closed. Futures contracts involve, to varying degrees, risk of loss in excess of the variation margin disclosed in the Statement of Assets and Liabilities. Exchange-traded futures have no significant counterparty risk as the exchange guarantees the contracts against default.
(K) Swap Agreements – Certain Funds enter into swap transactions, which involve swapping one or more investment characteristics of a security or a basket of securities with another party. Such transactions include market risk, risk of default by the other party to the transaction, risk of imperfect correlation and manager risk and may involve commissions or other costs. Swap transactions generally do not involve delivery of securities, other underlying assets or principal. Accordingly, the risk of loss with respect to swap transactions is generally limited to the net amount of payments that the Fund is contractually obligated to make, or in the case of the counterparty defaulting, the net amount of payments that the Fund is contractually entitled to receive. Risks of loss may exceed amounts recognized on the Statement of Assets and Liabilities. If there is a default by the counterparty, the Fund may have contractual remedies pursuant to the agreements related to the transaction. The contracts are valued daily and unrealized appreciation or depreciation is recorded. Swap agreements are valued at fair value of the contract as provided by an independent pricing service. The pricing service takes into account such factors as swap curves, default probabilities, recent trades, recovery rates and other factors it deems relevant in determining valuations. The Fund accrues for the periodic payment and amortizes upfront payments, if any, on swap agreements on a daily basis with the net amount recorded as realized gains or losses on the Statement of Operations. Receipts and payments received or made as a result of a credit event or termination of the contract are also recognized as realized gains or losses on the Statement of Operations. Collateral, in the form of cash or securities, may be required to be held with the Fund’s custodian, or a third party, in connection with these agreements. These swap agreements are over-the-counter and the Fund is exposed to counterparty risk, which is the discounted net amount of payments owed to the Fund. This risk is partially mitigated by the Fund’s collateral posting requirements. As the swap increases in value to the Fund, the Fund receives collateral from the counterparty. Certain interest rate and credit default index swaps must be cleared through a clearinghouse or central counterparty.
Credit Default Swaps – A credit default swap is a swap agreement between two parties to exchange the credit risk of a particular issuer, basket of securities or reference entity. The swap contract’s daily change in value (“variation margin”) is either paid to or received from the broker, and is recorded as an unrealized gain or loss. A buyer of a credit default swap is said to buy protection whereas a seller of a credit default swap is said to sell protection. A seller of protection profits if the credit of the underlying issuer or reference entity remains stable or improves while the swap is outstanding. However, the seller in a credit default swap contract would be required to pay the amount of credit loss, determined as specified in the agreement, to the buyer in the event of an adverse credit event in the underlying issuer or reference entity. The Funds may be either the protection seller or the protection buyer.
Certain Funds enter into credit default derivative contracts directly through credit default swaps (CDS) or through credit default swap indices (CDX Indices). CDX indices are static pools of equally weighted credit default swaps referencing corporate bonds and/or loans designed to provide diversified credit exposure to these asset classes. Funds sell default protection and assume long-risk positions in individual credits or indices. Index positions are entered into to gain exposure to the corporate bond and/or loan markets in a cost-efficient and diversified structure. In the event that a position defaults, by going into bankruptcy and failing to pay interest or principal on borrowed money, within any given CDX Index held, the maximum potential amount of future payments required would be equal to the pro-rata share of that position within the index based on the notional amount of the index. In the event of a default under a CDS contract the maximum potential amount of future payments would be the notional amount. For CDS, the default events could be bankruptcy and failing to pay interest or principal on
279
Thrivent Mutual Funds
Notes to Financial Statements
October 31, 2013
borrowed money or a restructuring. A restructuring is a change in the underlying obligations which would include reduction in interest or principal, maturity extension and subordination to other obligations. Refer to the credit default swap tables located within the Funds’ Schedules of Investments for additional information as of October 31, 2013.
(L) Mortgage Dollar Roll Transactions – Certain Funds enter into dollar roll transactions on securities issued or to be issued by the Government National Mortgage Association, Federal National Mortgage Association and Federal Home Loan Mortgage Corporation, in which the Funds sell mortgage securities and simultaneously agree to repurchase similar (same type and coupon) securities at a later date at an agreed upon price. The Funds must maintain liquid securities having a value not less than the repurchase price (including accrued interest) for such dollar rolls. The value of the securities that the Funds are required to purchase may decline below the agreed upon repurchase price of those securities.
During the period between the sale and repurchase, the Funds forgo principal and interest paid on the mortgage securities sold. The Funds are compensated from negotiated fees paid by brokers offered as an inducement to the Funds to “roll over” their purchase commitments, thus enhancing the yield. Mortgage dollar rolls may be renewed with a new purchase and repurchase price and a cash settlement made on settlement date without physical delivery of the securities subject to the contract. The fees received are recognized over the roll period and are included in Income from mortgage dollar rolls in the Statement of Operations.
(M) Securities Lending – The Trust has entered into a Securities Lending Agreement (the “Agreement”) with Deutsche Bank AG (“Deutsche”). The Agreement authorizes Deutsche to lend securities to authorized borrowers on behalf of the Funds. Pursuant to the Agreement, all loaned securities are initially collateralized by cash equal to at least 102% of the value of the loaned securities. All cash collateral received is invested in Thrivent Cash Management Trust. The Funds receive dividends and interest that would have been earned on the securities loaned while simultaneously seeking to earn income on the investment of cash collateral. Amounts earned on investments in Thrivent Cash Management Trust, net of rebates, fees paid to Deutsche for services provided and any other securities lending expenses, are included in Income from securities loaned on the Statement of Operations. By investing any cash collateral it receives in these transactions, a Fund could realize additional gains or losses. If the borrower fails to return the securities or the invested collateral has declined in value, the Fund could lose money.
As of October 31, 2013, the value of securities on loan is as follows:
| | | | |
Fund | | Securities on Loan | |
Moderately Aggressive Allocation | | $ | 1,264,074 | |
Moderate Allocation | | | 2,048,433 | |
Moderately Conservative Allocation | | | 2,919,262 | |
Partner Small Cap Growth | | | 16,058,406 | |
Partner Small Cap Value | | | 4,677,234 | |
Small Cap Stock | | | 25,141,302 | |
Mid Cap Growth | | | 19,613,520 | |
Mid Cap Stock | | | 93,875,929 | |
Partner Worldwide Allocation | | | 12,968,090 | |
Large Cap Growth | | | 6,839,344 | |
Large Cap Value | | | 9,749,404 | |
High Yield | | | 44,286,110 | |
Income | | | 11,798,271 | |
Government Bond | | | 6,726,588 | |
Limited Maturity Bond | | | 8,059,477 | |
(N) When-Issued and Delayed Delivery Transactions – Certain Funds may purchase or sell securities on a when-issued or delayed delivery basis. These transactions involve a commitment by a Fund to purchase or sell securities for a predetermined price or yield, with payment and delivery taking place beyond the customary settlement period. When delayed delivery purchases are outstanding, a Fund will designate liquid assets in an amount sufficient to meet the purchase price. When purchasing a security on a delayed delivery basis, a Fund assumes the rights and risks of ownership of the security, including the risk of price and yield fluctuations, and takes such fluctuations into account when determining its net asset value. A Fund may dispose of a delayed delivery transaction after it is entered into, and may sell when-issued securities before they are delivered, which may result in a capital gain or loss. When a Fund has sold a security on a delayed delivery basis, a Fund does not participate in future gains and losses with respect to the security.
(O) Treasury Inflation Protected Securities – Certain Funds may invest in treasury inflation protected securities (TIPS). These securities are fixed income securities whose principal value is periodically adjusted to the rate of inflation. The coupon interest rate is generally fixed at issuance. Interest is paid based on the principal value, which is adjusted for inflation. Any increase in the principal amount will be included as taxable interest in the Statement of Operations and received in cash upon maturity or sale of the security.
(P) Repurchase Agreements – Each Fund may engage in repurchase agreement transactions in pursuit of its investment objective. A repurchase agreement consists of a purchase and a simultaneous agreement to resell an investment for later delivery at an agreed upon price and rate of interest. The Fund uses a third-party custodian to maintain the collateral. If the original seller of a security subject to a repurchase agreement fails to repurchase the security at the agreed upon time, the Fund could incur a loss due to a drop in the value of the security during the time it takes the Fund to either sell the security or take action to enforce the original seller’s agreement to repurchase the security. Also, if a
280
Thrivent Mutual Funds
Notes to Financial Statements
October 31, 2013
defaulting original seller filed for bankruptcy or became insolvent, disposition of such security might be delayed by pending legal action. The Fund may only enter into repurchase agreements with banks and other recognized financial institutions such as broker/dealers that are found by the Adviser or subadviser to be creditworthy. During the year ended October 31, 2013, none of the Funds engaged in these types of investments.
(Q) Equity-Linked Structured Securities – Certain Funds may invest in equity-linked structured notes. Equity-linked structured notes are debt securities which combine the characteristics of common stock and the sale of an option. The return component is based upon the performance of a single equity security, a basket of equity securities, or an equity index and the sale of an option. There is no guaranteed return of principal with these securities. The appreciation potential of these securities may be limited by a maximum payment or call right and can be influenced by many unpredictable factors. In addition to the performance of the equity, the nature and credit of the issuer may also impact return.
(R) Stripped Securities – Certain Funds may invest in Interest Only and Principal Only stripped mortgage or asset backed securities. These securities represent a participation in securities that are structured in classes with rights to receive different portions of the interest and principal. Interest only securities receive all the interest and principal only securities receive all the principal. If the underlying pool of mortgages or assets experience greater than anticipated prepayments of principal, the Fund may not fully recoup its initial investment in an interest only security. Principal only securities increase in value if prepayments are greater than anticipated and decline if prepayments are slower than anticipated. The market value of these securities is highly sensitive to changes in interest rates.
(S) Credit Risk – The Funds may be susceptible to credit risk to the extent an issuer or counterparty defaults on its payment obligation. The Funds’ policy is to monitor the creditworthiness of issuers and counterparties. Interest receivable on defaulted securities is monitored for ability to collect payments in default and is adjusted accordingly.
(T) Accounting Estimates – The preparation of financial statements in conformity with GAAP requires management to make estimates and assumptions that affect the reported amounts of assets and liabilities and disclosure of contingent assets and liabilities at the date of the financial statements and the reported amounts of income and expenses during the reporting period. Actual results could differ from those estimates.
(U) Loan Commitments – Certain Funds may enter into loan commitments, which generally have interest rates which are reset daily, monthly, quarterly or semi-annually by reference to a base lending rate, plus a premium. These base rates are primarily the London-Interbank Offered Rate (“LIBOR”), and secondarily the prime rate offered by one or more major United States banks (the “Prime Rate”) and the certificate of deposit (“CD”) rate or other base lending rates used by commercial lenders. Loan commitments often require prepayments from excess cash flows or allow the borrower to repay at its election. The rate at which the borrower repays cannot be predicted with accuracy. Therefore, the remaining maturity may be considerably less than the stated maturity shown in the Schedule of Investments.
All or a portion of these loan commitments may be unfunded. A Fund is obligated to fund these commitments at the borrower’s discretion. Therefore, the Fund must have funds sufficient to cover its contractual obligation. These unfunded loan commitments, which are marked to market daily, are presented in the Schedule of Investments.
(V) Unfunded Loan Commitment – The following Fund entered into a loan commitment with Dell, Inc. on March 4, 2013. Maturity of the commitment will be no later than November 6, 2013. The Fund will receive a fee of 0.50%.
| | | | |
Fund | | Unfunded
Commitment | |
High Yield | | | $7,500,000 | |
The following Fund entered into a loan commitment with Tenet Healthcare Corporation on July 24, 2013. Maturity of the commitment will be no later than February 28, 2014. The Fund will receive a fee of 0.25%.
| | | | |
Fund | | Unfunded
Commitment | |
High Yield | | | $7,100,000 | |
The following Fund entered into a loan commitment with Community Health Systems, Inc. on September 11, 2013. Maturity of the initial commitment will be a maximum of 12 months from the closing date. The Fund will receive a commitment fee of 0.44%
| | | | |
Fund | | Unfunded
Commitment | |
High Yield | | | $11,806,026 | |
(W) Loss Contingencies – Thrivent High Yield Fund and Thrivent Income Fund are defendants in an adversary action filed on July 31, 2009 by the Official Committee of Unsecured Creditors of Motors Liquidation Company, formerly known as General Motors Corporation (GM), against prior and current holders of term loan debt of GM. The suit seeks to determine whether GM’s term loan facility was secured at the time it entered bankruptcy. High Yield Fund at one time held term loans in an original principal amount of at least $4,723,994 and, if the plaintiffs are successful, it is reasonably possible that the Fund will be required to make payments in some amount. This loss contingency has not been accrued as a liability because the amount of potential damages and the likelihood of loss cannot be reasonably estimated. Thrivent Income Fund is
281
Thrivent Mutual Funds
Notes to Financial Statements
October 31, 2013
named as a defendant in this action, but we do not expect that the Fund’s assets will be subject to a loss contingency.
(X) Litigation – Awards from class action litigation are are recorded as realized gains on the payment date.
(Y) Amortization of Offering Costs – The offering costs referenced in the Statement of Operations for Partner Emerging Markets Equity Fund are costs incurred by the Fund in order to establish it for sale. These costs generally include costs related to registering the shares for sale with the various states as well as any legal costs associated with registering the Fund. These costs are amortized over a period of 12 months from inception.
(Z) Recent Accounting Pronouncements – In December 2011, FASB released Accounting Standards Update 2011-11 (ASU 2011-11), Balance Sheet (Topic 210), Disclosures about Offsetting Assets and Liabilities. This updated standard is a result of collaboration between FASB and International Accounting Standards Board (IASB) to enhance current disclosures. The amendments include new disclosure requirements of gross and net information about instruments and transactions eligible for offset in the Statement of Assets and Liabilities or subject to a master netting agreement or similar agreement. In January 2013, additional guidance was issued to clarify which investment and instruments are subject to the offsetting disclosure requirements. The scope of the disclosure requirements will be limited to derivative instruments, repurchase agreements, and securities borrowing and securities lending transactions. The disclosures required became effective for any reporting period (annual or interim) beginning on or after January 1, 2013. Management is currently evaluating the application of ASU 2013-01 on the Fund’s financial statements.
(AA) Other – For financial statement purposes, investment security transactions are accounted for on the trade date. Realized gains and losses from investment transactions are determined on a specific cost identification basis, which is the same basis used for federal income tax purposes.
(3) FEES AND COMPENSATION PAID TO AFFILIATES
(A) Investment Advisory Fees – The Trust has entered into an Investment Advisory Agreement with Thrivent Asset Mgt. Under the Investment Advisory Agreement, each of the Funds pays a fee for investment advisory services. The fees are accrued daily and paid monthly.
The four Asset Allocation Funds – Aggressive Allocation Fund, Moderately Aggressive Allocation Fund, Moderate Allocation Fund and Moderately Conservative Allocation Fund – pay investment advisory fees for asset allocation services. In addition, for investments (other than underlying Thrivent Funds) held directly by the Asset Allocation Funds, each Asset Allocation Fund will pay an additional advisory fee. The annual rates of fees as a percentage of average daily net assets under the Investment Advisory Agreement are as follows:
| | | | | | | | | | | | |
Fund (M – Millions) | | $0 to
$500M | | | Over
$500 to
$2,000M | | | Over
$2,000M | |
Aggressive Allocation | | | 0.150 | % | | | 0.125 | % | | | 0.100 | % |
Aggressive Allocation – Direct Holdings | | | 0.600 | % | | | 0.600 | % | | | 0.600 | % |
Moderately Aggressive Allocation | | | 0.150 | % | | | 0.125 | % | | | 0.100 | % |
Moderately Aggressive Allocation – Direct Holdings | | | 0.550 | % | | | 0.550 | % | | | 0.550 | % |
Moderate Allocation | | | 0.150 | % | | | 0.125 | % | | | 0.100 | % |
Moderate Allocation – Direct Holdings | | | 0.500 | % | | | 0.500 | % | | | 0.500 | % |
Moderately Conservative Allocation | | | 0.150 | % | | | 0.125 | % | | | 0.100 | % |
Moderately Conservative Allocation – Direct Holdings | | | 0.450 | % | | | 0.450 | % | | | 0.450 | % |
282
Thrivent Mutual Funds
Notes to Financial Statements
October 31, 2013
For all other Funds, the annual rates of fees as a percent of average daily net assets under the Investment Advisory Agreement were as follows:
| | | | | | | | | | | | | | | | | | | | | | | | | | | | | | | | | | | | | | | | | | | | |
Fund (M – Millions) | | $0 to
$50M | | | Over
$50 to
$100M | | | Over
$100 to
$200M | | | Over
$200 to
$250M | | | Over
$250 to
$500M | | | Over
$500 to
$750M | | | Over
$750 to
$1,000M | | | Over
$1,000 to
$2,000M | | | Over
$2,000 to
$2,500M | | | Over
$2,500 to
$5,000M | | | Over
$5,000M | |
Balanced Income Plus | | | 0.550 | % | | | 0.550 | % | | | 0.550 | % | | | 0.550 | % | | | 0.550 | % | | | 0.500 | % | | | 0.500 | % | | | 0.475 | % | | | 0.475 | % | | | 0.450 | % | | | 0.425 | % |
Opportunity Income Plus | | | 0.450 | % | | | 0.450 | % | | | 0.450 | % | | | 0.450 | % | | | 0.450 | % | | | 0.400 | % | | | 0.400 | % | | | 0.375 | % | | | 0.375 | % | | | 0.350 | % | | | 0.325 | % |
Partner Emerging Markets Equity | | | 1.200 | % | | | 1.070 | % | | | 1.070 | % | | | 1.070 | % | | | 1.070 | % | | | 1.070 | % | | | 1.070 | % | | | 1.070 | % | | | 1.070 | % | | | 1.070 | % | | | 1.070 | % |
Partner Small Cap Growth | | | 0.900 | % | | | 0.900 | % | | | 0.900 | % | | | 0.900 | % | | | 0.900 | % | | | 0.800 | % | | | 0.800 | % | | | 0.800 | % | | | 0.800 | % | | | 0.800 | % | | | 0.800 | % |
Partner Small Cap Value | | | 0.700 | % | | | 0.700 | % | | | 0.700 | % | | | 0.700 | % | | | 0.700 | % | | | 0.700 | % | | | 0.700 | % | | | 0.700 | % | | | 0.700 | % | | | 0.700 | % | | | 0.700 | % |
Small Cap Stock | | | 0.700 | % | | | 0.700 | % | | | 0.700 | % | | | 0.650 | % | | | 0.650 | % | | | 0.650 | % | | | 0.650 | % | | | 0.600 | % | | | 0.600 | % | | | 0.550 | % | | | 0.525 | % |
Mid Cap Growth | | | 0.450 | % | | | 0.450 | % | | | 0.400 | % | | | 0.400 | % | | | 0.350 | % | | | 0.300 | % | | | 0.300 | % | | | 0.250 | % | | | 0.250 | % | | | 0.250 | % | | | 0.250 | % |
Partner Mid Cap Value | | | 0.750 | % | | | 0.750 | % | | | 0.750 | % | | | 0.700 | % | | | 0.700 | % | | | 0.700 | % | | | 0.700 | % | | | 0.700 | % | | | 0.700 | % | | | 0.700 | % | | | 0.700 | % |
Mid Cap Stock | | | 0.700 | % | | | 0.700 | % | | | 0.700 | % | | | 0.650 | % | | | 0.650 | % | | | 0.650 | % | | | 0.650 | % | | | 0.600 | % | | | 0.600 | % | | | 0.550 | % | | | 0.525 | % |
Partner Worldwide Allocation | | | 0.900 | % | | | 0.900 | % | | | 0.900 | % | | | 0.900 | % | | | 0.850 | % | | | 0.850 | % | | | 0.850 | % | | | 0.800 | % | | | 0.800 | % | | | 0.800 | % | | | 0.800 | % |
Large Cap Growth | | | 0.750 | % | | | 0.750 | % | | | 0.750 | % | | | 0.750 | % | | | 0.750 | % | | | 0.700 | % | | | 0.700 | % | | | 0.650 | % | | | 0.650 | % | | | 0.600 | % | | | 0.575 | % |
Large Cap Value | | | 0.450 | % | | | 0.450 | % | | | 0.450 | % | | | 0.450 | % | | | 0.450 | % | | | 0.450 | % | | | 0.450 | % | | | 0.450 | % | | | 0.450 | % | | | 0.450 | % | | | 0.450 | % |
Large Cap Stock | | | 0.650 | % | | | 0.650 | % | | | 0.650 | % | | | 0.650 | % | | | 0.650 | % | | | 0.575 | % | | | 0.575 | % | | | 0.500 | % | | | 0.475 | % | | | 0.450 | % | | | 0.425 | % |
High Yield | | | 0.400 | % | | | 0.400 | % | | | 0.400 | % | | | 0.400 | % | | | 0.400 | % | | | 0.350 | % | | | 0.350 | % | | | 0.300 | % | | | 0.300 | % | | | 0.300 | % | | | 0.300 | % |
Income | | | 0.350 | % | | | 0.350 | % | | | 0.350 | % | | | 0.350 | % | | | 0.350 | % | | | 0.325 | % | | | 0.325 | % | | | 0.300 | % | | | 0.300 | % | | | 0.300 | % | | | 0.300 | % |
Municipal Bond | | | 0.450 | % | | | 0.450 | % | | | 0.450 | % | | | 0.450 | % | | | 0.450 | % | | | 0.400 | % | | | 0.400 | % | | | 0.350 | % | | | 0.350 | % | | | 0.325 | % | | | 0.300 | % |
Government Bond | | | 0.400 | % | | | 0.400 | % | | | 0.400 | % | | | 0.400 | % | | | 0.400 | % | | | 0.350 | % | | | 0.350 | % | | | 0.350 | % | | | 0.350 | % | | | 0.350 | % | | | 0.350 | % |
Limited Maturity Bond | | | 0.300 | % | | | 0.300 | % | | | 0.300 | % | | | 0.300 | % | | | 0.300 | % | | | 0.275 | % | | | 0.275 | % | | | 0.250 | % | | | 0.250 | % | | | 0.250 | % | | | 0.250 | % |
Money Market | | | 0.500 | % | | | 0.500 | % | | | 0.500 | % | | | 0.500 | % | | | 0.500 | % | | | 0.400 | % | | | 0.350 | % | | | 0.325 | % | | | 0.325 | % | | | 0.300 | % | | | 0.275 | % |
(B) Sub-Adviser Fees – The following subadviser fees are charged as part of the total investment advisory fees stated in the table above. The subadvisory fees are borne directly by the Adviser and do not increase the overall fees paid by the Fund.
Partner Emerging Markets Equity Fund
The Adviser has entered into subadvisory agreements with DuPont Capital Management Corporation (“DuPont Capital”) for the performance of subadvisory services. The fee payable for DuPont Capital is equal to 0.72% of the first $50 million of average daily net assets and 0.68% for assets over $50 million. Thrivent Partner Worldwide Allocation Fund and Thrivent Partner Worldwide Allocation Portfolio are included in determining breakpoints for the assets managed by DuPont Capital.
Partner Small Cap Growth Fund
The Adviser has entered into a subadvisory agreement with Turner Investments, L.P. (“Turner”) for performance of subadvisory services. For assets that are defined as microcap assets, the fee payable is equal to 0.80% of the average daily net assets in that microcap portion. For all other assets, the fee payable is equal to 0.65% of the average daily net assets when the entire portfolio assets (including the microcap portion) are no greater than $100 million, 0.60% of the average daily net assets when the entire portfolio assets are greater than $100 million but no greater than $350 million, and 0.575% of the average daily net assets when the entire portfolio assets are greater than $350 million. Thrivent Partner Small Cap Growth Portfolio (including the microcap portion of that Portfolio) is included in determining breakpoints for the assets managed by Turner.
Partner Small Cap Value Fund
The Adviser has entered into a subadvisory agreement with T. Rowe Price Associates, Inc. for performance of subadvisory services. The fee payable is equal to 0.60% of average daily net assets.
Partner Mid Cap Value Fund
The Adviser has entered into a subadvisory agreement with Goldman Sachs Asset Management, L.P. (“GSAM”) for the performance of subadvisory services. The fee payable is equal to 0.50% of the first $200 million of average daily net assets and 0.45% for assets over $200 million. Thrivent Partner Mid Cap Value Portfolio is included in determining breakpoints for the assets managed by GSAM.
Partner Worldwide Allocation Fund
The Adviser has entered into subadvisory agreements with Mercator Asset Management, LP (“Mercator”), Principal Global Investors, LLC (“Principal”), Aberdeen Asset Managers Limited (“Aberdeen”), DuPont Capital and GSAM for the performance of subadvisory services.
The fee payable for Mercator is equal to 0.75% of the first $25 million of average daily net assets, 0.60% of the next $25 million, 0.55% of the next $25 million, 0.50% of the next $225 million, 0.40% of the next $200 million and 0.20% of average daily net assets over $500 million. Thrivent Partner Worldwide Allocation Portfolio is included in determining breakpoints for the assets managed by Mercator.
The fee payable for Principal is equal to 0.35% of the first $500 million of average daily net assets, 0.30% of the next
283
Thrivent Mutual Funds
Notes to Financial Statements
October 31, 2013
$ 500 million and 0.25% of average daily net assets over $1 billion. Thrivent Partner Worldwide Allocation Portfolio is included in determining breakpoints for the assets managed by Principal.
The fee payable for Aberdeen is equal to 0.85% of the first $50 million of average daily net assets, 0.72% of the next $50 million and 0.68% of average daily net assets over $100 million. Thrivent Partner Worldwide Allocation Portfolio and Thrivent Partner Emerging Markets Equity Portfolio are included in determining breakpoints for the assets managed by Aberdeen.
The fee payable for DuPont Capital is equal to 0.72% of the first $50 million of average daily net assets and 0.68% of average daily net net assets over $50 million. Thrivent Partner Worldwide Allocation Portfolio and Thrivent Partner Emerging Markets Equity Fund are included in determining breakpoints for the assets managed by DuPont Capital. The fee payable for GSAM for managing the emerging markets debt portion is equal to 0.50% of the first $200 million of average daily net assets, 0.45% of the next $200 million and 0.40% of average daily net assets over $400 million. The fee payable for GSAM for managing the international small- and mid-cap equities portion is equal to 0.58% of the first $250 million of average daily net assets; and 0.54% of average daily net assets in excess of $250 million. Thrivent Partner Worldwide Allocation Portfolio is included in determining breakpoints for the assets managed by GSAM.
(C) Expense Reimbursements – As of October 31, 2013, the following contractual expense reimbursements, as a percentage of net assets, were in effect:
| | | | | | | | | | | | |
Fund | | Class A | | | Institutional
Class | | | Expiration Date | |
Money Market* | | | 0.20% | | | | 0.10% | | | | 2/28/2014 | |
* Thrivent Asset Management has voluntarily agreed to reimburse certain class-specific and fund level expenses of Thrivent Money Market Fund to the extent necessary in order to maintain a minimum annualized net yield of 0.00% for all classes of the Fund. For the period ended October 31, 2013, contractual expense reimbursements to limit expenses to the following percentages were in effect: | |
| | | |
Fund | | Class A | | | Institutional
Class | | | Expiration
Date | |
Aggressive Allocation | | | 1.38 | %1 | | | N/A | | | | 2/28/2013 | |
Opportunity Income Plus | | | 0.85 | % | | | N/A | | | | 2/28/2014 | |
Partner Emerging Markets Equity | | | 1.79 | % | | | 1.32 | % | | | 2/28/2014 | |
Partner Small Cap Growth | | | 1.40 | % | | | N/A | | | | 2/28/2014 | |
Partner Small Cap Value | | | 1.35 | % | | | N/A | | | | 2/28/2013 | |
Small Cap Stock | | | 1.35 | % | | | N/A | | | | 2/28/2013 | |
Partner Mid Cap Value | | | 1.25 | % | | | N/A | | | | 2/28/2014 | |
Partner Worldwide Allocation | | | 1.40 | %2 | | | N/A | 3 | | | 2/28/2014 | |
Large Cap Growth | | | 1.20 | % | | | N/A | | | | 2/28/2014 | |
Government Bond | | | 0.90 | % | | | N/A | | | | 2/28/2014 | |
1 | The expense cap includes all indirect expenses. |
2 | Prior contractual expense cap of 1.30% expired on 2/28/2013. |
3 | Prior contractual expense cap of 1.00% expired on 2/28/2013. |
For the period ended October 31, 2013, the Adviser has voluntarily agreed to reimburse an additional 0.15% of the average daily net assets of the Class A shares of Partner Emerging Markets Equity Fund.
Thrivent does not recoup amounts previously reimbursed or waived in prior fiscal years.
Each equity, hybrid and fixed income fund may invest cash in High Yield Fund, Money Market Fund and Thrivent Cash Management Trust, subject to certain limitations. During the year ended October 31, 2013, Balanced Income Plus Fund, Opportunity Income Plus Fund and Limited Maturity Bond Fund invested in High Yield Fund. During the year ended October 31, 2013, no funds invested in Money Market Fund. During the year ended October 31, 2013, all funds except Municipal Bond Fund and Money Market Fund invested in Thrivent Cash Management Trust. These related-party transactions are subject to the same terms as non-related party transactions except that, to avoid duplicate investment advisory fees, Thrivent Asset Mgt. reimburses an amount equal to the advisory fee that is charged to the equity, hybrid or fixed income fund for its investment in High Yield Fund, Money Market Fund or Cash Management Trust.
(D) Distribution Plan – Thrivent Investment Management, Inc. (“Thrivent Investment Mgt.”) is the Trust’s distributor. The Trust has adopted a Distribution Plan pursuant to Rule 12b-1 under the 1940 Act. Class A shares have a Rule 12b-1 fee of up to 0.25% (up to 0.125% for Government Bond Fund, Limited Maturity Bond Fund and Money Market Fund) of average net assets.
(E) Sales Charges and Other Fees – For the year ended October 31, 2013, Thrivent Investment Mgt. received $12,000,381 of aggregate underwriting concessions from the sales of the Trust’s Class A shares. Sales charges are not an expense of the Trust and are not reflected in the financial statements of any of the Funds.
The Trust has entered into an accounting and administrative services agreement with Thrivent Asset Mgt. pursuant to which Thrivent Asset Mgt. provides certain accounting and administrative personnel and services to the Funds. For the year ended October 31, 2013, Thrivent Asset
284
Thrivent Mutual Funds
Notes to Financial Statements
October 31, 2013
Mgt. received aggregate fees for accounting and administrative personnel and services of $4,435,299 from the Trust.
The Trust has entered into an agreement with Thrivent Financial Investor Services Inc. (“Thrivent Investor Services”) to provide the Funds with transfer agent services. For the year ended October 31, 2013, Thrivent Investor Services received $14,346,309 for transfer agent services from the Trust.
Each Trustee who is not affiliated with the Adviser receives an annual fee from the Trust for services as a Trustee and is eligible to participate in a deferred compensation plan with respect to fees received from the Funds. Participants in the plan may designate their deferred Trustee’s fees as if invested in a series of the Thrivent Mutual Funds. The value of each Trustee’s deferred compensation account will increase or decrease as if invested in shares of that series. Their fees as well as the change in value are included in Trustee fees in the Statement of Operations. The deferred fees remain in the appropriate Fund until distribution in accordance with the plan. The deferred fee liability, included in accrued expenses in the Statement of Assets and Liabilities, is unsecured.
Those Trustees not participating in the above plan received $258,266 in fees from the Trust for the year ended October 31, 2013. In addition, the Trust reimbursed independent Trustees for reasonable expenses incurred in relation to attendance at meetings and industry conferences.
Certain officers and non-independent Trustees of the Trust are officers and directors of Thrivent Asset Mgt., Thrivent Investment Mgt. and Thrivent Investor Services; however, they receive no compensation from the Trust.
(F) Indirect Expenses – Some Funds invest in other mutual funds. Fees and expenses of those underlying funds are not included in those Funds’ expense ratios. The Funds indirectly bear their proportionate share of the annualized weighted average expense ratio of the underlying funds in which they invest.
(4) TAX INFORMATION
Distributions are based on amounts calculated in accordance with the applicable federal income tax regulations, which may differ from GAAP. To the extent that these differences are permanent in nature, such amounts are reclassified within the capital accounts based on their federal tax-basis treatment; temporary differences do not require reclassifications.
On the Statement of Assets and Liabilities, as a result of permanent book-to-tax differences, reclassification adjustments were made as follows [Increase/(Decrease)]:
| | | | | | | | | | | | |
Fund | | Accumulated
Net
Investment
Income/(Loss) | | | Accumulated
Net Realized
Gain/(Loss) | | | Capital
Stock | |
Aggressive Allocation | | | $261,209 | | | | ($773,974 | ) | | | $512,765 | |
Moderately Aggressive Allocation | | | 920,105 | | | | (938,473 | ) | | | 18,368 | |
Moderate Allocation | | | 565,250 | | | | (577,153 | ) | | | 11,903 | |
Moderately Conservative Allocation | | | 51,103 | | | | (55,506 | ) | | | 4,403 | |
Balanced Income Plus | | | 93,277 | | | | (94,587 | ) | | | 1,310 | |
Opportunity Income Plus | | | (158,504 | ) | | | 158,504 | | | | – | |
Partner Emerging Markets Equity | | | 22,878 | | | | 11,689 | | | | (34,567 | ) |
Partner Small Cap Growth | | | 1,007,953 | | | | (1,007,953 | ) | | | – | |
Partner Small Cap Value | | | 288,496 | | | | (483,458 | ) | | | 194,962 | |
Small Cap Stock | | | (18,208 | ) | | | 18,208 | | | | – | |
Mid Cap Growth | | | (172,040 | ) | | | (875,918 | ) | | | 1,047,958 | |
Partner Mid Cap Value | | | (51,578 | ) | | | 44,578 | | | | 7,000 | |
Mid Cap Stock | | | (243,341 | ) | | | 243,341 | | | | – | |
Partner Worldwide Allocation | | | 2,062,372 | | | | (2,062,372 | ) | | | – | |
Large Cap Growth | | | 10,974 | | | | (10,974 | ) | | | – | |
Large Cap Value | | | 224,392 | | | | (224,392 | ) | | | – | |
Large Cap Stock | | | 131,587 | | | | (3,131,587 | ) | | | 3,000,000 | |
High Yield | | | (222,272 | ) | | | 222,272 | | | | – | |
Income | | | (269,562 | ) | | | 269,562 | | | | – | |
Municipal Bond | | | (374 | ) | | | 374 | | | | – | |
Government Bond | | | (32,411 | ) | | | 75 | | | | 32,336 | |
Limited Maturity Bond | | | (15,499 | ) | | | 15,499 | | | | – | |
Money Market | | | 7,606 | | | | (7,606 | ) | | | – | |
At October 31, 2013, the components of distributable earnings on a tax basis were as follows:
| | | | | | | | |
Fund | | Undistributed
Ordinary
Incomea | | | Undistributed
Long-Term
Capital Gain | |
Aggressive Allocation | | | $8,905,849 | | | | $18,020,440 | |
Moderately Aggressive Allocation | | | 23,725,214 | | | | 36,413,606 | |
Moderate Allocation | | | 13,991,293 | | | | 27,439,777 | |
Moderately Conservative Allocation | | | 4,032,626 | | | | 12,216,611 | |
Balanced Income Plus | | | 9,622,601 | | | | 14,369,011 | |
Opportunity Income Plus | | | 154,493 | | | | – | |
Partner Emerging Markets Equity | | | 156,845 | | | | – | |
Partner Small Cap Growth | | | 4,389,856 | | | | 18,902,689 | |
Partner Small Cap Value | | | 14,200 | | | | 7,778,094 | |
Small Cap Stock | | | – | | | | 2,394,823 | |
Mid Cap Growth | | | 3,156,568 | | | | 47,193,808 | |
Partner Mid Cap Value | | | 9,912,210 | | | | 20,424,042 | |
Mid Cap Stock | | | 525,053 | | | | – | |
Partner Worldwide Allocation | | | 16,028,863 | | | | – | |
Large Cap Growth | | | 1,099,947 | | | | – | |
Large Cap Value | | | 6,950,551 | | | | – | |
Large Cap Stock | | | 42,282,289 | | | | 120,514,110 | |
High Yield | | | 179,286 | | | | – | |
Income | | | 15,764 | | | | – | |
Municipal Bondb | | | 219,997 | | | | – | |
285
Thrivent Mutual Funds
Notes to Financial Statements
October 31, 2013
| | | | | | | | |
Fund | | Undistributed
Ordinary Incomea | | | Undistributed
Long-Term
Capital Gain | |
Government Bond | | | 3,520 | | | | 1,228,420 | |
Limited Maturity Bond | | | 379,179 | | | | 4,999,009 | |
a | Undistributed Ordinary Income includes income derived from Short-Term Capital Gains. |
b | Municipal Bond Fund undistributed ordinary income is primarily exempt from federal income taxes. |
At October 31, 2013, the following Funds had accumulated net realized capital loss carryovers expiring as follows:
| | | | | | | | |
Fund | | Capital Loss
Carryover | | | Expiration
Year | |
| | | | | | | | |
Opportunity Income Plus | | $ | 8,042,400 | | | | 2017 | |
| | | | | | | | |
| | $ | 8,042,400 | | | | | |
| | | | | | | | |
Mid Cap Stock | | | 18,080,027 | | | | 2017 | |
| | | | | | | | |
| | $ | 18,080,027 | | | | | |
| | | | | | | | |
Partner Worldwide | | | | | | | | |
Allocation | | | 95,101,150 | | | | 2016 | |
| | | 6,799,658 | | | | 2017 | |
| | | | | | | | |
| | $ | 101,900,808 | | | | | |
| | | | | | | | |
Large Cap Growth | | | 2,083,594 | | | | 2015 | |
| | | 1,041,797 | | | | 2016 | |
| | | 37,386,729 | | | | 2017 | |
| | | | | | | | |
| | $ | 40,512,120 | | | | | |
| | | | | | | | |
Large Cap Value | | | 18,028,397 | | | | 2017 | |
| | | | | | | | |
| | $ | 18,028,397 | | | | | |
| | | | | | | | |
High Yield | | | 15,171,495 | | | | 2016 | |
| | | 30,243,630 | | | | 2017 | |
| | | | | | | | |
| | $ | 45,415,125 | | | | | |
| | | | | | | | |
Income | | | 11,020,687 | | | | 2017 | |
| | | | | | | | |
| | $ | 11,020,687 | | | | | |
| | | | | | | | |
To the extent that these Funds realize future net capital gains, taxable distributions will be reduced by any unused capital loss carryovers as permitted by the Internal Revenue Code.
Capital losses generated during the year ending October 31, 2012 and later, are subject to the provisions of the Regulated Investment Company Modernization Act of 2010 (the “Act”). Under the Act, if capital losses are not reduced by gains, the losses will be carried forward with no expiration and with the short-term or long-term character of the loss retained. Additionally, these capital losses must be fully utilized before those capital loss carryovers listed with noted expiration dates in the table above, which may make them more likely to expire unused.
At October 31, 2013, the following Funds had accumulated net realized capital loss carryovers subject to the Act, as follows:
| | | | | | | | |
Fund | | Capital Loss
Carryover | | | Tax Character | |
Partner Emerging Markets | | | | | | | | |
Equity | | $ | 30,746 | | | | Long-term | |
| | | | | | | | |
| | $ | 30,746 | | | | | |
| | | | | | | | |
Municipal Bond | | | 7,500,365 | | | | Short-term | |
Municipal Bond | | | 535,184 | | | | Long-term | |
| | | | | | | | |
| | $ | 8,035,549 | | | | | |
| | | | | | | | |
During the fiscal year 2013, capital loss carryovers utilized by the Funds were as follows:
| | | | |
Fund | | Capital Loss
Carryover | |
Opportunity Income Plus | | $ | 698,283 | |
Small Cap Stock | | | 21,122,861 | |
Mid Cap Stock | | | 89,356,944 | |
Partner Worldwide Allocation | | | 34,296,293 | |
Large Cap Growth | | | 30,367,723 | |
Large Cap Value | | | 33,939,115 | |
High Yield | | | 20,377,883 | |
Income | | | 14,343,689 | |
Limited Maturity Bond | | | 972,746 | |
The following funds deferred, on a tax basis, the following Late Year Ordinary Losses:
| | | | |
Fund | | Ordinary
Losses | |
Aggressive Allocation | | $ | 917,127 | |
Small Cap Stock | | $ | 471,092 | |
These amounts are deferred for tax purposes, deemed to occur on the first day of the following fiscal year, and are subject to the provisions of the Regulated Investment Company Modernization Act of 2010.
286
Thrivent Mutual Funds
Notes to Financial Statements
October 31, 2013
The tax character of distributions paid during the years ended October 31, 2013 and 2012 was as follows:
| | | | | | | | | | | | | | | | | | | | | | | | |
| | | Tax-Exempt Income | | | Ordinary Income | | | Long-Term Capital Gain | |
Fund | | 10/31/2013 | | | 10/31/2012 | | | 10/31/2013 | | | 10/31/2012 | | | 10/31/2013 | | | 10/31/2012 | |
Aggressive Allocation | | $ | – | | | $ | – | | | $ | 6,082,118 | | | $ | 3,049,754 | | | $ | 3,645,559 | | | $ | – | |
Moderately Aggressive Allocation | | | – | | | | – | | | | 20,337,543 | | | | 16,659,898 | | | | 10,582,766 | | | | – | |
Moderate Allocation | | | – | | | | – | | | | 32,723,709 | | | | 19,702,434 | | | | 7,962,093 | | | | 1,509,022 | |
Moderately Conservative Allocation | | | – | | | | – | | | | 17,364,734 | | | | 11,586,711 | | | | 5,910,056 | | | | 2,320,624 | |
Balanced Income Plus | | | – | | | | – | | | | 6,685,138 | | | | 2,244,364 | | | | 5,516,098 | | | | 4,829,710 | |
Opportunity Income Plus | | | – | | | | – | | | | 6,424,753 | | | | 7,169,527 | | | | – | | | | – | |
Partner Emerging Markets Equity | | | – | | | | – | | | | 143,847 | | | | – | | | | – | | | | – | |
Partner Small Cap Growth | | | – | | | | – | | | | – | | | | – | | | | 3,845,472 | | | | – | |
Partner Small Cap Value | | | – | | | | – | | | | 4,735,626 | | | | 1,009,708 | | | | 3,760,790 | | | | 2,250,423 | |
Mid Cap Growth | | | – | | | | – | | | | 484,142 | | | | – | | | | 25,881,632 | | | | 3,099,306 | |
Partner Mid Cap Value | | | – | | | | – | | | | 1,365,016 | | | | 887,106 | | | | 2,834,459 | | | | – | |
Mid Cap Stock | | | – | | | | – | | | | 1,000,068 | | | | – | | | | – | | | | – | |
Partner Worldwide Allocation | | | – | | | | – | | | | 16,685,137 | | | | 6,631,095 | | | | – | | | | – | |
Large Cap Growth | | | – | | | | – | | | | 1,883,415 | | | | 13,488 | | | | – | | | | – | |
Large Cap Value | | | – | | | | – | | | | 11,105,815 | | | | 9,006,362 | | | | – | | | | – | |
Large Cap Stock | | | – | | | | – | | | | 30,581,972 | | | | 11,202,984 | | | | 70,280,464 | | | | – | |
High Yield | | | – | | | | – | | | | 49,321,503 | | | | 51,506,433 | | | | – | | | | – | |
Income | | | – | | | | – | | | | 30,525,850 | | | | 32,041,000 | | | | – | | | | – | |
Municipal Bond | | | 58,294,692 | | | | 57,906,525 | | | | 321,074 | | | | 241,570 | | | | 583,098 | | | | – | |
Government Bond | | | – | | | | – | | | | 3,776,786 | | | | 2,568,232 | | | | 1,209,392 | | | | 1,327,120 | |
Limited Maturity Bond | | | – | | | | – | | | | 11,579,503 | | | | 14,528,251 | | | | – | | | | – | |
(5) SECURITY TRANSACTIONS
(A) Purchases and Sales of Investment Securities – For the year ended October 31, 2013, the cost of purchases and the proceeds from sales of investment securities, other than U.S. Government and short-term securities, were as follows:
| | | | | | | | |
| | | In thousands | |
Fund | | Purchases | | | Sales | |
Aggressive Allocation | | $ | 209,582 | | | $ | 249,339 | |
Moderately Aggressive Allocation | | | 458,482 | | | | 478,340 | |
Moderate Allocation | | | 461,573 | | | | 452,421 | |
Moderately Conservative Allocation | | | 245,932 | | | | 246,585 | |
Balanced Income Plus | | | 209,286 | | | | 204,735 | |
Opportunity Income Plus | | | 235,201 | | | | 175,313 | |
Partner Emerging Markets Equity | | | 16,003 | | | | 16,058 | |
Partner Small Cap Growth | | | 122,501 | | | | 134,637 | |
Partner Small Cap Value | | | 13,574 | | | | 33,686 | |
Small Cap Stock | | | 180,187 | | | | 178,647 | |
Mid Cap Growth | | | 139,245 | | | | 195,296 | |
Partner Mid Cap Value | | | 154,780 | | | | 160,906 | |
Mid Cap Stock | | | 305,990 | | | | 363,004 | |
Partner Worldwide Allocation | | | 562,050 | | | | 546,373 | |
Large Cap Growth | | | 233,112 | | | | 243,947 | |
Large Cap Value | | | 245,249 | | | | 244,972 | |
Large Cap Stock | | | 980,903 | | | | 1,045,990 | |
High Yield | | | 469,017 | | | | 486,924 | |
Income | | | 452,445 | | | | 457,210 | |
Municipal Bond | | | 370,478 | | | | 386,978 | |
Government Bond | | | 17,582 | | | | 19,378 | |
Limited Maturity Bond | | | 371,524 | | | | 302,338 | |
Purchases and sales of U.S. Government securities were:
| | | | | | | | |
| | | In thousands | |
Fund | | Purchases | | | Sales | |
Aggressive Allocation | | $ | 53,930 | | | $ | 57,138 | |
Moderately Aggressive Allocation | | | 257,914 | | | | 268,038 | |
Moderate Allocation | | | 742,030 | | | | 749,376 | |
Moderately Conservative Allocation | | | 843,805 | | | | 840,650 | |
Balanced Income Plus | | | 264,793 | | | | 281,333 | |
Opportunity Income Plus | | | 886,572 | | | | 996,439 | |
Partner Worldwide Allocation | | | 15,394 | | | | 15,193 | |
Income | | | 580,651 | | | | 623,711 | |
Government Bond | | | 171,348 | | | | 167,964 | |
Limited Maturity Bond | | | 711,149 | | | | 794,674 | |
(B) Investments in Restricted Securities – Certain Funds may own restricted securities that have been deemed illiquid and were purchased in private placement transactions without registration under the Securities Act of 1933. Unless such securities subsequently become registered, they generally may be resold only in privately negotiated transactions with a limited number of purchasers. As of October 31, 2013, the following funds held restricted securities:
| | | | | | | | |
Fund | | Number of
Securities | | | Percent of Fund’s
Net Assets | |
Moderately Aggressive Allocation | | | 3 | | | | 0.03 | % |
Moderate Allocation | | | 3 | | | | 0.02 | % |
Moderately Conservative Allocation | | | 3 | | | | 0.10 | % |
Balanced Income Plus | | | 2 | | | | 0.29 | % |
Opportunity Income Plus | | | 2 | | | | 0.83 | % |
Partner Worldwide Allocation | | | 6 | | | | 0.21 | % |
287
Thrivent Mutual Funds
Notes to Financial Statements
October 31, 2013
| | | | | | | | |
Fund | | Number of
Securities | | | Percent of Fund’s
Net Assets | |
High Yield | | | 8 | | | | 3.47 | % |
Income | | | 1 | | | | 0.21 | % |
Limited Maturity Bond | | | 6 | | | | 0.91 | % |
The Funds have no right to require registration of unregistered securities.
(C) Investments in High-Yielding Securities – High Yield Fund invests primarily in high-yielding fixed-income securities. Each of the other Funds, except Money Market Fund, may also invest in high-yielding securities. These securities will typically be in the lower rating categories or will be non-rated and generally will involve more risk than securities in the higher rating categories. Lower rated or unrated securities (e.g., junk bonds) are more likely to react to developments affecting market risk and credit risk than are more highly rated securities, which react primarily to movements in the general level of interest rates.
(D) Investments in Options and Futures Contracts – The movement in the price of the security underlying an option or futures contract may not correlate perfectly with the movement in the prices of the portfolio securities being hedged. A lack of correlation could render a Fund’s hedging strategy unsuccessful and could result in a loss to the Fund. In the event that a liquid secondary market would not exist, the Fund could be prevented from entering into a closing transaction, which could result in additional losses to the Fund.
(E) Written Option Contracts – The number of contracts and premium amounts associated with call option contracts written during the year ended October 31, 2013 were as follows:
| | | | | | | | |
| | | Number of
Contracts | | | Premium
Amount | |
Moderately Aggressive Allocation | | | | | | | | |
Balance at October 31, 2012 | | | – | | | $ | – | |
Opened | | | 5 | | | | 12,619 | |
Closed | | | (2 | ) | | | (6,576 | ) |
Expired | | | (3 | ) | | | (6,043 | ) |
Exercised | | | – | | | | – | |
| | | | | | | | |
Balance at October 31, 2013 | | | – | | | $ | – | |
| | | | | | | | |
Moderate Allocation | | | | | | | | |
Balance at October 31, 2012 | | | – | | | $ | – | |
Opened | | | 16 | | | | 42,988 | |
Closed | | | (8 | ) | | | (22,402 | ) |
Expired | | | (8 | ) | | | (20,586 | ) |
Exercised | | | – | | | | – | |
| | | | | | | | |
Balance at October 31, 2013 | | | – | | | $ | – | |
| | | | | | | | |
Moderately Conservative Allocation | | | | | | | | |
Balance at October 31, 2012 | | | – | | | $ | – | |
Opened | | | 16 | | | | 45,346 | |
Closed | | | (8 | ) | | | (23,631 | ) |
Expired | | | (8 | ) | | | (21,715 | ) |
Exercised | | | – | | | | – | |
| | | | | | | | |
Balance at October 31, 2013 | | | – | | | $ | – | |
| | | | | | | | |
(6) SECURITY TRANSACTIONS WITH AFFILIATED FUNDS
The Funds are permitted to purchase or sell securities from or to certain other Funds under specified conditions outlined in procedures adopted by the Board. The procedures have been designed to ensure that any purchase or sale of securities by a Fund from or to another fund or portfolio that is or could be considered an affiliate by virtue of having a common investment adviser (or affiliated investment advisers), common Trustees and/or common officers complies with Rule 17a-7 of the 1940 Act. Further, as defined under the procedures, each transaction is executed at the current market price.
(7) RELATED PARTY TRANSACTIONS
As of October 31, 2013, related parties (other than the Thrivent Asset Allocation Funds) held the following shares in excess of 5% of Thrivent Mutual Funds:
| | | | | | | | |
Fund | | Shares | | | Percent of
Fund’s
Outstanding
Shares | |
Partner Emerging Markets Equity | | | 1,016,610 | | | | 68.4 | % |
Partner Small Cap Growth | | | 643,298 | | | | 6.5 | % |
Partner Mid Cap Value | | | 516,189 | | | | 5.2 | % |
Partner Worldwide Allocation | | | 7,741,578 | | | | 9.4 | % |
Government Bond | | | 3,526,991 | | | | 32.7 | % |
As of October 31, 2013, retirement plans sponsored by Thrivent Financial for Lutherans held the following shares in excess of 5% of Thrivent Mutual Funds:
| | | | | | | | |
Fund | | Shares | | | Percent of
Fund’s
Outstanding
Shares | |
Aggressive Allocation | | | 6,490,857 | | | | 13.0 | % |
Moderately Aggressive Allocation | | | 7,683,006 | | | | 6.3 | % |
Balanced Income Plus | | | 3,729,594 | | | | 23.8 | % |
Partner Small Cap Value | | | 1,318,494 | | | | 10.2 | % |
Mid Cap Stock | | | 2,925,964 | | | | 6.7 | % |
288
Thrivent Mutual Funds
Notes to Financial Statements
October 31, 2013
(8) SUBSEQUENT EVENTS
The Adviser of the Funds has evaluated the impact of subsequent events, and, except as already included in the Notes to Financial Statements, has determined that no additional items require disclosure.
289
Thrivent Mutual Funds
Financial Highlights
| | | | | | | | | | | | |
| | | FOR A SHARE OUTSTANDING THROUGHOUT EACH PERIOD* |
| | | | | Income from Investment Operations | | Less Distributions from |
| | | Net Asset
Value,
Beginning of
Period | | Net
Investment
Income/(Loss) | | Net Realized
and Unrealized
Gain/(Loss) on
Investments(a) | | Total from
Investment
Operations | | Net
Investment
Income | | Net Realized
Gain on
Investments |
AGGRESSIVE ALLOCATION FUND |
Class A Shares | | | | | | | | | | | | |
Year Ended 10/31/2013 | | $11.54 | | $0.07 | | $2.73 | | $2.80 | | $(0.09) | | $(0.10) |
Year Ended 10/31/2012 | | 10.70 | | 0.04 | | 0.85 | | 0.89 | | (0.05) | | – |
Year Ended 10/31/2011 | | 10.35 | | 0.07 | | 0.33 | | 0.40 | | (0.05) | | – |
Year Ended 10/31/2010 | | 8.81 | | 0.06 | | 1.55 | | 1.61 | | (0.07) | | – |
Year Ended 10/31/2009 | | 8.26 | | 0.10 | | 0.99 | | 1.09 | | (0.09) | | (0.45) |
Institutional Class Shares | | | | | | | | | | | | |
Year Ended 10/31/2013 | | 11.64 | | 0.12 | | 2.75 | | 2.87 | | (0.14) | | (0.10) |
Year Ended 10/31/2012 | | 10.78 | | 0.09 | | 0.86 | | 0.95 | | (0.09) | | – |
Year Ended 10/31/2011 | | 10.43 | | 0.11 | | 0.33 | | 0.44 | | (0.09) | | – |
Year Ended 10/31/2010 | | 8.87 | | 0.09 | | 1.56 | | 1.65 | | (0.09) | | – |
Year Ended 10/31/2009 | | 8.31 | | 0.13 | | 1.00 | | 1.13 | | (0.12) | | (0.45) |
MODERATELY AGGRESSIVE ALLOCATION FUND |
Class A Shares | | | | | | | | | | | | |
Year Ended 10/31/2013 | | 11.64 | | 0.15 | | 2.16 | | 2.31 | | (0.17) | | (0.09) |
Year Ended 10/31/2012 | | 10.83 | | 0.11 | | 0.84 | | 0.95 | | (0.14) | | – |
Year Ended 10/31/2011 | | 10.65 | | 0.16 | | 0.17 | | 0.33 | | (0.15) | | – |
Year Ended 10/31/2010 | | 9.25 | | 0.16 | | 1.39 | | 1.55 | | (0.15) | | – |
Year Ended 10/31/2009 | | 8.36 | | 0.20 | | 1.11 | | 1.31 | | (0.20) | | (0.22) |
Institutional Class Shares | | | | | | | | | | | | |
Year Ended 10/31/2013 | | 11.73 | | 0.20 | | 2.17 | | 2.37 | | (0.22) | | (0.09) |
Year Ended 10/31/2012 | | 10.92 | | 0.16 | | 0.83 | | 0.99 | | (0.18) | | – |
Year Ended 10/31/2011 | | 10.72 | | 0.20 | | 0.18 | | 0.38 | | (0.18) | | – |
Year Ended 10/31/2010 | | 9.31 | | 0.20 | | 1.39 | | 1.59 | | (0.18) | | – |
Year Ended 10/31/2009 | | 8.41 | | 0.23 | | 1.12 | | 1.35 | | (0.23) | | (0.22) |
MODERATE ALLOCATION FUND |
Class A Shares | | | | | | | | | | | | |
Year Ended 10/31/2013 | | 11.55 | | 0.18 | | 1.48 | | 1.66 | | (0.19) | | (0.14) |
Year Ended 10/31/2012 | | 10.80 | | 0.16 | | 0.77 | | 0.93 | | (0.17) | | (0.01) |
Year Ended 10/31/2011 | | 10.67 | | 0.22 | | 0.13 | | 0.35 | | (0.22) | | – |
Year Ended 10/31/2010 | | 9.46 | | 0.23 | | 1.20 | | 1.43 | | (0.22) | | – |
Year Ended 10/31/2009 | | 8.42 | | 0.27 | | 1.09 | | 1.36 | | (0.26) | | (0.06) |
Institutional Class Shares | | | | | | | | | | | | |
Year Ended 10/31/2013 | | 11.57 | | 0.22 | | 1.49 | | 1.71 | | (0.23) | | (0.14) |
Year Ended 10/31/2012 | | 10.82 | | 0.20 | | 0.77 | | 0.97 | | (0.21) | | (0.01) |
Year Ended 10/31/2011 | | 10.69 | | 0.26 | | 0.13 | | 0.39 | | (0.26) | | – |
Year Ended 10/31/2010 | | 9.48 | | 0.26 | | 1.20 | | 1.46 | | (0.25) | | – |
Year Ended 10/31/2009 | | 8.43 | | 0.29 | | 1.11 | | 1.40 | | (0.29) | | (0.06) |
(a) | The amount shown may not correlate with the change in aggregate gains and losses of portfolio securities due to the timing of sales and redemptions of fund shares. |
* | All per share amounts have been rounded to the nearest cent. |
The accompanying Notes to Financial Statements are an integral part of this schedule.
290
Thrivent Mutual Funds
Financial Highlights – continued
| | | | | | | | | | | | | | | | |
| | | RATIOS / SUPPLEMENTAL DATA |
| | | | | | | | | Ratio to Average Net
Assets** | | Ratios to Average Net
Assets Before Expenses
Waived, Credited or Paid
Indirectly** |
Total
Distributions | | Net Asset
Value, End of
Period | | Total
Return(b) | | Net Assets, End
of Period
(in millions) | | Expenses | | Net
Investment
Income/(Loss) | | Expenses | | Net
Investment
Income/(Loss) | | Portfolio
Turnover Rate |
| | | | | | | | | | | | | | | | |
| | | | | | | | | | | | | | | | |
| $(0.19) | | $14.15 | | 24.64% | | $612.4 | | 0.81% | | 0.52% | | 0.82% | | 0.51% | | 44% |
(0.05) | | 11.54 | | 8.42% | | 494.3 | | 0.82% | | 0.33% | | 0.86% | | 0.29% | | 66% |
(0.05) | | 10.70 | | 3.87% | | 462.1 | | 0.75% | | 0.64% | | 0.89% | | 0.51% | | 72% |
(0.07) | | 10.35 | | 18.29% | | 435.5 | | 0.70% | | 0.57% | | 0.90% | | 0.37% | | 52% |
(0.54) | | 8.81 | | 14.66% | | 354.6 | | 0.57% | | 1.27% | | 0.88% | | 0.96% | | 19% |
| | | | | | | | | | | | | | | | |
| | | | | | | | | | | | | | | | |
(0.24) | | 14.27 | | 25.11% | | 94.6 | | 0.40% | | 0.96% | | 0.40% | | 0.96% | | 44% |
(0.09) | | 11.64 | | 8.94% | | 81.2 | | 0.42% | | 0.73% | | 0.42% | | 0.73% | | 66% |
(0.09) | | 10.78 | | 4.16% | | 80.0 | | 0.40% | | 1.01% | | 0.41% | | 1.00% | | 72% |
(0.09) | | 10.43 | | 18.73% | | 73.7 | | 0.35% | | 0.94% | | 0.39% | | 0.90% | | 52% |
(0.57) | | 8.87 | | 15.16% | | 62.9 | | 0.23% | | 1.62% | | 0.25% | | 1.60% | | 19% |
| | | | | | | | | | | | | | | | |
| | | | | | | | | | | | | | | | |
(0.26) | | 13.69 | | 20.28% | | 1,558.9 | | 0.72% | | 1.15% | | 0.74% | | 1.13% | | 51% |
(0.14) | | 11.64 | | 8.92% | | 1,268.2 | | 0.77% | | 0.99% | | 0.77% | | 0.99% | | 78% |
(0.15) | | 10.83 | | 3.06% | | 1,168.6 | | 0.70% | | 1.44% | | 0.75% | | 1.39% | | 58% |
(0.15) | | 10.65 | | 16.92% | | 1,085.3 | | 0.62% | | 1.60% | | 0.75% | | 1.47% | | 39% |
(0.42) | | 9.25 | | 16.78% | | 904.1 | | 0.54% | | 2.50% | | 0.72% | | 2.31% | | 17% |
| | | | | | | | | | | | | | | | |
| | | | | | | | | | | | | | | | |
(0.31) | | 13.79 | | 20.66% | | 107.5 | | 0.35% | | 1.50% | | 0.35% | | 1.50% | | 51% |
(0.18) | | 11.73 | | 9.29% | | 90.2 | | 0.37% | | 1.39% | | 0.37% | | 1.39% | | 78% |
(0.18) | | 10.92 | | 3.55% | | 85.1 | | 0.32% | | 1.82% | | 0.33% | | 1.81% | | 58% |
(0.18) | | 10.72 | | 17.24% | | 79.5 | | 0.28% | | 1.94% | | 0.31% | | 1.92% | | 39% |
(0.45) | | 9.31 | | 17.27% | | 69.0 | | 0.20% | | 2.85% | | 0.21% | | 2.84% | | 17% |
| | | | | | | | | | | | | | | | |
| | | | | | | | | | | | | | | | |
(0.33) | | 12.88 | | 14.74% | | 1,541.3 | | 0.68% | | 1.51% | | 0.70% | | 1.48% | | 85% |
(0.18) | | 11.55 | | 8.68% | | 1,316.5 | | 0.71% | | 1.47% | | 0.71% | | 1.47% | | 94% |
(0.22) | | 10.80 | | 3.27% | | 1,207.6 | | 0.65% | | 2.02% | | 0.68% | | 1.99% | | 46% |
(0.22) | | 10.67 | | 15.30% | | 1,118.6 | | 0.60% | | 2.28% | | 0.68% | | 2.21% | | 30% |
(0.32) | | 9.46 | | 16.91% | | 923.2 | | 0.53% | | 3.24% | | 0.64% | | 3.12% | | 19% |
| | | | | | | | | | | | | | | | |
(0.37) | | 12.91 | | 15.18% | | 75.2 | | 0.35% | | 1.83% | | 0.35% | | 1.83% | | 85% |
(0.22) | | 11.57 | | 9.05% | | 66.0 | | 0.35% | | 1.83% | | 0.35% | | 1.83% | | 94% |
(0.26) | | 10.82 | | 3.62% | | 59.7 | | 0.30% | | 2.36% | | 0.31% | | 2.35% | | 46% |
(0.25) | | 10.69 | | 15.64% | | 50.5 | | 0.27% | | 2.60% | | 0.29% | | 2.58% | | 30% |
(0.35) | | 9.48 | | 17.38% | | 38.5 | | 0.20% | | 3.55% | | 0.21% | | 3.54% | | 19% |
(b) | Total investment return assumes dividend reinvestment and does not reflect any deduction for applicable sales charges. Not annualized for periods less than one year. |
** | Computed on an annualized basis for periods less than one year. |
The accompanying Notes to Financial Statements are an integral part of this schedule.
291
Thrivent Mutual Funds
Financial Highlights—continued
| | | | | | | | | | | | |
| | | FOR A SHARE OUTSTANDING THROUGHOUT EACH PERIOD* |
| | | | | Income from Investment Operations | | Less Distributions from |
| | | Net Asset
Value,
Beginning of
Period | | Net
Investment
Income/(Loss) | | Net Realized
and Unrealized
Gain/(Loss) on
Investments(a) | | Total from
Investment
Operations | | Net
Investment
Income | | Net Realized
Gain on
Investments |
MODERATELY CONSERVATIVE ALLOCATION FUND |
Class A Shares | | | | | | | | | | | | |
Year Ended 10/31/2013 | | $11.34 | | $0.20 | | $0.83 | | $1.03 | | $(0.20) | | $(0.19) |
Year Ended 10/31/2012 | | 10.75 | | 0.19 | | 0.65 | | 0.84 | | (0.19) | | (0.06) |
Year Ended 10/31/2011 | | 10.73 | | 0.25 | | 0.02 | | 0.27 | | (0.25) | | – |
Year Ended 10/31/2010 | | 9.78 | | 0.27 | | 0.94 | | 1.21 | | (0.26) | | – |
Year Ended 10/31/2009 | | 8.75 | | 0.30 | | 1.03 | | 1.33 | | (0.30) | | – |
Institutional Class Shares | | | | | | | | | | | | |
Year Ended 10/31/2013 | | 11.37 | | 0.23 | | 0.83 | | 1.06 | | (0.23) | | (0.19) |
Year Ended 10/31/2012 | | 10.78 | | 0.22 | | 0.65 | | 0.87 | | (0.22) | | (0.06) |
Year Ended 10/31/2011 | | 10.75 | | 0.28 | | 0.03 | | 0.31 | | (0.28) | | – |
Year Ended 10/31/2010 | | 9.80 | | 0.29 | | 0.94 | | 1.23 | | (0.28) | | – |
Year Ended 10/31/2009 | | 8.77 | | 0.32 | | 1.03 | | 1.35 | | (0.32) | | – |
BALANCED INCOME PLUS FUND | | | | | | | | |
Class A Shares | | | | | | | | | | | | |
Year Ended 10/31/2013 | | 12.63 | | 0.14 | | 2.24 | | 2.38 | | (0.15) | | (0.65) |
Year Ended 10/31/2012 | | 12.11 | | 0.13 | | 0.83 | | 0.96 | | (0.13) | | (0.31) |
Year Ended 10/31/2011 | | 11.68 | | 0.16 | | 0.42 | | 0.58 | | (0.15) | | – |
Year Ended 10/31/2010 | | 10.20 | | 0.15 | | 1.48 | | 1.63 | | (0.15) | | – |
Year Ended 10/31/2009 | | 8.91 | | 0.14 | | 1.30 | | 1.44 | | (0.15) | | – |
Institutional Class Shares | | | | | | | | | | | | |
Year Ended 10/31/2013 | | 12.61 | | 0.20 | | 2.24 | | 2.44 | | (0.20) | | (0.66) |
Year Ended 10/31/2012 | | 12.09 | | 0.19 | | 0.82 | | 1.01 | | (0.18) | | (0.31) |
Year Ended 10/31/2011 | | 11.66 | | 0.21 | | 0.43 | | 0.64 | | (0.21) | | – |
Year Ended 10/31/2010 | | 10.19 | | 0.20 | | 1.47 | | 1.67 | | (0.20) | | – |
Year Ended 10/31/2009 | | 8.90 | | 0.19 | | 1.30 | | 1.49 | | (0.20) | | – |
OPPORTUNITY INCOME PLUS FUND | | | | | | | | |
Class A Shares | | | | | | | | | | | | |
Year Ended 10/31/2013 | | 10.70 | | 0.26 | | (0.39) | | (0.13) | | (0.25) | | – |
Year Ended 10/31/2012 | | 10.19 | | 0.26 | | 0.50 | | 0.76 | | (0.25) | | – |
Year Ended 10/31/2011 | | 10.11 | | 0.37 | | 0.08 | | 0.45 | | (0.37) | | – |
Year Ended 10/31/2010 | | 9.36 | | 0.39 | | 0.75 | | 1.14 | | (0.39) | | – |
Year Ended 10/31/2009 | | 8.36 | | 0.37 | | 1.02 | | 1.39 | | (0.39) | | – |
Institutional Class Shares | | | | | | | | | | | | |
Year Ended 10/31/2013 | | 10.71 | | 0.29 | | (0.40) | | (0.11) | | (0.28) | | – |
Year Ended 10/31/2012 | | 10.19 | | 0.30 | | 0.51 | | 0.81 | | (0.29) | | – |
Year Ended 10/31/2011 | | 10.11 | | 0.40 | | 0.08 | | 0.48 | | (0.40) | | – |
Year Ended 10/31/2010 | | 9.36 | | 0.43 | | 0.74 | | 1.17 | | (0.42) | | – |
Year Ended 10/31/2009 | | 8.36 | | 0.40 | | 1.02 | | 1.42 | | (0.42) | | – |
(a) | The amount shown may not correlate with the change in aggregate gains and losses of portfolio securities due to the timing of sales and redemptions of fund shares. |
* | All per share amounts have been rounded to the nearest cent. |
The accompanying Notes to Financial Statements are an integral part of this schedule.
292
Thrivent Mutual Funds
Financial Highlights – continued
| | | | | | | | | | | | | | | | |
| | | RATIOS / SUPPLEMENTAL DATA |
| | | | | | | | | Ratio to Average Net
Assets** | | Ratios to Average Net
Assets Before Expenses
Waived, Credited or Paid
Indirectly** |
Total
Distributions | | Net Asset
Value, End of
Period | | Total
Return(b) | | Net Assets, End
of Period (in millions) | | Expenses | | Net
Investment
Income/(Loss) | | Expenses | | Net
Investment
Income/(Loss) | | Portfolio
Turnover Rate |
| | | | | | | | | | |
| | | | | | | | | | | | | | | | |
$(0.39) | | $11.98 | | 9.32% | | $701.3 | | 0.71% | | 1.70% | | 0.75% | | 1.67% | | 166% |
(0.25) | | 11.34 | | 7.92% | | 632.9 | | 0.75% | | 1.70% | | 0.75% | | 1.70% | | 145% |
(0.25) | | 10.75 | | 2.49% | | 559.7 | | 0.64% | | 2.28% | | 0.69% | | 2.23% | | 46% |
(0.26) | | 10.73 | | 12.53% | | 503.7 | | 0.58% | | 2.61% | | 0.69% | | 2.50% | | 29% |
(0.30) | | 9.78 | | 15.66% | | 392.9 | | 0.51% | | 3.45% | | 0.64% | | 3.31% | | 21% |
| | | | | | | | | | | | | | | | |
(0.42) | | 12.01 | | 9.62% | | 31.7 | | 0.41% | | 2.01% | | 0.41% | | 2.01% | | 166% |
(0.28) | | 11.37 | | 8.26% | | 28.0 | | 0.41% | | 2.03% | | 0.41% | | 2.03% | | 145% |
(0.28) | | 10.78 | | 2.88% | | 22.4 | | 0.33% | | 2.59% | | 0.33% | | 2.59% | | 46% |
(0.28) | | 10.75 | | 12.78% | | 21.7 | | 0.32% | | 2.87% | | 0.33% | | 2.86% | | 29% |
(0.32) | | 9.80 | | 15.91% | | 13.8 | | 0.25% | | 3.72% | | 0.25% | | 3.71% | | 21% |
| | | | | | | | | | | | | | | | |
| | | | | | | | | | | | | | | | |
(0.80) | | 14.21 | | 19.95% | | 167.8 | | 1.09% | | 1.08% | | 1.10% | | 1.08% | | 236% |
(0.44) | | 12.63 | | 8.22% | | 141.0 | | 1.11% | | 1.06% | | 1.12% | | 1.06% | | 197% |
(0.15) | | 12.11 | | 4.98% | | 141.0 | | 1.12% | | 1.25% | | 1.13% | | 1.24% | | 211% |
(0.15) | | 11.68 | | 16.04% | | 148.9 | | 1.17% | | 1.30% | | 1.17% | | 1.30% | | 219% |
(0.15) | | 10.20 | | 16.42% | | 144.0 | | 1.23% | | 1.55% | | 1.24% | | 1.54% | | 264% |
| | | | | | | | | | | | | | | | |
(0.86) | | 14.19 | | 20.49% | | 54.7 | | 0.66% | | 1.52% | | 0.67% | | 1.51% | | 236% |
(0.49) | | 12.61 | | 8.72% | | 49.9 | | 0.66% | | 1.52% | | 0.67% | | 1.51% | | 197% |
(0.21) | | 12.09 | | 5.50% | | 52.7 | | 0.65% | | 1.73% | | 0.65% | | 1.72% | | 211% |
(0.20) | | 11.66 | | 16.55% | | 56.6 | | 0.67% | | 1.80% | | 0.67% | | 1.80% | | 219% |
(0.20) | | 10.19 | | 17.12% | | 54.2 | | 0.66% | | 2.11% | | 0.67% | | 2.10% | | 264% |
| | | | | | | | | | | | | | | | |
| | | | | | | | | | | | | | | | |
(0.25) | | 10.32 | | (1.26)% | | 228.4 | | 0.85% | | 2.42% | | 0.94% | | 2.33% | | 387% |
(0.25) | | 10.70 | | 7.59% | | 249.2 | | 0.85% | | 2.53% | | 0.94% | | 2.44% | | 355% |
(0.37) | | 10.19 | | 4.53% | | 236.3 | | 0.85% | | 3.64% | | 0.95% | | 3.54% | | 333% |
(0.39) | | 10.11 | | 12.42% | | 245.0 | | 0.86% | | 4.08% | | 0.97% | | 3.96% | | 307% |
(0.39) | | 9.36 | | 17.12% | | 231.4 | | 0.89% | | 4.35% | | 1.01% | | 4.24% | | 409% |
| | | | | | | | | | | | | | | | |
(0.28) | | 10.32 | | (1.04)% | | 24.8 | | 0.53% | | 2.58% | | 0.55% | | 2.56% | | 387% |
(0.29) | | 10.71 | | 8.03% | | 37.0 | | 0.53% | | 2.93% | | 0.54% | | 2.91% | | 355% |
(0.40) | | 10.19 | | 4.88% | | 56.5 | | 0.52% | | 3.97% | | 0.53% | | 3.95% | | 333% |
(0.42) | | 10.11 | | 12.79% | | 50.1 | | 0.53% | | 4.42% | | 0.55% | | 4.40% | | 307% |
(0.42) | | 9.36 | | 17.54% | | 64.0 | | 0.53% | | 4.71% | | 0.54% | | 4.69% | | 409% |
(b) Total investment return assumes dividend reinvestment and does not reflect any deduction for applicable sales charges. Not annualized for periods less than one year.
** Computed on an annualized basis for periods less than one year.
The accompanying Notes to Financial Statements are an integral part of this schedule.
293
Thrivent Mutual Funds
Financial Highlights – continued
| | | | | | | | | | | | |
| | | FOR A SHARE OUTSTANDING THROUGHOUT EACH PERIOD* |
| | | | | Income from Investment Operations | | Less Distributions from |
| | | Net Asset
Value,
Beginning of
Period | | Net
Investment
Income/(Loss) | | Net Realized
and Unrealized
Gain/(Loss) on
Investments(a) | | Total from
Investment
Operations | | Net
Investment
Income | | Net Realized
Gain on
Investments |
PARTNER EMERGING MARKETS EQUITY FUND |
Class A Shares | | | | | | | | | | | | |
Year Ended 10/31/2013 | | $10.27 | | $0.08 | | $0.26 | | $0.34 | | $– | | $(0.10) |
Year Ended 10/31/2012 (c) | | 10.00 | | 0.01 | | 0.26 | | 0.27 | | – | | – |
Institutional Class Shares | | | | | | | | | | | | |
Year Ended 10/31/2013 | | 10.27 | | 0.12 | | 0.26 | | 0.38 | | – | | (0.10) |
Year Ended 10/31/2012 (c) | | 10.00 | | 0.02 | | 0.25 | | 0.27 | | – | | – |
PARTNER SMALL CAP GROWTH FUND |
Class A Shares | | | | | | | | | | | | |
Year Ended 10/31/2013 | | 12.64 | | (0.05) | | 4.82 | | 4.77 | | – | | (0.38) |
Year Ended 10/31/2012 | | 11.72 | | (0.17) | | 1.09 | | 0.92 | | – | | – |
Year Ended 10/31/2011 | | 10.81 | | (0.12) | | 1.03 | | 0.91 | | – | | – |
Year Ended 10/31/2010 | | 8.31 | | (0.11) | | 2.61 | | 2.50 | | – | | – |
Year Ended 10/31/2009 | | 7.72 | | (0.04) | | 0.63 | | 0.59 | | – | | – |
Institutional Class Shares | | | | | | | | | | | | |
Year Ended 10/31/2013 | | 12.98 | | (0.04) | | 5.01 | | 4.97 | | – | | (0.38) |
Year Ended 10/31/2012 | | 11.99 | | (0.07) | | 1.06 | | 0.99 | | – | | – |
Year Ended 10/31/2011 | | 11.01 | | (0.08) | | 1.06 | | 0.98 | | – | | – |
Year Ended 10/31/2010 | | 8.42 | | (0.07) | | 2.66 | | 2.59 | | – | | – |
Year Ended 10/31/2009 | | 7.79 | | (0.03) | | 0.66 | | 0.63 | | – | | – |
PARTNER SMALL CAP VALUE FUND |
Class A Shares | | | | | | | | | | | | |
Year Ended 10/31/2013 | | 15.99 | | 0.15 | | 5.07 | | 5.22 | | (0.30) | | (0.29) |
Year Ended 10/31/2012 | | 14.47 | | 0.09 | | 1.60 | | 1.69 | | (0.01) | | (0.16) |
Year Ended 10/31/2011 | | 13.72 | | 0.04 | | 0.80 | | 0.84 | | (0.09) | | – |
Year Ended 10/31/2010 | | 11.26 | | 0.02 | | 2.47 | | 2.49 | | (0.03) | | – |
Year Ended 10/31/2009 | | 11.02 | | 0.05 | | 0.86 | | 0.91 | | (0.05) | | (0.62) |
Institutional Class Shares | | | | | | | | | | | | |
Year Ended 10/31/2013 | | 16.80 | | 0.23 | | 5.34 | | 5.57 | | (0.38) | | (0.29) |
Year Ended 10/31/2012 | | 15.19 | | 0.18 | | 1.69 | | 1.87 | | (0.10) | | (0.16) |
Year Ended 10/31/2011 | | 14.39 | | 0.14 | | 0.82 | | 0.96 | | (0.16) | | – |
Year Ended 10/31/2010 | | 11.81 | | 0.09 | | 2.59 | | 2.68 | | (0.10) | | – |
Year Ended 10/31/2009 | | 11.53 | | 0.10 | | 0.94 | | 1.04 | | (0.14) | | (0.62) |
(a) | The amount shown may not correlate with the change in aggregate gains and losses of portfolio securities due to the timing of sales and redemptions of fund shares. |
(c) | Since fund inception, August 31, 2012. |
* | All per share amounts have been rounded to the nearest cent. |
The accompanying Notes to Financial Statements are an integral part of this schedule.
294
Thrivent Mutual Funds
Financial Highlights – continued
| | | | | | | | | | | | | | | | |
| | | RATIOS / SUPPLEMENTAL DATA |
| | | | | | | | | Ratio to Average Net
Assets** | | Ratios to Average Net Assets
Before Expenses Waived,
Credited or Paid Indirectly** |
Total
Distributions | | Net Asset
Value, End of
Period | | Total
Return(b) | | Net Assets, End
of Period
(in millions) | | Expenses | | Net Investment
Income/(Loss) | | Expenses | | Net
Investment
Income/(Loss) | | Portfolio
Turnover Rate |
| | | | | | | | | | | | | | | | |
| | | | | | | | | | | | | | | | |
| $(0.10) | | $10.51 | | 3.26% | | $14.6 | | 1.64% | | 0.81% | | 3.41% | | (0.96)% | | 103% |
– | | 10.27 | | 2.70% | | 14.4 | | 1.61% | | 0.60% | | 3.02% | | (0.81)% | | 33% |
| | | | | | | | | | | | | | | | |
(0.10) | | 10.55 | | 3.65% | | 1.0 | | 1.32% | | 1.12% | | 3.14% | | (0.70)% | | 103% |
– | | 10.27 | | 2.70% | | 1.0 | | 1.32% | | 0.89% | | 2.75% | | (0.54)% | | 33% |
| | | | | | | | | | | | | | | | |
| | | | | | | | | | | | | | | | |
(0.38) | | 17.03 | | 38.86% | | 26.0 | | 1.40% | | (0.62)% | | 1.55% | | (0.76)% | | 84% |
– | | 12.64 | | 7.85% | | 17.2 | | 1.42% | | (0.89)% | | 1.53% | | (1.01)% | | 100% |
– | | 11.72 | | 8.42% | | 20.0 | | 1.47% | | (1.10)% | | 1.51% | | (1.13)% | | 106% |
– | | 10.81 | | 30.08% | | 17.3 | | 1.56% | | (1.14)% | | 1.56% | | (1.14)% | | 102% |
– | | 8.31 | | 7.64% | | 12.8 | | 1.58% | | (0.90)% | | 1.61% | | (0.93)% | | 116% |
| | | | | | | | | | | | | | | | |
(0.38) | | 17.57 | | 39.40% | | 146.1 | | 1.04% | | (0.24)% | | 1.04% | | (0.24)% | | 84% |
– | | 12.98 | | 8.26% | | 115.0 | | 1.05% | | (0.53)% | | 1.05% | | (0.53)% | | 100% |
– | | 11.99 | | 8.90% | | 104.4 | | 1.05% | | (0.67)% | | 1.05% | | (0.67)% | | 106% |
– | | 11.01 | | 30.76% | | 95.9 | | 1.09% | | (0.67)% | | 1.09% | | (0.67)% | | 102% |
– | | 8.42 | | 8.09% | | 72.7 | | 1.09% | | (0.40)% | | 1.12% | | (0.43)% | | 116% |
| | | | | | | | | | | | | | | | |
| | | | | | | | | | | | | | | | |
(0.59) | | 20.62 | | 33.79% | | 96.0 | | 1.32% | | 0.76% | | 1.32% | | 0.76% | | 6% |
(0.17) | | 15.99 | | 11.87% | | 72.0 | | 1.36% | | 0.59% | | 1.37% | | 0.59% | | 11% |
(0.09) | | 14.47 | | 6.08% | | 69.3 | | 1.40% | | 0.28% | | 1.40% | | 0.28% | | 9% |
(0.03) | | 13.72 | | 22.14% | | 71.7 | | 1.40% | | 0.14% | | 1.47% | | 0.07% | | 17% |
(0.67) | | 11.26 | | 9.51% | | 59.0 | | 1.56% | | 0.55% | | 1.67% | | 0.44% | | 14% |
| | | | | | | | | | | | | | | | |
(0.67) | | 21.70 | | 34.41% | | 178.6 | | 0.84% | | 1.28% | | 0.84% | | 1.28% | | 6% |
(0.26) | | 16.80 | | 12.51% | | 148.9 | | 0.85% | | 1.10% | | 0.85% | | 1.10% | | 11% |
(0.16) | | 15.19 | | 6.64% | | 143.4 | | 0.84% | | 0.84% | | 0.84% | | 0.84% | | 9% |
(0.10) | | 14.39 | | 22.78% | | 160.7 | | 0.85% | | 0.70% | | 0.85% | | 0.70% | | 17% |
(0.76) | | 11.81 | | 10.37% | | 119.2 | | 0.83% | | 1.25% | | 0.87% | | 1.21% | | 14% |
(b) | Total investment return assumes dividend reinvestment and does not reflect any deduction for applicable sales charges. Not annualized for periods less than one year. |
** | Computed on an annualized basis for periods less than one year. |
The accompanying Notes to Financial Statements are an integral part of this schedule.
295
Thrivent Mutual Funds
Financial Highlights – continued
| | | | | | | | | | | | |
| | | FOR A SHARE OUTSTANDING THROUGHOUT EACH PERIOD* |
| | | | | Income from Investment Operations | | Less Distributions from |
| | | Net Asset
Value,
Beginning
of Period | | Net
Investment
Income/(Loss) | | Net Realized
and Unrealized
Gain/(Loss) on
Investments(a) | | Total from
Investment
Operations | | Net
Investment
Income | | Net Realized
Gain on
Investments |
SMALL CAP STOCK FUND |
Class A Shares | | | | | | | | | | | | |
Year Ended 10/31/2013 | | $14.28 | | $(0.05) | | $4.29 | | $4.24 | | $– | | $– |
Year Ended 10/31/2012 | | 13.35 | | (0.06) | | 0.99 | | 0.93 | | – | | – |
Year Ended 10/31/2011 | | 12.56 | | (0.11) | | 0.90 | | 0.79 | | – | | – |
Year Ended 10/31/2010 | | 10.26 | | (0.09) | | 2.39 | | 2.30 | | – | | – |
Year Ended 10/31/2009 | | 10.33 | | – | | (0.06) | | (0.06) | | (0.01) | | – |
Institutional Class Shares | | | | | | | | | | | | |
Year Ended 10/31/2013 | | 16.09 | | 0.09 | | 4.80 | | 4.89 | | – | | – |
Year Ended 10/31/2012 | | 14.96 | | 0.05 | | 1.08 | | 1.13 | | – | | – |
Year Ended 10/31/2011 | | 13.99 | | 0.07 | | 0.90 | | 0.97 | | – | | – |
Year Ended 10/31/2010 | | 11.35 | | 0.02 | | 2.62 | | 2.64 | | – | | – |
Year Ended 10/31/2009 | | 11.43 | | 0.22 | | (0.20) | | 0.02 | | (0.10) | | – |
MID CAP GROWTH FUND |
Class A Shares | | | | | | | | | | | | |
Year Ended 10/31/2013 | | 18.34 | | (0.03) | | 4.66 | | 4.63 | | – | | (1.36) |
Year Ended 10/31/2012 | | 17.67 | | (0.08) | | 0.90 | | 0.82 | | – | | (0.15) |
Year Ended 10/31/2011 | | 16.62 | | (0.08) | | 1.13 | | 1.05 | | – | | – |
Year Ended 10/31/2010 | | 12.92 | | (0.08) | | 3.78 | | 3.70 | | – | | – |
Year Ended 10/31/2009 | | 10.24 | | (0.06) | | 2.74 | | 2.68 | | – | | – |
Institutional Class Shares | | | | | | | | | | | | |
Year Ended 10/31/2013 | | 20.68 | | 0.15 | | 5.23 | | 5.38 | | – | | (1.36) |
Year Ended 10/31/2012 | | 19.81 | | 0.05 | | 0.97 | | 1.02 | | – | | (0.15) |
Year Ended 10/31/2011 | | 18.53 | | 0.05 | | 1.23 | | 1.28 | | – | | – |
Year Ended 10/31/2010 | | 14.31 | | (0.02) | | 4.24 | | 4.22 | | – | | – |
Year Ended 10/31/2009 | | 11.24 | | (0.05) | | 3.12 | | 3.07 | | – | | – |
PARTNER MID CAP VALUE FUND |
Class A Shares | | | | | | | | | | | | |
Year Ended 10/31/2013 | | 12.81 | | 0.06 | | 3.77 | | 3.83 | | (0.10) | | (0.28) |
Year Ended 10/31/2012 | | 11.55 | | 0.10 | | 1.21 | | 1.31 | | (0.05) | | – |
Year Ended 10/31/2011 | | 11.19 | | 0.05 | | 0.35 | | 0.40 | | (0.04) | | – |
Year Ended 10/31/2010 | | 8.97 | | 0.06 | | 2.23 | | 2.29 | | (0.07) | | – |
Year Ended 10/31/2009 | | 7.89 | | 0.04 | | 1.11 | | 1.15 | | (0.07) | | – |
Institutional Class Shares | | | | | | | | | | | | |
Year Ended 10/31/2013 | | 12.86 | | 0.13 | | 3.76 | | 3.89 | | (0.14) | | (0.28) |
Year Ended 10/31/2012 | | 11.60 | | 0.15 | | 1.20 | | 1.35 | | (0.09) | | – |
Year Ended 10/31/2011 | | 11.23 | | 0.10 | | 0.35 | | 0.45 | | (0.08) | | – |
Year Ended 10/31/2010 | | 8.99 | | 0.09 | | 2.24 | | 2.33 | | (0.09) | | – |
Year Ended 10/31/2009 | | 7.92 | | 0.09 | | 1.08 | | 1.17 | | (0.10) | | – |
(a) | The amount shown may not correlate with the change in aggregate gains and losses of portfolio securities due to the timing of sales and redemptions of fund shares. |
* | All per share amounts have been rounded to the nearest cent. |
The accompanying Notes to Financial Statements are an integral part of this schedule.
296
Thrivent Mutual Funds
Financial Highlights – continued
| | | | | | | | | | | | | | | | | | | | | | | | | | | | | | | | |
| | | | RATIOS / SUPPLEMENTAL DATA | |
| | | | | | | | | | | | Ratio to Average Net
Assets** | | | Ratios to Average Net
Assets Before Expenses
Waived, Credited or Paid
Indirectly** | |
Total
Distributions | | Net Asset
Value, End of
Period | | | Total
Return(b) | | | Net Assets, End
of Period
(in millions) | | | Expenses | | | Net
Investment
Income/(Loss) | | | Expenses | | | Net
Investment
Income/(Loss) | | | Portfolio
Turnover Rate | |
| | | | | | | | | | | | | | | | | | | | | | | | | | | | | | | | |
| | | | | | | | | | | | | | | | | | | | | | | | | | | | | | | | |
$– | | $ | 18.52 | | | | 29.69% | | | $ | 255.6 | | | | 1.29 | % | | | (0.16)% | | | | 1.29 | % | | | (0.16)% | | | | 66 | % |
– | | | 14.28 | | | | 6.97% | | | | 216.6 | | | | 1.33 | % | | | (0.31)% | | | | 1.33 | % | | | (0.31)% | | | | 91 | % |
– | | | 13.35 | | | | 6.29% | | | | 226.3 | | | | 1.37 | % | | | (0.67)% | | | | 1.37 | % | | | (0.67)% | | | | 99 | % |
– | | | 12.56 | | | | 22.42% | | | | 239.1 | | | | 1.46 | % | | | (0.62)% | | | | 1.46 | % | | | (0.62)% | | | | 203 | % |
(0.01) | | | 10.26 | | | | (0.54)% | | | | 221.2 | | | | 1.58 | % | | | 0.03% | | | | 1.58 | % | | | 0.03% | | | | 283 | % |
| | | | | | | | | | | | | | | | | | | | | | | | | | | | | | | | |
– | | | 20.98 | | | | 30.39% | | | | 80.2 | | | | 0.76 | % | | | 0.36% | | | | 0.76 | % | | | 0.36% | | | | 66 | % |
– | | | 16.09 | | | | 7.55% | | | | 63.4 | | | | 0.77 | % | | | 0.26% | | | | 0.77 | % | | | 0.26% | | | | 91 | % |
– | | | 14.96 | | | | 6.93% | | | | 60.3 | | | | 0.76 | % | | | (0.05)% | | | | 0.76 | % | | | (0.05)% | | | | 99 | % |
– | | | 13.99 | | | | 23.26% | | | | 68.6 | | | | 0.78 | % | | | 0.05% | | | | 0.78 | % | | | 0.05% | | | | 203 | % |
(0.10) | | | 11.35 | | | | 0.27% | | | | 58.8 | | | | 0.77 | % | | | 0.82% | | | | 0.78 | % | | | 0.82% | | | | 283 | % |
| | | | | | | | | | | | | | | | | | | | | | | | | | | | | | | | |
| | | | | | | | | | | | | | | | | | | | | | | | | | | | | | | | |
(1.36) | | | 21.61 | | | | 27.13% | | | | 265.7 | | | | 1.00 | % | | | (0.15)% | | | | 1.00 | % | | | (0.15)% | | | | 37 | % |
(0.15) | | | 18.34 | | | | 4.72% | | | | 229.0 | | | | 1.03 | % | | | (0.36)% | | | | 1.03 | % | | | (0.36)% | | | | 46 | % |
– | | | 17.67 | | | | 6.32% | | | | 238.0 | | | | 1.07 | % | | | (0.35)% | | | | 1.07 | % | | | (0.35)% | | | | 68 | % |
– | | | 16.62 | | | | 28.64% | | | | 241.7 | | | | 1.18 | % | | | (0.51)% | | | | 1.18 | % | | | (0.51)% | | | | 55 | % |
– | | | 12.92 | | | | 26.17% | | | | 201.0 | | | | 1.40 | % | | | (0.55)% | | | | 1.41 | % | | | (0.56)% | | | | 65 | % |
| | | | | | | | | | | | | | | | | | | | | | | | | | | | | | | | |
(1.36) | | | 24.70 | | | | 27.72% | | | | 154.1 | | | | 0.52 | % | | | 0.34% | | | | 0.52 | % | | | 0.34% | | | | 37 | % |
(0.15) | | | 20.68 | | | | 5.23% | | | | 150.7 | | | | 0.53 | % | | | 0.13% | | | | 0.53 | % | | | 0.13% | | | | 46 | % |
– | | | 19.81 | | | | 6.91% | | | | 152.8 | | | | 0.52 | % | | | 0.21% | | | | 0.52 | % | | | 0.21% | | | | 68 | % |
– | | | 18.53 | | | | 29.49% | | | | 147.6 | | | | 0.53 | % | | | 0.15% | | | | 0.53 | % | | | 0.15% | | | | 55 | % |
– | | | 14.31 | | | | 27.31% | | | | 90.8 | | | | 0.54 | % | | | 0.29% | | | | 0.55 | % | | | 0.28% | | | | 65 | % |
| | | | | | | | | | | | | | | | | | | | | | | | | | | | | | | | |
| | | | | | | | | | | | | | | | | | | | | | | | | | | | | | | | |
(0.38) | | | 16.26 | | | | 30.68% | | | | 31.1 | | | | 1.25 | % | | | 0.50% | | | | 1.43 | % | | | 0.32% | | | | 109 | % |
(0.05) | | | 12.81 | | | | 11.41% | | | | 19.4 | | | | 1.25 | % | | | 0.85% | | | | 1.46 | % | | | 0.64% | | | | 83 | % |
(0.04) | | | 11.55 | | | | 3.57% | | | | 17.8 | | | | 1.25 | % | | | 0.45% | | | | 1.43 | % | | | 0.27% | | | | 78 | % |
(0.07) | | | 11.19 | | | | 25.63% | | | | 16.6 | | | | 1.25 | % | | | 0.60% | | | | 1.46 | % | | | 0.38% | | | | 91 | % |
(0.07) | | | 8.97 | | | | 14.70% | | | | 13.3 | | | | 1.25 | % | | | 0.80% | | | | 1.57 | % | | | 0.48% | | | | 111 | % |
| | | | | | | | | | | | | | | | | | | | | | | | | | | | | | | | |
(0.42) | | | 16.33 | | | | 31.14% | | | | 129.6 | | | | 0.90 | % | | | 0.88% | | | | 0.90 | % | | | 0.88% | | | | 109 | % |
(0.09) | | | 12.86 | | | | 11.77% | | | | 111.1 | | | | 0.91 | % | | | 1.20% | | | | 0.91 | % | | | 1.20% | | | | 83 | % |
(0.08) | | | 11.60 | | | | 3.94% | | | | 100.4 | | | | 0.90 | % | | | 0.81% | | | | 0.90 | % | | | 0.81% | | | | 78 | % |
(0.09) | | | 11.23 | | | | 26.07% | | | | 104.2 | | | | 0.93 | % | | | 0.92% | | | | 0.93 | % | | | 0.92% | | | | 91 | % |
(0.10) | | | 8.99 | | | | 15.02% | | | | 81.0 | | | | 0.95 | % | | | 1.19% | | | | 0.97 | % | | | 1.18% | | | | 111 | % |
(b) Total investment return assumes dividend reinvestment and does not reflect any deduction for applicable sales charges. Not annualized for periods less than one year.
** Computed on an annualized basis for periods less than one year.
The accompanying Notes to Financial Statements are an integral part of this schedule.
297
Thrivent Mutual Funds
Financial Highlights – continued
| | | | | | | | | | | | |
| | | FOR A SHARE OUTSTANDING THROUGHOUT EACH PERIOD* |
| | | | | Income from Investment Operations | | Less Distributions from |
| | | Net Asset
Value,
Beginning of
Period | | Net
Investment
Income/(Loss) | | Net Realized
and Unrealized
Gain/(Loss) on
Investments(a) | | Total from
Investment
Operations | | Net
Investment
Income | | Net Realized
Gain on
Investments |
MID CAP STOCK FUND | | | | |
Class A Shares | | | | | | | | |
Year Ended 10/31/2013 | | $15.34 | | $0.01 | | $5.03 | | $5.04 | | $– | | $– |
Year Ended 10/31/2012 | | 14.30 | | (0.01) | | 1.05 | | 1.04 | | – | | – |
Year Ended 10/31/2011 | | 13.49 | | (0.02) | | 0.83 | | 0.81 | | – | | – |
Year Ended 10/31/2010 | | 10.89 | | – | | 2.60 | | 2.60 | | – | | – |
Year Ended 10/31/2009 | | 9.05 | | 0.01 | | 1.87 | | 1.88 | | (0.04) | | – |
Institutional Class Shares | | | | | | | | |
Year Ended 10/31/2013 | | 16.63 | | 0.10 | | 5.43 | | 5.53 | | (0.07) | | – |
Year Ended 10/31/2012 | | 15.43 | | 0.07 | | 1.13 | | 1.20 | | – | | – |
Year Ended 10/31/2011 | | 14.53 | | 0.06 | | 0.89 | | 0.95 | | (0.05) | | – |
Year Ended 10/31/2010 | | 11.71 | | 0.07 | | 2.79 | | 2.86 | | (0.04) | | – |
Year Ended 10/31/2009 | | 9.74 | | 0.07 | | 2.01 | | 2.08 | | (0.11) | | – |
PARTNER WORLDWIDE ALLOCATION FUND | | | | |
Class A Shares | | | | | | | | |
Year Ended 10/31/2013 | | 8.73 | | 0.16 | | 1.58 | | 1.74 | | (0.18) | | – |
Year Ended 10/31/2012 | | 8.30 | | 0.19 | | 0.32 | | 0.51 | | (0.08) | | – |
Year Ended 10/31/2011 | | 8.80 | | 0.10 | | (0.50) | | (0.40) | | (0.10) | | – |
Year Ended 10/31/2010 | | 7.70 | | 0.11 | | 1.10 | | 1.21 | | (0.11) | | – |
Year Ended 10/31/2009 | | 6.09 | | 0.11 | | 1.61 | | 1.72 | | (0.11) | | – |
Institutional Class Shares | | | | | | | | |
Year Ended 10/31/2013 | | 8.79 | | 0.19 | | 1.59 | | 1.78 | | (0.21) | | – |
Year Ended 10/31/2012 | | 8.34 | | 0.19 | | 0.35 | | 0.54 | | (0.09) | | – |
Year Ended 10/31/2011 | | 8.83 | | 0.08 | | (0.45) | | (0.37) | | (0.12) | | – |
Year Ended 10/31/2010 | | 7.72 | | 0.13 | | 1.11 | | 1.24 | | (0.13) | | – |
Year Ended 10/31/2009 | | 6.10 | | 0.08 | | 1.66 | | 1.74 | | (0.12) | | – |
LARGE CAP GROWTH FUND | | | | |
Class A Shares | | | | | | | | |
Year Ended 10/31/2013 | | 5.48 | | 0.01 | | 1.63 | | 1.64 | | (0.02) | | – |
Year Ended 10/31/2012 | | 4.92 | | 0.01 | | 0.55 | | 0.56 | | – | | – |
Year Ended 10/31/2011 | | 4.80 | | (0.01) | | 0.13 | | 0.12 | | – | | – |
Year Ended 10/31/2010 | | 4.26 | | (0.01) | | 0.56 | | 0.55 | | (0.01) | | – |
Year Ended 10/31/2009 | | 3.69 | | – | | 0.57 | | 0.57 | | – | | – |
Institutional Class Shares | | | | | | | | |
Year Ended 10/31/2013 | | 5.91 | | 0.04 | | 1.74 | | 1.78 | | (0.04) | | – |
Year Ended 10/31/2012 | | 5.28 | | 0.03 | | 0.60 | | 0.63 | | – | | – |
Year Ended 10/31/2011 | | 5.13 | | 0.01 | | 0.14 | | 0.15 | | – | | – |
Year Ended 10/31/2010 | | 4.54 | | 0.01 | | 0.60 | | 0.61 | | (0.02) | | – |
Year Ended 10/31/2009 | | 3.94 | | 0.03 | | 0.58 | | 0.61 | | (0.01) | | – |
(a) The amount shown may not correlate with the change in aggregate gains and losses of portfolio securities due to the timing of sales and redemptions of fund shares.
* All per share amounts have been rounded to the nearest cent.
The accompanying Notes to Financial Statements are an integral part of this schedule.
298
Thrivent Mutual Funds
Financial Highlights – continued
| | | | | | | | | | | | | | | | | | | | | | | | |
| | | RATIOS / SUPPLEMENTAL DATA | |
| | | | | | | | | | Ratio to Average Net
Assets** | | | Ratios to Average Net
Assets Before Expenses
Waived, Credited or Paid
Indirectly** | |
Total
Distributions | | Net Asset
Value, End of
Period | | Total
Return(b) | | | Net Assets, End
of Period
(in millions) | | Expenses | | Net
Investment
Income/(Loss) | | | Expenses | | Net
Investment
Income/(Loss) | | | Portfolio
Turnover Rate | |
| | | | | | | | | | | | | | | | | | | | | | | | |
| | | | | | | | | | | | | | | | | | | | | | | | |
| $– | | $20.38 | | | 32.86% | | | $625.4 | | 1.15% | | | 0.07% | | | 1.15% | | | 0.07% | | | | 39 | % |
| – | | 15.34 | | | 7.27% | | | 517.5 | | 1.18% | | | (0.08)% | | | 1.18% | | | (0.08)% | | | | 36 | % |
| – | | 14.30 | | | 6.00% | | | 538.7 | | 1.20% | | | (0.15)% | | | 1.20% | | | (0.15)% | | | | 35 | % |
| – | | 13.49 | | | 23.88% | | | 571.1 | | 1.25% | | | 0.01% | | | 1.25% | | | 0.01% | | | | 69 | % |
| (0.04) | | 10.89 | | | 20.85% | | | 517.6 | | 1.35% | | | 0.08% | | | 1.35% | | | 0.08% | | | | 56 | % |
| | | | | | | | | | | | | | | | | | | | | | | | |
| (0.07) | | 22.09 | | | 33.41% | | | 290.0 | | 0.71% | | | 0.50% | | | 0.71% | | | 0.50% | | | | 39 | % |
| – | | 16.63 | | | 7.78% | | | 220.4 | | 0.72% | | | 0.38% | | | 0.72% | | | 0.38% | | | | 36 | % |
| (0.05) | | 15.43 | | | 6.51% | | | 215.6 | | 0.71% | | | 0.33% | | | 0.71% | | | 0.33% | | | | 35 | % |
| (0.04) | | 14.53 | | | 24.50% | | | 216.6 | | 0.73% | | | 0.55% | | | 0.73% | | | 0.55% | | | | 69 | % |
| (0.11) | | 11.71 | | | 21.63% | | | 205.9 | | 0.73% | | | 0.65% | | | 0.73% | | | 0.65% | | | | 56 | % |
| | | | | | | | | | | | | | | | | | | | | | | | |
| | | | | | | | | | | | | | | | | | | | | | | | |
| (0.18) | | 10.29 | | | 20.26% | | | 181.6 | | 1.37% | | | 1.60% | | | 1.60% | | | 1.37% | | | | 74 | % |
| (0.08) | | 8.73 | | | 6.20% | | | 159.5 | | 1.30% | | | 2.02% | | | 1.61% | | | 1.71% | | | | 57 | % |
| (0.10) | | 8.30 | | | (4.60)% | | | 179.9 | | 1.30% | | | 1.86% | | | 1.61% | | | 1.55% | | | | 101 | % |
| (0.11) | | 8.80 | | | 15.88% | | | 35.3 | | 1.30% | | | 1.61% | | | 1.64% | | | 1.27% | | | | 88 | % |
| (0.11) | | 7.70 | | | 28.63% | | | 25.5 | | 1.30% | | | 2.03% | | | 1.78% | | | 1.55% | | | | 90 | % |
| | | | | | | | | | | | | | | | | | | | | | | | |
| (0.21) | | 10.36 | | | 20.64% | | | 671.5 | | 0.98% | | | 1.99% | | | 0.98% | | | 1.99% | | | | 74 | % |
| (0.09) | | 8.79 | | | 6.58% | | | 544.6 | | 0.98% | | | 2.31% | | | 0.98% | | | 2.31% | | | | 57 | % |
| (0.12) | | 8.34 | | | (4.24)% | | | 478.0 | | 1.00% | | | 2.16% | | | 1.06% | | | 2.10% | | | | 101 | % |
| (0.13) | | 8.83 | | | 16.26% | | | 219.2 | | 0.99% | | | 1.95% | | | 1.19% | | | 1.75% | | | | 88 | % |
| (0.12) | | 7.72 | | | 29.13% | | | 119.0 | | 0.95% | | | 2.37% | | | 1.34% | | | 1.99% | | | | 90 | % |
| | | | | | | | | | | | | | | | | | | | | | | | |
| | | | | | | | | | | | | | | | | | | | | | | | |
| (0.02) | | 7.10 | | | 29.99% | | | 157.0 | | 1.20% | | | 0.14% | | | 1.41% | | | (0.07)% | | | | 63 | % |
| – | | 5.48 | | | 11.38% | | | 125.0 | | 1.20% | | | 0.19% | | | 1.48% | | | (0.09)% | | | | 101 | % |
| – | | 4.92 | | | 2.50% | | | 117.7 | | 1.20% | | | (0.23)% | | | 1.56% | | | (0.59)% | | | | 249 | % |
| (0.01) | | 4.80 | | | 12.94% | | | 121.3 | | 1.19% | | | (0.22)% | | | 1.64% | | | (0.66)% | | | | 232 | % |
| – | | 4.26 | | | 15.45% | | | 118.7 | | 1.17% | | | 0.17% | | | 1.79% | | | (0.44)% | | | | 221 | % |
| | | | | | | | | | | | | | | | | | | | | | | | |
| (0.04) | | 7.65 | | | 30.30% | | | 286.9 | | 0.82% | | | 0.52% | | | 0.82% | | | 0.52% | | | | 63 | % |
| – | | 5.91 | | | 11.94% | | | 224.9 | | 0.83% | | | 0.57% | | | 0.83% | | | 0.57% | | | | 101 | % |
| – | | 5.28 | | | 2.92% | | | 204.3 | | 0.83% | | | 0.14% | | | 0.83% | | | 0.14% | | | | 249 | % |
| (0.02) | | 5.13 | | | 13.52% | | | 200.0 | | 0.84% | | | 0.13% | | | 0.84% | | | 0.13% | | | | 232 | % |
| (0.01) | | 4.54 | | | 15.72% | | | 173.6 | | 0.84% | | | 0.56% | | | 0.84% | | | 0.56% | | | | 221 | % |
(b) Total investment return assumes dividend reinvestment and does not reflect any deduction for applicable sales charges. Not annualized for periods less than one year.
** Computed on an annualized basis for periods less than one year.
The accompanying Notes to Financial Statements are an integral part of this schedule.
299
Thrivent Mutual Funds
Financial Highlights – (continued)
| | | | | | | | | | | | |
| | | FOR A SHARE OUTSTANDING THROUGHOUT EACH PERIOD* |
| | | | | Income from Investment Operations | | Less Distributions from |
| | | Net Asset
Value,
Beginning
of Period | | Net
Investment
Income/(Loss) | | Net Realized
and Unrealized
Gain/(Loss) on
Investments(a) | | Total from
Investment Operations | | Net
Investment
Income | | Net Realized
Gain on
Investments |
LARGE CAP VALUE FUND | | | | | | | | | | | | |
Class A Shares | | | | | | | | | | | | |
Year Ended 10/31/2013 | | $14.66 | | $0.22 | | $3.96 | | $4.18 | | $(0.24) | | $– |
Year Ended 10/31/2012 | | 12.94 | | 0.22 | | 1.67 | | 1.89 | | (0.17) | | – |
Year Ended 10/31/2011 | | 12.61 | | 0.19 | | 0.26 | | 0.45 | | (0.12) | | – |
Year Ended 10/31/2010 | | 11.55 | | 0.13 | | 1.07 | | 1.20 | | (0.14) | | – |
Year Ended 10/31/2009 | | 11.10 | | 0.17 | | 0.52 | | 0.69 | | (0.24) | | – |
Institutional Class Shares | | | | | | | | | | | | |
Year Ended 10/31/2013 | | 14.76 | | 0.29 | | 3.99 | | 4.28 | | (0.31) | | – |
Year Ended 10/31/2012 | | 13.04 | | 0.27 | | 1.70 | | 1.97 | | (0.25) | | – |
Year Ended 10/31/2011 | | 12.71 | | 0.24 | | 0.28 | | 0.52 | | (0.19) | | – |
Year Ended 10/31/2010 | | 11.64 | | 0.18 | | 1.10 | | 1.28 | | (0.21) | | – |
Year Ended 10/31/2009 | | 11.19 | | 0.23 | | 0.54 | | 0.77 | | (0.32) | | – |
LARGE CAP STOCK FUND | | | | | | | | | | | | |
Class A Shares | | | | | | | | | | | | |
Year Ended 10/31/2013 | | 23.64 | | 0.19 | | 5.24 | | 5.43 | | (0.25) | | (1.28) |
Year Ended 10/31/2012 | | 21.30 | | 0.20 | | 2.29 | | 2.49 | | (0.15) | | – |
Year Ended 10/31/2011 | | 20.87 | | 0.13 | | 0.37 | | 0.50 | | (0.07) | | – |
Year Ended 10/31/2010 | | 18.87 | | 0.06 | | 2.04 | | 2.10 | | (0.10) | | – |
Year Ended 10/31/2009 | | 17.67 | | 0.15 | | 1.31 | | 1.46 | | (0.26) | | – |
Institutional Class Shares | | | | | | | | | | | | |
Year Ended 10/31/2013 | | 23.82 | | 0.30 | | 5.27 | | 5.57 | | (0.36) | | (1.28) |
Year Ended 10/31/2012 | | 21.48 | | 0.30 | | 2.30 | | 2.60 | | (0.26) | | – |
Year Ended 10/31/2011 | | 21.05 | | 0.24 | | 0.38 | | 0.62 | | (0.19) | | – |
Year Ended 10/31/2010 | | 19.02 | | 0.15 | | 2.09 | | 2.24 | | (0.21) | | – |
Year Ended 10/31/2009 | | 17.84 | | 0.25 | | 1.31 | | 1.56 | | (0.38) | | – |
HIGH YIELD FUND | | | | | | | | | | | | |
Class A Shares | | | | | | | | | | | | |
Year Ended 10/31/2013 | | 5.01 | | 0.31 | | 0.07 | | 0.38 | | (0.30) | | – |
Year Ended 10/31/2012 | | 4.71 | | 0.34 | | 0.30 | | 0.64 | | (0.34) | | – |
Year Ended 10/31/2011 | | 4.86 | | 0.36 | | (0.15) | | 0.21 | | (0.36) | | – |
Year Ended 10/31/2010 | | 4.47 | | 0.37 | | 0.39 | | 0.76 | | (0.37) | | – |
Year Ended 10/31/2009 | | 3.59 | | 0.36 | | 0.87 | | 1.23 | | (0.35) | | – |
Institutional Class Shares | | | | | | | | | | | | |
Year Ended 10/31/2013 | | 5.01 | | 0.32 | | 0.09 | | 0.41 | | (0.32) | | – |
Year Ended 10/31/2012 | | 4.72 | | 0.35 | | 0.29 | | 0.64 | | (0.35) | | – |
Year Ended 10/31/2011 | | 4.86 | | 0.38 | | (0.14) | | 0.24 | | (0.38) | | – |
Year Ended 10/31/2010 | | 4.47 | | 0.39 | | 0.38 | | 0.77 | | (0.38) | | – |
Year Ended 10/31/2009 | | 3.59 | | 0.38 | | 0.87 | | 1.25 | | (0.37) | | – |
(a) The amount shown may not correlate with the change in aggregate gains and losses of portfolio securities due to the timing of sales and redemptions of fund shares.
* | All per share amounts have been rounded to the nearest cent. |
The accompanying Notes to Financial Statements are an integral part of this schedule.
300
Thrivent Mutual Funds
Financial Highlights – (continued)
| | | | | | | | | | | | | | | | | | | | | | | | | | | | | | | | |
| | | | RATIOS / SUPPLEMENTAL DATA | |
| | | | | | | | | | | | Ratio to Average Net
Assets** | | | Ratios to Average Net
Assets Before Expenses
Waived, Credited or Paid
Indirectly** | |
Total Distributions | | Net Asset
Value, End of
Period | | | Total
Return(b) | | | Net Assets,
End of Period
(in millions) | | | Expenses | | | Net Investment
Income/(Loss) | | | Expenses | | | Net
Investment
Income/(Loss) | | | Portfolio
Turnover Rate | |
| | | | | | | | | | | | | | | | | | | | | | | | | | | | | | | | |
| | | | | | | | | | | | | | | | | | | | | | | | | | | | | | | | |
| $(0.24) | | | $18.60 | | | | 28.92% | | | | $214.6 | | | | 0.98 | % | | | 1.25 | % | | | 0.98 | % | | | 1.25 | % | | | 39 | % |
(0.17) | | | 14.66 | | | | 14.82% | | | | 171.1 | | | | 1.04 | % | | | 1.42 | % | | | 1.04 | % | | | 1.42 | % | | | 92 | % |
(0.12) | | | 12.94 | | | | 3.49% | | | | 164.5 | | | | 1.06 | % | | | 1.22 | % | | | 1.06 | % | | | 1.22 | % | | | 74 | % |
(0.14) | | | 12.61 | | | | 10.45% | | | | 176.0 | | | | 1.10 | % | | | 0.91 | % | | | 1.10 | % | | | 0.91 | % | | | 115 | % |
(0.24) | | | 11.55 | | | | 6.54% | | | | 179.6 | | | | 1.17 | % | | | 1.48 | % | | | 1.18 | % | | | 1.48 | % | | | 105 | % |
| | | | | | | | | | | | | | | | | | | | | | | | | | | | | | | | |
(0.31) | | | 18.73 | | | | 29.57% | | | | 508.9 | | | | 0.52 | % | | | 1.72 | % | | | 0.52 | % | | | 1.72 | % | | | 39 | % |
(0.25) | | | 14.76 | | | | 15.37% | | | | 403.0 | | | | 0.53 | % | | | 1.92 | % | | | 0.53 | % | | | 1.92 | % | | | 92 | % |
(0.19) | | | 13.04 | | | | 4.03% | | | | 356.0 | | | | 0.52 | % | | | 1.76 | % | | | 0.52 | % | | | 1.76 | % | | | 74 | % |
(0.21) | | | 12.71 | | | | 11.09% | | | | 331.2 | | | | 0.53 | % | | | 1.46 | % | | | 0.53 | % | | | 1.46 | % | | | 115 | % |
(0.32) | | | 11.64 | | | | 7.32% | | | | 273.5 | | | | 0.52 | % | | | 2.10 | % | | | 0.52 | % | | | 2.10 | % | | | 105 | % |
| | | | | | | | | | | | | | | | | | | | | | | | | | | | | | | | |
| | | | | | | | | | | | | | | | | | | | | | | | | | | | | | | | |
(1.53) | | | 27.54 | | | | 24.57% | | | | 1,556.5 | | | | 1.05 | % | | | 0.81 | % | | | 1.05 | % | | | 0.81 | % | | | 66 | % |
(0.15) | | | 23.64 | | | | 11.75% | | | | 1,382.5 | | | | 1.09 | % | | | 0.84 | % | | | 1.09 | % | | | 0.84 | % | | | 124 | % |
(0.07) | | | 21.30 | | | | 2.39% | | | | 1,393.5 | | | | 1.11 | % | | | 0.56 | % | | | 1.11 | % | | | 0.56 | % | | | 146 | % |
(0.10) | | | 20.87 | | | | 11.16% | | | | 1,549.4 | | | | 1.13 | % | | | 0.29 | % | | | 1.13 | % | | | 0.29 | % | | | 185 | % |
(0.26) | | | 18.87 | | | | 8.55% | | | | 1,579.3 | | | | 1.20 | % | | | 0.82 | % | | | 1.20 | % | | | 0.82 | % | | | 149 | % |
| | | | | | | | | | | | | | | | | | | | | | | | | | | | | | | | |
(1.64) | | | 27.75 | | | | 25.10% | | | | 192.8 | | | | 0.61 | % | | | 1.25 | % | | | 0.61 | % | | | 1.25 | % | | | 66 | % |
(0.26) | | | 23.82 | | | | 12.27% | | | | 170.3 | | | | 0.62 | % | | | 1.30 | % | | | 0.62 | % | | | 1.30 | % | | | 124 | % |
(0.19) | | | 21.48 | | | | 2.89% | | | | 170.2 | | | | 0.60 | % | | | 1.06 | % | | | 0.60 | % | | | 1.06 | % | | | 146 | % |
(0.21) | | | 21.05 | | | | 11.80% | | | | 176.4 | | | | 0.61 | % | | | 0.81 | % | | | 0.61 | % | | | 0.81 | % | | | 185 | % |
(0.38) | | | 19.02 | | | | 9.15% | | | | 174.2 | | | | 0.62 | % | | | 1.39 | % | | | 0.62 | % | | | 1.39 | % | | | 149 | % |
| | | | | | | | | | | | | | | | | | | | | | | | | | | | | | | | |
| | | | | | | | | | | | | | | | | | | | | | | | | | | | | | | | |
(0.30) | | | 5.09 | | | | 7.85% | | | | 540.0 | | | | 0.81 | % | | | 6.03 | % | | | 0.81 | % | | | 6.03 | % | | | 61 | % |
(0.34) | | | 5.01 | | | | 13.96% | | | | 520.0 | | | | 0.82 | % | | | 6.95 | % | | | 0.82 | % | | | 6.95 | % | | | 52 | % |
(0.36) | | | 4.71 | | | | 4.37% | | | | 445.3 | | | | 0.84 | % | | | 7.43 | % | | | 0.84 | % | | | 7.43 | % | | | 63 | % |
(0.37) | | | 4.86 | | | | 17.65% | | | | 448.1 | | | | 0.86 | % | | | 7.96 | % | | | 0.86 | % | | | 7.96 | % | | | 83 | % |
(0.35) | | | 4.47 | | | | 36.32% | | | | 403.7 | | | | 0.93 | % | | | 9.24 | % | | | 0.93 | % | | | 9.24 | % | | | 54 | % |
| | | | | | | | | | | | | | | | | | | | | | | | | | | | | | | | |
(0.32) | | | 5.10 | | | | 8.42% | | | | 240.7 | | | | 0.48 | % | | | 6.36 | % | | | 0.48 | % | | | 6.36 | % | | | 61 | % |
(0.35) | | | 5.01 | | | | 14.12% | | | | 285.7 | | | | 0.47 | % | | | 7.30 | % | | | 0.47 | % | | | 7.30 | % | | | 52 | % |
(0.38) | | | 4.72 | | | | 4.98% | | | | 243.4 | | | | 0.47 | % | | | 7.80 | % | | | 0.47 | % | | | 7.80 | % | | | 63 | % |
(0.38) | | | 4.86 | | | | 18.12% | | | | 254.6 | | | | 0.46 | % | | | 8.36 | % | | | 0.46 | % | | | 8.36 | % | | | 83 | % |
(0.37) | | | 4.47 | | | | 36.96% | | | | 230.9 | | | | 0.46 | % | | | 9.57 | % | | | 0.46 | % | | | 9.57 | % | | | 54 | % |
(b) Total investment return assumes dividend reinvestment and does not reflect any deduction for applicable sales charges. Not annualized for periods less than one year.
** Computed on an annualized basis for periods less than one year.
The accompanying Notes to Financial Statements are an integral part of this schedule.
301
Thrivent Mutual Funds
Financial Highlights – (continued)
| | | | | | | | | | | | |
| | | | | FOR A SHARE OUTSTANDING THROUGHOUT EACH PERIOD* |
| | | | | Income from Investment Operations | | Less Distributions from |
| | | Net Asset
Value,
Beginning of
Period | | Net
Investment
Income/(Loss) | | Net Realized
and Unrealized
Gain/(Loss) on
Investments(a) | | Total from
Investment
Operations | | Net
Investment
Income | | Net Realized
Gain on
Investments |
INCOME FUND | | | | |
Class A Shares | | | | | | | | | | | | |
Year Ended 10/31/2013 | | $9.38 | | $0.31 | | $(0.29) | | $0.02 | �� | $(0.31) | | $– |
Year Ended 10/31/2012 | | 8.77 | | 0.33 | | 0.61 | | 0.94 | | (0.33) | | – |
Year Ended 10/31/2011 | | 8.80 | | 0.38 | | (0.03) | | 0.35 | | (0.38) | | – |
Year Ended 10/31/2010 | | 8.12 | | 0.40 | | 0.68 | | 1.08 | | (0.40) | | – |
Year Ended 10/31/2009 | | 6.92 | | 0.40 | | 1.21 | | 1.61 | | (0.41) | | – |
Institutional Class Shares | | | | | | | | | | | | |
Year Ended 10/31/2013 | | 9.37 | | 0.35 | | (0.30) | | 0.05 | | (0.34) | | – |
Year Ended 10/31/2012 | | 8.76 | | 0.37 | | 0.60 | | 0.97 | | (0.36) | | – |
Year Ended 10/31/2011 | | 8.79 | | 0.42 | | (0.03) | | 0.39 | | (0.42) | | – |
Year Ended 10/31/2010 | | 8.12 | | 0.44 | | 0.67 | | 1.11 | | (0.44) | | – |
Year Ended 10/31/2009 | | 6.91 | | 0.43 | | 1.22 | | 1.65 | | (0.44) | | – |
MUNICIPAL BOND FUND | | | | |
Class A Shares | | | | | | | | | | | | |
Year Ended 10/31/2013 | | 11.93 | | 0.42 | | (0.74) | | (0.32) | | (0.42) | | (0.01) |
Year Ended 10/31/2012 | | 11.30 | | 0.44 | | 0.63 | | 1.07 | | (0.44) | | – |
Year Ended 10/31/2011 | | 11.42 | | 0.46 | | (0.10) | | 0.36 | | (0.46) | | (0.02) |
Year Ended 10/31/2010 | | 11.15 | | 0.47 | | 0.27 | | 0.74 | | (0.47) | | – |
Year Ended 10/31/2009 | | 10.37 | | 0.48 | | 0.79 | | 1.27 | | (0.48) | | (0.01) |
Institutional Class Shares | | | | | | | | | | | | |
Year Ended 10/31/2013 | | 11.93 | | 0.45 | | (0.74) | | (0.29) | | (0.45) | | (0.01) |
Year Ended 10/31/2012 | | 11.30 | | 0.47 | | 0.63 | | 1.10 | | (0.47) | | – |
Year Ended 10/31/2011 | | 11.42 | | 0.49 | | (0.10) | | 0.39 | | (0.49) | | (0.02) |
Year Ended 10/31/2010 | | 11.15 | | 0.50 | | 0.27 | | 0.77 | | (0.50) | | – |
Year Ended 10/31/2009 | | 10.36 | | 0.51 | | 0.80 | | 1.31 | | (0.51) | | (0.01) |
GOVERNMENT BOND FUND | | | | |
Class A Shares | | | | | | | | | | | | |
Year Ended 10/31/2013 | | 10.76 | | 0.07 | | (0.33) | | (0.26) | | (0.08) | | (0.40) |
Year Ended 10/31/2012 | | 10.69 | | 0.11 | | 0.32 | | 0.43 | | (0.11) | | (0.25) |
Year Ended 10/31/2011 | | 10.56 | | 0.19 | | 0.21 | | 0.40 | | (0.19) | | (0.08) |
Year Ended 10/31/2010(c) | | 10.00 | | 0.11 | | 0.56 | | 0.67 | | (0.11) | | – |
Institutional Class Shares | | | | | | | | | | | | |
Year Ended 10/31/2013 | | 10.76 | | 0.11 | | (0.34) | | (0.23) | | (0.11) | | (0.40) |
Year Ended 10/31/2012 | | 10.69 | | 0.14 | | 0.32 | | 0.46 | | (0.14) | | (0.25) |
Year Ended 10/31/2011 | | 10.57 | | 0.23 | | 0.20 | | 0.43 | | (0.23) | | (0.08) |
Year Ended 10/31/2010(c) | | 10.00 | | 0.13 | | 0.57 | | 0.70 | | (0.13) | | – |
(a) | The amount shown may not correlate with the change in aggregate gains and losses of portfolio securities due to the timing of sales and redemptions of fund shares. |
(c) | Since fund inception, February 26, 2010. |
* | All per share amounts have been rounded to the nearest cent. |
The accompanying Notes to Financial Statements are an integral part of this schedule.
302
Thrivent Mutual Funds
Financial Highlights – (continued)
| | | | | | | | | | | | | | | | | | | | | | | | | | | | | | | | |
| | | | RATIOS / SUPPLEMENTAL DATA | |
| | | | | | | | | | | | Ratio to Average Net
Assets** | | | Ratios to Average Net
Assets Before Expenses
Waived, Credited or Paid
Indirectly** | |
Total
Distributions | | Net Asset
Value, End of
Period | | | Total
Return(b) | | |
Net Assets,
End of Period
(in millions) | | | Expenses | | | Net Investment
Income/(Loss) | | | Expenses | | | Net Investment
Income/(Loss) | | | Portfolio
Turnover Rate | |
| | | | | | | | | | | | | | | | | | | | | | | | | | | | | | | | |
| | | | | | | | | | | | | | | | | | | | | | | | | | | | | | | | |
| $(0.31) | | | $9.09 | | | | 0.23% | | | | $419.5 | | | | 0.77 | % | | | 3.40 | % | | | 0.77 | % | | | 3.40 | % | | | 121 | % |
| (0.33) | | | 9.38 | | | | 10.92% | | | | 448.0 | | | | 0.77 | % | | | 3.69 | % | | | 0.77 | % | | | 3.69 | % | | | 117 | % |
| (0.38) | | | 8.77 | | | | 4.11% | | | | 397.9 | | | | 0.79 | % | | | 4.38 | % | | | 0.79 | % | | | 4.38 | % | | | 138 | % |
| (0.40) | | | 8.80 | | | | 13.66% | | | | 405.1 | | | | 0.80 | % | | | 4.81 | % | | | 0.81 | % | | | 4.80 | % | | | 146 | % |
| (0.41) | | | 8.12 | | | | 24.03% | | | | 365.9 | | | | 0.84 | % | | | 5.53 | % | | | 0.85 | % | | | 5.53 | % | | | 173 | % |
| | | | | | | | |
| | | | | | | | | | | | | | | | | | | | | | | | | | | | | | | | |
| (0.34) | | | 9.08 | | | | 0.60% | | | | 403.3 | | | | 0.40 | % | | | 3.77 | % | | | 0.40 | % | | | 3.77 | % | | | 121 | % |
| (0.36) | | | 9.37 | | | | 11.34% | | | | 456.1 | | | | 0.39 | % | | | 4.07 | % | | | 0.39 | % | | | 4.07 | % | | | 117 | % |
| (0.42) | | | 8.76 | | | | 4.52% | | | | 401.1 | | | | 0.39 | % | | | 4.78 | % | | | 0.39 | % | | | 4.77 | % | | | 138 | % |
| (0.44) | | | 8.79 | | | | 13.99% | | | | 370.7 | | | | 0.39 | % | | | 5.23 | % | | | 0.40 | % | | | 5.22 | % | | | 146 | % |
(0.44) | | | 8.12 | | | | 24.76% | | | | 383.1 | | | | 0.39 | % | | | 5.98 | % | | | 0.40 | % | | | 5.97 | % | | | 173 | % |
| | | | | | | | | | | | | | | | | | | | | | | | | | | | | | | | |
| | | | | | | | | | | | | | | | | | | | | | | | | | | | | | | | |
| (0.43) | | | 11.18 | | | | (2.76)% | | | | 1,397.2 | | | | 0.74 | % | | | 3.65 | % | | | 0.74 | % | | | 3.65 | % | | | 24 | % |
| (0.44) | | | 11.93 | | | | 9.61% | | | | 1,532.0 | | | | 0.74 | % | | | 3.76 | % | | | 0.74 | % | | | 3.76 | % | | | 13 | % |
| (0.48) | | | 11.30 | | | | 3.39% | | | | 1,339.6 | | | | 0.76 | % | | | 4.19 | % | | | 0.76 | % | | | 4.19 | % | | | 8 | % |
| (0.47) | | | 11.42 | | | | 6.79% | | | | 1,384.5 | | | | 0.76 | % | | | 4.20 | % | | | 0.76 | % | | | 4.20 | % | | | 9 | % |
| (0.49) | | | 11.15 | | | | 12.48% | | | | 1,246.5 | | | | 0.78 | % | | | 4.43 | % | | | 0.78 | % | | | 4.43 | % | | | 8 | % |
| | | | | | | | | | | | | | | | | | | | | | | | | | | | | | | | |
| (0.46) | | | 11.18 | | | | (2.51)% | | | | 91.8 | | | | 0.49 | % | | | 3.91 | % | | | 0.49 | % | | | 3.91 | % | | | 24 | % |
| (0.47) | | | 11.93 | | | | 9.89% | | | | 102.5 | | | | 0.49 | % | | | 4.02 | % | | | 0.49 | % | | | 4.02 | % | | | 13 | % |
| (0.51) | | | 11.30 | | | | 3.67% | | | | 86.5 | | | | 0.49 | % | | | 4.46 | % | | | 0.49 | % | | | 4.46 | % | | | 8 | % |
| (0.50) | | | 11.42 | | | | 7.08% | | | | 95.3 | | | | 0.50 | % | | | 4.46 | % | | | 0.50 | % | | | 4.46 | % | | | 9 | % |
(0.52) | | | 11.15 | | | | 12.90% | | | | 86.4 | | | | 0.50 | % | | | 4.69 | % | | | 0.50 | % | | | 4.69 | % | | | 8 | % |
| | | | | | | | | | | | | | | | | | | | | | | | | | | | | | | | |
| | | | | | | | | | | | | | | | | | | | | | | | | | | | | | | | |
| (0.48) | | | 10.02 | | | | (2.51)% | | | | 13.0 | | | | 0.90 | % | | | 0.71 | % | | | 1.03 | % | | | 0.57 | % | | | 184 | % |
| (0.36) | | | 10.76 | | | | 4.08% | | | | 14.5 | | | | 0.89 | % | | | 1.02 | % | | | 0.99 | % | | | 0.93 | % | | | 191 | % |
| (0.27) | | | 10.69 | | | | 3.99% | | | | 7.3 | | | | 0.92 | % | | | 1.82 | % | | | 1.00 | % | | | 1.74 | % | | | 183 | % |
| (0.11) | | | 10.56 | | | | 6.73% | | | | 5.9 | | | | 0.87 | % | | | 1.61 | % | | | 0.87 | % | | | 1.61 | % | | | 146 | % |
| | | | | | | | | | | | | | | | | | | | | | | | | | | | | | | | |
| (0.51) | | | 10.02 | | | | (2.18)% | | | | 95.1 | | | | 0.57 | % | | | 1.06 | % | | | 0.57 | % | | | 1.06 | % | | | 184 | % |
| (0.39) | | | 10.76 | | | | 4.44% | | | | 98.0 | | | | 0.55 | % | | | 1.38 | % | | | 0.55 | % | | | 1.38 | % | | | 191 | % |
| (0.31) | | | 10.69 | | | | 4.25% | | | | 94.6 | | | | 0.57 | % | | | 2.18 | % | | | 0.57 | % | | | 2.18 | % | | | 183 | % |
| (0.13) | | | 10.57 | | | | 7.04% | | | | 105.6 | | | | 0.60 | % | | | 1.94 | % | | | 0.60 | % | | | 1.94 | % | | | 146 | % |
(b) Total investment return assumes dividend reinvestment and does not reflect any deduction for applicable sales charges. Not annualized for periods less than one year.
** Computed on an annualized basis for periods less than one year.
The accompanying Notes to Financial Statements are an integral part of this schedule.
303
Thrivent Mutual Funds
Financial Highlights – continued
| | | | | | | | | | | | | | |
| | | FOR A SHARE OUTSTANDING THROUGHOUT EACH PERIOD* |
| | | | | | | Income from Investment Operations | | Less Distributions from |
| | | | | Net Asset
Value,
Beginning of
Period | | Net
Investment
Income/(Loss) | | Net Realized
and Unrealized
Gain/(Loss) on
Investments(a) | | Total from
Investment
Operations | | Net
Investment
Income | | Net Realized
Gain on
Investments |
LIMITED MATURITY BOND FUND | | | | |
Class A Shares | | | | | | | | | | | | |
Year Ended 10/31/2013 | | $12.62 | | $0.15 | | $(0.09) | | $0.06 | | $(0.15) | | $– |
Year Ended 10/31/2012 | | 12.41 | | 0.19 | | 0.20 | | 0.39 | | (0.18) | | – |
Year Ended 10/31/2011 | | 12.58 | | 0.28 | | (0.17) | | 0.11 | | (0.28) | | – |
Year Ended 10/31/2010 | | 12.24 | | 0.38 | | 0.34 | | 0.72 | | (0.38) | | – |
Year Ended 10/31/2009 | | 11.40 | | 0.46 | | 0.83 | | 1.29 | | (0.45) | | – |
Institutional Class Shares | | | | | | | | | | | | |
Year Ended 10/31/2013 | | 12.62 | | 0.18 | | (0.09) | | 0.09 | | (0.18) | | – |
Year Ended 10/31/2012 | | 12.40 | | 0.22 | | 0.21 | | 0.43 | | (0.21) | | – |
Year Ended 10/31/2011 | | 12.58 | | 0.31 | | (0.18) | | 0.13 | | (0.31) | | – |
Year Ended 10/31/2010 | | 12.23 | | 0.42 | | 0.34 | | 0.76 | | (0.41) | | – |
Year Ended 10/31/2009 | | 11.40 | | 0.50 | | 0.82 | | 1.32 | | (0.49) | | – |
MONEY MARKET FUND | | | | | | | | | | | | |
Class A Shares | | | | | | | | | | | | |
Year Ended 10/31/2013 | | 1.00 | | – | | – | | – | | – | | – |
Year Ended 10/31/2012 | | 1.00 | | – | | – | | – | | – | | – |
Year Ended 10/31/2011 | | 1.00 | | – | | – | | – | | – | | – |
Year Ended 10/31/2010 | | 1.00 | | – | | – | | – | | – | | – |
Year Ended 10/31/2009 | | 1.00 | | 0.01 | | – | | 0.01 | | (0.01) | | – |
Institutional Class Shares | | | | | | | | | | | | |
Year Ended 10/31/2013 | | 1.00 | | – | | – | | – | | – | | – |
Year Ended 10/31/2012 | | 1.00 | | – | | – | | – | | – | | – |
Year Ended 10/31/2011 | | 1.00 | | – | | – | | – | | – | | – |
Year Ended 10/31/2010 | | 1.00 | | – | | – | | – | | – | | – |
Year Ended 10/31/2009 | | 1.00 | | 0.01 | | – | | 0.01 | | (0.01) | | – |
(a) The amount shown may not correlate with the change in aggregate gains and losses of portfolio securities due to the timing of sales and redemptions of fund shares.
* | All per share amounts have been rounded to the nearest cent. |
The accompanying Notes to Financial Statements are an integral part of this schedule.
304
Thrivent Mutual Funds
Financial Highlights – continued
| | | | | | | | | | | | | | | | |
| | | RATIOS / SUPPLEMENTAL DATA |
| | | | | | | | | Ratio to Average Net
Assets** | | Ratios to Average Net Assets Before
Expenses Waived, Credited or Paid
Indirectly** |
Total Distributions | | Net Asset
Value, End of
Period | | Total
Return(b) | | Net Assets, End
of Period
(in millions) | | Expenses | | Net
Investment
Income/(Loss) | | Expenses | | Net
Investment
Income/(Loss) | | Portfolio
Turnover
Rate |
| | | | | | | | | | | | | | | | |
| | | | | | | | | | | | | | | | |
$(0.15) | | $12.53 | | 0.46% | | $415.6 | | 0.60% | | 1.21% | | 0.61% | | 1.20% | | 121% |
(0.18) | | 12.62 | | 3.18% | | 408.2 | | 0.60% | | 1.51% | | 0.61% | | 1.50% | | 113% |
(0.28) | | 12.41 | | 0.87% | | 344.8 | | 0.61% | | 2.20% | | 0.61% | | 2.19% | | 109% |
(0.38) | | 12.58 | | 5.97% | | 272.7 | | 0.64% | | 3.09% | | 0.64% | | 3.09% | | 131% |
(0.45) | | 12.24 | | 11.62% | | 128.1 | | 0.73% | | 3.98% | | 0.73% | | 3.98% | | 164% |
(0.18) | | 12.53 | | 0.70% | | 448.1 | | 0.37% | | 1.44% | | 0.37% | | 1.44% | | 121% |
| | | | | | | | | | | | | | | | |
(0.21) | | 12.62 | | 3.52% | | 472.6 | | 0.36% | | 1.77% | | 0.36% | | 1.77% | | 113% |
(0.31) | | 12.40 | | 1.05% | | 584.7 | | 0.35% | | 2.45% | | 0.36% | | 2.45% | | 109% |
(0.41) | | 12.58 | | 6.35% | | 530.8 | | 0.36% | | 3.38% | | 0.37% | | 3.38% | | 131% |
(0.49) | | 12.23 | | 11.93% | | 455.6 | | 0.37% | | 4.35% | | 0.38% | | 4.35% | | 164% |
| | | | | | | | | | | | | | | | |
| | | | | | | | | | | | | | | | |
– | | 1.00 | | 0.00% | | 469.0 | | 0.23% | | 0.00% | | 0.94% | | (0.71)% | | N/A |
– | | 1.00 | | 0.00% | | 493.9 | | 0.29% | | 0.00% | | 0.93% | | (0.64)% | | N/A |
– | | 1.00 | | 0.00% | | 587.9 | | 0.30% | | 0.00% | | 0.93% | | (0.63)% | | N/A |
– | | 1.00 | | 0.00% | | 717.0 | | 0.30% | | 0.00% | | 0.88% | | (0.57)% | | N/A |
(0.01) | | 1.00 | | 0.61% | | 1,017.3 | | 0.60% | | 0.63% | | 0.83% | | 0.40% | | N/A |
– | | 1.00 | | 0.00% | | 6.5 | | 0.23% | | 0.00% | | 0.59% | | (0.37)% | | N/A |
– | | 1.00 | | 0.00% | | 12.5 | | 0.29% | | 0.00% | | 0.58% | | (0.29)% | | N/A |
– | | 1.00 | | 0.00% | | 11.6 | | 0.30% | | 0.00% | | 0.56% | | (0.27)% | | N/A |
– | | 1.00 | | 0.00% | | 14.5 | | 0.30% | | 0.00% | | 0.52% | | (0.22)% | | N/A |
(0.01) | | 1.00 | | 0.80% | | 68.4 | | 0.40% | | 0.93% | | 0.50% | | 0.83% | | N/A |
(b) Total investment return assumes dividend reinvestment and does not reflect any deduction for applicable sales charges. Not annualized for periods less than one year.
** Computed on an annualized basis for periods less than one year.
The accompanying Notes to Financial Statements are an integral part of this schedule.
305
Additional Information
(unaudited)
Shareholder Notification of Federal Tax Information
The following information is provided solely to satisfy the requirements set forth by the Internal Revenue Code. Shareholders will be provided information regarding their distributions in January 2014.
The Funds designate the following percentages of dividends declared from net investment income as dividends qualifying for the 70% dividends received deduction for corporations or as qualified dividend income for individuals under the Jobs and Growth Tax Relief Reconciliation Act of 2003 for the tax period ending October 31, 2013:
| | | | | | | | |
Fund | | Dividends
Received
Deduction
for
Corporations | | | Qualified
Dividend
Income for
Individuals | |
Aggressive Allocation | | | 45 | % | | | 60 | % |
Moderately Aggressive Allocation | | | 32 | % | | | 43 | % |
Moderate Allocation | | | 21 | % | | | 30 | % |
Moderately Conservative Allocation | | | 16 | % | | | 22 | % |
Balanced Income Plus | | | 18 | % | | | 24 | % |
Opportunity Income Plus | | | 1 | % | | | 1 | % |
Partner Emerging Markets Equity | | | 0 | % | | | 62 | % |
Partner Small Cap Value | | | 100 | % | | | 100 | % |
Mid Cap Growth | | | 100 | % | | | 100 | % |
Partner Mid Cap Value | | | 72 | % | | | 72 | % |
Mid Cap Stock | | | 100 | % | | | 100 | % |
Partner Worldwide Allocation | | | 0 | % | | | 100 | % |
Large Cap Growth | | | 100 | % | | | 100 | % |
Large Cap Value | | | 100 | % | | | 100 | % |
Large Cap Stock | | | 85 | % | | | 90 | % |
Income | | | 2 | % | | | 2 | % |
Limited Maturity Bond | | | 1 | % | | | 2 | % |
The Municipal Bond Fund designates 99.45% of the dividends declared from net investment income as exempt from federal income tax for the tax period ended October 31, 2013.
Pursuant to IRC 852(b)(3) of the Internal Revenue Code, the Funds hereby designate the following amounts as long-term capital gains distributed during the year ended October 31, 2013, or if subsequently determined to be different, the net capital gain of such year:
| | | | |
Fund | | Distributions
of Long-Term
Capital Gains | |
Aggressive Allocation | | $ | 3,929,505 | |
Moderately Aggressive Allocation | | $ | 10,582,766 | |
Moderate Allocation | | $ | 7,962,093 | |
Moderately Conservative Allocation | | $ | 5,910,056 | |
Balanced Income Plus | | $ | 5,516,098 | |
Partner Small Cap Growth | | $ | 3,845,472 | |
Partner Small Cap Value | | $ | 3,874,190 | |
Mid Cap Growth | | $ | 26,818,932 | |
Partner Mid Cap Value | | $ | 2,834,459 | |
Large Cap Stock | | $ | 72,407,464 | |
Municipal Bond | | $ | 583,098 | |
Government Bond | | $ | 1,209,392 | |
These amounts may include earnings and profits distributed to shareholders on the redemption of shares as part of the dividend paid deduction.
Proxy Voting
The policies and procedures that the Trust uses to determine how to vote proxies relating to portfolio securities are attached to the Trust’s Statement of Additional Information. You may request a free copy of the Statement of Additional Information or the report of how the Trust voted proxies relating to portfolio securities during the most recent 12-month period ended June 30 by calling 1-800-847-4836. You also may review the Statement of Additional Information or the report of how the Trust voted proxies relating to portfolio securities during the most recent 12-month period ended June 30 at www.thrivent.com or www.sec.gov.
Quarterly Schedule of Portfolio Holdings
The Trust files its Schedule of Portfolio Holdings on Form N-Q with the SEC for the first and third quarters of each fiscal year. You may request a free copy of the Trust’s Forms N-Q by calling 1-800-847-4836. The Trust’s most recent Form N-Q Schedule of Investments also is at www.thrivent.com or www.sec.gov. You also may review and copy the Forms N-Q for the Trust at the SEC’s Public Reference Room in Washington, DC. You may get information about the operation of the Public Reference Room by calling 1-800-SEC-0330.
306
Board of Trustees and Officers
The following table provides information about the Trustees and Officers of the Trust. Each Trustee oversees each of the 26 series of the Trust and also serves as:
| | • | | Director of Thrivent Series Fund, Inc., a registered investment company consisting of 33 portfolios that serve as underlying funds for variable contracts issued by Thrivent Financial for Lutherans (“Thrivent Financial”) and Thrivent Life Insurance Company and investment options in the retirement plan offered by Thrivent Financial, and |
| | • | | Trustee of Thrivent Cash Management Trust, a registered investment company consisting of one portfolio that serves as a cash collateral fund for a securities lending program sponsored by Thrivent Financial. |
The 26 series of the Trust, the 33 portfolios of Thrivent Series Fund, Inc. and Thrivent Cash Management Trust are referred to herein as the “Fund Complex.” The Statement of Additional Information includes additional information about the Trustees and is available, without charge, by calling 1-800-847-4836.
Interested Trustee (1)(2)(3)(4)
| | |
Name
(Year of Birth) Year Elected | | Principal Occupation(s) and Directorships of Public Companies and Other Investment Companies
During the Past Five Years |
Russell W. Swansen (1957)
2008 | | Senior Vice President and Chief Investment Officer, Thrivent Financial since 2003. |
Independent Trustees (2)(3)(4)(5)
| | |
Name
(Year of Birth)
Year Elected | | Principal Occupation(s) and Directorships of Public Companies and Other Investment Companies
During the Past Five Years |
Janice B. Case
(1952)
2011 | | Independent Trustee of North American Electric Reliability Corporation (self-regulatory organization) since 2008; Independent Director of Western Electricity Coordinating Council (nonprofit corporation coordinating and promoting bulk electric system reliability) from 2002 through 2008. |
| |
Richard L. Gady (1943)
1987 | | Retired. |
| |
Richard A. Hauser (1943)
2004 | | Vice President and Assistant General Counsel, Boeing Company since 2007. |
| |
Marc S. Joseph (1960)
2011 | | Managing Director of GraniteRidgeLLP (consulting and advisory firm) since 2009; Managing Director of MJosephLLC (private investing and consulting firm) since 2004. |
| |
Paul R. Laubscher (1956)
2009 | | Portfolio Manager for U.S. and international equity portfolios and private real estate portfolios of IBM Retirement Funds. |
| |
James A. Nussle (1960)
2011 | | President and Chief Operating Officer of Growth Energy (trade association) since 2010; Advisory Board member of AVISTA Capital Partners (private equity firm) since 2010; Contributor on CNBC (media) since 2010; CEO of The Nussle Group LLC (consulting firm) since 2009; Director of the Office of Management and Budget from 2007 through 2009. |
| |
Douglas D. Sims (1946)
2006 | | Currently, Director of Keystone Neighbourhood Company, Keystone Center and Keystone Science School. Previously, Director of the Center for Corporate Excellence. |
| |
Constance L. Souders (1950)
2007 | | Retired. |
307
Board of Trustees and Officers
Executive Officers (4)
| | |
Name (Year of Birth)
Position Held With Thrivent | | Principal Occupation(s) During the Past Five Years |
Russell W. Swansen (1957) President | | Senior Vice President and Chief Investment Officer, Thrivent Financial since 2003. |
| |
David S. Royal (1971) Secretary and Chief Legal Officer | | Vice President, Deputy General Counsel Member Value since 2006; Interim Investment Company and Investment Adviser Chief Compliance Officer from May 2010 until December 2010. |
| |
Gerard V. Vaillancourt (1967) Treasurer and Principal Accounting Officer | | Vice President, Mutual Fund Accounting since 2006. |
| |
Ted S. Dryden (1965) Chief Compliance Officer | | Investment Company and Investment Adviser Chief Compliance Officer, Thrivent Financial since December 2010; Chief Compliance Officer, OptumHealth Financial Services from 2009 to 2010; Vice President, Asset Management Compliance, Ameriprise Financial from 2006 to 2009 |
| |
Janice M. Guimond (1965) Vice President | | Vice President, Investment Operations, Thrivent Financial since 2004. |
| |
Kathleen M. Koelling (1977) Anti-Money Laundering Officer (6) | | Privacy and Anti-Money Laundering Officer, Thrivent Financial since 2010; Senior Counsel, Thrivent Financial since 2002. |
| |
Mark D. Anema (1961) Vice President | | Vice President, New Product Management and Development, Thrivent Financial since 2007; Vice President, Strategic Planning, Thrivent Financial from 2004 to 2007. |
| |
Jody L. Bancroft (1971) Assistant Vice President | | Director, Investment Field Operations, Thrivent Financial since 2009; Director, Annuity & Settlement Option New Services, Thrivent Financial from 2007 until 2009. |
| |
Michael W. Kremenak (1978) Assistant Secretary | | Senior Counsel, Thrivent Financial since January 2013; Vice President and Assistant General Counsel at Nuveen Investments 2011 until 2013; Attorney at FAF Advisors 2009 to 2010; Associate at Skadden, Arps, Slate, Meagher & Flom 2005 to 2009. |
| |
James M. Odland (1955) Assistant Secretary | | Vice President and Managing Counsel, Thrivent Financial since 2005. |
| |
Rebecca A. Paulzine (1979) Assistant Secretary | | Senior Counsel, Thrivent Financial since January 2010; Associate, Faegre & Benson LLP from 2005 to December 2009. |
| |
Todd J. Kelly (1969) Assistant Treasurer (6) | | Director, Fund Accounting Operations, Thrivent Financial since 2002. |
| |
Sarah L. Bergstrom (1977) Assistant Treasurer | | Director, Fund Accounting Administration, Thrivent Financial since 2007; Manager, Fund Accounting Administration, Thrivent Financial from 2005 to 2007. |
(1) | “Interested Trustee” of the Fund as defined in the Investment Company Act of 1940 by virtue of positions with Thrivent Financial. Mr. Swansen is considered an interested trustee because of his principal occupation with Thrivent Financial. |
(2) | Each Trustee generally serves an indefinite term until her or his successor is duly elected and qualified. Trustees serve at the discretion of the board until their successors are duly appointed and qualified. |
(3) | Each Trustee oversees 60 portfolios. |
(4) | The address for each Trustee and Officer unless otherwise noted is 625 Fourth Avenue South, Minneapolis, MN 55415 |
(5) | The Trustees other than Mr. Swansen are not “interested trustees” of the Fund and are referred to as “Independent Trustees.” |
(6) | The address for this Officer is 4321 North Ballard Road, Appleton, WI 54913 |
308
THIS PAGE INTENTIONALLY LEFT BLANK
309
THIS PAGE INTENTIONALLY LEFT BLANK
310
THIS PAGE INTENTIONALLY LEFT BLANK
311
THIS PAGE INTENTIONALLY LEFT BLANK
312

We’re listening to you!
In response to concerns regarding multiple mailings, we send one copy of a shareholder report and one copy of a prospectusfor Thrivent Mutual Funds to each household. This consolidation helps reduce printing and postage costs, thereby saving money. If you wish to receive an additional copy of this report, call us toll-free at 800-847-4836.
Choose Paperless Delivery
By signing below, I request electronic delivery of the following documents regarding my Thrivent Mutual Funds and variable insurance products issued by Thrivent Financial for Lutherans and Thrivent Life Insurance Company (including Thrivent Series Fund, Inc.):
| | | | |
• Prospectus | | • Annual and semiannual reports | | • Annual privacy notices |
I understand and agree to the following:
| | |
• I will receive electronic delivery of Thrivent documents designated above. | | |
• I will no longer receive paper copies of these documents in the mail. | |  |
• A link to a printable copy of the annual privacy notice will be sent to me by electronic means at the email address I provide and I will continue to receive other privacy notices including copies of the Thrivent Financial health privacy notice and/or Notice of Insurance Information Practices by regular mail. | |
• I will receive periodic emails directing me to Thrivent Financial’s website where documents will be available. | |
• I will update Thrivent Financial if my email address changes. | |
• I I have the ability to access the Internet at my own cost and will need Adobe® Reader® to view the documents. (If I don’t have it, I can download Reader® free from adobe.com) | |
• This consent can be used for Thrivent Financial products I currently own or may purchase in the future, until consent is revoked. | |
• I can request specific documents in paper form free of charge without revoking this consent by calling Thrivent Financial Customer Service at 800-847-4836. | |
• My consent will remain in effect until I revoke it. I can revoke this consent or update my information at any time by changing my preference to “U.S. Mail” in the Preference Center at Thrivent.com/gopaperless (requires registration) or by calling 800-847-4836. | | |
Each investor requesting eDelivery must complete.
| | | | | | | | |
Investor 1: | | | | | | Investor 2: | | |
| | (Please print first and last name.) | | | | | | (Please print first and last name.) |
| | | | | | | | |
Address (If different than above): | | |
Securities offered through Thrivent Investment Management Inc., 625 Fourth Ave. S., Minneapolis, MN 55415, a FINRA and SIPC member and a wholly owned subsidiary of Thrivent Financial for Lutherans.
Item 2. Code of Ethics
As of the end of the period covered by this report, registrant has adopted a code of ethics (as defined in Item 2 of Form N-CSR) applicable to registrant’s Principal Executive Officer, Principal Financial Officer and Principal Accounting Officer. No waivers were granted to such code of ethics during the period covered by this report. A copy of this code of ethics is filed as an exhibit to this Form N-CSR.
Item 3. Audit Committee Financial Expert
Registrant’s Board of Trustees has determined that Constance L. Souders, an independent trustee, is the Audit Committee Financial Expert.
Item 4. Principal Accountant Fees and Services
The aggregate fees billed by registrant’s independent public accountants, PricewaterhouseCoopers LLP (“PwC”), for the fiscal year ended October 31, 2012 and the fiscal year ended October 31, 2013, for professional services rendered in connection with the audit of registrant’s annual financial statements or services that are normally provided by the accountant in connection with statutory and regulatory filings or engagements were $342,409.51 and $357,150.67, respectively.
The aggregate fees PwC billed to registrant for the fiscal year ended October 31, 2012 and the fiscal year ended October 31, 2013, for assurance and other services that are reasonably related to the performance of registrant’s audit and are not reported under Item 4(a), were $0 for 2012 and $3620.52 for 2013. The payments during the fiscal year ended October 31, 2013 were for testing of an accounting system conversion. The aggregate fees PwC billed to registrant’s investment adviser and any entity controlling, controlled by, or under common control with registrant’s investment adviser for the fiscal year ended October 31, 2012 and the fiscal year ended October 31, 2013, for assurance and other services directly related to the operations and financial reporting of registrant, were $0 for each respective period.
The aggregate tax fees PwC billed to registrant for the fiscal year ended October 31, 2012 and the fiscal year ended October 31, 2013, for tax compliance, tax advice and tax planning services, were $111,090.00 and $113,967.00, respectively. The aggregate tax fees PwC billed to registrant’s investment adviser and any entity controlling, controlled by, or under common control with registrant’s investment adviser for the fiscal year ended October 31, 2012 and the fiscal year ended October 31, 2013, for services directly related to the operations and financial reporting of registrant, were $0 for each respective period.
The aggregate fees PwC billed to registrant for the fiscal year ended October 31, 2012 and the fiscal year ended October 31, 2013 for products and services provided, other than the services reported in paragraphs (a) through (c) of this item, were $0 for each respective period. The aggregate fees PwC billed to registrant’s investment adviser and any entity controlling, controlled by, or under common control with registrant’s investment adviser for the fiscal year ended October 31, 2012 and the fiscal year ended October 31, 2013, for products and services provided, other than the services reported in paragraphs (a) through (c) of this item, were $6800.00 and $6450.00, respectively. These payments were for access to a PwC-sponsored online library that provides interpretive guidance regarding U.S. and foreign accounting standards. In 2013, these payments also included services provided related to the mergers of certain series of Thrivent Series Fund, Inc.. These figures are also reported in response to item 4(g) below.
| | (e) | Registrant’s audit committee charter provides that the audit committee (comprised of the independent Trustees of registrant) is responsible for pre-approval of all auditing services performed for the registrant. The audit committee also is responsible for pre-approval (subject to the de minimis exceptions for non-audit services described in Section 10A(i)(1)(B) of the Securities Exchange Act of 1934) of all non-auditing services performed for the registrant or an affiliate of registrant. In addition, registrant’s audit committee charter permits a designated member of the audit committee to pre-approve, between meetings, one or more audit or non-audit service projects, subject to an expense limit and notification to the audit committee at the next committee meeting. Registrant’s audit committee pre-approved all fees described above that PwC billed to registrant. |
| | (f) | Less than 50% of the hours billed by PwC for auditing services to registrant for the fiscal year ended October 31, 2013 was for work performed by persons other than full-time permanent employees of PwC. |
| | (g) | The aggregate non-audit fees billed by PwC to registrant and to registrant’s investment adviser and any entity controlling, controlled by, or under common control with registrant’s investment adviser for the fiscal year ended October 31, 2012 and the fiscal year ended October 31, 2013 were $6800.00 and $6450.00 for each respective period. These figures are also reported in response to item 4(d) above. |
| | (h) | Registrant’s audit committee has considered the non-audit services provided to the registrant and registrant’s investment adviser and any entity controlling, controlled by, or under common control with registrant’s investment adviser as described above and determined that these services do not compromise PwC’s independence. |
Item 5. Audit Committee of Listed Registrants
Not applicable.
Item 6. Schedule of Investments
(a) Registrant’s Schedule of Investments is included in the report to shareholders filed under Item 1.
(b) Not applicable to this filing.
Item 7. Disclosure of Proxy Voting Policies and Procedures for Closed-End Management Investment Companies
Not applicable.
Item 8. Portfolio Managers of Closed-End Management Investment Companies
Not applicable.
Item 9. Purchases of Equity Securities by Closed-End Management Investment Company and Affiliated Purchasers.
Not applicable.
Item 10. Submission of Matters to a Vote of Security Holders
There have been no material changes to the procedures by which shareholders may recommend nominees to registrant’s board of trustees.
Item 11. Controls and Procedures
(a)(i) Registrant’s President and Treasurer have concluded that registrant’s disclosure controls and procedures (as defined in Rule 30a-3(c) under the Investment Company Act of 1940) are effective, based on their evaluation of these controls and procedures as of a date within 90 days of the filing date of this report.
(a)(ii) Registrant’s President and Treasurer are aware of no change in registrant’s internal control over financial reporting (as defined in Rule 30a-3(d) under the Investment Company Act of 1940) that occurred during registrant’s most recent fiscal quarter that has materially affected, or is reasonably likely to materially affect, registrant’s internal control over financial reporting.
Item 12. Exhibits
(a) The code of ethics pursuant to Item 2 is attached hereto.
(b) Certifications pursuant to Rules 30a-2(a) and 30a-2(b) under the Investment Company Act of 1940 are attached hereto.
SIGNATURES
Pursuant to the requirements of the Securities Exchange Act of 1934 and the Investment Company Act of 1940, the registrant has duly caused this report to be signed on its behalf by the undersigned, thereunto duly authorized.
| | | | |
| Date: December 27, 2013 | | THRIVENT MUTUAL FUNDS |
| | |
| | By: | | |
| | | | /s/ Russell W. Swansen |
| | | | Russell W. Swansen |
| | | | President |
Pursuant to the requirements of the Securities Exchange Act of 1934 and the Investment Company Act of 1940, this report has been signed below by the following persons on behalf of the registrant and in the capacities and on the dates indicated.
| | | | |
| Date: December 27, 2013 | | By: | | |
| | |
| | | | /s/ Russell W. Swansen |
| | | | Russell W. Swansen |
| | | | President |
| | |
| Date: December 27, 2013 | | By: | | |
| | |
| | | | /s/ Gerard V. Vaillancourt |
| | | | Gerard V. Vaillancourt |
| | | | Treasurer |