UNITED STATES
SECURITIES AND EXCHANGE COMMISSION
Washington, D.C. 20549
FORM N-CSR
CERTIFIED SHAREHOLDER REPORT OF REGISTERED MANAGEMENT INVESTMENT COMPANIES
| | |
| Investment Company Act file number: | | 811-05075 |
Thrivent Mutual Funds
(Exact name of registrant as specified in charter)
| | |
625 Fourth Avenue South Minneapolis, Minnesota | | 55415 |
| (Address of principal executive offices) | | (Zip code) |
Michael W. Kremenak, Assistant Secretary
625 Fourth Avenue South
Minneapolis, Minnesota 55415
(Name and address of agent for service)
Registrant’s telephone number, including area code: (612) 844-4198
Date of fiscal year end: December 31
Date of reporting period: December 31, 2013
| Item 1. | Report to Stockholders |

Table of Contents
Dear Shareholder:
The stock market surged to record highs in 2013 as the U.S. economy accelerated and Europe showed signs of emerging from a recession. Fixed-income markets mostly fell as investors worried that the improving economic picture might prompt the Federal Reserve to temper its accommodative monetary policy. The investment outlook was generally positive heading into 2014.
Economic Review
After nearly stalling in the fourth quarter of 2012, the U.S. economy accelerated steadily through the first nine months of 2013. The housing and auto markets were particularly strong, with housing starts rising to a seasonally adjusted annual rate of 1,091,000 units by November, up nearly 30% from a year earlier and the highest rate in nearly six years. Auto sales rose 8% to 15.6 million units, nearly matching the number of cars and light trucks sold in 2007 just before the start of the last recession.
Gross domestic product (GDP), the sum of all goods and services produced, rose at a 1.1% annual rate in the first quarter, a 2.5% rate in the second, and a 4.1% rate in the third. The latest performance marked only the fourth time in the past 10 years that GDP growth surpassed the 4% level.
Rising business inventories accounted for nearly 41% of third-quarter GDP growth, but the economy showed renewed vigor on a broad front. Investment in factories and other nonresidential structures grew at a 13.4% annual rate. Exports rose 3.9%, reflecting improving economic conditions abroad, and hit a record high in November. On the consumer front, personal consumption expenditures grew 2.0% in the third quarter, while spending on durable goods, such as appliances and automobiles, increased 7.9%. All those gains were offset in part by continued reductions in federal spending and investment, which fell 1.5%. We expect fourth-quarter GDP results to show continued economic growth, albeit not at the heady rate exhibited in the third.
Despite the economy’s strong showing in 2013, the recovery from the 2008–2009 recession remains sluggish by historical standards, and that has translated into sluggish gains in the job market, too. The U.S. created an average of 182,000 jobs per month in 2013, about the same as in 2012, leaving the country with 1.2 million fewer jobs than it had prior to the 2008–2009 recession. The unemployment rate, which peaked at 10% in 2009, fell dramatically in 2013, to 6.7% in December from 7.9% a year earlier. But a large part of that improvement was attributable not to job creation but simply to people giving up looking for work.
Economic conditions improved in Europe and China, which are important to the American economy and its financial markets. After a year and a half of economic contraction, GDP for the 17-country eurozone grew 0.3% in the second quarter of 2013 and another 0.1% in the third. China, after watching its economic growth slow for much of the past three years, saw its GDP rise 7.5% year-over-year in the second quarter, then jump 7.8% in the third.
Market Review
Equity investors were generally cheered by the improving global economic outlook, sending several major U.S. stock market indexes to their first record highs since 2007. After posting a total return of 16% in 2012, the S&P 500 Index of large-company stocks earned 32.4% in 2013, its biggest gain since 1997. Small-company stocks did even better, with the Russell 2000 Index earning 38.8%. Growth stocks generally outperformed value stocks. On a price basis alone, the S&P 500 finished the year up 173% from its March 2009 low.
Stocks in developed markets overseas also turned in strong results in 2013 amid improving economic conditions in Europe and a shift in Japan to growth-oriented fiscal and monetary policies. The MSCI EAFE Index, which tracks developed markets in Europe, Asia and Australia, posted a total return of 23.3%.
Emerging market stocks were mostly lower, with the MSCI Emerging Markets index posting a total return of -2.3%. The index slumped during the second quarter as investors worried about slowing economic growth in China, India and Brazil, and about lower commodities prices, which adversely impact the many natural resources companies located in emerging economies. While stock prices rebounded in October when China’s economy began showing new signs of strength, they drifted lower again as the year wound to a close.
While equity markets were clearly helped by the improving economic climate, they also benefited from a dearth of opportunities in the fixed-income markets, where the accommodative monetary policies of the Federal Reserve were helping to keep bond yields near historic lows as the year got under way. New worries swept through the fixed-income markets in May, though, after Federal Reserve Chairman Ben Bernanke said the improving economy might prompt the Fed to pare back its quantitative easing program, which involved the Fed buying $85 billion of bonds each month to help keep long-term interest rates low. In December, the Fed announced that it would reduce its monthly purchases by $10 billion beginning in January 2014, and might schedule further cuts if the economy continued to improve.
Anticipating a shift in Fed policy, bond yields began to rise mid-year, which resulted in falling bond prices. By year-end, the yield on the 10-year Treasury note had jumped to just over 3% from 1.8% a year earlier. With most sectors of the bond market following the lead of the Treasury market, the broad-based Barclays U.S. Aggregate Bond Index finished the year with a loss of 2%. High-yield corporate bonds, which tend to rally when the economy grows, were the standout exception in the fixed-income markets, with the Barclays U.S. Corporate High Yield Bond Index posting a positive return of 7.4%.
2
Our Outlook
The generally tepid pace of the economic recovery over the past four and a half years has an opportunity to accelerate slightly in 2014, barring an unexpected crisis, and that should create a favorable environment for the investment markets. Our economic models suggest GDP growth in 2014 has the potential to meet or exceed the 2.2% rate averaged over the past three years. We also expect further improvement in GDP growth in the U.K. and Europe to about 2%, in China to about 8%, and in Japan to between 1% and 2%.
Continued economic progress will be important to the equity markets, where valuations are now relatively high and reflect a general expectation of stronger corporate profits in the year ahead. We believe profits will improve slightly, a consequence of both organic growth and corporate share repurchases. Stock prices could advance under that scenario, but we expect performance to be modest, especially compared to the extraordinary performance of 2013.
Activity in the fixed-income markets will depend to a large degree on U.S. monetary policy. The Fed is expected to keep short-term interest rates low through 2014, but longer-term rates are likely to ratchet somewhat higher, particularly if the Fed continues to pare back its quantitative easing program. We would not be surprised to see modest losses in the Treasury sector. High-yield bonds could post modest gains as fixed-income investors searching for yield continue buying in that sector.
To ensure that your portfolio is positioned to negotiate the shifting investment environment, we encourage you to meet with your Thrivent Financial representative. He or she can make sure your portfolio remains aligned with your financial goals and tolerance for risk.
As always, thank you for the trust you have placed in our entire team of professionals at Thrivent Financial.
|
| Sincerely, |
|
 |
| Russell W. Swansen |
President Thrivent Mutual Funds |
3
Thrivent Growth and Income Plus Fund
David R. Spangler, CFA and Stephen D. Lowe, CFA, Portfolio Co-Managers*
Thrivent Growth and Income Plus Fund seeks income plus long-term capital growth.
The Fund invests in equity securities and debt securities. The value of the Fund is influenced by factors impacting the overall market, certain asset classes, certain investment styles, and specific issuers. The Fund may incur losses due to incorrect assessments of investments by its investment adviser. Bond prices generally fall as interest rates rise. Credit risk is the risk that an issuer of a debt security may not pay its debt, and high yield securities are subject to increased credit risk as well as liquidity risk. Leveraged loans, preferred securities, sovereign debt, and mortgage-related and other asset-backed securities are subject to additional risks. Foreign investments involve additional risks, including currency fluctuations, liquidity, political, economic and market instability, and different legal and accounting standards; these risks are magnified for investments in emerging markets. Writing options is a highly specialized activity that can lead to losses and transaction costs.
As of August 16, 2013, the Fund changed its name from Thrivent Equity Income Plus Fund to its current name.
| * | Effective August 16, 2013, Stephen D. Lowe became a Portfolio Co-Manager. |
How did the Fund perform during the 12-month period ended December 31, 2013?
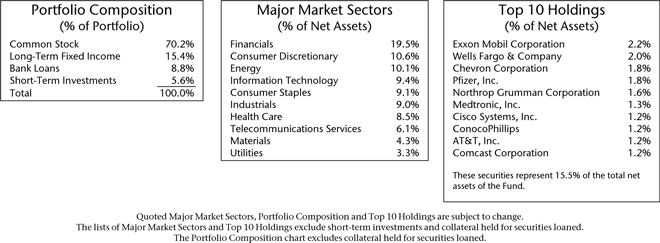
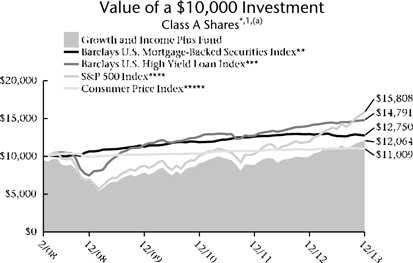
Thrivent Growth and Income Plus Fund earned a return of 21.08%, compared with the median return of its peer group, the Lipper Mixed-Asset Target Allocation Growth Funds category, of 19.33%. The Fund’s market benchmarks, the S&P 500 Index, the Barclays U.S. High Yield Loan Index and the Barclays U.S. Mortgage-Backed Securities Index, earned returns of 32.39%, 5.39% and -1.41%, respectively.
What factors affected the Fund’s performance?
The former Thrivent Equity Income Plus Fund was restructured on August 16, 2013, and renamed Thrivent Growth and Income Plus Fund. While the Fund continues to be managed as a multi-asset class product with strategic target weights to various asset classes, a fixed-income component was added to its asset mix as a result of this change. Approximately 70% of the Fund’s holdings are now composed of domestic dividend equity, international dividend equity, preferred stocks and real estate investment trusts (REITs). The remaining 30% of the Fund is invested in fixed-income securities.
For 2013, strong positive contribution came from domestic dividend-paying stocks, which performed in line with the S&P 500 Index. Good security selection allowed the dividend equity portion of the Fund to keep pace with the broader market, particularly in the technology, industrials and consumer staples sectors. However, stock selection hurt returns in the energy and consumer discretionary sectors, which underperformed the S&P 500 Index. Relative to the S&P 500 Index, underperforming asset classes included international dividend equity in the form of ADRs, preferreds and REITs.
Within fixed-income markets, the improving economy made investors more comfortable with higher-risk sectors, despite a mid-year uptick in interest rates. All fixed-income sectors in the Fund generated positive results, particularly high-yield bonds and mortgage-backed securities.
What is your outlook?
Continued economic growth in 2014, at or slightly above the pace in 2013, should create a favorable investment environment for the asset classes in which the Fund invests. Stock valuations were much higher heading into 2014 than they were in 2013, suggesting that stock returns are unlikely to match last year’s heady results. We anticipate tilting the Fund’s equity holdings slightly away from utilities, telecommunications and consumer staples stocks and into cyclical sectors that typically do well in a growing economy, such as technology, industrials and consumer discretionary.
Interest rates could creep higher in 2014, especially if the Federal Reserve, as expected, announces further cuts in the bond-buying program it has been using to support the economy. That could also moderate or negatively impact returns in the fixed-income markets. We may become slightly more defensive on interest rates by adding to our holdings of floating-rate leveraged loans and keeping the duration of the Fund’s bond holdings low.
Quoted Fund performance is for Class A shares and does not reflect a sales charge.
The returns shown do not reflect taxes a shareholder would pay on distributions or redemptions.
4
Average Annual Total Returns1
As of December 31, 2013
| | | | | | |
Class A2 | | 1-Year | | 5 Years | | From
Inception
2/29/2008 |
without sales charge | | 21.08% | | 12.18% | | 4.27% |
with sales charge | | 14.40% | | 10.92% | | 3.27% |
| | | |
Institutional Class3 | | 1-Year | | 5 Years | | From
Inception
2/29/2008 |
Net Asset Value | | 21.56% | | 12.57% | | 4.64% |
| 1 | Past performance is not an indication of future results. Average annual total returns represent past performance and reflect changes in share prices, the reinvestment of all dividends and capital gains, and the effects of compounding. The prospectus contains more complete information on the investment objectives, risks, charges and expenses of the investment company, which investors should read and consider carefully before investing. To obtain a prospectus, contact a registered representative or visit www.thrivent.com. At various times, the Fund’s adviser waived its management fee and/or reimbursed Fund expenses. Had the adviser not done so, the Fund’s total returns would have been lower. The returns shown do not reflect taxes a shareholder would pay on distributions or redemptions. Total investment return and principal value of your investment will fluctuate, and your shares, when redeemed, may be worth more or less than their original cost. Current performance may be higher or lower than the performance data quoted. Call 800-THRIVENT or visit www.thrivent.com for performance results current to the most recent month-end. |
| 2 | Class A performance with sales charge reflects the maximum sales charge of 5.5%. |
| 3 | Institutional Class shares have no sales load and are for institutional shareholders only. |
| (a) | Performance of other classes will be greater or less than the line shown based on the differences in loads and fees paid by shareholders investing in the different classes. |
| * | Effective August 2013, the Fund’s benchmark indices changed to include the Barclays U.S. High Yield Loan Index and the Barclays U.S. Mortgage-Backed Securities Index. The Adviser made these benchmark changes because of changes to the Fund’s principal investment strategies. As you compare performance, please note that the Fund’s performance reflects the maximum 5.5% sales charge, while the benchmark Indices do not reflect any such charges, deductions for fees, expenses or taxes. It is not possible to invest directly in the Indices shown. If you were to purchase any of the above individual stocks or funds represented in those indices, any charges you would pay would reduce your total return as well. |
| ** | The Barclays U.S. Mortgage-Backed Securities Index (MBS) is formed by grouping the universe of over 600,000 individual fixed-rate U.S. government agency MBS pools into approximately 3,500 generic types of securities. |
| *** | The Barclays U.S. High Yield Loan Index measures U.S. Dollar denominated syndicated term loans. |
| **** | The S&P 500 Index is an index that represents the average performance of a group of 500 widely held, publicly traded stocks. “S&P 500” is a trademark of The McGraw-Hill Companies, Inc. and has been licensed for use by Thrivent Financial for Lutherans. The product is not sponsored, endorsed or promoted by Standard & Poor’s and Standard & Poor’s makes no representation regarding the advisability of investing in the product. It is not possible to invest directly in the Index. The performance of the Index does not reflect deductions for fees, expenses or taxes. |
| ***** | The Consumer Price Index is an inflationary indicator that measures the change in the cost of a fixed basket of products and services, including housing, electricity, food and transportation. |
5
Thrivent Diversified Income Plus Fund
Mark L. Simenstad, CFA, Paul J. Ocenasek, CFA and David R. Spangler, CFA, Portfolio Co-Managers
Thrivent Diversified Income Plus Fund seeks to maximize income while maintainingg prospects for capital appreciation.
The Fund invests in debt securities and equity securities. The value of the Fund is influenced by factors impacting the overall market, certain asset classes, certain investment styles, and specific issuers. The Fund may incur losses due to incorrect assessments of investments by its investment adviser. Bond prices generally fall as interest rates rise. Credit risk is the risk that an issuer of a debt security may not pay its debt, and high yield securities are subject to increased credit risk as well as liquidity risk. Leveraged loans and mortgage-related and other asset-backed securities are subject to additional risks.
How did the Fund perform during the 12-month period ended December 31, 2013?
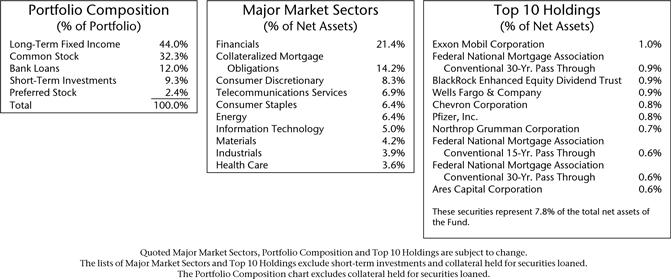
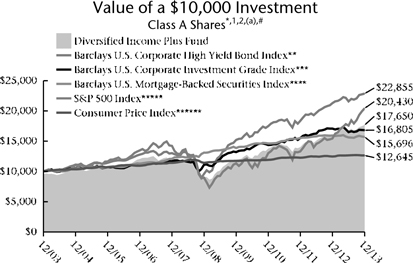
Thrivent Diversified Income Plus Fund earned a return of 10.40%, compared with the median return of its peer group, the Lipper Mixed-Asset Target Allocation Conservative Funds category, of 7.15%. The Fund’s market benchmarks, the S&P 500 Index, the Barclays U.S. High Yield Loan Index and the Barclays U.S. Mortgage-Backed Securities Index, returned 32.39%, 5.39% and -1.41%, respectively.
What factors affected the Fund’s performance?
A strengthening economy drove the stock market to record highs and also helped spur solid gains in the high-yield sector of the bond market.
Stocks accounted for just 30% of the Fund’s holdings, but played an outsized role in its results by generating a total return in line with the S&P 500 Index. Approximately 90% of the Fund’s equity holdings consisted of dividend-paying stocks, which typically underperform the broader market when stock prices are climbing sharply. Good security selection allowed the equity portion of the Fund to keep pace with the broader market, particularly in the technology, industrials and consumer staples sectors. Stock selection hurt returns in the energy and consumer discretionary sectors, which underperformed the S&P 500 Index.
The improving economy made investors more comfortable with higher-risk sectors of the fixed-income markets, despite a mid-year uptick in interest rates. Within the Fund, fixed-income holdings performed relatively well. All sectors had positive results, with nonagency mortgage-backed securities contributing exceptional results once again. The high-yield bond segment was modestly lower than the Barclays U.S. High Yield Bond Index due to our more conservative orientation in this sector. Finally, high-grade corporate bonds and preferred stocks generated positive, but low-single-digit returns.
What is your outlook?
Continued economic growth in 2014, at or slightly above the pace in 2013, should create a favorable investment environment for the asset classes in which the Fund invests. Stock valuations were much higher heading into 2014 than they were in 2013, however, suggesting that stock returns are unlikely to match last year’s heady results. We anticipate tilting equity holdings slightly away from utilities, telecommunications and consumer staples stocks and into cyclical sectors that typically do well in a growing economy, such as technology, industrials and consumer discretionary shares.
Interest rates could creep higher in 2014, especially if the Federal Reserve, as expected, announces further cuts in the bond-buying program it has been using to support the economy. We believe this could moderate or negatively impact returns in the fixed-income markets, too. We may consider becoming slightly more defensive on interest rates by adding to our holdings of floating-rate leveraged loans and keeping the duration of the Fund’s bond holdings low.
Quoted Fund performance is for Class A shares and does not reflect a sales charge.
The returns shown do not reflect taxes a shareholder would pay on distributions or redemptions.
6
Average Annual Total Returns1,2
As of December 31, 2013
| | | | | | |
Class A3 | | 1-Year | | 5 Years | | 10 Years |
without sales charge | | 10.40% | | 14.20% | | 6.33% |
with sales charge | | 5.46% | | 13.16% | | 5.84% |
| | | |
Institutional Class4 | | 1-Year | | 5 Years | | 10 Years |
Net Asset Value | | 10.70% | | 14.53% | | 6.72% |
| 1 | Past performance is not an indication of future results. Average annual total returns represent past performance and reflect changes in share prices, the reinvestment of all dividends and capital gains, and the effects of compounding. The prospectus contains more complete information on the investment objectives, risks, charges and expenses of the investment company, which investors should read and consider carefully before investing. To obtain a prospectus, contact a registered representative or visit www.thrivent.com. At various times, the Fund’s adviser waived its management fee and/or reimbursed Fund expenses. Had the adviser not done so, the Fund’s total returns would have been lower. The returns shown do not reflect taxes a shareholder would pay on distributions or redemptions. Total investment return and principal value of your investment will fluctuate, and your shares, when redeemed, may be worth more or less than their original cost. Current performance may be higher or lower than the performance data quoted. Call 800-THRIVENT or visit www.thrivent.com for performance results current to the most recent month-end. |
| 2 | Prior to July 3, 2006, the Fund, as a high yield fund, invested primarily in junk bonds. |
| 3 | Class A performance with sales charge reflects the maximum sales charge of 4.5%. |
| 4 | Institutional Class shares have no sales load and are for institutional shareholders only. |
| (a) | Performance of other classes will be greater or less than the line shown based on the differences in loads and fees paid by shareholders investing in the different classes. |
| * | Effective August 2013, the Fund’s benchmark indices changed from the Barclays U.S. Corporate High Yield Bond Index and the Barclays U.S. Corporate Investment Grade Index to the Barclays U.S. High Yield Loan Index and the Barclays U.S. Mortgage-Backed Securities Index. The Adviser made these benchmark changes because of changes to the Fund’s principal investment strategies. As you compare performance, please note that the Fund’s performance reflects the maximum 4.5% sales charge, while the benchmark indices do not reflect any such charges, deductions for fees, expenses or taxes. It is not possible to invest directly in the Indices shown. If you were to purchase any of the above individual stocks or funds represented in those indices, any charges you would pay would reduce your total return as well. |
| ** | The Barclays U.S. Corporate High Yield Bond Index is an index which measures the performance of fixed-rate non-investment grade bonds. |
| *** | The Barclays U.S. Corporate Investment Grade Index is an index that measures the performance of investment grade corporate bonds. |
| **** | The Barclays U.S. Mortgage-Backed Securities Index (MBS) is formed by grouping the universe of over 600,000 individual fixed-rate U.S. government agency MBS pools into approximately 3,500 generic types of securities. |
| ***** | The S&P 500 Index is an index that represents the average performance of a group of 500 widely held, publicly traded stocks. “S&P 500” is a trademark of The McGraw-Hill Companies, Inc. and has been licensed for use by Thrivent Financial for Lutherans. The product is not sponsored, endorsed or promoted by Standard & Poor’s and Standard & Poor’s makes no representation regarding the advisability of investing in the product. |
| ****** | The Consumer Price Index is an inflationary indicator that measures the change in the cost of a fixed basket of products and services, including housing, electricity, food and transportation. |
| # | The Barclays U.S. High Yield Loan Index incepted in January 2006. This Index is not shown in the chart because it does not have 10 years of history and thus an accurate comparison of a $10,000 investment over 10 years cannot be shown. |
7
Thrivent Natural Resources Fund
David C. Francis, CFA and Darren M. Bagwell, CFA, Portfolio Co-Managers
Thrivent Natural Resources Fund seeks long-term capital growth.
The Fund primarily invests in natural resource investments, which historically have been very volatile and are subject to risks that particularly affect the precious metals, oil, gas, mining, energy, chemicals, paper, steel or agricultural sectors. Real estate investment trusts are subject to numerous risks and can be affected by interest rates, the values of the properties they own, and the credit quality of mortgage loans they hold. The value of the Fund is influenced by factors impacting the overall market, certain asset classes, certain investment styles, and specific issuers. The Fund may incur losses due to incorrect assessments of investments by its investment adviser. Small and medium-sized companies often have greater price volatility and less liquidity than larger companies. Foreign investments involve additional risks, including currency fluctuations, liquidity, political, economic and market instability, and different legal and accounting standards; these risks are magnified for investments in emerging markets. The Fund is non-diversified, which means that it may invest a greater percentage of its assets in the securities of any single issuer compared with diversified funds.
How did the Fund perform during the 12-month period ended December 31, 2013?
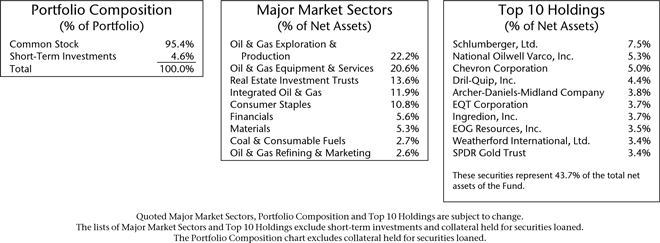
Thrivent Natural Resources Fund earned a return of 9.43%, compared with the median return of its peer group, the Lipper Natural Resources Funds category, of 25.29%. The Fund’s market benchmark, the S&P North American Natural Resources Sector Index, earned a return of 16.49%.
What factors affected the Fund’s performance?
Relative returns for 2013 were negatively impacted by the Fund’s strategic allocation to nonenergy sectors and poor security selection. While 85% of the S&P index is composed of energy issues and the average Lipper peer has a greater than 90% weighting, the Fund has a target weighting of 60% in energy. In periods when energy outperforms the other natural resource sectors, as it did so significantly in 2013, performance can be negatively impacted.
Compounding the negative influence of energy was the Fund’s strategic exposure to real estate (targeted at 15% to 20%) in the form of yield-focused real estate investment trusts (REITs), which were significant relative underperformers in an environment marked by anticipation of rising interest rates. It is important to note that these allocations, which created such negative volatility in 2013, are not tactical and are not the result of an attempt to anticipate short-term market movements. Rather, they are carefully considered allocations intended to be in place for the foreseeable investment horizon.
We believe our more diversified approach relative to the S&P index and the Lipper peers (the Fund also has target exposures to agriculture and materials) is a more appropriate approach for a portfolio intended to reflect commodity market opportunities as a whole, rather than just energy.
More disappointing than the allocation effect in 2013 was the subpar security selection within energy and materials. Within the integrated oils, our positions in Petrobras and BP underperformed. Our overweighting in coal and metals and mining was also costly, where our value bias once again had us involved too early in names like Peabody Energy, Rio Tinto and Walter Energy. While the relative benefits were mitigated by allocation, the Fund did generate solid relative performance in its refining, exploration and equipment investments within energy in names like Valero Energy, EQT and Dril-Quip. Finally, our underweighting in gold mining had a meaningful positive influence on relative performance.
What is your outlook?
By and large, commodity prices are near marginal costs of production and are reasonably valued. Futures curves for West Texas Intermediate oil suggest declining oil prices through 2014, but not dramatically so. Without an expectation of material resource price changes and without broad operational or valuation discrepancies by industry in the energy sector, we believe stock selection will be the most important driver of performance. Exploration and production holdings are low-cost producers, consistent with the modest commodity price landscape. Holdings in other energy industries and materials sectors tend toward higher-quality, conservatively managed enterprises.
Quoted Fund performance is for Class A shares and does not reflect a sales charge.
The returns shown do not reflect taxes a shareholder would pay on distributions or redemptions.
8
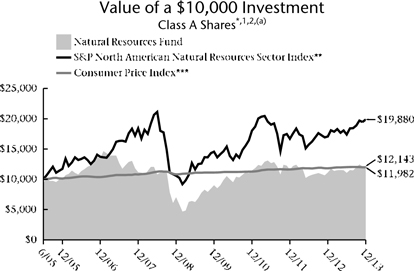
Average Annual Total Returns1,2
As of December 31, 2013
| | | | | | |
Class A3 | | 1-Year | | 5 Years | | From
Inception
6/30/2005 |
without sales charge | | 9.43% | | 11.60% | | 2.99% |
with sales charge | | 3.42% | | 10.34% | | 2.31% |
| | | |
Institutional Class4 | | 1-Year | | 5 Years | | From
Inception
6/30/2005 |
Net Asset Value | | 9.89% | | 11.96% | | 3.35% |
| 1 | Past performance is not an indication of future results. Average annual total returns represent past performance and reflect changes in share prices, the reinvestment of all dividends and capital gains, and the effects of compounding. The prospectus contains more complete information on the investment objectives, risks, charges and expenses of the investment company, which investors should read and consider carefully before investing. To obtain a prospectus, contact a registered representative or visit www.thrivent.com. At various times, the Fund’s adviser waived its management fee and/or reimbursed Fund expenses. Had the adviser not done so, the Fund’s total returns would have been lower. The returns shown do not reflect taxes a shareholder would pay on distributions or redemptions. Total investment return and principal value of your investment will fluctuate, and your shares, when redeemed, may be worth more or less than their original cost. Current performance may be higher or lower than the performance data quoted. Call 800-THRIVENT or visit www.thrivent.com for performance results current to the most recent month-end. |
| 2 | Prior to October 10, 2010, the Fund, as a real estate securities fund, invested primarily in real estate-related securities. |
| 3 | Class A performance with sales charge reflects the maximum sales charge of 5.5%. |
| 4 | Institutional Class shares have no sales load and are for institutional shareholders only. |
| (a) | Performance of other classes will be greater or less than the line shown based on the differences in loads and fees paid by shareholders investing in the different classes. |
| * | As you compare performance, please note that the Fund’s performance reflects the maximum 5.5% sales charge, while the benchmark indices do not reflect any such charges, deductions for fees, expenses or taxes. It is not possible to invest directly in the indices shown. If you were to purchase any of the above individual stocks or funds represented in those indices, any charges you would pay would reduce your total return as well. |
| ** | The S&P North American Natural Resources Sector Index is an index of selected U.S. traded natural resource related stocks. The product is not sponsored, endorsed or promoted by Standard & Poor’s, and Standard & Poor’s makes no representation regarding the advisability of investing in the product. |
| *** | The Consumer Price Index is an inflationary indicator that measures the change in the cost of a fixed basket of products and services, including housing, electricity, food and transportation. |
9
Shareholder Expense Example
(unaudited)
As a shareholder of the Fund, you incur, depending on the fund and share class, two types of costs: (1) transaction costs, including sales charges (loads) on purchase payments; and (2) ongoing costs, including management fees, distribution (12b-1) fees and other Fund expenses. This Example is intended to help you understand your ongoing costs (in dollars) of investing in the Fund and to compare these costs with the ongoing costs of investing in other mutual funds. The Example is based on an investment of $1,000 invested at the beginning of the period and held for the entire period from July 1, 2013 through December 31, 2013.
Actual Expenses
In the table below, the first section, labeled “Actual,” provides information about actual account values and actual expenses. You may use the information in this section, together with the amount you invested, to estimate the expenses that you paid over the period. Simply divide your account value by $1,000 (for example, an $8,600 account value divided by $1,000 = 8.6), then multiply the result by the number from the appropriate Class line under the heading entitled “Expenses Paid During Period” to estimate the expenses you paid. A small account fee of $12 may be charged to Class A shareholder accounts if the value falls below the stated account minimum of $1,000 in the case of a qualified account. This fee is not included in the table below. If it were, the expenses you paid during the period would have been higher and the ending account value would have been lower.
Hypothetical Example for Comparison Purposes
In the table below, the second section, labeled “Hypothetical,” provides information about hypothetical account values and hypothetical expenses based on the Fund’s actual expense ratio and an assumed rate of return of 5% per year before expenses, which is not the Fund’s actual return. The hypothetical account values and expenses may not be used to estimate the actual ending account balance or expenses you paid for the period. You may use this information to compare the ongoing costs of investing in the Fund and other funds. To do so, compare this 5% hypothetical example with the 5% hypothetical examples that appear in the shareholder reports of the other funds. A small account fee of $12 may be charged to Class A shareholder accounts if the value falls below the stated account minimum of $2,000 or less, in the case of a non-qualified account, and $1,000 in the case of a qualified account. This fee is not included in the table below. If it were, the expenses you paid during the period would have been higher and the ending account value would have been lower.
Please note that the expenses shown in the table are meant to highlight your ongoing costs only and do not reflect any transactional costs, such as sales charges (loads). Therefore, the second section of the table is useful in comparing ongoing costs only, and will not help you determine the relative total costs of owning different funds. In addition, if these transactional costs were included, your costs would have been higher.
| | | | | | | | | | | | | | | | |
| | | Beginning
Account
Value
7/1/2013 | | | Ending
Account
Value
12/31/2013 | | | Expenses
Paid
During
Period
7/1/2013-
12/31/2013* | | | Annualized
Expense
Ratio | |
Thrivent Growth and Income Plus Fund | | | | | | | | | | | | | | | | |
Actual | | | | | | | | | | | | | | | | |
Class A | | $ | 1,000 | | | $ | 1,096 | | | $ | 6.14 | | | | 1.16 | % |
Institutional Class | | $ | 1,000 | | | $ | 1,098 | | | $ | 4.28 | | | | 0.81 | % |
Hypothetical** | | | | | | | | | | | | | | | | |
Class A | | $ | 1,000 | | | $ | 1,019 | | | $ | 5.92 | | | | 1.16 | % |
Institutional Class | | $ | 1,000 | | | $ | 1,021 | | | $ | 4.12 | | | | 0.81 | % |
Thrivent Diversified Income Plus Fund | | | | | | | | | | | | | | | | |
Actual | | | | | | | | | | | | | | | | |
Class A | | $ | 1,000 | | | $ | 1,052 | | | $ | 5.23 | | | | 1.01 | % |
Institutional Class | | $ | 1,000 | | | $ | 1,053 | | | $ | 3.62 | | | | 0.70 | % |
Hypothetical** | | | | | | | | | | | | | | | | |
Class A | | $ | 1,000 | | | $ | 1,020 | | | $ | 5.15 | | | | 1.01 | % |
Institutional Class | | $ | 1,000 | | | $ | 1,022 | | | $ | 3.56 | | | | 0.70 | % |
Thrivent Natural Resources Fund | | | | | | | | | | | | | | | | |
Actual | | | | | | | | | | | | | | | | |
Class A | | $ | 1,000 | | | $ | 1,098 | | | $ | 6.95 | | | | 1.31 | % |
Institutional Class | | $ | 1,000 | | | $ | 1,100 | | | $ | 5.15 | | | | 0.97 | % |
Hypothetical** | | | | | | | | | | | | | | | | |
Class A | | $ | 1,000 | | | $ | 1,019 | | | $ | 6.69 | | | | 1.31 | % |
Institutional Class | | $ | 1,000 | | | $ | 1,020 | | | $ | 4.96 | | | | 0.97 | % |
| * | Expenses are equal to the Fund’s annualized expense ratio, multiplied by the average account value over the period, multiplied by 184/365 to reflect the one-half year period. |
| ** | Assuming 5% annualized total return before expenses. |
10

Report of Independent Registered Public Accounting Firm
To the Shareholders and Trustees of the Thrivent Mutual Funds:
In our opinion, the accompanying statements of assets and liabilities, including the schedules of investments, and the related statements of operations and of changes in net assets and the financial highlights present fairly, in all material respects, the financial position of Thrivent Growth and Income Plus Fund (Formerly “Thrivent Equity Income Plus Fund”), Thrivent Diversified Income Plus Fund, and Thrivent Natural Resources Fund (hereafter referred to as the “Funds”) at December 31, 2013, the results of each of their operations for the year then ended, the changes in each of their net assets for each of the two years in the period then ended and their financial highlights for each of the five years in the period then ended, in conformity with accounting principles generally accepted in the United States of America. These financial statements and financial highlights (hereafter referred to as “financial statements”) are the responsibility of the Funds’ management; our responsibility is to express an opinion on these financial statements based on our audits. We conducted our audits of these financial statements in accordance with the standards of the Public Company Accounting Oversight Board (United States). Those standards require that we plan and perform the audit to obtain reasonable assurance about whether the financial statements are free of material misstatement. An audit includes examining, on a test basis, evidence supporting the amounts and disclosures in the financial statements, assessing the accounting principles used and significant estimates made by management, and evaluating the overall financial statement presentation. We believe that our audits, which included confirmation of securities at December 31, 2013 by correspondence with the custodian, brokers, agent banks and transfer agent, provide a reasonable basis for our opinion.

February 19, 2014
PricewaterhouseCoopers LLP, Suite 1400, 225 South Sixth Street, Minneapolis, MN 55402
T: (612) 596 6000, F: (612) 373 7160, www.pwc.com/us
11
Growth and Income Plus Fund
Schedule of Investments as of December 31, 2013
| | | | | | | | |
Principal
Amount | | | Bank Loans (9.0%)a | | Value | |
| Basic Materials (0.4%) | | | | |
| | | | Fortescue Metals Group, Ltd., Term Loan | | | | |
| | $91,539 | | | 4.250%, 6/30/2019 | | $ | 92,655 | |
| | | | Ineos Group Holdings, Ltd., Term Loan | | | | |
| | 91,535 | | | 4.000%, 5/4/2018 | | | 91,764 | |
| | | | | | | | |
| | | | Total | | | 184,419 | |
| | | | | | | | |
| |
| Capital Goods (0.6%) | | | | |
| | | | ADS Waste Holdings, Term Loan | | | | |
| | 91,538 | | | 4.250%, 10/9/2019 | | | 91,944 | |
| | | | Berry Plastics Group, Inc., Term Loan | | | | |
| | 45,769 | | | 3.500%, 2/8/2020 | | | 45,579 | |
| | | | Rexnord, LLC, Term Loan | | | | |
| | 91,770 | | | 4.000%, 8/21/2020 | | | 91,961 | |
| | | | Silver II Borrower, Term Loan | | | | |
| | 90,158 | | | 4.000%, 12/13/2019 | | | 90,251 | |
| | | | | | | | |
| | | | Total | | | 319,735 | |
| | | | | | | | |
| |
| Communications Services (3.0%) | | | | |
| | | | Charter Communications Operating, LLC, Term Loan | | | | |
| | 45,770 | | | 3.000%, 12/31/2020 | | | 45,369 | |
| | | | Cincinnati Bell, Inc., Term Loan | | | | |
| | 91,770 | | | 4.000%, 9/10/2020 | | | 91,885 | |
| | | | Clear Channel Communications, Inc., Term Loan | | | | |
| | 92,000 | | | 6.919%, 1/30/2019 | | | 87,745 | |
| | | | Cricket Communications, Inc., Term Loan | | | | |
| | 68,655 | | | 4.750%, 3/8/2020 | | | 68,884 | |
| | | | Cumulus Media Holdings, Inc., Term Loan | | | | |
| | 44,213 | | | 0.000%, 12/23/2020b,c | | | 44,434 | |
| | | | Fairpoint Communications, Term Loan | | | | |
| | 91,539 | | | 7.500%, 2/14/2019 | | | 94,491 | |
| | | | Grande Communications Networks, LLC, Term Loan | | | | |
| | 91,540 | | | 4.500%, 5/29/2020 | | | 91,350 | |
| | | | Integra Telecom Holdings, Inc., Term Loan | | | | |
| | 91,539 | | | 5.250%, 2/22/2019 | | | 92,645 | |
| | | | Level 3 Communications, Inc., Term Loan | | | | |
| | 46,000 | | | 4.000%, 8/1/2019 | | | 46,211 | |
| | | | LTS Buyer, LLC, Term Loan | | | | |
| | 68,655 | | | 4.500%, 4/13/2020 | | | 68,891 | |
| | | | McGraw-Hill Global Education Holdings, LLC, Term Loan | | | | |
| | 82,316 | | | 9.000%, 3/22/2019 | | | 83,722 | |
| | | | NEP Broadcasting, LLC, Term Loan | | | | |
| | 91,538 | | | 4.750%, 1/22/2020 | | | 91,789 | |
| | | | NTelos, Inc., Term Loan | | | | |
| | 91,536 | | | 5.750%, 11/9/2019 | | | 91,689 | |
| | | | Puerto Rico Cable Acquisition Company, Inc., Term Loan | | | | |
| | 73,552 | | | 5.500%, 7/31/2018 | | | 73,583 | |
| | | | RCN Telecom Services, LLC, Term Loan | | | | |
| | 91,539 | | | 4.500%, 3/1/2020 | | | 92,192 | |
| | | | TNS, Inc., Term Loan | | | | |
| | 44,686 | | | 5.000%, 2/14/2020 | | | 44,895 | |
| | | | Univision Communications, Inc., Term Loan | | | | |
| | 91,539 | | | 4.500%, 2/28/2020 | | | 91,940 | |
| | | | Virgin Media Investment Holdings, Ltd., Term Loan | | | | |
| | 69,000 | | | 3.500%, 6/8/2020 | | | 69,103 | |
| | | | Visant Corporation, Term Loan | | | | |
| | 57,500 | | | 5.250%, 12/22/2016 | | | 56,590 | |
| | | | WideOpenWest Finance, LLC, Term Loan | | | | |
| | 80,096 | | | 4.750%, 4/1/2019 | | | 80,417 | |
| | | | Zayo Group, LLC, Term Loan | | | | |
| | 80,093 | | | 4.000%, 7/2/2019 | | | 80,112 | |
| | | | | | | | |
| | | | Total | | | 1,587,937 | |
| | | | | | | | |
| |
| Consumer Cyclical (1.7%) | | | | |
| | | | Bally Technologies, Inc., Term Loan | | | | |
| | 64,339 | | | 4.250%, 11/25/2020 | | | 64,761 | |
| | | | Burlington Coat Factory Warehouse Corporation, Term Loan | | | | |
| | 68,827 | | | 4.250%, 2/23/2017 | | | 69,429 | |
| | | | Cenveo Corporation, Term Loan | | | | |
| | 81,565 | | | 6.250%, 2/13/2017 | | | 81,905 | |
| | | | Ceridian Corporation, Term Loan | | | | |
| | 92,000 | | | 4.415%, 5/9/2017 | | | 92,258 | |
| | | | Golden Nugget, Inc., Delayed Draw | | | | |
| | 10,800 | | | 0.500%, 11/21/2019 | | | 10,948 | |
| | | | Golden Nugget, Inc., Term Loan | | | | |
| | 25,200 | | | 5.500%, 11/21/2019 | | | 25,546 | |
| | | | J.C. Penney Corporation, Inc., Term Loan | | | | |
| | 91,540 | | | 6.000%, 5/22/2018 | | | 89,435 | |
| | | | Las Vegas Sands, LLC, Term Loan | | | | |
| | 20,000 | | | 0.000%, 12/17/2020b,c | | | 19,973 | |
| | | | Marina District Finance Company, Inc., Term Loan | | | | |
| | 60,000 | | | 0.000%, 8/15/2018b,c | | | 60,188 | |
| | | | MGM Resorts International, Term Loan | | | | |
| | 34,326 | | | 3.500%, 12/20/2019 | | | 34,391 | |
| | | | Mohegan Tribal Gaming Authority, Term Loan | | | | |
| | 54,000 | | | 5.500%, 11/19/2019 | | | 54,777 | |
| | | | ROC Finance, LLC, Term Loan | | | | |
| | 91,770 | | | 5.000%, 6/20/2019 | | | 87,727 | |
| | | | Scientific Games International, Inc., Term Loan | | | | |
| | 92,000 | | | 4.250%, 10/18/2020 | | | 92,023 | |
| | | | Toys R Us, Inc., Term Loan | | | | |
| | 91,517 | | | 5.250%, 5/25/2018 | | | 77,046 | |
| | | | | | | | |
| | | | Total | | | 860,407 | |
| | | | | | | | |
| |
| Consumer Non-Cyclical (1.3%) | | | | |
| | | | Albertsons, Inc., Term Loan | | | | |
| | 141,769 | | | 3.075%, 3/21/2019b,c | | | 142,419 | |
| | | | Biomet, Inc., Term Loan | | | | |
| | 99,500 | | | 3.670%, 7/25/2017 | | | 100,060 | |
The accompanying Notes to Financial Statements are an integral part of this schedule.
12
Growth and Income Plus Fund
Schedule of Investments as of December 31, 2013
| | | | | | | | |
Principal
Amount | | | Bank Loans (9.0%)a | | Value | |
| Consumer Non-Cyclical (1.3%) - continued | |
| | | | CHS/Community Health Systems, Inc., Term Loan | | | | |
| | $46,000 | | | 3.737%, 1/25/2017 | | $ | 46,338 | |
| | | | Del Monte Corporation, Term Loan | | | | |
| | 46,000 | | | 4.000%, 3/8/2018 | | | 46,106 | |
| | | | DJO Finance, LLC, Term Loan | | | | |
| | 45,769 | | | 4.750%, 9/15/2017 | | | 46,198 | |
| | | | JBS USA, LLC, Term Loan | | | | |
| | 68,653 | | | 3.750%, 5/25/2018 | | | 68,653 | |
| | | | McJunkin Red Man Corporation, Term Loan | | | | |
| | 44,888 | | | 5.000%, 11/8/2019 | | | 45,449 | |
| | | | Roundy’s Supermarkets, Inc., Term Loan | | | | |
| | 71,340 | | | 5.750%, 2/13/2019 | | | 71,262 | |
| | | | Supervalu, Inc., Term Loan | | | | |
| | 91,302 | | | 5.000%, 3/21/2019 | | | 92,087 | |
| | | | | | | | |
| | | | Total | | | 658,572 | |
| | | | | | | | |
| |
| Energy (0.3%) | | | | |
| | | | Arch Coal, Inc., Term Loan | | | | |
| | 91,536 | | | 6.250%, 5/16/2018 | | | 90,182 | |
| | | | Pacific Drilling SA, Term Loan | | | | |
| | 68,655 | | | 4.500%, 6/3/2018 | | | 69,385 | |
| | | | | | | | |
| | | | Total | | | 159,567 | |
| | | | | | | | |
| |
| Financials (0.4%) | | | | |
| | | | Harland Clarke Holdings Corporation, Term Loan | | | | |
| | 90,850 | | | 7.000%, 5/22/2018 | | | 91,401 | |
| | | | Intelsat Jackson Holdings SA, Term Loan | | | | |
| | 44,444 | | | 3.750%, 6/30/2019 | | | 44,743 | |
| | | | Interactive Data Corporation, Term Loan | | | | |
| | 34,337 | | | 3.750%, 2/11/2018 | | | 34,330 | |
| | | | WaveDivision Holdings, LLC, Term Loan | | | | |
| | 57,211 | | | 4.000%, 10/12/2019 | | | 57,426 | |
| | | | | | | | |
| | | | Total | | | 227,900 | |
| | | | | | | | |
| Technology (0.6%) | | | | |
| | | | BMC Software, Inc., Term Loan | | | | |
| | 92,000 | | | 5.000%, 9/10/2020 | | | 92,431 | |
| | | | First Data Corporation Extended, Term Loan | | | | |
| | 92,000 | | | 4.166%, 3/23/2018 | | | 92,063 | |
| | | | Freescale Semiconductor, Inc., Term Loan | | | | |
| | 91,539 | | | 5.000%, 3/1/2020 | | | 92,405 | |
| | | | Infor US, Inc., Term Loan | | | | |
| | 45,884 | | | 3.750%, 6/3/2020 | | | 45,770 | |
| | | | | | | | |
| | | | Total | | | 322,669 | |
| | | | | | | | |
| |
| Transportation (0.4%) | | | | |
| | | | American Airlines, Inc., Term Loan | | | | |
| | 91,540 | | | 3.750%, 6/27/2019 | | | 91,998 | |
| | | | U.S. Airways, Inc., Term Loan | | | | |
| | 92,000 | | | 4.000%, 5/23/2019 | | | 92,529 | |
| | | | | | | | |
| | | | Total | | | 184,527 | |
| | | | | | | | |
| |
| Utilities (0.3%) | | | | |
| | | | Calpine Corporation, Term Loan | | | | |
| | 34,324 | | | 4.000%, 4/1/2018 | | | 34,522 | |
| | 30,000 | | | 4.000%, 10/31/2020 | | | 30,161 | |
| | | | Intergen NV, Term Loan | | | | |
| | 91,540 | | | 5.500%, 6/15/2020 | | | 92,226 | |
| | | | | | | | |
| | | | Total | | | 156,909 | |
| | | | | | | | |
| | | | Total Bank Loans (cost $4,659,073) | | | 4,662,642 | |
| | | | | | | | |
| | |
Shares | | | Common Stock (71.8%) | | | |
| |
| Consumer Discretionary (8.2%) | | | | |
| | 1,900 | | | Aaron’s, Inc. | | | 55,860 | |
| | 2,900 | | | Abercrombie & Fitch Company | | | 95,439 | |
| | 6,900 | | | Best Buy Company, Inc. | | | 275,172 | |
| | 3,300 | | | Cablevision Systems Corporation | | | 59,169 | |
| | 2,300 | | | CEC Entertainment, Inc. | | | 101,844 | |
| | 11,645 | | | Comcast Corporation | | | 605,133 | |
| | 4,300 | | | Dana Holding Corporation | | | 84,366 | |
| | 4,400 | | | Federal-Mogul Corporationd | | | 86,592 | |
| | 27,300 | | | Ford Motor Company | | | 421,239 | |
| | 5,010 | | | Home Depot, Inc. | | | 412,523 | |
| | 7,500 | | | Lowe’s Companies, Inc. | | | 371,625 | |
| | 1,900 | | | Madison Square Garden Companyd | | | 109,402 | |
| | 900 | | | McDonald’s Corporation | | | 87,327 | |
| | 3,700 | | | National CineMedia, Inc. | | | 73,852 | |
| | 5,800 | | | Regis Corporation | | | 84,158 | |
| | 22,700 | | | Staples, Inc. | | | 360,703 | |
| | 5,400 | | | Starwood Hotels & Resorts Worldwide, Inc. | | | 429,030 | |
| | 2,763 | | | Target Corporation | | | 174,815 | |
| | 3,760 | | | Thomson Reuters Corporation | | | 142,203 | |
| | 1,200 | | | Viacom, Inc. | | | 104,808 | |
| | 300 | | | Whirlpool Corporation | | | 47,058 | |
| | 1,100 | | | Wyndham Worldwide Corporation | | | 81,059 | |
| | | | | | | | |
| | | | Total | | | 4,263,377 | |
| | | | | | | | |
| |
| Consumer Staples (6.4%) | | | | |
| | 9,800 | | | Altria Group, Inc. | | | 376,222 | |
| | 9,299 | | | Coca-Cola Company | | | 384,142 | |
| | 7,941 | | | CVS Caremark Corporation | | | 568,337 | |
| | 5,900 | | | Dr Pepper Snapple Group, Inc. | | | 287,448 | |
| | 3,781 | | | General Mills, Inc. | | | 188,710 | |
| | 4,622 | | | PepsiCo, Inc. | | | 383,349 | |
| | 2,900 | | | Prestige Brands Holdings, Inc.d | | | 103,820 | |
| | 4,310 | | | Procter & Gamble Company | | | 350,877 | |
| | 2,347 | | | Reynolds American, Inc. | | | 117,327 | |
| | 7,176 | | | Wal-Mart Stores, Inc. | | | 564,679 | |
| | | | | | | | |
| | | | Total | | | 3,324,911 | |
| | | | | | | | |
| |
| Energy (8.9%) | | | | |
| | 3,900 | | | Anadarko Petroleum Corporation | | | 309,348 | |
| | 9,000 | | | Cabot Oil & Gas Corporation | | | 348,840 | |
| | 7,655 | | | Chevron Corporation | | | 956,186 | |
| | 8,944 | | | ConocoPhillips | | | 631,894 | |
| | 11,481 | | | Exxon Mobil Corporation | | | 1,161,877 | |
| | 13,200 | | | Kinder Morgan, Inc. | | | 475,200 | |
| | 4,300 | | | Oceaneering International, Inc. | | | 339,184 | |
| | 9,900 | | | RPC, Inc. | | | 176,715 | |
The accompanying Notes to Financial Statements are an integral part of this schedule.
13
Growth and Income Plus Fund
Schedule of Investments as of December 31, 2013
| | | | | | | | |
Shares | | | Common Stock (71.8%) | | Value | |
| Energy (8.9%) - continued | |
| | 3,000 | | | Targa Resources Corporation | | $ | 264,510 | |
| | | | | | | | |
| | | | Total | | | 4,663,754 | |
| | | | | | | | |
| |
| Financials (15.9%) | | | | |
| | 5,688 | | | ACE, Ltd. | | | 588,879 | |
| | 2,176 | | | Aflac, Inc. | | | 145,357 | |
| | 1,900 | | | American Financial Group, Inc. | | | 109,668 | |
| | 2,500 | | | Ameriprise Financial, Inc. | | | 287,625 | |
| | 21,000 | | | Anworth Mortgage Asset Corporation | | | 88,410 | |
| | 11,700 | | | Ashford Hospitality Trust, Inc. | | | 96,876 | |
| | 1,500 | | | Berkshire Hathaway, Inc.d | | | 177,840 | |
| | 2,800 | | | Cash America International, Inc. | | | 107,240 | |
| | 2,434 | | | Coresite Realty Corporation | | | 78,350 | |
| | 3,100 | | | Digital Realty Trust, Inc. | | | 152,272 | |
| | 7,200 | | | Discover Financial Services | | | 402,840 | |
| | 700 | | | Erie Indemnity Company | | | 51,184 | |
| | 4,600 | | | Excel Trust, Inc. | | | 52,394 | |
| | 9,000 | | | F.N.B. Corporation | | | 113,580 | |
| | 11,800 | | | Fifth Third Bancorp | | | 248,154 | |
| | 10,500 | | | First Financial Bancorp | | | 183,015 | |
| | 14,200 | | | First Niagara Financial Group, Inc. | | | 150,804 | |
| | 7,000 | | | Hancock Holding Company | | | 256,760 | |
| | 8,000 | | | Hatteras Financial Corporation | | | 130,720 | |
| | 3,600 | | | Horace Mann Educators Corporation | | | 113,544 | |
| | 11,600 | | | Huntington Bancshares, Inc. | | | 111,940 | |
| | 2,750 | | | iShares J.P. Morgan USD Emerging Markets Bond ETF | | | 297,440 | |
| | 11,514 | | | iShares S&P U.S. Preferred Stock Index Fund | | | 424,061 | |
| | 5,700 | | | KeyCorp | | | 76,494 | |
| | 8,000 | | | Lazard, Ltd. | | | 362,560 | |
| | 9,700 | | | Maiden Holdings, Ltd. | | | 106,021 | |
| | 525 | | | MasterCard, Inc. | | | 438,616 | |
| | 2,600 | | | National Bank Holdings Corporation | | | 55,640 | |
| | 3,405 | | | PartnerRe, Ltd. | | | 358,989 | |
| | 17,948 | | | PowerShares Preferred Portfolio | | | 241,221 | |
| | 4,600 | | | Prudential Financial, Inc. | | | 424,212 | |
| | 5,500 | | | Regions Financial Corporation | | | 54,395 | |
| | 4,666 | | | Travelers Companies, Inc. | | | 422,460 | |
| | 6,003 | | | U.S. Bancorp | | | 242,521 | |
| | 2,300 | | | W.R. Berkley Corporation | | | 99,797 | |
| | 23,335 | | | Wells Fargo & Company | | | 1,059,409 | |
| | | | | | | | |
| | | | Total | | | 8,311,288 | |
| | | | | | | | |
| |
| Health Care (8.5%) | | | | |
| | 12,913 | | | Abbott Laboratories | | | 494,955 | |
| | 1,719 | | | AmerisourceBergen Corporation | | | 120,863 | |
| | 1,636 | | | Amgen, Inc. | | | 186,766 | |
| | 1,300 | | | Computer Programs and Systems, Inc. | | | 80,353 | |
| | 1,600 | | | DaVita HealthCare Partners, Inc.d | | | 101,392 | |
| | 1,823 | | | Eli Lilly and Company | | | 92,973 | |
| | 1,500 | | | Forest Laboratories, Inc.d | | | 90,045 | |
| | 1,600 | | | HCA Holdings, Inc.d | | | 76,336 | |
| | 1,300 | | | Henry Schein, Inc.d | | | 148,538 | |
| | 4,198 | | | Johnson & Johnson | | | 384,495 | |
| | 1,500 | | | Mallinckrodt, LLCd | | | 78,390 | |
| | 1,100 | | | McKesson Corporation | | | 177,540 | |
| | 12,006 | | | Medtronic, Inc. | | | 689,024 | |
| | 14,748 | | | PDL BioPharma, Inc. | | | 124,473 | |
| | 30,510 | | | Pfizer, Inc. | | | 934,521 | |
| | 2,700 | | | Quintiles Transnational Holdings, Inc.d | | | 125,118 | |
| | 1,700 | | | St. Jude Medical, Inc. | | | 105,315 | |
| | 4,500 | | | WellPoint, Inc. | | | 415,755 | |
| | | | | | | | |
| | | | Total | | | 4,426,852 | |
| | | | | | | | |
| |
| Industrials (9.0%) | | | | |
| | 2,230 | | | 3M Company | | | 312,757 | |
| | 3,300 | | | ADT Corporation | | | 133,551 | |
| | 3,100 | | | Altra Industrial Motion Corporation | | | 106,082 | |
| | 5,000 | | | Brink’s Company | | | 170,700 | |
| | 1,800 | | | C.H. Robinson Worldwide, Inc. | | | 105,012 | |
| | 1,900 | | | Donaldson Company, Inc. | | | 82,574 | |
| | 3,000 | | | Ennis, Inc. | | | 53,100 | |
| | 19,481 | | | Exelis, Inc. | | | 371,308 | |
| | 3,600 | | | Landstar System, Inc. | | | 206,820 | |
| | 2,750 | | | Lockheed Martin Corporation | | | 408,815 | |
| | 7,285 | | | Northrop Grumman Corporation | | | 834,934 | |
| | 6,490 | | | Raytheon Company | | | 588,643 | |
| | 11,490 | | | Republic Services, Inc. | | | 381,468 | |
| | 2,800 | | | Roper Industries, Inc. | | | 388,304 | |
| | 7,600 | | | Southwest Airlines Company | | | 143,184 | |
| | 3,700 | | | Waste Connections, Inc. | | | 161,431 | |
| | 5,500 | | | Woodward, Inc. | | | 250,855 | |
| | | | | | | | |
| | | | Total | | | 4,699,538 | |
| | | | | | | | |
| |
| Information Technology (8.4%) | | | | |
| | 1,000 | | | Accenture plc | | | 82,220 | |
| | 7,400 | | | Agilent Technologies, Inc. | | | 423,206 | |
| | 5,400 | | | Altera Corporation | | | 175,662 | |
| | 500 | | | Apple, Inc. | | | 280,555 | |
| | 5,300 | | | Booz Allen Hamilton Holding Corporation | | | 101,495 | |
| | 28,611 | | | Cisco Systems, Inc. | | | 642,317 | |
| | 20,700 | | | Intel Corporation | | | 537,372 | |
| | 2,740 | | | International Business Machines Corporation | | | 513,942 | |
| | 5,725 | | | Leidos Holdings, Inc. | | | 266,155 | |
| | 3,800 | | | Lexmark International, Inc. | | | 134,976 | |
| | 6,800 | | | ManTech International Corporation | | | 203,524 | |
| | 8,300 | | | Microchip Technology, Inc. | | | 371,425 | |
| | 2,600 | | | Motorola Solutions, Inc. | | | 175,500 | |
| | 4,451 | | | Oracle Corporation | | | 170,295 | |
| | 5,500 | | | Take-Two Interactive Software, Inc.d | | | 95,535 | |
| | 6,800 | | | Xerox Corporation | | | 82,756 | |
| | 2,800 | | | Yahoo!, Inc.d | | | 113,232 | |
| | | | | | | | |
| | | | Total | | | 4,370,167 | |
| | | | | | | | |
| |
| Materials (2.4%) | | | | |
| | 25,800 | | | Alcoa, Inc. | | | 274,254 | |
| | 958 | | | CF Industries Holdings, Inc. | | | 223,252 | |
| | 1,500 | | | Innophos Holdings, Inc. | | | 72,900 | |
| | 2,900 | | | Sigma-Aldrich Corporation | | | 272,629 | |
| | 13,800 | | | Southern Copper Corporation | | | 396,198 | |
| | | | | | | | |
| | | | Total | | | 1,239,233 | |
| | | | | | | | |
| |
| Telecommunications Services (1.8%) | | | | |
| | 17,902 | | | AT&T, Inc. | | | 629,434 | |
| | 6,053 | | | Verizon Communications, Inc. | | | 297,445 | |
| | | | | | | | |
| | | | Total | | | 926,879 | |
| | | | | | | | |
The accompanying Notes to Financial Statements are an integral part of this schedule.
14
Growth and Income Plus Fund
Schedule of Investments as of December 31, 2013
| | | | | | | | |
Shares | | | Common Stock (71.8%) | | Value | |
| Utilities (2.3%) | |
| | 4,763 | | | CenterPoint Energy, Inc. | | $ | 110,406 | |
| | 3,125 | | | Empire District Electric Company | | | 70,906 | |
| | 1,115 | | | Laclede Group, Inc. | | | 50,777 | |
| | 2,338 | | | Otter Tail Corporation | | | 68,433 | |
| | 2,363 | | | PG&E Corporation | | | 95,182 | |
| | 3,435 | | | Pinnacle West Capital Corporation | | | 181,780 | |
| | 8,944 | | | Southern Company | | | 367,688 | |
| | 1,600 | | | WGL Holdings, Inc. | | | 64,096 | |
| | 4,854 | | | Wisconsin Energy Corporation | | | 200,665 | |
| | | | | | | | |
| | | | Total | | | 1,209,933 | |
| | | | | | | | |
| | | | Total Common Stock (cost $33,488,768) | | | 37,435,932 | |
| | | | | | | | |
| | |
Principal
Amount | | | Long-Term Fixed Income (15.7%) | | | |
| Asset-Backed Securities (0.1%) | |
| | | | Countrywide Asset-Backed | | | | |
| | | | Certificates | | | | |
| $ | 71,725 | | | 5.530%, 4/25/2047 | | | 65,643 | |
| | | | | | | | |
| | | | Total | | | 65,643 | |
| | | | | | | | |
|
| Basic Materials (0.4%) | |
| | | | BHP Billiton Finance USA, Ltd. | | | | |
| | 16,000 | | | 2.050%, 9/30/2018 | | | 15,998 | |
| | | | Dow Chemical Company | | | | |
| | 8,000 | | | 8.550%, 5/15/2019 | | | 10,330 | |
| | | | FMG Resources Pty. Ltd. | | | | |
| | 23,677 | | | 6.875%, 2/1/2018e | | | 24,920 | |
| | | | Freeport-McMoRan Copper & Gold, Inc. | | | | |
| | 10,000 | | | 2.375%, 3/15/2018 | | | 9,976 | |
| | | | Hexion US Finance | | | | |
| | | | Corporation/Hexion Nova | | | | |
| | | | Scotia Finance ULC | | | | |
| | 23,677 | | | 8.875%, 2/1/2018 | | | 24,594 | |
| | | | Ineos Finance plc | | | | |
| | 28,000 | | | 7.500%, 5/1/2020e | | | 30,695 | |
| | | | Inmet Mining Corporation | | | | |
| | 23,677 | | | 8.750%, 6/1/2020e | | | 25,690 | |
| | | | LyondellBasell Industries NV | | | | |
| | 8,000 | | | 5.000%, 4/15/2019 | | | 8,885 | |
| | 8,000 | | | 6.000%, 11/15/2021 | | | 9,201 | |
| | | | NOVA Chemicals Corporation | | | | |
| | 35,516 | | | 5.250%, 8/1/2023e | | | 36,581 | |
| | | | Xstrata Finance Canada, Ltd. | | | | |
| | 13,000 | | | 2.050%, 10/23/2015e | | | 13,165 | |
| | 21,000 | | | 2.700%, 10/25/2017e | | | 21,238 | |
| | | | | | | | |
| | | | Total | | | 231,273 | |
| | | | | | | | |
|
| Capital Goods (0.5%) | |
| | | | BAE Systems plc | | | | |
| | 12,000 | | | 3.500%, 10/11/2016e | | | 12,544 | |
| | | | Cemex Finance, LLC | | | | |
| | 23,677 | | | 9.375%, 10/12/2017e | | | 26,696 | |
| | | | CNH Capital, LLC | | | | |
| | 23,677 | | | 3.625%, 4/15/2018 | | | 24,003 | |
| | | | Eaton Corporation | | | | |
| | 12,000 | | | 1.500%, 11/2/2017 | | | 11,764 | |
| | | | John Deere Capital Corporation | | | | |
| | 24,000 | | | 1.050%, 10/11/2016 | | | 24,069 | |
| | | | Nortek, Inc. | | | | |
| | 23,677 | | | 8.500%, 4/15/2021 | | | 26,222 | |
| | | | Reynolds Group Issuer, Inc. | | | | |
| | 23,677 | | | 9.875%, 8/15/2019 | | | 26,341 | |
| | | | Roper Industries, Inc. | | | | |
| | 15,000 | | | 1.850%, 11/15/2017 | | | 14,869 | |
| | | | Textron, Inc. | | | | |
| | 12,000 | | | 4.625%, 9/21/2016 | | | 12,936 | |
| | | | Trinseo Materials Operating SCA | | | | |
| | 26,000 | | | 8.750%, 2/1/2019e | | | 26,845 | |
| | | | United Rentals North America, Inc. | | | | |
| | 30,000 | | | 7.375%, 5/15/2020 | | | 33,262 | |
| | | | | | | | |
| | | | Total | | | 239,551 | |
| | | | | | | | |
|
| Collateralized Mortgage Obligations (3.1%) | |
| | | | Banc of America Alternative Loan Trust | | | | |
| | 80,719 | | | 6.000%, 11/25/2035 | | | 66,557 | |
| | | | Citigroup Mortgage Loan Trust, Inc. | | | | |
| | 49,356 | | | 2.971%, 3/25/2037 | | | 35,799 | |
| | | | Countrywide Alternative Loan Trust | | | | |
| | 101,119 | | | 6.500%, 8/25/2036 | | | 68,878 | |
| | | | Credit Suisse First Boston Mortgage Securities Corporation | | | | |
| | 80,411 | | | 5.250%, 10/25/2035 | | | 78,061 | |
| | | | Deutsche Alt-A Securities, Inc., Mortgage Loan Trust | | | | |
| | 88,890 | | | 5.500%, 11/25/2035 | | | 80,697 | |
| | | | HomeBanc Mortgage Trust | | | | |
| | 54,439 | | | 2.409%, 4/25/2037 | | | 37,857 | |
| | | | J.P. Morgan Alternative Loan Trust | | | | |
| | 114,272 | | | 6.500%, 3/25/2036 | | | 100,180 | |
| | | | J.P. Morgan Mortgage Trust | | | | |
| | 125,210 | | | 2.660%, 6/25/2035 | | | 124,825 | |
| | 92,419 | | | 2.867%, 8/25/2035 | | | 91,831 | |
| | 106,922 | | | 2.530%, 1/25/2037 | | | 94,257 | |
| | | | MortgageIT Trust | | | | |
| | 90,467 | | | 0.425%, 12/25/2035f | | | 82,877 | |
| | | | New York Mortgage Trust 2006-1 | | | | |
| | 105,512 | | | 2.755%, 5/25/2036 | | | 92,092 | |
| | | | Residential Accredit Loans, Inc. | | | | |
| | 100,459 | | | 5.750%, 9/25/2035 | | | 88,488 | |
| | | | RFMSI Trust | | | | |
| | 123,117 | | | 6.000%, 7/25/2037 | | | 109,663 | |
| | | | Structured Adjustable Rate Mortgage Loan Trust | | | | |
| | 108,220 | | | 2.715%, 9/25/2035 | | | 91,670 | |
| | | | Structured Asset Mortgage Investments, Inc. | | | | |
| | 149,303 | | | 0.475%, 12/25/2035f | | | 110,577 | |
| | | | Wells Fargo Mortgage Backed Securities Trust | | | | |
| | 98,591 | | | 2.628%, 3/25/2036 | | | 98,397 | |
| | 78,226 | | | 2.632%, 7/25/2036 | | | 72,494 | |
| | 90,475 | | | 6.000%, 7/25/2037 | | | 85,596 | |
| | | | | | | | |
| | | | Total | | | 1,610,796 | |
| | | | | | | | |
|
| Communications Services (1.3%) | |
| | | | AMC Networks, Inc. | | | | |
| | 23,677 | | | 7.750%, 7/15/2021 | | | 26,637 | |
The accompanying Notes to Financial Statements are an integral part of this schedule.
15
Growth and Income Plus Fund
Schedule of Investments as of December 31, 2013
| | | | | | | | |
Principal
Amount | | | Long-Term Fixed Income (15.7%) | | Value | |
| Communications Services (1.3%) - continued | |
| | | | America Movil SAB de CV | | | | |
| $ | 8,000 | | | 5.000%, 10/16/2019 | | $ | 8,740 | |
| | | | American Tower Corporation | | | | |
| | 13,000 | | | 7.000%, 10/15/2017 | | | 14,984 | |
| | | | AT&T, Inc. | | | | |
| | 27,000 | | | 2.400%, 8/15/2016 | | | 27,765 | |
| | | | British Telecommunications plc | | | | |
| | 12,000 | | | 1.625%, 6/28/2016 | | | 12,106 | |
| | | | CBS Corporation | | | | |
| | 12,000 | | | 8.875%, 5/15/2019 | | | 15,342 | |
| | | | CC Holdings GS V, LLC | | | | |
| | 18,000 | | | 2.381%, 12/15/2017 | | | 17,829 | |
| | | | CCO Holdings, LLC | | | | |
| | 23,677 | | | 7.000%, 1/15/2019 | | | 24,950 | |
| | | | CenturyLink, Inc. | | | | |
| | 23,677 | | | 5.625%, 4/1/2020 | | | 24,091 | |
| | | | Digicel, Ltd. | | | | |
| | 23,677 | | | 6.000%, 4/15/2021e | | | 22,848 | |
| | | | DIRECTV Holdings, LLC | | | | |
| | 15,000 | | | 3.500%, 3/1/2016 | | | 15,745 | |
| | 8,000 | | | 5.875%, 10/1/2019 | | | 9,062 | |
| | | | Hughes Satellite Systems Corporation | | | | |
| | 30,000 | | | 6.500%, 6/15/2019 | | | 32,475 | |
| | | | Intelsat Jackson Holdings SA | | | | |
| | 23,677 | | | 7.250%, 10/15/2020 | | | 25,897 | |
| | | | Level 3 Financing, Inc. | | | | |
| | 30,000 | | | 8.625%, 7/15/2020 | | | 33,600 | |
| | | | NBC Universal Enterprise, Inc. | | | | |
| | 12,000 | | | 1.662%, 4/15/2018e | | | 11,720 | |
| | | | News America, Inc. | | | | |
| | 8,000 | | | 4.500%, 2/15/2021 | | | 8,575 | |
| | | | SBA Tower Trust | | | | |
| | 26,000 | | | 5.101%, 4/17/2017e | | | 28,026 | |
| | | | Sprint Communications, Inc. | | | | |
| | 23,677 | | | 9.000%, 11/15/2018e | | | 28,531 | |
| | | | Telefonica Emisiones SAU | | | | |
| | 16,000 | | | 3.992%, 2/16/2016 | | | 16,806 | |
| | 17,000 | | | 3.192%, 4/27/2018 | | | 17,313 | |
| | | | T-Mobile USA, Inc. | | | | |
| | 25,000 | | | 6.633%, 4/28/2021 | | | 26,313 | |
| | | | Univision Communications, Inc. | | | | |
| | 40,000 | | | 7.875%, 11/1/2020e | | | 43,950 | |
| | | | UPCB Finance V, Ltd. | | | | |
| | 40,000 | | | 7.250%, 11/15/2021e | | | 43,400 | |
| | | | Verizon Communications, Inc. | | | | |
| | 30,000 | | | 2.500%, 9/15/2016 | | | 31,021 | |
| | 12,000 | | | 1.993%, 9/14/2018f | | | 12,618 | |
| | 23,000 | | | 3.650%, 9/14/2018 | | | 24,347 | |
| | | | WideOpenWest Finance, LLC | | | | |
| | 40,000 | | | 10.250%, 7/15/2019 | | | 44,400 | |
| | | | Wind Acquisition Finance SA | | | | |
| | 23,677 | | | 11.750%, 7/15/2017e | | | 25,187 | |
| | | | | | | | |
| | | | Total | | | 674,278 | |
| | | | | | | | |
|
| Consumer Cyclical (0.7%) | |
| | | | Amazon.com, Inc. | | | | |
| | 18,000 | | | 1.200%, 11/29/2017 | | | 17,624 | |
| | | | Chrysler Group, LLC | | | | |
| | 23,677 | | | 8.250%, 6/15/2021 | | | 26,933 | |
| | | | Cinemark USA, Inc. | | | | |
| | 28,000 | | | 4.875%, 6/1/2023 | | | 26,320 | |
| | | | Ford Motor Credit Company, LLC | | | | |
| | 29,000 | | | 3.984%, 6/15/2016 | | | 30,839 | |
| | 17,000 | | | 3.000%, 6/12/2017 | | | 17,668 | |
| | 13,000 | | | 5.000%, 5/15/2018 | | | 14,481 | |
| | | | General Motors Company | | | | |
| | 16,000 | | | 3.500%, 10/2/2018e | | | 16,360 | |
| | | | General Motors Financial Company, Inc. | | | | |
| | 23,677 | | | 3.250%, 5/15/2018e | | | 23,677 | |
| | | | Home Depot, Inc. | | | | |
| | 8,000 | | | 3.950%, 9/15/2020 | | | 8,535 | |
| | | | Jaguar Land Rover Automotive plc | | | | |
| | 30,000 | | | 5.625%, 2/1/2023e | | | 30,000 | |
| | | | L Brands, Inc. | | | | |
| | 30,000 | | | 6.625%, 4/1/2021 | | | 32,925 | |
| | | | Macy’s Retail Holdings, Inc. | | | | |
| | 23,000 | | | 7.450%, 7/15/2017 | | | 26,898 | |
| | | | Royal Caribbean Cruises, Ltd. | | | | |
| | 23,677 | | | 5.250%, 11/15/2022 | | | 23,677 | |
| | | | Toll Brothers Finance Corporation | | | | |
| | 16,000 | | | 4.000%, 12/31/2018 | | | 16,280 | |
| | | | Toyota Motor Credit Corporation | | | | |
| | 13,000 | | | 2.000%, 10/24/2018 | | | 12,996 | |
| | | | West Corporation | | | | |
| | 23,677 | | | 8.625%, 10/1/2018 | | | 25,749 | |
| | | | Wynn Las Vegas, LLC | | | | |
| | 30,000 | | | 5.375%, 3/15/2022 | | | 30,300 | |
| | | | | | | | |
| | | | Total | | | 381,262 | |
| | | | | | | | |
|
| Consumer Non-Cyclical (1.4%) | |
| | | | AbbVie, Inc. | | | | |
| | 27,000 | | | 1.750%, 11/6/2017 | | | 26,954 | |
| | | | Altria Group, Inc. | | | | |
| | 15,000 | | | 9.700%, 11/10/2018 | | | 19,716 | |
| | | | Anheuser-Busch InBev Worldwide, Inc. | | | | |
| | 16,000 | | | 7.750%, 1/15/2019 | | | 19,978 | |
| | | | Beam, Inc. | | | | |
| | 8,000 | | | 5.375%, 1/15/2016 | | | 8,658 | |
| | | | Biomet, Inc. | | | | |
| | 23,677 | | | 6.500%, 8/1/2020 | | | 24,861 | |
| | | | Boston Scientific Corporation | | | | |
| | 15,000 | | | 2.650%, 10/1/2018 | | | 15,102 | |
| | | | Celgene Corporation | | | | |
| | 16,000 | | | 1.900%, 8/15/2017 | | | 15,924 | |
| | | | CHS/Community Health Systems, Inc. | | | | |
| | 30,000 | | | 7.125%, 7/15/2020 | | | 31,125 | |
| | | | ConAgra Foods, Inc. | | | | |
| | 20,000 | | | 2.100%, 3/15/2018 | | | 19,780 | |
| | | | CVS Caremark Corporation | | | | |
| | 8,000 | | | 2.250%, 12/5/2018 | | | 7,998 | |
| | | | Emergency Medical Services Corporation | | | | |
| | 15,677 | | | 8.125%, 6/1/2019 | | | 16,990 | |
| | | | Endo Health Solutions, Inc. | | | | |
| | 23,677 | | | 7.250%, 1/15/2022 | | | 25,334 | |
| | | | Express Scripts Holding Company | | | | |
| | 15,000 | | | 3.125%, 5/15/2016 | | | 15,656 | |
| | 16,000 | | | 2.650%, 2/15/2017 | | | 16,491 | |
| | | | Fresenius Medical Care US Finance, Inc. | | | | |
| | 23,677 | | | 5.750%, 2/15/2021e | | | 25,098 | |
The accompanying Notes to Financial Statements are an integral part of this schedule.
16
Growth and Income Plus Fund
Schedule of Investments as of December 31, 2013
| | | | | | | | |
Principal
Amount | | | Long-Term Fixed Income (15.7%) | | Value | |
| Consumer Non-Cyclical (1.4%) - continued | |
| | | | Gilead Sciences, Inc. | | | | |
| | $15,000 | | | 3.050%, 12/1/2016 | | $ | 15,838 | |
| | | | Hawk Acquisition Sub, Inc. | | | | |
| | 30,000 | | | 4.250%, 10/15/2020e | | | 29,025 | |
| | | | HCA, Inc. | | | | |
| | 23,677 | | | 4.750%, 5/1/2023 | | | 22,256 | |
| | | | Health Management Associates, Inc. | | | | |
| | 23,677 | | | 7.375%, 1/15/2020 | | | 26,489 | |
| | | | Heineken NV | | | | |
| | 7,000 | | | 1.400%, 10/1/2017e | | | 6,867 | |
| | | | IMS Health, Inc. | | | | |
| | 27,000 | | | 6.000%, 11/1/2020e | | | 28,687 | |
| | | | JBS Finance II, Ltd. | | | | |
| | 23,677 | | | 8.250%, 1/29/2018g | | | 24,861 | |
| | | | Kroger Company | | | | |
| | 16,000 | | | 1.200%, 10/17/2016 | | | 16,007 | |
| | | | Lorillard Tobacco Company | | | | |
| | 21,000 | | | 8.125%, 6/23/2019 | | | 25,581 | |
| | | | Mylan, Inc. | | | | |
| | 16,000 | | | 1.350%, 11/29/2016 | | | 15,971 | |
| | | | Pernod Ricard SA | | | | |
| | 8,000 | | | 2.950%, 1/15/2017e | | | 8,262 | |
| | 8,000 | | | 5.750%, 4/7/2021e | | | 8,818 | |
| | | | Perrigo Company, Ltd. | | | | |
| | 16,000 | | | 1.300%, 11/8/2016e | | | 15,945 | |
| | 8,000 | | | 2.300%, 11/8/2018e | | | 7,896 | |
| | | | Revlon Consumer Products Corporation | | | | |
| | 23,677 | | | 5.750%, 2/15/2021 | | | 23,351 | |
| | | | SABMiller plc | | | | |
| | 16,000 | | | 6.500%, 7/15/2018e | | | 18,888 | |
| | | | Safeway, Inc. | | | | |
| | 24,000 | | | 3.400%, 12/1/2016 | | | 24,970 | |
| | | | Spectrum Brands Escrow Corporation | | | | |
| | 30,000 | | | 6.375%, 11/15/2020e | | | 32,025 | |
| | | | Thermo Fisher Scientific, Inc. | | | | |
| | 16,000 | | | 1.300%, 2/1/2017 | | | 15,930 | |
| | 16,000 | | | 2.400%, 2/1/2019 | | | 15,851 | |
| | | | Valeant Pharmaceuticals International | | | | |
| | 23,677 | | | 7.250%, 7/15/2022e | | | 25,482 | |
| | | | Watson Pharmaceuticals, Inc. | | | | |
| | 19,000 | | | 1.875%, 10/1/2017 | | | 18,802 | |
| | | | WM Wrigley Jr. Company | | | | |
| | 12,000 | | | 2.000%, 10/20/2017e | | | 11,967 | |
| | | | | | | | |
| | | | Total | | | 729,434 | |
| | | | | | | | |
|
| Energy (0.9%) | |
| | | | BP Capital Markets plc | | | | |
| | 16,000 | | | 0.658%, 11/7/2016f | | | 16,068 | |
| | 16,000 | | | 2.241%, 9/26/2018 | | | 16,046 | |
| | | | CNOOC, Ltd. | | | | |
| | 16,000 | | | 1.125%, 5/9/2016 | | | 15,941 | |
| | | | Concho Resources, Inc. | | | | |
| | 23,677 | | | 6.500%, 1/15/2022 | | | 25,630 | |
| | | | Continental Resources, Inc. | | | | |
| | 20,000 | | | 7.125%, 4/1/2021 | | | 22,675 | |
| | | | Devon Energy Corporation | | | | |
| | 16,000 | | | 1.200%, 12/15/2016 | | | 15,993 | |
| | | | Energy Transfer Partners, LP | | | | |
| | 8,000 | | | 6.700%, 7/1/2018 | | | 9,288 | |
| | | | EQT Corporation | | | | |
| | 8,000 | | | 8.125%, 6/1/2019 | | | 9,705 | |
| | | | Gazprom Neft OAO Via GPN Capital SA | | | | |
| | 30,000 | | | 6.000%, 11/27/2023e | | | 30,450 | |
| | | | Harvest Operations Corporation | | | | |
| | 23,677 | | | 6.875%, 10/1/2017 | | | 25,926 | |
| | | | Hess Corporation | | | | |
| | 15,000 | | | 8.125%, 2/15/2019 | | | 18,632 | |
| | | | Kodiak Oil & Gas Corporation | | | | |
| | 23,677 | | | 5.500%, 1/15/2021 | | | 23,618 | |
| | | | Linn Energy, LLC | | | | |
| | 23,677 | | | 8.625%, 4/15/2020 | | | 25,571 | |
| | | | Lukoil International Finance BV | | | | |
| | 8,000 | | | 3.416%, 4/24/2018e | | | 8,070 | |
| | | | MEG Energy Corporation | | | | |
| | 30,000 | | | 6.375%, 1/30/2023e | | | 30,188 | |
| | | | Oasis Petroleum, Inc. | | | | |
| | 30,000 | | | 6.875%, 1/15/2023 | | | 31,950 | |
| | | | Offshore Group Investment, Ltd. | | | | |
| | 40,000 | | | 7.500%, 11/1/2019 | | | 43,500 | |
| | | | Petrobras Global Finance BV | | | | |
| | 18,000 | | | 2.000%, 5/20/2016 | | | 17,986 | |
| | | | Range Resources Corporation | | | | |
| | 33,385 | | | 5.000%, 8/15/2022 | | | 32,801 | |
| | | | Suncor Energy, Inc. | | | | |
| | 13,000 | | | 6.100%, 6/1/2018 | | | 15,028 | |
| | | | Transocean, Inc. | | | | |
| | 21,000 | | | 5.050%, 12/15/2016 | | | 23,198 | |
| | | | Weatherford International, Ltd. | | | | |
| | 13,000 | | | 6.000%, 3/15/2018 | | | 14,590 | |
| | 8,000 | | | 9.625%, 3/1/2019 | | | 10,279 | |
| | | | | | | | |
| | | | Total | | | 483,133 | |
| | | | | | | | |
|
| Financials (3.2%) | |
| | | | Abbey National Treasury Services plc | | | | |
| | 8,000 | | | 3.050%, 8/23/2018 | | | 8,220 | |
| | | | Ally Financial, Inc. | | | | |
| | 40,000 | | | 4.750%, 9/10/2018 | | | 41,850 | |
| | | | American International Group, Inc. | | | | |
| | 25,000 | | | 8.250%, 8/15/2018 | | | 31,272 | |
| | | | Aviation Capital Group Corporation | | | | |
| | 14,000 | | | 3.875%, 9/27/2016e | | | 14,460 | |
| | | | Bank of America Corporation | | | | |
| | 29,000 | | | 5.750%, 8/15/2016 | | | 31,981 | |
| | 20,000 | | | 5.750%, 12/1/2017 | | | 22,762 | |
| | 16,000 | | | 1.316%, 3/22/2018f | | | 16,212 | |
| | 25,000 | | | 5.650%, 5/1/2018 | | | 28,457 | |
| | 13,000 | | | 2.600%, 1/15/2019 | | | 13,057 | |
| | 15,000 | | | 5.625%, 7/1/2020 | | | 17,141 | |
| | | | Bank of Nova Scotia | | | | |
| | 16,000 | | | 1.100%, 12/13/2016 | | | 16,077 | |
| | | | Barclays Bank plc | | | | |
| | 14,000 | | | 5.140%, 10/14/2020 | | | 14,908 | |
| | | | BB&T Corporation | | | | |
| | 13,000 | | | 2.050%, 6/19/2018 | | | 12,870 | |
| | | | BBVA Banco Continental SA | | | | |
| | 13,000 | | | 2.250%, 7/29/2016e | | | 12,935 | |
| | | | BBVA US Senior SAU | | | | |
| | 20,000 | | | 4.664%, 10/9/2015 | | | 21,026 | |
The accompanying Notes to Financial Statements are an integral part of this schedule.
17
Growth and Income Plus Fund
Schedule of Investments as of December 31, 2013
| | | | | | | | |
Principal
Amount | | | Long-Term Fixed Income (15.7%) | | Value | |
| Financials (3.2%) - continued | | | | |
| | | | Bear Stearns Companies, LLC | | | | |
| $ | 26,000 | | | 6.400%, 10/2/2017 | | $ | 30,175 | |
| | | | BNP Paribas SA | | | | |
| | 16,000 | | | 1.250%, 12/12/2016 | | | 16,012 | |
| | 19,000 | | | 2.375%, 9/14/2017 | | | 19,398 | |
| | | | Branch Banking and Trust Company | | | | |
| | 16,000 | | | 0.667%, 12/1/2016f | | | 16,013 | |
| | | | Capital One Financial Corporation | | | | |
| | 12,000 | | | 6.150%, 9/1/2016 | | | 13,422 | |
| | | | Citigroup, Inc. | | | | |
| | 24,000 | | | 5.000%, 9/15/2014 | | | 24,684 | |
| | 29,000 | | | 5.500%, 2/15/2017 | | | 31,953 | |
| | 16,000 | | | 6.000%, 8/15/2017 | | | 18,236 | |
| | 16,000 | | | 8.500%, 5/22/2019 | | | 20,505 | |
| | | | CNA Financial Corporation | | | | |
| | 12,000 | | | 7.350%, 11/15/2019 | | | 14,547 | |
| | | | Cooperatieve Centrale Raiffeisen- Boerenleenbank BA | | | | |
| | 30,000 | | | 4.625%, 12/1/2023 | | | 30,211 | |
| | | | Credit Agricole SA | | | | |
| | 16,000 | | | 1.625%, 4/15/2016e | | | 16,099 | |
| | | | Credit Suisse AG | | | | |
| | 25,000 | | | 5.400%, 1/14/2020 | | | 27,783 | |
| | | | CyrusOne, LP | | | | |
| | 23,677 | | | 6.375%, 11/15/2022 | | | 24,506 | |
| | | | Denali Borrower, LLC | | | | |
| | 46,000 | | | 5.625%, 10/15/2020e | | | 45,598 | |
| | | | Developers Diversified Realty Corporation | | | | |
| | 12,000 | | | 7.875%, 9/1/2020 | | | 14,825 | |
| | | | Discover Financial Services | | | | |
| | 12,000 | | | 6.450%, 6/12/2017 | | | 13,598 | |
| | | | Fifth Third Bancorp | | | | |
| | 16,000 | | | 5.450%, 1/15/2017 | | | 17,584 | |
| | | | General Electric Capital Corporation | | | | |
| | 48,000 | | | 5.625%, 9/15/2017 | | | 54,605 | |
| | 6,000 | | | 1.625%, 4/2/2018 | | | 5,936 | |
| | | | Goldman Sachs Group, Inc. | | | | |
| | 19,000 | | | 6.250%, 9/1/2017 | | | 21,752 | |
| | 16,000 | | | 7.500%, 2/15/2019 | | | 19,487 | |
| | 16,000 | | | 5.375%, 3/15/2020 | | | 17,794 | |
| | | | Hartford Financial Services Group, Inc. | | | | |
| | 25,000 | | | 6.000%, 1/15/2019 | | | 28,673 | |
| | | | HCP, Inc. | | | | |
| | 6,000 | | | 3.750%, 2/1/2016 | | | 6,305 | |
| | 9,000 | | | 3.750%, 2/1/2019 | | | 9,348 | |
| | | | Health Care REIT, Inc. | | | | |
| | 8,000 | | | 4.700%, 9/15/2017 | | | 8,696 | |
| | | | HSBC Finance Corporation | | | | |
| | 20,000 | | | 6.676%, 1/15/2021 | | | 22,981 | |
| | | | HSBC USA, Inc. | | | | |
| | 4,000 | | | 1.625%, 1/16/2018 | | | 3,944 | |
| | | | Huntington National Bank | | | | |
| | 16,000 | | | 1.300%, 11/20/2016 | | | 16,002 | |
| | | | Icahn Enterprises, LP | | | | |
| | 23,677 | | | 8.000%, 1/15/2018 | | | 24,624 | |
| | | | ING Bank NV | | | | |
| | 10,000 | | | 3.750%, 3/7/2017e | | | 10,532 | |
| | | | ING Capital Funding Trust III | | | | |
| | 13,000 | | | 3.847%, 12/29/2049f,h | | | 12,951 | |
| | | | ING US, Inc. | | | | |
| | 13,000 | | | 2.900%, 2/15/2018 | | | 13,296 | |
| | | | International Lease Finance Corporation | | | | |
| | 8,000 | | | 2.193%, 6/15/2016f | | | 8,040 | |
| | 25,000 | | | 5.875%, 4/1/2019 | | | 26,625 | |
| | | | Intesa Sanpaolo SPA | | | | |
| | 12,000 | | | 3.625%, 8/12/2015e | | | 12,347 | |
| | 12,000 | | | 3.875%, 1/15/2019 | | | 11,931 | |
| | | | J.P. Morgan Chase & Company | | | | |
| | 18,000 | | | 3.450%, 3/1/2016 | | | 18,879 | |
| | 12,000 | | | 6.300%, 4/23/2019 | | | 14,163 | |
| | 26,000 | | | 7.900%, 4/29/2049h | | | 28,665 | |
| | | | KeyCorp | | | | |
| | 16,000 | | | 2.300%, 12/13/2018 | | | 15,884 | |
| | 5,000 | | | 5.100%, 3/24/2021 | | | 5,465 | |
| | | | Liberty Mutual Group, Inc. | | | | |
| | 3,000 | | | 5.000%, 6/1/2021e | | | 3,146 | |
| | | | Liberty Property, LP | | | | |
| | 14,000 | | | 5.500%, 12/15/2016 | | | 15,454 | |
| | | | Lloyds TSB Bank plc | | | | |
| | 15,000 | | | 6.500%, 9/14/2020e | | | 17,051 | |
| | | | Macquarie Bank, Ltd. | | | | |
| | 18,000 | | | 5.000%, 2/22/2017e | | | 19,520 | |
| | | | Mizuho Corporate Bank, Ltd. | | | | |
| | 16,000 | | | 1.550%, 10/17/2017e | | | 15,637 | |
| | | | Morgan Stanley | | | | |
| | 18,000 | | | 4.750%, 4/1/2014 | | | 18,143 | |
| | 19,000 | | | 1.750%, 2/25/2016 | | | 19,255 | |
| | 18,000 | | | 6.250%, 8/28/2017 | | | 20,596 | |
| | 8,000 | | | 4.875%, 11/1/2022 | | | 8,189 | |
| | | | Murray Street Investment Trust I | | | | |
| | 24,000 | | | 4.647%, 3/9/2017 | | | 25,845 | |
| | | | National City Corporation | | | | |
| | 11,000 | | | 6.875%, 5/15/2019 | | | 13,034 | |
| | | | Nomura Holdings, Inc. | | | | |
| | 18,000 | | | 2.000%, 9/13/2016 | | | 18,149 | |
| | | | Omega Healthcare Investors, Inc. | | | | |
| | 23,677 | | | 5.875%, 3/15/2024 | | | 23,914 | |
| | | | PNC Bank NA | | | | |
| | 26,000 | | | 1.150%, 11/1/2016 | | | 26,032 | |
| | | | Prologis, LP | | | | |
| | 14,000 | | | 6.625%, 5/15/2018 | | | 16,352 | |
| | | | Prudential Covered Trust | | | | |
| | 11,900 | | | 2.997%, 9/30/2015e | | | 12,269 | |
| | | | Realty Income Corporation | | | | |
| | 10,000 | | | 2.000%, 1/31/2018 | | | 9,794 | |
| | | | Regions Bank | | | | |
| | 20,000 | | | 7.500%, 5/15/2018 | | | 23,666 | |
| | | | Reinsurance Group of America, Inc. | | | | |
| | 20,000 | | | 5.625%, 3/15/2017 | | | 22,048 | |
| | | | Royal Bank of Scotland Group plc | | | | |
| | 19,000 | | | 5.050%, 1/8/2015 | | | 19,562 | |
| | | | Santander US Debt SAU | | | | |
| | 18,000 | | | 3.781%, 10/7/2015e | | | 18,548 | |
| | | | SLM Corporation | | | | |
| | 14,000 | | | 6.250%, 1/25/2016 | | | 15,120 | |
| | | | Svenska Handelsbanken AB | | | | |
| | 12,000 | | | 3.125%, 7/12/2016 | | | 12,551 | |
| | | | Swedbank Hypotek AB | | | | |
| | 15,000 | | | 1.375%, 3/28/2018e | | | 14,654 | |
| | | | Swiss RE Capital I, LP | | | | |
| | 16,000 | | | 6.854%, 5/29/2049e,h | | | 16,912 | |
The accompanying Notes to Financial Statements are an integral part of this schedule.
18
Growth and Income Plus Fund
Schedule of Investments as of December 31, 2013
| | | | | | | | |
Principal Amount | | | Long-Term Fixed Income (15.7%) | | Value | |
| Financials (3.2%) - continued | | | | |
| | | | Ventas Realty, LP | | | | |
| $ | 24,000 | | | 1.550%, 9/26/2016 | | $ | 24,170 | |
| | | | Wells Fargo & Company | | | | |
| | 18,000 | | | 1.250%, 7/20/2016 | | | 18,134 | |
| | 26,000 | | | 2.150%, 1/15/2019 | | | 25,919 | |
| | | | Westpac Banking Corporation | | | | |
| | 16,000 | | | 0.668%, 11/25/2016f | | | 16,023 | |
| | | | XLIT, Ltd. | | | | |
| | 16,000 | | | 2.300%, 12/15/2018 | | | 15,715 | |
| | | | | | | | |
| | | | Total | | | 1,642,704 | |
| | | | | | | | |
| |
| Mortgage-Backed Securities (2.4%) | | | | |
| | | | Federal National Mortgage Association Conventional 15- Yr. Pass Through | | | | |
| | 75,000 | | | 3.500%, 1/1/2029c | | | 78,431 | |
| | | | Federal National Mortgage Association Conventional 30- Yr. Pass Through | | | | |
| | 325,000 | | | 3.500%, 1/1/2044c | | | 322,842 | |
| | 325,000 | | | 4.000%, 1/1/2044c | | | 334,547 | |
| | 355,000 | | | 4.500%, 1/1/2044c | | | 376,147 | |
| | | | Vericrest Opportunity Loan Transferee | | | | |
| | 150,000 | | | 3.625%, 3/25/2054g | | | 149,355 | |
| | | | | | | | |
| | | | Total | | | 1,261,322 | |
| | | | | | | | |
| |
| Technology (0.4%) | | | | |
| | | | Alliance Data Systems Corporation | | | | |
| | 23,677 | | | 6.375%, 4/1/2020e | | | 24,802 | |
| | | | BMC Software Finance, Inc. | | | | |
| | 23,677 | | | 8.125%, 7/15/2021e | | | 24,387 | |
| | | | CommScope, Inc. | | | | |
| | 21,000 | | | 8.250%, 1/15/2019e | | | 23,021 | |
| | | | Computer Sciences Corporation | | | | |
| | 13,000 | | | 2.500%, 9/15/2015 | | | 13,269 | |
| | | | EMC Corporation | | | | |
| | 13,000 | | | 1.875%, 6/1/2018 | | | 12,852 | |
| | | | First Data Corporation | | | | |
| | 23,677 | | | 7.375%, 6/15/2019e | | | 25,275 | |
| | | | Freescale Semiconductor, Inc. | | | | |
| | 30,000 | | | 6.000%, 1/15/2022e | | | 30,375 | |
| | | | Hewlett-Packard Company | | | | |
| | 12,000 | | | 3.300%, 12/9/2016 | | | 12,560 | |
| | | | Iron Mountain, Inc. | | | | |
| | 23,677 | | | 6.000%, 8/15/2023 | | | 24,269 | |
| | | | Oracle Corporation | | | | |
| | 13,000 | | | 1.200%, 10/15/2017 | | | 12,793 | |
| | | | Tyco Electronics Group SA | | | | |
| | 13,000 | | | 6.550%, 10/1/2017 | | | 14,877 | |
| | | | Xerox Corporation | | | | |
| | 13,000 | | | 7.200%, 4/1/2016 | | | 14,582 | |
| | | | | | | | |
| | | | Total | | | 233,062 | |
| | | | | | | | |
| |
| Transportation (0.3%) | | | | |
| | | | Avis Budget Car Rental, LLC | | | | |
| | 23,677 | | | 8.250%, 1/15/2019 | | | 25,808 | |
| | | | Continental Airlines, Inc. | | | | |
| | 22,477 | | | 6.250%, 4/11/2020 | | | 23,882 | |
| | | | Delta Air Lines, Inc. | | | | |
| | 9,291 | | | 4.950%, 5/23/2019 | | | 10,081 | |
| | 7,440 | | | 4.750%, 5/7/2020 | | | 7,960 | |
| | | | ERAC USA Finance, LLC | | | | |
| | 12,000 | | | 1.400%, 4/15/2016e | | | 12,009 | |
| | | | Hertz Corporation | | | | |
| | 30,000 | | | 6.750%, 4/15/2019 | | | 32,325 | |
| | | | Kansas City Southern de Mexico SA de CV | | | | |
| | 13,000 | | | 0.937%, 10/28/2016f | | | 13,004 | |
| | | | United Air Lines, Inc. | | | | |
| | 8,326 | | | 10.400%, 11/1/2016 | | | 9,450 | |
| | | | | | | | |
| | | | Total | | | 134,519 | |
| | | | | | | | |
| |
| U.S. Government and Agencies (0.3%) | | | | |
| | | | U.S. Treasury Notes | | | | |
| | 170,000 | | | 0.250%, 9/30/2015 | | | 169,847 | |
| | | | | | | | |
| | | | Total | | | 169,847 | |
| | | | | | | | |
| |
| Utilities (0.7%) | | | | |
| | | | Access Midstream Partners, LP | | | | |
| | 40,000 | | | 4.875%, 5/15/2023 | | | 38,600 | |
| | | | AES Corporation | | | | |
| | 23,677 | | | 7.375%, 7/1/2021 | | | 26,696 | |
| | | | Atlas Pipeline Partners, LP | | | | |
| | 30,000 | | | 4.750%, 11/15/2021e | | | 27,450 | |
| | | | Buckeye Partners, LP | | | | |
| | 16,000 | | | 2.650%, 11/15/2018 | | | 15,765 | |
| | | | Constellation Energy Group, Inc. | | | | |
| | 13,000 | | | 5.150%, 12/1/2020 | | | 13,833 | |
| | | | Dayton Power and Light Company | | | | |
| | 13,000 | | | 1.875%, 9/15/2016e | | | 13,106 | |
| | | | DCP Midstream Operating, LP | | | | |
| | 8,000 | | | 2.500%, 12/1/2017 | | | 7,966 | |
| | | | Enel Finance International NV | | | | |
| | 12,000 | | | 3.875%, 10/7/2014e | | | 12,260 | |
| | 8,000 | | | 5.125%, 10/7/2019e | | | 8,541 | |
| | | | Energy Transfer Partners, LP | | | | |
| | 17,000 | | | 4.650%, 6/1/2021 | | | 17,487 | |
| | | | Enterprise Products Operating, LLC | | | | |
| | 12,000 | | | 1.250%, 8/13/2015 | | | 12,080 | |
| | | | Korea Western Power Company, Ltd. | | | | |
| | 16,000 | | | 2.875%, 10/10/2018 e | | | 15,907 | |
| | | | MidAmerican Energy Holdings Company | | | | |
| | 15,000 | | | 1.100%, 5/15/2017e | | | 14,919 | |
| | 18,000 | | | 5.750%, 4/1/2018 | | | 20,547 | |
| | | | NiSource Finance Corporation | | | | |
| | 19,000 | | | 6.400%, 3/15/2018 | | | 21,865 | |
| | | | NRG Energy, Inc. | | | | |
| | 23,677 | | | 6.625%, 3/15/2023 | | | 23,855 | |
| | | | ONEOK Partners, LP | | | | |
| | 24,000 | | | 6.150%, 10/1/2016 | | | 26,951 | |
| | 8,000 | | | 2.000%, 10/1/2017 | | | 7,961 | |
| | 8,000 | | | 3.200%, 9/15/2018 | | | 8,180 | |
| | | | Pacific Gas & Electric Company | | | | |
| | 8,000 | | | 5.625%, 11/30/2017 | | | 9,064 | |
The accompanying Notes to Financial Statements are an integral part of this schedule.
19
Growth and Income Plus Fund
Schedule of Investments as of December 31, 2013
| | | | | | | | |
Principal
Amount | | | Long-Term Fixed Income (15.7%) | | Value | |
| Utilities (0.7%) - continued | | | | |
| | | | PPL Capital Funding, Inc. | | | | |
| $ | 20,000 | | | 1.900%, 6/1/2018 | | $ | 19,529 | |
| | | | | | | | |
| | | | Total | | | 362,562 | |
| | | | | | | | |
| | | | Total Long-Term Fixed Income
(cost $8,146,657) | | | 8,219,386 | |
| | | | | | | | |
| | |
Shares or
Principal
Amount | | | Short-Term Investments (5.7%)i | | | |
| | | | Federal Home Loan Bank Discount Notes | | | | |
| | 100,000 | | | 0.120%, 5/28/2014j | | | 99,951 | |
| | | | Thrivent Cash Management Trust | | | | |
| | 2,877,246 | | | 0.060% | | | 2,877,246 | |
| | | | | | | | |
| | | | Total Short-Term Investments (at amortized cost) | | | 2,977,197 | |
| | | | | | | | |
| | | | Total Investments
(cost $49,271,695) 102.2% | | $ | 53,295,157 | |
| | | | | | | | |
| | | | Other Assets and Liabilities, Net (2.2%) | | | (1,164,062 | ) |
| | | | | | | | |
| | | | Total Net Assets 100.0% | | $ | 52,131,095 | |
| | | | | | | | |
| a | The stated interest rate represents the weighted average of all contracts within the bank loan facility. |
| b | All or a portion of the loan is unfunded. |
| c | Denotes investments purchased on a when-issued or delayed delivery basis. |
| d | Non-income producing security. |
| e | Denotes securities sold under Rule 144A of the Securities Act of 1933, which exempts them from registration. These securities have been deemed liquid and may be resold to other dealers in the program or to other qualified institutional buyers. As of December 31, 2013, the value of these investments was $1,241,501 or 2.4% of total net assets. |
| f | Denotes variable rate securities. Variable rate securities are securities whose yields vary with a designated market index or market rate. The rate shown is as of December 31, 2013. |
| g | Denotes restricted securities. Restricted securities are investment securities which have been deemed illiquid and cannot be offered for public sale without first being registered under the Securities Act of 1933. The following table indicates the acquisition date and cost of restricted securities Growth and Income Plus Fund owned as of December 31, 2013. |
| | | | | | | | |
Security | | Acquisition
Date | | | Cost | |
JBS Finance II, Ltd., 1/29/2018 | | | 8/19/2013 | | | $ | 24,688 | |
Vericrest Opportunity Loan Transferee, 3/25/2054 | | | 12/11/2013 | | | | 149,350 | |
| h | Denotes perpetual securities. Perpetual securities pay an indefinite stream of interest, but may be called by the issuer at an earlier date. |
| i | The interest rate shown reflects the yield, coupon rate or the discount rate at the date of purchase. |
| j | At December 31, 2013, $99,951 of investments were held on deposit with the counterparty and pledged as the initial margin deposit for open futures contracts. |
Definitions:
| | | | |
| ETF | | - | | Exchange Traded Fund. |
| REIT | | - | | Real Estate Investment Trust is a company that buys, develops, manages and/or sells real estate assets. |
Unrealized Appreciation (Depreciation)
Gross unrealized appreciation and depreciation of investments, based on cost for federal income tax purposes, were as follows:
| | | | |
Gross unrealized appreciation | | $ | 4,350,880 | |
Gross unrealized depreciation | | | (331,648 | ) |
| | | | |
Net unrealized appreciation (depreciation) | | $ | 4,019,232 | |
| |
Cost for federal income tax purposes | | $ | 49,275,925 | |
The accompanying Notes to Financial Statements are an integral part of this schedule.
20
Growth and Income Plus Fund
Schedule of Investments as of December 31, 2013
Fair Valuation Measurements
The following table is a summary of the inputs used, as of December 31, 2013, in valuing Growth and Income Plus Fund’s assets carried at fair value.
| | | | | | | | | | | | | | | | |
Investments in Securities | | Total | | | Level 1 | | | Level 2 | | | Level 3 | |
Bank Loans | | | | | | | | | | | | | | | | |
Basic Materials | | | 184,419 | | | | — | | | | 184,419 | | | | — | |
Capital Goods | | | 319,735 | | | | — | | | | 319,735 | | | | — | |
Communications Services | | | 1,587,937 | | | | — | | | | 1,587,937 | | | | — | |
Consumer Cyclical | | | 860,407 | | | | — | | | | 860,407 | | | | — | |
Consumer Non-Cyclical | | | 658,572 | | | | — | | | | 658,572 | | | | — | |
Energy | | | 159,567 | | | | — | | | | 159,567 | | | | — | |
Financials | | | 227,900 | | | | — | | | | 227,900 | | | | — | |
Technology | | | 322,669 | | | | — | | | | 322,669 | | | | — | |
Transportation | | | 184,527 | | | | — | | | | 184,527 | | | | — | |
Utilities | | | 156,909 | | | | — | | | | 156,909 | | | | — | |
Common Stock | | | | | | | | | | | | | | | | |
Consumer Discretionary | | | 4,263,377 | | | | 4,263,377 | | | | — | | | | — | |
Consumer Staples | | | 3,324,911 | | | | 3,324,911 | | | | — | | | | — | |
Energy | | | 4,663,754 | | | | 4,663,754 | | | | — | | | | — | |
Financials | | | 8,311,288 | | | | 8,311,288 | | | | — | | | | — | |
Health Care | | | 4,426,852 | | | | 4,426,852 | | | | — | | | | — | |
Industrials | | | 4,699,538 | | | | 4,699,538 | | | | — | | | | — | |
Information Technology | | | 4,370,167 | | | | 4,370,167 | | | | — | | | | — | |
Materials | | | 1,239,233 | | | | 1,239,233 | | | | — | | | | — | |
Telecommunications Services | | | 926,879 | | | | 926,879 | | | | — | | | | — | |
Utilities | | | 1,209,933 | | | | 1,209,933 | | | | — | | | | — | |
Long-Term Fixed Income | | | | | | | | | | | | | | | | |
Asset-Backed Securities | | | 65,643 | | | | — | | | | 65,643 | | | | — | |
Basic Materials | | | 231,273 | | | | — | | | | 231,273 | | | | — | |
Capital Goods | | | 239,551 | | | | — | | | | 239,551 | | | | — | |
Collateralized Mortgage Obligations | | | 1,610,796 | | | | — | | | | 1,610,796 | | | | — | |
Communications Services | | | 674,278 | | | | — | | | | 674,278 | | | | — | |
Consumer Cyclical | | | 381,262 | | | | — | | | | 381,262 | | | | — | |
Consumer Non-Cyclical | | | 729,434 | | | | — | | | | 729,434 | | | | — | |
Energy | | | 483,133 | | | | — | | | | 483,133 | | | | — | |
Financials | | | 1,642,704 | | | | — | | | | 1,642,704 | | | | — | |
Mortgage-Backed Securities | | | 1,261,322 | | | | — | | | | 1,261,322 | | | | — | |
Technology | | | 233,062 | | | | — | | | | 233,062 | | | | — | |
Transportation | | | 134,519 | | | | — | | | | 134,519 | | | | — | |
U.S. Government and Agencies | | | 169,847 | | | | — | | | | 169,847 | | | | — | |
Utilities | | | 362,562 | | | | — | | | | 362,562 | | | | — | |
Short-Term Investments | | | 2,977,197 | | | | 2,877,246 | | | | 99,951 | | | | — | |
| | | | | | | | | | | | | | | | |
Total | | $ | 53,295,157 | | | $ | 40,313,178 | | | $ | 12,981,979 | | | $ | — | |
| | | | | | | | | | | | | | | | |
| | | | |
Other Financial Instruments | | Total | | | Level 1 | | | Level 2 | | | Level 3 | |
Asset Derivatives | | | | | | | | | | | | | | | | |
Futures Contracts | | | 37,213 | | | | 37,213 | | | | — | | | | — | |
| | | | | | | | | | | | | | | | |
Total Asset Derivatives | | $ | 37,213 | | | $ | 37,213 | | | $ | — | | | $ | — | |
| | | | | | | | | | | | | | | | |
There were no significant transfers between Levels during the period ended December 31, 2013. Transfers between Levels are identified as of the end of the period.
| | | | | | | | | | | | | | | | | | | | |
Futures Contracts | | Number of
Contracts
Long/(Short) | | | Expiration
Date | | | Notional
Principal
Amount | | | Value | | | Unrealized
Gain/(Loss) | |
S&P 500 Index Mini-Futures | | | 12 | | | | March 2014 | | | $ | 1,067,448 | | | $ | 1,104,661 | | | $ | 37,213 | |
Total Futures Contracts | | | | | | | | | | | | | | | | | | $ | 37,213 | |
The accompanying Notes to Financial Statements are an integral part of this schedule.
21
Growth and Income Plus Fund
Schedule of Investments as of December 31, 2013
The following table summarizes the fair value and Statement of Assets and Liabilities location, as of December 31, 2013, for Growth and Income Plus Fund’s investments in financial derivative instruments by primary risk exposure as discussed under item (2) Significant Accounting Policies of the Notes to Financial Statements.
| | | | | | |
Derivatives by risk category | | Statement of Assets and Liabilities Location | | Fair Value | |
Asset Derivatives | | | | | | |
Equity Contracts | | | | | | |
Futures* | | Net Assets - Net unrealized appreciation/(depreciation) on Futures contracts | | $ | 37,213 | |
Total Equity Contracts | | | | | 37,213 | |
| | | | | | |
Total Asset Derivatives | | | | $ | 37,213 | |
| | | | | | |
| * | Includes cumulative appreciation/depreciation of futures contracts as reported in the Schedule of Investments. Only current day’s variation margin is reported within the Statement of Assets and Liabilities. |
The following table summarizes the net realized gains/(losses) and Statement of Operations location, for the period ended December 31, 2013, for Growth and Income Plus Fund’s investments in financial derivative instruments by primary risk exposure.
| | | | | | |
Derivatives by risk category | | Statement of Operations Location | | Realized Gains/(Losses)
recognized in Income | |
| Equity Contracts | | | | | | |
Futures | | Net realized gains/(losses) on Futures contracts | | | 423,538 | |
Total Equity Contracts | | | | | 423,538 | |
| | | | | | |
Total | | | | $ | 423,538 | |
| | | | | | |
The following table summarizes the change in net unrealized appreciation/(depreciation) and Statement of Operations location, for the period ended December 31, 2013, for Growth and Income Plus Fund’s investments in financial derivative instruments by primary risk exposure.
| | | | | | |
Derivatives by risk category | | Statement of Operations Location | | Change in unrealized
appreciation/(depreciation)
recognized in Income | |
| Equity Contracts | | | | | | |
Futures | | Change in net unrealized appreciation/(depreciation) on Futures contracts | | | 41,593 | |
Total Equity Contracts | | | | | 41,593 | |
| | | | | | |
Total | | | | $ | 41,593 | |
| | | | | | |
The following table presents Growth and Income Plus Fund’s average volume of derivative activity during the period ended December 31, 2013.
| | | | | | | | |
Derivative Risk Category | | Futures
(Notional)* | | | Futures
(Percentage of
Average Net Assets) | |
Equity Contracts | | $ | 2,503,850 | | | | 4.1 | % |
| * | Notional amount represents long or short, or both, derivative positions held by the Fund. |
Investment in Affiliates
Affiliated issuers, as defined under the Investment Company Act of 1940, include those in which the Fund’s holdings of an issuer represent 5% or more of the outstanding voting securities of an issuer, or any affiliated mutual fund.
A summary of transactions for the fiscal year to date, in Growth and Income Plus Fund, is as follows:
| | | | | | | | | | | | | | | | | | | | | | | | |
Fund | | Value
December 31, 2012 | | | Gross
Purchases | | | Gross Sales | | | Shares Held at
December 31, 2013 | | | Value
December 31, 2013 | | | Income Earned
January 1, 2013 -
December 31, 2013 | |
Cash Management Trust- Short Term Investment | | $ | 2,942 | | | $ | 46,978,236 | | | $ | 44,103,932 | | | | 2,877,246 | | | $ | 2,877,246 | | | $ | 2,743 | |
Total Value and Income Earned | | | 2,942 | | | | | | | | | | | | | | | | 2,877,246 | | | | 2,743 | |
The accompanying Notes to Financial Statements are an integral part of this schedule.
22
Diversified Income Plus Fund
Schedule of Investments as of December 31, 2013
| | | | | | | | |
Principal Amount | | | Bank Loans (12.4%)a | | Value | |
| Basic Materials (0.8%) | | | | |
| | | | Alpha Natural Resources, Inc., Term Loan | | | | |
| $ | 1,167,060 | | | 3.500%, 5/22/2020 | | $ | 1,146,053 | |
| | | | Fortescue Metals Group, Ltd., Term Loan | | | | |
| | 1,534,022 | | | 4.250%, 6/30/2019 | | | 1,552,722 | |
| | | | Ineos Group Holdings, Ltd., Term Loan | | | | |
| | 1,577,576 | | | 4.000%, 5/4/2018 | | | 1,581,520 | |
| | | | | | | | |
| | | | Total | | | 4,280,295 | |
| | | | | | | | |
| |
| Capital Goods (0.6%) | | | | |
| | | | ADS Waste Holdings, Term Loan | | | | |
| | 891,000 | | | 4.250%, 10/9/2019 | | | 894,956 | |
| | | | Berry Plastics Group, Inc., Term Loan | | | | |
| | 893,250 | | | 3.500%, 2/8/2020 | | | 889,525 | |
| | | | Rexnord, LLC, Term Loan | | | | |
| | 897,750 | | | 4.000%, 8/21/2020 | | | 899,618 | |
| | | | Silver II Borrower, Term Loan | | | | |
| | 881,977 | | | 4.000%, 12/13/2019 | | | 882,894 | |
| | | | | | | | |
| | | | Total | | | 3,566,993 | |
| | | | | | | | |
| |
| Communications Services (3.5%) | | | | |
| | | | Charter Communications Operating, LLC, Term Loan | | | | |
| | 895,500 | | | 3.000%, 12/31/2020 | | | 887,664 | |
| | | | Cincinnati Bell, Inc., Term Loan | | | | |
| | 448,875 | | | 4.000%, 9/10/2020 | | | 449,436 | |
| | | | Clear Channel Communications, Inc., Term Loan | | | | |
| | 12,356 | | | 3.819%, 1/29/2016 | | | 11,952 | |
| | 949,468 | | | 6.919%, 1/30/2019 | | | 905,555 | |
| | 228,177 | | | 7.669%, 7/30/2019 | | | 224,613 | |
| | | | Cumulus Media Holdings, Inc., Term Loan | | | | |
| | 686,766 | | | 0.000%, 12/23/2020b,c | | | 690,199 | |
| | | | Fairpoint Communications, Term Loan | | | | |
| | 89,549 | | | 7.500%, 2/14/2019b,c | | | 92,437 | |
| | | | Grande Communications Networks, LLC, Term Loan | | | | |
| | 1,194,000 | | | 4.500%, 5/29/2020 | | | 1,191,516 | |
| | | | Hargray Communications Group, Inc., Term Loan | | | | |
| | 895,500 | | | 4.750%, 6/26/2019 | | | 899,978 | |
| | | | Integra Telecom Holdings, Inc., Term Loan | | | | |
| | 893,250 | | | 5.250%, 2/22/2019 | | | 904,040 | |
| | | | Level 3 Communications, Inc., Term Loan | | | | |
| | 1,450,000 | | | 4.000%, 1/15/2020 | | | 1,459,976 | |
| | | | LTS Buyer, LLC, Term Loan | | | | |
| | 982,843 | | | 4.500%, 4/13/2020 | | | 986,224 | |
| | | | McGraw-Hill Global Education Holdings, LLC, Term Loan | | | | |
| | 799,794 | | | 9.000%, 3/22/2019 | | | 813,455 | |
| | | | NEP Broadcasting, LLC, Term Loan | | | | |
| | 1,188,000 | | | 4.750%, 1/22/2020 | | | 1,191,267 | |
| | | | Puerto Rico Cable Acquisition Company, Inc., Term Loan | | | | |
| | 980,693 | | | 5.500%, 7/31/2018 | | | 981,105 | |
| | | | RCN Telecom Services, LLC, Term Loan | | | | |
| | 878,842 | | | 4.500%, 3/1/2020 | | | 885,117 | |
| | | | TNS, Inc., Term Loan | | | | |
| | 850,000 | | | 5.000%, 2/14/2020 | | | 853,986 | |
| | | | Univision Communications, Inc., Term Loan | | | | |
| | 794,000 | | | 4.500%, 2/28/2020 | | | 797,478 | |
| | 149,248 | | | 4.500%, 3/1/2020 | | | 150,048 | |
| | 634,766 | | | 4.500%, 3/1/2020 | | | 637,547 | |
| | | | Virgin Media Investment Holdings, Ltd., Term Loan | | | | |
| | 900,000 | | | 3.500%, 6/8/2020 | | | 901,350 | |
| | | | Visant Corporation, Term Loan | | | | |
| | 1,517,699 | | | 5.250%, 12/22/2016 | | | 1,493,674 | |
| | | | WideOpenWest Finance, LLC, Term Loan | | | | |
| | 853,824 | | | 4.750%, 4/1/2019 | | | 857,239 | |
| | | | WMG Acquisition Corporation, Term Loan | | | | |
| | 897,750 | | | 3.750%, 7/1/2020 | | | 897,077 | |
| | | | Zayo Group, LLC, Term Loan | | | | |
| | 890,957 | | | 4.000%, 7/2/2019 | | | 891,162 | |
| | | | | | | | |
| | | | Total | | | 20,054,095 | |
| | | | | | | | |
| |
| Consumer Cyclical (2.8%) | | | | |
| | | | Bally Technologies, Inc., Term Loan | | | | |
| | 1,052,362 | | | 4.250%, 11/25/2020b,c | | | 1,059,266 | |
| | | | Booz Allen Hamilton, Inc., Term Loan | | | | |
| | 447,733 | | | 3.750%, 7/31/2019 | | | 448,772 | |
| | | | Burlington Coat Factory Warehouse Corporation, Term Loan | | | | |
| | 964,581 | | | 4.250%, 2/23/2017 | | | 973,021 | |
| | | | Caesars Entertainment Resot Properties, LLC, Term Loan | | | | |
| | 860,000 | | | 7.000%, 10/11/2020b,c | | | 854,625 | |
| | | | Cenveo Corporation, Term Loan | | | | |
| | 549,875 | | | 6.250%, 2/13/2017 | | | 552,168 | |
| | | | Ceridian Corporation, Term Loan | | | | |
| | 900,000 | | | 4.415%, 5/9/2017 | | | 902,529 | |
| | | | Chrysler Group, LLC, Term Loan | | | | |
| | 744,275 | | | 3.875%, 5/24/2017 | | | 748,718 | |
| | | | Golden Nugget, Inc., Delayed Draw | | | | |
| | 157,500 | | | 5.500%, 11/21/2019 | | | 159,666 | |
| | | | Golden Nugget, Inc., Term Loan | | | | |
| | 367,500 | | | 5.500%, 11/21/2019 | | | 372,553 | |
| | | | Hilton Worldwide Finance, LLC, Term Loan | | | | |
| | 552,632 | | | 4.000%, 10/26/2020 | | | 556,776 | |
| | | | J.C. Penney Corporation, Inc., Term Loan | | | | |
| | 895,500 | | | 6.000%, 5/22/2018 | | | 874,904 | |
| | | | Las Vegas Sands, LLC, Term Loan | | | | |
| | 1,000,000 | | | 0.000%, 12/17/2020b,c | | | 998,650 | |
| | | | Marina District Finance Company, Inc., Term Loan | | | | |
| | 1,050,000 | | | 0.000%, 8/15/2018b,c | | | 1,053,287 | |
The accompanying Notes to Financial Statements are an integral part of this schedule.
23
Diversified Income Plus Fund
Schedule of Investments as of December 31, 2013
| | | | | | | | |
Principal
Amount | | | Bank Loans (12.4%)a | | Value | |
| Consumer Cyclical (2.8%) - continued | | | | |
| | | | MGM Resorts International, Term Loan | | | | |
| $ | 358,191 | | | 3.500%, 12/20/2019 | | $ | 358,864 | |
| | | | Mohegan Tribal Gaming Authority, Term Loan | | | | |
| | 1,050,000 | | | 5.500%, 11/19/2019 | | | 1,065,099 | |
| | | | Pinnacle Entertainment, Inc., Term Loan | | | | |
| | 895,500 | | | 3.750%, 8/13/2020 | | | 898,634 | |
| | | | ROC Finance, LLC, Term Loan | | | | |
| | 897,750 | | | 5.000%, 6/20/2019 | | | 858,195 | |
| | | | Scientific Games International, Inc., Term Loan | | | | |
| | 900,000 | | | 4.250%, 10/18/2020 | | | 900,225 | |
| | | | Seminole Indian Tribe of Florida, Term Loan | | | | |
| | 852,750 | | | 3.000%, 4/29/2020 | | | 850,882 | |
| | | | Toys R Us, Inc., Term Loan | | | | |
| | 1,532,875 | | | 5.250%, 5/25/2018 | | | 1,290,497 | |
| | | | | | | | |
| | | | Total | | | 15,777,331 | |
| | | | | | | | |
| |
| Consumer Non-Cyclical (1.4%) | | | | |
| | | | Albertsons, Inc., Term Loan | | | | |
| | 1,245,124 | | | 4.750%, 3/21/2019b,c | | | 1,250,827 | |
| | | | CHS/Community Health Systems, Inc., Term Loan | | | | |
| | 800,000 | | | 3.737%, 1/25/2017 | | | 805,872 | |
| | | | JBS USA, LLC, Term Loan | | | | |
| | 1,496,250 | | | 3.750%, 9/11/2020 | | | 1,491,267 | |
| | | | McJunkin Red Man Corporation, Term Loan | | | | |
| | 1,047,375 | | | 5.000%, 11/8/2019 | | | 1,060,467 | |
| | | | Roundy’s Supermarkets, Inc., Term Loan | | | | |
| | 971,277 | | | 5.750%, 2/13/2019 | | | 970,219 | |
| | | | Supervalu, Inc., Term Loan | | | | |
| | 1,187,687 | | | 5.000%, 3/21/2019 | | | 1,197,889 | |
| | | | Van Wagner Communications, LLC, Term Loan | | | | |
| | 935,550 | | | 6.250%, 8/3/2018 | | | 946,075 | |
| | | | | | | | |
| | | | Total | | | 7,722,616 | |
| | | | | | | | |
| |
| Energy (0.8%) | | | | |
| | | | Arch Coal, Inc., Term Loan | | | | |
| | 1,420,018 | | | 6.250%, 5/16/2018 | | | 1,399,016 | |
| | | | Chesapeake Energy Corporation, Term Loan | | | | |
| | 1,615,000 | | | 5.750%, 12/2/2017 | | | 1,647,300 | |
| | | | Offshore Group Investment, Ltd., Term Loan | | | | |
| | 446,625 | | | 5.750%, 3/28/2019 | | | 451,511 | |
| | | | Pacific Drilling SA, Term Loan | | | | |
| | 895,500 | | | 4.500%, 6/3/2018 | | | 905,019 | |
| | | | | | | | |
| | | | Total | | | 4,402,846 | |
| | | | | | | | |
| |
| Financials (0.5%) | | | | |
| | | | Harland Clarke Holdings Corporation, Term Loan | | | | |
| | 888,750 | | | 7.000%, 5/22/2018 | | | 894,145 | |
| | | | Intelsat Jackson Holdings SA, Term Loan | | | | |
| | 948,775 | | | 3.750%, 6/30/2019 | | | 955,151 | |
| | | | WaveDivision Holdings, LLC, Term Loan | | | | |
| | 891,000 | | | 4.000%, 10/12/2019 | | | 894,341 | |
| | | | | | | | |
| | | | Total | | | 2,743,637 | |
| | | | | | | | |
| |
| Technology (0.7%) | | | | |
| | | | BMC Software, Inc., Term Loan | | | | |
| | 900,000 | | | 5.000%, 9/10/2020 | | | 904,221 | |
| | | | First Data Corporation Extended, Term Loan | | | | |
| | 1,600,000 | | | 4.166%, 3/23/2018 | | | 1,601,104 | |
| | | | Freescale Semiconductor, Inc., Term Loan | | | | |
| | 893,250 | | | 5.000%, 3/1/2020 | | | 901,700 | |
| | | | Infor US, Inc., Term Loan | | | | |
| | 563,938 | | | 5.250%, 4/5/2018 | | | 565,230 | |
| | 265,000 | | | 0.000%, 6/3/2020b,c | | | 264,393 | |
| | | | | | | | |
| | | | Total | | | 4,236,648 | |
| | | | | | | | |
| |
| Transportation (0.8%) | | | | |
| | | | American Airlines, Inc., Term Loan | | | | |
| | 1,417,875 | | | 3.750%, 6/27/2019 | | | 1,424,965 | |
| | | | American Petroleum Tankers Parent, LLC, Term Loan | | | | |
| | 833,476 | | | 4.750%, 10/2/2019 | | | 833,476 | |
| | | | Delta Air Lines, Inc., Term Loan | | | | |
| | 1,384,836 | | | 3.500%, 4/20/2017 | | | 1,389,046 | |
| | | | U.S. Airways, Inc., Term Loan | | | | |
| | 900,000 | | | 4.000%, 5/23/2019 | | | 905,175 | |
| | | | | | | | |
| | | | Total | | | 4,552,662 | |
| | | | | | | | |
| |
| Utilities (0.5%) | | | | |
| | | | Calpine Corporation, Term Loan | | | | |
| | 789,848 | | | 4.000%, 4/1/2018 | | | 794,405 | |
| | 175,000 | | | 4.000%, 10/31/2020 | | | 175,938 | |
| | | | Intergen NV, Term Loan | | | | |
| | 895,500 | | | 5.500%, 6/15/2020 | | | 902,216 | |
| | | | NGPL PipeCo, LLC, Term Loan | | | | |
| | 741,851 | | | 6.750%, 9/15/2017 | | | 689,766 | |
| | | | | | | | |
| | | | Total | | | 2,562,325 | |
| | | | | | | | |
| | | | Total Bank Loans
(cost $69,710,091) | | | 69,899,448 | |
| | | | | | | | |
| | |
Principal
Amount | | | Long-Term Fixed Income (45.3%) | | | |
| Asset-Backed Securities (1.4%) | | | | |
| | | | Asset Backed Securities Corporation Home Equity Loan Trust | | | | |
| | 1,230,875 | | | 0.305%, 7/25/2036d | | | 1,093,919 | |
| | 314,044 | | | 0.325%, 11/25/2036d | | | 241,049 | |
| | | | Countrywide Asset-Backed Certificates | | | | |
| | 1,120,710 | | | 5.530%, 4/25/2047 | | | 1,025,680 | |
| | | | GSAA Home Equity Trust | | | | |
| | 1,552,381 | | | 0.435%, 7/25/2037d | | | 1,318,023 | |
| | | | J.P. Morgan Mortgage Trust | | | | |
| | 1,024,031 | | | 2.716%, 2/25/2036 | | | 914,883 | |
| | | | Renaissance Home Equity Loan Trust | | | | |
| | 747,882 | | | 5.746%, 5/25/2036 | | | 556,429 | |
The accompanying Notes to Financial Statements are an integral part of this schedule.
24
Diversified Income Plus Fund
Schedule of Investments as of December 31, 2013
| | | | | | | | |
Principal
Amount | | | Long-Term Fixed Income (45.3%) | | Value | |
| | Asset-Backed Securities (1.4%) - continued | | | | |
| $ | 1,000,000 | | | 6.011%, 5/25/2036 | | $ | 700,428 | |
| | 1,450,000 | | | 5.797%, 8/25/2036 | | | 899,915 | |
| | | | Residential Asset Mortgage Products Trust | | | | |
| | 947,387 | | | 5.991%, 3/25/2033e | | | 909,611 | |
| | | | | | | | |
| | | | Total | | | 7,659,937 | |
| | | | | | | | |
| |
| | Basic Materials (0.9%) | | | | |
| | | | ArcelorMittal | | | | |
| | 860,000 | | | 6.000%, 3/1/2021 | | | 911,600 | |
| | | | BHP Billiton Finance USA, Ltd. | | | | |
| | 220,000 | | | 2.050%, 9/30/2018 | | | 219,973 | |
| | | | Dow Chemical Company | | | | |
| | 106,000 | | | 8.550%, 5/15/2019 | | | 136,866 | |
| | | | FMG Resources Pty. Ltd. | | | | |
| | 500,000 | | | 6.875%, 2/1/2018f | | | 526,250 | |
| | | | Freeport-McMoRan Copper & Gold, Inc. | | | | |
| | 125,000 | | | 2.375%, 3/15/2018 | | | 124,695 | |
| | | | Hexion US Finance Corporation/Hexion Nova Scotia Finance ULC | | | | |
| | 860,000 | | | 8.875%, 2/1/2018 | | | 893,325 | |
| | | | Ineos Finance plc | | | | |
| | 860,000 | | | 7.500%, 5/1/2020f | | | 942,775 | |
| | | | Inmet Mining Corporation | | | | |
| | 860,000 | | | 7.500%, 6/1/2021f | | | 898,700 | |
| | | | LyondellBasell Industries NV | | | | |
| | 110,000 | | | 5.000%, 4/15/2019 | | | 122,168 | |
| | 106,000 | | | 6.000%, 11/15/2021 | | | 121,912 | |
| | | | Xstrata Finance Canada, Ltd. | | | | |
| | 162,000 | | | 2.050%, 10/23/2015f | | | 164,062 | |
| | | | | | | | |
| | | | Total | | | 5,062,326 | |
| | | | | | | | |
| |
| | Capital Goods (0.9%) | | | | |
| | | | Case New Holland, Inc. | �� | | | |
| | 235,000 | | | 7.875%, 12/1/2017 | | | 277,300 | |
| | | | CNH Capital, LLC | | | | |
| | 615,000 | | | 3.625%, 4/15/2018 | | | 623,456 | |
| | | | Crown Cork & Seal Company, Inc. | | | | |
| | 610,000 | | | 7.375%, 12/15/2026 | | | 674,050 | |
| | | | Northrop Grumman Corporation | | | | |
| | 300,000 | | | 1.750%, 6/1/2018 | | | 292,668 | |
| | | | Reynolds Group Issuer, Inc. | | | | |
| | 250,000 | | | 5.750%, 10/15/2020 | | | 255,000 | |
| | 610,000 | | | 6.875%, 2/15/2021 | | | 657,275 | |
| | | | Roper Industries, Inc. | | | | |
| | 250,000 | | | 1.850%, 11/15/2017 | | | 247,816 | |
| | | | RSC Equipment Rental, Inc. | | | | |
| | 250,000 | | | 8.250%, 2/1/2021 | | | 281,875 | |
| | | | Textron, Inc. | | | | |
| | 450,000 | | | 7.250%, 10/1/2019 | | | 520,956 | |
| | | | Trinseo Materials Operating SCA | | | | |
| | 860,000 | | | 8.750%, 2/1/2019f | | | 887,950 | |
| | | | United Rentals North America, Inc. | | | | |
| | 610,000 | | | 7.375%, 5/15/2020 | | | 676,337 | |
| | | | | | | | |
| | | | Total | | | 5,394,683 | |
| | | | | | | | |
| |
| | Collateralized Mortgage Obligations (14.2%) | | | | |
| | | | Alternative Loan Trust | | | | |
| | 1,976,209 | | | 6.000%, 6/25/2036 | | | 1,686,602 | |
| | | | American Home Mortgage Investment Trust | | | | |
| | 2,323,719 | | | 6.250%, 12/25/2036 | | | 1,310,287 | |
| | | | Banc of America Alternative Loan Trust | | | | |
| | 1,039,388 | | | 0.665%, 4/25/2035d | | | 863,338 | |
| | 2,421,574 | | | 6.000%, 11/25/2035 | | | 1,996,709 | |
| | | | Banc of America Funding Corporation | | | | |
| | 711,995 | | | 5.019%, 5/20/2036 | | | 593,647 | |
| | | | Bear Stearns Adjustable Rate Mortgage Trust | | | | |
| | 1,301,221 | | | 2.430%, 10/25/2035d | | | 1,278,054 | |
| | 545,696 | | | 2.571%, 2/25/2036 | | | 430,674 | |
| | | | Citicorp Mortgage Securities Trust | | | | |
| | 981,813 | | | 6.000%, 5/25/2037 | | | 984,184 | |
| | | | Citigroup Mortgage Loan Trust, Inc. | | | | |
| | 690,102 | | | 5.500%, 11/25/2035 | | | 612,288 | |
| | | | CitiMortgage Alternative Loan Trust | | | | |
| | 992,764 | | | 5.750%, 4/25/2037 | | | 835,022 | |
| | | | Countrywide Alternative Loan Trust | | | | |
| | 993,722 | | | 0.565%, 2/25/2035d | | | 865,590 | |
| | 1,405,611 | | | 5.066%, 10/25/2035 | | | 1,133,694 | |
| | 534,008 | | | 5.500%, 2/25/2036 | | | 476,840 | |
| | 417,332 | | | 6.000%, 4/25/2036 | | | 343,709 | |
| | 1,433,195 | | | 6.500%, 8/25/2036 | | | 976,233 | |
| | 360,609 | | | 6.000%, 1/25/2037 | | | 306,340 | |
| | 1,379,153 | | | 5.500%, 5/25/2037 | | | 1,146,211 | |
| | | | Countrywide Home Loan Mortgage Pass Through Trust | | | | |
| | 1,261,957 | | | 2.586%, 11/25/2035 | | | 1,029,248 | |
| | 1,080,228 | | | 5.085%, 2/20/2036 | | | 942,488 | |
| | | | Credit Suisse First Boston Mortgage Securities Corporation | | | | |
| | 855,569 | | | 5.250%, 10/25/2035 | | | 830,571 | |
| | | | Deutsche Alt-A Securities, Inc., Mortgage Loan Trust | | | | |
| | 243,458 | | | 5.500%, 10/25/2021 | | | 233,127 | |
| | 830,007 | | | 0.365%, 11/25/2035d | | | 513,683 | |
| | 1,422,237 | | | 5.500%, 11/25/2035 | | | 1,291,152 | |
| | 1,483,016 | | | 0.900%, 4/25/2047d | | | 1,223,918 | |
| | | | Federal Home Loan Mortgage Corporation | | | | |
| | 13,744,307 | | | 2.500%, 12/15/2022g | | | 1,171,188 | |
| | 3,855,411 | | | 2.500%, 5/15/2027g | | | 437,493 | |
| | 4,450,509 | | | 2.500%, 2/15/2028g | | | 541,573 | |
| | 13,335,650 | | | 2.500%, 3/15/2028g | | | 1,599,055 | |
| | 7,381,150 | | | 3.000%, 4/15/2028g | | | 928,669 | |
| | 5,668,580 | | | 3.000%, 2/15/2033g | | | 866,083 | |
| | | | Federal National Mortgage Association | | | | |
| | 5,704,693 | | | 2.500%, 2/25/2028g | | | 700,940 | |
| | 4,525,247 | | | 3.000%, 4/25/2028g | | | 656,742 | |
| | 5,592,334 | | | 3.500%, 1/25/2033g | | | 997,868 | |
| | | | First Horizon Alternative Mortgage Securities Trust | | | | |
| | 1,564,939 | | | 2.250%, 3/25/2035 | | | 1,366,579 | |
The accompanying Notes to Financial Statements are an integral part of this schedule.
25
Diversified Income Plus Fund
Schedule of Investments as of December 31, 2013
| | | | | | | | |
Principal
Amount | | | Long-Term Fixed Income (45.3%) | | Value | |
| Collateralized Mortgage Obligations (14.2%) - continued | |
| | | | First Horizon Mortgage Pass- Through Trust | | | | |
| $ | 1,750,034 | | | 2.534%, 8/25/2037 | | $ | 1,438,314 | |
| | | | Government National Mortgage Association | | | | |
| | 7,108,353 | | | 4.000%, 1/16/2027g | | | 1,010,412 | |
| | | | Greenpoint Mortgage Funding Trust | | | | |
| | 1,150,650 | | | 0.365%, 10/25/2045d | | | 862,057 | |
| | | | GSR Mortgage Loan Trust | | | | |
| | 402,841 | | | 0.355%, 8/25/2046d | | | 396,534 | |
| | | | HomeBanc Mortgage Trust | | | | |
| | 1,306,525 | | | 2.409%, 4/25/2037 | | | 908,556 | |
| | | | IndyMac IMJA Mortgage Loan Trust | | | | |
| | 1,527,782 | | | 6.250%, 11/25/2037 | | | 1,362,679 | |
| | | | J.P. Morgan Alternative Loan Trust | | | | |
| | 1,663,955 | | | 6.500%, 3/25/2036 | | | 1,458,754 | |
| | | | J.P. Morgan Mortgage Trust | | | | |
| | 311,099 | | | 6.500%, 1/25/2035 | | | 300,003 | |
| | 2,218,068 | | | 2.867%, 8/25/2035 | | | 2,203,933 | |
| | 768,964 | | | 2.665%, 10/25/2036 | | | 637,200 | |
| | 1,648,168 | | | 0.545%, 1/25/2037d | | | 1,078,225 | |
| | 1,045,999 | | | 2.530%, 1/25/2037 | | | 922,098 | |
| | 1,008,916 | | | 6.250%, 8/25/2037 | | | 705,903 | |
| | | | Lehman Mortgage Trust | | | | |
| | 1,218,927 | | | 0.915%, 12/25/2035d | | | 840,085 | |
| | | | Lehman XS Trust | | | | |
| | 1,200,000 | | | 5.500%, 9/25/2035 | | | 1,037,512 | |
| | | | Master Asset Securitization Trust | | | | |
| | 1,286,860 | | | 0.665%, 6/25/2036d | | | 808,237 | |
| | | | MASTR Alternative Loans Trust | | | | |
| | 387,157 | | | 6.500%, 7/25/2034 | | | 387,429 | |
| | 1,170,130 | | | 0.615%, 12/25/2035d | | | 634,470 | |
| | | | Merrill Lynch Alternative Note Asset Trust | | | | |
| | 900,008 | | | 6.000%, 3/25/2037 | | | 672,508 | |
| | | | Morgan Stanley Mortgage Loan Trust | | | | |
| | 917,806 | | | 5.319%, 11/25/2035 | | | 676,476 | |
| | | | MortgageIT Trust | | | | |
| | 2,026,455 | | | 0.425%, 12/25/2035d | | | 1,856,454 | |
| | 1,536,202 | | | 0.365%, 4/25/2036d | | | 1,018,075 | |
| | | | New Century Alternative Mortgage Loan Trust | | | | |
| | 883,702 | | | 6.167%, 7/25/2036 | | | 592,230 | |
| | | | RALI Trust | | | | |
| | 1,151,432 | | | 5.750%, 4/25/2037 | | | 899,402 | |
| | 1,607,147 | | | 6.250%, 4/25/2037 | | | 1,294,909 | |
| | 671,461 | | | 6.000%, 6/25/2037 | | | 501,803 | |
| | | | Residential Accredit Loans, Inc. | | | | |
| | 1,550,290 | | | 5.750%, 9/25/2035 | | | 1,365,561 | |
| | 1,502,682 | | | 6.000%, 1/25/2037 | | | 1,169,164 | |
| | | | Residential Asset Securitization Trust | | | | |
| | 1,067,376 | | | 5.500%, 4/25/2035 | | | 1,052,402 | |
| | 1,326,674 | | | 0.545%, 8/25/2037d | | | 413,910 | |
| | | | RFMSI Trust | | | | |
| | 1,673,520 | | | 5.750%, 2/25/2036 | | | 1,471,093 | |
| | 2,585,454 | | | 6.000%, 7/25/2037 | | | 2,302,923 | |
| | | | Sequoia Mortgage Trust | | | | |
| | 2,231,933 | | | 2.631%, 9/20/2046 | | | 1,881,734 | |
| | | | Structured Adjustable Rate Mortgage Loan Trust | | | | |
| | 541,299 | | | 5.500%, 12/25/2034 | | | 523,673 | |
| | 711,585 | | | 2.715%, 9/25/2035 | | | 602,763 | |
| | 1,207,035 | | | 4.949%, 5/25/2036 | | | 918,282 | |
| | | | Structured Asset Mortgage Investments, Inc. | | | | |
| | 2,075,317 | | | 0.475%, 12/25/2035d | | | 1,537,017 | |
| | 1,671,063 | | | 0.375%, 5/25/2046d | | | 1,235,076 | |
| | | | WaMu Mortgage Pass Through Certificates | | | | |
| | 1,217,459 | | | 2.065%, 11/25/2036 | | | 1,023,538 | |
| | 213,231 | | | 2.402%, 8/25/2046 | | | 184,038 | |
| | 1,048,484 | | | 1.089%, 9/25/2046d | | | 893,495 | |
| | 1,400,714 | | | 2.213%, 3/25/2047d | | | 1,093,977 | |
| | | | Washington Mutual Alternative Mortgage Pass Through Certificates | | | | |
| | 1,442,577 | | | 0.765%, 6/25/2035d | | | 1,036,887 | |
| | 1,566,907 | | | 6.000%, 11/25/2035 | | | 1,293,073 | |
| | 1,285,922 | | | 0.889%, 2/25/2047d | | | 864,434 | |
| | | | Wells Fargo Mortgage Backed Securities Trust | | | | |
| | 2,646,372 | | | 2.632%, 7/25/2036 | | | 2,452,452 | |
| | 581,542 | | | 0.865%, 5/25/2037d | | | 490,346 | |
| | 1,219,220 | | | 6.000%, 7/25/2037 | | | 1,153,463 | |
| | | | | | | | |
| | | | Total | | | 80,633,358 | |
| | | | | | | | |
| |
| Commercial Mortgage-Backed Securities (0.6%) | | | | |
| | | | Credit Suisse Mortgage Capital Certificates | | | | |
| | 500,000 | | | 5.509%, 9/15/2039 | | | 536,875 | |
| | | | Greenwich Capital Commercial Funding Corporation | | | | |
| | 1,350,000 | | | 5.867%, 12/10/2049 | | | 1,479,233 | |
| | | | Morgan Stanley Capital, Inc. | | | | |
| | 1,350,000 | | | 5.406%, 3/15/2044 | | | 1,467,443 | |
| | | | | | | | |
| | | | Total | | | 3,483,551 | |
| | | | | | | | |
| |
| Communications Services (2.6%) | | | | |
| | | | America Movil SAB de CV | | | | |
| | 104,000 | | | 5.000%, 10/16/2019 | | | 113,620 | |
| | | | American Tower Corporation | | | | |
| | 157,000 | | | 7.000%, 10/15/2017 | | | 180,957 | |
| | | | AT&T, Inc. | | | | |
| | 350,000 | | | 2.400%, 8/15/2016 | | | 359,921 | |
| | | | CBS Corporation | | | | |
| | 165,000 | | | 8.875%, 5/15/2019 | | | 210,958 | |
| | | | CC Holdings GS V, LLC | | | | |
| | 270,000 | | | 2.381%, 12/15/2017 | | | 267,430 | |
| | | | CenturyLink, Inc. | | | | |
| | 860,000 | | | 5.625%, 4/1/2020 | | | 875,050 | |
| | | | Cequel Communications Escrow 1, LLC | | | | |
| | 610,000 | | | 6.375%, 9/15/2020f | | | 625,250 | |
| | | | DIRECTV Holdings, LLC | | | | |
| | 190,000 | | | 3.500%, 3/1/2016 | | | 199,441 | |
| | 106,000 | | | 5.875%, 10/1/2019 | | | 120,075 | |
| | | | Dish DBS Corporation | | | | |
| | 160,000 | | | 6.750%, 6/1/2021 | | | 169,600 | |
The accompanying Notes to Financial Statements are an integral part of this schedule.
26
Diversified Income Plus Fund
Schedule of Investments as of December 31, 2013
| | | | | | | | |
Principal
Amount | | | Long-Term Fixed Income (45.3%) | | Value | |
| Communications Services (2.6%) - continued | |
| | | | Hughes Satellite Systems Corporation | | | | |
| $ | 860,000 | | | 6.500%, 6/15/2019 | | $ | 930,950 | |
| | | | Intelsat Jackson Holdings SA | | | | |
| | 860,000 | | | 7.250%, 4/1/2019 | | | 928,800 | |
| | | | Level 3 Financing, Inc. | | | | |
| | 1,100,000 | | | 8.625%, 7/15/2020 | | | 1,232,000 | |
| | | | Nara Cable Funding, Ltd. | | | | |
| | 860,000 | | | 8.875%, 12/1/2018f | | | 924,500 | |
| | | | NBC Universal Enterprise, Inc. | | | | |
| | 156,000 | | | 1.662%, 4/15/2018f | | | 152,359 | |
| | | | News America, Inc. | | | | |
| | 106,000 | | | 4.500%, 2/15/2021 | | | 113,618 | |
| | | | SBA Tower Trust | | | | |
| | 300,000 | | | 3.598%, 4/16/2043f | | | 293,243 | |
| | | | Sprint Communications, Inc. | | | | |
| | 850,000 | | | 9.000%, 11/15/2018f | | | 1,024,250 | |
| | | | Telefonica Emisiones SAU | | | | |
| | 212,000 | | | 3.992%, 2/16/2016 | | | 222,684 | |
| | 211,000 | | | 3.192%, 4/27/2018 | | | 214,886 | |
| | | | T-Mobile USA, Inc. | | | | |
| | 870,000 | | | 6.633%, 4/28/2021 | | | 915,675 | |
| | | | Univision Communications, Inc. | | | | |
| | 250,000 | | | 6.875%, 5/15/2019f | | | 267,188 | |
| | 610,000 | | | 7.875%, 11/1/2020f | | | 670,238 | |
| | | | UPCB Finance V, Ltd. | | | | |
| | 860,000 | | | 7.250%, 11/15/2021f | | | 933,100 | |
| | | | Verizon Communications, Inc. | | | | |
| | 367,000 | | | 2.500%, 9/15/2016 | | | 379,491 | |
| | 154,000 | | | 1.993%, 9/14/2018d | | | 161,931 | |
| | 295,000 | | | 3.650%, 9/14/2018 | | | 312,276 | |
| | | | Wind Acquisition Finance SA | | | | |
| | 460,000 | | | 11.750%, 7/15/2017f | | | 489,325 | |
| | 400,000 | | | 7.250%, 2/15/2018f | | | 421,000 | |
| | | | Windstream Corporation | | | | |
| | 860,000 | | | 7.750%, 10/1/2021 | | | 911,600 | |
| | | | | | | | |
| | | | Total | | | 14,621,416 | |
| | | | | | | | |
| |
| Consumer Cyclical (2.0%) | | | | |
| | | | Brookfield Residential Properties, Inc. | | | | |
| | 850,000 | | | 6.500%, 12/15/2020f | | | 881,875 | |
| | | | Chrysler Group, LLC | | | | |
| | 840,000 | | | 8.000%, 6/15/2019 | | | 928,200 | |
| | | | Ford Motor Credit Company, LLC | | | | |
| | 375,000 | | | 3.984%, 6/15/2016 | | | 398,775 | |
| | 473,000 | | | 1.500%, 1/17/2017 | | | 472,788 | |
| | 157,000 | | | 3.000%, 6/12/2017 | | | 163,173 | |
| | 180,000 | | | 6.625%, 8/15/2017 | | | 208,518 | |
| | | | Gap, Inc. | | | | |
| | 300,000 | | | 5.950%, 4/12/2021 | | | 331,492 | |
| | | | General Motors Company | | | | |
| | 208,000 | | | 3.500%, 10/2/2018f | | | 212,680 | |
| | | | General Motors Financial Company, Inc. | | | | |
| | 860,000 | | | 3.250%, 5/15/2018f | | | 860,000 | |
| | | | Hilton Worldwide Finance, LLC | | | | |
| | 860,000 | | | 5.625%, 10/15/2021f | | | 892,250 | |
| | | | Home Depot, Inc. | | | | |
| | 106,000 | | | 3.950%, 9/15/2020 | | | 113,091 | |
| | | | Jaguar Land Rover Automotive plc | | | | |
| | 250,000 | | | 4.125%, 12/15/2018f | | | 251,563 | |
| | 710,000 | | | 5.625%, 2/1/2023f | | | 710,000 | |
| | | | L Brands, Inc. | | | | |
| | 860,000 | | | 5.625%, 2/15/2022 | | | 879,350 | |
| | | | Lennar Corporation | | | | |
| | 610,000 | | | 12.250%, 6/1/2017 | | | 784,612 | |
| | 250,000 | | | 4.125%, 12/1/2018 | | | 251,250 | |
| | | | Macy’s Retail Holdings, Inc. | | | | |
| | 490,000 | | | 6.700%, 7/15/2034 | | | 557,553 | |
| | | | MGM Resorts International | | | | |
| | 860,000 | | | 5.250%, 3/31/2020 | | | 853,550 | |
| | | | Toll Brothers Finance Corporation | | | | |
| | 208,000 | | | 4.000%, 12/31/2018 | | | 211,640 | |
| | | | Toys R Us Property Company II, LLC | | | | |
| | 610,000 | | | 8.500%, 12/1/2017 | | | 628,300 | |
| | | | Wynn Las Vegas, LLC | | | | |
| | 860,000 | | | 5.375%, 3/15/2022 | | | 868,600 | |
| | | | | | | | |
| | | | Total | | | 11,459,260 | |
| | | | | | | | |
| |
| Consumer Non-Cyclical (2.3%) | | | | |
| | | | AbbVie, Inc. | | | | |
| | 314,000 | | | 1.750%, 11/6/2017 | | | 313,462 | |
| | | | Altria Group, Inc. | | | | |
| | 191,000 | | | 9.700%, 11/10/2018 | | | 251,049 | |
| | | | Anheuser-Busch InBev Worldwide, Inc. | | | | |
| | 220,000 | | | 7.750%, 1/15/2019 | | | 274,705 | |
| | | | Beam, Inc. | | | | |
| | 110,000 | | | 5.375%, 1/15/2016 | | | 119,048 | |
| | | | Biomet, Inc. | | | | |
| | 860,000 | | | 6.500%, 8/1/2020 | | | 903,000 | |
| | | | Boston Scientific Corporation | | | | |
| | 157,000 | | | 6.000%, 1/15/2020 | | | 180,241 | |
| | | | Bunge Limited Finance Corporation | | | | |
| | 225,000 | | | 4.100%, 3/15/2016 | | | 237,587 | |
| | | | Celgene Corporation | | | | |
| | 198,000 | | | 1.900%, 8/15/2017 | | | 197,063 | |
| | | | CHS/Community Health Systems, Inc. | | | | |
| | 860,000 | | | 7.125%, 7/15/2020 | | | 892,250 | |
| | | | ConAgra Foods, Inc. | | | | |
| | 275,000 | | | 2.100%, 3/15/2018 | | | 271,978 | |
| | | | CVS Caremark Corporation | | | | |
| | 106,000 | | | 2.250%, 12/5/2018 | | | 105,969 | |
| | | | Endo Health Solutions, Inc. | | | | |
| | 610,000 | | | 7.000%, 12/15/2020 | | | 652,700 | |
| | | | Endo Pharmaceuticals Holdings, Inc. | | | | |
| | 250,000 | | | 7.000%, 7/15/2019 | | | 267,500 | |
| | | | Express Scripts Holding Company | | | | |
| | 208,000 | | | 2.650%, 2/15/2017 | | | 214,380 | |
| | | | Gilead Sciences, Inc. | | | | |
| | 165,000 | | | 3.050%, 12/1/2016 | | | 174,219 | |
| | | | Hawk Acquisition Sub, Inc. | | | | |
| | 860,000 | | | 4.250%, 10/15/2020f | | | 832,050 | |
| | | | Health Management Associates, Inc. | | | | |
| | 610,000 | | | 7.375%, 1/15/2020 | | | 682,438 | |
| | | | Hospira, Inc. | | | | |
| | 870,000 | | | 5.200%, 8/12/2020 | | | 902,637 | |
| | | | IMS Health, Inc. | | | | |
| | 370,000 | | | 12.500%, 3/1/2018f | | | 437,525 | |
| | 490,000 | | | 6.000%, 11/1/2020f | | | 520,625 | |
The accompanying Notes to Financial Statements are an integral part of this schedule.
27
Diversified Income Plus Fund
Schedule of Investments as of December 31, 2013
| | | | | | | | |
Principal
Amount | | | Long-Term Fixed Income (45.3%) | | Value | |
| Consumer Non-Cyclical (2.3%) - continued | | | | |
| | | | Kroger Company | | | | |
| $ | 220,000 | | | 1.200%, 10/17/2016 | | $ | 220,094 | |
| | | | Lorillard Tobacco Company | | | | |
| | 262,000 | | | 8.125%, 6/23/2019 | | | 319,154 | |
| | | | Mallinckrodt International Finance SA | | | | |
| | 150,000 | | | 3.500%, 4/15/2018f | | | 147,148 | |
| | | | Medco Health Solutions, Inc. | | | | |
| | 150,000 | | | 7.125%, 3/15/2018 | | | 178,240 | |
| | | | Mylan, Inc. | | | | |
| | 291,000 | | | 1.350%, 11/29/2016 | | | 290,467 | |
| | | | Pernod Ricard SA | | | | |
| | 110,000 | | | 2.950%, 1/15/2017f | | | 113,599 | |
| | 110,000 | | | 5.750%, 4/7/2021f | | | 121,249 | |
| | | | Perrigo Company, Ltd. | | | | |
| | 208,000 | | | 1.300%, 11/8/2016f | | | 207,279 | |
| | 104,000 | | | 2.300%, 11/8/2018f | | | 102,651 | |
| | | | SABMiller plc | | | | |
| | 218,000 | | | 6.500%, 7/15/2018f | | | 257,344 | |
| | | | Safeway, Inc. | | | | |
| | 315,000 | | | 3.400%, 12/1/2016 | | | 327,730 | |
| | | | Spectrum Brands Escrow Corporation | | | | |
| | 860,000 | | | 6.375%, 11/15/2020f | | | 918,050 | |
| | | | Thermo Fisher Scientific, Inc. | | | | |
| | 212,000 | | | 1.300%, 2/1/2017 | | | 211,079 | |
| | 212,000 | | | 2.400%, 2/1/2019 | | | 210,026 | |
| | | | Valeant Pharmaceuticals International | | | | |
| | 250,000 | | | 6.875%, 12/1/2014f | | | 267,500 | |
| | | | VPII Escrow Corporation | | | | |
| | 610,000 | | | 7.500%, 7/15/2021f | | | 669,475 | |
| | | | Watson Pharmaceuticals, Inc. | | | | |
| | 251,000 | | | 1.875%, 10/1/2017 | | | 248,382 | |
| | | | | | | | |
| | | | Total | | | 13,239,893 | |
| | | | | | | | |
| |
| Energy (1.8%) | | | | |
| | | | BP Capital Markets plc | | | | |
| | 208,000 | | | 0.658%, 11/7/2016d | | | 208,879 | |
| | 220,000 | | | 2.241%, 9/26/2018 | | | 220,635 | |
| | | | CNOOC, Ltd. | | | | |
| | 208,000 | | | 1.125%, 5/9/2016 | | | 207,234 | |
| | | | Concho Resources, Inc. | | | | |
| | 860,000 | | | 5.500%, 10/1/2022 | | | 887,950 | |
| | | | Continental Resources, Inc. | | | | |
| | 275,000 | | | 7.125%, 4/1/2021 | | | 311,781 | |
| | | | Devon Energy Corporation | | | | |
| | 220,000 | | | 1.200%, 12/15/2016 | | | 219,908 | |
| | | | Enbridge Energy Partners, LP | | | | |
| | 1,215,000 | | | 8.050%, 10/1/2037 | | | 1,344,950 | |
| | | | Energy Transfer Partners, LP | | | | |
| | 104,000 | | | 6.700%, 7/1/2018 | | | 120,750 | |
| | | | EQT Corporation | | | | |
| | 104,000 | | | 8.125%, 6/1/2019 | | | 126,170 | |
| | | | Gazprom Neft OAO Via GPN Capital SA | | | | |
| | 725,000 | | | 6.000%, 11/27/2023f | | | 735,875 | |
| | | | Hess Corporation | | | | |
| | 155,000 | | | 8.125%, 2/15/2019 | | | 192,528 | |
| | | | Linn Energy, LLC | | | | |
| | 860,000 | | | 7.000%, 11/1/2019f | | | 868,600 | |
| | | | Lukoil International Finance BV | | | | |
| | 110,000 | | | 3.416%, 4/24/2018f | | | 110,962 | |
| | | | MEG Energy Corporation | | | | |
| | 250,000 | | | 6.500%, 3/15/2021f | | | 263,125 | |
| | 610,000 | | | 6.375%, 1/30/2023f | | | 613,812 | |
| | | | Oasis Petroleum, Inc. | | | | |
| | 860,000 | | | 6.875%, 1/15/2023 | | | 915,900 | |
| | | | Offshore Group Investment, Ltd. | | | | |
| | 860,000 | | | 7.500%, 11/1/2019 | | | 935,250 | |
| | | | Petrobras Global Finance BV | | | | |
| | 245,000 | | | 2.000%, 5/20/2016 | | | 244,806 | |
| | | | Range Resources Corporation | | | | |
| | 860,000 | | | 5.000%, 8/15/2022 | | | 844,950 | |
| | | | Transocean, Inc. | | | | |
| | 259,000 | | | 5.050%, 12/15/2016 | | | 286,110 | |
| | | | Weatherford International, Ltd. | | | | |
| | 170,000 | | | 6.000%, 3/15/2018 | | | 190,789 | |
| | 104,000 | | | 9.625%, 3/1/2019 | | | 133,626 | |
| | | | | | | | |
| | | | Total | | | 9,984,590 | |
| | | | | | | | |
| |
| Financials (9.0%) | | | | |
| | | | Abbey National Treasury Services plc | | | | |
| | 110,000 | | | 3.050%, 8/23/2018 | | | 113,028 | |
| | | | Aegon NV | | | | |
| | 1,080,000 | | | 2.956%, 7/29/2049d,h | | | 912,600 | |
| | | | AGI Life Holdings, Inc. | | | | |
| | 1,200,000 | | | 7.570%, 12/1/2045f | | | 1,356,000 | |
| | | | American Express Company | | | | |
| | 1,250,000 | | | 6.800%, 9/1/2066 | | | 1,331,875 | |
| | | | American International Group, Inc. | | | | |
| | 325,000 | | | 8.250%, 8/15/2018 | | | 406,536 | |
| | | | Aviation Capital Group Corporation | | | | |
| | 162,000 | | | 3.875%, 9/27/2016f | | | 167,328 | |
| | | | Bank of America Corporation | | | | |
| | 280,000 | | | 5.750%, 8/15/2016 | | | 308,787 | |
| | 220,000 | | | 1.316%, 3/22/2018d | | | 222,922 | |
| | 300,000 | | | 5.650%, 5/1/2018 | | | 341,481 | |
| | 157,000 | | | 2.600%, 1/15/2019 | | | 157,693 | |
| | | | Bank of New York Mellon Corporation | | | | |
| | 720,000 | | | 4.500%, 12/29/2049h | | | 653,400 | |
| | | | Bank of Nova Scotia | | | | |
| | 220,000 | | | 1.100%, 12/13/2016 | | | 221,055 | |
| | | | Barclays Bank plc | | | | |
| | 150,000 | | | 5.140%, 10/14/2020 | | | 159,731 | |
| | | | BB&T Corporation | | | | |
| | 157,000 | | | 2.050%, 6/19/2018 | | | 155,436 | |
| | | | BBVA Banco Continental SA | | | | |
| | 158,000 | | | 2.250%, 7/29/2016f | | | 157,210 | |
| | | | BBVA International Preferred SA Unipersonal | | | | |
| | 1,545,000 | | | 5.919%, 12/29/2049h | | | 1,487,062 | |
| | | | BBVA US Senior SAU | | | | |
| | 275,000 | | | 4.664%, 10/9/2015 | | | 289,101 | |
| | | | Bear Stearns Companies, LLC | | | | |
| | 340,000 | | | 6.400%, 10/2/2017 | | | 394,591 | |
| | | | BNP Paribas SA | | | | |
| | 212,000 | | | 1.250%, 12/12/2016 | | | 212,155 | |
| | 240,000 | | | 2.375%, 9/14/2017 | | | 245,032 | |
| | 1,250,000 | | | 5.186%, 6/29/2049f,h | | | 1,276,562 | |
| | | | Branch Banking and Trust Company | | | | |
| | 208,000 | | | 0.667%, 12/1/2016d | | | 208,175 | |
The accompanying Notes to Financial Statements are an integral part of this schedule.
28
Diversified Income Plus Fund
Schedule of Investments as of December 31, 2013
| | | | | | | | |
Principal
Amount | | | Long-Term Fixed Income (45.3%) | | Value | |
| Financials (9.0%) - continued | | | | |
| | | | Capital One Financial Corporation | | | | |
| $ | 157,000 | | | 6.150%, 9/1/2016 | | $ | 175,602 | |
| | | | Citigroup, Inc. | | | | |
| | 310,000 | | | 5.000%, 9/15/2014 | | | 318,830 | |
| | 367,000 | | | 5.500%, 2/15/2017 | | | 404,373 | |
| | 220,000 | | | 6.000%, 8/15/2017 | | | 250,747 | |
| | 212,000 | | | 8.500%, 5/22/2019 | | | 271,697 | |
| | 1,490,000 | | | 5.950%, 12/29/2049h | | | 1,378,772 | |
| | | | CNA Financial Corporation | | | | |
| | 165,000 | | | 7.350%, 11/15/2019 | | | 200,015 | |
| | | | Cooperatieve Centrale Raiffeisen- Boerenleenbank BA | | | | |
| | 725,000 | | | 4.625%, 12/1/2023 | | | 730,088 | |
| | 975,000 | | | 11.000%, 12/29/2049f,h | | | 1,290,656 | |
| | | | Credit Agricole SA | | | | |
| | 208,000 | | | 1.625%, 4/15/2016f | | | 209,283 | |
| | | | Credit Suisse AG | | | | |
| | 318,000 | | | 5.400%, 1/14/2020 | | | 353,404 | |
| | | | Credit Suisse Group AG | | | | |
| | 600,000 | | | 7.500%, 12/11/2049f,h | | | 633,750 | |
| | | | CyrusOne, LP | | | | |
| | 860,000 | | | 6.375%, 11/15/2022 | | | 890,100 | |
| | | | Denali Borrower, LLC | | | | |
| | 860,000 | | | 5.625%, 10/15/2020f | | | 852,475 | |
| | | | Developers Diversified Realty Corporation | | | | |
| | 159,000 | | | 7.875%, 9/1/2020 | | | 196,425 | |
| | | | Discover Financial Services | | | | |
| | 150,000 | | | 6.450%, 6/12/2017 | | | 169,971 | |
| | | | Fifth Third Bancorp | | | | |
| | 198,000 | | | 5.450%, 1/15/2017 | | | 217,600 | |
| | 900,000 | | | 5.100%, 12/31/2049h | | | 796,500 | |
| | | | GE Capital Trust I | | | | |
| | 620,000 | | | 6.375%, 11/15/2067 | | | 669,600 | |
| | | | General Electric Capital Corporation | | | | |
| | 660,000 | | | 5.625%, 9/15/2017 | | | 750,814 | |
| | 73,000 | | | 1.625%, 4/2/2018 | | | 72,225 | |
| | 1,200,000 | | | 6.250%, 12/15/2049h | | | 1,239,000 | |
| | | | Goldman Sachs Group, Inc. | | | | |
| | 240,000 | | | 6.250%, 9/1/2017 | | | 274,766 | |
| | 205,000 | | | 7.500%, 2/15/2019 | | | 249,684 | |
| | 224,000 | | | 5.375%, 3/15/2020 | | | 249,117 | |
| | | | Hartford Financial Services Group, Inc. | | | | |
| | 315,000 | | | 6.000%, 1/15/2019 | | | 361,279 | |
| | | | HCP, Inc. | | | | |
| | 78,000 | | | 3.750%, 2/1/2016 | | | 81,963 | |
| | 107,000 | | | 3.750%, 2/1/2019 | | | 111,139 | |
| | | | Health Care REIT, Inc. | | | | |
| | 104,000 | | | 4.700%, 9/15/2017 | | | 113,048 | |
| | | | HSBC Finance Corporation | | | | |
| | 260,000 | | | 6.676%, 1/15/2021 | | | 298,750 | |
| | | | Huntington National Bank | | | | |
| | 208,000 | | | 1.300%, 11/20/2016 | | | 208,031 | |
| | | | Icahn Enterprises, LP | | | | |
| | 860,000 | | | 8.000%, 1/15/2018 | | | 894,400 | |
| | | | ING Bank NV | | | | |
| | 125,000 | | | 3.750%, 3/7/2017f | | | 131,652 | |
| | | | ING Capital Funding Trust III | | | | |
| | 1,420,000 | | | 3.847%, 12/29/2049d,h | | | 1,414,675 | |
| | | | ING US, Inc. | | | | |
| | 300,000 | | | 5.650%, 5/15/2053 | | | 291,750 | |
| | 150,000 | | | 2.900%, 2/15/2018 | | | 153,418 | |
| | | | International Lease Finance Corporation | | | | |
| | 110,000 | | | 2.193%, 6/15/2016d | | | 110,550 | |
| | 860,000 | | | 5.875%, 4/1/2019 | | | 915,900 | |
| | | | Intesa Sanpaolo SPA | | | | |
| | 157,000 | | | 3.125%, 1/15/2016 | | | 159,993 | |
| | 156,000 | | | 3.875%, 1/15/2019 | | | 155,098 | |
| | | | J.P. Morgan Chase & Company | | | | |
| | 295,000 | | | 3.450%, 3/1/2016 | | | 309,409 | |
| | 300,000 | | | 2.000%, 8/15/2017 | | | 304,306 | |
| | 300,000 | | | 7.900%, 4/29/2049h | | | 330,750 | |
| | 1,080,000 | | | 5.150%, 5/29/2049h | | | 969,300 | |
| | 300,000 | | | 6.000%, 12/29/2049h | | | 286,875 | |
| | | | KeyCorp | | | | |
| | 208,000 | | | 2.300%, 12/13/2018 | | | 206,491 | |
| | 63,000 | | | 5.100%, 3/24/2021 | | | 68,854 | |
| | | | Liberty Mutual Group, Inc. | | | | |
| | 975,000 | | | 10.750%, 6/15/2058f | | | 1,457,625 | |
| | 42,000 | | | 5.000%, 6/1/2021f | | | 44,049 | |
| | | | Liberty Property, LP | | | | |
| | 173,000 | | | 5.500%, 12/15/2016 | | | 190,970 | |
| | | | Lincoln National Corporation | | | | |
| | 1,120,000 | | | 6.050%, 4/20/2067 | | | 1,111,600 | |
| | | | Lloyds TSB Bank plc | | | | |
| | 154,000 | | | 6.500%, 9/14/2020f | | | 175,058 | |
| | | | Macquarie Bank, Ltd. | | | | |
| | 225,000 | | | 5.000%, 2/22/2017f | | | 243,999 | |
| | | | MetLife Capital Trust IV | | | | |
| | 1,422,000 | | | 7.875%, 12/15/2037f | | | 1,631,745 | |
| | | | MetLife, Inc. | | | | |
| | 600,000 | | | 6.400%, 12/15/2036 | | | 616,500 | |
| | | | Mizuho Corporate Bank, Ltd. | | | | |
| | 232,000 | | | 1.550%, 10/17/2017f | | | 226,742 | |
| | | | Morgan Stanley | | | | |
| | 250,000 | | | 4.750%, 4/1/2014 | | | 251,987 | |
| | 240,000 | | | 1.750%, 2/25/2016 | | | 243,222 | |
| | 268,000 | | | 6.250%, 8/28/2017 | | | 306,653 | |
| | 150,000 | | | 5.500%, 1/26/2020 | | | 168,386 | |
| | 110,000 | | | 4.875%, 11/1/2022 | | | 112,603 | |
| | | | Murray Street Investment Trust I | | | | |
| | 375,000 | | | 4.647%, 3/9/2017 | | | 403,833 | |
| | | | National City Corporation | | | | |
| | 214,000 | | | 6.875%, 5/15/2019 | | | 253,576 | |
| | | | Nomura Holdings, Inc. | | | | |
| | 237,000 | | | 2.000%, 9/13/2016 | | | 238,959 | |
| | | | PNC Bank NA | | | | |
| | 314,000 | | | 1.150%, 11/1/2016 | | | 314,385 | |
| | | | PNC Financial Services Group, Inc. | | | | |
| | 600,000 | | | 4.850%, 3/1/2049h | | | 537,300 | |
| | | | Prologis, LP | | | | |
| | 177,000 | | | 6.625%, 5/15/2018 | | | 206,731 | |
| | | | Prudential Covered Trust | | | | |
| | 153,000 | | | 2.997%, 9/30/2015f | | | 157,740 | |
| | | | Prudential Financial, Inc. | | | | |
| | 620,000 | | | 5.875%, 9/15/2042 | | | 630,075 | |
| | 1,225,000 | | | 5.625%, 6/15/2043 | | | 1,200,500 | |
| | | | QBE Capital Funding III, Ltd. | | | | |
| | 600,000 | | | 7.250%, 5/24/2041f | | | 620,554 | |
| | | | RBS Capital Trust III | | | | |
| | 900,000 | | | 5.512%, 9/29/2049h | | | 873,000 | |
| | | | Realty Income Corporation | | | | |
| | 131,000 | | | 2.000%, 1/31/2018 | | | 128,296 | |
The accompanying Notes to Financial Statements are an integral part of this schedule.
29
Diversified Income Plus Fund
Schedule of Investments as of December 31, 2013
| | | | | | | | |
Principal
Amount | | | Long-Term Fixed Income (45.3%) | | Value | |
| Financials (9.0%) - continued | | | | |
| | | | Regions Bank | | | | |
| $ | 250,000 | | | 7.500%, 5/15/2018 | | $ | 295,821 | |
| | | | Reinsurance Group of America, Inc. | | | | |
| | 1,290,000 | | | 6.750%, 12/15/2065 | | | 1,280,325 | |
| | 275,000 | | | 5.625%, 3/15/2017 | | | 303,166 | |
| | | | Royal Bank of Scotland Group plc | | | | |
| | 229,000 | | | 5.050%, 1/8/2015 | | | 235,779 | |
| | | | Santander US Debt SAU | | | | |
| | 325,000 | | | 3.724%, 1/20/2015f | | | 331,476 | |
| | | | SLM Corporation | | | | |
| | 170,000 | | | 6.250%, 1/25/2016 | | | 183,600 | |
| | | | Swiss RE Capital I, LP | | | | |
| | 1,350,000 | | | 6.854%, 5/29/2049f,h | | | 1,426,950 | |
| | | | Ventas Realty, LP | | | | |
| | 315,000 | | | 1.550%, 9/26/2016 | | | 317,235 | |
| | | | Wells Fargo & Company | | | | |
| | 175,000 | | | 1.250%, 7/20/2016 | | | 176,298 | |
| | 314,000 | | | 2.150%, 1/15/2019 | | | 313,017 | |
| | | | Westpac Banking Corporation | | | | |
| | 208,000 | | | 0.668%, 11/25/2016d | | | 208,293 | |
| | | | XLIT, Ltd. | | | | |
| | 208,000 | | | 2.300%, 12/15/2018 | | | 204,295 | |
| | | | ZFS Finance USA Trust II | | | | |
| | 1,553,000 | | | 6.450%, 12/15/2065f | | | 1,657,827 | |
| | | | | | | | |
| | | | Total | | | 50,781,055 | |
| | | | | | | | |
| |
| Foreign Government (0.3%) | | | | |
| | | | Mexico Government International Bond | | | | |
| | 1,570,000 | | | 4.000%, 10/2/2023 | | | 1,554,300 | |
| | | | | | | | |
| | | | Total | | | 1,554,300 | |
| | | | | | | | |
| |
| Mortgage-Backed Securities (3.1%) | | | | |
| | | | Federal National Mortgage Association Conventional 15- Yr. Pass Through | | | | |
| | 3,350,000 | | | 3.500%, 1/1/2029c | | | 3,503,236 | |
| | | | Federal National Mortgage Association Conventional 30- Yr. Pass Through | | | | |
| | 2,500,000 | | | 3.500%, 1/1/2044c | | | 2,483,399 | |
| | 3,350,000 | | | 4.000%, 1/1/2044c | | | 3,448,406 | |
| | 5,000,000 | | | 4.500%, 1/1/2044c | | | 5,297,852 | |
| | | | Vericrest Opportunity Loan Transferee | | | | |
| | 1,500,000 | | | 3.625%, 3/25/2054i | | | 1,493,550 | |
| | 1,296,550 | | | 3.625%, 4/25/2055i | | | 1,291,519 | |
| | | | | | | | |
| | | | Total | | | 17,517,962 | |
| | | | | | | | |
| |
| Technology (0.7%) | | | | |
| | | | Amkor Technology, Inc. | | | | |
| | 860,000 | | | 6.625%, 6/1/2021 | | | 892,250 | |
| | | | CommScope, Inc. | | | | |
| | 448,000 | | | 8.250%, 1/15/2019f | | | 491,120 | |
| | | | EMC Corporation | | | | |
| | 300,000 | | | 1.875%, 6/1/2018 | | | 296,592 | |
| | | | First Data Corporation | | | | |
| | 860,000 | | | 7.375%, 6/15/2019f | | | 918,050 | |
| | | | Freescale Semiconductor, Inc. | | | | |
| | 860,000 | | | 6.000%, 1/15/2022f | | | 870,750 | |
| | | | Oracle Corporation | | | | |
| | 163,000 | | | 1.200%, 10/15/2017 | | | 160,401 | |
| | | | Tyco Electronics Group SA | | | | |
| | 157,000 | | | 6.550%, 10/1/2017 | | | 179,670 | |
| | | | Xerox Corporation | | | | |
| | 157,000 | | | 7.200%, 4/1/2016 | | | 176,100 | |
| | | | | | | | |
| | | | Total | | | 3,984,933 | |
| | | | | | | | |
| |
| Transportation (0.5%) | | | | |
| | | | American Airlines Pass Through Trust | | | | |
| | 300,000 | | | 4.950%, 1/15/2023f | | | 309,187 | |
| | | | Avis Budget Car Rental, LLC | | | | |
| | 250,000 | | | 8.250%, 1/15/2019 | | | 272,500 | |
| | 610,000 | | | 5.500%, 4/1/2023 | | | 590,937 | |
| | | | Delta Air Lines, Inc. | | | | |
| | 120,786 | | | 4.950%, 5/23/2019 | | | 131,053 | |
| | 96,712 | | | 4.750%, 5/7/2020 | | | 103,483 | |
| | | | ERAC USA Finance, LLC | | | | |
| | 150,000 | | | 2.800%, 11/1/2018f | | | 151,580 | |
| | | | Hertz Corporation | | | | |
| | 610,000 | | | 6.750%, 4/15/2019 | | | 657,275 | |
| | | | Kansas City Southern de Mexico SA de CV | | | | |
| | 158,000 | | | 0.937%, 10/28/2016d | | | 158,043 | |
| | | | United Air Lines, Inc. | | | | |
| | 182,705 | | | 10.400%, 11/1/2016 | | | 207,370 | |
| | | | | | | | |
| | | | Total | | | 2,581,428 | |
| | | | | | | | |
| |
| U.S. Government and Agencies (0.4%) | | | | |
| | | | U.S. Treasury Notes | | | | |
| | 2,250,000 | | | 0.250%, 9/30/2015 | | | 2,247,979 | |
| | | | | | | | |
| | | | Total | | | 2,247,979 | |
| | | | | | | | |
| |
| U.S. Municipals (2.6%) | | | | |
| | | | Buckeye Tobacco Settlement Financing Auth. Rev. | | | | |
| | 1,800,000 | | | 5.125%, 6/1/2024, Ser. A-2 | | | 1,484,604 | |
| | | | Dallas/Fort Worth Texas International Airport Joint Rev. Improvement | | | | |
| | 1,800,000 | | | 5.000%, 11/1/2038, Ser. A, AMT | | | 1,674,414 | |
| | | | Los Angeles Department Of Water and Power System Rev. | | | | |
| | 2,400,000 | | | 5.000%, 7/1/2043, Ser. B | | | 2,460,024 | |
| | | | Massachusetts School Building Auth. Sales Tax Rev. | | | | |
| | 2,400,000 | | | 5.000%, 5/15/2043, Ser. A | | | 2,501,880 | |
| | | | Miami-Dade County Expressway Auth. Toll System Rev. | | | | |
| | 1,800,000 | | | 5.000%, 7/1/2040, Ser. A | | | 1,792,134 | |
| | | | New Jersey Transportation Trust Fund Auth. Transportation System Rev. | | | | |
| | 1,200,000 | | | 5.000%, 6/15/2042, Ser. A | | | 1,208,340 | |
| | | | New York City Municipal Water Finance Auth. Water and Sewer System Rev. | | | | |
| | 1,800,000 | | | 5.000%, 6/15/2047, Ser. EE | | | 1,835,262 | |
| | | | New York State Dormitory Auth. Personal Income Tax Rev. | | | | |
| | 1,800,000 | | | 5.000%, 3/15/2042, Ser. B | | | 1,849,842 | |
| | | | | | | | |
| | | | Total | | | 14,806,500 | |
| | | | | | | | |
The accompanying Notes to Financial Statements are an integral part of this schedule.
30
Diversified Income Plus Fund
Schedule of Investments as of December 31, 2013
| | | | | | | | |
Principal
Amount | | | Long-Term Fixed Income (45.3%) | | Value | |
| Utilities (2.0%) | | | | |
| | | | Atlas Pipeline Partners, LP | | | | |
| $ | 860,000 | | | 4.750%, 11/15/2021f | | $ | 786,900 | |
| | | | Buckeye Partners, LP | | | | |
| | 208,000 | | | 2.650%, 11/15/2018 | | | 204,944 | |
| | | | Calpine Corporation | | | | |
| | 870,000 | | | 6.000%, 1/15/2022f | | | 891,750 | |
| | | | CenterPoint Energy, Inc. | | | | |
| | 255,000 | | | 6.500%, 5/1/2018 | | | 297,538 | |
| | | | Constellation Energy Group, Inc. | | | | |
| | 160,000 | | | 5.150%, 12/1/2020 | | | 170,256 | |
| | | | DCP Midstream Operating, LP | | | | |
| | 106,000 | | | 2.500%, 12/1/2017 | | | 105,544 | |
| | | | DCP Midstream, LLC | | | | |
| | 450,000 | | | 5.850%, 5/21/2043f | | | 418,500 | |
| | | | Electricite de France SA | | | | |
| | 1,860,000 | | | 5.250%, 12/29/2049f,h | | | 1,849,770 | |
| | | | Enel Finance International NV | | | | |
| | 157,000 | | | 3.875%, 10/7/2014f | | | 160,405 | |
| | 110,000 | | | 5.125%, 10/7/2019f | | | 117,442 | |
| | | | Energy Transfer Partners, LP | | | | |
| | 212,000 | | | 4.650%, 6/1/2021 | | | 218,072 | |
| | | | Enterprise Products Operating, LLC | | | | |
| | 1,390,000 | | | 7.034%, 1/15/2068 | | | 1,535,950 | |
| | | | Exelon Generation Company, LLC | | | | |
| | 300,000 | | | 5.200%, 10/1/2019 | | | 323,302 | |
| | | | Korea Western Power Company, Ltd. | | | | |
| | 208,000 | | | 2.875%, 10/10/2018f | | | 206,791 | |
| | | | MidAmerican Energy Holdings Company | | | | |
| | 190,000 | | | 1.100%, 5/15/2017f | | | 188,972 | |
| | 230,000 | | | 5.750%, 4/1/2018 | | | 262,543 | |
| | | | National Rural Utilities Cooperative Finance Corporation | | | | |
| | 720,000 | | | 4.750%, 4/30/2043 | | | 670,500 | |
| | | | NiSource Finance Corporation | | | | |
| | 262,000 | | | 6.400%, 3/15/2018 | | | 301,515 | |
| | | | ONEOK Partners, LP | | | | |
| | 104,000 | | | 2.000%, 10/1/2017 | | | 103,492 | |
| | 110,000 | | | 3.200%, 9/15/2018 | | | 112,477 | |
| | | | Pacific Gas & Electric Company | | | | |
| | 104,000 | | | 5.625%, 11/30/2017 | | | 117,829 | |
| | | | PPL Capital Funding, Inc. | | | | |
| | 270,000 | | | 1.900%, 6/1/2018 | | | 263,646 | |
| | | | Southern California Edison Company | | | | |
| | 1,600,000 | | | 6.250%, 8/1/2049h | | | 1,656,000 | |
| | | | TransCanada PipeLines, Ltd. | | | | |
| | 600,000 | | | 6.350%, 5/15/2067 | | | 616,327 | |
| | | | | | | | |
| | | | Total | | | 11,580,465 | |
| | | | | | | | |
| | | | Total Long-Term Fixed Income
(cost $247,630,805) | | | 256,593,636 | |
| | | | | | | | |
| | |
Shares | | | Common Stock (33.3%) | | | |
| Consumer Discretionary (3.5%) | | | | |
| | 8,800 | | | Aaron’s, Inc. | | | 258,720 | |
| | 13,700 | | | Abercrombie & Fitch Company | | | 450,867 | |
| | 32,100 | | | Best Buy Company, Inc. | | | 1,280,148 | |
| | 15,000 | | | Cablevision Systems Corporation | | | 268,950 | |
| | 10,400 | | | CEC Entertainment, Inc. | | | 460,512 | |
| | 54,100 | | | Comcast Corporation | | | 2,811,306 | |
| | 19,900 | | | Dana Holding Corporation | | | 390,438 | |
| | 20,600 | | | Federal-Mogul Corporationj | | | 405,408 | |
| | 127,300 | | | Ford Motor Company | | | 1,964,239 | |
| | 23,100 | | | Home Depot, Inc. | | | 1,902,054 | |
| | 132 | | | Lear Corporation | | | 10,688 | |
| | 14 | | | Lear Corporation Warrants, $0.01, expires 11/9/2014j | | | 2,217 | |
| | 34,900 | | | Lowe’s Companies, Inc. | | | 1,729,295 | |
| | 8,700 | | | Madison Square Garden Companyj | | | 500,946 | |
| | 4,300 | | | McDonald’s Corporation | | | 417,229 | |
| | 16,900 | | | National CineMedia, Inc. | | | 337,324 | |
| | 27,100 | | | Regis Corporation | | | 393,221 | |
| | 105,800 | | | Staples, Inc. | | | 1,681,162 | |
| | 24,800 | | | Starwood Hotels & Resorts Worldwide, Inc. | | | 1,970,360 | |
| | 12,800 | | | Target Corporation | | | 809,856 | |
| | 17,300 | | | Thomson Reuters Corporation | | | 654,286 | |
| | 5,700 | | | Viacom, Inc. | | | 497,838 | |
| | 1,600 | | | Whirlpool Corporation | | | 250,976 | |
| | 5,300 | | | Wyndham Worldwide Corporation | | | 390,557 | |
| | | | | | | | |
| | | | Total | | | 19,838,597 | |
| | | | | | | | |
| |
| Consumer Staples (2.7%) | | | | |
| | 45,200 | | | Altria Group, Inc. | | | 1,735,228 | |
| | 42,900 | | | Coca-Cola Company | | | 1,772,199 | |
| | 36,600 | | | CVS Caremark Corporation | | | 2,619,462 | |
| | 27,300 | | | Dr Pepper Snapple Group, Inc. | | | 1,330,056 | |
| | 17,700 | | | General Mills, Inc. | | | 883,407 | |
| | 21,600 | | | PepsiCo, Inc. | | | 1,791,504 | |
| | 13,300 | | | Prestige Brands Holdings, Inc.j | | | 476,140 | |
| | 20,100 | | | Procter & Gamble Company | | | 1,636,341 | |
| | 10,800 | | | Reynolds American, Inc. | | | 539,892 | |
| | 33,300 | | | Wal-Mart Stores, Inc. | | | 2,620,377 | |
| | | | | | | | |
| | | | Total | | | 15,404,606 | |
| | | | | | | | |
| |
| Energy (3.8%) | | | | |
| | 18,300 | | | Anadarko Petroleum Corporation | | | 1,451,556 | |
| | 42,000 | | | Cabot Oil & Gas Corporation | | | 1,627,920 | |
| | 35,700 | | | Chevron Corporation | | | 4,459,287 | |
| | 41,700 | | | ConocoPhillips | | | 2,946,105 | |
| | 53,300 | | | Exxon Mobil Corporation | | | 5,393,960 | |
| | 61,400 | | | Kinder Morgan, Inc. | | | 2,210,400 | |
| | 19,900 | | | Oceaneering International, Inc. | | | 1,569,712 | |
| | 45,900 | | | RPC, Inc.k | | | 819,315 | |
| | 13,900 | | | Targa Resources Corporation | | | 1,225,563 | |
| | | | | | | | |
| | | | Total | | | 21,703,818 | |
| | | | | | | | |
| |
| Financials (9.4%) | | | | |
| | 26,400 | | | ACE, Ltd. | | | 2,733,192 | |
| | 9,900 | | | Aflac, Inc. | | | 661,320 | |
| | 66,000 | | | American Capital Agency Corporation | | | 1,273,140 | |
| | 9,000 | | | American Financial Group, Inc. | | | 519,480 | |
| | 11,800 | | | Ameriprise Financial, Inc. | | | 1,357,590 | |
| | 97,600 | | | Anworth Mortgage Asset Corporation | | | 410,896 | |
| | 183,600 | | | Ares Capital Corporation | | | 3,262,572 | |
| | 54,700 | | | Ashford Hospitality Trust, Inc. | | | 452,916 | |
The accompanying Notes to Financial Statements are an integral part of this schedule.
31
Diversified Income Plus Fund
Schedule of Investments as of December 31, 2013
| | | | | | | | |
Shares | | | Common Stock (33.3%) | | Value | |
| Financials (9.4%) - continued | |
| | 7,100 | | | Berkshire Hathaway, Inc.j | | $ | 841,776 | |
| | 633,180 | | | BlackRock Enhanced Equity Dividend Trust | | | 5,027,449 | |
| | 13,100 | | | Cash America International, Inc. | | | 501,730 | |
| | 11,230 | | | Coresite Realty Corporation | | | 361,494 | |
| | 14,200 | | | Digital Realty Trust, Inc. | | | 697,504 | |
| | 33,300 | | | Discover Financial Services | | | 1,863,135 | |
| | 3,400 | | | Erie Indemnity Company | | | 248,608 | |
| | 21,500 | | | Excel Trust, Inc. | | | 244,885 | |
| | 42,100 | | | F.N.B. Corporation | | | 531,302 | |
| | 54,800 | | | Fifth Third Bancorp | | | 1,152,444 | |
| | 48,700 | | | First Financial Bancorp | | | 848,841 | |
| | 66,100 | | | First Niagara Financial Group, Inc. | | | 701,982 | |
| | 32,100 | | | Hancock Holding Company | | | 1,177,428 | |
| | 37,400 | | | Hatteras Financial Corporation | | | 611,116 | |
| | 16,700 | | | Horace Mann Educators Corporation | | | 526,718 | |
| | 54,200 | | | Huntington Bancshares, Inc. | | | 523,030 | |
| | 150,000 | | | iShares FTSE NAREIT Mortgage Plus Capped Index Fund | | | 1,728,000 | |
| | 21,600 | | | iShares J.P. Morgan USD Emerging Markets Bond ETF | | | 2,336,256 | |
| | 26,500 | | | KeyCorp | | | 355,630 | |
| | 36,800 | | | Lazard, Ltd. | | | 1,667,776 | |
| | 44,900 | | | Maiden Holdings, Ltd. | | | 490,757 | |
| | 2,400 | | | MasterCard, Inc. | | | 2,005,104 | |
| | 11,900 | | | National Bank Holdings Corporation | | | 254,660 | |
| | 15,700 | | | PartnerRe, Ltd. | | | 1,655,251 | |
| | 21,500 | | | Prudential Financial, Inc. | | | 1,982,730 | |
| | 25,500 | | | Regions Financial Corporation | | | 252,195 | |
| | 10,600 | | | Silver Bay Realty Trust Corporation REIT | | | 169,494 | |
| | 140,000 | | | Solar Capital, Ltd. | | | 3,157,000 | |
| | 21,800 | | | Travelers Companies, Inc. | | | 1,973,772 | |
| | 217,100 | | | Two Harbors Investment Corporation | | | 2,014,688 | |
| | 27,800 | | | U.S. Bancorp | | | 1,123,120 | |
| | 10,700 | | | W.R. Berkley Corporation | | | 464,273 | |
| | 108,200 | | | Wells Fargo & Company | | | 4,912,280 | |
| | | | | | | | |
| | | | Total | | | 53,073,534 | |
| | | | | | | | |
| |
| Health Care (3.6%) | | | | |
| | 60,100 | | | Abbott Laboratories | | | 2,303,633 | |
| | 8,200 | | | AmerisourceBergen Corporation | | | 576,542 | |
| | 7,900 | | | Amgen, Inc. | | | 901,864 | |
| | 6,200 | | | Computer Programs and Systems, Inc. | | | 383,222 | |
| | 7,500 | | | DaVita HealthCare Partners, Inc.j | | | 475,275 | |
| | 8,600 | | | Eli Lilly and Company | | | 438,600 | |
| | 6,900 | | | Forest Laboratories, Inc.j | | | 414,207 | |
| | 7,300 | | | HCA Holdings, Inc.j | | | 348,283 | |
| | 6,200 | | | Henry Schein, Inc.j | | | 708,412 | |
| | 19,300 | | | Johnson & Johnson | | | 1,767,687 | |
| | 7,100 | | | Mallinckrodt, LLCj | | | 371,046 | |
| | 5,200 | | | McKesson Corporation | | | 839,280 | |
| | 55,500 | | | Medtronic, Inc. | | | 3,185,145 | |
| | 68,550 | | | PDL BioPharma, Inc.k | | | 578,562 | |
| | 141,928 | | | Pfizer, Inc. | | | 4,347,255 | |
| | 12,700 | | | Quintiles Transnational Holdings, Inc.j | | | 588,518 | |
| | 8,100 | | | St. Jude Medical, Inc. | | | 501,795 | |
| | 20,700 | | | WellPoint, Inc. | | | 1,912,473 | |
| | | | | | | | |
| | | | Total | | | 20,641,799 | |
| | | | | | | | |
| |
| Industrials (3.9%) | | | | |
| | 10,600 | | | 3M Company | | | 1,486,650 | |
| | 15,500 | | | ADT Corporation | | | 627,285 | |
| | 14,600 | | | Altra Industrial Motion Corporation | | | 499,612 | |
| | 22,900 | | | Brink’s Company | | | 781,806 | |
| | 8,400 | | | C.H. Robinson Worldwide, Inc.k | | | 490,056 | |
| | 8,900 | | | Donaldson Company, Inc. | | | 386,794 | |
| | 14,000 | | | Ennis, Inc. | | | 247,800 | |
| | 90,300 | | | Exelis, Inc. | | | 1,721,118 | |
| | 16,500 | | | Landstar System, Inc. | | | 947,925 | |
| | 12,800 | | | Lockheed Martin Corporation | | | 1,902,848 | |
| | 33,700 | | | Northrop Grumman Corporation | | | 3,862,357 | |
| | 30,200 | | | Raytheon Company | | | 2,739,140 | |
| | 53,500 | | | Republic Services, Inc. | | | 1,776,200 | |
| | 13,100 | | | Roper Industries, Inc. | | | 1,816,708 | |
| | 35,200 | | | Southwest Airlines Company | | | 663,168 | |
| | 17,300 | | | Waste Connections, Inc. | | | 754,799 | |
| | 25,400 | | | Woodward, Inc. | | | 1,158,494 | |
| | | | | | | | |
| | | | Total | | | 21,862,760 | |
| | | | | | | | |
| |
| Information Technology (3.6%) | | | | |
| | 4,900 | | | Accenture plc | | | 402,878 | |
| | 34,300 | | | Agilent Technologies, Inc. | | | 1,961,617 | |
| | 24,800 | | | Altera Corporation | | | 806,744 | |
| | 2,300 | | | Apple, Inc. | | | 1,290,553 | |
| | 24,700 | | | Booz Allen Hamilton Holding Corporation | | | 473,005 | |
| | 133,600 | | | Cisco Systems, Inc. | | | 2,999,320 | |
| | 96,000 | | | Intel Corporation | | | 2,492,160 | |
| | 13,100 | | | International Business Machines Corporation | | | 2,457,167 | |
| | 26,675 | | | Leidos Holdings, Inc.k | | | 1,240,121 | |
| | 17,600 | | | Lexmark International, Inc.k | | | 625,152 | |
| | 31,500 | | | ManTech International Corporationk | | | 942,795 | |
| | 38,400 | | | Microchip Technology, Inc.k | | | 1,718,400 | |
| | 12,500 | | | Motorola Solutions, Inc. | | | 843,750 | |
| | 20,500 | | | Oracle Corporation | | | 784,330 | |
| | 25,500 | | | Take-Two Interactive Software, Inc.j | | | 442,935 | |
| | 31,400 | | | Xerox Corporation | | | 382,138 | |
| | 13,200 | | | Yahoo!, Inc.j | | | 533,808 | |
| | | | | | | | |
| | | | Total | | | 20,396,873 | |
| | | | | | | | |
| |
| Materials (1.0%) | | | | |
| | 120,200 | | | Alcoa, Inc. | | | 1,277,726 | |
| | 4,400 | | | CF Industries Holdings, Inc. | | | 1,025,376 | |
| | 7,100 | | | Innophos Holdings, Inc. | | | 345,060 | |
| | 13,400 | | | Sigma-Aldrich Corporation | | | 1,259,734 | |
| | 63,900 | | | Southern Copper Corporation | | | 1,834,569 | |
| | | | | | | | |
| | | | Total | | | 5,742,465 | |
| | | | | | | | |
| |
| Telecommunications Services (0.8%) | | | | |
| | 83,400 | | | AT&T, Inc. | | | 2,932,344 | |
| | 27,800 | | | Verizon Communications, Inc. | | | 1,366,092 | |
| | | | | | | | |
| | | | Total | | | 4,298,436 | |
| | | | | | | | |
| |
| Utilities (1.0%) | | | | |
| | 22,200 | | | CenterPoint Energy, Inc. | | | 514,596 | |
| | 14,300 | | | Empire District Electric Companyk | | | 324,467 | |
| | 5,400 | | | Laclede Group, Inc. | | | 245,916 | |
| | 10,800 | | | Otter Tail Corporation | | | 316,116 | |
| | 11,200 | | | PG&E Corporation | | | 451,136 | |
The accompanying Notes to Financial Statements are an integral part of this schedule.
32
Diversified Income Plus Fund
Schedule of Investments as of December 31, 2013
| | | | | | | | |
Shares | | | Common Stock (33.3%) | | Value | |
| Utilities (1.0%) - continued | | | | |
| | 15,800 | | | Pinnacle West Capital Corporation | | $ | 836,136 | |
| | 41,400 | | | Southern Company | | | 1,701,954 | |
| | 7,400 | | | WGL Holdings, Inc. | | | 296,444 | |
| | 22,600 | | | Wisconsin Energy Corporation | | | 934,284 | |
| | | | | | | | |
| | | | Total | | | 5,621,049 | |
| | | | | | | | |
| | | | Total Common Stock
(cost $169,584,443) | | | 188,583,937 | |
| | | | | | | | |
| | |
| | | | Preferred Stock (2.5%) | | | |
| Financials (2.5%) | | | | |
| | 64,790 | | | Annaly Capital Management, Inc., 7.500%h | | | 1,425,380 | |
| | 1,200 | | | Bank of America Corporation, Convertible, 7.250%h | | | 1,273,200 | |
| | 20,070 | | | Cobank ACB, 6.250%f,h | | | 1,922,957 | |
| | 24,000 | | | Countrywide Capital V, 7.000% | | | 608,400 | |
| | 30,000 | | | DDR Corporation, 6.250%h | | | 626,400 | |
| | 6,000 | | | Farm Credit Bank of Texas, 6.750%f,h | | | 601,875 | |
| | 44,100 | | | Morgan Stanley, 7.125%h | | | 1,152,774 | |
| | 19,500 | | | PNC Financial Services Group, Inc., 6.125%h | | | 492,375 | |
| | 15,000 | | | Royal Bank of Scotland Group plc, 7.250%h | | | 360,000 | |
| | 15,000 | | | State Street Corporation, 5.250%h | | | 310,500 | |
| | 63,000 | | | The Allstate Corporation, 5.100% | | | 1,518,930 | |
| | 29,400 | | | The Goldman Sachs Group, Inc., 5.500%h | | | 655,326 | |
| | 52,000 | | | U.S. Bancorp, 6.500%h | | | 1,367,600 | |
| | 24,000 | | | Wells Fargo & Company, 5.850%h | | | 565,680 | |
| | 1,200 | | | Wells Fargo & Company, Convertible, 7.500%h | | | 1,326,000 | |
| | | | | | | | |
| | | | Total | | | 14,207,397 | |
| | | | | | | | |
| | | | Total Preferred Stock
(cost $15,131,035) | | | 14,207,397 | |
| | | | | | | | |
| | |
| | | | Collateral Held for Securities Loaned (0.9%) | | | |
| | 5,220,211 | | | Thrivent Cash Management Trust | | | 5,220,211 | |
| | | | | | | | |
| | | | Total Collateral Held for Securities Loaned
(cost $5,220,211) | | | 5,220,211 | |
| | | | | | | | |
| | |
Shares or
Principal
Amount | | | Short-Term Investments (9.5%)l | | | |
| | | | Federal Home Loan Bank Discount Notes | | | | |
| | 100,000 | | | 0.090%, 4/4/2014m | | | 99,977 | |
| | 400,000 | | | 0.100%, 4/23/2014m | | | 399,875 | |
| | 100,000 | | | 0.120%, 5/28/2014m | | | 99,951 | |
| | | | Federal Home Loan Mortgage Corporation Discount Notes | | | | |
| | 700,000 | | | 0.055%, 2/4/2014 | | | 699,964 | |
| | | | Thrivent Cash Management Trust | | | | |
| | 52,295,269 | | | 0.060% | | | 52,295,269 | |
| | | | U.S. Treasury Bill | | | | |
| | 300,000 | | | 0.065%, 6/12/2014n | | | 299,912 | |
| | | | | | | | |
| | | | Total Short-Term Investments (at amortized cost) | | | 53,894,948 | |
| | | | | | | | |
| | | | Total Investments (cost $561,171,533) 103.9% | | $ | 588,399,577 | |
| | | | | | | | |
| | | | Other Assets and Liabilities, Net (3.9%) | | | (21,842,177 | ) |
| | | | | | | | |
| | | | Total Net Assets 100.0% | | $ | 566,557,400 | |
| | | | | | | | |
| a | The stated interest rate represents the weighted average of all contracts within the bank loan facility. |
| b | All or a portion of the loan is unfunded. |
| c | Denotes investments purchased on a when-issued or delayed delivery basis. |
| d | Denotes variable rate securities. Variable rate securities are securities whose yields vary with a designated market index or market rate. The rate shown is as of December 31, 2013. |
| e | All or a portion of the security is insured or guaranteed. |
| f | Denotes securities sold under Rule 144A of the Securities Act of 1933, which exempts them from registration. These securities have been deemed liquid and may be resold to other dealers in the program or to other qualified institutional buyers. As of December 31, 2013, the value of these investments was $44,150,157 or 7.8% of total net assets. |
| g | Denotes interest only security. Interest only securities represent the right to receive monthly interest payments on an underlying pool of mortgages or assets. The principal shown is the outstanding par amount of the pool as of the end of the period. The actual effective yield of the security is different than the stated coupon rate. |
| h | Denotes perpetual securities. Perpetual securities pay an indefinite stream of interest, but may be called by the issuer at an earlier date. |
| i | Denotes restricted securities. Restricted securities are investment securities which have been deemed illiquid and cannot be offered for public sale without first being registered under the Securities Act of 1933. The following table indicates the acquisition date and cost of restricted securities Diversified Income Plus Fund owned as of December 31, 2013. |
| | | | | | | | |
Security | | Acquisition
Date | | | Cost | |
Vericrest Opportunity Loan | | | | | | | | |
Transferee, 3/25/2054 | | | 12/11/2013 | | | $ | 1,493,506 | |
Vericrest Opportunity Loan | | | | | | | | |
Transferee, 4/25/2055 | | | 11/21/2013 | | | | 1,291,576 | |
| j | Non-income producing security. |
| k | All or a portion of the security is on loan. |
| l | The interest rate shown reflects the yield, coupon rate or the discount rate at the date of purchase. |
| m | At December 31, 2013, $599,803 of investments were held on deposit with the counterparty and pledged as the initial margin deposit for open futures contracts. |
| n | At December 31, 2013, $99,971 of investments were pledged as collateral with the custodian under the agreement between the counterparty, the custodian and the fund for open swap contracts. |
The accompanying Notes to Financial Statements are an integral part of this schedule.
33
Diversified Income Plus Fund
Schedule of Investments as of December 31, 2013
Definitions:
| | | | |
| AMT | | - | | Subject to Alternative Minimum Tax |
| Auth. | | - | | Authority |
| ETF | | - | | Exchange Traded Fund. |
| REIT | | - | | Real Estate Investment Trust is a company that buys, develops, manages and/or sells real estate assets. |
| Rev. | | - | | Revenue |
| Ser. | | - | | Series |
Unrealized Appreciation (Depreciation)
Gross unrealized appreciation and depreciation of investments, based on cost for federal income tax purposes, were as follows:
| | | | |
Gross unrealized appreciation | | $ | 33,113,025 | |
Gross unrealized depreciation | | | (5,955,849 | ) |
| | | | |
Net unrealized appreciation (depreciation) | | $ | 27,157,176 | |
| |
Cost for federal income tax purposes | | $ | 561,242,401 | |
The accompanying Notes to Financial Statements are an integral part of this schedule.
34
Diversified Income Plus Fund
Schedule of Investments as of December 31, 2013
Fair Valuation Measurements
The following table is a summary of the inputs used, as of December 31, 2013, in valuing Diversified Income Plus Fund’s assets carried at fair value.
| | | | | | | | | | | | | | | | |
Investments in Securities | | Total | | | Level 1 | | | Level 2 | | | Level 3 | |
Bank Loans | | | | | | | | | | | | | | | | |
Basic Materials | | | 4,280,295 | | | | — | | | | 4,280,295 | | | | — | |
Capital Goods | | | 3,566,993 | | | | — | | | | 3,566,993 | | | | — | |
Communications Services | | | 20,054,095 | | | | — | | | | 20,054,095 | | | | — | |
Consumer Cyclical | | | 15,777,331 | | | | — | | | | 15,777,331 | | | | — | |
Consumer Non-Cyclical | | | 7,722,616 | | | | — | | | | 7,722,616 | | | | — | |
Energy | | | 4,402,846 | | | | — | | | | 4,402,846 | | | | — | |
Financials | | | 2,743,637 | | | | — | | | | 2,743,637 | | | | — | |
Technology | | | 4,236,648 | | | | — | | | | 4,236,648 | | | | — | |
Transportation | | | 4,552,662 | | | | — | | | | 4,552,662 | | | | — | |
Utilities | | | 2,562,325 | | | | — | | | | 2,562,325 | | | | — | |
Long-Term Fixed Income | | | | | | | | | | | | | | | | |
Asset-Backed Securities | | | 7,659,937 | | | | — | | | | 7,659,937 | | | | — | |
Basic Materials | | | 5,062,326 | | | | — | | | | 5,062,326 | | | | — | |
Capital Goods | | | 5,394,683 | | | | — | | | | 5,394,683 | | | | — | |
Collateralized Mortgage Obligations | | | 80,633,358 | | | | — | | | | 80,633,358 | | | | — | |
Commercial Mortgage-Backed Securities | | | 3,483,551 | | | | — | | | | 3,483,551 | | | | — | |
Communications Services | | | 14,621,416 | | | | — | | | | 14,621,416 | | | | — | |
Consumer Cyclical | | | 11,459,260 | | | | — | | | | 11,459,260 | | | | — | |
Consumer Non-Cyclical | | | 13,239,893 | | | | — | | | | 13,239,893 | | | | — | |
Energy | | | 9,984,590 | | | | — | | | | 9,984,590 | | | | — | |
Financials | | | 50,781,055 | | | | — | | | | 50,781,055 | | | | — | |
Foreign Government | | | 1,554,300 | | | | — | | | | 1,554,300 | | | | — | |
Mortgage-Backed Securities | | | 17,517,962 | | | | — | | | | 17,517,962 | | | | — | |
Technology | | | 3,984,933 | | | | — | | | | 3,984,933 | | | | — | |
Transportation | | | 2,581,428 | | | | — | | | | 2,581,428 | | | | — | |
U.S. Government and Agencies | | | 2,247,979 | | | | — | | | | 2,247,979 | | | | — | |
U.S. Municipals | | | 14,806,500 | | | | — | | | | 14,806,500 | | | | — | |
Utilities | | | 11,580,465 | | | | — | | | | 11,580,465 | | | | — | |
Common Stock | | | | | | | | | | | | | | | | |
Consumer Discretionary | | | 19,838,597 | | | | 19,838,597 | | | | — | | | | — | |
Consumer Staples | | | 15,404,606 | | | | 15,404,606 | | | | — | | | | — | |
Energy | | | 21,703,818 | | | | 21,703,818 | | | | — | | | | — | |
Financials | | | 53,073,534 | | | | 53,073,534 | | | | — | | | | — | |
Health Care | | | 20,641,799 | | | | 20,641,799 | | | | — | | | | — | |
Industrials | | | 21,862,760 | | | | 21,862,760 | | | | — | | | | — | |
Information Technology | | | 20,396,873 | | | | 20,396,873 | | | | — | | | | — | |
Materials | | | 5,742,465 | | | | 5,742,465 | | | | — | | | | — | |
Telecommunications Services | | | 4,298,436 | | | | 4,298,436 | | | | — | | | | — | |
Utilities | | | 5,621,049 | | | | 5,621,049 | | | | — | | | | — | |
Preferred Stock | | | | | | | | | | | | | | | | |
Financials | | | 14,207,397 | | | | 11,682,565 | | | | 2,524,832 | | | | — | |
Collateral Held for Securities Loaned | | | 5,220,211 | | | | 5,220,211 | | | | — | | | | — | |
Short-Term Investments | | | 53,894,948 | | | | 52,295,269 | | | | 1,599,679 | | | | — | |
| | | | | | | | | | | | | | | | |
Total | | $ | 588,399,577 | | | $ | 257,781,982 | | | $ | 330,617,595 | | | $ | — | |
| | | | | | | | | | | | | | | | |
| | | | |
Other Financial Instruments | | Total | | | Level 1 | | | Level 2 | | | Level 3 | |
Asset Derivatives | | | | | | | | | | | | | | | | |
Futures Contracts | | | 498,066 | | | | 498,066 | | | | — | | | | — | |
Credit Default Swaps | | | 8,860 | | | | — | | | | 8,860 | | | | — | |
| | | | | | | | | | | | | | | | |
Total Asset Derivatives | | $ | 506,926 | | | $ | 498,066 | | | $ | 8,860 | | | $ | — | |
| | | | | | | | | | | | | | | | |
Liability Derivatives | | | | | | | | | | | | | | | | |
Futures Contracts | | | 61,666 | | | | 61,666 | | | | — | | | | — | |
| | | | | | | | | | | | | | | | |
Total Liability Derivatives | | $ | 61,666 | | | $ | 61,666 | | | $ | — | | | $ | — | |
| | | | | | | | | | | | | | | | |
There were no significant transfers between Levels during the period ended December 31, 2013. Transfers between Levels are identified as of the end of the period.
The accompanying Notes to Financial Statements are an integral part of this schedule.
35
Diversified Income Plus Fund
Schedule of Investments as of December 31, 2013
| | | | | | | | | | | | | | | | | | | | |
Futures Contracts | | Number of
Contracts
Long/(Short) | | | Expiration Date | | | Notional
Principal
Amount | | | Value | | | Unrealized
Gain/(Loss) | |
5-Yr. U.S. Treasury Bond Futures | | | 39 | | | | March 2014 | | | $ | 4,714,854 | | | $ | 4,653,188 | | | ($ | 61,666 | ) |
10-Yr. U.S. Treasury Bond Futures | | | (130 | ) | | | March 2014 | | | | (16,300,385 | ) | | | (15,996,094 | ) | | | 304,291 | |
S&P 500 Index Mini-Futures | | | 64 | | | | March 2014 | | | | 5,697,745 | | | | 5,891,520 | | | | 193,775 | |
Total Futures Contracts | | | | | | | | | | | | | | | | | | $ | 436,400 | |
| | | | | |
Credit Default Swaps and Counterparty | | Buy/Sell Protection1 | | | Termination Date | | | Notional
Principal
Amount2 | | | Value3 | | | Unrealized
Gain/(Loss) | |
CDX HY 21, 5 Year, at 5.00%; Bank of | | | Sell | | | | 12/20/2018 | | | $ | 1,200,000 | | | $ | 8,860 | | | $ | 8,860 | |
America | | | | | | | | | | | | | | | | | | | | |
Total Credit Default Swaps | | | | | | | | | | | | | | $ | 8,860 | | | $ | 8,860 | |
| 1 | As the buyer of protection, Diversified Income Plus Fund pays periodic fees in return for payment by the seller which is contingent upon an adverse credit event occurring in the underlying issuer or reference entity. As the seller of protection, Diversified Income Plus Fund collects periodic fees from the buyer and profits if the credit of the underlying issuer or reference entity remains stable or improves while the swap is outstanding, but the seller in a credit default swap contract would be required to pay the amount of credit loss, determined as specified in the agreement, to the buyer in the event of an adverse credit event in the reference entity. |
| 2 | The maximum potential amount of future payments Diversified Income Plus Fund could be required to make as the seller or receive as the buyer of protection. |
| 3 | The values for credit indexes (CDX or LCDX) serve as an indicator of the current status of the payment/performance risk and represent the liability or profit for the credit default swap contract had the contract been closed as of the reporting date. When protection has been sold, the value of the swap will increase when the swap spread declines representing an improvement in the reference entity’s credit worthiness. The value of the swap will decrease when the swap spread increases representing a deterioration in the reference entity’s credit worthiness. When protection has been purchased, the value of the swap will increase when the swap spread increases representing a deterioration in the reference entity’s credit worthiness. The value of the swap will decrease when the swap spread declines representing an improvement in the reference entity’s credit worthiness. |
The following table summarizes the fair value and Statement of Assets and Liabilities location, as of December 31, 2013, for Diversified Income Plus Fund’s investments in financial derivative instruments by primary risk exposure as discussed under item (2) Significant Accounting Policies of the Notes to Financial Statements.
| | | | | | |
Derivatives by risk category | | Statement of Assets and Liabilities Location | | Fair Value | |
Asset Derivatives | | | | | | |
Interest Rate Contracts | | | | | | |
Futures* | | Net Assets - Net unrealized appreciation/(depreciation) on Futures contracts | | | 304,291 | |
Total Interest Rate Contracts | | | | | 304,291 | |
Equity Contracts | | | | | | |
Futures* | | Net Assets - Net unrealized appreciation/(depreciation) on Futures contracts | | | 193,775 | |
Total Equity Contracts | | | | | 193,775 | |
Credit Contracts | | | | | | |
Credit Default Swaps | | Net Assets - Net unrealized appreciation/(depreciation) on Swap agreements | | | 8,860 | |
Total Credit Contracts | | | | | 8,860 | |
| | | | | | |
Total Asset Derivatives | | | | $ | 506,926 | |
| | | | | | |
Liability Derivatives | | | | | | |
Interest Rate Contracts | | | | | | |
Futures* | | Net Assets - Net unrealized appreciation/(depreciation) on Futures contracts | | | 61,666 | |
Total Interest Rate Contracts | | | | | 61,666 | |
| | | | | | |
Total Liability Derivatives | | | | $ | 61,666 | |
| | | | | | |
| * | Includes cumulative appreciation/depreciation of futures contracts as reported in the Schedule of Investments. Only current day’s variation margin is reported within the Statement of Assets and Liabilities. |
The accompanying Notes to Financial Statements are an integral part of this schedule.
36
Diversified Income Plus Fund
Schedule of Investments as of December 31, 2013
The following table summarizes the net realized gains/(losses) and Statement of Operations location, for the period ended December 31, 2013, for Diversified Income Plus Fund’s investments in financial derivative instruments by primary risk exposure.
| | | | | | |
Derivatives by risk category | | Statement of Operations Location | | Realized Gains/(Losses)
recognized in Income | |
Equity Contracts | | | | | | |
Options Written | | Net realized gains/(losses) on Written option contracts | | | 13,750 | |
Futures | | Net realized gains/(losses) on Futures contracts | | | (2,728,313 | ) |
Total Equity Contracts | | | | | (2,714,563 | ) |
Interest Rate Contracts | | | | | | |
Futures | | Net realized gains/(losses) on Futures contracts | | | (253,137 | ) |
Total Interest Rate Contracts | | | | | (253,137 | ) |
Credit Contracts | | | | | | |
Credit Default Swaps | | Net realized gains/(losses) on Swap agreements | | | 18,155 | |
Total Credit Contracts | | | | | 18,155 | |
| | | | | | |
Total | | | | ($ | 2,949,545 | ) |
| | | | | | |
The following table summarizes the change in net unrealized appreciation/(depreciation) and Statement of Operations location, for the period ended December 31, 2013, for Diversified Income Plus Fund’s investments in financial derivative instruments by primary risk exposure.
| | | | | | |
Derivatives by risk category | | Statement of Operations Location | | Change in unrealized
appreciation/(depreciation)
recognized in Income | |
Interest Rate Contracts | | | | | | |
Futures | | Change in net unrealized appreciation/(depreciation) on Futures contracts | | | 242,618 | |
Total Interest Rate Contracts | | | | | 242,618 | |
Equity Contracts | | | | | | |
Futures | | Change in net unrealized appreciation/(depreciation) on Futures contracts | | | 227,455 | |
Total Equity Contracts | | | | | 227,455 | |
Credit Contracts | | | | | | |
Credit Default Swaps | | Change in net unrealized appreciation/(depreciation) on Swap agreements | | | 8,860 | |
Total Credit Contracts | | | | | 8,860 | |
| | | | | | |
Total | | | | $ | 478,933 | |
| | | | | | |
The following table presents Diversified Income Plus Fund’s average volume of derivative activity during the period ended December 31, 2013.
| | | | | | | | | | | | | | | | |
Derivative Risk Category | | Futures
(Notional)* | | | Futures
(Percentage of
Average Net Assets) | | | Swaps
(Notional)* | | | Options
(Contracts) | |
Equity Contracts | | $ | 16,772,333 | | | | 3.6 | % | | | N/A | | | | 1 | |
Interest Rate Contracts | | | 12,391,347 | | | | 2.6 | | | | N/A | | | | N/A | |
Credit Contracts | | | N/A | | | | N/A | | | $ | 46,641 | | | | N/A | |
| * | Notional amount represents long or short, or both, derivative positions held by the Fund. |
The accompanying Notes to Financial Statements are an integral part of this schedule.
37
Diversified Income Plus Fund
Schedule of Investments as of December 31, 2013
Investment in Affiliates
Affiliated issuers, as defined under the Investment Company Act of 1940, include those in which the Fund’s holdings of an issuer represent 5% or more of the outstanding voting securities of an issuer, or any affiliated mutual fund.
A summary of transactions for the fiscal year to date, in Diversified Income Plus Fund, is as follows:
| | | | | | | | | | | | | | | | | | | | | | | | |
Fund | | Value
December 31, 2012 | | | Gross
Purchases | | | Gross
Sales | | | Shares Held at
December 31, 2013 | | | Value
December 31, 2013 | | | Income Earned
January 1, 2013 -
December 31, 2013 | |
Cash Management Trust- Collateral Investment | | $ | 5,762,100 | | | $ | 66,702,617 | | | $ | 67,244,506 | | | | 5,220,211 | | | $ | 5,220,211 | | | $ | 58,584 | |
Cash Management Trust- Short Term Investment | | | 43,832,825 | | | | 266,758,801 | | | | 258,296,357 | | | | 52,295,269 | | | | 52,295,269 | | | | 45,790 | |
Total Value and Income Earned | | | 49,594,925 | | | | | | | | | | | | | | | | 57,515,480 | | | | 104,374 | |
The accompanying Notes to Financial Statements are an integral part of this schedule.
38
Natural Resources Fund
Schedule of Investments as of December 31, 2013
| | | | | | | | |
Shares | | | Common Stock (95.3%) | | Value | |
| Coal & Consumable Fuels (2.7%) | | | | |
| | 140,900 | | | Alpha Natural Resources, Inc.a | | $ | 1,006,026 | |
| | 91,200 | | | Peabody Energy Corporation | | | 1,781,136 | |
| | | | | | | | |
| | | | Total | | | 2,787,162 | |
| | | | | | | | |
| Consumer Staples (10.8%) | | | | |
| | 89,700 | | | Archer-Daniels-Midland Company | | | 3,892,980 | |
| | 41,000 | | | Bunge, Ltd. | | | 3,366,510 | |
| | 55,900 | | | Ingredion, Inc. | | | 3,826,914 | |
| | | | | | | | |
| | | | Total | | | 11,086,404 | |
| | | | | | | | |
| Financials (5.6%) | | | | |
| | 41,700 | | | DDR Corporation | | | 640,929 | |
| | 30,500 | | | Prologis, Inc. | | | 1,126,975 | |
| | 20,300 | | | RLJ Lodging Trust | | | 493,696 | |
| | 29,800 | | | SPDR Gold Trusta,b | | | 3,461,866 | |
| | | | | | | | |
| | | | Total | | | 5,723,466 | |
| | | | | | | | |
| Integrated Oil & Gas (11.9%) | | | | |
| | 40,600 | | | Chevron Corporation | | | 5,071,346 | |
| | 28,700 | | | Occidental Petroleum Corporation | | | 2,729,370 | |
| | 99,600 | | | Petroleo Brasileiro SA ADR | | | 1,372,488 | |
| | 48,600 | | | Total SA ADR | | | 2,977,722 | |
| | | | | | | | |
| | | | Total | | | 12,150,926 | |
| | | | | | | | |
| Materials (5.3%) | | | | |
| | 41,300 | | | Cliffs Natural Resources, Inc.b | | | 1,082,473 | |
| | 37,300 | | | Mosaic Company | | | 1,763,171 | |
| | 20,407 | | | Southern Copper Corporation | | | 585,885 | |
| | 52,400 | | | Teck Resources, Ltd. | | | 1,362,924 | |
| | 38,100 | | | Walter Energy, Inc.b | | | 633,603 | |
| | | | | | | | |
| | | | Total | | | 5,428,056 | |
| | | | | | | | |
| Oil & Gas Equipment & Services (20.6%) | | | | |
| | 41,000 | | | Dril-Quip, Inc.a | | | 4,507,130 | |
| | 750 | | | Frank’s International NV | | | 20,250 | |
| | 67,700 | | | National Oilwell Varco, Inc. | | | 5,384,181 | |
| | 85,300 | | | Schlumberger, Ltd. | | | 7,686,383 | |
| | 226,000 | | | Weatherford International, Ltd.a | | | 3,500,740 | |
| | | | | | | | |
| | | | Total | | | 21,098,684 | |
| | | | | | | | |
| Oil & Gas Exploration & Production (22.2%) | | | | |
| | 127,200 | | | Cobalt International Energy, Inc.a | | | 2,092,440 | |
| | 23,800 | | | Concho Resources, Inc.a | | | 2,570,400 | |
| | 21,500 | | | EOG Resources, Inc. | | | 3,608,560 | |
| | 42,700 | | | EQT Corporation | | | 3,833,606 | |
| | 88,300 | | | Marathon Oil Corporation | | | 3,116,990 | |
| | 53,200 | | | Oasis Petroleum, Inc.a | | | 2,498,804 | |
| | 39,000 | | | SM Energy Company | | | 3,241,290 | |
| | 44,500 | | | Southwestern Energy Companya | | | 1,750,185 | |
| | | | | | | | |
| | | | Total | | | 22,712,275 | |
| | | | | | | | |
| Oil & Gas Refining & Marketing (2.6%) | | | | |
| | 53,100 | | | Valero Energy Corporation | | | 2,676,240 | |
| | | | | | | | |
| | | | Total | | | 2,676,240 | |
| | | | | | | | |
| Real Estate Investment Trusts (13.6%) | | | | |
| | 18,223 | | | Boston Properties, Inc. | | | 1,829,042 | |
| | 13,700 | | | Camden Property Trust | | | 779,256 | |
| | 33,395 | | | Equity Residential | | | 1,732,199 | |
| | 20,187 | | | Health Care REIT, Inc. | | | 1,081,418 | |
| | 27,900 | | | Host Hotels & Resorts, Inc. | | | 542,376 | |
| | 56,100 | | | Kimco Realty Corporation | | | 1,107,975 | |
| | 11,300 | | | Macerich Company | | | 665,457 | |
| | 6,910 | | | Public Storage, Inc. | | | 1,040,093 | |
| | 19,426 | | | Simon Property Group, Inc. | | | 2,955,860 | |
| | 21,400 | | | Tanger Factory Outlet Centers, Inc. | | | 685,228 | |
| | 16,947 | | | Vornado Realty Trust | | | 1,504,724 | |
| | | | | | | | |
| | | | Total | | | 13,923,628 | |
| | | | | | | | |
| | | | Total Common Stock (cost $87,970,869) | | | 97,586,841 | |
| | | | | | | | |
| | |
| | | | Collateral Held for Securities Loaned (5.2%) | | | |
| | 5,291,600 | | | Thrivent Cash Management Trust | | | 5,291,600 | |
| | | | | | | | |
| | | | Total Collateral Held for Securities Loaned (cost $5,291,600) | | | 5,291,600 | |
| | | | | | | | |
| | |
Shares or
Principal
Amount | | | Short-Term Investments (4.5%)c | | | |
| | 4,661,263 | | | Thrivent Cash Management Trust 0.060% | | | 4,661,263 | |
| | | | | | | | |
| | | | Total Short-Term Investments (at amortized cost) | | | 4,661,263 | |
| | | | | | | | |
| | | | Total Investments (cost $97,923,732) 105.0% | | $ | 107,539,704 | |
| | | | | | | | |
| | | | Other Assets and Liabilities, Net (5.0%) | | | (5,157,519 | ) |
| | | | | | | | |
| | | | Total Net Assets 100.0% | | $ | 102,382,185 | |
| | | | | | | | |
| a | Non-income producing security. |
| b | All or a portion of the security is on loan. |
| c | The interest rate shown reflects the yield, coupon rate or the discount rate at the date of purchase. |
Definitions:
| | | | |
| ADR | | - | | American Depositary Receipt, which are certificates for an underlying foreign security’s shares held by an issuing U.S. depository bank. |
| REIT | | - | | Real Estate Investment Trust is a company that buys, develops, manages and/or sells real estate assets. |
Unrealized Appreciation (Depreciation)
Gross unrealized appreciation and depreciation of investments,based on cost for federal income tax purposes, were as follows:
| | | | |
Gross unrealized appreciation | | $ | 21,402,766 | |
Gross unrealized depreciation | | | (11,843,871 | ) |
| | | | |
Net unrealized appreciation (depreciation) | | $ | 9,558,895 | |
| |
Cost for federal income tax purposes | | $ | 97,980,809 | |
The accompanying Notes to Financial Statements are an integral part of this schedule.
39
Natural Resources Fund
Schedule of Investments as of December 31, 2013
Fair Valuation Measurements
The following table is a summary of the inputs used, as of December 31, 2013, in valuing Natural Resources Fund’s assets carried at fair value.
| | | | | | | | | | | | | | | | |
Investments in Securities | | Total | | | Level 1 | | | Level 2 | | | Level 3 | |
Common Stock | | | | | | | | | | | | | | | | |
Coal & Consumable Fuels | | | 2,787,162 | | | | 2,787,162 | | | | — | | | | — | |
Consumer Staples | | | 11,086,404 | | | | 11,086,404 | | | | — | | | | — | |
Financials | | | 5,723,466 | | | | 5,723,466 | | | | — | | | | — | |
Integrated Oil & Gas | | | 12,150,926 | | | | 12,150,926 | | | | — | | | | — | |
Materials | | | 5,428,056 | | | | 5,428,056 | | | | — | | | | — | |
Oil & Gas Equipment & Services | | | 21,098,684 | | | | 21,098,684 | | | | — | | | | — | |
Oil & Gas Exploration & Production | | | 22,712,275 | | | | 22,712,275 | | | | — | | | | — | |
Oil & Gas Refining & Marketing | | | 2,676,240 | | | | 2,676,240 | | | | — | | | | — | |
Real Estate Investment Trusts | | | 13,923,628 | | | | 13,923,628 | | | | — | | | | — | |
Collateral Held for Securities Loaned | | | 5,291,600 | | | | 5,291,600 | | | | — | | | | — | |
Short-Term Investments | | | 4,661,263 | | | | 4,661,263 | | | | — | | | | — | |
| | | | | | | | | | | | | | | | |
Total | | $ | 107,539,704 | | | $ | 107,539,704 | | | $ | — | | | $ | — | |
| | | | | | | | | | | | | | | | |
There were no significant transfers between Levels during the period ended December 31, 2013. Transfers between Levels are identified as of the end of the period.
The following table summarizes the net realized gains/(losses) and Statement of Operations location, for the period ended December 31, 2013, for Natural Resources Fund’s investments in financial derivative instruments by primary risk exposure.
| | | | | | |
Derivatives by risk category | | Statement of Operations Location | | Realized Gains/(Losses)
recognized in Income | |
Foreign Exchange Contracts | | | | | | |
Forward Contracts | | Net realized gains/(losses) on Foreign currency transactions | | | 20,772 | |
Total Foreign Exchange Contracts | | | | | 20,772 | |
| | | | | | |
Total | | | | $ | 20,772 | |
| | | | | | |
The following table presents Natural Resources Fund’s average volume of derivative activity during the period ended December 31, 2013.
| | | | |
Derivative Risk Category | | Forwards
(Notional)* | |
Foreign Exchange Contracts | | ($ | 8,953 | ) |
| * | Notional amount represents long or short, derivative positions held by the fund. |
Investment in Affiliates
Affiliated issuers, as defined under the Investment Company Act of 1940, include those in which the Fund’s holdings of an issuer represent 5% or more of the outstanding voting securities of an issuer, or any affiliated mutual fund.
A summary of transactions for the fiscal year to date, in Natural Resources Fund, is as follows:
| | | | | | | | | | | | | | | | | | | | | | | | |
Fund | | Value
December 31, 2012 | | | Gross
Purchases | | | Gross
Sales | | | Shares Held at
December 31, 2013 | | | Value
December 31, 2013 | | | Income Earned
January 1, 2013 -
December 31, 2013 | |
Cash Management Trust- Collateral Investment | | $ | 9,494,200 | | | $ | 63,544,721 | | | $ | 67,747,321 | | | | 5,291,600 | | | $ | 5,291,600 | | | $ | 29,192 | |
Cash Management Trust- Short Term Investment | | | 2,775,481 | | | | 7,779,974 | | | | 5,894,192 | | | | 4,661,263 | | | | 4,661,263 | | | | 2,755 | |
Total Value and Income Earned | | | 12,269,681 | | | | | | | | | | | | | | | | 9,952,863 | | | | 31,947 | |
The accompanying Notes to Financial Statements are an integral part of this schedule.
40
Thrivent Mutual Funds
Statement of Assets and Liabilities
| | | | | | | | | | | | |
As of December 31, 2013 | | Growth and
Income Plus
Fund | | | Diversified
Income Plus
Fund | | | Natural
Resources Fund | |
Assets | | | | | | | | | | | | |
Investments at cost | | $ | 49,271,695 | | | $ | 561,171,533 | | | $ | 97,923,732 | |
Investments in securities at value | | | 50,417,911 | | | | 530,884,097 | | | | 97,586,841 | |
Investments in affiliates at value | | | 2,877,246 | | | | 57,515,480 | | | | 9,952,863 | |
Investments at Value | | | 53,295,157 | | | | 588,399,577 | | | | 107,539,704 | |
Cash | | | 1,812 | | | | 27,856 | | | | — | |
Dividends and interest receivable | | | 148,676 | | | | 2,907,418 | | | | 234,718 | |
Prepaid expenses | | | 7,215 | | | | 8,874 | | | | 6,125 | |
Receivable for investments sold | | | 535,448 | | | | 3,511,291 | | | | — | |
Receivable for fund shares sold | | | 54,026 | | | | 538,609 | | | | 13,135 | |
Receivable for variation margin | | | 4,240 | | | | 46,038 | | | | — | |
Total Assets | | | 54,046,574 | | | | 595,439,663 | | | | 107,793,682 | |
Liabilities | | | | | | | | | | | | |
Accrued expenses | | | 23,307 | | | | 89,690 | | | | 26,929 | |
Payable for investments purchased | | | 1,837,224 | | | | 22,908,640 | | | | — | |
Payable upon return of collateral for securities loaned | | | — | | | | 5,220,211 | | | | 5,291,600 | |
Payable for fund shares redeemed | | | 19,052 | | | | 224,102 | | | | 16,422 | |
Payable for variation margin | | | — | | | | 3,656 | | | | — | |
Payable to affiliate | | | 34,368 | | | | 422,140 | | | | 76,546 | |
Mortgage dollar roll deferred revenue | | | 1,528 | | | | 13,824 | | | | — | |
Total Liabilities | | | 1,915,479 | | | | 28,882,263 | | | | 5,411,497 | |
Net Assets | | | | | | | | | | | | |
Capital stock (beneficial interest) | | | 48,119,158 | | | | 538,913,486 | | | | 105,065,223 | |
Accumulated undistributed net investment income/(loss) | | | 49,084 | | | | 724,056 | | | | (18,471 | ) |
Accumulated undistributed net realized gain/(loss) | | | (97,822 | ) | | | (753,446 | ) | | | (12,280,485 | ) |
Net unrealized appreciation/(depreciation) on: | | | | | | | | | | | | |
Investments | | | 4,023,462 | | | | 27,228,044 | | | | 9,615,972 | |
Futures contracts | | | 37,213 | | | | 436,400 | | | | — | |
Foreign currency transactions | | | — | | | | — | | | | (54 | ) |
Swap agreements | | | — | | | | 8,860 | | | | — | |
Total Net Assets | | $ | 52,131,095 | | | $ | 566,557,400 | | | $ | 102,382,185 | |
Class A Share Capital | | $ | 49,823,960 | | | $ | 459,060,500 | | | $ | 15,801,763 | |
Shares of beneficial interest outstanding (Class A) | | | 4,798,914 | | | | 63,354,999 | | | | 1,587,544 | |
Net asset value per share | | $ | 10.38 | | | $ | 7.25 | | | $ | 9.95 | |
Maximum public offering price | | $ | 10.98 | | | $ | 7.59 | | | $ | 10.53 | |
Institutional Class Share Capital | | $ | 2,307,135 | | | $ | 107,496,900 | | | $ | 86,580,422 | |
Shares of beneficial interest outstanding (Institutional Class) | | | 221,959 | | | | 14,946,300 | | | | 8,697,129 | |
Net asset value per share | | $ | 10.39 | | | $ | 7.19 | | | $ | 9.96 | |
The accompanying Notes to Financial Statements are an integral part of this schedule.
41
Thrivent Mutual Funds
Statement of Operations
| | | | | | | | | | | | |
For the year ended December 31, 2013 | | Growth and
Income Plus
Fund | | | Diversified
Income Plus
Fund | | | Natural
Resources Fund | |
Investment Income | | | | | | | | | | | | |
Dividends | | $ | 1,467,295 | | | $ | 5,796,607 | | | $ | 1,501,035 | |
Taxable interest | | | 261,510 | | | | 13,819,108 | | | | 1,183 | |
Income from mortgage dollar rolls | | | 19,585 | | | | 594,808 | | | | — | |
Income from securities loaned | | | — | | | | 58,584 | | | | 29,192 | |
Income from affiliated investments | | | 2,743 | | | | 45,790 | | | | 2,755 | |
Foreign tax withholding | | | (19,139 | ) | | | (1,783 | ) | | | (25,211 | ) |
Total Investment Income | | | 1,731,994 | | | | 20,313,114 | | | | 1,508,954 | |
Expenses | | | | | | | | | | | | |
Adviser fees | | | 397,276 | | | | 2,571,918 | | | | 791,402 | |
Administrative service fees | | | 81,307 | | | | 156,510 | | | | 88,301 | |
Audit and legal fees | | | 21,052 | | | | 26,000 | | | | 22,004 | |
Custody fees | | | 34,306 | | | | 51,804 | | | | 4,716 | |
Distribution expenses Class A | | | 93,372 | | | | 950,619 | | | | 38,669 | |
Insurance expenses | | | 4,179 | | | | 5,850 | | | | 4,363 | |
Printing and postage expenses Class A | | | 16,165 | | | | 86,994 | | | | 15,380 | |
Printing and postage expenses Institutional Class | | | 792 | | | | 7,426 | | | | 515 | |
SEC and state registration expenses | | | 33,338 | | | | 115,873 | | | | 28,252 | |
Transfer agent fees Class A | | | 73,564 | | | | 343,961 | | | | 75,793 | |
Transfer agent fees Institutional Class | | | 2,042 | | | | 43,898 | | | | 781 | |
Trustees’ fees | | | 7,254 | | | | 26,198 | | | | 8,319 | |
Other expenses | | | 14,920 | | | | 32,995 | | | | 9,490 | |
Total Expenses Before Reimbursement | | | 779,567 | | | | 4,420,046 | | | | 1,087,985 | |
Less: | | | | | | | | | | | | |
Reimbursement from adviser | | | (159,881 | ) | | | (7,961 | ) | | | (78,370 | ) |
Custody earnings credit | | | (11 | ) | | | (57 | ) | | | (5 | ) |
Total Net Expenses | | | 619,675 | | | | 4,412,028 | | | | 1,009,610 | |
Net Investment Income/(Loss) | | | 1,112,319 | | | | 15,901,086 | | | | 499,344 | |
Realized and Unrealized Gains/(Losses) | | | | | | | | | | | | |
Net realized gains/(losses) on: | | | | | | | | | | | | |
Investments | | | 5,161,830 | | | | 17,615,729 | | | | 4,536,388 | |
In-kind redemptions | | | 4,462,784 | | | | — | | | | — | |
Distributions of realized capital gains from affiliated investments | | | 3 | | | | 61 | | | | 13 | |
Written option contracts | | | — | | | | 13,750 | | | | — | |
Futures contracts | | | 423,538 | | | | (2,981,450 | ) | | | — | |
Foreign currency transactions | | | — | | | | — | | | | (3,673 | ) |
Swap agreements | | | — | | | | 18,155 | | | | — | |
Change in net unrealized appreciation/(depreciation) on: | | | | | | | | | | | | |
Investments | | | 1,110,315 | | | | 12,925,269 | | | | 4,128,104 | |
Futures contracts | | | 41,593 | | | | 470,073 | | | | — | |
Foreign currency transactions | | | — | | | | — | | | | 116 | |
Swap agreements | | | — | | | | 8,860 | | | | — | |
Net Realized and Unrealized Gains/(Losses) | | | 11,200,063 | | | | 28,070,447 | | | | 8,660,948 | |
Net Increase/(Decrease) in Net Assets Resulting From Operations | | $ | 12,312,382 | | | $ | 43,971,533 | | | $ | 9,160,292 | |
The accompanying Notes to Financial Statements are an integral part of this schedule.
42
Thrivent Mutual Funds
Statement of Changes in Net Assets
| | | | | | | | | | | | | | | | |
| | | Growth and Income Plus Fund | | | Diversified Income Plus Fund | |
For the periods ended | | 12/31/2013 | | | 12/31/2012 | | | 12/31/2013 | | | 12/31/2012 | |
Operations | | | | | | | | | | | | | | | | |
Net investment income/(loss) | | $ | 1,112,319 | | | $ | 1,385,941 | | | $ | 15,901,086 | | | $ | 11,445,522 | |
Net realized gains/(losses) | | | 10,048,155 | | | | 2,650,694 | | | | 14,666,245 | | | | 5,870,154 | |
Change in net unrealized appreciation/(depreciation) | | | 1,151,908 | | | | 2,789,481 | | | | 13,404,202 | | | | 16,722,735 | |
Net Change in Net Assets Resulting From Operations | | | 12,312,382 | | | | 6,826,116 | | | | 43,971,533 | | | | 34,038,411 | |
Distributions to Shareholders | | | | | | | | | | | | | | | | |
From net investment income Class A | | | (670,542 | ) | | | (532,917 | ) | | | (12,832,895 | ) | | | (9,729,680 | ) |
From net investment income Institutional Class | | | (437,400 | ) | | | (850,648 | ) | | | (3,288,301 | ) | | | (1,476,076 | ) |
| | | | | | | | | | | | | | | | |
Total From Net Investment Income | | | (1,107,942 | ) | | | (1,383,565 | ) | | | (16,121,196 | ) | | | (11,205,756 | ) |
| | | | | | | | | | | | | | | | |
From net realized gains Class A | | | (4,500,101 | ) | | | — | | | | (1,969,970 | ) | | | — | |
From net realized gains Institutional Class | | | (210,357 | ) | | | — | | | | (464,187 | ) | | | — | |
| | | | | | | | | | | | | | | | |
Total From Net Realized Gains | | | (4,710,458 | ) | | | — | | | | (2,434,157 | ) | | | — | |
| | | | | | | | | | | | | | | | |
Total Distributions to Shareholders | | | (5,818,400 | ) | | | (1,383,565 | ) | | | (18,555,353 | ) | | | (11,205,756 | ) |
Capital Stock Transactions | | | | | | | | | | | | | | | | |
Class A | | | | | | | | | | | | | | | | |
Sold | | | 26,107,853 | | | | 7,622,174 | | | | 183,195,143 | | | | 93,398,968 | |
Distributions reinvested | | | 4,903,364 | | | | 509,900 | | | | 12,815,201 | | | | 7,999,318 | |
Redeemed | | | (8,377,483 | ) | | | (5,752,057 | ) | | | (48,766,325 | ) | | | (31,625,945 | ) |
| | | | | | | | | | | | | | | | |
Total Class A Capital Stock Transactions | | | 22,633,734 | | | | 2,380,017 | | | | 147,244,019 | | | | 69,772,341 | |
| | | | | | | | | | | | | | | | |
Institutional Class | | | | | | | | | | | | | | | | |
Sold | | | 439,809 | | | | 1,685,762 | | | | 68,700,486 | | | | 39,483,169 | |
Distributions reinvested | | | 640,661 | | | | 846,684 | | | | 3,705,854 | | | | 1,456,365 | |
Redeemed | | | (2,309,705 | ) | | | (951,520 | ) | | | (23,395,235 | ) | | | (6,549,936 | ) |
In-kind redemptions | | | (36,694,752 | ) | | | — | | | | — | | | | — | |
Total Institutional Class Capital Stock Transactions | | | (37,923,987 | ) | | | 1,580,926 | | | | 49,011,105 | | | | 34,389,598 | |
Capital Stock Transactions | | | (15,290,253 | ) | | | 3,960,943 | | | | 196,255,124 | | | | 104,161,939 | |
Net Increase/(Decrease) in Net Assets | | | (8,796,271 | ) | | | 9,403,494 | | | | 221,671,304 | | | | 126,994,594 | |
Net Assets, Beginning of Period | | | 60,927,366 | | | | 51,523,872 | | | | 344,886,096 | | | | 217,891,502 | |
Net Assets, End of Period | | $ | 52,131,095 | | | $ | 60,927,366 | | | $ | 566,557,400 | | | $ | 344,886,096 | |
Accumulated Undistributed Net Investment Income/(Loss) | | $ | 49,084 | | | $ | (5,674 | ) | | $ | 724,056 | | | $ | 467,656 | |
Capital Stock Share Transactions | | | | | | | | | | | | | | | | |
Class A shares | | | | | | | | | | | | | | | | |
Sold | | | 2,424,516 | | | | 814,442 | | | | 25,783,352 | | | | 13,997,392 | |
Distributions reinvested | | | 472,405 | | | | 53,801 | | | | 1,798,667 | | | | 1,200,909 | |
Redeemed | | | (768,818 | ) | | | (608,405 | ) | | | (6,861,853 | ) | | | (4,770,795 | ) |
| | | | | | | | | | | | | | | | |
Total Class A shares | | | 2,128,103 | | | | 259,838 | | | | 20,720,166 | | | | 10,427,506 | |
| | | | | | | | | | | | | | | | |
Institutional Class shares | | | | | | | | | | | | | | | | |
Sold | | | 41,140 | | | | 181,445 | | | | 9,737,266 | | | | 5,957,144 | |
Distributions reinvested | | | 61,321 | | | | 89,233 | | | | 524,096 | | | | 219,226 | |
Redeemed | | | (217,765 | ) | | | (101,406 | ) | | | (3,311,239 | ) | | | (991,583 | ) |
In-kind redemptions | | | (3,341,963 | ) | | | — | | | | — | | | | — | |
| | | | | | | | | | | | | | | | |
Total Institutional Class shares | | | (3,457,267 | ) | | | 169,272 | | | | 6,950,123 | | | | 5,184,787 | |
| | | | | | | | | | | | | | | | |
The accompanying Notes to Financial Statements are an integral part of this schedule.
43
Thrivent Mutual Funds
Statement of Changes in Net Assets – continued
| | | | | | | | |
| | | Natural Resources Fund | |
For the periods ended | | 12/31/2013 | | | 12/31/2012 | |
Operations | | | | | | | | |
Net investment income/(loss) | | $ | 499,344 | | | $ | 702,883 | |
Net realized gains/(losses) | | | 4,532,728 | | | | 426,770 | |
Change in net unrealized appreciation/(depreciation) | | | 4,128,220 | | | | (4,201,622 | ) |
Net Change in Net Assets Resulting From Operations | | | 9,160,292 | | | | (3,071,969 | ) |
Distributions to Shareholders | | | | | | | | |
From net investment income Class A | | | (31,840 | ) | | | (69,338 | ) |
From net investment income Institutional Class | | | (453,034 | ) | | | (640,309 | ) |
| | | | | | | | |
Total From Net Investment Income | | | (484,874 | ) | | | (709,647 | ) |
| | | | | | | | |
From return of capital Class A | | | (32,514 | ) | | | (13,007 | ) |
From return of capital Institutional Class | | | (177,408 | ) | | | (69,179 | ) |
| | | | | | | | |
Total From Return of Capital | | | (209,922 | ) | | | (82,186 | ) |
| | | | | | | | |
Total Distributions to Shareholders | | | (694,796 | ) | | | (791,833 | ) |
Capital Stock Transactions | | | | | | | | |
Class A | | | | | | | | |
Sold | | | 3,144,273 | | | | 4,210,350 | |
Distributions reinvested | | | 63,177 | | | | 81,131 | |
Redeemed | | | (3,620,443 | ) | | | (4,023,927 | ) |
| | | | | | | | |
Total Class A Capital Stock Transactions | | | (412,993 | ) | | | 267,554 | |
| | | | | | | | |
Institutional Class | | | | | | | | |
Sold | | | 106,541 | | | | 6,943,628 | |
Distributions reinvested | | | 627,542 | | | | 705,386 | |
Redeemed | | | (366,481 | ) | | | (22,325,806 | ) |
| | | | | | | | |
Total Institutional Class Capital Stock Transactions | | | 367,602 | | | | (14,676,792 | ) |
| | | | | | | | |
Capital Stock Transactions | | | (45,391 | ) | | | (14,409,238 | ) |
Net Increase/(Decrease) in Net Assets | | | 8,420,105 | | | | (18,273,040 | ) |
Net Assets, Beginning of Period | | | 93,962,080 | | | | 112,235,120 | |
Net Assets, End of Period | | $ | 102,382,185 | | | $ | 93,962,080 | |
Accumulated Undistributed Net Investment Income/(Loss) | | $ | (18,471 | ) | | $ | (15,078 | ) |
Capital Stock Share Transactions | | | | | | | | |
Class A shares | | | | | | | | |
Sold | | | 328,157 | | | | 444,569 | |
Distributions reinvested | | | 6,375 | | | | 9,095 | |
Redeemed | | | (376,063 | ) | | | (434,457 | ) |
| | | | | | | | |
Total Class A shares | | | (41,531 | ) | | | 19,207 | |
| | | | | | | | |
Institutional Class shares | | | | | | | | |
Sold | | | 11,352 | | | | 712,428 | |
Distributions reinvested | | | 63,324 | | | | 79,079 | |
Redeemed | | | (37,794 | ) | | | (2,246,295 | ) |
| | | | | | | | |
Total Institutional Class shares | | | 36,882 | | | | (1,454,788 | ) |
| | | | | | | | |
The accompanying Notes to Financial Statements are an integral part of this schedule.
44
Thrivent Mutual Funds
Notes to Financial Statements
December 31, 2013
(1) ORGANIZATION
Thrivent Mutual Funds (the “Trust”) was organized as a Massachusetts Business Trust on March 10, 1987 and is registered as an open-end management investment company under the Investment Company Act of 1940 (the “1940 Act”). The Trust is divided into twenty-six separate series (each, a “Fund” and, collectively, the “Funds”), each with its own investment objective and policies. The Trust currently consists of four allocation funds, twelve equity funds, four hybrid funds, five fixed-income funds, and one money market fund.
This shareholder report includes Thrivent Growth and Income Plus Fund, Thrivent Diversified Income Plus Fund and Thrivent Natural Resources Fund, three of the Trust’s twenty-six Funds. The other Funds of the Trust have a fiscal year-end of October 31 and are presented under a separate shareholder report.
(A) Share Classes – As of December 31, 2013, the Trust includes two classes of shares: Class A and Institutional Class. The classes of shares differ principally in their respective distribution expenses and other class-specific expenses and arrangements. Class A shares have a 0.25% annual 12b-1 fee and a maximum front-end sales load of 5.50% for equity funds and 4.50% for fixed-income funds, although some of the fixed-income funds have reduced 12b-1 fees and either a reduced or no front-end sales load. Institutional Class shares are offered at net asset value and have no annual 12b-1 fees. The share classes have identical rights to earnings, assets and voting privileges, except for class-specific expenses and exclusive rights to vote on matters affecting only individual classes. All 26 Funds of the Trust offer Class A and Institutional Class shares.
(B) Other – Under the Trust’s organizational documents, its officers and trustees are indemnified against certain liabilities arising out of the performance of their duties to the Trust. In addition, in the normal course of business, the Trust enters into contracts with vendors and others that provide general damage clauses. The Trust’s maximum exposure under these contracts is unknown, as this would involve future claims that may be made against the Trust. However, based on experience, the Trust expects the risk of loss to be remote.
(2) SIGNIFICANT ACCOUNTING POLICIES
(A) Valuation of Investments – Securities traded on U.S. or foreign securities exchanges or included in a national market system are valued at the official closing price at the close of each business day unless otherwise stated below. Over-the-counter securities and listed securities for which no price is readily available are valued at the current bid price considered best to represent the value at that time. Swap agreements are valued at the fair value of the contract as furnished by an independent pricing service. Security prices are based on quotes that are obtained from an independent pricing service approved by the Trust’s Board of Trustees (“Board”). The pricing service, in determining values of fixed-income securities, takes into consideration such factors as current quotations by broker/dealers, coupon, maturity, quality, type of issue, trading characteristics, and other yield and risk factors it deems relevant in determining valuations. Securities which cannot be valued by the approved pricing service are valued using valuations obtained from dealers that make markets in the securities. Exchange-listed options and futures contracts are valued at the last quoted sales price. Forward foreign currency exchange contracts are marked-to-market based upon foreign currency exchange rates provided by a pricing service. Investments in mutual funds are valued at the net asset value at the close of each business day. Short-term securities are valued at amortized cost (which approximates market value) to the extent it is not materially different than market value.
The Board has delegated responsibility for daily valuation to the Adviser. The Adviser has formed a Valuation Committee (“Committee”) that is responsible for overseeing the Fund valuation policies and procedures. The Committee meets on a monthly and on an as-needed basis to review price challenges, price overrides, stale prices, shadow prices, manual prices, money market pricing, international fair valuation, and other securities requiring fair valuation.
The Committee monitors for significant events occurring prior to the close of trading on the New York Stock Exchange that could have a material impact on the value of any securities that are held by the Funds. Examples of such events include trading halts, national news/events, and issuer-specific developments. If the Committee decides that such events warrant using fair value estimates, the Committee will take such events into consideration in determining the fair value of such securities. If market quotations or prices are not readily available or determined to be unreliable, the securities will be valued at fair value as determined in good faith pursuant to procedures adopted by the Board.
Financial Accounting Standards Board (FASB) guidelines require increased fair value disclosure intended to improve the consistency and comparability of fair value measurements used in financial reporting. The guidelines define fair value, establish a framework for measuring fair value in U.S. Generally Accepted Accounting Principles (“GAAP”) and expand disclosures about fair value requirements. The various inputs used to determine the fair value of the Funds’ investments are summarized in three broad levels: Level 1 includes quoted prices in active markets for identical securities, typically included in this level are U.S. equity securities, futures and options; Level 2 includes other significant observable inputs such as quoted prices for similar securities, interest rates, prepayment speeds and credit risk, typically included in this level are fixed income securities, international securities, swaps and forward contracts; and Level 3 includes significant unobservable inputs such as the Adviser’s own assumptions and broker evaluations in determining the fair value of investments. Of the Level 3 securities, those for which market values were not readily available or were deemed unreliable were fair valued as determined in good faith under procedures established by the Board. As of December 31, 2013, no Funds held these types of Level 3 securities.
45
Thrivent Mutual Funds
Notes to Financial Statements
December 31, 2013
The valuation levels are not necessarily an indication of the risk associated with investing in these securities or other investments.
Valuation of International Securities – Because many foreign markets close before the U.S. markets, events may occur between the close of the foreign markets and the close of the U.S. markets that could have a material impact on the valuation of foreign securities. The Funds, under the supervision of the Board, evaluate the impacts of these events and may adjust the valuation of foreign securities to reflect fair value as of the close of the U.S. markets. The Board has authorized the Adviser to make fair valuation determinations pursuant to policies approved by the Board.
(B) Foreign Currency Translation – The accounting records of each Fund are maintained in U.S. dollars. Securities and other assets and liabilities that are denominated in foreign currencies are translated into U.S. dollars at the daily closing rates of exchange.
Foreign currency amounts related to the purchase or sale of securities and income and expenses are translated at the exchange rate on the transaction date. Net realized and unrealized currency gains and losses are recorded from closed forward contracts, disposition of foreign currencies, exchange gains or losses between the trade date and settlement date on securities transactions, and other translation gains or losses on dividends, interest income and foreign withholding taxes. The Funds do not separately report the effect of changes in foreign exchange rates from changes in market prices on securities held. Such changes are included in net realized and unrealized gain or loss from investments in the Statement of Operations.
For federal income tax purposes, the Funds treat the effect of changes in foreign exchange rates arising from actual foreign currency transactions and the changes in foreign exchange rates between the trade date and settlement date as ordinary income.
(C) Foreign Denominated Investments – Foreign denominated assets and currency contracts may involve more risks than domestic transactions including currency risk, political and economic risk, regulatory risk, and market risk. Certain Funds may also invest in securities of companies located in emerging markets. Future economic or political developments could adversely affect the liquidity or value, or both, of such securities.
(D) Federal Income Taxes – No provision has been made for income taxes because each Fund’s policy is to qualify as a regulated investment company under the Internal Revenue Code and distribute substantially all investment company taxable income and net capital gain on a timely basis. It is also the intention of each Fund to distribute an amount sufficient to avoid imposition of any federal excise tax. The Funds, accordingly, anticipate paying no federal taxes and no federal tax provision was recorded. Each Fund is treated as a separate taxable entity for federal income tax purposes. Certain Funds may utilize earnings and profits distributed to shareholders on the redemption of shares as part of the dividends paid deduction.
GAAP requires management of the Funds (i.e., the Adviser) to make additional tax disclosures with respect to the tax effects of certain income tax positions, whether those positions were taken on previously filed tax returns or are expected to be taken on future returns. These positions must meet a “more likely than not” standard that, based on the technical merits of the position, would have a greater than 50 percent likelihood of being sustained upon examination. In evaluating whether a tax position has met the more-likely-than-not recognition threshold, the Adviser must presume that the position will be examined by the appropriate taxing authority that has full knowledge of all relevant information.
The Adviser analyzed all open tax years, as defined by the statute of limitations, for all major jurisdictions. Open tax years are those that are open for examination by taxing authorities. Major jurisdictions for the Funds include U.S. Federal, Minnesota, Wisconsin, and Massachusetts as well as certain foreign countries. As of December 31, 2013, open U.S. Federal, Minnesota, Wisconsin and Massachusetts tax years include the tax years ended December 31, 2010 through 2013. Additionally, as of December 31, 2013, the tax year ended December 31, 2009 is open for Wisconsin. The Funds have no examinations in progress and none are expected at this time.
As of December 31, 2013, the Adviser has reviewed all open tax years and major jurisdictions and concluded that there is no effect to the Funds’ tax liability, financial position or results of operations. There is no tax liability resulting from unrecognized tax benefits related to uncertain income tax positions taken or expected to be taken in future tax returns. The Funds are also not aware of any tax positions for which it is reasonably possible that the total amounts of unrecognized tax benefits will significantly change in the next 12 months.
Foreign Income Taxes – Certain Funds are subject to foreign income taxes imposed by certain countries in which they invest. Withholding taxes on foreign dividends have been provided for in accordance with the applicable country’s tax rules and rates. These amounts are shown as foreign dividend tax withholding on the Statement of Operations. The Funds pay tax on foreign capital gains, where applicable.
46
Thrivent Mutual Funds
Notes to Financial Statements
December 31, 2013
(E) Expenses and Income – Estimated expenses are accrued daily. The Funds are charged for those expenses that are directly attributable to them. Expenses that are not directly attributable to a Fund are allocated among all appropriate Funds in
proportion to their respective net assets, number of shareholder accounts or other reasonable basis. Net investment income, expenses which are not class-specific, and realized and unrealized gains and losses are allocated directly to each class based upon the relative net asset value of outstanding shares.
Interest income is accrued daily and is determined on the basis of interest or discount earned on all debt securities, including accretion of market discount and original issue discount and amortization of premium. Paydown gains and losses on mortgage- and asset-backed securities are recorded as components of interest income. Dividend income is recorded on the ex-dividend date.
For certain securities, including real estate investment trusts, the Trust records distributions received in excess of income as a reduction of cost of investments and/or realized gain. Such amounts are based on estimates if actual amounts are not available. Actual amounts of income, realized gain and return of capital may differ from the estimated amounts. The Trust adjusts the estimated amounts of the components of distributions as adjustments to investment income, unrealized appreciation/depreciation and realized gain/loss on investments as necessary, once the issuers provide information about the actual composition of the distributions.
(F) Custody Earnings Credit – The Funds have a deposit arrangement with the custodian whereby interest earned on uninvested cash balances is used to pay a portion of custodian fees. This deposit arrangement is an alternative to overnight investments. Earnings credits are shown as a reduction of total expenses on the Statement of Operations.
(G) Distributions to Shareholders – Net investment income is distributed to each shareholder as a dividend. Dividends from Natural Resources Fund and Growth and Income Plus Fund are declared and paid quarterly. Dividends from Diversified Income Plus Fund are declared and paid monthly. Additionally, it is possible that such dividends may be reclassified as return of capital or capital gains after year end. Such determination cannot be made until tax information is received from the real estate investments of the Fund. Net realized gains from securities transactions, if any, are distributed at least annually.
(H) Derivative Financial Instruments – Each of the Funds may invest in derivatives. Derivatives, a category that includes options, futures, swaps and hybrid instruments, are financial instruments whose value derives from another security, an index or a currency. Each Fund may use derivatives for hedging (attempting to offset a potential loss in one position by establishing an interest in an opposite position). This includes the use of currency-based derivatives for hedging its positions in foreign securities. Each Fund may also use derivatives for replication of a certain asset class or speculation (investing for potential income or capital gain). These contracts may be transacted on an exchange or over-the-counter (OTC).
A derivative may incur a mark to market loss if the value if the derivative decreases due to an unfavorable change in the market rates or values of the underlying derivative. Losses can also occur if the counterparty does not perform under the derivative. A Fund’s risk of loss from the counterparty credit risk on OTC derivatives is generally limited to the aggregate unrealized gain netted against any collateral held by such Fund. With exchange traded futures and centrally cleared swaps, there is minimal counterparty credit risk to the Funds because the exchange’s clearinghouse, as counterparty to such derivatives, guarantees against a possible default. The clearing house stands between the buyer and the seller of the derivative; thus, the credit risk is limited to the failure of the clearinghouse. However, credit risk still exists in exchange traded futures and centrally cleared swaps with respect to initial and variation margin that is held in a broker’s customer accounts. While brokers are required to segregate customer margin from their own assets, in the event that a broker becomes insolvent or goes into bankruptcy and at that time there is a shortfall in the aggregate amount of margin held by the broker for all its clients, U.S. bankruptcy laws will typically allocate that shortfall on a pro-rata basis across all the broker’s customers, potentially resulting in losses in the Funds. Using derivatives to hedge can guard against potential risks, but it also adds to the Funds’ expenses and can eliminate some opportunities for gains. In addition, a derivative used for hedging or replication may not accurately track the value of the underlying asset. Another risk with derivatives is that some types can amplify a gain or loss, potentially earning or losing substantially more money than the actual cost of the derivative.
In order to define their contractual rights and to secure rights that will help the Funds mitigate their counterparty risk, the Funds may enter into an International Swaps and Derivatives Association, Inc. Master Agreement (“ISDA Master Agreement”) or similar agreement with its derivative contract counterparties. An ISDA Master Agreement is a bilateral agreement between a Fund and a counterparty that governs OTC derivatives and foreign exchange contracts and typically includes, among other things, collateral posting terms and netting provisions in the event of a default and/or termination event. Under an ISDA Master Agreement, each Fund may, under certain circumstances, offset with the counterparty certain derivative’s payables and/or receivables with collateral held and/or posted and create one single net payment. The provisions of the ISDA Master Agreement typically permit a single net payment in the event of a default (close-out netting) including the bankruptcy or insolvency of the counterparty. Note, however, that bankruptcy and insolvency laws of a particular jurisdiction may impose restrictions on or prohibitions against the right of offset in bankruptcy, insolvency or other events.
47
Thrivent Mutual Funds
Notes to Financial Statements
December 31, 2013
Collateral and margin requirements vary by type of derivative. Margin requirements are established by the broker or clearing house for exchange traded and centrally cleared derivatives (futures, options, and centrally cleared swaps). Brokers can ask for margining in excess of the minimum in certain situations. Collateral terms are contract specific for OTC derivatives (foreign currency exchange contracts, options, swaps). For derivatives traded under an IDSA Master Agreement, the collateral requirements are typically calculated by netting the mark to market amount for each transaction under such agreement and comparing that amount to the value of any collateral currently pledged by the Fund and the counterparty. For financial reporting purposes, non-cash collateral that has been pledged to cover obligations of the Fund has been noted in the Schedule of Investments. To the extent amounts due to the Fund from its counterparties are not fully collateralized, contractually or otherwise, the Fund bears the risk of loss from counterparty nonperformance. The Funds attempt to mitigate counterparty risk by only entering into agreements with counterparties that they believe have the financial resources to honor their obligations and by monitoring the financial stability of those counterparties.
Options – All Funds may buy put and call options and write put and covered call options. The Funds intend to use such derivative instruments as hedges to facilitate buying or selling securities or to provide protection against adverse movements in security prices or interest rates. The Funds may also enter into options contracts to protect against adverse foreign exchange rate fluctuations. Option contracts are valued daily and unrealized appreciation or depreciation is recorded. A Fund will realize a gain or loss upon expiration or closing of the option transaction. When an option is exercised, the proceeds upon sale for a written call option or the cost of a security for purchased put and call options is adjusted by the amount of premium received or paid.
Buying put options tends to decrease a Fund’s exposure to the underlying security while buying call options tends to increase a Fund’s exposure to the underlying security. The risk associated with purchasing put and call options is limited to the premium paid. There is no significant counterparty risk on exchange-traded options as the exchange guarantees the contract against default. Writing put options tends to increase a Fund’s exposure to the underlying security while writing call options tends to decrease a Fund’s exposure to the underlying security. The writer of an option has no control over whether the underlying security may be bought or sold, and therefore bears the market risk of an unfavorable change in the price of the underlying security. The counterparty risk for purchased options arises when a Fund has purchased an option, exercises that option, and the counterparty doesn’t buy from the Fund or sell to the Fund the underlying asset as required. In the case where a Fund has written an option, the Fund doesn’t have counterparty risk. Counterparty risk on purchased over-the-counter options is partially mitigated by the Fund’s collateral posting requirements. As the option increases in value to the Fund, the Fund receives collateral from the counterparty. Risks of loss may exceed amounts recognized on the Statement of Assets and Liabilities.
Futures Contracts – Certain Funds may use futures contracts to manage the exposure to interest rate and market or currency fluctuations. Gains or losses on futures contracts can offset changes in the yield of securities. When a futures contract is opened, cash or other investments equal to the required “initial margin deposit” are held on deposit with and pledged to the broker. Additional securities held by the Funds may be earmarked to cover open futures contracts. The futures contract’s daily change in value (“variation margin”) is either paid to or received from the broker, and is recorded as an unrealized gain or loss. When the contract is closed, realized gain or loss is recorded equal to the difference between the value of the contract when opened and the value of the contract when closed. Futures contracts involve, to varying degrees, risk of loss in excess of the variation margin disclosed in the Statement of Assets and Liabilities. Exchange-traded futures have no significant counterparty risk as the exchange guarantees the contracts against default.
Foreign Currency Forward Contracts – In connection with purchases and sales of securities denominated in foreign currencies all Funds may enter into foreign currency forward contracts. Additionally, the Funds may enter into such contracts to hedge certain other foreign-currency-denominated investments. These contracts are recorded at value and the related realized and unrealized foreign exchange gains and losses are included in the Statement of Operations. In the event that counterparties fail to settle these forward contracts, the Funds could be exposed to foreign currency fluctuations. Foreign currency contracts are valued daily and unrealized appreciation or depreciation is recorded daily as the difference between the contract exchange rate and the closing forward rate applied to the face amount of the contract. A realized gain or loss is recorded at the time a forward contract is closed. These contracts are over-the-counter and the Fund is exposed to counterparty risk equal to the discounted net amount of payments to the Fund. This risk is partially mitigated by the Fund’s collateral posting requirements.
Swap Agreements – Certain Funds enter into swap transactions, which involve swapping one or more investment characteristics of a security or a basket of securities with another party. Such transactions include market risk, risk of default by the other party to the transaction, risk of imperfect correlation and manager risk and may involve commissions or other costs. Swap transactions generally do not involve delivery of securities, other underlying assets or principal. Accordingly, the risk of loss with respect to swap transactions is generally limited to the net amount of payments that the Fund is contractually obligated to make, or in the case of the counterparty defaulting, the net amount of payments that the Fund is contractually entitled to receive. Risks of loss may exceed amounts recognized on the Statement of Assets and Liabilities. If there is a default by the counterparty, the Fund may have contractual remedies pursuant to the agreements related to the transaction. The contracts are valued daily and unrealized appreciation or depreciation is recorded. Swap agreements are valued at fair
48
Thrivent Mutual Funds
Notes to Financial Statements
December 31, 2013
value of the contract as provided by an independent pricing service. The pricing service takes into account such factors as swap curves, default probabilities, recent trades, recovery rates and other factors it deems relevant in determining valuations. Daily fluctuations in the value of the centrally cleared credit default contracts are recorded in variation margin in the Statement of Assets and Liabilities and recorded as unrealized gain or loss. The Fund accrues for the periodic payment and amortizes upfront payments, if any, on swap agreements on a daily basis with the net amount recorded as realized gains or losses in the Statement of Operations. Receipts and payments received or made as a result of a credit event or termination of the contract are also recognized as realized gains or losses in the Statement of Operations. Collateral, in the form of cash or securities, may be required to be held with the Fund’s custodian, or a third party, in connection with these agreements. These swap agreements are over-the-counter and the Fund is exposed to counterparty risk, which is the discounted net amount of payments owed to the Fund. This risk is partially mitigated by the Fund’s collateral posting requirements. As the swap increases in value to the Fund, the Fund receives collateral from the counterparty. Certain interest rate and credit default index swaps must be cleared through a clearinghouse or central counterparty.
Credit Default Swaps – A credit default swap is a swap agreement between two parties to exchange the credit risk of a particular issuer, basket of securities or reference entity. In a credit default swap transaction, a buyer pays periodic fees in return for payment by the seller which is contingent upon an adverse credit event occurring in the underlying issuer or reference entity. The seller collects periodic fees from the buyer and profits if the credit of the underlying issuer or reference entity remains stable or improves while the swap is outstanding, but the seller in a credit default swap contract would be required to pay the amount of credit loss, determined as specified in the agreement, to the buyer in the event of an adverse credit event in the reference entity. A buyer of a credit default swap is said to buy protection whereas a seller of a credit default swap is said to sell protection. The Funds may be either the protection seller or the protection buyer.
Certain Funds enter into credit default derivative contracts directly through credit default swaps (CDS) or through credit default swap indices (CDX Indices). CDX indices are static pools of equally weighted credit default swaps referencing corporate bonds and/or loans designed to provide diversified credit exposure to these asset classes. Funds sell default protection and assume long-risk positions in individual credits or indices. Index positions are entered into to gain exposure to the corporate bond and/or loan markets in a cost-efficient and diversified structure. In the event that a position defaults, by going into bankruptcy and failing to pay interest or principal on borrowed money, within any given CDX Index held, the maximum potential amount of future payments required would be equal to the pro-rata share of that position within the index based on the notional amount of the index. In the event of a default under a CDS contract the maximum potential amount of future payments would be the notional amount. For CDS, the default events could be bankruptcy and failing to pay interest or principal on borrowed money or a restructuring. A restructuring is a change in the underlying obligations which would include reduction in interest or principal, maturity extension and subordination to other obligations.
For financial reporting purposes, the Funds do not offset derivative assets and derivative liabilities that are subject to netting arrangements in the Statement of Assets and Liabilities. The amounts presented in the tables below are offset first by financial instruments that have the right of offset under master netting or similar arrangements, then any remaining amount is reduced by cash and non-cash collateral pledged. The actual amounts of collateral may be greater than amounts presented in the tables.
49
Thrivent Mutual Funds
Notes to Financial Statements
December 31, 2013
| | | | | | | | | | | | | | | | | | | | | | | | | | | | |
| | | | | | | | | | | | Gross Amounts Not Offset in the Statement of Assets and Liabilities | | | | |
Portfolio | | Gross Amounts
of Recognized
Assets | | | Gross
Amounts
Offset | | | Net Amounts
of
Recognized
Assets | | | Financial
Instruments | | | Cash
Collateral
Offset | | | Non-Cash
Collateral
Pledged* | | | Net Amount | |
Growth and Income Plus | | | | | | | | | | | | | | | | | | | | | | | | | | | | |
Futures Contracts | | | 4,240 | | | | — | | | | 4,240 | | | | — | | | | — | | | | — | | | | 4,240 | ** |
Diversified Income Plus | | | | | | | | | | | | | | | | | | | | | | | | | | | | |
Futures Contracts | | | 42,823 | | | | — | | | | 42,823 | | | | 3,656 | | | | — | | | | — | | | | 39,167 | ** |
Securities Lending | | | 5,220,211 | | | | — | | | | 5,220,211 | | | | — | | | | 5,220,211 | | | | — | | | | — | |
Swap Credit Contracts | | | 3,215 | | | | — | | | | 3,215 | | | | — | | | | — | | | | — | | | | 3,215 | ** |
Natural Resources | | | | | | | | | | | | | | | | | | | | | | | | | | | | |
Securities Lending | | | 5,291,600 | | | | — | | | | 5,291,600 | | | | — | | | | 5,291,600 | | | | — | | | | — | |
| * | Excess of collateral received from the counterparty may not be shown for financial reporting purposes. |
| ** | Net Amount represents the net amount receivable from the counterparty in the event of the default. |
| | | | | | | | | | | | | | | | | | | | | | | | | | | | |
Portfolio | | Gross Amounts
of Recognized
Liabilities | | | Gross
Amounts
Offset | | | Net Amounts
of
Recognized
Liabilities | | | Financial
Instruments | | | Cash
Collateral
Offset | | | Non-Cash
Collateral
Pledged* | | | Net Amount | |
Diversified Income Plus | | | | | | | | | | | | | | | | | | | | | | | | | | | | |
Futures Contracts | | | 3,656 | | | | — | | | | 3,656 | | | | 3,656 | | | | — | | | | — | | | | — | |
| * | Excess of collateral pledged to the counterparty may not be shown for financial reporting purposes. |
(I) Mortgage Dollar Roll Transactions – Certain Funds enter into dollar roll transactions on securities issued or to be issued by the Government National Mortgage Association, Federal National Mortgage Association and Federal Home Loan Mortgage Corporation, in which the Funds sell mortgage securities and simultaneously agree to repurchase similar (same type and coupon) securities at a later date at an agreed upon price. The Funds must maintain liquid securities having a value not less than the repurchase price (including accrued interest) for such dollar rolls. The value of the securities that the Funds are required to purchase may decline below the agreed upon repurchase price of those securities.
During the period between the sale and repurchase, the Funds forgo principal and interest paid on the mortgage securities sold. The Funds are compensated from negotiated fees paid by brokers offered as an inducement to the Funds to “roll over” their purchase commitments, thus enhancing the yield. Mortgage dollar rolls may be renewed with a new purchase and repurchase price and a cash settlement made on settlement date without physical delivery of the securities subject to the contract. The fees received are recognized over the roll period and are included in Income from mortgage dollar rolls in the Statement of Operations.
(J) Securities Lending – The Trust has entered into a Securities Lending Agreement (the “Agreement”) with Deutsche Bank AG (“Deutsche”). The Agreement authorizes Deutsche to lend securities to authorized borrowers on behalf of the Funds. Pursuant to the Agreement, all loaned securities are initially collateralized by cash equal to at least 102% of the value of the loaned securities. All cash collateral received is invested in Thrivent Cash Management Trust. The Funds receive dividends and interest that would have been earned on the securities loaned while simultaneously seeking to earn income on the investment of cash collateral. Amounts earned on investments in Thrivent Cash Management Trust, net of rebates, fees paid to Deutsche for services provided and any other securities lending expenses, are included in Income from securities loaned on the Statement of Operations. By investing any cash collateral it receives in these transactions, a Fund could realize additional gains or losses. If the borrower fails to return the securities or the invested collateral has declined in value, the Fund could lose money.
As of December 31, 2013, the value of securities on loan is as follows:
| | | | |
Fund | | Securities on
Loan | |
Diversified Income Plus | | $ | 5,098,852 | |
Natural Resources | | | 5,177,942 | |
50
Thrivent Mutual Funds
Notes to Financial Statements
December 31, 2013
(K) When-Issued and Delayed Delivery Transactions – Certain Funds may purchase or sell securities on a when-issued or delayed delivery basis. These transactions involve a commitment by a Fund to purchase or sell securities for a predetermined price or yield, with payment and delivery taking place beyond the customary settlement period. When delayed delivery purchases are outstanding, a Fund will designate liquid assets in an amount sufficient to meet the purchase price. When purchasing a security on a delayed delivery basis, a Fund assumes the rights and risks of ownership of the security, including the risk of price and yield fluctuations, and takes such fluctuations into account when determining its net asset value. A Fund may dispose of a delayed delivery transaction after it is entered into, and may sell when-issued securities before they are delivered, which may result in a capital gain or loss. When a Fund has sold a security on a delayed delivery basis, a Fund does not participate in future gains and losses with respect to the security.
(L) Treasury Inflation Protected Securities – Certain Funds may invest in treasury inflation protected securities (TIPS). These securities are fixed income securities whose principal value is periodically adjusted to the rate of inflation. The coupon interest rate is generally fixed at issuance. Interest is paid based on the principal value, which is adjusted for inflation. Any increase in the principal amount will be included as taxable interest in the Statement of Operations and received in cash upon maturity or sale of the security.
(M) Repurchase Agreements – Each Fund may engage in repurchase agreement transactions in pursuit of its investment objective. A repurchase agreement consists of a purchase and a simultaneous agreement to resell an investment for later delivery at an agreed upon price and rate of interest. The Fund uses a third-party custodian to maintain the collateral. If the original seller of a security subject to a repurchase agreement fails to repurchase the security at the agreed upon time, the Fund could incur a loss due to a drop in the value of the security during the time it takes the Fund to either sell the security or take action to enforce the original seller’s agreement to repurchase the security. Also, if a defaulting original seller filed for bankruptcy or became insolvent, disposition of such security might be delayed by pending legal action. The Fund may only enter into repurchase agreements with banks and other recognized financial institutions such as broker/dealers that are found by the Adviser or subadviser to be creditworthy. During the year ended December 31, 2013, none of the Funds engaged in these types of investments.
(N) Equity-Linked Structured Securities – Certain Funds may invest in equity-linked structured notes. Equity-linked structured notes are debt securities which combine the characteristics of common stock and the sale of an option. The return component is based upon the performance of a single equity security, a basket of equity securities, or an equity index and the sale of an option. There is no guaranteed return of principal with these securities. The appreciation potential of these securities may be limited by a maximum payment or call right and can be influenced by many unpredictable factors. In addition to the performance of the equity, the nature and credit of the issuer may also impact return.
(O) Stripped Securities – Certain Funds may invest in Interest Only and Principal Only stripped mortgage or asset backed securities. These securities represent a participation in securities that are structured in classes with rights to receive different portions of the interest and principal. Interest only securities receive all the interest and principal only securities receive all the principal. If the underlying pool of mortgages or assets experience greater than anticipated prepayments of principal, the Fund may not fully recoup its initial investment in an interest only security. Principal only securities increase in value if prepayments are greater than anticipated and decline if prepayments are slower than anticipated. The market value of these securities is highly sensitive to changes in interest rates.
(P) Credit Risk – The Funds may be susceptible to credit risk to the extent an issuer or counterparty defaults on its payment obligation. The Funds’ policy is to monitor the creditworthiness of issuers and counterparties. Interest receivable on defaulted securities is monitored for ability to collect payments in default and is adjusted accordingly.
(Q) Accounting Estimates – The preparation of financial statements in conformity with GAAP requires management to make estimates and assumptions that affect the reported amounts of assets and liabilities and disclosure of contingent assets and liabilities at the date of the financial statements and the reported amounts of income and expenses during the reporting period. Actual results could differ from those estimates.
(R) Loan Commitments – Certain Funds may enter into loan commitments, which generally have interest rates which are reset daily, monthly, quarterly or semi-annually by reference to a base lending rate, plus a premium. These base rates are primarily the London-Interbank Offered Rate (“LIBOR”), and secondarily the prime rate offered by one or more major United States banks (the “Prime Rate”) and the certificate of deposit (“CD”) rate or other base lending rates used by commercial lenders. Loan commitments often require prepayments from excess cash flows or allow the borrower to repay at its election. The rate at which the borrower repays cannot be predicted with accuracy. Therefore, the remaining maturity may be considerably less than the stated maturity shown in the Schedule of Investments.
51
Thrivent Mutual Funds
Notes to Financial Statements
December 31, 2013
All or a portion of these loan commitments may be unfunded. A Fund is obligated to fund these commitments at the borrower’s discretion. Therefore, the Fund must have funds sufficient to cover its contractual obligation. These unfunded loan commitments, which are marked to market daily, are presented in the Schedule of Investments.
(S) Loss Contingencies – Thrivent Diversified Income Plus Fund is a defendant in an adversary action filed on July 7, 2004 by the Official Committee of Asbestos Claimants of G-I Holdings, Inc. (G-I) against prior and current holders of secured debt of Building Materials Corporation of America (BMCA), a wholly owned subsidiary of G-I. The suit seeks to recover the value of assets G-I transferred to BMCA that later served as collateral for BMCA’s debt. The Fund at one time held secured notes in the amount of $1,650,000 and, if the plaintiffs are successful, it is reasonably possible that the Fund will be required to pay damages in some amount. Management does not believe it is possible at this time to predict with any reasonable certainty the amount or probability of any potential loss.
(T) Litigation – Awards from class action litigation are are recorded as realized gains on the payment date.
(U) Other – For financial statement purposes, investment security transactions are accounted for on the trade date. Realized gains and losses from investment transactions are determined on a specific cost identification basis, which is the same basis used for federal income tax purposes.
(V) In-kind Redemptions – During the year ended December 31, 2013, the Thrivent Asset Allocation Funds, as the shareholders of underlying funds of Thrivent Mutual Funds, (the “underlying funds”), redeemed their shares in-kind (“in-kind redemption”). The underlying funds distributed fund securities rather than cash as payment for the redemption of these fund shares. For financial reporting purposes, the underlying funds recognize gain on these transactions to the extent the value of the distributed securities on the date of redemption exceeds the cost of those securities; they recognize a loss if the cost exceeds the value. Gains or losses on in-kind redemptions are not recognized for tax purposes. The realized gains or losses below are included in the Statement of Operations of the underlying funds as net realized gains/losses on in-kind redemptions. The in-kind amounts and shares redeemed are included in the Capital Stock Transactions of the Statement of Changes in Net Assets of the underlying funds. These in-kind transactions were conducted at market value. The transactions were as follows:
| | | | | | | | | | | | | | | | | | |
| | | Underlying Fund | | Underlying
Shares
Redeemed | | | Date | | | In-kind
Amount | | | Realized
Gain/(Loss) | |
Aggressive Allocation Fund | | Growth and Income Plus | | | 475,273 | | | | 8/6/2013 | | | $ | 5,218,501 | | | $ | 628,200 | |
Moderately Aggressive Allocation Fund | | Growth and Income Plus | | | 1,204,539 | | | | 8/6/2013 | | | $ | 13,225,838 | | | $ | 1,625,645 | |
Moderate Allocation Fund | | Growth and Income Plus | | | 1,176,442 | | | | 8/6/2013 | | | $ | 12,917,331 | | | $ | 1,561,715 | |
Moderately Conservative Allocation Fund | | Growth and Income Plus | | | 485,709 | | | | 8/6/2013 | | | $ | 5,333,082 | | | $ | 647,224 | |
(3) FEES AND COMPENSATION PAID TO AFFILIATES
(A) Investment Advisory Fees – The Trust has entered into an Investment Advisory Agreement with Thrivent Asset Mgt. Under the Investment Advisory Agreement, each of the Funds pays a fee for investment advisory services. The fees are accrued daily and paid monthly. The annual rates of fees as a percent of average daily net assets under the Investment Advisory Agreement were as follows:
| | | | | | | | | | | | | | | | | | | | | | | | | | | | | | | | | | | | | | | | | | | | |
Fund (M - Millions) | | $0 to
$50M | | | Over
$50 to
$100M | | | Over
$100 to
$200M | | | Over
$200 to
$250M | | | Over
$250 to
$500M | | | Over
$500 to
$750M | | | Over
$750 to
$1,000M | | | Over
$1,000 to
$2,000M | | | Over
$2,000 to
$2,500M | | | Over
$2,500 to
$5,000M | | | Over
$5,000M | |
Growth and Income Plus | | | 0.650 | % | | | 0.650 | % | | | 0.650 | % | | | 0.650 | % | | | 0.600 | % | | | 0.600 | % | | | 0.600 | % | | | 0.600 | % | | | 0.600 | % | | | 0.600 | % | | | 0.600 | % |
Diversified Income Plus | | | 0.550 | % | | | 0.550 | % | | | 0.550 | % | | | 0.550 | % | | | 0.550 | % | | | 0.550 | % | | | 0.550 | % | | | 0.550 | % | | | 0.550 | % | | | 0.550 | % | | | 0.550 | % |
Natural Resources | | | 0.800 | % | | | 0.800 | % | | | 0.800 | % | | | 0.800 | % | | | 0.800 | % | | | 0.750 | % | | | 0.750 | % | | | 0.750 | % | | | 0.750 | % | | | 0.750 | % | | | 0.750 | % |
52
Thrivent Mutual Funds
Notes to Financial Statements
December 31, 2013
(B) Expense Reimbursements – As of December 31, 2013, contractual expense reimbursements to limit expenses to the following percentages were in effect:
| | | | | | | | | | | | |
Fund | | Class A | | | Institutional
Class | | | Expiration
Date | |
Growth and Income Plus | | | 1.15 | % | | | 0.80 | % | | | 2/28/2014 | |
Diversified Income Plus | | | 1.00 | % | | | N/A | | | | 2/28/2014 | |
Natural Resources | | | 1.30 | % | | | N/A | | | | 2/28/2014 | |
The Funds covered in this shareholder report may invest cash in High Yield Fund, Money Market Fund and Thrivent Cash Management Trust, subject to certain limitations. During the year ended December 31, 2013, none of the Funds covered in this shareholder report invested in High Yield Fund. During the year ended December 31, 2013, none of the Funds covered in this shareholder report invested in Money Market Fund. During the year ended December 31, 2013, all Funds covered in this shareholder report invested in Cash Management Trust. These related-party transactions are subject to the same terms as non-related party transactions except that, to avoid duplicate investment advisory fees, Thrivent Asset Mgt. reimburses an amount equal to the advisory fee which is charged to the Fund for its investment in High Yield Fund or Money Market Fund.
(C) Distribution Plan – Thrivent Investment Management, Inc. (“Thrivent Investment Mgt.”) is the Trust’s distributor. The Trust has adopted a Distribution Plan pursuant to Rule 12b-1 under the 1940 Act. Class A shares generally have a Rule 12b-1 fee of up to 0.25% of average net assets.
(D) Sales Charges and Other Fees – For the year ended December 31, 2013, Thrivent Investment Mgt. received $2,038,669 of aggregate underwriting concessions from the sales of the Trust’s Class A shares. Sales charges are not an expense of the Trust and are not reflected in the financial statements of any of the Funds.
The Trust has entered into an accounting and administrative services agreement with Thrivent Asset Mgt. pursuant to which Thrivent Asset Mgt. provides certain accounting and administrative personnel and services to the Funds. For the year ended December 31, 2013, Thrivent Asset Mgt. received aggregate fees for accounting and administrative personnel and services of $326,118 from the Funds covered in this shareholder report.
The Trust has entered into an agreement with Thrivent Financial Investor Services, Inc. (“Thrivent Investor Services”) to provide the Funds with transfer agent services. For the year ended December 31, 2013, Thrivent Investor Services received $547,296 for transfer agent services from the Funds covered in this shareholder report.
Each Trustee who is not affiliated with the Adviser receives an annual fee from the Trust for services as a Trustee and is eligible to participate in a deferred compensation plan with respect to fees received from the Funds. Participants in the plan may designate their deferred Trustee’s fees as if invested in a series of Thrivent Mutual Funds. The value of each Trustee’s deferred compensation account will increase or decrease as if invested in shares of that series. Their fees as well as the change in value are included in Trustee’s fees in the Statement of Operations. The deferred fees remain in the appropriate Fund until distribution in accordance with the plan. The deferred fee liability, included in accrued expenses in the Statement of Assets and Liabilities, is unsecured.
Those Trustees not participating in the above plan received $14,223 in fees from the Funds covered in this shareholder report for the year ended December 31, 2013. In addition, the Trust reimbursed independent Trustees for reasonable expenses incurred in relation to attendance at the meetings and industry conferences.
Certain officers and non-independent Trustees of the Trust are officers and directors of Thrivent Asset Mgt., Thrivent Investment Mgt. and Thrivent Investor Services; however, they receive no compensation from the Funds.
(E) Indirect Expenses – Some Funds invest in other mutual funds. Fees and expenses of those underlying funds are not included in those Funds’ expense ratios. The Funds indirectly bear their proportionate share of the annualized weighted average expense ratio of the underlying funds in which they invest.
(4) TAX INFORMATION
Distributions are based on amounts calculated in accordance with applicable federal income tax regulations, which may differ from GAAP. To the extent that these differences are permanent in nature, such amounts are reclassified within the capital accounts based on their federal tax-basis treatment; temporary differences do not require reclassifications. At fiscal year-end, the character and amount of distributions, on a tax basis and components of distributable earnings, are finalized. Therefore, as of December 31, 2013, the tax-basis balance has not yet been finalized.
On the Statement of Assets and Liabilities, as a result of permanent book-to-tax differences, reclassification adjustments were made as follows [Increase/(Decrease)]:
| | | | | | | | | | | | |
Fund | | Accumulated
Net
Investment
Income/(Loss) | | | Accumulated
Net Realized
Gain/(Loss) | | | Capital
Stock | |
Growth and Income Plus | | $ | 50,381 | | | ($ | 4,499,934 | ) | | $ | 4,449,553 | |
Diversified Income Plus | | | 476,510 | | | | (476,510 | ) | | | — | |
Natural Resources | | | (17,863 | ) | | | 17,863 | | | | — | |
53
Thrivent Mutual Funds
Notes to Financial Statements
December 31, 2013
At December 31, 2013, the components of distributable earnings on a tax basis were as follows:
| | | | | | | | |
Fund | | Undistributed
Ordinary Income | | | Undistributed
Long-Term
Capital Gain | |
Growth and Income Plus | | $ | 5,305 | | | $ | — | |
Diversified Income Plus | | | 344,088 | | | | — | |
At December 31, 2013, the following Funds had accumulated net realized capital loss carryovers expiring as follows:
| | | | | | | | |
Fund | | Capital Loss
Carryover | | | Expiration
Year | |
Natural Resources | | $ | 3,770,133 | | | | 2016 | |
| | | 7,987,053 | | | | 2017 | |
| | | | | | | | |
| | $ | 11,757,186 | | | | | |
| | | | | | | | |
To the extent that these Funds realize future net capital gains, taxable distributions will be reduced by any unused capital loss carryovers as permitted by the Internal Revenue Code.
Capital losses generated during the year ending December 31, 2012 and later, are subject to the provisions of the Regulated Investment Company Modernization Act of 2010 (the “Act”). Under the Act, if capital losses are not reduced by gains, the losses will be carried forward with no expiration and with the short-term or long-term character of the loss retained. Additionally, these capital losses must be fully utilized before those capital loss carryovers listed with noted expiration dates in the table above, which may make them more likely to expire unused.
At December 31, 2013, the following Fund had accumulated net realized capital loss carryovers subject to the Act, as follows:
| | | | | | | | |
Fund | | Capital Loss
Carryover | | | Tax Character | |
Natural Resources | | $ | 466,222 | | | | Short-term | |
| | | | | | | | |
| | $ | 466,222 | | | | | |
| | | | | | | | |
During the calendar year 2013, capital loss carryovers utilized by the Funds were as follows: Growth and Income Plus Fund, $842,469; Diversified Income Plus Fund, $12,371,643; and Natural Resources Fund, $4,456,408.
The tax character of distributions paid during the years ended December 31, 2013 and 2012 was as follows:
| | | | | | | | | | | | | | | | | | | | | | | | |
| | | Ordinary Income | | | Long-term Capital Gain | | | Return of Capital | |
Fund | | 12/31/2013 | | | 12/31/2012 | | | 12/31/2013 | | | 12/31/2012 | | | 12/31/2013 | | | 12/31/2012 | |
Growth and Income Plus | | $ | 2,046,124 | | | $ | 1,383,565 | | | $ | 3,772,276 | | | $ | — | | | $ | — | | | $ | — | |
Diversified Income Plus | | | 16,121,196 | | | | 11,205,756 | | | | 2,434,157 | | | | — | | | | — | | | | — | |
Natural Resources | | | 484,874 | | | | 709,647 | | | | — | | | | — | | | | 209,922 | | | | 82,186 | |
54
Thrivent Mutual Funds
Notes to Financial Statements
December 31, 2013
(5) SECURITY TRANSACTIONS
(A) Purchases and Sales of Investment Securities – For the year ended December 31, 2013, the cost of purchases and the proceeds from sales of investment securities, other than U.S. Government and short-term securities, were as follows:
| | | | | | | | |
| | | In thousands | |
Fund | | Purchases | | | Sales | |
Growth and Income Plus | | $ | 92,669 | | | $ | 83,915 | |
Diversified Income Plus | | | 545,951 | | | | 379,000 | |
Natural Resources | | | 34,542 | | | | 36,456 | |
Purchases and Sales of U.S. Government Securities were:
| | | | | | | | |
| | | In thousands | |
Fund | | Purchases | | | Sales | |
Growth and Income Plus | | $ | 12,319 | | | $ | 11,065 | |
Diversified Income Plus | | | 311,567 | | | | 298,345 | |
(B) Investments in Restricted Securities – Certain Funds may own restricted securities that have been deemed illiquid and were purchased in private placement transactions without registration under the Securities Act of 1933. Unless such securities subsequently become registered, they generally may be resold only in privately negotiated transactions with a limited number of purchasers. As of December 31, 2013, the following funds held restricted securities:
| | | | | | | | |
Fund | | Number of
Securities | | | Percent of Fund’s
Net Assets | |
Growth and Income Plus | | | 2 | | | | 0.33 | % |
Diversified Income Plus | | | 2 | | | | 0.49 | % |
The Funds have no right to require registration of unregistered securities.
(C) Investments in High-Yielding Securities – The Funds may invest in high-yielding securities. These securities will typically be in lower rated categories or will be non-rated and generally will involve more risk than securities in higher rated categories. Lower rated or unrated securities are more likely to react to developments affecting market risk and credit risk than are more highly rated securities, which react primarily to movements in the general level of interest rates.
(D) Investments in Options and Futures Contracts – The movement in the price of the security underlying an option or futures contract may not correlate perfectly with the movement in the prices of the portfolio securities being hedged. A lack of correlation could render a Fund’s hedging strategy unsuccessful and could result in a loss to the Fund. In the event that a liquid secondary market would not exist, the Fund could be prevented from entering into a closing transaction, which could result in additional losses to the Fund.
(E) Written Option Contracts – The number of contracts and premium amounts associated with covered call option contracts written during the year ended December 31, 2013, were as follows:
| | | | | | | | |
| | | Number of
Contracts | | | Premium
Amount | |
Diversified Income Plus | | | | | | | | |
Balance at December 31, 2012 | | | — | | | $ | — | |
Opened | | | 6 | | | | 17,750 | |
Closed | | | (3 | ) | | | (9,250 | ) |
Expired | | | (3 | ) | | | (8,500 | ) |
Exercised | | | — | | | | — | |
| | | | | | | | |
Balance at December 31, 2013 | | | — | | | $ | — | |
| | | | | | | | |
(6) SECURITY TRANSACTIONS WITH AFFILIATED FUNDS
The Funds are permitted to purchase or sell securities from or to certain other Funds under specified conditions outlined in procedures adopted by the Board. The procedures have been designed to ensure that any purchase or sale of securities by a Fund from or to another fund or portfolio that is or could be considered an affiliate by virtue of having a common investment adviser (or affiliated investment advisers), common Trustees and/or common officers complies with Rule 17a-7 of the 1940 Act. Further, as defined under the procedures, each transaction is executed at the current market price.
(7) RELATED PARTY TRANSACTIONS
As of December 31, 2013, no related parties held shares in excess of 5% of the Funds covered in this shareholder report.
(8) SUBSEQUENT EVENTS
The Adviser of the Funds has evaluated the impact of subsequent events, and, except as already included in the Notes to Financial Statements, has determined that no additional items require disclosure.
55
Thrivent Mutual Funds
Financial Highlights
| | | | | | | | | | | | | | | | | | | | | | | | | | | | |
| | | FOR A SHARE OUTSTANDING THROUGHOUT EACH PERIOD* | |
| | | | | | Income from Investment Operations | | | Less Distributions from | |
| | | Net Asset
Value,
Beginning
of Period | | | Net
Investment
Income/(Loss) | | | Net Realized
and Unrealized
Gain/(Loss) on
Investments(a) | | | Total from
Investment
Operations | | | Net
Investment
Income | | | Net Realized
Gain on
Investments | | | Return of
Capital | |
GROWTH AND INCOME PLUS FUND | |
Class A Shares | | | | | | | | | | | | | | | | | | | | | | | | | | | | |
Year Ended 12/31/2013 | | $ | 9.59 | | | $ | 0.18 | | | $ | 1.83 | | | $ | 2.01 | | | $ | (0.19 | ) | | $ | (1.03 | ) | | $ | — | |
Year Ended 12/31/2012 | | | 8.70 | | | | 0.20 | | | | 0.89 | | | | 1.09 | | | | (0.20 | ) | | | — | | | | — | |
Year Ended 12/31/2011 | | | 9.08 | | | | 0.13 | | | | (0.38 | ) | | | (0.25 | ) | | | (0.13 | ) | | | — | | | | — | |
Year Ended 12/31/2010 | | | 7.98 | | | | 0.13 | | | | 1.12 | | | | 1.25 | | | | (0.15 | ) | | | — | | | | — | |
Year Ended 12/31/2009 | | | 7.03 | | | | 0.13 | | | | 0.95 | | | | 1.08 | | | | (0.13 | ) | | | — | | | | — | |
Institutional Class Shares | |
Year Ended 12/31/2013 | | | 9.60 | | | | 0.44 | | | | 1.61 | | | | 2.05 | | | | (0.23 | ) | | | (1.03 | ) | | | — | |
Year Ended 12/31/2012 | | | 8.71 | | | | 0.24 | | | | 0.88 | | | | 1.12 | | | | (0.23 | ) | | | — | | | | — | |
Year Ended 12/31/2011 | | | 9.08 | | | | 0.16 | | | | (0.37 | ) | | | (0.21 | ) | | | (0.16 | ) | | | — | | | | — | |
Year Ended 12/31/2010 | | | 7.98 | | | | 0.17 | | | | 1.11 | | | | 1.28 | | | | (0.18 | ) | | | — | | | | — | |
Year Ended 12/31/2009 | | | 7.04 | | | | 0.16 | | | | 0.94 | | | | 1.10 | | | | (0.16 | ) | | | — | | | | — | |
| | | | | | | | | | | | | | | | | | | | | | | | | | | | |
DIVERSIFIED INCOME PLUS FUND | |
Class A Shares | | | | | | | | | | | | | | | | | | | | | | | | | | | | |
Year Ended 12/31/2013 | | | 6.82 | | | | 0.23 | | | | 0.47 | | | | 0.70 | | | | (0.23 | ) | | | (0.04 | ) | | | — | |
Year Ended 12/31/2012 | | | 6.22 | | | | 0.27 | | | | 0.59 | | | | 0.86 | | | | (0.26 | ) | | | — | | | | — | |
Year Ended 12/31/2011 | | | 6.39 | | | | 0.27 | | | | (0.15 | ) | | | 0.12 | | | | (0.29 | ) | | | — | | | | — | |
Year Ended 12/31/2010 | | | 5.83 | | | | 0.33 | | | | 0.54 | | | | 0.87 | | | | (0.31 | ) | | | — | | | | — | |
Year Ended 12/31/2009 | | | 4.68 | | | | 0.32 | | | | 1.11 | | | | 1.43 | | | | (0.28 | ) | | | — | | | | — | |
Institutional Class Shares | |
Year Ended 12/31/2013 | | | 6.77 | | | | 0.26 | | | | 0.46 | | | | 0.72 | | | | (0.26 | ) | | | (0.04 | ) | | | — | |
Year Ended 12/31/2012 | | | 6.19 | | | | 0.30 | | | | 0.57 | | | | 0.87 | | | | (0.29 | ) | | | — | | | | — | |
Year Ended 12/31/2011 | | | 6.36 | | | | 0.29 | | | | (0.15 | ) | | | 0.14 | | | | (0.31 | ) | | | — | | | | — | |
Year Ended 12/31/2010 | | | 5.81 | | | | 0.36 | | | | 0.52 | | | | 0.88 | | | | (0.33 | ) | | | — | | | | — | |
Year Ended 12/31/2009 | | | 4.67 | | | | 0.35 | | | | 1.09 | | | | 1.44 | | | | (0.30 | ) | | | — | | | | — | |
| | | | | | | | | | | | | | | | | | | | | | | | | | | | |
NATURAL RESOURCES FUND(c) | |
Class A Shares | | | | | | | | | | | | | | | | | | | | | | | | | | | | |
Year Ended 12/31/2013 | | | 9.13 | | | | 0.02 | | | | 0.84 | | | | 0.86 | | | | (0.02 | ) | | | — | | | | (0.02 | ) |
Year Ended 12/31/2012 | | | 9.57 | | | | 0.04 | | | | (0.43 | ) | | | (0.39 | ) | | | (0.04 | ) | | | — | | | | (0.01 | ) |
Year Ended 12/31/2011 | | | 9.66 | | | | 0.08 | | | | 0.01 | | | | 0.09 | | | | (0.09 | ) | | | — | | | | (0.09 | ) |
Year Ended 12/31/2010 | | | 7.79 | | | | 0.11 | | | | 1.98 | | | | 2.09 | | | | (0.18 | ) | | | — | | | | (0.04 | ) |
Year Ended 12/31/2009 | | | 6.36 | | | | 0.19 | | | | 1.50 | | | | 1.69 | | | | (0.18 | ) | | | — | | | | (0.08 | ) |
Institutional Class Shares | |
Year Ended 12/31/2013 | | | 9.13 | | | | 0.05 | | | | 0.85 | | | | 0.90 | | | | (0.05 | ) | | | — | | | | (0.02 | ) |
Year Ended 12/31/2012 | | | 9.57 | | | | 0.07 | | | | (0.43 | ) | | | (0.36 | ) | | | (0.07 | ) | | | — | | | | (0.01 | ) |
Year Ended 12/31/2011 | | | 9.66 | | | | 0.12 | | | | — | | | | 0.12 | | | | (0.12 | ) | | | — | | | | (0.09 | ) |
Year Ended 12/31/2010 | | | 7.80 | | | | 0.13 | | | | 1.98 | | | | 2.11 | | | | (0.21 | ) | | | — | | | | (0.04 | ) |
Year Ended 12/31/2009 | | | 6.34 | | | | 0.20 | | | | 1.53 | | | | 1.73 | | | | (0.19 | ) | | | — | | | | (0.08 | ) |
| (a) | The amount shown may not correlate with the change in aggregate gains and losses of portfolio securities due to the timing of sales and redemptions of fund shares. |
| (c) | Prior to October 10, 2011, Fund was the “Real Estate Securities Fund” and invested at least 80% of its net assets in issuers primarily engaged in the U.S. real estate industry. |
| * | All per share amounts have been rounded to the nearest cent. |
The accompanying Notes to Financial Statements are an integral part of this schedule.
56
Thrivent Mutual Funds
Financial Highlights – continued
| | | | | | | | | | | | | | | | | | | | | | | | | | | | | | | | | | |
| RATIOS / SUPPLEMENTAL DATA | |
| | | | | | | | | | | | | Ratio to Average Net
Assets** | | | Ratios to Average Net Assets
Before Expenses Waived,
Credited or Paid
Indirectly** | | | | |
Total
Distributions | | | Net Asset
Value, End of
Period | | | Total
Return(b) | | | Net Assets,
End of Period
(in millions) | | | Expenses | | | Net Investment
Income/(Loss) | | | Expenses | | | Net Investment
Income/(Loss) | | | Portfolio
Turnover
Rate | |
| | | | | | | | | | | | | | | | | | | | | | | | | | | | | | | | | | |
| | | | | | | | | | | | | | | | | | | | | | | | | | | | | | | | | | |
| | $(1.22) | | | $ | 10.38 | | | | 21.08 | % | | $ | 49.8 | | | | 1.15 | % | | | 1.69 | % | | | 1.50 | % | | | 1.34 | % | | | 162 | % |
| | (0.20) | | | | 9.59 | | | | 12.60 | % | | | 25.6 | | | | 1.15 | % | | | 2.18 | % | | | 1.47 | % | | | 1.86 | % | | | 164 | % |
| | (0.13) | | | | 8.70 | | | | (2.79 | )% | | | 21.0 | | | | 1.15 | % | | | 1.47 | % | | | 1.47 | % | | | 1.15 | % | | | 193 | % |
| | (0.15) | | | | 9.08 | | | | 15.83 | % | | | 11.7 | | | | 1.16 | % | | | 1.90 | % | | | 1.76 | % | | | 1.29 | % | | | 360 | % |
| | (0.13) | | | | 7.98 | | | | 15.74 | % | | | 4.1 | | | | 1.15 | % | | | 1.92 | % | | | 1.93 | % | | | 1.14 | % | | | 414 | % |
| | | | | | | | | | | | | | | | | | | | | | | | | | | | | | | | | | |
| | (1.26) | | | | 10.39 | | | | 21.56 | % | | | 2.3 | | | | 0.80 | % | | | 2.02 | % | | | 0.92 | % | | | 1.90 | % | | | 162 | % |
| | (0.23) | | | | 9.60 | | | | 12.97 | % | | | 35.3 | | | | 0.80 | % | | | 2.52 | % | | | 0.94 | % | | | 2.38 | % | | | 164 | % |
| | (0.16) | | | | 8.71 | | | | (2.35 | )% | | | 30.6 | | | | 0.80 | % | | | 1.80 | % | | | 0.94 | % | | | 1.66 | % | | | 193 | % |
| | (0.18) | | | | 9.08 | | | | 16.23 | % | | | 29.9 | | | | 0.81 | % | | | 2.09 | % | | | 1.19 | % | | | 1.70 | % | | | 360 | % |
| | (0.16) | | | | 7.98 | | | | 15.97 | % | | | 24.7 | | | | 0.80 | % | | | 2.28 | % | | | 1.35 | % | | | 1.73 | % | | | 414 | % |
| | | | | | | | | | | | | | | | | | | | | | | | | | | | | | | | | | |
| | | | | | | | | | | | | | | | | | | | | | | | | | | | | | | | | | |
| | | | | | | | | | | | | | | | | | | | | | | | | | | | | | | | | | |
| | (0.27) | | | | 7.25 | | | | 10.40 | % | | | 459.1 | | | | 1.00 | % | | | 3.34 | % | | | 1.00 | % | | | 3.34 | % | | | 155 | % |
| | (0.26) | | | | 6.82 | | | | 14.08 | % | | | 290.7 | | | | 0.99 | % | | | 4.14 | % | | | 1.03 | % | | | 4.10 | % | | | 153 | % |
| | (0.29) | | | | 6.22 | | | | 1.78 | % | | | 200.5 | | | | 0.97 | % | | | 4.29 | % | | | 1.06 | % | | | 4.20 | % | | | 126 | % |
| | (0.31) | | | | 6.39 | | | | 15.24 | % | | | 171.5 | | | | 1.12 | % | | | 5.62 | % | | | 1.12 | % | | | 5.61 | % | | | 112 | % |
| | (0.28) | | | | 5.83 | | | | 31.50 | % | | | 135.2 | | | | 1.18 | % | | | 6.32 | % | | | 1.20 | % | | | 6.30 | % | | | 94 | % |
| | | | | | | | | | | | | | | | | | | | | | | | | | | | | | | | | | |
| | (0.30) | | | | 7.19 | | | | 10.70 | % | | | 107.5 | | | | 0.70 | % | | | 3.66 | % | | | 0.70 | % | | | 3.66 | % | | | 155 | % |
| | (0.29) | | | | 6.77 | | | | 14.23 | % | | | 54.2 | | | | 0.72 | % | | | 4.47 | % | | | 0.72 | % | | | 4.47 | % | | | 153 | % |
| | (0.31) | | | | 6.19 | | | | 2.18 | % | | | 17.4 | | | | 0.74 | % | | | 4.53 | % | | | 0.74 | % | | | 4.52 | % | | | 126 | % |
| | (0.33) | | | | 6.36 | | | | 15.57 | % | | | 7.7 | | | | 0.76 | % | | | 5.92 | % | | | 0.77 | % | | | 5.92 | % | | | 112 | % |
| | (0.30) | | | | 5.81 | | | | 31.97 | % | | | 6.7 | | | | 0.76 | % | | | 6.71 | % | | | 0.79 | % | | | 6.69 | % | | | 94 | % |
| | | | | | | | | | | | | | | | | | | | | | | | | | | | | | | | | | |
| | | | | | | | | | | | | | | | | | | | | | | | | | | | | | | | | | |
| | | | | | | | | | | | | | | | | | | | | | | | | | | | | | | | | | |
| | (0.04) | | | | 9.95 | | | | 9.43 | % | | | 15.8 | | | | 1.30 | % | | | 0.22 | % | | | 1.81 | % | | | (0.28 | )% | | | 36 | % |
| | (0.05) | | | | 9.13 | | | | (4.05 | )% | | | 14.9 | | | | 1.30 | % | | | 0.46 | % | | | 1.77 | % | | | (0.01 | )% | | | 30 | % |
| | (0.18) | | | | 9.57 | | | | 0.85 | % | | | 15.4 | | | | 1.30 | % | | | 0.77 | % | | | 1.70 | % | | | 0.37 | % | | | 92 | % |
| | (0.22) | | | | 9.66 | | | | 27.15 | % | | | 14.8 | | | | 1.29 | % | | | 1.17 | % | | | 1.81 | % | | | 0.66 | % | | | 18 | % |
| | (0.26) | | | | 7.79 | | | | 28.55 | % | | | 10.8 | | | | 1.25 | % | | | 3.09 | % | | | 2.23 | % | | | 2.11 | % | | | 20 | % |
| | | | | | | | | | | | | | | | | | | | | | | | | | | | | | | | | | |
| | (0.07) | | | | 9.96 | | | | 9.89 | % | | | 86.6 | | | | 0.97 | % | | | 0.56 | % | | | 0.97 | % | | | 0.56 | % | | | 36 | % |
| | (0.08) | | | | 9.13 | | | | (3.71 | )% | | | 79.1 | | | | 0.97 | % | | | 0.78 | % | | | 0.97 | % | | | 0.78 | % | | | 30 | % |
| | (0.21) | | | | 9.57 | | | | 1.21 | % | | | 96.8 | | | | 0.94 | % | | | 1.15 | % | | | 0.94 | % | | | 1.15 | % | | | 92 | % |
| | (0.25) | | | | 9.66 | | | | 27.38 | % | | | 95.4 | | | | 0.97 | % | | | 1.47 | % | | | 0.97 | % | | | 1.47 | % | | | 18 | % |
| | (0.27) | | | | 7.80 | | | | 28.97 | % | | | 80.2 | | | | 1.03 | % | | | 3.24 | % | | | 1.04 | % | | | 3.23 | % | | | 20 | % |
| (b) | Total investment return assumes dividend reinvestment and does not reflect any deduction for applicable sales charges. Not annualized for periods less than one year. |
| ** | Computed on an annualized basis if less than one year. |
The accompanying Notes to Financial Statements are an integral part of this schedule.
57
Additional Information
(unaudited)
Shareholder Notification of Federal Tax Information
The following information is provided solely to satisfy the requirements set forth by the Internal Revenue Code. Shareholders will be provided information regarding their distribution in February 2014.
The funds designate the percentage of dividends declared from net investment income as dividends qualifying for the 70% dividends received deduction for corporations and the percentage as qualified dividend income for individuals under the Jobs and Growth Tax Relief Reconciliation Act of 2003 as follows:
| | | | | | | | |
Fund | | Dividends
Received
Deduction
for
Corporations | | | Qualified
Dividend
Income for
Individuals | |
Growth and Income Plus | | | 50 | % | | | 61 | % |
Diversified Income Plus | | | 26 | % | | | 27 | % |
Natural Resources | | | 100 | % | | | 100 | % |
Proxy Voting
The policies and procedures that the Trust uses to determine how to vote proxies relating to portfolio securities are attached to the Trust’s Statement of Additional Information. You may request a free copy of the Statement of Additional Information or the report of how the Trust voted proxies relating to portfolio securities during the most recent 12-month period ended June 30 by calling 1-800-847-4836. You also may review the Statement of Additional Information or the report of how the Trust voted proxies relating to portfolio securities during the most recent 12-month period ended June 30 at Thrivent.com or www.sec.gov.
Quarterly Schedule of Portfolio Holdings
The Trust files its Schedule of Portfolio Holdings on Form N-Q with the SEC for the first and third quarters of each fiscal year. You may request a free copy of the Trust’s Forms N-Q by calling 1-800-847-4836. The Trust’s most recent Form N-Q Schedule of Investments also is at Thrivent.com or www.sec.gov. You also may review and copy the Forms N-Q for the Trust at the SEC’s Public Reference Room in Washington, DC. You may get information about the operation of the Public Reference Room by calling 1-800-SEC-0330.
Board Approval of Investment Advisory Agreement and Subadvisory Agreements
Both the Investment Company Act of 1940 (the “Investment Company Act”) and the terms of the Investment Advisory and Subadvisory Agreements of the Thrivent Mutual Funds (the “Trust”) require that these agreements be approved annually by the Board of Trustees (the “Board”), including a majority of the Trustees who are not “interested persons” of the Trust, as defined in the Investment Company Act (the “Independent Trustees”). The nine-member Board consists of eight Independent Trustees, including the Chairman.
At its meeting on November 19-20, 2013, the Board voted unanimously to renew the existing Investment Advisory Agreement between the Trust and Thrivent Asset Management (the “Adviser”) for each series (each, a “Fund”) of the Trust. The Board also unanimously approved the Subadvisory Agreements for each of the Funds for which there is an investment subadviser (each a “Subadviser”). The Adviser and Subadvisers are referred to, collectively, as the “Advisory Organizations.” In connection with its evaluation of the agreements with the Advisory Organizations, the Board reviewed a broad range of information requested for this purpose and considered a variety of factors, including the following:
| | 1. | The nature, extent, and quality of the services provided by the Advisory Organizations; |
| | 2. | The performance of each Fund; |
| | 3. | The advisory fee and net operating expense ratio of each Fund compared to a peer group; |
| | 4. | The cost of services provided and profit realized by the Adviser; |
58
Additional Information
(unaudited)
| | 5. | The extent to which economies of scale may be realized as the Funds grow; |
| | 6. | Whether the breakpoint levels reflect these economies of scale for the benefit of the Funds’ shareholders; |
| | 7. | Other benefits realized by the Adviser or its affiliates from their relationship with the Trust; and |
| | 8. | Any other factors that the Board deemed relevant to its consideration. |
In connection with the renewal process, the Contracts Committee of the Board (consisting of each of the Independent Trustees) met on five occasions from May 21 to November 19, 2013 to consider information relevant to the renewal process. The Independent Trustees also retained the services of Management Practice, Inc. (“MPI”) as an independent consultant to assist in the compilation, organization, and evaluation of relevant information. This information included Fund-by-Fund statistical comparisons of the advisory fees, other fees, net operating expenses and performance of each of the Funds in comparison to a peer group of comparable funds; portfolio turnover percentages; information prepared by management with respect to the cost of services provided to the Funds and fees charged, including effective advisory fees that take into account breakpoints and fee waivers by the Adviser; asset and flow trends for the Funds; profit realized by the Adviser and its affiliates that provide services to the Funds; and information regarding the types of services furnished to the Funds. The Board received information from management, including the investment management staff of the Adviser regarding the personnel providing services to the Funds, as well as changes in staff and systems and compliance improvements. The Board also received periodic reports from the Adviser’s investment management staff with respect to the performance of the Funds. In addition to its review of the information presented to the Board during the contract renewal process, the Board also considered information obtained from management throughout the course of the year.
The Independent Trustees were represented by independent counsel throughout the review process and during executive sessions without management present to consider reapproval of the agreements. Each Independent Trustee relied on his or her own business judgment in determining the weight to be given to each factor considered in evaluating the materials that were presented. The Contracts Committee’s and Board’s review and conclusions were based on a comprehensive consideration of all information presented to them and were not the result of any single controlling factor. In addition, each Trustee may have weighed individual factors differently. The key factors considered and the conclusions reached are described below.
Nature, Extent and Quality of Services
At each of the Board’s regular quarterly meetings, management presented information describing the services furnished to the Funds by the Adviser and, as appropriate, the Subadvisers. During these meetings, management reported on the investment management, portfolio trading and compliance services provided to the Funds under the Advisory and Subadvisory Agreements. During the renewal process, the Board considered the specific services provided under the Advisory Agreement. The Board also considered information relating to the investment experience and qualifications of the Adviser’s portfolio managers and those of the Subadvisers.
The Board received reports at each of its quarterly meetings from the Adviser’s Head of Equity Investments and Head of Fixed Income Funds, as supplemented by the Adviser’s Chief Investment Officer, who was also present at all of the meetings. At each quarterly meeting, the Head of Equity Investments and Head of Fixed Income Funds presented information about each of the Funds. These reports and presentations gave the Board the opportunity to evaluate the portfolio managers’ abilities and the quality of services they provide to the Funds. Information was also presented to the Board describing the portfolio compliance functions performed by the Adviser and the Adviser’s oversight of the Subadvisers to the Trust. The Independent Trustees also met in-person with and received quarterly reports from the Trust’s Chief Compliance Officer.
The Board considered the adequacy of the Advisory Organizations’ resources used to provide services to the Trust pursuant to the Advisory and Subadvisory Agreements. The Adviser reviewed with the Board the Adviser’s process for overseeing the portfolio management teams of the Funds, and explained similarities and differences for how it oversees the Adviser’s teams and the teams of the Subadvisers. In addition, the Adviser explained how it has continued to invest in technology and personnel and the benefits those investments can have on the Funds. The Adviser also discussed how it has continued to strengthen its compliance program. The Adviser reviewed with the Board its process for selecting and overseeing the Subadvisers, including
59
Additional Information
(unaudited)
the results of recent on-site compliance due diligence visits. The Adviser also reviewed with the Board the services provided by the Subadvisers. The Board viewed these actions as a positive factor in reapproving the existing Advisory Agreement, as they demonstrated the Adviser’s commitment to provide the Funds with quality service and competitive investment performance. The Board concluded that, within the context of its full deliberations, the nature, extent and quality of the investment advisory services provided to the Funds by the Adviser and Subadvisers supported renewal of the Advisory Agreement and Subadvisory Agreements.
Performance of the Funds
In connection with each of its regular quarterly meetings, the Board received information on the performance of each Fund, including net performance, relative performance rankings within each Fund’s Lipper peer group, Morningstar ratings, and performance as compared to benchmark index returns. At each quarterly Board meeting, the Head of Equity Investments and Head of Fixed Income Funds reviewed with the Board the economic and market environment, risk management, and style consistency in connection with management of the Funds. The Board considered investment performance for each Fund, to the extent applicable, over the one-, two-, three-, five-, and ten-year periods. When evaluating investment performance, the Board considered longer-term performance and the trend of performance, and focused particularly upon the three-year performance record. Although the Board conducted its review on a Fund-by-Fund basis, it noted that, for the three-year period ended June 30, 2013, the average ranking of the Funds against their Lipper categories was 61% (with 1% being the best).
The Board requested and received from the Adviser additional information about certain Funds which had faced performance challenges, and information about how the Adviser was addressing such challenges. In addition, the Adviser discussed with the Board certain Funds whose principal investment strategies do not fit well within a Lipper peer group and described differences between these Funds and funds included in their respective Lipper peer group. The Adviser also discussed certain Funds whose performance did not compare well to their respective benchmark. In such cases, the Adviser provided additional information regarding these Funds’ performance compared to a customized benchmark. The Board concluded that the performance of each individual Fund was either satisfactory or that the Adviser had taken appropriate actions in an effort to improve performance.
Advisory Fees and Fund Expenses
The Board reviewed information prepared by MPI comparing each Fund’s advisory fee with the advisory fee of its peer group. The Board considered both the contractual and effective advisory fees for each of the Funds. The Board noted that the majority of the Funds’ advisory fees were at or below the medians of their peer groups, with many in the lowest (i.e., least expensive) quartile. Although the Board conducted its review on a Fund-by-Fund basis, it noted that the average ranking of the Class A Funds’ advisory fees was 30% and the average ranking of the Institutional Class Funds’ fees was 33%. The Board viewed favorably the Adviser’s proposal to continue or extend fee waivers for certain Funds and considered the effect of the waivers in lowering the Funds’ expenses.
On the basis of its review, the Board concluded that the advisory fees charged to the Funds for investment management services were not excessive.
The Board also reviewed information prepared by MPI comparing each Fund’s overall expense ratio with the expense ratio of its peer group. Although the Board conducted its review on a Fund-by-Fund basis, it noted that the Class A Funds had an average ranking of 32% while the Institutional Class Funds had an average ranking of 22%.
Cost of Services and Profitability
The Board considered the Adviser’s estimates of its profitability, which included allocations by the Adviser of its costs in providing advisory services to the Funds. The internal audit department (i.e., Business Risk Management) of the Adviser conducted a review of such allocations and a department representative reported to the Board his views regarding the reasonableness and consistency of these allocations. The Board considered the profitability of the Adviser both overall and on a Fund-by-Fund basis. The Board also considered the expense reimbursements and waivers in effect. Based on its review of the data prepared by MPI and expense and profit information provided by the Adviser, the Board concluded that the profits earned by the Adviser from the Advisory Agreement were not excessive in light of the nature, extent and quality of services provided to the Funds.
60
Additional Information
(unaudited)
With respect to fees paid to Subadvisers under the Subadvisory Agreements, the Board did not consider profitability information with respect to the Subadvisers, which are not affiliated with the Adviser. The Board considered that those contracts had been negotiated on an arm’s-length basis between the Adviser and each Subadviser, and that each Subadviser’s separate profitability from its relationship with the Funds was not a material factor in determining whether to renew the agreement.
Economies of Scale and Breakpoints
The Board considered information regarding the extent to which economies of scale may be realized as a Fund’s assets increase and whether the fee levels reflect these economies of scale for the benefit of shareholders. The Adviser explained its general goal with respect to the employment of fee waivers, expense reimbursements and breakpoints. The Board considered information provided by the Adviser related to advisory fee rates, breakpoints in the advisory fee rates and fee waivers provided by the Adviser. The Board also considered management’s view that it is difficult to generalize as to whether, or to what extent, economies in the advisory function may be realized as a Fund’s assets increase. The Board noted that expected economies of scale, where they exist, may be shared through the use of fee breakpoints, fee waivers by the Adviser, and/or a lower overall fee rate.
Other Benefits to the Adviser and its Affiliates
The Board considered information regarding potential “fall-out” or ancillary benefits that the Adviser and its affiliates may receive as a result of their relationship with the Trust, both tangible and intangible, such as their ability to leverage investment professionals who manage other portfolios, reputational benefits in the investment advisory community and the engagement of affiliates as service providers to the Funds. The Board noted that such benefits were difficult to quantify but were consistent with benefits received by other mutual fund advisers.
The Board also considered other potential benefits to the Adviser and its affiliates derived from its relationship with the Trust, including, among other things, research received by the Adviser generated from commission dollars spent on the Funds’ portfolio trading. The Board reviewed with the Adviser these arrangements and the reasonableness of the costs relative to the services performed. The Board considered the Adviser’s brokerage reports and representations that it evaluates any soft-dollar arrangements for compliance with applicable requirements, particularly with respect to the safe harbor contained in Section 28(e) of the Securities Exchange Act of 1934, and for compliance with the Adviser’s duty to seek best execution.
Based on the factors discussed above, the Contracts Committee unanimously recommended approval of the Advisory Agreement and the Subadvisory Agreements, and the Board, including all of the Independent Trustees voting separately, approved each of the agreements.
61
Board of Trustees and Officers
The following table provides information about the Trustees and Officers of the Trust. Each Trustee oversees each of the 26 series of the Trust and also serves as:
| | • | | Director of Thrivent Series Fund, Inc., a registered investment company consisting of 33 portfolios that serve as underlying funds for variable contracts issued by Thrivent Financial for Lutherans (“Thrivent Financial”) and Thrivent Life Insurance Company and investment options in the retirement plan offered by Thrivent Financial, and |
| | • | | Trustee of Thrivent Cash Management Trust, a registered investment company consisting of one portfolio that serves as a cash collateral fund for a securities lending program sponsored by Thrivent Financial. |
The 26 series of the Trust, the 33 portfolios of Thrivent Series Fund, Inc. and Thrivent Cash Management Trust are referred to herein as the “Fund Complex.” The Statement of Additional Information includes additional information about the Trustees and is available, without charge, by calling 1-800-847-4836.
Interested Trustee (1)(2)(3)(4)
| | |
Name (Year of Birth) Year Elected | | Principal Occupation(s) and Directorships of Public Companies and Other Investment Companies
During the Past Five Years |
Russell W. Swansen (1957) 2009 | | Senior Vice President, Chief Investment Officer, Thrivent Financial since 2003. |
Independent Trustees (2)(3)(4)(5)
| | |
Name (Year of Birth) Year Elected | | Principal Occupation(s) and Directorships of Public Companies and Other Investment Companies
During the Past Five Years |
| |
Janice B. Case (1952) 2011 | | Independent Trustee of North American Electric Reliability Corporation (self-regulatory organization) since 2008; Independent Director of Western Electricity Coordinating Council (nonprofit corporation coordinating and promoting bulk electric system reliability) from 2002 through 2008. |
| |
Richard L. Gady (1943) 1987 | | Retired. |
| |
Richard A. Hauser (1943) 2004 | | Vice President and Assistant General Counsel, The Boeing Company since 2007. |
| |
Marc S. Joseph (1960) 2011 | | Managing Director of GraniteRidgeLLP (consulting and advisory firm) since 2009; Managing Director of MJosephLLC (private investing and consulting firm) since 2004. |
| |
Paul R. Laubscher (1956) 2009 | | Portfolio Manager for private real estate portfolios of IBM Retirement Funds. |
| |
James A. Nussle (1960) 2011 | | President and Chief Operating Officer of Growth Energy (trade association) since 2010; Advisory Board member of AVISTA Capital Partners (private equity firm) since 2010; Contributor on CNBC (media) since 2010; CEO of The Nussle Group LLC (consulting firm) since 2009; Director of the Office of Management and Budget from 2007 through 2009. |
| |
Douglas D. Sims (1946) 2006 | | Currently, Director of Keystone Science School. Previously, Director of the Center for Corporate Excellence. |
| |
Constance L. Souders (1950) 2007 | | Retired. |
62
Board of Trustees and Officers
Executive Officers (4)
| | |
Name (Year of Birth) Position Held With Thrivent | | Principal Occupation(s) During the Past Five Years |
Russell W. Swansen (1957) President | | Senior Vice President, Chief Investment Officer, Thrivent Financial since 2003. |
| |
David S. Royal (1971) Secretary and Chief Legal Officer | | Vice President, Deputy General Counsel since 2006; Interim Investment Company and Investment Adviser Chief Compliance Officer from May 2010 until December 2010. |
| |
Gerard V. Vaillancourt (1967) Treasurer and Principal Accounting Officer | | Vice President, Mutual Fund Accounting since 2006. |
| |
Ted S. Dryden (1965) Chief Compliance Officer | | Investment Company and Investment Adviser Chief Compliance Officer, Thrivent Financial since 2010; Chief Compliance Officer, OptumHealth Financial Services from 2009 to 2010; Vice President, Asset Management Compliance, Ameriprise Financial from 2006 to 2009. |
| |
Janice M. Guimond (1965) Vice President | | Vice President, Investment Operations, Thrivent Financial since 2004. |
| |
Kathleen M. Koelling (1977) Anti-Money Laundering Officer (6) | | Privacy and Anti-Money Laundering Officer, Thrivent Financial since 2010; Senior Counsel, Thrivent Financial since 2002. |
| |
Mark D. Anema (1961) Vice President | | Vice President, New Product Management and Development, Thrivent Financial since 2007. |
| |
Jody L. Bancroft (1971) Assistant Vice President (6) | | Director, Investment Field Operations, Thrivent Financial since 2009; Director, Annuity & Settlement Option New Services, Thrivent Financial from 2007 until 2009. |
| |
Michael W. Kremenak (1978) Assistant Secretary | | Senior Counsel, Thrivent Financial since 2013; Vice President and Assistant General Counsel at Nuveen Investments 2011 to 2013; Attorney at FAF Advisors 2009 to 2010; Associate at Skadden, Arps, Slate, Meagher & Flom 2005 to 2009. |
| |
James M. Odland (1955) Assistant Secretary | | Vice President and Managing Counsel, Thrivent Financial since 2005. |
| |
Rebecca A. Paulzine (1979) Assistant Secretary | | Senior Counsel, Thrivent Financial since 2010; Associate, Faegre & Benson LLP from 2005 to 2009. |
| |
Todd J. Kelly (1969) Assistant Treasurer (6) | | Director, Fund Accounting Operations, Thrivent Financial since 2002. |
| |
Sarah L. Bergstrom (1977) Assistant Treasurer | | Director, Fund Accounting Administration, Thrivent Financial since 2007. |
| (1) | “Interested Trustee” of the Trust as defined in the Investment Company Act of 1940 by virtue of positions with Thrivent Financial. Mr. Swansen is considered an interested trustee because of his principal occupation with Thrivent Financial. |
| (2) | Each Trustee generally serves an indefinite term until her or his successor is duly elected and qualified. Trustees serve at the discretion of the board until their successors are duly appointed and qualified. |
| (3) | Each Trustee oversees 60 portfolios. |
| (4) | The address for each Trustee and Officer unless otherwise noted is 625 Fourth Avenue South, Minneapolis, MN 55415 |
| (5) | The Trustees other than Mr. Swansen are not “interested trustees” of the Fund and are referred to as “Independent Trustees.” |
| (6) | The address for this Officer is 4321 North Ballard Road, Appleton, WI 54913 |
63

As of the end of the period covered by this report, registrant has adopted a code of ethics (as defined in Item 2 of Form N-CSR) applicable to registrant’s Principal Executive Officer, Principal Financial Officer and Principal Accounting Officer. No waivers were granted to such code of ethics during the period covered by this report. A copy of this code of ethics is filed as an exhibit to this Form N-CSR.
| Item 3. | Audit Committee Financial Expert |
Registrant’s Board of Trustees has determined that Constance L. Souders, an independent trustee, is the Audit Committee Financial Expert.
| Item 4. | Principal Accountant Fees and Services |
(a) through (d)
Thrivent Natural Resources Fund, Thrivent Growth and Income Plus Fund, and Thrivent Diversified Income Plus Fund (each a “Fund” and collectively, the “Funds”) are each a series of Thrivent Mutual Funds, a Massachusetts business trust (the “Trust”). The Trust, as of the date of filing this Form N-CSR, contains a total of 26 series (the “Series”), including the Funds. This Form N-CSR relates to the annual report of each Fund.
The following table presents the aggregate fees billed to the Funds for the respective fiscal years ended December 31, 2013 and December 31, 2012 by the Funds’ independent public accountants, PricewaterhouseCoopers LLP (“PwC”), for professional services rendered for the audit of the Funds’ annual financial statements and fees billed for other services rendered by PwC during those periods.
| | | | | | | | |
Fiscal Years Ended | | 12/31/13 | | | 12/31/12 | |
| | |
Audit Fees | | $ | 29,185 | | | $ | 28,700 | |
| | |
Audit-Related Fees(1) | | $ | 297 | | | $ | 0 | |
| | |
Tax Fees(2) | | $ | 23,995 | | | $ | 7,859 | |
| | |
All Other Fees(3) | | $ | 0 | | | $ | 0 | |
| | | | | | | | |
| | |
Total | | $ | 53,477 | | | $ | 36,559 | |
| | | | | | | | |
| (1) | Audit-related fees consist of the aggregate fees billed for assurance and related services that are reasonably related to the performance of the audit of financial statements and are not reported under the category of audit fees. |
| (2) | Tax fees consist of the aggregate fees billed for professional services rendered by the principal accountant relating to tax compliance, tax advice, and tax planning and specifically include fees for tax return preparation. |
| (3) | All other fees consist of the aggregate fees billed for products and services provided by the principal accountant other than audit, audit-related, and tax services. |
The following table presents the aggregate fees billed to all Series of the Trust (other than the Funds) with fiscal years ending on October 31 for the fiscal years ended October 31, 2013 and October 31, 2012 by PwC for professional services rendered for the audit of the annual financial statements of the applicable Series and fees billed for other services rendered by PwC during those periods.
| | | | | | | | |
Fiscal Years Ended | | 12/31/13 | | | 12/31/12 | |
| | |
Audit Fees | | $ | 362,675 | | | $ | 373,880 | |
| | |
Audit-Related Fees(1) | | $ | 3,621 | | | $ | 0 | |
| | |
Tax Fees(2) | | $ | 174,182 | | | $ | 55,548 | |
| | |
All Other Fees(3) | | $ | 0 | | | $ | 0 | |
| | | | | | | | |
| | |
Total | | $ | 540,478 | | | $ | 429,428 | |
| | | | | | | | |
| (1) | Audit-related fees consist of the aggregate fees billed for assurance and related services that are reasonably related to the performance of the audit of financial statements and are not reported under the category of audit fees. |
| (2) | Tax fees consist of the aggregate fees billed for professional services rendered by the principal accountant relating to tax compliance, tax advice, and tax planning and specifically include fees for tax return preparation. |
| (3) | All other fees consist of the aggregate fees billed for products and services provided by the principal accountant other than audit, audit-related, and tax services. |
| | (e) | Registrant’s audit committee charter, adopted in February 2010, provides that the audit committee (comprised of the independent Trustees of registrant) is responsible for pre-approval of all auditing services performed for the registrant. The audit committee also is responsible for pre-approval (subject to the de minimis exceptions for non-audit services described in Section 10A(i)(1)(B) of the Securities Exchange Act of 1934) of all non-auditing services performed for the registrant or an affiliate of registrant. In addition, registrant’s audit committee charter permits a designated member of the audit committee to pre-approve, between meetings, one or more audit or non-audit service projects, subject to an expense limit and notification to the audit committee at the next committee meeting. Registrant’s audit committee pre-approved all fees described above that PwC billed to registrant. |
| | (f) | Less than 50% of the hours billed by PwC for auditing services to registrant for the fiscal year ended December 31, 2013 was for work performed by persons other than full-time permanent employees of PwC. |
| | (g) | The aggregate non-audit fees billed by PwC to registrant and to registrant’s investment adviser and any entity controlling, controlled by, or under common control with registrant’s investment adviser for the fiscal years set forth below are disclosed in the table below. The disclosed payments were for access to a PwC-sponsored online library that provides interpretive guidance regarding U.S. and foreign accounting standards. |
| | | | | | | | | | | | | | | | |
Fiscal Year Ended | | 10/31/13 | | | 12/31/13 | | | 10/31/12 | | | 12/31/12 | |
Registrant(1) | | $ | 0 | | | $ | 0 | | | $ | 0 | | | $ | 0 | |
Adviser | | $ | 6,450 | | | $ | 6,450 | | | $ | 1,800 | | | $ | 1,800 | |
| | (h) | Registrant’s audit committee has considered the non-audit services provided to the registrant and registrant’s investment adviser and any entity controlling, controlled by, or under common control with registrant’s investment adviser as described above and determined that these services do not compromise PwC’s independence. |
| Item 5. | Audit Committee of Listed Registrants |
Not applicable.
| Item 6. | Schedule of Investments |
(a) Registrant’s Schedule of Investments is included in the report to shareholders filed under Item 1.
(b) Not applicable to this filing.
| Item 7. | Disclosure of Proxy Voting Policies and Procedures for Closed-End Management Investment Companies |
Not applicable.
| Item 8. | Portfolio Managers of Closed-End Management Investment Companies |
Not applicable.
| Item 9. | Purchases of Equity Securities by Closed-End Management Investment Company and Affiliated Purchasers. |
Not applicable.
| Item 10. | Submission of Matters to a Vote of Security Holders |
There have been no material changes to the procedures by which shareholders may recommend nominees to registrant’s board of trustees.
| Item 11. | Controls and Procedures |
(a)(i) Registrant’s President and Treasurer have concluded that registrant’s disclosure controls and procedures (as defined in Rule 30a-3(c) under the Investment Company Act of 1940) are effective, based on their evaluation of these controls and procedures as of a date within 90 days of the filing date of this report.
(a)(ii) Registrant’s President and Treasurer are aware of no change in registrant’s internal control over financial reporting (as defined in Rule 30a-3(d) under the Investment Company Act of 1940) that occurred during registrant’s most recent fiscal quarter that has materially affected, or is reasonably likely to materially affect, registrant’s internal control over financial reporting.
(a) The code of ethics pursuant to Item 2 is attached hereto.
(b) Certifications pursuant to Rules 30a-2(a) and 30a-2(b) under the Investment Company Act of 1940 are attached hereto.
SIGNATURES
Pursuant to the requirements of the Securities Exchange Act of 1934 and the Investment Company Act of 1940, the registrant has duly caused this report to be signed on its behalf by the undersigned, thereunto duly authorized.
| | | | |
| Date: February 28, 2014 | | THRIVENT MUTUAL FUNDS |
| | |
| | By: | | /s/Russell W. Swansen |
| | | | Russell W. Swansen |
| | | | President |
Pursuant to the requirements of the Securities Exchange Act of 1934 and the Investment Company Act of 1940, this report has been signed below by the following persons on behalf of the registrant and in the capacities and on the dates indicated.
| | | | |
| Date: February 28, 2014 | | By: | | /s/Russell W. Swansen |
| | | | Russell W. Swansen |
| | | | President |
| | | | |
Date: February 28, 2014 | | By: | | /s/Gerard V. Vaillancourt |
| | | | Gerard V. Vaillancourt |
| | | | Treasurer |