UNITED STATES
SECURITIES AND EXCHANGE COMMISSION
Washington, D.C. 20549
FORM N-CSR
CERTIFIED SHAREHOLDER REPORT OF REGISTERED
MANAGEMENT INVESTMENT COMPANIES
Investment Company Act file number 811- 5079
John Hancock Tax-Exempt Series
(Exact name of registrant as specified in charter)
601 Congress Street, Boston, Massachusetts 02210
(Address of principal executive offices) (Zip code)
Alfred P. Ouellette
Senior Counsel and Assistant Secretary
601 Congress Street
Boston, Massachusetts 02210
(Name and address of agent for service)
Registrant's telephone number, including area code: 617-663-4324
| Date of fiscal year end: | August 31 | | ||
| Date of reporting period: | August 31, 2007 | |||
ITEM 1. REPORT TO SHAREHOLDERS.

| TABLE OF CONTENTS | ||
| Your fund at a glance | ||
| page 1 | ||
| Managers’ report | ||
| page 2 | ||
| A look at performance | ||
| page 6 | ||
| Your expenses | ||
| page 8 | ||
| Fund’s investments | ||
| page 10 | ||
| Financial statements | ||
| page 14 | ||
| Notes to financial | ||
| statements | ||
| page 20 | ||
| Trustees and officers | ||
| page 31 | ||
| For more information | ||
| page 36 | ||
CEO corner
To Our Shareholders,
Volatility returned to the U.S. stock market in the 12-month period ended August 31, 2007; however, stocks still posted a strong gain of 15.13%, as measured by the Standard & Poor’s 500 Index. The market experienced a particularly sharp downturn in August, as the subprime mortgage market’s woes increased. Rising defaults and an ensuing credit crunch caused heightened fears about their potential impact on U.S. economic growth. Foreign markets felt some ripple effects from the subprime issue, but they continued nonetheless to benefit from solid economic growth and outperformed the U.S. market in this period.
During this period of volatility, the U.S. stock market also passed a significant milestone — the broad Standard & Poor’s 500 Index climbed beyond the record it had set seven years ago. From its peak in March 2000, the stock market spiraled downward three consecutive years, bottoming in 2002. The upturn began in 2003, and the market has advanced each year since, finally setting a new high for the first time on May 30, 2007. During that period, the S&P 500 Index experienced five significant short-term sell-offs of 6% or more, with the August subprime-induced meltdown being the most recent.
This nearly complete market cycle highlights the importance of two investment principles you have heard us speak of often: diversification and patience. By allocating your investments among different asset classes, investment styles and portfolio managers, you are likely to be well represented through all phases of a complete market cycle, with the winners helping to cushion the fall of the losers.
The challenge for investors with a diversified portfolio is to properly evaluate your investments to tell the difference between an underperforming manager and an out-of-favor style, while also understanding the role each investment plays in your portfolio. That’s where your financial professional can provide true value. He or she can help you make those assessments and also counsel patience, because a properly diversified portfolio by its very nature will typically have something lagging or out of favor — a concept that can be difficult to live with, but necessary to embrace. If everything in your portfolio is “working,” then you are not truly diversified, but rather are leveraged to the current market and the flavor of the day. If so, you are bound to be out of step in the near future.
The recent volatility in the securities markets has prompted many investors to question how long this type of market cycle will last. History tells us it will indeed end and that when it does, today’s leaders may well turn into laggards and vice versa. The subprime mortgage market woes are just the latest example of why investors should be both patient and well-diversified. For with patience and a diversified portfolio, it could be easier to weather the market’s twists and turns and reach your long-term goals.
Sincerely,

Keith F. Hartstein,
President and Chief Executive Officer
This commentary reflects the CEO’s views as of August 31, 2007. They are subject to change at any time.
Your fund at a glance
The Fund seeks a high level of current income, consistent with preservation of capital, that is exempt from federal, New York State and New York City personal income taxes. In pursuing this goal, the fund normally invests at least 80% of its assets in securities of any maturity exempt from federal and New York personal income taxes.
Over the last twelve months
► Municipal bonds gained modestly as subprime mortgage lending woes led to a more volatile environment.
► The Fund performed in line with its peer group average but trailed its benchmark index.
► Pollution control and transportation bonds posted the best results, while education bonds lagged.
| Top 10 holdings | |
| Puerto Rico Aqueduct & Sewer Auth, 7-1-11, 7.970% | 4.3% |
| New York State Dormitory Auth, 5-15-19, 5.500% | 4.0% |
| Triborough Bridge & Tunnel Auth, 1-1-21, 6.125% | 3.2% |
| Oneida County Industrial Development Agency, 7-1-29, Zero | 3.1% |
| New York City Municipal Water Finance Auth, 6-15-33, 5.500% | 2.9% |
| New York, City of, 12-1-17, 5.250% | 2.9% |
| Virgin Islands Public Finance Auth, 10-1-18, 5.875% | 2.8% |
| Port Auth of New York & New Jersey, 10-1-19, 6.750% | 2.8% |
| New York Local Government Assistance Corp, 4-1-17, 5.500% | 2.5% |
| Puerto Rico Public Building Auth, 7-1-12, 6.250% | 2.3% |
As a percentage of net assets on August 31, 2007.
1
Managers’ report
John Hancock
New York Tax-Free Income Fund
In an increasingly unsettled investment environment, municipal bonds managed to post modestly positive results for the year ended August 31, 2007. The Lehman Brothers Municipal Bond Index advanced 2.30% for the one-year period; by comparison, the Lehman Brothers U.S. Aggregate Index — a broad measure of the taxable bond market — returned 5.26% .
The municipal bond market was relatively calm during the first eight months of the period. Slowing but still moderate U.S. economic growth, a stable interest rate policy from the Federal Reserve and balanced supply and demand in the municipal market contributed to a quiet environment for municipal bonds from September 2006 through April 2007, when interest income provided nearly all of the performance.
However, volatility increased markedly over the last four months, as fallout from the declining housing and subprime mortgage sectors spread to other segments of the economy and financial markets. The ensuing flight to quality, resulting from investors fleeing riskier investments, led to a sell-off in the municipal bond market, most notably among lower-quality bonds.
Municipal bond issuance, which had increased over the past several years as interest rates remained relatively low, was strong for most of the one-year period, dropping off only in the last two months as yields rose. Healthy demand from hedge funds and other non-traditional municipal
SCORECARD
| INVESTMENT | PERIOD’S PERFORMANCE ... AND WHAT’S BEHIND THE NUMBERS | |
| Pollution-control | ▲ | Higher coupon and stable credits posted solid gains |
| bonds | ||
| Shorter-term bonds | ▲ | Held up better in the market sell-off late in the one-year period |
| Education bonds | ▼ | Zero-coupon structures gave back gains from earlier in the year amid |
| increased volatility |
2

Portfolio Managers, MFC Global Investment Management (U.S.) LLC Dianne M. Sales, CFA, and Frank A. Lucibella, CFA
buyers absorbed the bulk of the new supply, but many of these non-traditional investors shifted away from the municipal market in recent months, contributing to the sell-off.
New York credit environment
Municipal credit quality in New York remained favorable over the past 12 months, with New York City receiving a credit-rating upgrade in July 2007. The state’s economy continued to deliver solid growth, and real estate and personal income tax revenues remained generally robust for both the state and its largest city. Governor Eliot Spitzer, who was elected in November 2006, and the state legislature have put a reasonable and timely budget in place for the 2008 fiscal year. However, recent volatility in the financial markets and a decline in merger activity could have an adverse impact on Wall Street income and bonuses, which could in turn put downward pressure on state and city tax revenues.
“In an increasingly unsettled
investment environment,
municipal bonds managed to post
modestly positive results for the
year ended August 31, 2007.”
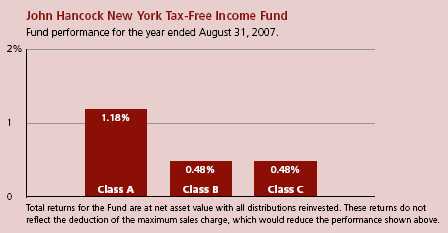
Fund performance
For the year ended August 31, 2007, John Hancock New York Tax-Free Income Fund’s Class A, Class B and Class C shares posted total returns of 1.18%, 0.48% and 0.48%, respectively, at net asset value. By comparison, the average return of Morningstar, Inc.’s muni New York long fund category was 1.14% 1 while the Lehman Brothers Municipal Bond Index returned 2.30% . Keep in mind that your net asset value return will be different from the Fund’s performance if you were not invested in the Fund for the entire period or did not reinvest all distributions. See pages six and seven for historical performance information.
New York Tax-Free Income Fund
3
Higher quality, higher yield helped
The portfolio narrowly outperformed its peer group average, largely, we believe, because of its above-average yield. In addition to providing a high level of tax-free interest income, the portfolio’s higher yield helped cushion price volatility within the portfolio. Higher-quality bonds also added value as they held up best during the recent sell-off, when investors shifted away from riskier securities.
“Within the portfolio, sectors
exhibiting stable credit and higher
coupons provided the
best returns…”
On the other side of the coin, the portfolio was hindered by its zero-coupon holdings as well as by several higher-yield names held further out on the yield curve, where we found the most attractive yields in that market segment. These bonds suffered as rates rose and credit spreads widened.
Sector performance
Returns in the municipal market were driven more by maturity and quality than by sector. Within the portfolio, sectors exhibiting stable credit and higher coupons provided the best returns, including pollution control bonds; transportation bonds, which are backed by airline, transit and bridge projects; and tobacco bonds.
The weaker performers in the portfolio over the past year included education bonds, where zero-coupon structures played a large role. Market concern over the liquidity in the finance sector and slowing real estate returns also negatively impacted credit spreads on projects like the Goldman Sachs’ headquarters building and some continuing care retirement centers.
| SECTOR DISTRIBUTION2 | |
| General obligation | |
| bonds | 7% |
| Revenue bonds | |
| Water & sewer | 15% |
| Education | 14% |
| Health | 10% |
| Industrial development | 9% |
| Sales tax | 7% |
| Transportation | 6% |
| Public facility | 5% |
| Tobacco | 3% |
| Pollution | 3% |
| Economic development | 2% |
| Electric | 2% |
| Other | 16% |
Avoiding the subprime fallout
Although the Fund had no securities directly impacted by the subprime mortgage meltdown, indirect effects did have an impact on certain economic development projects in the Fund. In the case of the Fund’s holdings in Goldman
New York Tax-Free Income Fund
4
Sachs’ headquarters, concerns over that firm’s exposure to the subprime market negatively impacted returns. However, the Fund has no direct exposure to the subprime market, and very limited exposure to raw property development risk.
Outlook
The recent events in the mortgage and housing markets are likely to have a dampening effect on the U.S. economy, but the extent of this impact is unclear. To date, the domestic economy has held up reasonably well, and economic growth on a global scale continues to strengthen. Nonetheless, the Fed, which cut its discount rate in mid-August, is widely expected to lower its federal funds rate in September.

Given the uncertain economic and credit environment, we expect the municipal bond market to remain volatile in the coming months. This volatility may present opportunities for us to find more attractive values and capture higher yields, enhancing the level of tax-free income the portfolio produces.
This commentary reflects the views of the portfolio managers through the end of the Fund’s period discussed in this report. The managers’ statements reflect their own opinions. As such, they are in no way guarantees of future events and are not intended to be used as investment advice or a recommendation regarding any specific security. They are also subject to change at any time as market and other conditions warrant.
1 Figures from Morningstar, Inc. include reinvested dividends and do not take into account sales charges. Actual load-adjusted performance is lower.
2 As a percentage of net assets on August 31, 2007.
New York Tax-Free Income Fund
5
A look at performance
| For the periods ended August 31, 2007 | ||||||||||||
| Average annual returns | Cumulative total returns | SEC 30- | ||||||||||
| with maximum sales charge (POP) | with maximum sales charge (POP) | day yield | ||||||||||
| Inception | Since | Since | as of | |||||||||
| Class | date | 1-year | 5-year | 10-year | inception | 6 months | 1-year | 5-year | 10-year | inception | 8-31-07 | |
| A | 9-13-87 | –3.34% | 2.66% | 4.18% | — | –5.73% | –3.34% | 14.02% | 50.60% | — | 4.15% | |
| B | 10-3-96 | –4.37 | 2.54 | 4.08 | — | –6.44 | –4.37 | 13.38 | 49.15 | — | 3.64 | |
| C | 4-1-99 | –0.49 | 2.89 | — | 3.57% | –2.58 | –0.49 | 15.31 | — | 34.33% | 3.64 | |
Performance figures assume all distributions are reinvested. Public offering price (POP) figures reflect maximum sales charge on Class A shares of 4.5% and the applicable contingent deferred sales charge (CDSC) on Class B and Class C shares. The returns for Class C shares have been adjusted to reflect the elimination of the front-end sales charge effective July 15, 2004. The Class B shares’ CDSC declines annually between years 1 to 6 according to the following schedule 5, 4, 3, 3, 2, 1%. No sales charge will be assessed after the sixth year. Class C shares held for less than one year are subject to a 1% CDSC.
The expense ratios of the Fund, both net (including any fee waivers or expense limitations) and gross (excluding any fee waivers or expense limitations), are set forth according to the most recent publicly available Prospectus for the Fund and may differ from the expense ratios disclosed in the Financial Highlights tables in this report. The gross expenses are as follows: Class A — 1.03%, Class B — 1.73%, Class C — 1.73% .
The returns reflect past results and should not be considered indicative of future performance. The return and principal value of an investment will fluctuate so that shares, when redeemed, may be worth more or less than their original cost. Due to market volatility, the Fund’s current performance may be higher or lower than the performance shown. For performance data current to the most recent month-end, please call 1-800-225-5291 or visit the Fund’s Web site at www.jhfunds.com.
The performance table above and the chart on the next page do not reflect the deduction of taxes that a shareholder would pay on fund distributions or the redemption of fund shares. Please note that a portion of the Fund’s income may be subject to taxes, and some investors may be subject to the Alternative Minimum Tax (AMT). Also note that capital gains are taxable.
The Fund’s performance results reflect any applicable expense reductions, without which the expenses would increase and results would have been less favorable.
New York Tax-Free Income Fund
6
Growth of $10,000
This chart shows what happened to a hypothetical $10,000 investment in New York Tax-Free Income Fund Class A shares for the period indicated. For comparison, we’ve shown the same investment in the Lehman Brothers Municipal Bond Index.

| With maximum | ||||
| Class | Period beginning | Without sales charge | sales charge | Index |
| B2 | 8-31-97 | $14,915 | $14,915 | $16,736 |
| C2 | 4-1-99 | 13,433 | 13,433 | 14,990 |
Assuming all distributions were reinvested for the period indicated, the table above shows the value of a $10,000 investment in the Fund’s Class B and Class C shares, respectively, as of August 31, 2007. The Class C shares investment with maximum sales charge has been adjusted to reflect the elimination of the front-end sales charge effective July 15, 2004. Performance of the classes will vary based on the difference in sales charges paid by shareholders investing in the different classes and the fee structure of those classes.
Lehman Brothers Municipal Bond Index is an unmanaged index that includes municipal bonds and is commonly used as a measure of bond performance.
It is not possible to invest directly in an index. Index figures do not reflect sales charges, which would have resulted in lower values if they did.
1 NAV represents net asset value and POP represents public offering price.
2 No contingent deferred sales charge applicable.
New York Tax-Free Income Fund
7
Your expenses
These examples are intended to help you understand your ongoing operating expenses.
Understanding fund expenses
As a shareholder of the Fund, you incur two types of costs:
■ Transaction costs which include sales charges (loads) on purchases or redemptions (varies by share class), minimum account fee charge, etc.
■ Ongoing operating expenses including management fees, distribution and service fees (if applicable) and other fund expenses.
We are going to present only your ongoing operating expenses here.
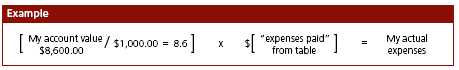
Actual expenses/actual returns
This example is intended to provide information about your fund’s actual ongoing operating expenses, and is based on your fund’s actual return. It assumes an account value of $1,000.00 on March 1, 2007, with the same investment held until August 31, 2007.
| Account value | Ending value | Expenses paid during period | |
| on 3-1-07 | on 8-31-07 | ended 8-31-071 | |
| Class A | $1,000.00 | $987.40 | $5.17 |
| Class B | 1,000.00 | 983.90 | 8.63 |
| Class C | 1,000.00 | 983.90 | 8.63 |
Together with the value of your account, you may use this information to estimate the operating expenses that you paid over the period. Simply divide your account value at August 31, 2007 by $1,000.00, then multiply it by the “expenses paid” for your share class from the table above. For example, for an account value of $8,600.00, the operating expenses should be calculated as follows:
New York Tax-Free Income Fund
8
Hypothetical example for comparison purposes
This table allows you to compare your fund’s ongoing operating expenses with those of any other fund. It provides an example of the Fund’s hypothetical account values and hypothetical expenses based on each class’s actual expense ratio and an assumed 5% annualized return before expenses (which is not your fund’s actual return). It assumes an account value of $1,000.00 on March 1, 2007, with the same investment held until August 31, 2007. Look in any other fund shareholder report to find its hypothetical example and you will be able to compare these expenses.
| Account value | Ending value | Expenses paid during period | |
| on 3-1-07 | on 8-31-07 | ended 8-31-07 1 | |
| Class A | $1,000.00 | $1,020.00 | $5.25 |
| Class B | 1,000.00 | 1,016.50 | 8.77 |
| Class C | 1,000.00 | 1,016.50 | 8.77 |
Remember, these examples do not include any transaction costs, such as sales charges; therefore, these examples will not help you to determine the relative total costs of owning different funds. If transaction costs were included, your expenses would have been higher. See the prospectus for details regarding transaction costs.
1 Expenses are equal to the Fund’s annualized expense ratio of 1.02%, 1.73% and 1.72% for Class A, Class B and Class C, respectively, multiplied by the average account value over the period, multiplied by number of days in most recent fiscal half-year/365 or 366 (to reflect the one-half year period).
New York Tax-Free Income Fund
9
F I N A N C I A L S T A T E M E N T S
Fund’s investments
Securities owned by the Fund on 8-31-07
This schedule is divided into two main categories: tax-exempt long-term bonds and short-term investments. Tax-exempt long-term bonds are broken down by state or territory. Under each state or territory is a list of securities owned by the Fund. Short-term investments, which represent the Fund’s cash position, are listed last.
| Interest | Maturity | Credit | Par value | |||
| State, issuer, description | rate | date | rating (A) | (000) | Value | |
| Tax-exempt long-term bonds 99.03% | $53,953,167 | |||||
| (Cost $51,342,344) | ||||||
| New York 85.65% | 46,662,374 | |||||
| Albany Parking Auth, | ||||||
| Rev Ref Bond Ser 2001A | 5.625% | 07-15-25 | BBB+ | $385 | 416,454 | |
| Rev Ref Bond Ser 2001A | 5.625 | 07-15-25 | BBB+ | 365 | 380,334 | |
| Chautauqua Tobacco Asset | ||||||
| Securitization Corp, | ||||||
| Rev Ref Asset Backed Bond | 6.750 | 07-01-40 | BBB | 1,000 | 1,040,860 | |
| Herkimer County Industrial | ||||||
| Development Agency, | ||||||
| Rev Ref Folts Adult Home | ||||||
| Ser 2005A | 5.500 | 03-20-40 | Aaa | 1,000 | 1,076,890 | |
| Metropolitan Transportation Auth, | ||||||
| Rev Serv Contract Commuter Facil | ||||||
| Ser 3 | 7.375 | 07-01-08 | A1 | 195 | 200,156 | |
| Monroe Newpower Corp, | ||||||
| Rev Ref Pwr Facil | 5.100 | 01-01-16 | BBB | 1,000 | 987,520 | |
| Nassau County Industrial | ||||||
| Development Agency, | ||||||
| Rev Ref Civic Facil North Shore | ||||||
| Hlth Sys Projs Ser 2001A | 6.250 | 11-01-21 | A3 | 275 | 289,344 | |
| Rev Ref Civic Facil North Shore | ||||||
| Hlth Sys Projs Ser 2001B | 5.875 | 11-01-11 | A3 | 250 | 260,115 | |
| New York, City of, | ||||||
| Gen Oblig Unltd Ser 2001B | 5.250 | 12-01-17 | AA | 1,500 | 1,557,075 | |
| Gen Oblig Unltd Ser 2004J | 5.000 | 05-15-23 | AA | 1,000 | 1,025,110 | |
| Gen Oblig Unltd Subser | ||||||
| 1993A-10 (P) | 3.840 | 08-01-16 | AAA | 300 | 300,000 | |
| Gen Oblig Unltd Subser | ||||||
| 1993B-2 (P) | 3.840 | 08-15-18 | AAA | 300 | 300,000 | |
| Gen Oblig Unltd Subser | ||||||
| 1993B-2 (P) | 3.840 | 08-15-19 | AAA | 200 | 200,000 | |
| New York City Industrial | ||||||
| Development Agency, | ||||||
| Rev Civic Facil Lycee Francais de | ||||||
| NY Proj Ser 2002A | 5.375 | 06-01-23 | A | 1,000 | 1,000,140 | |
| Rev Civic Facil Polytechnic | ||||||
| Univ Proj | 6.125 | 11-01-30 | BB+ | 1,000 | 1,081,620 | |
See notes to financial statements
New York Tax-Free Income Fund
10
F I N A N C I A L S T A T E M E N T S
| Interest | Maturity | Credit | Par value | |||
| State, issuer, description | rate | date | rating (A) | (000) | Value | |
| New York (continued) | ||||||
| New York City Industrial | ||||||
| Development Agency, (continued) | ||||||
| Rev Liberty 7 World Trade Ctr | ||||||
| Ser 2005A (G) | 6.250% | 03-01-15 | BB+ | $1,000 | $1,044,970 | |
| Rev Ref Brooklyn Navy Yard | ||||||
| Cogen Partners | 5.650 | 10-01-28 | BBB– | 1,000 | 968,370 | |
| Rev Spec Airport Facil Airis | ||||||
| JFK I LLC Proj Ser 2001A | 5.500 | 07-01-28 | BBB– | 1,000 | 978,090 | |
| Rev Terminal One Group Assn Proj | 5.500 | 01-01-21 | BBB+ | 1,000 | 1,055,980 | |
| New York City Municipal Water | ||||||
| Finance Auth, | ||||||
| Rev Polytechnic Univ Proj | 5.250 | 11-01-27 | A | 1,000 | 976,830 | |
| Rev Preref Wtr & Swr Sys | ||||||
| Ser 2000B | 6.000 | 06-15-33 | AA+ | 740 | 792,562 | |
| Rev Ref Wtr & Swr Sys | 5.500 | 06-15-33 | AAA | 1,500 | 1,586,835 | |
| Rev Ref Wtr & Swr Sys Cap Apprec | ||||||
| Ser 2001D | Zero | 06-15-20 | AA+ | 2,000 | 1,133,460 | |
| Rev Unref Bal Wtr & Swr Sys | ||||||
| Ser 2000B | 6.000 | 06-15-33 | AA+ | 460 | 489,895 | |
| New York City Transitional | ||||||
| Finance Auth, | ||||||
| Rev Future Tax Sec Ser 2000B | 6.000 | 11-15-29 | AAA | 1,000 | 1,069,290 | |
| Rev Ref Future Tax Sec Ser 2002A | ||||||
| (Zero to 11-1-11 then | ||||||
| 14.000%) (O) | Zero | 11-01-29 | AAA | 1,000 | 847,440 | |
| New York Liberty | ||||||
| Development Corp, | ||||||
| Rev Goldman Sachs Headquarters | 5.250 | 10-01-35 | AA– | 1,000 | 1,043,650 | |
| Rev National Sports Museum Proj | ||||||
| Ser 2006A (G) | 6.125 | 02-15-19 | BB– | 1,000 | 1,012,520 | |
| New York Local Government | ||||||
| Assistance Corp, | ||||||
| Rev Ref Ser 1993C | 5.500 | 04-01-17 | AAA | 1,225 | 1,345,809 | |
| New York State Dormitory Auth, | ||||||
| Rev Cap Apprec FHA Insd Mtg | ||||||
| Ser 2000B (G) | Zero | 08-15-40 | AA | 3,000 | 394,230 | |
| Rev Lease State Univ Dorm Facil | ||||||
| Ser 2000A | 6.000 | 07-01-30 | AA– | 1,000 | 1,072,800 | |
| Rev Miriam Osborn Mem Home | ||||||
| Ser 2000B | 6.875 | 07-01-25 | A | 750 | 815,498 | |
| Rev North Shore L I Jewish Grp | 5.375 | 05-01-23 | Aaa | 1,000 | 1,080,620 | |
| Rev Personal Income Tax Ser 2005F | 5.000 | 03-15-30 | AAA | 1,000 | 1,024,580 | |
| Rev Ref State Univ Edl Facil | ||||||
| Ser 1993A | 5.500 | 05-15-19 | AA– | 2,000 | 2,187,080 | |
| Rev Ref State Univ Edl Facil | ||||||
| Ser 1993A | 5.250 | 05-15-15 | AAA | 1,000 | 1,073,690 | |
| Rev Ref Univ of Rochester Defd | ||||||
| Income Ser 2000A (Zero to 7-1-10 | ||||||
| then 6.050%) (O) | Zero | 07-01-25 | AAA | 1,000 | 906,810 | |
| Rev State Univ Edl Facil | ||||||
| Ser 2000B | 5.375 | 05-15-23 | AA– | 1,000 | 1,054,260 | |
| Rev Unref City Univ 4th Ser 2001A | 5.250 | 07-01-31 | AA– | 130 | 137,658 | |
See notes to financial statements
New York Tax-Free Income Fund
11
F I N A N C I A L S T A T E M E N T S
| Interest | Maturity | Credit | Par value | |||
| State, issuer, description | rate | date | rating (A) | (000) | Value | |
| New York (continued) | ||||||
| New York State Environmental | ||||||
| Facilities Corp, | ||||||
| Rev Ref Poll Control (P) | 8.012% | 06-15-11 | AAA | $500 | $621,980 | |
| Rev Unref Bal Poll Control | ||||||
| Ser 1991E | 6.875 | 06-15-10 | AAA | 20 | 20,161 | |
| New York State Power Auth, | ||||||
| Rev Ref Gen Purpose Ser 1990W | 6.500 | 01-01-08 | AAA | 25 | 25,235 | |
| Oneida County Industrial | ||||||
| Development Agency, | ||||||
| Rev Civic Facilities Hamilton | ||||||
| College Proj Ser 2007A | Zero | 07-01-29 | AAA | 5,330 | 1,697,445 | |
| Onondaga County Industrial | ||||||
| Development Agency, | ||||||
| Rev Sr Air Cargo | 6.125 | 01-01-32 | Baa3 | 1,000 | 1,028,460 | |
| Orange County Industrial | ||||||
| Development Agency, | ||||||
| Rev Civic Facil Arden Hill Care | ||||||
| Ctr Newburgh Ser 2001C (G) | 7.000 | 08-01-31 | BB– | 500 | 520,525 | |
| Port Auth of New York & | ||||||
| New Jersey, | ||||||
| Rev Ref Spec Proj KIAC Partners | ||||||
| Ser 4 (G) | 6.750 | 10-01-19 | BBB– | 1,500 | 1,511,040 | |
| Suffolk County Industrial | ||||||
| Development Agency, | ||||||
| Rev Civic Facil Huntington Hosp | ||||||
| Proj Ser 2002B | 6.000 | 11-01-22 | BBB | 1,000 | 1,029,830 | |
| Triborough Bridge & Tunnel Auth, | ||||||
| Rev Ref Gen Purpose Ser 1992Y | 6.125 | 01-01-21 | AAA | 1,500 | 1,760,745 | |
| TSASC, Inc., | ||||||
| Rev Tobacco Settlement Asset | ||||||
| Backed Bond Ser 1 | 5.500 | 07-15-24 | AAA | 775 | 828,049 | |
| Upper Mohawk Valley Regional | ||||||
| Water Finance Auth, | ||||||
| Rev Wtr Sys Cap Apprec | Zero | 04-01-22 | Aaa | 2,230 | 1,147,224 | |
| Westchester County | ||||||
| Healthcare Corp, | ||||||
| Rev Ref Sr Lien Ser 2000A | 6.000 | 11-01-30 | BBB– | 1,150 | 1,166,065 | |
| Yonkers Industrial | ||||||
| Development Agency, | ||||||
| Rev Cmty Dev Pptys Yonkers Inc | ||||||
| Ser 2001A | 6.625 | 02-01-26 | Baa3 | 1,000 | 1,097,070 | |
| Puerto Rico 9.51% | 5,184,683 | |||||
| Puerto Rico Aqueduct & | ||||||
| Sewer Auth, | ||||||
| Rev Inverse Floater (Gtd) (M) (P) | 7.970 | 07-01-11 | AAA | 2,000 | 2,315,360 | |
| Puerto Rico, Commonwealth of, | ||||||
| Gen Oblig Unltd Ser 975 (P) | 5.750 | 07-01-18 | Aaa | 500 | 553,430 | |
See notes to financial statements
New York Tax-Free Income Fund
12
F I N A N C I A L S T A T E M E N T S
| Interest | Maturity | Credit | Par value | |||
| State, issuer, description | rate | date | rating (A) | (000) | Value | |
| Puerto Rico (continued) | ||||||
| Puerto Rico Public Building Auth, | ||||||
| Rev Govt Facil Ser 1995A (Gtd) | 6.250% | 07-01-12 | AAA | $1,110 | $1,235,719 | |
| Puerto Rico Public Finance Corp, | ||||||
| Rev Preref Commonwealth Approp | ||||||
| Ser 2002E | 5.500 | 08-01-29 | BBB– | 1,005 | 1,080,174 | |
| Virgin Islands 3.87% | $2,106,110 | |||||
| Virgin Islands Public | ||||||
| Finance Auth, | ||||||
| Rev Ref Gross Receipts Tax Ln | ||||||
| Note Ser 1999A | 6.500 | 10-01-24 | BBB+ | 535 | 583,685 | |
| Rev Sub Lien Fund Ln Notes | ||||||
| Ser 1998E (G) | 5.875 | 10-01-18 | BBB– | 1,500 | 1,522,425 | |
| Interest | Par value | |||||
| Issuer, description, maturity date | rate | (000) | Value | |||
| Short-term investments 0.06% | $34,000 | |||||
| (Cost $34,000) | ||||||
| Joint Repurchase Agreement 0.06% | 34,000 | |||||
| Joint Repurchase Agreement transaction with Barclays Plc, | ||||||
| dated 8-31-07 at 5.100% to be repurchased at $34,019 | ||||||
| on 9-4-07, collateralized by $33,884 of U.S. Treasury | ||||||
| Inflation Indexed Note, 2.000%, due 1-15-16 | ||||||
| (valued at $34,680, including interest) | 5.100% | $34 | 34,000 | |||
| Total investments (Cost $51,376,344) 99.09% | $53,987,167 | |||||
| Other assets and liabilities, net 0.91% | $494,117 | |||||
| Total net assets 100.00% | $54,481,284 | |||||
The percentage shown for each investment category is the total value of that category as a percentage of the net assets of the Fund.
(A) Credit ratings are unaudited and are rated by Moody’s Investors Service or Fitch where Standard & Poor’s ratings are not available unless indicated otherwise.
(G) Security rated internally by John Hancock Advisers, LLC. Unaudited.
(M) Inverse floater bond purchased on secondary market.
(O) Cash interest will be paid on this obligation at the stated rate beginning on the stated date.
(P) Variable rate obligation. The coupon rate shown represents the rate at period end.
See notes to financial statements
New York Tax-Free Income Fund
13
F I N A N C I A L S T A T E M E N T S
Financial statements
Statement of assets and liabilities 8-31-07
This Statement of Assets and Liabilities is the Fund’s balance sheet. It shows the value of what the Fund owns, is due and owes. You’ll also find the net asset value and the maximum offering price per share.
| Assets | |
| Investments at value (cost $51,376,344) | $53,987,167 |
| Cash | 23 |
| Receivable for shares sold | 4,866 |
| Interest receivable | 681,388 |
| Other assets | 6,000 |
| Total assets | 54,679,444 |
| Liabilities | |
| Payable for shares repurchased | 99,529 |
| Dividends payable | 6,163 |
| Payable to affiliates | |
| Management fees | 23,231 |
| Distribution and service fees | 2,148 |
| Other | 5,854 |
| Other payables and accrued expenses | 61,235 |
| Total liabilities | 198,160 |
| Net assets | |
| Capital paid-in | 52,476,389 |
| Accumulated net realized loss on investments | (625,000) |
| Net unrealized appreciation of investments | 2,610,823 |
| Accumulated net investment income | 19,072 |
| Net assets | $54,481,284 |
| Net asset value per share | |
| Based on net asset values and shares outstanding — the Fund has an | |
| unlimited number of shares authorized with no par value | |
| Class A ($40,343,915 ÷ 3,354,399 shares) | $12.03 |
| Class B1 ($10,544,334 ÷ 876,715 shares) | $12.03 |
| Class C1 ($3,593,035 ÷ 298,749 shares) | $12.03 |
| Maximum offering price per share | |
| Class A2 ($12.03 ÷ 95.5%) | $12.60 |
1 Redemption price is equal to net asset value less any applicable contingent deferred sales charge.
2 On single retail sales of less than $100,000. On sales of $100,000 or more and on group sales the offering price is reduced.
See notes to financial statements
New York Tax-Free Income Fund
14
F I N A N C I A L S T A T E M E N T S
Statement of operations For the year ended 8-31-07
This Statement of Operations summarizes the Fund’s investment income earned and expenses incurred in operating the Fund. It also shows net gains (losses) for the period stated.
| Investment income | |
| Interest | $3,048,977 |
| Total investment income | 3,048,977 |
| Expenses | |
| Investment management fees (Note 2) | 290,142 |
| Distribution and service fees (Note 2) | 285,381 |
| Transfer agent fees (Note 2) | 40,036 |
| Accounting and legal services fees (Note 2) | 7,045 |
| Compliance fees | 1,495 |
| Custodian fees | 32,396 |
| Professional fees | 24,182 |
| Printing fees | 15,004 |
| Blue sky fees | 5,790 |
| Trustees’ fees | 2,626 |
| Miscellaneous | 7,152 |
| Total expenses | 711,249 |
| Less expense reductions (Note 2) | (593) |
| Net expenses | 710,656 |
| Net investment income | 2,338,321 |
| Realized and unrealized gain (loss) | |
| Net realized gain on investments | 42,349 |
| Change in net unrealized appreciation (depreciation) of investments | (1,759,574) |
| Net realized and unrealized loss | (1,717,225) |
| Increase in net assets from operations | $621,096 |
See notes to financial statements
New York Tax-Free Income Fund
15
F I N A N C I A L S T A T E M E N T S
Statement of changes in net assets
These Statements of Changes in Net Assets show how the value of the Fund’s net assets has changed during the last two periods. The difference reflects earnings less expenses, any investment gains and losses, distributions, if any, paid to shareholders and the net of Fund share transactions.
| Year | Year | |
| ended | ended | |
| 8-31-06 | 8-31-07 | |
| Increase (decrease) in net assets | ||
| From operations | ||
| Net investment income | $2,473,104 | $2,338,321 |
| Net realized gain | 99,789 | 42,349 |
| Change in net unrealized appreciation (depreciation) | (1,231,981) | (1,759,574) |
| Increase in net assets resulting from operations | 1,340,912 | 621,096 |
| Distributions to shareholders | ||
| From net investment income | ||
| Class A | (1,786,319) | (1,773,258) |
| Class B | (541,611) | (424,606) |
| Class C | (137,990) | (132,621) |
| (2,465,920) | (2,330,485) | |
| From Fund share transactions | (4,118,407) | (3,989,619) |
| Total decrease | (5,243,415) | (5,699,008) |
| Net assets | ||
| Beginning of year | 65,423,707 | 60,180,292 |
| End of year1 | $60,180,292 | $54,481,284 |
1 Includes accumulated net investment income of $19,072 and $19,072, respectively.
See notes to financial statements
New York Tax-Free Income Fund
16
F I N A N C I A L S T A T E M E N T S
Financial highlights
The Financial Highlights show how the Fund’s net asset value for a share has changed since the end of the previous period.
| CLASS A SHARES | |||||
| Period ended | 8-31-03 | 8-31-04 | 8-31-05 | 8-31-06 | 8-31-07 |
| Per share operating performance | |||||
| Net asset value, | |||||
| beginning of period | $12.48 | $12.10 | $12.46 | $12.61 | $12.40 |
| Net investment income1 | 0.56 | 0.54 | 0.52 | 0.52 | 0.52 |
| Net realized and unrealized | |||||
| gain (loss) on investments | (0.38) | 0.36 | 0.15 | (0.21) | (0.37) |
| Total from investment operations | 0.18 | 0.90 | 0.67 | 0.31 | 0.15 |
| Less distributions | |||||
| From net investment income | (0.56) | (0.54) | (0.52) | (0.52) | (0.52) |
| Net asset value, end of period | $12.10 | $12.46 | $12.61 | $12.40 | $12.03 |
| Total return2 (%) | 1.433 | 7.543 | 5.50 | 2.543 | 1.183 |
| Ratios and supplemental data | |||||
| Net assets, end of period | |||||
| (in millions) | $46 | $44 | $44 | $43 | $40 |
| Ratio of net expenses to average | |||||
| net assets (%) | 1.00 | 1.01 | 1.06 | 1.03 | 1.03 |
| Ratio of gross expenses to average | |||||
| net assets (%) | 1.024 | 1.024 | 1.06 | 1.034 | 1.034 |
| Ratio of net investment income | |||||
| to average net assets (%) | 4.55 | 4.35 | 4.18 | 4.20 | 4.22 |
| Portfolio turnover (%) | 17 | 43 | 25 | 32 | 17 |
See notes to financial statements
New York Tax-Free Income Fund
17
F I N A N C I A L S T A T E M E N T S
Financial highlights
| CLASS B SHARES | |||||
| Period ended | 8-31-03 | 8-31-04 | 8-31-05 | 8-31-06 | 8-31-07 |
| Per share operating performance | |||||
| Net asset value, | |||||
| beginning of period | $12.48 | $12.10 | $12.46 | $12.61 | $12.40 |
| Net investment income1 | 0.47 | 0.45 | 0.43 | 0.43 | 0.43 |
| Net realized and unrealized | |||||
| gain (loss) on investments | (0.38) | 0.36 | 0.15 | (0.21) | (0.37) |
| Total from investment operations | 0.09 | 0.81 | 0.58 | 0.22 | 0.06 |
| Less distributions | |||||
| From net investment income | (0.47) | (0.45) | (0.43) | (0.43) | (0.43) |
| Net asset value, end of period | $12.10 | $12.46 | $12.61 | $12.40 | $12.03 |
| Total return2 (%) | 0.723 | 6.803 | 4.77 | 1.833 | 0.483 |
| Ratios and supplemental data | |||||
| Net assets, end of period | |||||
| (in millions) | $22 | $20 | $17 | $14 | $11 |
| Ratio of net expenses to average | |||||
| net assets (%) | 1.70 | 1.71 | 1.76 | 1.73 | 1.73 |
| Ratio of gross expenses to average | |||||
| net assets (%) | 1.724 | 1.724 | 1.76 | 1.734 | 1.734 |
| Ratio of net investment income | |||||
| to average net assets (%) | 3.85 | 3.65 | 3.48 | 3.50 | 3.52 |
| Portfolio turnover (%) | 17 | 43 | 25 | 32 | 17 |
See notes to financial statements
New York Tax-Free Income Fund
18
F I N A N C I A L S T A T E M E N T S
Financial highlights
| CLASS C SHARES | |||||
| Period ended | 8-31-03 | 8-31-04 | 8-31-05 | 8-31-06 | 8-31-07 |
| Per share operating performance | |||||
| Net asset value, | |||||
| beginning of period | $12.48 | $12.10 | $12.46 | $12.61 | $12.40 |
| Net investment income1 | 0.47 | 0.45 | 0.43 | 0.43 | 0.43 |
| Net realized and unrealized | |||||
| gain (loss) on investments | (0.38) | 0.36 | 0.15 | (0.21) | (0.37) |
| Total from investment operations | 0.09 | 0.81 | 0.58 | 0.22 | 0.06 |
| Less distributions | |||||
| From net investment income | (0.47) | (0.45) | (0.43) | (0.43) | (0.43) |
| Net asset value, end of period | $12.10 | $12.46 | $12.61 | $12.40 | $12.03 |
| Total return2 (%) | 0.723 | 6.803 | 4.77 | 1.833 | 0.483 |
| Ratios and supplemental data | |||||
| Net assets, end of period | |||||
| (in millions) | $5 | $5 | $5 | $3 | $4 |
| Ratio of net expenses to average | |||||
| net assets (%) | 1.70 | 1.71 | 1.76 | 1.73 | 1.73 |
| Ratio of gross expenses to average | |||||
| net assets (%) | 1.724 | 1.724 | 1.76 | 1.734 | 1.734 |
| Ratio of net investment income | |||||
| to average net assets (%) | 3.81 | 3.65 | 3.48 | 3.50 | 3.51 |
| Portfolio turnover (%) | 17 | 43 | 25 | 32 | 17 |
1 Based on the average of the shares outstanding.
2 Assumes dividend reinvestment and does not reflect the effect of sales charges.
3 Total returns would have been lower had certain expenses not been reduced during the periods shown.
4 Does not take into consideration expense reductions during the periods shown.
See notes to financial statements
New York Tax-Free Income Fund
19
Notes to financial statements
Note 1 Accounting policies
John Hancock New York Tax-Free Income Fund (the Fund) is a non-diversified series of John Hancock Tax-Exempt Series Fund (the Trust), an open-end management investment company registered under the Investment Company Act of 1940, as amended (the 1940 Act). The investment objective of the Fund is to seek a high level of current income, consistent with the preservation of capital, that is exempt from federal, New York State and New York City personal income taxes. Since the Fund invests primarily in New York state issuers, the Fund may be affected by political, economic or regulatory developments in the state of New York.
The Trustees have authorized the issuance of multiple classes of shares of the Fund, designated as Class A, Class B and Class C shares. The shares of each class represent an interest in the same portfolio of investments of the Fund and have equal rights as to voting, redemptions, dividends and liquidation, except that certain expenses, subject to the approval of the Trustees, may be applied differently to each class of shares in accordance with current regulations of the Securities and Exchange Commission (SEC) and the Internal Revenue Service. Shareholders of a class that bears distribution and service expenses under the terms of a distribution plan have exclusive voting rights to that distribution plan. Class B shares will convert to Class A shares eight years after purchase.
Significant accounting policies of the Fund are as follows:
Security valuation
The net asset value of Class A, Class B and Class C shares of the Fund is determined daily as of the close of the New York Stock Exchange (NYSE), normally at 4:00 p.m., Eastern Time. Short-term debt investments that have a remaining maturity of 60 days or less are valued at amortized cost, and thereafter assume a constant amortization to maturity of any discount or premium, which approximates market value. Securities traded only in the over-the-counter market are valued at the last bid price quoted by brokers making markets in the securities at the close of trading. Securities for which there are no such quotations, principally debt securities, are valued based on the valuation provided by an independent pricing service, which utilizes both dealer-supplied and electronic data processing t echniques, which take into account factors such as institutional-size trading in similar groups of securities, yield, quality, coupon rate, maturity, type of issue, trading characteristics and other market data. All other securities held by the Fund are valued at the last sale price or official closing price (closing bid price or last evaluated quote if no sale has occurred) as of the close of business on the principal securities exchange (domestic or foreign) on which they trade or, lacking any sales, at the closing bid price.
Other assets and securities for which no such quotations are readily available are valued at fair value as determined in good faith under consistently applied procedures established by and under the general supervision of the Board of Trustees.
Joint repurchase agreement
Pursuant to an exemptive order issued by the SEC, the Fund, along with other registered investment companies having a management contract with John Hancock Advisers, LLC (the Adviser), a wholly owned subsidiary of John Hancock Financial Services, Inc., a subsidiary of Manulife Financial Corporation (MFC), may participate in a joint repurchase agreement transaction. Aggregate cash balances are invested in one or more large repurchase agreements, whose underlying securities are obligations of the U.S. government and/ or its agencies. The Fund’s custodian bank
New York Tax-Free Income Fund
20
receives delivery of the underlying securities for the joint account on the Fund’s behalf. The Adviser is responsible for ensuring that the agreement is fully collateralized at all times.
Investment transactions
Investment transactions are accounted for on a trade date plus one basis for daily net asset value calculations. However, for financial reporting purposes, investment transactions are reported on trade date. Net realized gains and losses on sales of investments are determined on the identified cost basis.
Class allocations
Income, common expenses and realized and unrealized gains (losses) are determined at the fund level and allocated daily to each class of shares based on the appropriate net asset value of the respective classes. Distribution and service fees, if any, are calculated daily at the class level based on the appropriate net asset value of each class and the specific expense rate(s) applicable to each class.
Expenses
The majority of expenses are directly identifiable to an individual fund. Expenses that are not readily identifiable to a specific fund are allocated in such a manner as deemed equitable, taking into consideration, among other things, the nature and type of expense and the relative size of the funds.
Bank borrowings
The Fund is permitted to have bank borrowings for temporary or emergency purposes, including the meeting of redemption requests that otherwise might require the untimely disposition of securities. The Fund has entered into a line of credit agreement with The Bank of New York Mellon (BNYM), the Swing Line Lender and Administrative Agent. This agreement enables the Fund to participate, with other funds managed by the Adviser, in an unsecured line of credit with BNYM, which permits borrowings of up to $100 million, collectively. Interest is charged to each fund based on its borrowing. In addition, a commitment fee is charged to each fund based on the average daily unused portion of the line of credit, and is allocated among the participating funds. The Fund had no borrowing activity under the line of credit during the year ended August 31, 2007.
Federal income taxes
The Fund qualifies as a “regulated investment company” by complying with the applicable provisions of the Internal Revenue Code and will not be subject to federal income tax on taxable income that is distributed to shareholders. Therefore, no federal income tax provision is required. For federal income tax purposes, the Fund has $592,867 of a capital loss carryforward available, to the extent provided by regulations, to offset future net realized capital gains. To the extent that such carryforward is used by the Fund, no capital gain distributions will be made. The loss carryforward expires as follows: August 31, 2010 — $176,882, August 31, 2011 — $414,533 and August 31, 2012 — $1,452. Capital loss carryforward utilized for the year ended August 31, 2007 amounted to $30,778.
New accounting pronouncements
In July 2006, FASB Interpretation No. 48, Accounting for Uncertainty in Income Taxes, an interpretation of FASB Statement 109 (FIN 48), was issued and is effective for fiscal years beginning after December 15, 2006, and is to be applied to all open tax years as of the effective date. On December 22, 2006, the SEC delayed the implementation of FIN 48 for regulated investment companies for an additional six months. FIN 48 prescribes a minimum threshold for financial statement recognition of the benefit of a tax position taken or expected to be taken in a tax return, and requires certain expanded disclosures. Management has concluded that the adoption of FIN 48 will not result in a material impact on the Fund’s net assets, results of operations and financial statement disclosures.
In September 2006, FASB Standard No. 157, Fair Value Measurements (FAS 157), was issued and is effective for fiscal years beginning after November 15, 2007. FAS 157 defines fair value, establishing a framework for measuring fair value and expands disclosure about fair value measurements. Management is currently evaluating the application of FAS 157 to the Fund and its impact, if any, resulting from
New York Tax-Free Income Fund
21
the adoption of FAS 157 on the Fund’s financial statements.
Interest and distributions
Interest income on investment securities is recorded on the accrual basis. All premiums and discounts are amortized/accreted for financial reporting purposes.
The Fund records distributions to shareholders from net investment income and net realized gains, if any, on the ex-dividend date. The Fund’s net investment income is declared daily as dividends to shareholders of record as of the close of business on the preceding day, and distributed monthly. During the year ended August 31, 2006, the tax character of distributions paid was as follows: ordinary income $3,200 and exempt income $2,462,720. During the year ended August 31, 2007, the tax character of distributions paid was as follows: ordinary income $4,889 and exempt income $2,325,596. Distributions paid by the Fund with respect to each class of shares are calculated in the same manner, at the same time and are in the same amount, except for the effect of expenses that may be applied differently to each class.
As of August 31, 2007, the components of distributable earnings on a tax basis included $29,209 of undistributed exempt income.
Such distributions and distributable earnings, on a tax basis, are determined in conformity with income tax regulations, which may differ from accounting principles generally accepted in the United States of America. Distributions in excess of tax basis earnings and profits, if any, are reported in the Fund’s financial statements as a return of capital.
Use of estimates
The preparation of these financial statements, in accordance with accounting principles generally accepted in the United States of America, incorporates estimates made by management in determining the reported amount of assets, liabilities, revenues and expenses of the Fund. Actual results could differ from these estimates.
Note 2
Management fee and transactions with affiliates and others
The Fund has an investment management contract with the Adviser. Under the investment management contract, the Fund pays a monthly management fee to the Adviser equivalent, on an annual basis, to the sum of: (a) 0.50% of the first $250,000,000 of the Fund’s average daily net asset value, (b) 0.45% of the next $250,000,000, (c) 0.425% of the next $500,000,000, (d) 0.40% of the next $250,000,000 and (e) 0.30% of the Fund’s average daily net asset value in excess of $1,250,000,000.
Effective December 31, 2005, the investment management teams of the Adviser were reorganized into Sovereign Asset Management LLC (Sovereign), a wholly owned indirect subsidiary of John Hancock Life Insurance Company (JHLICO), a subsidiary of MFC. The Adviser remains the principal adviser of the Fund and Sovereign acts as subadviser under the supervision of the Adviser. The restructuring did not have an impact on the Fund, which continues to be managed using the same investment philosophy and process. The Fund is not responsible for payment of the subadvisory fees.
Effective October 1, 2006, Sovereign changed its name to MFC Global Investment Management (U.S.), LLC.
The Fund has an agreement with its custodian bank, under which custody fees are reduced by balance credits applied during the year. Accordingly, the expense reductions related to custody fee offsets amounted to $593.
The Fund has a Distribution Agreement with John Hancock Funds, LLC (JH Funds), a wholly owned subsidiary of the Adviser. The Fund has adopted Distribution Plans with respect to Class A, Class B and Class C, pursuant to Rule 12b-1 under the 1940 Act, to reimburse JH Funds for the services it provides as distributor of shares of the Fund. Accordingly, the Fund makes monthly payments to JH Funds at an annual rate not to exceed 0.30%, 1.00% and 1.00%, of the average daily net asset value of Class A, Class B, and Class C, respectively. A maximum of
New York Tax-Free Income Fund
22
0.25% of such payments may be service fees, as defined by the Conduct Rules of the National Association of Securities Dealers. Under the Conduct Rules, curtailment of a portion of the Fund’s 12b-1 payments could occur under certain circumstances.
Expenses under the agreements described above for the year ended August 31, 2007 were as follows:
| Distribution and | |
| Share class | service fees |
| Class A | $126,387 |
| Class B | 121,148 |
| Class C | 37,846 |
| Total | $285,381 |
Class A shares are assessed up-front sales charges. During the year ended August 31, 2007, JH Funds received net up-front sales charges of $42,385 with regard to sales of Class A shares. Of this amount, $5,434 was retained and used for printing prospectuses, advertising, sales literature and other purposes, $28,572 was paid as sales commissions to unrelated broker-dealers and $8,379 was paid as sales commissions to sales personnel of Signator Investors, Inc. (Signator Investors), a related broker-dealer. The Adviser’s indirect parent, JHLICO, is the indirect sole shareholder of Signator Investors.
Class B shares that are redeemed within six years of purchase are subject to a contingent deferred sales charge (CDSC) at declining rates, beginning at 5.00% of the lesser of the current market value at the time of redemption or the original purchase cost of the shares being redeemed. Class C shares that are redeemed within one year of purchase are subject to a CDSC at a rate of 1.00% of the lesser of the current market value at the time of redemption or the original purchase cost of the shares being redeemed. Proceeds from the CDSCs are paid to JH Funds and are used, in whole or in part, to defray its expenses for providing distribution-related services to the Fund in connection with the sale of Class B and Class C shares. During the year ended August 31, 2007, CDSCs received by JH Funds amounted to $23,926 for Class B shares and $1 for Class C shares.
The Fund has a transfer agent agreement with John Hancock Signature Services, Inc. (Signature Services), an indirect subsidiary of JHLICO. The Fund pays a monthly fee which is based on an annual rate of $16 for each Class A shareholder account, $18.50 for each Class B shareholder account and $17.50 for each Class C shareholder account. The Fund also pays a monthly transfer agent fee at an annual rate of 0.01% of each class’s average daily net asset value, plus a fee based on the number of shareholder accounts and reimbursement for certain out-of-pocket expenses, aggregated and allocated to each class on the basis of its relative net asset value.
The Fund has an agreement with the Adviser and affiliates to perform necessary tax, accounting and legal services for the Fund. The compensation for the year amounted to $7,045 with an effective rate of 0.01% of the Fund’s average daily net asset value. The Fund also reimbursed JHLICO for certain compliance costs, included in the Fund’s Statement of Operations.
Mr. James R. Boyle is Chairman of the Adviser, as well as affiliated Trustee of the Fund, and is compensated by the Adviser and/or its affiliates. The compensation of unaffiliated Trustees is borne by the Fund. The unaffiliated Trustees may elect to defer, for tax purposes, their receipt of this compensation under the John Hancock Group of Funds Deferred Compensation Plan. The Fund makes investments into other John Hancock funds, as applicable, to cover its liability for the deferred compensation. Investments to cover the Fund’s deferred compensation liability are recorded on the Fund’s books as an other asset. The deferred compensation liability and the related other asset are always equal and are marked to market on a periodic basis to reflect any income earned by the investments, as well as any unrealized gains or losses. The Deferred Compensation Plan investments had no impact on the operations of the Fund.
New York Tax-Free Income Fund
23
Note 3
Guarantees and indemnifications
Under the Fund’s organizational documents, its Officers and Trustees are indemnified against certain liability arising out of the performance of their duties to the Fund. Additionally, in the normal course of business, the Fund enters into contracts with service providers that contain general indemnification clauses. The Fund’s maximum exposure under these arrangements is unknown, as this would involve future claims that may be made against the Fund that have not yet occurred. However, based on experience, the Fund believes the risk of loss to be remote.
Note 4
Fund share transactions
This listing illustrates the number of Fund shares sold, reinvested and repurchased during the years ended August 31, 2006 and August 31, 2007, along with the corresponding dollar value.
| Year ended 8-31-06 | Year ended 8-31-07 | |||
| Shares | Amount | Shares | Amount | |
| Class A shares | ||||
| Sold | 313,148 | $3,860,804 | 239,433 | $2,958,232 |
| Distributions reinvested | 99,641 | 1,227,725 | 101,055 | 1,245,290 |
| Repurchased | (394,010) | (4,851,704) | (468,444) | (5,782,516) |
| Net increase (decrease) | 18,779 | $236,825 | (127,956) | ($1,578,994) |
| Class B shares | ||||
| Sold | 33,049 | $409,088 | 25,927 | $320,277 |
| Distributions reinvested | 27,838 | 343,042 | 23,459 | 289,183 |
| Repurchased | (334,834) | (4,123,694) | (265,314) | (3,276,108) |
| Net decrease | (273,947) | ($3,371,564) | (215,928) | ($2,666,648) |
| Class C shares | ||||
| Sold | 11,285 | $137,862 | 68,588 | $852,442 |
| Distributions reinvested | 7,691 | 94,775 | 3,797 | 46,817 |
| Repurchased | (98,780) | (1,216,305) | (51,988) | (643,236) |
| Net increase (decrease) | (79,804) | ($983,668) | 20,397 | $256,023 |
| Net decrease | (334,972) | ($4,118,407) | (323,487) | ($3,989,619) |
Note 5
Investment transactions
Purchases and proceeds from sales or maturities of securities, other than short-term securities and obligations of the U.S. government, during the year ended August 31, 2007, aggregated $9,784,937 and $13,887,428, respectively.
The cost of investments owned on August 31, 2007, including short-term investments, for federal income tax purposes, was $51,333,476. Gross unrealized appreciation and depreciation of investments aggregated $3,092,258 and $438,567, respectively, resulting in net unrealized appreciation of $2,653,691. The difference between book basis and tax basis net unrealized appreciation of investments is attributable primarily to amortization of premiums and accretion of discounts on debt securities.
Note 6
Reclassification of accounts
Capital accounts within the financial statements are adjusted for permanent book tax differences. These adjustments have no impact on net assets or the results of operations. Temporary book tax differences will reverse in a subsequent period. During the year ended August 31, 2007, the Fund reclassified amounts to reflect a decrease in accumulated net investment income of $7,836 and an
New York Tax-Free Income Fund
24
increase in capital paid-in of $7,836. These reclassifications are primarily attributable to certain differences in the computation of distributable income and capital gains under federal tax rules versus accounting principles generally accepted in the United States of America, for amortization of premiums on debt securities. The calculation of net investment income per share in the Fund’s Financial Highlights excludes these adjustments.
New York Tax-Free Income Fund
25
Auditors’ report
Report of Independent Registered Public Accounting Firm
To the Board of Trustees of John Hancock Tax-Exempt Series Fund and Shareholders of John Hancock New York Tax-Free Income Fund,
In our opinion, the accompanying statement of assets and liabilities, including the schedule of investments, and the related statements of operations and of changes in net assets and the financial highlights present fairly, in all material respects, the financial position of John Hancock New York Tax-Free Income Fund (the Fund) at August 31, 2007, and the results of its operations, the changes in its net assets and the financial highlights for the periods indicated, in conformity with accounting principles generally accepted in the United States of America. These financial statements and financial highlights (hereafter referred to as “financial statements”) are the responsibility of the Fund’s management; our responsibility is to express an opinion on these financial statements based on our audits. We conducted our audits of these financial statements in accordance with the standards of the Public Company Accounting Oversight Board (United States). Those standards require that we plan and perform the audits to obtain reasonable assurance about whether the financial statements are free of material misstatement. An audit includes examining, on a test basis, evidence supporting the amounts and disclosures in the financial statements, assessing the accounting principles used and significant estimates made by management, and evaluating the overall financial statement presentation. We believe that our audits, which included confirmation of securities at August 31, 2007 by correspondence with the custodian and brokers, provide a reasonable basis for our opinion.
PricewaterhouseCoopers LLP
Boston, Massachusetts
October 19, 2007
26
Tax information
Unaudited
For federal income tax purposes, the following information is furnished with respect to the distributions of the Fund, if any, paid during its taxable year ended August 31, 2007.
None of the 2007 income dividends qualify for the corporate dividends-received deduction. Shareholders who are not subject to the alternative minimum tax, received income dividends that are 99.80% tax-exempt. The percentage of income dividends from the Fund subject to the alternative minimum tax is 9.58% . None of the income dividends were derived from U.S. Treasury Bills.
For specific information on exception provisions in your state, consult your local state tax officer or your tax adviser. Shareholders will be mailed a 2007 U.S. Treasury Department Form 1099-DIV in January 2008. This will reflect the total of all distributions that are taxable for calendar year 2007.
27
Board Consideration of and Continuation of Investment Advisory Agreement and Subadvisory Agreement: John Hancock New York Tax-Free Income Fund
The Investment Company Act of 1940 (the 1940 Act) requires the Board of Trustees (the Board) of John Hancock Tax-Exempt Series Fund (the Trust), including a majority of the Trustees who have no direct or indirect interest in the investment advisory agreement and are not “interested persons” of the Trust, as defined in the 1940 Act (the Independent Trustees), annually to meet in person to review and consider the continuation of: (i) the investment advisory agreement (the Advisory Agreement) with John Hancock Advisers, LLC (the Adviser) and (ii) the investment subadvisory agreement (the Subadvisory Agreement) with MFC Global Investment Management (U.S.), LLC (the Subadviser) for the John Hancock New York Tax-Free Income Fund (the Fund). The Advisory Agreement and the Subadvisory Agreement are collectively referred to as the Advisory Agreements.
At meetings held on May 7 and June 4–5, 2007, the Board considered the factors and reached the conclusions described below relating to the selection of the Adviser and Subadviser and the continuation of the Advisory Agreements. During such meetings, the Board’s Contracts/Operations Committee and the Independent Trustees also met in executive sessions with their independent legal counsel.
In evaluating the Advisory Agreements, the Board, including the Contracts/Operations Committee and the Independent Trustees, reviewed a broad range of information requested for this purpose by the Independent Trustees, including: (i) the investment performance of the Fund relative to a category of relevant funds (the Category) and a peer group of comparable funds (the Peer Group) each selected by Morningstar, Inc. (Morningstar), an independent provider of investment company data, for a range of periods ended December 31, 2006, (ii) advisory and other fees incurred by, and the expense ratios of, the Fund relative to a Category and a Peer Group, (iii) the advisory fees of comparable portfolios of other clients of the Adviser and the Subadviser, (iv) the Adviser’s financial results and condition, including its and certain of its affiliates’ profitability from services performed for the Fund, (v) breakpoints in the Fund’s and the Peer Group’s fees, and information about economies of scale, (vi) the Adviser’s and Subadviser’s record of compliance with applicable laws and regulations, with the Fund’s investment policies and restrictions, and with the applicable Code of Ethics, and the structure and responsibilities of the Adviser’s and Subadviser’s compliance department, (vii) the background and experience of senior management and investment professionals, and (viii) the nature, cost and character of advisory and non-investment management services provided by the Adviser and its affiliates and by the Subadviser.
The Independent Trustees considered the legal advice of independent legal counsel and relied on their own business judgment in determining the factors to be considered in evaluating the materials that were presented to them and the weight to be given to each such factor. The Board’s review and conclusions were based on a comprehensive consideration of all information presented to the Board and not the result of any single controlling factor. They principally considered performance and other information from Morningstar as of December 31, 2006. The Board also considered updated performance information provided to it by the Adviser or Subadviser at the May and June 2007 meetings. Performance and other information may be quite different as of the date of this shareholders report. The key factors considered by the Board and the conclusions reached are described below.
Nature, extent and quality of services
The Board considered the ability of the Adviser and the Subadviser, based on their resources, reputation and other attributes, to attract and retain qualified investment professionals, including research, advisory and supervisory personnel. The Board considered the investment philosophy, research and investment decision-making processes of the Adviser and Subadviser. The Board further considered the culture of compliance, resources dedicated to compliance, compliance programs and compliance records of the Adviser and Subadviser. In addition, the Board took into account the administrative and other non-advisory services provided to the Fund by the Adviser and its affiliates.
28
Based on the above factors, together with those referenced below, the Board concluded that, within the context of its full deliberations, the nature, extent and quality of the investment advisory services provided to the Fund by the Adviser and Subadviser supported renewal of the Advisory Agreements.
Fund performance
The Board considered the performance results for the Fund over various time periods ended December 31, 2006. The Board also considered these results in comparison to the performance of the Category, as well as the Fund’s benchmark index. Morningstar determined the Category and Peer Group for the Fund. The Board reviewed with a representative of Morningstar the methodology used by Morningstar to select the funds in the Category and the Peer Group.
The Board noted that the Fund’s performance during the periods under review was generally competitive with the performance of the Peer Group and Category medians and its benchmark index, the Lehman Brothers Municipal Bond Index. The Board noted that, for the 10-year period under review, the Fund’s performance was lower than the performance of the Category median and benchmark index, but was higher than the performance of the Peer Group median. The Board also noted that, for the 5-year period under review, the Fund’s performance was lower than the performance of the Peer Group and Category medians and its benchmark index. The Board viewed favorably that the Fund’s performance for the 1- and 3-year periods under review was higher than the Peer Group and Category medians. The Board noted that the Fund’s performance during the 1- and 3-year periods was lower than the benchmark index, as was the performance of the Peer Group and Category medians.
Investment advisory fee and subadvisory fee rates and expenses
The Board reviewed and considered the contractual investment advisory fee rate payable by the Fund to the Adviser for investment advisory services (the Advisory Agreement Rate). The Board received and considered information comparing the Advisory Agreement Rate with the advisory fees for the Peer Group. The Board noted that the Advisory Agreement Rate was equal to the median rate of the Peer Group and Category.
The Board received and considered expense information regarding the Fund’s various components, including advisory fees, distribution and fees other than advisory and distribution fees, including transfer agent fees, custodian fees and other miscellaneous fees (e.g., fees for accounting and legal services). The Board considered comparisons of these expenses to the Peer Group median. The Board also received and considered expense information regarding the Fund’s total operating expense ratio (Expense Ratio). The Board noted that, unlike the Fund, several funds in the Peer Group employed fee waivers or reimbursements. The Board received and considered information comparing the Expense Ratio of the Fund to that of the Peer Group and Category medians before the application of fee waivers and reimbursements (Gross Expense Ratio) and after the application of such waivers and reimbursement (Net Expense Ratio). The Board noted that the Fund’s Gross and Net Expense Ratios were higher than the Peer Group and Category medians. The Board also noted the differences in the funds included in the Peer Group and Category, including differences in the employment of fee waivers.
The Adviser also discussed the Morningstar data and rankings, and other relevant information, for the Fund. Based on the above-referenced considerations and other factors, the Board concluded that the Fund’s overall performance and expenses supported the re-approval of the Advisory Agreements.
The Board also received information about the investment subadvisory fee rate (the Subadvisory Agreement Rate) payable by the Adviser to the Subadviser for investment subadvisory services. The Board concluded that the Subadvisory Agreement Rate was fair and equitable, based on its consideration of the factors described here.
Profitability
The Board received and considered a detailed profitability analysis of the Adviser based on the Advisory Agreements, as well as on other relationships between the Fund and the Adviser and its affiliates, including the Subadviser. The Board also considered a comparison of the Adviser’s profitability to that of other similar investment advisers whose profitability information is publicly available. The Board concluded that, in light of the costs of providing investment management and
29
other services to the Fund, the profits and other ancillary benefits reported by the Adviser were not unreasonable.
Economies of scale
The Board received and considered general information regarding economies of scale with respect to the management of the Fund, including the Fund’s ability to appropriately benefit from economies of scale under the Fund’s fee structure. The Board recognized the inherent limitations of any analysis of economies of scale, stemming largely from the Board’s understanding that most of the Adviser’s costs are not specific to individual Funds, but rather are incurred across a variety of products and services.
To the extent the Board and the Adviser were able to identify actual or potential economies of scale from Fund-specific or allocated expenses, in order to ensure that any such economies continue to be reasonably shared with the Fund as its assets increase, the Adviser and the Board agreed to continue the existing breakpoints to the Advisory Agreement Rate.
Information about services to other clients
The Board also received information about the nature, extent and quality of services and fee rates offered by the Adviser and Subadviser to their other clients, including other registered investment companies, institutional investors and separate accounts. The Board concluded that the Advisory Agreement Rate and the Subadvisory Agreement Rate were not unreasonable, taking into account fee rates offered to others by the Adviser and Subadviser, respectively, after giving effect to differences in services.
Other benefits to the Adviser
The Board received information regarding potential “fall-out” or ancillary benefits received by the Adviser and its affiliates as a result of the Adviser’s relationship with the Fund. Such benefits could include, among others, benefits directly attributable to the relationship of the Adviser with the Fund and benefits potentially derived from an increase in the business of the Adviser as a result of its relationship with the Fund (such as the ability to market to shareholders other financial products offered by the Adviser and its affiliates).
The Board also considered the effectiveness of the Adviser’s, Subadviser’s and Fund’s policies and procedures for complying with the requirements of the federal securities laws, including those relating to best execution of portfolio transactions and brokerage allocation.
Other factors and broader review
As discussed above, the Board reviewed detailed materials received from the Adviser and Subadviser as part of the annual re-approval process. The Board also regularly reviews and assesses the quality of the services that the Fund receives throughout the year. In this regard, the Board reviews reports of the Adviser at least quarterly, which include, among other things, a detailed portfolio review, detailed fund performance reports and compliance reports. In addition, the Board meets with portfolio managers and senior investment officers at various times throughout the year.
After considering the above-described factors and based on its deliberations and its evaluation of the information described above, the Board concluded that approval of the continuation of the Advisory Agreements for the Fund was in the best interest of the Fund and its shareholders. Accordingly, the Board unanimously approved the continuation of the Advisory Agreements.
30
Trustees and Officers
This chart provides information about the Trustees and Officers who oversee your John Hancock fund. Officers elected by the Trustees manage the day-to-day operations of the Fund and execute policies formulated by the Trustees.
| Independent Trustees | ||
| Name, Year of Birth | Number of | |
| Position(s) held with Fund | Trustee | John Hancock |
| Principal occupation(s) and other | of Fund | funds overseen |
| directorships during past 5 years | since1 | by Trustee |
| Ronald R. Dion, Born: 1946 | 1998 | 58 |
| Independent Chairman (since 2005); | ||
| Chairman and Chief Executive Officer, R.M. Bradley & Co., Inc.; Director, The New England Council and | ||
| Massachusetts Roundtable; Trustee, North Shore Medical Center; Director, Boston Stock Exchange; | ||
| Director, BJ’s Wholesale Club, Inc. and a corporator of the Eastern Bank; Trustee, Emmanuel College; | ||
| Director, Boston Municipal Research Bureau; Member of the Advisory Board, Carroll Graduate School | ||
| of Management at Boston College. | ||
| James F. Carlin, Born: 1940 | 2005 | 58 |
| Director and Treasurer, Alpha Analytical Laboratories, Inc. (chemical analysis) (since 1985); Part Owner | ||
| and Treasurer, Lawrence Carlin Insurance Agency, Inc. (since 1995); Part Owner and Vice President, | ||
| Mone Lawrence Carlin Insurance Agency, Inc. (until 2005); Chairman and Chief Executive Officer, | ||
| Carlin Consolidated, Inc. (management/investments) (since 1987); Trustee, Massachusetts Health and | ||
| Education Tax Exempt Trust (1993–2003). | ||
| William H. Cunningham, Born: 1944 | 2005 | 58 |
| Former Chancellor, University of Texas System, and former President, University of Texas at Austin; | ||
| Chairman and Chief Executive Officer, IBT Technologies (until 2001); Director of the following: Hire. | ||
| com (until 2004), STC Broadcasting, Inc. and Sunrise Television Corp. (until 2001), Symtx, Inc. (elec- | ||
| tronic manufacturing) (since 2001), Adorno/Rogers Technology, Inc. (until 2004), Pinnacle Foods | ||
| Corporation (until 2003), rateGenius (until 2003), Lincoln National Corporation (insurance) (since 2006), | ||
| Jefferson-Pilot Corporation (diversified life insurance company) (until 2006), New Century Equity | ||
| Holdings (formerly Billing Concepts) (until 2001), eCertain (until 2001), ClassMap.com (until 2001), Agile | ||
| Ventures (until 2001), AskRed.com (until 2001), Southwest Airlines (since 2000), Introgen (since 2000) | ||
| and Viasystems Group, Inc. (electronic manufacturer) (until 2003); Advisory Director, Interactive Bridge, | ||
| Inc. (college fundraising) (until 2001); Advisory Director, Q Investments (until 2003); Advisory Director, | ||
| JPMorgan Chase Bank (formerly Texas Commerce Bank–Austin), LIN Television (since 2002), WilTel | ||
| Communications (until 2003) and Hayes Lemmerz International, Inc. (diversified automotive parts supply | ||
| company) (since 2003). | ||
| Charles L. Ladner, 2 Born: 1938 | 2004 | 58 |
| Chairman and Trustee, Dunwoody Village, Inc. (retirement services) (until 2003); Senior Vice President | ||
| and Chief Financial Officer, UGI Corporation (public utility holding company) (retired 1998); Vice | ||
| President and Director, AmeriGas, Inc. (retired 1998); Director, AmeriGas Partners, L.P. (gas distribution) | ||
| (until 1997); Director, EnergyNorth, Inc. (until 1995); Director, Parks and History Association (until 2007). | ||
31
| Independent Trustees (continued) | ||
| Name, Year of Birth | Number of | |
| Position(s) held with Fund | Trustee | John Hancock |
| Principal occupation(s) and other | of Fund | funds overseen |
| directorships during past 5 years | since1 | by Trustee |
| John A. Moore,2 Born: 1939 | 1996 | 58 |
| President and Chief Executive Officer, Institute for Evaluating Health Risks (nonprofit institution) | ||
| (until 2001); Senior Scientist, Sciences International (health research) (until 2003); Former Assistant | ||
| Administrator and Deputy Administrator, Environmental Protection Agency; Principal, Hollyhouse (con- | ||
| sulting) (since 2000); Director, CIIT Center for Health Science Research (nonprofit research) (since 2002). | ||
| Patti McGill Peterson,2 Born: 1943 | 1996 | 58 |
| Executive Director, Council for International Exchange of Scholars and Vice President, Institute of In- | ||
| ternational Education (since 1998); Senior Fellow, Cornell Institute of Public Affairs, Cornell University | ||
| (until 1998); Former President, Wells College and St. Lawrence University; Director, Niagara Mohawk | ||
| Power Corporation (until 2003); Director, Ford Foundation, International Fellowships Program | ||
| (since 2002); Director, Lois Roth Endowment (since 2002); Director, Council for International Educational | ||
| Exchange (since 2003). | ||
| Steven R. Pruchansky, Born: 1944 | 2005 | 58 |
| Chairman and Chief Executive Officer, Greenscapes of Southwest Florida, Inc. (since 2000); Director and | ||
| President, Greenscapes of Southwest Florida, Inc. (until 2000); Managing Director, JonJames, LLC (real | ||
| estate) (since 2001); Director, First Signature Bank & Trust Company (until 1991); Director, Mast Realty | ||
| Trust (until 1994); President, Maxwell Building Corp. (until 1991). | ||
| Non-Independent Trustees3 | ||
| Name, Year of Birth | Number of | |
| Position(s) held with Fund | Trustee | John Hancock |
| Principal occupation(s) and other | of Fund | funds overseen |
| directorships during past 5 years | since1 | by Trustee |
| James R. Boyle, Born: 1959 | 2005 | 263 |
| President, John Hancock Insurance Group; Executive Vice President, John Hancock Life Insurance | ||
| Company (since June 2004); Chairman and Director, John Hancock Advisers, LLC (the Adviser), John | ||
| Hancock Funds, LLC and The Berkeley Financial Group, LLC (The Berkeley Group) (holding company) | ||
| (since 2005); Senior Vice President, The Manufacturers Life Insurance Company (U.S.A.) (until 2004). | ||
32
| Principal officers who are not Trustees | |
| Name, Year of Birth | |
| Position(s) held with Fund | Officer |
| Principal occupation(s) and other | of fund |
| directorships during past 5 years | since |
| Keith F. Hartstein, Born: 1956 | 2005 |
| President and Chief Executive Officer | |
| Senior Vice President, Manulife Financial Corporation (since 2004); Director, President and Chief | |
| Executive Officer, the Adviser, The Berkeley Group and John Hancock Funds, LLC (since 2005); Director, | |
| MFC Global Investment Management (U.S.), LLC (MFC Global (U.S.)) (since 2005); Director, John | |
| Hancock Signature Services, Inc. (since 2005); President and Chief Executive Officer, John Hancock | |
| Investment Management Services, LLC (since 2006); President and Chief Executive Officer, John Hancock | |
| Funds, John Hancock Funds II, John Hancock Funds III and John Hancock Trust (since 2005); Director, | |
| Chairman and President, NM Capital Management, Inc. (since 2005); Chairman, Investment Company | |
| Institute Sales Force Marketing Committee (since 2003); Director, President and Chief Executive Officer, | |
| MFC Global (U.S.) (2005–2006); Executive Vice President, John Hancock Funds, LLC (until 2005). | |
| Thomas M. Kinzler, Born: 1955 | 2006 |
| Secretary and Chief Legal Officer | |
| Vice President and Counsel, John Hancock Life Insurance Company (U.S.A.) (since 2006); Secretary | |
| and Chief Legal Officer, John Hancock Funds and John Hancock Funds III (since 2006); Secretary, John | |
| Hancock Funds II and Assistant Secretary, John Hancock Trust (since June 2007); Vice President and | |
| Associate General Counsel, Massachusetts Mutual Life Insurance Company (1999–2006); Secretary and | |
| Chief Legal Counsel, MML Series Investment Fund (2000–2006); Secretary and Chief Legal Counsel, | |
| MassMutual Institutional Funds (2000–2004); Secretary and Chief Legal Counsel, MassMutual Select | |
| Funds and MassMutual Premier Funds (2004–2006). | |
| Francis V. Knox, Jr., Born: 1947 | 2005 |
| Chief Compliance Officer | |
| Vice President and Chief Compliance Officer, John Hancock Investment Management Services, LLC, | |
| the Adviser and MFC Global (U.S.) (since 2005); Vice President and Chief Compliance Officer, John | |
| Hancock Funds, John Hancock Funds II, John Hancock Funds III and John Hancock Trust (since 2005); | |
| Vice President and Assistant Treasurer, Fidelity Group of Funds (until 2004); Vice President and Ethics & | |
| Compliance Officer, Fidelity Investments (until 2001). | |
| Charles A. Rizzo, Born: 1957 | 2007 |
| Chief Financial Officer | |
| Chief Financial Officer, John Hancock Funds, John Hancock Funds II, John Hancock Funds III and John | |
| Hancock Trust (June 2007–Present); Assistant Treasurer, Goldman Sachs Mutual Fund Complex (reg- | |
| istered investment companies) (2005–June 2007); Vice President, Goldman Sachs (2005–June 2007); | |
| Managing Director and Treasurer of Scudder Funds, Deutsche Asset Management (2003–2005); | |
| Director, Tax and Financial Reporting, Deutsche Asset Management (2002–2003); Vice President and | |
| Treasurer, Deutsche Global Fund Services (1999–2002). | |
| Gordon M. Shone, Born: 1956 | 2006 |
| Treasurer | |
| Treasurer, John Hancock Funds (since 2006), John Hancock Funds II, John Hancock Funds III and John | |
| Hancock Trust (since 2005); Vice President and Chief Financial Officer, John Hancock Trust (2003–2005); | |
| Senior Vice President, John Hancock Life Insurance Company (U.S.A.) (since 2001); Vice President, John | |
| Hancock Investment Management Services, Inc., John Hancock Advisers, LLC (since 2006) and The | |
| Manufacturers Life Insurance Company (U.S.A.) (1998–2000). | |
33
| Principal officers who are not Trustees (continued) | |
| Name, Year of Birth | |
| Position(s) held with Fund | Officer |
| Principal occupation(s) and other | of fund |
| directorships during past 5 years | since |
| John G. Vrysen, Born: 1955 | 2005 |
| Chief Operating Officer | |
| Senior Vice President, Manulife Financial Corporation (since 2006); Director, Executive Vice President | |
| and Chief Operating Officer, the Adviser, The Berkeley Group and John Hancock Funds, LLC (June 2007– | |
| Present); Chief Operating Officer, John Hancock Funds, John Hancock Funds II, John Hancock Funds III | |
| and John Hancock Trust (June 2007–Present); Director, Executive Vice President and Chief Financial | |
| Officer, the Adviser, The Berkeley Group and John Hancock Funds, LLC (until June 2007); Executive Vice | |
| President and Chief Financial Officer, John Hancock Investment Management Services, LLC (since 2005); | |
| Vice President and Chief Financial Officer, MFC Global (U.S.) (since 2005); Director, John Hancock | |
| Signature Services, Inc. (since 2005); Chief Financial Officer, John Hancock Funds, John Hancock Funds II, | |
| John Hancock Funds III and John Hancock Trust (2005–June 2007); Vice President and General Manager, | |
| Fixed Annuities, U.S. Wealth Management (until 2005); Vice President, Operations, Manulife Wood | |
| Logan (2000–2004). | |
The business address for all Trustees and Officers is 601 Congress Street, Boston, Massachusetts 02210-2805.
The Statement of Additional Information of the Fund includes additional information about members of the Board of Trustees of the Fund and is available without charge, upon request, by calling 1-800-225-5291.
1 Each Trustee serves until resignation, retirement age or until his or her successor is elected.
2 Member of Audit and Compliance Committee.
3 Non-Independent Trustee holds positions with the Fund’s investment adviser, underwriter and certain other affiliates.
34
Why John Hancock Funds?
For more than three decades, John Hancock Funds has been helping individual, corporate and institutional clients reach their most important financial goals. With so many fund companies to choose from, why should you invest with us?
► A name you know and trust
When you invest with John Hancock Funds, you are investing with one of the most recognized and respected names in the financial services industry. Our parent company has been helping individuals and institutions increase and protect wealth since 1862.
► Solutions across the investing spectrum
We offer equity, income, international, sector and asset allocation investment solutions managed by leading institutional money managers. Each of our funds utilizes a disciplined, team approach to portfolio management and research, leveraging the expertise of seasoned investment professionals.
► Committed to you
Our shareholders come first. We work hard to provide you with the products you need to build a solid financial foundation. We’re proud to offer you award-winning services and tools, like the www.jhfunds.com Web site, to help you every step of the way.
For more information
The Fund’s proxy voting policies, procedures and records are available without charge, upon request:
| By phone | On the Fund’s Web site | On the SEC’s Web site |
| 1-800-225-5291 | www.jhfunds.com/proxy | www.sec.gov |
| Investment adviser | Custodian | Legal counsel |
| John Hancock Advisers, LLC | The Bank of New York | Kirkpatrick & Lockhart |
| 601 Congress Street | One Wall Street | Preston Gates Ellis LLP |
| Boston, MA 02210-2805 | New York, NY 10286 | One Lincoln Street |
| Boston, MA 02111-2950 | ||
| Subadviser | Transfer agent | |
| MFC Global Investment | John Hancock Signature | Independent registered |
| Management (U.S.), LLC | Services, Inc. | public accounting firm |
| 101 Huntington Avenue | One John Hancock Way, | PricewaterhouseCoopers LLP |
| Boston, MA 02199 | Suite 1000 | 125 High Street |
| Boston, MA 02217-1000 | Boston, MA 02110 | |
| Principal distributor | ||
| John Hancock Funds, LLC | ||
| 601 Congress Street | ||
| Boston, MA 02210-2805 | ||
| How to contact us | ||
| Internet | www.jhfunds.com | |
| Regular mail: | Express mail: | |
| John Hancock | John Hancock | |
| Signature Services, Inc. | Signature Services, Inc. | |
| One John Hancock Way, Suite 1000 | Mutual Fund Image Operations | |
| Boston, MA 02217-1000 | 380 Stuart Street | |
| Boston, MA 02116 | ||
| Phone | Customer service representatives | 1-800-225-5291 |
| EASI-Line | 1-800-338-8080 | |
| TDD line | 1-800-554-6713 | |
A listing of month-end portfolio holdings is available on our Web site, www.jhfunds.com. A more detailed portfolio holdings summary is available on a quarterly basis 60 days after the fiscal quarter on our Web site or upon request by calling 1-800-225-5291, or on the SEC’s Web site, www.sec.gov.
36
J O H N H A N C O C K F A M I L Y O F F U N D S
| EQUITY | INTERNATIONAL/GLOBAL |
| Balanced Fund | Global Opportunities Fund |
| Classic Value Fund | Global Shareholder Yield Fund |
| Classic Value Fund II | Greater China Opportunities Fund |
| Classic Value Mega Cap Fund | International Allocation Portfolio |
| Core Equity Fund | International Classic Value Fund |
| Growth Fund | International Core Fund |
| Growth Opportunities Fund | International Growth Fund |
| Growth Trends Fund | |
| Intrinsic Value Fund | INCOME |
| Large Cap Equity Fund | Bond Fund |
| Large Cap Select Fund | Government Income Fund |
| Mid Cap Equity Fund | High Yield Fund |
| Multi Cap Growth Fund | Investment Grade Bond Fund |
| Small Cap Equity Fund | Strategic Income Fund |
| Small Cap Fund | |
| Small Cap Intrinsic Value Fund | TAX-FREE INCOME |
| Sovereign Investors Fund | California Tax-Free Income Fund |
| U.S. Core Fund | High Yield Municipal Bond Fund |
| U.S. Global Leaders Growth Fund | Massachusetts Tax-Free Income Fund |
| Value Opportunities Fund | New York Tax-Free Income Fund |
| Tax-Free Bond Fund | |
| ASSET ALLOCATION | |
| Lifecycle 2010 Portfolio | MONEY MARKET |
| Lifecycle 2015 Portfolio | Money Market Fund |
| Lifecycle 2020 Portfolio | |
| Lifecycle 2025 Portfolio | CLOSED-END |
| Lifecycle 2030 Portfolio | Bank and Thrift Opportunity Fund |
| Lifecycle 2035 Portfolio | Financial Trends Fund, Inc. |
| Lifecycle 2040 Portfolio | Income Securities Trust |
| Lifecycle 2045 Portfolio | Investors Trust |
| Lifecycle Retirement Portfolio | Patriot Premium Dividend Fund II |
| Lifestyle Aggressive Portfolio | Preferred Income Fund |
| Lifestyle Balanced Portfolio | Preferred Income II Fund |
| Lifestyle Conservative Portfolio | Preferred Income III Fund |
| Lifestyle Growth Portfolio | Tax-Advantaged Dividend Income Fund |
| Lifestyle Moderate Portfolio | Tax-Advantaged Global Shareholder Yield Fund |
| SECTOR | |
| Financial Industries Fund | |
| Health Sciences Fund | |
| Real Estate Fund | |
| Regional Bank Fund | |
| Technology Fund | |
| Technology Leaders Fund | |
The Fund’s investment objectives, risks, charges and expenses are included in the prospectus and should be considered carefully before investing. For a prospectus, contact your financial professional, call John Hancock Funds at 1-800-225-5291 or visit the Fund’s Web site at www.jhfunds.com. Please read the prospectus carefully before investing or sending money.

1-800-225-5291
1-800-554-6713 TDD
1-800-338-8080 EASI-Line
www.jhfunds.com
Now available: electronic delivery
www.jhfunds.com/edelivery
| This report is for the information of the shareholders of John Hancock New York Tax-Free Income Fund. | 7600A 8/07 |
| It is not authorized for distribution to prospective investors unless preceded or accompanied by a prospectus. | 10/07 |

| TABLE OF CONTENTS | ||
| Your fund at a glance | ||
| page 1 | ||
| Managers’ report | ||
| page 2 | ||
| A look at performance | ||
| page 6 | ||
| Your expenses | ||
| page 8 | ||
| Fund’s investments | ||
| page 10 | ||
| Financial statements | ||
| page 14 | ||
| Notes to financial | ||
| statements | ||
| page 20 | ||
| Trustees and officers | ||
| page 30 | ||
| For more information | ||
| page 36 | ||
CEO corner
To Our Shareholders,
Volatility returned to the U.S. stock market in the 12-month period ended August 31, 2007; however, stocks still posted a strong gain of 15.13%, as measured by the Standard & Poor’s 500 Index. The market experienced a particularly sharp downturn in August, as the subprime mortgage market’s woes increased. Rising defaults and an ensuing credit crunch caused heightened fears about their potential impact on U.S. economic growth. Foreign markets felt some ripple effects from the subprime issue, but they continued nonetheless to benefit from solid economic growth and outperformed the U.S. market in this period.
During this period of volatility, the U.S. stock market also passed a significant milestone — the broad Standard & Poor’s 500 Index climbed beyond the record it had set seven years ago. From its peak in March 2000, the stock market spiraled downward three consecutive years, bottoming in 2002. The upturn began in 2003, and the market has advanced each year since, finally setting a new high for the first time on May 30, 2007. During that period, the S&P 500 Index experienced five significant short-term sell-offs of 6% or more, with the August subprime-induced meltdown being the most recent.
This nearly complete market cycle highlights the importance of two investment principles you have heard us speak of often: diversification and patience. By allocating your investments among different asset classes, investment styles and portfolio managers, you are likely to be well represented through all phases of a complete market cycle, with the winners helping to cushion the fall of the losers.
The challenge for investors with a diversified portfolio is to properly evaluate your investments to tell the difference between an underperforming manager and an out-of-favor style, while also understanding the role each investment plays in your portfolio. That’s where your financial professional can provide true value. He or she can help you make those assessments and also counsel patience, because a properly diversified portfolio by its very nature will typically have something lagging or out of favor — a concept that can be difficult to live with, but necessary to embrace. If everything in your portfolio is “working,” then you are not truly diversified, but rather are leveraged to the current market and the flavor of the day. If so, you are bound to be out of step in the near future.
The recent volatility in the securities markets has prompted many investors to question how long this type of market cycle will last. History tells us it will indeed end and that when it does, today’s leaders may well turn into laggards and vice versa. The subprime mortgage market woes are just the latest example of why investors should be both patient and well-diversified. For with patience and a diversified portfolio, it could be easier to weather the market’s twists and turns and reach your long-term goals.
Sincerely,

Keith F. Hartstein,
President and Chief Executive Officer
This commentary reflects the CEO’s views as of August 31, 2007. They are subject to change at any time.
Your fund at a glance
The Fund seeks a high level of current income, consistent with preservation of capital, that is exempt from federal and Massachusetts personal income taxes. In pursuing this goal, the Fund normally invests at least 80% of its assets in securities of any maturity exempt from federal and Massachusetts personal income taxes.
Over the last twelve months
► Municipal bonds gained modestly as subprime mortgage lending woes led to a more volatile environment.
► The Fund outpaced its peer group average but trailed its benchmark index.
► Higher-quality and shorter-term bonds posted the best results, while lower-rated bonds lagged.

| Top 10 holdings | |
| Massachusetts Turnpike Auth, 1-1-23, 5.125% | 4.2% |
| Holyoke Gas & Electric Department, 12-1-31, 5.000% | 3.4% |
| Route 3 North Transit Improvement Associates, 6-15-29, 5.375% | 3.2% |
| Massachusetts Development Finance Agency, 11-1-28, 5.450% | 3.0% |
| Massachusetts Industrial Finance Agency, 12-1-20, 6.750% | 2.7% |
| Massachusetts Water Pollution Abatement Trust, 8-1-18, 5.250% | 2.6% |
| Massachusetts Health & Educational Facilities Auth, 12-15-31, 9.200% | 2.4% |
| Puerto Rico Aqueduct & Sewer Auth, 7-1-11, 7.970% | 2.3% |
| Massachusetts Development Finance Agency, 12-15-24, 5.000% | 2.2% |
| Massachusetts, Commonwealth of, 12-1-24, 5.500% | 2.2% |
As a percentage of net assets on August 31, 2007.
1
Managers’ report
John Hancock
Massachusetts Tax-Free Income Fund
In an increasingly unsettled investment environment, municipal bonds managed to post modestly positive results for the year ended August 31, 2007. The Lehman Brothers Municipal Bond Index advanced 2.30% for the one-year period; by comparison, the Lehman Brothers U.S. Aggregate Index — a broad measure of the taxable bond market — returned 5.26% .
The municipal bond market was relatively calm during the first eight months of the period. Slowing but still moderate U.S. economic growth, a stable interest rate policy from the Federal Reserve and balanced supply and demand in the municipal market contributed to a quiet environment for municipal bonds from September 2006 through April 2007, when interest income provided nearly all of the performance.
However, volatility increased markedly over the last four months as fallout from the declining housing and subprime mortgage sectors spread to other segments of the economy and financial markets. The ensuing flight to quality, resulting from investors fleeing riskier investments, led to a sell-off in the municipal bond market, most notably among lower-quality bonds.
Municipal bond issuance, which increased over the past several years as interest rates remained relatively low, was strong for most of the one-year period, dropping off only in the last two months as yields rose. Healthy demand from hedge funds and other non-traditional municipal
SCORECARD
| INVESTMENT | PERIOD’S PERFORMANCE ... AND WHAT’S BEHIND THE NUMBERS | |
| Industrial | ▲ | Consisted primarily of private water utilities bonds, which |
| development | performed well | |
| bonds | ||
| Shorter-term bonds | ▲ | Held up better in the market sell-off late in the one-year period |
| Lower-quality | ▼ | Suffered the largest losses in the municipal market decline |
| bonds | ||
2

Portfolio Managers, MFC Global Investment Management (U.S.), LLC Dianne M. Sales, CFA and Frank A. Lucibella, CFA
buyers absorbed the bulk of the new supply, but many of these non- traditional investors shifted away from the municipal market in recent months, contributing to the sell-off.
Massachusetts credit environment
Municipal credit quality in Massachusetts was largely unchanged over the past 12 months. The local economy has been relatively steady, and tax revenues remained on target. Governor Deval Patrick, who was elected in November 2006, and the state legislature have put a reasonable budget in place for the 2008 fiscal year. In addition, the state has gradually rebuilt its reserve funds in recent years to help weather potential declines in tax revenues.
“In an increasingly unsettled
investment environment,
municipal bonds managed to post
modestly positive results for the
year ended August 31, 2007.”
Fund performance
For the year ended August 31, 2007, John Hancock Massachusetts Tax-Free Income Fund’s Class A, Class B and Class C shares posted total returns of 2.02%, 1.31% and 1.31%, respectively, at net asset value. By comparison, the average return of Morningstar, Inc.’s muni Massachusetts fund category was 1.33% 1, while the Lehman Brothers Municipal Bond Index returned 2.30% . Keep in mind that your net asset value return will be different from the Fund’s performance if you were not invested in the Fund for the entire period or did not reinvest all distributions. See pages six and seven for historical performance information.
Playing defense
The portfolio’s outperformance of its peer group average resulted, we believe, from an emphasis on bonds with defensive characteristics, including higher credit quality, shorter maturities and higher coupons.
Massachusetts Tax-Free Income Fund
3
The portfolio benefited from a stable of seasoned high-coupon bonds with limited interest rate and credit volatility. These securities continued to generate a high level of tax-free income and also held up well during the recent sell-off, providing the bulk of the strong performance in a volatile environment.
The Fund also benefited from the pre-refunding of several higher-coupon bonds, meaning that the issuers refinanced them by issuing new bonds and putting the proceeds in U.S. Treasury securities until the existing bonds mature. The bonds now offer an excellent combination of high interest income and high credit ratings.
On the other side of the coin, longer-term and lower-quality bonds were among the weaker performers in the portfolio. Jordon Hospital saw a downgrade, lowering returns in the health care field. Wider credit spreads on several newer issues for continuing care retirement facilities also negatively impacted returns. Lower-rated bonds had been the best performers in the first half of the period, when their higher yields proved valuable in a relatively stable interest rate environment, but these securities suffered the sharpest losses during the municipal market decline of the past several months.
| SECTOR DISTRIBUTION2 | |
| General obligation | |
| bonds | 11% |
| Revenue bonds | |
| Transportation | 18% |
| Education | 11% |
| Health | 9% |
| Electric | 4% |
| Industrial development | 4% |
| Water & sewer | 3% |
| Pollution | 1% |
| Resource recovery | 1% |
| Economic development | 1% |
| Correctional facilities | 1% |
| Housing | 1% |
| Other | 33% |
Sector performance
Returns in the municipal market were driven more by maturity and quality than by sector. Within the portfolio, sectors exhibiting stable credit and higher coupons provided the best returns, including industrial development bonds, led by securities financing private water treatment plants. Transportation, one of the largest sector weightings, also posted solid gains, benefiting from the favorable coupon and maturity structure of our holdings.
The Fund was little affected by problems in the subprime mortgage area, having few holdings directly linked to real estate values. On the downside, the portfolio’s sales tax bonds lagged during the period, due to their non-callable structures. Though we took advantage of the market downturn to sell our lower-yielding positions and replace them with higher-yielding ones, we locked in some losses in the process.
Massachusetts Tax-Free Income Fund
4
Market concern over lower home prices also negatively impacted credit spreads on continuing care retirement centers, as reflected in lagging returns in health care.
Outlook
The recent events in the mortgage and housing markets are likely to have a dampening effect on the U.S. economy, but the extent of this impact is unclear. To date, the domestic economy has held up reasonably well, and economic growth on a global scale continues to strengthen. Nonetheless, the Fed, which cut its discount rate in mid-August, is widely expected to lower its federal funds rate in September. Given the uncertain economic and credit environment, we expect the municipal-bond market to remain volatile in the coming months.
“The portfolio benefited from a
stable of seasoned high-coupon
bonds with limited interest rate
and credit volatility.”
In the late 1990s, during the last major downturn in the municipal market, we added a number of attractively valued securities to the portfolio, capturing higher yields and enhancing the level of tax-free income the portfolio produces. Many of these securities are now nearing their call dates, and we are seeking out investments to replace these higher-yielding bonds. The near-term volatility may present some opportunities for us to accomplish this task.

This commentary reflects the views of the portfolio managers through the end of the Fund’s period discussed in this report. The managers’ statements reflect their own opinions. As such, they are in no way guarantees of future events and are not intended to be used as investment advice or a recommendation regarding any specific security. They are also subject to change at any time as market and other conditions warrant.
1 Figures from Morningstar, Inc. include reinvested dividends and do not take into account sales charges. Actual load-adjusted performance is lower.
2 As a percentage of net assets on August 31, 2007.
Massachusetts Tax-Free Income Fund
5
A look at performance
| For the periods ended August 31, 2007 | ||||||||||||
| Average annual returns | Cumulative total returns | SEC 30- | ||||||||||
| with maximum sales charge (POP) | with maximum sales charge (POP) | day yield | ||||||||||
| Inception | Since | Since | as of | |||||||||
| Class | date | 1-year | 5-year | 10-year | inception | 6 months | 1-year | 5-year | 10-year | inception | 8-31-07 | |
| A | 9-3-87 | –2.60% | 3.17% | 4.53% | — | –4.89% | –2.60% | 16.89% | 55.71% | — | 3.95% | |
| B | 10-3-96 | –3.58 | 3.05 | 4.42 | — | –5.61 | –3.58 | 16.23 | 54.16 | — | 3.44 | |
| C | 4-1-99 | 0.34 | 3.40 | — | 3.85% | –1.71 | 0.34 | 18.21 | — | 37.42% | 3.44 | |
Performance figures assume all distributions are reinvested. Public offering price (POP) figures reflect maximum sales charge on Class A shares of 4.5% and the applicable contingent deferred sales charge (CDSC) on Class B and Class C shares. The returns for Class C shares have been adjusted to reflect the elimination of the front-end sales charge effective July 15, 2004. The Class B shares’ CDSC declines annually between years 1 to 6 according to the following schedule 5, 4, 3, 3, 2, 1%. No sales charge will be assessed after the sixth year. Class C shares held for less than one year are subject to a 1% CDSC.
The expense ratios of the Fund, both net (including any fee waivers or expense limitations) and gross (excluding any fee waivers or expense limitations), are set forth according to the most recent publicly available Prospectus for the Fund and may differ from the expense ratios disclosed in the Financial Highlights tables in this report. The gross expenses are as follows: Class A — 0.99%, Class B — 1.69%, Class C — 1.69% .
The returns reflect past results and should not be considered indicative of future performance. The return and principal value of an investment will fluctuate so that shares, when redeemed, may be worth more or less than their original cost. Due to market volatility, the Fund’s current performance may be higher or lower than the performance shown. For performance data current to the most recent month-end, please call 1-800-225-5291 or visit the Fund’s Web site at www.jhfunds.com.
The performance table above and the chart on the next page do not reflect the deduction of taxes that a shareholder would pay on fund distributions or the redemption of fund shares. Please note that a portion of the Fund’s income may be subject to taxes, and some investors may be subject to the Alternative Minimum Tax (AMT). Also note that capital gains are taxable.
The Fund’s performance results reflect any applicable expense reductions, without which the expenses would increase and results would have been less favorable.
Massachusetts Tax-Free Income Fund
6
Growth of $10,000
This chart shows what happened to a hypothetical $10,000 investment in Massachusetts Tax-Free Income Fund Class A shares for the period indicated. For comparison, we’ve shown the same investment in the Lehman Brothers Municipal Bond Index.
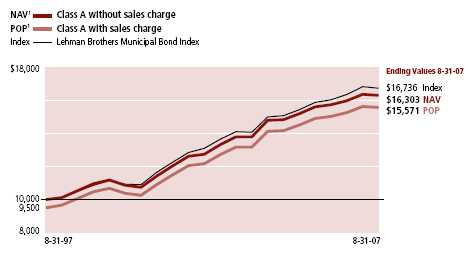
| With maximum | ||||
| Class | Period beginning | Without sales charge | sales charge | Index |
| B2 | 8-31-97 | $15,416 | $15,416 | $16,736 |
| C2 | 4-1-99 | 13,742 | 13,742 | 14,990 |
Assuming all distributions were reinvested for the period indicated, the table above shows the value of a $10,000 investment in the Fund’s Class B and Class C shares, respectively, as of August 31, 2007. The Class C shares investment with maximum sales charge has been adjusted to reflect the elimination of the front-end sales charge effective July 15, 2004. Performance of the classes will vary based on the difference in sales charges paid by shareholders investing in the different classes and the fee structure of those classes.
Lehman Brothers Municipal Bond Index is an unmanaged index that includes municipal bonds and is commonly used as a measure of bond performance.
It is not possible to invest directly in an index. Index figures do not reflect sales charges, which would have resulted in lower values if they did.
1 NAV represents net asset value and POP represents public offering price.
2 No contingent deferred sales charge applicable.
Massachusetts Tax-Free Income Fund
7
Your expenses
These examples are intended to help you understand your ongoing operating expenses.
Understanding fund expenses
As a shareholder of the Fund, you incur two types of costs:
■ Transaction costs which include sales charges (loads) on purchases or redemptions (varies by share class), minimum account fee charge, etc.
■ Ongoing operating expenses including management fees, distribution and service fees (if applicable), and other fund expenses.
We are going to present only your ongoing operating expenses here.
Actual expenses/actual returns
This example is intended to provide information about your fund’s actual ongoing operating expenses, and is based on your fund’s actual return. It assumes an account value of $1,000.00 on March 1, 2007, with the same investment held until August 31, 2007.
| Account value | Ending value | Expenses paid during period | |
| on 3-1-07 | on 8-31-07 | ended 8-31-071 | |
| Class A | $1,000.00 | $996.10 | $4.89 |
| Class B | 1,000.00 | 992.60 | 8.47 |
| Class C | 1,000.00 | 992.60 | 8.37 |
Together with the value of your account, you may use this information to estimate the operating expenses that you paid over the period. Simply divide your account value at August 31, 2007 by $1,000.00, then multiply it by the “expenses paid” for your share class from the table above. For example, for an account value of $8,600.00, the operating expenses should be calculated as follows:

Massachusetts Tax-Free Income Fund
8
Hypothetical example for comparison purposes
This table allows you to compare your fund’s ongoing operating expenses with those of any other fund. It provides an example of the Fund’s hypothetical account values and hypothetical expenses based on each class’s actual expense ratio and an assumed 5% annualized return before expenses (which is not your fund’s actual return). It assumes an account value of $1,000.00 on March 1, 2007, with the same investment held until August 31, 2007. Look in any other fund shareholder report to find its hypothetical example and you will be able to compare these expenses.
| Account value | Ending value | Expenses paid during period | |
| on 3-1-07 | on 8-31-07 | ended 8-31-07 1 | |
| Class A | $1,000.00 | $1,020.30 | $4.95 |
| Class B | 1,000.00 | 1,016.70 | 8.57 |
| Class C | 1,000.00 | 1,016.80 | 8.47 |
Remember, these examples do not include any transaction costs, such as sales charges; therefore, these examples will not help you to determine the relative total costs of owning different funds. If transaction costs were included, your expenses would have been higher. See the prospectus for details regarding transaction costs.
1 Expenses are equal to the Fund’s annualized expense ratio of 0.98%, 1.68% and 1.68% for Class A, Class B and Class C, respectively, multiplied by the average account value over the period, multiplied by number of days in most recent fiscal half-year/365 or 366 (to reflect the one-half year period).
Massachusetts Tax-Free Income Fund
9
F I N A N C I A L S T A T E M E N T S
Fund’s investments
Securities owned by the Fund on 8-31-07
This schedule is divided into two main categories: tax-exempt long-term bonds and short-term investments. Tax-exempt long-term bonds are broken down by state or territory. Under each state or territory is a list of securities owned by the Fund. Short-term investments, which represent the Fund’s cash position, are listed last.
| Interest | Maturity | Credit | Par value | |||
| State, issuer, description | rate | date | rating (A) | (000) | Value | |
| Tax-exempt long-term bonds 98.23% | $101,044,286 | |||||
| (Cost $97,425,373) | ||||||
| Massachusetts 89.96% | 92,533,189 | |||||
| Boston City Industrial | ||||||
| Development Financing Auth, | ||||||
| Rev Ref Swr Facil Harbor Electric | ||||||
| Energy Co Proj | 7.375% | 05-15-15 | BBB | $185 | 186,404 | |
| Boston Water & Sewer Commission, | ||||||
| Rev Ref Sr Ser 1992A | 5.750 | 11-01-13 | AA | 500 | 531,510 | |
| Freetown Lakeville Regional | ||||||
| School District, | ||||||
| Gen Oblig Unltd | 5.000 | 07-01-23 | AAA | 1,000 | 1,036,150 | |
| Holyoke Gas & Electric | ||||||
| Department, | ||||||
| Rev Ser 2001A | 5.000 | 12-01-31 | Aaa | 3,410 | 3,447,374 | |
| Massachusetts Bay | ||||||
| Transportation Auth, | ||||||
| Rev Assessment Ser A | 5.250 | 07-01-31 | AAA | 1,000 | 1,091,910 | |
| Rev Preref Assessment Ser 2000A | 5.250 | 07-01-30 | AAA | 150 | 156,275 | |
| Rev Preref Spec Assessment | ||||||
| Ser 2000A | 5.250 | 07-01-30 | AAA | 780 | 812,627 | |
| Rev Ref Assessment Ser 2006A | 5.250 | 07-01-35 | AAA | 1,310 | 1,425,437 | |
| Rev Ref Assessment Ser 2007A | 5.250 | 07-01-30 | AAA | 70 | 72,034 | |
| Rev Ref Cap Apprec Ser 2007A-2 | Zero | 07-01-26 | AAA | 2,500 | 942,050 | |
| Rev Ref Ser 1994A | 7.000 | 03-01-14 | AA | 1,000 | 1,148,200 | |
| Rev Spec Assessment Ser 2004A | 5.000 | 07-01-34 | AAA | 1,000 | 1,070,330 | |
| Massachusetts College | ||||||
| Building Auth, | ||||||
| Rev Ref Cap Apprec Ser 2003B | Zero | 05-01-19 | AAA | 1,000 | 590,950 | |
| Massachusetts, Commonwealth of, | ||||||
| Gen Oblig Ltd Ref | 5.500 | 11-01-17 | AAA | 1,000 | 1,113,800 | |
| Gen Oblig Ltd Ref Ser 2001C | 5.375 | 12-01-19 | AA | 1,000 | 1,064,040 | |
| Gen Oblig Ltd Ref Ser 2002C | 5.500 | 11-01-15 | AA | 1,000 | 1,106,730 | |
| Gen Oblig Ltd Ser 2005C | 5.000 | 09-01-24 | AAA | 1,000 | 1,073,060 | |
| Gen Oblig Unltd Ref Ser 2004C | 5.500 | 12-01-24 | AAA | 2,000 | 2,243,160 | |
| Massachusetts Development | ||||||
| Finance Agency, | ||||||
| Rev Belmont Hill School | 5.000 | 09-01-31 | A | 1,000 | 1,056,060 | |
| Rev Curry College Ser 2005A | 4.500 | 03-01-25 | A | 1,000 | 872,220 | |
| Rev Curry College Ser 2006A | 5.250 | 03-01-26 | A | 1,000 | 976,870 | |
See notes to financial statements
Massachusetts Tax-Free Income Fund
10
F I N A N C I A L S T A T E M E N T S
| Interest | Maturity | Credit | Par value | |||
| State, issuer, description | rate | date | rating (A) | (000) | Value | |
| Massachusetts (continued) | ||||||
| Massachusetts Development | ||||||
| Finance Agency, (continued) | ||||||
| Rev Linden | ||||||
| Ponds Inc Facility | ||||||
| Ser 2007A (G) | 5.750% | 11-15-35 | BB+ | $1,500 | $1,445,190 | |
| Rev Plantation Apts Hsg Prog | ||||||
| Ser 2004A | 5.000 | 12-15-24 | AAA | 2,320 | 2,293,366 | |
| Rev Ref Combined Jewish | ||||||
| Philanthropies Ser 2002A | 5.250 | 02-01-22 | Aa3 | 1,875 | 1,970,363 | |
| Rev Ref First Mortgage | ||||||
| Orchard Cove | 5.250 | 10-01-26 | BBB– | 1,000 | 938,060 | |
| Rev Ref Resource Recovery | ||||||
| Southeastern Ser 2001A | 5.625 | 01-01-16 | AAA | 500 | 536,625 | |
| Rev Volunteers of America Concord | ||||||
| Ser 2000A | 6.900 | 10-20-41 | AAA | 1,000 | 1,163,910 | |
| Rev YMCA Greater Boston Iss (G) | 5.450 | 11-01-28 | AA | 3,000 | 3,112,530 | |
| Rev YMCA Greater Boston Iss (G) | 5.350 | 11-01-19 | AA | 1,000 | 1,036,380 | |
| Massachusetts Health & | ||||||
| Educational Facilities Auth, | ||||||
| Rev Civic Investments Inc | ||||||
| Ser 2002B (G) | 9.200 | 12-15-31 | AA | 2,000 | 2,506,960 | |
| Rev Harvard Univ Iss Ser 2000W | 6.000 | 07-01-35 | Aaa | 1,000 | 1,070,840 | |
| Rev Jordan Hosp Ser 2003E | 6.750 | 10-01-33 | BB+ | 1,500 | 1,576,770 | |
| Rev Partners Health Ser 2001C | 5.750 | 07-01-32 | A– | 30 | 32,276 | |
| Rev Preref Partners Health | ||||||
| Ser 2001C | 5.750 | 07-01-32 | AA | 970 | 1,048,114 | |
| Rev Ref Boston College Iss | ||||||
| Ser 1998L | 5.000 | 06-01-26 | AA– | 1,000 | 1,005,250 | |
| Rev Ref Boston College Iss | ||||||
| Ser 1998L | 4.750 | 06-01-31 | AA– | 1,000 | 980,390 | |
| Rev Ref Emerson Hosp Ser 2005E | 5.000 | 08-15-35 | AA | 1,000 | 911,770 | |
| Rev Ref Harvard Pilgrim Health | ||||||
| Ser 1998A | 5.000 | 07-01-18 | AAA | 1,000 | 1,014,360 | |
| Rev Ref Lahey Clinic Med Ctr | ||||||
| Ser 2005C | 5.000 | 08-15-23 | AAA | 1,000 | 1,020,360 | |
| Rev Ref New England Med Ctr Hosp | ||||||
| Ser 2002H | 5.000 | 05-15-25 | AAA | 1,000 | 1,017,110 | |
| Rev Ref Partners Healthcare Sys | ||||||
| Ser 2007G-5 | 5.000 | 07-01-27 | AA | 1,000 | 1,004,560 | |
| Rev Ref South Shore Hosp | ||||||
| Ser 1999F | 5.750 | 07-01-29 | A | 1,000 | 1,019,930 | |
| Rev Ref Williams College | ||||||
| Ser 2003H | 5.000 | 07-01-33 | AA+ | 1,500 | 1,515,015 | |
| Rev Simmons College Ser 2000D | 6.150 | 10-01-29 | AAA | 1,000 | 1,080,280 | |
| Rev Sterling & Francine Clark | ||||||
| Ser 2006A | 5.000 | 07-01-36 | AA | 1,000 | 1,019,250 | |
| Rev Univ of Mass Worcester Campus | ||||||
| Ser 2001B | 5.250 | 10-01-31 | AAA | 1,500 | 1,586,730 | |
| Rev Wheelock College Ser 2000B | 5.625 | 10-01-30 | Aaa | 1,000 | 1,041,950 | |
| Massachusetts Housing | ||||||
| Finance Agency, | ||||||
| Rev Rental Mtg Ser 2001A | 5.800 | 07-01-30 | AAA | 975 | 1,001,306 | |
| Rev Ser 2003B | 4.700 | 12-01-16 | AA– | 1,310 | 1,341,492 | |
See notes to financial statements
Massachusetts Tax-Free Income Fund
11
F I N A N C I A L S T A T E M E N T S
| Interest | Maturity | Credit | Par value | |||
| State, issuer, description | rate | date | rating (A) | (000) | Value | |
| Massachusetts (continued) | ||||||
| Massachusetts Industrial | ||||||
| Finance Agency, | ||||||
| Rev Assisted Living Facil TNG | ||||||
| Marina Bay LLC Proj | 7.500% | 12-01-27 | AAA | $900 | $933,777 | |
| Rev Dominion Energy Brayton Point | 5.000 | 02-01-36 | BBB | 1,000 | 950,530 | |
| Rev Ref Resource Recovery Ogden | ||||||
| Haverhill Proj Ser 1998A | 5.600 | 12-01-19 | BBB | 500 | 510,475 | |
| Rev Ref Resource Recovery Ogden | ||||||
| Haverhill Proj Ser 1998B | 5.500 | 12-01-19 | BBB | 1,500 | 1,523,955 | |
| Rev Wtr Treatment American | ||||||
| Hingham Proj (G) | 6.900 | 12-01-29 | BBB– | 1,210 | 1,225,633 | |
| Rev Wtr Treatment American | ||||||
| Hingham Proj (G) | 6.750 | 12-01-20 | BBB– | 2,780 | 2,813,721 | |
| Massachusetts Municipal Wholesale | ||||||
| Electric Co, | ||||||
| Rev Pwr Supply Sys (P) | 7.040 | 07-01-18 | AAA | 1,000 | 1,002,720 | |
| Massachusetts Port Auth, | ||||||
| Rev Ref Bosfuel Proj | 5.000 | 07-01-32 | AAA | 1,770 | 1,767,380 | |
| Rev Ser 1999C | 5.750 | 07-01-29 | AAA | 1,250 | 1,318,763 | |
| Rev Spec Facil US Air Proj | ||||||
| Ser 1996A | 5.750 | 09-01-16 | AAA | 1,000 | 1,011,360 | |
| Massachusetts Special Obligation | ||||||
| Dedicated Tax, | ||||||
| Rev Ref Spec Oblig | 5.500 | 01-01-27 | AAA | 1,000 | 1,121,230 | |
| Rev Spec Oblig | 5.250 | 01-01-26 | AAA | 1,000 | 1,076,220 | |
| Massachusetts Turnpike Auth, | ||||||
| Rev Ref Metro Hwy Sys Sr | ||||||
| Ser 1997A | 5.125 | 01-01-23 | AAA | 4,300 | 4,357,491 | |
| Rev Ref Metro Hwy Sys Sr | ||||||
| Ser 1997A | 5.000 | 01-01-37 | AAA | 300 | 300,978 | |
| Rev Ref Metro Hwy Sys Sr | ||||||
| Ser 1997C | Zero | 01-01-20 | AAA | 1,000 | 569,320 | |
| Massachusetts Water Pollution | ||||||
| Abatement Trust, | ||||||
| Preref Pool PG Ser 9 | 5.250 | 08-01-18 | AAA | 2,440 | 2,658,429 | |
| Rev Preref Pool Prog Ser 7 | 5.125 | 02-01-31 | AAA | 645 | 677,321 | |
| Rev Unref Bal Pool Prog Ser 7 | 5.125 | 02-01-31 | AAA | 1,775 | 1,808,104 | |
| Unref Bal Pool PG Ser 2003-9 | 5.250 | 08-01-18 | AAA | 60 | 64,327 | |
| Narragansett Regional School | ||||||
| District, | ||||||
| Gen Oblig Unltd | 5.375 | 06-01-18 | Aaa | 1,000 | 1,049,450 | |
| Pittsfield, City of, | ||||||
| Gen Oblig Ltd | 5.000 | 04-15-19 | AAA | 1,000 | 1,039,300 | |
| Plymouth, County of, | ||||||
| Rev Ref Cert of Part Correctional | ||||||
| Facil Proj | 5.000 | 04-01-22 | AAA | 1,000 | 1,017,000 | |
| Rail Connections, Inc., | ||||||
| Rev Cap Apprec Rte 128 Pkg | ||||||
| Ser 1999B | Zero | 07-01-18 | Aaa | 1,750 | 936,635 | |
| Rev Cap Apprec Rte 128 Pkg | ||||||
| Ser 1999B | Zero | 07-01-19 | Aaa | 2,415 | 1,210,084 | |
See notes to financial statements
Massachusetts Tax-Free Income Fund
12
F I N A N C I A L S T A T E M E N T S
| Interest | Maturity | Credit | Par value | |||
| State, issuer, description | rate | date | rating (A) | (000) | Value | |
| Massachusetts (continued) | ||||||
| Route 3 North Transit Improvement | ||||||
| Associates, | ||||||
| Rev Lease | 5.375% | 06-15-29 | AAA | $3,100 | $3,237,888 | |
| University of Massachusetts, | ||||||
| Rev Bldg Auth Facil Gtd Ser 2000A | 5.125 | 11-01-25 | AAA | 1,000 | 1,042,770 | |
| Puerto Rico 8.27% | 8,511,097 | |||||
| Puerto Rico Aqueduct & | ||||||
| Sewer Auth, | ||||||
| Rev Inverse Floater (Gtd) (M)(P) | 7.970 | 07-01-11 | AAA | 2,000 | 2,315,360 | |
| Puerto Rico, Commonwealth of, | ||||||
| Gen Oblig Unltd Ser 975 (P) | 5.750 | 07-01-18 | Aaa | 1,500 | 1,660,290 | |
| Rev Inverse Floater (M)(P) | 7.720 | 07-01-11 | AAA | 1,000 | 1,162,140 | |
| Puerto Rico Highway & | ||||||
| Transportation Auth, | ||||||
| Rev Preref Hwy Ser 1996Y | 6.250 | 07-01-14 | A– | 955 | 1,093,351 | |
| Rev Ref Hwy Ser 2003AA | 5.500 | 07-01-19 | AAA | 2,000 | 2,229,500 | |
| Rev Unref Bal Hwy Ser 1996Y | 6.250 | 07-01-14 | A– | 45 | 50,456 | |
| Interest | Par value | |||||
| Issuer, description, maturity date | rate | (000) | Value | |||
| Short-term investments 0.47% | $484,000 | |||||
| (Cost $484,000) | ||||||
| Joint Repurchase Agreement 0.47% | 484,000 | |||||
| Joint Repurchase Agreement transaction with Barclays Plc, | ||||||
| dated 8-31-07 at 5.100% to be repurchased at $484,274 on | ||||||
| 9-4-07, collateralized by $482,350 of U.S. Inflation Indexed | ||||||
| Treasury Note, 2.000%, due 1-15-16 (valued at $493,680, | ||||||
| including interest) | 5.100% | $484 | 484,000 | |||
| Total investments (Cost $97,909,373) 98.70% | $101,528,286 | |||||
| Other assets and liabilities, net 1.30% | $1,335,451 | |||||
| Total net assets 100.00% | $102,863,737 | |||||
The percentage shown for each investment category is the total value of that category as a percentage of the net assets of the Fund.
(A) Credit ratings are unaudited and are rated by Moody’s Investors Service or Fitch where Standard & Poor’s ratings are not available unless indicated otherwise.
(G) Security rated internally by John Hancock Advisers, LLC. Unaudited.
(M) Inverse floater bond purchased on secondary market.
(P) Variable rate obligation. The coupon rate shown represents the rate at period end.
See notes to financial statements
Massachusetts Tax-Free Income Fund
13
F I N A N C I A L S T A T E M E N T S
Financial statements
Statement of assets and liabilities 8-31-07
This Statement of Assets and Liabilities is the Fund’s balance sheet. It shows the value of what the Fund owns, is due and owes. You’ll also find the net asset value and the maximum offering price per share.
| Assets | |
| Investments at value (cost $97,909,373) | $101,528,286 |
| Cash | 692 |
| Receivable for shares sold | 259,156 |
| Interest receivable | 1,226,787 |
| Other assets | 7,804 |
| Total assets | 103,022,725 |
| Liabilities | |
| Payable for shares repurchased | 22,841 |
| Dividends payable | 11,223 |
| Payable to affiliates | |
| Management fees | 43,691 |
| Distribution and service fees | 3,833 |
| Other | 8,270 |
| Other payables and accrued expenses | 69,130 |
| Total liabilities | 158,988 |
| Net assets | |
| Capital paid-in | 99,151,616 |
| Accumulated net realized gain on investments | 85,387 |
| Net unrealized appreciation of investments | 3,618,913 |
| Accumulated net investment income | 7,821 |
| Net assets | $102,863,737 |
| Net asset value per share | |
| Based on net asset values and shares outstanding — the Fund has an | |
| unlimited number of shares authorized with no par value | |
| Class A ($79,949,483 ÷ 6,463,994 shares) | $12.37 |
| Class B ($12,470,898 ÷ 1,008,305 shares)1 | $12.37 |
| Class C ($10,443,356 ÷ 844,396 shares)1 | $12.37 |
| Maximum offering price per share | |
| Class A2 ($12.37 ÷ 95.5%) | $12.95 |
1 Redemption price is equal to net asset value less any applicable contingent deferred sales charge.
2 On single retail sales of less than $100,000. On sales of $100,000 or more and on group sales the offering price is reduced.
See notes to financial statements
Massachusetts Tax-Free Income Fund
14
F I N A N C I A L S T A T E M E N T S
Statement of operations For the year ended 8-31-07
This Statement of Operations summarizes the Fund’s investment income earned and expenses incurred in operating the Fund. It also shows net gains (losses) for the period stated.
| Investment income | |
| Interest | $5,387,373 |
| Total investment income | 5,387,373 |
| Expenses | |
| Investment management fees (Note 2) | 523,770 |
| Distribution and service fees (Note 2) | 495,182 |
| Transfer agent fees (Note 2) | 60,870 |
| Accounting and legal services fees (Note 2) | 12,662 |
| Compliance fees | 2,493 |
| Custodian fees | 45,220 |
| Professional fees | 23,530 |
| Printing fees | 18,221 |
| Blue sky fees | 15,023 |
| Trustees’ fees | 4,545 |
| Miscellaneous | 6,903 |
| Total expenses | 1,208,419 |
| Less expense reductions (Note 2) | (71) |
| Net expenses | 1,208,348 |
| Net investment income | 4,179,025 |
| Realized and unrealized gain (loss) | |
| Net realized gain on investments | 170,909 |
| Change in net unrealized appreciation (depreciation) of investments | (2,453,587) |
| Net realized and unrealized loss | (2,282,678) |
| Increase in net assets from operations | $1,896,347 |
See notes to financial statements
Massachusetts Tax-Free Income Fund
15
F I N A N C I A L S T A T E M E N T S
Statement of changes in net assets
These Statements of Changes in Net Assets show how the value of the Fund’s net assets has changed during the last two periods. The difference reflects earnings less expenses, any investment gains and losses, distributions, if any, paid to shareholders and the net of Fund share transactions.
| Year | Year | |
| ended | ended | |
| 8-31-06 | 8-31-07 | |
| Increase (decrease) in net assets | ||
| From operations | ||
| Net investment income | $4,121,482 | $4,179,025 |
| Net realized gain | 38,153 | 170,909 |
| Change in net unrealized appreciation (depreciation) | (1,948,756) | (2,453,587) |
| Increase in net assets resulting from operations | 2,210,879 | 1,896,347 |
| Distributions to shareholders | ||
| From net investment income | ||
| Class A | (3,084,823) | (3,238,460) |
| Class B | (646,607) | (506,352) |
| Class C | (325,306) | (372,916) |
| From net realized gain | ||
| Class A | (22,507) | (48,486) |
| Class B | (5,846) | (10,264) |
| Class C | (2,724) | (6,898) |
| (4,087,813) | (4,183,376) | |
| From Fund share transactions | 3,225,905 | (734,203) |
| Total increase (decrease) | 1,348,971 | (3,021,232) |
| Net assets | ||
| Beginning of year | 104,535,998 | 105,884,969 |
| End of year1 | $105,884,969 | $102,863,737 |
1 Includes accumulated net investment income of $7,341 and $7,821, respectively.
See notes to financial statements
Massachusetts Tax-Free Income Fund
16
F I N A N C I A L S T A T E M E N T S
Financial highlights
The Financial Highlights show how the Fund’s net asset value for a share has changed since the end of the previous period.
| CLASS A SHARES | |||||
| Period ended | 8-31-03 | 8-31-04 | 8-31-05 | 8-31-06 | 8-31-07 |
| Per share operating performance | |||||
| Net asset value, beginning of period | $12.50 | $12.38 | $12.75 | $12.87 | $12.64 |
| Net investment income1 | 0.57 | 0.56 | 0.54 | 0.53 | 0.53 |
| Net realized and unrealized | |||||
| gain (loss) on investments | (0.13) | 0.36 | 0.11 | (0.24) | (0.27) |
| Total from investment operations | 0.44 | 0.92 | 0.65 | 0.29 | 0.26 |
| Less distributions | |||||
| From net investment income | (0.56) | (0.55) | (0.53) | (0.52) | (0.52) |
| From net realized gain | — | — | — | —2 | (0.01) |
| (0.56) | (0.55) | (0.53) | (0.52) | (0.53) | |
| Net asset value, end of period | $12.38 | $12.75 | $12.87 | $12.64 | $12.37 |
| Total return3 (%) | 3.57 | 7.55 | 5.21 | 2.384 | 2.024 |
| Ratios and supplemental data | |||||
| Net assets, end of period | |||||
| (in millions) | $66 | $71 | $76 | $78 | $80 |
| Ratio of net expenses to average | |||||
| net assets (%) | 1.02 | 1.01 | 1.04 | 0.99 | 0.98 |
| Ratio of gross expenses | |||||
| to average net assets (%) | 1.02 | 1.01 | 1.04 | 0.99 | 0.985 |
| Ratio of net investment income | |||||
| to average net assets (%) | 4.54 | 4.40 | 4.20 | 4.19 | 4.16 |
| Portfolio turnover (%) | 13 | 44 | 26 | 15 | 25 |
See notes to financial statements
Massachusetts Tax-Free Income Fund
17
F I N A N C I A L S T A T E M E N T S
Financial highlights
| CLASS B SHARES | |||||
| Period ended | 8-31-03 | 8-31-04 | 8-31-05 | 8-31-06 | 8-31-07 |
| Per share operating performance | |||||
| Net asset value, beginning of period | $12.50 | $12.38 | $12.75 | $12.87 | $12.64 |
| Net investment income1 | 0.49 | 0.47 | 0.45 | 0.44 | 0.44 |
| Net realized and unrealized | |||||
| gain (loss) on investments | (0.13) | 0.36 | 0.11 | (0.24) | (0.27) |
| Total from investment operations | 0.36 | 0.83 | 0.56 | 0.20 | 0.17 |
| Less distributions | |||||
| From net investment income | (0.48) | (0.46) | (0.44) | (0.43) | (0.43) |
| From net realized gain | — | — | — | —2 | (0.01) |
| (0.48) | (0.46) | (0.44) | (0.43) | (0.44) | |
| Net asset value, end of period | $12.38 | $12.75 | $12.87 | $12.64 | $12.37 |
| Total return3 (%) | 2.85 | 6.80 | 4.48 | 1.674 | 1.314 |
| Ratios and supplemental data | |||||
| Net assets, end of period | |||||
| (in millions) | $23 | $23 | $20 | $17 | $12 |
| Ratio of net expenses to average | |||||
| net assets (%) | 1.72 | 1.71 | 1.74 | 1.69 | 1.68 |
| Ratio of gross expenses | |||||
| to average net assets (%) | 1.72 | 1.71 | 1.74 | 1.69 | 1.685 |
| Ratio of net investment income | |||||
| to average net assets (%) | 3.83 | 3.70 | 3.50 | 3.49 | 3.46 |
| Portfolio turnover (%) | 13 | 44 | 26 | 15 | 25 |
See notes to financial statements
Massachusetts Tax-Free Income Fund
18
F I N A N C I A L S T A T E M E N T S
Financial highlights
| CLASS C SHARES | |||||
| Period ended | 8-31-03 | 8-31-04 | 8-31-05 | 8-31-06 | 8-31-07 |
| Per share operating performance | |||||
| Net asset value, beginning of period | $12.50 | $12.38 | $12.75 | $12.87 | $12.64 |
| Net investment income1 | 0.48 | 0.47 | 0.45 | 0.44 | 0.44 |
| Net realized and unrealized | |||||
| gain (loss) on investments | (0.12) | 0.36 | 0.11 | (0.24) | (0.27) |
| Total from investment operations | 0.36 | 0.83 | 0.56 | 0.20 | 0.17 |
| Less distributions | |||||
| From net investment income | (0.48) | (0.46) | (0.44) | (0.43) | (0.43) |
| From net realized gain | — | — | — | —2 | (0.01) |
| (0.48) | (0.46) | (0.44) | (0.43) | (0.44) | |
| Net asset value, end of period | $12.38 | $12.75 | $12.87 | $12.64 | $12.37 |
| Total return3 (%) | 2.85 | 6.80 | 4.48 | 1.674 | 1.314 |
| Ratios and supplemental data | |||||
| Net assets, end of period | |||||
| (in millions) | $7 | $8 | $8 | $11 | $10 |
| Ratio of net expenses to average | |||||
| net assets (%) | 1.72 | 1.71 | 1.74 | 1.69 | 1.68 |
| Ratio of gross expenses | |||||
| to average net assets (%) | 1.72 | 1.71 | 1.74 | 1.69 | 1.685 |
| Ratio of net investment income | |||||
| to average net assets (%) | 3.81 | 3.69 | 3.49 | 3.48 | 3.46 |
| Portfolio turnover (%) | 13 | 44 | 26 | 15 | 25 |
1 Based on the average of the shares outstanding.
2 Capital gains distribution less than $0.01.
3 Assumes dividend reinvestment and does not reflect the effect of sales charges.
4 Total returns would have been lower had certain expenses not been reduced during the periods shown.
5 Does not take into consideration expense reductions during the periods shown.
See notes to financial statements
Massachusetts Tax-Free Income Fund
19
Notes to financial statements
Note 1 Accounting policies
John Hancock Massachusetts Tax-Free Income Fund (the Fund) is a non-diversified series of John Hancock Tax-Exempt Series Fund (the Trust), an open-end management investment company registered under the Investment Company Act of 1940, as amended (the 1940 Act). The Fund seeks a high level of current income, consistent with the preservation of capital, that is exempt from federal and Massachusetts personal income taxes. Since the Fund invests primarily in Massachusetts state issuers, the Fund may be affected by political, economic or regulatory developments in the state of Massachusetts.
The Trustees have authorized the issuance of multiple classes of shares of the Fund, designated as Class A, Class B and Class C shares. The shares of each class represent an interest in the same portfolio of investments of the Fund and have equal rights as to voting, redemptions, dividends and liquidation, except that certain expenses, subject to the approval of the Trustees, may be applied differently to each class of shares in accordance with current regulations of the Securities and Exchange Commission (SEC) and the Internal Revenue Service. Shareholders of a class that bears distribution and service expenses under the terms of a distribution plan have exclusive voting rights to that distribution plan. Class B shares will convert to Class A shares eight years after purchase.
Significant accounting policies of the Fund are as follows:
Security valuation
The net asset value of the shares of Class A, Class B and Class C is determined daily as of the close of the New York Stock Exchange (NYSE), normally at 4:00 p.m., Eastern Time. Short-term debt investments that have a remaining maturity of 60 days or less are valued at amortized cost, and thereafter assume a constant amortization to maturity of any discount or premium, which approximates market value. Securities traded only in the over-the-counter market are valued at the last bid price quoted by brokers making markets in the securities at the close of trading. Securities for which there are no such quotations, principally debt securities, are valued based on the valuation provided by an independent pricing service, which utilizes both dealer-supplied and electronic data processing techni ques, which take into account factors such as institutional-size trading in similar groups of securities, yield, quality, coupon rate, maturity, type of issue, trading characteristics and other market data. All other securities held by the Fund are valued at the last sale price or official closing price (closing bid price or last evaluated quote if no sale has occurred) as of the close of business on the principal securities exchange (domestic or foreign) on which they trade or, lacking any sales, at the closing bid price.
Other assets and securities for which no such quotations are readily available are valued at fair value as determined in good faith under consistently applied procedures established by and under the general supervision of the Board of Trustees.
Joint repurchase agreement
Pursuant to an exemptive order issued by the SEC, the Fund, along with other registered investment companies having a management contract with John Hancock Advisers, LLC (the Adviser), a wholly owned subsidiary of John Hancock Financial Services, Inc., a subsidiary of Manulife Financial Corporation (MFC), may participate in a joint repurchase agreement transaction. Aggregate cash balances are invested in one or more large repurchase agreements, whose underlying securities are obligations of the U.S. government and/ or its agencies. The Fund’s custodian bank receives delivery of the underlying securities
Massachusetts Tax-Free Income Fund
20
for the joint account on the Fund’s behalf. The Adviser is responsible for ensuring that the agreement is fully collateralized at all times.
Investment transactions
Investment transactions are accounted for on a trade date plus one basis for daily net asset value calculations. However, for financial reporting purposes, investment transactions are reported on trade date. Net realized gains and losses on sales of investments are determined on the identified cost basis.
Class allocations
Income, common expenses, and realized and unrealized gains (losses) are determined at the fund level and allocated daily to each class of shares based on the appropriate net asset value of the respective classes. Distribution and service fees, if any, are calculated daily at the class level based on the appropriate net asset value of each class and the specific expense rate(s) applicable to each class.
Expenses
The majority of expenses are directly identifiable to an individual fund. Expenses that are not readily identifiable to a specific fund are allocated in such a manner as deemed equitable, taking into consideration, among other things, the nature and type of expense and the relative sizes of the funds.
Bank borrowings
The Fund is permitted to have bank borrowings for temporary or emergency purposes, including the meeting of redemption requests that otherwise might require the untimely disposition of securities. The Fund has entered into a syndicated line of credit agreement with the Bank of New York Mellon (BNYM), the Swing Line Lender and Administrative Agent. This agreement enables the Fund to participate, with other funds managed by the Adviser, in an unsecured line of credit with BNYM, which permits borrowings of up to $100 million, collectively. Interest is charged to each fund based on its borrowing. In addition, a commitment fee is charged to each fund based on the average daily unused portion of the line of credit and is allocated among the participating funds. The Fund had no borrowing activity under the line of credit during the year ended August 31, 2007.
Federal income taxes
The Fund qualifies as a “regulated investment company” by complying with the applicable provisions of the Internal Revenue Code and will not be subject to federal income tax on taxable income that is distributed to shareholders. Therefore, no federal income tax provision is required.
New accounting pronouncements
In July 2006, FASB Interpretation No. 48, Accounting for Uncertainty in Income Taxes, an interpretation of FASB Statement 109 (FIN 48), was issued and is effective for fiscal years beginning after December 15, 2006, and is to be applied to all open tax years as of the effective date. On December 22, 2006, the SEC delayed the implementation of FIN 48 for regulated investment companies for an additional six months. FIN 48 prescribes a minimum threshold for financial statement recognition of the benefit of a tax position taken or expected to be taken in a tax return, and requires certain expanded disclosures. Management has concluded that the adoption of FIN 48 will not result in a material impact on the Fund’s net assets, results of operations and financial statement disclosures.
In September 2006, FASB Standard No. 157, Fair Value Measurements (FAS 157), was issued and is effective for fiscal years beginning after November 15, 2007. FAS 157 defines fair value, establishing a framework for measuring fair value and expands disclosure about fair value measurements. Management is currently evaluating the application of FAS 157 to the Fund and its impact, if any, resulting from the adoption of FAS 157 on the Fund’s financial statements.
Interest and distributions
Interest income on investment securities is recorded on the accrual basis. All premiums and discounts are amortized/accreted for financial reporting purposes.
The Fund records distributions to shareholders from net investment income and net realized gains, if any, on the ex-dividend date. The Fund’s net investment income is declared daily as dividends to shareholders of record as of the close of business on the preceding day, and distributed monthly. During the year ended August 31, 2006, the tax character
Massachusetts Tax-Free Income Fund
21
of distributions paid was as follows: ordinary income $6,154, exempt income $4,050,581 and long-term capital gain $31,077. During the year ended August 31, 2007, the tax character of distributions paid was as follows: ordinary income $9,741, exempt income $4,107,987 and long-term capital gain $65,648. Distributions paid by the Fund with respect to each class of shares are calculated in the same manner, at the same time and are in the same amount, except for the effect of expenses that may be applied differently to each class.
As of August 31, 2007, the components of distributable earnings on a tax basis included $23,243 of undistributed exempt income and $143,647 of undistributed long-term capital gain.
Such distributions and distributable earnings, on a tax basis, are determined in conformity with income tax regulations, which may differ from accounting principles generally accepted in the United States of America. Distributions in excess of tax basis earnings and profits, if any, are reported in the Fund’s financial statements as a return of capital.
Use of estimates
The preparation of these financial statements, in accordance with accounting principles generally accepted in the United States of America, incorporates estimates made by management in determining the reported amount of assets, liabilities, revenues and expenses of the Fund. Actual results could differ from these estimates.
Note 2
Management fee and transactions with affiliates and others
The Fund has an investment management contract with the Adviser. Under the investment management contract, the Fund pays a monthly management fee to the Adviser equivalent, on an annual basis, to the sum of: (a) 0.50% of the first $250,000,000 of the Fund’s average daily net asset value, (b) 0.45% of the next $250,000,000, (c) 0.425% of the next $500,000,000, (d) 0.40% of the next $250,000,000 and (e) 0.30% of the Fund’s average daily net asset value in excess of $1,250,000,000.
Effective December 31, 2005, the investment management teams of the Adviser were reorganized into Sovereign Asset Management LLC (Sovereign), a wholly owned indirect subsidiary of John Hancock Life Insurance Company (JHLICO), a subsidiary of MFC. The Adviser remains the principal advisor on the Fund and Sovereign acts as subadviser under the supervision of the Adviser. The restructuring did not have an impact on the Fund, which continues to be managed using the same investment philosophy and process. The Fund is not responsible for payment of the subadvisory fees.
Effective October 1, 2006, Sovereign changed its name to MFC Global Investment Management (U.S.), LLC.
The Fund has an agreement with its custodian bank, under which custody fees are reduced by balance credits applied during the period. Accordingly, the expense reductions related to custody fee offsets amounted to $71.
The Fund has a Distribution Agreement with John Hancock Funds, LLC (JH Funds), a wholly owned subsidiary of the Adviser. The Fund has adopted Distribution Plans with respect to Class A, Class B and Class C, pursuant to Rule 12b-1 under the 1940 Act to reimburse JH Funds for the services it provides as distributor of shares of the Fund. Accordingly, the Fund makes monthly payments to JH Funds at an annual rate not to exceed 0.30% of Class A average daily net asset value and 1.00% of Class B and Class C average daily net asset value. A maximum of 0.25% of such payments may be service fees, as defined by the Conduct Rules of the National Association of Securities Dealers. Under the Conduct Rules, curtailment of a portion of the Fund’s 12b-1 payments could occur under certain circumstances.
Expenses under the agreement described above for the year ended August 31, 2007, were as follows:
| Distribution and | |
| Share class | service fees |
| Class A | $236,725 |
| Class B | 148,905 |
| Class C | 109,552 |
| Total | $495,182 |
Massachusetts Tax-Free Income Fund
22
Class A shares are assessed up-front sales charges. During the year ended August 31, 2007, JH Funds received net up-front sales charges of $107,778 with regard to sales of Class A shares. Of this amount, $14,560 was retained and used for printing prospectuses, advertising, sales literature and other purposes, $87,208 was paid as sales commissions to unrelated broker-dealers and $6,010 was paid as sales commissions to sales personnel of Signator Investors, Inc. (Signator Investors), a related broker-dealer. The Adviser’s indirect parent, JHLICO, is the indirect sole shareholder of Signator Investors.
Class B shares that are redeemed within six years of purchase are subject to a contingent deferred sales charge (CDSC) at declining rates, beginning at 5.00% of the lesser of the current market value at the time of redemption or the original purchase cost of the shares being redeemed. Class C shares that are redeemed within one year of purchase are subject to a CDSC at a rate of 1.00% of the lesser of the current market value at the time of redemption or the original purchase cost of the shares being redeemed. Proceeds from the CDSCs are paid to JH Funds and are used in whole or in part to defray its expenses for providing distribution-related services to the Fund in connection with the sale of Class B and Class C shares. During the year ended August 31, 2007, CDSCs received by JH Funds amounted to $23,018 for Class B shares and $1,708 for Class C shares.
The Fund has a transfer agent agreement with John Hancock Signature Services, Inc. (Signature Services), an indirect subsidiary of JHLICO. The Fund pays a monthly fee which is based on an annual rate of $16 for each Class A shareholder account, $18.50 for each Class B shareholder account and $17.50 for each Class C shareholder account. The Fund also pays a monthly transfer agent fee at an annual rate of 0.01% of each class’s average daily net asset value, plus a fee based on the number of shareholder accounts and reimbursement for certain out-of-pocket expenses, aggregated and allocated to each class on the basis of its relative net asset value.
The Fund has an agreement with the Adviser to perform necessary tax, accounting and legal services for the Fund. The compensation for the period amounted to $12,662 with an effective rate of 0.01% of the Fund’s average daily net asset value. The Fund also reimbursed JHLICO for certain compliance costs, included in the Fund’s Statement of Operations.
Mr. James R. Boyle is Chairman of the Adviser, as well as affiliated Trustee of the Fund, and is compensated by the Adviser and/or its affiliates. The compensation of unaffiliated Trustees is borne by the Fund. The unaffiliated Trustees may elect to defer, for tax purposes, their receipt of this compensation under the John Hancock Group of Funds Deferred Compensation Plan. The Fund makes investments into other John Hancock funds, as applicable, to cover its liability for the deferred compensation. Investments to cover the Fund’s deferred compensation liability are recorded on the Fund’s books as an other asset. The deferred compensation liability and the related other asset are always equal and are marked to market on a periodic basis to reflect any income earned by the investments, as well as any unrealized gains or losses. The Deferred Compensation Plan investments had no impact on the operations of the Fund.
Note 3
Guarantees and indemnifications
Under the Fund’s organizational documents, its Officers and Trustees are indemnified against certain liability arising out of the performance of their duties to the Fund. Additionally, in the normal course of business, the Fund enters into contracts with service providers that contain general indemnification clauses. The Fund’s maximum exposure under these arrangements is unknown, as this would involve future claims that may be made against the Fund that have not yet occurred. However, based on experience, the Fund believes the risk of loss to be remote.
Massachusetts Tax-Free Income Fund
23
Note 4
Fund share transactions
This listing illustrates the number of Fund shares sold, reinvested and repurchased during the years ended August 31, 2006, and August 31, 2007, along with the corresponding dollar value.
| Year ended 8-31-06 | Year ended 8-31-07 | |||
| Shares | Amount | Shares | Amount | |
| Class A shares | ||||
| Sold | 849,330 | $10,705,888 | 1,276,935 | $16,066,440 |
| Distributions reinvested | 163,970 | 2,066,332 | 172,992 | 2,176,719 |
| Repurchased | (761,829) | (9,604,132) | (1,134,584) | (14,263,334) |
| Net increase | 251,471 | $3,168,088 | 315,343 | $3,979,825 |
| Class B shares | ||||
| Sold | 97,643 | $1,232,887 | 76,660 | $964,654 |
| Distributions reinvested | 27,451 | 346,032 | 22,008 | 277,160 |
| Repurchased | (318,594) | (4,011,749) | (468,311) | (5,902,238) |
| Net decrease | (193,500) | ($2,432,830) | (369,643) | ($4,660,424) |
| Class C shares | ||||
| Sold | 268,906 | $3,390,122 | 173,366 | $2,187,397 |
| Distributions reinvested | 16,986 | 213,988 | 20,105 | 253,020 |
| Repurchased | (88,583) | (1,113,463) | (198,787) | (2,494,021) |
| Net increase (decrease) | 197,309 | $2,490,647 | (5,316) | ($53,604) |
| Net increase (decrease) | 255,280 | $3,225,905 | (59,616) | ($734,203) |
Note 5
Investment transactions
Purchases and proceeds from sales or maturities of securities, other than short-term securities and obligations of the U.S. government, during the year ended August 31, 2007, aggregated $25,679,488 and $27,864,130, respectively.
The cost of investments owned on August 31, 2007, including short-term investments, for federal income tax purposes, was $97,637,058. Gross unrealized appreciation and depreciation of investments aggregated $4,737,364 and $846,136, respectively, resulting in net unrealized appreciation of $3,891,228. The difference between book basis and tax basis net unrealized appreciation of investments is attributable primarily to the tax deferral of losses on certain sales of securities.
Note 6
Reclassification of accounts
Capital accounts within the financial statements are adjusted for permanent book tax differences. These adjustments have no impact on net assets or the results of operations. Temporary book tax differences will reverse in a subsequent period.
During the year ended August 31, 2007, the Fund reclassified amounts to reflect an increase in accumulated net realized gain on investments of $125, a decrease in accumulated net investment income of $60,817 and an increase in capital paid-in of $60,692. These reclassifications are primarily attributable to certain differences in the computation of distributable income and capital gains under federal tax rules versus accounting principles generally accepted in the United States of America, for federal excise tax and amortization of premium on debt securities. The calculation of net investment income per share in the Fund’s Financial Highlights excludes these adjustments.
Massachusetts Tax-Free Income Fund
24
Auditors’ report
Report of Independent Registered Public Accounting Firm
To the Board of Trustees of John Hancock Tax-Exempt Series Fund and Shareholders of John Hancock Massachusetts Tax-Free Income Fund,
In our opinion, the accompanying statement of assets and liabilities, including the schedule of investments, and the related statements of operations and of changes in net assets and the financial highlights present fairly, in all material respects, the financial position of John Hancock Massachusetts Tax-Free Income Fund (the Fund) at August 31, 2007, and the results of its operations, the changes in its net assets and the financial highlights for the periods indicated, in conformity with accounting principles generally accepted in the United States of America. These financial statements and financial highlights (hereafter referred to as “financial statements”) are the responsibility of the Fund’s management; our responsibility is to express an opinion on these financial statements based on our audits. We conducted our audits of these financial statements in accordance with the standards of the Public Company Accounting Oversight Board (United States). Th ose standards require that we plan and perform the audits to obtain reasonable assurance about whether the financial statements are free of material misstatement. An audit includes examining, on a test basis, evidence supporting the amounts and disclosures in the financial statements, assessing the accounting principles used and significant estimates made by management, and evaluating the overall financial statement presentation. We believe that our audits, which included confirmation of securities at August 31, 2007 by correspondence with the custodian and brokers, provide a reasonable basis for our opinion.
PricewaterhouseCoopers LLP
Boston, Massachusetts
October 19, 2007
25
Tax information
Unaudited
For federal income tax purposes, the following information is furnished with respect to the distributions of the Fund, if any, paid during its taxable year ended August 31, 2007.
The Fund has designated distributions to shareholders of $65,648 as a long-term capital gain dividend.
None of the 2006 income dividends qualify for the corporate dividends-received deduction. Shareholders who are not subject to the alternative minimum tax received income dividends that are 99.79% tax-exempt. The percentage of income dividends from the Fund subject to the alternative minimum tax is 13.41% . None of the income dividends were derived from U.S. Treasury Bills.
For specific information on exception provisions in your state, consult your local state tax officer or your tax adviser. Shareholders will be mailed a 2007 U.S. Treasury Department Form 1099-DIV in January 2008. This will reflect the total of all distributions that are taxable for calendar year 2007.
26
Board Consideration of and Continuation of Investment Advisory Agreement and Subadvisory Agreement: John Hancock Massachusetts Tax-Free Income Fund
The Investment Company Act of 1940 (the 1940 Act) requires the Board of Trustees (the Board) of John Hancock Tax-Exempt Series Fund (the Trust), including a majority of the Trustees who have no direct or indirect interest in the investment advisory agreement and are not “interested persons” of the Trust, as defined in the 1940 Act (the Independent Trustees), annually to meet in person to review and consider the continuation of: (i) the investment advisory agreement (the Advisory Agreement) with John Hancock Advisers, LLC (the Adviser) and (ii) the investment subadvisory agreement (the Subadvisory Agreement) with MFC Global Investment Management (U.S.), LLC (the Subadviser) for the John Hancock Massachusetts Tax-Free Income Fund (the Fund). The Advisory Agreement and the Subadvisory Agreement are collectively referred to as the Advisory Agreements.
At meetings held on May 7 and June 4–5, 2007, the Board considered the factors and reached the conclusions described below relating to the selection of the Adviser and Subadviser and the continuation of the Advisory Agreements. During such meetings, the Board’s Contracts/Operations Committee and the Independent Trustees also met in executive sessions with their independent legal counsel.
In evaluating the Advisory Agreements, the Board, including the Contracts/Operations Committee and the Independent Trustees, reviewed a broad range of information requested for this purpose by the Independent Trustees, including: (i) the investment performance of the Fund relative to a category of relevant funds (the Category) and a peer group of comparable funds (the Peer Group) each selected by Morningstar Inc. (Morningstar), an independent provider of investment company data, for a range of periods ended December 31, 2006, (ii) advisory and other fees incurred by, and the expense ratios of, the Fund relative to a Category and a Peer Group, (iii) the advisory fees of comparable portfolios of other clients of the Adviser and the Subadviser, (iv) the Adviser’s financial results and condition, including its and certain of its affiliates’ profitability from services performed for the Fund, (v) breakpoints in the Fund’s and the Peer Group’s fees, and information about economies of scale, (vi) the Adviser’s and Subadviser’s record of compliance with applicable laws and regulations, with the Fund’s investment policies and restrictions, and with the applicable Code of Ethics, and the structure and responsibilities of the Adviser’s and Subadviser’s compliance department, (vii) the background and experience of senior management and investment professionals, and (viii) the nature, cost and character of advisory and non-investment management services provided by the Adviser and its affiliates and by the Subadviser.
The Independent Trustees considered the legal advice of independent legal counsel and relied on their own business judgment in determining the factors to be considered in evaluating the materials that were presented to them and the weight to be given to each such factor. The Board’s review and conclusions were based on a comprehensive consideration of all information presented to the Board and not the result of any single controlling factor. They principally considered performance and other information from Morningstar as of December 31, 2006. The Board also considered updated performance information provided to it by the Adviser or Subadviser at the May and June 2007 meetings. Performance and other information may be quite different as of the date of this shareholders report. The key factors considered by the Board and the conclusions reached are described below.
Nature, extent and quality of services
The Board considered the ability of the Adviser and the Subadviser, based on their resources, reputation and other attributes, to attract and retain qualified investment professionals, including research, advisory, and supervisory personnel. The Board considered the investment philosophy, research and investment decision-making processes of the Adviser and Subadviser. The Board further considered the culture of
27
compliance, resources dedicated to compliance, compliance programs and compliance records of the Adviser and Subadviser. In addition, the Board took into account the administrative and other non-advisory services provided to the Fund by the Adviser and its affiliates.
Based on the above factors, together with those referenced below, the Board concluded that, within the context of its full deliberations, the nature, extent and quality of the investment advisory services provided to the Fund by the Adviser and Subadviser supported renewal of the Advisory Agreements.
Fund performance
The Board considered the performance results for the Fund over various time periods ended December 31, 2006. The Board also considered these results in comparison to the performance of the Category, as well as the Fund’s benchmark index. Morningstar determined the Category and Peer Group for the Fund. The Board reviewed with a representative of Morningstar the methodology used by Morningstar to select the funds in the Category and the Peer Group.
The Board noted that the Fund’s performance during the 5- and 10-year periods was higher than the performance of the Peer Group and Category medians, and lower than the performance of its benchmark index, the Lehman Brothers Municipal Bond Index. The Board noted that, although generally competitive, the Fund’s performance during the 3-year period under review was lower than the performance of the Peer Group median and its benchmark index, but higher than the performance of the Category median. The Board also noted that the Fund’s more recent performance during the 1-year period was lower than the performance of the Peer Group and Category medians, and its benchmark index. The Adviser provided information to the Board regarding factors contributing to the Fund’s performance results, as well as the Adviser’s outlook and investment strategy for the near future. The Board indicated its intent to continue to monitor the Fund’s performance trends.
Investment advisory fee and subadvisory fee rates and expenses
The Board reviewed and considered the contractual investment advisory fee rate payable by the Fund to the Adviser for investment advisory services (the Advisory Agreement Rate). The Board received and considered information comparing the Advisory Agreement Rate with the advisory fees for the Peer Group. The Board noted that the Advisory Agreement Rate was equal to the median rate of the Peer Group and lower than the Category median.
The Board received and considered expense information regarding the Fund’s various components, including advisory fees, distribution and fees other than advisory and distribution fees, including transfer agent fees, custodian fees, and other miscellaneous fees (e.g., fees for accounting and legal services). The Board considered comparisons of these expenses to the Peer Group median. The Board also received and considered expense information regarding the Fund’s total operating expense ratio (Expense Ratio). The Board noted that, unlike the Fund, several funds in the Peer Group employed fee waivers or reimbursements. The Board received and considered information comparing the Expense Ratio of the Fund to that of the Peer Group and Category medians before the application of fee waivers and reimbursements (Gross Expense Ratio) and after the application of such waivers and reimbursement (Net Expen se Ratio). The Board noted that the Fund’s Gross and Net Expense Ratios were higher than the Peer Group and Category medians. The Board also noted the differences in the funds included in the Peer Group and Category, including differences in the employment of fee waivers.
The Adviser also discussed the Morningstar data and rankings, and other relevant information, for the Fund. Based on the above-referenced considerations and other factors, the Board concluded that the Fund’s overall performance and expenses supported the re-approval of the Advisory Agreements.
The Board also received information about the investment subadvisory fee rate (the Subadvisory Agreement Rate) payable by the Adviser to the Subadviser for investment subadvisory services. The Board concluded that the Subadvisory
28
Agreement Rate was fair and equitable, based on its consideration of the factors described here.
Profitability
The Board received and considered a detailed profitability analysis of the Adviser based on the Advisory Agreements, as well as on other relationships between the Fund and the Adviser and its affiliates, including the Subadviser. The Board also considered a comparison of the Adviser’s profitability to that of other similar investment advisers whose profitability information is publicly available. The Board concluded that, in light of the costs of providing investment management and other services to the Fund, the profits and other ancillary benefits reported by the Adviser were not unreasonable.
Economies of scale
The Board received and considered general information regarding economies of scale with respect to the management of the Fund, including the Fund’s ability to appropriately benefit from economies of scale under the Fund’s fee structure. The Board recognized the inherent limitations of any analysis of economies of scale, stemming largely from the Board’s understanding that most of the Adviser’s costs are not specific to individual Funds, but rather are incurred across a variety of products and services.
To the extent the Board and the Adviser were able to identify actual or potential economies of scale from Fund-specific or allocated expenses, in order to ensure that any such economies continue to be reasonably shared with the Fund as its assets increase, the Adviser and the Board agreed to continue the existing breakpoints to the Advisory Agreement Rate.
Information about services to other clients
The Board also received information about the nature, extent and quality of services and fee rates offered by the Adviser and Subadviser to their other clients, including other registered investment companies, institutional investors and separate accounts. The Board concluded that the Advisory Agreement Rate and the Subadvisory Agreement Rate were not unreasonable, taking into account fee rates offered to others by the Adviser and Subadviser, respectively, after giving effect to differences in services.
Other benefits to the Adviser
The Board received information regarding potential “fall-out” or ancillary benefits received by the Adviser and its affiliates as a result of the Adviser’s relationship with the Fund. Such benefits could include, among others, benefits directly attributable to the relationship of the Adviser with the Fund and benefits potentially derived from an increase in the business of the Adviser as a result of its relationship with the Fund (such as the ability to market to shareholders other financial products offered by the Adviser and its affiliates).
The Board also considered the effectiveness of the Adviser’s, Subadviser’s and Fund’s policies and procedures for complying with the requirements of the federal securities laws, including those relating to best execution of portfolio transactions and brokerage allocation.
Other factors and broader review
As discussed above, the Board reviewed detailed materials received from the Adviser and Subadviser as part of the annual re-approval process. The Board also regularly reviews and assesses the quality of the services that the Fund receives throughout the year. In this regard, the Board reviews reports of the Adviser at least quarterly, which include, among other things, a detailed portfolio review, detailed fund performance reports and compliance reports. In addition, the Board meets with portfolio managers and senior investment officers at various times throughout the year.
After considering the above-described factors and based on its deliberations and its evaluation of the information described above, the Board concluded that approval of the continuation of the Advisory Agreements for the Fund was in the best interest of the Fund and its shareholders. Accordingly, the Board unanimously approved the continuation of the Advisory Agreements.
29
Trustees and Officers
This chart provides information about the Trustees and Officers who oversee your John Hancock fund. Officers elected by the Trustees manage the day-to-day operations of the Fund and execute policies formulated by the Trustees.
| Independent Trustees | ||
| Name, Year of Birth | Number of | |
| Position(s) held with Fund | Trustee | John Hancock |
| Principal occupation(s) and other | of Fund | funds overseen |
| directorships during past 5 years | since1 | by Trustee |
| Ronald R. Dion, Born: 1946 | 1998 | 58 |
| Independent Chairman (since 2005); | ||
| Chairman and Chief Executive Officer, R.M. Bradley & Co., Inc.; Director, The New England Council and | ||
| Massachusetts Roundtable; Trustee, North Shore Medical Center; Director, Boston Stock Exchange; | ||
| Director, BJ’s Wholesale Club, Inc. and a corporator of the Eastern Bank; Trustee, Emmanuel College; | ||
| Director, Boston Municipal Research Bureau; Member of the Advisory Board, Carroll Graduate School | ||
| of Management at Boston College. | ||
| James F. Carlin, Born: 1940 | 2005 | 58 |
| Director and Treasurer, Alpha Analytical Laboratories, Inc. (chemical analysis) (since 1985); Part Owner | ||
| and Treasurer, Lawrence Carlin Insurance Agency, Inc. (since 1995); Part Owner and Vice President, | ||
| Mone Lawrence Carlin Insurance Agency, Inc. (until 2005); Chairman and Chief Executive Officer, | ||
| Carlin Consolidated, Inc. (management/investments) (since 1987); Trustee, Massachusetts Health and | ||
| Education Tax Exempt Trust (1993–2003). | ||
| William H. Cunningham, Born: 1944 | 2005 | 58 |
| Former Chancellor, University of Texas System, and former President, University of Texas at Austin; | ||
| Chairman and Chief Executive Officer, IBT Technologies (until 2001); Director of the following: Hire. | ||
| com (until 2004), STC Broadcasting, Inc. and Sunrise Television Corp. (until 2001), Symtx, Inc. (elec- | ||
| tronic manufacturing) (since 2001), Adorno/Rogers Technology, Inc. (until 2004), Pinnacle Foods | ||
| Corporation (until 2003), rateGenius (until 2003), Lincoln National Corporation (insurance) (since 2006), | ||
| Jefferson-Pilot Corporation (diversified life insurance company) (until 2006), New Century Equity | ||
| Holdings (formerly Billing Concepts) (until 2001), eCertain (until 2001), ClassMap.com (until 2001), Agile | ||
| Ventures (until 2001), AskRed.com (until 2001), Southwest Airlines (since 2000), Introgen (since 2000) | ||
| and Viasystems Group, Inc. (electronic manufacturer) (until 2003); Advisory Director, Interactive Bridge, | ||
| Inc. (college fundraising) (until 2001); Advisory Director, Q Investments (until 2003); Advisory Director, | ||
| JPMorgan Chase Bank (formerly Texas Commerce Bank–Austin), LIN Television (since 2002), WilTel | ||
| Communications (until 2003) and Hayes Lemmerz International, Inc. (diversified automotive parts supply | ||
| company) (since 2003). | ||
| Charles L. Ladner, 2 Born: 1938 | 2004 | 58 |
| Chairman and Trustee, Dunwoody Village, Inc. (retirement services) (until 2003); Senior Vice President | ||
| and Chief Financial Officer, UGI Corporation (public utility holding company) (retired 1998); Vice | ||
| President and Director, AmeriGas, Inc. (retired 1998); Director, AmeriGas Partners, L.P. (gas distribution) | ||
| (until 1997); Director, EnergyNorth, Inc. (until 1995); Director, Parks and History Association (until 2007). | ||
30
| Independent Trustees (continued) | ||
| Name, Year of Birth | Number of | |
| Position(s) held with Fund | Trustee | John Hancock |
| Principal occupation(s) and other | of Fund | funds overseen |
| directorships during past 5 years | since1 | by Trustee |
| John A. Moore,2 Born: 1939 | 1996 | 58 |
| President and Chief Executive Officer, Institute for Evaluating Health Risks (nonprofit institution) | ||
| (until 2001); Senior Scientist, Sciences International (health research) (until 2003); Former Assistant | ||
| Administrator and Deputy Administrator, Environmental Protection Agency; Principal, Hollyhouse | ||
| (consulting) (since 2000); Director, CIIT Center for Health Science Research (nonprofit research) | ||
| (since 2002). | ||
| Patti McGill Peterson,2 Born: 1943 | 1996 | 58 |
| Executive Director, Council for International Exchange of Scholars and Vice President, Institute of In- | ||
| ternational Education (since 1998); Senior Fellow, Cornell Institute of Public Affairs, Cornell University | ||
| (until 1998); Former President, Wells College and St. Lawrence University; Director, Niagara Mohawk | ||
| Power Corporation (until 2003); Director, Ford Foundation, International Fellowships Program | ||
| (since 2002); Director, Lois Roth Endowment (since 2002); Director, Council for International Educational | ||
| Exchange (since 2003). | ||
| Steven R. Pruchansky, Born: 1944 | 2005 | 58 |
| Chairman and Chief Executive Officer, Greenscapes of Southwest Florida, Inc. (since 2000); Director and | ||
| President, Greenscapes of Southwest Florida, Inc. (until 2000); Managing Director, JonJames, LLC (real | ||
| estate) (since 2001); Director, First Signature Bank & Trust Company (until 1991); Director, Mast Realty | ||
| Trust (until 1994); President, Maxwell Building Corp. (until 1991). | ||
| Non-Independent Trustees3 | ||
| Name, Year of Birth | Number of | |
| Position(s) held with Fund | Trustee | John Hancock |
| Principal occupation(s) and other | of Fund | funds overseen |
| directorships during past 5 years | since1 | by Trustee |
| James R. Boyle, Born: 1959 | 2005 | 263 |
| President, John Hancock Insurance Group; Executive Vice President, John Hancock Life Insurance | ||
| Company (since June 2004); Chairman and Director, John Hancock Advisers, LLC (the Adviser), John | ||
| Hancock Funds, LLC and The Berkeley Financial Group, LLC (The Berkeley Group) (holding company) | ||
| (since 2005); Senior Vice President, The Manufacturers Life Insurance Company (U.S.A.) (until 2004). | ||
31
| Principal officers who are not Trustees | |
| Name, Year of Birth | |
| Position(s) held with Fund | Officer |
| Principal occupation(s) and other | of fund |
| directorships during past 5 years | since |
| Keith F. Hartstein, Born: 1956 | 2005 |
| President and Chief Executive Officer | |
| Senior Vice President, Manulife Financial Corporation (since 2004); Director, President and Chief | |
| Executive Officer, the Adviser, The Berkeley Group and John Hancock Funds, LLC (since 2005); Director, | |
| MFC Global Investment Management (U.S.), LLC (MFC Global (U.S.)) (since 2005); Director, John | |
| Hancock Signature Services, Inc. (since 2005); President and Chief Executive Officer, John Hancock | |
| Investment Management Services, LLC (since 2006); President and Chief Executive Officer, John Hancock | |
| Funds, John Hancock Funds II, John Hancock Funds III and John Hancock Trust (since 2005); Director, | |
| Chairman and President, NM Capital Management, Inc. (since 2005); Chairman, Investment Company | |
| Institute Sales Force Marketing Committee (since 2003); Director, President and Chief Executive Officer, | |
| MFC Global (U.S.) (2005–2006); Executive Vice President, John Hancock Funds, LLC (until 2005). | |
| Thomas M. Kinzler, Born: 1955 | 2006 |
| Secretary and Chief Legal Officer | |
| Vice President and Counsel, John Hancock Life Insurance Company (U.S.A.) (since 2006); Secretary | |
| and Chief Legal Officer, John Hancock Funds and John Hancock Funds III (since 2006); Secretary, John | |
| Hancock Funds II and Assistant Secretary, John Hancock Trust (since June 2007); Vice President and | |
| Associate General Counsel, Massachusetts Mutual Life Insurance Company (1999–2006); Secretary and | |
| Chief Legal Counsel, MML Series Investment Fund (2000–2006); Secretary and Chief Legal Counsel, | |
| MassMutual Institutional Funds (2000–2004); Secretary and Chief Legal Counsel, MassMutual Select | |
| Funds and MassMutual Premier Funds (2004–2006). | |
| Francis V. Knox, Jr., Born: 1947 | 2005 |
| Chief Compliance Officer | |
| Vice President and Chief Compliance Officer, John Hancock Investment Management Services, LLC, | |
| the Adviser and MFC Global (U.S.) (since 2005); Vice President and Chief Compliance Officer, John | |
| Hancock Funds, John Hancock Funds II, John Hancock Funds III and John Hancock Trust (since 2005); | |
| Vice President and Assistant Treasurer, Fidelity Group of Funds (until 2004); Vice President and Ethics & | |
| Compliance Officer, Fidelity Investments (until 2001). | |
| Charles A. Rizzo, Born: 1957 | 2007 |
| Chief Financial Officer | |
| Chief Financial Officer, John Hancock Funds, John Hancock Funds II, John Hancock Funds III and John | |
| Hancock Trust (June 2007–Present); Assistant Treasurer, Goldman Sachs Mutual Fund Complex (reg- | |
| istered investment companies) (2005–June 2007); Vice President, Goldman Sachs (2005–June 2007); | |
| Managing Director and Treasurer of Scudder Funds, Deutsche Asset Management (2003–2005); | |
| Director, Tax and Financial Reporting, Deutsche Asset Management (2002–2003); Vice President and | |
| Treasurer, Deutsche Global Fund Services (1999–2002). | |
| Gordon M. Shone, Born: 1956 | 2006 |
| Treasurer | |
| Treasurer, John Hancock Funds (since 2006), John Hancock Funds II, John Hancock Funds III and John | |
| Hancock Trust (since 2005); Vice President and Chief Financial Officer, John Hancock Trust (2003–2005); | |
| Senior Vice President, John Hancock Life Insurance Company (U.S.A.) (since 2001); Vice President, John | |
| Hancock Investment Management Services, Inc., John Hancock Advisers, LLC (since 2006) and The | |
| Manufacturers Life Insurance Company (U.S.A.) (1998–2000). | |
32
| Principal officers who are not Trustees (continued) | |
| Name, Year of Birth | |
| Position(s) held with Fund | Officer |
| Principal occupation(s) and other | of fund |
| directorships during past 5 years | since |
| John G. Vrysen, Born: 1955 | 2005 |
| Chief Operating Officer | |
| Senior Vice President, Manulife Financial Corporation (since 2006); Director, Executive Vice President | |
| and Chief Operating Officer, the Adviser, The Berkeley Group and John Hancock Funds, LLC (June 2007– | |
| Present); Chief Operating Officer, John Hancock Funds, John Hancock Funds II, John Hancock Funds III | |
| and John Hancock Trust (June 2007–Present); Director, Executive Vice President and Chief Financial | |
| Officer, the Adviser, The Berkeley Group and John Hancock Funds, LLC (until June 2007); Executive Vice | |
| President and Chief Financial Officer, John Hancock Investment Management Services, LLC (since 2005); | |
| Vice President and Chief Financial Officer, MFC Global (U.S.) (since 2005); Director, John Hancock | |
| Signature Services, Inc. (since 2005); Chief Financial Officer, John Hancock Funds, John Hancock Funds II, | |
| John Hancock Funds III and John Hancock Trust (2005–June 2007); Vice President and General Manager, | |
| Fixed Annuities, U.S. Wealth Management (until 2005); Vice President, Operations, Manulife Wood | |
| Logan (2000–2004). The business address for all Trustees and Officers is 601 Congress Street, Boston, | |
| Massachusetts 02210-2805. | |
The Statement of Additional Information of the Fund includes additional information about members of the Board of Trustees of the Fund and is available without charge, upon request, by calling 1-800-225-5291.
1 Each Trustee serves until resignation, retirement age or until his or her successor is elected.
2 Member of Audit and Compliance Committee.
3 Non-Independent Trustee holds positions with the Fund’s investment adviser, underwriter and certain other affiliates.
33
Why John Hancock Funds?
For more than three decades, John Hancock Funds has been helping individual, corporate and institutional clients reach their most important financial goals. With so many fund companies to choose from, why should you invest with us?
► A name you know and trust
When you invest with John Hancock Funds, you are investing with one of the most recognized and respected names in the financial services industry. Our parent company has been helping individuals and institutions increase and protect wealth since 1862.
► Solutions across the investing spectrum
We offer equity, income, international, sector and asset allocation investment solutions managed by leading institutional money managers. Each of our funds utilizes a disciplined, team approach to portfolio management and research, leveraging the expertise of seasoned investment professionals.
► Committed to you
Our shareholders come first. We work hard to provide you with the products you need to build a solid financial foundation. We’re proud to offer you award-winning services and tools, like the www.jhfunds.com Web site, to help you every step of the way.
For immediate insight and answers,
turn to www.jhfunds.com
Discover the new and improved www.jhfunds.com.
■ View accounts, statements and fund information.
■ Access college and retirement planning calculators and investment education.
■ Gain investment ideas, expand your knowledge and become a more informed investor.

This is just the beginning of how much you can do.
Now is the ideal time to experience our Web site that received the following recognition in 2006:

“Best Innovation: Redesigned Web Site” by the Mutual Fund Education Alliance.

“Outstanding Web Site” by the Web Marketing Association.

“Creative excellence on the Web, Silver Award winner” by W3.
Discover convenience and comprehensive resources at one
easy-to-access location. Your financial professional can steer you to the tools that
will help you the most and enable you to transform your knowledge into action.
See how far www.jhfunds.com can take you!
For more information
The Fund’s proxy voting policies, procedures and records are available without charge, upon request:
| By phone | On the Fund’s Web site | On the SEC’s Web site |
| 1-800-225-5291 | www.jhfunds.com/proxy | www.sec.gov |
| Investment adviser | Custodian | Legal counsel |
| John Hancock Advisers, LLC | The Bank of New York | Kirkpatrick & Lockhart |
| 601 Congress Street | One Wall Street | Preston Gates Ellis LLP |
| Boston, MA 02210-2805 | New York, NY 10286 | One Lincoln Street |
| Boston, MA 02111-2950 | ||
| Subadviser | Transfer agent | |
| MFC Global Investment | John Hancock Signature | Independent registered |
| Management (U.S.), LLC | Services, Inc. | public accounting firm |
| 101 Huntington Avenue | One John Hancock Way, | PricewaterhouseCoopers LLP |
| Boston, MA 02199 | Suite 1000 | 125 High Street |
| Boston, MA 02217-1000 | Boston, MA 02110 | |
| Principal distributor | ||
| John Hancock Funds, LLC | ||
| 601 Congress Street | ||
| Boston, MA 02210-2805 | ||
| How to contact us | ||
| Internet | www.jhfunds.com | |
| Regular mail: | Express mail: | |
| John Hancock | John Hancock | |
| Signature Services, Inc. | Signature Services, Inc. | |
| One John Hancock Way, Suite 1000 | Mutual Fund Image Operations | |
| Boston, MA 02217-1000 | 380 Stuart Street | |
| Boston, MA 02116 | ||
| Phone | Customer service representatives | 1-800-225-5291 |
| EASI-Line | 1-800-338-8080 | |
| TDD line | 1-800-554-6713 | |
A listing of month-end portfolio holdings is available on our Web site, www.jhfunds.com. A more detailed portfolio holdings summary is available on a quarterly basis 60 days after the fiscal quarter on our Web site or upon request by calling 1-800-225-5291, or on the SEC’s Web site, www.sec.gov.
36
J O H N H A N C O C K F A M I L Y O F F U N D S
| EQUITY | INTERNATIONAL/GLOBAL |
| Balanced Fund | Global Opportunities Fund |
| Classic Value Fund | Global Shareholder Yield Fund |
| Classic Value Fund II | Greater China Opportunities Fund |
| Classic Value Mega Cap Fund | International Allocation Portfolio |
| Core Equity Fund | International Classic Value Fund |
| Growth Fund | International Core Fund |
| Growth Opportunities Fund | International Growth Fund |
| Growth Trends Fund | |
| Intrinsic Value Fund | INCOME |
| Large Cap Equity Fund | Bond Fund |
| Large Cap Select Fund | Government Income Fund |
| Mid Cap Equity Fund | High Yield Fund |
| Multi Cap Growth Fund | Investment Grade Bond Fund |
| Small Cap Equity Fund | Strategic Income Fund |
| Small Cap Fund | |
| Small Cap Intrinsic Value Fund | TAX-FREE INCOME |
| Sovereign Investors Fund | California Tax-Free Income Fund |
| U.S. Core Fund | High Yield Municipal Bond Fund |
| U.S. Global Leaders Growth Fund | Massachusetts Tax-Free Income Fund |
| Value Opportunities Fund | New York Tax-Free Income Fund |
| Tax-Free Bond Fund | |
| ASSET ALLOCATION | |
| Lifecycle 2010 Portfolio | MONEY MARKET |
| Lifecycle 2015 Portfolio | Money Market Fund |
| Lifecycle 2020 Portfolio | |
| Lifecycle 2025 Portfolio | CLOSED-END |
| Lifecycle 2030 Portfolio | Bank and Thrift Opportunity Fund |
| Lifecycle 2035 Portfolio | Financial Trends Fund, Inc. |
| Lifecycle 2040 Portfolio | Income Securities Trust |
| Lifecycle 2045 Portfolio | Investors Trust |
| Lifecycle Retirement Portfolio | Patriot Premium Dividend Fund II |
| Lifestyle Aggressive Portfolio | Preferred Income Fund |
| Lifestyle Balanced Portfolio | Preferred Income II Fund |
| Lifestyle Conservative Portfolio | Preferred Income III Fund |
| Lifestyle Growth Portfolio | Tax-Advantaged Dividend Income Fund |
| Lifestyle Moderate Portfolio | Tax-Advantaged Global Shareholder Yield Fund |
| SECTOR | |
| Financial Industries Fund | |
| Health Sciences Fund | |
| Real Estate Fund | |
| Regional Bank Fund | |
| Technology Fund | |
| Technology Leaders Fund | |
The Fund’s investment objectives, risks, charges and expenses are included in the prospectus and should be considered carefully before investing. For a prospectus, contact your financial professional, call John Hancock Funds at 1-800-225-5291 or visit the Fund’s Web site at www.jhfunds.com. Please read the prospectus carefully before investing or sending money.

1-800-225-5291
1-800-554-6713 TDD
1-800-338-8080 EASI-Line
www.jhfunds.com
| Now available: electronic delivery |
| www.jhfunds.com/edelivery |
| This report is for the information of the shareholders of John Hancock Massachusetts Tax-Free Income Fund. | 7700A 8/07 |
| It is not authorized for distribution to prospective investors unless preceded or accompanied by a prospectus. | 10/07 |
ITEM 2. CODE OF ETHICS.
As of the end of the period, August 31, 2007, the registrant has adopted a code of ethics, as defined in Item 2 of Form N-CSR, that applies to its Chief Executive Officer, Chief Financial Officer and Treasurer (respectively, the principal executive officer, the principal financial officer and the principal accounting officer, the “Senior Financial Officers”). A copy of the code of ethics is filed as an exhibit to this Form N-CSR.
ITEM 3. AUDIT COMMITTEE FINANCIAL EXPERT.
Charles L. Ladner is the audit committee financial expert and is “independent”, pursuant to general instructions on Form N-CSR Item 3.
ITEM 4. PRINCIPAL ACCOUNTANT FEES AND SERVICES.
(a) Audit Fees
The aggregate fees billed for professional services rendered by the principal accountant(s) for the audit of the registrant’s annual financial statements or services that are normally provided by the accountant(s) in connection with statutory and regulatory filings or engagements amounted to $35,600 for the fiscal year ended August 31, 2007 (broken out as follows: John Hancock Massachusetts Tax-Free Income Fund - $17,800 and John Hancock New York Tax-Free Income Fund - $17,800) and $35,600 for the fiscal year ended August 31, 2006 (broken out as follows: John Hancock Massachusetts Tax-Free Income Fund - $17,800 and John Hancock New York Tax-Free Income Fund - $17,800). These fees were billed to the registrant and were approved by the registrant’s audit committee.
(b) Audit-Related Services
There were no audit-related fees during the fiscal year ended August 31, 2007 and fiscal year ended August 31, 2006 billed to the registrant or to the registrant's investment adviser (not including any sub-adviser whose role is primarily portfolio management and is subcontracted with or overseen by another investment adviser), and any entity controlling, controlled by, or under common control with the adviser that provides ongoing services to the registrant ("control affiliates").
(c) Tax Fees
The aggregate fees billed for professional services rendered by the principal accountant(s) for the tax compliance, tax advice and tax planning (“tax fees”) amounted to $5,000 for the fiscal year ended August 31, 2007 (broken out as follows: John Hancock Massachusetts Tax-Free Income Fund - $2,500 and John Hancock New York Tax-Free Income Fund - $2,500) and $5,000 for the fiscal year ended August 31, 2006 (broken out as follows: John Hancock Massachusetts Tax-Free Income Fund - $2,500 and John Hancock New York Tax-Free Income Fund - $2,500). The nature of the services comprising the tax fees was the review of the registrant’s income tax returns and tax distribution requirements. These fees were billed to the registrant and were approved by the registrant’s audit committee. There were no tax fees billed to the control affiliates.
(d) All Other Fees
There were no other fees during the fiscal year ended August 31, 2007 and fiscal year ended August 31, 2006 billed to the registrant or to the control affiliates.
(e)(1) See attachment "Approval of Audit, Audit-related, Tax and Other Services", with the audit committee pre-approval policies and procedures.
(e)(2) There were no fees that were approved by the audit committee pursuant to the de minimis exception for the fiscal years ended August 31, 2007 and August 31, 2006 on behalf of the
registrant or on behalf of the control affiliates that relate directly to the operations and financial reporting of the registrant.
(f) According to the registrant’s principal accountant, for the fiscal year ended August 31, 2007, the percentage of hours spent on the audit of the registrant's financial statements for the most recent fiscal year that were attributed to work performed by persons who were not full-time, permanent employees of principal accountant was less than 50%.
(g) The aggregate non-audit fees billed by the registrant's accountant(s) for services rendered to the registrant and rendered to the registrant's control affiliates for each of the last two fiscal years of the registrant were $1,685,835 for the fiscal year ended August 31, 2007, and $438,491 for the fiscal year ended August 31, 2006.
(h) The audit committee of the registrant has considered the non-audit services provided by the registrant’s principal accountant(s) to the control affiliates and has determined that the services that were not pre-approved are compatible with maintaining the principal accountant(s)' independence.
ITEM 5. AUDIT COMMITTEE OF LISTED REGISTRANTS.
The registrant has a separately-designated standing audit committee comprised of independent trustees. The members of the audit committee are as follows:
Dr. John A. Moore - Chairman
Charles L. Ladner
Patti McGill Peterson
ITEM 6. SCHEDULE OF INVESTMENTS.
Not applicable.
ITEM 7. DISCLOSURE OF PROXY VOTING POLICIES AND PROCEDURES FOR CLOSED-END MANAGEMENT INVESTMENT COMPANIES.
Not applicable.
ITEM 8. PORTFOLIO MANAGERS OF CLOSED-END MANAGEMENT INVESTMENT COMPANIES.
Not applicable.
ITEM 9. PURCHASES OF EQUITY SECURITIES BY CLOSED-END MANAGEMENT INVESTMENT COMPANY AND AFFILIATED PURCHASERS.
Not applicable.
ITEM 10. SUBMISSION OF MATTERS TO A VOTE OF SECURITY HOLDERS.
The registrant has adopted procedures by which shareholders August recommend nominees to the registrant's Board of Trustees. A copy of the procedures is filed as an exhibit to this Form N-CSR. See attached “John Hancock Funds – Governance Committee Charter”.
ITEM 11. CONTROLS AND PROCEDURES.
(a) Based upon their evaluation of the registrant's disclosure controls and procedures as conducted within 90 days of the filing date of this Form N-CSR, the registrant's principal executive
officer and principal financial officer have concluded that those disclosure controls and procedures provide reasonable assurance that the material information required to be disclosed by the registrant on this report is recorded, processed, summarized and reported within the time periods specified in the Securities and Exchange Commission's rules and forms.
(b) There were no changes in the registrant's internal control over financial reporting that occurred during the registrant's most recent fiscal half-year (the registrant's second fiscal half-year in the case of an annual report) that have materially affected, or are reasonably likely to materially affect, the registrant's internal control over financial reporting.
ITEM 12. EXHIBITS.
(a)(1) Code of Ethics for Senior Financial Officers is attached.
(a)(2) Separate certifications for the registrant's principal executive officer and principal financial officer, as required by Section 302 of the Sarbanes-Oxley Act of 2002 and Rule 30a-2(a) under the Investment Company Act of 1940, are attached.
(b) Separate certifications for the registrant's principal executive officer and principal financial officer, as required by 18 U.S.C. Section 1350, as adopted pursuant to Section 906 of the Sarbanes-Oxley Act of 2002, and Rule 30a-2(b) under the Investment Company Act of 1940, are attached. The certifications furnished pursuant to this paragraph are not deemed to be "filed" for purposes of Section 18 of the Securities Exchange Act of 1934, or otherwise subject to the liability of that section. Such certifications are not deemed to be incorporated by reference into any filing under the Securities Act of 1933 or the Securities Exchange Act of 1934, except to the extent that the Registrant specifically incorporates them by reference.
(c)(1) Approval of Audit, Audit-related, Tax and Other Services is attached.
(c)(2) Submission of Matters to a Vote of Security Holders is attached. See attached “John Hancock Funds – Governance Committee Charter”.
(c)(3) Proxy Voting Policies and Procedures are attached.
(c)(4) Contact person at the registrant.
SIGNATURES
Pursuant to the requirements of the Securities Exchange Act of 1934 and the Investment Company Act of 1940, the registrant has duly caused this report to be signed on its behalf by the undersigned, thereunto duly authorized.
John Hancock Tax-Exempt Series Fund
By: /s/ Keith F. Hartstein
-------------------------------------
Keith F. Hartstein
President and Chief Executive Officer
Date: October 26, 2007
Pursuant to the requirements of the Securities Exchange Act of 1934 and the Investment Company Act of 1940, this report has been signed below by the following persons on behalf of the registrant and in the capacities and on the dates indicated.
By: /s/ Keith F. Hartstein
-------------------------------------
Keith F. Hartstein
President and Chief Executive Officer
Date: October 26, 2007
By: /s/ Charles A. Rizzo
-------------------------------------
Charles A. Rizzo
Chief Financial Officer
Date: October 26, 2007