| UNITED STATES | |
| SECURITIES AND EXCHANGE COMMISSION | |
| Washington, D.C. 20549 | |
| FORM N-CSR | |
| CERTIFIED SHAREHOLDER REPORT OF REGISTERED | |
| MANAGEMENT INVESTMENT COMPANIES | |
| Investment Company Act file number 811-5079 | |
| John Hancock Tax-Exempt Series Fund | |
| (Exact name of registrant as specified in charter) | |
| 601 Congress Street, Boston, Massachusetts 02210 | |
| (Address of principal executive offices) (Zip code) | |
| Salvatore Schiavone | |
| Treasurer | |
| 601 Congress Street | |
| Boston, Massachusetts 02210 | |
| (Name and address of agent for service) | |
| Registrant's telephone number, including area code: 617-663-4497 | |
| Date of fiscal year end: | May 31 |
| Date of reporting period: | November 30, 2013 |
ITEM 1. REPORTS TO STOCKHOLDERS.
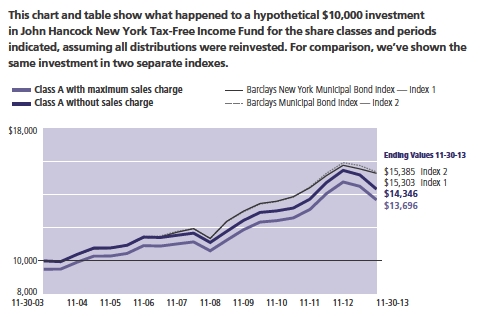
A look at performance
Total returns for the period ended November 30, 2013
| Tax- | ||||||||||||||
| Average annual total | Cumulative total | SEC 30-day | SEC 30-day | equivalent | ||||||||||
| returns (%) | returns (%) | yield (%) | yield (%) | subsidized | ||||||||||
| with maximum sales charge | with maximum sales charge | subsidized | unsubsidized1 | yield (%)2 | ||||||||||
| as of | as of | as of | ||||||||||||
| 1-year | 5-year | 10-year | 6-months | 1-year | 5-year | 10-year | 11-30-13 | 11-30-13 | 11-30-13 | |||||
| Class A | –11.45 | 4.26 | 3.20 | –9.88 | –11.45 | 23.21 | 36.96 | 2.80 | 2.65 | 5.43 | ||||
| Class B | –12.51 | 4.14 | 3.10 | –10.62 | –12.51 | 22.48 | 35.75 | 2.19 | 2.08 | 4.24 | ||||
| Class C | –8.95 | 4.48 | 2.94 | –6.91 | –8.95 | 24.49 | 33.63 | 2.18 | 2.07 | 4.22 | ||||
| Index 1† | –3.06 | 6.14 | 4.35 | –1.70 | –3.06 | 34.68 | 53.03 | — | — | — | ||||
| Index 2† | –3.51 | 6.26 | 4.40 | –2.45 | –3.51 | 35.44 | 53.85 | — | — | — | ||||
Performance figures assume all distributions have been reinvested. Figures reflect maximum sales charges on Class A shares of 4.5% and the applicable contingent deferred sales charge (CDSC) on Class B and Class C shares. The returns for Class C shares have been adjusted to reflect the elimination of the front-end sales charge, effective 7-15-04. The Class B shares’ CDSC declines annually between years 1 to 6 according to the following schedule: 5%, 4%, 3%, 3%, 2%, 1%. No sales charge will be assessed after the sixth year. Class C shares held for less than one year are subject to a 1% CDSC. Effective 2-3-14, Class A sales charges of the fund are being reduced to 4.0%.
The expense ratios of the fund, both net (including any fee waivers or expense limitations) and gross (excluding any fee waivers or expense limitations), are set forth according to the most recent publicly available prospectus for the fund and may differ from those disclosed in the Financial highlights tables in this report. The fee waivers and expense limitations are contractual at least until 9-30-14 for Class A, Class B, and Class C shares. Had the fee waivers and expense limitations not been in place, gross expenses would apply. The expense ratios are as follows:
| Class A* | Class B* | Class C* | ||||||
| Net (%) | 0.89 | 1.64 | 1.64 | |||||
| Gross (%) | 1.04 | 1.74 | 1.74 |
* The fund’s distributor has contractually agreed to waive 0.15%, 0.10%, and 0.10% of Rule 12b-1 fees for Class A, Class B, and Class C shares, respectively. The current waiver agreement will remain in effect through 9-30-14.
The returns reflect past results and should not be considered indicative of future performance. The return and principal value of an investment will fluctuate so that shares, when redeemed, may be worth more or less than their original cost. Due to market volatility, the fund’s current performance may be higher or lower than the performance shown. For current to the most recent month-end performance data, please call 800-225-5291 or visit the fund’s website at jhinvestments.com.
The performance table above and the chart on the next page do not reflect the deduction of taxes that a shareholder may pay on fund distributions or on the redemption of fund shares. Please note that a portion of the fund’s income may be subject to taxes, and on some investors may be subject to the Alternative Minimum Tax (AMT). Also note that capital gains are taxable. The fund’s performance results reflect any applicable fee waivers or expense reductions, without which the expenses would increase and results would have been less favorable.
† Index 1 is the Barclays New York Municipal Bond Index; Index 2 is the Barclays Municipal Bond Index.
See the following page for footnotes.
| 6 | New York Tax-Free Income Fund | Semiannual report |
| With maximum | Without | ||||
| Start date | sales charge | sales charge | Index 1 | Index 2 | |
| Class B3 | 11-30-03 | $13,575 | $13,575 | $15,303 | $15,385 |
| Class C3 | 11-30-03 | 13,363 | 13,363 | 15,303 | 15,385 |
Performance of the classes will vary based on the difference in sales charges paid by shareholders investing in the different classes and the fee structure of those classes.
The Class C shares investment with maximum sales charge has been adjusted to reflect the elimination of the front-end sales charge, effective 7-15-04.
Barclays New York Municipal Bond Index is an unmanaged index composed of New York investment-grade municipal bonds.
Barclays Municipal Bond Index is an unmanaged index representative of the tax-exempt bond market.
It is not possible to invest directly in an index. Index figures do not reflect expenses or sales charges, which would have resulted in lower values.
Prior to 12-14-12, the fund compared its performance solely to the Barclays Municipal Bond Index. After this date, the fund added the Barclays New York Municipal Bond Index as the primary benchmark index and retained the Barclays Municipal Bond Index as the secondary benchmark index to which the fund compares its performance to better reflect the universe of investment opportunities based on the fund’s investment strategy.
Footnotes related to performance pages
1 Unsubsidized yield reflects what the yield would have been without the effect of reimbursements and waivers.
2 Tax-equivalent yield is based on the maximum federal income tax rate of 43.4% and a state tax rate of 8.82%. Share classes will differ due to varying expenses.
3 The contingent deferred sales charge is not applicable.
| Semiannual report | New York Tax-Free Income Fund | 7 |
Your expenses
These examples are intended to help you understand your ongoing operating expenses of investing in the fund so you can compare these costs with the ongoing costs of investing in other mutual funds.
Understanding fund expenses
As a shareholder of the fund, you incur two types of costs:
▪ Transaction costs, which include sales charges (loads) on purchases or redemptions (varies by share class), minimum account fee charge, etc.
▪ Ongoing operating expenses, including management fees, distribution and service fees (if applicable), and other fund expenses.
We are going to present only your ongoing operating expenses here.
Actual expenses/actual returns
This example is intended to provide information about the fund’s actual ongoing operating expenses and is based on the fund’s actual return. It assumes an account value of $1,000.00 on June 1, 2013, with the same investment held until November 30, 2013.
| Account value | Ending value | Expenses paid during | |
| on 6-1-13 | on 11-30-13 | period ended 11-30-131 | |
| Class A | $1,000.00 | $943.70 | $4.53 |
| Class B | 1,000.00 | 940.10 | 8.17 |
| Class C | 1,000.00 | 940.10 | 8.17 |
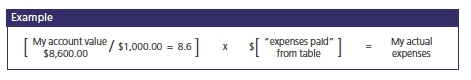
Together with the value of your account, you may use this information to estimate the operating expenses that you paid over the period. Simply divide your account value at November 30, 2013, by $1,000.00, then multiply it by the “expenses paid” for your share class from the table above. For example, for an account value of $8,600.00, the operating expenses should be calculated as follows:
| 8 | New York Tax-Free Income Fund | Semiannual report |
Hypothetical example for comparison purposes
This table allows you to compare the fund’s ongoing operating expenses with those of any other fund. It provides an example of the fund’s hypothetical account values and hypothetical expenses based on each class’s actual expense ratio and an assumed 5% annualized return before expenses (which is not the fund’s actual return). It assumes an account value of $1,000.00 on June 1, 2013, with the same investment held until November 30, 2013. Look in any other fund shareholder report to find its hypothetical example and you will be able to compare these expenses. Please remember that these hypothetical account values and expenses may not be used to estimate the actual ending account balance or expenses you paid for the period.
| Account value | Ending value | Expenses paid during | |
| on 6-1-13 | on 11-30-13 | period ended 11-30-131 | |
| Class A | $1,000.00 | $1,020.40 | $4.71 |
| Class B | 1,000.00 | 1,016.60 | 8.49 |
| Class C | 1,000.00 | 1,016.60 | 8.49 |
Remember, these examples do not include any transaction costs; therefore, these examples will not help you to determine the relative total costs of owning different funds. If transaction costs were included, your expenses would have been higher. See the prospectus for details regarding transaction costs.
1 Expenses are equal to the fund’s annualized expense ratio of 0.93%, 1.68%, and 1.68% for Class A, Class B, and Class C shares, respectively, multiplied by the average account value over the period, multiplied by 183/365 (to reflect the one-half year period).
| Semiannual report | New York Tax-Free Income Fund | 9 |
Portfolio summary
| Top 10 Holdings (33.4% of Net Assets on 11-30-13)1,2 | ||||
| Oneida County Industrial Development Agency, Zero Coupon, 7-1-29 | 4.9% | |||
| New York State Dormitory Authority, 5.500%, 5-15-19 | 4.3% | |||
| Triborough Bridge & Tunnel Authority, 6.125%, 1-1-21 | 3.4% | |||
| Metropolitan Transportation Authority, 5.000%, 11-15-34 | 3.4% | |||
| New York City Municipal Water Finance Authority, Zero Coupon, 6-15-20 | 3.2% | |||
| Upper Mohawk Valley Regional Water Finance Authority, Zero Coupon, 4-1-22 | 3.1% | |||
| Long Island Power Authority, 5.750%, 4-1-39 | 3.0% | |||
| New York State Dormitory Authority, 5.000%, 7-1-42 | 2.9% | |||
| Puerto Rico Sales Tax Financing Corp., Step Coupon, 8-1-32 | 2.7% | |||
| New York Local Assistance Corp., 5.500%, 4-1-17 | 2.5% | |||
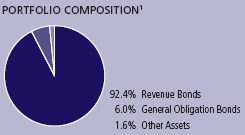
| Sector Composition1,3 | ||||
| General Obligation Bonds | 3.0% | Health Care | 7.5% | |
| Revenue Bonds | Transportation | 5.4% | ||
| Other Revenue | 27.6% | Airport | 4.0% | |
| Education | 15.5% | Pollution | 2.3% | |
| Water & Sewer | 12.3% | Tobacco | 1.7% | |
| Development | 9.6% | Other | 2.6% | |
| Utilities | 8.5% | |||
| Quality Composition1,3,4 | ||||
| AAA | 7.7% | |||
| AA | 45.2% | |||
| A | 20.9% | |||
| BBB | 13.8% | |||
| BB | 5.4% | |||
| B | 1.5% | |||
| Not Rated | 2.9% | |||
| Other | 2.6% | |||

1 As a percentage of net assets on 11-30-13.
2 Cash and cash equivalents not included.
3 Fixed-income investments are subject to interest-rate and credit risk; their value will normally decline as interest rates rise or if a creditor is unable or unwilling to make principal or interest payments. Illiquid securities may be difficult to sell at a price approximating their value. Investments in higher-yielding, lower-rated securities include a higher risk of default. Municipal bond prices can decline due to fiscal mismanagement or tax shortfalls, or if related projects become unprofitable. If the fund invests heavily in any one state or region, performance could be disproportionately affected by factors particular to that state or region. The use of hedging and derivatives could produce disproportionate gains or losses and may increase costs. Sector investing is subject to greater risks than the market as a whole. Because the fund may focus on particular sectors of the economy, its performance may depend on the performance of those sectors and investments focused in one sector may fluctuate more widely than investments diversified across sectors. Please see the fund’s prospectus for additional risks.
4 Ratings are from Moody’s Investors Service, Inc. If not available, we have used Standard & Poor’s Ratings Services. In the absence of ratings from these agencies, we have used Fitch Ratings, Inc., ratings. “Not Rated” securities are those with no ratings available from these agencies. All ratings are as of 11-30-13 and do not reflect subsequent downgrades or upgrades, if any.
| 10 | New York Tax-Free Income Fund | Semiannual report |
Fund’s investments
As of 11-30-13 (unaudited)
| Maturity | |||||
| Rate (%) | date | Par value | Value | ||
| Municipal Bonds 97.4% | $52,830,771 | ||||
| (Cost $50,874,684) | |||||
| New York 89.7% | 48,639,296 | ||||
| Brooklyn Arena Local Development Corp. | |||||
| Barclays Center Project | 6.375 | 07-15-43 | $1,000,000 | 1,053,940 | |
| Chautauqua Asset Securitization Corp. | |||||
| Tobacco Settlement | 6.750 | 07-01-40 | 1,000,000 | 916,700 | |
| City of New York, Series D-1 | 5.000 | 10-01-36 | 1,000,000 | 1,038,690 | |
| City of New York, Series E-1 | 6.250 | 10-15-28 | 500,000 | 583,045 | |
| Herkimer County Industrial | |||||
| Development Agency | |||||
| Folts Adult Home, Series A (D) | 5.500 | 03-20-40 | 935,000 | 1,032,969 | |
| Hudson Yards Infrastructure Corp. | |||||
| Series A | 5.750 | 02-15-47 | 1,000,000 | 1,066,940 | |
| Long Island Power Authority | |||||
| Electric, Power & Light Revenues, Series A | 5.750 | 04-01-39 | 1,500,000 | 1,615,333 | |
| Long Island Power Authority | |||||
| Electric, Power & Light Revenues, Series A | 6.000 | 05-01-33 | 1,000,000 | 1,124,750 | |
| Metropolitan Transportation Authority | |||||
| Transit Revenue, Series A | 5.250 | 11-15-28 | 1,000,000 | 1,082,140 | |
| Metropolitan Transportation Authority | |||||
| Transit Revenue, Series B | 5.000 | 11-15-34 | 1,750,000 | 1,818,443 | |
| Monroe County Industrial Development Corp., | |||||
| Series A | 5.000 | 07-01-41 | 1,000,000 | 1,019,560 | |
| Monroe Newpower Corp. | |||||
| Electric, Power & Light Revenues | 5.100 | 01-01-16 | 845,000 | 854,329 | |
| New York City Industrial Development Agency | |||||
| Brooklyn Navy Yard Cogeneration | |||||
| Partners AMT | 5.650 | 10-01-28 | 1,000,000 | 804,530 | |
| New York City Industrial Development Agency | |||||
| Polytechnic University Project (D) | 5.250 | 11-01-27 | 1,000,000 | 1,024,850 | |
| New York City Industrial Development Agency | |||||
| Terminal One Group Association Project | |||||
| AMT (P) | 5.500 | 01-01-21 | 1,000,000 | 1,075,930 | |
| New York City Municipal Water | |||||
| Finance Authority | |||||
| Water Revenue, Series A | 5.750 | 06-15-40 | 1,000,000 | 1,108,260 | |
| New York City Municipal Water | |||||
| Finance Authority | |||||
| Water Revenue, Series D (Z) | Zero | 06-15-20 | 2,000,000 | 1,749,360 | |
| See notes to financial statements | Semiannual report | New York Tax-Free Income Fund | 11 |
| Maturity | |||||
| Rate (%) | date | Par value | Value | ||
| New York (continued) | |||||
| New York City Municipal Water | |||||
| Finance Authority | |||||
| Water Revenue, Series FF-2 | 5.000 | 06-15-40 | $1,000,000 | $1,035,180 | |
| New York City Municipal Water | |||||
| Finance Authority | |||||
| Water Revenue, Series GG-1 | 5.000 | 06-15-39 | 1,000,000 | 1,035,680 | |
| New York City Transitional Finance Authority | |||||
| Government Fund/Grant Revenue, Series S-4 | 5.500 | 01-15-39 | 1,000,000 | 1,103,360 | |
| New York Liberty Development Corp. | |||||
| 7 World Trade Center, Class 2 | 5.000 | 09-15-43 | 1,000,000 | 1,002,620 | |
| New York Liberty Development Corp. | |||||
| Bank of America Tower, Class 2 | 5.625 | 07-15-47 | 1,000,000 | 1,056,320 | |
| New York Local Assistance Corp. | |||||
| Sales Tax Revenue, Series C | 5.500 | 04-01-17 | 1,225,000 | 1,364,589 | |
| New York State Dormitory Authority | |||||
| General Purpose, Series E | 5.000 | 02-15-35 | 1,000,000 | 1,048,850 | |
| New York State Dormitory Authority | |||||
| Mount Sinai School of Medicine | 5.125 | 07-01-39 | 1,000,000 | 1,015,720 | |
| New York State Dormitory Authority | |||||
| North Shore Long Island Jewish Group, | |||||
| Series A | 5.000 | 05-01-41 | 1,000,000 | 994,050 | |
| New York State Dormitory Authority | |||||
| Orange Regional Medical Center | 6.125 | 12-01-29 | 750,000 | 751,118 | |
| New York State Dormitory Authority | |||||
| Rockefeller University, Series A | 5.000 | 07-01-41 | 1,000,000 | 1,076,860 | |
| New York State Dormitory Authority | |||||
| Series A | 5.000 | 03-15-43 | 1,000,000 | 1,036,800 | |
| New York State Dormitory Authority | |||||
| Series B | 5.000 | 07-01-42 | 1,500,000 | 1,556,130 | |
| New York State Dormitory Authority | |||||
| State University Educational Facilities, | |||||
| Series A (D) | 5.250 | 05-15-15 | 1,000,000 | 1,034,650 | |
| New York State Dormitory Authority | |||||
| State University Educational Facilities, | |||||
| Series A | 5.500 | 05-15-19 | 2,000,000 | 2,308,780 | |
| New York State Environmental Facilities Corp. | |||||
| Water Revenue, Series A | 5.000 | 06-15-34 | 1,000,000 | 1,062,390 | |
| New York State Urban Development Corp., | |||||
| Series A–1 | 5.000 | 03-15-43 | 1,000,000 | 1,031,430 | |
| Niagara Area Development Corp. | |||||
| Covanta Energy Project, Series A AMT | 5.250 | 11-01-42 | 500,000 | 440,105 | |
| Oneida County Industrial Development Agency | |||||
| Hamilton College Project, Series A (D)(Z) | Zero | 07-01-29 | 5,330,000 | 2,675,340 | |
| Onondaga Civic Development Corp. | |||||
| St. Joseph’s Hospital Health Center | 5.000 | 07-01-42 | 1,000,000 | 836,690 | |
| Orange County Industrial Development Agency | |||||
| Arden Hill Care Center, Series C | 7.000 | 08-01-31 | 500,000 | 469,175 | |
| Port Authority of New York & New Jersey | |||||
| 5th Installment Special Project AMT | 6.750 | 10-01-19 | 1,150,000 | 1,099,228 | |
| Port Authority of New York & New Jersey | |||||
| JFK International Airport Terminal | 6.000 | 12-01-36 | 1,000,000 | 1,074,980 | |
| 12 | New York Tax-Free Income Fund | Semiannual report | See notes to financial statements |
| Maturity | |||||
| Rate (%) | date | Par value | Value | ||
| New York (continued) | |||||
| Triborough Bridge & Tunnel Authority | |||||
| Highway Revenue Tolls, Escrowed to | |||||
| Maturity, Series Y | 6.125 | 01-01-21 | $1,500,000 | $1,869,030 | |
| Upper Mohawk Valley Regional Water | |||||
| Finance Authority | |||||
| Water Revenue (D)(Z) | Zero | 04-01-22 | 2,230,000 | 1,690,452 | |
| Puerto Rico 4.8% | 2,589,005 | ||||
| Puerto Rico Sales Tax Financing Corp. | |||||
| Sales Tax Revenue, Series A (Zero coupon | |||||
| steps up to 6.750% on 8-1-16) | Zero | 08-01-32 | 2,000,000 | 1,480,040 | |
| Puerto Rico Sales Tax Financing Corp., Series C | 5.000 | 08-01-35 | 1,000,000 | 729,920 | |
| Puerto Rico Sales Tax Financing Corp., Series C | 5.375 | 08-01-38 | 500,000 | 379,045 | |
| Virgin Islands 2.0% | 1,084,010 | ||||
| Virgin Islands Public Finance Authority, Series A | 6.750 | 10-01-37 | 1,000,000 | 1,084,010 | |
| Guam 0.9% | 518,460 | ||||
| Guam Government, Series A | 5.750 | 12-01-34 | 500,000 | 518,460 | |
| Total investments (Cost $50,874,684)† 97.4% | $52,830,771 | ||||
| Other assets and liabilities, net 2.6% | $1,387,308 | ||||
| Total net assets 100.0% | $54,218,079 | ||||
The percentage shown for each investment category is the total value of the category as a percentage of the net assets of the fund.
AMT Interest earned from these securities may be considered a tax preference item for purpose of the Federal Alternative Minimum Tax.
(D) Bond is insured by one or more of these companies:
| Insurance coverage | As a % of total investments | ||
| National Public Finance Guarantee Corp. | 7.0% | ||
| Ambac Financial Group, Inc. | 3.2% | ||
| Federal Housing Administration | 2.0% | ||
| ACA Financial Guaranty Corp. | 1.9% | ||
| Total | 14.1% | ||
(P) Variable rate obligation. The coupon rate shown represents the rate at period end.
(Z) Zero coupon bonds are issued at a discount from their principal amount in lieu of paying interest periodically.
† At 11-30-13, the aggregate cost of investment securities for federal income tax purposes was $50,747,052. Net unrealized appreciation aggregated $2,083,719 of which $3,170,196 related to appreciated investment securities and $1,086,477 related to depreciated investment securities.
The fund had the following sector composition as a percentage of total net assets on 11-30-13:
| General Obligation Bonds | 3.0% | |
| Revenue Bonds | ||
| Other Revenue | 27.6% | |
| Education | 15.5% | |
| Water & Sewer | 12.3% | |
| Development | 9.6% | |
| Utilities | 8.5% | |
| Health Care | 7.5% | |
| Transportation | 5.4% | |
| Airport | 4.0% | |
| Pollution | 2.3% | |
| Tobacco | 1.7% | |
| Other | 2.6% | |
| Total | 100.0% |
| See notes to financial statements | Semiannual report | New York Tax-Free Income Fund | 13 |
F I N A N C I A L S T A T E M E N T S
Financial statements
Statement of assets and liabilities 11-30-13 (unaudited)
This Statement of assets and liabilities is the fund’s balance sheet. It shows the value of what the fund owns, is due and owes. You’ll also find the net asset value and the maximum offering price per share.
| Assets | |
| Investments, at value (Cost $50,874,684) | $52,830,771 |
| Cash | 831,014 |
| Receivable for fund shares sold | 13,910 |
| Interest receivable | 657,564 |
| Receivable from affiliates | 609 |
| Other receivables and prepaid expenses | 6,515 |
| Total assets | 54,340,383 |
| Liabilities | |
| Payable for fund shares repurchased | 59,321 |
| Distributions payable | 24,704 |
| Payable to affiliates | |
| Accounting and legal services fees | 1,132 |
| Transfer agent fees | 3,099 |
| Distribution and service fees | 6,091 |
| Trustees’ fees | 2,743 |
| Other liabilities and accrued expenses | 25,214 |
| Total liabilities | 122,304 |
| Net assets | $54,218,079 |
| Net assets consist of | |
| Paid-in capital | $52,895,086 |
| Undistributed net investment income | 58,539 |
| Accumulated net realized gain (loss) on investments | (691,633) |
| Net unrealized appreciation (depreciation) on investments | 1,956,087 |
| Net assets | $54,218,079 |
| Net asset value per share | |
| Based on net asset values and shares outstanding — the fund has an | |
| unlimited number of shares authorized with no par value | |
| Class A ($44,947,280 ÷ 3,818,233 shares)1 | $11.77 |
| Class B ($1,835,017 ÷ 155,864 shares)1 | $11.77 |
| Class C ($7,435,782 ÷ 631,540 shares)1 | $11.77 |
| Maximum offering price per share | |
| Class A (net asset value per share ÷ 95.5%)2 | $12.32 |
1 Redemption price per share is equal to the net asset value less any applicable contingent deferred sales charge.
2 On single retail sales of less than $100,000. On sales of $100,000 or more and on group sales the offering price is reduced.
| 14 | New York Tax-Free Income Fund | Semiannual report | See notes to financial statements |
F I N A N C I A L S T A T E M E N T S
Statement of operations For the six-month period ended 11-30-13
(unaudited)
This Statement of operations summarizes the fund’s investment income earned and expenses incurred in operating the fund. It also shows net gains (losses) for the period stated.
| Investment income | |
| Interest | $1,393,514 |
| Expenses | |
| Investment management fees | 145,217 |
| Distribution and service fees | 123,187 |
| Accounting and legal services fees | 5,650 |
| Transfer agent fees | 19,147 |
| Trustees’ fees | 1,410 |
| State registration fees | 3,733 |
| Printing and postage | 4,457 |
| Professional fees | 29,702 |
| Custodian fees | 6,011 |
| Registration and filing fees | 9,844 |
| Other | 4,215 |
| Total expenses | 352,573 |
| Less expense reductions | (42,611) |
| Net expenses | 309,962 |
| Net investment income | 1,083,552 |
| Realized and unrealized gain (loss) | |
| Net realized loss on investments | (813,384) |
| Change in net unrealized appreciation (depreciation) of investments | (3,942,377) |
| Net realized and unrealized loss | (4,755,761) |
| Decrease in net assets from operations | ($3,672,209) |
| See notes to financial statements | Semiannual report | New York Tax-Free Income Fund | 15 |
F I N A N C I A L S T A T E M E N T S
Statements of changes in net assets
These Statements of changes in net assets show how the value of the fund’s net assets has changed during the last two periods. The difference reflects earnings less expenses, any investment gains and losses, distributions, if any, paid to shareholders and the net of fund share transactions.
| Six months | ||
| ended | Year | |
| 11-30-13 | ended | |
| (Unaudited) | 5-31-13 | |
| Increase (decrease) in net assets | ||
| From operations | ||
| Net investment income | $1,083,552 | $2,215,046 |
| Net realized gain (loss) | (813,384) | 154,736 |
| Change in net unrealized appreciation (depreciation) | (3,942,377) | (463,629) |
| Increase (decrease) in net assets resulting from operations | (3,672,209) | 1,906,153 |
| Distributions to shareholders | ||
| From net investment income | ||
| Class A | (932,300) | (1,868,234) |
| Class B | (32,134) | (62,518) |
| Class C | (129,947) | (273,301) |
| From net realized gain | ||
| Class A | — | (173,051) |
| Class B | — | (7,277) |
| Class C | — | (33,390) |
| Total distributions | (1,094,381) | (2,417,771) |
| From fund share transactions | (5,962,773) | 1,196,453 |
| Total increase (decrease) | (10,729,363) | 684,835 |
| Net assets | ||
| Beginning of period | 64,947,442 | 64,262,607 |
| End of period | $54,218,079 | $64,947,442 |
| Undistributed net investment income | $58,539 | $69,368 |
| 16 | New York Tax-Free Income Fund | Semiannual report | See notes to financial statements |
Financial highlights
The Financial highlights show how the fund’s net asset value for a share has changed during the period.
| CLASS A SHARES | |||||||
| Period ended | 11-30-131 | 5-31-13 | 5-31-12 | 5-31-11 | 5-31-10 | 5-31-092 | 8-31-08 |
| Per share operating performance | |||||||
| Net asset value, beginning | |||||||
| of period | $12.72 | $12.82 | $11.94 | $12.20 | $11.60 | $11.96 | $12.03 |
| Net investment income3 | 0.23 | 0.46 | 0.48 | 0.52 | 0.51 | 0.38 | 0.51 |
| Net realized and unrealized gain | |||||||
| (loss) on investments | (0.95) | (0.06) | 0.89 | (0.28) | 0.60 | (0.36) | (0.07) |
| Total from | |||||||
| investment operations | (0.72) | 0.40 | 1.37 | 0.24 | 1.11 | 0.02 | 0.44 |
| Less distributions | |||||||
| From net investment income | (0.23) | (0.46) | (0.48) | (0.50) | (0.51) | (0.38) | (0.51) |
| From net realized gain | — | (0.04) | (0.01) | — | — | — | — |
| Total distributions | (0.23) | (0.50) | (0.49) | (0.50) | (0.51) | (0.38) | (0.51) |
| Net asset value, end of period | $11.77 | $12.72 | $12.82 | $11.94 | $12.20 | $11.60 | $11.96 |
| Total return (%)4,5 | (5.63)6 | 3.11 | 11.71 | 2.04 | 9.71 | 0.286 | 3.73 |
| Ratios and supplemental data | |||||||
| Net assets, end of period | |||||||
| (in millions) | $45 | $53 | $53 | $50 | $54 | $46 | $44 |
| Ratios (as a percentage of | |||||||
| average net assets): | |||||||
| Expenses before reductions | 1.097 | 1.04 | 1.06 | 1.08 | 1.10 | 1.197,8 | 1.04 |
| Expenses net of fee waivers | 0.937 | 0.89 | 0.93 | 0.96 | 1.10 | 1.197,8 | 1.04 |
| Net investment income | 3.867 | 3.53 | 3.92 | 4.31 | 4.27 | 4.507 | 4.28 |
| Portfolio turnover (%) | 3 | 8 | 16 | 9 | 7 | 22 | 25 |
1 Six months ended 11-30-13. Unaudited.
2 For the nine-month period ended 5-31-09. The fund changed its fiscal year end from August 31 to May 31.
3 Based on the average daily shares outstanding.
4 Does not reflect the effect of sales charges, if any.
5 Total returns would have been lower had certain expenses not been reduced during the applicable periods.
6 Not annualized.
7 Annualized.
8 Includes proxy fees. The impact of this expense to the gross and net expense ratios was 0.04%.
| See notes to financial statements | Semiannual report | New York Tax-Free Income Fund | 17 |
| CLASS B SHARES | |||||||
| Period ended | 11-30-131 | 5-31-13 | 5-31-12 | 5-31-11 | 5-31-10 | 5-31-092 | 8-31-08 |
| Per share operating performance | |||||||
| Net asset value, beginning | |||||||
| of period | $12.72 | $12.82 | $11.94 | $12.21 | $11.60 | $11.96 | $12.03 |
| Net investment income3 | 0.19 | 0.36 | 0.39 | 0.43 | 0.42 | 0.32 | 0.43 |
| Net realized and unrealized gain | |||||||
| (loss) on investments | (0.95) | (0.06) | 0.89 | (0.28) | 0.61 | (0.36) | (0.07) |
| Total from | |||||||
| investment operations | (0.76) | 0.30 | 1.28 | 0.15 | 1.03 | (0.04) | 0.36 |
| Less distributions | |||||||
| From net investment income | (0.19) | (0.36) | (0.39) | (0.42) | (0.42) | (0.32) | (0.43) |
| From net realized gain | — | (0.04) | (0.01) | — | — | — | — |
| Total distributions | (0.19) | (0.40) | (0.40) | (0.42) | (0.42) | (0.32) | (0.43) |
| Net asset value, end of period | $11.77 | $12.72 | $12.82 | $11.94 | $12.21 | $11.60 | $11.96 |
| Total return (%)4,5 | (5.99)6 | 2.34 | 10.90 | 1.25 | 9.03 | (0.24)6 | 3.01 |
| Ratios and supplemental data | |||||||
| Net assets, end of period | |||||||
| (in millions) | $2 | $2 | $2 | $2 | $3 | $6 | $8 |
| Ratios (as a percentage of | |||||||
| average net assets): | |||||||
| Expenses before reductions | 1.797 | 1.74 | 1.76 | 1.77 | 1.80 | 1.897,8 | 1.74 |
| Expenses net of fee waivers | 1.687 | 1.64 | 1.66 | 1.66 | 1.80 | 1.897,8 | 1.74 |
| Net investment income | 3.117 | 2.78 | 3.18 | 3.59 | 3.57 | 3.807 | 3.57 |
| Portfolio turnover (%) | 3 | 8 | 16 | 9 | 7 | 22 | 25 |
1 Six months ended 11-30-13. Unaudited.
2 For the nine-month period ended 5-31-09. The fund changed its fiscal year end from August 31 to May 31.
3 Based on the average daily shares outstanding.
4 Does not reflect the effect of sales charges, if any.
5 Total returns would have been lower had certain expenses not been reduced during the applicable periods.
6 Not annualized.
7 Annualized.
8 Includes proxy fees. The impact of this expense to the gross and net expense ratios was 0.04%.
| 18 | New York Tax-Free Income Fund | Semiannual report | See notes to financial statements |
| CLASS C SHARES | |||||||
| Period ended | 11-30-131 | 5-31-13 | 5-31-12 | 5-31-11 | 5-31-10 | 5-31-092 | 8-31-08 |
| Per share operating performance | |||||||
| Net asset value, beginning | |||||||
| of period | $12.72 | $12.82 | $11.94 | $12.21 | $11.60 | $11.96 | $12.03 |
| Net investment income3 | 0.19 | 0.36 | 0.39 | 0.43 | 0.43 | 0.32 | 0.43 |
| Net realized and unrealized gain | |||||||
| (loss) on investments | (0.95) | (0.06) | 0.89 | (0.28) | 0.60 | (0.36) | (0.07) |
| Total from | |||||||
| investment operations | (0.76) | 0.30 | 1.28 | 0.15 | 1.03 | (0.04) | 0.36 |
| Less distributions | |||||||
| From net investment income | (0.19) | (0.36) | (0.39) | (0.42) | (0.42) | (0.32) | (0.43) |
| From net realized gain | — | (0.04) | (0.01) | — | — | — | — |
| Total distributions | (0.19) | (0.40) | (0.40) | (0.42) | (0.42) | (0.32) | (0.43) |
| Net asset value, end of period | $11.77 | $12.72 | $12.82 | $11.94 | $12.21 | $11.60 | $11.96 |
| Total return (%)4,5 | (5.99)6 | 2.34 | 10.90 | 1.25 | 9.04 | (0.24)6 | 3.01 |
| Ratios and supplemental data | |||||||
| Net assets, end of period | |||||||
| (in millions) | $7 | $10 | $9 | $8 | $8 | $6 | $3 |
| Ratios (as a percentage of | |||||||
| average net assets): | |||||||
| Expenses before reductions | 1.797 | 1.74 | 1.76 | 1.78 | 1.80 | 1.897,8 | 1.74 |
| Expenses net of fee waivers | 1.687 | 1.64 | 1.66 | 1.66 | 1.80 | 1.897,8 | 1.74 |
| Net investment income | 3.117 | 2.78 | 3.19 | 3.61 | 3.56 | 3.797 | 3.57 |
| Portfolio turnover (%) | 3 | 8 | 16 | 9 | 7 | 22 | 25 |
1 Six months ended 11-30-13. Unaudited.
2 For the nine-month period ended 5-31-09. The fund changed its fiscal year end from August 31 to May 31.
3 Based on the average daily shares outstanding.
4 Does not reflect the effect of sales charges, if any.
5 Total returns would have been lower had certain expenses not been reduced during the applicable periods.
6 Not annualized.
7 Annualized.
8 Includes proxy fees. The impact of this expense to the gross and net expense ratios was 0.04%.
| See notes to financial statements | Semiannual report | New York Tax-Free Income Fund | 19 |
Notes to financial statements
(unaudited)
Note 1 — Organization
John Hancock New York Tax-Free Income Fund (the fund) is a series of John Hancock Tax-Exempt Series Fund (the Trust), an open-end management investment company organized as a Massachusetts business trust and registered under the Investment Company Act of 1940, as amended (the 1940 Act). The investment objective of the fund is to seek a high level of current income, consistent with preservation of capital, that is exempt from federal, New York State, and New York City personal income taxes.
The fund may offer multiple classes of shares. The shares currently offered are detailed in the Statement of assets and liabilities. Class A and Class C shares are offered to all investors. Class B shares are closed to new investors. Shareholders of each class have exclusive voting rights to matters that affect that class. The distribution and service fees, if any, and transfer agent fees for each class may differ. Class B shares convert to Class A shares eight years after purchase.
Note 2 — Significant accounting policies
The financial statements have been prepared in conformity with accounting principles generally accepted in the United States of America, which require management to make certain estimates and assumptions as of the date of the financial statements. Actual results could differ from those estimates and those differences could be significant. Events or transactions occurring after the end of the fiscal period through the date that the financial statements were issued have been evaluated in the preparation of the financial statements. The following summarizes the significant accounting policies of the fund:
Security valuation. Investments are stated at value as of the close of regular trading on the New York Stock Exchange (NYSE), normally at 4:00 P.M., Eastern Time. In order to value the securities, the fund uses the following valuation techniques: Debt obligations are valued based on the evaluated prices provided by an independent pricing service, which utilizes both dealer-supplied and electronic data processing techniques, taking into account factors such as institutional-size trading in similar groups of securities, yield, quality, coupon rate, maturity, type of issue, trading characteristics and other market data. Certain securities traded only in the over-the-counter (OTC) market are valued at the last bid price quoted by brokers making markets in the securities at the close of trading. Other portfolio securities and assets, for which reliable market quotations are not readily available, are valued at fair value as determined in good faith by the fund’s Pricing Committee following procedures established by the Board of Trustees. The frequency with which these fair valuation procedures are used cannot be predicted and fair value of securities may differ significantly from the value that would have been used had a ready market for such securities existed.
The fund uses a three-tier hierarchy to prioritize the pricing assumptions, referred to as inputs, used in valuation techniques to measure fair value. Level 1 includes securities valued using quoted prices in active markets for identical securities. Level 2 includes securities valued using other significant observable inputs. Observable inputs may include quoted prices for similar securities, interest rates, prepayment speeds and credit risk. Prices for securities valued using these inputs are received from independent pricing vendors and brokers and are based on an evaluation of the inputs described. Level 3 includes securities valued using significant unobservable inputs when market prices are not readily available or reliable, including the fund’s own assumptions in determining the fair value of investments. Factors used in determining value may include market or issuer specific events or trends, changes in interest rates and credit quality. The inputs or methodology used for valuing
| 20 | New York Tax-Free Income Fund | Semiannual report |
securities are not necessarily an indication of the risks associated with investing in those securities. Changes in valuation techniques may result in transfers into or out of an assigned level within the disclosure hierarchy.
As of November 30, 2013, all investments are categorized as Level 2 under the hierarchy described above.
Security transactions and related investment income. Investment security transactions are accounted for on a trade date plus one basis for daily net asset value calculations. However, for financial reporting purposes, investment transactions are reported on trade date. Interest income is accrued as earned. Interest income includes coupon interest and amortization/accretion of premiums/discounts on debt securities. Debt obligations may be placed in a non-accrual status and related interest income may be reduced by stopping current accruals and writing off interest receivable when the collection of all or a portion of interest has become doubtful. Gains and losses on securities sold are determined on the basis of identified cost and may include proceeds from litigation.
Line of credit. The fund may borrow from banks for temporary or emergency purposes, including meeting redemption requests that otherwise might require the untimely sale of securities. Pursuant to the fund’s custodian agreement, the custodian may loan money to the fund to make properly authorized payments. The fund is obligated to repay the custodian for any overdraft, including any related costs or expenses. The custodian may have a lien, security interest or security entitlement in any fund property that is not otherwise segregated or pledged, to the maximum extent permitted by law, to the extent of any overdraft.
In addition, the fund and other affiliated funds have entered into an agreement with Citibank N.A. that enables them to potentially participate in a $300 million unsecured committed line of credit. A commitment fee, payable at the end of each calendar quarter, based on the average daily unused portion of the line of credit, is charged to each participating fund on a pro rata basis and is reflected in other expenses on the Statement of operations. Commitment fees for the six months ended November 30, 2013 were $334. For the six months ended November 30, 2013, the fund had no borrowings under the line of credit.
Expenses. Within the John Hancock funds complex, expenses that are directly attributable to an individual fund are allocated to such fund. Expenses that are not readily attributable to a specific fund are allocated among all funds in an equitable manner, taking into consideration, among other things, the nature and type of expense and the fund’s relative net assets. Expense estimates are accrued in the period to which they relate and adjustments are made when actual amounts are known.
Class allocations. Income, common expenses and realized and unrealized gains (losses) are determined at the fund level and allocated daily to each class of shares based on the net assets of the class. Class-specific expenses, such as distribution and service fees, if any, and transfer agent fees, are calculated daily for each class, based on the net asset value of the class and the applicable specific expense rates.
Federal income taxes. The fund intends to continue to qualify as a regulated investment company by complying with the applicable provisions of the Internal Revenue Code and will not be subject to federal income tax on taxable income that is distributed to shareholders. Therefore, no federal income tax provision is required.
As of May 31, 2013, the fund had no uncertain tax positions that would require financial statement recognition, derecognition or disclosure. The fund’s federal tax returns are subject to examination by the Internal Revenue Service for a period of three years.
| Semiannual report | New York Tax-Free Income Fund | 21 |
Distribution of income and gains. Distributions to shareholders from net investment income and net realized gains, if any, are recorded on the ex-date. The fund generally declares dividends daily and pays them monthly. Capital gains distributions, if any, are distributed at least annually.
Distributions paid by the fund with respect to each class of shares are calculated in the same manner, at the same time and in the same amount, except for the effect of class level expenses that may be applied differently to each class.
Such distributions, on a tax basis, are determined in conformity with income tax regulations, which may differ from accounting principles generally accepted in the United States of America.
Capital accounts within the financial statements are adjusted for permanent book-tax differences. These adjustments have no impact on net assets or the results of operations. Temporary book-tax differences, if any, will reverse in a subsequent period. Book-tax differences are primarily attributable to distributions payable and accretion on debt securities.
Note 3 — Guarantees and indemnifications
Under the Trust’s organizational documents, its Officers and Trustees are indemnified against certain liabilities arising out of the performance of their duties to the Trust, including the fund. Additionally, in the normal course of business, the fund enters into contracts with service providers that contain general indemnification clauses. The fund’s maximum exposure under these arrangements is unknown, as this would involve future claims that may be made against the fund that have not yet occurred. The risk of material loss from such claims is considered remote.
Note 4 — Fees and transactions with affiliates
John Hancock Advisers, LLC (the Advisor) serves as investment advisor for the fund. John Hancock Funds, LLC (the Distributor), an affiliate of the Advisor, serves as principal underwriter of the fund. The Advisor and the Distributor are indirect, wholly owned subsidiaries of Manulife Financial Corporation (MFC).
Management fee. The fund has an investment management agreement with the Advisor under which the fund pays a daily management fee to the Advisor equivalent, on an annual basis, to the sum of: (a) 0.500% of the first $250,000,000 of the fund’s average daily net assets, (b) 0.450% of the next $250,000,000 of the fund’s average daily net assets, (c) 0.425% of the next $500,000,000 of the fund��s average daily net assets, (d) 0.400% of the next $250,000,000 of the fund’s average daily net assets, and (e) 0.300% of the fund’s average daily net assets in excess of $1,250,000,000. The Advisor has a subadvisory agreement with John Hancock Asset Management a division of Manulife Asset Management (US) LLC, an indirectly owned subsidiary of MFC and an affiliate of the Advisor. The fund is not responsible for payment of the subadvisory fees.
Effective June 1, 2013, the Advisor has contractually agreed to waive a portion of its management fee and/or reimburse expenses for certain funds of the John Hancock funds complex, including the fund (the participating portfolios). The waiver equals, on an annualized basis, 0.01% of that portion of the aggregate net assets of all the participating portfolios that exceeds $75 billion but is less than or equal to $125 billion; 0.0125% of that portion of the aggregate net assets of all the participating portfolios that exceeds $125 billion but is less than or equal to $150 billion; and 0.015% of that portion of the aggregate net assets of all the participating portfolios that exceeds $150 billion. The amount of the reimbursement is calculated daily and allocated among all the participating portfolios in proportion to the daily net assets of each fund. This arrangement may be amended or terminated at any time by the advisor upon notice to the funds and with the approval of the Board of Trustees.
| 22 | New York Tax-Free Income Fund | Semiannual report |
Accordingly, for the six months ended November 30, 2013 these expense reductions amounted to $1,334, $57 and $230 for Class A, Class B, and Class C shares, respectively.
The investment management fees incurred for the six months ended November 30, 2013 were equivalent to a net annual effective rate of 0.49% of the fund’s average daily net assets.
Accounting and legal services. Pursuant to a service agreement, the fund reimburses the Advisor for all expenses associated with providing the administrative, financial, legal, accounting and recordkeeping services to the fund, including the preparation of all tax returns, periodic reports to shareholders and regulatory reports, among other services. These expenses are allocated to each share class based on its relative net assets at the time the expense was incurred. These accounting and legal services fees incurred for the six months ended November 30, 2013 amounted to an annual rate of 0.02% of the fund’s average daily net assets.
Distribution and service plans. The fund has a distribution agreement with the Distributor. The fund has adopted distribution and service plans with respect to Class A, Class B, and Class C shares pursuant to Rule 12b-1 under the 1940 Act, to pay the Distributor for services provided as the distributor of shares of the fund. The fund pays the following contractual rates of distribution and service fees under these arrangements, expressed as an annual percentage of average daily net assets for each class of the fund’s shares.
| CLASS | 12b–1 FEE | ||||
| Class A | 0.30% | ||||
| Class B | 1.00% | ||||
| Class C | 1.00% | ||||
The fund’s Distributor has contractually agreed to waive 0.15% of Rule 12b-1 fees for Class A shares and 0.10% of Rule 12b-1 fees for Class B and Class C shares. The current waiver agreement expires on September 30, 2014, unless renewed by mutual agreement of the fund and the Distributor based upon a determination that this is appropriate under the circumstances at that time.
Accordingly, these fee limitations amounted to $35,839, $1,022 and $4,129 for Class A, Class B, and Class C shares, respectively, for the six months ended November 30, 2013.
Sales charges. Class A shares are assessed up-front sales charges, which resulted in payments to the Distributor amounting to $27,281 for the six months ended November 30, 2013. Of this amount, $4,075 was retained and used for printing prospectuses, advertising, sales literature and other purposes, $22,332 was paid as sales commissions to broker-dealers and $874 was paid as sales commissions to sales personnel of Signator Investors, Inc., a broker-dealer affiliate of the Advisor.
Class A, Class B, and Class C shares may be subject to contingent deferred sales charges (CDSCs). Certain Class A shares that are acquired through purchases of $1 million or more and are redeemed within one year of purchase are subject to a 1.00% sales charge. Class B shares that are redeemed within six years of purchase are subject to CDSCs, at declining rates, beginning at 5.00%. Class C shares that are redeemed within one year of purchase are subject to a 1.00% CDSC. CDSCs are applied to the lesser of the current market value at the time of redemption or the original purchase cost of the shares being redeemed. Proceeds from CDSCs are used to compensate the Distributor for providing distribution-related services in connection with the sale of these shares. During the six months ended November 30, 2013, CDSCs received by the Distributor amounted to $0, $2,566, and $1,086 for Class A, Class B, and Class C shares, respectively.
Transfer agent fees. The fund has a transfer agent agreement with John Hancock Signature Services, Inc. (Signature Services), an affiliate of the Advisor. The transfer agent fees paid to Signature Services are determined based on the cost to Signature Services (Signature Services Cost)
| Semiannual report | New York Tax-Free Income Fund | 23 |
of providing recordkeeping services. The Signature Services Cost includes a component of allocated John Hancock corporate overhead for providing transfer agent services to the fund and to all other John Hancock affiliated funds. It also includes out-of-pocket expenses, including payments made to third-parties for recordkeeping services provided to their clients who invest in one or more John Hancock funds. In addition, Signature Services Cost may be reduced by certain fees that Signature Services receives in connection with retirement and small accounts. Signature Services Cost is calculated monthly and allocated, as applicable, to five categories of share classes: Retail Share and Institutional Classes of Non-Municipal Bond Funds, Class R6 Shares, Retirement Share Classes and Municipal Bond Share Classes. Within each of these categories, the applicable costs are allocated to the affected John Hancock affiliated funds and/or classes, based on the relative average daily net assets.
Prior to October 1, 2013, Signature Services Cost were calculated monthly and allocated, as applicable, to four categories of share classes: Institutional Share Classes, Retirement Share Classes, Municipal Bond Share Classes and all other retail share classes. Within each of these categories, the applicable costs were allocated to the affected John Hancock affiliated funds and/or classes, based on the relative average daily net assets.
Class level expenses. Class level expenses for the six months ended November 30, 2013 were:
| DISTRIBUTION AND | TRANSFER | ||||
| CLASS | SERVICE FEES | AGENT FEES | |||
| Class A | $71,678 | $15,755 | |||
| Class B | $10,217 | $674 | |||
| Class C | $41,292 | $2,718 | |||
| Total | $123,187 | $19,147 | |||
Trustee expenses. The fund compensates each Trustee who is not an employee of the Advisor or its affiliates. The costs of paying Trustee compensation and expenses are allocated to each fund based on its net assets relative to other funds within the John Hancock funds complex.
Note 5 — Fund share transactions
Transactions in fund shares for the six months ended November 30, 2013 and for the year ended May 31, 2013 were as follows:
| Six months ended 11-30-13 | Year ended 5-31-13 | |||
| Shares | Amount | Shares | Amount | |
| Class A shares | ||||
| Sold | 92,180 | $1,102,739 | 578,225 | $7,472,175 |
| Distributions reinvested | 67,632 | 803,032 | 136,227 | 1,760,207 |
| Repurchased | (497,957) | (5,930,006) | (690,645) | (8,948,446) |
| Net increase (decrease) | (338,145) | ($4,024,235) | 23,807 | $283,936 |
| Class B shares | ||||
| Sold | 728 | $8,974 | 57,293 | $742,493 |
| Distributions reinvested | 2,001 | 23,755 | 4,095 | 52,928 |
| Repurchased | (24,832) | (293,468) | (50,809) | (656,479) |
| Net increase (decrease) | (22,103) | ($260,739) | 10,579 | $138,942 |
| 24 | New York Tax-Free Income Fund | Semiannual report |
| Six months ended 11-30-13 | Year ended 5-31-13 | |||
| Shares | Amount | Shares | Amount | |
| Class C shares | ||||
| Sold | 30,033 | $359,277 | 201,474 | $2,606,705 |
| Distributions reinvested | 9,309 | 110,588 | 20,488 | 264,805 |
| Repurchased | (179,693) | (2,147,664) | (162,435) | (2,097,935) |
| Net increase (decrease) | (140,351) | ($1,677,799) | 59,527 | $773,575 |
| Total net increase (decrease) | (500,599) | ($5,962,773) | 93,913 | $1,196,453 |
Note 6 — Purchase and sale of securities
Purchases and sales of securities, other than short-term securities, amounted to $1,530,960 and $7,421,484, respectively, for the six months ended November 30, 2013.
| Semiannual report | New York Tax-Free Income Fund | 25 |
More information
| Trustees | Investment advisor |
| James M. Oates, Chairperson | John Hancock Advisers, LLC |
| Steven R. Pruchansky, Vice Chairperson | |
| Charles L. Bardelis* | Subadvisor |
| James R. Boyle† | John Hancock Asset Management a division of |
| Craig Bromley† | Manulife Asset Management (US) LLC |
| Peter S. Burgess* | |
| William H. Cunningham | Principal distributor |
| Grace K. Fey | John Hancock Funds, LLC |
| Theron S. Hoffman* | |
| Deborah C. Jackson | Custodian |
| Hassell H. McClellan | State Street Bank and Trust Company |
| Gregory A. Russo | |
| Warren A. Thomson† | Transfer agent |
| John Hancock Signature Services, Inc. | |
| Officers | |
| Hugh McHaffie | Legal counsel |
| President | K&L Gates LLP |
| Andrew G. Arnott | |
| Executive Vice President | |
| Thomas M. Kinzler | |
| Secretary and Chief Legal Officer | |
| Francis V. Knox, Jr. | |
| Chief Compliance Officer | |
| Charles A. Rizzo | |
| Chief Financial Officer | |
| Salvatore Schiavone | |
| Treasurer | |
| *Member of the Audit Committee | |
| †Non-Independent Trustee | |
The fund’s proxy voting policies and procedures, as well as the fund’s proxy voting record for the most recent twelve-month period ended June 30, are available free of charge on the Securities and Exchange Commission (SEC) website at sec.gov or on our website.
The fund’s complete list of portfolio holdings, for the first and third fiscal quarters, is filed with the SEC on Form N-Q. The fund’s Form N-Q is available on our website and the SEC’s website, sec.gov, and can be reviewed and copied (for a fee) at the SEC’s Public Reference Room in Washington, DC. Call 800-SEC-0330 to receive information on the operation of the SEC’s Public Reference Room.
We make this information on your fund, as well as monthly portfolio holdings, and other fund details available on our website at jhinvestments.com or by calling 800-225-5291.
| You can also contact us: | ||
| 800-225-5291 | Regular mail: | Express mail: |
| jhinvestments.com | Investment Operations | Investment Operations |
| John Hancock Signature Services, Inc. | John Hancock Signature Services, Inc. | |
| P.O. Box 55913 | 30 Dan Road | |
| Boston, MA 02205-5913 | Canton, MA 02021 |
| 26 | New York Tax-Free Income Fund | Semiannual report |

800-225-5291
800-338-8080 EASI-Line
jhinvestments.com

| This report is for the information of the shareholders of John Hancock New York Tax-Free Income Fund. | |
| It is not authorized for distribution to prospective investors unless preceded or accompanied by a prospectus. | 76SA 11/13 |
| MF167890 | 1/14 |
A look at performance
Total returns for the period ended November 30, 2013
| Tax- | ||||||||||
| Average annual total | Cumulative total | SEC 30-day | SEC 30-day | equivalent | ||||||
| returns (%) | returns (%) | yield (%) | yield (%) | subsidized | ||||||
| with maximum sales charge | with maximum sales charge | subsidized | unsubsidized1 | yield (%)2 | ||||||
| as of | as of | as of | ||||||||
| 1-year | 5-year | 10-year | 6-months | 1-year | 5-year | 10-year | 11-30-13 | 11-30-13 | 11-30-13 | |
| Class A | –12.72 | 3.94 | 2.98 | –10.49 | –12.72 | 21.30 | 34.18 | 2.96 | 2.81 | 5.52 |
| Class B | –13.68 | 3.81 | 2.88 | –11.23 | –13.68 | 20.54 | 32.84 | 2.35 | 2.25 | 4.38 |
| Class C | –10.15 | 4.15 | 2.73 | –7.55 | –10.15 | 22.54 | 30.87 | 2.35 | 2.25 | 4.38 |
| Index 1† | –3.52 | 5.84 | 4.43 | –1.74 | –3.52 | 32.84 | 54.32 | — | — | — |
| Index 2† | –3.51 | 6.26 | 4.40 | –2.45 | –3.51 | 35.44 | 53.85 | — | — | — |
Performance figures assume all distributions have been reinvested. Figures reflect maximum sales charges on Class A shares of 4.5% and the applicable contingent deferred sales charge (CDSC) on Class B and Class C shares. The returns for Class C shares have been adjusted to reflect the elimination of the front-end sales charge, effective 7-15-04. The Class B shares’ CDSC declines annually between years 1 to 6 according to the following schedule: 5%, 4%, 3%, 3%, 2%, 1%. No sales charge will be assessed after the sixth year. Class C shares held for less than one year are subject to a 1% CDSC. Effective 2-3-14, Class A sales charges of the fund are being reduced to 4.0%.
The expense ratios of the fund, both net (including any fee waivers or expense limitations) and gross (excluding any fee waivers or expense limitations), are set forth according to the most recent publicly available prospectus for the fund and may differ from those disclosed in the Financial highlights tables in this report. Had the fee waivers and expense limitations not been in place, gross expenses would apply. The expense ratios are as follows:
| Class A* | Class B* | Class C* | ||||||||
| Net (%) | 0.83 | 1.58 | 1.58 | |||||||
| Gross (%) | 0.98 | 1.68 | 1.68 |
* The fund’s distributor has contractually agreed to waive 0.15% of Rule 12b-1 fees for Class A shares and 0.10% of Rule 12b-1 fees for Class B and Class C shares. The current waiver agreement expires on 9-30-14.
The returns reflect past results and should not be considered indicative of future performance. The return and principal value of an investment will fluctuate so that shares, when redeemed, may be worth more or less than their original cost. Due to market volatility, the fund’s current performance may be higher or lower than the performance shown. For current to the most recent month-end performance data, please call 800-225-5291 or visit the fund’s website at jhinvestments.com.
The performance table above and the chart on the next page do not reflect the deduction of taxes that a shareholder may pay on fund distributions or on the redemption of fund shares. Please note that a portion of the fund’s income may be subject to taxes, and some investors may be subject to the Alternative Minimum Tax (AMT). Also note that capital gains are taxable. The fund’s performance results reflect any applicable fee waivers or expense reductions, without which the expenses would increase and results would have been less favorable.
† Index 1 is the Barclays Massachusetts Municipal Bond Index; Index 2 is the Barclays Municipal Bond Index.
See the following page for footnotes.
| 6 | Massachusetts Tax-Free Income Fund | Semiannual report |

| With maximum | Without | ||||
| Start date | sales charge | sales charge | Index 1 | Index 2 | |
| Class B3 | 11-30-03 | $13,284 | $13,284 | $15,432 | $15,385 |
| Class C3 | 11-30-03 | 13,087 | 13,087 | 15,432 | 15,385 |
Performance of the classes will vary based on the difference in sales charges paid by shareholders investing in the different classes and the fee structure of those classes.
The Class C shares investment with maximum sales charge has been adjusted to reflect the elimination of the front-end sales charge, effective 7-15-04.
Barclays Massachusetts Municipal Bond Index is an unmanaged index composed of Massachusetts investment-grade municipal bonds. Total return for this index is not available for the 10-year period.
Barclays Municipal Bond Index is an unmanaged index representative of the tax-exempt bond market.
Prior to 12-14-12, the fund compared its performance solely to the Barclays Municipal Bond Index. After this date, the fund added the Barclays Massachusetts Municipal Bond Index as the primary benchmark index and retained the Barclays Municipal Bond Index as the secondary benchmark index to which the fund compares its performance to better reflect the universe of investment opportunities based on the fund’s investment strategy.
It is not possible to invest directly in an index. Index figures do not reflect expenses or sales charges, which would have resulted in lower values.
Footnotes related to performance pages
1 Unsubsidized yield reflects what the yield would have been without the effect of reimbursements and waivers.
2 Tax-equivalent yield is based on the maximum federal income tax rate of 43.4% and state tax rate of 5.25%. Share classes will differ due to varying expenses.
3 The contingent deferred sales charge is not applicable.
| Semiannual report | Massachusetts Tax-Free Income Fund | 7 |
Your expenses
These examples are intended to help you understand your ongoing operating expenses of investing in the fund so you can compare these costs with the ongoing costs of investing in other mutual funds.
Understanding fund expenses
As a shareholder of the fund, you incur two types of costs:
▪ Transaction costs, which include sales charges (loads) on purchases or redemptions (varies by share class), minimum account fee charge, etc.
▪ Ongoing operating expenses, including management fees, distribution and service fees (if applicable), and other fund expenses.
We are going to present only your ongoing operating expenses here.
Actual expenses/actual returns
This example is intended to provide information about the fund’s actual ongoing operating expenses and is based on the fund’s actual return. It assumes an account value of $1,000.00 on June 1, 2013, with the same investment held until November 30, 2013.
| Account value | Ending value | Expenses paid during | |
| on 6-1-13 | on 11-30-13 | period ended 11-30-131 | |
| Class A | $1,000.00 | $937.20 | $4.18 |
| Class B | 1,000.00 | 933.70 | 7.80 |
| Class C | 1,000.00 | 933.70 | 7.80 |
Together with the value of your account, you may use this information to estimate the operating expenses that you paid over the period. Simply divide your account value at November 30, 2013, by $1,000.00, then multiply it by the “expenses paid” for your share class from the table above. For example, for an account value of $8,600.00, the operating expenses should be calculated as follows:

| 8 | Massachusetts Tax-Free Income Fund | Semiannual report |
Hypothetical example for comparison purposes
This table allows you to compare the fund’s ongoing operating expenses with those of any other fund. It provides an example of the fund’s hypothetical account values and hypothetical expenses based on each class’s actual expense ratio and an assumed 5% annualized return before expenses (which is not the fund’s actual return). It assumes an account value of $1,000.00 on June 1, 2013, with the same investment held until November 30, 2013. Look in any other fund shareholder report to find its hypothetical example and you will be able to compare these expenses. Please remember that these hypothetical account values and expenses may not be used to estimate the actual ending account balance or expenses you paid for the period.
| Account value | Ending value | Expenses paid during | |
| on 6-1-13 | on 11-30-13 | period ended 11-30-131 | |
| Class A | $1,000.00 | $1,020.80 | $4.36 |
| Class B | 1,000.00 | 1,017.00 | 8.14 |
| Class C | 1,000.00 | 1,017.00 | 8.14 |
Remember, these examples do not include any transaction costs; therefore, these examples will not help you to determine the relative total costs of owning different funds. If transaction costs were included, your expenses would have been higher. See the prospectus for details regarding transaction costs.
1 Expenses are equal to the fund’s annualized expense ratio of 0.86%, 1.61% and 1.61% for Class A, Class B, and Class C shares, respectively, multiplied by the average account value over the period, multiplied by 183/365 (to reflect the one-half year period).
| Semiannual report | Massachusetts Tax-Free Income Fund | 9 |
Portfolio summary
| Top 10 Holdings (26.4% of Net Assets on 11-30-13)1,2 | |
| Boston Housing Authority, 5.000%, 4-1-27 | 3.4% |
| Massachusetts State Department of Transportation, 5.000%, 1-1-37 | 3.1% |
| Massachusetts Water Resources Authority, 5.250%, 8-1-29 | 2.9% |
| Massachusetts Bay Transportation Authority, 5.250%, 7-1-33 | 2.9% |
| Commonwealth of Massachusetts, 5.500%, 12-1-24 | 2.5% |
| Massachusetts Development Finance Agency, 5.000%, 12-15-24 | 2.4% |
| Massachusetts Development Finance Agency, 5.000%, 2-1-36 | 2.3% |
| Massachusetts Development Finance Agency, 5.875%, 9-1-30 | 2.3% |
| Puerto Rico Sales Tax Financing Corp., Step Coupon, 8-1-32 | 2.3% |
| Massachusetts Bay Transportation Authority, 5.000%, 7-1-31 | 2.3% |
| Sector Composition1,3 | ||||
| General Obligation Bonds | 6.0% | Housing | 9.0% | |
| Revenue Bonds | Facilities | 3.2% | ||
| Health Care | 17.7% | Pollution | 2.3% | |
| Transportation | 17.5% | Development | 1.9% | |
| Education | 16.7% | Industrial Development | 0.1% | |
| Other Revenue | 14.1% | Other Assets | 1.6% | |
| Water & Sewer | 9.9% | |||
| Quality Composition1,4 | ||||
| AAA | 6.1% | |||
| AA | 43.9% | |||
| A | 23.6% | |||
| BBB | 22.1% | |||
| BB | 0.9% | |||
| Not Rated | 1.8% | |||
| Other Assets | 1.6% | |||
1 As a percentage of net assets on 11-30-13.
2 Cash and cash equivalents not included.
3 Fixed-income investments are subject to interest-rate and credit risk; their value will normally decline as interest rates rise or if a creditor is unable or unwilling to make principal or interest payments. Illiquid securities may be difficult to sell at a price approximating their value. Investments in higher-yielding, lower-rated securities include a higher risk of default. Municipal bond prices can decline due to fiscal mismanagement or tax shortfalls, or if related projects become unprofitable. If the fund invests heavily in any one state or region, performance could be disproportionately affected by factors particular to that state or region. The use of hedging and derivatives could produce disproportionate gains or losses and may increase costs. Sector investing is subject to greater risks than the market as a whole. Because the fund may focus on particular sectors of the economy, its performance may depend on the performance of those sectors and investments focused in one sector may fluctuate more widely than investments diversified across sectors. For additional information on these and other risk considerations, please see the fund’s prospectus.
4 Ratings are from Moody’s Investors Service, Inc. If not available, we have used Standard & Poor’s Ratings Services. In the absence of ratings from these agencies, we have used Fitch Ratings, Inc., ratings. “Not Rated” securities are those with no ratings available from these agencies. All ratings are as of 11-30-13 and do not reflect subsequent downgrades or upgrades, if any.
| 10 | Massachusetts Tax-Free Income Fund | Semiannual report |
Fund’s investments
As of 11-30-13 (unaudited)
| Maturity | |||||
| Rate (%) | date | Par value | Value | ||
| Municipal Bonds 98.4% | $96,277,284 | ||||
| (Cost $94,437,479) | |||||
| Massachusetts 87.0% | 85,126,719 | ||||
| Boston Housing Authority | |||||
| Capital Program Revenue (D) | 5.000 | 04-01-27 | $3,255,000 | 3,363,001 | |
| Boston Housing Authority | |||||
| Capital Program Revenue (D) | 5.000 | 04-01-28 | 2,000,000 | 2,051,580 | |
| Boston Industrial Development | |||||
| Financing Authority | |||||
| Harbor Electric Energy Company Project AMT | 7.375 | 05-15-15 | 70,000 | 70,337 | |
| Commonwealth of Massachusetts | |||||
| Public Improvements (D) | 5.500 | 11-01-17 | 1,000,000 | 1,180,750 | |
| Commonwealth of Massachusetts | |||||
| Public Improvements, Series C | 5.500 | 11-01-15 | 1,000,000 | 1,100,060 | |
| Commonwealth of Massachusetts | |||||
| Series C (D) | 5.500 | 12-01-24 | 2,000,000 | 2,462,880 | |
| Commonwealth of Massachusetts | |||||
| Series E (D) | 5.000 | 11-01-25 | 1,000,000 | 1,173,410 | |
| Massachusetts Bay Transportation Authority | |||||
| Sales Tax Revenue, Series A | 5.000 | 07-01-31 | 2,000,000 | 2,215,960 | |
| Massachusetts Bay Transportation Authority | |||||
| Sales Tax Revenue, Series A | 5.250 | 07-01-35 | 1,310,000 | 1,481,859 | |
| Massachusetts Bay Transportation Authority | |||||
| Sales Tax Revenue, Series A–2 (Z) | Zero | 07-01-26 | 2,500,000 | 1,442,850 | |
| Massachusetts Bay Transportation Authority | |||||
| Transit Revenue, Series A | 7.000 | 03-01-14 | 190,000 | 193,283 | |
| Massachusetts Bay Transportation Authority | |||||
| Transit Revenue, Series B | 5.250 | 07-01-33 | 2,500,000 | 2,808,650 | |
| Massachusetts Development Finance Agency | |||||
| Brandeis University, Series 0-1 | 5.000 | 10-01-40 | 1,000,000 | 1,033,010 | |
| Massachusetts Development Finance Agency | |||||
| Carleton Willard Village | 5.625 | 12-01-30 | 850,000 | 876,376 | |
| Massachusetts Development Finance Agency | |||||
| Covanta Energy Project, Series C AMT | 5.250 | 11-01-42 | 1,000,000 | 874,980 | |
| Massachusetts Development Finance Agency | |||||
| Curry College, Series A (D) | 4.500 | 03-01-25 | 1,000,000 | 996,440 | |
| Massachusetts Development Finance Agency | |||||
| Curry College, Series A (D) | 5.250 | 03-01-26 | 1,000,000 | 1,049,310 | |
| Massachusetts Development Finance Agency | |||||
| Dominion Energy Brayton Point AMT (P) | 5.000 | 02-01-36 | 2,000,000 | 2,231,680 | |
| Massachusetts Development Finance Agency | |||||
| Draper Laboratory | 5.875 | 09-01-30 | 2,000,000 | 2,221,720 | |
| See notes to financial statements | Semiannual report | Massachusetts Tax-Free Income Fund | 11 |
| Maturity | |||||
| Rate (%) | date | Par value | Value | ||
| Massachusetts (continued) | |||||
| Massachusetts Development Finance Agency | |||||
| Emerson College, Series A | 5.000 | 01-01-40 | $2,000,000 | $1,948,720 | |
| Massachusetts Development Finance Agency | |||||
| Harvard University, Series B | 5.000 | 10-15-40 | 1,190,000 | 1,286,081 | |
| Massachusetts Development Finance Agency | |||||
| Linden Ponds, Inc., Series A–1 | 5.500 | 11-15-46 | 56,460 | 39,159 | |
| Massachusetts Development Finance Agency | |||||
| Linden Ponds, Inc., Series A–1 | 6.250 | 11-15-39 | 1,057,748 | 846,389 | |
| Massachusetts Development Finance Agency | |||||
| Linden Ponds, Inc., Series B (I)(Z) | Zero | 11-15-56 | 280,825 | 1,429 | |
| Massachusetts Development Finance Agency | |||||
| Massachusetts College of Pharmacy, | |||||
| Series E (D) | 5.000 | 07-01-37 | 1,000,000 | 1,011,050 | |
| Massachusetts Development Finance Agency | |||||
| New England Conservatory of Music | 5.250 | 07-01-38 | 2,000,000 | 2,007,980 | |
| Massachusetts Development Finance Agency | |||||
| North Hill Communities, Inc., Series A | 6.500 | 11-15-43 | 1,000,000 | 935,260 | |
| Massachusetts Development Finance Agency | |||||
| Olin College, Series E | 5.000 | 11-01-38 | 2,000,000 | 2,023,320 | |
| Massachusetts Development Finance Agency | |||||
| Orchard Cove | 5.250 | 10-01-26 | 1,000,000 | 932,580 | |
| Massachusetts Development Finance Agency | |||||
| Partners Healthcare, Series L | 5.000 | 07-01-36 | 1,000,000 | 1,020,840 | |
| Massachusetts Development Finance Agency | |||||
| Plantation Apartments, Series A AMT | 5.000 | 12-15-24 | 2,320,000 | 2,339,300 | |
| Massachusetts Development Finance Agency | |||||
| The Groves in Lincoln, Series A (H) | 7.750 | 06-01-39 | 700,000 | 7,000 | |
| Massachusetts Development Finance Agency | |||||
| Williams College, Series P | 5.000 | 07-01-38 | 1,000,000 | 1,065,830 | |
| Massachusetts Health & Educational | |||||
| Facilities Authority | |||||
| Emerson Hospital, Series E (D) | 5.000 | 08-15-35 | 1,000,000 | 822,660 | |
| Massachusetts Health & Educational | |||||
| Facilities Authority | |||||
| Harvard Pilgrim Health Care, Series A (D) | 5.000 | 07-01-18 | 1,000,000 | 1,002,690 | |
| Massachusetts Health & Educational | |||||
| Facilities Authority | |||||
| Lahey Clinic Medical Center, Series C (D) | 5.000 | 08-15-23 | 1,000,000 | 1,055,860 | |
| Massachusetts Health & Educational | |||||
| Facilities Authority | |||||
| Mass Eye & Ear Infirmary | 5.375 | 07-01-35 | 2,000,000 | 1,961,100 | |
| Massachusetts Health & Educational | |||||
| Facilities Authority | |||||
| Partners HealthCare System | 5.000 | 07-01-22 | 1,000,000 | 1,104,900 | |
| Massachusetts Health & Educational | |||||
| Facilities Authority | |||||
| Partners HealthCare, Series J1 | 5.000 | 07-01-34 | 1,000,000 | 1,023,430 | |
| Massachusetts Health & Educational | |||||
| Facilities Authority, | |||||
| Series A | 5.750 | 07-01-39 | 1,000,000 | 1,031,700 | |
| Massachusetts Health & Educational | |||||
| Facilities Authority | |||||
| South Shore Hospital | 5.750 | 07-01-29 | 365,000 | 366,296 | |
| 12 | Massachusetts Tax-Free Income Fund | Semiannual report | See notes to financial statements |
| Maturity | |||||
| Rate (%) | date | Par value | Value | ||
| Massachusetts (continued) | |||||
| Massachusetts Health & Educational | |||||
| Facilities Authority | |||||
| Springfield College | 5.625 | 10-15-40 | $2,000,000 | $2,068,000 | |
| Massachusetts Health & Educational | |||||
| Facilities Authority | |||||
| Sterling & Francine Clark, Series A | 5.000 | 07-01-36 | 1,000,000 | 1,023,180 | |
| Massachusetts Health & Educational | |||||
| Facilities Authority | |||||
| Suffolk University, Series A | 6.250 | 07-01-30 | 1,000,000 | 1,092,290 | |
| Massachusetts Health & Educational | |||||
| Facilities Authority | |||||
| Tufts University | 5.375 | 08-15-38 | 350,000 | 382,127 | |
| Massachusetts Health & Educational | |||||
| Facilities Authority | |||||
| Woods Hole Oceanographic, Series B | 5.375 | 06-01-30 | 1,000,000 | 1,084,870 | |
| Massachusetts Port Authority | |||||
| Boston Fuel Project AMT (D) | 5.000 | 07-01-32 | 1,770,000 | 1,773,947 | |
| Massachusetts Port Authority | |||||
| Conrac Project, Series A | 5.125 | 07-01-41 | 1,500,000 | 1,518,270 | |
| Massachusetts Port Authority, | |||||
| Series B | 5.000 | 07-01-32 | 2,000,000 | 2,123,180 | |
| Massachusetts Port Authority | |||||
| US Airways Project, Series A AMT (D) | 5.750 | 09-01-16 | 635,000 | 636,067 | |
| Massachusetts State College Building Authority | |||||
| College & University Revenue, Series A | 5.500 | 05-01-49 | 1,000,000 | 1,057,550 | |
| Massachusetts State College Building Authority | |||||
| College & University Revenue, Series B (D)(Z) | Zero | 05-01-19 | 1,000,000 | 895,670 | |
| Massachusetts State Department | |||||
| of Transportation | |||||
| Highway Revenue Tolls, Escrowed to | |||||
| Maturity, Series A (D) | 5.125 | 01-01-23 | 445,000 | 530,204 | |
| Massachusetts State Department | |||||
| of Transportation | |||||
| Highway Revenue Tolls, Series B | 5.000 | 01-01-37 | 3,000,000 | 3,066,180 | |
| Massachusetts State Department | |||||
| of Transportation | |||||
| Highway Revenue Tolls, Series C (D)(Z) | Zero | 01-01-20 | 1,000,000 | 860,130 | |
| Massachusetts Water Pollution | |||||
| Abatement Trust | |||||
| Government Fund/Grant Revenue | 5.000 | 08-01-28 | 1,000,000 | 1,113,170 | |
| Massachusetts Water Pollution | |||||
| Abatement Trust, | |||||
| Series 9 | 5.250 | 08-01-18 | 60,000 | 64,721 | |
| Massachusetts Water Pollution | |||||
| Abatement Trust | |||||
| Unrefunded 2012 Pooled Loan Program, | |||||
| Series 7 | 5.125 | 02-01-31 | 785,000 | 787,253 | |
| Massachusetts Water Pollution | |||||
| Abatement Trust | |||||
| Water Revenue, Series 13 | 5.000 | 08-01-28 | 1,000,000 | 1,081,200 | |
| Massachusetts Water Pollution | |||||
| Abatement Trust | |||||
| Water Revenue, Series 14 | 5.000 | 08-01-32 | 1,000,000 | 1,071,830 | |
| See notes to financial statements | Semiannual report | Massachusetts Tax-Free Income Fund | 13 |
| Maturity | |||||
| Rate (%) | date | Par value | Value | ||
| Massachusetts (continued) | |||||
| Massachusetts Water Resources Authority | |||||
| Water Revenue, Series A | 5.000 | 08-01-40 | $1,600,000 | $1,670,880 | |
| Massachusetts Water Resources Authority | |||||
| Water Revenue, Series B | 5.000 | 08-01-39 | 1,000,000 | 1,044,400 | |
| Massachusetts Water Resources Authority | |||||
| Water Revenue, Series B (D) | 5.250 | 08-01-29 | 2,500,000 | 2,851,700 | |
| Metropolitan Boston Transit Parking Corp. | 5.000 | 07-01-41 | 2,000,000 | 2,042,960 | |
| Metropolitan Boston Transit Parking Corp. | 5.250 | 07-01-36 | 1,000,000 | 1,058,930 | |
| University of Massachusetts Building Authority | |||||
| College & University Revenue, Series 1 | 5.000 | 05-01-39 | 1,500,000 | 1,566,300 | |
| Puerto Rico 9.3% | 9,071,135 | ||||
| Puerto Rico Highway & | |||||
| Transportation Authority | |||||
| Fuel Sales Tax Revenue, Escrowed to | |||||
| Maturity, Series Y | 6.250 | 07-01-14 | 955,000 | 989,046 | |
| Puerto Rico Highway & | |||||
| Transportation Authority | |||||
| Fuel Sales Tax Revenue, Series Y | 6.250 | 07-01-14 | 45,000 | 44,735 | |
| Puerto Rico Highway & | |||||
| Transportation Authority | |||||
| Prerefunded, Series AA (D) | 5.500 | 07-01-19 | 1,640,000 | 1,994,388 | |
| Puerto Rico Highway & | |||||
| Transportation Authority | |||||
| Unrefunded, Series AA (D) | 5.500 | 07-01-19 | 360,000 | 343,800 | |
| Puerto Rico Highway & | |||||
| Transportation Authority | |||||
| Unrefunded, Series H | 5.450 | 07-01-35 | 285,000 | 204,026 | |
| Puerto Rico Housing Finance Authority | |||||
| Subordinated Capital Fund Modernization (D) | 5.125 | 12-01-27 | 1,000,000 | 1,004,110 | |
| Puerto Rico Sales Tax Financing Corp. | |||||
| Sales Tax Revenue, Series A (Zero coupon | |||||
| steps up to 6.750% on 8-1-16) | Zero | 08-01-32 | 3,000,000 | 2,220,060 | |
| Puerto Rico Sales Tax Financing Corp., | |||||
| Series A | 5.375 | 08-01-39 | 1,000,000 | 754,790 | |
| Puerto Rico Sales Tax Financing Corp., | |||||
| Series C | 5.375 | 08-01-38 | 2,000,000 | 1,516,180 | |
| Virgin Islands 1.6% | 1,560,970 | ||||
| Virgin Islands Public Finance Authority, Series A | 6.750 | 10-01-37 | 1,000,000 | 1,084,010 | |
| Virgin Islands Public Finance Authority, | |||||
| Series A–1 | 5.000 | 10-01-39 | 500,000 | 476,960 | |
| Guam 0.5% | 518,460 | ||||
| Guam Government, Series A | 5.750 | 12-01-34 | 500,000 | 518,460 | |
| Total investments (Cost $94,437,479)† 98.4% | $96,277,284 | ||||
| Other assets and liabilities, net 1.6% | $1,551,213 | ||||
| Total net assets 100.0% | $97,828,497 | ||||
The percentage shown for each investment category is the total value of that category as a percentage of the net assets of the fund.
| 14 | Massachusetts Tax-Free Income Fund | Semiannual report | See notes to financial statements |
Notes to Schedule of Investments
AMT Interest earned from these securities may be considered a tax preference item for purpose of the Federal Alternative Minimum Tax.
(D) Bond is insured by one or more these companies:
| Insurance coverage | As a % of total investments | ||||||
| Assured Guaranty Municipal Corp. | 10.9% | ||||||
| National Public Finance Guarantee Corp. | 6.9% | ||||||
| Ambac Financial Group, Inc. | 3.8% | ||||||
| ACA Financial Guaranty Corp. | 2.1% | ||||||
| Assured Guarantee Corp. | 1.1% | ||||||
| Capital Funding Program | 1.0% | ||||||
| Radian Asset Assurance, Inc. | 0.9% | ||||||
| XL Capital Assurance, Inc. | 0.9% | ||||||
| Financial Guaranty Insurance Company | 0.6% | ||||||
| Total | 28.2% | ||||||
(H) Issuer is in default.
(I) Non-income producing security.
(P) Variable rate obligation. The coupon rate shown represents the rate at period end.
(Z) Zero coupon bonds are issued at a discount from their principal amount in lieu of paying interest periodically.
† At 11-30-13, the aggregate cost of investment securities for federal income tax purposes was $94,154,069. Net unrealized appreciation aggregated $2,123,215, of which $4,361,917 related to appreciated investment securities and $2,238,702 related to depreciated investment securities.
The fund had the following sector composition as a percentage of total net assets on 11-30-13:
| General Obligation Bonds | 6.0% | |||||||
| Revenue Bonds | ||||||||
| Health Care | 17.7% | |||||||
| Transportation | 17.5% | |||||||
| Education | 16.7% | |||||||
| Other Revenue | 14.1% | |||||||
| Water & Sewer | 9.9% | |||||||
| Housing | 9.0% | |||||||
| Facilities | 3.2% | |||||||
| Pollution | 2.3% | |||||||
| Development | 1.9% | |||||||
| Industrial Development | 0.1% | |||||||
| Other Assets | 1.6% | |||||||
| Total | 100.0% |
| See notes to financial statements | Semiannual report | Massachusetts Tax-Free Income Fund | 15 |
Financial statements
Statement of assets and liabilities 11-30-13 (unaudited)
This Statement of assets and liabilities is the fund’s balance sheet. It shows the value of what the fund owns, is due and owes. You’ll also find the net asset value and the maximum offering price per share.
| Assets | |
| Investments, at value (Cost $94,437,479) | $96,277,284 |
| Cash | 451,066 |
| Receivable for fund shares sold | 21,738 |
| Interest receivable | 1,468,989 |
| Receivable from affiliates�� | 1,212 |
| Other receivables and prepaid expenses | 12,418 |
| Total assets | 98,232,707 |
| Liabilities | |
| Payable for fund shares repurchased | 304,903 |
| Distributions payable | 48,334 |
| Payable to affiliates | |
| Accounting and legal services fees | 2,245 |
| Transfer agent fees | 5,611 |
| Distribution and service fees | 12,119 |
| Trustees’ fees | 4,369 |
| Other liabilities and accrued expenses | 26,629 |
| Total liabilities | 404,210 |
| Net assets | $97,828,497 |
| Net assets consist of | |
| Paid-in capital | $99,397,064 |
| Undistributed net investment income | 222,148 |
| Accumulated net realized gain (loss) on investments | (3,630,520) |
| Net unrealized appreciation (depreciation) on investments | 1,839,805 |
| Net assets | $97,828,497 |
| Net asset value per share | |
| Based on net asset values and shares outstanding — the fund has an | |
| unlimited number of shares authorized with no par value | |
| Class A ($80,931,007 ÷ 6,793,964 shares)1 | $11.91 |
| Class B ($2,429,079 ÷ 203,952 shares)1 | $11.91 |
| Class C ($14,468,411 ÷ 1,214,613 shares)1 | $11.91 |
| Maximum offering price per share | |
| Class A (net asset value per share ÷ 95.5%)2 | $12.47 |
1 Redemption price is equal to net asset value less any applicable contingent deferred sales charge.
2 On single retail sales of less than $100,000. On sales of $100,000 or more and on group sales the offering price is reduced.
| 16 | Massachusetts Tax-Free Income Fund | Semiannual report | See notes to financial statements |
FINANCIAL STATEMENTS
Statement of operations For the six-month period ended 11-30-13
(unaudited)
This Statement of operations summarizes the fund’s investment income earned and expenses incurred in operating the fund. It also shows net gains (losses) for the period stated.
| Investment income | |
| Interest | $2,437,990 |
| Total investment income | 2,437,990 |
| Expenses | |
| Investment management fees | 267,335 |
| Distribution and service fees | 227,559 |
| Accounting and legal services fees | 10,398 |
| Transfer agent fees | 35,216 |
| Trustees’ fees | 2,734 |
| State registration fees | 8,081 |
| Printing and postage | 5,391 |
| Professional fees | 29,611 |
| Custodian fees | 8,977 |
| Registration and filing fees | 10,028 |
| Other | 5,017 |
| Total expenses | 610,347 |
| Less expense reductions | (78,386) |
| Net expenses | 531,961 |
| Net investment income | 1,906,029 |
| Realized and unrealized gain (loss) | |
| Net realized gain (loss) on | |
| Investments | (4,064,281) |
| (4,064,281) | |
| Change in net unrealized appreciation (depreciation) of | |
| Investments | (5,778,714) |
| (5,778,714) | |
| Net realized and unrealized loss | (9,842,995) |
| Decrease in net assets from operations | ($7,936,966) |
| See notes to financial statements | Semiannual report | Massachusetts Tax-Free Income Fund | 17 |
Statements of changes in net assets
These Statements of changes in net assets show how the value of the fund’s net assets has changed during the last two periods. The difference reflects earnings less expenses, any investment gains and losses, distributions, if any, paid to shareholders and the net of fund share transactions.
| Six months | ||
| ended | Year | |
| 11-30-13 | ended | |
| (Unaudited) | 5-31-13 | |
| Increase (decrease) in net assets | ||
| From operations | ||
| Net investment income | $1,906,029 | $4,111,700 |
| Net realized gain (loss) | (4,064,281) | 253,622 |
| Change in net unrealized appreciation (depreciation) | (5,778,714) | (1,976,254) |
| Increase (decrease) in net assets resulting from operations | (7,936,966) | 2,389,068 |
| Distributions to shareholders | ||
| From net investment income | ||
| Class A | (1,641,151) | (3,498,903) |
| Class B | (40,697) | (88,721) |
| Class C | (246,794) | (505,315) |
| From net realized gain | ||
| Class A | — | (8,479) |
| Class B | — | (275) |
| Class C | — | (1,592) |
| Total distributions | (1,928,642) | (4,103,285) |
| From fund share transactions | (18,489,019) | (124,316) |
| Total decrease | (28,354,627) | (1,838,533) |
| Net assets | ||
| Beginning of period | 126,183,124 | 128,021,657 |
| End of period | $97,828,497 | $126,183,124 |
| Undistributed net investment income | $222,148 | $244,761 |
| 18 | Massachusetts Tax-Free Income Fund | Semiannual report | See notes to financial statements |
Financial highlights
The Financial highlights show how the fund’s net asset value for a share has changed during the period.
| CLASS A SHARES Period ended | 11-30-131 | 5-31-13 | 5-31-12 | 5-31-11 | 5-31-10 | 5-31-092 | 8-31-08 |
| Per share operating performance | |||||||
| Net asset value, beginning of period | $12.95 | $13.13 | $12.22 | $12.53 | $12.10 | $12.28 | $12.37 |
| Net investment income3 | 0.22 | 0.44 | 0.49 | 0.50 | 0.49 | 0.38 | 0.51 |
| Net realized and unrealized gain (loss) | |||||||
| on investments | (1.03) | (0.18) | 0.91 | (0.30) | 0.46 | (0.17) | (0.08) |
| Total from investment operations | (0.81) | 0.26 | 1.40 | 0.20 | 0.95 | 0.21 | 0.43 |
| Less distributions | |||||||
| From net investment income | (0.23) | (0.44) | (0.48) | (0.49) | (0.49) | (0.39) | (0.50) |
| From net realized gain | — | —4 | (0.01) | (0.02) | (0.03) | —4 | (0.02) |
| Total distributions | (0.23) | (0.44) | (0.49) | (0.51) | (0.52) | (0.39) | (0.52) |
| Net asset value, end of period | $11.91 | $12.95 | $13.13 | $12.22 | $12.53 | $12.10 | $12.28 |
| Total return (%)5,6 | (6.28)7 | 1.94 | 11.67 | 1.67 | 8.04 | 1.847 | 3.55 |
| Ratios and supplemental data | |||||||
| Net assets, end of period (in millions) | $81 | $103 | $105 | $92 | $105 | $95 | $97 |
| Ratios (as a percentage of average | |||||||
| net assets): | |||||||
| Expenses before reductions | 1.028 | 0.98 | 1.00 | 1.00 | 1.00 | 1.098,9 | 0.98 |
| Expenses net of fee waivers | |||||||
| and credits | 0.868 | 0.83 | 0.87 | 0.95 | 1.00 | 1.098,9 | 0.97 |
| Net investment income | 3.708 | 3.31 | 3.82 | 4.04 | 4.00 | 4.398 | 4.08 |
| Portfolio turnover (%) | 8 | 16 | 11 | 17 | 10 | 17 | 22 |
1 Six months ended 11-30-13. Unaudited.
2 For the nine-month period ended 5-31-09. The fund changed its fiscal year end from August 31 to May 31.
3 Based on the average daily shares outstanding.
4 Less than $0.005 per share.
5 Does not reflect the effect of sales charges, if any.
6 Total returns would have been lower had certain expenses not been reduced during the applicable periods.
7 Not annualized.
8 Annualized.
9 Includes the impact of proxy expenses, which amounted to 0.04% of average net assets.
| See notes to financial statements | Semiannual report | Massachusetts Tax-Free Income Fund | 19 |
| CLASS B SHARES Period ended | 11-30-131 | 5-31-13 | 5-31-12 | 5-31-11 | 5-31-10 | 5-31-092 | 8-31-08 |
| Per share operating performance | |||||||
| Net asset value, beginning | |||||||
| of period | $12.95 | $13.13 | $12.22 | $12.53 | $12.09 | $12.28 | $12.37 |
| Net investment income3 | 0.18 | 0.34 | 0.39 | 0.41 | 0.41 | 0.32 | 0.42 |
| Net realized and unrealized gain | |||||||
| (loss) on investments | (1.04) | (0.18) | 0.92 | (0.29) | 0.46 | (0.19) | (0.08) |
| Total from investment operations | (0.86) | 0.16 | 1.31 | 0.12 | 0.87 | 0.13 | 0.34 |
| Less distributions | |||||||
| From net investment income | (0.18) | (0.34) | (0.39) | (0.41) | (0.40) | (0.32) | (0.41) |
| From net realized gain | — | —4 | (0.01) | (0.02) | (0.03) | —4 | (0.02) |
| Total distributions | (0.18) | (0.34) | (0.40) | (0.43) | (0.43) | (0.32) | (0.43) |
| Net asset value, end of period | $11.91 | $12.95 | $13.13 | $12.22 | $12.53 | $12.09 | $12.28 |
| Total return (%)5,6 | (6.63)7 | 1.18 | 10.85 | 0.96 | 7.37 | 1.227 | 2.83 |
| Ratios and supplemental data | |||||||
| Net assets, end of period (in millions) | $2 | $3 | $3 | $3 | $5 | $7 | $10 |
| Ratios (as a percentage of average | |||||||
| net assets): | |||||||
| Expenses before reductions | 1.728 | 1.68 | 1.70 | 1.70 | 1.70 | 1.798,9 | 1.68 |
| Expenses net of fee waivers | |||||||
| and credits | 1.618 | 1.58 | 1.62 | 1.65 | 1.70 | 1.798,9 | 1.67 |
| Net investment income | 2.958 | 2.56 | 3.08 | 3.33 | 3.29 | 3.698 | 3.39 |
| Portfolio turnover (%) | 8 | 16 | 11 | 17 | 10 | 17 | 22 |
1 Six months ended 11-30-13. Unaudited.
2 For the nine-month period ended 5-31-09. The fund changed its fiscal year end from August 31 to May 31.
3 Based on the average daily shares outstanding.
4 Less than $0.005 per share.
5 Does not reflect the effect of sales charges, if any.
6 Total returns would have been lower had certain expenses not been reduced during the applicable periods.
7 Not annualized.
8 Annualized.
9 Includes the impact of proxy expenses, which amounted to 0.04% of average net assets.
| 20 | Massachusetts Tax-Free Income Fund | Semiannual report | See notes to financial statements |
| CLASS C SHARES Period ended | 11-30-131 | 5-31-13 | 5-31-12 | 5-31-11 | 5-31-10 | 5-31-092 | 8-31-08 |
| Per share operating performance | |||||||
| Net asset value, beginning | |||||||
| of period | $12.95 | $13.13 | $12.22 | $12.53 | $12.10 | $12.28 | $12.37 |
| Net investment income3 | 0.18 | 0.34 | 0.39 | 0.41 | 0.41 | 0.32 | 0.42 |
| Net realized and unrealized gain | |||||||
| (loss) on investments | (1.04) | (0.18) | 0.92 | (0.29) | 0.45 | (0.18) | (0.08) |
| Total from investment operations | (0.86) | 0.16 | 1.31 | 0.12 | 0.86 | 0.14 | 0.34 |
| Less distributions | |||||||
| From net investment income | (0.18) | (0.34) | (0.39) | (0.41) | (0.40) | (0.32) | (0.41) |
| From net realized gain | — | —4 | (0.01) | (0.02) | (0.03) | —4 | (0.02) |
| Total distributions | (0.18) | (0.34) | (0.40) | (0.43) | (0.43) | (0.32) | (0.43) |
| Net asset value, end of period | $11.91 | $12.95 | $13.13 | $12.22 | $12.53 | $12.10 | $12.28 |
| Total return (%)5,6 | (6.63)7 | 1.18 | 10.85 | 0.96 | 7.29 | 1.317 | 2.83 |
| Ratios and supplemental data | |||||||
| Net assets, end of period (in millions) | $14 | $20 | $19 | $17 | $19 | $14 | $12 |
| Ratios (as a percentage of average | |||||||
| net assets): | |||||||
| Expenses before reductions | 1.728 | 1.68 | 1.70 | 1.70 | 1.70 | 1.798,9 | 1.68 |
| Expenses net of fee waivers | |||||||
| and credits | 1.618 | 1.58 | 1.62 | 1.65 | 1.70 | 1.798,9 | 1.67 |
| Net investment income | 2.968 | 2.56 | 3.07 | 3.34 | 3.30 | 3.678 | 3.38 |
| Portfolio turnover (%) | 8 | 16 | 11 | 17 | 10 | 17 | 22 |
1 Six months ended 11-30-13. Unaudited.
2 For the nine-month period ended 5-31-09. The fund changed its fiscal year end from August 31 to May 31.
3 Based on the average daily shares outstanding.
4 Less than $0.005 per share.
5 Does not reflect the effect of sales charges, if any.
6 Total returns would have been lower had certain expenses not been reduced during the applicable periods.
7 Not annualized.
8 Annualized.
9 Includes the impact of proxy expenses, which amounted to 0.04% of average net assets.
| See notes to financial statements | Semiannual report | Massachusetts Tax-Free Income Fund | 21 |
Notes to financial statements
(unaudited)
Note 1 — Organization
John Hancock Massachusetts Tax-Free Income Fund (the fund) is a series of John Hancock Tax-Exempt Series Fund (the Trust), an open-end management investment company organized as a Massachusetts business trust and registered under the Investment Company Act of 1940, as amended (the 1940 Act). The investment objective of the fund is to seek a high level of current income, consistent with preservation of capital, that is exempt from federal and Massachusetts personal income taxes.
The fund may offer multiple classes of shares. The shares currently offered are detailed in the Statement of assets and liabilities. Class A and Class C shares are offered to all investors. Class B shares are closed to new investors. Shareholders of each class have exclusive voting rights to matters that affect that class. The distribution and service fees, if any, and transfer agent fees for each class may differ. Class B shares convert to Class A shares eight years after purchase.
Note 2 — Significant accounting policies
The financial statements have been prepared in conformity with accounting principles generally accepted in the United States of America, which require management to make certain estimates and assumptions as of the date of the financial statements. Actual results could differ from those estimates and those differences could be significant. Events or transactions occurring after the end of the fiscal period through the date that the financial statements were issued have been evaluated in the preparation of the financial statements. The following summarizes the significant accounting policies of the fund:
Security valuation. Investments are stated at value as of the close of regular trading on the New York Stock Exchange (NYSE), normally at 4:00 P.M., Eastern Time. In order to value the securities, the fund uses the following valuation techniques: Debt obligations are valued based on the evaluated prices provided by an independent pricing service, which utilizes both dealer-supplied and electronic data processing techniques, taking into account factors such as institutional-size trading in similar groups of securities, yield, quality, coupon rate, maturity, type of issue, trading characteristics and other market data. Certain securities traded only in the over-the-counter (OTC) market are valued at the last bid price quoted by brokers making markets in the securities at the close of trading. Certain short-term securities with maturities of 60 days or less at the time of purchase are valued at amortized cost. Other portfolio securities and assets, for which reliable market quotations are not readily available, are valued at fair value as determined in good faith by the fund’s Pricing Committee following procedures established by the Board of Trustees. The frequency with which these fair valuation procedures are used cannot be predicted and fair value of securities may differ significantly from the value that would have been used had a ready market for such securities existed.
The fund uses a three-tier hierarchy to prioritize the pricing assumptions, referred to as inputs, used in valuation techniques to measure fair value. Level 1 includes securities valued using quoted prices in active markets for identical securities. Level 2 includes securities valued using other significant observable inputs. Observable inputs may include quoted prices for similar securities, interest rates, prepayment speeds and credit risk. Prices for securities valued using these inputs are received from independent pricing vendors and brokers and are based on an evaluation of the inputs described. Level 3 includes securities valued using significant unobservable inputs when market prices are not readily available or reliable, including the fund’s own assumptions in determining the fair value of investments. Factors used in determining value may include market or issuer specific events or
| 22 | Massachusetts Tax-Free Income Fund | Semiannual report |
trends, changes in interest rates and credit quality. The inputs or methodology used for valuing securities are not necessarily an indication of the risks associated with investing in those securities. Changes in valuation techniques may result in transfers into or out of an assigned level within the disclosure hierarchy.
As of November 30, 2013, all investments are categorized as Level 2 under the hierarchy described above.
Security transactions and related investment income. Investment security transactions are accounted for on a trade date plus one basis for daily net asset value calculations. However, for financial reporting purposes, investment transactions are reported on trade date. Interest income is accrued as earned. Interest income includes coupon interest and amortization/accretion of premiums/discounts on debt securities. Debt obligations may be placed in a non-accrual status and related interest income may be reduced by stopping current accruals and writing off interest receivable when the collection of all or a portion of interest has become doubtful. Gains and losses on securities sold are determined on the basis of identified cost and may include proceeds from litigation.
Line of credit. The fund may borrow from banks for temporary or emergency purposes, including meeting redemption requests that otherwise might require the untimely sale of securities. Pursuant to the fund’s custodian agreement, the custodian may loan money to the fund to make properly authorized payments. The fund is obligated to repay the custodian for any overdraft, including any related costs or expenses. The custodian may have a lien, security interest or security entitlement in any fund property that is not otherwise segregated or pledged, to the maximum extent permitted by law, to the extent of any overdraft.
In addition, the fund and other affiliated funds have entered into an agreement with Citibank N.A. that enables them to potentially participate in a $300 million unsecured committed line of credit. A commitment fee, payable at the end of each calendar quarter, based on the average daily unused portion of the line of credit, is charged to each participating fund on a pro rata basis and is reflected in other expenses on the Statement of operations. Commitment fees for the six months ended November 30, 2013 were $358. For the six months ended November 30, 2013, the fund had no borrowings under the line of credit.
Expenses. Within the John Hancock funds complex, expenses that are directly attributable to an individual fund are allocated to such fund. Expenses that are not readily attributable to a specific fund are allocated among all funds in an equitable manner, taking into consideration, among other things, the nature and type of expense and the fund’s relative net assets. Expense estimates are accrued in the period to which they relate and adjustments are made when actual amounts are known.
Class allocations. Income, common expenses and realized and unrealized gains (losses) are determined at the fund level and allocated daily to each class of shares based on the net assets of the class. Class-specific expenses, such as distribution and service fees, if any, and transfer agent fees, are calculated daily for each class, based on the net asset value of the class and the applicable specific expense rates.
Federal income taxes. The fund intends to continue to qualify as a regulated investment company by complying with the applicable provisions of the Internal Revenue Code and will not be subject to federal income tax on taxable income that is distributed to shareholders. Therefore, no federal income tax provision is required.
| Semiannual report | Massachusetts Tax-Free Income Fund | 23 |
As of May 31, 2013, the fund had no uncertain tax positions that would require financial statement recognition, derecognition or disclosure. The fund’s federal tax returns are subject to examination by the Internal Revenue Service for a period of three years.
Distribution of income and gains. Distributions to shareholders from net investment income and net realized gains, if any, are recorded on the ex-date. The fund generally declares dividends daily and pays them monthly. Capital gain distributions, if any, are distributed annually.
Distributions paid by the fund with respect to each class of shares are calculated in the same manner, at the same time and in the same amount, except for the effect of class level expenses that may be applied differently to each class.
Such distributions, on a tax basis, are determined in conformity with income tax regulations, which may differ from accounting principles generally accepted in the United States of America.
Capital accounts within the financial statements are adjusted for permanent book-tax differences. These adjustments have no impact on net assets or the results of operations. Temporary book-tax differences, if any, will reverse in a subsequent period. Book-tax differences are primarily attributable to distributions payable and accretion on debt securities.
Note 3 — Guarantees and indemnifications
Under the Trust’s organizational documents, its Officers and Trustees are indemnified against certain liabilities arising out of the performance of their duties to the Trust, including the fund. Additionally, in the normal course of business, the fund enters into contracts with service providers that contain general indemnification clauses. The fund’s maximum exposure under these arrangements is unknown, as this would involve future claims that may be made against the fund that have not yet occurred. The risk of material loss from such claims is considered remote.
Note 4 — Fees and transactions with affiliates
John Hancock Advisers, LLC (the Advisor) serves as investment advisor for the fund. John Hancock Funds, LLC (the Distributor), an affiliate of the Advisor, serves as principal underwriter of the fund. The Advisor and the Distributor are indirect, wholly owned subsidiaries of Manulife Financial Corporation (MFC).
Management fee. The fund has an investment management agreement with the Advisor under which the fund pays a daily management fee to the Advisor equivalent, on an annual basis, to the sum of: (a) 0.500% of the first $250,000,000 of the fund’s average daily net assets, (b) 0.450% of the next $250,000,000 of the fund’s average daily net assets, (c) 0.425% of the next $500,000,000 of the fund’s average daily net assets, (d) 0.400% of the next $250,000,000 of the fund’s average daily net assets and (e) 0.300% of the fund’s average daily net assets in excess of $1,250,000,000. The Advisor has a subadvisory agreement with John Hancock Asset Management a division of Manulife Asset Management (US) LLC, an indirectly owned subsidiary of MFC and an affiliate of the Advisor. The fund is not responsible for payment of the subadvisory fees.
Effective June 1, 2013, the Advisor has contractually agreed to waive a portion of its management fee and/or reimburse expenses for certain funds of the John Hancock funds complex, including the fund (the participating portfolios). The waiver equals, on an annualized basis, 0.01% of that portion of the aggregate net assets of all the participating portfolios that exceeds $75 billion but is less than or equal to $125 billion; 0.0125% of that portion of the aggregate net assets of all the participating portfolios that exceeds $125 billion but is less than or equal to $150 billion; and 0.015% of that portion of the aggregate net assets of all the participating portfolios that exceeds $150 billion. The amount of the reimbursement is calculated daily and allocated among all the participating portfolios in proportion to the daily net assets of each fund. This arrangement may be
| 24 | Massachusetts Tax-Free Income Fund | Semiannual report |
amended or terminated at any time by the Advisor upon notice to the funds and with the approval of the Board of Trustees.
Accordingly, these expense reductions amounted to $2,446, $76 and $460 for Class A, Class B, and Class C, respectively, for the six months ended November 30, 2013.
The investment management fees incurred for the six months ended November 30, 2013 were equivalent to a net annual effective rate of 0.49% of the fund’s average daily net assets.
Accounting and legal services. Pursuant to a service agreement, the fund reimburses the Advisor for all expenses associated with providing the administrative, financial, legal, accounting and recordkeeping services to the fund, including the preparation of all tax returns, periodic reports to shareholders and regulatory reports, among other services. These expenses are allocated to each share class based on its relative net assets at the time the expense was incurred. These accounting and legal services fees incurred for the six months ended November 30, 2013 amounted to an annual rate of 0.02% of the fund’s average daily net assets.
Distribution and service plans. The fund has a distribution agreement with the Distributor. The fund has adopted distribution and service plans with respect to Class A, Class B, and Class C pursuant to Rule 12b-1 under the 1940 Act, to pay the Distributor for services provided as the distributor of shares of the fund. The fund may pay up to the following contractual rates of distribution and service fees under these arrangements, expressed as an annual percentage of average daily net assets for each class of the fund’s shares.
| CLASS | RULE 12b–1 FEE | |||||
| Class A | 0.30% | |||||
| Class B | 1.00% | |||||
| Class C | 1.00% | |||||
The Distributor has contractually agreed to waive 0.15% of the distribution fees for Class A shares and 0.10% of the distribution fees for Class B and Class C shares. The current waiver expires on September 30, 2014, unless renewed by mutual agreement of the fund and the Distributor based upon a determination that this is appropriate under the circumstances at the time.
Accordingly, these fee limitations amounted to $65,810, $1,360 and $8,234 for Class A, Class B, and Class C shares, respectively, for the six months ended November 30, 2013.
Sales charges. Class A shares are assessed up-front sales charges, which resulted in payments to the Distributor amounting to $22,685 for the six months ended November 30, 2013. Of this amount, $3,531 was retained and used for printing prospectuses, advertising, sales literature and other purposes, $14,859 was paid as sales commissions to broker-dealers and $4,295 was paid as sales commissions to sales personnel of Signator Investors, Inc., a broker-dealer affiliate of the Advisor.
Class A, Class B, and Class C shares may be subject to contingent deferred sales charges (CDSCs). Certain Class A shares that are acquired through purchases of $1 million or more and are redeemed within one year of purchase are subject to a 1.00% sales charge. Class B shares that are redeemed within six years of purchase are subject to CDSCs, at declining rates, beginning at 5.00%. Class C shares that are redeemed within one year of purchase are subject to a 1.00% CDSC. CDSCs are applied to the lesser of the current market value at the time of redemption or the original purchase cost of the shares being redeemed. Proceeds from CDSCs are used to compensate the Distributor for providing distribution-related services in connection with the sale of these shares. During the six months November 30, 2013, CDSCs received by the Distributor amounted to $0, $1,028 and $2,015 for Class A, Class B, and Class C shares, respectively.
| Semiannual report | Massachusetts Tax-Free Income Fund | 25 |
Transfer agent fees. The fund has a transfer agent agreement with John Hancock Signature Services, Inc. (Signature Services), an affiliate of the Advisor. The transfer agent fees paid to Signature Services are determined based on the cost to Signature Services (Signature Services Cost) of providing recordkeeping services. The Signature Services Cost includes a component of allocated John Hancock corporate overhead for providing transfer agent services to the fund and to all other John Hancock affiliated funds. It also includes out-of-pocket expenses, including payments made to third-parties for recordkeeping services provided to their clients who invest in one or more John Hancock funds. In addition, Signature Services Cost may be reduced by certain fees that Signature Services receives in connection with retirement and small accounts. Signature Services Cost is calculated monthly and allocated, as applicable, to five categories of share classes: Retail Share and Institutional Classes of Non Municipal Bond Funds, Class R6 Shares, Retirement Share Classes and Municipal Bond Share Classes. Within each of these categories, the applicable costs are allocated to the affected John Hancock affiliated funds and/or classes, based on the relative average daily net assets.
Prior to October 1, 2013, Signature Services Cost was calculated monthly and allocated, as applicable, to four categories of share classes: Institutional Share Classes, Retirement Share Classes, Municipal Bond Share Classes and all other Retail Share Classes. Within each of these categories, the applicable costs were allocated to the affected John Hancock affiliated funds and/or classes, based on the relative average daily net assets.
Class level expenses. Class level expenses for the six months ended November 30, 2013 were:
| DISTRIBUTION AND | TRANSFER AGENT | |||||||
| CLASS | SERVICE FEES | FEES | ||||||
| A | $131,619 | $28,901 | ||||||
| B | $13,603 | $896 | ||||||
| C | $82,337 | $5,419 | ||||||
| Total | $227,559 | $35,216 | ||||||
Trustee expenses. The fund compensates each Trustee who is not an employee of the Advisor or its affiliates. The costs of paying Trustee compensation and expenses are allocated to the fund based on its net assets relative to other funds within the John Hancock funds complex.
Note 5 — Fund share transactions
Transactions in fund shares for the six months ended November 30, 2013 and the year ended May 31, 2013 were as follows:
| Six months ended 11-30-13 | Year ended 5-31-13 | |||
| Shares | Amount | Shares | Amount | |
| Class A shares | ||||
| Sold | 509,974 | $6,141,775 | 968,028 | $12,758,934 |
| Distributions reinvested | 114,130 | 1,369,508 | 209,720 | 2,766,056 |
| Repurchased | (1,807,026) | (21,840,823) | (1,218,206) | (16,078,058) |
| Net decrease | (1,182,922) | ($14,329,540) | (40,458) | ($553,068) |
| Class B shares | ||||
| Sold | 518 | $6,522 | 48,013 | $632,987 |
| Distributions reinvested | 2,554 | 30,641 | 4,919 | 64,872 |
| Repurchased | (46,350) | (556,981) | (70,184) | (924,865) |
| Net decrease | (43,278) | ($519,818) | (17,252) | ($227,006) |
| 26 | Massachusetts Tax-Free Income Fund | Semiannual report |
| Six months ended 11-30-13 | Year ended 5-31-13 | |||
| Shares | Amount | Shares | Amount | |
| Class C shares | ||||
| Sold | 14,921 | $188,216 | 211,768 | $2,794,376 |
| Distributions reinvested | 17,371 | 208,500 | 32,179 | 424,360 |
| Repurchased | (335,172) | (4,036,377) | (194,723) | (2,562,978) |
| Net increase (decrease) | (302,880) | ($3,639,661) | 49,224 | $655,758 |
| Total net decrease | (1,529,080) | ($18,489,019) | (8,486) | ($124,316) |
Note 6 — Purchase and sale of securities
Purchases and sales of securities, other than short-term securities, amounted to $8,268,379 and $21,705,768, respectively, for the six months ended November 30, 2013.
| Semiannual report | Massachusetts Tax-Free Income Fund | 27 |
More information
| Trustees | Investment advisor |
| James M. Oates, Chairperson | John Hancock Advisers, LLC |
| Steven R. Pruchansky, Vice Chairperson | |
| Charles L. Bardelis* | Subadvisor |
| James R. Boyle† | John Hancock Asset Management a division of |
| Craig Bromley† | Manulife Asset Management (US) LLC |
| Peter S. Burgess* | |
| William H. Cunningham | Principal distributor |
| Grace K. Fey | John Hancock Funds, LLC |
| Theron S. Hoffman* | |
| Deborah C. Jackson | Custodian |
| Hassell H. McClellan | State Street Bank and Trust Company |
| Gregory A. Russo | |
| Warren A. Thomson† | Transfer agent |
| John Hancock Signature Services, Inc. | |
| Officers | |
| Hugh McHaffie | Legal counsel |
| President | K&L Gates LLP |
| Andrew G. Arnott | |
| Executive Vice President | |
| Thomas M. Kinzler | |
| Secretary and Chief Legal Officer | |
| Francis V. Knox, Jr. | |
| Chief Compliance Officer | |
| Charles A. Rizzo | |
| Chief Financial Officer | |
| Salvatore Schiavone | |
| Treasurer | |
| *Member of the Audit Committee | |
| †Non-Independent Trustee | |
The fund’s proxy voting policies and procedures, as well as the fund’s proxy voting record for the most recent twelve-month period ended June 30, are available free of charge on the Securities and Exchange Commission (SEC) website at sec.gov or on our website.
The fund’s complete list of portfolio holdings, for the first and third fiscal quarters, is filed with the SEC on Form N-Q. The fund’s Form N-Q is available on our website and the SEC’s website, sec.gov, and can be reviewed and copied (for a fee) at the SEC’s Public Reference Room in Washington, DC. Call 800-SEC-0330 to receive information on the operation of the SEC’s Public Reference Room.
We make this information on your fund, as well as monthly portfolio holdings, and other fund details available on our website at jhinvestments.com or by calling 800-225-5291.
| You can also contact us: | ||
| 800-225-5291 | Regular mail: | Express mail: |
| jhinvestments.com | Investment Operations | Investment Operations |
| John Hancock Signature Services, Inc. | John Hancock Signature Services, Inc. | |
| P.O. Box 55913 | 30 Dan Road | |
| Boston, MA 02205-5913 | Canton, MA 02021 |
| 28 | Massachusetts Tax-Free Income Fund | Semiannual report |

800-225-5291
800-338-8080 EASI-Line
jhinvestments.com

| This report is for the information of the shareholders of John Hancock Massachusetts Tax-Free Income Fund. | |
| It is not authorized for distribution to prospective investors unless preceded or accompanied by a prospectus. | 77SA 11/13 |
| MF167894 | 1/14 |
ITEM 2. CODE OF ETHICS.
Not applicable at this time.
ITEM 3. AUDIT COMMITTEE FINANCIAL EXPERT.
Not applicable at this time.
ITEM 4. PRINCIPAL ACCOUNTANT FEES AND SERVICES.
Not applicable at this time.
ITEM 5. AUDIT COMMITTEE OF LISTED REGISTRANTS.
Not applicable at this time.
ITEM 6. SCHEDULE OF INVESTMENTS.
(a) Not applicable.
(b) Not applicable.
ITEM 7. DISCLOSURE OF PROXY VOTING POLICIES AND PROCEDURES FOR CLOSED-END MANAGEMENT INVESTMENT COMPANIES.
Not applicable.
ITEM 8. PORTFOLIO MANAGERS OF CLOSED-END MANAGEMENT INVESTMENT COMPANIES.
Not applicable.
ITEM 9. PURCHASES OF EQUITY SECURITIES BY CLOSED-END MANAGEMENT INVESTMENT COMPANY AND AFFILIATED PURCHASERS.
Not applicable.
ITEM 10. SUBMISSION OF MATTERS TO A VOTE OF SECURITY HOLDERS.
Not applicable.
ITEM 11. CONTROLS AND PROCEDURES.
(a) Based upon their evaluation of the registrant's disclosure controls and procedures as conducted within 90 days of the filing date of this Form N-CSR, the registrant's principal executive officer and principal financial officer have concluded that those disclosure controls and procedures provide reasonable assurance that the material information required to be disclosed by the registrant on this report is recorded, processed, summarized and reported within the time periods specified in the Securities and Exchange Commission's rules and forms.
(b) There were no changes in the registrant's internal control over financial reporting that occurred during the registrant's most recent fiscal half-year (the registrant's second fiscal half-year in the case of an annual report) that have materially affected, or are reasonably likely to materially affect, the registrant's internal control over financial reporting.
ITEM 12. EXHIBITS.
(a) Separate certifications for the registrant's principal executive officer and principal financial officer, as required by Section 302 of the Sarbanes-Oxley Act of 2002 and Rule 30a-2(a) under the Investment Company Act of 1940, are attached.
(b) Separate certifications for the registrant's principal executive officer and principal financial officer, as required by 18 U.S.C. Section 1350, as adopted pursuant to Section 906 of the Sarbanes-Oxley Act of 2002, and Rule 30a-2(b) under the Investment Company Act of 1940, are attached. The certifications furnished pursuant to this paragraph are not deemed to be "filed" for purposes of Section 18 of the Securities Exchange Act of 1934, or otherwise subject to the liability of that section. Such certifications are not deemed to be incorporated by reference into any filing under the Securities Act of 1933 or the Securities Exchange Act of 1934, except to the extent that the Registrant specifically incorporates them by reference.
(c)(1) Contact person at the registrant.
| SIGNATURES |
Pursuant to the requirements of the Securities Exchange Act of 1934 and the Investment Company Act of 1940, the registrant has duly caused this report to be signed on its behalf by the undersigned, thereunto duly authorized.
| John Hancock Tax-Exempt Series Fund | |
| By: | /s/ Hugh McHaffie |
| Hugh McHaffie | |
| President | |
| Date: | January 24, 2014 |
Pursuant to the requirements of the Securities Exchange Act of 1934 and the Investment Company Act of 1940, this report has been signed below by the following persons on behalf of the registrant and in the capacities and on the dates indicated.
| By: | /s/ Hugh McHaffie |
| Hugh McHaffie | |
| President | |
| Date: | January 24, 2014 |
| By: | /s/ Charles A. Rizzo |
| Charles A. Rizzo | |
| Chief Financial Officer | |
| Date: | January 24, 2014 |