UNITED STATES
SECURITIES AND EXCHANGE COMMISSION
Washington, D.C. 20549
FORM N-CSR
CERTIFIED SHAREHOLDER REPORT OF REGISTERED
MANAGEMENT INVESTMENT COMPANIES
Investment Company Act file number 811- 5079
John Hancock Tax-Exempt Series Fund
(Exact name of registrant as specified in charter)
601 Congress Street, Boston, Massachusetts 02210
(Address of principal executive offices) (Zip code)
Salvatore Schiavone
Treasurer
601 Congress Street
Boston, Massachusetts 02210
(Name and address of agent for service)
Registrant's telephone number, including area code: 617-663-4497
| Date of fiscal year end: | May 31 |
| Date of reporting period: | November 30, 2014 |
ITEM 1: REPORTS TO STOCKHOLDERS.
John Hancock
New York Tax-Free Income Fund
Semiannual report 11/30/14


A message to shareholders
Dear fellow shareholder,
Robust economic growth in the United States continues to set the standard globally. Unemployment has ratcheted down to pre-recession levels, consumer confidence and spending are rising, and inflation remains low. Bond markets have turned in positive performance against this backdrop as investors pursue yield where they can find it. Despite a 30-year bull market in bonds, many U.S. bond yields look compelling when compared with other developed markets around the world.
The coming year may likely present greater challenges for bond investors, however. The U.S. Federal Reserve (Fed) has signaled its intention to be patient in beginning to raise short-term interest rates. Once the Fed does raise the rates, it may have an adverse affect on many fixed-income portfolios, particularly those that invest in less-liquid markets. At John Hancock Investments, we are closely monitoring our fixed-income portfolios and communicating regularly with their portfolio managers about these issues. Now may also be a good time for you to discuss your fixed-income strategy with your financial advisor to determine if your portfolio continues to match your long-term goals.
A new look
I am pleased to introduce you to our redesigned shareholder reports. As part of an effort to elevate the educational substance in our communications, we undertook an initiative to make our reports more engaging and easier to navigate. Included in the changes are a performance snapshot that shows your fund's performance against that of its benchmark, and a Q&A with your fund's lead portfolio manager. We hope these enhancements give you better insight into your fund's activity and performance.
On behalf of everyone at John Hancock Investments, I'd like to take this opportunity to thank you for the continued trust you've placed in us and wish you a happy and healthy 2015.
Sincerely,

Andrew G. Arnott
President and Chief Executive Officer
John Hancock Investments
This commentary reflects the CEO's views as of November 30, 2014. They are subject to change at any time. For more up-to-date information, you can visit our website at jhinvestments.com.
John Hancock
New York Tax-Free Income Fund
1
INVESTMENT OBJECTIVE
The fund seeks a high level of current income, consistent with preservation of capital, that is exempt from federal, New York State, and New York City personal income taxes.
AVERAGE ANNUAL TOTAL RETURNS AS OF 11/30/14 (%)
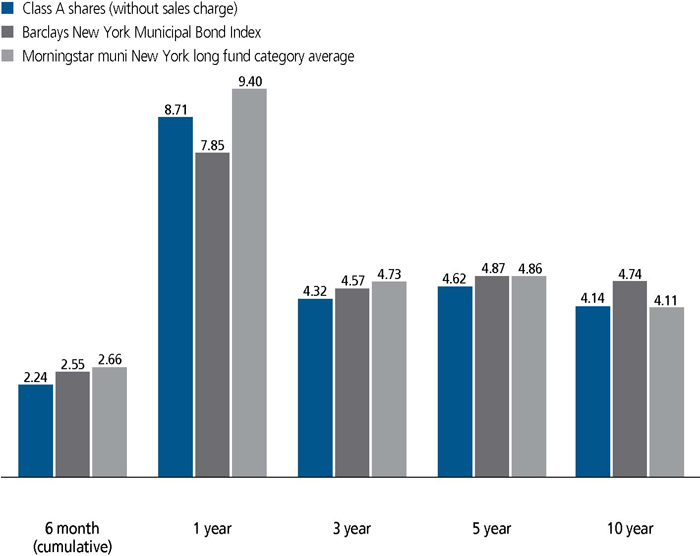
The Barclays New York Municipal Bond Index is an unmanaged index of New York investment-grade municipal bonds.
It is not possible to invest directly in an index.
Figures from Morningstar, Inc. include reinvested distributions and do not take into account sales charges. Actual load-adjusted performance is lower.
The past performance shown here reflects reinvested distributions and the beneficial effect of any expense reductions, and does not guarantee future results. Returns for periods shorter than one year are cumulative, and results for other share classes will vary. Shares will fluctuate in value and, when redeemed, may be worth more or less than their original cost. Current performance may be lower or higher than the performance cited, and can be found at jhinvestments.com or by calling 800-225-5291. For further information on the fund's objectives, risks, and strategy, see the fund's prospectus.
2
PERFORMANCE HIGHLIGHTS OVER THE LAST SIX MONTHS
Municipal bonds advanced
Favorable supply-and-demand conditions and a lack of inflationary pressure contributed to positive returns in the municipal bond market, and New York municipal bonds fared slightly better.
Fund underperformed
The fund modestly trailed the performance of its benchmark, the Barclays New York Municipal Bond Index.
Shorter duration and Puerto Rico exposure detracted
The fund's underperformance versus its benchmark was driven by a shorter duration (i.e., less interest-rate sensitivity) and exposure to Puerto Rico.
PORTFOLIO COMPOSITION AS OF 11/30/14 (%)

A note about risks
Fixed-income investments are subject to interest-rate and credit risk; their value will normally decline as interest rates rise or if a creditor, grantor, or counterparty is unable or unwilling to make principal, interest, or settlement payments. Investments in higher-yielding, lower-rated securities include a higher risk of default. Municipal bond prices can decline due to fiscal mismanagement or tax shortfalls, or if related projects become unprofitable. If the fund invests heavily in any one state or region, performance could be disproportionately affected by factors particular to that state or region. Events in the financial markets have resulted, and may continue to result, in an unusually high degree of volatility in the financial markets, both domestic and foreign. In addition, reduced liquidity in credit and fixed-income markets may adversely affect issuers worldwide. Certain market conditions, including reduced trading volume, heightened volatility, and rising interest rates, may impair liquidity, the ability of the fund to sell securities or close derivative positions at advantageous prices. The use of hedging and derivatives could produce disproportionate gains or losses and may increase costs. Sector investing is subject to greater risks than the market as a whole. Because the fund may focus on particular sectors of the economy, its performance may depend on the performance of those sectors, and investments focused in one sector may fluctuate more widely than investments diversified across sectors. Please see the fund's prospectus for additional risks.
3
An interview with Portfolio Manager Dianne M. Sales, CFA, John Hancock Asset Management, a division of Manulife Asset Management (US) LLC

Dianne M. Sales, CFA
Portfolio Manager
John Hancock Asset Management
What factors contributed to the positive returns in the municipal bond market over the past six months?
Supply and demand in the municipal bond market aided performance during the six-month period. Through November 30, 2014, new municipal bond issuance year to date was 4% lower than for the same period in 2013. Moreover, a meaningful portion of the new issues in the muni market, especially during the last half of the six-month period, was used to refinance existing securities, which does not materially increase the volume of outstanding municipal bonds. On the other side of the equation, investor demand picked up, resulting in steadily positive inflows into the municipal bond market. This stood in contrast to 2013, when investment dollars flowed out of the muni market.
The favorable supply-and-demand backdrop helped tax-exempt municipal bonds outperform the broad taxable bond market. As a point of reference, the Barclays Municipal Bond Index returned 2.45% for the six-month period, while the Barclays U.S. Aggregate Bond Index, a broad taxable bond market measure, returned 1.92%. New York municipal bonds fared slightly better as the Barclays New York Municipal Bond Index returned 2.55%.
How did the economic environment affect the muni market?
Economic conditions were supportive for bonds in general. Inflation in the United States remained well below its long-term historical average, in part because of declining energy prices and slowing economic growth elsewhere in the world, particularly in Europe and China. But we are also seeing little evidence of domestic wage pressure, despite stronger job numbers and a lower unemployment rate. The lack of inflationary pressure enabled bond yields to trend lower during the six-month period, leading to higher bond prices.
Munis also benefited from stronger economic data in the United States, which typically boosts state and local tax revenues, aids publicly funded development projects, and strengthens municipal credit quality.
4
Speaking of which, did any municipal credit concerns develop in New York over the last six months?
New York credit quality remained solid as the state's economy continued to improve. Tax revenues have remained on an upward trajectory and government spending levels have been relatively stable. After struggling with enormous budget shortfalls in the wake of the 2008 credit crisis and recession, the state of New York delivered timely balanced budgets in each of the past four years.
The state's prudent fiscal stewardship led to a credit rating upgrade on state debt from each of the major credit rating agencies in mid-2014. The state's current credit rating is the highest it has been since the mid-1970s. In New York City, tax revenues exceeded expectations thanks to improving economic conditions driven by a strengthening financial services sector.
Looking at the portfolio, what contributed to the fund's underperformance of its benchmark, the Barclays New York Municipal Bond Index?
The fund's duration (a measure of interest-rate sensitivity) detracted from relative results. The fund's duration (4.2 years as of November 30, 2014) was shorter than that of the benchmark (4.5 years as of November 30, 2014), which meant that the fund had less interest-rate sensitivity, so it did not
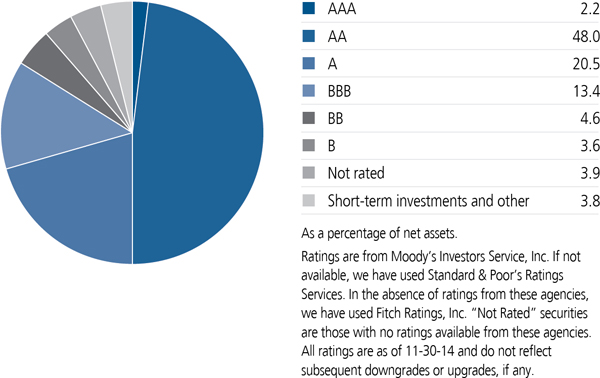
QUALITY COMPOSITION AS OF 11/30/14 (%)
5
benefit as much from declining municipal bond yields. Furthermore, several of the fund's holdings were subject to near-term call pressure as issuers exercised their right to pay off the bonds prior to maturity. These securities had relatively high yields and traded at a premium, so the call led to downward pressure on their prices as they moved closer to par.
The fund's small position in bonds issued by the Commonwealth of Puerto Rico, which are not represented in the benchmark, also had a negative impact on relative performance. Puerto Rico has been struggling with a persistent economic downturn and potential liquidity problems. We continued to reduce the fund's Puerto Rico holdings during the six-month period; as of November 30, 2014, they made up approximately 3.7% of net assets, compared with 5.1% six months ago. The fund's Puerto Rico holdings consisted entirely of sales tax revenue bonds, so they are tied to a dedicated revenue stream rather than to general fund collections.
What contributed positively to results versus the benchmark over the last six months?
The fund's lower-grade, higher-yielding holdings benefited from continued investor demand for yield. Examples included the fund's holdings of bonds financing industrial development and pollution control projects, as well as securities rated BBB, the lower end of the investment-grade credit rating spectrum. The fund also benefited from its lower-rated healthcare bonds, especially those financing hospitals that are viewed as critical suppliers in their region of the state.
Are there any noteworthy themes in the municipal bond market?
In recent years, the federal budget deficit has prompted some proposals to limit the tax exemption that municipal bond interest payments have enjoyed since the passage of the Revenue Act of 1913.
TOP 10 HOLDINGS AS OF 11/30/14 (%)
| Oneida County Industrial Development Agency, Hamilton College Project, Series A, zero coupon bond, 7-1-29 | 5.6 |
| New York State Dormitory Authority, State University Educational Facilities, Series A, 5.500%, 5-15-19 | 4.5 |
| Upper Mohawk Valley Regional Water Finance Authority, Water Revenue, zero coupon bond, 4-1-22 | 3.6 |
| New York City Municipal Water Finance Authority, Water Revenue, Series D, zero coupon bond, 6-15-20 | 3.6 |
| Triborough Bridge & Tunnel Authority, Highway Revenue Tolls, Escrowed to Maturity, Series Y, 6.125%, 1-1-21 | 3.5 |
| Long Island Power Authority, Electric, Power & Light Revenues, Series A, 5.750%, 4-1-39 | 3.3 |
| New York State Dormitory Authority, Fordham University, 5.000%, 7-1-44 | 2.9 |
| New York Local Assistance Corp., Sales Tax Revenue, Series C, 5.500%, 4-1-17 | 2.6 |
| Brooklyn Arena Local Development Corp., Barclays Center Project, 6.375%, 7-15-43 | 2.3 |
| Long Island Power Authority, Electric, Power & Light Revenues, Series A, 6.000%, 5-1-33 | 2.3 |
| Total | 34.2 |
| As a percentage of net assets. | |
| Cash and cash equivalents are not included. |
6
In 2014, there were proposals from both Congress and the White House recommending a cap on the municipal bond interest tax deduction for higher-income investors.
As a result of the November midterm elections, Republicans will control both houses of Congress starting in January 2015. Given the potential for conflicting priorities between Congress and the president, we anticipate that near-term changes to the municipal bond interest tax deduction are unlikely.
Can you provide some details about the timing of the fund's proposed merger?
The fund's Board of Trustees approved the merger of the fund into John Hancock Tax-Free Bond Fund. Shareholders have approved the merger, and it is expected to occur at the close of business on or about February 13, 2015.
MANAGED BY
| | Dianne M. Sales, CFA On the fund since 1995 Investing since 1984 |
7
TOTAL RETURNS FOR THE PERIOD ENDED NOVEMBER 30, 2014
| Average annual total returns (%) with maximum sales charge | Cumulative total returns (%) with maximum sales charge | SEC 30-day yield (%) subsidized | SEC 30-day yield (%) unsubsidized1 | Tax- equivalent subsidized yield (%)2 | |||||||||
| 1-year | 5-year | 10-year | 6-month | 5-year | 10-year | as of 11-30-14 | as of 11-30-14 | as of 11-30-14 | |||||
| Class A | 4.36 | 3.76 | 3.71 | -1.84 | 20.29 | 43.98 | 1.71 | 1.56 | 3.31 | ||||
| Class B | 2.99 | 3.52 | 3.56 | -3.06 | 18.91 | 41.89 | 1.03 | 0.93 | 2.00 | ||||
| Class C | 6.99 | 3.87 | 3.41 | 0.94 | 20.92 | 39.80 | 1.03 | 0.93 | 2.00 | ||||
| Index 1† | 7.85 | 4.87 | 4.74 | 2.55 | 26.85 | 58.93 | — | — | — | ||||
| Index 2† | 8.23 | 5.12 | 4.81 | 2.45 | 28.39 | 59.99 | — | — | — | ||||
Performance figures assume all distributions have been reinvested. Figures reflect maximum sales charges on Class A shares of 4.0% and the applicable contingent deferred sales charge (CDSC) on Class B and Class C shares. The returns for Class A shares have been adjusted to reflect the reduction in the maximum sales charge from 4.5% to 4.0%, effective 2-3-14. The Class B shares' CDSC declines annually between years 1 to 6 according to the following schedule: 5%, 4%, 3%, 3%, 2%, 1%. No sales charge will be assessed after the sixth year. Class C shares held for less than one year are subject to a 1% CDSC.
The expense ratios of the fund, both net (including any fee waivers or expense limitations) and gross (excluding any fee waivers or expense limitations), are set forth according to the most recent publicly available prospectuses for the fund and may differ from those disclosed in the Financial highlights tables in this report. Had the fee waivers and expense limitations not been in place, gross expenses would apply. The expense ratios are as follows:
| Class A | Class B | Class C | |
| Gross (%) | 1.12 | 1.82 | 1.82 |
| Net (%) | 0.97 | 1.72 | 1.72 |
Please refer to the most recent prospectus and annual or semiannual report for more information on expenses and any expense limitation arrangements for each class.
The returns reflect past results and should not be considered indicative of future performance. The return and principal value of an investment will fluctuate so that shares, when redeemed, may be worth more or less than their original cost. Due to market volatility, the fund's current performance may be higher or lower than the performance shown. For current to the most recent month-end performance data, please call 800-225-5291 or visit the fund's website at jhinvestments.com.
The performance table above and the chart on the next page do not reflect the deduction of taxes that a shareholder would pay on fund distributions or the redemption of fund shares. The fund's performance results reflect any applicable fee waivers or expense reductions, without which the expenses would increase and results would have been less favorable.
| † | Index 1 is the Barclays New York Municipal Bond Index; Index 2 is the Barclays Municipal Bond Index. |
See the following page for footnotes.
8
This chart and table show what happened to a hypothetical $10,000 investment in John Hancock New York Tax-Free Income Fund for the share classes and periods indicated, assuming all distributions were reinvested. For comparison, we've shown the same investment in two separate indexes.
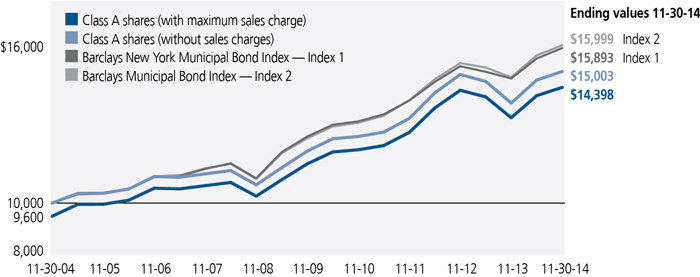
| Start date | With maximum sales charge ($) | Without sales charge ($) | Index 1 ($) | Index 2 ($) | |
| Class B3 | 11-30-04 | 14,189 | 14,189 | 15,893 | 15,999 |
| Class C3 | 11-30-04 | 13,980 | 13,980 | 15,893 | 15,999 |
The values shown in the chart for "Class A shares with maximum sales charge" have been adjusted to reflect the reduction in the Class A shares' maximum sales charge from 4.5% to 4.0%, which became effective on 2-3-14.
Performance of the classes will vary based on the difference in sales charges paid by shareholders investing in the different classes and the fee structure of those classes.
The Barclays New York Municipal Bond Index is an unmanaged index of New York investment-grade municipal bonds.
The Barclays Municipal Bond Index is an unmanaged index representative of the tax-exempt bond market.
It is not possible to invest directly in an index. Index figures do not reflect expenses or sales charges, which would have resulted in lower values.
Footnotes related to performance pages
| 1 | Unsubsidized yield reflects what the yield would have been without the effect of reimbursements and waivers. |
| 2 | Tax-equivalent yield is based on the maximum federal income tax rate of 43.4% and a state tax rate of 8.82%. |
| 3 | The contingent deferred sales charge is not applicable. |
9
These examples are intended to help you understand your ongoing operating expenses of investing in the fund so you can compare these costs with the ongoing costs of investing in other mutual funds.
Understanding fund expenses
As a shareholder of the fund, you incur two types of costs:
| • | Transaction costs, which include sales charges (loads) on purchases or redemptions (varies by share class), minimum account fee charge, etc. |
| • | Ongoing operating expenses, including management fees, distribution and service fees (if applicable), and other fund expenses. |
We are presenting only your ongoing operating expenses here.
Actual expenses/actual returns
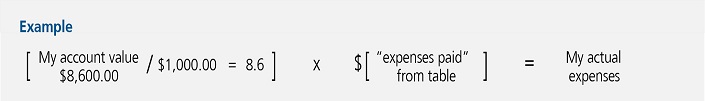
This example is intended to provide information about the fund's actual ongoing operating expenses, and is based on the fund's actual return. It assumes an account value of $1,000.00 on June 1, 2014, with the same investment held until November 30, 2014.
| Account value on 6-1-2014 | Ending value on 11-30-2014 | Expenses paid during period ended 11-30-20141 | Annualized expense ratio | |
| Class A | $1,000.00 | $1,022.40 | $5.73 | 1.13% |
| Class B | 1,000.00 | 1,019.40 | 9.57 | 1.89% |
| Class C | 1,000.00 | 1,019.40 | 9.52 | 1.88% |
Together with the value of your account, you may use this information to estimate the operating expenses that you paid over the period. Simply divide your account value at November 30, 2014, by $1,000.00, then multiply it by the "expenses paid" for your share class from the table above. For example, for an account value of $8,600.00, the operating expenses should be calculated as follows:
10
Hypothetical example for comparison purposes
This table allows you to compare the fund's ongoing operating expenses with those of any other fund. It provides an example of the fund's hypothetical account values and hypothetical expenses based on each class's actual expense ratio and an assumed 5% annualized return before expenses (which is not the fund's actual return). It assumes an account value of $1,000.00 on June 1, 2014, with the same investment held until November 30, 2014. Look in any other fund shareholder report to find its hypothetical example and you will be able to compare these expenses. Please remember that these hypothetical account values and expenses may not be used to estimate the actual ending account balance or expenses you paid for the period.
| Account value on 6-1-2014 | Ending value on 11-30-2014 | Expenses paid during period ended 11-30-20141 | Annualized expense ratio | |
| Class A | $1,000.00 | $1,019.40 | $5.72 | 1.13% |
| Class B | 1,000.00 | $1,015.60 | 9.55 | 1.89% |
| Class C | 1,000.00 | $1,015.60 | 9.50 | 1.88% |
Remember, these examples do not include any transaction costs, therefore, these examples will not help you to determine the relative total costs of owning different funds. If transaction costs were included, your expenses would have been higher. See the prospectus for details regarding transaction costs.
| 1 | Expenses are equal to the fund's annualized expense ratio, multiplied by the average account value over the period, multiplied by 183/365 (to reflect the one-half year period). |
11
Fund's investments
| As of 11-30-14 (unaudited) | ||||||||||||||||||||
| Rate (%) | Maturity date | Par value | Value | |||||||||||||||||
| Municipal bonds 96.2% | $49,457,982 | |||||||||||||||||||
| (Cost $44,672,894) | ||||||||||||||||||||
| New York 89.2% | 45,895,422 | |||||||||||||||||||
| Brooklyn Arena Local Development Corp. Barclays Center Project | 6.375 | 07-15-43 | 1,000,000 | 1,177,549 | ||||||||||||||||
| Chautauqua Asset Securitization Corp. Tobacco Settlement | 6.750 | 07-01-40 | 1,000,000 | 1,002,360 | ||||||||||||||||
| City of New York, Series D-1 | 5.000 | 10-01-36 | 1,000,000 | 1,128,990 | ||||||||||||||||
| City of New York, Series E-1 | 6.250 | 10-15-28 | 500,000 | 595,025 | ||||||||||||||||
| Hudson Yards Infrastructure Corp. Series A | 5.750 | 02-15-47 | 1,000,000 | 1,149,750 | ||||||||||||||||
| Long Island Power Authority Electric, Power & Light Revenues, Series A | 5.750 | 04-01-39 | 1,500,000 | 1,703,325 | ||||||||||||||||
| Long Island Power Authority Electric, Power & Light Revenues, Series A | 6.000 | 05-01-33 | 1,000,000 | 1,170,440 | ||||||||||||||||
| Metropolitan Transportation Authority Transit Revenue, Series A | 5.250 | 11-15-28 | 1,000,000 | 1,130,290 | ||||||||||||||||
| Metropolitan Transportation Authority Transit Revenue, Series B | 5.000 | 11-15-34 | 1,000,000 | 1,126,220 | ||||||||||||||||
| Monroe County Industrial Development Corp., Series A | 5.000 | 07-01-41 | 1,000,000 | 1,102,430 | ||||||||||||||||
| Monroe Newpower Corp. Electric, Power & Light Revenues | 5.100 | 01-01-16 | 520,000 | 520,707 | ||||||||||||||||
| New York City Industrial Development Agency Polytechnic University Project (D) | 5.250 | 11-01-27 | 1,000,000 | 1,111,740 | ||||||||||||||||
| New York City Industrial Development Agency Terminal One Group Association Project AMT (P) | 5.500 | 01-01-21 | 1,000,000 | 1,050,300 | ||||||||||||||||
| New York City Municipal Water Finance Authority Water Revenue, Series A | 5.750 | 06-15-40 | 1,000,000 | 1,146,480 | ||||||||||||||||
| New York City Municipal Water Finance Authority Water Revenue, Series D (Z) | 1.458 | 06-15-20 | 2,000,000 | 1,843,660 | ||||||||||||||||
| New York City Municipal Water Finance Authority Water Revenue, Series FF-2 | 5.000 | 06-15-40 | 1,000,000 | 1,111,180 | ||||||||||||||||
| New York City Municipal Water Finance Authority Water Revenue, Series GG-1 | 5.000 | 06-15-39 | 1,000,000 | 1,117,100 | ||||||||||||||||
| New York City Transitional Finance Authority Government Fund/Grant Revenue, Series S-4 | 5.500 | 01-15-39 | 1,000,000 | 1,142,140 | ||||||||||||||||
| New York Liberty Development Corp. 7 World Trade Center, Class 2 | 5.000 | 09-15-43 | 1,000,000 | 1,110,770 | ||||||||||||||||
| New York Liberty Development Corp. Bank of America Tower, Class 2 | 5.625 | 07-15-47 | 1,000,000 | 1,136,660 | ||||||||||||||||
| New York Local Assistance Corp. Sales Tax Revenue, Series C | 5.500 | 04-01-17 | 1,225,000 | 1,319,582 | ||||||||||||||||
| New York State Dormitory Authority Fordham University | 5.000 | 07-01-44 | 1,350,000 | 1,514,916 | ||||||||||||||||
| New York State Dormitory Authority Mount Sinai School of Medicine | 5.125 | 07-01-39 | 1,000,000 | $1,108,230 | ||||||||||||||||
| New York State Dormitory Authority North Shore Long Island Jewish Group, Series A | 5.000 | 05-01-41 | 1,000,000 | 1,092,230 | ||||||||||||||||
| New York State Dormitory Authority Orange Regional Medical Center | 6.125 | 12-01-29 | 750,000 | 803,325 | ||||||||||||||||
| New York State Dormitory Authority Rockefeller University, Series A | 5.000 | 07-01-41 | 1,000,000 | 1,136,130 | ||||||||||||||||
| New York State Dormitory Authority Series A | 5.000 | 03-15-43 | 1,000,000 | 1,146,690 | ||||||||||||||||
| New York State Dormitory Authority State University Educational Facilities, Series A (D) | 5.250 | 05-15-15 | 355,000 | 363,382 | ||||||||||||||||
| New York State Dormitory Authority State University Educational Facilities, Series A | 5.500 | 05-15-19 | 2,000,000 | 2,301,760 | ||||||||||||||||
| New York State Dormitory Authority Unrefunded General Purpose, Series E | 5.000 | 02-15-35 | 1,000,000 | 1,130,160 | ||||||||||||||||
| New York State Environmental Facilities Corp. Water Revenue, Series A | 5.000 | 06-15-34 | 1,000,000 | 1,125,850 | ||||||||||||||||
| Niagara Area Development Corp. Covanta Energy Project, Series A AMT (S) | 5.250 | 11-01-42 | 500,000 | 514,540 | ||||||||||||||||
| Oneida County Industrial Development Agency Hamilton College Project, Series A (D)(Z) | 4.276 | 07-01-29 | 5,330,000 | 2,868,340 | ||||||||||||||||
| Onondaga Civic Development Corp. | 5.125 | 07-01-31 | 1,000,000 | 1,054,020 | ||||||||||||||||
| Port Authority of New York & New Jersey 5th Installment Special Project AMT | 6.750 | 10-01-19 | 990,000 | 986,901 | ||||||||||||||||
| Port Authority of New York & New Jersey JFK International Airport Terminal | 6.000 | 12-01-36 | 1,000,000 | 1,163,220 | ||||||||||||||||
| Triborough Bridge & Tunnel Authority Highway Revenue Tolls, Escrowed to Maturity, Series Y | 6.125 | 01-01-21 | 1,500,000 | 1,821,360 | ||||||||||||||||
| Upper Mohawk Valley Regional Water Finance Authority Water Revenue (D)(Z) | 2.411 | 04-01-22 | 2,230,000 | 1,867,670 | ||||||||||||||||
| Puerto Rico 3.7% | 1,869,185 | |||||||||||||||||||
| Puerto Rico Sales Tax Financing Corp. Sales Tax Revenue, Series A (0.000% steps up to 6.750% on 8-1-16) (Z) | 1.860 | 08-01-32 | 1,000,000 | 773,900 | ||||||||||||||||
| Puerto Rico Sales Tax Financing Corp., Series C | 5.000 | 08-01-35 | 1,000,000 | 722,770 | ||||||||||||||||
| Puerto Rico Sales Tax Financing Corp., Series C | 5.375 | 08-01-38 | 500,000 | 372,515 | ||||||||||||||||
| Virgin Islands 2.2% | 1,141,140 | |||||||||||||||||||
| Virgin Islands Public Finance Authority, Series A | 6.750 | 10-01-37 | 1,000,000 | 1,141,140 | ||||||||||||||||
| Guam 1.1% | 552,235 | |||||||||||||||||||
| Guam Government, Series A | 5.750 | 12-01-34 | 500,000 | 552,235 | ||||||||||||||||
| Par value | Value | |||||||||||||||||||
| Short-term investments 2.7% | $1,410,000 | |||||||||||||||||||
| (Cost $1,410,000) | ||||||||||||||||||||
| Repurchase agreement 2.7% | 1,410,000 | |||||||||||||||||||
| Barclays Tri-Party Repurchase Agreement dated 11-28-14 at 0.060% to be repurchased at $1,410,007 on 12-1-14, collateralized by $1,322,900 U.S. Treasury Inflation Indexed Notes, 0.125% due 4-15-16 (valued at $1,438,229, including interest) | 1,410,000 | 1,410,000 | ||||||||||||||||||
| Total investments (Cost $46,082,894)† 98.9% | $50,867,982 | |||||||||||||||||||
| Other assets and liabilities, net 1.1% | $571,986 | |||||||||||||||||||
| Total net assets 100.0% | $51,439,968 | |||||||||||||||||||
The percentage shown for each investment category is the total value of the category as a percentage of the net assets of the fund. Key to Security Abbreviations and Legend | ||||||
| AMT | Interest earned from these securities may be considered a tax preference item for purpose of the Federal Alternative Minimum Tax. | |||||
| (D) | Bond is insured by one or more of these companies: | |||||
| Insurance Coverage | As a % of total Investments | |||||
| National Public Finance Guarantee Corp. | 6.4% | |||||
| Ambac Financial Group, Inc. | 3.7% | |||||
| ACA Financial Guaranty Corp. | 2.2% | |||||
| Total | 12.3% | |||||
| (P) | Variable rate obligation. The coupon rate shown represents the rate at period end. | |||||
| (S) | These securities are exempt from registration under Rule 144A of the Securities Act of 1933. Such securities may be resold, normally to qualified institutional buyers, in transactions exempt from registration. | |||||
| (Z) | Zero coupon bonds are issued at a discount from their principal amount in lieu of paying interest periodically. Rate shown is the effective yield at period end. | |||||
| † | At 11-30-14, the aggregate cost of investment securities for federal income tax purposes was $45,955,122. Net unrealized appreciation aggregated $4,912,860 of which $5,269,104 related to appreciated investment securities and $356,244 related to depreciated investment securities. | |||||
Financial statements
STATEMENT OF ASSETS AND LIABILITIES 11-30-14 (unaudited)
| Assets | ||||||||||||||||||||||||||||||||||||||||
| Investments, at value (Cost $46,082,894) | $50,867,982 | |||||||||||||||||||||||||||||||||||||||
| Cash | 69,630 | |||||||||||||||||||||||||||||||||||||||
| Receivable for fund shares sold | 6,531 | |||||||||||||||||||||||||||||||||||||||
| Interest receivable | 606,724 | |||||||||||||||||||||||||||||||||||||||
| Receivable from affiliates | 628 | |||||||||||||||||||||||||||||||||||||||
| Other receivables and prepaid expenses | 4,303 | |||||||||||||||||||||||||||||||||||||||
| Total assets | 51,555,798 | |||||||||||||||||||||||||||||||||||||||
| Liabilities | ||||||||||||||||||||||||||||||||||||||||
| Payable for fund shares repurchased | 43,749 | |||||||||||||||||||||||||||||||||||||||
| Distributions payable | 17,862 | |||||||||||||||||||||||||||||||||||||||
| Payable to affiliates | ||||||||||||||||||||||||||||||||||||||||
| Accounting and legal services fees | 1,924 | |||||||||||||||||||||||||||||||||||||||
| Transfer agent fees | 4,412 | |||||||||||||||||||||||||||||||||||||||
| Distribution and service fees | 6,283 | |||||||||||||||||||||||||||||||||||||||
| Trustees' fees | 155 | |||||||||||||||||||||||||||||||||||||||
| Other liabilities and accrued expenses | 41,445 | |||||||||||||||||||||||||||||||||||||||
| Total liabilities | 115,830 | |||||||||||||||||||||||||||||||||||||||
| Net assets | $51,439,968 | |||||||||||||||||||||||||||||||||||||||
| Net assets consist of | ||||||||||||||||||||||||||||||||||||||||
| Paid-in capital | $47,651,854 | |||||||||||||||||||||||||||||||||||||||
| Accumulated distributions in excess of net investment income | (8,650 | ) | ||||||||||||||||||||||||||||||||||||||
| Accumulated net realized gain (loss) on investments | (988,324 | ) | ||||||||||||||||||||||||||||||||||||||
| Net unrealized appreciation (depreciation) on investments | 4,785,088 | |||||||||||||||||||||||||||||||||||||||
| Net assets | $51,439,968 | |||||||||||||||||||||||||||||||||||||||
STATEMENT OF ASSETS AND LIABILITIES (continued)
| Net asset value per share | ||||||||||||||||||
| Based on net asset values and shares outstanding-the fund has an unlimited number of shares authorized with no par value | ||||||||||||||||||
| Class A ($42,162,820 ÷ 3,418,311 shares)1 | $12.33 | |||||||||||||||||
| Class B ($1,617,090 ÷ 131,089 shares)1 | $12.34 | |||||||||||||||||
| Class C ($7,660,058 ÷ 620,917 shares)1 | $12.34 | |||||||||||||||||
| Maximum offering price per share | ||||||||||||||||||
| Class A (net asset value per share ÷ 96%)2 | $12.84 | |||||||||||||||||
| 1 | Redemption price per share is equal to net asset value less any applicable contingent deferred sales charge. | |||||||
| 2 | On single retail sales of less than $100,000. On sales of $100,000 or more and on group sales the offering price is reduced. | |||||||
STATEMENT OF OPERATIONS For the six months ended 11-30-14 (unaudited)
| Investment income | ||||||||||||||||||||||||||||||||||||||||
| Interest | $1,217,815 | |||||||||||||||||||||||||||||||||||||||
| Expenses | ||||||||||||||||||||||||||||||||||||||||
| Investment management fees | 132,983 | |||||||||||||||||||||||||||||||||||||||
| Distribution and service fees | 112,896 | |||||||||||||||||||||||||||||||||||||||
| Accounting and legal services fees | 4,787 | |||||||||||||||||||||||||||||||||||||||
| Transfer agent fees | 15,174 | |||||||||||||||||||||||||||||||||||||||
| Trustees' fees | 308 | |||||||||||||||||||||||||||||||||||||||
| State registration fees | 4,180 | |||||||||||||||||||||||||||||||||||||||
| Printing and postage | 3,603 | |||||||||||||||||||||||||||||||||||||||
| Professional fees | 80,261 | |||||||||||||||||||||||||||||||||||||||
| Custodian fees | 5,984 | |||||||||||||||||||||||||||||||||||||||
| Registration and filing fees | 13,031 | |||||||||||||||||||||||||||||||||||||||
| Other | 3,070 | |||||||||||||||||||||||||||||||||||||||
| Total expenses | 376,277 | |||||||||||||||||||||||||||||||||||||||
| Less expense reductions | (39,462 | ) | ||||||||||||||||||||||||||||||||||||||
| Net expenses | 336,815 | |||||||||||||||||||||||||||||||||||||||
| Net investment income | 881,000 | |||||||||||||||||||||||||||||||||||||||
| Realized and unrealized gain (loss) | ||||||||||||||||||||||||||||||||||||||||
| Net realized gain (loss) on | ||||||||||||||||||||||||||||||||||||||||
| Investments | (158,487 | ) | ||||||||||||||||||||||||||||||||||||||
| (158,487 | ) | |||||||||||||||||||||||||||||||||||||||
| Change in net unrealized appreciation (depreciation) of | ||||||||||||||||||||||||||||||||||||||||
| Investments | 439,259 | |||||||||||||||||||||||||||||||||||||||
| 439,259 | ||||||||||||||||||||||||||||||||||||||||
| Net realized and unrealized gain | 280,772 | |||||||||||||||||||||||||||||||||||||||
| Increase in net assets from operations | $1,161,772 | |||||||||||||||||||||||||||||||||||||||
STATEMENTS OF CHANGES IN NET ASSETS
| Six months ended 11-30-14 | Year ended 5-31-14 | |||||||||||||||||||||||||||||||||||||||||||||||||
| (unaudited) | ||||||||||||||||||||||||||||||||||||||||||||||||||
| Increase (decrease) in net assets | ||||||||||||||||||||||||||||||||||||||||||||||||||
| From operations | ||||||||||||||||||||||||||||||||||||||||||||||||||
| Net investment income | $881,000 | $2,053,114 | ||||||||||||||||||||||||||||||||||||||||||||||||
| Net realized loss | (158,487 | ) | (962,310 | ) | ||||||||||||||||||||||||||||||||||||||||||||||
| Change in net unrealized appreciation (depreciation) | 439,259 | (1,552,635 | ) | |||||||||||||||||||||||||||||||||||||||||||||||
| Increase (decrease) in net assets resulting from operations | 1,161,772 | (461,831 | ) | |||||||||||||||||||||||||||||||||||||||||||||||
| Distributions to shareholders | ||||||||||||||||||||||||||||||||||||||||||||||||||
| From net investment income | ||||||||||||||||||||||||||||||||||||||||||||||||||
| Class A | (791,106 | ) | (1,769,144 | ) | ||||||||||||||||||||||||||||||||||||||||||||||
| Class B | (24,804 | ) | (60,420 | ) | ||||||||||||||||||||||||||||||||||||||||||||||
| Class C | (110,793 | ) | (245,143 | ) | ||||||||||||||||||||||||||||||||||||||||||||||
| Total distributions | (926,703 | ) | (2,074,707 | ) | ||||||||||||||||||||||||||||||||||||||||||||||
| From fund share transactions | (3,554,437 | ) | (7,651,568 | ) | ||||||||||||||||||||||||||||||||||||||||||||||
| Total decrease | (3,319,368 | ) | (10,188,106 | ) | ||||||||||||||||||||||||||||||||||||||||||||||
| Net assets | ||||||||||||||||||||||||||||||||||||||||||||||||||
| Beginning of period | 54,759,336 | 64,947,442 | ||||||||||||||||||||||||||||||||||||||||||||||||
| End of period | $51,439,968 | $54,759,336 | ||||||||||||||||||||||||||||||||||||||||||||||||
| Undistributed (accumulated distributions in excess of) net investment income | ($8,650 | ) | $37,053 | |||||||||||||||||||||||||||||||||||||||||||||||
Financial highlights
| Class A Shares Period ended | 11-30-14 | 1 | 5-31-14 | 5-31-13 | 5-31-12 | 5-31-11 | 5-31-10 | ||||||||||||||||||||||||||||||||||||||||||||||||||||||||||||||||||||||||||||||||||||||||||||||||||||||||||||||||
| Per share operating performance | |||||||||||||||||||||||||||||||||||||||||||||||||||||||||||||||||||||||||||||||||||||||||||||||||||||||||||||||||||||||
| Net asset value, beginning of period | $12.28 | $12.72 | $12.82 | $11.94 | $12.20 | $11.60 | |||||||||||||||||||||||||||||||||||||||||||||||||||||||||||||||||||||||||||||||||||||||||||||||||||||||||||||||||
| Net investment income2 | 0.21 | 0.46 | 0.46 | 0.48 | 0.52 | 0.51 | |||||||||||||||||||||||||||||||||||||||||||||||||||||||||||||||||||||||||||||||||||||||||||||||||||||||||||||||||
| Net realized and unrealized gain (loss) on investments | 0.06 | (0.44 | ) | (0.06 | ) | 0.89 | (0.28 | ) | 0.60 | ||||||||||||||||||||||||||||||||||||||||||||||||||||||||||||||||||||||||||||||||||||||||||||||||||||||||||||||
| Total from investment operations | 0.27 | 0.02 | 0.40 | 1.37 | 0.24 | 1.11 | |||||||||||||||||||||||||||||||||||||||||||||||||||||||||||||||||||||||||||||||||||||||||||||||||||||||||||||||||
| Less distributions | |||||||||||||||||||||||||||||||||||||||||||||||||||||||||||||||||||||||||||||||||||||||||||||||||||||||||||||||||||||||
| From net investment income | (0.22 | ) | (0.46 | ) | (0.46 | ) | (0.48 | ) | (0.50 | ) | (0.51 | ) | |||||||||||||||||||||||||||||||||||||||||||||||||||||||||||||||||||||||||||||||||||||||||||||||||||||||||||
| From net realized gain | — | — | (0.04 | ) | (0.01 | ) | — | — | |||||||||||||||||||||||||||||||||||||||||||||||||||||||||||||||||||||||||||||||||||||||||||||||||||||||||||||||
| Total distributions | (0.22 | ) | (0.46 | ) | (0.50 | ) | (0.49 | ) | (0.50 | ) | (0.51 | ) | |||||||||||||||||||||||||||||||||||||||||||||||||||||||||||||||||||||||||||||||||||||||||||||||||||||||||||
| Net asset value, end of period | $12.33 | $12.28 | $12.72 | $12.82 | $11.94 | $12.20 | |||||||||||||||||||||||||||||||||||||||||||||||||||||||||||||||||||||||||||||||||||||||||||||||||||||||||||||||||
| Total return (%)3,4 | 2.24 | 5 | 0.34 | 3.11 | 11.71 | 2.04 | 9.71 | ||||||||||||||||||||||||||||||||||||||||||||||||||||||||||||||||||||||||||||||||||||||||||||||||||||||||||||||||
| Ratios and supplemental data | |||||||||||||||||||||||||||||||||||||||||||||||||||||||||||||||||||||||||||||||||||||||||||||||||||||||||||||||||||||||
| Net assets, end of period (in millions) | $42 | $45 | $53 | $53 | $50 | $54 | |||||||||||||||||||||||||||||||||||||||||||||||||||||||||||||||||||||||||||||||||||||||||||||||||||||||||||||||||
| Ratios (as a percentage of average net assets): | |||||||||||||||||||||||||||||||||||||||||||||||||||||||||||||||||||||||||||||||||||||||||||||||||||||||||||||||||||||||
| Expenses before reductions | 1.20 | 6 | 1.12 | 1.04 | 1.06 | 1.08 | 1.10 | ||||||||||||||||||||||||||||||||||||||||||||||||||||||||||||||||||||||||||||||||||||||||||||||||||||||||||||||||
| Expenses including reductions | 1.04 | 6 | 0.97 | 0.89 | 0.93 | 0.96 | 1.10 | ||||||||||||||||||||||||||||||||||||||||||||||||||||||||||||||||||||||||||||||||||||||||||||||||||||||||||||||||
| Net investment income | 3.45 | 6 | 3.82 | 3.53 | 3.92 | 4.31 | 4.27 | ||||||||||||||||||||||||||||||||||||||||||||||||||||||||||||||||||||||||||||||||||||||||||||||||||||||||||||||||
| Portfolio turnover (%) | 2 | 7 | 8 | 16 | 9 | 7 | |||||||||||||||||||||||||||||||||||||||||||||||||||||||||||||||||||||||||||||||||||||||||||||||||||||||||||||||||
| 1 | Six months ended 11-30-14. Unaudited. | |||||||||||||||||||||||||||||||||||||
| 2 | Based on average daily shares outstanding. | |||||||||||||||||||||||||||||||||||||
| 3 | Does not reflect the effect of sales charges, if any. | |||||||||||||||||||||||||||||||||||||
| 4 | Total returns would have been lower had certain expenses not been reduced during the applicable periods. | |||||||||||||||||||||||||||||||||||||
| 5 | Not annualized. | |||||||||||||||||||||||||||||||||||||
| 6 | Annualized. | |||||||||||||||||||||||||||||||||||||
| Class B Shares Period ended | 11-30-14 | 1 | 5-31-14 | 5-31-13 | 5-31-12 | 5-31-11 | 5-31-10 | ||||||||||||||||||||||||||||||||||||||||||||||||||||||||||||||||||||||||||||||||||||||||||||||||||||||||||||||||
| Per share operating performance | |||||||||||||||||||||||||||||||||||||||||||||||||||||||||||||||||||||||||||||||||||||||||||||||||||||||||||||||||||||||
| Net asset value, beginning of period | $12.28 | $12.72 | $12.82 | $11.94 | $12.21 | $11.60 | |||||||||||||||||||||||||||||||||||||||||||||||||||||||||||||||||||||||||||||||||||||||||||||||||||||||||||||||||
| Net investment income2 | 0.17 | 0.37 | 0.36 | 0.39 | 0.43 | 0.42 | |||||||||||||||||||||||||||||||||||||||||||||||||||||||||||||||||||||||||||||||||||||||||||||||||||||||||||||||||
| Net realized and unrealized gain (loss) on investments | 0.07 | (0.44 | ) | (0.06 | ) | 0.89 | (0.28 | ) | 0.61 | ||||||||||||||||||||||||||||||||||||||||||||||||||||||||||||||||||||||||||||||||||||||||||||||||||||||||||||||
| Total from investment operations | 0.24 | (0.07 | ) | 0.30 | 1.28 | 0.15 | 1.03 | ||||||||||||||||||||||||||||||||||||||||||||||||||||||||||||||||||||||||||||||||||||||||||||||||||||||||||||||||
| Less distributions | |||||||||||||||||||||||||||||||||||||||||||||||||||||||||||||||||||||||||||||||||||||||||||||||||||||||||||||||||||||||
| From net investment income | (0.18 | ) | (0.37 | ) | (0.36 | ) | (0.39 | ) | (0.42 | ) | (0.42 | ) | |||||||||||||||||||||||||||||||||||||||||||||||||||||||||||||||||||||||||||||||||||||||||||||||||||||||||||
| From net realized gain | — | — | (0.04 | ) | (0.01 | ) | — | — | |||||||||||||||||||||||||||||||||||||||||||||||||||||||||||||||||||||||||||||||||||||||||||||||||||||||||||||||
| Total distributions | (0.18 | ) | (0.37 | ) | (0.40 | ) | (0.40 | ) | (0.42 | ) | (0.42 | ) | |||||||||||||||||||||||||||||||||||||||||||||||||||||||||||||||||||||||||||||||||||||||||||||||||||||||||||
| Net asset value, end of period | $12.34 | $12.28 | $12.72 | $12.82 | $11.94 | $12.21 | |||||||||||||||||||||||||||||||||||||||||||||||||||||||||||||||||||||||||||||||||||||||||||||||||||||||||||||||||
| Total return (%)3,4 | 1.94 | 5 | (0.41 | ) | 2.34 | 10.90 | 1.25 | 9.03 | |||||||||||||||||||||||||||||||||||||||||||||||||||||||||||||||||||||||||||||||||||||||||||||||||||||||||||||||
| Ratios and supplemental data | |||||||||||||||||||||||||||||||||||||||||||||||||||||||||||||||||||||||||||||||||||||||||||||||||||||||||||||||||||||||
| Net assets, end of period (in millions) | $2 | $2 | $2 | $2 | $2 | $3 | |||||||||||||||||||||||||||||||||||||||||||||||||||||||||||||||||||||||||||||||||||||||||||||||||||||||||||||||||
| Ratios (as a percentage of average net assets): | |||||||||||||||||||||||||||||||||||||||||||||||||||||||||||||||||||||||||||||||||||||||||||||||||||||||||||||||||||||||
| Expenses before reductions | 1.90 | 6 | 1.82 | 1.74 | 1.76 | 1.77 | 1.80 | ||||||||||||||||||||||||||||||||||||||||||||||||||||||||||||||||||||||||||||||||||||||||||||||||||||||||||||||||
| Expenses including reductions | 1.79 | 6 | 1.72 | 1.64 | 1.66 | 1.66 | 1.80 | ||||||||||||||||||||||||||||||||||||||||||||||||||||||||||||||||||||||||||||||||||||||||||||||||||||||||||||||||
| Net investment income | 2.69 | 6 | 3.07 | 2.78 | 3.18 | 3.59 | 3.57 | ||||||||||||||||||||||||||||||||||||||||||||||||||||||||||||||||||||||||||||||||||||||||||||||||||||||||||||||||
| Portfolio turnover (%) | 2 | 7 | 8 | 16 | 9 | 7 | |||||||||||||||||||||||||||||||||||||||||||||||||||||||||||||||||||||||||||||||||||||||||||||||||||||||||||||||||
| 1 | Six months ended 11-30-14. Unaudited. | |||||||||||||||||||||||||||||||||||||
| 2 | Based on average daily shares outstanding. | |||||||||||||||||||||||||||||||||||||
| 3 | Does not reflect the effect of sales charges, if any. | |||||||||||||||||||||||||||||||||||||
| 4 | Total returns would have been lower had certain expenses not been reduced during the applicable periods. | |||||||||||||||||||||||||||||||||||||
| 5 | Not annualized. | |||||||||||||||||||||||||||||||||||||
| 6 | Annualized. | |||||||||||||||||||||||||||||||||||||
| Class C Shares Period ended | 11-30-14 | 1 | 5-31-14 | 5-31-13 | 5-31-12 | 5-31-11 | 5-31-10 | ||||||||||||||||||||||||||||||||||||||||||||||||||||||||||||||||||||||||||||||||||||||||||||||||||||||||||||||||
| Per share operating performance | |||||||||||||||||||||||||||||||||||||||||||||||||||||||||||||||||||||||||||||||||||||||||||||||||||||||||||||||||||||||
| Net asset value, beginning of period | $12.28 | $12.72 | $12.82 | $11.94 | $12.21 | $11.60 | |||||||||||||||||||||||||||||||||||||||||||||||||||||||||||||||||||||||||||||||||||||||||||||||||||||||||||||||||
| Net investment income2 | 0.17 | 0.37 | 0.36 | 0.39 | 0.43 | 0.43 | |||||||||||||||||||||||||||||||||||||||||||||||||||||||||||||||||||||||||||||||||||||||||||||||||||||||||||||||||
| Net realized and unrealized gain (loss) on investments | 0.07 | (0.44 | ) | (0.06 | ) | 0.89 | (0.28 | ) | 0.60 | ||||||||||||||||||||||||||||||||||||||||||||||||||||||||||||||||||||||||||||||||||||||||||||||||||||||||||||||
| Total from investment operations | 0.24 | (0.07 | ) | �� | 0.30 | 1.28 | 0.15 | 1.03 | |||||||||||||||||||||||||||||||||||||||||||||||||||||||||||||||||||||||||||||||||||||||||||||||||||||||||||||||
| Less distributions | |||||||||||||||||||||||||||||||||||||||||||||||||||||||||||||||||||||||||||||||||||||||||||||||||||||||||||||||||||||||
| From net investment income | (0.18 | ) | (0.37 | ) | (0.36 | ) | (0.39 | ) | (0.42 | ) | (0.42 | ) | |||||||||||||||||||||||||||||||||||||||||||||||||||||||||||||||||||||||||||||||||||||||||||||||||||||||||||
| From net realized gain | — | — | (0.04 | ) | (0.01 | ) | — | — | |||||||||||||||||||||||||||||||||||||||||||||||||||||||||||||||||||||||||||||||||||||||||||||||||||||||||||||||
| Total distributions | (0.18 | ) | (0.37 | ) | (0.40 | ) | (0.40 | ) | (0.42 | ) | (0.42 | ) | |||||||||||||||||||||||||||||||||||||||||||||||||||||||||||||||||||||||||||||||||||||||||||||||||||||||||||
| Net asset value, end of period | $12.34 | $12.28 | $12.72 | $12.82 | $11.94 | $12.21 | |||||||||||||||||||||||||||||||||||||||||||||||||||||||||||||||||||||||||||||||||||||||||||||||||||||||||||||||||
| Total return (%)3,4 | 1.94 | 5 | (0.41 | ) | 2.34 | 10.90 | 1.25 | 9.04 | |||||||||||||||||||||||||||||||||||||||||||||||||||||||||||||||||||||||||||||||||||||||||||||||||||||||||||||||
| Ratios and supplemental data | |||||||||||||||||||||||||||||||||||||||||||||||||||||||||||||||||||||||||||||||||||||||||||||||||||||||||||||||||||||||
| Net assets, end of period (in millions) | $8 | $8 | $10 | $9 | $8 | $8 | |||||||||||||||||||||||||||||||||||||||||||||||||||||||||||||||||||||||||||||||||||||||||||||||||||||||||||||||||
| Ratios (as a percentage of average net assets): | |||||||||||||||||||||||||||||||||||||||||||||||||||||||||||||||||||||||||||||||||||||||||||||||||||||||||||||||||||||||
| Expenses before reductions | 1.90 | 6 | 1.82 | 1.74 | 1.76 | 1.78 | 1.80 | ||||||||||||||||||||||||||||||||||||||||||||||||||||||||||||||||||||||||||||||||||||||||||||||||||||||||||||||||
| Expenses including reductions | 1.79 | 6 | 1.72 | 1.64 | 1.66 | 1.66 | 1.80 | ||||||||||||||||||||||||||||||||||||||||||||||||||||||||||||||||||||||||||||||||||||||||||||||||||||||||||||||||
| Net investment income | 2.70 | 6 | 3.07 | 2.78 | 3.19 | 3.61 | 3.56 | ||||||||||||||||||||||||||||||||||||||||||||||||||||||||||||||||||||||||||||||||||||||||||||||||||||||||||||||||
| Portfolio turnover (%) | 2 | 7 | 8 | 16 | 9 | 7 | |||||||||||||||||||||||||||||||||||||||||||||||||||||||||||||||||||||||||||||||||||||||||||||||||||||||||||||||||
| 1 | Six months ended 11-30-14. Unaudited. | |||||||||||||||||||||||||||||||||||||
| 2 | Based on average daily shares outstanding. | |||||||||||||||||||||||||||||||||||||
| 3 | Does not reflect the effect of sales charges, if any. | |||||||||||||||||||||||||||||||||||||
| 4 | Total returns would have been lower had certain expenses not been reduced during the applicable periods. | |||||||||||||||||||||||||||||||||||||
| 5 | Not annualized. | |||||||||||||||||||||||||||||||||||||
| 6 | Annualized. | |||||||||||||||||||||||||||||||||||||
Note 1 — Organization
John Hancock New York Tax-Free Income Fund (the fund) is a series of John Hancock Tax-Exempt Series Fund (the Trust), an open-end management investment company organized as a Massachusetts business trust and registered under the Investment Company Act of 1940, as amended (the 1940 Act). The investment objective of the fund is to seek a high level of current income, consistent with preservation of capital, that is exempt from federal, New York State and New York City personal income taxes.
The fund may offer multiple classes of shares. The shares currently outstanding are detailed in the Statement of assets and liabilities. All share classes are currently closed to new investors in anticipation of a reorganization of the fund into John Hancock Tax-Free Bond Fund. Shareholders of each class have exclusive voting rights to matters that affect that class. The distribution and service fees, if any, and transfer agent fees for each class may differ. Class B shares convert to Class A shares eight years after purchase.
On June 25, 2014, the Board of Trustees approved a proposal to merge the fund into John Hancock Tax-Free Bond Fund, a series of John Hancock Municipal Securities Trust. Shareholders of the fund approved the merger at a shareholder meeting held on January 9, 2015, and it is expected to be complete on or about February 13, 2015. The fund will remain open to purchases and redemptions from existing shareholders until on or about February 13, 2015.
Note 2 — Significant accounting policies
The financial statements have been prepared in conformity with accounting principles generally accepted in the United States of America (US GAAP), which require management to make certain estimates and assumptions as of the date of the financial statements. Actual results could differ from those estimates and those differences could be significant. The fund intends to qualify as an investment company under Topic 946 of Accounting Standards Codification of US GAAP.
Events or transactions occurring after the end of the fiscal period through the date that the financial statements were issued have been evaluated in the preparation of the financial statements. The following summarizes the significant accounting policies of the fund:
Security valuation. Investments are stated at value as of the close of regular trading on the New York Stock Exchange (NYSE), normally at 4:00 p.m., Eastern Time. In order to value the securities, the fund uses the following valuation techniques: Debt obligations are valued based on the evaluated prices provided by an independent pricing vendor or from broker-dealers. Independent pricing vendors utilize matrix pricing which takes into account factors such as institutional-size trading in similar groups of securities, yield, quality, coupon rate, maturity, type of issue, trading characteristics and other market data, as well as broker supplied prices. Securities that trade only in the over-the-counter (OTC) market are valued using bid prices. Certain short-term securities with maturities of 60 days or less at the time of purchase are valued at amortized cost. Other fund securities and assets, for which reliable market quotations are not readily available, are valued at fair value as determined in good faith by the fund's Pricing Committee following procedures established by the Board of Trustees. The frequency with which these fair valuation procedures are used cannot be predicted and fair value of securities may differ significantly from the value that would have been used had a ready market for such securities existed.
The fund uses a three-tier hierarchy to prioritize the pricing assumptions, referred to as inputs, used in valuation techniques to measure fair value. Level 1 includes securities valued using quoted prices in active markets for identical securities. Level 2 includes securities valued using other significant observable inputs. Observable inputs may include quoted prices for similar securities, interest rates, prepayment speeds and credit risk. Prices for securities valued using these inputs are received from independent pricing vendors and brokers and are based on an evaluation of the inputs described. Level 3 includes securities valued using significant unobservable inputs when market prices are not readily available or reliable, including the fund's own assumptions in determining the fair value of investments. Factors used in determining value may include market or issuer specific events or trends, changes in interest rates and credit quality. The inputs or methodology used for valuing securities are not necessarily an indication of the risks associated with investing in those securities. Changes in valuation techniques may result in transfers into or out of an assigned level within the disclosure hierarchy.
As of November 30, 2014, all investments are categorized as Level 2 under the hierarchy described above.
22
Repurchase agreements. The fund may enter into repurchase agreements. When the fund enters into a repurchase agreement, it receives collateral that is held in a segregated account by the fund's custodian, or for tri-party repurchase agreements, collateral is held at a third-party custodian bank in a segregated account for the benefit of the fund. The collateral amount is marked-to-market and monitored on a daily basis to ensure that the collateral held is in an amount not less than the principal amount of the repurchase agreement plus any accrued interest. Collateral received by the fund for repurchase agreements is disclosed in the Fund's investments as part of the caption related to the repurchase agreement.
Repurchase agreements are typically governed by the terms and conditions of the Master Repurchase Agreement and/or Global Master Repurchase Agreement (collectively, MRA). Upon an event of default, the non-defaulting party may close out all transactions traded under the MRA and net amounts owed. Absent an event of default, the MRA does not result in an offset of the reported amounts of assets and liabilities in the Statement of assets and liabilities. In the event of a default by the counterparty, realization of the collateral proceeds could be delayed, during which time the collateral value may decline or the counterparty may have insufficient assets to pay back claims resulting from close-out of the transactions.
Security transactions and related investment income. Investment security transactions are accounted for on a trade date plus one basis for daily net asset value calculations. However, for financial reporting purposes, investment transactions are reported on trade date. Interest income is accrued as earned. Interest income includes coupon interest and amortization/accretion of premiums/discounts on debt securities. Debt obligations may be placed in a non-accrual status and related interest income may be reduced by stopping current accruals and writing off interest receivable when the collection of all or a portion of interest has become doubtful. Gains and losses on securities sold are determined on the basis of identified cost and may include proceeds from litigation.
Line of credit. The fund may borrow from banks for temporary or emergency purposes, including meeting redemption requests that otherwise might require the untimely sale of securities. Pursuant to the fund's custodian agreement, the custodian may loan money to the fund to make properly authorized payments. The fund is obligated to repay the custodian for any overdraft, including any related costs or expenses. The custodian may have a lien, security interest or security entitlement in any fund property that is not otherwise segregated or pledged, to the maximum extent permitted by law, to the extent of any overdraft.
In addition, the fund and other affiliated funds have entered into an agreement with Citibank N.A. that enables them to participate in a $300 million unsecured committed line of credit. A commitment fee, payable at the end of each calendar quarter, based on the average daily unused portion of the line of credit, is charged to each participating fund on a pro rata basis and is reflected in other expenses on the Statement of operations. Commitment fees for the six months ended November 30, 2014 were $243. For the six months ended November 30, 2014, the fund had no borrowings under the line of credit.
Expenses. Within the John Hancock group of funds complex, expenses that are directly attributable to an individual fund are allocated to such fund. Expenses that are not readily attributable to a specific fund are allocated among all funds in an equitable manner, taking into consideration, among other things, the nature and type of expense and the fund's relative net assets. Expense estimates are accrued in the period to which they relate and adjustments are made when actual amounts are known.
Class allocations. Income, common expenses and realized and unrealized gains (losses) are determined at the fund level and allocated daily to each class of shares based on the net assets of the class. Class-specific expenses, such as distribution and service fees, if any, and transfer agent fees, are calculated daily for each class based on the appropriate net assets of each class and the specific expense rates applicable to each class.
Federal income taxes. The fund intends to continue to qualify as a regulated investment company by complying with the applicable provisions of the Internal Revenue Code and will not be subject to federal income tax on taxable income that is distributed to shareholders. Therefore, no federal income tax provision is required.
Under the Regulated Investment Company Modernization Act of 2010, the fund is permitted to carry forward capital losses incurred in taxable years beginning after December 22, 2010 for an unlimited period. Additionally, post-enactment capital
23
losses that are carried forward will retain their character as either short-term or long-term capital losses rather than being considered all short-term as under previous law.
For federal income tax purposes, as of May 31, 2014, the fund has a short-term capital loss carryforward of $144,534 and a long-term capital loss carryforward of $535,425 available to offset future net realized capital gains. These carryforwards do not expire.
As of May 31, 2014, the fund had no uncertain tax positions that would require financial statement recognition, derecognition or disclosure. The fund's federal tax returns are subject to examination by the Internal Revenue Service for a period of three years.
Distribution of income and gains. Distributions to shareholders from net investment income and net realized gains, if any, are recorded on the ex-date. The fund generally declares dividends daily and pays them monthly. Capital gain distributions, if any, are distributed annually.
Distributions paid by the fund with respect to each class of shares are calculated in the same manner, at the same time and in the same amount, except for the effect of class level expenses that may be applied differently to each class.
Such distributions, on a tax basis, are determined in conformity with income tax regulations, which may differ from US GAAP.
Capital accounts within the financial statements are adjusted for permanent book-tax differences. These adjustments have no impact on net assets or the results of operations. Temporary book-tax differences, if any, will reverse in a subsequent period. Book-tax differences are primarily attributable to accretion on debt securities.
Note 3 — Guarantees and indemnifications
Under the Trust's organizational documents, its Officers and Trustees are indemnified against certain liabilities arising out of the performance of their duties to the Trust, including the fund. Additionally, in the normal course of business, the fund enters into contracts with service providers that contain general indemnification clauses. The fund's maximum exposure under these arrangements is unknown, as this would involve future claims that may be made against the fund that have not yet occurred. The risk of material loss from such claims is considered remote.
Note 4 — Fees and transactions with affiliates
John Hancock Advisers, LLC (the Advisor) serves as investment advisor for the fund. John Hancock Funds, LLC (the Distributor), an affiliate of the Advisor, serves as principal underwriter of the fund. The Advisor and the Distributor are indirect, wholly owned subsidiaries of Manulife Financial Corporation (MFC).
Management fee. The fund has an investment management agreement with the Advisor under which the fund pays a daily management fee to the Advisor equivalent, on an annual basis, to the sum of: (a) 0.500% of the first $250 million of the fund's average daily net assets; (b) 0.450% of the next $250 million of the fund's average daily net assets; (c) 0.425% of the next $500 million of the fund's average daily net assets; (d) 0.400% of the next $250 million of the fund's average daily net assets and (e) 0.300% of the fund's average daily net assets in excess of $1.25 billion. The Advisor has a subadvisory agreement with John Hancock Asset Management a division of Manulife Asset Management (US) LLC, an indirectly owned subsidiary of MFC and an affiliate of the Advisor. The fund is not responsible for payment of the subadvisory fees.
The Advisor has contractually agreed to waive a portion of its management fee and/or reimburse expenses for certain funds of the John Hancock complex, including the fund (the participating portfolios). The waiver equals, on an annualized basis, 0.01% of that portion of the aggregate net assets of all the participating portfolios that exceeds $75 billion but is less than or equal to $125 billion; 0.0125% of that portion of the aggregate net assets of all the participating portfolios that exceeds $125 billion but is less than or equal to $150 billion; and 0.015% of that portion of the aggregate net assets of all the participating portfolios that exceeds $150 billion. The amount of the reimbursement is calculated daily and allocated among all the participating portfolios in proportion to the daily net assets of each fund. This arrangement may be amended or terminated at any time by the Advisor upon notice to the fund and with the approval of the Board of Trustees.
24
The expense reductions described above amounted to $1,587, $63, and $281 for Class A, Class B, and Class C shares, respectively, for the six months ended November 30, 2014.
The investment management fees, including the impact of the waivers and reimbursements as described above, incurred for the six months ended November 30, 2014 were equivalent to a net annual effective rate of 0.49% of the fund's average daily net assets.
Accounting and legal services. Pursuant to a service agreement, the fund reimburses the Advisor for all expenses associated with providing the administrative, financial, legal, accounting and recordkeeping services to the fund, including the preparation of all tax returns, periodic reports to shareholders and regulatory reports, among other services. These expenses are allocated to each share class based on its relative net assets at the time the expense was incurred. These accounting and legal services fees incurred for the six months ended November 30, 2014 amounted to an annual rate of 0.02% of the fund's average daily net assets.
Distribution and service plans. The fund has a distribution agreement with the Distributor. The fund has adopted distribution and service plans with respect to Class A, Class B, and Class C shares pursuant to Rule 12b-1 under the 1940 Act, to pay the Distributor for services provided as the distributor of shares of the fund. The fund may pay up to the following contractual rates of distribution and service fees under these arrangements, expressed as an annual percentage of average daily net assets for each class of the fund's shares.
| Class | Rule 12b-1 fee |
| Class A | 0.30% |
| Class B | 1.00% |
| Class C | 1.00% |
The fund's Distributor has contractually agreed to waive 0.15%, 0.10%, and 0.10% of Rule 12b-1 fees for Class A, Class B, and Class C shares, respectively. The current waiver agreement expires on September 30, 2015, unless renewed by mutual agreement of the fund and the Distributor based upon a determination that this is appropriate under the circumstances at the time. For the period ended November 30, 2014 the fund was reimbursed $32,801, $866, and $3,864 for Class A, Class B, and Class C shares, respectively, for Rule 12b-1 fees.
Sales charges. Class A shares are assessed up-front sales charges, which resulted in payments to the Distributor amounting to $22,627 for the six months ended November 30, 2014. Of this amount, $3,212 was retained and used for printing prospectuses, advertising, sales literature and other purposes, $19,217 was paid as sales commissions to broker-dealers and $198 was paid as sales commissions to sales personnel of Signator Investors, Inc., a broker-dealer affiliate of the Advisor. The up-front sales charge for Class A shares is 4.00%.
Class A, Class B, and Class C shares may be subject to contingent deferred sales charges (CDSCs). Certain Class A shares that are acquired through purchases of $1 million or more and are redeemed within one year of purchase are subject to a 1.00% sales charge. Class B shares that are redeemed within six years of purchase are subject to CDSCs, at declining rates, beginning at 5.00%. Class C shares that are redeemed within one year of purchase are subject to a 1.00% CDSC. CDSCs are applied to the lesser of the current market value at the time of redemption or the original purchase cost of the shares being redeemed. Proceeds from CDSCs are used to compensate the Distributor for providing distribution-related services in connection with the sale of these shares. During the six months ended November 30, 2014, CDSCs received by the Distributor amounted to $6,149 and $255 for Class B and Class C shares, respectively.
Transfer agent fees. The fund has a transfer agent agreement with John Hancock Signature Services, Inc. (Signature Services), an affiliate of the Advisor. The transfer agent fees paid to Signature Services are determined based on the cost to Signature Services (Signature Services Cost) of providing recordkeeping services. The Signature Services Cost includes a component of allocated John Hancock corporate overhead for providing transfer agent services to the fund and to all other John Hancock affiliated funds. It also includes out-of-pocket expenses, including payments made to third-parties for recordkeeping services provided to their clients who invest in one or more John Hancock funds. In addition, Signature
25
Services Cost may be reduced by certain fees that Signature Services receives in connection with retirement and small accounts. Signature Services Cost is calculated monthly and allocated, as applicable, to five categories of share classes: Retail Share and Institutional Classes of Non-Municipal Bond Funds, Class R6 Shares, Retirement Share Classes, and Municipal Bond Share Classes. Within each of these categories, the applicable costs are allocated to the affected John Hancock affiliated funds and/or classes, based on the relative average daily net assets.
Class level expenses. Class level expenses for the six months ended November 30, 2014 were:
| Class | Distribution and service fees | Transfer agent fees |
| Class A | $65,602 | $12,476 |
| Class B | 8,659 | 494 |
| Class C | 38,635 | 2,204 |
| Total | $112,896 | $15,174 |
Trustee expenses. The fund compensates each Trustee who is not an employee of the Advisor or its affiliates. The costs of paying Trustee compensation and expenses are allocated to each fund based on its net assets relative to other funds within the John Hancock group of funds complex.
Note 5 — Fund share transactions
Transactions in fund shares for the six months ended November 30, 2014 and for the year ended May 31, 2014 were as follows:
| Six months ended 11-30-14 | Year ended 5-31-14 | |||||||||||||||||||||||||
| Shares | Amount | Shares | Amount | |||||||||||||||||||||||
| Class A shares | ||||||||||||||||||||||||||
| Sold | 72,531 | $888,218 | 253,876 | $3,051,902 | ||||||||||||||||||||||
| Distributions reinvested | 56,475 | 694,350 | 127,801 | 1,524,928 | ||||||||||||||||||||||
| Repurchased | (378,629 | ) | (4,638,238 | ) | (870,121 | ) | (10,355,155 | ) | ||||||||||||||||||
| Net decrease | (249,623 | ) | ($3,055,670 | ) | (488,444 | ) | ($5,778,325 | ) | ||||||||||||||||||
| Class B shares | ||||||||||||||||||||||||||
| Sold | 3,452 | $42,403 | 1,012 | $12,358 | ||||||||||||||||||||||
| Distributions reinvested | 1,469 | 18,059 | 3,728 | 44,485 | ||||||||||||||||||||||
| Repurchased | (23,652 | ) | (290,476 | ) | (32,887 | ) | (390,910 | ) | ||||||||||||||||||
| Net decrease | (18,731 | ) | ($230,014 | ) | (28,147 | ) | ($334,067 | ) | ||||||||||||||||||
| Class C shares | ||||||||||||||||||||||||||
| Sold | 20,018 | $246,873 | 118,121 | $1,418,674 | ||||||||||||||||||||||
| Distributions reinvested | 7,732 | 95,092 | 17,415 | 207,859 | ||||||||||||||||||||||
| Repurchased | (49,743 | ) | (610,718 | ) | (264,517 | ) | (3,165,709 | ) | ||||||||||||||||||
| Net decrease | (21,993 | ) | ($268,753 | ) | (128,981 | ) | ($1,539,176 | ) | ||||||||||||||||||
| Total net decrease | (290,347 | ) | ($3,554,437 | ) | (645,572 | ) | ($7,651,568 | ) | ||||||||||||||||||
Note 6 — Purchase and sale of securities
Purchases and sales of securities, other than short-term securities amounted to $1,047,058 and $3,934,528, respectively, for the six months ended November 30, 2014.
26
CONTINUATION OF INVESTMENT ADVISORY AND SUBADVISORY AGREEMENTS
Evaluation of Advisory and Subadvisory Agreements by the Board of Trustees
This section describes the evaluation by the Board of Trustees (the Board) of John Hancock Tax-Exempt Series Fund (the Trust) of the Advisory Agreement (the Advisory Agreement) with John Hancock Advisers, LLC (the Advisor) and the Subadvisory Agreement (the Subadvisory Agreement) with John Hancock Asset Management a division of Manulife Asset Management (US) LLC (the Subadvisor) for John Hancock New York Tax-Free Income Fund (the fund). The Advisory Agreement and Subadvisory Agreement are collectively referred to as the Agreements. Prior to the June 23-25, 2014 meeting at which the Agreements were approved, the Board also discussed and considered information regarding the proposed continuation of the Agreements at an in-person meeting held on May 27-29, 2014.
Approval of Advisory and Subadvisory Agreements
At in-person meetings held on June 23-25, 2014, the Board, including the Trustees who are not considered to be interested persons of the Trust under the Investment Company Act of 1940, as amended (the 1940 Act) (the Independent Trustees), reapproved the continuation of the Advisory Agreement between the Trust and the Advisor and the Subadvisory Agreement between the Advisor and the Subadvisor with respect to the fund for a term ending as of the anticipated closing of the fund's proposed reorganization into John Hancock Tax-Free Bond Fund ("Tax-Free Bond Fund"), which is expected to take place on or about February 13, 2015.
In considering the Advisory Agreement and the Subadvisory Agreement, the Board received in advance of the meetings a variety of materials relating to the fund, the Advisor and the Subadvisor, including comparative performance, fee and expense information for a peer group of similar funds prepared by an independent third-party provider of fund data, performance information for an applicable benchmark index; and, with respect to the Subadvisor, comparative performance information for comparably managed accounts, as applicable, and other information provided by the Advisor and the Subadvisor regarding the nature, extent and quality of services provided by the Advisor and the Subadvisor under their respective Agreements, as well as information regarding the Advisor's revenues and costs of providing services to the fund and any compensation paid to affiliates of the Advisor. At the meetings at which the renewal of the Advisory Agreement and Subadvisory Agreement are considered, particular focus is given to information concerning fund performance, comparability of fees and total expenses, and profitability. However, the Board notes that the evaluation process with respect to the Advisor and the Subadvisor is an ongoing one. In this regard, the Board also took into account discussions with management and information provided to the Board at prior meetings with respect to the services provided by the Advisor and the Subadvisor to the fund, including quarterly performance reports prepared by management containing reviews of investment results and prior presentations from the Subadvisor with respect to the fund. The Board noted the affiliation of the Subadvisor with the Advisor, noting any potential conflicts of interest. The Board also considered the nature, quality, and extent of non-advisory services, if any, to be provided to the fund by the Advisor's affiliates, including distribution services.
Throughout the process, the Board asked questions of and requested additional information from management. The Board is assisted by counsel for the Trust and the Independent Trustees are also separately assisted by independent legal counsel throughout the process. The Independent Trustees also received a memorandum from their independent legal counsel discussing the legal standards for their consideration of the proposed continuation of the Agreements and discussed the proposed continuation of the Agreements in private sessions with their independent legal counsel at which no representatives of management were present.
Approval of Advisory Agreement
In approving the Advisory Agreement with respect to the fund, the Board, including the Independent Trustees, considered a variety of factors, including those discussed below. The Board also considered other factors (including conditions and trends prevailing generally in the economy, the securities markets, and the industry) and does not treat any single factor as determinative, and each Trustee may attribute different weights to different factors. The Board's conclusions may be based in
27
part on its consideration of the advisory and subadvisory arrangements in prior years and on the Board's ongoing regular review of fund performance and operations throughout the year.
Nature, extent, and quality of services. Among the information received by the Board from the Advisor relating to the nature, extent, and quality of services provided to the fund, the Board reviewed information provided by the Advisor relating to its operations and personnel, descriptions of its organizational and management structure, and information regarding the Advisor's compliance and regulatory history, including its Form ADV. The Board also noted that on a regular basis it receives and reviews information from the Trust's Chief Compliance Officer (CCO) regarding the fund's compliance policies and procedures established pursuant to Rule 38a-1 under the 1940 Act. The Board also considered the Advisor's risk management processes. The Board considered that the Advisor is responsible for the management of the day-to-day operations of the fund, including, but not limited to, general supervision of and coordination of the services provided by the Subadvisor, and is also responsible for monitoring and reviewing the activities of the Subadvisor and third-party service providers.
In considering the nature, extent, and quality of the services provided by the Advisor, the Trustees also took into account their knowledge of the Advisor's management and the quality of the performance of the Advisor's duties, through Board meetings, discussions and reports during the preceding year and through each Trustee's experience as a Trustee of the Trust and of the other trusts in the complex.
In the course of their deliberations regarding the Advisory Agreement, the Board considered, among other things:
| (a) | the skills and competency with which the Advisor has in the past managed the Trust's affairs and its subadvisory relationship, the Advisor's oversight and monitoring of the Subadvisor's investment performance and compliance programs, such as the Subadvisor's compliance with fund policies and objectives, review of brokerage matters, including with respect to trade allocation and best execution and the Advisor's timeliness in responding to performance issues; | |
| (b) | the background, qualifications and skills of the Advisor's personnel; | |
| (c) | the Advisor's compliance policies and procedures and its responsiveness to regulatory changes and mutual fund industry developments; | |
| (d) | the Advisor's administrative capabilities, including its ability to supervise the other service providers for the fund; | |
| (e) | the financial condition of the Advisor and whether it has the financial wherewithal to provide a high level and quality of services to the fund; and | |
| (f) | the Advisor's reputation and experience in serving as an investment advisor to the Trust and the benefit to shareholders of investing in funds that are part of a family of funds offering a variety of investments. |
The Board concluded that the Advisor may reasonably be expected to continue to provide a high quality of services under the Advisory Agreement with respect to the fund.
Investment performance. In considering the fund's performance, the Board noted that it reviews at its regularly scheduled meetings information about the fund's performance results. In connection with the consideration of the Advisory Agreement, the Board:
| (a) | reviewed information prepared by management regarding the fund's performance; | |
| (b) | considered the comparative performance of an applicable benchmark index; | |
| (c) | considered the performance of comparable funds, if any, as included in the report prepared by an independent third-party provider of fund data; and | |
| (d) | took into account the Advisor's analysis of the fund's performance and its plans and recommendations regarding the Trust's subadvisory arrangements generally. |
28
The Board noted that the fund underperformed its benchmark index and peer group average for the one-, three- and five-year periods ended December 31, 2013. The Board took into account management's discussion of the fund's performance and the proposed reorganization of the fund.
Fees and expenses. The Board reviewed comparative information prepared by an independent third-party provider of mutual fund data, including, among other data, the fund's contractual and net management fees (and subadvisory fees, to the extent available) and total expenses as compared to similarly situated investment companies deemed to be comparable to the fund. The Board considered the fund's ranking within a smaller group of peer funds chosen by the independent third-party provider, as well as the fund's ranking within a broader group of funds. In comparing the fund's contractual and net management fees to those of comparable funds, the Board noted that such fees include both advisory and administrative costs. The Board noted that net management fees and total expenses for the fund are higher than the peer group median. The Board took into account management's discussion of the fund's expenses.
The Board also took into account management's discussion with respect to the advisory/subadvisory fee structure, including the amount of the advisory fee retained by the Advisor after payment of the subadvisory fee. The Board also noted that the Advisor pays the subadvisory fee. In addition, the Board took into account that management had agreed, effective July 1, 2014, to implement an overall fee waiver across the complex, including the fund, which is discussed further below. The Board also noted actions taken over the past several years to reduce the fund's operating expenses. The Board also noted that, in addition, the Advisor is currently waiving fees and/or reimbursing expenses with respect to the fund and that the fund has breakpoints in its contractual management fee schedule that reduce management fees as assets increase. The Board also noted that the fund's distributor, an affiliate of the Advisor, has agreed to waive a portion of its Rule 12b-1 fee for the fund's share classes through September 30, 2015. The Board reviewed information provided by the Advisor concerning the investment advisory fee charged by the Advisor or one of its advisory affiliates to other clients (including other funds in the complex) having similar investment mandates, if any. The Board considered any differences between the Advisor's and Subadvisor's services to the fund and the services they provide to other comparable clients or funds. The Board concluded that the advisory fee paid with respect to the fund is reasonable.
Profitability/indirect benefits. In considering the costs of the services to be provided and the profits to be realized by the Advisor and its affiliates (including the Subadvisor) from the Advisor's relationship with the Trust, the Board:
| (a) | reviewed financial information of the Advisor; | |||||||
| (b) | reviewed and considered information presented by the Advisor regarding the net profitability to the Advisor and its affiliates with respect to the fund; | |||||||
| (c) | received and reviewed profitability information with respect to the John Hancock fund complex as a whole; | |||||||
| (d) | received information with respect to the Advisor's allocation methodologies used in preparing the profitability data; | |||||||
| (e) | considered that the John Hancock insurance companies that are affiliates of the Advisor, as shareholders of the Trust directly or through their separate accounts, receive certain tax credits or deductions relating to foreign taxes paid and dividends received by certain funds of the Trust and noted that these tax benefits, which are not available to participants in qualified retirement plans under applicable income tax law, are reflected in the profitability analysis reviewed by the Board; | |||||||
| (f) | considered that the Advisor also provides administrative services to the fund on a cost basis pursuant to an administrative services agreement; | |||||||
| (g) | noted that affiliates of the Advisor provide transfer agency services and distribution services to the fund, and that the fund's distributor also receives Rule 12b-1 payments to support distribution of the fund; | |||||||
| (h) | noted that the fund's Subadvisor is an affiliate of the Advisor; | |||||||
| (i) | noted that the Advisor also derives reputational and other indirect benefits from providing advisory services to the fund; |
29
| (j) | noted that the subadvisory fee for the fund is paid by the Advisor; and | |||||||
| (k) | considered that the Advisor should be entitled to earn a reasonable level of profits in exchange for the level of services it provides to the fund and the entrepreneurial risk that it assumes as Advisor. |
Based upon its review, the Board concluded that the level of profitability, if any, of the Advisor and its affiliates (including the Subadvisor) from their relationship with the fund was reasonable and not excessive.
Economies of scale. Keeping in mind that the fund is expected to be reorganized into Tax-Free Bond Fund, in considering the extent to which economies of scale could be realized if the fund were to grow, and whether fee levels reflect these economies of scale for the benefit of fund shareholders, the Board:
| (a) | considered that the Advisor has agreed, effective July 1, 2014, to waive a portion of its management fee for the fund and each of the other John Hancock funds in the complex (except for those discussed below) (the Participating Portfolios) or otherwise reimburse the expenses of the Participating Portfolios as follows (the Reimbursement): | ||
| The Reimbursement shall equal, on an annualized basis, 0.01% of that portion of the aggregate net assets of all the Participating Portfolios that exceed $75 billion but is less than or equal to $125 billion, 0.0125% of that portion of the aggregate net assets of all the Participating Portfolios that exceed $125 billion but is less than or equal to $150 billion and 0.015% of that portion of the aggregate net assets of all the Participating Portfolios that exceeds $150 billion. (The funds that are not Participating Portfolios are the funds of funds in the complex, which benefit from such overall management fee waiver through their investment in underlying portfolios that include Participating Portfolios, which are subject to the Reimbursement.) | |||
| (b) | reviewed the fund's advisory fee structure and concluded that: (i) the fund's fee structure contains breakpoints at the subadvisory fee level and that such breakpoints are reflected as breakpoints in the advisory fees for the fund; and (ii) although economies of scale cannot be measured with precision, these arrangements could permit shareholders of the fund to benefit from economies of scale if the fund were to grow. The Board also took into account management's discussion of the fund's advisory fee structure; and | ||
| (c) | the Board also considered the effect of the fund's growth in size on its performance and fees. The Board also noted that the fund is expected to be reorganized into Tax-Free Bond Fund, and considered the likelihood that economies of scale would not be achieved by the fund. | ||
Approval of Subadvisory Agreement
In making its determination with respect to approval of the Subadvisory Agreement, the Board reviewed:
| (1) | information relating to the Subadvisor's business, including current subadvisory services to the Trust (and other funds in the John Hancock family of funds); | |
| (2) | the historical and current performance of the fund and comparative performance information relating to an applicable benchmark index and comparable funds; and | |
| (3) | the subadvisory fee for the fund, including any breakpoints, and to the extent available, comparable fee information prepared by an independent third party provider of fund data. |
Nature, extent, and quality of services. With respect to the services provided by the Subadvisor, the Board received information provided to the Board by the Subadvisor, including the Subadvisor's Form ADV, as well as took into account information presented throughout the past year. The Board considered the Subadvisor's current level of staffing and its overall resources, as well as received information relating to the Subadvisor's compensation program. The Board reviewed the Subadvisor's history and investment experience, as well as information regarding the qualifications, background, and
30
responsibilities of the Subadvisor's investment and compliance personnel who provide services to the fund. The Board also considered, among other things, the Subadvisor's compliance program and any disciplinary history. The Board also considered the Subadvisor's risk assessment and monitoring process. The Board reviewed the Subadvisor's regulatory history, including whether it was involved in any regulatory actions or investigations as well as material litigation, and any settlements and amelioratory actions undertaken, as appropriate. The Board noted that the Advisor conducts regular, periodic reviews of the Subadvisor and its operations, including regarding investment processes and organizational and staffing matters. The Board also noted that the Trust's CCO and his staff conduct regular, periodic compliance reviews with the Subadvisor and present reports to the Independent Trustees regarding the same, which includes evaluating the regulatory compliance systems of the Subadvisor and procedures reasonably designed to assure compliance with the federal securities laws. The Board also took into account the financial condition of the Subadvisor.
The Board considered the Subadvisor's investment process and philosophy. The Board took into account that the Subadvisor's responsibilities include the development and maintenance of an investment program for the fund that is consistent with the fund's investment objective, the selection of investment securities and the placement of orders for the purchase and sale of such securities, as well as the implementation of compliance controls related to performance of these services. The Board also received information with respect to the Subadvisor's brokerage policies and practices, including with respect to best execution and soft dollars.
Subadvisor compensation. In considering the cost of services to be provided by the Subadvisor and the profitability to the Subadvisor of its relationship with the fund, the Board noted that the fees under the Subadvisory Agreement are paid by the Advisor and not the fund. The Board also considered any potential conflicts of interest the Advisor might have in connection with the Subadvisory Agreement.
In addition, the Board considered other potential indirect benefits that the Subadvisor and its affiliates may receive from the Subadvisor's relationship with the fund, such as the opportunity to provide advisory services to additional funds in the John Hancock fund complex and reputational benefits.
Subadvisory fees. The Board considered that the fund pays an advisory fee to the Advisor and that, in turn, the Advisor pays a subadvisory fee to the Subadvisor. As noted above, the Board also considered the fund's subadvisory fees as compared to similarly situated investment companies deemed to be comparable to the fund as included in the report prepared by the independent third party provider of fund data, to the extent available. The Board noted that the limited size of the Lipper peer group was not sufficient for comparative purposes. The Board also took into account the subadvisory fees paid by the Advisor to the Subadvisor with respect to the fund to fees charged by the Subadvisor to manage other subadvised portfolios and portfolios not subject to regulation under the 1940 Act, as applicable.
Subadvisor performance. As noted above, the Board considered the fund's performance as compared to the fund's peer group and the benchmark index and noted that the Board reviews information about the fund's performance results at its regularly scheduled meetings. The Board noted the Advisor's expertise and resources in monitoring the performance, investment style and risk-adjusted performance of the Subadvisor. The Board was mindful of the Advisor's focus on the Subadvisor's performance. The Board also noted the Subadvisor's long-term performance record for similar accounts, as applicable.
The Board's decision to approve the Subadvisory Agreement was based on a number of determinations, including the following:
| (1) | the Subadvisor has extensive experience and demonstrated skills as a manager; | |
| (2) | the fund's performance is being monitored and reasonably addressed; | |
| (3) | the subadvisory fee is reasonable in relation to the level and quality of services being provided; and | |
| (4) | subadvisory fee breakpoints are reflected as breakpoints in the advisory fees for the fund in order to permit shareholders to benefit from economies of scale if the fund grows. | |
| * * * | ||
31
32
Trustees James M. Oates, Chairperson Officers Andrew G. Arnott John J. Danello Francis V. Knox, Jr. Charles A. Rizzo Salvatore Schiavone | Investment advisor John Hancock Advisers, LLC Subadvisor John Hancock Asset Management a division of Manulife Asset Management (US) LLC Principal distributor John Hancock Funds, LLC Custodian State Street Bank and Trust Company Transfer agent John Hancock Signature Services, Inc. Legal counsel K&L Gates LLP |
*Member of the Audit Committee
†Non-Independent Trustee
The fund's proxy voting policies and procedures, as well as the fund's proxy voting record for the most recent twelve-month period ended June 30, are available free of charge on the Securities and Exchange Commission (SEC) website at sec.gov or on our website.
The fund's complete list of portfolio holdings, for the first and third fiscal quarters, is filed with the SEC on Form N-Q. The fund's Form N-Q is available on our website and the SEC's website, sec.gov, and can be reviewed and copied (for a fee) at the SEC's Public Reference Room in Washington, DC. Call 800-SEC-0330 to receive information on the operation of the SEC's Public Reference Room.
We make this information on your fund, as well as monthly portfolio holdings, and other fund details available on our website at jhinvestments.com or by calling 800-225-5291.
| You can also contact us: | |||
| 800-225-5291 jhinvestments.com | Regular mail: John Hancock Signature Services, Inc. | Express mail: John Hancock Signature Services, Inc. | |
33
Family of funds
DOMESTIC EQUITY FUNDS Balanced Classic Value Disciplined Value Disciplined Value Mid Cap Fundamental All Cap Core Fundamental Large Cap Core Fundamental Large Cap Value Large Cap Equity Select Growth Small Cap Equity Small Cap Value Small Company Strategic Growth U.S. Equity U.S. Global Leaders Growth Value Equity GLOBAL AND INTERNATIONAL EQUITY FUNDS Disciplined Value International Emerging Markets Global Equity Global Opportunities Global Shareholder Yield Greater China Opportunities International Core International Growth International Growth Equity International Small Company International Value Equity INCOME FUNDS Bond California Tax-Free Income Core High Yield Emerging Markets Debt Floating Rate Income Focused High Yield Global Income Government Income High Yield Municipal Bond Income Investment Grade Bond | INCOME FUNDS (continued) Massachusetts Tax-Free Income Money Market New York Tax-Free Income Short Duration Credit Opportunities Strategic Income Opportunities Tax-Free Bond ALTERNATIVE AND SPECIALTY FUNDS Absolute Return Currency Alternative Asset Allocation Enduring Equity Financial Industries Global Absolute Return Strategies Global Conservative Absolute Return Natural Resources Redwood Regional Bank Seaport Technical Opportunities ASSET ALLOCATION PORTFOLIOS Income Allocation Lifestyle Aggressive Lifestyle Balanced Lifestyle Conservative Lifestyle Growth Lifestyle Moderate Retirement Choices (2010-2055) Retirement Living (2010-2055) Retirement Living II (2010-2055) CLOSED-END FUNDS Financial Opportunities Hedged Equity & Income Income Securities Trust Investors Trust Preferred Income Preferred Income II Preferred Income III Premium Dividend Tax-Advantaged Dividend Income Tax-Advantaged Global Shareholder Yield |
The fund's investment objective, risks, charges, and expenses are included in the prospectuses and should be considered carefully before investing. For a prospectus, call your financial professional, call John Hancock Investments at 800-225-5291, or visit the fund's website at jhinvestments.com. Please read the prospectus carefully before investing or sending money.
John Hancock Investments
A trusted brand
John Hancock has helped individuals and institutions build and protect wealth since 1862. Today, we are one of America's strongest and most-recognized brands.
A better way to invest
As a manager of managers, we search the world to find proven portfolio teams with specialized expertise for every fund we offer, then apply vigorous investment oversight to ensure they continue to meet our uncompromising standards.
Results for investors
Our unique approach to asset management has led to a diverse set of investments deeply rooted in investor needs, along with strong risk-adjusted returns across asset classes.
 | John Hancock Funds, LLC n Member FINRA, SIPC 601 Congress Street n Boston, MA 02210-2805 800-225-5291 n jhinvestments.com | |
| This report is for the information of the shareholders of John Hancock New York Tax-Free Income Fund. It is not authorized for distribution to prospective investors unless preceded or accompanied by a prospectus. | ||
| MF209441 | 76SA 11/14 1/15 | |
John Hancock
Massachusetts Tax-Free Income Fund
Semiannual report 11/30/14
A message to shareholders
Dear fellow shareholder,
Robust economic growth in the United States continues to set the standard globally. Unemployment has ratcheted down to pre-recession levels, consumer confidence and spending are rising, and inflation remains low. Bond markets have turned in positive performance against this backdrop as investors pursue yield where they can find it. Despite a 30-year bull market in bonds, many U.S. bond yields look compelling when compared with other developed markets around the world.
The coming year may likely present greater challenges for bond investors, however. The U.S. Federal Reserve (Fed) has signaled its intention to be patient in beginning to raise short-term interest rates. Once the Fed does raise the rates, it may have an adverse affect on many fixed-income portfolios, particularly those that invest in less-liquid markets. At John Hancock Investments, we are closely monitoring our fixed-income portfolios and communicating regularly with their portfolio managers about these issues. Now may also be a good time for you to discuss your fixed-income strategy with your financial advisor to determine if your portfolio continues to match your long-term goals.
A new look
I am pleased to introduce you to our redesigned shareholder reports. As part of an effort to elevate the educational substance in our communications, we undertook an initiative to make our reports more engaging and easier to navigate. Included in the changes are a performance snapshot that shows your fund's performance against that of its benchmark, and a Q&A with your fund's lead portfolio manager. We hope these enhancements give you better insight into your fund's activity and performance.
On behalf of everyone at John Hancock Investments, I'd like to take this opportunity to thank you for the continued trust you've placed in us and wish you a happy and healthy 2015.
Sincerely,
Andrew G. Arnott
President and Chief Executive Officer
John Hancock Investments
This commentary reflects the CEO's views as of November 30, 2014. They are subject to change at any time. For more up-to-date information, you can visit our website at jhinvestments.com.
John Hancock
Massachusetts Tax-Free Income Fund
1
INVESTMENT OBJECTIVE
The fund seeks a high level of current income, consistent with preservation of capital, that is exempt from federal and Massachusetts personal income taxes.
AVERAGE ANNUAL TOTAL RETURNS AS OF 11/30/14 (%)
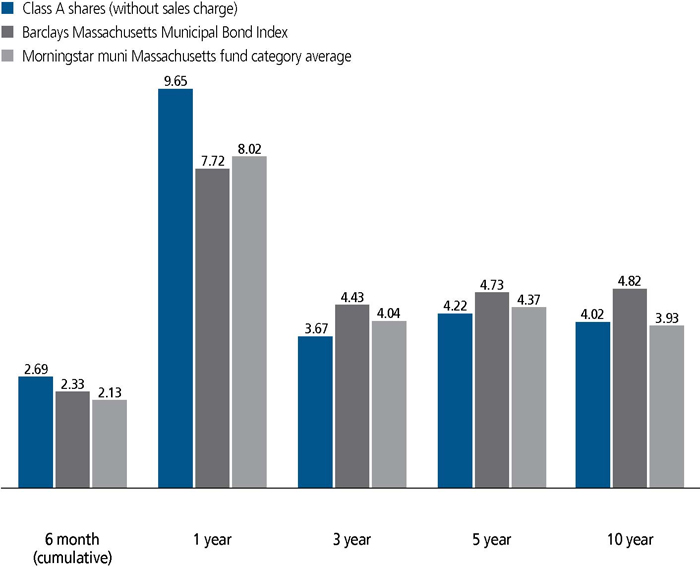
The Barclays Massachusetts Municipal Bond Index is an unmanaged index of Massachusetts investment-grade municipal bonds.
It is not possible to invest directly in an index.
Figures from Morningstar, Inc. include reinvested distributions and do not take into account sales charges. Actual load-adjusted performance is lower.
The past performance shown here reflects reinvested distributions and the beneficial effect of any expense reductions, and does not guarantee future results. Returns for periods shorter than one year are cumulative, and results for other share classes will vary. Shares will fluctuate in value and, when redeemed, may be worth more or less than their original cost. Current performance may be lower or higher than the performance cited, and can be found at jhinvestments.com or by calling 800-225-5291. For further information on the fund's objectives, risks, and strategy, see the fund's prospectus.
2
PERFORMANCE HIGHLIGHTS OVER THE LAST SIX MONTHS
Municipal bonds advanced
Favorable supply-and-demand conditions and a lack of inflationary pressure contributed to positive returns in the municipal bond market.
Longer duration helped
The fund's longer duration (i.e., greater interest-rate sensitivity) holdings versus its benchmark added value as muni yields declined.
Factors affecting performance
Favorable security selection added value during the period, while several holdings with near-term call dates detracted from results.
PORTFOLIO COMPOSITION AS OF 11/30/14 (%)
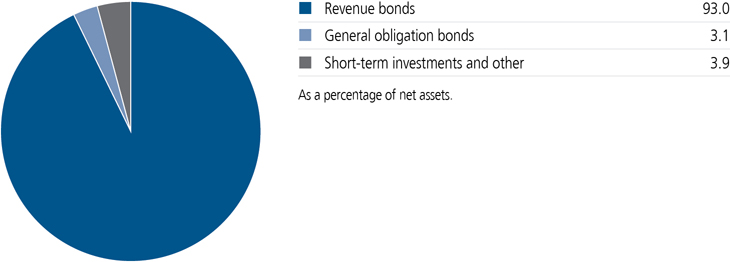
A note about risks
Fixed-income investments are subject to interest-rate and credit risk; their value will normally decline as interest rates rise or if a creditor, grantor, or counterparty is unable or unwilling to make principal, interest, or settlement payments. Investments in higher-yielding, lower-rated securities include a higher risk of default. Municipal bond prices can decline due to fiscal mismanagement or tax shortfalls, or if related projects become unprofitable. If the fund invests heavily in any one state or region, performance could be disproportionately affected by factors particular to that state or region. Events in the financial markets have resulted, and may continue to result, in an unusually high degree of volatility in the financial markets, both domestic and foreign. In addition, reduced liquidity in credit and fixed-income markets may adversely affect issuers worldwide. Certain market conditions, including reduced trading volume, heightened volatility, and rising interest rates, may impair liquidity, the ability of the fund to sell securities or close derivative positions at advantageous prices. The use of hedging and derivatives could produce disproportionate gains or losses and may increase costs. Sector investing is subject to greater risks than the market as a whole. Because the fund may focus on particular sectors of the economy, its performance may depend on the performance of those sectors, and investments focused in one sector may fluctuate more widely than investments diversified across sectors. For additional information on these and other risk considerations, please see the fund's prospectus.
3
An interview with Portfolio Manager Dianne M. Sales, CFA, John Hancock Asset Management, a division of Manulife Asset Management (US) LLC
Dianne M. Sales, CFA
Portfolio Manager
John Hancock Asset Management
What factors contributed to the positive returns in the municipal bond market over the past six months?
Supply and demand in the municipal bond market aided performance during the six-month period. Through November 30, 2014, new municipal bond issuance year to date was 4% lower than for the same period in 2013. Moreover, a meaningful portion of the new issues in the muni market, especially during the last half of the six-month period, was used to refinance existing securities, which does not materially increase the volume of outstanding municipal bonds. On the other side of the equation, investor demand picked up, resulting in steadily positive inflows into the municipal bond market. This stood in contrast to 2013, when investment dollars flowed out of the muni market.
The favorable supply-and-demand backdrop helped tax-exempt municipal bonds outperform the broad taxable bond market. As a point of reference, the Barclays Municipal Bond Index returned 2.45% for the six-month period, while the Barclays U.S. Aggregate Bond Index, a broad taxable bond market measure, returned 1.92%. Massachusetts municipal bonds slightly underperformed as the Barclays Massachusetts Municipal Bond Index returned 2.33%.
How did the economic environment affect the muni market?
Economic conditions were supportive for bonds in general. Inflation in the United States remained well below its long-term historical average, in part because of declining energy prices and slowing economic growth elsewhere in the world, particularly in Europe and China. But we are also seeing little evidence of domestic wage pressure, despite stronger job numbers and a lower unemployment rate. The lack of inflationary pressure enabled bond yields to trend lower during the six-month period, leading to higher bond prices.
Munis also benefited from stronger economic data in the United States, which typically boosts state and local tax revenues, aids publicly funded development projects, and strengthens municipal credit quality.
4
Speaking of which, did any municipal credit concerns develop in Massachusetts over the last six months?
Massachusetts credit quality remained stable, reflecting the state's prudent fiscal stewardship and relatively steady economy. One notable development for 2015 is that Massachusetts residents will receive a reduction in the state income-tax rate, from 5.2% to 5.15%. The reduction is based on the state exceeding certain tax revenue benchmarks and is part of a gradual plan to bring the state tax rate down to 5%. The state estimates that the lowered tax rate will lead to a $70 million decline in tax revenues.
Looking at the portfolio, what contributed positively to the fund's performance versus its benchmark, the Barclays Massachusetts Municipal Bond Index?
The fund's duration (a measure of interest-rate sensitivity) was longer than that of the benchmark for much of the reporting period. (The fund's duration was 5.4 years at the beginning of the period, while the benchmark's duration was 5.0 years.) This positioning added value as muni yields declined. In addition, the fund's higher-yielding holdings, especially bonds rated BB and BBB, benefited from continued investor demand for yield. A recovering economy helped lift returns for housing-related bonds, particularly those financing senior care communities.
The fund also benefited from prerefundings on a number of its bonds, especially several lower-rated bonds financing higher education facilities.
QUALITY COMPOSITION AS OF 11/30/14 (%)
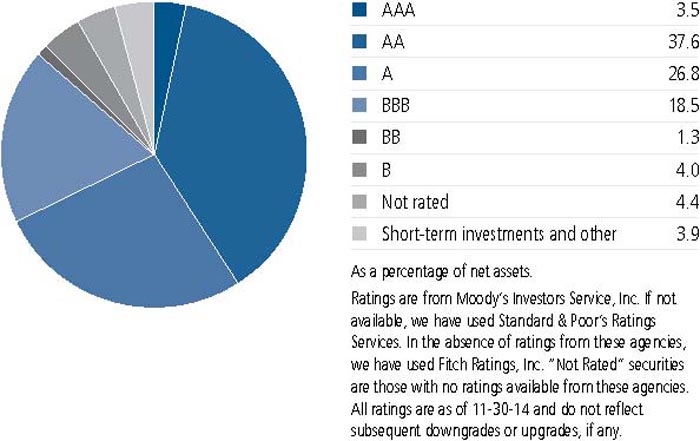
5
What does prerefunding mean?
Municipal bond issuers often take advantage of low interest rates to refinance an existing bond, much like a homeowner refinancing a mortgage. However, the existing bond can only be retired on a predetermined call date, which could be months or years away. So, the municipal entity issues a new bond and invests the proceeds in U.S. Treasury securities until the call date arrives, at which point the proceeds are used to pay off the existing bond.
This process often results in a credit rating upgrade for the prerefunded securities, equivalent to that of the U.S. Treasury securities in which the proceeds are invested. During the six-month period, some of the fund's holdings rallied following their prerefunding.
What detracted from results versus the benchmark over the last six months?
The fund's position in bonds issued by the Commonwealth of Puerto Rico, which are not represented in the benchmark, had a negative impact on relative performance. Puerto Rico has been struggling with a persistent economic downturn and potential liquidity problems. We continued to reduce the fund's holdings of Puerto Rico bonds during the six-month period; as of November 30, 2014, they made up 8% of net assets, down from 10.3% at the beginning of the period. Half of that exposure was backed by U.S. government securities; the remaining holdings consisted of sales tax bonds, which are tied to a dedicated revenue stream.
Are there any noteworthy themes in the municipal bond market?
In recent years, the federal budget deficit has prompted some proposals to limit the tax exemption that municipal bond interest payments have enjoyed since the passage of the Revenue Act of 1913.
TOP 10 HOLDINGS AS OF 11/30/14 (%)
| Massachusetts State Department of Transportation, Highway Revenue Tolls, Series B, 5.000%, 1-1-37 | 4.3 |
| Massachusetts Bay Transportation Authority, Transit Revenue, Series B, 5.250%, 7-1-33 | 4.2 |
| Massachusetts Water Resources Authority, Water Revenue, Series B, 5.250%, 8-1-29 | 4.2 |
| Massachusetts Development Finance Agency, New England Conservatory of Music, 5.250%, 7-1-38 | 3.0 |
| Massachusetts Development Finance Agency, Draper Laboratory, 5.875%, 9-1-30 | 3.0 |
| Massachusetts Port Authority, Series B, 5.000%, 7-1-32 | 3.0 |
| Metropolitan Boston Transit Parking Corp., 5.000%, 7-1-41 | 2.9 |
| Boston Housing Authority, Capital Program Revenue, 5.000%, 4-1-28 | 2.9 |
| Massachusetts Health & Educational Facilities Authority, Springfield College, 5.625%, 10-15-40 | 2.8 |
| Massachusetts Development Finance Agency, Dominion Energy Brayton Point AMT, 5.000%, 2-1-36 | 2.8 |
| Total | 33.1 |
| As a percentage of net assets. | |
| Cash and cash equivalents are not included. |
6
In 2014, there were proposals from both Congress and the White House recommending a cap on the municipal bond interest tax deduction for higher-income investors.
As a result of the November midterm elections, Republicans will control both houses of Congress starting in January 2015. Given the potential for conflicting priorities between Congress and the president, we anticipate that near-term changes to the municipal bond interest tax deduction are unlikely.
Can you provide some details about the timing of the fund's proposed merger?
The fund's Board of Trustees approved the merger of the fund into John Hancock Tax-Free Bond Fund. Shareholders have approved the merger, and it is expected to occur at the close of business on or about February 13, 2015.
MANAGED BY
| | Dianne M. Sales, CFA On the fund since 1995 Investing since 1984 |
7
TOTAL RETURNS FOR THE PERIOD ENDED NOVEMBER 30, 2014
| Average annual total returns (%) with maximum sales charge | Cumulative total returns (%) with maximum sales charge | SEC 30-day yield (%) subsidized | SEC 30-day yield (%) unsubsidized1 | Tax- equivalent subsidized yield (%)2 | |||||||||
| 1-year | 5-year | 10-year | 6-month | 5-year | 10-year | as of 11-30-14 | as of 11-30-14 | as of 11-30-14 | |||||
| Class A | 5.23 | 3.37 | 3.59 | -1.42 | 18.02 | 42.35 | 1.74 | 1.59 | 3.24 | ||||
| Class B | 3.75 | 3.09 | 3.43 | -2.77 | 16.45 | 40.15 | 1.07 | 0.96 | 1.99 | ||||
| Class C | 7.84 | 3.46 | 3.28 | 1.31 | 18.55 | 38.07 | 1.06 | 0.96 | 1.98 | ||||
| Index 1† | 7.72 | 4.73 | 4.82 | 2.33 | 25.97 | 60.13 | — | — | — | ||||
| Index 2† | 8.23 | 5.12 | 4.81 | 2.45 | 28.39 | 59.99 | — | — | — | ||||
Performance figures assume all distributions have been reinvested. Figures reflect maximum sales charges on Class A shares of 4.0% and the applicable contingent deferred sales charge (CDSC) on Class B and Class C shares. The returns for Class A shares have been adjusted to reflect the reduction in the maximum sales charge from 4.5% to 4.0%, effective 2-3-14. The Class B shares' CDSC declines annually between years 1 to 6 according to the following schedule: 5%, 4%, 3%, 3%, 2%, 1%. No sales charge will be assessed after the sixth year. Class C shares held for less than one year are subject to a 1% CDSC.
The expense ratios of the fund, both net (including any fee waivers and/or expense limitations) and gross (excluding any fee waivers and/or expense limitations), are set forth according to the most recent publicly available prospectuses for the fund and may differ from those disclosed in the Financial highlights tables in this report. Had the fee waivers and expense limitations not been in place, gross expenses would apply. The expense ratios are as follows:
| Class A | Class B | Class C | |
| Gross (%) | 1.04 | 1.74 | 1.74 |
| Net (%) | 0.89 | 1.64 | 1.64 |
Please refer to the most recent prospectuses and annual or semiannual report for more information on expenses and any expense limitation arrangements for each class.
The returns reflect past results and should not be considered indicative of future performance. The return and principal value of an investment will fluctuate so that shares, when redeemed, may be worth more or less than their original cost. Due to market volatility, the fund's current performance may be higher or lower than the performance shown. For current to the most recent month-end performance data, please call 800-225-5291 or visit the fund's website at jhinvestments.com.
The performance table above and the chart on the next page do not reflect the deduction of taxes that a shareholder would pay on fund distributions or the redemption of fund shares. The fund's performance results reflect any applicable fee waivers or expense reductions, without which the expenses would increase and results would have been less favorable.
| † | Index 1 is the Barclays Massachusetts Municipal Bond Index; Index 2 is the Barclays Municipal Bond Index. |
See the following page for footnotes.
8
This chart and table show what happened to a hypothetical $10,000 investment in John Hancock Massachusetts Tax-Free Income Fund for the share classes and periods indicated, assuming all distributions were reinvested. For comparison, we've shown the same investment in two separate indexes.
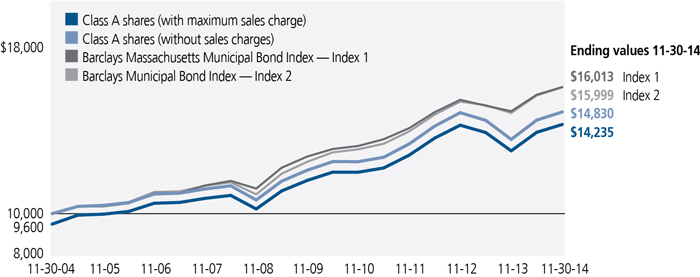
| Start date | With maximum sales charge ($) | Without sales charge ($) | Index 1 ($) | Index 2 ($) | |
| Class B3 | 11-30-04 | 14,015 | 14,015 | 16,013 | 15,999 |
| Class C3 | 11-30-04 | 13,807 | 13,807 | 16,013 | 15,999 |
The values shown in the chart for "Class A shares with maximum sales charge" have been adjusted to reflect the reduction in the Class A shares' maximum sales charge from 4.5% to 4.0%, which became effective on 2-3-14.
Performance of the classes will vary based on the difference in sales charges paid by shareholders investing in the different classes and the fee structure of those classes.
The Barclays Massachusetts Municipal Bond Index is an unmanaged index of Massachusetts investment-grade municipal bonds.
The Barclays Municipal Bond Index is an unmanaged index representative of the tax-exempt bond market.
It is not possible to invest directly in an index. Index figures do not reflect expenses or sales charges, which would have resulted in lower values.
Footnotes related to performance pages
| 1 | Unsubsidized yield reflects what the yield would have been without the effect of reimbursements and waivers. |
| 2 | Tax-equivalent yield is based on the maximum federal income tax rate of 43.4% and state tax rate of 5.2%. |
| 3 | The contingent deferred sales charge is not applicable. |
9
These examples are intended to help you understand your ongoing operating expenses of investing in the fund so you can compare these costs with the ongoing costs of investing in other mutual funds.
Understanding fund expenses
As a shareholder of the fund, you incur two types of costs:
| • | Transaction costs, which include sales charges (loads) on purchases or redemptions (varies by share class), minimum account fee charge, etc. |
| • | Ongoing operating expenses, including management fees, distribution and service fees (if applicable), and other fund expenses. |
We are presenting only your ongoing operating expenses here.
Actual expenses/actual returns
This example is intended to provide information about the fund's actual ongoing operating expenses, and is based on the fund's actual return. It assumes an account value of $1,000.00 on June 1, 2014, with the same investment held until November 30, 2014.
| Account value on 6-1-2014 | Ending value on 11-30-2014 | Expenses paid during period ended 11-30-20141 | Annualized expense ratio | |
| Class A | $1,000.00 | $1,026.90 | $4.62 | 0.91% |
| Class B | 1,000.00 | 1,022.30 | 8.42 | 1.66% |
| Class C | 1,000.00 | 1,023.10 | 8.42 | 1.66% |
Together with the value of your account, you may use this information to estimate the operating expenses that you paid over the period. Simply divide your account value at November 30, 2014, by $1,000.00, then multiply it by the "expenses paid" for your share class from the table above. For example, for an account value of $8,600.00, the operating expenses should be calculated as follows:
10
Hypothetical example for comparison purposes
This table allows you to compare the fund's ongoing operating expenses with those of any other fund. It provides an example of the fund's hypothetical account values and hypothetical expenses based on each class's actual expense ratio and an assumed 5% annualized return before expenses (which is not the fund's actual return). It assumes an account value of $1,000.00 on June 1, 2014, with the same investment held until November 30, 2014. Look in any other fund shareholder report to find its hypothetical example and you will be able to compare these expenses. Please remember that these hypothetical account values and expenses may not be used to estimate the actual ending account balance or expenses you paid for the period.
| Account value on 6-1-2014 | Ending value on 11-30-2014 | Expenses paid during period ended 11-30-20141 | Annualized expense ratio | |
| Class A | $1,000.00 | $1,020.50 | $4.61 | 0.91% |
| Class B | 1,000.00 | 1,016.70 | 8.39 | 1.66% |
| Class C | 1,000.00 | 1,016.70 | 8.39 | 1.66% |
Remember, these examples do not include any transaction costs, therefore, these examples will not help you to determine the relative total costs of owning different funds. If transaction costs were included, your expenses would have been higher. See the prospectus for details regarding transaction costs.
| 1 | Expenses are equal to the fund's annualized expense ratio, multiplied by the average account value over the period, multiplied by 183/365 (to reflect the one-half year period). |
11
Fund's investments
| As of 11-30-14 (unaudited) | ||||||||||||||||||||
| Rate (%) | Maturity date | Par value | Value | |||||||||||||||||
| Municipal bonds 96.1% | $73,256,340 | |||||||||||||||||||
| (Cost $66,189,230) | ||||||||||||||||||||
| Massachusetts 85.2% | 64,971,347 | |||||||||||||||||||
| Boston Housing Authority Capital Program Revenue (D) | 5.000 | 04-01-28 | 2,000,000 | 2,227,438 | ||||||||||||||||
| Commonwealth of Massachusetts Public Improvements (D) | 5.500 | 11-01-17 | 1,000,000 | 1,140,280 | ||||||||||||||||
| Commonwealth of Massachusetts Series E (D) | 5.000 | 11-01-25 | 1,000,000 | 1,249,800 | ||||||||||||||||
| Massachusetts Bay Transportation Authority Sales Tax Revenue, Series A | 5.250 | 07-01-35 | 1,310,000 | 1,722,087 | ||||||||||||||||
| Massachusetts Bay Transportation Authority Sales Tax Revenue, Series A-2 (Z) | 4.273 | 07-01-26 | 2,500,000 | 1,528,875 | ||||||||||||||||
| Massachusetts Bay Transportation Authority Sales Tax Revenue, Series B | 5.250 | 07-01-33 | 2,500,000 | 3,222,075 | ||||||||||||||||
| Massachusetts Development Finance Agency Brandeis University, Series 0-1 | 5.000 | 10-01-40 | 1,000,000 | 1,129,860 | ||||||||||||||||
| Massachusetts Development Finance Agency Carleton Willard Village | 5.625 | 12-01-30 | 850,000 | 947,181 | ||||||||||||||||
| Massachusetts Development Finance Agency Covanta Energy Project, Series C AMT (S) | 5.250 | 11-01-42 | 1,000,000 | 1,026,650 | ||||||||||||||||
| Massachusetts Development Finance Agency Curry College, Series A (D) | 5.250 | 03-01-26 | 1,000,000 | 1,048,520 | ||||||||||||||||
| Massachusetts Development Finance Agency Dominion Energy Brayton Point AMT (P) | 5.000 | 02-01-36 | 2,000,000 | 2,151,660 | ||||||||||||||||
| Massachusetts Development Finance Agency Draper Laboratory | 5.875 | 09-01-30 | 2,000,000 | 2,283,060 | ||||||||||||||||
| Massachusetts Development Finance Agency Emerson College, Series A | 5.000 | 01-01-40 | 2,000,000 | 2,122,440 | ||||||||||||||||
| Massachusetts Development Finance Agency Harvard University, Series B | 5.000 | 10-15-40 | 1,190,000 | 1,365,049 | ||||||||||||||||
| Massachusetts Development Finance Agency Massachusetts College of Pharmacy, Series E (D) | 5.000 | 07-01-37 | 1,000,000 | 1,080,530 | ||||||||||||||||
| Massachusetts Development Finance Agency New England Conservatory of Music | 5.250 | 07-01-38 | 2,000,000 | 2,312,940 | ||||||||||||||||
| Massachusetts Development Finance Agency North Hill Communities, Inc., Series A (S) | 6.500 | 11-15-43 | 1,000,000 | 1,055,520 | ||||||||||||||||
| Massachusetts Development Finance Agency Northeastern University, Series A | 5.000 | 03-01-39 | 1,000,000 | 1,125,280 | ||||||||||||||||
| Massachusetts Development Finance Agency Olin College, Series E | 5.000 | 11-01-38 | 1,000,000 | 1,110,870 | ||||||||||||||||
| Massachusetts Development Finance Agency Orchard Cove | 5.250 | 10-01-26 | 1,000,000 | 1,010,570 | ||||||||||||||||
| Massachusetts Health & Educational Facilities Authority Harvard Pilgrim Health Care, Series A (D) | 5.000 | 07-01-18 | 1,000,000 | 1,004,010 | ||||||||||||||||
| Massachusetts Health & Educational Facilities Authority Lahey Clinic Medical Center, Series C (D) | 5.000 | 08-15-23 | 1,000,000 | $1,030,240 | ||||||||||||||||
| Massachusetts Health & Educational Facilities Authority Mass Eye & Ear Infirmary | 5.375 | 07-01-35 | 2,000,000 | 2,137,520 | ||||||||||||||||
| Massachusetts Health & Educational Facilities Authority Partners HealthCare System | 5.000 | 07-01-22 | 1,000,000 | 1,138,190 | ||||||||||||||||
| Massachusetts Health & Educational Facilities Authority Partners HealthCare, Series J1 | 5.000 | 07-01-34 | 1,000,000 | 1,130,050 | ||||||||||||||||
| Massachusetts Health & Educational Facilities Authority Springfield College | 5.625 | 10-15-40 | 2,000,000 | 2,161,120 | ||||||||||||||||
| Massachusetts Health & Educational Facilities Authority Suffolk University, Series A | 5.750 | 07-01-39 | 1,000,000 | 1,104,010 | ||||||||||||||||
| Massachusetts Health & Educational Facilities Authority Suffolk University, Series A | 6.250 | 07-01-30 | 1,000,000 | 1,170,230 | ||||||||||||||||
| Massachusetts Health & Educational Facilities Authority Tufts University | 5.375 | 08-15-38 | 350,000 | 397,793 | ||||||||||||||||
| Massachusetts Health & Educational Facilities Authority Woods Hole Oceanographic, Series B | 5.375 | 06-01-30 | 1,000,000 | 1,113,450 | ||||||||||||||||
| Massachusetts Port Authority Boston Fuel Project AMT (D) | 5.000 | 07-01-32 | 1,770,000 | 1,874,483 | ||||||||||||||||
| Massachusetts Port Authority Conrac Project, Series A | 5.125 | 07-01-41 | 1,500,000 | 1,641,405 | ||||||||||||||||
| Massachusetts Port Authority Series B | 5.000 | 07-01-32 | 2,000,000 | 2,269,720 | ||||||||||||||||
| Massachusetts State College Building Authority College & University Revenue, Series A | 5.500 | 05-01-49 | 1,000,000 | 1,133,900 | ||||||||||||||||
| Massachusetts State College Building Authority College & University Revenue, Series B (D)(Z) | 1.546 | 05-01-19 | 1,000,000 | 933,560 | ||||||||||||||||
| Massachusetts State Department of Transportation Highway Revenue Tolls, Series B | 5.000 | 01-01-37 | 3,000,000 | 3,285,720 | ||||||||||||||||
| Massachusetts State Department of Transportation Highway Revenue Tolls, Series C (D)(Z) | 1.614 | 01-01-20 | 1,000,000 | 920,670 | ||||||||||||||||
| Massachusetts Water Pollution Abatement Trust Series 9 | 5.250 | 08-01-18 | 60,000 | 62,026 | ||||||||||||||||
| Massachusetts Water Pollution Abatement Trust Unrefunded 2012 Pooled Loan Program, Series 7 | 5.125 | 02-01-31 | 105,000 | 105,381 | ||||||||||||||||
| Massachusetts Water Pollution Abatement Trust Water Revenue, Series 14 | 5.000 | 08-01-32 | 1,000,000 | 1,131,800 | ||||||||||||||||
| Massachusetts Water Resources Authority Water Revenue, Series A | 5.000 | 08-01-40 | 1,600,000 | 1,804,864 | ||||||||||||||||
| Massachusetts Water Resources Authority Water Revenue, Series B | 5.000 | 08-01-39 | 1,000,000 | 1,128,470 | ||||||||||||||||
| Massachusetts Water Resources Authority General Revenue, Series B (D) | 5.250 | 08-01-29 | 2,500,000 | 3,194,550 | ||||||||||||||||
| Metropolitan Boston Transit Parking Corp. | 5.000 | 07-01-41 | 2,000,000 | 2,237,500 | ||||||||||||||||
| Puerto Rico 8.0% | $6,061,933 | |||||||||||||||||||
| Puerto Rico Highway & Transportation Authority Prerefunded, Series AA (D) | 5.500 | 07-01-19 | 1,640,000 | 1,954,913 | ||||||||||||||||
| Puerto Rico Housing Finance Authority Subordinated Capital Fund Modernization (D) | 5.125 | 12-01-27 | 1,000,000 | 1,069,160 | ||||||||||||||||
| Puerto Rico Sales Tax Financing Corp. Sales Tax Revenue, Series A (0.000% steps up to 6.750% on 8-1-16) (Z) | 1.525 | 08-01-32 | 2,000,000 | 1,547,800 | ||||||||||||||||
| Puerto Rico Sales Tax Financing Corp., Series C | 5.375 | 08-01-38 | 2,000,000 | 1,490,060 | ||||||||||||||||
| Virgin Islands 2.2% | 1,670,825 | |||||||||||||||||||
| Virgin Islands Public Finance Authority, Series A | 6.750 | 10-01-37 | 1,000,000 | 1,141,140 | ||||||||||||||||
| Virgin Islands Public Finance Authority, Series A-1 | 5.000 | 10-01-39 | 500,000 | 529,685 | ||||||||||||||||
| Guam 0.7% | 552,235 | |||||||||||||||||||
| Guam Government, Series A | 5.750 | 12-01-34 | 500,000 | 552,235 | ||||||||||||||||
| Par value | Value | |||||||||||||||||||
| Short-term investments 2.6% | $1,984,000 | |||||||||||||||||||
| (Cost $1,984,000) | ||||||||||||||||||||
| Repurchase agreement 2.6% | 1,984,000 | |||||||||||||||||||
| Barclays Tri-Party Repurchase Agreement dated 11-28-14 at 0.0600% to be repurchased at $1,984,010 on 12-1-14, collateralized by $1,861,500 U.S. Treasury Inflation Indexed Notes, 0.125% due 4-15-16 (valued at $2,023,784, including interest) | 1,984,000 | 1,984,000 | ||||||||||||||||||
| Total investments (Cost $68,173,230)† 98.7% | $75,240,340 | |||||||||||||||||||
| Other assets and liabilities, net 1.3% | $969,081 | |||||||||||||||||||
| Total net assets 100.0% | $76,209,421 | |||||||||||||||||||
The percentage shown for each investment category is the total value of the category as a percentage of the net assets of the fund. Key to Security Abbreviations and Legend | ||||||
| AMT | Interest earned from these securities may be considered a tax preference item for purpose of the Federal Alternative Minimum Tax. | |||||
| (D) | Bond is insured by one or more of these companies: | |||||
| Insurance Coverage | As a % of total Investments | |||||
| Assured Guaranty Municipal Corp. | 10.1% | |||||
| National Public Finance Guarantee Corp. | 7.7% | |||||
| Ambac Financial Group, Inc. | 1.7% | |||||
| Assured Guaranty Corp. | 1.4% | |||||
| Capital Funding Program | 1.4% | |||||
| ACA Financial Guaranty Corp. | 1.4% | |||||
| XL Capital Assurance, Inc. | 1.2% | |||||
| Total | 24.9% | |||||
| (P) | Variable rate obligation. The coupon rate shown represents the rate at period end. | |||||
| (S) | These securities are exempt from registration under Rule 144A of the Securities Act of 1933. Such securities may be resold, normally to qualified institutional buyers, in transactions exempt from registration. | |||||
| (Z) | Zero coupon bonds are issued at a discount from their principal amount in lieu of paying interest periodically. Rate shown is the effective yield at period end. | |||||
| † | At 11-30-14, the aggregate cost of investment securities for federal income tax purposes was $67,885,542. Net unrealized appreciation aggregated $7,354,798, of which $7,844,818 related to appreciated investment securities and $490,020 related to depreciated investment securities. | |||||
Financial statements
STATEMENT OF ASSETS AND LIABILITIES 11-30-14 (unaudited)
| Assets | ||||||||||||||||||||||||||||||||||||||||
| Investments, at value (Cost $68,173,230) | $75,240,340 | |||||||||||||||||||||||||||||||||||||||
| Cash | 97,588 | |||||||||||||||||||||||||||||||||||||||
| Receivable for fund shares sold | 6,543 | |||||||||||||||||||||||||||||||||||||||
| Interest receivable | 1,036,930 | |||||||||||||||||||||||||||||||||||||||
| Receivable from affiliates | 1,009 | |||||||||||||||||||||||||||||||||||||||
| Other receivables and prepaid expenses | 9,318 | |||||||||||||||||||||||||||||||||||||||
| Total assets | 76,391,728 | |||||||||||||||||||||||||||||||||||||||
| Liabilities | ||||||||||||||||||||||||||||||||||||||||
| Payable for fund shares repurchased | 74,061 | |||||||||||||||||||||||||||||||||||||||
| Distributions payable | 35,876 | |||||||||||||||||||||||||||||||||||||||
| Payable to affiliates | ||||||||||||||||||||||||||||||||||||||||
| Accounting and legal services fees | 3,219 | |||||||||||||||||||||||||||||||||||||||
| Transfer agent fees | 6,611 | |||||||||||||||||||||||||||||||||||||||
| Distribution and service fees | 10,094 | |||||||||||||||||||||||||||||||||||||||
| Trustees' fees | 323 | |||||||||||||||||||||||||||||||||||||||
| Other liabilities and accrued expenses | 52,123 | |||||||||||||||||||||||||||||||||||||||
| Total liabilities | 182,307 | |||||||||||||||||||||||||||||||||||||||
| Net assets | $76,209,421 | |||||||||||||||||||||||||||||||||||||||
| Net assets consist of | ||||||||||||||||||||||||||||||||||||||||
| Paid-in capital | $73,089,819 | |||||||||||||||||||||||||||||||||||||||
| Undistributed net investment income | 115,162 | |||||||||||||||||||||||||||||||||||||||
| Accumulated net realized gain (loss) on investments | (4,062,670 | ) | ||||||||||||||||||||||||||||||||||||||
| Net unrealized appreciation (depreciation) on investments | 7,067,110 | |||||||||||||||||||||||||||||||||||||||
| Net assets | $76,209,421 | |||||||||||||||||||||||||||||||||||||||
STATEMENT OF ASSETS AND LIABILITIES (continued)
| Net asset value per share | ||||||||||||||||||
| Based on net asset values and shares outstanding-the fund has an unlimited number of shares authorized with no par value | ||||||||||||||||||
| Class A ($62,129,320 ÷ 4,944,208 shares)1 | $12.57 | |||||||||||||||||
| Class B ($1,908,096 ÷ 151,876 shares)1 | $12.56 | |||||||||||||||||
| Class C ($12,172,005 ÷ 968,678 shares)1 | $12.57 | |||||||||||||||||
| Maximum offering price per share | ||||||||||||||||||
| Class A (net asset value per share ÷ 96%)2 | $13.09 | |||||||||||||||||
| 1 | Redemption price per share is equal to net asset value less any applicable contingent deferred sales charge. | |||||||
| 2 | On single retail sales of less than $100,000. On sales of $100,000 or more and on group sales the offering price is reduced. | |||||||
STATEMENT OF OPERATIONS For the six months ended 11-30-14 (unaudited)
| Investment income | ||||||||||||||||||||||||||||||||||||||||
| Interest | $1,853,897 | |||||||||||||||||||||||||||||||||||||||
| Expenses | ||||||||||||||||||||||||||||||||||||||||
| Investment management fees | 212,487 | |||||||||||||||||||||||||||||||||||||||
| Distribution and service fees | 180,818 | |||||||||||||||||||||||||||||||||||||||
| Accounting and legal services fees | 7,650 | |||||||||||||||||||||||||||||||||||||||
| Transfer agent fees | 24,320 | |||||||||||||||||||||||||||||||||||||||
| Trustees' fees | 490 | |||||||||||||||||||||||||||||||||||||||
| State registration fees | 8,695 | |||||||||||||||||||||||||||||||||||||||
| Printing and postage | 3,982 | |||||||||||||||||||||||||||||||||||||||
| Professional fees | 46,926 | |||||||||||||||||||||||||||||||||||||||
| Custodian fees | 7,055 | |||||||||||||||||||||||||||||||||||||||
| Registration and filing fees | 13,095 | |||||||||||||||||||||||||||||||||||||||
| Other | 352 | |||||||||||||||||||||||||||||||||||||||
| Total expenses | 505,870 | |||||||||||||||||||||||||||||||||||||||
| Less expense reductions | (63,023 | ) | ||||||||||||||||||||||||||||||||||||||
| Net expenses | 442,847 | |||||||||||||||||||||||||||||||||||||||
| Net investment income | 1,411,050 | |||||||||||||||||||||||||||||||||||||||
| Realized and unrealized gain (loss) | ||||||||||||||||||||||||||||||||||||||||
| Net realized gain (loss) on | ||||||||||||||||||||||||||||||||||||||||
| Investments | (287,335 | ) | ||||||||||||||||||||||||||||||||||||||
| (287,335 | ) | |||||||||||||||||||||||||||||||||||||||
| Change in net unrealized appreciation (depreciation) of | ||||||||||||||||||||||||||||||||||||||||
| Investments | 1,020,761 | |||||||||||||||||||||||||||||||||||||||
| 1,020,761 | ||||||||||||||||||||||||||||||||||||||||
| Net realized and unrealized gain | 733,426 | |||||||||||||||||||||||||||||||||||||||
| Increase in net assets from operations | $2,144,476 | |||||||||||||||||||||||||||||||||||||||
STATEMENTS OF CHANGES IN NET ASSETS
| Six months ended 11-30-14 | Year ended 5-31-14 | |||||||||||||||||||||||||||||||||||||||||||||||||
| (unaudited) | ||||||||||||||||||||||||||||||||||||||||||||||||||
| Increase (decrease) in net assets | ||||||||||||||||||||||||||||||||||||||||||||||||||
| From operations | ||||||||||||||||||||||||||||||||||||||||||||||||||
| Net investment income | $1,411,050 | $3,519,493 | ||||||||||||||||||||||||||||||||||||||||||||||||
| Net realized loss | (287,335 | ) | (4,072,230 | ) | ||||||||||||||||||||||||||||||||||||||||||||||
| Change in net unrealized appreciation (depreciation) | 1,020,761 | (1,572,170 | ) | |||||||||||||||||||||||||||||||||||||||||||||||
| Increase (decrease) in net assets resulting from operations | 2,144,476 | (2,124,907 | ) | |||||||||||||||||||||||||||||||||||||||||||||||
| Distributions to shareholders | ||||||||||||||||||||||||||||||||||||||||||||||||||
| From net investment income | ||||||||||||||||||||||||||||||||||||||||||||||||||
| Class A | (1,245,493 | ) | (3,048,725 | ) | ||||||||||||||||||||||||||||||||||||||||||||||
| Class B | (29,231 | ) | (75,533 | ) | ||||||||||||||||||||||||||||||||||||||||||||||
| Class C | (185,349 | ) | (458,662 | ) | ||||||||||||||||||||||||||||||||||||||||||||||
| From net realized gain | ||||||||||||||||||||||||||||||||||||||||||||||||||
| Class A | — | (127,277 | ) | |||||||||||||||||||||||||||||||||||||||||||||||
| Class B | — | (3,898 | ) | |||||||||||||||||||||||||||||||||||||||||||||||
| Class C | — | (22,840 | ) | |||||||||||||||||||||||||||||||||||||||||||||||
| Total distributions | (1,460,073 | ) | (3,736,935 | ) | ||||||||||||||||||||||||||||||||||||||||||||||
| From fund share transactions | (14,612,176 | ) | (30,184,088 | ) | ||||||||||||||||||||||||||||||||||||||||||||||
| Total decrease | (13,927,773 | ) | (36,045,930 | ) | ||||||||||||||||||||||||||||||||||||||||||||||
| Net assets | ||||||||||||||||||||||||||||||||||||||||||||||||||
| Beginning of period | 90,137,194 | 126,183,124 | ||||||||||||||||||||||||||||||||||||||||||||||||
| End of period | $76,209,421 | $90,137,194 | ||||||||||||||||||||||||||||||||||||||||||||||||
| Undistributed net investment income | $115,162 | $164,185 | ||||||||||||||||||||||||||||||||||||||||||||||||
Financial highlights
| Class A Shares Period ended | 11-30-14 | 1 | 5-31-14 | 5-31-13 | 5-31-12 | 5-31-11 | 5-31-10 | ||||||||||||||||||||||||||||||||||||||||||||||||||||||||||||||||||||||||||||||||||||||||||||||||||||||||||||||||
| Per share operating performance | |||||||||||||||||||||||||||||||||||||||||||||||||||||||||||||||||||||||||||||||||||||||||||||||||||||||||||||||||||||||
| Net asset value, beginning of period | $12.46 | $12.95 | $13.13 | $12.22 | $12.53 | $12.10 | |||||||||||||||||||||||||||||||||||||||||||||||||||||||||||||||||||||||||||||||||||||||||||||||||||||||||||||||||
| Net investment income2 | 0.22 | 0.45 | 0.44 | 0.49 | 0.50 | 0.49 | |||||||||||||||||||||||||||||||||||||||||||||||||||||||||||||||||||||||||||||||||||||||||||||||||||||||||||||||||
| Net realized and unrealized gain (loss) on investments | 0.11 | (0.46 | ) | (0.18 | ) | 0.91 | (0.30 | ) | 0.46 | ||||||||||||||||||||||||||||||||||||||||||||||||||||||||||||||||||||||||||||||||||||||||||||||||||||||||||||||
| Total from investment operations | 0.33 | (0.01 | ) | 0.26 | 1.40 | 0.20 | 0.95 | ||||||||||||||||||||||||||||||||||||||||||||||||||||||||||||||||||||||||||||||||||||||||||||||||||||||||||||||||
| Less distributions | |||||||||||||||||||||||||||||||||||||||||||||||||||||||||||||||||||||||||||||||||||||||||||||||||||||||||||||||||||||||
| From net investment income | (0.22 | ) | (0.46 | ) | (0.44 | ) | (0.48 | ) | (0.49 | ) | (0.49 | ) | |||||||||||||||||||||||||||||||||||||||||||||||||||||||||||||||||||||||||||||||||||||||||||||||||||||||||||
| From net realized gain | — | (0.02 | ) | — | 3 | (0.01 | ) | (0.02 | ) | (0.03 | ) | ||||||||||||||||||||||||||||||||||||||||||||||||||||||||||||||||||||||||||||||||||||||||||||||||||||||||||||
| Total distributions | (0.22 | ) | (0.48 | ) | (0.44 | ) | (0.49 | ) | (0.51 | ) | (0.52 | ) | |||||||||||||||||||||||||||||||||||||||||||||||||||||||||||||||||||||||||||||||||||||||||||||||||||||||||||
| Net asset value, end of period | $12.57 | $12.46 | $12.95 | $13.13 | $12.22 | $12.53 | |||||||||||||||||||||||||||||||||||||||||||||||||||||||||||||||||||||||||||||||||||||||||||||||||||||||||||||||||
| Total return (%)4,5 | 2.69 | 6 | 0.07 | 1.94 | 11.67 | 1.67 | 8.04 | ||||||||||||||||||||||||||||||||||||||||||||||||||||||||||||||||||||||||||||||||||||||||||||||||||||||||||||||||
| Ratios and supplemental data | |||||||||||||||||||||||||||||||||||||||||||||||||||||||||||||||||||||||||||||||||||||||||||||||||||||||||||||||||||||||
| Net assets, end of period (in millions) | $62 | $74 | $103 | $105 | $92 | $105 | |||||||||||||||||||||||||||||||||||||||||||||||||||||||||||||||||||||||||||||||||||||||||||||||||||||||||||||||||
| Ratios (as a percentage of average net assets): | |||||||||||||||||||||||||||||||||||||||||||||||||||||||||||||||||||||||||||||||||||||||||||||||||||||||||||||||||||||||
| Expenses before reductions | 1.05 | 7 | 1.04 | 0.98 | 1.00 | 1.00 | 1.00 | ||||||||||||||||||||||||||||||||||||||||||||||||||||||||||||||||||||||||||||||||||||||||||||||||||||||||||||||||
| Expenses including reductions | 0.89 | 7 | 0.88 | 0.83 | 0.87 | 0.95 | 1.00 | ||||||||||||||||||||||||||||||||||||||||||||||||||||||||||||||||||||||||||||||||||||||||||||||||||||||||||||||||
| Net investment income | 3.46 | 7 | 3.70 | 3.31 | 3.82 | 4.04 | 4.00 | ||||||||||||||||||||||||||||||||||||||||||||||||||||||||||||||||||||||||||||||||||||||||||||||||||||||||||||||||
| Portfolio turnover (%) | 0 | 10 | 16 | 11 | 17 | 10 | |||||||||||||||||||||||||||||||||||||||||||||||||||||||||||||||||||||||||||||||||||||||||||||||||||||||||||||||||
| 1 | Six months ended 11-30-14. Unaudited. | |||||||||||||||||||||||||||||||||||||
| 2 | Based on average daily shares outstanding. | |||||||||||||||||||||||||||||||||||||
| 3 | Less than $0.005 per share. | |||||||||||||||||||||||||||||||||||||
| 4 | Does not reflect the effect of sales charges, if any. | |||||||||||||||||||||||||||||||||||||
| 5 | Total returns would have been lower had certain expenses not been reduced during the applicable periods. | |||||||||||||||||||||||||||||||||||||
| 6 | Not annualized. | |||||||||||||||||||||||||||||||||||||
| 7 | Annualized. | |||||||||||||||||||||||||||||||||||||
| Class B Shares Period ended | 11-30-14 | 1 | 5-31-14 | 5-31-13 | 5-31-12 | 5-31-11 | 5-31-10 | ||||||||||||||||||||||||||||||||||||||||||||||||||||||||||||||||||||||||||||||||||||||||||||||||||||||||||||||||
| Per share operating performance | |||||||||||||||||||||||||||||||||||||||||||||||||||||||||||||||||||||||||||||||||||||||||||||||||||||||||||||||||||||||
| Net asset value, beginning of period | $12.46 | $12.95 | $13.13 | $12.22 | $12.53 | $12.09 | |||||||||||||||||||||||||||||||||||||||||||||||||||||||||||||||||||||||||||||||||||||||||||||||||||||||||||||||||
| Net investment income2 | 0.17 | 0.36 | 0.34 | 0.39 | 0.41 | 0.41 | |||||||||||||||||||||||||||||||||||||||||||||||||||||||||||||||||||||||||||||||||||||||||||||||||||||||||||||||||
| Net realized and unrealized gain (loss) on investments | 0.11 | (0.47 | ) | (0.18 | ) | 0.92 | (0.29 | ) | 0.46 | ||||||||||||||||||||||||||||||||||||||||||||||||||||||||||||||||||||||||||||||||||||||||||||||||||||||||||||||
| Total from investment operations | 0.28 | (0.11 | ) | 0.16 | 1.31 | 0.12 | 0.87 | ||||||||||||||||||||||||||||||||||||||||||||||||||||||||||||||||||||||||||||||||||||||||||||||||||||||||||||||||
| Less distributions | |||||||||||||||||||||||||||||||||||||||||||||||||||||||||||||||||||||||||||||||||||||||||||||||||||||||||||||||||||||||
| From net investment income | (0.18 | ) | (0.36 | ) | (0.34 | ) | (0.39 | ) | (0.41 | ) | (0.40 | ) | |||||||||||||||||||||||||||||||||||||||||||||||||||||||||||||||||||||||||||||||||||||||||||||||||||||||||||
| From net realized gain | — | (0.02 | ) | — | 3 | (0.01 | ) | (0.02 | ) | (0.03 | ) | ||||||||||||||||||||||||||||||||||||||||||||||||||||||||||||||||||||||||||||||||||||||||||||||||||||||||||||
| Total distributions | (0.18 | ) | (0.38 | ) | (0.34 | ) | (0.40 | ) | (0.43 | ) | (0.43 | ) | |||||||||||||||||||||||||||||||||||||||||||||||||||||||||||||||||||||||||||||||||||||||||||||||||||||||||||
| Net asset value, end of period | $12.56 | $12.46 | $12.95 | $13.13 | $12.22 | $12.53 | |||||||||||||||||||||||||||||||||||||||||||||||||||||||||||||||||||||||||||||||||||||||||||||||||||||||||||||||||
| Total return (%)4,5 | 2.23 | 6 | (0.68 | ) | 1.18 | 10.85 | 0.96 | 7.37 | |||||||||||||||||||||||||||||||||||||||||||||||||||||||||||||||||||||||||||||||||||||||||||||||||||||||||||||||
| Ratios and supplemental data | |||||||||||||||||||||||||||||||||||||||||||||||||||||||||||||||||||||||||||||||||||||||||||||||||||||||||||||||||||||||
| Net assets, end of period (in millions) | $2 | $2 | $3 | $3 | $3 | $5 | |||||||||||||||||||||||||||||||||||||||||||||||||||||||||||||||||||||||||||||||||||||||||||||||||||||||||||||||||
| Ratios (as a percentage of average net assets): | |||||||||||||||||||||||||||||||||||||||||||||||||||||||||||||||||||||||||||||||||||||||||||||||||||||||||||||||||||||||
| Expenses before reductions | 1.75 | 7 | 1.74 | 1.68 | 1.70 | 1.70 | 1.70 | ||||||||||||||||||||||||||||||||||||||||||||||||||||||||||||||||||||||||||||||||||||||||||||||||||||||||||||||||
| Expenses including reductions | 1.64 | 7 | 1.63 | 1.58 | 1.62 | 1.65 | 1.70 | ||||||||||||||||||||||||||||||||||||||||||||||||||||||||||||||||||||||||||||||||||||||||||||||||||||||||||||||||
| Net investment income | 2.70 | 7 | 2.95 | 2.56 | 3.08 | 3.33 | 3.29 | ||||||||||||||||||||||||||||||||||||||||||||||||||||||||||||||||||||||||||||||||||||||||||||||||||||||||||||||||
| Portfolio turnover (%) | 0 | 10 | 16 | 11 | 17 | 10 | |||||||||||||||||||||||||||||||||||||||||||||||||||||||||||||||||||||||||||||||||||||||||||||||||||||||||||||||||
| 1 | Six months ended 11-30-14. Unaudited. | |||||||||||||||||||||||||||||||||||||
| 2 | Based on average daily shares outstanding. | |||||||||||||||||||||||||||||||||||||
| 3 | Less than $0.005 per share. | |||||||||||||||||||||||||||||||||||||
| 4 | Does not reflect the effect of sales charges, if any. | |||||||||||||||||||||||||||||||||||||
| 5 | Total returns would have been lower had certain expenses not been reduced during the applicable periods. | |||||||||||||||||||||||||||||||||||||
| 6 | Not annualized. | |||||||||||||||||||||||||||||||||||||
| 7 | Annualized. | |||||||||||||||||||||||||||||||||||||
| Class C Shares Period ended | 11-30-14 | 1 | 5-31-14 | 5-31-13 | 5-31-12 | 5-31-11 | 5-31-10 | ||||||||||||||||||||||||||||||||||||||||||||||||||||||||||||||||||||||||||||||||||||||||||||||||||||||||||||||||
| Per share operating performance | |||||||||||||||||||||||||||||||||||||||||||||||||||||||||||||||||||||||||||||||||||||||||||||||||||||||||||||||||||||||
| Net asset value, beginning of period | $12.46 | $12.95 | $13.13 | $12.22 | $12.53 | $12.10 | |||||||||||||||||||||||||||||||||||||||||||||||||||||||||||||||||||||||||||||||||||||||||||||||||||||||||||||||||
| Net investment income2 | 0.17 | 0.36 | 0.34 | 0.39 | 0.41 | 0.41 | |||||||||||||||||||||||||||||||||||||||||||||||||||||||||||||||||||||||||||||||||||||||||||||||||||||||||||||||||
| Net realized and unrealized gain (loss) on investments | 0.12 | (0.47 | ) | (0.18 | ) | 0.92 | (0.29 | ) | 0.45 | ||||||||||||||||||||||||||||||||||||||||||||||||||||||||||||||||||||||||||||||||||||||||||||||||||||||||||||||
| Total from investment operations | 0.29 | (0.11 | ) | 0.16 | 1.31 | 0.12 | 0.86 | ||||||||||||||||||||||||||||||||||||||||||||||||||||||||||||||||||||||||||||||||||||||||||||||||||||||||||||||||
| Less distributions | |||||||||||||||||||||||||||||||||||||||||||||||||||||||||||||||||||||||||||||||||||||||||||||||||||||||||||||||||||||||
| From net investment income | (0.18 | ) | (0.36 | ) | (0.34 | ) | (0.39 | ) | (0.41 | ) | (0.40 | ) | |||||||||||||||||||||||||||||||||||||||||||||||||||||||||||||||||||||||||||||||||||||||||||||||||||||||||||
| From net realized gain | — | (0.02 | ) | — | 3 | (0.01 | ) | (0.02 | ) | (0.03 | ) | ||||||||||||||||||||||||||||||||||||||||||||||||||||||||||||||||||||||||||||||||||||||||||||||||||||||||||||
| Total distributions | (0.18 | ) | (0.38 | ) | (0.34 | ) | (0.40 | ) | (0.43 | ) | (0.43 | ) | |||||||||||||||||||||||||||||||||||||||||||||||||||||||||||||||||||||||||||||||||||||||||||||||||||||||||||
| Net asset value, end of period | $12.57 | $12.46 | $12.95 | $13.13 | $12.22 | $12.53 | |||||||||||||||||||||||||||||||||||||||||||||||||||||||||||||||||||||||||||||||||||||||||||||||||||||||||||||||||
| Total return (%)4,5 | 2.31 | 6 | (0.67 | ) | 1.18 | 10.85 | 0.96 | 7.29 | |||||||||||||||||||||||||||||||||||||||||||||||||||||||||||||||||||||||||||||||||||||||||||||||||||||||||||||||
| Ratios and supplemental data | |||||||||||||||||||||||||||||||||||||||||||||||||||||||||||||||||||||||||||||||||||||||||||||||||||||||||||||||||||||||
| Net assets, end of period (in millions) | $12 | $14 | $20 | $19 | $17 | $19 | |||||||||||||||||||||||||||||||||||||||||||||||||||||||||||||||||||||||||||||||||||||||||||||||||||||||||||||||||
| Ratios (as a percentage of average net assets): | |||||||||||||||||||||||||||||||||||||||||||||||||||||||||||||||||||||||||||||||||||||||||||||||||||||||||||||||||||||||
| Expenses before reductions | 1.75 | 7 | 1.74 | 1.68 | 1.70 | 1.70 | 1.70 | ||||||||||||||||||||||||||||||||||||||||||||||||||||||||||||||||||||||||||||||||||||||||||||||||||||||||||||||||
| Expenses including reductions | 1.64 | 7 | 1.63 | 1.58 | 1.62 | 1.65 | 1.70 | ||||||||||||||||||||||||||||||||||||||||||||||||||||||||||||||||||||||||||||||||||||||||||||||||||||||||||||||||
| Net investment income | 2.70 | 7 | 2.95 | 2.56 | 3.07 | 3.34 | 3.30 | ||||||||||||||||||||||||||||||||||||||||||||||||||||||||||||||||||||||||||||||||||||||||||||||||||||||||||||||||
| Portfolio turnover (%) | 0 | 10 | 16 | 11 | 17 | 10 | |||||||||||||||||||||||||||||||||||||||||||||||||||||||||||||||||||||||||||||||||||||||||||||||||||||||||||||||||
| 1 | Six months ended 11-30-14. Unaudited. | |||||||||||||||||||||||||||||||||||||
| 2 | Based on average daily shares outstanding. | |||||||||||||||||||||||||||||||||||||
| 3 | Less than $0.005 per share. | |||||||||||||||||||||||||||||||||||||
| 4 | Does not reflect the effect of sales charges, if any. | |||||||||||||||||||||||||||||||||||||
| 5 | Total returns would have been lower had certain expenses not been reduced during the applicable periods. | |||||||||||||||||||||||||||||||||||||
| 6 | Not annualized. | |||||||||||||||||||||||||||||||||||||
| 7 | Annualized. | |||||||||||||||||||||||||||||||||||||
Note 1 — Organization
John Hancock Massachusetts Tax-Free Income Fund (the fund) is a series of John Hancock Tax-Exempt Series Fund (the Trust), an open-end management investment company organized as a Massachusetts business trust and registered under the Investment Company Act of 1940, as amended (the 1940 Act). The investment objective of the fund is to seek a high level of current income, consistent with preservation of capital, that is exempt from federal and Massachusetts personal income taxes.
The fund may offer multiple classes of shares. The shares currently outstanding are detailed in the Statement of assets and liabilities. All share classes are currently closed to new investors in anticipation of a reorganization of the fund into John Hancock Tax-Free Bond Fund. Shareholders of each class have exclusive voting rights to matters that affect that class. The distribution and service fees, if any, and transfer agent fees for each class may differ. Class B shares convert to Class A shares eight years after purchase.
On June 25, 2014, the Board of Trustees approved a proposal to merge the fund into John Hancock Tax-Free Bond Fund, a series of John Hancock Municipal Series Trust. Shareholders of the fund approved the merger at a shareholder meeting held on January 9, 2015, and it is expected to be complete on or about February 13, 2015. The fund will remain open to purchases and redemptions from existing shareholders until on or about February 13, 2015.
Note 2 — Significant accounting policies
The financial statements have been prepared in conformity with accounting principles generally accepted in the United States of America (US GAAP), which require management to make certain estimates and assumptions as of the date of the financial statements. Actual results could differ from those estimates and those differences could be significant. The fund intends to qualify as an investment company under Topic 946 of Accounting Standards Codification of US GAAP.
Events or transactions occurring after the end of the fiscal period through the date that the financial statements were issued have been evaluated in the preparation of the financial statements. The following summarizes the significant accounting policies of the fund:
Security valuation. Investments are stated at value as of the close of regular trading on the New York Stock Exchange (NYSE), normally at 4:00 p.m., Eastern Time. In order to value the securities, the fund uses the following valuation techniques: Debt obligations are valued based on the evaluated prices provided by an independent pricing vendor or from broker-dealers. Independent pricing vendors utilize matrix pricing which takes into account factors such as institutional-size trading in similar groups of securities, yield, quality, coupon rate, maturity, type of issue, trading characteristics and other market data, as well as broker supplied prices. Securities that trade only in the over-the-counter market are valued using bid prices. Certain short-term securities with maturities of 60 days or less at the time of purchase are valued at amortized cost. Other portfolio securities and assets, for which reliable market quotations are not readily available, are valued at fair value as determined in good faith by the fund's Pricing Committee following procedures established by the Board of Trustees. The frequency with which these fair valuation procedures are used cannot be predicted and fair value of securities may differ significantly from the value that would have been used had a ready market for such securities existed.
The fund uses a three-tier hierarchy to prioritize the pricing assumptions, referred to as inputs, used in valuation techniques to measure fair value. Level 1 includes securities valued using quoted prices in active markets for identical securities. Level 2 includes securities valued using other significant observable inputs. Observable inputs may include quoted prices for similar securities, interest rates, prepayment speeds and credit risk. Prices for securities valued using these inputs are received from independent pricing vendors and brokers and are based on an evaluation of the inputs described. Level 3 includes securities valued using significant unobservable inputs when market prices are not readily available or reliable, including the fund's own assumptions in determining the fair value of investments. Factors used in determining value may include market or issuer specific events or trends, changes in interest rates and credit quality. The inputs or methodology used for valuing securities are not necessarily an indication of the risks associated with investing in those securities. Changes in valuation techniques may result in transfers into or out of an assigned level within the disclosure hierarchy.
As of November 30, 2014, all investments are categorized as Level 2 under the hierarchy described above.
23
Repurchase agreements. The fund may enter into repurchase agreements. When the fund enters into a repurchase agreement, it receives collateral that is held in a segregated account by the fund's custodian, or for tri-party repurchase agreements, collateral is held at a third-party custodian bank in a segregated account for the benefit of the fund. The collateral amount is marked-to-market and monitored on a daily basis to ensure that the collateral held is in an amount not less than the principal amount of the repurchase agreement plus any accrued interest. Collateral received by the fund for repurchase agreements is disclosed in the Fund's investments as part of the caption related to the repurchase agreement.
Repurchase agreements are typically governed by the terms and conditions of the Master Repurchase Agreement and/or Global Master Repurchase Agreement (collectively, MRA). Upon an event of default, the non-defaulting party may close out all transactions traded under the MRA and net amounts owed. Absent an event of default, the MRA does not result in an offset of the reported amounts of assets and liabilities in the Statement of assets and liabilities. In the event of a default by the counterparty, realization of the collateral proceeds could be delayed, during which time the collateral value may decline or the counterparty may have insufficient assets to pay back claims resulting from close-out of the transactions.
Security transactions and related investment income. Investment security transactions are accounted for on a trade date plus one basis for daily net asset value calculations. However, for financial reporting purposes, investment transactions are reported on trade date. Interest income is accrued as earned. Interest income includes coupon interest and amortization/accretion of premiums/discounts on debt securities. Debt obligations may be placed in a non-accrual status and related interest income may be reduced by stopping current accruals and writing off interest receivable when the collection of all or a portion of interest has become doubtful. Gains and losses on securities sold are determined on the basis of identified cost and may include proceeds from litigation.
Line of credit. The fund may borrow from banks for temporary or emergency purposes, including meeting redemption requests that otherwise might require the untimely sale of securities. Pursuant to the fund's custodian agreement, the custodian may loan money to the fund to make properly authorized payments. The fund is obligated to repay the custodian for any overdraft, including any related costs or expenses. The custodian may have a lien, security interest or security entitlement in any fund property that is not otherwise segregated or pledged, to the maximum extent permitted by law, to the extent of any overdraft.
In addition, the fund and other affiliated funds have entered into an agreement with Citibank N.A. that enables them to participate in a $300 million unsecured committed line of credit. A commitment fee, payable at the end of each calendar quarter, based on the average daily unused portion of the line of credit, is charged to each participating fund on a pro rata basis and is reflected in other expenses on the Statement of operations. Commitment fees for the six months ended November 30, 2014 were $253. For the six months ended November 30, 2014, the fund had no borrowings under the line of credit.
Expenses. Within the John Hancock group of funds complex, expenses that are directly attributable to an individual fund are allocated to such fund. Expenses that are not readily attributable to a specific fund are allocated among all funds in an equitable manner, taking into consideration, among other things, the nature and type of expense and the fund's relative net assets. Expense estimates are accrued in the period to which they relate and adjustments are made when actual amounts are known.
Class allocations. Income, common expenses and realized and unrealized gains (losses) are determined at the fund level and allocated daily to each class of shares based on the net assets of the class. Class-specific expenses, such as distribution and service fees, if any, and transfer agent fees, are calculated daily for each class, based on the net asset value of the class and the applicable specific expense rates.
Federal income taxes. The fund intends to continue to qualify as a regulated investment company by complying with the applicable provisions of the Internal Revenue Code and will not be subject to federal income tax on taxable income that is distributed to shareholders. Therefore, no federal income tax provision is required.
24
Under the Regulated Investment Company Modernization Act of 2010, the fund is permitted to carry forward capital losses for an unlimited period. Capital losses that are carried forward will retain their character as either short-term or long-term capital losses rather than being considered all short-term as under previous law.
For federal income tax purposes, as of May 31, 2014, the fund has a short-term capital loss carryfoward of $2,450,485 and a long-term capital loss carryforward of $1,391,915 available to offset future net realized capital gains. These carryforwards as of May 31, 2014, do not expire.
As of May 31, 2014, the fund had no uncertain tax positions that would require financial statement recognition, derecognition or disclosure. The fund's federal tax returns are subject to examination by the Internal Revenue Service for a period of three years.
Distribution of income and gains. Distributions to shareholders from net investment income and net realized gains, if any, are recorded on the ex-date. The fund generally declares dividends daily and pays them monthly. Capital gain distributions, if any, are distributed annually.
Distributions paid by the fund with respect to each class of shares are calculated in the same manner, at the same time and in the same amount, except for the effect of class level expenses that may be applied differently to each class.
Such distributions, on a tax basis, are determined in conformity with income tax regulations, which may differ from US GAAP.
Capital accounts within the financial statements are adjusted for permanent book-tax differences. These adjustments have no impact on net assets or the results of operations. Temporary book-tax differences, if any, will reverse in a subsequent period. Book-tax differences are primarily attributable to distributions payable and accretion on debt securities.
Note 3 — Guarantees and indemnifications
Under the Trust's organizational documents, its Officers and Trustees are indemnified against certain liabilities arising out of the performance of their duties to the Trust, including the fund. Additionally, in the normal course of business, the fund enters into contracts with service providers that contain general indemnification clauses. The fund's maximum exposure under these arrangements is unknown, as this would involve future claims that may be made against the fund that have not yet occurred. The risk of material loss from such claims is considered remote.
Note 4 — Fees and transactions with affiliates
John Hancock Advisers, LLC (the Advisor) serves as investment advisor for the fund. John Hancock Funds, LLC (the Distributor), an affiliate of the Advisor, serves as principal underwriter of the fund. The Advisor and the Distributor are indirect, wholly owned subsidiaries of Manulife Financial Corporation (MFC).
Management fee. The fund has an investment management agreement with the Advisor under which the fund pays a daily management fee to the Advisor equivalent, on an annual basis, to the sum of: (a) 0.500% of the first $250 million of the fund's average daily net assets; (b) 0.450% of the next $250 million of the fund's average daily net assets; (c) 0.425% of the next $500 million of the fund's average daily net assets; (d) 0.400% of the next $250 million of the fund's average daily net assets; and (e) 0.300% of the fund's average daily net assets in excess of $1.25 billion. The Advisor has a subadvisory agreement with John Hancock Asset Management a division of Manulife Asset Management (US) LLC, an indirectly owned subsidiary of MFC and an affiliate of the Advisor. The fund is not responsible for payment of the subadvisory fees.
The Advisor has contractually agreed to waive a portion of its management fee and/or reimburse expenses for certain funds of the John Hancock complex, including the fund (the participating portfolios). The waiver equals, on an annualized basis, 0.01% of that portion of the aggregate net assets of all the participating portfolios that exceeds $75 billion but is less than or equal to $125 billion; 0.0125% of that portion of the aggregate net assets of all the participating portfolios that exceeds $125 billion but is less than or equal to $150 billion; and 0.015% of that portion of the aggregate net assets of all the participating portfolios that exceeds $150 billion. The amount of the reimbursement is calculated daily and allocated among all the participating portfolios in proportion to the daily net assets of each fund. This arrangement may be amended or terminated at any time by the Advisor upon notice to the fund and with the approval of the Board of Trustees.
25
The expense reductions described above amounted to $2,533, $75, and $478, for Class A, Class B, and Class C shares, respectively, for the six months ended November 30, 2014.
The investment management fees, including waivers described above, incurred for the six months ended November 30, 2014 were equivalent to a net annual effective rate of 0.49% of the fund's average daily net assets.
Accounting and legal services. Pursuant to a service agreement, the fund reimburses the Advisor for all expenses associated with providing the administrative, financial, legal, accounting and recordkeeping services to the fund, including the preparation of all tax returns, periodic reports to shareholders and regulatory reports, among other services. These expenses are allocated to each share class based on its relative net assets at the time the expense was incurred. These accounting and legal services fees incurred for the six months ended November 30, 2014 amounted to an annual rate of 0.02% of the fund's average daily net assets.
Distribution and service plans. The fund has a distribution agreement with the Distributor. The fund has adopted distribution and service plans with respect to Class A, Class B, and Class C shares pursuant to Rule 12b-1 under the 1940 Act, to pay the Distributor for services provided as the distributor of shares of the fund. The fund may pay up to the following contractual rates of distribution and service fees under these arrangements, expressed as an annual percentage of average daily net assets for each class of the fund's shares.
| Class | Rule 12b-1 fee |
| Class A | 0.30% |
| Class B | 1.00% |
| Class C | 1.00% |
The fund's Distributor has contractually agreed to waive 0.15%, 0.10%, and 0.10% of Rule 12b-1 fees for Class A, Class B, and Class C shares, respectively, until at least September 30, 2015, unless renewed by mutual agreement of the fund and the Distributor based upon a determination that this is appropriate under the circumstances at the time. Reimbursements related to this contractual waiver amounted to $52,319, $1,040, and $6,578 for Class A, Class B, and Class C shares, respectively, for the period ended November 30, 2014.
Sales charges. Class A shares are assessed up-front sales charges, which resulted in payments to the Distributor amounting to $17,582 for the six months ended November 30, 2014. Of this amount, $2,474 was retained and used for printing prospectuses, advertising, sales literature and other purposes, $14,489 was paid as sales commissions to broker-dealers and $619 was paid as sales commissions to sales personnel of Signator Investors, Inc., a broker-dealer affiliate of the Advisor. The up-front sales charges for Class A shares is 4.00%.
Class A, Class B, and Class C shares may be subject to contingent deferred sales charges (CDSCs). Certain Class A shares that are acquired through purchases of $1 million or more and are redeemed within one year of purchase are subject to a 1.00% sales charge. Class B shares that are redeemed within six years of purchase are subject to CDSCs, at declining rates, beginning at 5.00%. Class C shares that are redeemed within one year of purchase are subject to a 1.00% CDSC. CDSCs are applied to the lesser of the current market value at the time of redemption or the original purchase cost of the shares being redeemed. Proceeds from CDSCs are used to compensate the Distributor for providing distribution-related services in connection with the sale of these shares. During the six months ended November 30, 2014, CDSCs received by the Distributor amounted to $10,000, $2,513, and $816 for Class A, Class B, and Class C shares, respectively.
Transfer agent fees. The fund has a transfer agent agreement with John Hancock Signature Services, Inc. (Signature Services), an affiliate of the Advisor. The transfer agent fees paid to Signature Services are determined based on the cost to Signature Services (Signature Services Cost) of providing recordkeeping services. The Signature Services Cost includes a component of allocated John Hancock corporate overhead for providing transfer agent services to the fund and to all other John Hancock affiliated funds. It also includes out-of-pocket expenses, including payments made to third-parties for recordkeeping services provided to their clients who invest in one or more John Hancock funds. In addition, Signature Services Cost may be reduced by certain fees that Signature Services receives in connection with retirement and small
26
accounts. Signature Services Cost is calculated monthly and allocated, as applicable, to five categories of share classes: Retail Share and Institutional Share Classes of Non-Municipal Bond Funds, Class R6 Shares, Retirement Share Classes, and Municipal Bond Share Classes. Within each of these categories, the applicable costs are allocated to the affected John Hancock affiliated funds and/or classes, based on the relative average daily net assets.
Class level expenses. Class level expenses for the six months ended November 30, 2014 were:
| Class | Distribution and service fees | Transfer agent fees |
| Class A | $104,638 | $19,975 |
| Class B | 10,398 | 594 |
| Class C | 65,782 | 3,751 |
| Total | $180,818 | $24,320 |
Trustee expenses. The fund compensates each Trustee who is not an employee of the Advisor or its affiliates. The costs of paying Trustee compensation and expenses are allocated to each fund based on its net assets relative to other funds within the John Hancock group of funds complex.
Note 5 — Fund share transactions
Transactions in fund shares for the six months ended November 30, 2014 and for the year ended May 31, 2014 were as follows:
| Six months ended 11-30-14 | Year ended 5-31-14 | |||||||||||||||||||||||||
| Shares | Amount | Shares | Amount | |||||||||||||||||||||||
| Class A shares | ||||||||||||||||||||||||||
| Sold | 78,829 | $982,523 | 707,713 | $8,542,342 | ||||||||||||||||||||||
| Distributions reinvested | 84,435 | 1,055,425 | 222,241 | 2,678,125 | ||||||||||||||||||||||
| Repurchased | (1,177,671 | ) | (14,730,055 | ) | (2,948,225 | ) | (35,497,559 | ) | ||||||||||||||||||
| Net decrease | (1,014,407 | ) | ($12,692,107 | ) | (2,018,271 | ) | ($24,277,092 | ) | ||||||||||||||||||
| Class B shares | ||||||||||||||||||||||||||
| Sold | 14 | $178 | 2,098 | $25,737 | ||||||||||||||||||||||
| Distributions reinvested | 1,853 | 23,158 | 5,143 | 61,944 | ||||||||||||||||||||||
| Repurchased | (24,336 | ) | (304,158 | ) | (80,126 | ) | (966,571 | ) | ||||||||||||||||||
| Net decrease | (22,469 | ) | ($280,822 | ) | (72,885 | ) | ($878,890 | ) | ||||||||||||||||||
| Class C shares | ||||||||||||||||||||||||||
| Sold | 4,025 | $50,201 | 55,389 | $674,851 | ||||||||||||||||||||||
| Distributions reinvested | 12,063 | 150,805 | 33,391 | 402,349 | ||||||||||||||||||||||
| Repurchased | (147,147 | ) | (1,840,253 | ) | (506,536 | ) | (6,105,306 | ) | ||||||||||||||||||
| Net decrease | (131,059 | ) | ($1,639,247 | ) | (417,756 | ) | ($5,028,106 | ) | ||||||||||||||||||
| Total net decrease | (1,167,935 | ) | ($14,612,176 | ) | (2,508,912 | ) | ($30,184,088 | ) | ||||||||||||||||||
Note 6 — Purchase and sale of securities
Purchases and sales of securities, other than short-term investments, amounted to $0 and $15,769,670, respectively, for the six months ended November 30, 2014.
27
CONTINUATION OF INVESTMENT ADVISORY AND SUBADVISORY AGREEMENTS
Evaluation of Advisory and Subadvisory Agreements by the Board of Trustees
This section describes the evaluation by the Board of Trustees (the Board) of John Hancock Tax-Exempt Series Fund (the Trust) of the Advisory Agreement (the Advisory Agreement) with John Hancock Advisers, LLC (the Advisor) and the Subadvisory Agreement (the Subadvisory Agreement) with John Hancock Asset Management a division of Manulife Asset Management (US) LLC (the Subadvisor) for John Hancock Massachusetts Tax-Free Income Fund (the fund). The Advisory Agreement and Subadvisory Agreement are collectively referred to as the Agreements. Prior to the June 23-25, 2014 meeting at which the Agreements were approved, the Board also discussed and considered information regarding the proposed continuation of the Agreements at an in-person meeting held on May 27-29, 2014.
Approval of Advisory and Subadvisory Agreements
At in-person meetings held on June 23-25, 2014, the Board, including the Trustees who are not considered to be interested persons of the Trust under the Investment Company Act of 1940, as amended (the 1940 Act) (the Independent Trustees), reapproved the continuation of the Advisory Agreement between the Trust and the Advisor and the Subadvisory Agreement between the Advisor and the Subadvisor with respect to the fund for a term ending as of the anticipated closing of the fund's proposed reorganization into John Hancock Tax-Free Bond Fund ("Tax-Free Bond Fund"), which is expected to take place on or about February 13, 2015.
In considering the Advisory Agreement and the Subadvisory Agreement, the Board received in advance of the meetings a variety of materials relating to the fund, the Advisor and the Subadvisor, including comparative performance, fee and expense information for a peer group of similar funds prepared by an independent third-party provider of fund data, performance information for an applicable benchmark index; and, with respect to the Subadvisor, comparative performance information for comparably managed accounts, as applicable, and other information provided by the Advisor and the Subadvisor regarding the nature, extent and quality of services provided by the Advisor and the Subadvisor under their respective Agreements, as well as information regarding the Advisor's revenues and costs of providing services to the fund and any compensation paid to affiliates of the Advisor. At the meetings at which the renewal of the Advisory Agreement and Subadvisory Agreement are considered, particular focus is given to information concerning fund performance, comparability of fees and total expenses, and profitability. However, the Board notes that the evaluation process with respect to the Advisor and the Subadvisor is an ongoing one. In this regard, the Board also took into account discussions with management and information provided to the Board at prior meetings with respect to the services provided by the Advisor and the Subadvisor to the fund, including quarterly performance reports prepared by management containing reviews of investment results and prior presentations from the Subadvisor with respect to the fund. The Board noted the affiliation of the Subadvisor with the Advisor, noting any potential conflicts of interest. The Board also considered the nature, quality, and extent of non-advisory services, if any, to be provided to the fund by the Advisor's affiliates, including distribution services.
Throughout the process, the Board asked questions of and requested additional information from management. The Board is assisted by counsel for the Trust and the Independent Trustees are also separately assisted by independent legal counsel throughout the process. The Independent Trustees also received a memorandum from their independent legal counsel discussing the legal standards for their consideration of the proposed continuation of the Agreements and discussed the proposed continuation of the Agreements in private sessions with their independent legal counsel at which no representatives of management were present.
Approval of Advisory Agreement
In approving the Advisory Agreement with respect to the fund, the Board, including the Independent Trustees, considered a variety of factors, including those discussed below. The Board also considered other factors (including conditions and trends prevailing generally in the economy, the securities markets, and the industry) and does not treat any single factor as determinative, and each Trustee may attribute different weights to different factors. The Board's conclusions may be based in
28
part on its consideration of the advisory and subadvisory arrangements in prior years and on the Board's ongoing regular review of fund performance and operations throughout the year.
Nature, extent, and quality of services. Among the information received by the Board from the Advisor relating to the nature, extent, and quality of services provided to the fund, the Board reviewed information provided by the Advisor relating to its operations and personnel, descriptions of its organizational and management structure, and information regarding the Advisor's compliance and regulatory history, including its Form ADV. The Board also noted that on a regular basis it receives and reviews information from the Trust's Chief Compliance Officer (CCO) regarding the fund's compliance policies and procedures established pursuant to Rule 38a-1 under the 1940 Act. The Board also considered the Advisor's risk management processes. The Board considered that the Advisor is responsible for the management of the day-to-day operations of the fund, including, but not limited to, general supervision of and coordination of the services provided by the Subadvisor, and is also responsible for monitoring and reviewing the activities of the Subadvisor and third-party service providers.
In considering the nature, extent, and quality of the services provided by the Advisor, the Trustees also took into account their knowledge of the Advisor's management and the quality of the performance of the Advisor's duties, through Board meetings, discussions and reports during the preceding year and through each Trustee's experience as a Trustee of the Trust and of the other trusts in the complex.
In the course of their deliberations regarding the Advisory Agreement, the Board considered, among other things:
| (a) | the skills and competency with which the Advisor has in the past managed the Trust's affairs and its subadvisory relationship, the Advisor's oversight and monitoring of the Subadvisor's investment performance and compliance programs, such as the Subadvisor's compliance with fund policies and objectives, review of brokerage matters, including with respect to trade allocation and best execution and the Advisor's timeliness in responding to performance issues; | |
| (b) | the background, qualifications and skills of the Advisor's personnel; | |
| (c) | the Advisor's compliance policies and procedures and its responsiveness to regulatory changes and mutual fund industry developments; | |
| (d) | the Advisor's administrative capabilities, including its ability to supervise the other service providers for the fund; | |
| (e) | the financial condition of the Advisor and whether it has the financial wherewithal to provide a high level and quality of services to the fund; and | |
| (f) | the Advisor's reputation and experience in serving as an investment advisor to the Trust and the benefit to shareholders of investing in funds that are part of a family of funds offering a variety of investments. |
The Board concluded that the Advisor may reasonably be expected to continue to provide a high quality of services under the Advisory Agreement with respect to the fund.
Investment performance. In considering the fund's performance, the Board noted that it reviews at its regularly scheduled meetings information about the fund's performance results. In connection with the consideration of the Advisory Agreement, the Board:
| (a) | reviewed information prepared by management regarding the fund's performance; | |
| (b) | considered the comparative performance of an applicable benchmark index; | |
| (c) | considered the performance of comparable funds, if any, as included in the report prepared by an independent third-party provider of fund data; and | |
| (d) | took into account the Advisor's analysis of the fund's performance and its plans and recommendations regarding the Trust's subadvisory arrangements generally. |
29
The Board noted that the fund underperformed its benchmark index and peer group average for the one-, three- and five-year periods ended December 31, 2013. The Board took into account management's discussion of the fund's performance, including the differences between the investment strategies of the fund and those of its benchmark index and peer group, as well as the proposed reorganization of the fund.
Fees and expenses. The Board reviewed comparative information prepared by an independent third-party provider of mutual fund data, including, among other data, the fund's contractual and net management fees (and subadvisory fees, to the extent available) and total expenses as compared to similarly situated investment companies deemed to be comparable to the fund. The Board considered the fund's ranking within a smaller group of peer funds chosen by the independent third-party provider, as well as the fund's ranking within a broader group of funds. In comparing the fund's contractual and net management fees to those of comparable funds, the Board noted that such fees include both advisory and administrative costs. The Board noted that net management fees and total expenses for the fund are higher than the peer group median. The Board took into account management's discussion of the fund's expenses.
The Board also took into account management's discussion with respect to the advisory/subadvisory fee structure, including the amount of the advisory fee retained by the Advisor after payment of the subadvisory fee. The Board also noted that the Advisor pays the subadvisory fee. In addition, the Board took into account that management had agreed, effective July 1, 2014, to implement an overall fee waiver across the complex, including the fund, which is discussed further below. The Board also noted actions taken over the past several years to reduce the fund's operating expenses. The Board also noted that, in addition, the Advisor is currently waiving fees and/or reimbursing expenses with respect to the fund and that the fund has breakpoints in its contractual management fee schedule that reduce management fees as assets increase. The Board also noted that the fund's distributor, an affiliate of the Advisor, has agreed to waive a portion of its Rule 12b-1 fee for the fund's share classes through September 30, 2015. The Board reviewed information provided by the Advisor concerning the investment advisory fee charged by the Advisor or one of its advisory affiliates to other clients (including other funds in the complex) having similar investment mandates, if any. The Board considered any differences between the Advisor's and Subadvisor's services to the fund and the services they provide to other comparable clients or funds. The Board concluded that the advisory fee paid with respect to the fund is reasonable.
Profitability/indirect benefits. In considering the costs of the services to be provided and the profits to be realized by the Advisor and its affiliates (including the Subadvisor) from the Advisor's relationship with the Trust, the Board:
| (a) | reviewed financial information of the Advisor; | |||||||
| (b) | reviewed and considered information presented by the Advisor regarding the net profitability to the Advisor and its affiliates with respect to the fund; | |||||||
| (c) | received and reviewed profitability information with respect to the John Hancock fund complex as a whole; | |||||||
| (d) | received information with respect to the Advisor's allocation methodologies used in preparing the profitability data; | |||||||
| (e) | considered that the John Hancock insurance companies that are affiliates of the Advisor, as shareholders of the Trust directly or through their separate accounts, receive certain tax credits or deductions relating to foreign taxes paid and dividends received by certain funds of the Trust and noted that these tax benefits, which are not available to participants in qualified retirement plans under applicable income tax law, are reflected in the profitability analysis reviewed by the Board; | |||||||
| (f) | considered that the Advisor also provides administrative services to the fund on a cost basis pursuant to an administrative services agreement; | |||||||
| (g) | noted that affiliates of the Advisor provide transfer agency services and distribution services to the fund, and that the fund's distributor also receives Rule 12b-1 payments to support distribution of the fund; | |||||||
| (h) | noted that the fund's Subadvisor is an affiliate of the Advisor; |
30
| (i) | noted that the Advisor also derives reputational and other indirect benefits from providing advisory services to the fund; | |||||||
| (j) | noted that the subadvisory fee for the fund is paid by the Advisor; and | |||||||
| (k) | considered that the Advisor should be entitled to earn a reasonable level of profits in exchange for the level of services it provides to the fund and the entrepreneurial risk that it assumes as Advisor. |
Based upon its review, the Board concluded that the level of profitability, if any, of the Advisor and its affiliates (including the Subadvisor) from their relationship with the fund was reasonable and not excessive.
Economies of scale. Keeping in mind that the fund is expected to be reorganized into Tax-Free Bond Fund, in considering the extent to which economies of scale could be realized if the fund were to grow, and whether fee levels reflect these economies of scale for the benefit of fund shareholders, the Board:
| (a) | considered that the Advisor has agreed, effective July 1, 2014, to waive a portion of its management fee for the fund and each of the other John Hancock funds in the complex (except for those discussed below) (the Participating Portfolios) or otherwise reimburse the expenses of the Participating Portfolios as follows (the Reimbursement): | ||
| The Reimbursement shall equal, on an annualized basis, 0.01% of that portion of the aggregate net assets of all the Participating Portfolios that exceed $75 billion but is less than or equal to $125 billion, 0.0125% of that portion of the aggregate net assets of all the Participating Portfolios that exceed $125 billion but is less than or equal to $150 billion and 0.015% of that portion of the aggregate net assets of all the Participating Portfolios that exceeds $150 billion. (The funds that are not Participating Portfolios are the funds of funds in the complex, which benefit from such overall management fee waiver through their investment in underlying portfolios that include Participating Portfolios, which are subject to the Reimbursement.) | |||
| (b) | reviewed the fund's advisory fee structure and concluded that: (i) the fund's fee structure contains breakpoints at the subadvisory fee level and that such breakpoints are reflected as breakpoints in the advisory fees for the fund; and (ii) although economies of scale cannot be measured with precision, these arrangements could permit shareholders of the fund to benefit from economies of scale if the fund were to grow. The Board also took into account management's discussion of the fund's advisory fee structure; and | ||
| (c) | the Board also considered the effect of the fund's growth in size on its performance and fees. The Board also noted that the fund is expected to be reorganized into Tax-Free Bond Fund, and considered the likelihood that economies of scale would not be achieved by the fund. | ||
Approval of Subadvisory Agreement
In making its determination with respect to approval of the Subadvisory Agreement, the Board reviewed:
| (1) | information relating to the Subadvisor's business, including current subadvisory services to the Trust (and other funds in the John Hancock family of funds); | |
| (2) | the historical and current performance of the fund and comparative performance information relating to an applicable benchmark index and comparable funds; and | |
| (3) | the subadvisory fee for the fund, including any breakpoints, and to the extent available, comparable fee information prepared by an independent third party provider of fund data. |
Nature, extent, and quality of services. With respect to the services provided by the Subadvisor, the Board received information provided to the Board by the Subadvisor, including the Subadvisor's Form ADV, as well as took into account information presented throughout the past year. The Board considered the Subadvisor's current level of staffing and its
31
overall resources, as well as received information relating to the Subadvisor's compensation program. The Board reviewed the Subadvisor's history and investment experience, as well as information regarding the qualifications, background, and responsibilities of the Subadvisor's investment and compliance personnel who provide services to the fund. The Board also considered, among other things, the Subadvisor's compliance program and any disciplinary history. The Board also considered the Subadvisor's risk assessment and monitoring process. The Board reviewed the Subadvisor's regulatory history, including whether it was involved in any regulatory actions or investigations as well as material litigation, and any settlements and amelioratory actions undertaken, as appropriate. The Board noted that the Advisor conducts regular, periodic reviews of the Subadvisor and its operations, including regarding investment processes and organizational and staffing matters. The Board also noted that the Trust's CCO and his staff conduct regular, periodic compliance reviews with the Subadvisor and present reports to the Independent Trustees regarding the same, which includes evaluating the regulatory compliance systems of the Subadvisor and procedures reasonably designed to assure compliance with the federal securities laws. The Board also took into account the financial condition of the Subadvisor.
The Board considered the Subadvisor's investment process and philosophy. The Board took into account that the Subadvisor's responsibilities include the development and maintenance of an investment program for the fund that is consistent with the fund's investment objective, the selection of investment securities and the placement of orders for the purchase and sale of such securities, as well as the implementation of compliance controls related to performance of these services. The Board also received information with respect to the Subadvisor's brokerage policies and practices, including with respect to best execution and soft dollars.
Subadvisor compensation. In considering the cost of services to be provided by the Subadvisor and the profitability to the Subadvisor of its relationship with the fund, the Board noted that the fees under the Subadvisory Agreement are paid by the Advisor and not the fund. The Board also considered any potential conflicts of interest the Advisor might have in connection with the Subadvisory Agreement.
In addition, the Board considered other potential indirect benefits that the Subadvisor and its affiliates may receive from the Subadvisor's relationship with the fund, such as the opportunity to provide advisory services to additional funds in the John Hancock fund complex and reputational benefits.
Subadvisory fees. The Board considered that the fund pays an advisory fee to the Advisor and that, in turn, the Advisor pays a subadvisory fee to the Subadvisor. As noted above, the Board also considered the fund's subadvisory fees as compared to similarly situated investment companies deemed to be comparable to the fund as included in the report prepared by the independent third party provider of fund data, to the extent available. The Board noted that the limited size of the Lipper peer group was not sufficient for comparative purposes. The Board also took into account the subadvisory fees paid by the Advisor to the Subadvisor with respect to the fund to fees charged by the Subadvisor to manage other subadvised portfolios and portfolios not subject to regulation under the 1940 Act, as applicable.
Subadvisor performance. As noted above, the Board considered the fund's performance as compared to the fund's peer group and the benchmark index and noted that the Board reviews information about the fund's performance results at its regularly scheduled meetings. The Board noted the Advisor's expertise and resources in monitoring the performance, investment style and risk-adjusted performance of the Subadvisor. The Board was mindful of the Advisor's focus on the Subadvisor's performance. The Board also noted the Subadvisor's long-term performance record for similar accounts, as applicable.
The Board's decision to approve the Subadvisory Agreement was based on a number of determinations, including the following:
| (1) | the Subadvisor has extensive experience and demonstrated skills as a manager; | |||||||
| (2) | the fund's performance is being monitored and reasonably addressed; | |||||||
| (3) | the subadvisory fee is reasonable in relation to the level and quality of services being provided; and |
32
| (4) | subadvisory fee breakpoints are reflected as breakpoints in the advisory fees for the fund in order to permit shareholders to benefit from economies of scale if the fund grows. | |||||||
| * * * | ||||||||
Based on the Board's evaluation of all factors that the Board deemed to be material, including those factors described above, the Board, including the Independent Trustees, concluded that renewal of the Advisory Agreement and the Subadvisory Agreement would be in the best interest of the fund and its shareholders. Accordingly, the Board, and the Independent Trustees voting separately, approved the Advisory Agreement and Subadvisory Agreement for a term ending as of the anticipated closing of the fund's reorganization.
33
Trustees James M. Oates, Chairperson Officers Andrew G. Arnott John J. Danello Francis V. Knox, Jr. Charles A. Rizzo Salvatore Schiavone | Investment advisor John Hancock Advisers, LLC Subadvisor John Hancock Asset Management a division of Manulife Asset Management (US) LLC Principal distributor John Hancock Funds, LLC Custodian State Street Bank and Trust Company Transfer agent John Hancock Signature Services, Inc. Legal counsel K&L Gates LLP |
*Member of the Audit Committee
†Non-Independent Trustee
The fund's proxy voting policies and procedures, as well as the fund's proxy voting record for the most recent twelve-month period ended June 30, are available free of charge on the Securities and Exchange Commission (SEC) website at sec.gov or on our website.
The fund's complete list of portfolio holdings, for the first and third fiscal quarters, is filed with the SEC on Form N-Q. The fund's Form N-Q is available on our website and the SEC's website, sec.gov, and can be reviewed and copied (for a fee) at the SEC's Public Reference Room in Washington, DC. Call 800-SEC-0330 to receive information on the operation of the SEC's Public Reference Room.
We make this information on your fund, as well as monthly portfolio holdings, and other fund details available on our website at jhinvestments.com or by calling 800-225-5291.
| You can also contact us: | |||
| 800-225-5291 jhinvestments.com | Regular mail: John Hancock Signature Services, Inc. | Express mail: John Hancock Signature Services, Inc. | |
34
Family of funds
DOMESTIC EQUITY FUNDS Balanced Classic Value Disciplined Value Disciplined Value Mid Cap Fundamental All Cap Core Fundamental Large Cap Core Fundamental Large Cap Value Large Cap Equity Select Growth Small Cap Equity Small Cap Value Small Company Strategic Growth U.S. Equity U.S. Global Leaders Growth Value Equity GLOBAL AND INTERNATIONAL EQUITY FUNDS Disciplined Value International Emerging Markets Global Equity Global Opportunities Global Shareholder Yield Greater China Opportunities International Core International Growth International Growth Equity International Small Company International Value Equity INCOME FUNDS Bond California Tax-Free Income Core High Yield Emerging Markets Debt Floating Rate Income Focused High Yield Global Income Government Income High Yield Municipal Bond Income Investment Grade Bond | INCOME FUNDS (continued) Massachusetts Tax-Free Income Money Market New York Tax-Free Income Short Duration Credit Opportunities Strategic Income Opportunities Tax-Free Bond ALTERNATIVE AND SPECIALTY FUNDS Absolute Return Currency Alternative Asset Allocation Enduring Equity Financial Industries Global Absolute Return Strategies Global Conservative Absolute Return Natural Resources Redwood Regional Bank Seaport Technical Opportunities ASSET ALLOCATION PORTFOLIOS Income Allocation Lifestyle Aggressive Lifestyle Balanced Lifestyle Conservative Lifestyle Growth Lifestyle Moderate Retirement Choices (2010-2055) Retirement Living (2010-2055) Retirement Living II (2010-2055) CLOSED-END FUNDS Financial Opportunities Hedged Equity & Income Income Securities Trust Investors Trust Preferred Income Preferred Income II Preferred Income III Premium Dividend Tax-Advantaged Dividend Income Tax-Advantaged Global Shareholder Yield |
The fund's investment objective, risks, charges, and expenses are included in the prospectuses and should be considered carefully before investing. For a prospectus, call your financial professional, call John Hancock Investments at 800-225-5291, or visit the fund's website at jhinvestments.com. Please read the prospectus carefully before investing or sending money.
John Hancock Investments
A trusted brand
John Hancock has helped individuals and institutions build and protect wealth since 1862. Today, we are one of America's strongest and most-recognized brands.
A better way to invest
As a manager of managers, we search the world to find proven portfolio teams with specialized expertise for every fund we offer, then apply vigorous investment oversight to ensure they continue to meet our uncompromising standards.
Results for investors
Our unique approach to asset management has led to a diverse set of investments deeply rooted in investor needs, along with strong risk-adjusted returns across asset classes.
| | John Hancock Funds, LLC n Member FINRA, SIPC 601 Congress Street n Boston, MA 02210-2805 800-225-5291 n jhinvestments.com | |
| This report is for the information of the shareholders of John Hancock Massachusetts Tax-Free Income Fund. It is not authorized for distribution to prospective investors unless preceded or accompanied by a prospectus. | ||
| MF209440 | 77SA 11/14 1/15 | |
ITEM 2. CODE OF ETHICS.
Not applicable at this time.
ITEM 3. AUDIT COMMITTEE FINANCIAL EXPERT.
Not applicable at this time.
ITEM 4. PRINCIPAL ACCOUNTANT FEES AND SERVICES.
Not applicable at this time.
ITEM 5. AUDIT COMMITTEE OF LISTED REGISTRANTS.
Not applicable at this time.
ITEM 6. SCHEDULE OF INVESTMENTS.
| (a) | Not applicable. |
| (b) | Not applicable. |
ITEM 7. DISCLOSURE OF PROXY VOTING POLICIES AND PROCEDURES FOR CLOSED-END MANAGEMENT INVESTMENT COMPANIES.
Not applicable.
ITEM 8. PORTFOLIO MANAGERS OF CLOSED-END MANAGEMENT INVESTMENT COMPANIES.
Not applicable.
ITEM 9. PURCHASES OF EQUITY SECURITIES BY CLOSED-END MANAGEMENT INVESTMENT COMPANY AND AFFILIATED PURCHASERS.
Not applicable.
ITEM 10. SUBMISSION OF MATTERS TO A VOTE OF SECURITY HOLDERS.
Not applicable.
ITEM 11. CONTROLS AND PROCEDURES.
(a) Based upon their evaluation of the registrant's disclosure controls and procedures as conducted within 90 days of the filing date of this Form N-CSR, the registrant's principal executive officer and principal financial officer have concluded that those disclosure controls and procedures provide reasonable assurance that the material information required to be disclosed by the registrant on this report is recorded, processed, summarized and reported within the time periods specified in the Securities and Exchange Commission's rules and forms.
(b) There were no changes in the registrant's internal control over financial reporting that occurred during the registrant's most recent fiscal half-year (the registrant's second fiscal half-year in the case of an annual report) that have materially affected, or are reasonably likely to materially affect, the registrant's internal control over financial reporting.
ITEM 12. EXHIBITS.
(a) Separate certifications for the registrant's principal executive officer and principal financial officer, as required by Section 302 of the Sarbanes-Oxley Act of 2002 and Rule 30a-2(a) under the Investment Company Act of 1940, are attached.
(b) Separate certifications for the registrant's principal executive officer and principal financial officer, as required by 18 U.S.C. Section 1350, as adopted pursuant to Section 906 of the Sarbanes-Oxley Act of 2002, and Rule 30a-2(b) under the Investment Company Act of 1940, are attached. The certifications furnished pursuant to this paragraph are not deemed to be "filed" for purposes of Section 18 of the Securities Exchange Act of 1934, or otherwise subject to the liability of that section. Such certifications are not deemed to be incorporated by reference into any filing under the Securities Act of 1933 or the Securities Exchange Act of 1934, except to the extent that the Registrant specifically incorporates them by reference.
(c)(1) Contact person at the registrant.
SIGNATURES
Pursuant to the requirements of the Securities Exchange Act of 1934 and the Investment Company Act of 1940, the registrant has duly caused this report to be signed on its behalf by the undersigned, thereunto duly authorized.
John Hancock Tax-Exempt Series Fund
| By: | /s/ Andrew Arnott |
| Andrew Arnott | |
| President |
Date: January 15, 2015
Pursuant to the requirements of the Securities Exchange Act of 1934 and the Investment Company Act of 1940, this report has been signed below by the following persons on behalf of the registrant and in the capacities and on the dates indicated.
| By: | /s/ Andrew Arnott |
| Andrew Arnott | |
| President |
Date: January 15, 2015
| By: | /s/ Charles A. Rizzo |
| Charles A. Rizzo | |
| Chief Financial Officer |
Date: January 15, 2015