The semi-annual period was a tale of four strong months in the equity markets and two weak months, with momentum dissipating along the way. Equity markets generally moved higher through April on the back of improved economic data and accommodative monetary policy from the Federal Reserve Board (the Fed). As the Fed’s second round of quantitative easing approached its scheduled expiration at the end of June, investors expressed their concern by selling heavily through May and most of June. Investors subsequently seemed to view the sell-off as a buying opportunity, as the broader equity markets staged a rally in the very last week of June.
With the Fed seemingly stuck between a rock and a hard place as the federal deficit piled up and economic headwinds remained persistent, there were some pockets of outperformance in the equity markets during the semi-annual period. The health care sector provided the strongest return. Also, gold was perceived as a safe haven for investors who see inflation looming as a result of the Fed’s loose monetary discipline. However, while most hard asset commodities began 2011 with positive momentum, they fell back equally as fast as equities, ending the semi-annual period up only marginally. Momentum sectors, such as information technology and energy, similarly started the period strong and then fell back to flat before finishing the semi-annual period on a positive note. Emerging equity markets showed mixed results for the first half. In our view, two overriding themes emerged during the semi-annual period. One was the accounting liabilities of Chinese equities trading on U.S. exchanges, with many stocks halting trading for extended periods. Second was the resurgence of Initial Public Offerings, especially in the information technology sector. On the fixed income side, high yield corporate bonds performed in line with equities, whereas municipal bonds performed surprisingly well.
|
VAN ECK VIP MULTI-MANAGER ALTERNATIVES FUND |
| |
We redeemed two investments within the arbitrage strategy during the semi-annual period. In January, we redeemed from The Arbitrage Fund (“Arbitrage”). Our investment committee felt that though the Arbitrage team is highly skilled and runs a quality, low risk strategy, it is nearly impossible for them to generate double-digit annualized returns through merger arbitrage due to mutual fund leverage restrictions. Also, in March, we redeemed the Fund’s allocation to Centaur Performance Group, LLC (“Centaur”), as Centaur had decided to make a broad change to its strategy and to its team. While the Fund had garnered solid, slow and steady performance from Centaur, our investment committee was not comfortable with the changes being made.
We added two hedge-style mutual fund investments in March with the proceeds made available from the redemption from Centaur. The first was Marketfield Fund (“Marketfield”), a discretionary macro, long/short equity strategy run by Michael Aronstein. Mr. Aronstein historically has run the strategy with a long bias but will establish short positions to generate alpha should conditions warrant it, as was the case in 2008 when Marketfield profited from short positions in the financials sector. Mr. Aronstein is not averse to taking a contrarian view. The second mutual fund we added to the Fund is AQR Diversified Arbitrage Fund (“AQR Diversified Arbitrage”). This manager utilizes proprietary trading models and a research-driven strategy with a strict process and investment parameters to invest across three different types of arbitrage—merger arbitrage, convertible arbitrage and event-driven arbitrage, which includes arbitrage opportunities that may arise from corporate spin-offs, high yield corporate bonds, dual-class securities, closed-end funds and more.
As of June 30, 2011, the Fund had assets allocated to six sub-advisers and was invested in a variety of open-end mutual funds, ETFs, two UCITS6 Funds, structured notes and other securities.
Long/Short Equity Strategy
The Fund’s long/short equity investments delivered mixed performance during the semi-annual period, as equity correlation remained high making it difficult to generate alpha through fundamental bottom-up stock selection.
Sub-Adviser Primary Funds, LLC (“Primary”) (8.97% of Fund net assets†) performed well early in 2011, as it was titled toward long positions in information technology and energy stocks. Primary took some profits, but remained long biased in these sectors, as its investment orientation remained toward economic recovery. While it did significantly reduce the net and volatility exposures in response to market uncertainty surrounding global events, it remained invested in later-cycle companies operating in global industries, such as an oil and gas rig equipment supplier, a diversified semiconductor and components manufacturer and a construction and facilities management company. Primary’s short positions had exposure to consumer discretionary spending and health care, primarily in the U.S., where the sub-adviser believed continued high unemployment and commodity inflation would hamper growth in consumer spending. Valuations underlying Primary’s positioning supported the strategy, where many long positions were at attractive discounts to relative S&P 500 measures and short positions were at a premium. That said, Primary lost much of its early 2011 performance in May and June when cyclical sectors sold off and more defensive sectors were in favor. Primary employs a balanced, or low net exposure, long/short equity strategy that focuses primarily on mid-cap companies across multiple sectors. Its approach is a fundamentally-driven one, taking into account a top-down view of the economy broken down by sector.
As mentioned earlier, we established Fund positions in Sub-Advisers Millrace (9.14% of Fund net assets†) and Coe (9.08% of Fund net assets†) during the semi-annual period. Millrace began trading for the Fund at the beginning of June and Coe in the third week of June. In the weeks since funding these two sub-advisers, which were among the volatile of the period, each was profitable for the Fund. Millrace utilizes a fundamental, bottom up, long/short equity strategy, focused on small/mid cap U.S. equities. Coe is also a long/short equity strategy, focused on small/mid cap U.S. equities, but is highly catalyst driven in nature, trading around various events that may cause fluctuations in prices.
The Fund’s long/short equity mutual fund holding, Highland Long/Short Equity Fund (“Highland”) (4.7% of Fund net assets†), was a disappointment, declining marginally during the semi-annual period. Nevertheless, we maintained the Fund’s position in Highland.
Fixed Income Strategy
We significantly reduced the Fund’s exposure to the fixed income strategy during the semi-annual period, primarily by redeeming the Fund’s positions in several actively managed fixed income funds. High yield corporate debt had had a run of strong performance in 2009 and 2010, and our investment committee felt that better risk/reward opportunities lay elsewhere. The Fund’s sole fixed income investment for most of the semi-annual period was Sub-Adviser Medley Capital (which, as mentioned earlier, purchased Viathon) (10.94% of Fund net assets†). The strategy did not change as a result of the acquisition, and we felt comfortable with this investment because the strategy is consistently run with significant short exposure and low beta to the broader markets.
2
Despite the strong run in 2009 and 2010, the credit markets continued to perform strongly during the semi-annual period. Returns, new issuance and mutual fund inflation were particularly robust during the first four months of 2011, though the markets did struggle in May and June as weak economic data, record new issue volume and sovereign debt concerns eventually tempered risk appetites. During the semi-annual period, lower quality issuers outperformed, especially during the first quarter. Mutual fund inflows into the high yield asset class were strong during the first quarter, helping to fuel the market’s increased risk appetite for a record volume of new high yield issuance. Year-to-date through June 30 high yield issuance of approximately $180 billion was predominantly used to refinance shorter maturity bonds and bank debt, significantly denting the “maturity wall” that was a cause for much concern over the past year or two.
Medley Capital entered 2011 positioned for a tighter credit spread environment. As the market rallied, the sub-adviser began to take profits in several of its higher beta, long risk positions, including Ono, Fist Data and Rite-Aid. The credit markets then continued to rally into March and April, motivating Medley Capital to adopt a more cautious risk attitude. Although the sub-adviser believed such a stance was appropriate, it consequently did not fully participate in the later stages of the credit rally that materialized during March and April. Medley Capital maintained its risk-averse profile during May and June, as it believed that short risk positions in names including Best Buy, Range Resources and Borgata represented a compelling opportunity. The high yield corporate market generated negative returns during May and June, vindicating the sub-adviser’s cautious approach. During the second quarter, Medley Capital’s short positions focused on themes such as margin compression, competitive threats, impaired discretionary spending and relative value. Its long risk positions were focused on issuers expected to generate positive absolute returns with lower realized volatility, primarily due to an inherent undervaluation. At the end of the semi-annual period, Medley Capital’s risk profile was fairly neutral, while the sub-adviser’s overall view on the credit markets remained cautious. The sub-adviser intended to continue to search going forward for undervalued long risk positions and overvalued shorts, focusing on forward-looking credit metrics, including cash flow generation, cash burn, leverage, coverage, margins, asset values and enterprise valuation.
Global Macro Strategy
Of the Fund’s four global macro investments held during the semi-annual period, two performed well and two faced some difficulties. The Fund’s largest investment in this strategy was in the AC Risk Parity 12 Vol (11.3% of Fund net assets†) and 7 Vol Funds (sold during the period) (“Risk Parity Funds”) through an open-end UCITS III structure. The Risk Parity Funds delivered solid uncorrelated performance during the semi-annual period. Marketfield (5.2% of Fund net assets†), which, as mentioned earlier, was a new position for the Fund, also performed strongly during the semi-annual period, as Mr. Aronstein took a contrarian approach to most hedge style funds, investing long in the U.S. and short in the emerging markets.
Sub-Adviser Dix Hills Partners (“Dix Hills”) (1.09% of Fund net assets†), on the other hand, produced disappointing returns, as the semi-annual period proved to be a challenging one for Dix Hills’ active duration Alternative Treasury strategies. Dix Hills’ underperformance was generated primarily during the first week of February when stronger than expected economic data and lingering concerns about the sustainability of sovereign debt in peripheral eurozone countries helped push global rates upward against Dix Hills’ long U.S. Treasury position. Ongoing turmoil in the Middle East and North Africa and a nuclear power crisis in Japan resulting from devastating natural disasters negatively impacted performance as well. These largely unexpected events led to substantial declines in interest rates, when Dix Hills’ directional strategies were positioned for rising yields. On a positive note, the macro drivers of Dix Hills’ investment process were generally bearish on bonds throughout the first quarter and consistent with the overall tone of subsequently released macroeconomic data. Dix Hills’ performance during the second quarter was generally flat, as underperformance in April was mainly offset by gains in May and June. Prudently, the Fund’s investment committee had been reducing exposure to Dix Hills throughout the semi-annual period, not simply because of poor performance but because it is our belief that its models do not take into account the significant impact of federal intervention, i.e. buying U.S. Treasuries through the Fed’s quantitative easing programs. In addition, in our view, the investment parameters of Dix Hills’ strategy do not allow its investment team to shift exposures in the middle of a trade period. While this discipline benefited Dix Hills in the past, it hurt its performance over the past couple of years.
Luxcellence-Virtuoso Fund (“Virtuoso”) (3.8% of Fund net assets†), run by Old Park Capital through a UCITS III structure, also generated poor results during the semi-annual period. Virtuoso takes a multi-asset class approach to using futures. Virtuoso can invest in four asset classes—equity (via the Dow Jones EURO STOXX 50 Index traded on Eurex), bonds (via euro-bond futures contracted traded on Eurex), real estate (via the S&P High Yield Europe Property Index), and cash (via the EONIA Index). The reasoning for this is that 95% of European institutional money is in those four asset classes. The assumption underlying the Virtuoso Strategy is that whenever money is reallocated, there are structural transfers among these asset classes according to the behavior of each of them. During the semi-annual period, volatility in the markets
3
|
VAN ECK VIP MULTI-MANAGER ALTERNATIVES FUND |
| |
broadly caused stop losses to be hit before markets turned, ultimately proving Virtuoso’s models correct. As a result, Virtuoso’s portfolio manager decided to reduce exposures to allow more room for trades to go against it until he felt more comfortable with the economic landscape and market volatility. Virtuoso returned to full exposures late in June.
Arbitrage Strategy
The arbitrage strategy contributed positively to the Fund’s results during the semi-annual period, generating strong alpha. TFS Market Neutral Fund (“TFS”) (9.17% of Fund net assets†) was the Fund’s top performer within the strategy. We shifted categorization of TFS from the long/short equity strategy to the arbitrage strategy, as its beta to the S&P 500 Index has been consistently around 0.30.
EMERALD (Equity MEan Reversion ALpha InDex) (5.3% of Fund net assets†), a “rules based” volatility arbitrage strategy through notes that were structured by Deutsche Bank, seeks to capture returns from mean-reversion of the S&P 500 Index during the course of a single week. EMERALD performed well during the semi-annual period, generating particularly strong performance in June. EMERALD historically performs best in a market environment when daily volatility exceeds weekly volatility, which, indeed, was the case during the semi-annual period overall.
AQR Diversified Arbitrage (6.3% of Fund net assets†), as mentioned earlier, was a new position for the Fund, established because our investment committee believed it would help reduce the Fund’s overall beta and volatility. AQR Diversified Arbitrage disappointed somewhat during the semi-annual period but did generate modestly positive returns. Sub-Adviser Acorn (7.05% of Fund net assets†), another new position for the Fund, specializes in options volatility strategies. Acorn began trading at the beginning of June and supplied some protection early in the month. An investment with Acorn allows us, we believe, to be more aggressive in allocating to other funds that run strategies with positive beta.
Emerging Markets Strategy
The Fund’s emerging markets exposure detracted from its results, as emerging market equities lagged their U.S. and developed international equity counterparts during the semi-annual period. On the positive side, the Fund’s emerging markets exposure finished the semi-annual period with returns in line with the iShares MSCI Emerging Markets Index Fund7 and with substantially less beta to the S&P 500 Index and lower volatility than the broader emerging market indices. The Fund’s long positions actually generated alpha versus the exchange traded fund but part of the Fund’s hedge in this sleeve is broad U.S. equity exposure, which detracted from performance. The Fund’s investment committee continued to believe at the end of the semi-annual period that emerging market equities are likely to outperform developed market equities over the medium to long term.
Tactical Strategy
The Fund’s tactical, or opportunistic, strategy sleeve was the strongest performing segment of the Fund during the semi-annual period. Much of the Fund’s returns were generated from short positions, as the Fund had opportunistically been short banks in Spain, Portugal, Ireland and Germany, where sovereign debt crises and slower economic growth made headlines. We tactically added to these positions after periods of short covering when the banks’ shares bumped into resistance levels. While the tactical strategy remained a relatively small sleeve for the Fund, it not only enhanced its overall performance but also continued to be an effective tool to manage the beta and standard deviation targets of the Fund.
Outlook
Going forward, we intend to continue to seek to allocate the Fund’s capital to the best risk/reward strategies given current economic and other macro conditions. We also look to add additional sub-advisers that may help diversify from a sub-strategy perspective. Among these are anticipated to be the inclusion of an emerging markets debt strategy and a multi-cap structure event-driven strategy. Further, as indicated, while the Fund was at the lower end of its beta range at the end of the semi-annual period, we may look to opportunistically cover some of the Fund’s hedges should the market successfully turn its focus more toward fundamentals and away from recent economic headwinds.
As the Fund implements a fund-of-funds strategy, an investor in the Fund will bear the operating expenses of the “Underlying Funds” in which the Fund invests. The total expenses borne by an investor in the Fund will be higher than if the investor invested directly in the Underlying Funds, and the returns may therefore be lower. The Fund, the Sub-Advisers and the Underlying Funds may use aggressive investment strategies, including absolute return strategies, which are riskier than those used by typical mutual funds. If the Fund and Sub-Advisers are unsuccessful in applying these investment strategies, the Fund and you may lose more money than if you had invested in another fund that did not invest aggressively. The Fund is subject to risks associated with the Sub-Advisers making trading decisions independently, investing in other investment companies, using a particular style or set of styles, basing investment decisions on historical relationships and correlations,
4
trading frequently, using leverage, making short sales, being non-diversified and investing in securities with low correlation to the market. The Fund is also subject to risks associated with investments in foreign markets, emerging market securities, small cap companies, debt securities, derivatives, commodity-linked instruments, illiquid securities, asset-backed securities and CMOs.
We appreciate your investment in the Van Eck VIP Multi-Manager Alternatives Fund, and we look forward to helping you meet your investment goals in the future.
Investment Team Members:
| | | | | | |

| | 
| | 
| | 
|
| | | | | | |

| | 
| | 
| | 
|
| | | | | | |
Stephen H. Scott | | Jan F. van Eck | | Michael F. Mazier | | Scott Schaffran |
Co-Portfolio Manager | | Co-Portfolio Manager | | Analyst | | Analyst |
| | | | | | |
July 15, 2011 | | | | | | |
| |
† | All Fund assets referenced are Total Net Assets as of June 30, 2011. |
The performance quoted represents past performance. Past performance is no guarantee of future results; current performance may be lower or higher than the performance data quoted. Performance information reflects temporary waivers of expenses and/or fees and does not include insurance/annuity fees and expenses. Investment returns would have been reduced had these fees/expenses been included. Investment return and the value of the shares of the Fund will fluctuate so that an investor’s shares, when redeemed, may be worth more or less than their original cost. Fund returns assume that dividends and capital gains distributions have been reinvested in the Fund at NAV. Index returns assume that dividends of the Index constituents in the Index have been reinvested. Performance information current to the most recent month end is available by calling 1.800.826.2333.
The Fund is only available to life insurance and annuity companies to fund their variable annuity and variable life insurance products. These contracts offer life insurance and tax benefits to the beneficial owners of the Fund. Your insurance or annuity company charges, fees and expenses for these benefits are not reflected in this report or in the Fund’s performance, since they are not direct expenses of the Fund. Had these fees been included, returns would have been lower. For insurance products, performance figures do not reflect the cost for insurance and if they did, the performance shown would be significantly lower. A review of your particular life and/or annuity contract will provide you with much greater detail regarding these costs and benefits.
All indices listed are unmanaged indices and include the reinvestment of all dividends, but do not reflect the payment of transaction costs, advisory fees or expenses that are associated with an investment in the Fund. An index’s performance is not illustrative of the Fund’s performance. Indices are not securities in which investments can be made.
| |
1 | The HFRX Global Hedge Fund Index is designed to be representative of the overall composition of the hedge fund universe. It is comprised of eight strategies: convertible arbitrage, distressed securities, equity hedge, equity market neutral, event driven, macro, merger arbitrage, and relative value arbitrage. The strategies are asset weighted based on the distribution of assets in the hedge fund industry. |
|
2 | S&P® 500 Index consists of 500 widely held common stocks, covering industrials, utility, financial and transportation sectors. |
|
3 | Alpha is a measure of an investment’s performance over and above the performance of other investments of the same risk. A stock with an alpha of 1.25 is projected to rise by an annual premium of 1.25% above its comparable benchmark index. |
|
4 | Beta is a measure of sensitivity to market movements. A beta higher than 1 indicates that a security or portfolio will tend to exhibit higher volatility than the market. A beta lower than 1 indicates that a security or portfolio will tend to exhibit lower volatility than the market. |
|
5 | Standard deviation is a measure of the variability, or volatility, of a security, derived from the security’s historical returns, and used in determining the range of possible future returns. The higher the standard deviation, the greater the potential for volatility. |
|
6 | UCITS stands for “Undertakings for Collective Investment in Transferable Securities.” |
|
7 | iShares MSCI Emerging Markets Index Fund is an exchange traded fund that seeks to provide long-term capital growth by replicating, to the extent possible, the performance of the MSCI Emerging Markets Index, net of expenses. The MSCI Emerging Markets Index is a free float-adjusted market capitalization weighted index provided by MSCI that is designed to measure the equity market performance of emerging markets. |
5
|
VAN ECK VIP MULTI-MANAGER ALTERNATIVES FUND |
| |
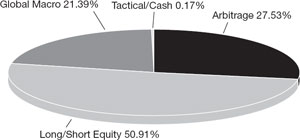
FUND ALLOCATION BY STRATEGY* |
(unaudited) |
| | | | | | | | |
| | | | | | | |
Investment Strategy | | Implementation | | 2Q 2011
Allocation | | 4Q 2010
Allocation |
| | | | | | | |
Arbitrage | | | | | | |
Blended Arbitrage | | Open-End Fund | | 6.32 | | | — | |
Credit Arbitrage | | Sub-Adviser: Centaur | | — | | | 9.90 | |
Market Neutral | | Open-End Fund | | 9.17 | | | 9.17 | |
Merger Arbitrage | | Open-End Fund | | — | | | 5.87 | |
Volatility Arbitrage | | Structured Note | | 4.99 | | | 5.19 | |
Volatility Arbitrage | | Sub-Adviser: Acorn | | 7.05 | | | — | |
| | | | | | | | | |
Long/Short | | | | | | | | |
Emerging Markets | | ETFs, Other Securities | | 8.07 | | | 8.33 | |
Long/Short Equity | | Open-End Fund | | 4.71 | | | — | |
Long/Short Equity | | Open-End Fund | | — | | | 7.55 | |
Long/Short Equity | | Sub-Adviser: Coe | | 9.08 | | | — | |
Long/Short Equity | | Sub-Adviser: Millrace | | 9.14 | | | — | |
Long/Short Equity | | Sub-Adviser: Primary | | 8.97 | | | 15.54 | |
Long/Short Fixed Income | | Sub-Adviser: Medley | | 10.94 | | | 9.97 | |
| | | | | | | | | |
Global Macro | | | | | | | | |
Discretionary Macro | | Sub-Adviser: Dix Hills | | 1.09 | | | 5.47 | |
Discretionary Macro | | Open-End Fund | | 5.21 | | | — | |
Systematic Macro | | UCITS Fund: Statistical Value | | 11.28 | | | 10.93 | |
Systematic Macro | | UCITS Fund: Virtuoso | | 3.81 | | | 9.30 | |
| | | | | | | | | |
Tactical Overlay | | ETFs, Other Securities | | — | | | 2.00 | |
| | | | | | | | | |
Cash/Equivalents | | — | | 0.17 | | | 0.78 | |
| | | | | | | | | |
| |
As of June 30, 2011. Portfolio subject to change. |
* | Percentage of net assets. |
6
|
| |
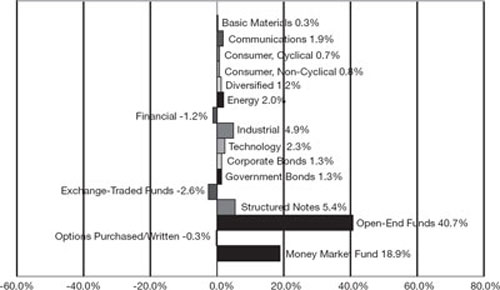
SECTOR WEIGHTING NET EXPOSURE** |
(unaudited) |
| |
As of June 30, 2011. Portfolio subject to change. |
** | Net exposure was calculated by adding long and short positions. |
7
|
VAN ECK VIP MULTI-MANAGER ALTERNATIVES FUND |
| |
EXPLANATION OF EXPENSES |
(unaudited) |
As a shareholder of the Fund, you incur two types of costs: (1) transaction costs, including program fees on purchase payments; and (2) ongoing costs, including management fees and other Fund expenses. This disclosure is intended to help you understand your ongoing costs (in dollars) of investing in the Fund and to compare these costs with the ongoing costs of investing in other mutual funds.
The disclosure is based on an investment of $1,000 invested at the beginning of the period and held for the entire period, January 1, 2011 to June 30, 2011.
Actual Expenses
The first line in the table below provides information about account values and actual expenses. You may use the information in this line, together with the amount you invested, to estimate the expenses that you paid over the period. Simply divide your account value by $1,000 (for example, an $8,600 account value divided by $1,000 = 8.6), then multiply the result by the number in the first line under the heading entitled “Expenses Paid During Period” to estimate the expenses you paid on your account during this period.
Hypothetical Example for Comparison Purposes
The second line in the table below provides information about hypothetical account values and hypothetical expenses based on the Fund’s actual expense ratio and an assumed rate of return of 5% per year before expenses, which is not the Fund’s actual return. The hypothetical account values and expenses may not be used to estimate the actual ending account balance or expenses you paid for the period. You may use this information to compare the ongoing costs of investing in the Fund and other funds. To do so, compare this 5% hypothetical example with the 5% hypothetical examples that appear in the shareholder reports of other funds.
Please note that the expenses shown in the table are meant to highlight your ongoing costs only and do not reflect any transactional costs, such as program fees. Therefore, the second line of the table is useful in comparing ongoing costs only, and will not help you determine the relative costs of owning different funds. In addition, if these transactional costs were included, your costs would have been higher.
| | | | | | | | | | | | | | | | | | |
| | | | Beginning
Account Value
January 1, 2011 | | Ending
Account Value
June 30, 2011 | | Expenses Paid
During the Period*
January 1, 2011-
June 30, 2011 | |
| | | | | | | | | | |
Initial Class | | Actual | | | $ | 1,000.00 | | | | $ | 1,007.30 | | | | $ | 11.72 | | |
| | Hypothetical** | | | $ | 1,000.00 | | | | $ | 1,013.12 | | | | $ | 11.75 | | |
| | | | | | | | | | | | | | | | | | | |
| |
* | Expenses are equal to the Fund’s annualized expense ratio (for the six months ended June 30, 2011), of 2.15% multiplied by the average account value over the period, multiplied by 181 and divided by 365 (to reflect the one-half year period). |
|
** | Assumes annual return of 5% before expenses |
8
|
| |
SCHEDULE OF INVESTMENTS |
June 30, 2011 (unaudited) |
| | | | | | |
Number of
Shares | | | | Value | |
| | | | | | |
COMMON STOCKS: 26.4% | | | | |
Basic Materials: 1.1% | | | | |
181 | | CF Industries Holdings, Inc. | | $ | 25,643 | |
308 | | Huntsman Corp. | | | 5,806 | |
331 | | KapStone Paper and Packaging Corp. | | | 5,485 | |
554 | | Kronos Worldwide, Inc. | | | 17,424 | |
201 | | Potash Corp of Saskatchewan, Inc. | | | 11,455 | |
1,235 | | Steel Dynamics, Inc. | | | 20,069 | |
109 | | The Mosaic Co. | | | 7,383 | |
| | | | | | |
| | | | | 93,265 | |
| | | | | | |
Communications: 2.7% | | | | |
4,960 | | Alcatel-Lucent (ADR) | | | 28,619 | |
599 | | Allot Communications Ltd. | | | 10,956 | |
559 | | Arris Group, Inc. | | | 6,490 | |
553 | | Calix, Inc. | | | 11,513 | |
596 | | Ceragon Networks Ltd. | | | 7,086 | |
331 | | Constant Contact, Inc. | | | 8,401 | |
297 | | DealerTrack Holdings, Inc. | | | 6,816 | |
335 | | Equinix, Inc. | | | 33,842 | |
337 | | GeoEye, Inc. | | | 12,604 | |
1,028 | | KIT Digital, Inc. | | | 12,274 | |
551 | | Liquidity Services, Inc. | | | 13,009 | |
248 | | Motricity, Inc. | | | 1,917 | |
530 | | Neutral Tandem, Inc. | | | 9,233 | |
395 | | NIC, Inc. | | | 5,317 | |
1,365 | | RF Micro Devices, Inc. | | | 8,354 | |
960 | | SPS Commerce, Inc. | | | 17,078 | |
638 | | ValueClick, Inc. | | | 10,591 | |
979 | | VASCO Data Security International, Inc. | | | 12,189 | |
| | | | | | |
| | | | | 216,289 | |
| | | | | | |
Consumer, Cyclical: 3.5% | | | | |
370 | | Ascena Retail Group, Inc. | | | 12,598 | |
559 | | Beacon Roofing Supply, Inc. | | | 12,756 | |
311 | | Buffalo Wild Wings, Inc. | | | 20,622 | |
243 | | California Pizza Kitchen, Inc. | | | 4,488 | |
348 | | CVS Caremark Corp. | | | 13,078 | |
326 | | DSW, Inc. | | | 16,499 | |
305 | | Ezcorp, Inc. | | | 10,850 | |
1,000 | | First Cash Financial Services, Inc. * | | | 41,990 | |
181 | | Foot Locker, Inc. | | | 4,301 | |
202 | | Hibbett Sports, Inc. | | | 8,223 | |
643 | | Interface, Inc. | | | 12,455 | |
174 | | Lear Corp. | | | 9,306 | |
313 | | Life Time Fitness, Inc. | | | 12,492 | |
295 | | Mobile Mini, Inc. | | | 6,251 | |
435 | | National CineMedia, Inc. | | | 7,356 | |
1,137 | | Pier 1 Imports, Inc. | | | 13,155 | |
182 | | Regal Entertainment Group. | | | 2,248 | |
538 | | Select Comfort Corp. | | | 9,673 | |
466 | | Starbucks Corp. | | | 18,402 | |
251 | | Tempur-Pedic International, Inc. | | | 17,023 | |
279 | | The Finish Line, Inc. | | | 5,971 | |
138 | | The Wendy’s Co. | | | 700 | |
277 | | Titan International, Inc. | | | 6,720 | |
186 | | Titan Machinery, Inc. | | | 5,353 | |
743 | | Wabash National Corp. | | | 6,962 | |
| | | | | | |
| | | | | 279,472 | |
| | | | | | |
| | | | | | |
Number of
Shares | | | | Value | |
| | | | | | | |
Consumer, Non-cyclical: 2.3% | | | | |
1,481 | | ACCO Brands Corp. | | $ | 11,626 | |
259 | | Arthrocare Corp. | | | 8,669 | |
476 | | Dollar Financial Corp. | | | 10,305 | |
2,604 | | EnteroMedics, Inc. | | | 7,057 | |
175 | | Express Scripts, Inc. | | | 9,447 | |
353 | | Heartland Payment Systems, Inc. | | | 7,272 | |
790 | | IRIS International, Inc. | | | 7,892 | |
1,566 | | Merge Healthcare, Inc. | | | 8,143 | |
500 | | Merit Medical Systems, Inc. | | | 8,985 | |
646 | | Mylan, Inc. | | | 15,937 | |
411 | | NuVasive, Inc. | | | 13,514 | |
1,524 | | On Assignment, Inc. | | | 14,981 | |
9 | | Paychex, Inc. | | | 276 | |
109 | | Perrigo Co. | | | 9,578 | |
956 | | Quanta Services, Inc. | | | 19,311 | |
349 | | Team, Inc. | | | 8,421 | |
282 | | The Andersons, Inc. | | | 11,914 | |
1,121 | | Uroplasty, Inc. | | | 8,408 | |
| | | | | | |
| | | | | 181,736 | |
| | | | | | |
Diversified: 1.2% | | | | |
1,990 | | Imperial Holdings Ltd. # | | | 35,714 | |
17,580 | | Noble Group Ltd. (SGD) # | | | 28,310 | |
2,000 | | Swire Pacific Ltd. (HKD) # | | | 29,497 | |
| | | | | | |
| | | | | 93,581 | |
| | | | | | |
Energy: 2.0% | | | | |
296 | | Clayton Williams Energy, Inc. | | | 17,775 | |
249 | | Gulf Island Fabrication, Inc. | | | 8,038 | |
500 | | Lukoil (ADR) | | | 31,851 | |
222 | | Mitcham Industries, Inc. | | | 3,841 | |
429 | | National Oilwell Varco, Inc. | | | 33,552 | |
376 | | Schlumberger Ltd. | | | 32,486 | |
813 | | Superior Energy Services, Inc. | | | 30,195 | |
| | | | | | |
| | | | | 157,738 | |
| | | | | | |
Financial: 1.7% | | | | |
55,250 | | Bank of China Ltd. (HKD) # | | | 27,114 | |
3,300 | | BR Malls Participacoes S.A. | | | 37,744 | |
478 | | Home Bancshares, Inc. | | | 11,300 | |
29,888 | | Raven Russia Ltd. (GBP) | | | 27,582 | |
24,117 | | Tisco Financial Group PCL (THB) # | | | 29,564 | |
| | | | | | |
| | | | | 133,304 | |
| | | | | | |
Industrial: 7.4% | | | | |
54 | | AAR Corp. | | | 1,463 | |
829 | | Arkansas Best Corp. | | | 19,672 | |
362 | | Armstrong World Industries, Inc. | | | 16,493 | |
415 | | Astec Industries, Inc. | | | 15,347 | |
229 | | Atlas Air Worldwide Holdings, Inc. | | | 13,628 | |
228 | | BE Aerospace, Inc. | | | 9,305 | |
557 | | Celadon Group, Inc. | | | 7,776 | |
57 | | Coherent, Inc. | | | 3,150 | |
220 | | Crane Co. | | | 10,870 | |
650 | | Danaher Corp. | | | 34,443 | |
417 | | Darling International, Inc. | | | 7,381 | |
427 | | DXP Enterprises, Inc. | | | 10,824 | |
1,641 | | Dycom Industries, Inc. | | | 26,814 | |
1,189 | | EMCOR Group, Inc. | | | 34,850 | |
56 | | FedEx Corp. | | | 5,312 | |
1,027 | | FEI Co. | | | 39,221 | |
1,700 | | Globaltrans Investment Plc (GDR) | | | 31,566 | |
See Notes to Financial Statements
9
|
VAN ECK VIP MULTI-MANAGER ALTERNATIVES FUND |
| |
SCHEDULE OF INVESTMENTS |
(continued) |
| | | | | | |
Number of
Shares | | | | Value | |
| | | | | | |
Industrial: (continued) | | | | |
152 | | Goodrich Corp. | | $ | 14,516 | |
74 | | GrafTech International Ltd. | | | 1,500 | |
316 | | Jacobs Engineering Group, Inc. | | | 13,667 | |
513 | | JB Hunt Transport Services, Inc. | | | 24,157 | |
391 | | Kennametal, Inc. | | | 16,504 | |
1,027 | | LeCroy Corp. | | | 12,365 | |
552 | | Leggett & Platt, Inc. | | | 13,458 | |
141 | | Martin Marietta Materials, Inc. | | | 11,276 | |
398 | | Metalico, Inc. | | | 2,348 | |
38 | | Middleby Corp. | | | 3,574 | |
914 | | Molex, Inc. | | | 23,554 | |
1,090 | | NCI Building Systems, Inc. | | | 12,415 | |
466 | | Old Dominion Freight Line, Inc. | | | 17,382 | |
389 | | Owens Corning | | | 14,529 | |
370 | | Progressive Waste Solutions Ltd. | | | 9,213 | |
1,721 | | Roadrunner Transportation Systems, Inc. | | | 25,953 | |
252 | | Roper Industries, Inc. | | | 20,992 | |
200 | | Trimble Navigation Ltd. | | | 7,928 | |
211 | | Triumph Group, Inc. | | | 21,011 | |
514 | | TTM Technologies, Inc. | | | 8,234 | |
222 | | Tyco International Ltd. | | | 10,973 | |
236 | | Vitran Corp, Inc. | | | 2,997 | |
357 | | Waste Connections, Inc. | | | 11,328 | |
| | | | | | |
| | | | | 587,989 | |
| | | | | | |
Technology: 4.5% | | | | |
275 | | ACI Worldwide, Inc. | | | 9,287 | |
2,057 | | Atmel Corp. | | | 28,942 | |
300 | | ATMI, Inc. | | | 6,129 | |
2,154 | | AXT, Inc. | | | 18,266 | |
169 | | CACI International, Inc. | | | 10,661 | |
415 | | Ceva, Inc. | | | 12,641 | |
1,474 | | Convio, Inc. | | | 15,934 | |
1,035 | | Cypress Semiconductor Corp. | | | 21,880 | |
98 | | Entropic Communications, Inc. | | | 871 | |
337 | | Fairchild Semiconductor International, Inc. | | | 5,631 | |
815 | | Freescale Semiconductor Holdings I Ltd. | | | 14,988 | |
1,710 | | inContact, Inc. | | | 8,123 | |
51 | | Infosys Ltd. (ADR) | | | 3,327 | |
1,125 | | LTX-Credence Corp. | | | 10,057 | |
1,821 | | Magma Design Automation, Inc. | | | 14,550 | |
636 | | MEMC Electronic Materials, Inc. | | | 5,425 | |
1,209 | | Micron Technology, Inc. | | | 9,043 | |
259 | | MICROS Systems, Inc. | | | 12,875 | |
351 | | NXP Semiconductor N.V. | | | 9,382 | |
979 | | OCZ Technology Group, Inc. | | | 7,832 | |
962 | | Omnicell, Inc. | | | 14,998 | |
287 | | Omnivision Technologies, Inc. | | | 9,990 | |
329 | | Opnet Technologies, Inc. | | | 13,469 | |
1,738 | | Radisys Corp. | | | 12,670 | |
466 | | SciQuest, Inc. | | | 7,964 | |
2,410 | | Taiwan Semiconductor Manufacturing
Co. Ltd. (ADR) | | | 30,390 | |
363 | | Ultratech, Inc. | | | 11,028 | |
376 | | Veeco Instruments, Inc. | | | 18,202 | |
459 | | Velti Plc | | | 7,762 | |
429 | | Volterra Semiconductor Corp. | | | 10,579 | |
| | | | | | |
| | | | | 362,896 | |
| | | | | | |
Total Common Stocks
(Cost: $1,860,842) (a) | | | 2,106,210 | |
| | | | |
| | | | | | | |
Principal
Amount | | | | Value | |
| | | | | | |
CORPORATE BONDS: 8.0% | | | | |
| | | Arch Coal, Inc. | | | | |
$ | 31,000 | | 7.00%,06/15/19 144A | | $ | 31,077 | |
| 31,000 | | 7.25%,06/15/21 144A | | | 31,194 | |
| | | Berry Plastics Corp. | | | | |
| 23,000 | | 9.50%, 05/15/18 | | | 22,942 | |
| | | Catalyst Paper Corp. | | | | |
| 50,000 | | 11.00%, 12/15/16 144A | | | 43,000 | |
| | | Celanese US Holdings LLC | | | | |
| 12,500 | | 5.88%, 06/15/21 | | | 12,797 | |
| | | Cumulus Media, Inc. | | | | |
| 12,500 | | 7.75%, 05/01/19 144A | | | 12,125 | |
| | | Earthlink, Inc. | | | | |
| 55,000 | | 8.88%, 05/15/19 144A | | | 50,187 | |
| | | Intelsat Jackson Holdings S.A. | | | | |
| 50,000 | | 11.25%, 06/15/16 | | | 53,125 | |
| | | International Lease Finance Corp. | | | | |
| 25,000 | | 5.75%,05/15/16 | | | 24,644 | |
| 25,000 | | 6.25%,05/15/19 | | | 24,464 | |
| | | Lions Gate Entertainment, Inc. | | | | |
| 15,000 | | 10.25%, 11/01/16 144A | | | 15,337 | |
| | | Liz Claiborne, Inc. | | | | |
| 70,000 | | 10.50%, 04/15/19 144A | | | 71,750 | |
| | | PAETEC Holding Corp. | | | | |
| 30,000 | | 9.88%, 12/01/18 144A | | | 31,237 | |
| | | Production Resource Group, Inc. | | | | |
| 35,000 | | 8.88%, 05/01/19 144A | | | 34,912 | |
| | | RadioShack Corp. | | | | |
| 12,500 | | 6.75%, 05/15/19 144A | | | 12,094 | |
| | | Satmex Escrow S.A. de C.V. | | | | |
| 50,000 | | 9.50%, 05/15/17 144A | | | 51,250 | |
| | | Seagate HDD Cayman | | | | |
| 50,000 | | 7.75%, 12/15/18 144A | | | 52,750 | |
| | | The Gap, Inc. | | | | |
| 68,000 | | 5.95%, 04/12/21 | | | 65,447 | |
| | | | | | | |
Total Corporate Bonds
(Cost: $651,562) (a) | | | 640,332 | |
| | | | |
GOVERNMENT BONDS: 2.1% | | | | |
| | | U.S. Treasury Bond | | | | |
| 20,000 | | 4.25%, 11/15/40 | | | 19,553 | |
| | | U.S. Treasury Notes | | | | |
| 43,000 | | 1.50%,06/30/16 | | | 42,483 | |
| 101,500 | | 3.63%,02/15/21 | | | 105,853 | |
| | | | | | | |
Total Government Bonds
(Cost: $166,599) (a) | | | 167,889 | |
| | | | |
STRUCTURED NOTES: 5.4% | | | | |
| | | | | | | |
| | | Deutsche Bank A.G. London Branch,
Alpha Overlay Securities | | | | |
| 380,000 | | 09/24/12 * § (b) | | | 406,562 | |
| 20,000 | | 07/03/13 (b) | | | 20,000 | |
| | | | | | | |
Total Structured Notes
(Cost: $400,458) (a) | | | 426,562 | |
| | | | |
See Notes to Financial Statements
10
| | | | | | |
Number of
Shares | | | | Value | |
| | | | | | |
EXCHANGE TRADED FUNDS: 3.7% | | | | |
550 | | iShares MSCI All Peru Capped Index Fund | | $ | 20,691 | |
2,920 | | Market Vectors Emerging Markets
Local Currency Bond ETF‡ | | | 80,169 | |
2,290 | | Market Vectors India Small-Cap Index ETF ‡ | | | 37,144 | |
3,000 | | WisdomTree Emerging Markets SmallCap
Dividend Fund | | | 157,590 | |
| | | | | | |
Total Exchange Traded Funds
(Cost: $278,806) (a) | | | 295,594 | |
| | | | |
OPEN-END FUNDS: 40.7% | | | | |
6,362 | | AC Risk Parity 12 Vol Fund # | | | 913,077 | |
45,198 | | AQR Diversified Arbitrage Fund | | | 505,314 | |
33,435 | | Highland Long/Short Equity Fund | | | 376,810 | |
348 | | Luxcellence - Virtuoso Fund * # | | | 304,591 | |
30,369 | | Marketfield Fund | | | 416,972 | |
47,270 | | TFS Market Neutral Fund | | | 733,626 | |
| | | | | | |
Total Open-End Funds
(Cost: $3,127,519) | | | 3,250,390 | |
| | | | |
OPTIONS PURCHASED: 0.1%
(Cost: $7,722) | | | | |
1,100 | | S&P 500 Index Calls($1,360,
expiring 08/20/11) * | | | 9,658 | |
| | | | |
MONEY MARKET FUND: 18.9%
(Cost: $1,504,671) | | | | |
1,504,671 | | AIM Treasury Portfolio - Institutional Class | | | 1,504,671 | |
| | | | |
Total Investments: 105.3%
(Cost: $7,998,179) | | | 8,401,306 | |
Liabilities in excess of other assets: (5.3)% | | | (424,226 | ) |
| | | | |
NET ASSETS: 100.0% | | $ | 7,977,080 | |
| | | | |
| | | | | | |
SECURITIES SOLD SHORT: (29.0)% | | | | |
COMMON STOCKS: (13.5)% | | | | |
Basic Materials: (0.8)% | | | | |
(218 | ) | Celanese Corp. | | | (11,622 | ) |
(909 | ) | RPM International, Inc. | | | (20,925 | ) |
(183 | ) | The Sherwin-Williams Co. | | | (15,348 | ) |
(420 | ) | Valspar Corp. | | | (15,145 | ) |
| | | | | | |
| | | | | (63,040 | ) |
| | | | | | |
Communications: (0.8)% | | | | |
(49 | ) | Acme Packet, Inc. | | | (3,436 | ) |
(474 | ) | EZchip Semiconductor Ltd. | | | (17,524 | ) |
(57 | ) | Factset Research Systems, Inc. | | | (5,832 | ) |
(549 | ) | Juniper Networks, Inc. | | | (17,294 | ) |
(449 | ) | Viasat, Inc. | | | (19,428 | ) |
| | | | | | |
| | | | | (63,514 | ) |
| | | | | | |
Consumer, Cyclical: (2.8)% | | | | |
(107 | ) | Abercrombie & Fitch Co. | | | (7,160 | ) |
(811 | ) | BJ’s Restaurants, Inc. | | | (42,464 | ) |
(409 | ) | Bob Evans Farms, Inc. | | | (14,303 | ) |
(54 | ) | Chipotle Mexican Grill, Inc. | | | (16,642 | ) |
(811 | ) | Cintas Corp. | | | (26,787 | ) |
(823 | ) | Fastenal Co. | | | (29,620 | ) |
(74 | ) | Group 1 Automotive, Inc. | | | (3,047 | ) |
(110 | ) | Limited Brands, Inc. | | | (4,230 | ) |
(44 | ) | MSC Industrial Direct Co. | | | (2,918 | ) |
(312 | ) | O’Reilly Automotive, Inc. | | | (20,439 | ) |
(73 | ) | Phillips-Van Heusen Corp. | | | (4,779 | ) |
(35 | ) | Polo Ralph Lauren Corp. | | | (4,641 | ) |
| | | | | | |
Number of
Shares | | | | Value | |
| | | | | | |
Consumer, Cyclical: (continued) | | | | |
(73 | ) | The Childrens Place Retail Stores, Inc. | | $ | (3,248 | ) |
(131 | ) | The Gap, Inc. | | | (2,371 | ) |
(874 | ) | Thor Industries, Inc. | | | (25,206 | ) |
(317 | ) | Urban Outfitters, Inc. | | | (8,924 | ) |
(235 | ) | Zumiez, Inc. | | | (5,868 | ) |
| | | | | | |
| | | | | (222,647 | ) |
| | | | | | |
Consumer, Non-cyclical: (1.5)% | | | | |
(52 | ) | Alliance Data Systems Corp. | | | (4,892 | ) |
(109 | ) | Colgate-Palmolive Co. | | | (9,528 | ) |
(79 | ) | Edwards Lifesciences Corp. | | | (6,887 | ) |
(106 | ) | Global Payments, Inc. | | | (5,406 | ) |
(78 | ) | HMS Holdings Corp. | | | (5,996 | ) |
(86 | ) | Kinetic Concepts, Inc. | | | (4,956 | ) |
(467 | ) | Laboratory Corp of America Holdings | | | (45,201 | ) |
(56 | ) | Monro Muffler Brake, Inc. | | | (2,088 | ) |
(37 | ) | RSC Holdings, Inc. | | | (443 | ) |
(407 | ) | Safeway, Inc. | | | (9,512 | ) |
(487 | ) | SAIC, Inc. | | | (8,191 | ) |
(127 | ) | The Scotts Miracle-Gro Co. | | | (6,516 | ) |
(92 | ) | Whole Foods Market, Inc. | | | (5,837 | ) |
| | | | | | |
| | | | | (115,453 | ) |
| | | | | | |
Financial: (2.9)% | | | | |
(11,100 | ) | Allied Irish Banks Plc (ADR) | | | (23,643 | ) |
(5,300 | ) | Banco Bilbao Vizcaya Argentaria S.A. (ADR) | | | (62,222 | ) |
(5,300 | ) | Banco Santander S.A. (ADR) | | | (61,003 | ) |
(1,050 | ) | Deutsche Bank AG | | | (62,202 | ) |
(38 | ) | Jones Lang LaSalle, Inc. | | | (3,583 | ) |
(19,000 | ) | The Governor & Co. of the Bank of
Ireland (ADR) | | | (20,520 | ) |
| | | | | | |
| | | | | (233,173 | ) |
| | | | | | |
Industrial: (2.5)% | | | | |
(178 | ) | Aerovironment, Inc. | | | (6,292 | ) |
(328 | ) | Aptargroup, Inc. | | | (17,168 | ) |
(136 | ) | Badger Meter, Inc. | | | (5,031 | ) |
(138 | ) | Belden, Inc. | | | (4,811 | ) |
(536 | ) | Boeing Co. | | | (39,626 | ) |
(367 | ) | Briggs & Stratton Corp. | | | (7,289 | ) |
(324 | ) | Ceradyne, Inc. | | | (12,633 | ) |
(59 | ) | CH Robinson Worldwide, Inc. | | | (4,652 | ) |
(118 | ) | Cymer, Inc. | | | (5,842 | ) |
(362 | ) | ESCO Technologies, Inc. | | | (13,322 | ) |
(476 | ) | Fabrinet | | | (11,557 | ) |
(146 | ) | FEI Co. | | | (5,576 | ) |
(200 | ) | Forward Air Corp. | | | (6,758 | ) |
(453 | ) | II-VI, Inc. | | | (11,597 | ) |
(146 | ) | Lennox International, Inc. | | | (6,288 | ) |
(81 | ) | Precision Castparts Corp. | | | (13,337 | ) |
(107 | ) | Regal-Beloit Corp. | | | (7,144 | ) |
(312 | ) | Swift Transportation Co. | | | (4,228 | ) |
(302 | ) | Thermo Fisher Scientific, Inc. | | | (19,446 | ) |
| | | | | | |
| | | | | (202,597 | ) |
| | | | | | |
Technology: (2.2)% | | | | |
(86 | ) | ANSYS, Inc. | | | (4,702 | ) |
(186 | ) | ARM Holdings Plc (ADR) | | | (5,288 | ) |
(984 | ) | ASML Holding N.V. | | | (36,369 | ) |
(561 | ) | Cavium, Inc. | | | (24,454 | ) |
(544 | ) | Emulex Corp. | | | (4,678 | ) |
(998 | ) | Hewlett-Packard Co. | | | (36,327 | ) |
See Notes to Financial Statements
11
|
VAN ECK VIP MULTI-MANAGER ALTERNATIVES FUND |
| |
SCHEDULE OF INVESTMENTS |
(continued) |
| | | | | | |
Number of
Shares | | | | Value | |
| | | | | | |
Technology: (continued) | | | | |
(186 | ) | Intel Corp. | | $ | (4,122 | ) |
(244 | ) | JDA Software Group, Inc. | | �� | (7,537 | ) |
(71 | ) | Lam Research Corp. | | | (3,144 | ) |
(244 | ) | LivePerson, Inc. | | | (3,450 | ) |
(292 | ) | Mercury Computer Systems, Inc. | | | (5,455 | ) |
(111 | ) | ON Semiconductor Corp. | | | (1,162 | ) |
(159 | ) | RADWARE Ltd. | | | (5,540 | ) |
(148 | ) | RightNow Technologies, Inc. | | | (4,795 | ) |
(124 | ) | Riverbed Technology, Inc. | | | (4,909 | ) |
(183 | ) | Rudolph Technologies, Inc. | | | (1,960 | ) |
(187 | ) | SYNNEX Corp. | | | (5,928 | ) |
(111 | ) | Texas Instruments, Inc. | | | (3,644 | ) |
(382 | ) | The Keyw Holding Corp. | | | (4,733 | ) |
(118 | ) | VeriFone Systems, Inc. | | | (5,233 | ) |
| | | | | | |
| | | | | (173,430 | ) |
| | | | | | |
Total Common Stocks
(Proceeds: $(1,062,809)) | | | (1,073,854 | ) |
| | | | |
| | | | | | | |
Principal
Amount | | | | | |
| | | | | | |
CORPORATE BONDS: (6.7)% | | | | |
| | | Best Buy Co., Inc. | | | | |
$ | (50,000 | ) | 5.50%, 03/15/21 | | | (49,320 | ) |
| | | First Data Corp. | | | | |
| (30,000 | ) | 10.55%,09/24/15 | | | (31,275 | ) |
| (15,000 | ) | 11.25%,03/31/16 | | | (14,850 | ) |
| | | Genworth Financial, Inc. | | | | |
| (50,000 | ) | 7.63%, 09/24/21 | | | (50,670 | ) |
| | | JPMorgan Chase & Co. | | | | |
| (50,000 | ) | 4.63%, 05/10/21 | | | (49,693 | ) |
| | | Marina District Finance Co., Inc. | | | | |
| (70,000 | ) | 9.50%, 10/15/15 144A | | | (73,150 | ) |
| | | Pilgrim’s Pride Corp. | | | | |
| (40,000 | ) | 7.88%, 12/15/18 144A | | | (37,200 | ) |
| | | Range Resources Corp. | | | | |
| (12,000 | ) | 5.75%, 06/01/21 | | | (11,820 | ) |
| | | Realogy Corp. | | | | |
| (35,000 | ) | 7.88%, 02/15/19 144A | | | (34,825 | ) |
| | | The Dow Chemical Co | | | | |
| (60,000 | ) | 4.25%, 11/15/20 | | | (58,781 | ) |
| | | United States Steel Corp. | | | | |
| (30,000 | ) | 7.38%, 04/01/20 | | | (30,975 | ) |
| | | Univision Communications, Inc. | | | | |
| (40,000 | ) | 8.50%, 05/15/21 144A | | | (40,100 | ) |
| | | Vail Resorts, Inc. | | | | |
| (50,000 | ) | 6.50%, 05/01/19 144A | | | (50,500 | ) |
| | | | | | | |
| | | | | | | |
Total Corporate Bonds
(Proceeds: $(533,322)) | | | (533,159 | ) |
| | | | |
GOVERNMENT BONDS: (0.8)% | | | | |
| | | U.S. Treasury Bond | | | | |
| (20,000 | ) | 4.75%, 02/15/41 | | | (21,263 | ) |
| | | U.S. Treasury Notes | | | | |
| (43,000 | ) | 1.75%,05/31/16 | | | (43,074 | ) |
| (500 | ) | 3.63%,02/15/21 | | | (521 | ) |
| | | | | | | |
Total Government Bonds
(Proceeds: $(65,403)) | | | (64,858 | ) |
| | | | |
| | | | | | | |
Number of
Shares | | | | Value | |
| | | | | | |
EXCHANGE TRADED FUNDS: (8.0)% | | | | |
| (42 | ) | Consumer Discretionary Select Sector
SPDR Fund | | $ | (1,689 | ) |
| (298 | ) | Consumer Staples Select Sector SPDR Fund | | | (9,307 | ) |
| (1,510 | ) | Direxion Daily Emerging Markets Bull
3X Shares | | | (57,274 | ) |
| (1,430 | ) | Direxion Daily Financial Bull 3X Shares | | | (36,665 | ) |
| (410 | ) | Direxion Daily Technology Bull 3X Shares | | | (17,991 | ) |
| (37 | ) | iShares Dow Jones Transportation Average
Index Fund | | | (3,625 | ) |
| (1,670 | ) | iShares MSCI Emerging Markets Index Fund | | | (79,492 | ) |
| (243 | ) | iShares PHLX SOX Semiconductor Sector
Index Fund | | | (13,499 | ) |
| (720 | ) | iShares Russell 2000 Growth Index Fund | | | (68,292 | ) |
| (428 | ) | iShares Russell Microcap Index Fund | | | (21,931 | ) |
| (270 | ) | Oil Services HOLDRs Trust | | | (41,040 | ) |
| (391 | ) | Semiconductor HOLDRs Trust | | | (13,325 | ) |
| (1,810 | ) | SPDR S&P 500 ETF Trust | | | (238,866 | ) |
| (82 | ) | SPDR S&P MidCap 400 ETF Trust | | | (14,547 | ) |
| (145 | ) | SPDR S&P Retail ETF | | | (7,752 | ) |
| (563 | ) | Technology Select Sector SPDR Fund | | | (14,469 | ) |
| | | | | | | |
Total Exchange Traded Funds
(Proceeds: $(616,289)) | | | (639,764 | ) |
| | | | |
Total Securities Sold Short
(Proceeds: $(2,277,823)) | | $ | (2,311,635 | ) |
| | | | |
| | | | | | | |
COVERED OPTIONS WRITTEN: (0.4)%
(Premiums received: $(24,778)) | | | | |
| (1,100 | ) | S&P 500 Index Calls ($1,320, expiring
8/20/11) * | | | (29,645 | ) |
| | | | | | | |
See Notes to Financial Statements
12
| | |
ADR | — | American Depositary Receipt |
GBP | — | British Pound |
GDR | — | Global Depositary Receipt |
HKD | — | Hong Kong Dollar |
SGD | — | Singapore Dollar |
THB | — | Thai Baht |
| |
(a) | All or a portion of these securities are segregated for securities sold short and written options. Total value of the securities segregated, including cash on deposit with broker, is $4,251,545. |
(b) | Issued with zero coupon at par. These securities are linked to the performance of the Deutsche Bank Fed Funds Total Return Index and the Deutsche Bank Equity Mean Reversion Alpha Index. |
‡ | Affiliated issuer – as defined under the Investment Company Act of 1940 (Van Eck Associates Corp. is the distributor and investment manager of the Market Vectors ETF Trust). |
* | Non-income producing |
# | Indicates a fair valued security which has not been valued utilizing an independent quote, but has been valued pursuant to guidelines established by the Board of Trustees. The aggregate value of fair valued securities is $1,367,867 which represents 17.1% of net assets. |
§ | Illiquid Security — the aggregate value of illiquid securities is $406,562 which represents 5.1% of net assets. |
144A | Security exempt from registration under Rule 144A of the Securities Act of 1933, as amended, or otherwise restricted. These securities may be resold in transactions exempt from registration, unless otherwise noted, and the net value amounted to $201,138, or 2.5% of net assets. |
A summary of the Fund’s transactions in securities of affiliates for the period ended June 30, 2011 is set forth below:
| | | | | | | | | | | | | | | | | | | | | | | | | | |
Affiliates | | | Value
12/31/10 | | Purchases | | Sales
Proceeds | | Gain
(Loss) | | Dividend
Income | | Value
06/30/11 | |
| | | | | | | | | | | | | | | |
Market Vectors Emerging Markets
Local Currency Bond ETF | | $ | — | | | $ | 79,686 | | | | $ | — | | | $ | — | | | $ | 390 | | | $ | 80,169 | |
Market Vectors Gold Miners ETF | | | 20,039 | | | | — | | | | | 18,426 | | | | 374 | | | | — | | | | — | |
Market Vectors India Small-Cap
Index ETF | | | — | | | | 38,263 | | | | | | | | | | | | | | | | | 37,144 | |
Market Vectors Junior Gold Miners ETF | | | 21,580 | | | | — | | | | | 19,805 | | | | 3,023 | | | | — | | | | — | |
Market Vectors Russia ETF | | | 87,534 | | | | — | | | | | 90,291 | | | | 12,355 | | | | — | | | | — | |
| | | | | | | | | | | | | | | | | | | | | | | | | |
| | $ | 129,153 | | | $ | 117,949 | | | | $ | 128,522 | | | $ | 15,752 | | | $ | 390 | | | $ | 117,313 | |
| | | | | | | | | | | | | | | | | | | | | | | | | |
The summary of inputs used to value the Fund’s investments as of June 30, 2011 is as follows:
| | | | | | | | | | | | | | | | | |
Long positions | | Level 1
Quoted
Prices | | Level 2
Significant
Observable
Inputs | | Level 3
Significant
Unobservable
Inputs | | Value | |
| | | | | | | | | |
Common Stocks | | | | | | | | | | | | | |
Basic Materials | | $ | 93,265 | | | $ | — | | | | $ | — | | | $ | 93,265 | |
Communications | | | 216,289 | | | | — | | | | | — | | | | 216,289 | |
Consumer, Cyclical | | | 279,472 | | | | — | | | | | — | | | | 279,472 | |
Consumer, Non-cyclical | | | 181,736 | | | | — | | | | | — | | | | 181,736 | |
Diversified | | | — | | | | 93,521 | | | | | — | | | | 93,521 | |
Energy | | | 157,738 | | | | — | | | | | — | | | | 157,738 | |
Financial | | | 76,626 | | | | 56,678 | | | | | — | | | | 133,304 | |
Industrial | | | 587,989 | | | | — | | | | | — | | | | 587,989 | |
Technology | | | 362,896 | | | | — | | | | | — | | | | 362,896 | |
Corporate Bonds | | | — | | | | 640,332 | | | | | — | | | | 640,332 | |
Government Bonds | | | — | | | | 167,889 | | | | | — | | | | 167,889 | |
Structured Notes | | | — | | | | 426,562 | | | | | — | | | | 426,562 | |
Exchange Traded Funds | | | 295,594 | | | | — | | | | | — | | | | 295,594 | |
Open-End Funds | | | 2,032,722 | | | | 1,217,668 | | | | | — | | | | 3,250,390 | |
Options | | | 9,658 | | | | — | | | | | — | | | | 9,658 | |
Money Market Fund | | | 1,504,671 | | | | — | | | | | — | | | | 1,504,671 | |
| | | | | | | | | | | | | | | | | |
Total | | $ | 5,798,656 | | | $ | 2,602,650 | | | | $ | — | | | $ | 8,401,306 | |
| | | | | | | | | | | | | | | | | |
See Notes to Financial Statements
13
|
VAN ECK VIP MULTI-MANAGER ALTERNATIVES FUND |
| |
SCHEDULE OF INVESTMENTS |
(continued) |
| | | | | | | | | | | | | | | | | |
Short positions | | Level 1
Quoted
Prices | | Level 2
Significant
Observable
Inputs | | Level 3
Significant
Unobservable
Inputs | | Value | |
| | | | | | | | | |
Common Stocks* | | $ | (1,073,854 | ) | | $ | — | | | | $ | — | | | $ | (1,073,854 | ) |
Corporate Bonds | | | — | | | | (533,159 | ) | | | | — | | | | (533,159 | ) |
Government Bonds | | | — | | | | (64,858 | ) | | | | — | | | | (64,858 | ) |
Exchange Traded Funds | | | (639,764 | ) | | | — | | | | | — | | | | (639,764 | ) |
| | | | | | | | | | | | | | | | | |
Total | | $ | (1,713,618 | ) | | $ | (598,017 | ) | | | $ | — | | | $ | (2,311,635 | ) |
| | | | | | | | | | | | | | | | | |
Other Financial Instruments, net** | | $ | (29,645 | ) | | $ | — | | | | $ | — | | | $ | (29,645 | ) |
| | | | | | | | | | | | | | | | | |
| | |
| | | |
* | See Schedule of Investments for security type and industry sector breakouts. |
** | Other financial instruments include written options. |
The following table reconciles the valuation of the Fund’s Level 3 investment securities and related transactions during the period ended June 30, 2011:
| | | | |
Balance as of 12/31/10 | | $ | 400 | |
Realized gain (loss) | | | 1,850 | |
Change in unrealized appreciation (depreciation) | | | (400 | ) |
Purchases | | | — | |
Sales | | | (1,850 | ) |
Transfers in and/or out of level 3 | | | — | |
| | | | |
Balance as of 6/30/11 | | $ | — | |
| | | | |
See Notes to Financial Statements
14
|
| |
STATEMENT OF ASSETS AND LIABILITIES |
June 30, 2011 (unaudited) |
| | | | |
Assets: | | | | |
Unaffiliated issuers (Cost $7,880,230) | | $ | 8,283,993 | |
Affiliated issuers (Cost $117,949) | | | 117,313 | |
Receivables: | | | | |
Due from broker | | | 2,106,794 | |
Investments sold | | | 188,977 | |
Shares of beneficial interest sold | | | 14,213 | |
Dividends and interest | | | 12,546 | |
Prepaid expenses | | | 112 | |
| | | | |
Total assets | | | 10,723,948 | |
| | | | |
Liabilities: | | | | |
Payables: | | | | |
Securities sold short (proceeds $2,277,823) | | | 2,311,635 | |
Written options, at value (premiums received $24,778) | | | 29,645 | |
Dividends on securities sold short | | | 1,604 | |
Investments purchased | | | 267,902 | |
Shares of beneficial interest redeemed | | | 122 | |
Due to Adviser | | | 2,889 | |
Due to custodian | | | 65,584 | |
Deferred Trustee fees | | | 2,492 | |
Accrued expenses | | | 64,995 | |
| | | | |
Total liabilities | | | 2,746,868 | |
| | | | |
NET ASSETS | | $ | 7,977,080 | |
| | | | |
Shares of beneficial interest outstanding | | | 793,193 | |
| | | | |
Net asset value, redemption and offering price per share | | | $10.06 | |
| | | | |
| | | | |
Net Assets consist of: | | | | |
Aggregate paid in capital | | $ | 7,766,228 | |
Net unrealized appreciation | | | 362,885 | |
Accumulated net investment loss | | | (130,929 | ) |
Accumulated net realized loss | | | (21,104 | ) |
| | | | |
| | $ | 7,977,080 | |
| | | | |
See Notes to Financial Statements
15
|
VAN ECK VIP MULTI-MANAGER ALTERNATIVES FUND |
| |
STATEMENT OF OPERATIONS |
For the Six Months Ended June 30, 2011 (unaudited) |
| | | | | | | |
Income: | | | | | | | |
Dividends (net of foreign taxes withheld of $828) | | | | | $ | 18,157 | |
Dividends from affiliates | | | | | | 390 | |
Interest | | | | | | 5,507 | |
| | | | | | | |
Total income | | | | | | 24,054 | |
| | | | | | | |
|
Expenses: | | | | | | | |
Management fees | | $ | 72,256 | | | | |
Dividends on securities sold short | | | 11,204 | | | | |
Transfer agent fees | | | 5,873 | | | | |
Custodian fees | | | 8,951 | | | | |
Professional fees | | | 23,293 | | | | |
Reports to shareholders | | | 22,154 | | | | |
Insurance | | | 293 | | | | |
Trustees’ fees and expenses | | | 1,167 | | | | |
Interest | | | 146 | | | | |
Other | | | 3,415 | | | | |
| | | | | | | |
Total expenses | | | 148,752 | | | | |
Waiver of management fees | | | (56,926 | ) | | | |
| | | | | | | |
Net expenses | | | | | | 91,826 | |
| | | | | | | |
Net investment loss | | | | | | (67,772 | ) |
| | | | | | | |
|
Net realized gain (loss) on: | | | | | | | |
Investments (net of foreign taxes of $132) | | | | | | 97,136 | |
Investments – affiliated issuers | | | | | | 15,752 | |
Securities sold short | | | | | | (15,733 | ) |
Futures contracts | | | | | | (33,568 | ) |
Foreign currency transactions and foreign denominated assets and liabilities | | | | | | 1,938 | |
Options purchased | | | | | | (13,649 | ) |
Written options | | | | | | 5,168 | |
| | | | | | | |
Net realized gain | | | | | | 57,044 | |
| | | | | | | |
|
Change in net unrealized appreciation (depreciation) on: | | | | | | | |
Investments, futures contracts, options purchased and written options (net of foreign taxes of $1,431) | | | | | | 24,148 | |
Securities sold short | | | | | | 41,056 | |
Foreign currency transactions and foreign denominated assets and liabilities | | | | | | (5 | ) |
| | | | | | | |
Change in net unrealized appreciation | | | | | | 65,199 | |
| | | | | | | |
Net Increase in Net Assets Resulting from Operations | | | | | $ | 54,471 | |
| | | | | | | |
See Notes to Financial Statements
16
|
| |
STATEMENT OF CHANGES IN NET ASSETS |
| | | | | | | |
| | Six Months Ended
June 30,
2011 | | Year Ended
December 31,
2010 | |
| | | | | |
| | (unaudited) | | | |
| | | | | |
Operations: | | | | | | | |
Net investment loss | | $ | (67,772 | ) | $ | (78,668 | ) |
Net realized gain | | | 57,044 | | | 538,630 | |
Net change in unrealized appreciation (depreciation) | | | 65,199 | | | (119,403 | ) |
| | | | | | | |
Net increase in net assets resulting from operations | | | 54,471 | | | 340,559 | |
| | | | | | | |
|
Dividends and Distributions to shareholders from: | | | | | | | |
Net investment income | | | (66,671 | ) | | — | |
Net realized gains | | | (41,670 | ) | | — | |
| | | | | | | |
Total dividends and distributions | | | (108,341 | ) | | — | |
| | | | | | | |
|
Share transactions*: | | | | | | | |
Proceeds from sale of shares | | | 748,065 | | | 2,052,442 | |
Reinvestment of dividends and distributions | | | 108,341 | | | — | |
Cost of shares redeemed | | | (467,532 | ) | | (2,381,633 | ) |
| | | | | | | |
Net increase (decrease) in net assets resulting from share transactions | | | 388,874 | | | (329,191 | ) |
| | | | | | | |
Total increase in net assets | | | 335,004 | | | 11,368 | |
| | | | | | | |
Net Assets: | | | | | | | |
Beginning of period | | | 7,642,076 | | | 7,630,708 | |
| | | | | | | |
End of period (including undistributed (accumulated) net investment income (loss) of ($130,929)
and $3,514, respectively) | | $ | 7,977,080 | | $ | 7,642,076 | |
| | | | | | | |
| | | | | | | |
* Shares of beneficial interest issued, reinvested and redeemed
(unlimited number of $.001 par value shares authorized): | | | | | | | |
Shares sold | | | 74,282 | | | 206,625 | |
Shares reinvested | | | 10,867 | | | — | |
Shares redeemed | | | (46,433 | ) | | (243,874 | ) |
| | | | | | | |
Net increase (decrease) | | | 38,716 | | | (37,249 | ) |
| | | | | | | |
See Notes to Financial Statements
17
|
VAN ECK VIP MULTI-MANAGER ALTERNATIVES FUND |
| |
STATEMENT OF CASH FLOWS |
For the Six Months Ended June 30, 2011 (unaudited) |
| | | | |
Cash flows from operating activities | | | | |
Net increase in net assets resulting from operations | | $ | 54,471 | |
| | | | |
Adjustments to reconcile net increase in net assets resulting from operations to net cash used from operating activities: | | | | |
Purchases of long term securities | | | (6,189,689 | ) |
Proceeds from sale of long term securities | | | 6,576,076 | |
Increase in short term investments | | | (109,008 | ) |
Proceeds of short sales of long term securities | | | 1,772,739 | |
Purchases of short sale covers of long term securities | | | (1,380,147 | ) |
Net premiums received from options written | | | (24,778 | ) |
Increase in receivable for investments sold | | | (169,579 | ) |
Increase in receivable due from broker | | | (1,049,236 | ) |
Increase in dividends and interest receivable | | | (345 | ) |
Decrease in prepaid expenses | | | 293 | |
Increase in variation margin | | | (1,359 | ) |
Increase in payable for investments purchased | | | 260,369 | |
Increase in dividends payable on securities sold short | | | 718 | |
Increase in accrued expenses | | | 10,769 | |
Increase in deferred Trustee fees | | | 470 | |
Decrease in due to Adviser | | | (9,898 | ) |
Net realized gain from investments, futures, securities sold short | | | (97,155 | ) |
Change in unrealized appreciation (depreciation) of investments | | | (84,899 | ) |
| | | | |
Net cash used from operating activities | | $ | (440,188 | ) |
| | | | |
| | | | |
Cash flows from financing activities | | | | |
Proceeds from sales of shares | | | 842,225 | |
Cost of shares redeemed | | | (467,621 | ) |
| | | | |
Net cash provided in financing activities | | | 374,604 | |
| | | | |
Net change in cash | | | (65,584 | ) |
Cash, beginning of period | | | — | |
| | | | |
Cash due to custodian, end of period | | $ | (65,584 | ) |
| | | | |
| | | | |
Supplemental disclosure of cash flow information: | | | | |
Short sale dividends paid during the period | | $ | 11,204 | |
| | | | |
Interest expense paid during the period | | $ | 146 | |
| | | | |
See Notes to Financial Statements
18
|
| |
FINANCIAL HIGHLIGHTS |
For a share outstanding throughout the period: |
| | | | | | | | | | | | | | | | | | | | |
| | Initial Class Shares | |
| | | |
| | For the Six
Months Ended
June 30,
2011 | | | | |
| | | | Year Ended December 31, | |
| | | | | |
| | | | 2010 | | | 2009 | | | 2008 | | | 2007 | | | 2006 | |
| | | | | | | | | | | | | | | | | | |
| | (unaudited) | | | | | | | | | | | | | | | | |
Net asset value, beginning of period | | | $10.13 | | | | $9.64 | | | $9.01 | | | $10.73 | | | $10.63 | | | $9.85 | |
| | | | | | | | | | | | | | | | | | | | |
|
Income from investment operations: | | | | | | | | | | | | | | | | | | | | |
Net investment income (loss) | | | (0.08 | ) | | | (0.10 | ) | | (0.01 | ) | | — | (b) | | (0.06 | ) | | 0.08 | |
Net realized and unrealized gain (loss) on investments | | | 0.16 | | | | 0.59 | | | 1.19 | | | (1.39 | ) | | 0.52 | | | 0.77 | |
| | | | | | | | | | | | | | | | | | | | |
Total from investment operations | | | 0.08 | | | | 0.49 | | | 1.18 | | | (1.39 | ) | | 0.46 | | | 0.85 | |
| | | | | | | | | | | | | | | | | | | | |
Less distributions from: | | | | | | | | | | | | | | | | | | | | |
Net investment income | | | (0.09 | ) | | | — | | | (0.02 | ) | | (0.01 | ) | | (0.08 | ) | | — | |
Net realized gains | | | (0.06 | ) | | | — | | | (0.53 | ) | | (0.32 | ) | | (0.28 | ) | | (0.07 | ) |
| | | | | | | | | | | | | | | | | | | | |
Total distributions | | | (0.15 | ) | | | — | | | (0.55 | ) | | (0.33 | ) | | (0.36 | ) | | (0.07 | ) |
| | | | | | | | | | | | | | | | | | | | |
Net asset value, end of period | | | $10.06 | | | | $10.13 | | | $9.64 | | | $9.01 | | | $10.73 | | | $10.63 | |
| | | | | | | | | | | | | | | | | | | | |
Total return (a) | | | 0.73 | %(e) | | | 5.08 | % | | 13.75 | % | | (13.26 | )% | | 4.35 | % | | 8.76 | % |
| | | | | | | | | | | | | | | | | | | | | |
| | | | | | | | | | | | | | | | | | | | |
Ratios/Supplemental Data | | | | | | | | | | | | | | | | | | | | |
Net Assets, end of period (000’s) | | | $7,977 | | | | $7,642 | | | $7,631 | | | $6,179 | | | $7,468 | | | $7,226 | |
Ratio of gross expenses to average net assets (c) | | | 3.81 | %(d) | | | 4.54 | % | | 4.64 | % | | 4.73 | % | | 5.32 | % | | 3.72 | % |
Ratio of net expenses to average net assets (c) | | | 2.46 | %(d) | | | 2.46 | % | | 2.56 | % | | 3.24 | % | | 4.13 | % | | 3.16 | % |
Ratio of net expenses, excluding dividends on securities sold short and interest expense, to average net assets (c) | | | 2.15 | %(d) | | | 2.15 | % | | 2.09 | % | | 2.14 | % | | 2.50 | % | | 2.48 | % |
Ratio of net investment income (loss) to average net assets (c) | | | (1.74 | )%(d) | | | (1.04 | )% | | (0.14 | )% | | 0.02 | % | | (0.50 | )% | | 0.72 | % |
Portfolio turnover rate | | | 92 | %(e) | | | 334 | % | | 220 | % | | 240 | % | | 207 | % | | 182 | % |
| | |
| | |
(a) | Total return is calculated assuming an initial investment of made at the net asset value at the beginning of period, reinvestment of any dividends and distributions at net asset value on the dividend/distributions payment date and a redemption on the last day of the period. The return does not reflect the deduction of taxes that a shareholder would pay on Fund dividends/distributions or the redemption of Fund shares. |
(b) | Amount represents less than $0.005 per share. |
(c) | The ratios presented do not reflect the Fund’s proportionate share of income and expenses from the Fund’s investments in underlying Funds. |
(d) | Annualized |
(e) | Not annualized |
See Notes to Financial Statements
19
|
VAN ECK VIP MULTI-MANAGER ALTERNATIVES FUND |
| |
NOTES TO FINANCIAL STATEMENTS |
June 30, 2011 (unaudited) |
Note 1—Fund Organization—Van Eck VIP Trust, (the “Trust”), is registered under the Investment Company Act of 1940, as amended, as an open-end management investment company. The Trust was organized as a Massachusetts business trust on January 7, 1987. The Van Eck VIP Multi-Manager Alternatives Fund, (the “Fund”) is a non-diversified series of the Trust and seeks to achieve consistent absolute (positive) returns in various market cycles. The Fund currently offers a single class of shares: Initial Class Shares.
Note 2—Significant Accounting Policies—The preparation of financial statements in conformity with U.S. generally accepted accounting principles (“GAAP”) requires management to make estimates and assumptions that affect the reported amounts and disclosures in the financial statements. Actual results could differ from those estimates.
The following is a summary of significant accounting policies followed by the Fund.
| |
A. | Security Valuation—Securities traded on national exchanges or traded on the NASDAQ National Market System are valued at the last sales price as reported at the close of each business day. Securities traded on the NASDAQ Stock Market are valued at the NASDAQ official closing price. Over-the-counter securities not included in the NASDAQ National Market System and listed securities for which no sale was reported are valued at the mean of the bid and ask prices. To the extent these securities are actively traded they are categorized as level 1 in the fair value hierarchy (as described below). Certain foreign securities, whose values may be affected by market direction or events occurring before the Fund’s pricing time (4:00 p.m. Eastern Time) but after the close of the securities’ primary market, are fair valued using a pricing service and are categorized as level 2 in the fair value hierarchy. The pricing service, using methods approved by the Board of Trustees, considers the correlation of the trading patterns of the foreign security to intraday trading in the U.S. markets, based on indices of domestic securities and other appropriate indicators such as prices of relevant ADR’s and futures contracts. The Fund may also fair value securities in other situations, such as, when a particular foreign market is closed but the Fund is open. Bonds and notes are fair valued by a pricing service which utilizes models that incorporate observable data such as sales of similar securities, broker quotes, yields, bids, offers and reference data and are categorized as level 2 in the fair value hierarchy. Short-term obligations purchased with more than sixty days remaining to maturity are valued at market value. Short-term obligations purchased with sixty days or less to maturity are valued at amortized cost, which with accrued interest approximates market value. Open-end mutual fund investments (including money market funds) investments are valued at their closing net asset value each business day and are categorized as level 1 in the fair value hierarchy. Futures are valued using the closing price reported at the close of the respective exchange and are categorized as level 1 in the fair value hierarchy. Forward foreign currency contracts are valued at the spot currency rate plus an amount (“points”), which reflects the differences in interest rates between the U.S. and foreign markets. Securities for which quotations are not readily available are stated at fair value as determined by the Pricing Committee of Van Eck Associates Corporation (the “Adviser”) appointed by the Board of Trustees. Certain factors such as economic conditions, political events, market trends, the nature of and duration of any restrictions on disposition, trading in similar securities of the issuer or comparable issuers and other security specific information are used to determine the fair value for these securities. Depending on the relative significance of valuation inputs, these securities may be classified either as level 2 or level 3 in the fair value hierarchy. The price which the Fund may realize upon sale of an investment may differ materially from the value presented on the Schedule of Investments. |
| |
| The Fund utilizes various methods to measure the fair value of most of its investments on a recurring basis which includes a hierarchy that prioritizes inputs to valuation methods used to measure fair value. GAAP establishes a fair value hierarchy that prioritizes inputs to valuation techniques used to measure fair value. The hierarchy gives highest priority to unadjusted quoted prices in active markets for identical assets and liabilities (Level 1 measurements) and the lowest priority to unobservable inputs (Level 3 measurements). The inputs or methodologies used for valuing securities are not necessarily an indication of the risk associated with investing in those securities. The three levels of the fair value hierarchy are described below: |
| |
| Level 1 – Quoted prices in active markets for identical securities. |
| |
| Level 2 – Significant observable inputs (including quoted prices for similar securities, interest rates, prepayment speeds, credit risk, etc.). |
| |
| Level 3 – Significant unobservable inputs (including the Fund’s own assumptions in determining the fair value of investments). |
| |
B. | Federal Income Taxes—It is the Fund’s policy to comply with the provisions of the Internal Revenue Code applicable to regulated investment companies and to distribute all of its taxable income to its shareholders. Therefore, no federal income tax provision is required. |
| |
C. | Dividends and Distributions to Shareholders—Dividends to shareholders from net investment income and distributions from net realized capital gains, if any, are declared and paid annually. Income dividends and capital gain distributions are determined in accordance with income tax regulations, which may differ from such amounts determined in accordance with GAAP. |
20
| |
D. | Securities Sold Short—A short sale occurs when a Fund sells a security, which it does not own, by borrowing it from a broker. Proceeds from securities sold short are reported as liabilities on the Statement of Assets and Liabilities and are marked to market daily in accordance with the fair value methodology described in Note 2A. Gains and losses are classified as realized when short positions are closed. In the event that the value of the security that the Fund sold short declines, the Fund will gain as it repurchases the security in the market at the lower price. If the price of the security increases, the Fund will suffer a loss, as it will have to repurchase the security at the higher price. Short sales may incur higher transaction costs than regular securities transactions. Dividends and interest on short sales are recorded as an expense by the Fund on the ex-dividend date or interest payment date. Cash as collected is deposited in a segregated account with brokers, maintained by the Fund, for its open short sales. Until the Fund replaces the borrowed security, the Fund maintains securities or permissible liquid assets in a segregated account with a broker or custodian sufficient to cover its short positions. Securities sold short at June 30, 2011, are reflected in the Schedule of Investments. |
| |
E. | Currency Translation—Assets and liabilities denominated in foreign currencies and commitments under forward foreign currency contracts are translated into U.S. dollars at the closing prices of such currencies each business day. Purchases and sales of investments are translated at the exchange rates prevailing when such investments are acquired or sold. Income and expenses are translated at the exchange rates prevailing when accrued. The portion of realized and unrealized gains and losses on investments that result from fluctuations in foreign currency exchange rates is not separately disclosed. Recognized gains or losses attributable to foreign currency fluctuations on foreign currency denominated assets, other than investments, and liabilities are recorded as net realized gains and losses from foreign currency transactions. |
| |
F. | Restricted Securities—The Fund may invest in securities that are subject to legal or contractual restrictions on resale. These securities generally may be resold in transactions exempt from registration or to the public if the securities are registered. Disposal of these securities may involve time-consuming negotiations and expense, and prompt sale at an acceptable price may be difficult. Information regarding restricted securities is included at the end of the Fund’s Schedule of Investments. |
| |
G. | Structured Notes—The Fund may invest in structured notes whose values are based on the price movements of a referenced security or index. The value of these structured notes will rise and fall in response to changes in the referenced security or index. On the maturity date of each structured note, a Fund will receive a payment from a counterparty based on the value of the referenced security or index (notional amount multiplied by the price of the referenced security or index) and record a realized gain or loss. |
| |
| Structured notes may present a greater degree of market risk than many types of securities and may be more volatile and less liquid than less complex securities. Structured notes are also subject to the risks that the issuer of the structured notes may fail to perform its contractual obligations. Structured notes at June 30, 2011, are reflected in the Schedule of Investments. |
| |
H. | Use of Derivative Instruments—The Fund may make investments in derivative instruments, including, but not limited to, options, futures, swaps and other derivatives relating to foreign currency transactions. A derivative is an instrument whose value is derived from underlying assets, indices, reference rates or a combination of these factors. Derivative instruments may be privately negotiated contracts (often referred to as over the counter (“OTC”) derivatives) or they may be listed and traded on an exchange. Derivative contracts may involve future commitments to purchase or sell financial instruments or commodities at specified terms on a specified date, or to exchange interest payment streams or currencies based on a notional or contractual amount. Derivative instruments may involve a high degree of financial risk. The use of derivatives also involves the risk of loss if the investment adviser is incorrect in its expectation of the timing or level of fluctuations in securities prices, interest rates or currency prices. Investments in derivative instruments also include the risk of default by the counterparty, the risk that the investment may not be liquid and the risk that a small movement in the price of the underlying security or benchmark may result in a disproportionately large movement, unfavorable or favorable, in the price of the derivative instrument. Details of this disclosure are found below as well as in the Schedule of Investments. |
21
|
VAN ECK VIP MULTI-MANAGER ALTERNATIVES FUND |
| |
NOTES TO FINANCIAL STATEMENTS |
(continued) |
|
At June 30, 2011, the Fund had the following derivatives (not designated as hedging instruments under GAAP): |
| | |
| | Liability derivatives |
| | |
| | Equity risk |
| | |
Written options1 | | $29,645 |
| |
1 | Statement of Assets and Liabilities location: Written options, at value |
|
The impact of transactions in derivative instruments, during the period ended June 30, 2011, were as follows: |
| | | | | | | | | | | |
| | Interest rate risk | | Equity risk | |
| | | | | |
Realized gain (loss): | | | | | | | | | | | |
Written options2 | | | | | | | | $ | 5,168 | | |
Futures contracts3 | | | | (33,568 | ) | | | | | | |
|
Change in appreciation (depreciation): | | | | | | | | | | | |
Written options4 | | | | | | | | | (8,378 | ) | |
Futures contracts4 | | | | (12,044 | ) | | | | | | |
| |
2 | Statement of Operations location: Net realized gain on written options |
3 | Statement of Operations location: Net realized loss on futures contracts |
4 | Statement of Operations location: Change in unrealized appreciation (depreciation) of investments, futures contracts, and written options |
|
Option Contracts—The Fund is subject to equity price risk, interest rate risk and commodity price risk in the normal course of pursuing its investment objectives. The Fund may invest, for investment or hedging purposes, in call and put options on securities, currencies and commodities. Call and put options give the Fund the right, but not the obligation, to buy (calls) or sell (puts) the instrument underlying the option at a specified price. The premium paid on the option, should it be exercised, will, on a call, increase the cost of the instrument acquired and, on a put, reduce the proceeds received from the sale of the instrument underlying the option. If the options are not exercised, the premium paid will be recorded as a realized loss upon expiration. The Fund may incur additional risk to the extent the value of the underlying instrument does not correlate with the movement of the option value. |
|
The Fund may also write call or put options in order to gain exposure or to protect against changes in the markets or in an attempt to enhance income or gains. As the writer of an option, the Fund receives a premium. The Fund keeps the premium whether or not the option is exercised. The premium will be recorded, upon expiration of the option, as a short-term realized gain. If the option is exercised, the Fund must sell, in the case of a written call, or buy, in the case of a written put, the underlying instrument at the exercise price. The Fund may write only covered puts and calls. A covered call option is an option in which the Fund owns the instrument underlying the call. A covered call sold by the Fund exposes it during the term of the option to possible loss of opportunity to realize appreciation in the market price of the underlying instrument or to possible continued holding of an underlying instrument which might otherwise have been sold to protect against a decline in the market price. A covered put exposes the Fund during the term of the option to a decline in price of the underlying instrument. The Fund maintains securities or permissible liquid assets in a segregated account with a broker or custodian sufficient to cover its put option positions. The Fund may incur additional risk from investments in written currency options if there are unanticipated movements in the underlying currencies. Transactions in put and call options written during the period ended June 30, 2011 were as follows: |
| | | | | | | | | | | |
| | Number of Contracts | | Premiums | |
| | | | | |
Options outstanding at December 31, 2010 | | | | 47 | | | | | 6,701 | | |
Options opened | | | | 27 | | | | | 1,502 | | |
Options written | | | | (26 | ) | | | | (35,183 | ) | |
Options exercised | | | | (4 | ) | | | | (79 | ) | |
Options expired | | | | (55 | ) | | | | 2,281 | | |
| | | | | | | | | | | |
Options outstanding at June 30, 2011 | | | | (11 | ) | | | | (24,778 | ) | |
| | | | | | | | | | | |
|
Forward Foreign Currency Contracts—The Fund is subject to foreign currency risk in the normal course of pursuing its investment objectives. The Fund may buy and sell forward foreign currency contracts to settle purchases and sales of foreign denominated securities or to hedge foreign denominated assets. Realized gains and losses from forward foreign currency contracts are included in realized gain (loss) on forward foreign currency contracts and foreign currency transactions. The Fund may incur additional risk from investments in forward foreign currency contracts if the counterparty is unable to fulfill its obligation or there are unanticipated movements of the foreign currency relative to the U.S. dollar. The Fund had no outstanding forward foreign currency contracts during the period ended June 30, 2011. |
22
| |
| |
|
| Futures Contracts—The Fund is subject to equity price risk in the normal course of pursuing its investment objectives. The Fund may buy and sell futures contracts. The Fund may engage in these transactions to seek performance that corresponds to the Index and in managing cash flows. A futures contract is an agreement between two parties to buy or sell a specified instrument at a set price on a future date. Realized gains and losses from futures contracts are reported separately. The Fund had no outstanding futures contracts at June 30, 2011. |
| |
I. | Other—Security transactions are accounted for on trade date. Dividend income and expenses are recorded on the ex-dividend date. Interest income, including amortization of premiums and discounts, is accrued as earned. Realized gains and losses are calculated on the identified cost basis. Interest income, including amortization of premiums and discounts, is accrued as earned. Estimated foreign taxes that are expected to be withheld from proceeds at the sale of certain foreign investments is accrued by the Fund and decreases the unrealized gain on investments. |
| |
| In the normal course of business, the Fund enters into contracts that contain a variety of general indemnifications. The Fund’s maximum exposure under these agreements is unknown as this would involve future claims that may be made against the Fund that have not yet occurred. However, the Adviser believes the risk of loss under these arrangements to be remote. |
Note 3—Investment Management and Other Agreements—The Adviser is the investment adviser to the Fund. The Adviser receives a management fee, calculated daily and payable monthly based on an annual rate of 2.50% of the Fund’s average daily net assets. The Adviser has agreed, at least until May 1, 2012, to voluntarily waive or limit management fees and/or assume expenses (excluding acquired fund fees and expenses, interest expense, dividends on securities sold short, taxes and extraordinary expenses) exceeding 2.15% of average daily net assets. In addition, the Adviser has agreed to waive its management fee with respect to any portion of the Fund’s assets invested directly by the Adviser in an Underlying Fund (Exchange Traded Funds or Open-End Funds) excluding money market funds. For the period ended June 30, 2011, the Adviser waived management fees in the amount of $14,961 related to the overall expense waiver and $41,965 related to the Underlying Fund waiver. The Adviser offsets the management fees it charges the Fund by the amount it collects as a management fee from an Underlying Fund managed by the Adviser, as a result of an investment of the Fund’s assets by a sub-adviser in such Underlying Fund. For the six months ended June 30, 2011, the Adviser reduced management fees charged by $511 due to such sub-adviser investments. Certain officers and trustees of the Trust are officers, directors or stockholders of the Adviser and Van Eck Securities Corporation, the Distributor.
As of June 30, 2011, the Fund had six sub-advisers, Acorn Derivatives Management Corp., Coe Capital Management, LLC, Dix Hills Partners, LLC, Millrace Asset Group, Inc., Primary Funds, LLC, and Medley Credit Strategies, LLC, formerly known as Viathon Capital LP, LLC. The Adviser directly paid sub-advisory fees to the sub-advisers at a rate of 1.00% of the portion of the average daily net assets of the Fund managed by each of the sub-advisers.
Note 4—Investments—For the period ended June 30, 2011, the cost of purchases and proceeds from sales of investments-other than U.S. government securities and short-term obligations aggregated $6,189,689 and $6,576,076, respectively. For the period ended June 30, 2011, proceeds of short sales and the cost of purchases of short sale covers aggregated $1,380,147 and $1,772,739, respectively.
Note 5—Income Taxes—For Federal income tax purposes, the identified cost of investments owned at June 30, 2011 was $7,998,179 and net unrealized appreciation aggregated $403,127 of which $455,574 related to appreciated securities and $52,447 related to depreciated securities.
The tax character of dividends and distributions paid to shareholders were as follows:
| | | | | | |
| | Period Ended
June 30, 2011 | |
| | | |
Ordinary income | | | $ | 66,671 | | |
Long term capital gains | | | | 41,670 | | |
| | | | | | |
Total | | | $ | 108,341 | | |
| | | | | | |
The Fund recognizes the tax benefits of uncertain tax positions only where the position is “more likely than not” to be sustained assuming examination by applicable tax authorities. Management has analyzed the Fund’s tax positions, and has concluded that no liability for unrecognized tax benefits should be recorded related to uncertain tax positions taken on return filings for open tax years (tax years ended December 31, 2007-2010), or expected to be taken in the Fund’s current tax year. Therefore, no provision for income tax is required in the Fund’s financial statements.
The Fund recognizes interest and penalties, if any, related to uncertain tax positions as income tax expense in the Statement of Operations. During the period, the Fund did not incur any interest or penalties.
23
|
VAN ECK VIP MULTI-MANAGER ALTERNATIVES FUND |
| |
NOTES TO FINANCIAL STATEMENTS |
(continued) |
Note 6—Concentration of Risk—The Fund may invest in debt securities which are rated as below investment grade by rating agencies. Such securities involve more risk of default than do higher rated securities and are subject to greater price variability.
At June 30, 2011, Van Eck Securities Corp. owns approximately 19% of the outstanding shares of beneficial interest Fund. Additionally, the aggregate shareholder accounts of three insurance companies own approximately 29%, 26% and 20% of the outstanding shares of beneficial interest of the Fund.
Note 7—Bank Line of Credit—The Trust may participate with Van Eck Funds (collectively the “VE/VIP Funds”) in a $20 million committed credit facility (the “Facility”) to be utilized for temporary financing until the settlement of sales or purchases of portfolio securities, the repurchase or redemption of shares of the Fund at the request of the shareholders and other temporary or emergency purposes. The VE/VIP Funds have agreed to pay commitment fees, pro rata, based on the unused but available balance. Interest is charged to the VE/VIP Funds at rates based on prevailing market rates in effect at the time of borrowings. The average daily loan balance during the 8 day period for which a loan was outstanding amounted to $387,962 and the weighted average interest rate was 1.51%. At June 30, 2011, the Fund had no outstanding borrowings under the Facility.
Note 8—Trustee Deferred Compensation Plan—The Trust has a Deferred Compensation Plan (the “Plan”) for Trustees under which the Trustees can elect to defer receipt of their trustee fees until retirement, disability or termination from the Board of Trustees. The fees otherwise payable to the participating Trustees are deemed invested in shares of the Van Eck Funds (another registered investment company managed by the Adviser) as directed by the Trustees.
The expense for the Plan is included in “Trustees’ fees and expenses” in the Statement of Operations. The liability for the plan is shown as “Deferred Trustee fees” in the Statement of Assets and Liabilities.
Note 9—Custodian Fees—The Fund has entered into an expense offset agreement with its custodian wherein it receives credit toward the reduction of custodian fees whenever there are uninvested cash balances. For the period ended June 30, 2011, there were no offsets of custodial fees.
Note 10—Subsequent Event Review—The Fund has evaluated subsequent events and transactions for potential recognition or disclosure through the date the financial statements were issued.
24
|
| |
APPROVAL OF ADVISORY AND SUB-ADVISORY AGREEMENTS |
The Investment Company Act of 1940, as amended, provides, in substance, that each investment advisory agreement between a fund and its investment advisers will be entered into only if it is approved, and will continue in effect from year to year, after an initial two-year period, only if its continuance is approved at least annually, by the Board of Trustees (the “Board”), including by a vote of a majority of the Trustees who are not “interested persons” of the Fund (“Independent Trustees”), cast in person at a meeting called for the purpose of considering such approval.
Approval of Advisory and Sub-Advisory Agreements
In considering the renewal of the Fund’s existing investment advisory agreement and certain of the Fund’s existing sub-advisory agreements, the Board reviewed and considered information that had been provided by the Adviser and the relevant sub-advisers, which consisted of the following: Dix Hills Partners (“Dix Hills”), Lazard Asset Management LLC (“LAM”), Martingale Asset Management, L.P. (“Martingale”), PanAgora Asset Management LLC (“PanAgora”) and Primary Funds LLC (“Primary” and, collectively with Dix Hills, LAM, Martingale, and PanAgora, the “Sub-Advisers”). Such information had been provided throughout the year at regular Board meetings, as well as information requested by the Board and furnished by the Adviser and the Existing Sub-Advisers for the meetings of the Board held on May 19, 2011 and June 29 and 30, 2011 to specifically consider the renewal of the Fund’s investment advisory agreements. This information included, among other things, the following:
| |
§ | Information about the overall organization of the Adviser and the Adviser’s short-term and long-term business plan with respect to its mutual fund operations; |
| |
§ | The Adviser’s consolidated financial statements for the past three fiscal years; |
| |
§ | A description of the advisory and sub-advisory agreements with the Fund, their terms and the services provided thereunder; |
| |
§ | Information regarding each Sub-Adviser’s organization, personnel, investment strategies and key compliance procedures; |
| |
§ | Information concerning the Adviser’s compliance program, the resources devoted to compliance efforts undertaken by the Adviser and its affiliates on behalf of the Fund, and reports regarding a variety of compliance-related issues; |
| |
§ | An independently prepared report comparing the management fees and non-investment management expenses with respect to a representative class of shares of the Fund during its fiscal year ended December 31, 2010, with those of (i) a universe of funds with similar investment strategies, including both open-end and variable annuity funds (the “Expense Universe”) and (ii) a sub-group of the Expense Universe consisting of funds of comparable size and with comparable fee and expense structures (the “Expense Group”); |
| |
§ | An independently prepared report comparing the Fund’s annualized investment performance with respect to a representative class of shares of the Fund (including standard deviations and Sharpe ratios) for the one-, three- and five-year periods ended March 31, 2011 with those of (i) a universe of funds with similar investment strategies, including both open-end and variable annuity funds (the “Performance Universe”) and (ii) a sub-group of the Performance Universe consisting of funds of comparable size and with comparable fee and expense structures (the “Performance Group”); |
| |
§ | Additional comparative information prepared by the Adviser concerning the performance and fees and expenses of the Fund and of relevant peer funds with a management structure and investment strategies and techniques comparable to those of the Fund; |
| |
§ | Information regarding the performance results of the Fund’s sub-advisers in managing their respective portions of the Fund’s assets; |
| |
§ | An analysis of the profitability of the Adviser with respect to the services it provides to the Fund and the Van Eck complex of mutual funds as a whole; |
| |
§ | Information with respect to the brokerage practices of the Adviser and each Sub-Adviser, including the benefits received from research acquired with soft dollars, if any; and |
| |
§ | Other information provided by the Adviser and each Sub-Adviser in response to a comprehensive questionnaire prepared by independent legal counsel on behalf of the Independent Trustees. |
25
|
VAN ECK VIP MULTI-MANAGER ALTERNATIVES FUND |
| |
APPROVAL OF ADVISORY AND SUB-ADVISORY AGREEMENTS |
(continued) |
In considering whether to approve the investment advisory and sub-advisory agreements, the Board evaluated the following factors: (1) the quality, nature, cost and character of the investment management services provided by the Sub-Advisers; (2) the capabilities and background of the Sub-Advisers’ investment personnel, and the overall capabilities, experience, resources and strengths of each Sub-Adviser and its affiliates in managing investment companies and other accounts utilizing similar investment strategies; (3) the quality, nature, cost and character of the administrative and other services provided by the Adviser and its affiliates, including its services in overseeing the services provided by each Sub-Adviser; (4) the quality, nature and extent of the services performed by the Adviser in interfacing with, and monitoring the services performed by, third parties, such as the Fund’s custodian, transfer agent, sub-accounting agent and independent auditors, and the Adviser’s commitment and efforts to review the quality and pricing of third party service providers to the Fund with a view to reducing non-management expenses of the Fund; (5) the terms of the advisory and sub-advisory agreements and the reasonableness and appropriateness of the particular fee paid by the Fund for the services described therein; (6) the profits, if any, realized by the Adviser from managing the Fund, in light of the services rendered and the costs associated with providing such services; (7) the Adviser’s willingness to reduce the cost of the Fund to shareholders from time to time by means of waiving a portion of its management fees or paying expenses of the Fund or by reducing fees from time to time; (8) the services, procedures and processes used to determine the value of Fund assets, and the actions taken to monitor and test the effectiveness of such services, procedures and processes; (9) the ongoing efforts of, and resources devoted by, the Adviser with respect to the development of a comprehensive compliance program and written compliance policies and procedures, and the implementation of recommendations of independent consultants with respect to a variety of compliance issues; (10) the responsiveness of the Adviser and its affiliated companies to inquiries from, and examinations by, regulatory agencies such as the Securities and Exchange Commission; (11) the Adviser’s record of compliance with its policies and procedures; and (12) the ability of the Adviser and each Sub-Adviser to attract and retain quality professional personnel to perform a variety of investment advisory and administrative services for the Fund.
The Board considered the fact that the Adviser is managing other investment products and vehicles, including exchange-traded funds, hedge funds and separate accounts. The Board concluded that the management of these products contributes to the Adviser’s financial stability and is helpful to the Adviser in attracting and retaining quality portfolio management personnel for the Fund. In addition, the Board concluded that the Adviser has established appropriate procedures to monitor conflicts of interest involving the management of the Fund and the other products and for resolving any such conflicts of interest in a fair and equitable manner.
The performance data and the management fee and expense ratio data described below for the Fund is based on data for a representative class of shares of the Fund. The performance data is for periods on an annualized basis ended March 31, 2011, and the management fee and expense ratio data is as of the Fund’s fiscal year end of December 31, 2010.
In evaluating the investment performance of the Fund, the Board noted that the Fund’s annualized returns had outperformed those of its Performance Universe median for the one-, three- and five-year periods. The Board further noted that while the Fund’s annualized returns had underperformed those of its Performance Group median for the one-year period, the Fund’s annualized returns had outperformed those of its Performance Group median for the three- and five-year periods. The Board concluded that the performance of the Fund is satisfactory. When considering the fees and expenses of the Fund, the Board noted that the management fee and total expense ratio for the Fund, net of waivers, were higher than the median management fee and median total expense ratio for its Expense Group. The Board also noted that there are very few other mutual funds that pursue similar investment objectives utilizing alternative investment strategies in a multi-manager structure, and that the Adviser has agreed to waive or to reimburse expenses through April 2012 to the extent necessary to maintain an agreed upon expense ratio. The Board concluded that the management fee charged to the Fund for advisory, sub-advisory and related services is reasonable.
The Board noted that the Fund commenced its operations on May 1, 2003, and that the Adviser has not realized any profits with respect to the Fund since its commencement, and may not realize profits in the coming year. In view of the small asset size of the Fund and the fact that none of the Sub-Advisers is affiliated with the Adviser, the Board concluded that the profitability of the Sub-Advisers was not a relevant factor in its renewal deliberations regarding the Sub-Advisers. Similarly, the Board concluded that the Fund does not have sufficient assets for the Adviser or any Sub-Adviser to realize economies of scale for the foreseeable future, and, therefore, that the implementation of breakpoints for the Fund would not be warranted at this time.
26
The Board concluded that each of the Sub-Advisers continues to be qualified to manage the Fund’s assets in accordance with its respective investment objectives and policies, has an investment strategy that is appropriate for pursuing the Fund’s investment objectives, and has strategies that are complementary in pursuing the Fund’s investment objective.
The Board did not consider any single factor as controlling in determining whether or not to renew the investment advisory agreement. Nor are the items described herein all of the matters considered by the Board. Based on its consideration of the foregoing factors and conclusions, and such other factors and conclusions as it deemed relevant, and assisted by the advice of its independent counsel, the Board concluded that the renewal of the investment advisory agreement and each sub-advisory agreement, including its fee structure (described herein) is in the interests of shareholders, and accordingly, the Board approved the continuation of the investment advisory agreement and each sub-advisory agreement for an additional one-year period.
27
This report must be preceded or accompanied by a Van Eck VIP (the “Trust”) Prospectus, which includes more complete information. An investor should consider the investment objective, risks, and charges and expenses of the Fund carefully before investing. The prospectus contains this and other information about the investment company. Please read the prospectus carefully before investing.
Additional information about the Trust’s Board of Trustees/Officers and a description of the policies and procedures the Trust uses to determine how to vote proxies relating to portfolio securities are provided in the Statement of Additional Information. The Statement of Information and information regarding how the Trust voted proxies relating to portfolio securities during the most recent twelve month period ending June 30 is available, without charge, by calling 800.826.2333, or by visiting vaneck.com, or on the Securities and Exchange Commission’s website at http://www.sec.gov.
The Trust files its complete schedule of portfolio holdings with the Securities and Exchange Commission for the first and third quarters of each fiscal year on Form N-Q. The Trust’s Form N-Qs are available on the Commission’s website at http://www.sec.gov and may be reviewed and copied at the Commission’s Public Reference Room in Washington, D.C. Information on the operation of the Public Reference Room may be obtained by calling 202.942.8090. The Fund’s complete schedule of portfolio holdings is also available by calling 800.826.2333 or by visiting vaneck.com.

| Investment Adviser: | Van Eck Associates Corporation |
| Distributor: | Van Eck Securities Corporation
335 Madison Avenue, New York, NY 10017
vaneck.com |
| Account Assistance: | 800.544.4653 |
| | |
| vaneck.com |
VIPMMASAR
Item 2. CODE OF ETHICS.

     Not applicable.

Item 3. AUDIT COMMITTEE FINANCIAL EXPERT.

     Not applicable.

Item 4. PRINCIPAL ACCOUNTANT FEES AND SERVICES.

     Not applicable.

Item 5. AUDIT COMMITTEE OF LISTED REGISTRANTS.

     Not applicable.

Item 6. SCHEDULE OF INVESTMENTS.

     Information included in Item 1.

Item 7. DISCLOSURE OF PROXY VOTING POLICIES AND PROCEDURES FOR CLOSED-END
        MANAGEMENT INVESTMENT COMPANIES.

     Not applicable.

Item 8. PORTFOLIO MANAGER OF CLOSED-END MANAGEMENT INVESTMENT COMPANIES.

     Not applicable.

Item 9. PURCHASE OF EQUITY SECURITIES BY CLOSED-END MANAGEMENT INVESTMENT
        COMPANY AND AFFILIATED PURCHASERS.

     Not applicable.

Item 10. SUBMISSION OF MATTERS TO A VOTE OF SECURITY HOLDERS.

     No changes.

Item 11. CONTROLS AND PROCEDURES.

(a)  The Chief Executive Officer and the Chief Financial Officer have concluded
     that the Van Eck VIP Multi-Manager Alternatives Fund disclosure controls and
     procedures (as defined in Rule 30a-3(c) under the Investment Company Act)
     provide reasonable assurances that material information relating to the
     Van Eck VIP Multi-Manager Alternatives Fund is made known to them by the appropriate
     persons, based on their evaluation of these controls and procedures as of a
     date within 90 days of the filing date of this report.

(b)  There were no significant changes in the registrant's internal controls
     over financial reporting or in other factors that could significantly
     affect these controls over financial reporting subsequent to the date of
     our evaluation.


Item 12. EXHIBITS.

(a)(1) Not applicable.

(a)(2) A separate certification for each principal executive officer and
       principal financial officer of the registrant as required by Rule 30a-2
       under the Act (17 CFR 270.30a-2) is attached as Exhibit 99.CERT.

(b)  Certification pursuant to Section 906 of the Sarbanes-Oxley Act of 2002 is
     furnished as Exhibit 99.906CERT.
                                   SIGNATURES

Pursuant to the requirements of the Securities Exchange Act of 1934 and the
Investment Company Act of 1940, the registrant has duly caused this report to be
signed on its behalf by the undersigned, thereunto duly authorized.

(Registrant) VAN ECK VIP TRUST - VAN ECK VIP MULTI-MANAGER ALTERNATIVES FUND

By (Signature and Title) /s/ Bruce J. Smith, SVP & CFO
                         -----------------------------
Date  September 2, 2011
     -------------------

Pursuant to the requirements of the Securities Exchange Act of 1934 and the
Investment Company Act of 1940, this report has been signed below by the
following persons on behalf of the registrant and in the capacities and on the
dates indicated.

By (Signature and Title) /s/ Jan F. van Eck, CEO
                        --------------------------
Date   September 2, 2011
     --------------------

By (Signature and Title)  /s/ Bruce J. Smith, CFO
                         ------------------------


Date   September 2, 2011
     --------------------