|
VAN ECK VIP EMERGING MARKETS FUND |
| |
Effective May 1, 2010, the Worldwide Emerging Markets Fund was renamed the Van Eck VIP Emerging Markets Fund. The Fund’s investment objective did not change.
Dear Shareholder:
The Initial Class shares of the Van Eck VIP Emerging Markets Fund declined 3.48% for the six months ended June 30, 2010. The Fund significantly outperformed emerging markets equities in general as measured by the Fund’s benchmark index, the Morgan Stanley Capital International Emerging Markets (MSCI EM) Index1, which fell 6.04% for the same period.
We attribute the Fund’s notable outperformance on a relative basis primarily to effective individual stock selection, as well as an overweight in emerging Asia in the consumer discretionary sector relative to its benchmark index. As always, our investment process aims to capture high growth opportunities in the emerging market space. Over the course of the semi-annual period, this focus on secular growth trends—domestic consumption in particular—tilted the portfolio to the consumer discretionary sector. This tends to result in a bias toward small- and mid-capitalization companies. As of June 30, 2010, the Fund had a 15.1% weighting to the consumer discretionary sector, as compared to 6.4% for its benchmark index.
Market and Economic Review
Emerging market equities rallied to a high thus far in 2010 in mid-April, but the asset class subsequently gave back all of its first quarter gains—and more—amid recurring bouts of global risk aversion. The deterioration of the fiscal crisis in peripheral Europe, anxiety regarding the sustainability of the U.S. economic recovery, and concerns over a Chinese economic “hard landing” were the main considerations underlying lingering market turbulence. On some level, concerns regarding China were justified, as macroeconomic indicators released toward the end of the semi-annual period showed a moderation in China’s growth momentum due to monetary normalization, a gradual withdrawal of stimulatory initiatives and policy curbs on its property market. We would argue, however, that slowing monetary and fiscal policy in China is a normal response needed to manage one of the world’s fastest growing economies and should be expected by market participants as a responsible way to maintain sustainable growth over the longer term.
There is no doubt that the speed and magnitude of the global economic recovery among emerging markets has been remarkable. Yet justifiably so, questions remain about which economies will continue to lead global growth higher. It was conventional wisdom at the end of June to argue that emerging market fundamentals are better at this stage of the economic cycle than usual and, in particular, are better than those of developed economies at this point in time. These better fundamentals, in terms of current account and fiscal balances, limited any constraint on the stance of economic policies in emerging market countries during the first half of 2010 and we believe should, over time, result in better conditions to sustain growth relative to their developed market peers. It is well worth noting that the MSCI EM Index modestly outperformed the broad U.S. equity market, as measured by the S&P® 500 Index2, which declined 6.65% for the six-month period, and more significantly outpaced the developed international equity markets, as measured by the MSCI EAFE (Europe, Australasia and the Far East) Index3, which decreased 12.93%.
All that said, equity markets in all regions within the emerging markets lost ground during the first half of 2010, but with considerable variation in performance. Emerging Asia was the most resilient region with the MSCI EM Asia Index4 declining 3.80%. Its outperformance can be attributed to the southeast Asian markets of Indonesia* and Thailand*, which posted gains greater than 10% for the first half in U.S. dollar terms. China*, Hong Kong* and Taiwan* were notable detractors. The Emerging Europe, Middle East and African (EMEA) region trailed the MSCI EM Index with a 9.24% decline for the MSCI EM EMEA Index5 in U.S. dollar terms during the semi-annual period. The EMEA region’s performance was dragged lower mainly by the eastern European markets of Hungary*, Poland* and the Czech Republic*, as worsening macroeconomic fundamentals in the neighboring Eurozone negatively influenced their share prices. Russia*, Egypt* and Turkey* were the main outperformers within EMEA. Latin American equity markets overall posted the worst relative performance, with the MSCI EM Latin America Index6 declining 10.47% in U.S. dollar terms for the six-month period. Brazilian equities* were the main detractor from the region’s performance, while Colombia* and Mexico* were stronger.
From a sector* perspective, those market segments with more traditionally defensive qualities, including utilities, information technology and consumer staples, outperformed the MSCI EM Index. Consumer discretionary also outperformed. The global economically-sensitive, cyclical sectors of energy, materials and industrials lagged.
Fund Review
Contributors to the Fund’s outperformance during the six months ended June 30, 2010, included South Korea’s CJ O Shopping (1.1% of Fund net assets†). This retailer has developed a sound business model through its 24-hour home shopping television channels in its home country, and its stock performance benefited during the semi-annual period from
1
|
VAN ECK VIP EMERGING MARKETS FUND |
| |
expansion into an underpenetrated Chinese market. The Fund’s position in Mexican personal care product distributor Genomma Lab International (1.3% of Fund net assets†) also demonstrated strong price appreciation through the first half of 2010. Such outperformance was due in part to the company’s recent brand acquisitions in Mexico and to its initiatives to enter into the fast-growing Brazilian and U.S. Hispanic markets.
Detractors from the Fund’s semi-annual results included oil and gas exploration and production companies such as Brazil’s Petroleo Brasileiro (Petrobras) (0.8% of Fund net assets†) and Kazakhstan’s KazMunaiGas Exploration Production (1.4% of Fund net assets†). Concerns over global economic growth weighed on the entire energy sector, as crude oil prices ended the semi-annual period lower than where they started the year. The share price of KazMunaiGas Exploration Production was also negatively influenced by the Kazakh government’s announcement that it may introduce crude oil export duties. Petrobras’ shares were additionally under pressure stemming from uncertainties surrounding the timing and size of a proposed capital increase to support the company’s long-term investment program. Another detractor from Fund performance during the semi-annual period was Taiwan’s Ju Teng (0.7% of Fund net assets†), as this component supplier for global manufacturers of consumer electronics suffered from a weaker outlook on shipments due to order postponements.
At the end of June, the Fund maintained an overweighted position in Emerging Asia relative to the MSCI EM Index, as the region features high Gross Domestic Product (GDP) growth rates and low inflation; current account surpluses and large foreign exchange reserves; small fiscal deficits; and a sizable emerging middle class. The region’s corporate sector, in our view, also has solid fundamentals with strong earnings momentum and solid balance sheets. Perhaps most attractive about the region’s equities is that valuations were not demanding at the end of the semi-annual period.
We had a constructive view on Latin America but remained neutral in the Fund’s positioning due to region-wide tightening of monetary policy anticipated for the rest of the year. The Fund was underweight the EMEA region at the end of the semi-annual period relative to the MSCI EM Index, as macroeconomic fundamentals for nations within this region, in our view, were the least compelling within the emerging markets universe.
By sector, we continued to favor consumer discretionary-related names over the materials and energy sectors. While the Fund maintained an overweight position in information technology relative to the MSCI EM Index at the end of June, we gradually reduced the Fund’s positioning in this sector, redeploying proceeds into the health care sector. From a capitalization perspective, we maintained a bias towards small- and mid-capitalization stocks, as these companies, we believe, continue to have the greatest potential to leverage off of the strong growth in domestic consumption that attracts so many investors to the emerging market equities asset class.
* * *
Looking forward, we see the potential for a moderation in global economic growth, but a collapse in growth is not the base case for us. Risk factors ahead include the potential for downward revisions in corporate earnings estimates, although we are of the opinion that revisions overall will not be severe enough to signal an imminent earnings recession. Additionally, the prospects for downward pressure on earnings estimates appear to have already been priced into equity markets at the time of this writing. At current levels, we believe that investors are overlooking inexpensive valuations in emerging markets, especially in the context of relatively higher economic growth rates compared to developed markets, flexible exchange rates, current account surpluses and reassuring fiscal reserves.
We expect the second half of 2010 may encourage investors to be more constructive toward emerging market equities, as anxieties about the global context fade thereby allowing investors to refocus on generally positive fundamentals within the asset class. It may take time before fears seen at the end of the semi-annual period regarding a double-dip of the global economy and of a Chinese economic hard landing subside. However, we are upbeat on the prospects for emerging market economies and companies over the mid- to long-term. Near-term inflation risks have declined due to moderating food prices and lower energy prices. Also, in general, real wage increases, low per-capita consumption levels and increasing penetration of consumer credit have allowed for strong domestic demand within emerging markets. We continue to believe that this is one of the most powerful themes for emerging markets and should be a strong secular trend for the asset class for years to come. We firmly believe in the bright fundamental growth prospects for emerging markets, as overall, developing economies boast strong balance sheets at the country, household and consumer levels, favorable demographics, and an abundance of sectors with solid secular growth prospects.
You can lose money by investing in the Fund. Any investment in the Fund should be part of an overall investment program, not a complete program. The Fund is subject to the risks associated with its investments in emerging market securities, which tend to be more volatile and less liquid than securities traded in developed countries. The Fund’s investments in foreign securities involve risks related to adverse political and economic developments unique to a country or a region, currency fluctuations or controls, and the possibility of arbitrary action by foreign governments, including the takeover of
2
property without adequate compensation or imposition of prohibitive taxation. The Fund is subject to risks associated with investments in debt securities, derivatives, commodity-linked instruments, illiquid securities, asset-backed securities, CMOs and small or mid-cap companies. The Fund is also subject to inflation risk, short-sales risk, market risk, nondiversification risk and leverage risk. Please see the prospectus for information on these and other risk considerations.
We thoroughly appreciate your participation in the Van Eck VIP Emerging Markets Fund, and we look forward to helping you meet your investment goals in the future.
| | | | |

| | 
| | 
|
|

| | 
| | 
|
|
David A. Semple | | Edward M. Kuczma | | Angus Shillington |
Portfolio Manager | | | | |
| | | | |
July 16, 2010 | | | | |
| |
* | All regional and market returns are in U.S. dollar terms (unless otherwise specified), are based on country-specific stock market indices and reflect the reinvestment of any dividends if applicable. All sector returns referenced are also in U.S. dollar terms. |
| |
† | All Fund assets referenced are Total Net Assets as of June 30, 2010 |
The performance quoted represents past performance. Past performance does not guarantee future results; current performance may be lower or higher than the performance data quoted. Investment return and value of shares of the Fund will fluctuate so that an investor’s shares, when redeemed, may be worth more or less than their original cost. Performance information reflects temporary waivers of expenses and/or fees. Had the Fund incurred all expenses, investment returns would have been reduced. NAV returns assume that dividends and capital gains distributions have been reinvested in the Fund at NAV. Index returns assume that dividends of the Index constituents in the Index have been reinvested. These returns do not reflect the deduction of taxes that a shareholder would pay on Fund dividends and distributions or the redemption of Fund shares. Performance information current to the most recent month end is available by calling 1.800.826.2333 or by visiting vaneck.com.
The Fund is only available to life insurance and annuity companies to fund their variable annuity and variable life insurance products. These contracts offer life insurance and tax benefits to the beneficial owners of the Fund. Your insurance or annuity company’s charges, fees and expenses for these benefits are not reflected in this report or in the Fund’s performance, since they are not direct expenses of the Fund. Had these fees been included, returns would have been lower. For insurance products, performance figures do not reflect the cost for insurance and if they did, the performance shown would be significantly lower. A review of your particular life and/or annuity contract will provide you with much greater detail regarding these costs and benefits.
All indices listed are unmanaged indices and include the reinvestment of all dividends, but do not reflect the payment of transaction costs, advisory fees or expenses that are associated with an investment in the Fund. An index’s performance is not illustrative of the Fund’s performance. Indices are not securities in which investments can be made.
| |
1 | The Morgan Stanley Capital International Emerging Markets Index (MSCI EM) is calculated with dividends reinvested. The Index captures 60% of the publicly traded equities in each industry for approximately 25 emerging markets. |
| |
2 | The S&P® 500 Index consists of 500 widely held common stocks covering industrial, utility, financial and transportation sectors. |
| |
3 | The MSCI EAFE Index is an unmanaged capitalization-weighted index containing approximately 1,100 equity securities of companies located in Europe, Australasia and the Far East. |
| |
4 | The MSCI EM Asia Index is a free float-adjusted market capitalization index that is designed to measure equity market performance in the emerging market countries of Asia. |
| |
5 | The MSCI EM EMEA (Emerging Europe, Middle East and Africa) Index is a free float-adjusted market capitalization index that is designed to measure equity market performance in the emerging market countries of Europe, the Middle East & Africa. |
| |
6 | The MSCI EM Latin America Index is a free float-adjusted market capitalization index that is designed to measure equity market performance in Latin America. |
3
|
VAN ECK VIP EMERGING MARKETS FUND |
| |
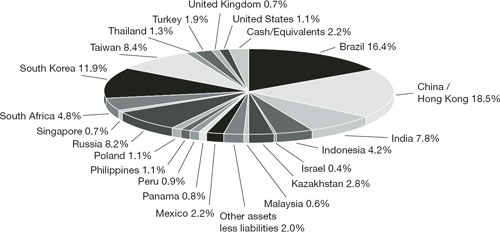
Geographical Weightings*
(unaudited)
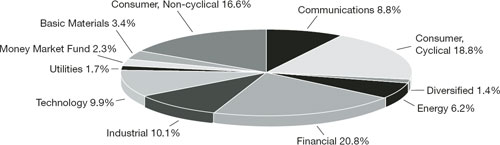
Sector Weightings**
(unaudited)
| |
As of June 30, 2010. |
|
* | Percentage of net assets. |
| |
** | Percentage of investments. |
| |
Portfolio subject to change. |
4
|
VAN ECK VIP EMERGING MARKETS FUND |
| |
TOP TEN EQUITY HOLDINGS* |
June 30, 2010 (unaudited) |
|
Localiza Rent a Car S.A.
(Brazil, 2.2%)
Localiza Rent a Car rents automobiles. The company owns and franchises locations in Brazil and elsewhere in Latin America. Localiza primarily operates through airport locations. The company also sells used cars and offers fleet management services.
Lotte Shopping Co., Ltd.
(South Korea, 2.2%)
Lotte Shopping operates department stores and discount stores in South Korea. The company retails clothing, household goods, foods and other items through several branches. Lotte Shopping also operates movie theaters and Krispy Kreme Doughnuts chains.
SJM Holdings Ltd.
(Hong Kong, 2.1%)
SJM offers amusement and recreation services. The company operates casinos, hotels and other tourism-related facilities in Macau.
Tencent Holdings Ltd.
(China, 2.1%)
Tencent provides Internet, mobile and telecommunication value-added services in China. The company has an instant messaging community in China and provides online advertising and gaming services.
BR Malls Participacoes S.A.
(Brazil, 2.0%)
BR Malls is a shopping mall service provider; managing, consulting and leasing services for shopping centers and commercial and business centers throughout Brazil.
Hyundai Mobis Co. Ltd.
(South Korea, 2.0%)
Hyundai Mobis manufactures and markets automotive parts and equipment, such as automotive service components, modules and systems. The company also contracts environmental projects, including sewage treatment plant and industrial waste water treatment plant construction.
Naspers Ltd.
(South Africa, 2.0%)
Naspers is a holding company for a group of companies which operate in the electronic and print media industries. The company provides television subscription and internet services and publishes newspapers, magazines and books.
Cia Vale do Rio Doce (CVRD)
(Brazil, 1.9%)
CVRD produces and sells iron ore, pellets, manganese, iron alloys, gold, kaolin, bauxite, alumina, aluminum and potash. The company owns stakes in several steel companies. CVRD also owns and operates railroads and maritime terminals in Brazil.
Anhanguera Educacional Participacoes S.A.
(Brazil, 1.9%)
Anhanguera is a group of universities offering undergraduate and graduate studies in Sao Paulo. The school offers courses in business administration, law, engineering, psychology, physiotherapy and other subjects
Diagnosticos da America S.A.
(Brazil, 1.8%)
DASA specializes in diagnostic medicine and preventive health. The company provides services to patients in the area of clinical analysis, specialized tests and image diagnosis with locations in Sao Paulo, Rio de Janeiro and Parana, Brazil.
| | |
| | |
* | Percentage of net assets. Portfolio is subject to change. |
| |
| Company descriptions courtesy of Bloomberg.com. |
5
|
VAN ECK VIP EMERGING MARKETS FUND |
| |
EXPLANATION OF EXPENSES |
(unaudited) |
As a shareholder of the Fund, you incur two types of costs: (1) transaction costs, including program fees on purchase payments; and (2) ongoing costs, including management fees and other Fund expenses. This disclosure is intended to help you understand your ongoing costs (in dollars) of investing in the Fund and to compare these costs with the ongoing costs of investing in other mutual funds.
The disclosure is based on an investment of $1,000 invested at the beginning of the period and held for the entire period, January 1, 2010 to June 30, 2010.
Actual Expenses
The first line in the table below provides information about account values and actual expenses. You may use the information in this line, together with the amount you invested, to estimate the expenses that you paid over the period. Simply divide your account value by $1,000 (for example, an $8,600 account value divided by $1,000 = 8.6), then multiply the result by the number in the first line under the heading entitled “Expenses Paid During Period”.
Hypothetical Example for Comparison Purposes
The second line in the table below provides information about hypothetical account values and hypothetical expenses based on the Fund’s actual expense ratio and an assumed rate of return of 5% per year before expenses, which is not the Fund’s actual return. The hypothetical account values and expenses may not be used to estimate the actual ending account balance or expenses you paid for the period. You may use this information to compare the ongoing costs of investing in the Fund and other funds. To do so, compare this 5% hypothetical example with the 5% hypothetical examples that appear in the shareholder reports of other funds.
Please note that the expenses shown in the table are meant to highlight your ongoing costs only and do not reflect any transactional costs, such as fees on purchase payments. Therefore, the second line of the table is useful in comparing ongoing costs only, and will not help you determine the relative costs of owning different funds. In addition, if these transactional costs were included, your costs would have been higher.
| | | | | | | | | | | | |
| | | | Beginning
Account Value
January 1, 2010 | | Ending
Account Value
June 30, 2010 | | Expenses Paid
During Period*
January 1, 2010-
June 30, 2010 | |
| | | | | | | | | | |
Initial Class | | Actual | | $1,000.00 | | | $ | 965.20 | | | $6.19 | |
| | Hypothetical** | | $1,000.00 | | | $ | 1,018.50 | | | $6.36 | |
| | | | | | | | | | | | | |
Class R1 | | Actual | | $1,000.00 | | | $ | 965.20 | | | $6.24 | |
| | Hypothetical** | | $1,000.00 | | | $ | 1,018.45 | | | $6.41 | |
| | | | | | | | | | | | | |
| |
* | Expenses are equal to the Fund’s annualized expense ratio (for the six months ended June 30, 2010), of 1.27% on Initial Class Shares, and 1.28% on Class R1 Shares, multiplied by the average account value over the period, multiplied by 181 and divided by 365 (to reflect the one-half year period). |
| |
** | Assumes annual return of 5% before expenses. |
6
|
VAN ECK VIP EMERGING MARKETS FUND |
| |
SCHEDULE OF INVESTMENTS |
June 30, 2010 (unaudited) |
| | | | | | | |
Number of
Shares | | | | Value | |
| | | | | | |
COMMON STOCKS: 91.0% | | | | |
Brazil: 11.6% | | | | |
| 281,000 | | BR Malls Participacoes S.A. | | $ | 3,692,698 | |
| 80,400 | | Cia Hering S.A. | | | 2,093,518 | |
| 155,000 | | Cielo S.A. | | | 1,317,285 | |
| 336,000 | | Diagnosticos da America S.A. | | | 3,160,820 | |
| 69,000 | | Drogasil S.A. | | | 1,318,836 | |
| 120,000 | | Hypermarcas S.A. * | | | 1,539,058 | |
| 350,000 | | Localiza Rent a Car S.A. | | | 4,027,424 | |
| 106,000 | | Marisa Lojas S.A. * | | | 1,219,147 | |
| 40,000 | | Petroleo Brasileiro S.A. (ADR) | | | 1,372,800 | |
| 21,000 | | Totvs S.A. | | | 1,539,690 | |
| | | | | | | |
| | | | | | 21,281,276 | |
| | | | | | | |
China / Hong Kong: 18.5% | | | | |
| 50,000 | | AsiaInfo Holdings, Inc. (USD) * | | | 1,093,000 | |
| 1,990,000 | | China High Precision Automation Group Ltd. * # | | | 1,147,798 | |
| 2,960,000 | | EVA Precision Industrial Holdings Ltd. # | | | 1,382,523 | |
| 1,390,000 | | Fu Ji Food & Catering Services Holdings Ltd. * # | | | — | |
| 2,210,000 | | Fushan International Energy Group Ltd. # | | | 1,241,865 | |
| 63,000 | | Home Inns & Hotels Management, Inc. (ADR) * | | | 2,459,520 | |
| 2,146,000 | | Ju Teng International Holdings Ltd. # | | | 1,317,423 | |
| 695,000 | | Lianhua Supermarket Holdings Co. Ltd. # | | | 2,545,792 | |
| 528,000 | | L’Occitane International S.A. * (b) | | | 1,151,349 | |
| 1,448,181 | | Noble Group Ltd. (SGD) # | | | 1,750,395 | |
| 2,885,000 | | Pacific Basin Shipping Ltd. # | | | 1,785,339 | |
| 3,414,000 | | Peace Mark Holdings Ltd. * # | | | — | |
| 615,000 | | Ports Design Ltd. # | | | 1,564,240 | |
| 9,822,490 | | Qin Jia Yuan Media Services Co. Ltd. # | | | 1,640,084 | |
| 16,080,000 | | REXLot Holdings Ltd. # | | | 1,471,598 | |
| 4,675,000 | | SJM Holdings Ltd. # | | | 3,915,346 | |
| 4,370,000 | | Soho China Ltd. # | | | 2,528,833 | |
| 227,500 | | Tencent Holdings Ltd. # | | | 3,769,049 | |
| 1,029,200 | | Tian An China Investment Co. Ltd. # | | | 657,098 | |
| 204,000 | | Tsingtao Brewery Co. Ltd. # | | | 952,982 | |
| 720,000 | | Yanzhou Coal Mining Co. Ltd. # | | | 1,384,441 | |
| | | | | | | |
| | | | | | 33,758,675 | |
| | | | | | | |
India: 7.8% | | | | |
| 350,000 | | Crompton Greaves Ltd. # | | | 1,932,286 | |
| 75,000 | | Financial Technologies India Ltd. # | | | 2,141,738 | |
| 1,282,400 | | Hirco PLC (GBP) * # | | | 2,577,923 | |
| 195,000 | | Housing Development & Infrastructure Ltd. * # | | | 1,036,316 | |
| 125,000 | | Mundra Port & Special Economic Zone Ltd. # | | | 1,971,707 | |
| 539,000 | | Rolta India Ltd. # | | | 1,928,656 | |
| 210,769 | | Shriram Transport Finance Co. Ltd. # | | | 2,597,416 | |
| | | | | | | |
| | | | | | 14,186,042 | |
| | | | | | | |
| | | | | | | |
Indonesia: 4.2% | | | | |
| 8,000,000 | | Adaro Energy Tbk PT # | | | 1,737,635 | |
| 11,000,000 | | Bank Tabungan Negara Tbk PT # | | | 2,041,440 | |
| 8,000,000 | | Mitra Adiperkasa Tbk PT * # | | | 579,025 | |
| 3,375,000 | | Perusahaan Gas Negara PT # | | | 1,430,731 | |
| 1,770,000 | | PT Bank Rakyat Indonesia Tbk # | | | 1,797,008 | |
| | | | | | | |
| | | | | | 7,585,839 | |
| | | | | | | |
Israel: 0.4% | | | | |
| 182,500 | | Queenco Leisure International Ltd. (GDR) * R (a) | | | 757,818 | |
| | | | | | | |
See Notes to Financial Statements
7
|
VAN ECK VIP EMERGING MARKETS FUND |
| |
SCHEDULE OF INVESTMENTS |
(continued) |
| | | | | | | |
Number of
Shares | | | | Value | |
| | | | | | |
Kazakhstan: 2.8% | | | | |
| 108,350 | | Eurasian Natural Resources Corp. (GBP) # | | $ | 1,378,739 | |
| 136,000 | | Halyk Savings Bank of Kazakhstan (GDR) * # Reg S | | | 1,065,975 | |
| 60,000 | | Kazakhstan Kagazy PLC (GDR) * (a) | | | 11,400 | |
| 510,300 | | Kazakhstan Kagazy PLC (GDR) * R (a) | | | 96,957 | |
| 140,000 | | KazMunaiGas Exploration (GDR) # Reg S | | | 2,579,065 | |
| | | | | | | |
| | | | | | 5,132,136 | |
| | | | | | | |
Malaysia: 0.6% |
| 1,235,400 | | CB Industrial Product Holding BHD # | | | 1,009,946 | |
| | | | | | | |
Mexico: 2.2% | | | | |
| 328,700 | | Banco Compartamos, S.A. de C.V. | | | 1,708,430 | |
| 713,600 | | Genomma Lab Internacional, S.A. de C.V. * | | | 2,369,829 | |
| | | | | | | |
| | | | | | 4,078,259 | |
| | | | | | | |
Panama: 0.8% | | | | |
| 34,500 | | Copa Holdings S.A. (Class A) (USD) | | | 1,525,590 | |
| | | | | | | |
Peru: 0.9% | | | | |
| 18,900 | | Credicorp Ltd. (USD) | | | 1,717,821 | |
| | | | | | | |
Philippines: 1.1% | | | | |
| 5,800,000 | | Alliance Global Group, Inc. * # | | | 665,612 | |
| 37,250,000 | | Megaworld Corp. # | | | 1,088,195 | |
| 19,400,000 | | Megaworld Corp. Warrants (PHP 1.00, expiring 12/14/14) * # | | | 246,921 | |
| | | | | | | |
| | | | | | 2,000,728 | |
| | | | | | | |
Poland: 1.1% | | | | |
| 710,000 | | International Personal Finance PLC (GBP) # | | | 2,008,255 | |
| | | | | | | |
Russia: 8.2% | | | | |
| 223,000 | | Globaltrans Investment PLC (GDR) # Reg S | | | 3,114,914 | |
| 55,000 | | Lukoil (ADR) | | | 2,832,500 | |
| 182,000 | | Novorossiysk Sea Trade Port (GDR) * # Reg S | | | 1,971,112 | |
| 31,300,000 | | OGK-3 OJSC * (b) | | | 1,665,623 | |
| 81,000 | | Pharmstandard (GDR) * # Reg S | | | 1,763,134 | |
| 797,000 | | Sberbank RF | | | 1,914,831 | |
| 49,000 | | X5 Retail Group N.V. (GDR) * # | | | 1,668,650 | |
| | | | | | | |
| | | | | | 14,930,764 | |
| | | | | | | |
Singapore: 0.7% | | | | |
| 2,110,000 | | CSE Global Ltd. # | | | 1,312,380 | |
| | | | | | | |
South Africa: 4.8% | | | | |
| 55,000 | | African Rainbow Minerals Ltd. # | | | 1,150,839 | |
| 105,000 | | Naspers Ltd. # | | | 3,535,926 | |
| 240,000 | | Spar Group Ltd. # | | | 2,490,410 | |
| 126,114 | | Standard Bank Group Ltd. # | | | 1,672,408 | |
| | | | | | | |
| | | | | | 8,849,583 | |
| | | | | | | |
| | | | | | | |
South Korea: 11.9% | | | | |
| 174,500 | | Cheil Worldwide, Inc. # | | | 1,825,285 | |
| 25,400 | | CJ O Home Shopping Co. Ltd. * # | | | 2,038,258 | |
| 21,800 | | Hyundai Mobis Co. Ltd. # | | | 3,656,394 | |
| 13,800 | | Lotte Shopping Co. # | | | 3,962,621 | |
| 36,000 | | Samsung Card Co. # | | | 1,453,889 | |
| 3,600 | | Samsung Electronics Co. Ltd. # | | | 2,257,971 | |
| 13,700 | | Samsung Techwin Co. Ltd. # | | | 1,175,361 | |
| 6,500 | | Shinsegae Co. Ltd. # | | | 2,808,481 | |
| 122,000 | | Woongjin Thinkbig Co. Ltd. # | | | 2,520,354 | |
| | | | | | | |
| | | | | | 21,698,614 | |
| | | | | | | |
See Notes to Financial Statements
8
|
| |
SCHEDULE OF INVESTMENTS |
(continued) |
| | | | | | | |
Number of
Shares | | | | Value | |
| | | | | | |
Taiwan: 8.4% | | | | |
| 1,735,000 | | Advanced Semiconductor Engineering, Inc. # | | $ | 1,366,085 | |
| 1,700,000 | | Alpha Networks, Inc. # | | | 1,299,343 | |
| 620,000 | | China Ecotek Corp. # | | | 910,675 | |
| 905,000 | | Faraday Technology Corp. # | | | 1,392,758 | |
| 548,000 | | Hon Hai Precision Industry Co. Ltd. * # | | | 1,920,834 | |
| 75,000 | | Largan Precision Co. Ltd. # | | | 1,193,056 | |
| 285,700 | | Lumax International Corp. Ltd. # | | | 460,771 | |
| 559,000 | | Novatek Microelectronics Corp. Ltd. # | | | 1,500,149 | |
| 335,000 | | Powertech Technology, Inc. # | | | 930,134 | |
| 780,000 | | President Chain Store Corp. # | | | 2,301,833 | |
| 225,000 | | Simplo Technology Co. Ltd. # | | | 1,219,435 | |
| 649,213 | | Wistron Corp. # | | | 951,318 | |
| | | | | | | |
| | | | | | 15,446,391 | |
| | | | | | | |
Thailand: 1.3% | | | | |
| 2,650,000 | | Tisco Financial Group PCL # | | | 2,331,253 | |
| | | | | | | |
Turkey: 1.9% | | | | |
| 48,000 | | BIM Birlesik Magazalar A.S. # | | | 1,330,349 | |
| 897,085 | | Sinpas Gayrimenkul Yatirim Ortakligi A.S. * # | | | 1,068,595 | |
| 253,000 | | Turkiye Garanti Bankasi A.S. # | | | 1,052,893 | |
| | | | | | | |
| | | | | | 3,451,837 | |
| | | | | | | |
United Kingdom: 0.7% | | | | |
| 50,000 | | Standard Chartered PLC # | | | 1,217,521 | |
| | | | | | | |
United States: 1.1% | | | | |
| 95,000 | | First Cash Financial Services, Inc. * | | | 2,071,000 | |
| | | | | | | |
Total Common Stocks
(Cost: $148,613,192) | | | 166,351,728 | |
| | | | | | | |
PREFERRED STOCKS: 4.8% | | | | |
Brazil: 4.8% | | | | |
| 230,000 | | Anhanguera Educacional Participacoes S.A. | | | 3,440,443 | |
| 163,064 | | Cia Vale do Rio Doce | | | 3,450,995 | |
| 250,000 | | Rossi Residencial S.A. | | | 1,826,870 | |
| | | | | | | |
Total Preferred Stocks
(Cost: $4,887,465) | | | 8,718,308 | |
| | | | | | | |
MONEY MARKET FUND: 2.2%
(Cost: $4,064,083) | | | | |
| 4,064,083 | | AIM Treasury Portfolio - Institutional Class | | | 4,064,083 | |
| | | | | | | |
Total Investments: 98.0%
(Cost: $157,564,740) | | | 179,134,119 | |
Other assets less liabilities: 2.0% | | | 3,739,998 | |
| | | | |
NET ASSETS: 100.0% | | $ | 182,874,117 | |
| | | | |
| |
| | |
ADR — American Depositary Receipt |
GBP — British Pound |
GDR — Global Depositary Receipt |
PHP — Philippine Peso |
SGD — Singapore Dollar |
USD — United States Dollar |
| | |
| | |
* | Non-income producing |
(a) | Illiquid Security — the aggregate value of illiquid securities is $866,175 which represents 0.5% of net assets. |
(b) | Affiliated issuer—as defined under the Investment Company Act of 1940. |
# | Indicates a fair valued security which has not been valued utilizing an independent quote, but has been valued pursuant to guidelines established by the Board of Trustees. The aggregate value of fair valued securities is $123,694,783 which represents 67.6% of net assets. |
R | Security exempt from registration under Rule 144A of the Securities Act of 1933, as amended, or otherwise restricted. These securities may be resold in transactions exempt from registration, unless otherwise noted, and the value amounted to $854,775, or 0.5% of net assets. |
Reg S | Security was purchased pursuant to Regulation S under the Securities Act of 1933, which exempts from registration securities offered and sold outside of the United States. Such a security cannot be sold in the United States without either an effective registration statement filed pursuant to the Securities Act of 1933, or pursuant to an exemption from registration. |
See Notes to Financial Statements
9
|
VAN ECK VIP EMERGING MARKETS FUND |
| |
SCHEDULE OF INVESTMENTS |
(continued) |
|
Restricted securities held by the Fund are as follows: |
| | | | | | | | | | | | | | |
Security | | | Acquisition
Date | | Number
of Shares | | Acquisition
Cost | | Value | | % of
Net Assets |
| | | | | | | | | | | | |
Kazakhstan Kagazy PLC (GDR) (a) | | 7/19/2007 | | 510,300 | | $ | 2,551,500 | | $ | 96,957 | | 0.1 | % |
Queenco Leisure International Ltd. (GDR) (a) | | 7/3/2007 | | 182,500 | | | 3,481,828 | | | 757,818 | | 0.4 | |
| | | | | | | | | | | | | |
| | | | | | $ | 6,033,328 | | $ | 854,775 | | 0.5 | % |
| | | | | | | | | | | | | |
A summary of the Fund’s transactions in securities of affiliates for the period ended June 30, 2010 is set forth below:
| | | | | | | | | | | | | | | | | | | |
Affiliates | | | Value
12/31/09 | | Purchases | | Sales
Proceeds | | Gain
(Loss) | | Dividend
Income | | Market Value
6/30/10 |
| | | | | | | | | | | | | | |
L’Occitane International S.A. | | $ | — | | $ | 1,084,687 | | $ | — | | $ | — | | $ | — | | $ | 1,151,349 |
OGK-3 OJSC | | | — | | | 2,190,230 | | | — | | | — | | | — | | | 1,665,623 |
| | | | | | | | | | | | | | | | | | |
Total | | $ | — | | $ | 3,274,917 | | $ | — | | $ | — | | $ | — | | $ | 2,816,972 |
| | | | | | | | | | | | | | | | | | |
| | | | | | | | | | | | | | |
Summary of Investments
by Sector (unaudited) | | | | | | % of
Investments | | | | | Value | |
| | | | | | | | | | | | | |
Basic Materials | | | | | | 3.4 | % | | | | $ | 6,088,930 | |
Communications | | | | | | 8.8 | | | | | | 15,683,041 | |
Consumer, Cyclical | | | | | | 18.8 | | | | | | 33,743,225 | |
Consumer, Non-cyclical | | | | | | 16.6 | | | | | | 29,729,233 | |
Diversified | | | | | | 1.4 | | | | | | 2,416,007 | |
Energy | | | | | | 6.2 | | | | | | 11,148,306 | |
Financial | | | | | | 20.8 | | | | | | 37,302,590 | |
Industrial | | | | | | 10.1 | | | | | | 18,048,689 | |
Technology | | | | | | 9.9 | | | | | | 17,813,661 | |
Utilities | | | | | | 1.7 | | | | | | 3,096,354 | |
Money Market Fund | | | | | | 2.3 | | | | | | 4,064,083 | |
| | | | | | | | | | | | | |
| | | | | | 100.0 | % | | | | $ | 179,134,119 | |
| | | | | | | | | | | | | |
| | | | | | | | | | | | | |
The summary of inputs used to value investments as of June 30, 2010 is as follows: |
| | | | | | | | | | | | | |
| | Level 1
Quoted
Prices | | Level 2
Significant
Observable
Inputs | | Level 3
Significant
Unobservable
Inputs | | Value | |
| | | | | | | | | |
Common Stocks: | | | | | | | | | | | | | |
Brazil | | $ | 21,281,276 | | $ | — | | $ | — | | $ | 21,281,276 | |
China / Hong Kong | | | 4,703,869 | | | 29,054,806 | | | — | | | 33,758,675 | |
India | | | — | | | 14,186,042 | | | — | | | 14,186,042 | |
Indonesia | | | — | | | 7,585,839 | | | — | | | 7,585,839 | |
Israel | | | 757,818 | | | — | | | — | | | 757,818 | |
Kazakhstan | | | 108,357 | | | 5,023,779 | | | — | | | 5,132,136 | |
Malaysia | | | — | | | 1,009,946 | | | — | | | 1,009,946 | |
Mexico | | | 4,078,259 | | | — | | | — | | | 4,078,259 | |
Panama | | | 1,525,590 | | | — | | | — | | | 1,525,590 | |
Peru | | | 1,717,821 | | | — | | | — | | | 1,717,821 | |
Philippines | | | — | | | 2,000,728 | | | — | | | 2,000,728 | |
Poland | | | — | | | 2,008,255 | | | — | | | 2,008,255 | |
Russia | | | 6,412,955 | | | 8,517,809 | | | — | | | 14,930,764 | |
Singapore | | | — | | | 1,312,380 | | | — | | | 1,312,380 | |
South Africa | | | — | | | 8,849,583 | | | — | | | 8,849,583 | |
South Korea | | | — | | | 21,698,614 | | | — | | | 21,698,614 | |
Taiwan | | | — | | | 15,446,391 | | | — | | | 15,446,391 | |
Thailand | | | — | | | 2,331,253 | | | — | | | 2,331,253 | |
Turkey | | | — | | | 3,451,837 | | | — | | | 3,451,837 | |
United Kingdom | | | — | | | 1,217,521 | | | — | | | 1,217,521 | |
United States | | | 2,071,000 | | | — | | | — | | | 2,071,000 | |
| | | | | | | | | | | | | |
Preferred Stocks: | | | | | | | | | | | | | |
Brazil | | | 8,718,308 | | | — | | | — | | | 8,718,308 | |
| | | | | | | | | | | | | |
Money Market Fund | | | 4,064,083 | | | — | | | — | | | 4,064,083 | |
| | | | | | | | | | | | | |
Total | | $ | 55,439,336 | | $ | 123,694,783 | | $ | — | | $ | 179,134,119 | |
| | | | | | | | | | | | | |
See Notes to Financial Statements
10
|
VAN ECK VIP EMERGING MARKETS FUND |
| |
STATEMENT OF ASSETS AND LIABILITIES |
June 30, 2010 (unaudited) |
| | | |
Assets: | | | |
Investments, at value (Cost: $157,564,740) | | $179,134,119 | |
Cash | | 10,196 | |
Foreign currency (Cost: $1,180,409) | | 1,181,944 | |
Receivables: | | | |
Investments sold | | 3,640,497 | |
Shares of beneficial interest sold | | 173 | |
Dividends and interest | | 398,350 | |
| | | |
Total assets | | 184,365,279 | |
| | | |
| | | |
Liabilities: | | | |
Payables: | | | |
Investments purchased | | 727,552 | |
Shares of beneficial interest redeemed | | 297,885 | |
Due to Adviser | | 153,380 | |
Deferred Trustee Fees | | 45,991 | |
Accrued expenses | | 266,354 | |
| | | |
Total liabilities | | 1,491,162 | |
| | | |
NET ASSETS | | $182,874,117 | |
| | | |
| | | |
Initial Class Shares: | | | |
Net Assets | | $136,335,265 | |
| | | |
Shares of beneficial interest outstanding | | 12,669,119 | |
| | | |
Net asset value, redemption and offering price per share | | $10.76 | |
| | | |
| | | |
Class R1 Shares: | | | |
Net Assets | | $46,538,852 | |
| | | |
Shares of beneficial interest outstanding | | 4,328,275 | |
| | | |
Net asset value, redemption and offering price per share | | $10.75 | |
| | | |
| | | |
Net Assets consist of: | | | |
Aggregate paid in capital | | $193,628,604 | |
Net unrealized appreciation | | 21,388,408 | |
Distributions in excess of net investment income | | (1,043,394 | ) |
Accumulated net realized loss | | (31,099,501 | ) |
| | | |
| | $182,874,117 | |
| | | |
See Notes to Financial Statements
11
|
VAN ECK VIP EMERGING MARKETS FUND |
| |
STATEMENT OF OPERATIONS |
Six Months Ended June 30, 2010 (unaudited) |
| | | | | | | |
Income: | | | | | | | |
Dividends (net of foreign taxes withheld of $152,473) | | | | | $ | 1,822,843 | |
Interest | | | | | | 435 | |
| | | | | | | |
Total income | | | | | | 1,823,278 | |
| | | | | | | |
| | | | | | | |
Expenses: | | | | | | | |
Management fees | | $ | 1,027,785 | | | | |
Custodian fees | | | 178,953 | | | | |
Professional fees | | | 17,720 | | | | |
Insurance | | | 3,058 | | | | |
Trustees’ fees and expenses | | | 6,837 | | | | |
Report to shareholders | | | 50,375 | | | | |
Transfer agent fees – Initial Class Shares | | | 13,540 | | | | |
Transfer agent fees – R1 Class Shares | | | 6,939 | | | | |
Interest | | | 954 | | | | |
Other | | | 3,589 | | | | |
| | | | | | | |
Total expenses | | | | | | 1,309,750 | |
| | | | | | | |
Net investment income | | | | | | 513,528 | |
| | | | | | | |
| | | | | | | |
Net realized gain (loss) on: | | | | | | | |
Investments (net of foreign taxes of $179,555) | | | | | | 25,493,940 | |
Forward foreign currency contracts and foreign currency transactions | | | | | | (459,491 | ) |
| | | | | | | |
Net realized gain | | | | | | 25,034,449 | |
| | | | | | | |
| | | | | | | |
Change in net unrealized appreciation (depreciation) on: | | | | | | | |
Investments (net of foreign taxes of $182,521) | | | | | | (33,347,390 | ) |
Foreign denominated assets and liabilities and forward foreign currency contracts | | | | | | 372,345 | |
| | | | | | | |
Change in net unrealized appreciation (depreciation) | | | | | | (32,975,045 | ) |
| | | | | | | |
Net Decrease in Net Assets Resulting from Operations | | | | | $ | (7,427,068 | ) |
| | | | | | | |
See Notes to Financial Statements
12
|
VAN ECK VIP EMERGING MARKETS FUND |
| |
STATEMENT OF CHANGES IN NET ASSETS |
| | | | | | | | |
| | Six Months
Ended
June 30,
2010 | | Year Ended
December 31,
2009 | |
| | | | | |
| | (unaudited) | | | |
Operations: | | | | | | | |
Net investment income | | $ | 513,528 | | $ | 766,599 | |
Net realized gain (loss) | | | 25,034,449 | | | (36,341,444 | ) |
Net increase from payment from Adviser (see Note 11) | | | — | | | 774,938 | |
Change in net unrealized appreciation (depreciation) | | | (32,975,045 | ) | | 149,969,780 | |
| | | | | | | |
Net increase (decrease) in net assets resulting from operations | | | (7,427,068 | ) | | 115,169,873 | |
| | | | | | | |
| | | | | | | |
Dividends and distributions to shareholders: | | | | | | | |
Dividends from net investment income | | | | | | | |
Initial Class Shares | | | (1,000,363 | ) | | (177,910 | ) |
Class R1 Shares | | | (349,298 | ) | | (59,012 | ) |
| | | | | | | |
| | | (1,349,661 | ) | | (236,922 | ) |
| | | | | | | |
Distributions from net realized capital gains | | | | | | | |
Initial Class Shares | | | — | | | (7,192,696 | ) |
Class R1 Shares | | | — | | | (2,385,762 | ) |
| | | | | | | |
| | | — | | | (9,578,458 | ) |
| | | | | | | |
Total dividends and distributions | | | (1,349,661 | ) | | (9,815,380 | ) |
| | | | | | | |
| | | | | | | |
Share transactions*: | | | | | | | |
Proceeds from sales of shares | | | | | | | |
Initial Class Shares | | | 15,195,534 | | | 67,892,635 | |
Class R1 Shares | | | 3,864,260 | | | 18,442,001 | |
| | | | | | | |
| | | 19,059,794 | | | 86,334,636 | |
| | | | | | | |
Reinvestment of dividends and distributions | | | | | | | |
Initial Class Shares | | | 1,000,363 | | | 7,370,606 | |
Class R1 Shares | | | 349,298 | | | 2,444,774 | |
| | | | | | | |
| | | 1,349,661 | | | 9,815,380 | |
| | | | | | | |
Cost of shares redeemed | | | | | | | |
Initial Class Shares | | | (40,356,831 | ) | | (63,150,220 | ) |
Class R1 Shares | | | (14,637,181 | ) | | (13,850,846 | ) |
Redemption fees | | | 11,566 | | | 30,549 | |
| | | | | | | |
| | | (54,982,446 | ) | | (76,970,517 | ) |
| | | | | | | |
Net increase (decrease) in net assets resulting from share transactions | | | (34,572,991 | ) | | 19,179,499 | |
| | | | | | | |
Total increase (decrease) in net assets | | | (43,349,720 | ) | | 124,533,992 | |
| | | | | | | |
Net Assets: | | | | | | | |
Beginning of period | | | 226,223,837 | | | 101,689,845 | |
| | | | | | | |
End of period (including distributions in excess of net investment income of ($1,043,394) and ($207,261), respectively) | | $ | 182,874,117 | | $ | 226,223,837 | |
| | | | | | | |
| | | | | | | |
* Shares of beneficial interest issued, reinvested and redeemed (unlimited number of $.001 par value shares authorized): | | | | | | | |
|
Initial Class Shares: | | | | | | | |
Shares sold | | | 1,366,235 | | | 8,017,278 | |
Shares reinvested | | | 95,001 | | | 1,489,012 | |
Shares redeemed | | | (3,676,236 | ) | | (7,632,175 | ) |
| | | | | | | |
Net increase (decrease) | | | (2,215,000 | ) | | 1,874,115 | |
| | | | | | | |
| | | | | | | |
Class R1 Shares: | | | | | | | |
Shares sold | | | 350,136 | | | 2,195,834 | |
Shares reinvested | | | 33,203 | | | 494,893 | |
Shares redeemed | | | (1,340,156 | ) | | (1,685,412 | ) |
| | | | | | | |
Net increase (decrease) | | | (956,817 | ) | | 1,005,315 | |
| | | | | | | |
See Notes to Financial Statements
13
|
VAN ECK VIP EMERGING MARKETS FUND |
| |
FINANCIAL HIGHLIGHTS |
|
For a share outstanding throughout each period: |
| | | | | | | | | | | | | | | | | | | |
| | Initial Class |
| | |
| | Six Months
Ended
June 30,
2010 | | |
| | | Year Ended December 31, |
| | | |
| | | 2009 | | 2008 | | 2007 | | 2006 | | 2005 | |
| | | | | | | | | | | | | |
| | (unaudited) | | | | | | | | | | | |
Net Asset Value, Beginning of Period | | $ | 11.22 | | $ | 5.89 | | $ | 27.71 | | $ | 24.98 | | $ | 19.91 | | $ | 15.21 | |
| | | | | | | | | | | | | | | | | | | |
Income (Loss) from Investment Operations: | | | | | | | | | | | | | | | | | | | |
Net Investment Income | | | 0.02 | | | 0.04 | | | 0.07 | | | 0.12 | | | 0.14 | | | 0.20 | |
Net Realized and Unrealized Gain (Loss)
on Investments | | | (0.41 | ) | | 5.83 | | | (12.20 | ) | | 7.47 | | | 7.15 | | | 4.63 | |
Payment from Adviser | | | — | | | 0.04 | (d) | | — | | | — | | | — | | | — | |
| | | | | | | | | | | | | | | | | | | |
Total from Investment Operations | | | (0.39 | ) | | 5.91 | | | (12.13 | ) | | 7.59 | | | 7.29 | | | 4.83 | |
| | | | | | | | | | | | | | | | | | | |
Less: | | | | | | | | | | | | | | | | | | | |
Dividends from Net Investment Income | | | (0.07 | ) | | (0.01 | ) | | — | | | (0.12 | ) | | (0.13 | ) | | (0.13 | ) |
Distributions from Net Realized Capital Gains | | | — | | | (0.57 | ) | | (9.69 | ) | | (4.74 | ) | | (2.09 | ) | | — | |
| | | | | | | | | | | | | | | | | | | |
Total Dividends and Distributions | | | (0.07 | ) | | (0.58 | ) | | (9.69 | ) | | (4.86 | ) | | (2.22 | ) | | (0.13 | ) |
| | | | | | | | | | | | | | | | | | | |
Redemption Fees | | | — | (c) | | — | (c) | | — | (c) | | — | (c) | | — | (c) | | — | (c) |
| | | | | | | | | | | | | | | | | | | |
Net Asset Value, End of Period | | $ | 10.76 | | $ | 11.22 | | $ | 5.89 | | $ | 27.71 | | $ | 24.98 | | $ | 19.91 | |
| | | | | | | | | | | | | | | | | | | |
Total Return (a) | | | (3.48 | )%(f) | | 113.17 | %(d) | | (64.77 | )% | | 37.56 | % | | 39.51 | % | | 32.00 | % |
| | | | | | | | | | | | | | | | | | | | |
| | | | | | | | | | | | | | | | | | | |
Ratios/Supplementary Data | | | | | | | | | | | | | | | | | | | |
Net Assets, End of Period (000) | | $ | 136,335 | | $ | 166,991 | | $ | 76,566 | | $ | 255,052 | | $ | 220,361 | | $ | 198,077 | |
Ratio of Gross Expenses to Average Net Assets | | | 1.27 | %(e) | | 1.22 | % | | 1.29 | % | | 1.23 | % | | 1.33 | % | | 1.35 | % |
Ratio of Net Expenses to Average Net Assets (b) | | | 1.27 | %(e) | | 1.22 | % | | 1.29 | % | | 1.23 | % | | 1.33 | % | | 1.34 | % |
Ratio of Net Investment Income to Average
Net Assets | | | 0.50 | %(e) | | 0.49 | % | | 0.53 | % | | 0.45 | % | | 0.63 | % | | 1.10 | % |
Portfolio Turnover Rate | | | 41 | %(f) | | 68 | % | | 45 | % | | 80 | % | | 52 | % | | 65 | % |
| | |
| | |
(a) | Total return is calculated assuming an initial investment of $10,000 made at the net asset value at the beginning of the period, reinvestment of any dividends and distributions at net asset value on the dividend/distribution payment date and a redemption on the last day of the period. The return does not reflect the deduction of taxes that a shareholder would pay on Fund dividends/distributions or the redemption of Fund shares. |
(b) | Excluding interest expense, the ratio of net expenses to average net assets would be 1.21% for the Initial Class shares for the year ended December 31, 2009. The ratio for all other years shown would be unchanged if any interest expense incurred during those years was excluded. |
(c) | Amount represents less than $0.005 per share. |
(d) | For the year ended December 31, 2009, 0.76% of the total return representing $0.04 per share, consisted of a reimbursement by the Adviser for an investment loss (see Note 11). |
(e) | Annualized |
(f) | Not annualized |
See Notes to Financial Statements
14
| | | | | | | | | | | | | | | | | | | |
| | Class R1 Shares |
| | |
| | Six Months
Ended
June 30,
2010 | | |
| | | Year Ended December 31, |
| | | |
| | | 2009 | | 2008 | | 2007 | | 2006 | | 2005 | |
| | | | | | | | | | | | | |
| | (unaudited) | | | | | | | | | | | | | | | | |
Net Asset Value, Beginning of Period | | $ | 11.21 | | $ | 5.87 | | $ | 27.68 | | $ | 24.95 | | $ | 19.89 | | $ | 15.21 | |
| | | | | | | | | | | | | | | | | | | |
Income (Loss) from Investment Operations: | | | | | | | | | | | | | | | | | | | |
Net Investment Income | | | 0.02 | | | 0.03 | | | 0.07 | | | 0.11 | | | 0.13 | | | 0.17 | |
Net Realized and Unrealized Gain (Loss)
on Investments | | | (0.41 | ) | | 5.85 | | | (12.19 | ) | | 7.48 | | | 7.15 | | | 4.64 | |
Payment from Adviser | | | — | | | 0.04(d | ) | | — | | | — | | | — | | | — | |
| | | | | | | | | | | | | | | | | | | |
Total from Investment Operations | | | (0.39 | ) | | 5.92 | | | (12.12 | ) | | 7.59 | | | 7.28 | | | 4.81 | |
| | | | | | | | | | | | | | | | | | | |
Less: | | | | | | | | | | | | | | | | | | | |
Dividends from Net Investment Income | | | (0.07 | ) | | (0.01 | ) | | — | | | (0.12 | ) | | (0.13 | ) | | (0.13 | ) |
Distributions from Net Realized Capital Gains | | | — | | | (0.57 | ) | | (9.69 | ) | | (4.74 | ) | | (2.09 | ) | | — | |
| | | | | | | | | | | | | | | | | | | |
Total Dividends and Distributions | | | (0.07 | ) | | (0.58 | ) | | (9.69 | ) | | (4.86 | ) | | (2.22 | ) | | (0.13 | ) |
| | | | | | | | | | | | | | | | | | | |
Redemption fees | | | — | (c) | | — | (c) | | — | (c) | | — | (c) | | — | (c) | | — | (c) |
| | | | | | | | | | | | | | | | | | | |
Net Asset Value, End of Period | | $ | 10.75 | | $ | 11.21 | | $ | 5.87 | | $ | 27.68 | | $ | 24.95 | | $ | 19.89 | |
| | | | | | | | | | | | | | | | | | | |
Total Return (a) | | | (3.48 | ) %(f) | | 113.39 | %(d) | | (64.75 | )% | | 37.62 | % | | 39.49 | % | | 31.86 | % |
| | | | | | | | | | | | | | | | | | | | |
| | | | | | | | | | | | | | | | | | | |
Ratios/Supplementary Data | | | | | | | | | | | | | | | | | | | |
Net Assets, End of Period (000) | | $ | 46,539 | | $ | 59,233 | | $ | 25,134 | | $ | 104,412 | | $ | 80,848 | | $ | 56,219 | |
Ratio of Gross Expenses to Average Net Assets | | | 1.28 | %(e) | | 1.22 | % | | 1.29 | % | | 1.24 | % | | 1.35 | % | | 1.38 | % |
Ratio of Net Expenses to Average Net Assets (b) | | | 1.28 | %(e) | | 1.22 | % | | 1.29 | % | | 1.24 | % | | 1.35 | % | | 1.36 | % |
Ratio of Net Investment Income to Average
Net Assets | | | 0.49 | %(e) | | 0.43 | % | | 0.47 | % | | 0.42 | % | | 0.62 | % | | 1.04 | % |
Portfolio Turnover Rate | | | 41 | %(f) | | 68 | % | | 45 | % | | 80 | % | | 52 | % | | 65 | % |
| | |
| | |
(a) | Total return is calculated assuming an initial investment of $10,000 made at the net asset value at the beginning of the period, reinvestment of any dividends and distributions at net asset value on the dividend/distribution payment date and a redemption on the last day of the period. The return does not reflect the deduction of taxes that a shareholder would pay on Fund dividends/distributions or the redemption of Fund shares. |
(b) | Excluding interest expense, the ratio of net expenses to average net assets would be 1.23% for the Class R1 Shares for the year ended December 31, 2007. The ratio for all other years shown would be unchanged if any interest expense incurred during those years was excluded. |
(c) | Amount represents less than $0.005 per share |
(d) | For the year ended December 31, 2009, 0.76% of the total return representing $0.04 per share, consisted of a reimbursement by the Adviser for an investment loss (see Note 11). |
(e) | Annualized |
(f) | Not annualized |
See Notes to Financial Statements
15
|
VAN ECK VIP EMERGING MARKETS FUND |
NOTES TO FINANCIAL STATEMENTS |
June 30, 2010 (unaudited) |
Note 1—Fund Organization—Van Eck VIP Trust, formerly Van Eck Worldwide Insurance Trust, (the “Trust”), is registered under the Investment Company Act of 1940, as amended, as an open-end management investment company. The Trust was organized as a Massachusetts business trust on January 7, 1987. The Van Eck VIP Emerging Markets Fund, formerly Worldwide Emerging Markets Fund, (the “Fund”) is a diversified series of the Trust and seeks long-term capital appreciation by investing primarily in equity securities in emerging markets around the world. The Fund offers two classes of shares: Initial Class Shares and Class R1 Shares. The two classes are identical except Class R1 Shares are, under certain circumstances, subject to a redemption fee on redemptions within 60 days of purchase.
Note 2—Significant Accounting Policies—The preparation of financial statements in conformity with U.S. generally accepted accounting principles (“GAAP”) requires management to make estimates and assumptions that affect the reported amounts and disclosures in the financial statements. Actual results could differ from those estimates.
The following is a summary of significant accounting policies followed by the Fund.
| |
A. | Security Valuation—Securities traded on national exchanges or traded on the NASDAQ National Market System are valued at the last sales price as reported at the close of each business day. Securities traded on the NASDAQ Stock Market are valued at the NASDAQ official closing price. Over-the-counter securities not included in the NASDAQ National Market System and listed securities for which no sale was reported are valued at the mean of the bid and ask prices. Securities for which market values are not readily available, or whose values have been affected by events occurring before the Fund’s pricing time (4:00 p.m. Eastern Time) but after the close of the securities’ primary market, are fair valued using methods approved by the Board of Trustees. The Fund may also fair value securities in other situations, for example, when a particular foreign market is closed but the Fund is open. The price which the Fund may realize upon sale of an investment may differ materially from the value presented on the Schedule of Investments. Short-term obligations purchased with more than sixty days remaining to maturity are valued at market value. Short-term obligations purchased with sixty days or less to maturity are valued at amortized cost, which with accrued interest approximates market value. Money market fund investments are valued at net asset value. Forward foreign currency contracts are valued at the spot currency rate plus an amount (“points”), which reflects the differences in interest rates between the U.S. and foreign markets. Securities for which quotations are not readily available are stated at fair value as determined by the Pricing Committee of Van Eck Associates Corporation (the “Adviser”) appointed by the Board of Trustees. Certain factors such as economic conditions, political events, market trends and security specific information are used to determine the fair value of these securities. Short-term investments held as collateral for securities loaned are valued at net asset value. |
| |
| The Fund utilizes various methods to measure the fair value of most of its investments on a recurring basis which includes a hierarchy that prioritizes inputs to valuation methods used to measure fair value. GAAP establishes a fair value hierarchy that prioritizes inputs to valuation techniques used to measure fair value. The hierarchy gives highest priority to unadjusted quoted prices in active markets for identical assets and liabilities (Level 1 measurements) and the lowest priority to unobservable inputs (Level 3 measurements). The inputs or methodologies used for valuing securities are not necessarily an indication of the risk associated with investing in those securities. The three levels of the fair value hierarchy are described below: |
| |
| Level 1 – Quoted prices in active markets for identical securities. |
| |
| Level 2 – Significant observable inputs (including quoted prices for similar securities, interest rates, prepayment speeds, credit risk, etc.). |
| |
| Level 3 – Significant unobservable inputs (including the Fund’s own assumptions in determining the fair value of investments). |
| |
B. | Federal Income Taxes—It is the Fund’s policy to comply with the provisions of the Internal Revenue Code applicable to regulated investment companies and to distribute all of its taxable income to its shareholders. Therefore, no federal income tax provision is required. |
| |
C. | Currency Translation—Assets and liabilities denominated in foreign currencies and commitments under forward foreign currency contracts are translated into U.S. dollars at the closing prices of such currencies each business day. Purchases and sales of investments are translated at the exchange rates prevailing when such investments are acquired or sold. Income and expenses are translated at the exchange rates prevailing when accrued. The portion of realized and unrealized gains and losses on investments that result from fluctuations in foreign currency exchange rates is not separately disclosed. Recognized gains or losses attributable to foreign currency fluctuations on foreign currency denominated assets, other than investments, and liabilities are recorded as net realized gains and losses from foreign currency transactions. |
| |
D. | Dividends and Distributions to Shareholders—Dividends to shareholders from net investment income and distributions from net realized capital gains, if any, are declared and paid annually. Income dividends and capital gain distributions are determined in accordance with income tax regulations, which may differ from such amounts determined in accordance with GAAP. |
16
|
NOTES TO FINANCIAL STATEMENTS |
(continued) |
| |
E. | Restricted Securities—The Fund may invest in securities that are subject to legal or contractual restrictions on resale. These securities generally may be resold in transactions exempt from registration or to the public if the securities are registered. Disposal of these securities may involve time-consuming negotiations and expense, and prompt sale at an acceptable price may be difficult. Information regarding restricted securities is included at the end of the Fund’s Schedule of Investments. |
| |
F. | Warrants—The Fund may invest in warrants whose values are linked to indices or underlying instruments. The Fund may use these warrants to gain exposure to markets that might be difficult to invest in through conventional securities. Warrants may be more volatile than their linked indices or underlying instruments. Potential losses are limited to the amount of the original investment. |
| |
G. | Use of Derivative Instruments—The Fund may make investments in derivative instruments, including, but not limited to, options, futures, swaps and other derivatives relating to foreign currency transactions. A derivative is an instrument whose value is derived from underlying assets, indices, reference rates or a combination of these factors. Derivative instruments may be privately negotiated contracts (often referred to as over the counter (“OTC”) derivatives) or they may be listed and traded on an exchange. Derivative contracts may involve future commitments to purchase or sell financial instruments or commodities at specified terms on a specified date, or to exchange interest payment streams or currencies based on a notional or contractual amount. Derivative instruments may involve a high degree of financial risk. The use of derivatives also involves the risk of loss if the investment adviser is incorrect in its expectation of the timing or level of fluctuations in securities prices, interest rates or currency prices. Investments in derivative instruments also include the risk of default by the counterparty, the risk that the investment may not be liquid and the risk that a small movement in the price of the underlying security or benchmark may result in a disproportionately large movement, unfavorable or favorable, in the price of the derivative instrument. GAAP requires enhanced disclosures about the Fund’s derivatives and hedging activities. Details of this disclosure are found below. |
| |
| The impact of transactions in derivative instruments, during the period ended June 30, 2010, were as follows: |
| | | | |
| | Foreign
exchange risk | |
Realized gain (loss)1: | | | | |
Forward foreign currency contracts | | | $(176,316 | ) |
| |
1 Statement of operations location: Net realized loss on foreign currency transactions and forward foreign currency contracts |
| |
| Forward Foreign Currency Contracts—The Fund is subject to foreign currency risk in the normal course of pursuing its investment objectives. The Fund may buy and sell forward foreign currency contracts to settle purchases and sales of foreign denominated securities or to hedge foreign denominated assets. Realized gains and losses from forward foreign currency contracts are included in realized gain (loss) on forward foreign currency contracts and foreign currency transactions. The Fund may incur additional risk from investments in forward foreign currency contracts if the counterparty is unable to fulfill its obligation or there are unanticipated movements of the foreign currency relative to the U.S. dollar. |
| |
H. | Other—Security transactions are accounted for on trade date. Dividend income is recorded on the ex-dividend date. Dividend on foreign securities are recorded when the Fund is informed of such dividends. Realized gains and losses are calculated on the specific identified cost basis. Interest income, including amortization of premiums and discounts, is accrued as earned. Estimated foreign taxes that are expected to be withheld from proceeds at the sale of certain foreign investments are accrued by the Funds and decrease the unrealized gain on investments. |
| |
| Income, expenses (excluding class-specific expenses) and realized/unrealized gains/losses are allocated proportionately to each class of shares based upon the relative net asset value of outstanding shares of each class at the beginning of the day (after adjusting for current capital share activity of the respective classes). Class-specific expenses are charged directly to the applicable class of shares. |
Note 3—Investment Management and Other Agreements—The Adviser is the investment adviser to the Fund. The Adviser receives a management fee, calculated daily and payable monthly based on an annual rate of 1.00% of the Fund’s average daily net assets. The Adviser has agreed to waive management fees and/or assume expenses excluding interest, taxes, and extra ordinary expenses exceeding 1.50% for both the Initial Class shares and Class R1 shares. For the period ended June 30, 2010, no management fees were waived nor were any expenses assumed by the Adviser. Certain of the officers and trustees of the Trust are officers, directors or stockholders of the Adviser and Van Eck Securities Corporation, the Distributor.
Note 4—Investments—For the period ended June 30, 2010, the cost of purchases and proceeds from sales of investments, other than U.S. government securities and short-term obligations aggregated $487,655,523 and $475,071,090, respectively.
Note 5—Income Taxes—For Federal income tax purposes, the identified cost of investments owned at June 30, 2010 was $162,315,241 and net unrealized appreciation aggregated $16,818,878 of which $43,102,636 related to appreciated securities and $26,283,758 related to depreciated securities.
17
|
VAN ECK VIP EMERGING MARKETS FUND |
NOTES TO FINANCIAL STATEMENTS |
(continued) |
The tax character of dividends and distributions paid to shareholders were as follows:
| | | | | | | | | | | |
| | Six Months Ended
June 30, 2010 | | Year Ended
December 31, 2009 | |
| | | | | |
Ordinary income | | | $ | 1,349,661 | | | | $ | 253,117 | | |
Long term capital gains | | | | — | | | | | 9,562,263 | | |
| | | | | | | | | | | |
Total | | | $ | 1,349,661 | | | | $ | 9,815,380 | | |
| | | | | | | | | | | |
The Fund recognizes the tax benefits of uncertain tax positions only where the position is “more likely than not” to be sustained assuming examination by applicable tax authorities. Management has analyzed the Fund’s tax positions, and has concluded that no liability for unrecognized tax benefits should be recorded related to uncertain tax positions taken on returns filed for open tax years (tax years ended December 31, 2006-2009), or expected to be taken in the Fund’s current tax year. Therefore, no provision for income tax is required in the Fund’s financial statements.
Note 6—Concentration of Risk—The Fund may purchase securities on foreign exchanges. Securities of foreign issuers involve special risks and considerations not typically associated with investing in U.S. issuers. These risks include devaluation of currencies, less reliable information about issuers, different securities transaction clearance and settlement practices, and future adverse political and economic developments. These risks are heightened for investments in emerging market countries. Moreover, securities of many foreign issuers and their markets may be less liquid and their prices more volatile than those of comparable U.S. issuers.
At June 30, 2010, the aggregate shareholder accounts of three insurance companies own approximately 61%, 9%, and 5% of the Initial Class Shares and one of whom owns approximately 100% of the Class R1 Shares.
In the normal course of business, the Fund enters into contracts that contain a variety of general indemnifications. The Fund’s maximum exposure under these agreements is unknown as this would involve future claims that may be made against the Fund that have not yet occurred. However, the Adviser believes the risk of loss under these arrangements to be remote.
Note 7—Trustee Deferred Compensation Plan—The Trust has a Deferred Compensation Plan (the “Plan”) for Trustees under which the Trustees can elect to defer receipt of their trustee fees until retirement, disability or termination from the Board of Trustees. The Fund’s contributions to the Plan are limited to the amount of fees earned by the participating Trustees. The fees otherwise payable to the participating Trustees are invested in shares of the Van Eck Funds (another registered investment company managed by the Adviser) as directed by the Trustees.
The expense for the deferred compensation plan is included in “Trustees fees and expenses” in the Statement of Operations. The liability for the deferred compensation plan is shown as “Deferred Trustee fees” in the Statement of Assets and Liabilities.
Note 8—Bank Line of Credit—The Trust may participate with Van Eck Funds (the “VE/VIP Funds”) in a $10 million committed credit facility (the “Facility”) to be utilized for temporary financing until the settlement of sales or purchases of portfolio securities, the repurchase or redemption of shares of the Fund at the request of the shareholders and other temporary or emergency purposes. The VE/VIP Funds have agreed to pay commitment fees, pro rata, based on the unused but available balance. Interest is charged to the VE/VIP Funds at rates based on prevailing market rates in effect at the time of borrowings. During the period ended June 30, 2010, the Fund borrowed under this Facility. The average daily loan balance during the 80 day period for which a loan was outstanding amounted to $712,338 and the weighted average interest rate was 1.51%. At June 30, 2010, the Fund had no outstanding borrowings under the Facility.
Note 9—Custodian Fees—The Fund has entered into an expense offset agreement with its custodian wherein it receives credit toward the reduction of custodian fees whenever there are uninvested cash balances. For the period ended June 30, 2010, there were no offsets of custodial fees.
Note 10—Securities Lending—To generate additional income, the Fund may lend its securities pursuant to a securities lending agreement with State Street Bank & Trust Co., the securities lending agent and also the Fund’s custodian. For the period ended June 30, 2010, there was no securities lending activity.
Note 11—Payment from Adviser—In 2009, the Fund incurred a loss of $774,938 from an incorrect processing of a corporate action. The Adviser reimbursed the Fund for the total amount of the loss which is reflected in the Statement of Changes in Net Assets as Net increase from Payment from Adviser. The impact to the Fund’s total return is reflected in the Financial Highlights.
Note 12—Subsequent Event Review—The Funds have evaluated subsequent events and transactions for potential recognition or disclosure through the date the financial statements were issued and there were no material events requiring recording or disclosure.
18
|
VAN ECK VIP EMERGING MARKETS FUND |
| |
APPROVAL OF ADVISORY AGREEMENT |
(unaudited) |
Approval of Advisory Agreement
The Investment Company Act of 1940, as amended, provides, in substance, that each investment advisory agreement between a fund and its investment advisers will continue in effect from year to year only if its continuance is approved at least annually by the Board of Trustees (the “Board”), including by a vote of a majority of the Trustees who are not “interested persons” of the Fund (“Independent Trustees”), cast in person at a meeting called for the purpose of considering such approval.
In considering the renewal of the Fund’s investment advisory agreement, the Board, which is comprised exclusively of Independent Trustees, reviewed and considered information that had been provided by the Adviser throughout the year at regular Board meetings, as well as information requested by the Board and furnished by the Adviser for the meetings of the Board held on June 10, 2010 and June 29 and 30, 2010 to specifically consider the renewal of the Fund’s investment advisory agreement. This information included, among other things, the following:
| |
n | Information about the overall organization of the Adviser and the Adviser’s short-term and long-term business plan with respect to its mutual fund operations; |
| |
n | The Adviser’s consolidated financial statements for the past three fiscal years; |
| |
n | A description of the advisory agreement with the Fund, its terms and the services provided thereunder; |
| |
n | Descriptions of the qualifications, education and experience of the individual investment professionals whose responsibilities include portfolio management and investment research for the Fund, and information relating to their compensation and responsibilities with respect to managing other mutual funds and investment accounts; |
| |
n | Presentations by the Adviser’s key investment personnel with respect to the Adviser’s investment strategies and general investment outlook in relevant markets, and the resources available to support the implementation of such investment strategies; |
| |
n | An independently prepared report comparing the management fees and non-investment management expenses of the Fund during its fiscal year ended December 31, 2009 with those of (i) the universe of funds with a similar investment strategy, offered in connection with variable insurance products (the “Expense Universe”), and (ii) a sub-group of the Expense Universe consisting of funds of comparable size and with comparable fee and expense structures (the “Expense Group”); |
| |
n | An independently prepared report comparing the Fund’s annualized investment performance for the one- through five-year periods ended December 31, 2009 with those of (i) the universe of funds with a similar investment strategy, offered in connection with variable insurance products (the “Performance Universe”) and (ii) a sub-group of the Performance Universe consisting of funds of comparable size and with comparable fee and expense structures (the “Performance Group”); |
| |
n | An analysis of the profitability of the Adviser with respect to the services it provides to the Fund and the Van Eck complex of mutual funds as a whole; |
| |
n | Information regarding other accounts and investment vehicles managed by the Adviser, including the types of accounts, the fees charged by the Adviser for managing the accounts, the material differences between the nature of services provided for the Fund as compared to the other accounts, the other accounts investment strategies, the net assets under management in each such account and vehicle, and the individuals that are performing investment management functions with respect to each such account and vehicle; |
| |
n | Information concerning the Adviser’s compliance program, the resources devoted to compliance efforts undertaken by the Adviser and its affiliates on behalf of the Fund, and reports regarding a variety of compliance-related issues; |
| |
n | Information with respect to the Adviser’s brokerage practices, including the benefits received by the Adviser from research acquired with soft dollars; and |
| |
n | Other information provided by the Adviser in its response to a comprehensive questionnaire prepared by independent legal counsel on behalf of the Independent Trustees. |
In considering whether to approve the investment advisory agreement, the Board evaluated the following factors: (1) the quality, nature, cost and character of the investment management as well as the administrative and other non-investment management services provided by the Adviser and its affiliates; (2) the nature, quality and extent of the services performed by the Adviser in interfacing with, and monitoring the services performed by, third parties, such as the Fund’s custodian, transfer agent, sub-accounting agent and independent auditors, and the Adviser’s commitment and efforts to review the
19
|
VAN ECK VIP EMERGING MARKETS FUND |
| |
APPROVAL OF ADVISORY AGREEMENT |
(continued) |
quality and pricing of third party service providers to the Fund with a view to reducing non-management expenses of the Fund; (3) the terms of the advisory agreement and the reasonableness and appropriateness of the particular fee paid by the Fund for the services described therein; (4) the Adviser’s willingness to reduce the cost of the Fund to shareholders from time to time by means of waiving a portion of its management fees or paying expenses of the Fund or by reducing fees from time to time; (5) the services, procedures and processes used to determine the value of Fund assets, and the actions taken to monitor and test the effectiveness of such services, procedures and processes; (6) the ongoing efforts of, and resources devoted by, the Adviser with respect to the development of a comprehensive compliance program and written compliance policies and procedures, and the implementation of recommendations of independent consultants with respect to a variety of compliance issues; (7) the responsiveness of the Adviser and its affiliated companies to inquiries from, and examinations by, regulatory agencies such as the Securities and Exchange Commission; (8) the Adviser’s record of compliance with its policies and procedures; and (9) the ability of the Adviser to attract and retain quality professional personnel to perform investment advisory and administrative services for the Fund.
The Board considered the fact that the Adviser is managing other investment products and vehicles, including exchange-traded funds, hedge funds and separate accounts, that invest in the same financial markets and may be managed by the same investment professionals according to a similar investment strategy as the Fund. The Board concluded that the management of these products contributes to the Adviser’s financial stability and is helpful to the Adviser in attracting and retaining quality portfolio management personnel for the Fund. In addition, the Board concluded that the Adviser has established appropriate procedures to monitor conflicts of interest involving the management of the Fund and the other products and for resolving any such conflicts of interest in a fair and equitable manner.
In considering the Fund’s performance, the Board noted that the Fund’s annualized returns underperformed its Performance Group and Performance Universe averages over the two- through five-year periods ended December 31, 2009, but that the Fund’s annualized returns outperformed its Performance Group and Performance Universe averages over the one-year period ended December 31, 2009. The Board considered the impact on relative performance of the Adviser’s strategy of focusing on smaller, more growth oriented stocks and noted the improvement in the Fund’s performance in 2009. The Board also noted that a primary factor impacting the Fund’s one-year performance was the rebound in 2009 from the extreme sell-down of smaller, growth oriented emerging markets securities in 2008. The Board concluded that the investment strategy being pursued by the Adviser is appropriate for the Fund and that the overall performance of the Fund is satisfactory. With respect to the Fund’s fees and expenses, the Board noted that, during 2009, the Fund’s overall management fee and expense ratio were lower than the median ratios for its Expense Group. The Board also noted that the Adviser has agreed to waive or to reimburse expenses through April 2011 to the extent necessary to maintain an agreed upon expense ratio. The Board concluded that the management fee charged to, and the total expense ratio of, the Fund are reasonable.
The Board considered the profits, if any, realized by the Adviser from managing the Fund, in light of the services rendered and the costs associated with providing such services, and concluded that the profits realized by the Adviser from managing the Fund are not excessive. In this regard, the Board also considered the extent to which the Adviser may realize economies of scale as the Fund grows, and whether the Fund’s fee reflects these economies of scale for the benefit of shareholders. The Board concluded that the Adviser does not currently, and is unlikely in the foreseeable future to, realize material benefits from economies of scale and, therefore, the implementation of breakpoints would not be warranted at this time for the Fund.
The Board did not consider any single factor as controlling in determining whether or not to renew the investment advisory agreement. Nor are the items described herein all of the matters considered by the Board. Based on its consideration of the foregoing factors and conclusions, and such other factors and conclusions as it deemed relevant, and assisted by the advice of its independent counsel, the Board concluded that the renewal of the investment advisory agreement, including the fee structure (described herein) is in the interests of shareholders, and accordingly, the Board approved the continuation of the advisory agreement for an additional one-year period.
20
This report must be preceded or accompanied by a Van Eck VIP (the “Trust”) Prospectus, which includes more complete information. An investor should consider the investment objective, risks, and charges and expenses of the Fund carefully before investing. The prospectus contains this and other information about the investment company. Please read the prospectus carefully before investing.
Additional information about the Trust’s Board of Trustees/Officers and a description of the policies and procedures the Trust uses to determine how to vote proxies relating to portfolio securities are provided in the Statement of Additional Information. The Statement of Information and information regarding how the Trust voted proxies relating to portfolio securities during the most recent twelve month period ending June 30 is available, without charge, by calling 800.826.2333, or by visiting vaneck.com, or on the Securities and Exchange Commission’s website at http://www.sec.gov.
The Trust files its complete schedule of portfolio holdings with the Securities and Exchange Commission for the first and third quarters of each fiscal year on Form N-Q. The Trust’s Form N-Qs are available on the Commission’s website at http://www.sec.gov and may be reviewed and copied at the Commission’s Public Reference Room in Washington, D.C. Information on the operation of the Public Reference Room may be obtained by calling 202.942.8090. The Fund’s complete schedule of portfolio holdings is also available by calling 800.826.2333 or by visiting vaneck.com.
| | |

|
| | |
Investment Adviser: | | Van Eck Associates Corporation |
Distributor: | | Van Eck Securities Corporation |
| | 335 Madison Avenue, New York, NY 10017 |
Account Assistance: | | 800.544.4653 |
| | |
vaneck.com |
Item 2. CODE OF ETHICS.

     Not applicable.

Item 3. AUDIT COMMITTEE FINANCIAL EXPERT.

     Not applicable.

Item 4. PRINCIPAL ACCOUNTANT FEES AND SERVICES.

     Not applicable.

Item 5. AUDIT COMMITTEE OF LISTED REGISTRANTS.

     Not applicable.

Item 6. SCHEDULE OF INVESTMENTS.

     Information included in Item 1.

Item 7. DISCLOSURE OF PROXY VOTING POLICIES AND PROCEDURES FOR CLOSED-END
        MANAGEMENT INVESTMENT COMPANIES.

     Not applicable.

Item 8. PORTFOLIO MANAGER OF CLOSED-END MANAGEMENT INVESTMENT COMPANIES.

     Not applicable.

Item 9. PURCHASE OF EQUITY SECURITIES BY CLOSED-END MANAGEMENT INVESTMENT
        COMPANY AND AFFILIATED PURCHASERS.

     Not applicable.

Item 10. SUBMISSION OF MATTERS TO A VOTE OF SECURITY HOLDERS.

     No changes.

Item 11. CONTROLS AND PROCEDURES.

(a)  The Chief Executive Officer and the Chief Financial Officer have concluded
     that the Van Eck VIP Emerging Markets Fund disclosure controls and procedures
     (as defined in Rule 30a-3(c) under the Investment Company Act) provide
     reasonable assurances that material information relating to the Van Eck VIP
     Emerging Markets Fund is made known to them by the appropriate persons,
     based on their evaluation of these controls and procedures as of a date
     within 90 days of the filing date of this report.

(b)  There were no significant changes in the registrant's internal controls
     over financial reporting or in other factors that could significantly
     affect these controls over financial reporting subsequent to the date of
     our evaluation.


Item 12. EXHIBITS.

(a)(1) Not applicable.

(a)(2) A separate certification for each principal executive officer and
       principal financial officer of the registrant as required by Rule 30a-2
       under the Act (17 CFR 270.30a-2) is attached as Exhibit 99.CERT.

(b)  Certification pursuant to Section 906 of the Sarbanes-Oxley Act of 2002 is
     furnished as Exhibit 99.906CERT.


                                   SIGNATURES


Pursuant to the requirements of the Securities Exchange Act of 1934 and the
Investment Company Act of 1940, the registrant has duly caused this report to be
signed on its behalf by the undersigned, thereunto duly authorized.

(Registrant) VAN ECK VIP TRUST - VAN ECK VIP EMERGING MARKETS FUND

By (Signature and Title) /s/ Bruce J. Smith, SVP & CFO
                         -----------------------------
Date  August 26, 2010
      ---------------

Pursuant to the requirements of the Securities Exchange Act of 1934 and the
Investment Company Act of 1940, this report has been signed below by the
following persons on behalf of the registrant and in the capacities and on the
dates indicated.

By (Signature and Title) /s/ Derek S. van Eck, CEO
                        --------------------------
Date  August 26, 2010
      ---------------

By (Signature and Title)  /s/ Bruce J. Smith, CFO
                         -------------------------
Date  August 26, 2010
      ---------------