|
| |
TOP TEN EQUITY HOLDINGS* |
June 30, 2009 (unaudited) |
Noble Energy
(U.S., 4.1%)
Houston-based Noble Energy is involved in the exploration, development, production, and marketing of crude oil and natural gas in the U.S. and internationally. The company operates and holds interests in properties in several western U.S. states, and operates in Equatorial Guinea and Cameroon in West Africa, the North Sea, Israel, Ecuador, China and Suriname.
XTO Energy, Inc.
(U.S., 3.8%)
XTO Energy is a natural gas producer that acquires, exploits and develops long-lived oil and gas properties. The company’s properties are all located in the U.S., concentrated in Texas, Oklahoma, Kansas, New Mexico, Colorado, Arkansas, Wyoming, Louisiana and Alaska.
Randgold Resources Ltd.
(United Kingdom, 3.8%)
Randgold explores for and develops mines and mineral interests in sub-Saharan Africa. The company also acquires and rehabilitates existing underperforming gold mines as well as mature exploration programs and bulk tonnage shallow deposits with gold producing potential. The group has interests in Cote d’Ivoire, Mali, Tanzania and Senegal.
Anadarko Petroleum Corp.
(U.S., 3.7%)
Anadarko Petroleum is an oil and gas exploration and production company, with major areas of operation located onshore in the United States, the Gulf of Mexico, Algeria, and has production in China and a development project in Brazil. The company markets natural gas, oil and natural gas liquids (NGLs), and owns and operates gas gathering and processing systems.
Schlumberger Ltd.
(U.S., 3.5%)
Schlumberger is the leading oilfield services provider, trusted to deliver superior results and improved E&P performance for oil and gas companies around the world. Schlumberger Limited operates as an oilfield services company in the United States and internationally. It operates in two segments, Oilfield Services and WesternGeco. The Oilfield Services segment provides technology, project management, and information solutions to the oil and gas exploration and production industry.
Hess Corp.
(U.S., 3.5%)
Hess and its subsidiaries explore for, produce, purchase, transport and sell crude oil and natural gas. The company also manufactures, purchases, transports and markets refined petroleum products. Hess’ exploration and production activities are located primarily in the U.S., UK, Norway and Gabon.
Transocean, Inc.
(U.S., 3.4%)
Transocean provides offshore contract drilling services for oil and gas wells. The Houston-based company contracts drilling rigs, related equipment and work crews that focus on deepwater and harsh environment drilling services in the U.S., the UK, Brazil, India and elsewhere.
Weatherford International Ltd.
(U.S., 3.4%)
Weatherford International is a provider of equipment and services used for the drilling, evaluation, completion, production and intervention of oil and natural gas wells. The company operates in approximately 100 countries through approximately 800 locations situated in nearly all of the oil and natural gas producing regions in the world.
11
|
| |
TOP TEN EQUITY HOLDINGS* |
June 30, 2009 (unaudited) (continued) |
Occidental Petroleum Corp.
(U.S., 3.1%)
Occidental Petroleum explores for, develops, produces and markets crude oil and natural gas. The company also manufactures and markets a variety of basic chemicals, including chlorine, caustic soda, polyvinyl chloride, vinyl chloride monomer and ethylene dichloride as well as specialty chemicals. Occidental also has an interest in petrochemicals.
Quanta Services
(U.S., 3.1%)
Quanta Services provides specialty contracting services to the transmission and distribution sector of the North American electric utility industry. Its Infrastructure Services segment provides end-to-end network solutions to the electric power, gas, telecommunications, and cable television industries; and its Dark Fiber segment designs, procures, constructs, and maintains fiber-optic telecommunications facilities.
| |
* | Percentage of net assets. Portfolio is subject to change. |
| Company descriptions courtesy of Bloomberg.com. |
12
|
| |
EXPLANATION OF EXPENSES |
(unaudited) |
Hypothetical $1,000 investment at beginning of period
As a shareholder of the Fund, you incur two types of costs: (1) transaction costs, including program fees on purchase payments; and (2) ongoing costs, including management fees and other Fund expenses. This disclosure is intended to help you understand your ongoing costs (in dollars) of investing in the Fund and to compare these costs with the ongoing costs of investing in other mutual funds.
The disclosure is based on an investment of $1,000 invested at the beginning of the period and held for the entire period, January 1, 2009 to June 30, 2009.
Actual Expenses
The first line in the table below provides information about actual account values and actual expenses. You may use the information in this line, together with the amount you invested, to estimate the expenses that you paid over a period. Simply divide your account value by $1,000 (for example, an $8,600 account value divided by $1,000 = 8.6), then multiply the result by the number in the first line under the heading “Expenses Paid During Period” to estimate the expenses you paid on your account during this period.
Hypothetical Example for Comparison Purposes
The second line in the table below provides information about hypothetical account values and hypothetical expenses based on the Fund’s actual expense ratio and an assumed rate of return of 5% per year before expenses, which is not the Fund’s actual return. The hypothetical account values and expenses may not be used to estimate the actual ending account balance or expenses you paid for the period. You may use this information to compare the ongoing costs of investing in the Fund and other funds. To do so, compare this 5% hypothetical example with the 5% hypothetical examples that appear in the shareholder reports of other funds.
Please note that the expenses shown in the table are meant to highlight your ongoing costs only and do not reflect any transactional costs, such as program fees. Therefore, the second line of the table is useful in comparing ongoing costs only, and will not help you determine the relative total costs of owning different funds. In addition, if these transactional costs were included, your costs would have been higher.
| | | | | | | | | | | | | | | | | | |
| | | | Beginning
Account Value
January 1, 2009 | | Ending
Account Value
June 30, 2009 | | Expenses Paid
During Period*
January 1, 2009-
June 30, 2009 | |
| | | | | | | | | | |
Initial Class | | Actual | | | $ | 1,000.00 | | | | $ | 1,255.00 | | | | $ | 6.21 | | |
| | Hypothetical** | | | $ | 1,000.00 | | | | $ | 1,019.29 | | | | $ | 5.56 | | |
| | | | | | | | | | | | | | | | | | | |
Class R1 | | Actual | | | $ | 1,000.00 | | | | $ | 1,255.70 | | | | $ | 6.32 | | |
| | Hypothetical** | | | $ | 1,000.00 | | | | $ | 1,019.19 | | | | $ | 5.66 | | |
| | | | | | | | | | | | | | | | | | | |
Class S | | Actual | | | $ | 1,000.00 | | | | $ | 1,253.70 | | | | $ | 7.82 | | |
| | Hypothetical** | | | $ | 1,000.00 | | | | $ | 1,017.85 | | | | $ | 7.00 | | |
| | | | | | | | | | | | | | | | | | | |
| |
* | Expenses are equal to the Fund’s annualized expense ratio (for the six months ended June 30, 2009) of 1.11% on Initial Class Shares, 1.13% on Class R1 Shares and 1.40% on Class S Shares, multiplied by the average account value over the period, multiplied by 181 and divided by 365 (to reflect the one-half year period) |
| |
** | Assumes annual return of 5% before expenses |
13
|
| |
SCHEDULE OF INVESTMENTS |
June 30, 2009 (unaudited) |
| | | | | | | |
Number of
Shares | | | | Value | |
| | | | | | |
COMMON STOCKS: 94.7% | | | | |
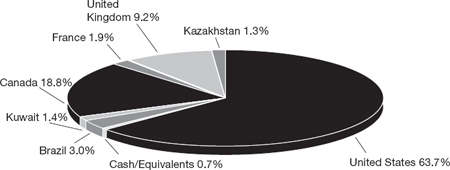
Brazil: 3.0% | | | | |
| 554,000 | | Petroleo Brasileiro S.A. (ADR) | | $ | 22,702,920 | |
| | | | | | | |
Canada: 18.8% | | | | |
| 212,000 | | Addax Petroleum Corp. | | | 8,991,067 | |
| 397,500 | | Agnico-Eagle Mines Ltd. (USD) | | | 20,860,800 | |
| 1,614,800 | | Brazilian Resources, Inc. * # | | | 0 | |
| 381,000 | | Canadian Natural Resources Ltd. | | | 19,998,690 | |
| 96,600 | | CIC Energy Corp. * R | | | 153,643 | |
| 227,100 | | First Quantum Minerals Ltd. | | | 10,982,569 | |
| 539,152 | | Goldcorp, Inc. (USD) | | | 18,735,532 | |
| 845,700 | | IAMGOLD Corp. | | | 8,558,484 | |
| 211,855 | | Kinross Gold Corp. | | | 3,861,347 | |
| 233,500 | | Kinross Gold Corp. (USD) | | | 4,238,025 | |
| 1,483,000 | | Osisko Mining Corp. * | | | 8,351,158 | |
| 1,482,000 | | Pacific Rubiales Energy Corp. * | | | 12,218,871 | |
| 14,800 | | Petrolifera Petroleum Ltd. * | | | 36,264 | |
| 968,900 | | Petrolifera Petroleum Ltd. * R | | | 2,374,040 | |
| 107,800 | | Potash Corp. of Saskatchewan | | | 10,030,790 | |
| 1,038,000 | | Red Back Mining, Inc. * | | | 9,048,979 | |
| 234,000 | | Silver Wheaton Corp. (USD) * | | | 1,928,160 | |
| 230,800 | | Timberwest Forest Corp. | | | 672,666 | |
| 291,048 | | Yamana Gold Inc. R | | | 2,587,316 | |
| | | | | | | |
| | | | | | 143,628,401 | |
| | | | | | | |
France: 1.9% | | | | |
| 266,000 | | Total S.A. (ADR) | | | 14,425,180 | |
| | | | | | | |
Kazakhstan: 1.3% | | | | |
| 538,000 | | KazMunaiGas Exploration (GDR) Reg S # | | | 10,235,479 | |
| | | | | | | |
Kuwait: 1.4% | | | | |
| 15,562,437 | | Kuwait Energy Co. KSCC # R | | | 10,479,555 | |
| | | | | | | |
United Kingdom: 9.2% | | | | |
| 809,000 | | BHP Billiton PLC # | | | 18,233,764 | |
| 447,100 | | Randgold Resources Ltd. (ADR) | | | 28,690,407 | |
| 41,000 | | Rio Tinto PLC (ADR) | | | 6,718,670 | |
| 1,488,000 | | Xstrata PLC # | | | 16,171,984 | |
| | | | | | | |
| | | | | | 69,814,825 | |
| | | | | | | |
United States: 59.1% | | | | |
| 356,800 | | AK Steel Holding Corp. | | | 6,846,992 | |
| 143,000 | | Alpha Natural Resources, Inc. * | | | 3,756,610 | |
| 625,200 | | Anadarko Petroleum Corp. | | | 28,377,828 | |
| 261,000 | | Cameron International Corp. * | | | 7,386,300 | |
| 528,000 | | Ellora Oil & Gas, Inc. * # R | | | 2,897,136 | |
| 531,650 | | EQT Corp. | | | 18,559,902 | |
| 418,000 | | Freeport-McMoRan Copper & Gold, Inc. | | | 20,945,980 | |
| 103,000 | | General Cable Corp * | | | 3,870,740 | |
| 492,700 | | Hess Corp. | | | 26,482,625 | |
|
See Notes to Financial Statements |
14
|
| | | | | | | |
Number
of Shares | | | | Value | |
| | | | | | |
United States (continued) | | | | |
| 274,017 | | Kaiser Aluminum Corp. | | $ | 9,839,951 | |
| 891,000 | | Mariner Energy Inc. * | | | 10,469,250 | |
| 401,000 | | MEMC Electronic Materials Inc. * | | | 7,141,810 | |
| 101,000 | | Monsanto Co. | | | 7,508,340 | |
| 53,300 | | MYR Group Inc * | | | 1,077,726 | |
| 549,300 | | Newfield Exploration Co. * | | | 17,945,631 | |
| 359,000 | | Noble Corp. | | | 10,859,750 | |
| 528,000 | | Noble Energy, Inc. | | | 31,136,160 | |
| 176,100 | | Nucor Corp. * | | | 7,824,123 | |
| 365,000 | | Occidental Petroleum Corp. | | | 24,020,650 | |
| 330,400 | | Petrohawk Energy Corp. * | | | 7,367,920 | |
| 1,029,700 | | Quanta Services, Inc. * | | | 23,816,961 | |
| 1,274,000 | | Quicksilver Resources, Inc. * | | | 11,835,460 | |
| 494,000 | | Schlumberger Ltd. | | | 26,730,340 | |
| 515,000 | | Smith International, Inc. | | | 13,261,250 | |
| 486,000 | | Southwestern Energy Co. * | | | 18,881,100 | |
| 1,067,300 | | Steel Dynamics, Inc. | | | 15,721,329 | |
| 347,805 | | Transocean, Inc. * | | | 25,838,434 | |
| 1,318,600 | | Weatherford International Ltd. * | | | 25,791,816 | |
| 221,000 | | Weyerhaeuser Co. | | | 6,725,030 | |
| 759,350 | | XTO Energy, Inc. | | | 28,961,609 | |
| | | | | | | |
| | | | | | 451,878,753 | |
| | | | | | | |
Total Common Stocks | | | | |
(Cost: $629,264,228) | | | 723,165,113 | |
| | | | |
EXCHANGE TRADED FUNDS: 4.6% | | | | |
(Cost: $31,290,458) | | | | |
United States: 4.6% | | | | |
| 519,000 | | iShares Silver Trust * | | | 6,944,220 | |
| 299,000 | | PowerShares DB Agriculture Fund * | | | 7,609,550 | |
| 228,000 | | SPDR Gold Trust * | | | 20,789,040 | |
| | | | | | | |
Total Exchange Traded Funds | | | | |
(Cost: $31,290,458) | | | 35,342,810 | |
| | | | |
MONEY MARKET FUND: 1.9% | | | | |
(Cost: $14,746,402) | | | | |
United States: 1.9% | | | | |
| 14,746,402 | | AIM Treasury Portfolio -
Institutional Class | | | 14,746,402 | |
�� | | | | | | | |
Total Investments: 101.2% | | | | |
(Cost: $675,301,088) | | | 773,254,325 | |
Liabilities in excess of other assets: (1.2)% | | | (9,170,190 | ) |
| | | | |
NET ASSETS: 100.0% | | $ | 764,084,135 | |
| | | | |
|
See Notes to Financial Statements |
15
|
|
| |
SCHEDULE OF INVESTMENTS |
(unaudited) (continued) |
| |
| | |
ADR — American Depositary Receipt |
GDR — Global Depositary Receipt |
USD — United States Dollar |
| |
* | Non-income producing |
# | Indicates a fair valued security which has not been valued using an independent quote, but has been valued pursuant to guidelines established by the Board of Trustees. The aggregate value for fair valued securities is $58,017,918, which represents 7.6% of net assets. |
R | Security exempt from registration under Rule 144A of the Securities Act of 1933, as amended, or otherwise restricted. These securities may be resold in transactions exempt from registration, unless otherwise noted, and the market value amounted to $18,491,690, or 2.4% of net assets. |
Reg S | Security was purchased pursuant to Regulation S under the Securities Act of 1933, which exempts from registration securities offered and sold outside of the United States. Such a security cannot be sold in the United States without either an effective registration statement filed pursuant to the Securities Act of 1933, or pursuant to an exemption from registration. |
Restricted securities held by the Fund are as follows:
| | | | | | | | | | | | | | | | | |
Security | | | Acquisition
Date | | Number
of Shares | | Acquisition
Cost | | Value | | % of
Net Assets | |
| | | | | | | | | | | | | |
CIC Energy Corp. | | | 2/8/07 | | | 96,600 | | $ | 1,224,335 | | $ | 153,643 | | 0.0 | % | |
Ellora Oil & Gas Co. (a) | | | 6/30/06 | | | 528,000 | | | 6,336,000 | | | 2,897,136 | | 0.4 | | |
Kuwait Energy Co. KSCC (a) | | | 8/6/08 | | | 15,562,437 | | | 11,764,893 | | | 10,479,555 | | 1.4 | | |
Petrolifera Petroleum Ltd. | | | 3/7/05 | | | 722,400 | | | 962,197 | | | 1,770,055 | | 0.2 | | |
Petrolifera Petroleum Ltd. | | | 5/2/07 | | | 246,500 | | | 665,886 | | | 603,985 | | 0.1 | | |
Yamana Gold Inc. | | | 5/29/08 | | | 291,048 | | | 582,096 | | | 2,587,316 | | 0.3 | | |
| | | | | | | | | | | | | | | | |
(a) - Illiquid security | | | | | | | | $ | 21,535,407 | | $ | 18,491,690 | | 2.4 | % | |
| | | | | | | | | | | | | | | | |
| | | | | | | | | |
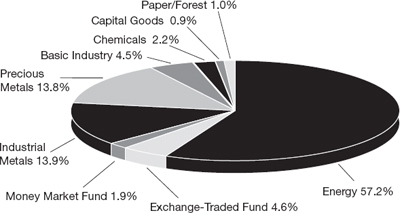
Summary of
Investments by Industry | | | % of
Investments | | Value | |
| | | | | | | |
Basic Industry | | | 4.5 | % | | $ | 34,925,477 | |
Capital Goods | | | 0.9 | | | | 7,141,810 | |
Chemicals | | | 2.2 | | | | 17,348,291 | |
Energy | | | 57.2 | | | | 442,175,480 | |
Industrial Metals | | | 13.9 | | | | 107,316,151 | |
Paper and Forest | | | 1.0 | | | | 7,397,696 | |
Precious Metals | | | 13.8 | | | | 106,860,208 | |
| | | | | | | | |
Total Common Stocks | | | 93.5 | % | | | 723,165,113 | |
Exchange Traded Funds | | | 4.6 | | | | 35,342,810 | |
Money Market Fund | | | 1.9 | | | | 14,746,402 | |
| | | | | | | | |
| | | 100.0 | % | | $ | 773,254,325 | |
| | | | | | | | |
|
See Notes to Financial Statements |
16
|
|
| |
STATEMENT OF ASSETS AND LIABILITIES |
June 30, 2009 (unaudited) |
| | | | |
| | | | |
Assets: | | | | |
Investments, at value (Cost $675,301,088) | | $ | 773,254,325 | |
Receivables: | | | | |
Investments sold | | | 12,979,724 | |
Shares of beneficial interest sold | | | 589,391 | |
Dividends and interest | | | 1,189,884 | |
| | | | |
Total assets | | | 788,013,324 | |
| | | | |
| | | | |
Liabilities: | | | | |
Payables: | | | | |
Investments purchased | | | 20,692,347 | |
Shares of beneficial interest redeemed | | | 1,224,413 | |
Due to Adviser | | | 621,331 | |
Due to Custodian | | | 1,045,210 | |
Due to Distributor | | | 928 | |
Deferred Trustee fees | | | 106,928 | |
Unrealized depreciation on forward foreign currency exchange contracts | | | 14,103 | |
Accrued expenses | | | 223,929 | |
| | | | |
Total liabilities | | | 23,929,189 | |
| | | | |
NET ASSETS | | $ | 764,084,135 | |
| | | | |
| | | | |
Initial Class Shares: | | | | |
Net Assets | | $ | 697,369,147 | |
| | | | |
| | | | |
Shares of beneficial interest outstanding | | | 29,911,184 | |
| | | | |
| | | | |
Net asset value, redemption and offering price per share | | | $23.31 | |
| | | | |
| | | | |
Class R1 Shares: | | | | |
Net Assets | | $ | 65,654,258 | |
| | | | |
| | | | |
Shares of beneficial interest outstanding | | | 2,816,470 | |
| | | | |
| | | | |
Net asset value, redemption and offering price per share | | | $23.31 | |
| | | | |
| | | | |
Class S Shares: | | | | |
Net Assets | | $ | 1,060,730 | |
| | | | |
| | | | |
Shares of beneficial interest outstanding | | | 46,090 | |
| | | | |
| | | | |
Net asset value, redemption and offering price per share | | | $23.01 | |
| | | | |
| | | | |
Net assets consist of: | | | | |
Aggregate paid in capital | | $ | 806,020,998 | |
| | | | |
Unrealized appreciation of investments, foreign currency transactions and options | | | 97,969,298 | |
Accumulated net investment loss | | | (341,702 | ) |
Accumulated net realized loss on investments and options | | | (139,564,459 | ) |
| | | | |
| | $ | 764,084,135 | |
| | | | |
|
See Notes to Financial Statements |
17
|
|
| |
STATEMENT OF OPERATIONS |
Six Months Ended June 30, 2009 (unaudited) |
| | | | | | | |
Income: | | | | | | | |
Dividends (net of foreign taxes withheld of $171,739) | | | | | $ | 4,059,190 | |
Interest | | | | | | 18,431 | |
| | | | | | | |
Total income | | | | | | 4,077,621 | |
| | | | | | | |
Expenses: | | | | | | | |
Management fees | | $ | 3,184,327 | | | | |
Professional fees | | | 154,308 | | | | |
Insurance | | | 110,048 | | | | |
Reports to shareholders | | | 71,653 | | | | |
Custodian fees | | | 39,347 | | | | |
Trustees’ fees and expenses | | | 35,710 | | | | |
Transfer agent fees – Initial Class Shares | | | 24,100 | | | | |
Transfer agent fees – Class R1 Shares | | | 6,755 | | | | |
Transfer agent fees – Class S Shares | | | 6,082 | | | | |
Interest | | | 1,180 | | | | |
Distribution fees – Class S Shares | | | 500 | | | | |
Other | | | 13,728 | | | | |
| | | | | | | |
Total expenses | | | 3,647,738 | | | | |
Waiver of management fees | | | (5,861 | ) | | | |
| | | | | | | |
Net expenses | | | | | | 3,641,877 | |
| | | | | | | |
Net investment income | | | | | | 435,744 | |
| | | | | | | |
| | | | | | | |
| | | | | | | |
Realized and Unrealized Gain (Loss) on Investments: | | | | | | | |
Net realized loss on investments | | | | | | (56,058,940 | ) |
Net realized loss on foreign currency transactions | | | | | | (274,250 | ) |
Net realized gain on options | | | | | | 1,934,374 | |
Net change in unrealized appreciation (depreciation) of investments and options | | | | | | 201,352,980 | |
Net change in unrealized appreciation (depreciation) of foreign denominated assets and foreign forward currency contracts | | | | | | 16,172 | |
| | | | | | | |
Net realized and unrealized gain on investments | | | | | | 146,970,336 | |
| | | | | | | |
Net Increase in Net Assets Resulting from Operations | | | | | $ | 147,406,080 | |
| | | | | | | |
|
See Notes to Financial Statements |
18
|
| |
|
| |
STATEMENTS OF CHANGES IN NET ASSETS |
| | | | | | | |
| | Six Months
Ended June 30,
2009 | | Year Ended
December 31,
2008 | |
| | | | | |
| | (unaudited) | | | |
Operations: | | | | | | | |
Net investment income | | $ | 435,744 | | $ | 2,964,073 | |
Net realized loss on investments, foreign currency transactions and options | | | (54,398,816 | ) | | (78,413,886 | ) |
Net change in unrealized appreciation (depreciation) of investments, options, foreign denominated assets and foreign forward currency contracts | | | 201,369,152 | | | (469,677,132 | ) |
| | | | | | | |
Net increase (decrease) in net assets resulting from operations | | | 147,406,080 | | | (545,126,945 | ) |
| | | | | | | |
|
Dividends and distributions to shareholders: | | | | | | | |
Dividends from net investment income | | | | | | | |
Initial Class Shares | | | (1,710,192 | ) | | (2,696,806 | ) |
Class R1 Shares | | | (162,607 | ) | | (390,350 | ) |
Class S Shares | | | (1,235 | ) | | (3,815 | ) |
| | | | | | | |
| | | (1,874,034 | ) | | (3,090,971 | ) |
| | | | | | | |
Distributions from net realized capital gains | | | | | | | |
Initial Class Shares | | | (3,391,397 | ) | | (147,675,090 | ) |
Class R1 Shares | | | (322,458 | ) | | (17,488,855 | ) |
Class S Shares | | | (2,448 | ) | | (101,176 | ) |
| | | | | | | |
| | | (3,716,303 | ) | | (165,265,121 | ) |
| | | | | | | |
Total dividends and distributions | | | (5,590,337 | ) | | (168,356,092 | ) |
| | | | | | | |
|
Share transactions*: | | | | | | | |
Proceeds from sales of shares | | | | | | | |
Initial Class Shares | | | 72,127,783 | | | 258,033,721 | |
Class R1 Shares | | | 10,544,073 | | | 29,914,438 | |
Class S Shares | | | 708,045 | | | 864,743 | |
| | | | | | | |
| | | 83,379,901 | | | 288,812,902 | |
| | | | | | | |
Reinvestment of dividends and distributions | | | | | | | |
Initial Class Shares | | | 5,101,589 | | | 150,371,896 | |
Class R1 Shares | | | 485,065 | | | 17,879,205 | |
Class S Shares | | | 3,683 | | | 104,991 | |
| | | | | | | |
| | | 5,590,337 | | | 168,356,092 | |
| | | | | | | |
Cost of shares redeemed | | | | | | | |
Initial Class Shares | | | (50,922,969 | ) | | (253,326,191 | ) |
Class R1 Shares | | | (9,791,743 | ) | | (50,004,374 | ) |
Class S Shares | | | (102,432 | ) | | (675,484 | ) |
Redemption fees | | | 19,344 | | | 81,587 | |
| | | | | | | |
| | | (60,797,800 | ) | | (303,924,462 | ) |
| | | | | | | |
Net increase in net assets resulting from capital share transactions | | | 28,172,438 | | | 153,244,532 | |
| | | | | | | |
Total increase (decrease) in net assets | | | 169,988,181 | | | (560,238,505 | ) |
|
See Notes to Financial Statements |
19
|
| |
|
| |
STATEMENTS OF CHANGES IN NET ASSETS |
(continued) |
| | | | | | | |
| | Six Months
Ended June 30,
2009 | | Year Ended
December 31,
2008 | |
| | | | | |
| | (unaudited) | | | |
Net Assets: | | | | | | | |
Beginning of period | | $ | 594,095,954 | | $ | 1,154,334,459 | |
| | | | | | | |
End of period (including undistributed (accumulated) net investment income (loss) of ($341,702) and $1,370,838, respectively) | | $ | 764,084,135 | | $ | 594,095,954 | |
| | | | | | | |
* Shares of beneficial interest issued, reinvested and redeemed (unlimited number of $.001 par value shares authorized): | | | | | | | |
Initial Class Shares: | | | | | | | |
Shares sold | | | 3,332,199 | | | 7,610,087 | |
Shares reinvested | | | 275,315 | | | 4,583,112 | |
Shares redeemed | | | (2,589,022 | ) | | (8,340,958 | ) |
| | | | | | | |
Net increase | | | 1,018,492 | | | 3,852,241 | |
| | | | | | | |
| | | | | | | |
Class R1 Shares: | | | | | | | |
Shares sold | | | 496,414 | | | 887,699 | |
Shares reinvested | | | 26,192 | | | 545,596 | |
Shares redeemed | | | (477,187 | ) | | (1,629,036 | ) |
| | | | | | | |
Net increase (decrease) | | | 45,419 | | | (195,741 | ) |
| | | | | | | |
| | | | | | | |
Class S Shares: | | | | | | | |
Shares sold | | | 29,979 | | | 26,445 | |
Shares reinvested | | | 201 | | | 3,226 | |
Shares redeemed | | | (4,986 | ) | | (25,362 | ) |
| | | | | | | |
Net increase | | | 25,194 | | | 4,309 | |
| | | | | | | |
|
See Notes to Financial Statements |
20
|
| |
For a share outstanding throughout each period:
| | | | | | | | | | | | | | | | | | | | | |
| | Initial Class Shares | |
| | | | | | | | | | | | | | | | | | | |
|
| | Six Months
Ended
June 30,
2009 | | | |
| | | Year Ended December 31, | |
| | | | | | | | | | | | | | | | | |
| | | 2008 | | 2007 | | 2006 | | 2005 | | 2004 | |
| | | | | | | | | | | | | |
| | (unaudited) | | | | | | | | | | | | | | | | |
Net Asset Value, Beginning of Period | | | $ | 18.75 | | | $ | 41.19 | | $ | 32.71 | | $ | 27.73 | | $ | 18.36 | | $ | 14.84 | |
| | | | | | | | | | | | | | | | | | | | | |
Income (Loss) From | | | | | | | | | | | | | | | | | | | | | |
Investment Operations: | | | | | | | | | | | | | | | | | | | | | |
Net Investment Income (Loss) | | | | 0.01 | | | | 0.11 | | | (0.02 | ) | | 0.06 | | | (0.01 | ) | | 0.08 | |
Net Realized and Unrealized Gain (Loss) on Investments | | | | 4.73 | | | | (16.53 | ) | | 12.94 | | | 6.64 | | | 9.45 | | | 3.50 | |
| | | | | | | | | | | | | | | | | | | | | |
Total from Investment Operations | | | | 4.74 | | | | (16.42 | ) | | 12.92 | | | 6.70 | | | 9.44 | | | 3.58 | |
| | | | | | | | | | | | | | | | | | | | | |
Less: | | | | | | | | | | | | | | | | | | | | | |
Dividends from Net Investment Income | | | | (0.06 | ) | | | (0.11 | ) | | (0.05 | ) | | (0.02 | ) | | (0.07 | ) | | (0.06 | ) |
Distributions from Net Realized Capital Gains | | | | (0.12 | ) | | | (5.91 | ) | | (4.39 | ) | | (1.70 | ) | | — | | | — | |
| | | | | | | | | | | | | | | | | | | | | |
Total Dividends and Distributions | | | | (0.18 | ) | | | (6.02 | ) | | (4.44 | ) | | (1.72 | ) | | (0.07 | ) | | (0.06 | ) |
| | | | | | | | | | | | | | | | | | | | | |
Redemption Fees | | | | — | (c) | | | — | (c) | | — | (c) | | — | (c) | | — | (c) | | — | (c) |
| | | | | | | | | | | | | | | | | | | | | |
Net Asset Value, End of Period | | | $ | 23.31 | | | $ | 18.75 | | $ | 41.19 | | $ | 32.71 | | $ | 27.73 | | $ | 18.36 | |
| | | | | | | | | | | | | | | | | | | | | |
Total Return (a) | | | | 25.50 | %(e) | | | (46.12 | )% | | 45.36 | % | | 24.54 | % | | 51.67 | % | | 24.23 | % |
| | | | | | | | | | | | | | | | | | | | | | |
Ratios/Supplementary Data | | | | | | | | | | | | | | | | | | | | | |
Net Assets, End of Period (000) | | | $ | 697,369 | | | $ | 541,777 | | $ | 1,031,487 | | $ | 642,822 | | $ | 424,017 | | $ | 190,206 | |
Ratio of Gross Expenses to Average Net Assets | | | | 1.11 | %(d) | | | 0.99 | % | | 1.01 | % | | 1.13 | % | | 1.17 | % | | 1.20 | % |
Ratio of Net Expenses to Average Net Assets (b) | | | | 1.11 | %(d) | | | 0.99 | % | | 1.01 | % | | 1.13 | % | | 1.17 | % | | 1.20 | % |
Ratio of Net Investment Income (Loss) to Average Net Assets | | | | 0.13 | %(d) | | | 0.28 | % | | (0.09 | )% | | 0.17 | % | | (0.03 | )% | | 0.54 | % |
Portfolio Turnover Rate | | | | 58 | %(e) | | | 76 | % | | 94 | % | | 78 | % | | 52 | % | | 60 | % |
| |
(a) | Total return is calculated assuming an initial investment of $10,000 made at the net asset value at the beginning of the year, reinvestment of any dividends and distributions at net asset value on the dividend/distribution payment date and a redemption on the last day of the year. The return does not reflect the deduction of taxes that a shareholder would pay on Fund dividends/distributions or the redemption of Fund shares. |
(b) | Excluding interest expense, the ratio would be 1.00% for the year ended December 31, 2007. The ratio for all other years shown would be unchanged if any interest expense incurred during those years was excluded. |
(c) | Amount represents less than $0.005 per share. |
(d) | Annualized |
(e) | Not annualized |
|
See Notes to Financial Statements |
21 |
|
|
| |
|
| |
FINANCIAL HIGHLIGHTS |
(continued) |
For a share outstanding throughout each period:
| | | | | | | | | | | | | | | | | | | | | | | | | | | | | | |
| | Class R1 Shares |
| | | | | | | | | | | | | | | | | | |
| | Six Months
Ended
June 30,
2009 | | | | | | | | | | | | | | For the
Period
May 1, 2004*
through
December 31,
2004 |
| | | | | | | | | | | | | | |
| | | Year Ended December 31, | |
| | | | | | | | | | | | | | |
| | | 2008 | | 2007 | | 2006 | | 2005 | |
| | | | | | | | | | | | |
| | (unaudited) | | | | | | | | | | | | | | | |
Net Asset Value, Beginning of Period | | | $ | 18.74 | | | | $ | 41.18 | | | | $ | 32.70 | | | | $ | 27.73 | | | | $ | 18.36 | | | | $ | 14.54 | |
| | | | | | | | | | | | | | | | | | | | | | | | | | | | | | |
Income (Loss) from | | | | | | | | | | | | | | | | | | | | | | | | | | | | | | |
Investment Operations: | | | | | | | | | | | | | | | | | | | | | | | | | | | | | | |
Net Investment Income (Loss) | | | | 0.01 | | | | | 0.09 | | | | | (0.03 | ) | | | | 0.04 | | | | | 0.01 | | | | | 0.03 | |
Net Realized and Unrealized Gain (Loss) on Investments | | | | 4.74 | | | | | (16.49 | ) | | | | 12.95 | | | | | 6.65 | | | | | 9.43 | | | | | 3.79 | |
| | | | | | | | | | | | | | | | | | | | | | | | | | | | | | |
Total from Investment Operations | | | | 4.75 | | | | | (16.40 | ) | | | | 12.92 | | | | | 6.69 | | | | | 9.44 | | | | | 3.82 | |
| | | | | | | | | | | | | | | | | | | | | | | | | | | | | | |
Less: | | | | | | | | | | | | | | | | | | | | | | | | | | | | | | |
Dividends from Net Investment Income | | | | (0.06 | ) | | | | (0.13 | ) | | | | (0.05 | ) | | | | (0.02 | ) | | | | (0.07 | ) | | | | — | |
Distributions from Net Realized Capital Gains | | | | (0.12 | ) | | | | (5.91 | ) | | | | (4.39 | ) | | | | (1.70 | ) | | | | — | | | | | — | |
| | | | | | | | | | | | | | | | | | | | | | | | | | | | | | |
Total Dividends and Distributions | | | | (0.18 | ) | | | | (6.04 | ) | | | | (4.44 | ) | | | | (1.72 | ) | | | | (0.07 | ) | | | | — | |
| | | | | | | | | | | | | | | | | | | | | | | | | | | | | | |
Redemption fees | | | | — | (c) | | | | — | (c) | | | | — | (c) | | | | — | (c) | | | | — | (c) | | | | — | (c) |
| | | | | | | | | | | | | | | | | | | | | | | | | | | | | | |
Net Asset Value, End of Period | | | $ | 23.31 | | | | $ | 18.74 | | | | $ | 41.18 | | | | $ | 32.70 | | | | $ | 27.73 | | | | $ | 18.36 | |
| | | | | | | | | | | | | | | | | | | | | | | | | | | | | | |
Total Return (a) | | | | 25.57 | %(e) | | | | (46.10 | )% | | | | 45.37 | % | | | | 24.49 | % | | | | 51.61 | % | | | | 26.27 | %(e) |
| | | | | | | | | | | | | | | | | | | | | | | | | | | | | | | |
Ratios/Supplementary Data | | | | | | | | | | | | | | | | | | | | | | | | | | | | | | |
Net Assets, End of Period (000) | | | $ | 65,654 | | | | $ | 51,932 | | | | $ | 122,166 | | | | $ | 89,949 | | | | $ | 84,113 | | | | $ | 25,952 | |
Ratio of Gross Expenses to Average Net Assets | | | | 1.13 | %(d) | | | | 0.99 | % | | | | 1.02 | % | | | | 1.15 | % | | | | 1.19 | % | | | | 1.32 | %(d) |
Ratio of Net Expenses to Average Net Assets (b) | | | | 1.13 | %(d) | | | | 0.99 | % | | | | 1.02 | % | | | | 1.15 | % | | | | 1.19 | % | | | | 1.24 | %(d) |
Ratio of Net Investment Income (Loss) to Average Net Assets | | | | 0.12 | %(d) | | | | 0.27 | % | | | | (0.10 | )% | | | | 0.14 | % | | | | (0.06 | )% | | | | 0.39 | %(d) |
Portfolio Turnover Rate | | | | 58 | %(e) | | | | 76 | % | | | | 94 | % | | | | 78 | % | | | | 52 | % | | | | 60 | % |
| |
(a) | Total return is calculated assuming an initial investment of $10,000 made at the net asset value at the beginning of the period, reinvestment of any dividends and distributions at net asset value on the dividend/distribution payment date and a redemption on the last day of the period. The return does not reflect the deduction of taxes that a shareholder would pay on Fund dividends/distributions or the redemption of Fund shares. |
(b) | Excluding interest expense, the ratio would be 1.01% and 1.14% for the Class R1 Shares for the years ending December 31, 2007 and 2006, respectively, and 1.30% and 1.19% for the Class S Shares for the years ended December 31, 2008 and 2007, respectively. The ratio for all other periods shown would be unchanged if any interest expense incurred during those periods was excluded. |
(c) | Amount represents less than $0.005 per share. |
(d) | Annualized |
(e) | Not annualized |
* | Inception date of Class R1 Shares. |
^ | Inception date of Class S Shares. |
|
See Notes to Financial Statements |
22
|
| |
| | | | | | | | | | | | | | | | | | | | |
| | Class S Shares |
| | | | | | | | | | | | |
| | Six Months
Ended
June 30,
2009 | | | | | | | | For the
Period
May 1, 2006^
through
December 31,
2006 |
| | | | | | | | |
| | | Year Ended December 31, | |
| | | | |
| | | 2008 | | 2007 | |
| | | | | | | | |
| | (unaudited) | | | | | | | | | |
Net Asset Value, Beginning of Period | | | $ | 18.53 | | | | $ | 41.05 | | | | $ | 32.72 | | | | $ | 32.55 | |
| | | | | | | | | | | | | | | | | | | | |
Income (Loss) from | | | | | | | | | | | | | | | | | | | | |
Investment Operations: | | | | | | | | | | | | | | | | | | | | |
Net Investment Income (Loss) | | | | — | | | | | 0.05 | | | | | (0.03 | ) | | | | 0.07 | |
Net Realized and Unrealized Gain (Loss) on Investments | | | | 4.66 | | | | | (16.44 | ) | | | | 12.80 | | | | | 0.10 | |
| | | | | | | | | | | | | | | | | | | | |
Total from Investment Operations | | | | 4.66 | | | | | (16.39 | ) | | | | 12.77 | | | | | 0.17 | |
| | | | | | | | | | | | | | | | | | | | |
Less: | | | | | | | | | | | | | | | | | | | | |
Dividends from Net Investment Income | | | | (0.06 | ) | | | | (0.22 | ) | | | | (0.05 | ) | | | | — | |
Distributions from Net Realized Capital Gains | | | | (0.12 | ) | | | | (5.91 | ) | | | | (4.39 | ) | | | | — | |
| | | | | | | | | | | | | | | | | | | | |
Total Dividends and Distributions | | | | (0.18 | ) | | | | (6.13 | ) | | | | (4.44 | ) | | | | — | |
| | | | | | | | | | | | | | | | | | | | |
Redemption fees | | | | — | (c) | | | | — | (c) | | | | — | (c) | | | | — | (c) |
| | | | | | | | | | | | | | | | | | | | |
Net Asset Value, End of Period | | | $ | 23.01 | | | | $ | 18.53 | | | | $ | 41.05 | | | | $ | 32.72 | |
| | | | | | | | | | | | | | | | | | | | |
Total Return (a) | | | | 25.37 | %(e) | | | | (46.35 | )% | | | | 44.83 | % | | | | 0.49 | %(e) |
| | | | | | | | | | | | | | | | | | | | | |
Ratios/Supplementary Data | | | | | | | | | | | | | | | | | | | | |
Net Assets, End of Period (000) | | | $ | 1,061 | | | | $ | 387 | | | | $ | 681 | | | | $ | 92 | |
Ratio of Gross Expenses to Average Net Assets | | | | 3.76 | %(d) | | | | 2.90 | % | | | | 5.79 | % | | | | 11.91 | %(d) |
Ratio of Net Expenses to Average Net Assets (b) | | | | 1.40 | %(d) | | | | 1.31 | % | | | | 1.20 | % | | | | 1.21 | %(d) |
Ratio of Net Investment Income (Loss) to Average Net Assets | | | | (0.17 | )%(d) | | | | (0.02 | )% | | | | (0.30 | )% | | | | 0.61 | %(d) |
Portfolio Turnover Rate | | | | 58 | %(e) | | | | 76 | % | | | | 94 | % | | | | 78 | % |
|
See Notes to Financial Statements |
23
|
| |
|
| |
NOTES TO FINANCIAL STATEMENTS |
June 30, 2009 (unaudited) |
Note 1—Fund Organization—Van Eck Worldwide Insurance Trust (the “Trust”), is registered under the Investment Company Act of 1940, as amended, as an open-end management investment company. The Trust was organized as a Massachusetts business trust on January 7, 1987. The Worldwide Hard Assets Fund (the “Fund”) is a non-diversified series of the Trust and seeks long-term capital appreciation by investing primarily in hard asset securities. The Fund offers three classes of shares: Initial Class Shares that have been continuously offered since the inception of the Fund, Class R1 Shares that became available for purchase on May 1, 2004 and Class S Shares that became available for purchase on May 1, 2006. The three classes are identical except Class R1 Shares are, under certain circumstances, subject to a redemption fee on redemptions within 60 days of purchase and Class S Shares are subject to a distribution fee.
Note 2—Significant Accounting Policies—The preparation of financial statements in conformity with U.S. generally accepted accounting principles requires management to make estimates and assumptions that effect the reported amounts and disclosures in the financial statements. Actual results could differ from those estimates.
The following is a summary of significant accounting policies followed by the Fund.
| |
A. | Security Valuation—Securities traded on national exchanges or traded on the NASDAQ National Market System are valued at the last sales price as reported at the close of each business day. Securities traded on the NASDAQ Stock Market are valued at the NASDAQ official closing price. Over-the-counter securities not included in the NASDAQ National Market System and listed securities for which no sale was reported are valued at the mean of the bid and ask prices. Securities for which market values are not readily available, or whose values have been affected by events occurring before the Fund’s pricing time (4:00 p.m. Eastern Time) but after the close of the securities’ primary market, are valued using methods approved by the Board of Trustees. The Fund may also fair value securities in other situations, for example, when a particular foreign market is closed but the Fund is open. The price which the Fund may realize upon sale of an investment may differ materially from the value presented on the Schedule of Investments. Money Market Fund investments are valued at net asset value. Short-term obligations purchased with more than sixty days remaining to maturity are valued at market value. Short-term obligations purchased with sixty days or less to maturity are valued at amortized cost, which with accrued interest approximates market value. Futures are valued using the closing price reported at the close of the respective exchange. Forward foreign currency contracts are valued at the spot currency rate plus an amount (“points”), |
24
| | |
| which reflects the differences in interest rates between the U.S. and foreign markets. Securities for which quotations are not available are stated at fair value as determined by a Pricing Committee of the Adviser appointed by the Board of Trustees. Certain factors such as economic conditions, political events, market trends and security specific information are used to determine the fair value for these securities. Short-term investments held as collateral for securities loaned are valued at net asset value. |
| | |
| In accordance with Financial Accounting Standards Board (“FASB”) Statement of Financial Accounting Standards No. 157 Fair Value Measurements (FAS 157), the Fund utilizes various methods to measure the fair value of most of its investments on a recurring basis. FAS 157 establishes a hierarchy that prioritizes inputs to valuation methods used to measure fair value. The hierarchy gives highest priority to unadjusted quoted prices in active markets for identical assets and liabilities (Level 1 measurements) and the lowest priority to unobservable inputs (Level 3 measurements). The three levels of the fair value hierarchy under FAS 157 are described below: |
| | |
| Level 1 — | Quoted prices in active markets for identical securities. |
| | |
| Level 2 — | Significant observable inputs (including quoted prices for similar securities, interest rates, prepayment speeds, credit risk, etc.). |
| | |
| Level 3 — | Significant unobservable inputs (including the Fund’s own assumptions in determining the fair value of investments). |
| | |
| In April 2009, FASB Staff Position No. 157-4, Determining Fair Value When the Volume and Level of Activity for the Asset or Liability Have Significantly Decreased and Identifying Transactions That Are Not Orderly, (“Position 157-4”) was issued and is effective for fiscal years and interim periods ending after June 15, 2009. Position 157-4 provides additional guidance for estimating fair value in accordance with FAS 157 when the volume and level of activity for the asset or liability have significantly decreased and also includes guidance on identifying circumstances that indicate a transaction is not orderly. Position 157-4 also requires additional disclosures on fair valuation inputs and techniques and requires expanded fair value hierarchy disclosures by each major security type. The Fund has adopted Position 157-4 effective June 30, 2009. |
25
|
| |
NOTES TO FINANCIAL STATEMENTS |
(unaudited) (continued) |
| |
| The inputs or methodology used for valuing securities are not necessarily an indication of the risk associated with investing in those securities. The following table summarizes the valuation of the Fund’s investments by the above fair value hierarchy levels as of June 30, 2009: |
| | | | | | | | | | | | | |
| | Level 1
Quoted
Prices | | Level 2
Significant
Observable
Inputs | | Level 3
Significant
Unobservable
Inputs | | Market
Value of
Investments | |
| | | | | | | | | |
Common Stocks: | | | | | | | | | | | | | |
Brazil | | $ | 22,702,920 | | $ | — | | $ | — | | $ | 22,702,920 | |
Canada | | | 143,628,401 | | | — | | | — | | | 143,628,401 | |
France | | | 14,425,180 | | | — | | | — | | | 14,425,180 | |
Kazakhstan | | | — | | | 10,235,479 | | | — | | | 10,235,479 | |
Kuwait | | | — | | | — | | | 10,479,555 | | | 10,479,555 | |
United Kingdom | | | 35,409,077 | | | 34,405,748 | | | — | | | 69,814,825 | |
United States | | | 448,981,617 | | | — | | | 2,897,136 | | | 451,878,753 | |
Exchange Traded Funds: | | | | | | | | | | | | | |
United States | | | 35,342,810 | | | — | | | — | | | 35,342,810 | |
Money Market Fund: | | | | | | | | | | | | | |
United States | | | 14,746,402 | | | — | | | — | | | 14,746,402 | |
| | | | | | | | | | | | | |
Total | | $ | 715,236,407 | | $ | 44,641,227 | | $ | 13,376,691 | | $ | 773,254,325 | |
| | | | | | | | | | | | | |
| |
| The following table reconciles the valuation of the fund’s Level 3 investment securities and related transactions during the six months ended June 30, 2009: |
| | | | |
Balance as of 12/31/08 | | $ | 12,390,616 | |
Realized gain (loss) | | | — | |
Change in unrealized appreciation (depreciation) | | | 986,075 | |
Net purchases (sales) | | | — | |
Transfers in and/or out of Level 3 | | | — | |
| | | | |
Balance as of 6/30/09 | | $ | 13,376,691 | |
| | | | |
| |
B. | Federal Income Taxes—It is the Fund’s policy to comply with the provisions of the Internal Revenue Code applicable to regulated investment companies and to distribute all of its taxable income to its shareholders. Therefore, no federal income tax provision is required. |
| |
C. | Currency Translation—Assets and liabilities denominated in foreign currencies and commitments under forward foreign currency contracts are translated into U.S. dollars at the closing prices of such currencies each business day. Purchases and sales of investments are translated at the exchange rates prevailing when such investments are acquired or sold. Income and expenses are translated at the exchange rates prevailing when accrued. The portion of realized and unrealized gains and losses on investments that result from fluctuations in foreign currency exchange rates is |
26
| |
| not separately disclosed. Recognized gains or losses attributable to foreign currency fluctuations on foreign currency denominated assets, other than investments, and liabilities are recorded as net realized gains and losses from foreign currency transactions. |
| |
D. | Dividends and Distributions to Shareholders—Dividends to shareholders from net investment income and distributions from net realized capital gains, if any, are declared and paid annually. Income dividends and capital gain distributions are determined in accordance with income tax regulations, which may differ from such amounts determined in accordance with U.S. generally accepted accounting principles. |
| |
E. | Other—Security transactions are accounted for on trade date. Dividend income is recorded on the ex-dividend date. Dividends on foreign securities are recorded when the Fund is informed of such dividends. Realized gains and losses are calculated on the specific identified cost basis. Interest income, including amortization of premiums and discounts, is accrued as earned. Estimated foreign taxes that are expected to be withheld from proceeds at the sale of certain foreign investments are accrued by the Fund and decrease the unrealized gain on investments. |
| |
| Income, expenses (excluding class-specific expenses) and realized/unrealized gains/losses are allocated proportionately to each class of shares based upon the relative net asset value of outstanding shares of each class at the beginning of the day (after adjusting for current capital share activity of the respective classes). Class-specific expenses are charged directly to the applicable class of shares. |
| |
F. | Use of Derivative Instruments—In March 2008, the FASB issued Statement of Financial Accounting Standards No. 161, “Disclosures about Derivative Instruments and Hedging Activities” (“FAS 161”), which is effective for fiscal years and interim periods beginning after November 15, 2008. FAS 161 changes the disclosure requirements for derivative instruments and hedging activities requiring that: (1) the objectives for using derivative instruments be disclosed in terms of underlying risk and accounting designation, (2) the fair values of derivative instruments and their gains and losses be disclosed in a tabular format, and (3) information be disclosed about credit-risk contingent features of derivatives contracts. The Fund adopted FAS 161 January 1, 2009. Details of this disclosure are found below as well as in the Schedule of Investments and Notes to Financial Statements. |
27
|
| |
NOTES TO FINANCIAL STATEMENTS |
(unaudited) (continued) |
| | | | | | | | | | | |
| | Fair value of derivative instruments
as of June 30, 2009 | |
| | | |
Derivative contracts not
accounted for as
hedging instruments
under Statement 133 | | Balance Sheet Location | | Derivative Liabilities | |
| | | | | | |
Forward Foreign Currency Contracts | | Payables, Net Assets – Unrealized depreciation | | | | $14,103 | | |
| | | | | | | | | | | |
| | The effect of derivative instruments on the Statement of
Operations for the six months ended June 30, 2009 | |
| | | |
Derivative contracts not
accounted for as
hedging instruments
under Statement 133 | | Amount of realized
gains/(losses) on derivatives
recognized in income | | Change in unrealized
appreciation/(depreciation)
on derivatives recognized
in income | |
| | | | | | |
Forward Foreign Currency Contracts | | | $ | (297,078 | ) | | | $ | (14,103 | ) | |
Equity Contracts – Options | | | | 1,934,374 | | | | | (593,028 | ) | |
| |
| Option Contracts—The Fund is subject to equity price risk, interest rate risk and commodity price risk in the normal course of pursuing its investment objectives. The Fund may invest, for hedging and other purposes, in call and put options on securities, currencies and commodities. Call and put options give the Fund the right but not the obligation to buy (calls) or sell (puts) the instrument underlying the option at a specified price. The premium paid on the option, should it be exercised, will, on a call, increase the cost of the instrument acquired and, on a put, reduce the proceeds received from the sale of the instrument underlying the option. If the options are not exercised, the premium paid will be recorded as a realized loss upon expiration. The Fund may incur additional risk to the extent the value of the underlying instrument does not correlate with the movement of the option value. |
| |
| The Fund may also write call or put options. As the writer of an option, the Fund receives a premium. The Fund keeps the premium whether or not the option is exercised. The premium will be recorded, upon expiration of the option, as a short-term realized gain. If the option is exercised, the Fund must sell, in the case of a written call, or buy, in the case of a written put, the underlying instrument at the exercise price. The Fund may write only covered puts and calls. A covered call option is an option in which the Fund owns the instrument underlying the call. A covered call sold by the Fund exposes it during the term of the option to possible loss of opportunity to realize appreciation in the market price of the underlying instrument or to possible continued holding of an underlying instrument which might otherwise have been sold to protect against a decline in the market price. A covered put exposes the Fund during the term of the option to a decline in price of the underlying instrument. A put option sold by the Fund is covered when, among |
28
| |
| other things, cash or short-term liquid securities are placed in a segregated account to fulfill the obligations undertaken. The Fund may incur additional risk from investments in written currency options if there are unanticipated movements in the underlying currencies. Transactions in call options written for the six months ended June 30, 2009 were as follows: |
| | | | | | | |
| | Number
of
Contracts | | Premiums | |
| | | | | |
Options outstanding at December 31, 2008 | | | 3,877 | | $ | 847,808 | |
Options written | | | 12,162 | | | 2,797,019 | |
Options exercised | | | (6,119 | ) | | (1,934,374 | ) |
Options expired | | | (9,920 | ) | | (1,710,453 | ) |
| | | | | | | |
Options outstanding at June 30, 2009 | | | — | | $ | — | |
| | | | | | | |
| |
| Futures Contracts—The Fund is subject to equity price risk in the normal course of pursuing its investment objectives. The Fund may buy and sell financial futures contracts to hedge against changes in the value of equity securities. When the Fund enters into a futures contract, it must make an initial deposit (“initial margin”) as a partial guarantee of its performance under the contract. As the value of the futures contract fluctuates, the Fund is required to make additional margin payments (“variation margin”) to cover any additional obligation it may have under the contract. In the remote chance that a broker cannot fulfill its obligation, the Fund could lose the variation margin due to it. Risks may be caused by an imperfect correlation between the movements in the price of the futures contract and the price of the underlying instrument and interest rates. Realized gains and losses from futures contracts are reported separately. At June 30, 2009, the Fund had no futures contracts outstanding. |
| |
| Structured Notes—The Fund may invest in indexed securities whose value is linked to one or more currencies, interest rates, commodities or financial commodity indices. When the Fund purchases a structured note (a non-publicly traded indexed security entered into directly between two parties) it will make a payment of principal to the counterparty. The Fund will purchase structured notes only from counterparties rated A or better by S&P, Moody’s or another nationally recognized statistical rating organization. Van Eck Associates Corporation will monitor the liquidity of structured notes under the supervision of the Board of Trustees and structured notes determined to be illiquid will be aggregated with other illiquid securities limited to 15% of the net assets of the Fund. Indexed securities may be more volatile than the underlying instrument itself, and present many of the same risks as investing in futures and options. Indexed securities are also subject to credit risks associated |
29
|
| |
NOTES TO FINANCIAL STATEMENTS |
(unaudited) (continued) |
| |
| with the counterparty of the security with respect to both principal and interest. At June 30, 2009, the Fund had no structured notes outstanding. |
| |
G. | Restricted Securities—The Fund may invest in securities that are subject to legal or contractual restrictions on resale. These securities generally may be resold in transactions exempt from registration or to the public if the securities are registered. Disposal of these securities may involve time-consuming negotiations and expense, and prompt sale at an acceptable price may be difficult. Information regarding restricted securities is included at the end of the Fund’s Schedule of Investments. |
Note 3—Management Fees—Van Eck Associates Corporation (the “Adviser”) is the investment adviser to the Fund. The Adviser receives a management fee, calculated daily and payable monthly based on an annual rate of 1.00% on the first $500 million of average daily net assets, 0.90% on the next $250 million of average daily net assets and 0.70% on the average daily net assets in excess of $750 million. For the period May 1, 2008 through April 30, 2009, the Adviser had agreed to waive management fees and/or assume expenses, excluding interest, taxes, and extraordinary expenses, exceeding 1.20% of average daily net assets for the Initial Class shares and Class R1 shares and 1.35% for the Class S shares. For the period May 1, 2009 through April 30, 2010, the waiver is 1.20% for the Initial Class shares and Class R1 shares and 1.45% for the Class S shares. For the six months ended June 30, 2009, the Adviser waived management fees in the amount of $5,861 attributable to Class S Shares. Certain of the officers and trustees of the Trust are officers, directors or stockholders of the Adviser and Van Eck Securities Corporation, the Distributor.
Note 4—Distribution/12b-1 Plan—The Fund and Van Eck Securities Corporation (the “Distributor”) are parties to a distribution agreement dated May 1, 2006. The Fund has adopted a Distribution Plan (the “Plan”) for Class S Shares in accordance with Rule 12b-1 under the 1940 Act. Pursuant to the Plan, the Fund is authorized to incur distribution expenses for its Class S Shares which will principally be payments to securities dealers who have sold shares and serviced shareholder accounts and payments to the Distributor, for reimbursement of other actual promotion and distribution expenses incurred by the Distributor on behalf of the Fund. For periods prior to April 30, 2009, the amount paid under the Plan was limited to 0.15% of the Class S Shares average daily net assets. Commencing May 1, 2009, the amount paid under the Plan was increased to 0.25% of the Class S Shares average daily net assets.
Note 5—Investments—For the six months ended June 30, 2009, the cost of purchases and proceeds from sales of investments—other than U.S. government securities and short-term obligations aggregated $412,522,840 and $373,033,595, respectively.
30
Note 6—Income Taxes—For Federal income tax purposes, the identified cost of investments owned at June 30, 2009 was $684,560,317 and net unrealized appreciation aggregated $88,694,008 of which $142,694,987 related to appreciated securities and $54,000,979 related to depreciated securities.
The tax character of dividends and distributions paid to shareholders were as follows:
| | | | | | | |
| | Six Months Ended
June 30,
2009 | | Year Ended
December 31,
2008 | |
| | | | | |
Ordinary income | | $ | 1,874,034 | | $ | 63,731,031 | |
Long term capital gains | | | 3,716,303 | | | 104,625,061 | |
| | | | | | | |
Total | | $ | 5,590,337 | | $ | 168,356,092 | |
| | | | | | | |
The Financial Accounting Standards Board Interpretation No. 48 requires the evaluation of tax positions taken or expected to be taken in the course of preparing the Fund’s tax returns to determine whether the tax positions will “more-likely-than-not” be sustained by the applicable tax authority, and is applicable to all open tax years (tax years ended December 31, 2005-2008). The Fund evaluated the tax positions taken and to be taken, and concluded that no provision for income tax is required in the Fund’s financial statements.
Note 7—Concentration of Risk—The Fund may purchase securities on foreign exchanges. Securities of foreign issuers involve special risks and considerations not typically associated with investing in U.S. issuers. These risks include devaluation of currencies, less reliable information about issuers, different securities transaction clearance and settlement practices, and future adverse political and economic developments. These risks are heightened for investments in emerging market countries. Moreover, securities of many foreign issuers and their markets may be less liquid and their prices more volatile than those of comparable U.S. issuers.
The Fund may concentrate its investments in companies which are significantly engaged in the exploration, development, production and distribution of gold and other natural resources such as strategic and other metals, minerals, forest products, oil, natural gas and coal and by investing in gold bullion and coins. Since the Fund may so concentrate, it may be subject to greater risks and market fluctuations than other more diversified portfolios. The production and marketing of gold and other natural resources may be affected by actions and changes in governments. In addition, gold and natural resources may be cyclical in nature.
At June 30, 2009, the aggregate shareholder accounts of three insurance companies own approximately 68%, 14% and 8% of the Initial Class Shares and
31
|
| |
NOTES TO FINANCIAL STATEMENTS |
(unaudited) (continued) |
one of whom owns approximately 100% of the Class R1 Shares. Additionally, two insurance companies own approximately 51% and 42% of the Class S Shares.
Note 8—Warrants—The Fund may invest in warrants whose values are linked to indices or underlying instruments. The Fund may use these warrants to gain exposure to markets that might be difficult to invest in through conventional securities. Warrants may be more volatile than their linked indices or underlying instruments. Potential losses are limited to the amount of the original investment.
Note 9—Forward Foreign Currency Contracts—The Fund is subject to foreign currency risk in the normal course of pursuing its investment objectives. The Fund may buy and sell forward foreign currency contracts to settle purchases and sales of foreign denominated securities or to hedge foreign denominated assets. The Fund may incur additional risk from investments in forward foreign currency contracts if the counterparty is unable to fulfill its obligation or there are unanticipated movements of the foreign currency relative to the U.S. dollar. At June 30, 2009, the Fund had no outstanding forward foreign currency contracts.
Note 10—Trustee Deferred Compensation Plan—The Trust has a Deferred Compensation Plan (the “Plan”) for Trustees under which the Trustees can elect to defer receipt of their trustee fees until retirement, disability or termination from the Board of Trustees. The fees otherwise payable to the participating Trustees are deemed invested in shares of the Van Eck Funds (another registered investment company managed by the Adviser) as directed by the Trustees.
The expense for the deferred compensation plan is included in “Trustees’ fees and expenses” in the Statement of Operations. The liability for the deferred compensation plan is shown as “Deferred Trustee fees” in the Statement of Assets and Liabilities.
Note 11—Equity Swap—The Fund may enter into an equity swap to gain investment exposure to the relevant market of the underlying security. A swap is an agreement that obligates the parties to exchange cash flows at specified intervals. The Fund is obligated to pay the counterparty on trade date an amount based upon the value of the underlying instrument (notional amount) and, at termination date, final payment is settled based on the value of the underlying security on trade date versus the value on termination date plus accrued dividends. Risks may arise as a result of the failure of the counterparty to the contract to comply with the terms of the swap contract. The Fund bears the risk of loss of the amount expected to be received under a swap agreement in the event of the default of the counterparty. Therefore, the Fund considers the creditworthiness of each counterparty to a swap contract in evaluating potential credit risk. Additionally, risks may arise from unanticipated movements in the
32
value of the swap relative to the underlying securities. The Fund records a net receivable or payable daily, based on the change in the value of the underlying securities. The net receivable or payable for financial statement purposes is shown as due to or from broker on the Statement of Assets and Liabilities. At June 30, 2009, there were no equity swaps outstanding.
Note 12—Commodity Swap—The Fund may enter into a commodity swap to gain investment exposure to the relevant spread of the commodity reference prices. A swap is an agreement that obligates the parties to exchange cash flows at specified intervals. At termination date, a final payment is made based on the swap’s notional amount on trade date versus the value on termination date. Risks may arise as a result of the failure of the counterparty to the contract to comply with the terms of the swap contract. The Fund bears the risk of loss of the amount expected to be received under a swap agreement in the event of the default of the counterparty. Therefore, the Fund considers the credit worthiness of each counterparty to a swap contract in evaluating potential credit risk. Additionally, risks may arise from unanticipated movements in the value of the swap relative to the underlying reference prices. The Fund records a net receivable or payable daily, based on the change in the value of the swap. The net receivable or payable for financial statement purposes is shown as due to or from broker on the Statement of Assets and Liabilities. At June 30, 2009, there were no commodity swaps outstanding.
Note 13—Bank Line of Credit—The Trust may participate with the Van Eck Funds (together the “Funds”) in a $10 million committed credit facility (“Facility”) to be utilized for temporary financing until the settlement of sales or purchases of portfolio securities, the repurchase or redemption of shares of the Funds, including the Fund, at the request of the shareholders and other temporary or emergency purposes. The Funds have agreed to pay commitment fees, pro rata, based on the unused but available balance. Interest is charged to the Funds at rates based on prevailing market rates in effect at the time of borrowings. During the period ended June 30, 2009, the Fund borrowed under this Facility. The average daily balance during the 10 day period during which the loan was outstanding amounted to $5,230,922 and the weighted average interest rate was 0.83%. At June 30, 2009, there were no outstanding borrowings by the Fund under the Facility.
Note 14—Securities Lending—To generate additional income, the Fund may lend its securities pursuant to a securities lending agreement with State Street Bank & Trust Co., the securities lending agent and also the Fund’s custodian. The Fund may lend up to 50% of its investments requiring that the loan be continuously collateralized by cash, U.S. government or U.S. government agency securities, shares of an investment trust or mutual fund, or any
33
|
| |
NOTES TO FINANCIAL STATEMENTS |
(unaudited) (continued) |
combination of cash and such securities at all times to at least 102% (105% for foreign securities) of the market value plus accrued interest on the securities loaned. During the term of the loan, the Fund will continue to receive any dividends or amounts equivalent thereto, on the securities loaned while receiving a fee from the borrower or earning interest on the investment of the cash collateral. Securities lending income is disclosed as such in the Statements of Operations. The collateral for securities loaned is recognized in the Schedule of Investments and the Statement of Assets and Liabilities. The cash collateral is maintained on the Fund’s behalf by the lending agent and is invested in a money market portfolio. Loans are subject to termination at the option of the borrower or the Fund. Upon termination of the loan, the borrower will return to the lender securities identical to the securities loaned. The Fund may pay reasonable finders’, administrative and custodial fees in connection with a loan of its securities and may share the interest earned on the collateral with the securities lending agent. The Fund bears the risk of delay in recovery of, or even loss of rights in, the securities loaned should the borrower of the securities fail financially. For the six months ended June 30, 2009, there was no securities lending activity.
Note 15—Custodian Fees—The Fund has entered into an expense offset agreement with its custodian wherein it receives credit toward the reduction of custodian fees whenever there are uninvested cash balances. For the six months ended June 30, 2009, there were no offsets of custodial fees.
Note 16—Subsequent Event Review—The Fund has adopted FASB Statement No.165, Subsequent Events (“FAS 165”) which was issued in May 2009 and is effective for fiscal years and interim periods ending after June 15, 2009. FAS 165, requires evaluation of subsequent events through the date of financial statement issuance. Subsequent events for the Fund have been evaluated through, August, 17, 2009, and there were no material subsequent events requiring disclosure.
34
|
| |
APPROVAL OF ADVISORY AGREEMENT |
The Investment Company Act of 1940, as amended, provides, in substance, that each investment advisory agreement between a fund and its investment advisers will continue in effect from year to year only if its continuance is approved at least annually by the Board of Trustees (the “Board”), including by a vote of a majority of the Trustees who are not “interested persons” of the Fund (“Independent Trustees”), cast in person at a meeting called for the purpose of considering such approval.
In considering the renewal of the Fund’s investment advisory agreement, the Board, which is comprised exclusively of Independent Trustees, reviewed and considered information that had been provided by the Adviser throughout the year at regular Board meetings, as well as information requested by the Board and furnished by the Adviser for the meetings of the Board held on May 19, 2009 and June 3 and 4, 2009 to specifically consider the renewal of the Fund’s investment advisory agreement. This information included, among other things, the following:
| | |
| • | Information about the overall organization of the Adviser and the Adviser’s short-term and long-term business plan with respect to its mutual fund operations; |
| | |
| • | The Adviser’s consolidated financial statements for the past three fiscal years; |
| | |
| • | A description of the advisory agreement with the Fund, its terms and the services provided thereunder; |
| | |
| • | Descriptions of the qualifications, education and experience of the individual investment professionals whose responsibilities include portfolio management and investment research for the Fund, and information relating to their compensation and responsibilities with respect to managing other mutual funds and investment accounts; |
| | |
| • | Presentations by the Adviser’s key investment personnel with respect to the Adviser’s investment strategies and general investment outlook in relevant markets, and the resources available to support the implementation of such investment strategies; |
| | |
| • | An independently prepared report comparing the management fees and non-investment management expenses of the Fund during its fiscal year ended December 31, 2008 with those of (i) the universe of funds with a similar investment strategy, offered in connection with variable insurance products (the “Expense Universe”), and (ii) a sub-group of the Expense Universe consisting of funds of comparable size and fees and expense structure (the “Peer Group”); |
35
|
| |
APPROVAL OF ADVISORY AGREEMENT |
(continued) |
| | |
| • | An independently prepared report comparing the Fund’s annualized investment performance for the one- through five-year periods ended December 31, 2008 with those of (i) the universe of funds with a similar investment strategy, offered in connection with variable insurance products (the “Performance Universe”), (ii) its Peer Group, and (iii) appropriate benchmark indices as identified by an independent data provider; |
| | |
| • | An analysis of the profitability of the Adviser with respect to the services it provides to the Fund and the Van Eck complex of mutual funds as a whole; |
| | |
| • | Information regarding other accounts and investment vehicles managed by the Adviser, their investment strategy, the net assets under management in each such account and vehicle, and the individuals that are performing investment management functions with respect to each such account and vehicle; |
| | |
| • | Information concerning the Adviser’s compliance program, the resources devoted to compliance efforts undertaken by the Adviser and its affiliates on behalf of the Fund, and reports regarding a variety of compliance-related issues; |
| | |
| • | Reports with respect to the Adviser’s brokerage practices, including the benefits received by the Adviser from research acquired with soft dollars; and |
| | |
| • | Other information provided by the Adviser in its response to a comprehensive questionnaire prepared by independent legal counsel on behalf of the Independent Trustees. |
In considering whether to approve the investment advisory agreement, the Board evaluated the following factors: (1) the quality, nature, cost and character of the investment management as well as the administrative and other non-investment management services provided by the Adviser and its affiliates; (2) the nature, quality and extent of the services performed by the Adviser in interfacing with, and monitoring the services performed by, third parties, such as the Fund’s custodian, transfer agent, sub-accounting agent and independent auditors, and the Adviser’s commitment and efforts to review the quality and pricing of third party service providers to the Fund with a view to reducing non-management expenses of the Fund; (3) the terms of the advisory agreement and the reasonableness and appropriateness of the particular fee paid by the Fund for the services described therein; (4) the Adviser’s willingness to reduce the cost of the Fund to shareholders from time to time by means of waiving a portion of its management fees or paying expenses of the Fund or by reducing fees
36
from time to time; (5) the services, procedures and processes used to determine the value of Fund assets, and the actions taken to monitor and test the effectiveness of such services, procedures and processes; (6) the ongoing efforts of, and resources devoted by, the Adviser with respect to the development of a comprehensive compliance program and written compliance policies and procedures, and the implementation of recommendations of independent consultants with respect to a variety of compliance issues; (7) the responsiveness of the Adviser and its affiliated companies to inquiries from, and examinations by, regulatory agencies such as the Securities and Exchange Commission; (8) the Adviser’s record of compliance with its policies and procedures; and (9) the ability of the Adviser to attract and retain quality professional personnel to perform investment advisory and administrative services for the Fund.
The Board considered the fact that the Adviser is managing other investment products and vehicles, including exchange-traded funds, hedge funds and separate accounts, that invest in the same financial markets and are managed by the same investment professionals according to a similar investment strategy as the Fund. The Board concluded that the management of these products contributes to the Adviser’s financial stability and is helpful to the Adviser in attracting and retaining quality portfolio management personnel for the Fund. In addition, the Board concluded that the Adviser has established appropriate procedures to monitor conflicts of interest involving the management of the Fund and the other products and for resolving any such conflicts of interest in a fair and equitable manner.
In evaluating the investment performance of the Fund, the Board noted that the Fund had outperformed, on an annualized basis, its Peer Group and Performance Universe averages, as well as its benchmark indices, for the one- through five-year periods ended December 31, 2008. The Board concluded that the performance of the Fund is satisfactory. When considering the fees and expenses of the Fund, the Board noted that, during 2008, the management fee and expense ratio, net of waivers, for the Fund were below the median for its Expense Universe, and that the Adviser has agreed to waive or to reimburse expenses through April 2009 to the extent necessary to maintain an agreed upon expense ratio. The Board concluded that the management fee charged to the Fund for advisory and related services is reasonable and that the total expense ratio of the Fund is reasonable.
The Board considered the profits, if any, realized by the Adviser from managing the Fund, in light of the services rendered and the costs
37
|
| |
APPROVAL OF ADVISORY AGREEMENT |
(continued) |
associated with providing such services, and concluded that the profits realized by the Adviser from managing the Fund are not excessive. In this regard, the Board also considered the extent to which the Adviser may realize economies of scale as the Fund grows, and whether the Fund’s fee reflects these economies of scale for the benefit of shareholders. The Board concluded that the advisory fee breakpoints in place will allow the Fund to share the benefits of economies of scale as it grows in a fair and equitable manner.
The Board did not consider any single factor as controlling in determining whether or not to renew the investment advisory agreement. Nor are the items described herein all of the matters considered by the Board. Based on its consideration of the foregoing factors and conclusions, and such other factors and conclusions as it deemed relevant, and assisted by the advice of its independent counsel, the Board concluded that the renewal of the investment advisory agreement, including the fee structure (described herein) is in the interests of shareholders, and accordingly, the Board approved the continuation of the advisory agreement for an additional one-year period.
38
[This page intentionally left blank]
[This page intentionally left blank]
|
|
This report must be preceded or accompanied by a Van Eck Worldwide Insurance Trust (the “Trust”) Prospectus, which includes more complete information. An investor should consider the investment objective, risks, and charges and expenses of the Fund carefully before investing. The prospectus contains this and other information about the investment company. Please read the prospectus carefully before investing. |
|
Additional information about the Trust’s Board of Trustees/Officers and a description of the policies and procedures the Trust uses to determine how to vote proxies relating to portfolio securities are provided in the Statement of Additional Information and information regarding how the Trust voted proxies relating to portfolio securities during the most recent twelve month period ending June 30 is available, without charge, by calling 1.800.826.2333, or by visiting vaneck.com, or on the Securities and Exchange Commission’s website at http://www.sec.gov. |
|
The Trust files its complete schedule of portfolio holdings with the Securities and Exchange Commission for the first and third quarters of each fiscal year on Form N-Q. The Trust’s Form N-Qs are available on the Commission’s website at http://www.sec.gov and may be reviewed and copied at the Commission’s Public Reference Room in Washington, D.C. Information on the operation of the Public Reference Room may be obtained by calling 1.202.942.8090. The Fund’s complete schedule of portfolio holdings is also available by calling 1.800.826.2333 or by visiting vaneck.com. |
|
Investment Adviser: Van Eck Associates Corporation |
Distributor: Van Eck Securities Corporation | 335 Madison Avenue | New York, NY 10017 | www.vaneck.com
Account Assistance: 1.800.544.4653 |

|
Item 2. CODE OF ETHICS.

     Not applicable.

Item 3. AUDIT COMMITTEE FINANCIAL EXPERT.

     Not applicable.

Item 4. PRINCIPAL ACCOUNTANT FEES AND SERVICES.

     Not applicable.

Item 5. AUDIT COMMITTEE OF LISTED REGISTRANTS.

        Not applicable.

Item 6. SCHEDULE OF INVESTMENTS.

     Information included in Item 1.

Item 7. DISCLOSURE OF PROXY VOTING POLICIES AND PROCEDURES FOR CLOSED-END
        MANAGEMENT INVESTMENT COMPANIES.

     Not applicable.

Item 8. PORTFOLIO MANAGER OF CLOSED-END MANAGEMENT INVESTMENT COMPANIES.

     Not applicable.

Item 9. PURCHASES OF EQUITY SECURITIES BY CLOSED-END MANAGEMENT INVESTMENT
        COMPANY AND AFFILIATED PURCHASERS.

     Not applicable.

Item 10. SUBMISSION OF MATTERS TO A VOTE OF SECURITY HOLDERS.

     No changes.

Item 11. CONTROLS AND PROCEDURES.

(a)  The Chief Executive Officer and the Chief Financial Officer have concluded
     that the Worldwide Hard Assets Fund disclosure controls and procedures
     (as defined in Rule 30a-3(c) under the Investment Company Act) provide
     reasonable assurances that material information relating to the Worldwide
     Hard Assets Fund is made known to them by the appropriate persons,
     based on their evaluation of these controls and procedures as of a date
     within 90 days of the filing date of this report.

(b)  There were no significant changes in the registrant's internal controls
     over financial reporting or in other factors that could significantly
     affect these controls over financial reporting subsequent to the date of
     our evaluation.

Item 12. EXHIBITS.

(a)(1) Not applicable.

(a)(2) A separate certification for each principal executive officer and
       principal financial officer of the registrant as required by Rule 30a-2
       under the Act (17 CFR 270.30a-2) is attached as Exhibit 99.CERT.

(b)  Certification pursuant to Section 906 of the Sarbanes-Oxley Act of 2002 is
     furnished as Exhibit 99.906CERT.
                                   SIGNATURES


Pursuant to the requirements of the Securities Exchange Act of 1934 and the
Investment Company Act of 1940, the registrant has duly caused this report to be
signed on its behalf by the undersigned, thereunto duly authorized.

(Registrant) WORLDWIDE INSURANCE TRUST - WORLDWIDE HARD ASSETS FUND

By (Signature and Title) /s/ Bruce J. Smith, SVP & CFO
                         -----------------------------
Date  August 27, 2009
     -----------------

Pursuant to the requirements of the Securities Exchange Act of 1934 and the
Investment Company Act of 1940, this report has been signed below by the
following persons on behalf of the registrant and in the capacities and on the
dates indicated.

By (Signature and Title) /s/ Derek S. van Eck, CEO
                        --------------------------
Date  August 27, 2009
     -----------------

By (Signature and Title)  /s/ Bruce J. Smith, CFO
                         ------------------------

Date  August 27, 2009
     -----------------