|
VAN ECK VIP GLOBAL BOND FUND |
Effective May 1, 2010, the Worldwide Bond Fund was renamed the Van Eck VIP Global Bond Fund. The Fund’s investment objective did not change.
Dear Shareholder:
For the six months ended June 30, 2010, the Initial Class shares of the Van Eck VIP Global Bond Fund gained 0.37%, outpacing its benchmark, the S&P®/Citigroup World Government Bond (WGBI) Index1, which returned -1.04% in U.S. dollar terms (versus +3.53% in local currency terms). The Fund benefitted during the period from a regulatory settlement received from unaffiliated third parties and, to a lesser extent, from its overweight position in both U.S. currency and U.S bonds (duration) relative to the benchmark. By contrast, the Fund’s underweight position in yen currency and its overweight exposure to the euro, relative to the benchmark, did not prove beneficial given the deep impact of the European sovereign debt crisis.
Since 2008, the major driver of Fund performance relative to its benchmark has been its long-running underweighted position in Japanese bonds and the yen in favor of an overweighting in higher-yielding commodity related bond markets of Australia, Canada and New Zealand. However, during periods of credit market and financial system stress like the first half of 2010, this strategy can stall Fund performance. Periods of stress, as occurred in the second quarter, tend to support a strengthening yen, while negatively impacting commodity currencies as risk aversion increases. We were surprised by the pace and scope of the deterioration witnessed across the Eurozone in the second quarter in particular.
The Fund invests primarily in high-quality debt instruments of bond markets worldwide, with heavy emphasis on government bonds of developed nations. As of June 30, 2010, 71.1% of the Fund’s bond holdings were rated AAA and 10.2% were rated AA. Given the Fund’s focus on higher-grade government bonds, we believe that the Fund is well positioned in this uncertain environment. Since high-quality bond markets move generally in different cycles and with varying supply/demand characteristics, global bonds can add balance to a diversified fixed income strategy.
Market and Economic Review
We began this year on a relatively positive note for markets, given our climb back from financial disaster in 2009. In January, investors were cautiously confident that the global economy had entered a phase of moderate recovery. However, the recovery failed to maintain traction as the first half progressed, and markets were forced to acknowledge that we are in a new regime of tight fiscal policies within the developing world. By April, the positive impact of last year’s government stimulus appeared to be stalling. At the same time, several economic assaults helped call the recovery’s sustainability into question, including the fiscal implosion of Greece and its threat to Europe’s economic health, China’s economic slowdown, and here in the U.S., persistent high levels of unemployment, the weakening housing market, and the Gulf of Mexico oil spill.
At this writing, fears of a prolonged period of slower economic growth among developed economies had taken hold given the industrial world’s deteriorating fiscal conditions. The crux of the situation is that the developing world must continue to work off the financial excesses of the past decades in a system that is bloated with too much debt. It is a painful process of balancing contrasting de-leveraging and funding issues, and the ongoing need for heavy government stimulation in order to avert prolonged recession or even depression. As a side point, it is worth noting that in contrast to weakened developing countries there are many emerging market economies that are in good health, reporting sustainable rates of growth, and carrying more manageable debt levels.
Growing investor anxiety meant a strong midyear finish for higher-quality global bond markets. Especially as the European sovereign debt crisis worsened, and weak U.S. economic reports increased, a flight-to-quality ensued that pushed up the value of high-quality debt instruments and caused yields to fall. The benchmark 10-year U.S. Treasury note yield began the year at 3.84%, and ended the first half at 2.93%, dropping 0.9 percentage points alone in the second quarter. At the same time, the yield on the 10-year German government bond fell from 3.39% to 2.58%; the 10-year Canadian government bond yield fell from 3.61% to 3.08%; the U.K. 10-year sovereign bond yield declined from 4.02% to 3.36%; and the Japanese 10-year sovereign bond yield fell from 1.30% to 1.09%. Although investors began the year with some appetite for risk, by midyear, investors had retreated to the safe-haven of higher-quality government bonds. The dramatic drop in 10-year yields in the second quarter is a clear indication that bond markets have priced out the likelihood of a sustainable global economic recovery.
Throughout the first half, central banks, as they did in 2009, continued to maintain accommodative monetary policies in order to encourage economic momentum and to promote normalization of credit markets. The U.S. Federal Reserve (the “Fed”), for example, continues to hold the federal funds rate at an historically low level of 0.25%, where it has stood since December 2008. Any concerns about inflation, and the need to raise interest rates, have been put on hold for the near future; in fact, many experts suggest that deflation is currently a bigger risk. Finally, although low interest rates have helped to support liquidity, the need for fiscal retrenchment will create negative counter.
1
|
VAN ECK VIP GLOBAL BOND FUND |
In terms of currencies, Europe’s debt troubles forced investors out of euros and into U.S. dollars. For the first half, with the U.S. Dollar Index (DXY)2 gaining 10.48% year to date through June 30, with the euro, for example, hitting a four-year low against the dollar. The overall strengthening of the dollar against most major currencies in the first half was advantageous to investors, like us, who held bonds denominated in U.S. dollars. However, at the time of this writing the U.S. dollar had retreated on the back of mounting doubts about the U.S. economic recovery, weakening against all major currencies.
Fund Review
During the first quarter we repositioned the Fund from underweight to overweight positions in U.S. currency exposure and U.S. duration relative to the benchmark Index. This resulted in a slight drag on the Fund’s performance in the first quarter given that U.S. government bond yields ended the period flat. However, this tactic proved beneficial in the second quarter as the U.S. bond market rallied strongly.
Elsewhere among the dollar block countries, we continued to maintain an overweight position in Canadian bonds relative to the benchmark Index, and this helped the in the first half, as the Canadian bond market gained 3.24% in U.S. dollar terms; in the second quarter, weakness in the Canadian dollar tempered these results as Canadian bonds lost 0.95% in U.S. dollar terms. The Australian bond market was down 1.46% in U.S. dollar terms for the six months, offsetting a 4.92% local market return for the period. The Fund was hurt on a relative and an absolute basis as we added Australian exposure towards the end of the first quarter. The Fund’s exposure to the New Zealand bond market hurt relative performance in the first half as currency weakness reduced local market performance. The New Zealand market declined 0.12% in U.S. dollar terms in the first half, although it gained 5.69% in local currency terms. We continue to like the Australian, Canadian and New Zealand bond markets on a relative basis we believe they should benefit from stronger fiscal situations and leverage to emerging market economies.
Our Japanese underweight (both currency and bonds) was also a large detractor to relative performance for the period, given the strength of the yen relative to the U.S. dollar. The yen strengthened dramatically relative to the dollar as it received a flight to quality bid in the second quarter. This helped push the Japanese market up 7.52% in U.S. dollar terms in the first half (compared to 2.20% in local yen terms). Nevertheless, we continue to find Japanese bonds unattractive given low yields, Japan’s poor economic fundamentals, and its continued weak fiscal situation. Notwithstanding, the Japanese market could continue to perform well on a relative basis during periods of risk aversion and credit turmoil like the first six months of 2010.
In terms of the Eurozone, overall we were overweight the euro currency and core European bond exposure. Most major European bond markets had positive performance for the first six months with Eurozone government bonds up 2.24% in local currency terms; however, in U.S. dollar terms, the Eurozone market lost 12.72% as the euro weakened dramatically relative to the dollar. The Fund’s overweight U.K. bond position dragged on absolute and relative performance for the first half as this market lost 2.01% in US dollar terms (compared to gaining 5.77% in local currency terms). As Europe’s sovereign debt crisis intensified throughout the first half, the Fund’s relative overweight in the European bond market dampened performance. However, in advance of the problems in Greece spreading to peripheral Europe, we did eliminate the Fund’s Spanish bond market exposure in the first quarter, in favor of Australian bonds.
* * *
Although the European sovereign debt crisis appears to have stabilized in recent weeks, most experts believe the 16-nation Eurozone will continue to face major challenges including a muted economic recovery, tight fiscal policies, banking troubles and concerns over the ongoing management of its euro currency. Fundamentals in the U.S. and Japan are not much better than in Europe, and the first half’s “flight to quality” that favored the bonds and currency of the U.S. and Japan is most likely to be reassessed if the turmoil in Europe subsides. We see a muddle through economic and market scenario over the next several quarters, marked by unpredictable periods of volatility as we experienced in the first half. This global deleveraging process will be lengthy, and continue to require action by fiscal and monetary authorities.
Our outlook on global growth is not without points of optimism. Although the developed world continues to bear the worst of the global economic slowdown, the bright spot for investors continues to remain the relatively strong economic resilience within the developing world. Many emerging market economies are growing well, and are not hampered by excessive government debt. At the same time, we believe that the negative fallout from the European debt crisis appears to have been discounted. China appears to be orchestrating a reasonable slowdown. Corporate news in the U.S. has been surprisingly optimistic, with early July second-quarter earnings reports indicating a continuing outlook for economic recovery in the U.S.
2
The Fund is subject to risks associated with investments in debt securities, debt securities rated below investment grade, common stocks, convertible securities, derivatives, asset-backed securities, CMOs and to risks associated with investments in other investment companies. Bonds and bond funds will decrease in value as interest rates rise. The Fund’s investments in foreign securities involve risks related to adverse political and economic developments unique to a country or a region, currency fluctuations or controls, and the possibility of arbitrary action by foreign governments, including the takeover of property without adequate compensation or imposition of prohibitive taxation. The Fund is also subject to non-diversification risk and leverage risk. Please see the prospectus for information on these and other risk considerations.
We appreciate your investment in the Van Eck VIP Global Bond Fund, and we look forward to helping you meet your investment goals in the future.
Investment Team Members:
| |

| 
|
| |

| 
|
Charles T. Cameron | Gregory F. Krenzer |
Portfolio Manager | Portfolio Manager |
|
July 27, 2010 | |
† All Fund assets referenced are Total Net Assets as of June 30, 2010.
3
|
VAN ECK VIP GLOBAL BOND FUND |
The performance quoted represents past performance. Past performance does not guarantee future results; current performance may be lower or higher than the performance data quoted. Investment return and value of shares of the Fund will fluctuate so that an investor’s shares, when redeemed, may be worth more or less than their original cost. Performance information reflects temporary waivers of expenses and/or fees. Had the Fund incurred all expenses, investment returns would have been reduced. NAV returns assume that dividends and capital gains distributions have been reinvested in the Fund at NAV. Index returns assume that dividends of the Index constituents in the Index have been reinvested. These returns do not reflect the deduction of taxes that a shareholder would pay on Fund dividends and distributions or the redemption of Fund shares. Performance information current to the most recent month end is available by calling 1.800.826.2333 or by visiting vaneck.com.
The Fund is only available to life insurance and annuity companies to fund their variable annuity and variable life insurance products. These contracts offer life insurance and tax benefits to the beneficial owners of the Fund. Your insurance or annuity company’s charges, fees and expenses for these benefits are not reflected in this report or in the Fund’s performance, since they are not direct expenses of the Fund. Had these fees been included, returns would have been lower. For insurance products, performance figures do not reflect the cost for insurance and if they did, the performance shown would be significantly lower. A review of your particular life and/or annuity contract will provide you with much greater detail regarding these costs and benefits.
Note: All country and regional bond market returns are Citigroup Government Bond Indices.
All indices listed are unmanaged indices and include the reinvestment of all dividends, but do not reflect the payment of transaction costs, advisory fees or expenses that are associated with an investment in the Fund. An index’s performance is not illustrative of the Fund’s performance. Indices are not securities in which investments can be made.
| |
1 | Citigroup World Government Bond Index (CGWGB) is a market capitalization weighted benchmark that tracks the performance of approximately 20 world government bond markets. |
2 | U.S. Dollar Index (DXY) indicates the general international value of the U.S. dollar. The DXY does this by averaging the exchange rates between the U.S. dollar and six major world currencies. |
3 | Citigroup Eurozone Government Bond Index (EGBI) is a component of the Citigroup World Government Bond Index (CGWGB). |
4
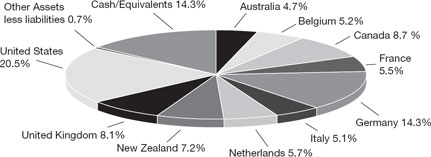
Geographical Weightings*
(unaudited)
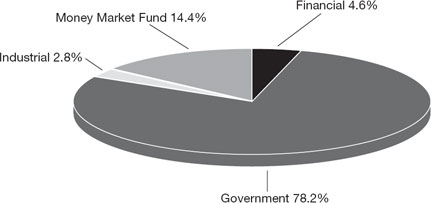
Sector Weightings**
(unaudited)
| |
As of June 30, 2010. |
| |
* | Percentage of net assets. |
| |
** | Percentage of investments. |
| |
Portfolio subject to change. |
5
|
VAN ECK VIP GLOBAL BOND FUND |
EXPLANATION OF EXPENSES
(unaudited) |
As a shareholder of the Fund, you incur two types of costs: (1) transaction costs, including program fees on purchase payments; and (2) ongoing costs, including management fees and other Fund expenses. This disclosure is intended to help you understand your ongoing costs (in dollars) of investing in the Fund and to compare these costs with the ongoing costs of investing in other mutual funds.
The disclosure is based on an investment of $1,000 invested at the beginning of the period and held for the entire period, January 1, 2010 to June 30, 2010.
Actual Expenses
The first line in the table below provides information about account values and actual expenses. You may use the information in this line, together with the amount you invested, to estimate the expenses that you paid over the period. Simply divide your account value by $1,000 (for example, an $8,600 account value divided by $1,000 = 8.6), then multiply the result by the number in the first line under the heading entitled “Expenses Paid During Period” to estimate the expenses you paid on your account during this period.
Hypothetical Example for Comparison Purposes
The second line in the table below provides information about hypothetical account values and hypothetical expenses based on the Fund’s actual expense ratio and an assumed rate of return of 5% per year before expenses, which is not the Fund’s actual return. The hypothetical account values and expenses may not be used to estimate the actual ending account balance or expenses you paid for the period. You may use this information to compare the ongoing costs of investing in the Fund and other funds. To do so, compare this 5% hypothetical example with the 5% hypothetical examples that appear in the shareholder reports of other funds.
Please note that the expenses shown in the table are meant to highlight your ongoing costs only and do not reflect any transactional costs, such as fees on purchase payments. Therefore, the second line of the table is useful in comparing ongoing costs only, and will not help you determine the relative costs of owning different funds. In addition, if these transactional costs were included, your costs would have been higher.
| | | | | | | | |
| | | | Beginning
Account Value
January 1, 2010 | | Ending
Account Value
June 30, 2010 | | Expenses Paid
During Period*
January 1, 2010-
June 30, 2010 |
Initial Class | | Actual | | $1,000.00 | | $1,003.70 | | $5.46 |
| | Hypothetical** | | $1,000.00 | | $1,019.34 | | $5.51 |
Class R1 | | Actual | | $1,000.00 | | $1,003.70 | | $5.46 |
| | Hypothetical** | | $1,000.00 | | $1,019.34 | | $5.51 |
| |
* | Expenses are equal to the Fund’s annualized expense ratio (for the six months ended June 30, 2010), of 1.10% on Initial Class Shares, and 1.10% on Class R1 Shares, multiplied by the average account value over the period, multiplied by 181 and divided by 365 (to reflect the one-half year period). |
| |
** | Assumes annual return of 5% before expenses. |
6
|
VAN ECK VIP GLOBAL BOND FUND |
| |
SCHEDULE OF INVESTMENTS |
June 30, 2010 (unaudited) |
| | | | | | |
Principal
Amount | | | | Value | |
| | | | | | | |
BONDS AND NOTES: 85.0% | | | | |
Australia: 4.7% | | | | | | |
AUD 2,400,000 | | Australia Government Bond
5.75%, 5/15/21 | | $ | 2,120,885 | |
| | | | | | |
Belgium: 5.2% | | | | | | |
EUR 1,800,000 | | Belgium Kingdom
4.00%, 3/28/17 | | | 2,346,023 | |
| | | | | | |
Canada: 8.7% | | | | | | |
CAD 4,000,000 | | Canadian Government Bond
6.00%, 6/1/11 | | | 3,927,707 | |
| | | | | | |
France: 5.5% | | | | | | |
EUR 1,900,000 | | French Treasury Note
3.75%, 4/25/17 | | | 2,513,528 | |
| | | | | | |
Germany: 14.3% | | | | | | |
EUR 3,000,000 | | Bundesrepublik Deutschland
4.75%, 7/4/28 | | | 4,434,223 | |
EUR 1,600,000 | | Kreditanstalt fuer Wiederaufbau
3.625%, 1/20/20 | | | 2,065,299 | |
| | | | | | |
| | | | | 6,499,522 | |
| | | | | | |
Italy: 5.1% | | | | | | |
EUR 1,800,000 | | Italian Government Bond
5.00%, 2/1/12 | | | 2,304,642 | |
| | | | | | |
Netherlands: 5.7% | | | | |
EUR 1,900,000 | | Netherlands Government Bond
4.00%, 7/15/16 | | | 2,586,869 | |
| | | | | | |
New Zealand: 7.2% | | | | |
NZD 4,500,000 | | New Zealand Government Bond
6.50%, 4/15/13 | | | 3,274,432 | |
| | | | | | |
United Kingdom: 8.1% | | | | |
GBP 2,400,000 | | Great Britain Government
4.25%, 3/7/11 | | | 3,676,545 | |
| | | | | | |
United States: 20.5% | | | | |
$1,000,000 | | Caterpillar, Inc.
7.90%, 12/15/18 | | | 1,287,413 | |
| | U.S. Treasury | | | | |
$5,000,000 | | 3.625%, 2/15/20 | | | 5,283,595 | |
$2,000,000 | | 6.625%, 2/15/27 | | | 2,753,438 | |
| | | | | | |
| | | | | 9,324,446 | |
| | | | | | |
Total Bonds and Notes
(Cost: $34,280,208) | | | 38,574,599 | |
| | | | | | |
| | | | | | |
Number
of Shares | | | | | | |
| | | | | | | |
MONEY MARKET FUND: 14.3%
(Cost: $6,465,911) | | | | |
6,465,911 | | AIM Treasury Portfolio - Institutional Class | | | 6,465,911 | |
| | | | | | |
Total Investments: 99.3%
(Cost: $40,746,119) | | | 45,040,510 | |
Other assets less liabilities: 0.7% | | | 323,367 | |
| | | | |
NET ASSETS: 100.0% | | $ | 45,363,877 | |
| | | | |
See Notes to Financial Statements
7
|
VAN ECK VIP GLOBAL BOND FUND |
| |
SCHEDULE OF INVESTMENTS |
(continued) |
| | |
| | |
AUD | — Australian Dollar |
CAD | — Canadian Dollar |
EUR | — Euro |
GBP | — British Pound |
NZD | — New Zealand Dollar |
| | | | | | | | | | |
Summary of Investments by Sector (unaudited) | | | % of
Investments | | Value | |
| | | | | | | |
Financial | | | | 4.6 | % | | $ | 2,065,299 | |
Government | | | | 78.2 | | | | 35,221,887 | |
Industrial | | | | 2.8 | | | | 1,287,413 | |
Money Market Fund | | | | 14.4 | | | | 6,465,911 | |
| | | | | | | | | |
| | | | 100.0 | % | | $ | 45,040,510 | |
| | | | | | | | | |
The summary of inputs used to value investments as of June 30, 2010 is as follows:
| | | | | | | | | | | | | | | |
| | Level 1
Quoted
Prices | | Level 2
Significant
Observable
Inputs | | Level 3
Significant
Unobservable
Inputs | | Value | |
| | | | | | | | | |
Bonds and Notes * | | $ | — | | $ | 38,574,599 | | | $ | — | | | $ | 38,574,599 | |
Money Market Fund * | | | 6,465,911 | | | — | | | | — | | | | 6,465,911 | |
| | | | | | | | | | | | | | | |
Total | | $ | 6,465,911 | | $ | 38,574,599 | | | $ | — | | | $ | 45,040,510 | |
| | | | | | | | | | | | | | | |
* See Schedule of Investments for security type and geographic sector breakouts
See Notes to Financial Statements
8
|
VAN ECK VIP GLOBAL BOND FUND |
| |
STATEMENT OF ASSETS AND LIABILITIES |
June 30, 2010 (unaudited) |
| | | | |
Assets: | | | | |
Investments, at value (Cost: $40,746,119) | | $ | 45,040,510 | |
Receivables: | | | | |
Interest | | | 613,669 | |
Foreign tax reclaim | | | 12,600 | |
| | | | |
Total assets | | | 45,666,779 | |
| | | | |
| | | | |
Liabilities: | | | | |
Payables: | | | | |
Shares of beneficial interest redeemed | | | 162,466 | |
Due to Adviser | | | 33,367 | |
Deferred Trustee fees | | | 12,233 | |
Accrued expenses | | | 94,836 | |
| | | | |
Total liabilities | | | 302,902 | |
| | | | |
NET ASSETS | | $ | 45,363,877 | |
| | | | |
| | | | |
Initial Class Shares: | | | | |
Net Assets | | $ | 33,811,497 | |
| | | | |
Shares of beneficial interest outstanding | | | 2,974,076 | |
| | | | |
Net asset value, redemption and offering price per share | | | $11.37 | |
| | | | |
| | | | |
Class R1 Shares: | | | | |
Net Assets | | $ | 11,552,380 | |
| | | | |
Shares of beneficial interest outstanding | | | 1,016,367 | |
| | | | |
Net asset value, redemption and offering price per share | | | $11.37 | |
| | | | |
| | | | |
Net Assets consist of: | | | | |
Aggregate paid in capital | | $ | 37,119,272 | |
Net unrealized appreciation | | | 4,249,719 | |
Undistributed net investment income | | | 555,956 | |
Accumulated net realized gain | | | 3,438,930 | |
| | | | |
| | $ | 45,363,877 | |
| | | | |
See Notes to Financial Statements
9
|
VAN ECK VIP GLOBAL BOND FUND |
| |
STATEMENT OF OPERATIONS |
Six Months Ended June 30, 2010 (unaudited) |
| | | | | | | |
Income: | | | | | | | |
Interest | | | | | $ | 831,061 | |
| | | | | | | |
Total income | | | | | | 831,061 | |
| | | | | | | |
Expenses: | | | | | | | |
Management fees | | $ | 228,273 | | | | |
Transfer agent fees - Initial Class Shares | | | 9,900 | | | | |
Transfer agent fees - Class R1 Shares | | | 6,992 | | | | |
Professional fees | | | 9,853 | | | | |
Custodian fees | | | 6,782 | | | | |
Insurance | | | 1,033 | | | | |
Reports to shareholders | | | 59,733 | | | | |
Trustees’ fees and expenses | | | 6,396 | | | | |
Other | | | 1,435 | | | | |
| | | | | | | |
Total expenses | | | 330,397 | | | | |
Waiver of management fees | | | (79,272 | ) | | | |
| | | | | | | |
Net expenses | | | | | | 251,125 | |
| | | | | | | |
Net investment income | | | | | | 579,936 | |
| | | | | | | |
Net realized gain on: | | | | | | | |
Investments | | | | | | 161,727 | |
Settlement payment from unaffiliated third parties | | | | | | 1,523,237 | |
| | | | | | | |
Forward foreign currency contracts and foreign currency transactions | | | | | | 2,496,168 | |
| | | | | | | |
Net realized gain | | | | | | 4,181,132 | |
| | | | | | | |
Change in net unrealized appreciation (depreciation) on: | | | | | | | |
Investments | | | | | | (4,557,421 | ) |
Foreign denominated assets and liabilities | | | | | | (45,123 | ) |
| | | | | | | |
Change in net unrealized appreciation (depreciation) | | | | | | (4,602,544 | ) |
| | | | | | | |
Net Increase in Net Assets Resulting from Operations | | | | | $ | 158,524 | |
| | | | | | | |
See Notes to Financial Statements
10
|
VAN ECK VIP GLOBAL BOND FUND |
| |
STATEMENT OF CHANGES IN NET ASSETS |
| | | | | | | |
| | Six Months
Ended
June 30,
2010 | | Year Ended
December 31,
2009 | |
| | | | | |
| | (unaudited) | | | | |
| | | | | | | |
Operations: | | | | | | | |
Net investment income | | $ | 579,936 | | $ | 1,343,334 | |
Net realized gain | | | 2,657,895 | | | 407,301 | |
Settlement payment from unaffiliated third parties | | | 1,523,237 | | | — | |
Net change in unrealized appreciation (depreciation) | | | (4,602,544 | ) | | 561,585 | |
| | | | | | | |
Net increase in net assets resulting from operations | | | 158,524 | | | 2,312,220 | |
| | | | | | | |
Dividends to shareholders from: | | | | | | | |
Net investment income | | | | | | | |
Initial Class Shares | | | (1,213,045 | ) | | (1,232,333 | ) |
Class R1 Shares | | | (444,772 | ) | | (512,683 | ) |
| | | | | | | |
Total dividends | | | (1,657,817 | ) | | (1,745,016 | ) |
| | | | | | | |
Share transactions*: | | | | | | | |
Proceeds from sales of shares | | | | | | | |
Initial Class Shares | | | 5,183,626 | | | 7,889,333 | |
Class R1 Shares | | | 668,256 | | | 2,353,432 | |
| | | | | | | |
| | | 5,851,882 | | | 10,242,765 | |
| | | | | | | |
Reinvestment of dividends | | | | | | | |
Initial Class Shares | | | 1,213,045 | | | 1,232,333 | |
Class R1 Shares | | | 444,772 | | | 512,683 | |
| | | | | | | |
| | | 1,657,817 | | | 1,745,016 | |
| | | | | | | |
Cost of shares redeemed | | | | | | | |
Initial Class Shares | | | (5,235,581 | ) | | (10,999,804 | ) |
Class R1 Shares | | | (1,804,001 | ) | | (4,835,278 | ) |
Redemption fees | | | 7 | | | 1,049 | |
| | | | | | | |
| | | (7,039,575 | ) | | (15,834,033 | ) |
| | | | | | | |
Net increase (decrease) in net assets resulting from share transactions | | | 470,124 | | | (3,846,252 | ) |
| | | | | | | |
Total decrease in net assets | | | (1,029,169 | ) | | (3,279,048 | ) |
| | | | | | | |
Net Assets: | | | | | | | |
Beginning of period | | | 46,393,046 | | | 49,672,094 | |
| | | | | | | |
End of period (including undistributed net investment income of $555,956 and $1,633,837, respectively) | | $ | 45,363,877 | | $ | 46,393,046 | |
| | | | | | | |
| | | | | | | |
* Shares of beneficial interest issued, reinvested and redeemed (unlimited number of $.001 par value shares authorized) | | | | | | | |
Initial Class Shares: | | | | | | | |
Shares sold | | | 450,855 | | | 684,579 | |
Shares reinvested | | | 107,826 | | | 117,142 | |
Shares redeemed | | | (458,086 | ) | | (983,788 | ) |
| | | | | | | |
Net increase (decrease) | | | 100,595 | | | (182,067 | ) |
| | | | | | | |
| | | | | | | |
| | | | | | | |
Class R1 Shares: | | | | | | | |
Shares sold | | | 58,829 | | | 205,868 | |
Shares reinvested | | | 39,570 | | | 48,734 | |
Shares redeemed | | | (157,793 | ) | | (435,374 | ) |
| | | | | | | |
Net decrease | | | (59,394 | ) | | (180,772 | ) |
| | | | | | | |
See Notes to Financial Statements
11
|
VAN ECK VIP GLOBAL BOND FUND |
| |
FINANCIAL HIGHLIGHTS |
|
For a share outstanding throughout each period: |
| | | | | | | | | | | | | | | | | | | |
| | Initial Class Shares | |
| | | |
| | Six Months
Ended
June 30,
2010 | | | | | | | | | | | |
| | | Year Ended December 31, | |
| | | | |
| | | 2009 | | 2008 | | 2007 | | 2006 | | 2005 | |
| | | | | | | | | | | | | |
| | (unaudited) | | | | | | | | | | | |
Net Asset Value, Beginning of Period | | $ | 11.75 | | $ | 11.52 | | $ | 12.12 | | $ | 11.78 | | $ | 12.03 | | $ | 13.33 | |
| | | | | | | | | | | | | | | | | | | |
Income (Loss) From Investment Operations: | | | | | | | | | | | | | | | | | | | |
Net Investment Income | | | 0.14 | | | 0.34 | | | 0.41 | | | 0.41 | | | 0.53 | | | 0.58 | |
Net Realized and Unrealized Gain (Loss) on Investments | | | (0.10 | ) | | 0.30 | | | 0.02 | | | 0.66 | | | 0.20 | | | (0.97 | ) |
| | | | | | | | | | | | | | | | | | | |
Total from Investment Operations | | | 0.04 | | | 0.64 | | | 0.43 | | | 1.07 | | | 0.73 | | | (0.39 | ) |
| | | | | | | | | | | | | | | | | | | |
Less: | | | | | | | | | | | | | | | | | | | |
Dividends from Net Investment Income | | | (0.42 | ) | | (0.41 | ) | | (1.03 | ) | | (0.73 | ) | | (0.98 | ) | | (0.91 | ) |
| | | | | | | | | | | | | | | | | | | |
Total Dividends | | | (0.42 | ) | | (0.41 | ) | | (1.03 | ) | | (0.73 | ) | | (0.98 | ) | | (0.91 | ) |
| | | | | | | | | | | | | | | | | | | |
Redemption Fees | | | — | (c) | | — | (c) | | — | (c) | | — | (c) | | — | (c) | | — | (c) |
| | | | | | | | | | | | | | | | | | | |
Net Asset Value, End of Period | | $ | 11.37 | | $ | 11.75 | | $ | 11.52 | | $ | 12.12 | | $ | 11.78 | | $ | 12.03 | |
| | | | | | | | | | | | | | | | | | | |
Total Return (a) | | | 0.37 | %(e)(f) | | 5.98 | % | | 3.61 | % | | 9.71 | % | | 6.48 | % | | (3.03 | )% |
| | | | | | | | | | | | | | | | | | | | |
| | | | | | | | | | | | | | | | | | | |
Ratios/Supplementary Data | | | | | | | | | | | | | | | | | | | |
Net Assets, End of Period (000) | | $ | 33,811 | | $ | 33,757 | | $ | 35,200 | | $ | 39,745 | | $ | 39,071 | | $ | 46,350 | |
Ratio of Gross Expenses to Average Net Assets | | | 1.43 | %(d) | | 1.31 | % | | 1.17 | % | | 1.32 | % | | 1.28 | % | | 1.29 | % |
Ratio of Net Expenses to Average Net Assets (b) | | | 1.10 | %(d) | | 1.10 | % | | 1.10 | % | | 1.10 | % | | 1.10 | % | | 1.29 | % |
Ratio of Net Investment Income to Average Net Assets | | | 2.54 | %(d) | | 2.95 | % | | 3.08 | % | | 3.31 | % | | 3.77 | % | | 3.67 | % |
Portfolio Turnover Rate | | | 23 | %(e) | | 0 | % | | 2 | % | | 20 | % | | 19 | % | | 16 | % |
| | |
| | |
(a) | Total return is calculated assuming an initial investment of $10,000 made at the net asset value at the beginning of the period, reinvestment of any dividends at net asset value on the dividend payment date and a redemption on the last day of the period. The return does not reflect the deduction of taxes that a shareholder would pay on Fund dividends or the redemption of Fund shares. |
(b) | The ratio of net expenses to average net assets would be be unchanged if any interest expense incurred during the above periods were excluded. |
(c) | Amount represents less than $0.005 per share |
(d) | Annualized |
(e) | Not annualized |
(f) | The Fund received a settlement payment from unaffiliated third parties which represented 3.35% of the Initial Class total return. |
See Notes to Financial Statements
12
| | | | | | | | | | | | | | | | | | | |
| | Class R1 Shares | |
| | |
| | Six Months
Ended
June 30,
2010 | | | | | | | | | | | |
| | | Year Ended December 31, | |
| | | | |
| | | 2009 | | 2008 | | 2007 | | 2006 | | 2005 | |
| | | | | | | | | | | | | |
| | (unaudited) | | | | | | | | | | | |
Net Asset Value, Beginning of Period | | $ | 11.75 | | $ | 11.52 | | $ | 12.11 | | $ | 11.77 | | $ | 12.02 | | $ | 13.33 | |
| | | | | | | | | | | | | | | | | | | |
Income (Loss) From Investment Operations: | | | | | | | | | | | | | | | | | | | |
Net Investment Income | | | 0.16 | | | 0.35 | | | 0.41 | | | 0.40 | | | 0.52 | | | 0.76 | |
Net Realized and Unrealized Gain (Loss) on Investments | | | (0.12 | ) | | 0.29 | | | 0.03 | | | 0.67 | | | 0.21 | | | (1.16 | ) |
| | | | | | | | | | | | | | | | | | | |
Total from Investment Operations | | | 0.04 | | | 0.64 | | | 0.44 | | | 1.07 | | | 0.73 | | | (0.40 | ) |
| | | | | | | | | | | | | | | | | | | |
Less: | | | | | | | | | | | | | | | | | | | |
Dividends from Net Investment Income | | | (0.42 | ) | | (0.41 | ) | | (1.03 | ) | | (0.73 | ) | | (0.98 | ) | | (0.91 | ) |
| | | | | | | | | | | | | | | | | | | |
Total Dividends | | | (0.42 | ) | | (0.41 | ) | | (1.03 | ) | | (0.73 | ) | | (0.98 | ) | | (0.91 | ) |
| | | | | | | | | | | | | | | | | | | |
Redemption fees | | | — | (c) | | — | (c) | | — | (c) | | — | (c) | | — | (c) | | — | (c) |
| | | | | | | | | | | | | | | | | | | |
Net Asset Value, End of Period | | $ | 11.37 | | $ | 11.75 | | $ | 11.52 | | $ | 12.11 | | $ | 11.77 | | $ | 12.02 | |
| | | | | | | | | | | | | | | | | | | |
Total Return (a) | | | 0.37 | %(e)(f) | | 5.98 | % | | 3.70 | % | | 9.73 | % | | 6.48 | % | | (3.11 | )% |
| | | | | | | | | | | | | | | | | | | | |
| | | | | | | | | | | | | | | | | | | |
Ratios/Supplementary Data | | | | | | | | | | | | | | | | | | | |
Net Assets, End of Period (000) | | $ | 11,552 | | $ | 12,636 | | $ | 14,472 | | $ | 14,533 | | $ | 12,238 | | $ | 10,889 | |
Ratio of Gross Expenses to Average Net Assets | | | 1.50 | %(d) | | 1.36 | % | | 1.21 | % | | 1.38 | % | | 1.35 | % | | 1.38 | % |
Ratio of Net Expenses to Average Net Assets (b) | | | 1.10 | %(d) | | 1.10 | % | | 1.10 | % | | 1.10 | % | | 1.10 | % | | 1.38 | % |
Ratio of Net Investment Income to Average Net Assets | | | 2.54 | %(d) | | 2.95 | % | | 3.08 | % | | 3.31 | % | | 3.75 | % | | 3.63 | % |
Portfolio Turnover Rate | | | 23 | %(e) | | 0 | % | | 2 | % | | 20 | % | | 19 | % | | 16 | % |
| | |
| | |
(a) | Total return is calculated assuming an initial investment of $10,000 made at the net asset value at the beginning of the period, reinvestment of any dividends at net asset value on the dividend payment date and a redemption on the last day of the period. The return does not reflect the deduction of taxes that a shareholder would pay on Fund dividends or the redemption of Fund shares. |
(b) | The ratio of net expenses to average net assets would be be unchanged if any interest expense incurred during the above periods were excluded. |
(c) | Amount represents less than $0.005 per share |
(d) | Annualized |
(e) | Not annualized |
(f) | The Fund received a settlement payment from unaffiliated third parties which represented 3.35% of the Class R1 total return. |
See Notes to Financial Statements
13
|
VAN ECK VIP GLOBAL BOND FUND |
NOTES TO FINANCIAL STATEMENTS |
June 30, 2010 (unaudited)
Note 1—Fund Organization—Van Eck VIP Trust, formerly Van Eck Worldwide Insurance Trust, (the “Trust”), is registered under the Investment Company Act of 1940, as amended, as an open-end management investment company. The Trust was organized as a Massachusetts business trust on January 7, 1987. The Van Eck VIP Global Bond Fund, formerly Worldwide Bond Fund, (the “Fund”) is a non-diversified series of the Trust and seeks high total return (income plus capital appreciation) by investing globally, primarily in a variety of debt securities. The Fund offers two classes of shares: Initial Class Shares and Class R1 Shares. The two classes are identical except Class R1 Shares are, under certain circumstances, subject to a redemption fee on redemptions within 60 days of purchase.
Note 2—Significant Accounting Policies—The preparation of financial statements in conformity with U.S. generally accepted accounting principles (“GAAP”) requires management to make estimates and assumptions that affect the reported amounts and disclosures in the financial statements. Actual results could differ from those estimates.
The following is a summary of significant accounting policies followed by the Fund.
| |
A. | Security Valuation—Securities traded on national exchanges or traded on the NASDAQ National Market System are valued at the last sales price as reported at the close of each business day. Securities traded on the NASDAQ Stock Market are valued at the NASDAQ official closing price. Over-the-counter securities not included in the NASDAQ National Market System and listed securities for which no sale was reported are valued at the mean of the bid and ask prices. Securities for which market values are not readily available, or whose values have been affected by events occurring before the Fund’s pricing time (4:00 p.m. Eastern Time) but after the close of the securities’ primary market, are fair valued using methods approved by the Board of Trustees. The Fund may also fair value securities in other situations, for example, when a particular foreign market is closed but the Fund is open. The price which the Fund may realize upon sale of an investment may differ materially from the value presented on the Schedule of Investments. Short-term obligations purchased with more than sixty days remaining to maturity are valued at market value. Short-term obligations purchased with sixty days or less to maturity are valued at amortized cost, which with accrued interest approximates market value. Money market fund investments are valued at net asset value. Forward foreign currency contracts are valued at the spot currency rate plus an amount (“points”), which reflects the differences in interest rates between the U.S. and foreign markets. Securities for which quotations are not readily available are stated at fair value as determined by the Pricing Committee of Van Eck Associates Corporation (the “Adviser”) appointed by the Board of Trustees. Certain factors such as economic conditions, political events, market trends and security specific information are used to determine the fair value of these securities. Short-term investments held as collateral for securities loaned are valued at net asset value. |
| |
| The Fund utilizes various methods to measure the fair value of most of its investments on a recurring basis which includes a hierarchy that prioritizes inputs to valuation methods used to measure fair value. GAAP establishes a fair value hierarchy that prioritizes inputs to valuation techniques used to measure fair value. The hierarchy gives highest priority to unadjusted quoted prices in active markets for identical assets and liabilities (Level 1 measurements) and the lowest priority to unobservable inputs (Level 3 measurements). The inputs or methodologies used for valuing securities are not necessarily an indication of the risk associated with investing in those securities. The three levels of the fair value hierarchy are described below: |
| |
| Level 1 – Quoted prices in active markets for identical securities. |
| |
| Level 2 – Significant observable inputs (including quoted prices for similar securities, interest rates, prepayment speeds, credit risk, etc.). |
| |
| Level 3 – Significant unobservable inputs (including the Fund’s own assumptions in determining the fair value of investments). |
| |
B. | Federal Income Taxes—It is the Fund’s policy to comply with the provisions of the Internal Revenue Code applicable to regulated investment companies and to distribute all of its taxable income to its shareholders. Therefore, no federal income tax provision is required. |
| |
C. | Currency Translation—Assets and liabilities denominated in foreign currencies and commitments under forward foreign currency contracts are translated into U.S. dollars at the closing prices of such currencies each business day. Purchases and sales of investments are translated at the exchange rates prevailing when such investments are acquired or sold. Income and expenses are translated at the exchange rates prevailing when accrued. The portion of realized and unrealized gains and losses on investments that result from fluctuations in foreign currency exchange rates is not separately disclosed. Recognized gains or losses attributable to foreign currency fluctuations on foreign currency denominated assets, other than investments, and liabilities are recorded as net realized gains and losses from foreign currency transactions. |
| |
D. | Dividends and Distributions to Shareholders—Dividends to shareholders from net investment income and distributions from net realized capital gains, if any, are declared and paid annually. Income dividends and capital gain distributions are determined in accordance with income tax regulations, which may differ from such amounts determined in accordance with GAAP. |
14
|
NOTES TO FINANCIAL STATEMENTS |
(continued) |
| |
E. | Use of Derivative Instruments—The Fund may make investments in derivative instruments, including, but not limited to, options, futures, swaps and other derivatives relating to foreign currency transactions. A derivative is an instrument whose value is derived from underlying assets, indices, reference rates or a combination of these factors. Derivative instruments may be privately negotiated contracts (often referred to as over the counter (“OTC”) derivatives) or they may be listed and traded on an exchange. Derivative contracts may involve future commitments to purchase or sell financial instruments at specified terms on a specified date, or to exchange interest payment streams or currencies based on a notional or contractual amount. Derivative instruments may involve a high degree of financial risk. The use of derivatives also involves the risk of loss if the investment adviser is incorrect in its expectation of the timing or level of fluctuations in securities prices, interest rates or currency prices. Investments in derivative instruments also include the risk of default by the counterparty, the risk that the investment may not be liquid and the risk that a small movement in the price of the underlying security or benchmark may result in a disproportionately large movement, unfavorable or favorable, in the price of the derivative instrument. GAAP requires enhanced disclosures about the Fund’s derivatives and hedging activities. Details of this disclosure are found below. |
| |
| The impact of transactions in derivative instruments, during the period ended June 30, 2010, were as follows: |
| | | | |
| | Foreign
exchange risk | |
Realized gain (loss)1: | | | | |
Forward foreign currency contracts | | $ | 3,219 | |
| |
| 1 Statement of operations location: Net realized loss on foreign currency transactions and forward foreign currency contracts |
| |
| Forward Foreign Currency Contracts—The Fund is subject to foreign currency risk in the normal course of pursuing its investment objectives. The Fund may buy and sell forward foreign currency contracts to settle purchases and sales of foreign denominated securities or to hedge foreign denominated assets. Realized gains and losses from forward foreign currency contracts are included in realized gain (loss) on forward foreign currency contracts and foreign currency transactions. The Fund may incur additional risk from investments in forward foreign currency contracts if the counterparty is unable to fulfill its obligation or there are unanticipated movements of the foreign currency relative to the U.S. dollar. |
| |
F. | Other—Security transactions are accounted for on trade date. Realized gains and losses are calculated on the identified cost basis. Interest income, including amortization of premiums and discounts, is accrued as earned. Estimated foreign taxes that are expected to be withheld from proceeds at the sale of certain foreign investments are accrued by the Fund and decrease the unrealized gain on investments. |
| |
| Income, expenses (excluding class-specific expenses) and realized/ unrealized gains/losses are allocated proportionately to each class of shares based upon the relative net asset value of outstanding shares of each class at the beginning of the day (after adjusting for current capital share activity of the respective classes). Class-specific expenses are charged directly to the applicable class of shares. |
Note 3—Investment Management and Other Agreements—The Adviser is the investment adviser to the Fund. The Adviser receives a management fee, calculated daily and payable monthly based on an annual rate of 1.00% on the first $500 million of average daily net assets, 0.90% on the next $250 million of average daily net assets and 0.70% on the average daily net assets in excess of $750 million. The Adviser has agreed to waive management fees and/or assume expenses, excluding interest, taxes, and extraordinary expenses, exceeding 1.10% of average daily net assets, for both Initial Class Shares and Class R1 Shares. For the period ended June 30, 2010, the Adviser waived management fees in the amount of $79,272. Certain officers and trustees of the Trust are officers, directors or stockholders of the Adviser and Van Eck Securities Corporation, the Distributor.
Note 4—Investments—For the period ended June 30, 2010, the cost of purchases and proceeds from sales of investments-other than U.S. government securities and short-term obligations aggregated $9,394,646 and $12,313,964, respectively.
Note 5—Income Taxes—For Federal income tax purposes, the identified cost of investments owned at June 30, 2010 was $40,746,119 and net unrealized appreciation aggregated $4,294,391 of which $5,647,636 related to appreciated securities and $1,353,245 related to depreciated securities.
The tax character of dividends paid to shareholders during the six months ended June 30, 2010 and the year ended December 31, 2009 consisted of ordinary income of $1,657,817 and $1,745,016, respectively.
The Fund recognizes the tax benefits of uncertain tax positions only where the position is “more likely than not” to be sustained assuming examination by applicable tax authorities. Management has analyzed the Fund’s tax positions, and has concluded that no liability for unrecognized tax benefits should be recorded related to uncertain tax positions taken on returns filed for open tax years (tax years ended December 31, 2006-2009), or expected to be taken in the Fund’s current tax year. Therefore, no provision for income tax is required in the Fund’s financial statements.
15
|
VAN ECK VIP GLOBAL BOND FUND |
NOTES TO FINANCIAL STATEMENTS |
(continued) |
Note 6—Concentration of Risk—The Fund invests in foreign securities. Investments in foreign securities may involve a greater degree of risk than investments in domestic securities due to political, economic or social instability. Foreign investments may also be subject to foreign taxes and settlement delays. Since the Fund may have significant investments in foreign debt securities it may be subject to greater credit and interest risks and greater currency fluctuations than portfolios with significant investments in domestic debt securities.
At June 30, 2010, the aggregate shareholder accounts of three insurance companies own approximately 57%, 12% and 11% of the Initial Class Shares and one of whom owns approximately 100% of the Class R1 Shares.
In the normal course of business, the Fund enters into contracts that contain a variety of general indemnifications. The Fund’s maximum exposure under these agreements is unknown as this would involve future claims that may be made against the Fund that have not yet occurred. However, the Adviser believes the risk of loss under these arrangements to be remote.
Note 7—Trustee Deferred Compensation Plan—The Trust has a Deferred Compensation Plan (the “Plan”) for Trustees under which the Trustees can elect to defer receipt of their trustee fees until retirement, disability or termination from the Board of Trustees. The fees otherwise payable to the participating Trustees are deemed invested in shares of the Van Eck Funds (another registered investment company management by the Adviser) as directed by the Trustees.
The expense for the deferred compensation plan is included in “Trustees fees and expenses” in the Statement of Operations. The liability for the deferred compensation plan is shown as “Deferred Trustee fees” in the Statement of Assets and Liabilities.
Note 8—Custodian Fees—The Fund has entered into an expense offset agreement with its custodian wherein it receives credit toward the reduction of custodian fees whenever there are uninvested cash balances. For the period ended June 30, 2010, there were no offsets of custodial fees.
Note 9—Bank Line of Credit—The Trust may participate with Van Eck Funds (the “VE/VIP Funds”) in a $10 million committed credit facility (the “Facility”) to be utilized for temporary financing until the settlement of sales or purchases of portfolio securities, the repurchase or redemption of shares of the Funds at the request of the shareholders and other temporary or emergency purposes. The VE/VIP Funds have agreed to pay commitment fees, pro rata, based on the unused but available balance. Interest is charged to the VE/VIP Funds at rates based on prevailing market rates in effect at the time of borrowings. At June 30, 2010, the Fund had no outstanding borrowings under the Facility.
Note 10—Securities Lending—To generate additional income, the Fund may lend its securities pursuant to a securities lending agreement with State Street Bank & Trust Co., the securities lending agent and also the Fund’s custodian. For the period ended June 30, 2010, there was no securities lending activity.
Note 11—Subsequent Event Review—The Funds have evaluated subsequent events and transactions for potential recognition or disclosure through the date the financial statements were issued and there were no material events requiring recording or disclosure.
16
|
VAN ECK VIP GLOBAL BOND FUND |
APPROVAL OF ADVISORY AGREEMENT |
(unaudited) |
Approval of Advisory Agreement
The Investment Company Act of 1940, as amended, provides, in substance, that each investment advisory agreement between a fund and its investment advisers will continue in effect from year to year only if its continuance is approved at least annually by the Board of Trustees (the “Board”), including by a vote of a majority of the Trustees who are not “interested persons” of the Fund (“Independent Trustees”), cast in person at a meeting called for the purpose of considering such approval.
In considering the renewal of the Fund’s investment advisory agreement, the Board, which is comprised exclusively of Independent Trustees, reviewed and considered information that had been provided by the Adviser throughout the year at regular Board meetings, as well as information requested by the Board and furnished by the Adviser for the meetings of the Board held on June 10, 2010 and June 29 and 30, 2010 to specifically consider the renewal of the Fund’s investment advisory agreement. This information included, among other things, the following:
| |
n | Information about the overall organization of the Adviser and the Adviser’s short-term and long-term business plan with respect to its mutual fund operations; |
| |
n | The Adviser’s consolidated financial statements for the past three fiscal years; |
| |
n | A description of the advisory agreement with the Fund, its terms and the services provided thereunder; |
| |
n | Descriptions of the qualifications, education and experience of the individual investment professionals whose responsibilities include portfolio management and investment research for the Fund, and information relating to their compensation and responsibilities with respect to managing other mutual funds and investment accounts; |
| |
n | Presentations by the Adviser’s key investment personnel with respect to the Adviser’s investment strategies and general investment outlook in relevant markets, and the resources available to support the implementation of such investment strategies; |
| |
n | An independently prepared report comparing the management fees and non-investment management expenses of the Fund during its fiscal year ended December 31, 2009 with those of (i) the universe of funds with a similar investment strategy, offered in connection with variable insurance products (the “Expense Universe”) and (ii) a sub-group of the Expense Universe consisting of funds of comparable size and with comparable fee and expense structures (the “Expense Group”); |
| |
n | An independently prepared report comparing the Fund’s annualized investment performance for the one- through five-year periods ended December 31, 2009 with those of (i) the universe of funds with similar investment strategies, offered in connection with variable insurance products (the “Performance Universe”) and (ii) a sub-group of the Performance Universe consisting of funds of comparable size and with comparable fee and expense structures (each a “Performance Group”); |
| |
n | An analysis of the profitability of the Adviser with respect to the services it provides to the Fund and the Van Eck complex of mutual funds as a whole; |
| |
n | Information regarding other accounts and investment vehicles managed by the Adviser, including the types of accounts, the fees charged by the Adviser for managing the accounts, the material differences between the nature of services provided for the Fund as compared to the other accounts, the other accounts investment strategies, the net assets under management in each such account and vehicle, and the individuals that are performing investment management functions with respect to each such account and vehicle; |
| |
n | Information concerning the Adviser’s compliance program, the resources devoted to compliance efforts undertaken by the Adviser and its affiliates on behalf of the Fund, and reports regarding a variety of compliance-related issues; |
| |
n | Information with respect to the Adviser’s brokerage practices, including the benefits received by the Adviser from research acquired with soft dollars; and |
| |
n | Other information provided by the Adviser in its response to a comprehensive questionnaire prepared by independent legal counsel on behalf of the Independent Trustees. |
| |
In considering whether to approve the investment advisory agreement, the Board evaluated the following factors: (1) the quality, nature, cost and character of the investment management as well as the administrative and other non-investment management services provided by the Adviser and its affiliates; (2) the nature, quality and extent of the services performed by the Adviser in interfacing with, and monitoring the services performed by, third parties, such as the Fund’s custodian, transfer agent, sub-accounting agent and independent auditors, and the Adviser’s commitment and efforts to review the |
17
|
VAN ECK VIP GLOBAL BOND FUND |
| |
APPROVAL OF ADVISORY AGREEMENT |
(continued) |
quality and pricing of third party service providers to the Fund with a view to reducing non-management expenses of the Fund; (3) the terms of the advisory agreement and the reasonableness and appropriateness of the particular fee paid by the Fund for the services described therein; (4) the Adviser’s willingness to reduce the cost of the Fund to shareholders from time to time by means of waiving a portion of its management fees or paying expenses of the Fund or by reducing fees from time to time; (5) the services, procedures and processes used to determine the value of Fund assets, and the actions taken to monitor and test the effectiveness of such services, procedures and processes; (6) the ongoing efforts of, and resources devoted by, the Adviser with respect to the development of a comprehensive compliance program and written compliance policies and procedures, and the implementation of recommendations of independent consultants with respect to a variety of compliance issues; (7) the responsiveness of the Adviser and its affiliated companies to inquiries from, and examinations by, regulatory agencies such as the Securities and Exchange Commission; (8) the Adviser’s record of compliance with its policies and procedures; and (9) the ability of the Adviser to attract and retain quality professional personnel to perform investment advisory and administrative services for the Fund.
The Board considered the fact that the Adviser is managing other investment products and vehicles, including exchange-traded funds, hedge funds and separate accounts. The Board concluded that the management of these products contributes to the Adviser’s financial stability and is helpful to the Adviser in attracting and retaining quality portfolio management personnel for the Fund. In addition, the Board concluded that the Adviser has established appropriate procedures to monitor conflicts of interest involving the management of the Fund and the other products and for resolving any such conflicts of interest in a fair and equitable manner.
In evaluating the investment performance of the Fund, the Board noted that the Fund’s annualized returns underperformed its Performance Group and Performance Universe averages over the one- through five-year periods ended December 31, 2009. In evaluating the performance of the Fund relative to its Performance Group and Performance Universe, the Board noted that the Fund’s performance has been adversely affected by its underweight position in Yen-denominated instruments and overweight position in higher yielding commodity-related markets. The Board also noted the adverse impact on the Fund’s performance in recent periods of the Adviser’s strategy of overweighting higher-quality sovereign debt, in contrast to the strategy pursued by other funds in the Performance Group during the same periods. In addition, the Board considered the performance of the Fund as compared to its benchmark index, which has a risk profile that is similar to the risk profile of the Fund. The Board noted that the Fund substantially outperformed its benchmark index for the one-year period and only slightly underperformed its benchmark index for the five- and ten-year periods. Based on all of the information provided by the Adviser, the Board concluded that the Fund’s performance was satisfactory. The Board noted that, during 2009, the management fee and expense ratio, net of waivers, of the Fund was higher than the medians for its Expense Group, which reflect, among other things, the impact of the relatively small size of the Fund and the nature of the global investment strategy used to pursue the Fund’s objective. The Board further noted that the Adviser has agreed to waive or to reimburse expenses through April 2011 to the extent necessary to maintain an agreed upon expense ratio. The Board concluded that the management fee charged to the Fund for advisory and related services and the total expense ratio of the Fund are reasonable.
The Board considered the profits, if any, realized by the Adviser from managing the Fund, in light of the services rendered and the costs associated with providing such services, and concluded that the profits realized by the Adviser from managing the Fund are not excessive. In this regard, the Board also considered the extent to which the Adviser may realize economies of scale as the Fund grows, and whether the Fund’s fee reflects these economies of scale for the benefit of shareholders. The Board concluded that the advisory fee breakpoints in place will allow the Fund to share the benefits of economies of scale as it grows in a fair and equitable manner.
The Board did not consider any single factor as controlling in determining whether or not to renew the investment advisory agreement. Nor are the items described herein all of the matters considered by the Board. Based on its consideration of the foregoing factors and conclusions, and such other factors and conclusions as it deemed relevant, and assisted by the advice of its independent counsel, the Board concluded that the renewal of the investment advisory agreement, including the fee structure (described herein) is in the interests of shareholders, and accordingly, the Board approved the continuation of the advisory agreement for an additional one-year period.
18
This report must be preceded or accompanied by a Van Eck VIP (the “Trust”) Prospectus, which includes more complete information. An investor should consider the investment objective, risks, and charges and expenses of the Fund carefully before investing. The prospectus contains this and other information about the investment company. Please read the prospectus carefully before investing.
Additional information about the Trust’s Board of Trustees/Officers and a description of the policies and procedures the Trust uses to determine how to vote proxies relating to portfolio securities are provided in the Statement of Additional Information. The Statement of Information and information regarding how the Trust voted proxies relating to portfolio securities during the most recent twelve month period ending June 30 is available, without charge, by calling 800.826.2333, or by visiting vaneck.com, or on the Securities and Exchange Commission’s website at http://www.sec.gov.
The Trust files its complete schedule of portfolio holdings with the Securities and Exchange Commission for the first and third quarters of each fiscal year on Form N-Q. The Trust’s Form N-Qs are available on the Commission’s website at http://www.sec.gov and may be reviewed and copied at the Commission’s Public Reference Room in Washington, D.C. Information on the operation of the Public Reference Room may be obtained by calling 202.942.8090. The Fund’s complete schedule of portfolio holdings is also available by calling 800.826.2333 or by visiting vaneck.com.
| |

|
| |
Investment Adviser: | Van Eck Associates Corporation |
Distributor: | Van Eck Securities Corporation |
| 335 Madison Avenue, New York, NY 10017 |
Account Assistance: | 800.544.4653 |
| |
vaneck.com |
Item 2. CODE OF ETHICS.

     Not applicable.

Item 3. AUDIT COMMITTEE FINANCIAL EXPERT.

     Not applicable.

Item 4. PRINCIPAL ACCOUNTANT FEES AND SERVICES.

     Not applicable.

Item 5. AUDIT COMMITTEE OF LISTED REGISTRANTS.

     Not applicable.

Item 6. SCHEDULE OF INVESTMENTS.

     Information included in Item 1.

Item 7. DISCLOSURE OF PROXY VOTING POLICIES AND PROCEDURES FOR CLOSED-END
        MANAGEMENT INVESTMENT COMPANIES.

     Not applicable.

Item 8. PORTFOLIO MANAGER OF CLOSED-END MANAGEMENT INVESTMENT COMPANIES.

     Not applicable.

Item 9. PURCHASE OF EQUITY SECURITIES BY CLOSED-END MANAGEMENT INVESTMENT
        COMPANY AND AFFILIATED PURCHASERS.

     Not applicable.

Item 10. SUBMISSION OF MATTERS TO A VOTE OF SECURITY HOLDERS.

     No changes.

Item 11. CONTROLS AND PROCEDURES.

(a)  The Chief Executive Officer and the Chief Financial Officer have concluded
     that the Van Eck VIP Global Bond Fund disclosure controls and procedures (as defined
     in Rule 30a-3(c) under the Investment Company Act) provide reasonable
     assurances that material information relating to the Van Eck VIP Global Bond Fund is
     made known to them by the appropriate persons, based on their evaluation of
     these controls and procedures as of a date within 90 days of the filing
     date of this report.

(b)  There were no significant changes in the registrant's internal controls
     over financial reporting or in other factors that could significantly
     affect these controls over financial reporting subsequent to the date of
     our evaluation.


Item 12. EXHIBITS.

(a)(1) Not applicable.

(a)(2) A separate certification for each principal executive officer and
       principal financial officer of the registrant as required by Rule 30a-2
       under the Act (17 CFR 270.30a-2) is attached as Exhibit 99.CERT.

(b)  Certification pursuant to Section 906 of the Sarbanes-Oxley Act of 2002 is
     furnished as Exhibit 99.906CERT.


                                   SIGNATURES


Pursuant to the requirements of the Securities Exchange Act of 1934 and the
Investment Company Act of 1940, the registrant has duly caused this report to be
signed on its behalf by the undersigned, thereunto duly authorized.

(Registrant) VAN ECK VIP TRUST - VAN ECK VIP GLOBAL BOND FUND

By (Signature and Title) /s/ Bruce J. Smith, SVP and CFO
                         -------------------------------
Date August 26, 2010
     ---------------

Pursuant to the requirements of the Securities Exchange Act of 1934 and the
Investment Company Act of 1940, this report has been signed below by the
following persons on behalf of the registrant and in the capacities and on the
dates indicated.

By (Signature and Title) /s/ Derek S. van Eck, CEO
                        --------------------------
Date August 26, 2010
     ---------------

By (Signature and Title)  /s/ Bruce J. Smith, CFO
                        ---------------------------

Date August 26, 2010
     ---------------