|
VAN ECK VIP GLOBAL HARD ASSETS FUND |
| |
TOP TEN EQUITY HOLDINGS*
June 30, 2011 (unaudited) |
Halliburton Co.
(U.S., 3.8%)
Halliburton provides energy services and engineering and construction services, as well as manufactures products for the energy industry. The company offers services and products and integrated solutions to customers in the exploration, development, and production of oil and natural gas.
Anadarko Petroleum Corp.
(U.S., 3.7%)
Anadarko Petroleum is an oil and gas exploration and production company, with major areas of operation located onshore in the United States, the Gulf of Mexico, Algeria, and has production in China and a development project in Brazil. The company markets natural gas, oil and natural gas liquids (NGLs), and owns and operates gas gathering and processing systems.
Schlumberger Ltd.
(U.S., 3.7%)
Schlumberger is an oil services company. The company, through its subsidiaries, provides a wide range of services, including technology, project management and information solutions to the international petroleum industry as well as advanced acquisition and data processing surveys.
Newfield Exploration Co.
(U.S., 3.5%)
Newfield Exploration Company is an independent oil and gas company which explores, develops and acquires oil and natural gas properties. The company operates in the Gulf of Mexico, in the onshore United States Gulf Coast, within the North Sea, within Malaysia, and in the Bohai Bay in China.
Alpha Natural Resources, Inc.
(U.S., 3.3%)
Alpha Natural Resources extracts, processes, and markets steam and metallurgical coal. The company conducts operations from surface and underground mines located in the northern and central Appalachian regions and Colorado, all located in the United States. Alpha Natural Resources markets its coal to electric utilities, steel and other industrial producers.
Occidental Petroleum Corp.
(U.S., 3.0%)
Occidental Petroleum explores for, develops, produces and markets crude oil and natural gas. The company also manufactures and markets a variety of basic chemicals, vinyls and performance chemicals. Occidental gathers, treats, processes, transports, stores, trades and markets crude oil, natural gas, NGLs, condensate and carbon dioxide (CO2) and generates and markets power.
Xstrata PLC
(United Kingdom, 3.0%)
Xstrata, a diversified mining group, explores for and mines copper, coking coal, thermal coal, ferrochrome, vanadium, zinc, gold, lead and silver. The group conducts operations in Australia, South Africa, Germany, Argentina and the U.K.
Weatherford International Ltd.
(Switzerland, 2.9%)
Weatherford is a provider of equipment and services used for the drilling, evaluation, completion, production and intervention of oil and natural gas wells. The company operates in approximately 100 countries through approximately 800 locations situated in nearly all of the oil and natural gas producing regions in the world.
Newmont Mining Corp.
(U.S., 2.8%)
Newmont Mining acquires, explores and develops mineral properties. The company produces gold from operations in the United States, Australia, Peru, Indonesia, Ghana, Canada, New Zealand and Mexico. Newmont also mines and processes copper in Indonesia.
Petrohawk Energy Corp.
(U.S., 2.8%)
Petrohawk Energy is an oil and gas company. The company participates in the exploration and production of natural gas and crude oil. Petrohawk’s operations are currently focused in proven oil and gas producing trends primarily in South Texas, Louisiana and Central California.
| |
* | Percentage of net assets. Portfolio is subject to change.
Company descriptions courtesy of Bloomberg.com. |
8
|
| |
EXPLANATION OF EXPENSES
(unaudited) |
As a shareholder of the Fund, you incur two types of costs: (1) transaction costs, including program fees on purchase payments; and (2) ongoing costs, including management fees and other Fund expenses. This disclosure is intended to help you understand your ongoing costs (in dollars) of investing in the Fund and to compare these costs with the ongoing costs of investing in other mutual funds.
The disclosure is based on an investment of $1,000 invested at the beginning of the period and held for the entire period, January 1, 2011 to June 30, 2011.
Actual Expenses
The first line in the table below provides information about account values and actual expenses. You may use the information in this line, together with the amount you invested, to estimate the expenses that you paid over the period. Simply divide your account value by $1,000 (for example, an $8,600 account value divided by $1,000 = 8.6), then multiply the result by the number in the first line under the heading entitled “Expenses Paid During Period” to estimate the expenses you paid on your account during this period.
Hypothetical Example for Comparison Purposes
The second line in the table below provides information about hypothetical account values and hypothetical expenses based on the Fund’s actual expense ratio and an assumed rate of return of 5% per year before expenses, which is not the Fund’s actual return. The hypothetical account values and expenses may not be used to estimate the actual ending account balance or expenses you paid for the period. You may use this information to compare the ongoing costs of investing in the Fund and other funds. To do so, compare this 5% hypothetical example with the 5% hypothetical examples that appear in the shareholder reports of other funds.
Please note that the expenses shown in the table are meant to highlight your ongoing costs only and do not reflect any transactional costs, such as fees on purchase payments. Therefore, the second line of the table is useful in comparing ongoing costs only, and will not help you determine the relative costs of owning different funds. In addition, if these transactional costs were included, your costs would have been higher.
| | | | | | | | | | | | | |
| | | | Beginning
Account Value
January 1, 2011 | | Ending
Account Value
June 30, 2011 | | Expenses Paid
During the Period*
January 1, 2011 –
June 30, 2011 | |
| | | | | | | | | | |
Initial Class | | | Actual | | | $1,000.00 | | | $1,018.40 | | | $4.56 | |
| | | Hypothetical** | | | $1,000.00 | | | $1,020.27 | | | $4.57 | |
| | | | | | | | | | | | | | |
Class R1 | | | Actual | | | $1,000.00 | | | $1,018.60 | | | $4.60 | |
| | | Hypothetical** | | | $1,000.00 | | | $1,020.23 | | | $4.61 | |
| | | | | | | | | | | | | | |
Class S | | | Actual | | | $1,000.00 | | | $1,016.80 | | | $6.28 | |
| | | Hypothetical** | | | $1,000.00 | | | $1,018.57 | | | $6.28 | |
| | | | | | | | | | | | | | |
| |
* | Expenses are equal to the Fund’s annualized expense ratio (for the six months ended June 30, 2011), of 0.91% on Initial Class, 0.92% on Class R1 Shares, 1.25% on Class S Shares, multiplied by the average account value over the period, multiplied by 181 and divided by 365 (to reflect the one-half year period). |
| |
** | Assumes annual return of 5% before expenses. |
9
|
VAN ECK VIP GLOBAL HARD ASSETS FUND |
| |
SCHEDULE OF INVESTMENTS |
June 30, 2011 (unaudited) |
| | | | | | |
Number of
Shares | | | | Value | |
| | | | | | |
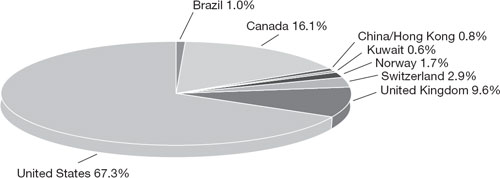
COMMON STOCKS: 95.0% | | | | |
Brazil: 1.0% | | | | |
1,614,800 | | Brazilian Resources, Inc. (CAD) *#§ | | $ | 1,071,106 | |
352,400 | | Petroleo Brasileiro S.A. (ADR) | | | 11,932,264 | |
| | | | | | |
| | | | | 13,003,370 | |
| | | | | | |
Canada: 16.1% | | | | |
316,000 | | Agnico-Eagle Mines Ltd. (USD) | | | 19,949,080 | |
247,400 | | First Quantum Minerals Ltd. | | | 36,071,738 | |
479,300 | | Goldcorp, Inc. (USD) | | | 23,135,811 | |
1,445,700 | | IAMGOLD Corp. (USD) | | | 27,121,332 | |
953,719 | | Kinross Gold Corp. | | | 15,060,543 | |
643,800 | | Kinross Gold Corp. (USD) | | | 10,172,040 | |
59,004 | | Kinross Gold Corp. Warrants
(CAD 21.30, expiring 09/17/14) * | | | 149,888 | |
1,576,500 | | Osisko Mining Corp. * | | | 24,502,810 | |
806,200 | | Pacific Rubiales Energy Corp. | | | 21,608,450 | |
457,700 | | Potash Corp of Saskatchewan, Inc.
(USD) | | | 26,084,323 | |
275,800 | | Teck Resources Ltd. (USD) | | | 13,994,092 | |
| | | | | | |
| | | | | 217,850,107 | |
| | | | | | |
China / Hong Kong: 0.8% | | | | |
2,760,500 | | Yanzhou Coal Mining Co. Ltd. # | | | 10,653,884 | |
| | | | | | |
Kuwait: 0.6% | | | | |
15,562,437 | | Kuwait Energy Co. K.S.C.C. *#§ø | | | 8,482,465 | |
| | | | | | |
Norway: 1.7% | | | | |
646,500 | | SeaDrill Ltd. # | | | 22,730,156 | |
| | | | | | |
Switzerland: 2.9% | | | | |
2,104,700 | | Weatherford International Ltd. (USD) * | | | 39,463,125 | |
| | | | | | |
United Kingdom: 9.6% | | | | |
3,515,600 | | Afren Plc * # | | | 8,906,406 | |
15,000 | | African Minerals Ltd. *#ø | | | 97,710 | |
723,400 | | African Minerals Ltd. *# | | | 6,417,557 | |
272,300 | | Antofagasta Plc # | | | 6,093,567 | |
668,500 | | BHP Billiton Plc # | | | 26,267,890 | |
254,500 | | Ensco PLC (ADR) | | | 13,564,850 | |
693,900 | | Heritage Oil Ltd. * | | | 2,443,404 | |
192,400 | | Randgold Resources Ltd. (ADR) * | | | 16,171,220 | |
286,900 | | Vedanta Resources Plc # | | | 9,644,365 | |
1,812,600 | | Xstrata Plc # | | | 39,923,231 | |
| | | | | | |
| | | | | 129,530,200 | |
| | | | | | |
United States: 62.3% | | | | |
968,405 | | Alpha Natural Resources, Inc. * | | | 44,004,323 | |
657,600 | | Anadarko Petroleum Corp. | | | 50,477,376 | |
156,300 | | Apache Corp. | | | 19,285,857 | |
279,700 | | Berry Petroleum Co. | | | 14,860,461 | |
701,100 | | Brigham Exploration Co. * | | | 20,983,923 | |
433,200 | | Cabot Oil & Gas Corp. | | | 28,725,492 | |
388,700 | | Cameron International Corp. * | | | 19,547,723 | |
298,000 | | Cimarex Energy Co. | | | 26,796,160 | |
146,500 | | Cliffs Natural Resources, Inc. | | | 13,543,925 | |
214,250 | | Concho Resources, Inc. * | | | 19,678,863 | |
639,200 | | Consol Energy, Inc. | | | 30,988,416 | |
69,600 | | Cummins, Inc. | | | 7,202,904 | |
374,200 | | Diamond Offshore Drilling, Inc. | | | 26,347,422 | |
294,200 | | Dril-Quip, Inc. * | | | 19,955,586 | |
1,947,370 | | Far East Energy Corp. * | | | 623,158 | |
| | | | | | |
Number of
Shares | | | | Value | |
| | | | | | | |
United States: (continued) | | | | |
419,074 | | Far East Energy Corp. Warrants
(USD 1.25, expiring 12/28/14) *# | | $ | 31,431 | |
1,019,600 | | General Maritime Corp. | | | 1,376,460 | |
145,200 | | Green Plains Renewable Energy, Inc. * | | | 1,566,708 | |
1,009,800 | | Halliburton Co. | | | 51,499,800 | |
461,000 | | Holly Corp. | | | 31,993,400 | |
141,600 | | Jacobs Engineering Group, Inc. * | | | 6,124,200 | |
432,400 | | Key Energy Services, Inc. * | | | 7,783,200 | |
1,264,000 | | Louisiana-Pacific Corp. * | | | 10,288,960 | |
93,600 | | National Oilwell Varco, Inc. | | | 7,320,456 | |
690,050 | | Newfield Exploration Co. * | | | 46,937,201 | |
708,900 | | Newmont Mining Corp. | | | 38,259,333 | |
228,700 | | Noble Energy, Inc. | | | 20,498,381 | |
392,300 | | Occidental Petroleum Corp. | | | 40,814,892 | |
1,518,400 | | Petrohawk Energy Corp. * | | | 37,458,928 | |
293,900 | | Pioneer Natural Resources Co. | | | 26,324,623 | |
653,600 | | QEP Resources, Inc. | | | 27,340,088 | |
581,300 | | Schlumberger Ltd. | | | 50,224,320 | |
697,400 | | Steel Dynamics, Inc. | | | 11,332,750 | |
359,600 | | Terex Corp. * | | | 10,230,620 | |
206,900 | | The Mosaic Co. | | | 14,013,337 | |
138,100 | | Walter Energy, Inc. | | | 15,991,980 | |
882,600 | | Western Refining, Inc. * | | | 15,948,582 | |
443,000 | | Whiting Petroleum Corp. * | | | 25,211,130 | |
| | | | | | |
| | | | | 841,592,369 | |
| | | | | | |
Total Common Stocks
(Cost: $905,407,059) | | | 1,283,305,676 | |
| | | | |
EXCHANGE TRADED FUND: 1.8%
(Cost: $20,292,281) | | | | |
166,900 | | SPDR Gold Trust * | | | 24,364,062 | |
| | | | | | |
MONEY MARKET FUND: 3.2%
(Cost: $43,182,156) | | | | |
43,182,156 | | AIM Treasury Portfolio –
Institutional Class | | | 43,182,156 | |
| | | | | | |
Total Investments: 100.0%
(Cost: $968,881,496) | | | 1,350,851,894 | |
Other assets less liabilities: 0.0% | | | 144,190 | |
| | | | |
NET ASSETS: 100.0% | | $ | 1,350,996,084 | |
| | | | |
| |
| | |
ADR — American Depositary Receipt |
CAD — Canadian Dollar |
USD — United States Dollar |
| | |
| | |
* | Non-income producing |
# | Indicates a fair valued security which has not been valued utilizing an independent quote, but has been valued pursuant to guidelines established by the Board of Trustees. The aggregate value of fair valued securities is $140,319,768 which represents 10.4% of net assets. |
§ | Illiquid Security – the aggregate value of illiquid securities is $9,553,571 which represents 0.7% of net assets. |
ø | Restricted security – the aggregate value of restricted securities is $8,580,175, or 0.6% of net assets. |
See Notes to Financial Statements
10
Restricted securities held by the Fund as of June 30, 2011 are as follows:
| | | | | | | | | | | | | | | | | | |
Security | | | Acquisition
Date | | Number of
Shares | | Acquisition
Cost | | Value | | % of
Net Assets | |
| | | | | | | | | | | | | |
African Minerals Ltd. | | | 07/02/2009 | | | 15,000 | | $ | 61,444 | | $ | 97,710 | | | 0.0 | % | |
Kuwait Energy Co. K.S.C.C. | | | 08/06/2008 | | | 15,562,437 | | | 11,764,893 | | | 8,482,465 | | 0.6 | | |
| | | | | | | | | | | | | | | | | |
| | | | | | | | $ | 11,826,337 | | $ | 8,580,175 | | 0.6 | % | |
| | | | | | | | | | | | | | | | | |
| | | | | | | | |
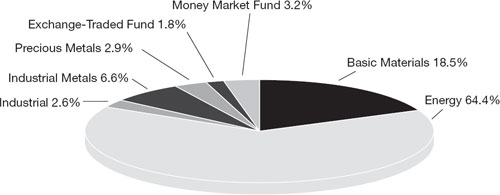
Summary of Investments
by Sector (unaudited) | | % of
Investments | | Value | |
| | | | | |
Basic Materials | | | 18.5 | % | | $ | 249,848,981 | |
Energy | | | 64.4 | | | | 870,075,990 | |
Industrial | | | 2.6 | | | | 35,223,144 | |
Industrial Metals | | | 6.6 | | | | 88,444,320 | |
Precious Metals | | | 2.9 | | | | 39,713,241 | |
Exchange Traded Fund | | | 1.8 | | | | 24,364,062 | |
Money Market Fund | | | 3.2 | | | | 43,182,156 | |
| | | | | | | | |
| | | 100.0 | % | | $ | 1,350,851,894 | |
| | | | | | | | |
The summary of inputs used to value the Fund’s investments as of June 30, 2011 is as follows:
| | | | | | | | | | | | | |
| | Level 1
Quoted
Prices | | Level 2
Significant
Observable
Inputs | | Level 3
Significant
Unobservable
Inputs | | Value | |
| | | | | | | | | |
Common Stocks | | | | | | | | | | | | | |
Brazil | | $ | 11,932,264 | | $ | — | | $ | 1,071,106 | | $ | 13,003,370 | |
Canada | | | 217,850,107 | | | — | | | — | | | 217,850,107 | |
China / Hong Kong | | | — | | | 10,653,884 | | | — | | | 10,653,884 | |
Kuwait | | | — | | | — | | | 8,482,465 | | | 8,482,465 | |
Norway | | | — | | | 22,730,156 | | | — | | | 22,730,156 | |
Switzerland | | | 39,463,125 | | | — | | | — | | | 39,463,125 | |
United Kingdom | | | 32,179,474 | | | 97,350,726 | | | — | | | 129,530,200 | |
United States | | | 841,560,938 | | | 31,431 | | | — | | | 841,592,369 | |
Exchange Traded Fund | | | 24,364,062 | | | — | | | — | | | 24,364,062 | |
Money Market Fund | | | 43,182,156 | | | — | | | — | | | 43,182,156 | |
| | | | | | | | | | | | | |
Total | | $ | 1,210,532,126 | | $ | 130,766,197 | | $ | 9,553,571 | | $ | 1,350,851,894 | |
| | | | | | | | | | | | | |
The following table reconciles the valuation of the Fund’s Level 3 investment securities and related transactions during the period ended June 30, 2011:
| | | | |
Balance as of 12/31/10 | | $ | 8,850,899 | |
Realized gain (loss) | | | — | |
Change in unrealized appreciation (depreciation) | | | 702,672 | |
Purchases | | | — | |
Sales | | | — | |
Transfers in and/or out of level 3 | | | — | |
| | | | |
Balance as of 6/30/11 | | $ | 9,553,571 | |
| | | | |
See Notes to Financial Statements
11
|
VAN ECK VIP GLOBAL HARD ASSETS FUND |
| |
STATEMENT OF ASSETS AND LIABILITIES |
June 30, 2011 (unaudited) |
| | | | |
Assets: | | | | |
Investments, at value (Cost $968,881,496) | | $ | 1,350,851,894 | |
Foreign currency (Cost $2,792,567) | | | 2,794,296 | |
Receivables: | | | | |
Shares of beneficial interest sold | | | 1,456,602 | |
Dividends and interest | | | 1,087,357 | |
Prepaid expenses | | | 13,884 | |
| | | | |
Total assets | | | 1,356,204,033 | |
| | | | |
Liabilities: | | | | |
Payables: | | | | |
Investments purchased | | | 2,567,529 | |
Shares of beneficial interest redeemed | | | 1,123,672 | |
Due to Adviser | | | 917,200 | |
Due to Distributor | | | 8,727 | |
Deferred Trustee fees | | | 283,585 | |
Accrued expenses | | | 307,236 | |
| | | | |
Total liabilities | | | 5,207,949 | |
| | | | |
NET ASSETS | | $ | 1,350,996,084 | |
| | | | |
| | | | |
Initial Class Shares: | | | | |
Net Assets | | $ | 1,173,793,777 | |
| | | | |
Shares of beneficial interest outstanding | | | 31,320,179 | |
| | | | |
Net asset value, redemption and offering price per share | | | $37.48 | |
| | | | |
| | | | |
Class R1 Shares: | | | | |
Net Assets | | $ | 132,562,947 | |
| | | | |
Shares of beneficial interest outstanding | | | 3,534,613 | |
| | | | |
Net asset value, redemption and offering price per share | | | $37.50 | |
| | | | |
| | | | |
Class S Shares: | | | | |
Net Assets | | $ | 44,639,360 | |
| | | | |
Shares of beneficial interest outstanding | | | 1,214,986 | |
| | | | |
Net asset value, redemption and offering price per share | | | $36.74 | |
| | | | |
| | | | |
Net Assets consist of: | | | | |
Aggregate paid in capital | | $ | 928,711,245 | |
Net unrealized appreciation | | | 381,925,480 | |
Distributions in excess of net investment income | | | (15,009,863 | ) |
Accumulated net realized gain | | | 55,369,222 | |
| | | | |
| | $ | 1,350,996,084 | |
| | | | |
See Notes to Financial Statements
12
|
| |
STATEMENT OF OPERATIONS |
For the Six Months Ended June 30, 2011 (unaudited) |
| | | | | | | |
Income: | | | | | | | |
Dividends (net of foreign taxes withheld of $337,535) | | | | | $ | 6,528,612 | |
Interest | | | | | | 4,642 | |
| | | | | | | |
Total income | | | | | | 6,533,254 | |
| | | | | | | |
|
Expenses: | | | | | | | |
Management fees | | | 5,750,429 | | | | |
Distribution fees – Class S | | | 45,317 | | | | |
Transfer agent fees – Initial Class | | | 25,232 | | | | |
Transfer agent fees – R1 Class Shares | | | 8,203 | | | | |
Transfer agent fees – S Class Shares | | | 17,974 | | | | |
Custodian fees | | | 59,041 | | | | |
Professional fees | | | 83,812 | | | | |
Reports to shareholders | | | 174,571 | | | | |
Insurance | | | 33,445 | | | | |
Trustees’ fees and expenses | | | 55,716 | | | | |
Other | | | 12,424 | | | | |
| | | | | | | |
Total expenses | | | 6,266,164 | | | | |
| | | | | | | |
Net investment income | | | | | | 267,090 | |
| | | | | | | |
|
Net realized gain (loss) on: | | | | | | | |
Investments (net of foreign taxes of $80) | | | | | | 65,587,272 | |
Foreign currency transactions and foreign denominated assets and liabilities | | | | | | (186,267 | ) |
| | | | | | | |
Net realized gain | | | | | | 65,401,005 | |
| | | | | | | |
|
Change in net unrealized depreciation on: | | | | | | | |
Investments | | | | | | (43,839,955 | ) |
Foreign currency transactions and foreign denominated assets and liabilities | | | | | | (47,750 | ) |
| | | | | | | |
Change in net unrealized depreciation | | | | | | (43,887,705 | ) |
| | | | | | | |
Net Increase in Net Assets Resulting from Operations | | | | | $ | 21,780,390 | |
| | | | | | | |
| | | | | | | |
See Notes to Financial Statements
13
|
VAN ECK VIP GLOBAL HARD ASSETS FUND |
| |
STATEMENT OF CHANGES IN NET ASSETS |
| | | | | | | |
| | Six Months Ended
June 30,
2011 | | Year Ended
December 31,
2010 | |
| | | | | |
| | | (unaudited) | | | | |
Operations: | | | | | | | |
Net investment income (loss) | | $ | 267,090 | | $ | (516,982 | ) |
Net realized gain | | | 65,401,005 | | | 115,883,452 | |
Net change in unrealized appreciation (depreciation) | | | (43,887,705 | ) | | 167,505,269 | |
| | | | | | | |
Net increase in net assets resulting from operations | | | 21,780,390 | | | 282,871,739 | |
| | | | | | | |
|
Dividends and Distributions to shareholders from: | | | | | | | |
Net investment income | | | | | | | |
Initial Class Shares | | | (13,120,525 | ) | | (3,285,133 | ) |
Class R1 Shares | | | (1,392,680 | ) | | (289,355 | ) |
Class S Shares | | | (279,746 | ) | | (13,077 | ) |
| | | | | | | |
| | | (14,792,951 | ) | | (3,587,565 | ) |
| | | | | | | |
Net realized gains | | | | | | | |
Initial Class Shares | | | (14,048,864 | ) | | — | |
Class R1 Shares | | | (1,498,287 | ) | | — | |
Class S Shares | | | (337,778 | ) | | — | |
| | | | | | | |
| | | (15,884,929 | ) | | — | |
| | | | | | | |
Total dividends and distributions | | | (30,677,880 | ) | | (3,587,565 | ) |
| | | | | | | |
Settlement payments from unaffiliated third parties | | | — | | | 400,743 | |
| | | | | | | |
|
Share transactions: | | | | | | | |
Proceeds from sale of shares | | | | | | | |
Initial Class Shares | | | 86,513,523 | | | 153,570,256 | |
Class R1 Shares | | | 26,010,077 | | | 32,326,860 | |
Class S Shares | | | 29,963,766 | | | 22,379,472 | |
| | | | | | | |
| | | 142,487,366 | | | 208,276,588 | |
| | | | | | | |
Reinvestment of dividends and distributions | | | | | | | |
Initial Class Shares | | | 27,169,390 | | | 3,285,133 | |
Class R1 Shares | | | 2,890,967 | | | 289,355 | |
Class S Shares | | | 617,523 | | | 13,077 | |
| | | | | | | |
| | | 30,677,880 | | | 3,587,565 | |
| | | | | | | |
Cost of shares redeemed | | | | | | | |
Initial Class Shares | | | (95,047,113 | ) | | (142,666,349 | ) |
Class R1 Shares | | | (16,294,287 | ) | | (17,109,954 | ) |
Class S Shares | | | (10,316,990 | ) | | (5,093,918 | ) |
Redemption fees | | | — | | | 33,256 | |
| | | | | | | |
| | | (121,658,390 | ) | | (164,836,965 | ) |
| | | | | | | |
Net increase in net assets resulting from share transactions | | | 51,506,856 | | | 47,027,188 | |
| | | | | | | |
Total increase in net assets | | | 42,609,366 | | | 326,712,105 | |
Net Assets: | | | | | | | |
Beginning of period | | | 1,308,386,718 | | | 981,674,613 | |
| | | | | | | |
End of period (including distributions in excess of net investment income (loss)
of ($15,009,863) and ($484,002), respectively) | | $ | 1,350,996,084 | | $ | 1,308,386,718 | |
| | | | | | | |
| | | | | | | |
* Shares of beneficial interest issued, reinvested and redeemed
(unlimited number of $.001 par value shares authorized): | | | | | | | |
Initial Class Shares: | | | | | | | |
Shares sold | | | 2,258,422 | | | 4,898,956 | |
Shares reinvested | | | 727,816 | | | 118,554 | |
Shares redeemed | | | (2,519,956 | ) | | (4,823,656 | ) |
| | | | | | | |
Net increase | | | 466,282 | | | 193,854 | |
| | | | | | | |
| | | | | | | |
Class R1 Shares: | | | | | | | |
Shares sold | | | 679,471 | | | 1,029,261 | |
Shares reinvested | | | 77,402 | | | 10,438 | |
Shares redeemed | | | (438,559 | ) | | (581,461 | ) |
| | | | | | | |
Net increase | | | 318,314 | | | 458,238 | |
| | | | | | | |
| | | | | | | |
Class S Shares: | | | | | | | |
Shares sold | | | 800,941 | | | 712,177 | |
Shares reinvested | | | 16,849 | | | 479 | |
Shares redeemed | | | (280,961 | ) | | (169,869 | ) |
| | | | | | | |
Net increase | | | 536,829 | | | 542,787 | |
| | | | | | | |
See Notes to Financial Statements
14
|
| |
FINANCIAL HIGHLIGHTS |
For a share outstanding throughout each period: |
| | | | | | | | | | | | | | | | | | | | | |
| | Initial Class Shares | |
| | | |
| | For the Six
Months Ended
June 30,
2011 | | | | | | | | | | | | | | | | |
| | | Year Ended December 31, | |
| | | | |
| | | 2010 | | 2009 | | 2008 | | 2007 | | 2006 | |
| | | | | | | | | | | | | |
| | (unaudited) | | | | | | | | | | | | | | | | |
Net asset value, beginning of period | | | | $37.67 | | | | $29.26 | | | $18.75 | | | $41.19 | | | $32.71 | | | $27.73 | |
| | | | | | | | | | | | | | | | | | | | | |
Income from investment operations: | | | | | | | | | | | | | | | | | | | | | |
Net investment income (loss) | | | | 0.01 | (f) | | | (0.01 | ) | | (0.03 | ) | | 0.11 | | | (0.02 | ) | | 0.06 | |
Net realized and unrealized gain (loss) on investments | | | | 0.67 | | | | 8.52 | | | 10.72 | | | (16.53 | ) | | 12.94 | | | 6.64 | |
| | | | | | | | | | | | | | | | | | | | | |
Total from investment operations | | | | 0.68 | | | | 8.51 | | | 10.69 | | | (16.42 | ) | | 12.92 | | | 6.70 | |
| | | | | | | | | | | | | | | | | | | | | |
Less distributions from: | | | | | | | | | | | | | | | | | | | | | |
Net investment income | | | | (0.42 | ) | | | (0.11 | ) | | (0.06 | ) | | (0.11 | ) | | (0.05 | ) | | (0.02 | ) |
Net realized gains | | | | (0.45 | ) | | | — | | | (0.12 | ) | | (5.91 | ) | | (4.39 | ) | | (1.70 | ) |
| | | | | | | | | | | | | | | | | | | | | |
Total distributions | | | | (0.87 | ) | | | (0.11 | ) | | (0.18 | ) | | (6.02 | ) | | (4.44 | ) | | (1.72 | ) |
| | | | | | | | | | | | | | | | | | | | | |
Settlement payments from unaffiliated third parties | | | | — | | | | 0.01 | | | — | | | — | | | — | | | — | |
| | | | | | | | | | | | | | | | | | | | | |
Redemption fees | | | | — | (b) | | | — | (b) | | — | (b) | | — | (b) | | — | (b) | | — | (b) |
| | | | | | | | | | | | | | | | | | | | | |
Net asset value, end of period | | | | $37.48 | | | | $37.67 | | | $29.26 | | | $18.75 | | | $41.19 | | | $32.71 | |
| | | | | | | | | | | | | | | | | | | | | |
Total return (a) | | | | 1.84 | %(c) | | | 29.23 | %(e) | | 57.54 | % | | (46.12 | )% | | 45.36 | % | | 24.54 | % |
| |
| | | | | | | | | | | | | | | | | | | | | |
Ratios/Supplemental Data | | | | | | | | | | | | | | | | | | | | | |
Net Assets, end of period (000’s) | | | | $1,173,794 | | | | $1,162,125 | | | $897,073 | | | $541,777 | | | $1,031,487 | | | $642,822 | |
Ratio of gross expenses to average net assets | | | | 0.91 | %(d) | | | 0.97 | % | | 1.10 | % | | 0.99 | % | | 1.01 | % | | 1.13 | % |
Ratio of net expenses to average net assets | | | | 0.91 | %(d) | | | 0.97 | % | | 1.10 | % | | 0.99 | % | | 1.01 | % | | 1.13 | % |
Ratio of net expenses, excluding interest expense,
to average net assets | | | | 0.91 | %(d) | | | 0.97 | % | | 1.09 | % | | 0.99 | % | | 1.00 | % | | 1.13 | % |
Ratio of net investment income to average net assets | | | | 0.05 | %(d) | | | (0.05 | )% | | (0.15 | )% | | 0.28 | % | | (0.09 | )% | | 0.17 | % |
Portfolio turnover rate | | | | 18 | %(c) | | | 70 | % | | 105 | % | | 76 | % | | 94 | % | | 78 | % |
| | | | | | | | | | | | | | | | | | | | | |
| |
| | | | | | | | | | | | | | | | | | | | | |
| | | Class R1 Shares | |
| | | | |
| | For the Six
Months Ended
June 30,
2011 | | | | | | | | | | | | | | | | |
| | | Year Ended December 31, | |
| | | | |
| | | 2010 | | 2009 | | 2008 | | 2007 | | 2006 | |
| | | | | | | | | | | | | |
| | (unaudited) | | | | | | | | | | | | | | | | |
Net asset value, beginning of period | | | | $37.68 | | | | $29.26 | | | $18.74 | | | $41.18 | | | $32.70 | | | $27.73 | |
| | | | | | | | | | | | | | | | | | | | | |
Income from investment operations: | | | | | | | | | | | | | | | | | | | | | |
Net investment income (loss) | | | | 0.01 | (f) | | | — | (b) | | (0.04 | ) | | 0.09 | | | (0.03 | ) | | 0.04 | |
Net realized and unrealized gain (loss) on investments | | | | 0.68 | | | | 8.50 | | | 10.74 | | | (16.49 | ) | | 12.95 | | | 6.65 | |
| | | | | | | | | | | | | | | | | | | | | |
Total from investment operations | | | | 0.69 | | | | 8.50 | | | 10.70 | | | (16.40 | ) | | 12.92 | | | 6.69 | |
| | | | | | | | | | | | | | | | | | | | | |
Less dividends from: | | | | | | | | | | | | | | | | | | | | | |
Net investment income | | | | (0.42 | ) | | | (0.10 | ) | | (0.06 | ) | | (0.13 | ) | | (0.05 | ) | | (0.02 | ) |
Net realized gains | | | | (0.45 | ) | | | — | | | (0.12 | ) | | (5.91 | ) | | (4.39 | ) | | (1.70 | ) |
| | | | | | | | | | | | | | | | | | | | | |
Total dividends | | | | (0.87 | ) | | | (0.10 | ) | | (0.18 | ) | | (6.04 | ) | | (4.44 | ) | | (1.72 | ) |
| | | | | | | | | | | | | | | | | | | | | |
Settlement payments from unaffiliated third parties | | | | — | | | | 0.01 | | | — | | | — | | | — | | | — | |
| | | | | | | | | | | | | | | | | | | | | |
Redemption fees | | | | — | (b) | | | 0.01 | | | — | (b) | | — | (b) | | — | (b) | | — | (b) |
| | | | | | | | | | | | | | | | | | | | | |
Net asset value, end of period | | | | $37.50 | | | | $37.68 | | | $29.26 | | | $18.74 | | | $41.18 | | | $32.70 | |
| | | | | | | | | | | | | | | | | | | | | |
Total return (a) | | | | 1.86 | %(c) | | | 29.25 | %(e) | | 57.62 | % | | (46.10 | )% | | 45.37 | % | | 24.49 | % |
| |
| | | | | | | | | | | | | | | | | | | | | |
Ratios/Supplemental Data | | | | | | | | | | | | | | | | | | | | | |
Net Assets, end of period (000’s) | | | | $132,563 | | | | $121,201 | | | $80,703 | | | $51,932 | | | $122,166 | | | $89,949 | |
Ratio of gross expenses to average net assets | | | | 0.92 | %(d) | | | 0.98 | % | | 1.11 | % | | 0.99 | % | | 1.02 | % | | 1.15 | % |
Ratio of net expenses to average net assets | | | | 0.92 | %(d) | | | 0.98 | % | | 1.11 | % | | 0.99 | % | | 1.02 | % | | 1.15 | % |
Ratio of net expenses, excluding interest expense,
to average net assets | | | | 0.92 | %(d) | | | 0.98 | % | | 1.10 | % | | 0.99 | % | | 1.01 | % | | 1.14 | % |
Ratio of net investment income to average net assets | | | | 0.05 | %(d) | | | (0.06 | )% | | (0.15 | )% | | 0.27 | % | | (0.10 | )% | | 0.14 | % |
Portfolio turnover rate | | | | 18 | %(c) | | | 70 | % | | 105 | % | | 76 | % | | 94 | % | | 78 | % |
| | |
| | |
(a) | Total return is calculated assuming an initial investment made at the net asset value at the beginning of period, reinvestment of any dividends and distributions at net asset value on the dividend/distributions payment date and a redemption on the last day of the period. The return does not reflect the deduction of taxes that a shareholder would pay on Fund dividends/distributions or the redemption of Fund shares. |
(b) | Amount represents less than $0.005 per share |
(c) | Not annualized |
(d) | Annualized |
(e) | For the year ended December 31, 2010, the Fund received settlement payments from unaffiliated third parties which represented 0.04% of the Initial Class Shares and Class R1 Shares total return. |
(f) | Calculated based upon weighted average shares outstanding. |
See Notes to Financial Statements
15
|
VAN ECK VIP GLOBAL HARD ASSETS FUND |
| |
FINANCIAL HIGHLIGHTS |
(continued) |
For a share outstanding throughout each period: |
| | | | | | | | | | | | | | | | | | | | | | | |
| | Class S Shares | |
| | | |
| | For the Six
Months Ended
June 30,
2011 | | | | | | | | | | | | | | For the Period
May 1, 2006(a)
through
December 31,
2006 | |
| | | | | | | | | | | | | | | |
| | | Year Ended December 31, | | |
| | | | | |
| | | 2010 | | 2009 | | 2008 | | 2007 | | |
| | | | | | | | | | | | | |
| | (unaudited) | | | | | | | | | | | | | | | | |
Net asset value, beginning of period | | | | $36.95 | | | | $28.80 | | | $18.53 | | | $41.05 | | | $32.72 | | | | $32.55 | | |
| | | | | | | | | | | | | | | | | | | | | | | |
Income from investment operations: | | | | | | | | | | | | | | | | | | | | | | | |
Net investment income (loss) | | | | (0.05 | )(g) | | | 0.05 | | | (0.06 | ) | | 0.05 | | | (0.03 | ) | | | 0.07 | | |
Net realized and unrealized gain (loss) on investments | | | | 0.67 | | | | 8.17 | | | 10.51 | | | (16.44 | ) | | 12.80 | | | | 0.10 | | |
| | | | | | | | | | | | | | | | | | | | | | | |
Total from investment operations | | | | 0.62 | | | | 8.22 | | | 10.45 | | | (16.39 | ) | | 12.77 | | | | 0.17 | | |
| | | | | | | | | | | | | | | | | | | | | | | |
Less dividends from: | | | | | | | | | | | | | | | | | | | | | | | |
Net investment income | | | | (0.38 | ) | | | (0.08 | ) | | (0.06 | ) | | (0.22 | ) | | (0.05 | ) | | | — | | |
Net realized gains | | | | (0.45 | ) | | | — | | | (0.12 | ) | | (5.91 | ) | | (4.39 | ) | | | — | | |
| | | | | | | | | | | | | | | | | | | | | | | |
Total dividends | | | | (0.83 | ) | | | (0.08 | ) | | (0.18 | ) | | (6.13 | ) | | (4.44 | ) | | | — | | |
| | | | | | | | | | | | | | | | | | | | | | | |
Settlement payments from unaffiliated third parties | | | | — | | | | 0.01 | | | — | | | — | | | — | | | | — | | |
| | | | | | | | | | | | | | | | | | | | | | | |
Redemption fees | | | | — | (c) | | | — | (c) | | — | (c) | | — | (c) | | — | (c) | | | — | (c) | |
| | | | | | | | | | | | | | | | | | | | | | | |
Net asset value, end of period | | | | $36.74 | | | | $36.95 | | | $28.80 | | | $18.53 | | | $41.05 | | | | $32.72 | | |
| | | | | | | | | | | | | | | | | | | | | | | |
Total return (b) | | | | 1.68 | %(d) | | | 28.67 | %(f) | | 56.92 | % | | (46.35 | )% | | 44.83 | % | | | 0.49 | %(d) | |
| | | | | | | | | | | | | | | | | | | | | | | | |
| | | | | | | | | | | | | | | | | | | | | | | |
Ratios/Supplemental Data | | | | | | | | | | | | | | | | | | | | | | | |
Net Assets, end of period (000’s) | | | | $44,639 | | | | $25,061 | | | $3,899 | | | $387 | | | $681 | | | | $92 | | |
Ratio of gross expenses to average net assets | | | | 1.25 | %(e) | | | 1.36 | % | | 2.24 | % | | 2.90 | % | | 5.79 | % | | | 11.91 | %(e) | |
Ratio of net expenses to average net assets | | | | 1.25 | %(e) | | | 1.36 | % | | 1.44 | % | | 1.31 | % | | 1.20 | % | | | 1.21 | %(e) | |
Ratio of net expenses, excluding interest expense,
to average net assets | | | | 1.25 | %(e) | | | 1.36 | % | | 1.44 | % | | 1.30 | % | | 1.19 | % | | | 1.21 | % | |
Ratio of net investment income to average net assets | | | | (0.26 | )%(e) | | | (0.39 | )% | | (0.73 | )% | | (0.02 | )% | | (0.30 | )% | | | 0.61 | %(e) | |
Portfolio turnover rate | | | | 18 | %(d) | | | 70 | % | | 105 | % | | 76 | % | | 94 | % | | | 78 | %(d) | |
| | |
| | |
(a) | Commencement of operations |
(b) | Total return is calculated assuming an initial investment made at the net asset value at the beginning of period, reinvestment of any dividends and distributions at net asset value on the dividend/distributions payment date and a redemption on the last day of the period. The return does not reflect the deduction of taxes that a shareholder would pay on Fund dividends/distributions or the redemption of Fund shares. |
(c) | Amount represents less than $0.005 per share |
(d) | Not annualized |
(e) | Annualized |
(f) | For the year ended December 31, 2010, the Fund received settlement payments from unaffiliated third parties which represented 0.04% of the Class S Shares total return |
(g) | Calculated based upon weighted average shares outstanding. |
See Notes to Financial Statements
16
|
VAN ECK VIP GLOBAL HARD ASSETS FUND |
| |
NOTES TO FINANCIAL STATEMENTS |
June 30, 2011 (unaudited) |
Note 1—Fund Organization—Van Eck VIP Trust (the “Trust”) is registered under the Investment Company Act of 1940, as amended, as an open-end management investment company. The Trust was organized as a Massachusetts business trust on January 7, 1987. The Van Eck VIP Global Hard Assets Fund (the “Fund”) is a non-diversified series of the Trust and seeks long-term capital appreciation by investing primarily in hard asset securities. The Fund offers three classes of shares: Initial Class Shares, Class R1 Shares and Class S Shares. The three classes are identical except Class R1 Shares are, under certain circumstances, subject to a redemption fee on redemptions within 60 days of purchase and Class S Shares are subject to a distribution fee.
Note 2—Significant Accounting Policies—The preparation of financial statements in conformity with U.S. generally accepted accounting principles (“GAAP”) requires management to make estimates and assumptions that affect the reported amounts and disclosures in the financial statements. Actual results could differ from those estimates.
The following is a summary of significant accounting policies followed by the Fund.
| |
A. | Security Valuation—Securities traded on national exchanges or traded on the NASDAQ National Market System are valued at the last sales price as reported at the close of each business day. Securities traded on the NASDAQ Stock Market are valued at the NASDAQ official closing price. Over-the-counter securities not included in the NASDAQ National Market System and listed securities for which no sale was reported are valued at the mean of the bid and ask prices. To the extent these securities are actively traded they are categorized as level 1 in the fair value hierarchy (as described below). Certain foreign securities, whose values may be affected by market direction or events occurring before the Fund’s pricing time (4:00 p.m. Eastern Time) but after the last close of the securities’ primary market, are fair valued using a pricing service and are categorized as level 2 in the fair value hierarchy. The pricing service, using methods approved by the Board of Trustees, considers the correlation of the trading patterns of the foreign security to intraday trading in the U.S. markets, based on indices of domestic securities and other appropriate indicators such as prices of relevant ADR’s and futures contracts. The Fund may also fair value securities in other situations, such as, when a particular foreign market is closed but the Fund is open. Short-term obligations purchased with more than sixty days remaining to maturity are valued at market value. Short-term obligations purchased with sixty days or less to maturity are valued at amortized cost, which with accrued interest approximates fair value. Money market fund investments are valued at net asset value. Forward foreign currency contracts are valued at the spot currency rate plus an amount (“points”), which reflects the differences in interest rates between the U.S. and foreign markets. Securities for which quotations are not available are stated at fair value as determined by a Pricing Committee of Van Eck Associates Corporation (the “Adviser”) appointed by the Board of Trustees. Certain factors such as economic conditions, political events, market trends, the nature of and duration of any restrictions on disposition, trading in similar securities of the issuer or comparable issuers and other security specific information are used to determine the fair value for these securities. Depending on the relative significance of valuation inputs, these securities may be classified either as level 2 or level 3 in the fair value hierarchy. The price which the Fund may realize upon sale of an investment may differ materially from the value presented on the Schedule of Investments. |
| |
| The Fund utilizes various methods to measure the fair value of most of its investments on a recurring basis which includes a hierarchy that prioritizes inputs to valuation methods used to measure fair value. GAAP establishes a fair value hierarchy that prioritizes inputs to valuation techniques used to measure fair value. The hierarchy gives highest priority to unadjusted quoted prices in active markets for identical assets and liabilities (Level 1 measurements) and the lowest priority to unobservable inputs (Level 3 measurements). The inputs or methodologies used for valuing securities are not necessarily an indication of the risk associated with investing in those securities. The three levels of the fair value hierarchy are described below: |
| |
| Level 1 – Quoted prices in active markets for identical securities. |
| |
| Level 2 – Significant observable inputs (including quoted prices for similar securities, interest rates, prepayment speeds, credit risk, etc.). |
| |
| Level 3 – Significant unobservable inputs (including the Fund’s own assumptions in determining the fair value of investments). |
| |
B. | Federal Income Taxes—It is the Fund’s policy to comply with the provisions of the Internal Revenue Code applicable to regulated investment companies and to distribute all of its taxable income to its shareholders. Therefore, no federal income tax provision is required. |
| |
C. | Currency Translation—Assets and liabilities denominated in foreign currencies and commitments under forward foreign currency contracts are translated into U.S. dollars at the closing prices of such currencies each business day. Purchases and sales of investments are translated at the exchange rates prevailing when such investments are acquired or sold. Income and expenses are translated at the exchange rates prevailing when accrued. The portion of realized and unrealized gains and losses on investments that result from fluctuations in foreign currency exchange rates is not separately disclosed. Recognized gains or losses attributable to foreign currency fluctuations on foreign currency denominated assets, other than investments, and liabilities are recorded as net realized gains and losses from foreign currency transactions. |
17
|
VAN ECK VIP GLOBAL HARD ASSETS FUND |
| |
NOTES TO FINANCIAL STATEMENTS |
(unaudited) (continued) |
| |
D. | Dividends and Distributions to Shareholders—Dividends to shareholders from net investment income and distributions from net realized capital gains, if any, are declared and paid annually. Income dividends and capital gain distributions are determined in accordance with income tax regulations, which may differ from such amounts determined in accordance with GAAP. |
| |
E. | Restricted Securities—The Fund may invest in securities that are subject to legal or contractual restrictions on resale. These securities generally may be resold in transactions exempt from registration or to the public if the securities are registered. Disposal of these securities may involve time-consuming negotiations and expense, and prompt sale at an acceptable price may be difficult. Information regarding restricted securities is included at the end of the Fund’s Schedule of Investments. |
| |
F. | Warrants—The Fund may invest in warrants whose values are linked to indices or underlying instruments. The Fund may use these warrants to gain exposure to markets that might be difficult to invest in through conventional securities. Warrants may be more volatile than their linked indices or underlying instruments. Potential losses are limited to the amount of the original investment. |
| |
G. | Use of Derivative Instruments—The Fund may make investments in derivative instruments, including, but not limited to, options, futures, swaps and other derivatives relating to foreign currency transactions. A derivative is an instrument whose value is derived from underlying assets, indices, reference rates or a combination of these factors. Derivative instruments may be privately negotiated contracts (often referred to as over the counter (“OTC”) derivatives) or they may be listed and traded on an exchange. Derivative contracts may involve future commitments to purchase or sell financial instruments or commodities at specified terms on a specified date, or to exchange interest payment streams or currencies based on a notional or contractual amount. Derivative instruments may involve a high degree of financial risk. The use of derivatives also involves the risk of loss if the investment adviser is incorrect in its expectation of the timing or level of fluctuations in securities prices, interest rates or currency prices. Investments in derivative instruments also include the risk of default by the counterparty, the risk that the investment may not be liquid and the risk that a small movement in the price of the underlying security or benchmark may result in a disproportionately large movement, unfavorable or favorable, in the price of the derivative instrument. GAAP requires enhanced disclosures about the Fund’s derivatives and hedging activities. The Fund had no derivatives outstanding during the period ended June 30, 2011. |
| |
| Forward Foreign Currency Contracts—The Fund is subject to foreign currency risk in the normal course of pursuing its investment objectives. The Fund may buy and sell forward foreign currency contracts to settle purchases and sales of foreign denominated securities or to hedge foreign denominated assets. Realized gains and losses from forward foreign currency contracts are included in realized gain (loss) on forward foreign currency contracts and foreign currency transactions. The Fund may incur additional risk from investments in forward foreign currency contracts if the counterparty is unable to fulfill its obligation or there are unanticipated movements of the foreign currency relative to the U.S. dollar. The Fund had no outstanding forward foreign currency contracts during the period ended June 30, 2011. |
| |
H. | Other—Security transactions are accounted for on trade date. Dividend income is recorded on the ex-dividend date except that certain dividends from foreign securities are recognized as soon as the Fund is notified of the ex-dividend date. Realized gains and losses are calculated on the specific identified cost basis. Interest income, including amortization of premiums and discounts, is accrued as earned. Estimated foreign taxes that are expected to be withheld from proceeds at the sale of certain foreign investments are accrued by the Fund and decrease the unrealized gain on investments. The Fund received regulatory settlement payments during 2010 from unaffiliated third parties which is included in the Statement of Changes on Net Assets. |
| |
| Income, expenses (excluding class-specific expenses), realized, and unrealized gains/losses are allocated proportionately to each class of shares based upon the relative net asset value of outstanding shares of each class at the beginning of the day (after adjusting for current capital share activity of the respective classes). Class-specific expenses are charged directly to the applicable class of shares. |
| |
| In the normal course of business, the Fund enters into contracts that contain a variety of general indemnifications. The Fund’s maximum exposure under these agreements is unknown as this would involve future claims that may be made against the Fund that have not yet occurred. However, the Adviser believes the risk of loss under these arrangements to be remote. |
Note 3—Investment Management and Other Agreements—The Adviser is the investment adviser to the Fund. The Adviser receives a management fee, calculated daily and payable monthly based on an annual rate of 1.00% on the first $500 million of average daily net assets, 0.90% on the next $250 million of average daily net assets and 0.70% on the average daily net assets in excess of $750 million. The Adviser has agreed, at least until May 1, 2012, to waive management fees and/or assume expenses, excluding interest, taxes, and extraordinary expenses exceeding 1.20% for the Initial Class shares and Class R1 shares and 1.45% for the Class S shares. For the period ended June 30, 2011, no management fees were waived nor were any expenses assumed by the Adviser. Certain of the officers and trustees of the Trust are officers, directors or stockholders of the Adviser and Van Eck Securities Corporation, (the “Distributor”).
18
Note 4—12b-1 Plans of Distribution—The Fund and the Distributor are parties to a distribution agreement dated May 1, 2006. The Fund has adopted a Distribution Plan (the “Plan”) for Class S Shares in accordance with Rule 12b-1 under the 1940 Act. Pursuant to the Plan, the Fund is authorized to incur distribution expenses for its Class S Shares which will principally be payments to securities dealers who have sold shares and serviced shareholder accounts and payments to the Distributor, for reimbursement of other actual promotion and distribution expenses incurred by the Distributor on behalf of the Fund. The amount paid in any one year is 0.25% of average daily net assets (prior to the May 1, 2009, the limit was 0.15%) for Class S Shares.
Note 5—Investments—For the period ended June 30, 2011, the cost of purchases and proceeds from sales of investments-other than U.S. government securities and short-term obligations aggregated $289,081,530 and $235,353,539, respectively.
Note 6—Income Taxes—For Federal income tax purposes, the identified cost of investments owned at June 30, 2011 was $968,881,496 and net unrealized appreciation aggregated $381,970,398 of which $399,095,747 related to appreciated securities and $17,125,349 related to depreciated securities.
The tax character of dividends and distributions paid to shareholders were as follows:
| | | | | | | | | | | |
| | Six Months Ended
June 30, 2011 | | Year Ended
December 31, 2010 | |
| | | | | |
Ordinary income | | | $ | 14,792,951 | | | | $ | 3,587,565 | | |
Long term capital gains | | | | 15,884,929 | | | | | — | | |
| | | | | | | | | | | |
Total | | | $ | 30,677,880 | | | | $ | 3,587,565 | | |
| | | | | | | | | | | |
The Fund recognizes the tax benefits of uncertain tax positions only where the position is “more likely than not” to be sustained assuming examination by applicable tax authorities. Management has analyzed the Fund’s tax positions, and has concluded that no liability for unrecognized tax benefits should be recorded related to uncertain tax positions taken on return filings for open tax years (tax years ended December 31, 2007-2010), or expected to be taken in the Fund’s current tax year. Therefore, no provision for income tax is required in the Fund’s financial statements.
The Fund recognizes interest and penalties, if any, related to uncertain tax positions as income tax expense in the Statement of Operations. During the period, the Fund did not incur any interest or penalties.
Note 7—Concentration of Risk—The Fund may purchase securities on foreign exchanges. Securities of foreign issuers involve special risks and considerations not typically associated with investing in U.S. issuers. These risks include devaluation of currencies, less reliable information about issuers, different securities transaction clearance and settlement practices, and future adverse political and economic developments. These risks are heightened for investments in emerging market countries. Moreover, securities of many foreign issuers and their markets may be less liquid and their prices more volatile than those of comparable U.S. issuers.
The Fund may concentrate its investments in companies which are significantly engaged in the exploration, development, production and distribution of gold and other natural resources such as strategic and other metals, minerals, forest products, oil, natural gas and coal and by investing in gold bullion and coins. Since the Fund may so concentrate, it may be subject to greater risks and market fluctuations than other more diversified portfolios. The production and marketing of gold and other natural resources may be affected by actions and changes in governments. In addition, gold and natural resources may be cyclical in nature.
At June 30, 2011, the aggregate shareholder accounts of three insurance companies own approximately 69%, 7%, and 5% of the Initial Class Shares and three of whom own approximately 50%, 34% and 11% of the Class R1 Shares. Additionally, four insurance companies own approximately 32%, 25%, 13% and 13% of the Class S Shares.
Note 8—Trustee Deferred Compensation Plan—The Trust has a Deferred Compensation Plan (the “Plan”) for Trustees under which the Trustees can elect to defer receipt of their trustee fees until retirement, disability or termination from the Board of Trustees. The fees otherwise payable to the participating Trustees are deemed invested in shares of the Van Eck Funds (another registered investment company managed by the Adviser) as directed by the Trustees.
The expense for the Plan is included in “Trustees’ fees and expenses” in the Statement of Operations. The liability for the plan is shown as “Deferred Trustee fees” in the Statement of Assets and Liabilities.
Note 9—Bank Line of Credit—The Trust may participate with Van Eck Funds (collectively the “VE/VIP Funds”) in a $20 million committed credit facility (the “Facility”) to be utilized for temporary financing until the settlement of sales or purchases of portfolio securities, the repurchase or redemption of shares of the Fund at the request of the shareholders and other temporary or emergency purposes. The VE/VIP Funds have agreed to pay commitment fees, pro rata, based on the unused but available balance. Interest is charged to the VE/VIP Funds at rates based on prevailing market rates in effect at the time of borrowings. The
19
|
VAN ECK VIP GLOBAL HARD ASSETS FUND |
| |
NOTES TO FINANCIAL STATEMENTS |
(unaudited) (continued) |
average daily loan balance during the 3 day period for which a loan was outstanding amounted to $717,000 and the weighted average interest rate was 1.39%. The Fund had no outstanding borrowings under the Facility at June 30, 2011.
Note 10—Securities Lending—To generate additional income, the Fund may lend its securities pursuant to a securities lending agreement with State Street Bank & Trust Co., the securities lending agent and also the Fund’s custodian. During the period ended June 30, 2011, there was no securities lending activity.
Note 11—Custodian Fees—The Fund has entered into an expense offset agreement with its custodian wherein it receives credit toward the reduction of custodian fees whenever there are uninvested cash balances. For the period ended June 30, 2011, there were no offsets of custodial fees.
Note 12—Subsequent Event Review—The Fund has evaluated subsequent events and transactions for potential recognition or disclosure through the date the financial statements were issued.
20
|
| |
APPROVAL OF ADVISORY AGREEMENT |
Approval of Advisory Agreement
The Investment Company Act of 1940, as amended, provides, in substance, that each investment advisory agreement between a fund and its investment advisers will continue in effect from year to year only if its continuance is approved at least annually by the Board of Trustees (the “Board”), including by a vote of a majority of the Trustees who are not “interested persons” of the Fund (“Independent Trustees”), cast in person at a meeting called for the purpose of considering such approval.
In considering the renewal of the Fund’s investment advisory agreement, the Board, which is comprised exclusively of Independent Trustees, reviewed and considered information that had been provided by the Adviser throughout the year at regular Board meetings, as well as information requested by the Board and furnished by the Adviser for the meetings of the Board held on May 19, 2011 and June 29 and 30, 2011 to specifically consider the renewal of the Fund’s investment advisory agreement. This information included, among other things, the following:
| |
§ | Information about the overall organization of the Adviser and the Adviser’s short-term and long-term business plan with respect to its mutual fund operations; |
| |
§ | The Adviser’s consolidated financial statements for the past three fiscal years; |
| |
§ | A description of the advisory agreement with the Fund, its terms and the services provided thereunder; |
| |
§ | Descriptions of the qualifications, education and experience of the individual investment professionals whose responsibilities include portfolio management and investment research for the Fund, and information relating to their compensation and responsibilities with respect to managing other mutual funds and investment accounts; |
| |
§ | Presentations by the Adviser’s key investment personnel with respect to the Adviser’s investment strategies and general investment outlook in relevant markets, and the resources available to support the implementation of such investment strategies; |
| |
§ | An independently prepared report comparing the management fees and non-investment management expenses with respect to a representative class of shares of the Fund during its fiscal year ended December 31, 2010 with those of (i) a universe of funds with similar investment strategies, including open-end and variable annuity funds (the “Expense Universe”), and (ii) a sub-group of the Expense Universe consisting of funds of comparable size and with comparable fee and expense structures (the “Expense Group”); |
| |
§ | An independently prepared report comparing the Fund’s annualized investment performance, with respect to a representative class of shares of the Fund (including standard deviations and Sharpe ratios) for the one-, three-, five-and ten-year periods ended March 31, 2011 with those of (i) a universe of funds with similar investment strategies, including open-end and variable annuity funds (the “Performance Universe”) and (ii) a sub-group of the Performance Universe consisting of funds of comparable size and with comparable fee and expense structures (the “Performance Group”); |
| |
§ | An analysis of the profitability of the Adviser with respect to the services it provides to the Fund and the Van Eck complex of mutual funds as a whole; |
| |
§ | Information regarding other accounts and investment vehicles managed by the Adviser, including the types of accounts, the fees charged by the Adviser for managing the accounts, the material differences between the nature of services provided for the Fund as compared to the other accounts, the other accounts investment strategies, the net assets under management in each such account and vehicle, and the individuals that are performing investment management functions with respect to each such account and vehicle; |
| |
§ | Information concerning the Adviser’s compliance program, the resources devoted to compliance efforts undertaken by the Adviser and its affiliates on behalf of the Fund, and reports regarding a variety of compliance-related issues; |
| |
§ | Information with respect to the Adviser’s brokerage practices, including the benefits received by the Adviser from research acquired with soft dollars; and |
| |
§ | Other information provided by the Adviser in its response to a comprehensive questionnaire prepared by independent legal counsel on behalf of the Independent Trustees. |
In considering whether to approve the investment advisory agreement, the Board evaluated the following factors: (1) the quality, nature, cost and character of the investment management as well as the administrative and other non-investment management services provided by the Adviser and its affiliates; (2) the nature, quality and extent of the services performed by the Adviser in interfacing with, and monitoring the services performed by, third parties, such as the Fund’s custodian,
21
|
VAN ECK VIP GLOBAL HARD ASSETS FUND |
| |
APPROVAL OF ADVISORY AGREEMENT |
(continued) |
transfer agent, sub-accounting agent and independent auditors, and the Adviser’s commitment and efforts to review the quality and pricing of third party service providers to the Fund with a view to reducing non-management expenses of the Fund; (3) the terms of the advisory agreement and the reasonableness and appropriateness of the particular fee paid by the Fund for the services described therein; (4) the Adviser’s willingness to reduce the cost of the Fund to shareholders from time to time by means of waiving a portion of its management fees or paying expenses of the Fund or by reducing fees from time to time; (5) the services, procedures and processes used to determine the value of Fund assets, and the actions taken to monitor and test the effectiveness of such services, procedures and processes; (6) the ongoing efforts of, and resources devoted by, the Adviser with respect to the development of a comprehensive compliance program and written compliance policies and procedures, and the implementation of recommendations of independent consultants with respect to a variety of compliance issues; (7) the responsiveness of the Adviser and its affiliated companies to inquiries from, and examinations by, regulatory agencies such as the Securities and Exchange Commission; (8) the Adviser’s record of compliance with its policies and procedures; and (9) the ability of the Adviser to attract and retain quality professional personnel to perform investment advisory and administrative services for the Fund.
The Board considered the fact that the Adviser is managing other investment products and vehicles, including exchange-traded funds, hedge funds and separate accounts, that invest in the same financial markets and may be managed by the same investment professionals according to a similar investment strategy as the Fund. The Board concluded that the management of these products contributes to the Adviser’s financial stability and is helpful to the Adviser in attracting and retaining quality portfolio management personnel for the Fund. In addition, the Board concluded that the Adviser has established appropriate procedures to monitor conflicts of interest involving the management of the Fund and the other products and for resolving any such conflicts of interest in a fair and equitable manner.
The performance data and the management fee and expense ratio data described below for the Fund is based on data for a representative class of shares of the Fund. The performance data is for periods on an annualized basis ended March 31, 2011, and the management fee and expense ratio data is as of the Fund’s fiscal year end of December 31, 2010.
In evaluating the investment performance of the Fund, the Board noted that the Fund’s annualized returns had outperformed those of its Performance Group and Performance Universe medians for the one-, three- and five-year periods. The Board noted that the Fund’s annualized return had outperformed those of its Performance Universe median for the ten-year period but had underperformed that of its Performance Group median for the ten-year period. The Board concluded that the performance of the Fund is satisfactory. When considering the fees and expenses of the Fund, the Board noted that while the actual management fee for the Fund, net of waivers, was higher than the median management fee for its Expense Group, the total expense ratio for the Fund, net of waivers, was below the median total expense ratio for its Expense Group. The Board also noted that the Adviser has agreed to waive or to reimburse expenses through April 2012 to the extent necessary to maintain an agreed upon expense ratio. The Board concluded that the management fee charged to the Fund for advisory and related services is reasonable.
The Board considered the profits, if any, realized by the Adviser from managing the Fund, in light of the services rendered and the costs associated with providing such services, and concluded that the profits realized by the Adviser from managing the Fund are not excessive. In this regard, the Board also considered the extent to which the Adviser may realize economies of scale as the Fund grows, and whether the Fund’s fee reflects these economies of scale for the benefit of shareholders. The Board concluded that the advisory fee breakpoints in place will allow the Fund to continue to share in the benefits of economies of scale in the future as the Fund grows.
The Board did not consider any single factor as controlling in determining whether or not to renew the investment advisory agreement. Nor are the items described herein all of the matters considered by the Board. Based on its consideration of the foregoing factors and conclusions, and such other factors and conclusions as it deemed relevant, and assisted by the advice of its independent counsel, the Board concluded that the renewal of the investment advisory agreement, including the fee structure (described herein) is in the interests of shareholders, and accordingly, the Board approved the continuation of the advisory agreement for an additional one-year period.
22
This report must be preceded or accompanied by a Van Eck VIP (the “Trust”) Prospectus, which includes more complete information. An investor should consider the investment objective, risks, and charges and expenses of the Fund carefully before investing. The prospectus contains this and other information about the investment company. Please read the prospectus carefully before investing.
Additional information about the Trust’s Board of Trustees/Officers and a description of the policies and procedures the Trust uses to determine how to vote proxies relating to portfolio securities are provided in the Statement of Additional Information. The Statement of Information and information regarding how the Trust voted proxies relating to portfolio securities during the most recent twelve month period ending June 30 is available, without charge, by calling 800.826.2333, or by visiting vaneck.com, or on the Securities and Exchange Commission’s website at http://www.sec.gov.
The Trust files its complete schedule of portfolio holdings with the Securities and Exchange Commission for the first and third quarters of each fiscal year on Form N-Q. The Trust’s Form N-Qs are available on the Commission’s website at http://www.sec.gov and may be reviewed and copied at the Commission’s Public Reference Room in Washington, D.C. Information on the operation of the Public Reference Room may be obtained by calling 202.942.8090. The Fund’s complete schedule of portfolio holdings is also available by calling 800.826.2333 or by visiting vaneck.com.
| |

|
|
Investment Adviser: | Van Eck Associates Corporation |
Distributor: | Van Eck Securities Corporation |
| 335 Madison Avenue, New York, NY 10017 |
| vaneck.com |
Account Assistance: | 800.544.4653 |
| |
vaneck.com | |
| VIPGHASAR |
Item 2. CODE OF ETHICS.

     Not applicable.

Item 3. AUDIT COMMITTEE FINANCIAL EXPERT.

     Not applicable.

Item 4. PRINCIPAL ACCOUNTANT FEES AND SERVICES.

     Not applicable.

Item 5. AUDIT COMMITTEE OF LISTED REGISTRANTS.

        Not applicable.

Item 6. SCHEDULE OF INVESTMENTS.

     Information included in Item 1.

Item 7. DISCLOSURE OF PROXY VOTING POLICIES AND PROCEDURES FOR CLOSED-END
        MANAGEMENT INVESTMENT COMPANIES.

     Not applicable.

Item 8. PORTFOLIO MANAGER OF CLOSED-END MANAGEMENT INVESTMENT COMPANIES.

     Not applicable.

Item 9. PURCHASES OF EQUITY SECURITIES BY CLOSED-END MANAGEMENT INVESTMENT
        COMPANY AND AFFILIATED PURCHASERS.

     Not applicable.

Item 10. SUBMISSION OF MATTERS TO A VOTE OF SECURITY HOLDERS.

     No changes.

Item 11. CONTROLS AND PROCEDURES.

(a)  The Chief Executive Officer and the Chief Financial Officer have concluded
     that the Van Eck VIP Global Hard Assets Fund disclosure controls and
     procedures (as defined in Rule 30a-3(c) under the Investment Company Act)
     provide reasonable assurances that material information relating to the Van
     Eck VIP Global Hard Assets Fund is made known to them by the appropriate
     persons, based on their evaluation of these controls and procedures as of a
     date within 90 days of the filing date of this report.

(b)  There were no significant changes in the registrant's internal controls
     over financial reporting or in other factors that could significantly
     affect these controls over financial reporting subsequent to the date of
     our evaluation.

Item 12. EXHIBITS.

(a)(1) Not applicable.

(a)(2) A separate certification for each principal executive officer and
       principal financial officer of the registrant as required by Rule 30a-2
       under the Act (17 CFR 270.30a-2) is attached as Exhibit 99.CERT.

(b)  Certification pursuant to Section 906 of the Sarbanes-Oxley Act of 2002 is
     furnished as Exhibit 99.906CERT.
                                   SIGNATURES


Pursuant to the requirements of the Securities Exchange Act of 1934 and the
Investment Company Act of 1940, the registrant has duly caused this report to be
signed on its behalf by the undersigned, thereunto duly authorized.

(Registrant) VAN ECK VIP TRUST - VAN ECK VIP GLOBAL HARD ASSETS FUND

By (Signature and Title) /s/ Bruce J. Smith, SVP & CFO
                         -----------------------------
Date  September 2, 2011
     -------------------

Pursuant to the requirements of the Securities Exchange Act of 1934 and the
Investment Company Act of 1940, this report has been signed below by the
following persons on behalf of the registrant and in the capacities and on the
dates indicated.

By (Signature and Title) /s/ Jan F. van Eck, CEO
                        -------------------------
Date  September 2, 2011
     -------------------

By (Signature and Title)  /s/ Bruce J. Smith, CFO
                         ------------------------

Date  September 2, 2011
     -------------------