                                  UNITED STATES

                       SECURITIES AND EXCHANGE COMMISSION

                             Washington, D.C. 20549


                                   FORM N-CSR

              CERTIFIED SHAREHOLDER REPORT OF REGISTERED MANAGEMENT

                              INVESTMENT COMPANIES

Investment Company Act file number  811-05083

    VAN ECK VIP TRUST - VAN ECK VIP UNCONSTRAINED EMERGING MARKETS BOND FUND
               (Exact name of registrant as specified in charter)

                     335 Madison Avenue, New York, NY 10017
               (Address of principal executive offices) (Zip code)

                         Van Eck Associates Corporation
                     335 Madison Avenue, New York, NY 10017
                     (Name and address of agent for service)

Registrant's telephone number, including area code: (212) 293-2000

Date of fiscal year end:  DECEMBER 31

Date of reporting period: JUNE 30, 2013
Item 1. Report to Shareholders
| SEMI-ANNUAL REPORT JUNE 30, 2013 (unaudited) |
Van Eck VIP Trust
Van Eck VIP Unconstrained Emerging Markets Bond Fund (formerly known as Van Eck VIP Global Bond Fund) | ||||
 | ||||
Van Eck VIP Unconstrained Emerging Markets Bond Fund
The information contained in this shareholder letter represents the personal opinions of the investment team members and may differ from those of other portfolio managers or of the firm as a whole. This information is not intended to be a forecast of future events, a guarantee of future results or investment advice. Also, unless otherwise specifically noted, any discussion of the Fund’s holdings and the Fund’s performance, and the views of the investment team members are as of June 30, 2013, and are subject to change.
VAN ECK VIP UNCONSTRAINED EMERGING MARKETS BOND FUND
Dear Shareholder:
On May 1, 2013, the Van Eck VIP Global Bond Fund implemented changes to its principal investment strategies and changed its name to the Van Eck VIP Unconstrained Emerging Markets Bond Fund and its benchmarks to the J.P. Morgan Government Bond — Emerging Markets Global Diversified (GBI-EM) Index1 and the J.P. Morgan Emerging Markets Bond Global Diversified (EMBI) Index2.
Overview
Emerging markets (EM) debt attracted just more than $30 billion in mutual fund inflows during the first half of 2013. At the same time, starting in May 2013 the asset class suffered its largest weekly outflows since the Lehman crisis in 2008, as there was a rotation out of emerging markets debt and equities in favor of developed market equities. Concerns around an end to easy monetary policy in the U.S. were a major headwind to emerging markets debt — both hard and local currency. A lot of money flowed into EM debt, seeking superior yields and fundamentals. Although those yields and fundamentals are still intact, the selling pressure resulted in what are, in our opinion, over-reactions. Indeed as has been the case for the past several years, the primary risk to emerging markets debt came from the developed markets, not from the emerging markets countries themselves. However, during this period, the main factor was a U.S.-driven reversal of capital flows instead of a European-driven credit shock, as was the case in 2012.
With a focus on the last two months of the semi-annual period from a country-specific perspective, it was a contest of which market declined the least, as all major country bond markets were down. In local currency3 terms, as measured by the GBI-EM, China, Hungary and Malaysia were down the least, with the biggest negative performances coming from Brazil, the Philippines and Peru. In hard currency4 terms, as measured by the EMBI, it was similarly a contest of which country’s debt market declined least. In particular, small positive returns led Pakistan and Jamaica to be the best performers, with Bulgaria in the top three by being down only slightly. Uruguay, Ivory Coast and Senegal generated the biggest negative returns in hard currency debt.
Fund Review
From January 1, 2013 through April 30, 2013 (the “initial part of the reporting period”), the Fund was still operating as the Van Eck VIP Global Bond Fund. The Initial Class shares of the Fund advanced 0.51% during the initial part of the reporting period, outperforming its then benchmark index, the Citigroup World Government Bond Index5, which declined 1.74% (in U.S. dollar terms) for the same period. The largest driver of the Fund’s outperformance during the initial part of the reporting period was its lack of exposure to the Japanese bond market and to its currency, the yen. For the four months through April 30, 2013, the Japanese bond market declined 9.48% in U.S. dollar terms, as the yen weakened materially relative to the U.S. dollar. The yen’s weakness during these months was a continuation of a trend that began in late 2012 as a result of then newly elected Japanese Prime Minister Shinzo Abe’s apparent commitment to reflationary monetary and fiscal policy. The Fund’s overweighted exposures relative to the Citigroup World Government Bond Index to the dollar-bloc bond markets of Australia, Canada and New Zealand also contributed positively to its relative performance during the initial part of the reporting period. Only partially offsetting these positive contributors was the Fund’s underweight exposure relative to the Citigroup World Government Bond Index to the peripheral European bond markets, which detracted during the first four months of 2013. More specifically, the Fund was hurt by its lack of exposure to the strongly-performing bond markets of Italy, Spain and Ireland, which returned 4.69%, 8.09% and 7.88%, respectively, in U.S. dollar terms, during the initial part of the reporting period.
On May 1, 2013, the Van Eck VIP Global Bond Fund implemented changes to its principal investment strategy and changed its name to the Van Eck VIP Unconstrained Emerging Markets Bond Fund. From May 1, 2013 through June 30, 2013 (the “latter part of the reporting period”), the Initial Class shares of the Fund declined 12.79%. During the same period, the GBI-EM and the EMBI fell 10.12% and 8.31%, respectively. The Fund’s absolute performance was driven by losses from positions in Venezuela hard currency bonds as well as in the local currency bonds of the Philippines, Mexico, Nigeria, Brazil and Uruguay. Such negative returns were only slightly offset by absolute gains from positions in Indonesia hard currency bonds, China hard currency debt and Peru local currency bonds. While, as indicated, virtually all bond markets represented in the GBI-EM and EMBI declined during the latter part of the reporting period, the Fund’s performance relative to the two benchmark indices was hurt most by its overweighted allocations to Venezuela hard currency bonds, Brazil local currency debt and Philippine local currency debt, as these markets declined steeply.
At the end of June 2013, the Fund’s portfolio reflected our view that weakness in 2Q13 is likely to represent a longer-term buying opportunity, while generating attractive carry in the meantime. Opportunities in the space, in our opinion, will likely be generated by an eventual calming of currency and interest rate markets, in which a country’s bottom-up fundamentals
| 1 |
VAN ECK VIP UNCONSTRAINED EMERGING MARKETS BOND FUND
(as opposed to technicals triggered in U.S. Treasuries) drive asset prices. EM debt has higher real yields and higher credit spreads than developed markets, with superior fundamentals, in our opinion — we aim to earn outsized carry while we position to capture longer term upside that should be generated by country fundamentals over time.
The countries where we see the best opportunities can generally be characterized as having strong balance sheets, high real interest rates, and stabilized technicals. All of them have been in our portfolio to medium or large degrees over time. In particular, we like Nigerian local debt, with one-year average yields in the 13% range (relative to inflation of around 8%), a currency that is credibly managed by the central bank, low indebtedness, and long-term rating upgrade potential. Brazilian local debt has also become attractive, in our opinion, offering one-year average yields of 7%-9% (relative to inflation of around 6%-7%), a strong balance sheet, a currency that has been among the weakest in EM, what we consider to be continued bearish positioning in the currency, and an overall negative investor bias on Brazil. Romanian local debt remains attractive due to yields of around 5%, with inflation looking set to decline, but more importantly a Bund curve that has anchored European yields more than U.S.-based yield curves. Russia local debt is attractive due to a potential rate-cutting cycle later in 2013 as base effects reduce inflation. A strong balance sheet and cleaner positioning round out the argument. We also remain constructive on Mexico, where a reform program and leverage to U.S. growth give it upside potential; however, we are somewhat concerned about positioning there. In hard-currency debt, we had a bias to accumulate bonds that finally showed value after the 2Q selloff in EM debt, and viewed those types of bonds as the most likely to stabilize first (thus “phase 1” assets). However, there was no one champion to reflect this. Instead, we had a smattering of credits including Hungary, Colombia, the Philippines, Iraq, and Mexico. These will likely act, currently, and as we transition to whatever new yield environment materializes, as defensive investments that can perform well in risk-off environments, especially if the U.S. dollar is rallying.
We should emphasize, moreover, that “good fundamentals” aren’t simply a nice theoretical argument supporting the asset class. There are very practical implications of “good fundamentals”. A different way of describing the type of fundamentals that we focus on and which describe a “strong” EM balance sheet is to say that the countries have high savings rates. High savings rates mean that domestic savings pools (often mutual funds) have a natural bid for duration - most countries can sell their government’s debt to private actors, not a co-opted central bank. Yet another way of describing high savings/strong balance sheet is that many of these governments have no acute need for money. As a result, Thailand, Romania, and Nigeria have cancelled bond auctions simply because they did not like the price, while Brazil has announced (limited) buybacks of its domestic debt. Good fundamentals matter for practical reasons.
EM Bond Country Return Breakdown (YTD as of June 30, 2013)
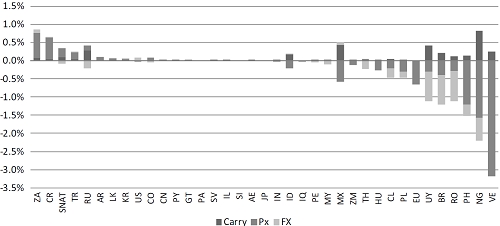
Source: Van Eck Research. Not intended to be a forecast of future events, a guarantee of future results or investment advice. Current market conditions may not continue.
During the latter part of the reporting period, the Fund used derivatives, specifically non-deliverable and deliverable foreign exchange forwards, to hedge the currency component of fixed income holdings. In particular, the Fund directly hedged its Mexican peso risk and its Brazilian real risk using these forwards, for short periods of time. The Fund also hedged the euro risk encumbered in other currency positions. During the initial part of the reporting period, the Fund did not use any derivatives.
| 2 |
The Fund is subject to risks associated with its investments in emerging markets securities. Investing in foreign denominated and/or domiciled securities may involve heightened risk due to currency fluctuations, and economic and political risks, which may be enhanced in emerging markets. As the Fund may invest in securities denominated in foreign currencies and some of the income received by the Fund will be in foreign currencies, changes in currency exchange rates may negatively impact the Fund’s return. Derivatives may involve certain costs and risks such as liquidity, interest rate, market, credit, management and the risk that a position could not be closed when most advantageous. The Fund may also be subject to credit risk, interest rate risk, sovereign debt risk, tax risk, non-diversification risk and risks associated with non-investment grade securities. Please see the prospectus and summary prospectus for information on these and other risk considerations.
We thoroughly appreciate your participation in the Van Eck VIP Unconstrained Emerging Markets Bond Fund, and we look forward to helping you meet your investment goals in the future.
Investment Committee:
 |  |  | |||
 |  |  | |||
| Eric Fine | Carlos Nogueira | David Austerweil | |||
| Portfolio Manager | Assistant Portfolio Manager | Assistant Portfolio Manager | |||
July 19, 2013
All indices listed are unmanaged indices and include the reinvestment of all dividends, but do not reflect the payment of transaction costs, advisory fees or expenses that are associated with an investment in the Fund. An index’s performance is not illustrative of the Fund’s performance. Indices are not securities in which investments can be made.
| 1 | The J.P. Morgan Government Bond Index-Emerging Markets Global Diversified (GBI-EM) tracks local currency bonds issued by Emerging Markets governments. The index spans over 15 countries. |
| 2 | The J.P. Morgan Emerging Markets Bond Index Global Diversified (EMBI) tracks returns for actively traded external debt instruments in emerging markets, and is also J.P. Morgan’s most liquid U.S-dollar emerging markets debt benchmark. |
| 3 | Emerging markets local currency bonds are bonds denominated in the local currency of the issuer. |
| 4 | Hard currency refers to currencies that are generally widely accepted around the world such as the U.S. dollar, euro or yen. |
| 5 | The Citigroup World Government Bond Index (CGWGBI) is a market capitalization weighted benchmark that tracks the performance of approximately 20 world government bond markets. |
| 3 |
VAN ECK VIP UNCONSTRAINED EMERGING MARKETS BOND FUND
(unaudited)
As a shareholder of the Fund, you incur two types of costs: (1) transaction costs, including program fees on purchase payments; and (2) ongoing costs, including management fees and other Fund expenses. This disclosure is intended to help you understand the ongoing costs (in dollars) of investing in the Fund and to compare these costs with the ongoing costs of investing in other mutual funds.
The disclosure is based on an investment of $1,000 invested at the beginning of the period and held for the entire period, January 1, 2013 to June 30, 2013.
Actual Expenses
The first line in the table below provides information about account values and actual expenses. You may use the information in this line, together with the amount you invested, to estimate the expenses that you paid over the period. Simply divide your account value by $1,000 (for example, an $8,600 account value divided by $1,000 = 8.6), then multiply the result by the number in the first line under the heading entitled “Expenses Paid During the Period.”
Hypothetical Example for Comparison Purposes
The second line in the table below provides information about hypothetical account values and hypothetical expenses based on the Fund’s actual expense ratio and an assumed rate of return of 5% per year before expenses, which is not the Fund’s actual return. The hypothetical account values and expenses may not be used to estimate the actual ending account balance or expenses you paid for the period. You may use this information to compare the ongoing costs of investing in the Fund and other funds. To do so, compare this 5% hypothetical example with the 5% hypothetical examples that appear in the shareholder reports of other funds.
Please note that the expenses shown in the table are meant to highlight your ongoing costs only and do not reflect any transactional costs, such as fees on purchase payments. Therefore, the second line of the table is useful in comparing ongoing costs only, and will not help you determine the relative costs of owning different funds. In addition, if these transactional costs were included, your costs would have been higher.
Van Eck VIP Unconstrained Emerging Markets Bond Fund
| Beginning Account Value January 1, 2013 | Ending Account Value June 30, 2013 | Expenses Paid During the Period* January 1, 2013 – June 30, 2013 | |||||||
| Initial Class | Actual | $1,000.00 | $ | 876.60 | $5.12 | ||||
| Hypothetical** | $1,000.00 | $ | 1,019.34 | $5.51 | |||||
| * | Expenses are equal to the Fund’s annualized expense ratio (for the six months ended June 30, 2013), of 1.10% multiplied by the average account value over the period, multiplied by the number of days in the most recent fiscal half year divided by the number of days in the fiscal year (to reflect the one-half year period). |
| ** | Assumes annual return of 5% before expenses |
| 4 |
June 30, 2013 (unaudited)
| Principal Amount | Value | ||||||
| CORPORATE BONDS: 28.3% | |||||||
| Brazil: 12.9% | |||||||
| BRL | 2,500,000 | Cia Energetica de Sao Paulo 6.87%, 01/15/15 Reg S TIPS | $ | 1,697,406 | |||
| 5,375,000 | Concessionaria Ecovias dos Imigrantes S.A. 4.28%, 04/15/24 # § TIPS | 2,314,753 | |||||
| USD | 1,920,000 | Vale S.A. 5.63%, 09/11/42 | 1,684,591 | ||||
| 5,696,750 | |||||||
| Hungary: 2.1% | |||||||
| 1,000,000 | Nitrogenmuvek Zrt 7.88%, 05/21/17 (c) 144A | 942,500 | |||||
| Mexico: 9.2% | |||||||
| MXN | 17,650,000 | Grupo Televisa S.A.B. 7.25%, 05/14/43 | 1,162,085 | ||||
| 21,000,000 | Petroleos Mexicanos 7.65%, 11/24/21 Reg S | 1,722,631 | |||||
| USD | 1,250,000 | Servicios Corporativos Javer SAPI de C.V. 9.88%, 04/06/16 (c) Reg S | 1,150,000 | ||||
| 4,034,716 | |||||||
| Singapore: 0.4% | |||||||
| 410,000 | Bakrie Telecom Pte Ltd. 11.50%, 08/09/13 (c) Reg S | 158,875 | |||||
| United States: 3.7% | |||||||
| 240,000 | Rolta, LLC 10.75%, 05/16/16 (c) 144A | 225,600 | |||||
| 1,675,000 | Southern Copper Corp. 5.25%, 11/08/42 | 1,382,845 | |||||
| 1,608,445 | |||||||
| Total Corporate Bonds (Cost: $13,625,902) | 12,441,286 | ||||||
GOVERNMENT OBLIGATIONS: 51.5% | |||||||
| Iraq:1.8% | |||||||
| 960,000 | Republic of Iraq 5.80%, 08/25/13 (c) Reg S | 804,000 | |||||
| Mexico: 4.4% | |||||||
| 2,100,000 | Mexican Government International Bond 5.75%, 10/12/49 | 1,926,750 | |||||
| Nigeria: 12.6% | |||||||
| Nigerian Government Bonds | |||||||
| NGN | 475,000,000 | 10.00%, 07/23/30 | 2,177,115 | ||||
| 300,000,000 | 16.00%, 06/29/19 | 1,990,119 | |||||
| 200,000,000 | 16.39%, 01/27/22 | 1,380,520 | |||||
| 5,547,754 | |||||||
| Principal Amount | Value | ||||||
| Philippines: 11.9% | |||||||
| Philippine Government International Bonds | |||||||
| PHP | 23,000,000 | 3.90%, 11/26/22 | $ | 516,850 | |||
| 11,000,000 | 4.95%, 01/15/21 | 261,135 | |||||
| 181,000,000 | 6.25%, 01/14/36 | 4,462,153 | |||||
| 5,240,138 | |||||||
| Poland: 4.2% | |||||||
| PLN | 6,250,000 | Polish Government Bond 4.00%, 10/25/23 | 1,828,812 | ||||
| Romania: 4.3% | |||||||
| RON | 6,480,000 | Romanian Government Bond 5.80%, 07/26/27 | 1,909,173 | ||||
| Slovenia: 3.0% | |||||||
| USD | 1,440,000 | Slovenia Government International Bond 5.85%, 05/10/23 Reg S | 1,342,800 | ||||
| Thailand: 2.1% | |||||||
| THB | 30,000,000 | Thailand Government Bond 3.58%, 12/17/27 | 913,544 | ||||
| Uruguay: 6.3% | |||||||
| Uruguay Government International Bonds | |||||||
| UYU | 8,936,632 | 3.70%, 06/26/37 | 474,943 | ||||
| 39,760,494 | 4.38%, 12/15/28 | 2,279,926 | |||||
| 2,754,869 | |||||||
| Venezuela: 0.9% | |||||||
| USD | 420,000 | Venezuelan Government International Bond 11.75%, 10/21/26 Reg S | 401,100 | ||||
| Total Government Obligations (Cost: $25,314,792) | 22,668,940 | ||||||
| Number of Shares | |||||||
| MONEY MARKET FUND: 25.2% (Cost: $11,072,428) | |||||||
| 11,072,428 | AIM Treasury Portfolio - Institutional Class | 11,072,428 | |||||
| Total Investments: 105.0% (Cost: $50,013,122) | 46,182,654 | ||||||
| Liabilities in excess of other assets: (5.0)% | (2,198,281 | ) | |||||
| NET ASSETS: 100.0% | $ | 43,984,373 | |||||
| BRL | — | Brazilian Real |
| MXN | — | Mexican Peso |
| NGN | — | Nigerian Naira |
| PHP | — | Philippine Peso |
| PLN | — | Polish Zloty |
| RON | — | Romanian Leu |
| THB | — | Thai Baht |
| USD | — | United States Dollar |
| UYU | — | Uruguayan Peso |
See Notes to Financial Statements
| 5 |
VAN ECK VIP UNCONSTRAINED EMERGING MARKETS BOND FUND
SCHEDULE OF INVESTMENTS
(continued)
| (c) | Callable Security - the redemption date shown is when the security may be redeemed by the issuer |
| # | Indicates a fair valued security which has not been valued utilizing an independent quote, but has been valued pursuant to guidelines established by the |
| Board of Trustees. The aggregate value of fair valued securities is $2,314,753 which represents 5.3% of net assets. | |
| § | Illiquid Security - the aggregate value of illiquid securities is $2,314,753 which represents 5.3% of net assets. |
| Reg S | Security was purchased pursuant to Regulation S under the Securities Act of 1933, which exempts from registration securities offered and sold outside of the United States. Such a security cannot be sold in the United States without either an effective registration statement filed pursuant to the Securities Act of 1933, or pursuant to an exemption from registration. |
| 144A | Security exempt from registration under Rule 144A of the Securities Act of 1933, as amended, or otherwise restricted. These securities may be resold in |
| transactions exempt from registration, unless otherwise noted, and the value amounted to $1,168,100, or 2.7% of net assets. | |
| TIPS | Treasury Inflation Protected Securities |
As of June 30, 2013, the fund had the following open forward foreign currency contracts:
| Counterparty | Contracts to deliver | In Exchange For | Settlement Dates | Unrealized Appreciation (Depreciation) | ||||||||||||
| State Street Bank And Trust Company | USD | 1,104,210 | BRL | 2,400,000 | 7/2/2013 | (28,628 | ) | |||||||||
| State Street Bank And Trust Company | BRL | 1,584,000 | USD | 741,747 | 7/2/2013 | 31,863 | ||||||||||
| State Street Bank And Trust Company | USD | 1,190,980 | BRL | 2,592,168 | 7/2/2013 | (29,276 | ) | |||||||||
| State Street Bank And Trust Company | USD | 700,000 | BRL | 1,518,300 | 7/2/2013 | (19,560 | ) | |||||||||
| State Street Bank And Trust Company | USD | 308,000 | BRL | 661,584 | 7/2/2013 | (11,505 | ) | |||||||||
| State Street Bank And Trust Company | BRL | 1,440,000 | USD | 672,740 | 7/2/2013 | 27,391 | ||||||||||
| State Street Bank And Trust Company | BRL | 1,047,600 | USD | 468,097 | 7/2/2013 | (1,395 | ) | |||||||||
| State Street Bank And Trust Company | BRL | 1,584,000 | USD | 741,226 | 7/2/2013 | 31,342 | ||||||||||
| State Street Bank And Trust Company | BRL | 1,200,000 | USD | 560,486 | 7/2/2013 | 22,695 | ||||||||||
| State Street Bank And Trust Company | EUR | 4,704,000 | USD | 6,101,041 | 7/5/2013 | (21,991 | ) | |||||||||
| State Street Bank And Trust Company | USD | 4,294,339 | EUR | 3,312,000 | 7/5/2013 | 16,775 | ||||||||||
| State Street Bank And Trust Company | USD | 929,795 | EUR | 696,000 | 7/5/2013 | (23,837 | ) | |||||||||
| State Street Bank And Trust Company | USD | 925,840 | EUR | 696,000 | 7/5/2013 | (19,881 | ) | |||||||||
| State Street Bank And Trust Company | USD | 1,200,000 | MXN | 15,823,080 | 7/24/2013 | 18,771 | ||||||||||
| State Street Bank And Trust Company | USD | 20,005 | MXN | 264,720 | 7/24/2013 | 385 | ||||||||||
| State Street Bank And Trust Company | MXN | 16,087,800 | USD | 1,200,000 | 7/24/2013 | (39,161 | ) | |||||||||
| State Street Bank And Trust Company | EUR | 1,513,678 | USD | 2,000,000 | 7/24/2013 | 29,550 | ||||||||||
| State Street Bank And Trust Company | EUR | 1,135,173 | USD | 1,500,000 | 7/24/2013 | 22,274 | ||||||||||
| State Street Bank And Trust Company | MXN | 21,586,950 | USD | 1,650,000 | 8/2/2013 | (11,404 | ) | |||||||||
| State Street Bank And Trust Company | BRL | 5,501,750 | USD | 2,500,000 | 8/2/2013 | 51,568 | ||||||||||
| State Street Bank And Trust Company | USD | 162,295 | BRL | 358,996 | 8/2/2013 | (2,532 | ) | |||||||||
| State Street Bank And Trust Company | USD | 325,103 | BRL | 717,991 | 8/2/2013 | (5,577 | ) | |||||||||
| State Street Bank And Trust Company | BRL | 6,242,500 | USD | 2,750,000 | 8/2/2013 | (28,087 | ) | |||||||||
| State Street Bank And Trust Company | BRL | 6,253,500 | USD | 2,750,000 | 8/2/2013 | (32,982 | ) | |||||||||
| State Street Bank And Trust Company | USD | 2,500,000 | BRL | 5,560,000 | 8/2/2013 | (25,644 | ) | |||||||||
| Net unrealized depreciation on forward foreign currency contracts | (48,846 | ) | ||||||||||||||
| BRL | — | Brazilian Real |
| EUR | — | Euro |
| MXN | — | Mexican Peso |
| USD | — | United States Dollar |
| Summary of Investments by Sector (unaudited) | % of Investments | Value | |||||||
| Basic Materials | 8.7 | % | $ | 4,009,936 | |||||
| Communications | 2.8 | 1,320,960 | |||||||
| Consumer, Cyclical | 2.5 | 1,150,000 | |||||||
| Consumer, Non-cyclical | 5.0 | 2,314,753 | |||||||
| Energy | 3.7 | 1,722,631 | |||||||
| Government | 49.1 | 22,668,940 | |||||||
| Money Market Fund | 24.0 | 11,072,428 | |||||||
| Technology | 0.5 | 225,600 | |||||||
| Utilities | 3.7 | 1,697,406 | |||||||
| 100.0 | % | $ | 46,182,654 | ||||||
See Notes to Financial Statements
| 6 |
The summary of inputs used to value the Fund’s investments as of June 30, 2013 is as follows:
| Level 1 Quoted Prices | Level 2 Significant Observable Inputs | Level 3 Significant Unobservable Inputs | Value | |||||||||||||
| Corporate Bonds* | $ | — | $ | 12,441,286 | $ | — | $ | 12,441,286 | ||||||||
| Government Obligations* | — | 22,668,940 | — | 22,668,940 | ||||||||||||
| Money Market Fund | 11,072,428 | — | — | 11,072,428 | ||||||||||||
| Total | $ | 11,072,428 | $ | 35,110,226 | $ | — | $ | 46,182,654 | ||||||||
| Other Financial Instruments | ||||||||||||||||
| Forward Foreign Currency Contracts | $ | — | $ | (48,846 | ) | $ | — | $ | (48,846 | ) | ||||||
| * | See Schedule of Investments for security type and geographic sector breakouts. |
See Notes to Financial Statements
| 7 |
VAN ECK VIP UNCONSTRAINED EMERGING MARKETS BOND FUND
STATEMENT OF ASSETS AND LIABILITIES
June 30, 2013 (unaudited)
| Assets: | ||||
| Investments, at value (Cost $50,013,122) | $ | 46,182,654 | ||
| Receivables: | ||||
| Investments sold | 4,134,093 | |||
| Shares of beneficial interest sold | 45,534 | |||
| Dividends and interest | 926,407 | |||
| Foreign tax reclaim | 10,266 | |||
| Prepaid expenses | 238 | |||
| Other assets | 6,621 | |||
| Total assets | 51,305,813 | |||
| Liabilities: | ||||
| Payables: | ||||
| Investments purchased | 7,067,703 | |||
| Shares of beneficial interest redeemed | 58,839 | |||
| Due to Adviser | 32,865 | |||
| Due to custodian | 9,276 | |||
| Deferred Trustee fees | 10,569 | |||
| Accrued expenses | 93,342 | |||
| Unrealized depreciation on forward foreign currency contracts | 48,846 | |||
| Total liabilities | 7,321,440 | |||
| NET ASSETS | $ | 43,984,373 | ||
| Shares of beneficial interest outstanding | 4,299,114 | |||
| Net asset value, redemption and offering price per share | $ | 10.23 | ||
| Net Assets consist of: | ||||
| Aggregate paid in capital | $ | 40,217,690 | ||
| Net unrealized depreciation | (3,905,423 | ) | ||
| Undistributed net investment income | 775,686 | |||
| Accumulated net realized gain | 6,896,420 | |||
| $ | 43,984,373 | |||
See Notes to Financial Statements
| 8 |
For the Six Months Ended June 30, 2013 (unaudited)
| Income: | ||||||||
| Dividends | $ | 425 | ||||||
| Interest (net of foreign taxes withheld of $4,143) | 1,070,528 | |||||||
| Total income | 1,070,953 | |||||||
| Expenses: | ||||||||
| Management fees | $ | 253,098 | ||||||
| Transfer agent fees | 12,565 | |||||||
| Custodian fees | 3,615 | |||||||
| Professional fees | 16,479 | |||||||
| Reports to shareholders | 14,559 | |||||||
| Insurance | 1,193 | |||||||
| Trustees’ fees and expenses | 1,366 | |||||||
| Interest | 26 | |||||||
| Other | 1,473 | |||||||
| Total expenses | 304,374 | |||||||
| Waiver of management fees | (26,098 | ) | ||||||
| Net expenses | 278,276 | |||||||
| Net investment income | 792,677 | |||||||
| Net realized gain (loss) on: | ||||||||
| Investments | 6,941,402 | |||||||
| Forward foreign currency contracts, foreign currency transactions and foreign denominated assets and liabilities | (44,797 | ) | ||||||
| Net realized gain | 6,896,605 | |||||||
| Net change in unrealized appreciation (depreciation) on: | ||||||||
| Investments | (13,879,768 | ) | ||||||
| Forward foreign currency contracts, foreign currency transactions and foreign denominated assets and liabilities | (86,452 | ) | ||||||
| Net change in unrealized appreciation (depreciation) | (13,966,220 | ) | ||||||
| Net Decrease in Net Assets Resulting from Operations | $ | (6,276,938 | ) |
See Notes to Financial Statements
| 9 |
VAN ECK VIP UNCONSTRAINED EMERGING MARKETS BOND FUND
STATEMENT OF CHANGES IN NET ASSETS
| Six Months Ended June 30, 2013 | Year Ended December 31, 2012 | ||||||||||
| (unaudited) | |||||||||||
| Operations: | |||||||||||
| Net investment income | $ | 792,677 | $ | 1,159,662 | |||||||
| Net realized gain (loss) | 6,896,605 | (33,387 | ) | ||||||||
| Net change in unrealized appreciation (depreciation) | (13,966,220 | ) | 1,860,854 | ||||||||
| Net increase (decrease) in net assets resulting from operations | (6,276,938 | ) | 2,987,129 | ||||||||
| Dividends and Distributions to shareholders from: | |||||||||||
| Net investment income | |||||||||||
| Initial Class Shares | (1,121,981 | ) | (945,039 | ) | |||||||
| Class R1 Shares | — | (277,296 | ) | ||||||||
| (1,121,981 | ) | (1,222,335 | ) | ||||||||
| Net realized gains | |||||||||||
| Initial Class Shares | (9,085 | ) | (596,101 | ) | |||||||
| Class R1 Shares | — | (174,910 | ) | ||||||||
| (9,085 | ) | (771,011 | ) | ||||||||
| Total dividends and distributions | (1,131,066 | ) | (1,993,346 | ) | |||||||
| Share transactions*: | |||||||||||
| Proceeds from sale of shares | |||||||||||
| Initial Class Shares | 3,492,641 | 13,344,381 | |||||||||
| Class R1 Shares | — | 210,896 | |||||||||
| 3,492,641 | 13,555,277 | ||||||||||
| Transfer of shares due to conversion (a) | |||||||||||
| Initial Class Shares | — | 11,955,539 | |||||||||
| Class R1 Shares | — | (11,955,539 | ) | ||||||||
| — | — | ||||||||||
| Reinvestment of dividends and distributions | |||||||||||
| Initial Class Shares | 1,131,066 | 1,541,140 | |||||||||
| Class R1 Shares | — | 452,206 | |||||||||
| 1,131,066 | 1,993,346 | ||||||||||
| Cost of shares redeemed | |||||||||||
| Initial Class Shares | (7,760,744 | ) | (17,304,779 | ) | |||||||
| Class R1 Shares | — | (1,313,508 | ) | ||||||||
| Redemption fees | — | 338 | |||||||||
| (7,760,744 | ) | (18,617,949 | ) | ||||||||
| Net decrease in net assets resulting from share transactions | (3,137,037 | ) | (3,069,326 | ) | |||||||
| Total decrease in net assets | (10,545,041 | ) | (2,075,543 | ) | |||||||
| Net Assets: | |||||||||||
| Beginning of period | 54,529,414 | 56,604,957 | |||||||||
| End of period (including undistributed net investment income of $775,686 and $1,104,990, respectively) | $ | 43,984,373 | $ | 54,529,414 | |||||||
| * Shares of beneficial interest issued, reinvested and redeemed (unlimited number of $.001 par value shares authorized): | |||||||||||
| Initial Class Shares: | |||||||||||
| Shares sold | 301,812 | 1,153,175 | |||||||||
| Shares transferred (a) | — | 1,033,322 | |||||||||
| Shares reinvested | 97,338 | 134,129 | |||||||||
| Shares redeemed | (675,591 | ) | (1,490,971 | ) | |||||||
| Net increase (decrease) | (276,441 | ) | 829,655 | ||||||||
| Class R1 Shares: | |||||||||||
| Shares sold | — | 18,570 | |||||||||
| Shares transferred (a) | — | (1,033,322 | ) | ||||||||
| Shares reinvested | — | 39,356 | |||||||||
| Shares redeemed | — | (113,789 | ) | ||||||||
| Net decrease | — | (1,089,185 | ) | ||||||||
| (a) | At the close of business on April 30, 2012, the Fund closed Class R1 shares and all outstanding Class R1 shares were converted to Initial Class Shares. |
See Notes to Financial Statements
| 10 |
For a share outstanding throughout each period:
| Initial Class Shares | |||||||||||||||||||||||||
| For the Six Months Ended June 30, | Year Ended December 31, | ||||||||||||||||||||||||
| 2013 | 2012 | 2011 | 2010 | 2009 | 2008 | ||||||||||||||||||||
| (unaudited) | |||||||||||||||||||||||||
| Net asset value, beginning of period | $11.92 | $11.71 | $12.03 | $11.75 | $11.52 | $12.12 | |||||||||||||||||||
| Income from investment operations: | |||||||||||||||||||||||||
| Net investment income | 0.19 | 0.24 | 0.27 | 0.31 | 0.34 | 0.41 | |||||||||||||||||||
| Net realized and unrealized gain (loss) on investments | (1.63 | ) | 0.39 | 0.62 | (0.02 | ) | 0.30 | 0.02 | |||||||||||||||||
| Total from investment operations | (1.44 | ) | 0.63 | 0.89 | 0.29 | 0.64 | 0.43 | ||||||||||||||||||
| Less dividends and distributions from: | |||||||||||||||||||||||||
| Net investment income | (0.25 | ) | (0.26 | ) | (0.96 | ) | (0.42 | ) | (0.41 | ) | (1.03 | ) | |||||||||||||
| Net realized gains | — | (b) | (0.16 | ) | (0.25 | ) | — | — | — | ||||||||||||||||
| Total dividends and distributions | (0.25 | ) | (0.42 | ) | (1.21 | ) | (0.42 | ) | (0.41 | ) | (1.03 | ) | |||||||||||||
| Settlement payments from unaffiliated third parties | — | — | — | 0.41 | (c) | — | — | ||||||||||||||||||
| Redemption fees | — | — | (b) | — | (b) | — | (b) | — | (b) | — | (b) | ||||||||||||||
| Net asset value, end of period | $10.23 | $11.92 | $11.71 | $12.03 | $11.75 | $11.52 | |||||||||||||||||||
| Total return (a) | (12.34 | )%(e) | 5.55 | % | 8.14 | % | 6.20 | %(c) | 5.98 | % | 3.61 | % | |||||||||||||
| Ratios/Supplemental Data | |||||||||||||||||||||||||
| Net Assets, end of period (000’s) | $43,984 | $54,529 | $43,854 | $35,688 | $33,757 | $35,200 | |||||||||||||||||||
| Ratio of gross expenses to average net assets | 1.20 | %(d) | 1.18 | % | 1.22 | % | 1.30 | % | 1.31 | % | 1.17 | % | |||||||||||||
| Ratio of net expenses to average net assets | 1.10 | %(d) | 1.10 | % | 1.10 | % | 1.10 | % | 1.10 | % | 1.10 | % | |||||||||||||
| Ratio of net expenses, excluding interest expense,to average net assets | 1.10 | %(d) | 1.10 | % | 1.10 | % | 1.10 | % | 1.10 | % | 1.10 | % | |||||||||||||
| Ratio of net investment income to average net assets | 3.14 | %(d) | 2.10 | % | 2.33 | % | 2.60 | % | 2.95 | % | 3.08 | % | |||||||||||||
| Portfolio turnover rate | 215 | %(e) | 0 | % | 23 | % | 35 | % | 0 | % | 2 | % | |||||||||||||
| (a) | Total return is calculated assuming an initial investment made at the net asset value at the beginning of period, reinvestment of any dividends and distributions at net asset value on the dividend/distributions payment date and a redemption on the last day of the period. The return does not reflect the deduction of taxes that a shareholder would pay on Fund dividends/distributions or the redemption of Fund shares. |
| (b) | Amount represents less than $0.005 per share |
| (c) | For the year ended December 31, 2010, the Fund received settlement payments from unaffiliated third parties which represented 3.71% of the Initial Class Shares total return. |
| (d) | Annualized |
| (e) | Not annualized |
See Notes to Financial Statements
| 11 |
VAN ECK VIP UNCONSTRAINED EMERGING MARKETS BOND FUND
June 30, 2013 (unaudited)
Note 1—Fund Organization—Van Eck VIP Trust (the “Trust”) is registered under the Investment Company Act of 1940, as amended, as an open-end management investment company. The Trust was organized as a Massachusetts business trust on January 7, 1987. The Van Eck VIP Unconstrained Emerging Markets Bond Fund, previously known as the Van Eck VIP Global Bond Fund (the “Fund”), is a non-diversified series of the Trust and seeks high total return (income plus capital appreciation) by investing globally, primarily in a variety of debt securities. Effective May 1, 2013, the Fund implemented changes to its principal strategy. The Fund currently offers a single class of shares: Initial Class Shares. At the close of business on April 30, 2012, the Fund closed Class R1 Shares and all Class R1 Shares outstanding were converted to Initial Class Shares.
Note 2—Significant Accounting Policies—The preparation of financial statements in conformity with U.S. generally accepted accounting principles (“GAAP”) requires management to make estimates and assumptions that affect the reported amounts and disclosures in the financial statements. Actual results could differ from those estimates.
The following is a summary of significant accounting policies followed by the Fund.
| A. | Security Valuation—The Fund values its investments in securities and other assets and liabilities carried at fair value daily. Fair value is the price that would be received to sell an asset or paid to transfer a liability in an orderly transaction between market participants on the measurement date. Bonds and notes are fair valued by a pricing service which utilizes models that incorporate observable data such as sales of similar securities, broker quotes, yields, bids, offers and reference data and are categorized as Level 2 in the fair value hierarchy. Short-term obligations purchased with more than sixty days remaining to maturity are valued at market value. Short-term obligations purchased with sixty days or less to maturity are valued at amortized cost, which with accrued interest approximates fair value. Money market fund investments are valued at net asset value. Forward foreign currency contracts are valued at the spot currency rate plus an amount (“points”), which reflects the differences in interest rates between the U.S. and foreign markets and are categorized as Level 2 in the fair value hierarchy. Securities for which quotations are not available are stated at fair value as determined by the Pricing Committee of Van Eck Associates Corporation (the “Adviser”) appointed by the Board of Trustees. The Pricing Committee provides oversight of the Fund’s valuation policies and procedures, which are approved by the Fund’s Board of Trustees. Among other things, these procedures allow the Fund to utilize independent pricing services, quotations from broker dealers, and other market sources to determine fair value. The Pricing Committee convenes regularly to review the fair value of financial instruments for which market prices are not readily available. The Pricing Committee employs various methods for calibrating the valuation approaches utilized to determine fair value, including a regular review of key inputs and assumptions, transactional back-testing and disposition analysis. | |
| Certain factors such as economic conditions, political events, market trends, the nature of and duration of any restrictions on disposition, trading in similar securities of the issuer or comparable issuers and other security specific information are used to determine the fair value for these securities. Depending on the relative significance of valuation inputs, these securities may be classified either as Level 2 or Level 3 in the fair value hierarchy. The price which the Fund may realize upon sale of an investment may differ materially from the value presented on the Schedule of Investments. | ||
| The Fund utilizes various methods to measure the fair value of its investments on a recurring basis which includes a hierarchy that prioritizes inputs to valuation methods used to measure fair value. The fair value hierarchy gives highest priority to unadjusted quoted prices in active markets for identical assets and liabilities (Level 1 measurements) and the lowest priority to unobservable inputs (Level 3 measurements). The inputs or methodologies used for valuing securities are not necessarily an indication of the risk associated with investing in those securities. The transfers between levels of the fair value hierarchy assume the financial instruments were transferred at the beginning of the reporting period. The three levels of the fair value hierarchy are described below: | ||
| Level 1 – | Quoted prices in active markets for identical securities. | |
| Level 2 – | Significant observable inputs (including quoted prices for similar securities, interest rates, prepayment speeds, credit risk, etc.). | |
| Level 3 – | Significant unobservable inputs (including the Fund’s own assumptions in determining the fair value of investments). | |
| A summary of the inputs, the levels used to value the Fund’s investments, and transfers between levels are located in the Schedule of Investments. Additionally, tables that reconcile the valuation of the Fund’s Level 3 investments and that present additional information about valuation methodologies and unobservable inputs, if applicable, are located in the Schedule of Investments. | ||
| B. | Federal Income Taxes—It is the Fund’s policy to comply with the provisions of the Internal Revenue Code applicable to regulated investment companies and to distribute all of its taxable income to its shareholders. Therefore, no federal income tax provision is required. | |
| 12 |
| C. | Currency Translation—Assets and liabilities denominated in foreign currencies and commitments under foreign currency contracts are translated into U.S. dollars at the closing prices of such currencies each business day. Purchases and sales of investments are translated at the exchange rates prevailing when such investments are acquired or sold. Income and expenses are translated at the exchange rates prevailing when accrued. The portion of realized and unrealized gains and losses on investments that result from fluctuations in foreign currency exchange rates is not separately disclosed. Recognized gains or losses attributable to foreign currency fluctuations on foreign currency denominated assets, other than investments, and liabilities are recorded as net realized gain (loss) on forward foreign currency contracts, foreign currency transactions and foreign denominated assets and liabilities in the Statement of Operations. |
| D. | Dividends and Distributions to Shareholders—Dividends to shareholders from net investment income and distributions from net realized capital gains, if any, are declared and paid annually. Income dividends and capital gain distributions are determined in accordance with U.S. income tax regulations, which may differ from such amounts determined in accordance with GAAP. |
| E. | Use of Derivative Instruments—The Fund may make investments in derivative instruments, including, but not limited to, options, futures, swaps and other derivatives relating to foreign currency transactions. A derivative is an instrument whose value is derived from underlying assets, indices, reference rates or a combination of these factors. Derivative instruments may be privately negotiated contracts (often referred to as over-the-counter (“OTC”) derivatives) or they may be listed and traded on an exchange. Derivative contracts may involve future commitments to purchase or sell financial instruments or commodities at specified terms on a specified date, or to exchange interest payment streams or currencies based on a notional or contractual amount. Derivative instruments may involve a high degree of financial risk. The use of derivative instruments also involves the risk of loss if the investment adviser is incorrect in its expectation of the timing or level of fluctuations in securities prices, interest rates or currency prices. Investments in derivative instruments also include the risk of default by the counterparty, the risk that the investment may not be liquid and the risk that a small movement in the price of the underlying security or benchmark may result in a disproportionately large movement, unfavorable or favorable, in the price of the derivative instrument. GAAP requires enhanced disclosures about the Fund’s derivative instruments and hedging activities. Details of this disclosure are found below as well as in the Schedule of Investments. |
| At June 30, 2013, the Fund held the following derivatives (not designated as hedging instruments under GAAP): |
| Liability Derivatives | ||
| Foreign Currency Risk | ||
| Forward foreign currency contracts1 | $48,846 |
| 1 | Statement of Assets and Liabilities location: Unrealized depreciation on forward foreign currency contracts |
The impact of transactions in derivative instruments, during the period ended June 30, 2013, were as follows:
| Foreign Currency Risk | ||
| Net realized loss: | ||
| Forward foreign currency contracts1 | $(32,523) | |
| Net change in unrealized appreciation (depreciation): | ||
| Forward foreign currency contracts2 | $(48,846) |
| 1 | Statement of Operations location: Net realized gain (loss) on forward foreign currency contracts, foreign currency transactions and foreign denominated assets and liabilities |
| 2 | Statement of Operations location: Net change in unrealized appreciation (depreciation) on forward foreign currency contracts, foreign currency transactions and foreign denominated assets and liabilities |
| Forward Foreign Currency Contracts—The Fund is subject to foreign currency risk in the normal course of pursuing its investment objectives. The Fund may buy and sell forward foreign currency contracts to settle purchases and sales of foreign denominated securities or to hedge foreign denominated assets. Realized gains and losses from forward foreign currency contracts, if any, are included in realized gain (loss) on forward foreign currency contracts, foreign currency transactions and foreign denominated assets and liabilities in the Statement of Operations. The Fund may incur additional risk from investments in forward foreign currency contracts if the counterparty is unable to fulfill its obligation or there are unanticipated movements of the foreign currency relative to the U.S. dollar. Forward foreign currency contracts at June 30, 2013 are reflected in the Schedule of Investments. The Fund held forward foreign currency contracts with an average unrealized depreciation of $26,872 for the period ended June 30, 2013. |
| F. | Offsetting Assets and Liabilities—In the ordinary course of business, the Fund enters into transactions subject to enforceable master netting agreements or other similar agreements. Generally, the right of setoff in those agreements allows the Fund to set off any exposure to a specific counterparty with any collateral received from or delivered to that counterparty |
| 13 |
VAN ECK VIP UNCONSTRAINED EMERGING MARKETS BOND FUND
NOTES TO FINANCIAL STATEMENTS
(continued)
based on the terms of the agreements. The Fund may pledge or receive cash and/or securities as collateral for derivative contracts. Collateral held at June 30, 2013 is presented in the Schedule of Investments.
The tables below present both gross and net information about the derivative instruments eligible for offset in the Statement of Assets and Liabilities or are subject to an agreement similar to a master netting agreement, as well as financial collateral received or pledged (including cash collateral) as of June 30, 2013. Collateral, if any, is disclosed up to an amount of 100% of the net amount of unrealized gain/loss for the respective financial instruments.
| Gross Amounts of Recognized Liabilities | Gross Amounts Offset in the Statement of Assets and Liabilities | Net Amounts of Liabilities Presented in the Statement of Assets and Liabilities | Financial Instruments and Collateral Received | Net Amount | |||||||||||||||||||||
| Forward foreign currency contracts | $ | 301,459 | $ | 252,613 | $ | 48,846 | $ | — | $ | 48,846 | |||||||||||||||
| G. | Other—Security transactions are accounted for on trade date. Realized gains and losses are calculated on the identified cost basis. Interest income, including amortization of premiums and discounts, is accrued as earned. Estimated foreign taxes that are expected to be withheld from proceeds at the sale of certain foreign investments are accrued by the Fund and decrease the unrealized gain on investments. The Fund received regulatory settlement payments during 2010 from unaffiliated third parties which is included in the Financial Highlights. The Fund received redemption fees from Class R1 Shares prior to its closing on April 30, 2012 which are reflected in the Statement of Changes in Net Assets and Financial Highlights. |
| Prior to the closing of Class R1 Shares on April 30, 2012, income, expenses (excluding class-specific expenses), realized and unrealized gains/losses are allocated proportionately to each class of shares based upon the relative net asset value of outstanding shares of each class at the beginning of the day (after adjusting for current capital share activity of the respective classes). Class-specific expenses are charged directly to the applicable class of shares. | |
| In the normal course of business, the Fund enters into contracts that contain a variety of general indemnifications. The Fund’s maximum exposure under these agreements is unknown as this would involve future claims that may be made against the Fund that have not yet occurred. However, the Adviser believes the risk of loss under these arrangements to be remote. |
Note 3—Investment Management and Other Agreements—The Adviser is the investment adviser to the Fund. The Adviser receives a management fee, calculated daily and payable monthly based on an annual rate of 1.00% of the first $500 million of average daily net assets, 0.90% of the next $250 million of average daily net assets and 0.70% of the average daily net assets in excess of $750 million. The Adviser has agreed, at least until May 1, 2014, to waive management fees and/or assume expenses, excluding interest, taxes, and extraordinary expenses, exceeding 1.10% of the Fund’s average daily net assets, for Initial Class Shares. For the period ended June 30, 2013, the Adviser waived management fees in the amount of $26,098. Certain officers and trustees of the Trust are officers, directors or stockholders of the Adviser and Van Eck Securities Corporation, the distributor.
Note 4—Investments—For the period ended June 30, 2013, the cost of purchases and proceeds from sales of investments, excluding U.S. government securities and short-term obligations, aggregated $87,545,179 and $98,951,479, respectively.
Note 5—Income Taxes—For Federal income tax purposes, the identified cost of investments owned at June 30, 2013 was $50,013,122 and net unrealized depreciation aggregated $3,830,468 of which $95,898 related to appreciated securities and $3,926,366 related to depreciated securities.
The tax character of dividends and distributions paid to shareholders were as follows:
| As of June 30, 2013 | Year Ended December 31, 2012 | ||||||
| Ordinary income* | $1,131,066 | $1,224,715 | ||||||
| * | Includes short-term capital gains |
| 14 |
On December 22, 2010, the Regulated Investment Company Modernization Act of 2010 (the “Act”) was enacted, which changed various technical rules governing the tax treatment of regulated investment companies. The changes are generally effective for taxable years beginning after the date of enactment. One of the more prominent changes addresses capital loss carryforwards. Under the Act, the Fund is permitted to carryforward capital losses incurred in taxable years beginning after the date of enactment for an unlimited period. However, any losses incurred during those future taxable years will be required to be utilized prior to the losses incurred in pre-enactment taxable years, which carry an expiration date. As a result of this ordering rule, pre-enactment capital loss carryforwards may be more likely to expire unused. Additionally, post-enactment capital loss carryforwards will retain their character as either short-term or long-term capital losses rather than being considered all short-term as permitted under previous regulation.
The Fund recognizes the tax benefits of uncertain tax positions only where the position is “more-likely-than-not” to be sustained assuming examination by applicable tax authorities. Management has analyzed the Fund’s tax positions, and has concluded that no liability for unrecognized tax benefits should be recorded related to uncertain tax positions taken on return filings for open tax years (tax years ended December 31, 2009-2012), or expected to be taken in the Fund’s current tax year. The Fund does not have exposure for additional years that might still be open in certain foreign jurisdictions. Therefore, no provision for income tax is required in the Fund’s financial statements.
The Fund recognizes interest and penalties, if any, related to uncertain tax positions as income tax expense in the Statement of Operations. During the period ended June 30, 2013, the Fund did not incur any interest or penalties.
Note 6—Concentration of Risk—The Fund may purchase securities on foreign exchanges. Securities of foreign issuers involve special risks and considerations not typically associated with investing in U.S. issuers. These risks include devaluation of currencies, less reliable information about issuers, different security transaction clearance and settlement practices and future adverse political and economic developments. These risks are heightened for investments in emerging market countries. Moreover, securities of many foreign issuers and their markets may be less liquid and their prices more volatile than those of comparable U.S. issuers. The Fund may invest in debt securities which are rated below investment grade by rating agencies. Such securities involve more risk of default than higher rated securities and are subject to greater price variability.
At June 30, 2013, the aggregate shareholder accounts of two insurance companies own approximately 52% and 26% of the Initial Class Shares.
Note 7—Trustee Deferred Compensation Plan—The Trust has a Deferred Compensation Plan (the “Deferred Plan”) for Trustees under which the Trustees can elect to defer receipt of their trustee fees until retirement, disability or termination from the Board of Trustees. The fees otherwise payable to the participating Trustees are deemed invested in shares of eligible Funds of the Trust and the Van Eck Funds (another registered investment company managed by the Adviser) as directed by the Trustees.
The expense for the Deferred Plan is included in “Trustees’ fees and expenses” in the Statement of Operations. The liability for the Deferred Plan is shown as “Deferred Trustee fees” in the Statement of Assets and Liabilities.
Note 8—Bank Line of Credit—The Trust may participate with Van Eck Funds (collectively the “VE/VIP Funds”) in a $20 million committed credit facility (the “Facility”) to be utilized for temporary financing until the settlement of sales or purchases of portfolio securities, the repurchase or redemption of shares of the Fund at the request of the shareholders and other temporary or emergency purposes. The VE/VIP Funds have agreed to pay commitment fees, pro rata, based on the unused but available balance. Interest is charged to the VE/VIP Funds at rates based on prevailing market rates in effect at the time of borrowings. During the period ended June 30, 2013, the average daily loan balance during the 7 day period for which a loan was outstanding amounted to $81,885 and the average interest rate was 1.43%. At June 30, 2013, the Fund had no outstanding borrowings under the Facility.
Note 9—Securities Lending—To generate additional income, the Fund may lend its securities pursuant to a securities lending agreement with State Street Bank & Trust Co., the securities lending agent and also the Fund’s custodian. During the period ended June 30, 2013, the Fund had no securities lending activity.
Note 10—Recent Accounting Pronouncements—The Fund has adopted Accounting Standards Update (“ASU”) No. 2011-11, Balance Sheet (Topic 210) Disclosures about Offsetting Assets and Liabilities, as clarified by ASU No. 2013-01 “Clarifying the Scope of Disclosures about Offsetting Assets and Liabilities” which requires entities to disclose gross and net information about derivative instruments, repurchase and reverse-repurchase agreements, and securities borrowing and lending transactions that are either: (1) offset in accordance with GAAP, or (2) subject to enforceable master netting arrangement or similar agreements, irrespective of whether they are offset in accordance with GAAP. In addition, ASU No. 2011-11 requires disclosure of collateral received and posted in connection with master netting agreements or similar arrangements. Additional disclosure requirements of ASU No. 2011-11 and ASU No. 2013-01, if any, are reflected in Note 2 to the Fund’s financial statements.
Note 11—Subsequent Event Review—The Fund has evaluated subsequent events and transactions for potential recognition or disclosure through the date the financial statements were issued.
Effective July 26, 2013, the VE/VIP Funds increased the line of credit from $20 million to $30 million.
| 15 |
VAN ECK VIP UNCONSTRAINED EMERGING MARKETS BOND FUND
APPROVAL OF ADVISORY AGREEMENT
(formerly named Van Eck VIP Global Bond Fund)
The Investment Company Act of 1940, as amended (the “1940 Act”), provides, in substance, that an investment advisory agreement between a fund and its investment adviser may be entered into only if it is approved, and may continue in effect from year to year after an initial two-year period only if its continuance is approved, at least annually by the fund’s board of trustees, including by a vote of a majority of the trustees who are not “interested persons” of the fund as defined in the 1940 Act (the “Independent Trustees”), cast in person at a meeting called for the purpose of considering such approval.
On June 25, 2013, the Board of Trustees (the “Board”) of Van Eck VIP Trust (the “Trust”), which is comprised exclusively of Independent Trustees, voted to approve the continuation of the existing advisory agreement (the “Advisory Agreement”) between the Van Eck VIP Unconstrained Emerging Markets Bond Fund (the “Fund”) and its investment adviser, Van Eck Associates Corporation (together with its affiliated companies, the “Adviser”). Information regarding the material factors considered and related conclusions reached by the Board in approving the continuation of the Advisory Agreement is set forth below.
In considering the continuation of the Advisory Agreement, the Board reviewed and considered information that had been provided by the Adviser throughout the year at regular and special meetings of the Board and its committees, including information requested by the Board and furnished by the Adviser for meetings of the Board held on June 4, 2013 and June 24 and 25, 2013 specifically for the purpose of considering the continuation of the Advisory Agreement. The written and oral reports provided to the Board included, among other things, the following:
| n | Information about the overall organization of the Adviser and the Adviser’s short-term and long-term business plans with respect to its mutual fund operations and other lines of business; |
| n | The consolidated financial statements of the Adviser for the past three fiscal years; |
| n | A copy of the Advisory Agreement and descriptions of the services provided by the Adviser thereunder; |
| n | Information regarding the qualifications, education and experience of the investment professionals responsible for portfolio management, investment research and trading activities for the Fund, the structure of their compensation and the resources available to support these activities; |
| n | A report prepared by an independent consultant comparing the Fund’s investment performance (including, where relevant, total returns, standard deviations, Sharpe ratios, information ratios, beta and alpha) with respect to a representative class of shares of the Fund for the one-, three-, five- and ten-year periods ended March 31, 2013 with those of (i) two universes of mutual funds selected by the independent consultant with similar portfolio holding characteristics, share class attributes and other operational characteristics as the Fund prior to May 1, 2013 (the “Historic Category”) and effective May 1, 2013 (the “New Category”); (ii) two sub-groups of funds selected from the Historic Category, one by the independent consultant further limited to approximate more closely the Fund’s investment style, expense structure and asset size (the “Historic Consultant Peer Group”) and one by the Adviser (the “Historic Adviser Peer Group”); (iii) a sub-group of funds selected from the New Category with similar investment style, expense structure and asset size as the Fund (the “New Consultant Peer Group”) and (iv) appropriate benchmark indexes; |
| n | A report prepared by an independent consultant comparing the advisory fees and other expenses of a representative class of shares of the Fund during its fiscal year ended December 31, 2012 with a similar share class of each fund in the (i) Historic Category; (ii) New Category; (iii) Historic Consultant Peer Group; (iv) Historic Adviser Peer Group and (v) New Consultant Peer Group; |
| n | An analysis of the profitability of the Adviser with respect to its services for the Fund and the Van Eck complex of mutual funds as a whole (the “Van Eck Complex”); |
| n | Information regarding other investment products and services offered by the Adviser involving investment objectives and strategies similar to the Fund (“Comparable Products”), including the fees charged by the Adviser for managing the Comparable Products, a description of material differences and similarities in the services provided by the Adviser for the Fund and the Comparable Products, the size of the Comparable Products, the performance of the Comparable Products and identity of the individuals responsible for managing the Comparable Products; |
| n | Information concerning the Adviser’s compliance program, the resources devoted to compliance efforts undertaken by the Adviser on behalf of the Fund, and reports regarding a variety of compliance-related issues; |
| n | Information with respect to the Adviser’s brokerage practices, including the Adviser’s processes for monitoring best execution of portfolio transactions and the benefits received by the Adviser from research acquired with soft dollars; |
| 16 |
| n | Information regarding the procedures used by the Adviser in monitoring the valuation of portfolio securities, including the methodologies used in making fair value determinations; |
| n | Information regarding the Adviser’s policies and practices with respect to personal investing by the Adviser and its employees, including reports regarding the administration of the Adviser’s code of ethics and the Adviser’s policy with respect to investments in the Fund by the Adviser’s investment personnel; |
| n | Descriptions of other administrative and other non-investment management services provided by the Adviser for the Fund, including the Adviser’s activities in managing relationships with the Fund’s custodian, transfer agent and other service providers; and |
| n | Other information provided by the Adviser in its response to a comprehensive questionnaire prepared by independent legal counsel on behalf of the Independent Trustees. |
In determining whether to approve the continuation of the Advisory Agreement, the Board considered, among other things, the following: (1) the nature, quality, extent and cost of the investment management, administrative and other non-investment management services provided by the Adviser; (2) the nature, quality and extent of the services performed by the Adviser in interfacing with, and monitoring the services performed by, third parties, such as the Fund’s custodian, transfer agent, sub-accounting agent and independent auditors, and the Adviser’s commitment and efforts to review the quality and pricing of third party service providers to the Fund with a view to reducing non-management expenses of the Fund; (3) the terms of the Advisory Agreement and the services performed thereunder; (4) the willingness of the Adviser to reduce the overall expenses of the Fund from time to time, if necessary or appropriate, by means of waiving a portion of its fees or paying expenses of the Fund; (5) the quality of the services, procedures and processes used to determine the value of the Fund’s assets and the actions taken to monitor and test the effectiveness of such services, procedures and processes; (6) the ongoing efforts of, and resources devoted by, the Adviser with respect to the development and implementation of a comprehensive compliance program; (7) the responsiveness of the Adviser to inquiries from, and examinations by, regulatory authorities, including the Securities and Exchange Commission; (8) the resources committed by the Adviser in recent periods to information technology; and (9) the ability of the Adviser to attract and retain quality professional personnel to perform investment advisory and administrative services for the Fund.
The Board considered the fact that the Adviser is managing other investment products, including exchange-traded funds, hedge funds, separate accounts and UCITs, one or more of which may invest in the same financial markets and may be managed by the same investment professionals according to a similar investment objective and/or strategy as the Fund. The Board concluded that the management of these products contributes to the Adviser’s financial stability and is helpful to the Adviser in attracting and retaining quality portfolio management personnel for the Fund. In addition, the Board concluded that the Adviser has established appropriate procedures to monitor conflicts of interest involving the management of the Fund and the other products and for resolving any such conflicts of interest in a fair and equitable manner.
The performance data and the advisory fee and expense ratio data described below for the Fund is based on data for a representative class of shares of the Fund. The performance data is for periods on an annualized basis ended March 31, 2013, and the advisory fee and expense ratio data is as of the Fund’s fiscal year end of December 31, 2012.
Performance. The Board noted that, in an effort to enhance the performance and long-term viability of the Fund, the Board had approved material changes to the Fund’s principal investment strategies, which became effective May 1, 2013. The Board concluded that, in light of these changes, the performance of the Fund compared to other similarly managed funds prior to May 1, 2013 was not relevant to the Board’s consideration of the Advisory Agreement and that additional time is needed to evaluate the effectiveness of these changes.
Fees and Expenses. Fees and Expenses. The Board noted that the fees payable for advisory services were the highest in the Fund’s New Category and New Consultant Peer Group and that the Fund’s total expense ratio, net of waivers or reimbursements, was higher than the median expense ratios of the New Category and New Consultant Peer Group. The Board also noted that the Adviser makes use of a complex and unique proprietary strategy for managing the Fund’s portfolio and that the Adviser has agreed to waive fees or pay expenses of the Fund through April 2014 to the extent necessary to prevent the expense ratio of the Fund from exceeding a specified maximum amount. On the basis of the foregoing, and in light of the nature, extent and quality of the services provided by the Adviser, the Board concluded that the advisory fee charged to the Fund is reasonable.
| 17 |
VAN ECK VIP UNCONSTRAINED EMERGING MARKETS BOND FUND
APPROVAL OF ADVISORY AGREEMENT
(continued)
Profitability and Economies of Scale. The Board considered the profits, if any, realized by the Adviser from managing the Fund and other mutual funds in the Van Eck Complex and the methodology used to determine such profits, including the results of an analysis of the methodology performed recently by an independent consultant on behalf of the Board and its independent counsel. The Board noted that the levels of profitability reported on a fund-by-fund basis varied widely depending on such factors as the size, type of fund and operating history. The Board further noted that, in evaluating the reasonableness of the Adviser’s profits from managing any particular Fund, it would be appropriate to consider the size of the Adviser relative to other firms in the investment management industry and the impact on the Adviser’s profits of the volatility of the markets in which the Funds invest and the volatility of cash flows into and out of the Funds through various market cycles. Based on its review of the foregoing information, and in light of the nature, extent and quality of the services provided by the Adviser, the Board concluded that the profits realized by the Adviser, if any, are not excessive. In this regard, the Board also considered the extent to which the Adviser may realize economies of scale as the Fund grows and whether the Fund’s fee schedule, which includes breakpoints, reflects these economies of scale for the benefit of shareholders. The Board concluded that, with respect to the Fund, the economies of scale being realized, if any, are currently being shared by the Adviser and the Fund, and that adding or modifying existing breakpoints would not be warranted at this time for the Fund.
Conclusion. In determining the material factors to be considered in evaluating the Advisory Agreement and the weight to be given to such factors, the members of the Board relied upon the advice of independent legal counsel and their own business judgment. The Board did not consider any single factor as controlling in determining whether to approve the continuation of the Advisory Agreement and each member of the Board may have placed varying emphasis on particular factors considered in reaching a conclusion. Moreover, this summary description does not necessarily identify all of the factors considered or conclusions reached by the Board. Based on its consideration of the foregoing factors and conclusions, and such other factors and conclusions as it deemed relevant, the Board (comprised exclusively of Independent Trustees) concluded that the continuation of the Advisory Agreement is in the interests of shareholders and, accordingly, the Board approved the continuation of the Advisory Agreement for an additional one-year period.
| 18 |
This report must be preceded or accompanied by a Van Eck VIP (the “Trust”) Prospectus, which includes more complete information. An investor should consider the investment objective, risks, and charges and expenses of the Fund carefully before investing. The prospectus contains this and other information about the investment company. Please read the prospectus carefully before investing.
Additional information about the Trust’s Board of Trustees/Officers and a description of the policies and procedures the Trust uses to determine how to vote proxies relating to portfolio securities are provided in the Statement of Additional Information. The Statement of Information and information regarding how the Trust voted proxies relating to portfolio securities during the most recent twelve month period ending June 30 is available, without charge, by calling 800.826.2333, or by visiting vaneck.com, or on the Securities and Exchange Commission’s website at http://www.sec.gov.
The Trust files its complete schedule of portfolio holdings with the Securities and Exchange Commission for the first and third quarters of each fiscal year on Form N-Q. The Trust’s Form N-Qs are available on the Commission’s website at http://www.sec.gov and may be reviewed and copied at the Commission’s Public Reference Room in Washington, D.C. Information on the operation of the Public Reference Room may be obtained by calling 202.942.8090. The Fund’s complete schedule of portfolio holdings is also available by calling 800.826.2333 or by visiting vaneck.com.
| Investment Adviser: | Van Eck Associates Corporation |
| Distributor: | Van Eck Securities Corporation |
| 335 Madison Avenue, New York, NY 10017 | |
| vaneck.com | |
| Account Assistance: | 800.544.4653 |
| vaneck.com | |
| VIPEMBSAR |
Item 2. CODE OF ETHICS.

     Not applicable.

Item 3. AUDIT COMMITTEE FINANCIAL EXPERT.

     Not applicable.

Item 4. PRINCIPAL ACCOUNTANT FEES AND SERVICES.

     Not applicable.

Item 5. AUDIT COMMITTEE OF LISTED REGISTRANTS.

     Not applicable.

Item 6. SCHEDULE OF INVESTMENTS.

     Information included in Item 1.

Item 7. DISCLOSURE OF PROXY VOTING POLICIES AND PROCEDURES FOR CLOSED-END
        MANAGEMENT INVESTMENT COMPANIES.

     Not applicable.

Item 8. PORTFOLIO MANAGER OF CLOSED-END MANAGEMENT INVESTMENT COMPANIES.

     Not applicable.

Item 9. PURCHASE OF EQUITY SECURITIES BY CLOSED-END MANAGEMENT INVESTMENT
        COMPANY AND AFFILIATED PURCHASERS.

     Not applicable.

Item 10. SUBMISSION OF MATTERS TO A VOTE OF SECURITY HOLDERS.

     No changes.

Item 11. CONTROLS AND PROCEDURES.

(a)  The Chief Executive Officer and the Chief Financial Officer have concluded
     that the Van Eck VIP Unconstrained Emerging Markets Bond Fund disclosure
     controls and procedures (as defined in Rule 30a-3(c) under the Investment
     Company Act) provide reasonable assurances that material information
     relating to the Van Eck VIP Unconstrained Emerging Markets Bond Fund is
     made known to them by the appropriate persons, based on their evaluation
     of these controls and procedures as of a date within 90 days of the filing
     date of this report.

(b)  There  were no changes in the registrant's internal control over financial
     reporting (as defined in Rule 30a-3(d) under the 1940 Act (17 CFR
     270.30a-3(d)) that occurred during the second fiscal quarter of the period
     covered by this report that has materially affected, or is reasonably
     likely to materially affect, the registrant's internal  control over
     financial reporting.


Item 12. EXHIBITS.

(a)(1) Not applicable.

(a)(2) A separate certification for each principal executive officer and
       principal financial officer of the registrant as required by Rule 30a-2
       under the Act (17 CFR 270.30a-2) is attached as Exhibit 99.CERT.

(b)  Certification pursuant to Section 906 of the Sarbanes-Oxley Act of 2002 is
     furnished as Exhibit 99.906CERT.


                                   SIGNATURES


Pursuant to the requirements of the Securities Exchange Act of 1934 and the
Investment Company Act of 1940, the registrant has duly caused this report to be
signed on its behalf by the undersigned, thereunto duly authorized.

(Registrant) VAN ECK VIP TRUST - VAN ECK VIP UNCONSTRAINED EMERGING MARKETS BOND
FUND

By (Signature and Title) /s/ John J. Crimmins, Treasurer and CFO
                         ---------------------------------------
Date September 6, 2013
     -----------------

Pursuant to the requirements of the Securities Exchange Act of 1934 and the
Investment Company Act of 1940, this report has been signed below by the
following persons on behalf of the registrant and in the capacities and on the
dates indicated.

By (Signature and Title) /s/ Jan F. van Eck, CEO
                        ------------------------
Date September 6, 2013
     -----------------

By (Signature and Title)  /s/ John J. Crimmins, Treasurer and CFO
                        -----------------------------------------

Date September 6, 2013
     -----------------