ITEM 1. REPORT TO SHAREHOLDERS
| | | | | SEMI-ANNUAL REPORT
JUNE 30, 2014
(unaudited) |
| | |  |
| | | | | |
| | | | | |
| | | Van Eck VIP Trust Van Eck VIP Global Hard Assets Fund |
| | | | | |
| | | | | |
| | | | | |
| | | | | |
| | | | | |
| | | |  |
| | | | | |
Van Eck VIP Global Hard Assets Fund
The information contained in this shareholder letter represents the personal opinions of the investment team members and may differ from those of other portfolio managers or of the firm as a whole. This information is not intended to be a forecast of future events, a guarantee of future results or investment advice. Also, unless otherwise specifically noted, any discussion of the Fund’s holdings and the Fund’s performance, and the views of the investment team members are as of June 30, 2014 and are subject to change.
VAN ECK VIP GLOBAL HARD ASSETS FUND
(unaudited)
Dear Shareholder:
The Initial Class shares of the Van Eck VIP Global Hard Assets Fund (the “Fund”) gained 13.58% for the six months ended June 30, 2014. To compare, the Standard and Poor’s (S&P®) North American Natural Resources Sector Index1 rose 16.43% for the same period. Two key aspects of the Fund that detracted from performance relative to its primary benchmark were an overweight position in oil and gas refining and marketing, which suffered from a weak spread between WTI and Brent, and an underweight position, and poor stock selection, in oil and gas storage and transportation.
It is important to note that, as the Fund continues to employ a diversified natural resource strategy, it has, historically, been underweight energy relative to the S&P® North American Natural Resources Sector Index (the “Index”), the Fund’s benchmark index. For example, the benchmark was approximately 86% energy as of June 30, whereas the Fund was approximately 70% energy. It is, however, also important to note that the S&P® Global Natural Resources Index2 gained only 6.88% for the six-month period. As of June 30, this index was a little more than 33% energy. This divergence in performances amongst indices, over the six months ended June 30, 2014, highlights the effect that energy allocation had on performance during the period.
The Fund remained underweight relative to the benchmark in the energy sector overall at the end of the six-month period, but continued, with its focus on the U.S. unconventional shale story, to maintain an energy allocation close to its historical highs. At the end of the first half of 2014, within energy, the Fund was significantly underweight integrated oil and gas, having no allocation to the sub-sector at period end. The next largest underweight was in the oil and gas storage and transportation sub-sector. As of June 30, 2014, the Fund was overweight relative to the Index in the oil and gas equipment and services and oil and gas drilling sub-sectors, and slightly overweight in the oil and gas exploration and production sub-sector. As of the same date, the Fund was also overweight in the oil and gas refining and marketing sub-sector and the coal and consumable fuels sub-sector. The Fund’s largest overweights relative to the Index were in the diversified metals and mining sub-sector, and in the gold sub-sector.
Overview
Several important factors influenced the markets in which the Fund invested during the first six month of 2014. On the demand side, there was, on the one hand, the continuing clear deceleration of growth in China, particularly during the first quarter of the year, but, as a result of the government stimulus program, less so during the second quarter. On the other hand, not only was there solid demand for commodities on a global basis, which included China, but also, in the developed markets, there were continuing indications of inflections in GDP growth.
On the supply side, markets were affected by a number of significant disruptions. While the situation in Ukraine, and the possibility of further sanctions on Russia, remained a concern during the period under review, there was also the continuing disruption caused by Indonesia’s decision in January to implement a total ban on the export of unprocessed nickel and copper ore. The platinum miners’ strike in South Africa lasted throughout most of the first six months of the year, with the dispute only eventually being settled in the last week in June. And, finally, as June drew to a close, there was the accelerating deterioration of the situation in Iraq.
During the period, too, the risk of inflation, not only in the U.S., but also in Europe and Asia, increasingly became both a topic of conversation and a factor for consideration in future investment decisions.
Fund Review
Our underweight in integrated oil and gas and paper products led them to be two of the Fund’s strongest positive-contributing sub-sectors relative to the primary benchmark. In the case of integrated oil and gas, a sub-sector currently experiencing a decline in capital expenditure, we were significantly underweight. In the case of paper products, the absence of any exposure to the sub-sector enabled the Fund to avoid the benchmark’s negative performance. In gold, not only was the Fund overweight, but it also had reasonable stock selection. Gold companies are currently benefitting, among other things, from an increase in the price of gold, successful cost-cutting and an increase in merger and acquisition activity.
The three weakest-contributing sub-sectors to the Fund’s performance relative to the primary benchmark were oil and gas refining and marketing, vulnerable to a narrowing spread between WTI and Brent, oil and gas storage and transportation, in which a weak tanker selection by the Fund detracted from performance, and steel, a sub-sector facing not only over capacity, but also only modest demand. There was no allocation to steel in the benchmark index during the period.
The Fund’s three strongest contributors were energy-related companies. The strongest contributor was oil services giant Halliburton (4.2% of Fund’s net assets†) which continued to enjoy strong revenue growth from its directional drilling,
VAN ECK VIP GLOBAL HARD ASSETS FUND
(unaudited)
pressure pumping and fracking activities, especially in North America. The second and third strongest contributors were Cimarex Energy (4.0% of Fund’s net assets†) and Concho Resources (4.1% of Fund’s net assets†), both oil and gas exploration companies and both continuing beneficiaries of their unconventional shale oil activities, especially in the Permian Basin and, in particular, in the Delaware Sub-Basin.
The Fund’s three weakest contributing companies were Louisiana Pacific (1.2% of Fund’s net assets†), a forest products company, currently affected by concerns about the sustainability of the housing recovery in the U.S.; Marathon Petroleum (1.8% of Fund’s net assets†), an oil and gas refining and marketing company, vulnerable to a narrowing of the spread between WTI and Brent; and, Ophir Energy (0.6% of Fund’s net assets†), an oil and gas exploration and production company, which recently reported some poor drilling results.
Significant purchases by the Fund were made in the diversified metals and mining, oil and gas drilling and gold sub-sectors, with a new position in Freeport-McMoRan (2.1% of Fund’s net assets†) and the addition of shares in Nabors Industries (2.6% of Fund’s net assets†) and Goldcorp (2.3% of Fund’s net assets†) respectively.
The Fund’s largest sales during the period were the integrated oil and gas company Occidental Petroleum, the gold company Newmont Mining, and the oil and gas exploration and production company Whiting Petroleum (all eliminated by the Fund at period end).
During the six-month period, the Fund’s positions in both the gold and diversified metals and mining sub-sectors increased not least because of both its new position in Freeport-McMoRan and the addition of shares in Goldcorp. The Fund’s allocation to the energy sector also trended higher in all sub-sectors except oil and gas refining and marketing and integrated oil and gas which both declined. By period end the Fund had no allocation to the integrated oil and gas sub-sector. The Fund’s allocation to steel had also declined.
Outlook
Our outlook for demand is that we continue to see a gradual improvement in global GDP, driven by a combination of both the developed and emerging markets. Very importantly, we believe that, as some of the most obvious products of both global geopolitics and social unrest, in the immediate term, supply issues and disruptions will continue to have the most impact on the markets in which we invest. In the longer term, however, persistent concerns over resource scarcity and political issues, such as resource nationalization, will continue to affect these markets, as will the current downtrend in capital expenditure.
Within the themes of resource scarcity and the need for supply security, we have recently added liquid natural gas (LNG) as an area of interest and have, consequently, taken a very small position therein.
Finally, in our extensive travels over the last six months, in addition to the increasing concern we have encountered about the risk of inflation, not just here in the U.S., but also in both Asia and Europe, we have also been informed by a number of natural resource fund managers, particularly in Europe, that they think the unconventional shale story in North America is passé. We would beg strongly to differ. Based on results alone, we believe the unconventional esource story continues to be the most prominent individual natural resource investment theme and will probably be around for quite some time.
The Fund is subject to risks associated with concentrating its investments in hard assets and the hard assets sector, including real estate, precious metals and natural resources, and can be significantly affected by events relating to these industries, including international political and economic developments, inflation, and other factors. The Fund’s portfolio securities may experience substantial price fluctuations as a result of these factors, and may move independently of the trends of industrialized companies. The Fund’s investments in foreign securities involve risks related to adverse political and economic developments unique to a country or a region, currency fluctuations or controls, and the possibility of arbitrary action by foreign governments, including the takeover of property without adequate compensation or imposition of prohibitive taxation. The Fund is subject to risks associated with investments in debt securities, derivative, commodity-linked instruments, illiquid securities, asset-backed securities and CMOs. The Fund is also subject to inflation risk, short sales risk, market risk, non-diversification risk and leverage risk. An investment in the Fund should be considered part of an overall investment program, rather than a complete investment program.
We appreciate your continued investment in the Van Eck VIP Global Hard Assets Fund, and we look forward to helping you meet your investment goals in the future.
 |  | |
| | | |
| Charles T. Cameron | Shawn Reynolds | |
| Co-Portfolio Manager | Co-Portfolio Manager | |
The performance quoted represents past performance. Past performance is no guarantee of future results; current performance may be lower or higher than the performance data quoted. Performance information reflects temporary waivers of expenses and/or fees and does not include insurance/annuity fees and expenses. Investment returns would have been reduced had these fees/expenses been included. Investment return and the value of the shares of the Fund will fluctuate so that an investor’s shares, when redeemed, may be worth more or less than their original cost. Fund returns assume that dividends and capital gains distributions have been reinvested in the Fund at NAV. Index returns assume that dividends of the Index constituents in the Index have been reinvested. Performance information current to the most recent month end is available by calling 1.800.826.2333.
The Fund is only available to life insurance and annuity companies to fund their variable annuity and variable life insurance products. These contracts offer life insurance and tax benefits to the beneficial owners of the Fund. Your insurance or annuity company charges, fees and expenses for these benefits are not reflected in this report or in the Fund’s performance, since they are not direct expenses of the Fund. Had these fees been included, returns would have been lower. For insurance products, performance figures do not reflect the cost for insurance and if they did, the performance shown would be significantly lower. A review of your particular life and/or annuity contract will provide you with much greater detail regarding these costs and benefits.
| † | All Fund assets referenced are Total Net Assets as of June 30, 2014. |
| | |
| All indices are unmanaged and include the reinvestment of all dividends, but do not reflect the payment of transaction costs, advisory fees or expenses that are associated with an investment in the Fund. An index’s performance is not illustrative of the Fund’s performance. Indices are not securities in which investments can be made. Results reflect past performance and do not guarantee future results. |
| | |
| 1 | S&P® North American Natural Resources Sector (SPGINRTR) Index includes mining, energy, paper and forest products, and plantation-owning companies. |
| | |
| 2 | S&P® Global Natural Resources Index (SPGNRUP) includes 90 of the largest publicly traded companies in natural resources and commodities businesses that meet specific investability requirements, offering investors diversified and investable equity exposure across three primary commodity-related sectors: agribusiness, energy and metals and mining. |
VAN ECK VIP GLOBAL HARD ASSETS FUND
TOP TEN EQUITY HOLDINGS*
June 30, 2014 (unaudited)
Glencore Xstrata Plc
(Switzerland, 4.6%)
Glencore Xstrata is a diversified natural resources company. The company operates in three groups: metals and minerals, energy products, and agricultural products. Glencore Xstrata offers its products and services around the world.
Schlumberger Ltd.
(U.S., 4.3%)
Schlumberger is an oil services company. The company, through its subsidiaries, provides a wide range of services, including technology, project management and information solutions to the international petroleum industry as well as advanced acquisition and data processing surveys.
Halliburton Co.
(U.S., 4.2%)
Halliburton provides energy services and engineering and construction services, as well as manufactures products for the energy industry. The company offers services and products and integrated solutions to customers in the exploration, development, and production of oil and natural gas.
Concho Resources, Inc.
(U.S, 4.1%)
Concho acquires, develops and explores for oil and natural gas properties in the Permian Basin area of Southeast New Mexico and West Texas.
Cimarex Energy Co.
(U.S., 3.9%)
Cimarex Energy explores for and produces crude oil and natural gas in the United States. The company conducts activities primarily in New Mexico, Texas and Oklahoma.
Consol Energy, Inc.
(U.S., 3.9%)
Consol is a diversified fuel producer in the Eastern U.S. The company owns and operates mining complexes in several states that contain coal reserves. Consol also explores, develops and produces natural gas, including methane and shale beds.
Pioneer Natural Resources Co.
(U.S., 3.9%)
Pioneer Natural Resources is an independent oil and gas exploration and production company, headquartered in Dallas, Texas, with operations primarily in the United States.
Anadarko Petroleum Corp.
(U.S., 3.6%)
Anadarko Petroleum is an oil and gas exploration and production company, with major areas of operation located onshore in the United States, the Gulf of Mexico, Algeria, East and West Africa, and has production in China. The company markets natural gas, oil and natural gas liquids (NGLs), and owns and operates gas gathering and processing systems.
First Quantum Minerals Ltd.
(Canada, 3.1%)
First Quantum explores for, mines, and produces copper cathode, copper in concentrate, and gold. The company also produces sulfuric acid.
EOG Resources, Inc.
(U.S., 3.1%)
EOG explores for, develops, produces and markets natural gas and crude oil. The company operates in major producing basins in the United States, Canada, Trinidad, the United Kingdom North Sea, China and, from time to time, select other international areas
| * | Percentage of net assets. Portfolio is subject to change. |
| | Company descriptions courtesy of Bloomberg.com. |
EXPLANATION OF EXPENSES
(unaudited)
As a shareholder of the Fund, you incur two types of costs: (1) transaction costs, including program fees on purchase payments; and (2) ongoing costs, including management fees and other Fund expenses. This disclosure is intended to help you understand the ongoing costs (in dollars) of investing in the Fund and to compare these costs with the ongoing costs of investing in other mutual funds.
The disclosure is based on an investment of $1,000 invested at the beginning of the period and held for the entire period, January 1, 2014 to June 30, 2014.
Actual Expenses
The first line in the table below provides information about account values and actual expenses. You may use the information in this line, together with the amount you invested, to estimate the expenses that you paid over the period. Simply divide your account value by $1,000 (for example, an $8,600 account value divided by $1,000 = 8.6), then multiply the result by the number in the first line under the heading entitled “Expenses Paid During the Period.”
Hypothetical Example for Comparison Purposes
The second line in the table below provides information about hypothetical account values and hypothetical expenses based on the Fund’s actual expense ratio and an assumed rate of return of 5% per year before expenses, which is not the Fund’s actual return. The hypothetical account values and expenses may not be used to estimate the actual ending account balance or expenses you paid for the period. You may use this information to compare the ongoing costs of investing in the Fund and other funds. To do so, compare this 5% hypothetical example with the 5% hypothetical examples that appear in the shareholder reports of other funds.
Please note that the expenses shown in the table are meant to highlight your ongoing costs only and do not reflect any transactional costs, such as fees on purchase payments. Therefore, the second line of the table is useful in comparing ongoing costs only, and will not help you determine the relative costs of owning different funds. In addition, if these transactional costs were included, your costs would have been higher.
Van Eck VIP Global Hard Assets Fund
| | | | | Expenses Paid |
| | | Beginning | Ending | During the Period* |
| | | Account Value | Account Value | January 1, 2014 – |
| | | January 1, 2014 | June 30, 2014 | June 30, 2014 |
| Initial Class | Actual | $ 1,000.00 | $ 1,135.80 | $ 5.67 |
| | Hypothetical** | $ 1,000.00 | $ 1,019.49 | $ 5.36 |
| Class S | Actual | $ 1,000.00 | $ 1,134.20 | $ 7.04 |
| | Hypothetical** | $ 1,000.00 | $ 1,018.20 | $ 6.66 |
| * | Expenses are equal to the Fund’s annualized expense ratio (for the six months ended June 30, 2014), of 1.07% on Initial Class, and 1.33% on Class S Shares, multiplied by the average account value over the period, multiplied by the number of days in the most recent fiscal half divided by the number of days in the fiscal year (to reflect the one-half year period). |
| | |
| ** | Assumes annual return of 5% before expenses |
VAN ECK VIP GLOBAL HARD ASSETS FUND
SCHEDULE OF INVESTMENTS
June 30, 2014 (unaudited)
| Number of | | | | | | |
| Shares | | | | | Value | |
| | | | | | | | | |
| COMMON STOCKS: 95.6% |
| |
| Bermuda: 3.0% |
| | 33,600 | | | Golar LNG Ltd. (USD) | | $ | 2,019,360 | |
| | 462,500 | | | Nabors Industries Ltd. (USD) | | | 13,583,625 | |
| | | | | | | | 15,602,985 | |
| Brazil: 0.0% | | | | |
| | 1,614,800 | | | Brazilian Resources, Inc. (CAD) *#§ | | | 0 | |
| Canada: 10.4% | | | | |
| | 26,623 | | | Agnico-Eagle Mines Ltd. | | | 1,019,444 | |
| | 68,700 | | | Agrium, Inc. (USD) | | | 6,294,981 | |
| | 792,300 | | | Eldorado Gold Corp. (USD) | | | 6,053,172 | |
| | 763,600 | | | First Quantum Minerals Ltd. | | | 16,330,399 | |
| | 442,300 | | | Goldcorp, Inc. (USD) | | | 12,344,593 | |
| | 454,519 | | | Kinross Gold Corp. (USD) * | | | 1,881,708 | |
| | 806,100 | | | New Gold, Inc. (USD) * | | | 5,134,857 | |
| | 36,650 | | | Osisko Gold Royalties Ltd. * | | | 551,270 | |
| | 97,016 | | | Yamana Gold, Inc. | | | 798,278 | |
| | 531,200 | | | Yamana Gold, Inc. (USD) | | | 4,366,464 | |
| | | | | | | | 54,775,166 | |
| Kuwait: 2.2% | | | | |
| | 3,890,609 | | | Kuwait Energy Plc *#§ø | | | 11,382,507 | |
| Monaco: 0.3% | | | | |
| | 166,000 | | | Scorpio Tankers, Inc. (USD) | | | 1,688,220 | |
| Norway: 0.7% | | | | |
| | 100,400 | | | SeaDrill Ltd. # | | | 3,978,911 | |
| Switzerland: 5.5% | | | | |
| | 4,392,465 | | | Glencore Xstrata Plc (GBP) # | | | 24,477,955 | |
| | 127,900 | | | Noble Corp Plc (USD) | | | 4,292,324 | |
| | | | | | | | 28,770,279 | |
| United Kingdom: 4.2% | | | | |
| | 3,102,200 | | | Afren Plc *# | | | 7,685,125 | |
| | 15,000 | | | African Minerals Ltd. *#ø | | | 17,770 | |
| | 285,500 | | | African Minerals Ltd. *# | | | 338,218 | |
| | 143,800 | | | Genel Energy Plc *# | | | 2,495,107 | |
| | 848,820 | | | Ophir Energy Plc *# | | | 3,192,929 | |
| | 97,600 | | | Randgold Resources Ltd. (ADR) | | | 8,256,960 | |
| | | | | | | | 21,986,109 | |
| United States: 69.3% | | | | |
| | 100,905 | | | Alpha Natural Resources, Inc. * | | | 374,357 | |
| | 172,400 | | | Anadarko Petroleum Corp. | | | 18,872,628 | |
| | 71,200 | | | Archer-Daniels-Midland Co. | | | 3,140,632 | |
| | 153,600 | | | Atwood Oceanics, Inc. * | | | 8,060,928 | |
| | 153,000 | | | Cameron International Corp. * | | | 10,359,630 | |
| | 37,500 | | | CARBO Ceramics, Inc. | | | 5,779,500 | |
| | 144,400 | | | Cimarex Energy Co. | | | 20,715,624 | |
| | 120,500 | | | Cloud Peak Energy, Inc. * | | | 2,219,610 | |
| | 150,150 | | | Concho Resources, Inc. * | | | 21,696,675 | |
| | 448,300 | | | Consol Energy, Inc. | | | 20,653,181 | |
| | 50,100 | | | Cummins, Inc. | | | 7,729,929 | |
| | 112,300 | | | Delek US Holdings, Inc. | | | 3,170,229 | |
| | 66,500 | | | Diamond Offshore Drilling, Inc. | | | 3,300,395 | |
| | 102,700 | | | Diamondback Energy, Inc. * | | | 9,119,760 | |
| | 82,000 | | | Dril-Quip, Inc. * | | | 8,957,680 | |
| | 138,000 | | | EOG Resources, Inc. | | | 16,126,680 | |
| | 306,700 | | | Freeport-McMoRan Copper & Gold, Inc. | | | 11,194,550 | |
| Number of | | | | | | |
| Shares | | | | | Value | |
| | | | | | | | | |
| United States: (continued) | | | | |
| | 97,500 | | | Gulfport Energy Corp. * | | $ | 6,123,000 | |
| | 309,100 | | | Halliburton Co. | | | 21,949,191 | |
| | 210,700 | | | HollyFrontier Corp. | | | 9,205,483 | |
| | 18,700 | | | Jacobs Engineering Group, Inc. * | | | 996,336 | |
| | 91,400 | | | Laredo Petroleum, Inc. * | | | 2,831,572 | |
| | 414,300 | | | Louisiana-Pacific Corp. * | | | 6,222,786 | |
| | 339,700 | | | Marathon Oil Corp. | | | 13,560,824 | |
| | 118,900 | | | Marathon Petroleum Corp. | | | 9,282,523 | |
| | 147,500 | | | National Oilwell Varco, Inc. | | | 12,146,625 | |
| | 87,350 | | | Newfield Exploration Co. * | | | 3,860,870 | |
| | 36,875 | | | NOW, Inc. * | | | 1,335,244 | |
| | 281,900 | | | Peabody Energy Corp. | | | 4,609,065 | |
| | 121,500 | | | Phillips 66 | | | 9,772,245 | |
| | 89,600 | | | Pioneer Natural Resources Co. | | | 20,590,976 | |
| | 73,800 | | | Royal Gold, Inc. | | | 5,617,656 | |
| | 192,200 | | | Schlumberger Ltd. | | | 22,669,990 | |
| | 186,600 | | | SM Energy Co. | | | 15,693,060 | |
| | 194,900 | | | Steel Dynamics, Inc. | | | 3,498,455 | |
| | 266,700 | | | Superior Energy Services, Inc. | | | 9,638,538 | |
| | 169,400 | | | Tesoro Corp. | | | 9,938,698 | |
| | 157,000 | | | United States Steel Corp. | | | 4,088,280 | |
| | | | | | | | 365,103,405 | |
Total Common Stocks
(Cost: $377,423,408) | | | 503,287,582 | |
WARRANTS: 0.0%
(Cost: $29,072) | | | | |
| | | | | |
| Canada: 0.0% | | | | |
| | 24,704 | | | Kinross Gold Corp. Warrants
(CAD 21.30, expiring 09/17/14) * | | | 579 | |
| United States: 0.0% | | | | |
| | 419,074 | | | Far East Energy Corp. Warrants
(USD 1.25, expiring 12/28/14) *#§ | | | 0 | |
| MONEY MARKET FUND: 3.4% | | | | |
| (Cost: $18,160,862) | | | | |
| | 18,160,862 | | | AIM Treasury Portfolio – Institutional Class | | | 18,160,862 | |
| Total Investments: 99.0% | | | | |
| (Cost: $395,613,342) | | | 521,449,023 | |
| Other assets less liabilities: 1.0% | | | 5,279,553 | |
| NET ASSETS: 100.0% | | $ | 526,728,576 | |
| ADR | — | American Depositary Receipt |
| CAD | — | Canadian Dollar |
| GBP | — | British Pound |
| USD | — | United States Dollar |
| * | Non-income producing |
| # | Indicates a fair valued security which has not been valued utilizing an independent quote, but has been valued pursuant to guidelines established by the Board of Trustees. The aggregate value of fair valued securities is $53,568,522 which represents 10.2% of net assets. |
| § | Illiquid Security - the aggregate value of illiquid securities is $11,382,507 which represents 2.2% of net assets. |
| ø | Restricted Security - the aggregate value of restricted securities is $11,400,277, or 2.2% of net assets. |
See Notes to Financial Statements
Restricted securities held by the Fund as of June 30, 2014 are as follows:
| | | Acquisition | | | Number of | | Acquisition | | | | | | % of |
| Security | | Date | | | Shares | | Cost | | | Value | | | Net Assets |
| African Minerals Ltd. | | 07/02/2009 | | | 15,000 | | $ | 61,440 | | | $ | 17,770 | | | | 0.0 | % |
| Kuwait Energy Plc | | 08/06/2008 | | | 3,890,609 | | | 11,764,893 | | | | 11,382,507 | | | | 2.2 | |
| | | | | | | | $ | 11,826,333 | | | $ | 11,400,277 | | | | 2.2 | % |
| Summary of Investments | | % of | | | |
| by Sector (unaudited) | | Investments | | Value | |
| Consumer Staples | | | 0.6 | % | | $ | 3,140,632 | |
| Energy | | | 71.3 | | | | 371,597,645 | |
| Industrials | | | 1.9 | | | | 10,061,509 | |
| Materials | | | 22.7 | | | | 118,488,375 | |
| Money Market Fund | | | 3.5 | | | | 18,160,862 | |
| | | | 100.0 | % | | $ | 521,449,023 | |
The summary of inputs used to value the Fund’s investments as of June 30, 2014 is as follows:
| | | | | | Level 2 | | | Level 3 | | | |
| | | Level 1 | | | Significant | | | Significant | | | |
| | | Quoted | | | Observable | | | Unobservable | | | |
| | | Prices | | | Inputs | | | Inputs | | Value | |
| Common Stocks | | | | | | | | | | | | | | | | | |
| Bermuda | | $ | 15,602,985 | | | $ | — | | | | $ | — | | | $ | 15,602,985 | |
| Brazil | | | — | | | | — | | | | | — | | | | — | |
| Canada | | | 54,775,166 | | | | — | | | | | — | | | | 54,775,166 | |
| Kuwait | | | — | | | | — | | | | | 11,382,507 | | | | 11,382,507 | |
| Monaco | | | 1,688,220 | | | | — | | | | | — | | | | 1,688,220 | |
| Norway | | | — | | | | 3,978,911 | | | | | — | | | | 3,978,911 | |
| Switzerland | | | 4,292,324 | | | | 24,477,955 | | | | | — | | | | 28,770,279 | |
| United Kingdom | | | 8,256,960 | | | | 13,729,149 | | | | | — | | | | 21,986,109 | |
| United States | | | 365,103,405 | | | | — | | | | | — | | | | 365,103,405 | |
| Warrants | | | | | | | | | | | | | | | | | |
| Canada | | | 579 | | | | — | | | | | — | | | | 579 | |
| United States | | | — | | | | — | | | | | — | | | | — | |
| Money Market Fund | | | 18,160,862 | | | | — | | | | | — | | | | 18,160,862 | |
| Total | | $ | 467,880,501 | | | $ | 42,186,015 | | | | $ | 11,382,507 | | | $ | 521,449,023 | |
The following table reconciles the valuation of the Fund’s Level 3 investment securities and related transactions during the period ended June 30, 2014:
| | | Common Stocks | |
| | | Brazil | | | Kuwait | |
| Balance as of December 31, 2013 | | $ | 174,535 | | | $ | 10,996,311 | |
| Realized gain (loss) | | | — | | | | — | |
| Net change in unrealized appreciation (depreciation) | | | (174,535 | ) | | | 386,196 | |
| Purchases | | | — | | | | — | |
| Sales | | | — | | | | — | |
| Transfers in and/or out of level 3 | | | — | | | | — | |
| Balance as of June 30, 2014 | | $ | 0 | | | $ | 11,382,507 | |
See Notes to Financial Statements
VAN ECK VIP GLOBAL HARD ASSETS FUND
SCHEDULE OF INVESTMENTS
June 30, 2014 (unaudited) (continued)
The following table presents additional information about valuation methodologies and inputs used for investments that are measured at fair value and categorized within Level 3 as of June 30, 2014:
| | | | | | | | | | | Impact to |
| | | Value as of | | | | | | | | Valuation from |
| | | June 30, | | | | Unobservable Input | | Unobservable | | an Increase in |
| | | 2014 | | Valuation Technique | | Description (1) | | Input | | Input (2) |
Common Stocks
Kuwait | | $11,382,507 | | Market comparable companies | | Production multiple | | 45.0x | | Increase |
| | | | | | | | Reserve multiple | | 11.0x | | Increase |
| (1) | In determining certain of these inputs, management evaluates a variety of factors including economic condition, industry and market developments, market valuations of comparable companies and company specific developments. |
| (2) | This column represents the directional change in the fair value of the Level 3 investments that would result from an increase to the corresponding unobservable input. A decrease to the unobservable input would have the opposite effect. Significant increases or decreases in these inputs in isolation could result in significantly higher or lower fair value measurements. |
See Notes to Financial Statements
STATEMENT OF ASSETS AND LIABILITIES
June 30, 2014 (unaudited)
| Assets: | | | | |
| Investments, at value (Cost $395,613,342) | | $ | 521,449,023 | |
| Receivables: | | | | |
| Investments sold | | | 6,446,691 | |
| Shares of beneficial interest sold | | | 481,315 | |
| Dividends | | | 191,080 | |
| Total assets | | | 528,568,109 | |
| | | | | |
| Liabilities: | | | | |
| Payables: | | | | |
| Shares of beneficial interest redeemed | | | 692,362 | |
| Due to Adviser | | | 417,660 | |
| Due to Distributor | | | 31,158 | |
| Deferred Trustee fees | | | 127,853 | |
| Accrued expenses | | | 570,500 | |
| Total liabilities | | | 1,839,533 | |
| NET ASSETS | | $ | 526,728,576 | |
| | | | | |
| Initial Class Shares: | | | | |
| Net Assets | | $ | 367,889,561 | |
| Shares of beneficial interest outstanding | | | 10,328,117 | |
| Net asset value, redemption and offering price per share | | | $35.62 | |
| | | | | |
| Class S Shares: | | | | |
| Net Assets | | $ | 158,839,015 | |
| Shares of beneficial interest outstanding | | | 4,584,160 | |
| Net asset value, redemption and offering price per share | | | $34.65 | |
| | | | | |
| Net Assets consist of: | | | | |
| Aggregate paid in capital | | $ | 407,121,255 | |
| Net unrealized appreciation | | | 125,835,680 | |
| Undistributed net investment income | | | 53,414 | |
| Accumulated net realized loss | | | (6,281,773 | ) |
| | | $ | 526,728,576 | |
See Notes to Financial Statements
VAN ECK VIP GLOBAL HARD ASSETS FUND
STATEMENT OF OPERATIONS
For the Six Months Ended June 30, 2014 (unaudited)
| Income: | | | | | | |
| Dividends (net of foreign taxes withheld of $49,229) | | | | | | $ | 3,140,099 | |
| | | | | | | | | |
| Expenses: | | | | | | | | |
| Management fees | | $ | 2,330,571 | | | | | |
| Distribution fees — Class S Shares | | | 165,820 | | | | | |
| Transfer agent fees — Initial Class Shares | | | 30,118 | | | | | |
| Transfer agent fees — Class S Shares | | | 13,773 | | | | | |
| Custodian fees | | | 23,943 | | | | | |
| Professional fees | | | 28,025 | | | | | |
| Reports to shareholders | | | 77,246 | | | | | |
| Trustees’ fees and expenses | | | 3,581 | | | | | |
| Other | | | 2,275 | | | | | |
| Total expenses | | | 2,675,352 | | | | | |
| Net investment income | | | | | | | 464,747 | |
| | | | | | | | | |
| Net realized loss on: | | | | | | | | |
| Investments | | | | | | | (4,281,477 | ) |
| Foreign currency transactions and foreign denominated assets and liabilities | | | | | | | (6,843 | ) |
| Net realized loss | | | | | | | (4,288,320 | ) |
| | | | | | | | | |
| Net change in unrealized appreciation (depreciation) on: | | | | | | | | |
| Investments | | | | | | | 65,383,223 | |
| Net Increase in Net Assets Resulting from Operations | | | | | | $ | 61,559,650 | |
See Notes to Financial Statements
STATEMENT OF CHANGES IN NET ASSETS
| | | Six Months Ended | | Year Ended | |
| | | June 30, | | December 31, | |
| | | 2014 | | 2013 | |
| | | (unaudited) | | | | |
| Operations: | | | | | | | | | | |
| Net investment income | | | $ | 464,747 | | | | $ | 944,077 | |
| Net realized gain (loss) | | | | (4,288,320 | ) | | | | 5,530,768 | |
| Net change in unrealized appreciation (depreciation) | | | | 65,383,223 | | | | | 37,352,321 | |
| Net increase in net assets resulting from operations | | | | 61,559,650 | | | | | 43,827,166 | |
| | | | | | | | | | | |
| Dividends and Distributions to shareholders from: | | | | | | | | | | |
| Net investment income | | | | | | | | | | |
| Initial Class Shares | | | | (298,583 | ) | | | | (2,370,818 | ) |
| Class S Shares | | | | — | | | | | (468,880 | ) |
| | | | | (298,583 | ) | | | | (2,839,698 | ) |
| Net realized gains | | | | | | | | | | |
| Initial Class Shares | | | | — | | | | | (6,777,188 | ) |
| Class S Shares | | | | — | | | | | (1,817,712 | ) |
| | | | | — | | | | | (8,594,900 | ) |
| Total dividends and distributions | | | | (298,583 | ) | | | | (11,434,598 | ) |
| | | | | | | | | | | |
| Share transactions*: | | | | | | | | | | |
| Proceeds from sale of shares | | | | | | | | | | |
| Initial Class Shares | | | | 35,216,288 | | | | | 53,276,344 | |
| Class S Shares | | | | 28,212,264 | | | | | 67,429,463 | |
| | | | | 63,428,552 | | | | | 120,705,807 | |
| Reinvestment of dividends and distributions | | | | | | | | | | |
| Initial Class Shares | | | | 298,583 | | | | | 9,148,007 | |
| Class S Shares | | | | — | | | | | 2,286,591 | |
| | | | | 298,583 | | | | | 11,434,598 | |
| Cost of shares redeemed | | | | | | | | | | |
| Initial Class Shares | | | | (47,565,686 | ) | | | | (104,572,301 | ) |
| Class S Shares | | | | (9,863,658 | ) | | | | (41,518,622 | ) |
| | | | | (57,429,344 | ) | | | | (146,090,923 | ) |
| Net increase (decrease) in net assets resulting from share transactions | | | | 6,297,791 | | | | | (13,950,518 | ) |
| Total increase in net assets | | | | 67,558,858 | | | | | 18,442,050 | |
| | | | | | | | | | | |
| Net Assets: | | | | | | | | | | |
| Beginning of period | | | | 459,169,718 | | | | | 440,727,668 | |
| End of period (including undistributed (accumulated) net investment income (loss) of $53,414 and ($112,750), respectively) | | | $ | 526,728,576 | | | | $ | 459,169,718 | |
| | | | | | | | | | | |
* Shares of beneficial interest issued, reinvested and redeemed
(unlimited number of $.001 par value shares authorized): | | | | | | | | | | |
| | | | | | | | | | | |
| Initial Class Shares: | | | | | | | | | | |
| Shares sold | | | | 1,083,437 | | | | | 1,806,442 | |
| Shares reinvested | | | | 10,006 | | | | | 308,429 | |
| Shares redeemed | | | | (1,492,386 | ) | | | | (3,557,223 | ) |
| Net decrease | | | | (398,943 | ) | | | | (1,442,352 | ) |
| | | | | | | | | | | |
| Class S Shares: | | | | | | | | | | |
| Shares sold | | | | 888,909 | | | | | 2,335,791 | |
| Shares reinvested | | | | — | | | | | 79,039 | |
| Shares redeemed | | | | (311,793 | ) | | | | (1,446,168 | ) |
| Net increase | | | | 577,116 | | | | | 968,662 | |
See Notes to Financial Statements
VAN ECK VIP GLOBAL HARD ASSETS FUND
FINANCIAL HIGHLIGHTS
For a share outstanding throughout each period:
| | | Initial Class Shares | |
| | | For the Six | | | | | | | | | | | | | | | |
| | | Months Ended | | | | | | | | | | | | | | | |
| | | June 30, | | Year Ended December 31, | |
| | | 2014 | | | 2013 | | | | 2012 | | | | 2011 | | | | 2010 | | | | 2009 | |
| | | (unaudited) | | | | | | | | | | | | | | | | | | | | |
| Net asset value, beginning of period | | | | $31.39 | | | | $29.13 | | | | $30.75 | | | | $37.67 | | | | $29.26 | | | | $18.75 | |
| Income from investment operations: | | | | | | | | | | | | | | | | | | | | | | | | | |
| Net investment income (loss) | | | | 0.04 | | | | 0.08 | (b) | | | 0.15 | (b) | | | 0.04 | (b) | | | (0.01 | ) | | | (0.03 | ) |
| Net realized and unrealized gain (loss) on investments | | | | 4.22 | | | | 2.95 | | | | 1.00 | | | | (6.09 | ) | | | 8.52 | | | | 10.72 | |
| Total from investment operations | | | | 4.26 | | | | 3.03 | | | | 1.15 | | | | (6.05 | ) | | | 8.51 | | | | 10.69 | |
| Less dividends and distributions from: | | | | | | | | | | | | | | | | | | | | | | | | | |
| Net investment income | | | | (0.03 | ) | | | (0.20 | ) | | | (0.18 | ) | | | (0.42 | ) | | | (0.11 | ) | | | (0.06 | ) |
| Net realized gains | | | | — | | | | (0.57 | ) | | | (2.59 | ) | | | (0.45 | ) | | | — | | | | (0.12 | ) |
| Total dividends and distributions | | | | (0.03 | ) | | | (0.77 | ) | | | (2.77 | ) | | | (0.87 | ) | | | (0.11 | ) | | | (0.18 | ) |
| Settlement payments from unaffiliated third parties | | | | — | | | | — | | | | — | | | | — | | | | 0.01 | (c) | | | — | |
| Redemption fees | | | | — | | | | — | | | | — | (d) | | | — | (d) | | | — | (d) | | | — | (d) |
| Net asset value, end of period | | | | $35.62 | | | | $31.39 | | | | $29.13 | | | | $30.75 | | | | $37.67 | | | | $29.26 | |
| Total return (a) | | | | 13.58 | %(e) | | | 10.53 | % | | | 3.39 | % | | | (16.45 | )% | | | 29.23 | %(c) | | | 57.54 | % |
| | | | | | | | | | | | | | | | | | | | | | | | | | |
| | | | | | | | | | | | | | | | | | | | | | | | | | |
| Ratios/Supplemental Data | | | | | | | | | | | | | | | | | | | | | | | | | |
| Net Assets, end of period (000’s) | $367,890 | | $336,763 | | $354,487 | | $926,630 | | $1,162,125 | | $897,073 | |
| Ratio of gross expenses to average net assets | | | | 1.07 | %(f) | | | 1.09 | % | | | 1.03 | % | | | 0.92 | % | | | 0.97 | % | | | 1.10 | % |
| Ratio of net expenses to average net assets | | | | 1.07 | %(f) | | | 1.09 | % | | | 1.03 | % | | | 0.92 | % | | | 0.97 | % | | | 1.10 | % |
| Ratio of net expenses, excluding interest expense, to average net assets | | | | 1.07 | %(f) | | | 1.09 | % | | | 1.03 | % | | | 0.92 | % | | | 0.97 | % | | | 1.09 | % |
| Ratio of net investment income (loss) to average net assets | | | | 0.26 | %(f) | | | 0.27 | % | | | 0.50 | % | | | 0.11 | % | | | (0.05 | )% | | | (0.15 | )% |
| Portfolio turnover rate | | | | 13 | %(e) | | | 31 | % | | | 29 | % | | | 38 | % | | | 70 | % | | | 105 | % |
| | | Class S Shares | |
| | | For the Six | | | | | | | | | | | | | | | |
| | | Months Ended | | | | | | | | | | | | | | | |
| | | June 30, | | Year Ended December 31, | |
| | | 2014 | | | 2013 | | | | 2012 | | | | 2011 | | | | 2010 | | | | 2009 | |
| | | (unaudited) | | | | | | | | | | | | | | | | | | | | |
| Net asset value, beginning of period | | | | $30.55 | | | | $28.38 | | | | $30.10 | | | | $36.95 | | | | $28.80 | | | | $18.53 | |
| Income from investment operations: | | | | | | | | | | | | | | | | | | | | | | | | | |
| Net investment income (loss) | | | | 0.01 | | | | 0.01 | (b) | | | 0.13 | (b) | | | (0.06 | )(b) | | | 0.05 | | | | (0.06 | ) |
| Net realized and unrealized gain (loss) on investments | | | | 4.09 | | | | 2.88 | | | | 0.92 | | | | (5.96 | ) | | | 8.17 | | | | 10.51 | |
| Total from investment operations | | | | 4.10 | | | | 2.89 | | | | 1.05 | | | | (6.02 | ) | | | 8.22 | | | | 10.45 | |
| Less dividends and distributions from: | | | | | | | | | | | | | | | | | | | | | | | | | |
| Net investment income | | | | — | | | | (0.15 | ) | | | (0.18 | ) | | | (0.38 | ) | | | (0.08 | ) | | | (0.06 | ) |
| Net realized gains | | | | — | | | | (0.57 | ) | | | (2.59 | ) | | | (0.45 | ) | | | — | | | | (0.12 | ) |
| Total dividends and distributions | | | | — | | | | (0.72 | ) | | | (2.77 | ) | | | (0.83 | ) | | | (0.08 | ) | | | (0.18 | ) |
| Settlement payments from unaffiliated third parties | | | | — | | | | — | | | | — | | | | — | | | | 0.01 | (c) | | | — | |
| Redemption fees | | | | — | | | | — | | | | — | (d) | | | — | (d) | | | — | (d) | | | — | (d) |
| Net asset value, end of period | | | | $34.65 | | | | $30.55 | | | | $28.38 | | | | $30.10 | | | | $36.95 | | | | $28.80 | |
| Total return (a) | | | | 13.42 | %(e) | | | 10.30 | % | | | 3.11 | % | | | (16.69 | )% | | | 28.67 | %(c) | | | 56.92 | % |
| | | | | | | | | | | | | | | | | | | | | | | | | | |
| | | | | | | | | | | | | | | | | | | | | | | | | | |
| Ratios/Supplemental Data | | | | | | | | | | | | | | | | | | | | | | | | | |
| Net Assets, end of period (000’s) | | $158,839 | | $122,407 | | $86,241 | | $47,818 | | $25,061 | | $3,899 | |
| Ratio of gross expenses to average net assets | | | | 1.33 | %(f) | | | 1.34 | % | | | 1.34 | % | | | 1.26 | % | | | 1.36 | % | | | 2.24 | % |
| Ratio of net expenses to average net assets | | | | 1.33 | %(f) | | | 1.34 | % | | | 1.34 | % | | | 1.26 | % | | | 1.36 | % | | | 1.44 | % |
| Ratio of net expenses, excluding interest expense, to average net assets | | | | 1.33 | %(f) | | | 1.34 | % | | | 1.34 | % | | | 1.26 | % | | | 1.36 | % | | | 1.44 | % |
| Ratio of net investment income (loss) to average net assets | | | | 0.03 | %(f) | | | 0.03 | % | | | 0.47 | % | | | (0.18 | )% | | | (0.39 | )% | | | (0.73 | )% |
| Portfolio turnover rate | | | | 13 | %(e) | | | 31 | % | | | 29 | % | | | 38 | % | | | 70 | % | | | 105 | % |
| (a) | Total return is calculated assuming an initial investment made at the net asset value at the beginning of period, reinvestment of any dividends and distributions at net asset value on the dividend/distributions payment date and a redemption at the net asset value on the last day of the period. The return does not reflect the deduction of taxes that a shareholder would pay on Fund dividends/distributions or the redemption of Fund shares. |
| (b) | Calculated based upon average shares outstanding |
| (c) | For the year ended December 31, 2010, the Fund received settlement payments from unaffiliated third parties which represented 0.04% of the Initial Class Shares and Class S Shares total return. |
| (d) | Amount represents less than $0.005 per share |
| (e) | Not annualized |
| (f) | Annualized |
See Notes to Financial Statements
NOTES TO FINANCIAL STATEMENTS
June 30, 2014 (unaudited)
Note 1—Fund Organization—Van Eck VIP Trust (the “Trust”) is registered under the Investment Company Act of 1940, as amended, as an open-end management investment company. The Trust was organized as a Massachusetts business trust on January 7, 1987. The Van Eck VIP Global Hard Assets Fund (the “Fund”) is a non-diversified series of the Trust and seeks long-term capital appreciation by investing primarily in hard asset securities. The Fund offers two classes of shares: Initial Class Shares and Class S Shares. The two classes are identical except Class S Shares are subject to a distribution fee.
Note 2—Significant Accounting Policies—The preparation of financial statements in conformity with U.S. generally accepted accounting principles (“GAAP”) requires management to make estimates and assumptions that affect the reported amounts and disclosures in the financial statements. Actual results could differ from those estimates.
The Fund is an investment company and is following accounting and reporting requirements of Accounting Standard Codification (“ASC”) 946 Financial Services - Investment Companies.
The following is a summary of significant accounting policies followed by the Fund.
| A. | Security Valuation—The Fund values its investments in securities and other assets and liabilities carried at fair value daily. Fair value is the price that would be received to sell an asset or paid to transfer a liability in an orderly transaction between market participants on the measurement date. Securities traded on national exchanges or traded on the NASDAQ National Market System are valued at the last sales price reported at the close of each business day. Securities traded on the NASDAQ Stock Market are valued at the NASDAQ official closing price. Over-the-counter securities not included in the NASDAQ National Market System and listed securities for which no sale was reported are valued at the mean of the bid and ask prices. To the extent these securities are actively traded they are categorized as Level 1 in the fair value hierarchy (as described below). Certain foreign securities, whose values may be affected by market direction or events occurring before the Fund’s pricing time (4:00 p.m. Eastern Standard Time) but after the last close of the securities’ primary market, are fair valued using a pricing service and are categorized as Level 2 in the fair value hierarchy. The pricing service considers the correlation of the trading patterns of the foreign security to intraday trading in the U.S. market, based on indices of domestic securities and other appropriate indicators such as prices of relevant ADR’s and futures contracts. The Fund may also fair value securities in other situations, such as, when a particular foreign market is closed but the Fund is open. Short-term obligations with more than sixty days remaining to maturity are valued at market value. Short-term obligations with sixty days or less to maturity are valued at amortized cost, which with accrued interest approximates fair value. Money market fund investments are valued at net asset value and are classified as Level 1 in the fair value hierarchy. Forward foreign currency contracts are valued at the spot currency rate plus an amount (“points”), which reflects the differences in interest rates between the U.S. and foreign markets. Securities for which quotations are not available are stated at fair value as determined by the Pricing Committee of Van Eck Associates Corporation (the “Adviser”) appointed by the Board of Trustees. The Pricing Committee provides oversight of the Fund’s valuation policies and procedures, which are approved by the Fund’s Board of Trustees. Among other things, these procedures allow the Fund to utilize independent pricing services, quotations from securities dealers, and other market sources to determine fair value. The Pricing Committee convenes regularly to review the fair value of financial instruments for which market prices are not readily available. The Pricing Committee employs various methods for calibrating the valuation approaches utilized to determine fair value, including a regular review of key inputs and assumptions, transactional back-testing and disposition analysis. |
Certain factors such as economic conditions, political events, market trends, the nature of and duration of any restrictions on disposition, trading in similar securities of the issuer or comparable issuers and other security specific information are used to determine the fair value for these securities. Depending on the relative significance of valuation inputs, these securities may be classified either as Level 2 or Level 3 in the fair value hierarchy. The price which the Fund may realize upon sale of an investment may differ materially from the value presented in the Schedule of Investments.
The Fund utilizes various methods to measure the fair value of its investments on a recurring basis which includes a hierarchy that prioritizes inputs to valuation methods used to measure fair value. The fair value hierarchy gives highest priority to unadjusted quoted prices in active markets for identical assets and liabilities (Level 1 measurements) and the lowest priority to unobservable inputs (Level 3 measurements). The inputs or methodologies used for valuing securities are not necessarily an indication of the risk associated with investing in those securities. The transfers between levels of the fair value hierarchy assume the financial instruments were transferred at the beginning of the reporting period. The three levels of the fair value hierarchy are described below:
| | Level 1 – | Quoted prices in active markets for identical securities. |
| | | |
| | Level 2 – | Significant observable inputs (including quoted prices for similar securities, interest rates, prepayment speeds, credit risk, etc.). |
| | | |
| | Level 3 – | Significant unobservable inputs (including the Fund’s own assumptions in determining the fair value of investments). |
VAN ECK VIP GLOBAL HARD ASSETS FUND
NOTES TO FINANCIAL STATEMENTS
(unaudited) (continued)
| | A summary of the inputs, the levels used to value the Fund’s investments, and transfers between levels are located in the Schedule of Investments. Additionally, tables that reconcile the valuation of the Fund’s Level 3 investments and that present additional information about valuation methodologies and unobservable inputs, if applicable, are located in the Schedule of Investments. |
| | | |
| B. | Federal Income Taxes—It is the Fund’s policy to comply with the provisions of the Internal Revenue Code applicable to regulated investment companies and to distribute all of its taxable income to its shareholders. Therefore, no federal income tax provision is required. |
| | | |
| C. | Currency Translation—Assets and liabilities denominated in foreign currencies and commitments under foreign currency contracts are translated into U.S. dollars at the closing prices of such currencies each business day. Purchases and sales of investments are translated at the exchange rates prevailing when such investments are acquired or sold. Income and expenses are translated at the exchange rates prevailing when accrued. The portion of realized and unrealized gains and losses on investments that result from fluctuations in foreign currency exchange rates is not separately disclosed. Recognized gains or losses attributable to foreign currency fluctuations on foreign currency denominated assets, other than investments, and liabilities are recorded as net realized gain (loss) on foreign currency transactions and foreign denominated assets and liabilities in the Statement of Operations. |
| | | |
| D. | Dividends and Distributions to Shareholders—Dividends to shareholders from net investment income and distributions from net realized capital gains, if any, are declared and paid annually. Income dividends and capital gain distributions are determined in accordance with U.S. income tax regulations, which may differ from such amounts determined in accordance with GAAP. |
| | | |
| E. | Restricted Securities—The Fund may invest in securities that are subject to legal or contractual restrictions on resale. These securities generally may be resold in transactions exempt from registration or to the public if the securities are registered. Disposal of these securities may involve time-consuming negotiations and expense, and prompt sale at an acceptable price may be difficult. Information regarding restricted securities is included at the end of the Fund’s Schedule of Investments. |
| | | |
| F. | Warrants—The Fund may invest in warrants whose values are linked to indices or underlying instruments. The Fund may use these warrants to gain exposure to markets that might be difficult to invest in through conventional securities. Warrants may be more volatile than their linked indices or underlying instruments. Potential losses are limited to the amount of the original investment. Warrants held at June 30, 2014 are reflected in the Fund’s Schedule of Investments. |
| | | |
| G. | Use of Derivative Instruments—The Fund may make investments in derivative instruments, including, but not limited to, options, futures, swaps and other derivatives relating to foreign currency transactions. A derivative is an instrument whose value is derived from underlying assets, indices, reference rates or a combination of these factors. Derivative instruments may be privately negotiated contracts (often referred to as over-the-counter (“OTC”) derivatives) or they may be listed and traded on an exchange. Derivative contracts may involve future commitments to purchase or sell financial instruments or commodities at specified terms on a specified date, or to exchange interest payment streams or currencies based on a notional or contractual amount. Derivative instruments may involve a high degree of financial risk. The use of derivative instruments also involves the risk of loss if the investment adviser is incorrect in its expectation of the timing or level of fluctuations in securities prices, interest rates or currency prices. Investments in derivative instruments also include the risk of default by the counterparty, the risk that the investment may not be liquid and the risk that a small movement in the price of the underlying security or benchmark may result in a disproportionately large movement, unfavorable or favorable, in the price of the derivative instrument. GAAP requires enhanced disclosures about the Fund’s derivatives instruments and hedging activities. The Fund held no derivative instruments during the period ended June 30, 2014. |
| | | |
| | Forward Foreign Currency Contracts—The Fund is subject to foreign currency risk in the normal course of pursuing its investment objectives. The Fund may buy and sell forward foreign currency contracts to settle purchases and sales of foreign denominated securities, gain currency exposure or to hedge foreign denominated assets. Realized gains and losses from forward foreign currency contracts, if any, are included in realized gain (loss) on foreign currency transactions and foreign denominated assets and liabilities in the Statement of Operations. The Fund may incur additional risk from investments in forward foreign currency contracts if the counterparty is unable to fulfill its obligation or there are unanticipated movements of the foreign currency relative to the U.S. dollar. The Fund held no forward foreign currency contract during the period ended June 30, 2014. |
| | H. | Other—Security transactions are accounted for on trade date. Dividend income is recorded on the ex-dividend date except that certain dividends from foreign securities are recognized upon notification of the ex-dividend date. Realized gains and losses are calculated on the specific identified cost basis. Interest income, including amortization of premiums and discounts, is accrued as earned. Estimated foreign taxes that are expected to be withheld from proceeds at the sale of certain foreign investments are accrued by the Fund and decrease the unrealized gain on investments. The Fund received regulatory settlement payments during 2010 from unaffiliated third parties which is included in the Financial Highlights. The Fund received redemption fees from Class R1 Shares prior to its closing on April 30, 2012 and are reflected in the Financial Highlights. |
| | | |
| | | Income, expenses (excluding class-specific expenses), realized, and unrealized gains/losses are allocated proportionately to each class of shares based upon the relative net asset value of outstanding shares of each class at the beginning of the day (after adjusting for current capital share activity of the respective classes). Class-specific expenses are charged directly to the applicable class of shares. |
| | | |
| | | In the normal course of business, the Fund enters into contracts that contain a variety of general indemnifications. The Fund’s maximum exposure under these agreements is unknown as this would involve future claims that may be made against the Fund that have not yet occurred. However, the Adviser believes the risk of loss under these arrangements to be remote. |
Note 3—Investment Management and Other Agreements—The Adviser is the investment adviser to the Fund. The Adviser receives a management fee, calculated daily and payable monthly based on an annual rate of 1.00% of the first $500 million of average daily net assets, 0.90% of the next $250 million of average daily net assets and 0.70% of the average daily net assets in excess of $750 million. The Adviser has agreed to, at least until May 1, 2015, waive management fees and/or assume expenses (excluding acquired fund fees and expenses, interest expense, trading expenses, dividends and interest payments on securities sold short, taxes, and extraordinary expenses) from exceeding 1.20% for the Initial Class Shares and 1.45% for the Class S Shares. For the period ended June 30, 2014, no management fees were waived nor were any expenses assumed by the Adviser. Certain of the officers and trustees of the Trust are officers, directors or stockholders of the Adviser and Van Eck Securities Corporation, (the “Distributor”).
Note 4—12b-1 Plans of Distribution—The Fund and the Distributor are parties to a distribution agreement dated May 1, 2006. The Fund has adopted a Distribution Plan (the “Plan”) for Class S Shares in accordance with Rule 12b-1 under the 1940 Act. Pursuant to the Plan, the Fund is authorized to incur distribution expenses for its Class S Shares which will principally be payments to securities dealers who have sold shares and serviced shareholder accounts and payments to the Distributor, for reimbursement of other actual promotion and distribution expenses incurred by the Distributor on behalf of the Fund. The amount paid in any one year is 0.25% of average daily net assets for Class S Shares.
Note 5—Investments—For the period ended June 30, 2014, the cost of purchases and proceeds from sales of investments, excluding U.S. government securities and short-term obligations, aggregated $66,146,822 and $59,177,152, respectively.
Note 6—Income Taxes—For Federal income tax purposes, the identified cost of investments owned at June 30, 2014 was $397,589,288 and net unrealized appreciation aggregated $123,859,735 of which $145,330,021 related to appreciated securities and $21,470,286 related to depreciated securities.
The tax character of dividends and distributions paid to shareholders during the year ended December 31, 2013 were as follows:
| | | Year Ended |
| | | December 31, 2013 |
| Ordinary income | | | $ | 2,855,232 | |
| Long-term capital gains | | | | 8,579,366 | |
| Total | | | $ | 11,434,598 | |
The Fund recognizes the tax benefits of uncertain tax positions only where the position is “more-likely-than-not” to be sustained assuming examination by applicable tax authorities. Management has analyzed the Fund’s tax positions, and has concluded that no liability for unrecognized tax benefits should be recorded related to uncertain tax positions taken on return filings for open tax years (tax years ended December 31, 2010-2013), or expected to be taken in the Fund’s current tax year. The Fund does not have exposure for additional years that might still be open in certain foreign jurisdictions. Therefore, no provision for income tax is required in the Fund’s financial statements.
The Fund recognizes interest and penalties, if any, related to uncertain tax positions as income tax expense in the Statement of Operations. During the period ended June 30, 2014, the Fund did not incur any interest or penalties.
VAN ECK VIP GLOBAL HARD ASSETS FUND
NOTES TO FINANCIAL STATEMENTS
(unaudited) (continued)
Note 7—Concentration of Risk—The Fund may purchase securities on foreign exchanges. Securities of foreign issuers involve special risks and considerations not typically associated with investing in U.S. issuers. These risks include devaluation of currencies, less reliable information about issuers, different securities transaction clearance and settlement practices, and future adverse political and economic developments. These risks are heightened for investments in emerging market countries. Moreover, securities of many foreign issuers and their markets may be less liquid and their prices more volatile than those of comparable U.S. issuers.
The Fund may concentrate its investments in companies which are significantly engaged in the exploration, development, production and distribution of gold and other natural resources such as strategic and other metals, minerals, forest products, oil, natural gas and coal and by investing in gold bullion and coins. Since the Fund may so concentrate, it may be subject to greater risks and market fluctuations than other more diversified portfolios. The production and marketing of gold and other natural resources may be affected by actions and changes in governments. In addition, gold and natural resources may be cyclical in nature.
At June 30, 2014, the aggregate shareholder accounts of three insurance companies own approximately 53%, 22%, and 5% of the Initial Class Shares and four insurance companies own approximately 50%, 30% and 7%, and 6% of the Class S Shares.
Note 8—Trustee Deferred Compensation Plan—The Trust has a Deferred Compensation Plan (the “Deferred Plan”) for Trustees under which the Trustees can elect to defer receipt of their trustee fees until retirement, disability or termination from the Board of Trustees. The fees otherwise payable to the participating Trustees are deemed invested in shares of eligible Funds of the Trust and the Van Eck Funds (another registered investment company managed by the Adviser) as directed by the Trustees.
The expense for the Deferred Plan is included in “Trustees’ fees and expenses” in the Statement of Operations. The liability for the Deferred Plan is shown as “Deferred Trustee fees” in the Statement of Assets and Liabilities.
Note 9—Bank Line of Credit—The Trust may participate with Van Eck Funds (collectively the “VE/VIP Funds”) in a $30 million committed credit facility (the “Facility”) to be utilized for temporary financing until the settlement of sales or purchases of portfolio securities, the repurchase or redemption of shares of the Fund and other temporary or emergency purposes. The VE/VIP Funds have agreed to pay commitment fees, pro rata, based on the unused but available balance. Interest is charged to the VE/VIP Funds at rates based on prevailing market rates in effect at the time of borrowings. During the period ended June 30, 2014, the Fund had no borrowings under the Facility.
Note 10—Securities Lending—To generate additional income, the Fund may lend its securities pursuant to a securities lending agreement with State Street Bank & Trust Co., the securities lending agent and also the Fund’s custodian. During the period ended June 30, 2014, the Fund had no securities lending activity.
Note 11—Subsequent Event Review—The Fund has evaluated subsequent events and transactions for potential recognition or disclosure through the date the financial statements were issued.
VAN ECK VIP GLOBAL HARD ASSETS FUND
APPROVAL OF ADVISORY AGREEMENT
June 30, 2014 (unaudited)
The Investment Company Act of 1940, as amended (the “1940 Act”), provides, in substance, that an investment advisory agreement between a fund and its investment adviser may be entered into only if it is approved, and may continue in effect from year to year after an initial two-year period only if its continuance is approved, at least annually by the fund’s board of trustees, including by a vote of a majority of the trustees who are not “interested persons” of the fund as defined in the 1940 Act (the “Independent Trustees”), cast in person at a meeting called for the purpose of considering such approval. On June 25, 2014, the Board of Trustees (the “Board”) of Van Eck VIP Trust (the “Trust”), which is comprised exclusively of Independent Trustees, voted to approve the continuation of the existing advisory agreement (the “Advisory Agreement”) between the Van Eck VIP Global Hard Assets Fund (the “Fund”) and its investment adviser, Van Eck Associates Corporation (together with its affiliated companies, the “Adviser”). Information regarding the material factors considered and related conclusions reached by the Board in approving the continuation of the Advisory Agreement is set forth below.
In considering the continuation of the Advisory Agreement, the Board reviewed and considered information that had been provided by the Adviser throughout the year at regular and special meetings of the Board and its committees, including information requested by the Board and furnished by the Adviser for meetings of the Board held on June 5, 2014 and June 24 and 25, 2014 specifically for the purpose of considering the continuation of the Advisory Agreement. The written and oral reports provided to the Board included, among other things, the following:
| | ■ | Information about the overall organization of the Adviser and the Adviser’s short-term and long-term business plans with respect to its mutual fund operations and other lines of business; |
| | | |
| | ■ | The consolidated financial statements of the Adviser for the past three fiscal years; |
| | | |
| | ■ | A copy of the Advisory Agreement and descriptions of the services provided by the Adviser thereunder; |
| | | |
| | ■ | Information regarding the qualifications, education and experience of the investment professionals responsible for portfolio management, investment research and trading activities for the Fund, the structure of their compensation and the resources available to support these activities; |
| | | |
| | ■ | A report prepared by an independent consultant comparing the Fund’s investment performance (including, where relevant, total returns, standard deviations, Sharpe ratios, information ratios, beta and alpha) with respect to a representative class of shares of the Fund for the one-, three-, five- and ten-year periods ended March 31, 2014 with those of (i) a universe of mutual funds selected by the independent consultant with similar portfolio holding characteristics, share class attributes and other operational characteristics as the Fund (the “Category”), (ii) a sub-group of funds selected from the Category by the independent consultant further limited to approximate more closely the Fund’s investment style, expense structure and asset size (the “Peer Group”), (iii) an appropriate benchmark index, and (iv) an additional benchmark index that includes relevant exposures not otherwise reflected in the benchmark index (the “Additional Index”); |
| | | |
| | ■ | A report prepared by an independent consultant comparing the advisory fees and other expenses of a representative class of shares of the Fund during its fiscal year ended December 31, 2013 with a similar share class of each fund in the (i) Category and (ii) Peer Group; |
| | | |
| | ■ | An analysis of the profitability of the Adviser with respect to its services for the Fund and the Van Eck complex of mutual funds as a whole (the “Van Eck Complex”); |
| | | |
| | ■ | Information regarding other investment products and services offered by the Adviser involving investment objectives and strategies similar to the Fund (“Comparable Products”), including the fees charged by the Adviser for managing the Comparable Products, a description of material differences and similarities in the services provided by the Adviser for the Fund and the Comparable Products, the size of the Comparable Products, the performance of the Comparable Products and identity of the individuals responsible for managing the Comparable Products; |
| | | |
| | ■ | Information concerning the Adviser’s compliance program, the resources devoted to compliance efforts undertaken by the Adviser on behalf of the Fund, and reports regarding a variety of compliance-related issues; |
| | | |
| | ■ | Information with respect to the Adviser’s brokerage practices, including the Adviser’s processes for monitoring best execution of portfolio transactions and the benefits received by the Adviser from research acquired with soft dollars; |
| | | |
| | ■ | Information regarding the procedures used by the Adviser in monitoring the valuation of portfolio securities, including the methodologies used in making fair value determinations; |
| | | |
| | ■ | Information regarding the Adviser’s policies and practices with respect to personal investing by the Adviser and its employees, including reports regarding the administration of the Adviser’s code of ethics and the Adviser’s policy with respect to investments in the Fund by the Adviser’s investment personnel; |
VAN ECK VIP GLOBAL HARD ASSETS FUND
APPROVAL OF ADVISORY AGREEMENT
(unaudited) (continued)
| | ■ | Descriptions of other administrative and other non-investment management services provided by the Adviser for the Fund, including the Adviser’s activities in managing relationships with the Fund’s custodian, transfer agent and other service providers; and |
| | | |
| | ■ | Other information provided by the Adviser in its response to a comprehensive questionnaire prepared by independent legal counsel on behalf of the Independent Trustees. |
In determining whether to approve the continuation of the Advisory Agreement, the Board considered, among other things, the following: (1) the nature, quality, extent and cost of the investment management, administrative and other non-investment management services provided by the Adviser; (2) the nature, quality and extent of the services performed by the Adviser in interfacing with, and monitoring the services performed by, third parties, such as the Fund’s custodian, transfer agent, sub-accounting agent and independent auditors, and the Adviser’s commitment and efforts to review the quality and pricing of third party service providers to the Fund with a view to reducing non-management expenses of the Fund; (3) the terms of the Advisory Agreement and the services performed thereunder; (4) the willingness of the Adviser to reduce the overall expenses of the Fund from time to time, if necessary or appropriate, by means of waiving a portion of its fees or paying expenses of the Fund; (5) the quality of the services, procedures and processes used to determine the value of the Fund’s assets and the actions taken to monitor and test the effectiveness of such services, procedures and processes; (6) the ongoing efforts of, and resources devoted by, the Adviser with respect to the development and implementation of a comprehensive compliance program; (7) the responsiveness of the Adviser to inquiries from, and examinations by, regulatory authorities, including the Securities and Exchange Commission; (8) the resources committed by the Adviser in recent periods to information technology; and (9) the ability of the Adviser to attract and retain quality professional personnel to perform investment advisory and administrative services for the Fund.
The Board considered the fact that the Adviser is managing other investment products, including exchange-traded funds, hedge funds, separate accounts and UCITs, one or more of which may invest in the same financial markets and may be managed by the same investment professionals according to a similar investment objective and/or strategy as the Fund. The Board concluded that the management of these products contributes to the Adviser’s financial stability and is helpful to the Adviser in attracting and retaining quality portfolio management personnel for the Fund. In addition, the Board concluded that the Adviser has established appropriate procedures to monitor conflicts of interest involving the management of the Fund and the other products and for resolving any such conflicts of interest in a fair and equitable manner.
The performance data and the advisory fee and expense ratio data described below for the Fund is based on data for a representative class of shares of the Fund. The performance data is for periods on an annualized basis ended March 31, 2014, and the advisory fee and expense ratio data is as of the Fund’s fiscal year end of December 31, 2013.
Performance. The Board noted, based on a review of comparative annualized total returns, that the Fund had outperformed its Peer Group median over the one-year period and its Category and Peer Group medians for the ten-year period, but had underperformed its Category median for the one-year period and its Category and Peer Group medians over the three- and five-year periods. The Board also noted that the Fund had outperformed its benchmark index for the ten-year period, but had underperformed its benchmark index for the one-, three- and five-year periods. The Board further noted that the Fund had outperformed its Additional Index for the one-, three-, five- and ten-year periods. On the basis of the foregoing and other relevant information provided in response to inquiries by the Board regarding material factors that contributed to the Fund’s underperformance in recent periods, the Board concluded that the performance of the Fund was satisfactory.
Fees and Expenses. The Board noted that the fees payable for advisory services were higher than the median advisory fees of its Category and Peer Group, but that the Fund’s total expense ratio, net of waivers or reimbursements, was equal to the median expense ratio of its Category and higher than the median expense ratio of its Peer Group. The Board also noted that the Adviser has agreed to waive fees or pay expenses of the Fund through April 2015 to the extent necessary to prevent the expense ratio of the Fund from exceeding a specified maximum amount. On the basis of the foregoing, and in light of the nature, extent and quality of the services provided by the Adviser, the Board concluded that the advisory fee charged to the Fund is reasonable.
Profitability and Economies of Scale. The Board considered the profits, if any, realized by the Adviser from managing the Fund and other mutual funds in the Van Eck Complex and the methodology used to determine such profits, including the results of an analysis of the methodology performed by an independent consultant in 2013 on behalf of the Board and its independent counsel. The Board noted that the levels of profitability reported on a fund-by-fund basis varied widely depending on such factors as the size, type of fund and operating history The Board further noted that, in evaluating the reasonableness of the Adviser’s profits from managing any particular Fund, it would be appropriate to consider the size of
the Adviser relative to other firms in the investment management industry and the impact on the Adviser’s profits of the volatility of the markets in which the Funds invest and the volatility of cash flows into and out of the Funds through various market cycles. Based on its review of the foregoing information, and in light of the nature, extent and quality of the services provided by the Adviser, the Board concluded that the profits realized by the Adviser, if any, are not excessive. In this regard, the Board also considered the extent to which the Adviser may realize economies of scale as the Fund grows and whether the Fund’s fee schedule, which includes breakpoints, reflects these economies of scale for the benefit of shareholders. The Board concluded that, with respect to the Fund, the economies of scale being realized, if any, are currently being shared by the Adviser and the Fund, and that adding or modifying existing breakpoints would not be warranted at this time for the Fund.
Conclusion. In determining the material factors to be considered in evaluating the Advisory Agreement and the weight to be given to such factors, the members of the Board relied upon the advice of independent legal counsel and their own business judgment. The Board did not consider any single factor as controlling in determining whether to approve the continuation of the Advisory Agreement and each member of the Board may have placed varying emphasis on particular factors considered in reaching a conclusion. Moreover, this summary description does not necessarily identify all of the factors considered or conclusions reached by the Board. Based on its consideration of the foregoing factors and conclusions, and such other factors and conclusions as it deemed relevant, the Board (comprised exclusively of Independent Trustees) concluded that the continuation of the Advisory Agreement is in the interests of shareholders and, accordingly, the Board approved the continuation of the Advisory Agreement for an additional one-year period.
[This page intentionally left blank.]
This report must be preceded or accompanied by a Van Eck VIP (the “Trust”) Prospectus, which includes more complete information. An investor should consider the investment objective, risks, and charges and expenses of the Fund carefully before investing. The prospectus contains this and other information about the investment company. Please read the prospectus carefully before investing.
Additional information about the Trust’s Board of Trustees/Officers and a description of the policies and procedures the Trust uses to determine how to vote proxies relating to portfolio securities are provided in the Statement of Additional Information. The Statement of Information and information regarding how the Trust voted proxies relating to portfolio securities during the most recent twelve month period ending June 30 is available, without charge, by calling 800.826.2333, or by visiting vaneck.com, or on the Securities and Exchange Commission’s website at http://www.sec.gov.
The Trust files its complete schedule of portfolio holdings with the Securities and Exchange Commission for the first and third quarters of each fiscal year on Form N-Q. The Trust’s Form N-Qs are available on the Commission’s website at http://www.sec.gov and may be reviewed and copied at the Commission’s Public Reference Room in Washington, D.C. Information on the operation of the Public Reference Room may be obtained by calling 202.942.8090. The Fund’s complete schedule of portfolio holdings is also available by calling 800.826.2333 or by visiting vaneck.com.

| Investment Adviser: | Van Eck Associates Corporation |
| Distributor: | Van Eck Securities Corporation |
| | 335 Madison Avenue, New York, NY 10017 |
| | vaneck.com |
| Account Assistance: | 800.544.4653 |
| | |
| vaneck.com | |
VIPGHASAR
| | | | | SEMI-ANNUAL REPORT
JUNE 30, 2014
(unaudited) |
| | |  |
| | | | | |
| | | | | |
| | | Van Eck VIP Trust Van Eck VIP Emerging Markets Fund |
| | | | | |
| | | | | |
| | | | | |
| | | | | |
| | | | | |
| | | |  |
| | | | | |
Van Eck VIP Emerging Markets Fund
The information contained in this shareholder letter represents the personal opinions of the investment team members and may differ from those of other portfolio managers or of the firm as a whole. This information is not intended to be a forecast of future events, a guarantee of future results or investment advice. Also, unless otherwise specifically noted, any discussion of the Fund’s holdings and the Fund’s performance, and the views of the investment team members are as of June 30, 2014 and are subject to change.
VAN ECK VIP EMERGING MARKETS FUND
(unaudited)
Dear Shareholder:
The Initial Class shares of the Van Eck VIP Emerging Markets Fund (the “Fund”) gained 5.20% during the first half of 2014, as compared to its benchmark index, the MSCI Emerging Markets (MSCI EM) Index1, which returned 6.32% over the same period.
Emerging markets equities produced creditable returns; not only did the Fund outperform during the reporting period, it has substantially outperformed this benchmark over the last one, three and five years. We concentrate on rigorous fundamental bottom-up analysis designed to identify and invest in companies with strong structural growth prospects. There are times when some of the more cyclical, state-owned emerging markets heavyweights tend to outperform. This is often related to political change which may improve the prospects of these state owned enterprises, or heavy inflows into passive emerging markets products which are designed to track market capitalization-based indices. Over the long run, we firmly believe that focusing on well-run companies generates better returns. When compared with the MSCI EM Index, the Fund fared well in financial and industrial stocks, while investments in the consumer staples and energy sectors detracted from performance overall.
Overview
Broad emerging markets had a creditable first half of the year, producing returns close to those generated in the broad U.S. market. It appears reasonably clear that the global economy continues to improve, albeit gradually, and with a significant side effect in the form of asset inflation. At the same time, there is, perhaps, uneasiness about the relative length, and degree, of the outperformance of the developed markets, and the extremely negative positioning towards emerging markets.
China was one market that notably underperformed in the period under review. As usual, there is a wide range of opinions, and a great deal of skepticism, about the China story. What is clear is that there is a continuing tug of war between significant positive and negative economic variables. On the negative side, there is the issue of dealing with the rapid accumulation of debt in the economy, while reform measures, such as closure of inefficient industrial capacity and the fight against corruption, depress economic growth. On the positive side, in the medium term, such reforms will enhance the longer-term potential of the economy.
This year is, we believe, particularly significant for its elections. The impact of a decisive win for the BJP in India has clearly been beneficial for the stock market. Other significant elections this year include those in Brazil and Indonesia, while Thailand’s path back to democracy is not immediately clear.
Not only domestic politics, but also geopolitics continue to have significant potential to cause trouble. To a certain extent this is appreciated and has been priced in. However, we remain vigilant for the effects of changes in global liquidity conditions and continue to select what we believe to be high quality companies in structural growth industries that have positive cash flows, strong balance sheets and can continue to grow, even when access to capital becomes more challenging.
Fund Review
The Fund’s stock selection within Latin America generally fared well in the first half of 2014. In particular, two stocks in Brazil, Estacio Participacoes (2.3% of Fund’s net assets†) and BB Seguridade Participacoes (2.2% of Fund’s net assets†) were notable performers, despite the overall economic conditions in Brazil being disappointing. This illustrates that we can often find strong structural growth stories which will perform even in lackluster environments.
Estacio Participacoes is a provider of post-secondary school education in Brazil, through campus programs and distance learning for undergraduates and post-graduate courses. It caters mostly to middle and lower income students. Government policy is strongly in favor of the sector, and Estacio Participacoes, as one of the largest and best run companies in the sector, has been able to take advantage of consolidation opportunities to gain market share. A combination of strong student intake and an increase in the “ticket size” has created healthy revenue growth. The increased value of the brand will help to protect margins in the long run.
BB Seguridade Participacoes is the insurance arm of Banco do Brasil, the largest Latin American-based bank. Its advantage is the ability to penetrate the bank’s clients with its insurance- and investment-related products. The bank has over 5,000 branches and BB Seguridade Participacoes has an exclusivity agreement. Insurance premiums paid as a percentage of GDP are low in Brazil, implying a long runway of growth. Additionally the operating subsidiaries are actually joint ventures controlled by non-state owned stakeholders, giving comfort to minority shareholders.
VAN ECK VIP EMERGING MARKETS FUND
(unaudited)
The Indian market was clearly a star performer during the first half of 2014. Clearly the most important factor was the election, which resulted in a change of government, one perceived to be more business friendly. The economy had already been showing better signs, so appropriate policy will undoubtedly serve to unlock more of India’s undoubted potential. The Fund was overweight in India compared to the benchmark throughout the period, but in that context, stock selection was mixed. On the positive side, the Fund’s long-term holding Adani Ports & Special Economic Zone (1.8% of Fund’s net assets†) had a strong first half of 2014. Adani Ports is the leading private port operator in India, controlled by one of the largest infrastructure conglomerates. The company’s operations stand out as well run, with good infrastructure connections, allowing it to gain market share even though trade volumes have been somewhat lackluster in the recent past. Adding other port assets, scaling them up while monetizing its land assets, provides strong secular growth in the context of an improvement in trade volume.
Glenmark Pharmaceuticals (2.0% of Fund’s net assets†), one of the Fund’s larger holdings, is an India-based manufacturer and marketer of pharmaceuticals, focusing on dermatology, respiratory and oncological therapies, with its main focus being on India, the U.S. and Latin America. We think that there are areas of product focus that should have attractive growth with upside from drug discovery research. Investing in longer-term opportunities and increasing the R&D spend, depresses margins in the short term, but creates substantial and fairly visible longer-term benefits.
The Fund employs a flexible agnostic approach to market capitalization. Sometimes described as “all cap”, in reality it is essentially the flexibility to invest in the best structural growth stories that we can find, many of which are found in small-and mid-stocks. Two of our longer-term holdings which fall into that category contributed to portfolio performance, one positively and the other negatively.
Ezion Holdings (2.4% of Fund’s net assets†) is one of the Fund’s larger holdings. The company owns a fleet of oil service rigs, including liftboats (self-propelled service rigs), which are benefitting from more emphasis on maintenance and repair in the energy sector in South East Asia and other areas in the world. The stock had been a very strong performer over the last two years, but less so in the last six months, as fear of increased supply, combined with some fabrication delays, have investors more cautious. However, we see the company as a play on a longer-term secular theme, with high earnings visibility, whose valuation does not reflect increasing profitability and reduced leverage. Its market capitalization at the end of June 2014 was just over $2 billion.
On a more positive note, Boer Power (1.4% of Fund’s net assets†), a sub-$1billion market cap company in which the Fund has been invested for more than two year, had a strong first half in terms of price performance. Boer provides electrical distribution solutions, benefitting industrial companies seeking better efficiency in power usage in China. Boer is a strong beneficiary of the development of a smarter grid in China. It works closely with Schneider, the multinational manufacturer of power distribution equipment based in France. Longer-term contracts create significant earnings visibility, while the company is expected to be a significant generator of cash.
Strategy and Outlook
One of the points that we often make about emerging markets is the increasing idiosyncrasy that we see, and that the asset class should not be treated as just a “beta block” on global growth. There are huge differences in the stage of development and future prospects from country to country. This means that the Fund can find many opportunities to invest in companies that have truly attractive longer-term structural growth opportunities. Secular growth is apparent in very many areas in emerging markets, such as the internet in North Asia, consumers in Africa or education in Brazil. Sometimes the more obvious and larger stocks in these areas can become over-valued, but the Fund exercises strong valuation discipline and casts its net wide to construct a well-valued portfolio of structural growth beneficiaries. All of the stocks in which we invest have a visible, persistent arc of growth, at a reasonable price. In management, we look for capable stewards, and we are unforgiving of bad decisions that disadvantage minority shareholders. The Fund is certainly not immune to macro considerations, and these can impact share prices in the shorter term. For instance, periodic bouts of negativity about the (undoubted) challenges that China faces can create significant valuation opportunities for the Fund to invest in companies focused on the more forward-looking parts of the Chinese economy.
For the remainder of 2014, and beyond, we will continue to search diligently for investments that embody the Fund’s ethos of structural growth at a reasonable price.
The Fund is subject to the risks associated with its investments in emerging market securities, which tend to be more volatile and less liquid than securities traded in developed countries. The Fund’s investments in foreign securities involve risks related to adverse political and economic developments unique to a country or a region, currency fluctuations or controls, and the possibility of arbitrary action by foreign governments, including the takeover of property without adequate
compensation or imposition of prohibitive taxation. The Fund is subject to risks associated with investments in debt securities, derivatives, commodity-linked instruments, illiquid securities, asset-backed securities, CMOs and small or mid-cap companies. The Fund is also subject to inflation risk, short-sales risk, market risk, nondiversification risk and leverage risk. Please see the prospectus for information on these and other risk considerations.
We thoroughly appreciate your participation in the Van Eck VIP Emerging Markets Fund, and we look forward to helping you meet your investment goals in the future.
 | |  | |
| | | | |
 | |  | |
| | | | |
David A. Semple
Portfolio Manager | | Angus Shillington
Deputy Portfolio Manager |
| | | | |
| July 15, 2014 | | | |
The performance quoted represents past performance. Past performance is no guarantee of future results; current performance may be lower or higher than the performance data quoted. Performance information reflects temporary waivers of expenses and/or fees and does not include insurance/annuity fees and expenses. Investment returns would have been reduced had these fees/expenses been included. Investment return and the value of the shares of the Fund will fluctuate so that an investor’s shares, when redeemed, may be worth more or less than their original cost. Fund returns assume that dividends and capital gains distributions have been reinvested in the Fund at NAV. Index returns assume that dividends of the Index constituents in the Index have been reinvested. Performance information current to the most recent month end is available by calling 1.800.826.2333.
The Fund is only available to life insurance and annuity companies to fund their variable annuity and variable life insurance products. These contracts offer life insurance and tax benefits to the beneficial owners of the Fund. Your insurance or annuity company charges, fees and expenses for these benefits are not reflected in this report or in the Fund’s performance, since they are not direct expenses of the Fund. Had these fees been included, returns would have been lower. For insurance products, performance figures do not reflect the cost for insurance and if they did, the performance shown would be significantly lower. A review of your particular life and/or annuity contract will provide you with much greater detail regarding these costs and benefits.
| † | All Fund assets referenced are Total Net Assets as of June 30, 2014. |
| | |
| | All indices are unmanaged and include the reinvestment of all dividends, but do not reflect the payment of transaction costs, advisory fees or expenses that are associated with an investment in the Fund. An index’s performance is not illustrative of the Fund’s performance. Indices are not securities in which investments can be made. Results reflect past performance and do not guarantee future results. |
| | |
| 1 | MSCI Emerging Markets Index (MSCI EM), a free float-adjusted market capitalization index that is designed to measure equity market performance of emerging markets, is calculated with dividends reinvested. The Index covers 2,700 securities of the publicly traded equities in each industry for 21 emerging markets that are currently classified as emerging market countries. |
VAN ECK VIP EMERGING MARKETS FUND
TOP TEN EQUITY HOLDINGS*
June 30, 2014 (unaudited)
Ezion Holdings Ltd.
(Singapore, 2.4%)
Ezion offers offshore marine logistics and support services, including liftboats and jack-up rigs.
Glencore Xstrata Plc
(Switzerland, 2.4%)
Glencore Xstrata is a diversified natural resources company. The company operates in three groups: metals and minerals, energy products, and agricultural products. Glencore Xstrata offers its products and services around the world.
Estacio Participacoes S.A.
(Brazil, 2.3%)
Estacio Participacoes provides post-secondary education services. The company’s network is comprised of university centers, colleges and distance learning units offering various traditional and technological undergraduate and post-graduate programs.
BB Seguridade Participacoes S.A.
(Brazil, 2.2%)
BB Seguridade acts as a holding company investing in insurance companies and as an insurance broker. The company offers insurance products, open pension plans, and special savings bonds. BB Seguridade also provides brokerage services.
Tencent Holdings Ltd.
(Hong Kong, 2.2%)
Tencent provides Internet, mobile, and telecommunication value-added services in China. The company has an instant messaging community in China and also provides online advertising services.
Tech Mahindra Ltd.
(India, 2.1%)
Tech Mahindra develops and markets computer software. The company markets software for telecommunications equipment manufacturers, telecom service providers, software vendors, and systems integrators.
Taiwan Semiconductor Manufacturing Co. Ltd.
(Taiwan, 2.1%)
Taiwan Semiconductor manufactures and markets integrated circuits. The company provides the following services: wafer manufacturing, wafer probing, assembly and testing, mask production, and design services. TSMC’s ICs are used in computer, communication, consumer electronics, automotive, and industrial equipment industries.
Samsung Electronics Co. Ltd.
(South Korea, 2.0%)
Samsung manufactures a wide range of consumer electronics, information technology and mobile communication products. Its semiconductor business manufactures a wide range of memory chips and system large scale integrated circuits.
Glenmark Pharmaceuticals Ltd.
(India, 2.0%)
Glenmark Pharmaceuticals is a company involved in the discovery new pharmaceutical products for a wide range of therapeutic segments, as well as the manufacture of generic products with the equivalence to branded formulations.
Magnit OJSC
(Russia, 2.0%)
Magnit is a principally a food retailer and operates a chain of hypermarkets, conveniences stores and other formats.
| * | Percentage of net assets. Portfolio is subject to change. |
| | Company descriptions courtesy of Bloomberg.com |
EXPLANATION OF EXPENSES
(unaudited)
As a shareholder of the Fund, you incur two types of costs: (1) transaction costs, including program fees on purchase payments; and (2) ongoing costs, including management fees and other Fund expenses. This disclosure is intended to help you understand the ongoing costs (in dollars) of investing in the Fund and to compare these costs with the ongoing costs of investing in other mutual funds.
The disclosure is based on an investment of $1,000 invested at the beginning of the period and held for the entire period, January 1, 2014 to June 30, 2014.
Actual Expenses
The first line in the table below provides information about account values and actual expenses. You may use the information in this line, together with the amount you invested, to estimate the expenses that you paid over the period. Simply divide your account value by $1,000 (for example, an $8,600 account value divided by $1,000 = 8.6), then multiply the result by the number in the first line under the heading entitled “Expenses Paid During the Period.”
Hypothetical Example for Comparison Purposes
The second line in the table below provides information about hypothetical account values and hypothetical expenses based on the Fund’s actual expense ratio and an assumed rate of return of 5% per year before expenses, which is not the Fund’s actual return. The hypothetical account values and expenses may not be used to estimate the actual ending account balance or expenses you paid for the period. You may use this information to compare the ongoing costs of investing in the Fund and other funds. To do so, compare this 5% hypothetical example with the 5% hypothetical examples that appear in the shareholder reports of other funds.
Please note that the expenses shown in the table are meant to highlight your ongoing costs only and do not reflect any transactional costs, such as fees on purchase payments. Therefore, the second line of the table is useful in comparing ongoing costs only, and will not help you determine the relative costs of owning different funds. In addition, if these transactional costs were included, your costs would have been higher.
Van Eck VIP Emerging Markets Fund
| | | | | Beginning
Account Value
January 1, 2014 | | Ending
Account Value
June 30, 2014 | | Expenses Paid
During the Period*
January 1, 2014 –
June 30, 2014 |
| Initial Class | | Actual | | $1,000.00 | | $1,052.00 | | $6.26 |
| | | Hypothetical** | | $1,000.00 | | $1,018.70 | | $6.16 |
| * | Expenses are equal to the Fund’s annualized expense ratio (for the six months ended June 30, 2014), of 1.23% multiplied by the average account value over the period, multiplied by the number of days in the most recent fiscal half year divided by the number of days in the fiscal year (to reflect the one-half year period). |
| | |
| ** | Assumes annual return of 5% before expenses |
VAN ECK VIP EMERGING MARKETS FUND
SCHEDULE OF INVESTMENTS
June 30, 2014 (unaudited)
Number of
Shares | | | | Value | |
| COMMON STOCKS: 88.6% | | | | |
| | | | | |
| Brazil: 8.6% | | | |
| | 82,000 | | | American Banknote S.A. | | $ | 1,420,665 | |
| | 261,000 | | | BB Seguridade Participacoes S.A. | | | 3,832,016 | |
| | 360,000 | | | BR Malls Participacoes S.A. | | | 3,063,136 | |
| | 301,000 | | | Estacio Participacoes S.A. | | | 3,984,725 | |
| | 52,700 | | | Guararapes Confeccoes S.A. | | | 2,528,264 | |
| | | | | | | | 14,828,806 | |
| China / Hong Kong: 24.5% | | | | |
| | 13,700 | | | Baidu, Inc. (ADR) * | | | 2,559,297 | |
| | 2,410,000 | | | Baoxin Auto Group Ltd. # | | | 2,034,692 | |
| | 2,579,608 | | | Beijing Capital International Airport Co. Ltd. # | | | 1,763,449 | |
| | 1,976,000 | | | Boer Power Holdings Ltd. # | | | 2,435,201 | |
| | 1,301,400 | | | Brilliance China Automotive Holdings Ltd. # | | | 2,436,183 | |
| | 1,847,969 | | | China Animal Healthcare Ltd. # | | | 1,287,863 | |
| | 3,070,000 | | | China Hongqiao Group Ltd. # | | | 2,219,078 | |
| | 7,440,000 | | | China Huishan Dairy Holdings Co. Ltd. * # | | | 1,629,741 | |
| | 90,800 | | | China Lodging Group Ltd. (ADR) * | | | 2,279,080 | |
| | 777,000 | | | China Singyes Solar Technologies Holdings Ltd. # | | | 1,321,023 | |
| | 692,000 | | | China Vanke Co. Ltd. * | | | 1,216,071 | |
| | 2,514,900 | | | Franshion Properties China Ltd. # | | | 665,009 | |
| | 326,000 | | | Galaxy Entertainment Group Ltd. # | | | 2,597,142 | |
| | 3,781,000 | | | Genting Hong Kong Ltd. (USD) # | | | 1,493,469 | |
| | 541,000 | | | Great Wall Motor Co. Ltd. # | | | 2,011,788 | |
| | 1,504,000 | | | Greatview Aseptic Packaging Co. Ltd. | | | 1,028,489 | |
| | 737,000 | | | Kunlun Energy Co. Ltd. # | | | 1,214,990 | |
| | 2,883,000 | | | Petro-King Oilfield Services Ltd. # | | | 829,672 | |
| | 397,000 | | | Shanghai Pharmaceuticals Holding Co. Ltd. | | | 825,717 | |
| | 528,000 | | | Techtronic Industries Co. # | | | 1,692,606 | |
| | 245,000 | | | Tencent Holdings Ltd. # | | | 3,736,653 | |
| | 2,684,000 | | | Wasion Group Holdings Ltd. # | | | 2,022,170 | |
| | 984,000 | | | Xinyi Glass Holdings Ltd. # | | | 577,614 | |
| | 681,000 | | | Zhuzhou CSR Times Electric Co. Ltd. # | | | 2,064,341 | |
| | | | | | | | 41,941,338 | |
| India: 14.0% | | | | |
| | 68,400 | | | Apollo Hospitals Enterprise Ltd. # | | | 1,135,195 | |
| | 88,000 | | | Axis Bank Ltd. # | | | 2,806,609 | |
| | 532,232 | | | DEN Networks Ltd. * # | | | 2,106,609 | |
| | 362,700 | | | Glenmark Pharmaceuticals Ltd. # | | | 3,438,162 | |
| | 102,300 | | | Jammu & Kashmir Bank Ltd. # | | | 2,661,262 | |
| | 775,000 | | | Adani Port & Special Economic Zone Ltd. # | | | 3,143,933 | |
| | 103,400 | | | Persistent Systems Ltd. | | | 1,853,275 | |
| | 287,800 | | | Phoenix Mills Ltd. # | | | 1,537,464 | |
| | 103,100 | | | Tech Mahindra Ltd. # | | | 3,686,479 | |
| | 188,000 | | | Yes Bank Ltd. # | | | 1,695,198 | |
| | | | | | | | 24,064,186 | |
| Indonesia: 1.0% | | | | |
| | 1,975,000 | | | Bank Rakyat Indonesia Tbk PT # | | | 1,720,839 | |
| Israel: 0.0% | | | |
| | 182,500 | | | Queenco Leisure International Ltd. (GDR) * # § Reg S | | | 56,813 | |
Number of
Shares | | | | Value | |
| Malaysia: 1.1% | | | | |
| | 1,407,000 | | | SapuraKencana Petroleum Bhd # | | $ | 1,919,182 | |
| Mexico: 0.5% | | | | |
| | 383,000 | | | Credito Real S.A.B. de C.V. | | | 857,606 | |
| Netherlands: 0.7% | | |
| | 100,000 | | | Nostrum Oil & Gas Plc (GBP) * | | | 1,283,550 | |
| Nigeria: 1.6% | | | | |
| | 11,890,000 | | | Guaranty Trust Bank Plc # | | | 2,115,522 | |
| | 84,672 | | | Nestle Nigeria Plc | | | 597,562 | |
| | | | | | | | 2,713,084 | |
| Panama: 1.6% | | | | |
| | 19,300 | | | Copa Holdings S.A. (Class A) (USD) | | | 2,751,601 | |
| Peru: 1.7% | | | |
| | 18,800 | | | Credicorp Ltd. (USD) | | | 2,922,836 | |
| Philippines: 1.8% | | |
| | 13,800,000 | | | Megaworld Corp. # | | | 1,422,840 | |
| | 1,027,000 | | | Robinsons Retail Holdings, Inc. * # | | | 1,715,948 | |
| | | | | | | | 3,138,788 | |
| Portugal: 0.4% | | | | |
| | 45,000 | | | Jeronimo Martins, SGPS S.A. # | | | 739,869 | |
| Russia: 4.5% | | | |
| | 13,200 | | | Magnit OJSC # | | | 3,434,835 | |
| | 83,000 | | | Mail.ru Group Ltd. (GDR) * Reg S | | | 2,925,750 | |
| | 524,000 | | | Sberbank RF (USD) * # | | | 1,291,057 | |
| | | | | | | | 7,651,642 | |
| Singapore: 2.4% | | | |
| | 2,424,800 | | | Ezion Holdings Ltd. # | | | 4,048,975 | |
| South Africa: 1.7% | | | |
| | 104,100 | | | Aspen Pharmacare Holdings Ltd. # | | | 2,927,090 | |
| South Korea: 4.9% | | | |
| | 4,950 | | | CJ O Shopping Co. Ltd. # | | | 1,787,377 | |
| | 81,900 | | | GS Retail Co. Ltd. # | | | 2,002,373 | |
| | 7,160 | | | Hyundai Mobis Co. Ltd. # | | | 2,010,835 | |
| | 11,170 | | | Hyundai Motor Co. # | | | 2,532,471 | |
| | | | | | | | 8,333,056 | |
| Switzerland: 2.4% | | | | |
| | 725,000 | | | Glencore Xstrata Plc (GBP) # | | | 4,040,218 | |
| Taiwan: 6.2% | | | | |
| | 998,000 | | | Advanced Semiconductor Engineering, Inc. # | | | 1,293,212 | |
| | 518,300 | | | Chailease Holding Co. Ltd. # | | | 1,303,620 | |
| | 16,000 | | | Largan Precision Co. Ltd. # | | | 1,276,452 | |
| | 124,400 | | | MediaTek, Inc. # | | | 2,104,261 | |
| | 187,000 | | | Sinmag Equipment Corp. # | | | 1,052,710 | |
| | 851,000 | | | Taiwan Semiconductor Manufacturing Co. Ltd. # | | | 3,601,043 | |
| | | | | | | | 10,631,298 | |
| Thailand: 1.3% | | | |
| | 48,000 | | | Kasikornbank PCL # | | | 301,691 | |
| | 297,000 | | | Kasikornbank PCL (NVDR) # | | | 1,866,713 | |
| | | | | | | | 2,168,404 | |
See Notes to Financial Statements
Number of
Shares | | | | Value | |
| Turkey: 1.8% | | | | |
| | 84,000 | | | BIM Birlesik Magazalar A.S. # | | $ | 1,927,170 | |
| | 1,520,000 | | | Turkiye Sinai Kalkinma Bankasi A.S. # | | | 1,241,252 | |
| | | | | | | | 3,168,422 | |
| United Arab Emirates: 0.4% | | | | |
| | 42,000 | | | Al Noor Hospitals Group Plc (GBP) | | | 734,601 | |
| United Kingdom: 4.4% | | | |
| | 756,000 | | | Afren Plc * # | | | 1,872,850 | |
| | 28,000 | | | Bank of Georgia Holdings Plc # | | | 1,125,985 | |
| | 59,000 | | | Hikma Pharmaceuticals Plc # | | | 1,693,405 | |
| | 1,235,312 | | | Hirco Plc * # § | | | 0 | |
| | 1,295,474 | | | Raven Russia Ltd. * # | | | 1,702,946 | |
| | 520,500 | | | Volga Gas Plc * | | | 1,104,572 | |
| | | | | | | | 7,499,758 | |
| United States: 1.1% | | | |
| | 583,900 | | | Samsonite International S.A. (HKD) # | | | 1,924,768 | |
Total Common Stocks
(Cost: $124,902,014) | | 152,066,730 | |
| | | | | | | | | |
| PREFERRED STOCKS: 3.1% | | |
| | | |
| Colombia: 1.0% | | | |
| | 110,000 | | | Banco Davivienda S.A. | | | 1,776,405 | |
| South Korea: 2.1% | | | |
| | 3,350 | | | Samsung Electronics Co. Ltd. # | | | 3,510,450 | |
| | | |
| | Total Preferred Stocks
(Cost: $3,954,944) | | 5,286,855 | |
Number of
Shares | | | | Value | |
| REAL ESTATE INVESTMENT TRUST: 0.8% | | | |
| | | |
Mexico: 0.8%
(Cost: $1,398,794) | | | |
| | 596,000 | | | TF Administradora Industrial, S. de R.L. de C.V. | | $ | 1,330,876 | |
| | | | | | | | | |
| WARRANTS: 2.5% | | | |
| | | | |
| Luxembourg: 2.5% | | | | |
| | 28,899 | | | Deutsche Bank AG, London Branch aXess Warrants (USD 0.00, expiring 12/01/14) * # (a) | | | 1,088,383 | |
| | 245,000 | | | Deutsche Bank AG, London Branch aXess Warrants (USD 0.00, expiring 09/27/16) * # (b) | | | 3,174,122 | |
Total Warrants
(Cost: $3,385,851) | | 4,262,505 | |
| | | | |
MONEY MARKET FUND: 3.6%
(Cost: $6,122,722) | | | |
| | 6,122,722 | | | AIM Treasury Portfolio - Institutional Class | | | 6,122,722 | |
Total Investments: 98.6%
(Cost: $139,764,325) | | 169,069,688 | |
| Other assets less liabilities: 1.4% | | | 2,453,687 | |
| NET ASSETS: 100.0% | | $ | 171,523,375 | |
| ADR | | American Depositary Receipt |
| GBP | | British Pound |
| GDR | | Global Depositary Receipt |
| HKD | | Hong Kong Dollar |
| NVDR | | Non-Voting Depositary Receipt |
| USD | | United States Dollar |
| (a) | | Issue price $21.53. The security is linked to the performance of Herfy Food Services Co. |
| (b) | | Issue price $8.53. The security is linked to the performance of The Saudi British Bank. |
| * | | Non-income producing |
| # | | Indicates a fair valued security which has not been valued utilizing an independent quote,but has been valued pursuant to guidelines established by the Board of Trustees. The aggregate value of fair valued securities is $122,070,872 which represents 71.2% of net assets. |
| § | | Illiquid Security — the aggregate value of illiquid securities is $56,813 which represents 0.0% of net assets. |
| Reg S | | Security was purchased pursuant to Regulation S under the Securities Act of 1933, which exempts from registration securities offered and sold outside of the United States. Such a security cannot be sold in the United States without either an effective registration statement filed pursuant to the Securities Act of 1933, or pursuant to an exemption from registration. |
Restricted securities held by the Fund as of June 30, 2014 are as follows:
| | | Acquisition | | Number of | | Acquisition | | | | % of |
| Security | | Date | | Shares | | Cost | | Value | | Net Assets |
| Queenco Leisure International Ltd. (GDR) | | 07/03/2007 | | 182,500 | | | $3,490,971 | | | $56,813 | | | 0.0% | |
| | | | | | | | | | | | | |
See Notes to Financial Statements
VAN ECK VIP EMERGING MARKETS FUND
SCHEDULE OF INVESTMENTS
(unaudited) (continued)
Summary of Investments
by Sector (unaudited) | | % of
Investments | | Value | |
| Consumer Discretionary | | | 19.6 | % | | $ | 33,142,819 | |
| Consumer Staples | | | 7.1 | | | | 12,047,498 | |
| Energy | | | 7.3 | | | | 12,273,791 | |
| Financials | | | 24.6 | | | | 41,631,075 | |
| Health Care | | | 7.1 | | | | 12,042,033 | |
| Industrials | | | 9.5 | | | | 15,952,923 | |
| Information Technology | | | 16.9 | | | | 28,569,042 | |
| Materials | | | 4.3 | | | | 7,287,785 | |
| Money Market Fund | | | 3.6 | | | | 6,122,722 | |
| | | | 100.0 | % | | $ | 169,069,688 | |
The summary of inputs used to value the Fund’s investments as of June 30, 2014 is as follows:
| | | | | | Level 2 | | Level 3 | | | |
| | | Level 1 | | | Significant | | Significant | | | |
| | | Quoted | | | Observable | | Unobservable | | | |
| | | Prices | | | Inputs | | Inputs | | Value | |
| Common Stocks | | | | | | | | | | | | | | | | | |
| Brazil | | $ | 14,828,806 | | | | $ | — | | | $ | — | | | $ | 14,828,806 | |
| China / Hong Kong | | | 7,908,654 | | | | | 34,032,684 | | | | — | | | | 41,941,338 | |
| India | | | 1,853,275 | | | | | 22,210,911 | | | | — | | | | 24,064,186 | |
| Indonesia | | | — | | | | | 1,720,839 | | | | — | | | | 1,720,839 | |
| Israel | | | — | | | | | — | | | | 56,813 | | | | 56,813 | |
| Malaysia | | | — | | | | | 1,919,182 | | | | — | | | | 1,919,182 | |
| Mexico | | | 857,606 | | | | | — | | | | — | | | | 857,606 | |
| Netherlands | | | 1,283,550 | | | | | — | | | | — | | | | 1,283,550 | |
| Nigeria | | | 597,562 | | | | | 2,115,522 | | | | — | | | | 2,713,084 | |
| Panama | | | 2,751,601 | | | | | — | | | | — | | | | 2,751,601 | |
| Peru | | | 2,922,836 | | | | | — | | | | — | | | | 2,922,836 | |
| Philippines | | | — | | | | | 3,138,788 | | | | — | | | | 3,138,788 | |
| Portugal | | | — | | | | | 739,869 | | | | — | | | | 739,869 | |
| Russia | | | 2,925,750 | | | | | 4,725,892 | | | | — | | | | 7,651,642 | |
| Singapore | | | — | | | | | 4,048,975 | | | | — | | | | 4,048,975 | |
| South Africa | | | — | | | | | 2,927,090 | | | | — | | | | 2,927,090 | |
| South Korea | | | — | | | | | 8,333,056 | | | | — | | | | 8,333,056 | |
| Switzerland | | | — | | | | | 4,040,218 | | | | — | | | | 4,040,218 | |
| Taiwan | | | — | | | | | 10,631,298 | | | | — | | | | 10,631,298 | |
| Thailand | | | — | | | | | 2,168,404 | | | | — | | | | 2,168,404 | |
| Turkey | | | — | | | | | 3,168,422 | | | | — | | | | 3,168,422 | |
| United Arab Emirates | | | 734,601 | | | | | — | | | | — | | | | 734,601 | |
| United Kingdom | | | 1,104,572 | | | | | 6,395,186 | | | | — | | | | 7,499,758 | |
| United States | | | — | | | | | 1,924,768 | | | | — | | | | 1,924,768 | |
| Preferred Stocks | | | | | | | | | | | | | | | | | |
| Colombia | | | 1,776,405 | | | | | — | | | | — | | | | 1,776,405 | |
| South Korea | | | — | | | | | 3,510,450 | | | | — | | | | 3,510,450 | |
| Real Estate Investment Trust * | | | 1,330,876 | | | | | — | | | | — | | | | 1,330,876 | |
| Warrants * | | | — | | | | | 4,262,505 | | | | — | | | | 4,262,505 | |
| Money Market Fund | | | 6,122,722 | | | | | — | | | | — | | | | 6,122,722 | |
| Total | | $ | 46,998,816 | | | | $ | 122,014,059 | | | $ | 56,813 | | | $ | 169,069,688 | |
| * | See Schedule of Investments for security type and geographic country breakouts. |
During the period ended June 30, 2014, transfers of securities from Level 1 to Level 2 were $1,060,842 and transfers from Level 2 to Level 1 were $4,582,741. These transfers resulted primarily from changes in certain foreign securities valuation methodologies between the last close of the securities’ primary market (Level 1) and valuation by the pricing service (Level 2), which takes into account market direction or events occurring before the Fund’s pricing time but after the last local close, as described in the Notes to Financial Statements.
The following table reconciles the valuation of the Fund’s Level 3 investment securities and related transactions during the period ended June 30, 2014:
| | | Common Stocks |
| | | Israel | | | United Kingdom |
| Balance as of December 31, 2013 | | $ | 87,243 | | | | $ | 235,156 | | |
| Realized gain (loss) | | | — | | | | | — | | |
| Net change in unrealized appreciation (depreciation) | | | (30,430 | ) | | | | (235,156 | ) | |
| Purchases | | | — | | | | | — | | |
| Sales | | | — | | | | | — | | |
| Transfers in and/or out of level 3 | | | — | | | | | — | | |
| Balance as of June 30, 2014 | | $ | 56,813 | | | | $ | 0 | | |
See Notes to Financial Statements
STATEMENT OF ASSETS AND LIABILITIES
June 30, 2014 (unaudited)
| Assets: | | | | |
| Investments, at value (Cost $139,764,325) | | $ | 169,069,688 | |
| Cash denominated in foreign currency, at value (Cost $3,280,120) | | | 3,298,744 | |
| Receivables: | | | | |
| Investments sold | | | 2,323,805 | |
| Shares of beneficial interest sold | | | 170,503 | |
| Dividends | | | 399,957 | |
| Prepaid expenses | | | 20 | |
| Total assets | | | 175,262,717 | |
| | | | | |
| Liabilities: | | | | |
| Payables: | | | | |
| Investments purchased | | | 3,032,104 | |
| Shares of beneficial interest redeemed | | | 135,707 | |
| Due to Adviser | | | 139,219 | |
| Deferred Trustee fees | | | 46,796 | |
| Accrued expenses | | | 385,516 | |
| Total liabilities | | | 3,739,342 | |
| NET ASSETS | | $ | 171,523,375 | |
| Shares of beneficial interest outstanding | | | 12,536,427 | |
| Net asset value, redemption and offering price per share | | | $13.68 | |
| | | | | |
| Net Assets consist of: | | | | |
| Aggregate paid in capital | | $ | 137,839,410 | |
| Net unrealized appreciation | | | 29,231,014 | |
| Accumulated net investment loss | | | (193,689 | ) |
| Accumulated net realized gain | | | 4,646,640 | |
| | | $ | 171,523,375 | |
See Notes to Financial Statements
VAN ECK VIP EMERGING MARKETS FUND
STATEMENT OF OPERATIONS
For the Six Months Ended June 30, 2014 (unaudited)
| Income: | | | | | | | | |
| Dividends (net of foreign taxes withheld of $107,256) | | | | | | $ | 1,740,115 | |
| | | | | | | | | |
| Expenses: | | | | | | | | |
| Management fees | | | 807,524 | | | | | |
| Transfer agent fees | | | 16,436 | | | | | |
| Custodian fees | | | 111,973 | | | | | |
| Professional fees | | | 22,242 | | | | | |
| Reports to shareholders | | | 31,804 | | | | | |
| Trustees’ fees and expenses | | | 1,606 | | | | | |
| Other | | | 1,375 | | | | | |
| Total expenses | | | 992,960 | | | | | |
| Net investment income | | | | | | | 747,155 | |
| | | | | | | | | |
| Net realized gain (loss) on: | | | | | | | | |
| Investments (net of foreign taxes of $74,741) | | | | | | | 4,805,541 | |
| Foreign currency transactions and foreign denominated assets and liabilities | | | | | | | (42,651 | ) |
| Net realized gain | | | | | | | 4,762,890 | |
| | | | | | | | | |
| Net change in unrealized appreciation (depreciation) on: | | | | | | | | |
| Investments (net of foreign taxes of $93,378) | | | | | | | 2,775,135 | |
| Foreign currency transactions and foreign denominated assets and liabilities | | | | | | | 5,892 | |
| Net change in unrealized appreciation (depreciation) | | | | | | | 2,781,027 | |
| Net Increase in Net Assets Resulting from Operations | | | | | | $ | 8,291,072 | |
See Notes to Financial Statements
STATEMENT OF CHANGES IN NET ASSETS
| | | Six Months
Ended
June 30, 2014 | | | Year Ended
December 31,
2013 | |
| | | (unaudited) | | | | |
| Operations: | | | | | | | | |
| Net investment income | | $ | 747,155 | | | $ | 939,446 | |
| Net realized gain | | | 4,762,890 | | | | 22,931,091 | |
| Net change in unrealized appreciation (depreciation) | | | 2,781,027 | | | | (4,709,605 | ) |
| Net increase in net assets resulting from operations | | | 8,291,072 | | | | 19,160,932 | |
| | | | | | | | | |
| Dividends and Distributions to shareholders from: | | | | | | | | |
| Net investment income | | | (843,441 | ) | | | (2,678,236 | ) |
| Net realized gains | | | (19,254,876 | ) | | | — | |
| Total dividends and distributions | | | (20,098,317 | ) | | | (2,678,236 | ) |
| | | | | | | | | |
| Share transactions*: | | | | | | | | |
| Proceeds from sale of shares | | | 14,071,742 | | | | 30,451,797 | |
| Reinvestment of dividends and distributions | | | 20,098,317 | | | | 2,678,236 | |
| Cost of shares redeemed | | | (18,771,617 | ) | | | (53,136,863 | ) |
| Net increase (decrease) in net assets resulting from share transactions | | | 15,398,442 | | | | (20,006,830 | ) |
| Total increase (decrease) in net assets | | | 3,591,197 | | | | (3,524,134 | ) |
| | | | | | | | | |
| Net Assets: | | | | | | | | |
| Beginning of period | | | 167,932,178 | | | | 171,456,312 | |
| End of period (including accumulated net investment loss of ($193,689) and ($97,403), respectively) | | $ | 171,523,375 | | | $ | 167,932,178 | |
| | | | | | | | | |
* Shares of beneficial interest issued, reinvested and redeemed
(unlimited number of $.001 par value shares authorized): | | | | | | | | |
| Shares sold | | | 1,066,366 | | | | 2,157,722 | |
| Shares reinvested | | | 1,618,222 | | | | 190,622 | |
| Shares redeemed | | | (1,415,466 | ) | | | (3,777,072 | ) |
| Net increase (decrease) | | | 1,269,122 | | | | (1,428,728 | ) |
See Notes to Financial Statements
VAN ECK VIP EMERGING MARKETS FUND
FINANCIAL HIGHLIGHTS
For a share outstanding throughout each period:
| | | For the Six
Months Ended | | Year Ended December 31, | |
| | | June 30, 2014 | | 2013 | | | 2012 | | | 2011 | | | 2010 | | | 2009 | |
| | | (unaudited) | | | | | | | | | | | | | | | |
| Net asset value, beginning of period | | | | $14.90 | | | | $13.50 | | | | $10.40 | | | | $14.14 | | | | $11.22 | | | | $5.89 | |
| Income from investment operations: | | | | | | | | | | | | | | | | | | | | | | | | | |
| Net investment income | | | | 0.07 | | | | 0.07 | | | | 0.07 | | | | 0.05 | (b) | | | 0.01 | | | | 0.04 | |
| Net realized and unrealized gain (loss) on investments | | | | 0.53 | | | | 1.54 | | | | 3.03 | | | | (3.66 | ) | | | 2.93 | | | | 5.83 | |
| Payment by the Adviser | | | | — | | | | — | | | | — | | | | — | | | | — | | | | 0.04 | (c) |
| Total from investment operations | | | | 0.60 | | | | 1.61 | | | | 3.10 | | | | (3.61 | ) | | | 2.94 | | | | 5.91 | |
| Less dividends and distributions from: | | | | | | | | | | | | | | | | | | | | | | | | | |
| Net investment income | | | | (0.08 | ) | | | (0.21 | ) | | | — | | | | (0.13 | ) | | | (0.07 | ) | | | (0.01 | ) |
| Net realized gains | | | | (1.74 | ) | | | — | | | | — | | | | — | | | | — | | | | (0.57 | ) |
| Total dividends and distributions | | | | (1.82 | ) | | | (0.21 | ) | | | — | | | | (0.13 | ) | | | (0.07 | ) | | | (0.58 | ) |
| Settlement payments from unaffiliated third parties | | | | — | | | | — | | | | — | | | | — | | | | 0.05 | (d) | | | — | |
| Redemption fees | | | | — | | | | — | | | | — | (e) | | | — | (e) | | | — | (e) | | | — | (e) |
| Net asset value, end of period | | | | $13.68 | | | | $14.90 | | | | $13.50 | | | | $10.40 | | | | $14.14 | | | | $11.22 | |
| Total return (a) | | | | 5.20 | %(g) | | | 12.02 | % | | | 29.81 | % | | | (25.74 | )% | | | 26.84 | %(d) | | | 113.17 | %(c) |
| | | | | | | | | | | | | | | | | | | | | | | | | | |
| | | | | | | | | | | | | | | | | | | | | | | | | | |
| Ratios/Supplemental Data | | | | | | | | | | | | | | | | | | | | | | | | | |
| Net Assets, end of period (000’s) | | $171,523 | | | $167,932 | | | $171,456 | | | $108,286 | | | $176,522 | | | $166,991 | |
| Ratio of gross expenses to average net assets | | | | 1.23 | %(f) | | | 1.23 | % | | | 1.23 | % | | | 1.26 | % | | | 1.28 | % | | | 1.22 | % |
| Ratio of net expenses to average net assets | | | | 1.23 | %(f) | | | 1.23 | % | | | 1.23 | % | | | 1.26 | % | | | 1.28 | % | | | 1.22 | % |
| Ratio of net expenses, excluding interest expense, to average net assets | | | | 1.23 | %(f) | | | 1.22 | % | | | 1.23 | % | | | 1.26 | % | | | 1.28 | % | | | 1.21 | % |
| Ratio of net investment income to average net assets | | | | 0.93 | %(f) | | | 0.56 | % | | | 0.55 | % | | | 0.36 | % | | | 0.17 | % | | | 0.49 | % |
| Portfolio turnover rate | | | | 38 | %(g) | | | 83 | % | | | 93 | % | | | 95 | % | | | 96 | % | | | 68 | % |
| (a) | Total return is calculated assuming an initial investment made at the net asset value at the beginning of period, reinvestment of any dividends and distributions at net asset value on the dividend/distributions payment date and a redemption at the net asset value on the last day of the period. The return does not reflect the deduction of taxes that a shareholder would pay on Fund dividends/distributions or the redemption of Fund shares. |
| (b) | Calculated based upon average shares outstanding |
| (c) | For the year ended December 31, 2009, 0.70% of the total return, representing $0.04 per share, consisted of a reimbursement by the Adviser for an investment loss. |
| (d) | For the year ended December 31, 2010, the Fund received settlement payments from unaffiliated third parties which represented 0.46% of the Initial Class Shares total return. |
| (e) | Amount represents less than $0.005 per share |
| (f) | Annualized |
| (g) | Not annualized |
See Notes to Financial Statements
NOTES TO FINANCIAL STATEMENTS
June 30, 2014 (unaudited)
Note 1—Fund Organization—Van Eck VIP Trust (the “Trust”) is registered under the Investment Company Act of 1940, as amended, as an open-end management investment company. The Trust was organized as a Massachusetts business trust on January 7, 1987. The Van Eck VIP Emerging Markets Fund (the “Fund”) is a non-diversified series of the Trust and seeks long-term capital appreciation by investing primarily in equity securities in emerging markets around the world. The Fund currently offers a single class of shares: Initial Class Shares.
Note 2—Significant Accounting Policies—The preparation of financial statements in conformity with U.S. generally accepted accounting principles (“GAAP”) requires management to make estimates and assumptions that affect the reported amounts and disclosures in the financial statements. Actual results could differ from those estimates.
The Fund is an investment company and is following accounting and reporting requirements of Accounting Standard Codification (“ASC”) 946 Financial Services - Investment Companies.
The following is a summary of significant accounting policies followed by the Fund.
| A. | Security Valuation—The Fund values its investments in securities and other assets and liabilities carried at fair value daily. Fair value is the price that would be received to sell an asset or paid to transfer a liability in an orderly transaction between market participants on the measurement date. Securities traded on national exchanges or traded on the NASDAQ National Market System are valued at the last sales price as reported at the close of each business day. Securities traded on the NASDAQ Stock Market are valued at the NASDAQ official closing price. Over-the-counter securities not included in the NASDAQ National Market System and listed securities for which no sale was reported are valued at the mean of the bid and ask prices. To the extent these securities are actively traded they are categorized as Level 1 in the fair value hierarchy (as described below). Certain foreign securities, whose values may be affected by market direction or events occurring before the Fund’s pricing time (4:00 p.m. Eastern Time) but after the last close of the securities’ primary market, are fair valued using a pricing service and are categorized as Level 2 in the fair value hierarchy. The pricing service considers the correlation of the trading patterns of the foreign security to intraday trading in the U.S. markets, based on indices of domestic securities and other appropriate indicators such as prices of relevant ADR’s and futures contracts. The Fund may also fair value securities in other situations, such as, when a particular foreign market is closed but the Fund is open. Short-term obligations with more than sixty days remaining to maturity are valued at market value. Short-term obligations with sixty days or less to maturity are valued at amortized cost, which with accrued interest approximates fair value. Money market fund investments are valued at net asset value and are categorized as Level 1 in the fair value hierarchy. Forward foreign currency contracts are valued at the spot currency rate plus an amount (“points”), which reflects the differences in interest rates between the U.S. and foreign markets. Securities for which quotations are not available are stated at fair value as determined by the Pricing Committee of Van Eck Associates Corporation (the “Adviser”) appointed by the Board of Trustees. The Pricing Committee provides oversight of the Fund’s valuation policies and procedures, which are approved by the Fund’s Board of Trustees. Among other things, these procedures allow the Fund to utilize independent pricing services, quotations from securities dealers, and other market sources to determine fair value. The Pricing Committee convenes regularly to review the fair value of financial instruments for which market prices are not readily available. The Pricing Committee employs various methods for calibrating the valuation approaches utilized to determine fair value, including a regular review of key inputs and assumptions, transactional back-testing and disposition analysis. |
| | |
| | Certain factors such as economic conditions, political events, market trends, the nature of and duration of any restrictions on disposition, trading in similar securities of the issuer or comparable issuers and other security specific information are used to determine the fair value for these securities. Depending on the relative significance of valuation inputs, these securities may be classified either as Level 2 or Level 3 in the fair value hierarchy. The price which the Fund may realize upon sale of an investment may differ materially from the value presented in the Schedule of Investments. |
| | |
| | The Fund utilizes various methods to measure the fair value of its investments on a recurring basis which includes a hierarchy that prioritizes inputs to valuation methods used to measure fair value. The fair value hierarchy gives highest priority to unadjusted quoted prices in active markets for identical assets and liabilities (Level 1 measurements) and the lowest priority to unobservable inputs (Level 3 measurements). The inputs or methodologies used for valuing securities are not necessarily an indication of the risk associated with investing in those securities. The transfers between levels of the fair value hierarchy assume the financial instruments were transferred at the beginning of the reporting period. The three levels of the fair value hierarchy are described below: |
| | Level 1 – | Quoted prices in active markets for identical securities. |
| | | |
| | Level 2 – | Significant observable inputs (including quoted prices for similar securities, interest rates, prepayment speeds, credit risk, etc.). |
| | | |
| | Level 3 – | Significant unobservable inputs (including the Fund’s own assumptions in determining the fair value of investments). |
VAN ECK VIP EMERGING MARKETS FUND
NOTES TO FINANCIAL STATEMENTS
(unaudited) (continued)
| | A summary of the inputs, the levels used to value the Fund’s investments, and transfers between levels are located in the Schedule of Investments. Additionally, tables that reconcile the valuation of the Fund’s Level 3 investments and that present additional information about valuation methodologies and unobservable inputs, if applicable, are located in the Schedule of Investments. |
| B. | Federal Income Taxes—It is the Fund’s policy to comply with the provisions of the Internal Revenue Code applicable to regulated investment companies and to distribute all of its taxable income to its shareholders. Therefore, no federal income tax provision is required. |
| | |
| C. | Currency Translation—Assets and liabilities denominated in foreign currencies and commitments under foreign currency contracts are translated into U.S. dollars at the closing prices of such currencies each business day. Purchases and sales of investments are translated at the exchange rates prevailing when such investments are acquired or sold. Income and expenses are translated at the exchange rates prevailing when accrued. The portion of realized and unrealized gains and losses on investments that result from fluctuations in foreign currency exchange rates is not separately disclosed. Recognized gains or losses attributable to foreign currency fluctuations on foreign currency denominated assets, other than investments, and liabilities are recorded as net realized gain (loss) on foreign currency transactions and foreign denominated assets and liabilities in the Statement of Operations. |
| | |
| D. | Dividends and Distributions to Shareholders—Dividends to shareholders from net investment income and distributions from net realized capital gains, if any, are declared and paid annually. Income dividends and capital gain distributions are determined in accordance with U.S. income tax regulations, which may differ from such amounts determined in accordance with GAAP. |
| | |
| E. | Restricted Securities—The Fund may invest in securities that are subject to legal or contractual restrictions on resale. These securities generally may be resold in transactions exempt from registration or to the public if the securities are registered. Disposal of these securities may involve time-consuming negotiations and expense, and prompt sale at an acceptable price may be difficult. Information regarding restricted securities is included at the end of the Fund’s Schedule of Investments. |
| | |
| F. | Warrants—The Fund may invest in warrants whose values are linked to indices or underlying instruments. The Fund may use these warrants to gain exposure to markets that might be difficult to invest in through conventional securities. Warrants may be more volatile than their linked indices or underlying instruments. Potential losses are limited to the amount of the original investment. The Fund has invested in aXess warrants that are linked to the shares of an underlying security and are issued by Deutsche Bank AG London. The warrants are obligations of the issuer and are not secured by any collateral. The warrant may be exercised by the Fund during the exercise period. If the warrants have not been exercised on the last day of the exercise period, the warrants will be automatically exercised on that day. Warrants held at June 30, 2014 are reflected in the Schedule of Investments. |
| | |
| G. | Use of Derivative Instruments—The Fund may make investments in derivative instruments, including, but not limited to, options, futures, swaps and other derivatives relating to foreign currency transactions. A derivative is an instrument whose value is derived from underlying assets, indices, reference rates or a combination of these factors. Derivative instruments may be privately negotiated contracts (often referred to as over-the-counter (“OTC”) derivatives) or they may be listed and traded on an exchange. Derivative contracts may involve future commitments to purchase or sell financial instruments or commodities at specified terms on a specified date, or to exchange interest payment streams or currencies based on a notional or contractual amount. Derivative instruments may involve a high degree of financial risk. The use of derivative instruments also involves the risk of loss if the investment adviser is incorrect in its expectation of the timing or level of fluctuations in securities prices, interest rates or currency prices. Investments in derivative instruments also include the risk of default by the counterparty, the risk that the investment may not be liquid and the risk that a small movement in the price of the underlying security or benchmark may result in a disproportionately large movement, unfavorable or favorable, in the price of the derivative instrument. GAAP requires enhanced disclosures about the Fund’s derivatives instruments and hedging activities. The Fund held no derivative instruments during the period ended June 30, 2014. |
| | |
| | Forward Foreign Currency Contracts—The Fund is subject to foreign currency risk in the normal course of pursuing its investment objectives. The Fund may buy and sell forward foreign currency contracts to settle purchases and sales of foreign denominated securities, gain currency exposure or to hedge foreign denominated assets. Realized gains and losses from forward foreign currency contracts, if any, are included in realized gain (loss) on foreign currency transactions and foreign denominated assets and liabilities in the Statement of Operations. The Fund may incur additional risk from investments in forward foreign currency contracts if the counterparty is unable to fulfill its obligation or there are unanticipated movements of the foreign currency relative to the U.S. dollar. The Fund held no forward foreign currency contracts during the period ended June 30, 2014. |
| H. | Other—Security transactions are accounted for on trade date. Dividend income is recorded on the ex-dividend date except that certain dividends from foreign securities are recognized upon notification of the ex-dividend date. Realized gains and losses are calculated on the specific identified cost basis. Interest income, including amortization of premiums and discounts, is accrued as earned. The Fund received regulatory settlement payments during 2010 from unaffiliated third parties which is included in the Financial Highlights. The Fund received redemption fees from Class R1 Shares prior to its closing on April 30, 2012 and is reflected in the Financial Highlights. |
| | |
| | In the normal course of business, the Fund enters into contracts that contain a variety of general indemnifications. The Fund’s maximum exposure under these agreements is unknown as this would involve future claims that may be made against the Fund that have not yet occurred. However, the Adviser believes the risk of loss under these arrangements to be remote. |
Note 3—Investment Management and Other Agreements—The Adviser is the investment adviser to the Fund. The Adviser receives a management fee, calculated daily and payable monthly based on an annual rate of 1.00% of the Fund’s average daily net assets. The Adviser has agreed, at least until May 1, 2015, to waive management fees and/or assume expenses (excluding acquired fund fees and expenses, interest expense, trading expenses, dividends and interest payments on securities sold short, taxes, and extraordinary expenses) from exceeding 1.50% for the Fund’s average daily net assets. For the period ended June 30, 2014, no management fees were waived nor were any expenses assumed by the Adviser. Certain of the officers and trustees of the Trust are officers, directors or stockholders of the Adviser and Van Eck Securities Corporation, the distributor.
Note 4—Investments—For the period ended June 30, 2014, the cost of purchases and proceeds from sales of investments, excluding U.S. government securities and short-term obligations, aggregated $58,423,046 and $62,888,772, respectively.
Note 5—Income Taxes—For Federal income tax purposes, the identified cost of investments owned at June 30, 2014 was $140,768,038 and net unrealized appreciation aggregated $28,301,650 of which $36,965,979 related to appreciated securities and $8,664,329 related to depreciated securities.
The tax character of dividends and distributions paid to shareholders during the year ended December 31, 2013 were as follows:
| | | Year Ended
December 31, 2013 |
| Ordinary income | | | $2,678,236 | |
During the year ended December 31, 2013, the Fund utilized $21,487 of capital loss carryforwards.
The Fund recognizes the tax benefits of uncertain tax positions only where the position is “more-likely-than-not” to be sustained assuming examination by applicable tax authorities. Management has analyzed the Fund’s tax positions, and has concluded that no liability for unrecognized tax benefits should be recorded related to uncertain tax positions taken on return filings for open tax years (tax years ended December 31, 2010-2013), or expected to be taken in the Fund’s current tax year. The Fund does not have exposure for additional years that might still be open in certain foreign jurisdictions. Therefore, no provision for income tax is required in the Fund’s financial statements. However, the Fund is subject to foreign taxes on the appreciation in value of certain investments. The Fund provides for such taxes on both realized and unrealized appreciation.
The Fund recognizes interest and penalties, if any, related to uncertain tax positions as income tax expense in the Statement of Operations. During the period ended June 30, 2014, the Fund did not incur any interest or penalties.
Note 6—Concentration of Risk—The Fund may purchase securities on foreign exchanges. Securities of foreign issuers involve special risks and considerations not typically associated with investing in U.S. issuers. These risks include devaluation of currencies, less reliable information about issuers, different securities transaction clearance and settlement practices, and future adverse political and economic developments. These risks are heightened for investments in emerging market countries. Moreover, securities of many foreign issuers and their markets may be less liquid and their prices more volatile than those of comparable U.S. issuers.
As a result of recent events involving Ukraine and the Russian Federation, the United States and the European Union have imposed sanctions on certain Russian individuals and companies. These sanctions do not currently impact the Fund. Additional economic sanctions may be imposed or other actions may be taken that may adversely affect the value and liquidity of the Russian-related issuers’ held by the Fund.
At June 30, 2014, the aggregate shareholder accounts of three insurance companies own approximately 71%, 11%, and 5% of the Initial Class Shares.
Note 7—Trustee Deferred Compensation Plan—The Trust has a Deferred Compensation Plan (the “Deferred Plan”) for Trustees under which the Trustees can elect to defer receipt of their trustee fees until retirement, disability or termination from the Board of Trustees. The fees otherwise payable to the participating Trustees are deemed invested in shares of eligible Funds of the Trust and the Van Eck Funds (another registered investment company managed by the Adviser) as directed by the Trustees.
VAN ECK VIP EMERGING MARKETS FUND
NOTES TO FINANCIAL STATEMENTS
(unaudited) (continued)
The expense for the Deferred Plan is included in “Trustees’ fees and expenses” in the Statement of Operations. The liability for the Deferred Plan is shown as “Deferred Trustee fees” in the Statement of Assets and Liabilities.
Note 8—Bank Line of Credit—The Trust may participate with Van Eck Funds (collectively the “VE/VIP Funds”) in a $30 million committed credit facility (the “Facility”) to be utilized for temporary financing until the settlement of sales or purchases of portfolio securities, the repurchase or redemption of shares of the Fund and other temporary or emergency purposes. The VE/VIP Funds have agreed to pay commitment fees, pro rata, based on the unused but available balance. Interest is charged to the VE/VIP Funds at rates based on prevailing market rates in effect at the time of borrowings. During the period ended June 30, 2014, the Fund had no borrowings under the Facility.
Note 9—Securities Lending—To generate additional income, the Fund may lend its securities pursuant to a securities lending agreement with State Street Bank & Trust Co., the securities lending agent and also the Fund’s custodian. During the period ended June 30, 2014, the Fund had no securities lending activity.
Note 10—Subsequent Event Review—The Fund has evaluated subsequent events and transactions for potential recognition or disclosure through the date the financial statements were issued.
VAN ECK VIP EMERGING MARKETS FUND
APPROVAL OF ADVISORY AGREEMENT
June 30, 2014 (unaudited)
The Investment Company Act of 1940, as amended (the “1940 Act”), provides, in substance, that an investment advisory agreement between a fund and its investment adviser may be entered into only if it is approved, and may continue in effect from year to year after an initial two-year period only if its continuance is approved, at least annually by the fund’s board of trustees, including by a vote of a majority of the trustees who are not “interested persons” of the fund as defined in the 1940 Act (the “Independent Trustees”), cast in person at a meeting called for the purpose of considering such approval. On June 25, 2014, the Board of Trustees (the “Board”) of Van Eck VIP Trust (the “Trust”), which is comprised exclusively of Independent Trustees, voted to approve the continuation of the existing advisory agreement (the “Advisory Agreement”) between the Van Eck VIP Emerging Markets Fund (the “Fund”) and its investment adviser, Van Eck Associates Corporation (together with its affiliated companies, the “Adviser”). Information regarding the material factors considered and related conclusions reached by the Board in approving the continuation of the Advisory Agreement is set forth below.
In considering the continuation of the Advisory Agreement, the Board reviewed and considered information that had been provided by the Adviser throughout the year at regular and special meetings of the Board and its committees, including information requested by the Board and furnished by the Adviser for meetings of the Board held on June 5, 2014 and June 24 and 25, 2014 specifically for the purpose of considering the continuation of the Advisory Agreement. The written and oral reports provided to the Board included, among other things, the following:
| ■ | Information about the overall organization of the Adviser and the Adviser’s short-term and long-term business plans with respect to its mutual fund operations and other lines of business; |
| | |
| ■ | The consolidated financial statements of the Adviser for the past three fiscal years; |
| | |
| ■ | A copy of the Advisory Agreement and descriptions of the services provided by the Adviser thereunder; |
| | |
| ■ | Information regarding the qualifications, education and experience of the investment professionals responsible for portfolio management, investment research and trading activities for the Fund, the structure of their compensation and the resources available to support these activities; |
| | |
| ■ | A report prepared by an independent consultant comparing the Fund’s investment performance (including, where relevant, total returns, standard deviations, Sharpe ratios, information ratios, beta and alpha) with respect to a representative class of shares of the Fund for the one-, three-, five- and ten-year periods ended March 31, 2014 with those of (i) a universe of mutual funds selected by the independent consultant with similar portfolio holding characteristics, share class attributes and other operational characteristics as the Fund (the “Category”), (ii) a sub-group of funds selected from the Category by the independent consultant further limited to approximate more closely the Fund’s investment style, expense structure and asset size (the “Peer Group”) and (iii) an appropriate benchmark index; |
| | |
| ■ | A report prepared by an independent consultant comparing the advisory fees and other expenses of a representative class of shares of the Fund during its fiscal year ended December 31, 2013 with a similar share class of each fund in the (i) Category and (ii) Peer Group; |
| | |
| ■ | An analysis of the profitability of the Adviser with respect to its services for the Fund and the Van Eck complex of mutual funds as a whole (the “Van Eck Complex”); |
| | |
| ■ | Information regarding other investment products and services offered by the Adviser involving investment objectives and strategies similar to the Fund (“Comparable Products”), including the fees charged by the Adviser for managing the Comparable Products, a description of material differences and similarities in the services provided by the Adviser for the Fund and the Comparable Products, the size of the Comparable Products, the performance of the Comparable Products and identity of the individuals responsible for managing the Comparable Products; |
| | |
| ■ | Information concerning the Adviser’s compliance program, the resources devoted to compliance efforts undertaken by the Adviser on behalf of the Fund, and reports regarding a variety of compliance-related issues; |
| | |
| ■ | Information with respect to the Adviser’s brokerage practices, including the Adviser’s processes for monitoring best execution of portfolio transactions and the benefits received by the Adviser from research acquired with soft dollars; |
| | |
| ■ | Information regarding the procedures used by the Adviser in monitoring the valuation of portfolio securities, including the methodologies used in making fair value determinations; |
| | |
| ■ | Information regarding the Adviser’s policies and practices with respect to personal investing by the Adviser and its employees, including reports regarding the administration of the Adviser’s code of ethics and the Adviser’s policy with respect to investments in the Fund by the Adviser’s investment personnel; |
VAN ECK VIP EMERGING MARKETS FUND
APPROVAL OF ADVISORY AGREEMENT
(unaudited) (continued)
| ■ | Descriptions of other administrative and other non-investment management services provided by the Adviser for the Fund, including the Adviser’s activities in managing relationships with the Fund’s custodian, transfer agent and other service providers; and |
| | |
| ■ | Other information provided by the Adviser in its response to a comprehensive questionnaire prepared by independent legal counsel on behalf of the Independent Trustees. |
In determining whether to approve the continuation of the Advisory Agreement, the Board considered, among other things, the following: (1) the nature, quality, extent and cost of the investment management, administrative and other non-investment management services provided by the Adviser; (2) the nature, quality and extent of the services performed by the Adviser in interfacing with, and monitoring the services performed by, third parties, such as the Fund’s custodian, transfer agent, sub-accounting agent and independent auditors, and the Adviser’s commitment and efforts to review the quality and pricing of third party service providers to the Fund with a view to reducing non-management expenses of the Fund; (3) the terms of the Advisory Agreement and the services performed thereunder; (4) the willingness of the Adviser to reduce the overall expenses of the Fund from time to time, if necessary or appropriate, by means of waiving a portion of its fees or paying expenses of the Fund; (5) the quality of the services, procedures and processes used to determine the value of the Fund’s assets and the actions taken to monitor and test the effectiveness of such services, procedures and processes; (6) the ongoing efforts of, and resources devoted by, the Adviser with respect to the development and implementation of a comprehensive compliance program; (7) the responsiveness of the Adviser to inquiries from, and examinations by, regulatory authorities, including the Securities and Exchange Commission; (8) the resources committed by the Adviser in recent periods to information technology; and (9) the ability of the Adviser to attract and retain quality professional personnel to perform investment advisory and administrative services for the Fund.
The Board considered the fact that the Adviser is managing other investment products, including exchange-traded funds, hedge funds, separate accounts and UCITs, one or more of which may invest in the same financial markets and may be managed by the same investment professionals according to a similar investment objective and/or strategy as the Fund. The Board concluded that the management of these products contributes to the Adviser’s financial stability and is helpful to the Adviser in attracting and retaining quality portfolio management personnel for the Fund. In addition, the Board concluded that the Adviser has established appropriate procedures to monitor conflicts of interest involving the management of the Fund and the other products and for resolving any such conflicts of interest in a fair and equitable manner.
The performance data and the advisory fee and expense ratio data described below for the Fund is based on data for a representative class of shares of the Fund. The performance data is for periods on an annualized basis ended March 31, 2014, and the advisory fee and expense ratio data is as of the Fund’s fiscal year end of December 31, 2013.
Performance. The Board noted, based on a review of comparative annualized total returns, that the Fund had outperformed its Category and Peer Group medians, as well as its benchmark index, over the one-, three-, five- and ten-year periods. The Board concluded that the performance of the Fund was satisfactory.
Fees and Expenses. The Board noted that the fees payable for advisory services were lower than the median advisory fees of its Category and Peer Group and that the Fund’s total expense ratio, net of waivers or reimbursements, was lower than the median expense ratios of its Category and Peer Group. The Board also noted that the Adviser has agreed to waive fees or pay expenses of the Fund through April 2015 to the extent necessary to prevent the expense ratio of the Fund from exceeding a specified maximum amount. On the basis of the foregoing, and in light of the nature, extent and quality of the services provided by the Adviser, the Board concluded that the advisory fee charged to the Fund is reasonable.
Profitability and Economies of Scale. The Board considered the profits, if any, realized by the Adviser from managing the Fund and other mutual funds in the Van Eck Complex and the methodology used to determine such profits, including the results of an analysis of the methodology performed by an independent consultant in 2013 on behalf of the Board and its independent counsel. The Board noted that the levels of profitability reported on a fund-by-fund basis varied widely depending on such factors as the size, type of fund and operating history. The Board further noted that, in evaluating the reasonableness of the Adviser’s profits from managing any particular Fund, it would be appropriate to consider the size of the Adviser relative to other firms in the investment management industry and the impact on the Adviser’s profits of the volatility of the markets in which the Funds invest and the volatility of cash flows into and out of the Funds through various market cycles. Based on its review of the foregoing information, and in light of the nature, extent and quality of the services provided by the Adviser, the Board concluded that the profits realized by the Adviser, if any, are not excessive. In this regard, the Board also considered the extent to which the Adviser may realize economies of scale as the Fund grows and whether the Fund’s fee schedule reflects these economies of scale for the benefit of shareholders. The Board concluded
that, with respect to the Fund, the economies of scale being realized, if any, are currently being shared by the Adviser and the Fund, and that adding breakpoints would not be warranted at this time for the Fund.
Conclusion. In determining the material factors to be considered in evaluating the Advisory Agreement and the weight to be given to such factors, the members of the Board relied upon the advice of independent legal counsel and their own business judgment. The Board did not consider any single factor as controlling in determining whether to approve the continuation of the Advisory Agreement and each member of the Board may have placed varying emphasis on particular factors considered in reaching a conclusion. Moreover, this summary description does not necessarily identify all of the factors considered or conclusions reached by the Board. Based on its consideration of the foregoing factors and conclusions, and such other factors and conclusions as it deemed relevant, the Board (comprised exclusively of Independent Trustees) concluded that the continuation of the Advisory Agreement is in the interests of shareholders and, accordingly, the Board approved the continuation of the Advisory Agreement for an additional one-year period.
This report must be preceded or accompanied by a Van Eck VIP (the “Trust”) Prospectus, which includes more complete information. An investor should consider the investment objective, risks, and charges and expenses of the Fund carefully before investing. The prospectus contains this and other information about the investment company. Please read the prospectus carefully before investing.
Additional information about the Trust’s Board of Trustees/Officers and a description of the policies and procedures the Trust uses to determine how to vote proxies relating to portfolio securities are provided in the Statement of Additional Information. The Statement of Information and information regarding how the Trust voted proxies relating to portfolio securities during the most recent twelve month period ending June 30 is available, without charge, by calling 800.826.2333, or by visiting vaneck.com, or on the Securities and Exchange Commission’s website at http://www.sec.gov.
The Trust files its complete schedule of portfolio holdings with the Securities and Exchange Commission for the first and third quarters of each fiscal year on Form N-Q. The Trust’s Form N-Qs are available on the Commission’s website at http://www.sec.gov and may be reviewed and copied at the Commission’s Public Reference Room in Washington, D.C. Information on the operation of the Public Reference Room may be obtained by calling 202.942.8090. The Fund’s complete schedule of portfolio holdings is also available by calling 800.826.2333 or by visiting vaneck.com.
 |
| Investment Adviser: | Van Eck Associates Corporation |
| Distributor: | Van Eck Securities Corporation |
| | 335 Madison Avenue, New York, NY 10017 |
| | vaneck.com |
| Account Assistance: | 800.544.4653 |
| | | | | SEMI-ANNUAL REPORT |
| | | | | JUNE 30, 2014 |
| | | | | (unaudited) |
| | |  |
| | | | | |
| | | | | |
| | | Van Eck VIP Trust Van Eck VIP Unconstrained Emerging Markets Bond Fund |
| | | | | |
| | | | | |
| | | | | |
| | | | | |
| | | | | |
| | | |  |
| | | | | |
Van Eck VIP Unconstrained Emerging Markets Bond Fund
The information contained in this shareholder letter represents the personal opinions of the investment team members and may differ from those of other portfolio managers or of the firm as a whole. This information is not intended to be a forecast of future events, a guarantee of future results or investment advice. Also, unless otherwise specifically noted, any discussion of the Fund’s holdings and the Fund’s performance, and the views of the investment team members are as of June 30, 2014, and are subject to change.
VAN ECK VIP UNCONSTRAINED EMERGING MARKETS BOND FUND
(unaudited)
Dear Shareholder:
The Initial Class shares of the Van Eck VIP Unconstrained Emerging Markets Bond Fund (the “Fund”) gained 9.96% for the six months ended June 30, 2014. The Fund outperformed its two benchmark indices, the J.P. Morgan Government Bond — Emerging Markets Global Diversified (GBI-EM) Index1 (representing local currency2) and the J.P. Morgan Emerging Markets Bond Global Diversified (EMBI) Index3 (representing hard currency4), which rose 5.99% and 8.66%, respectively, for the same period.
Even though most of the outperformance occurred in the second quarter, the Fund performed competitively in the first quarter. In that quarter it gained 3.94%, while the GBI-EM (representing local currency) gained 1.90% and the EMBI (representing hard currency) gained 3.73% for the same period. The Fund’s mandate is flexible in nature, and was among the first to blend hard and local currencies.
Overview
Inflows to emerging markets debt funds improved in the first half of 2014 on the back of ample global liquidity and fundamental improvements in some emerging markets that resulted in several rating upgrades. However, there is uncertainty about the persistence of these trends, as the U.S. continues to move toward a higher interest rate environment which is likely to put pressure on emerging markets debt. Moreover, a number of well-known emerging markets countries continue to face weak economic outcomes and political turmoil.
We would, however, regard whatever upcoming turmoil may occur as a setback, not a crisis. It is telling that a number of countries responded to external pressures in an orthodox fashion by hiking interest rates and allowing currencies to weaken, compared to earlier crises when deeper and tougher policy responses were necessitated (for example, defaults and banking system resets). This policy response, nonetheless, argues in favor of greater allocation to hard-currency debt, which should benefit from the resulting accumulation/stability of international reserves. We also envisage continued secular inflows into the asset class, particularly from strategic investors looking for higher yields and fundamentals that do not include the high debt levels that characterize developed markets. Other central banks are noteworthy contributors to this demand for emerging markets debt.
Fund Review
At the portfolio level, outperformance during the semi-annual period was due to a combination of comparatively overweight positions in securities driven, to a large extent, by idiosyncratic factors — Venezuelan hard-currency bonds, Israel local-currency bonds, Argentina hard-currency bonds, and corporate hard-currency bonds in Mexico and Brazil. The Fund’s biggest winners during the six-month period were positions in Venezuela, Brazil, Mexico, and Argentina (sovereign and corporate hard-currency debt and corporate local-currency debt), as well as in Portugal, Israel, and Nigeria, where the Fund’s exposure was in local-currency debt.
The Fund’s major detractor from performance was exposure to Hungary hard-currency sovereign and corporate debt, which suffered from the political noise in the region. The Fund’s positions in South Africa, Russia (where the Fund’s exposure was in corporate hard-currency debt), Chile (where the Fund’s exposure was in corporate local-currency debt), and Uruguay (where the Fund’s exposure was in sovereign hard-currency debt), also detracted from performance.
Our current portfolio reflects our view that the exit from the quantitative easing programs in the U.S. will leave room for idiosyncrasy, and diverse policy reactions (i.e., some good, some bad) in the emerging markets. In general, the current portfolio seeks, in the long run, to generate potential for price upside, stemming from the fact that a country’s bottom-up fundamentals (as opposed to technicals triggered by U.S. Treasuries) drive asset prices. Emerging markets debt continues to have higher real yields and higher credit spreads than developed markets debt, with, in our opinion, superior fundamentals. We aim to earn carry5 while we position to capture longer-term upside that should, over time, be generated by country fundamentals. We would note that, relative to bonds with a low spread and idiosyncrasy component, bonds with a high spread and idiosyncrasy component relative to the overall yield should, over time, outperform in any generalized bond sell-off.
The countries where we see the best opportunities can generally be characterized as having strong or improving balance sheets, good policy reactions relative to market opinions, high real interest rates, and stabilized technicals. All such countries have been in our portfolio to a medium or large degree over time. In particular, we like exposure to local-currency debt in Israel which is rapidly de-coupling from the Eurozone and already benefitting from large natural gas deposits (against the backdrop of extremely low foreign ownership, the improving fiscal balance and significant pre-financing of the 2014 issuance plan).
VAN ECK VIP UNCONSTRAINED EMERGING MARKETS BOND FUND
(unaudited)
We believe that selected corporate hard-currency debt in Brazil, Mexico, and Peru still looks attractive and should benefit further from growth rebound in China and the U.S., as well as from the reform program in Mexico. We are constructive on corporate hard-currency debt in India, where the government received a strong reform mandate in the last parliamentary elections. In hard-currency debt, we also have a bias toward accumulating low-correlated high-spread bonds (both corporate and sovereign credits — including Venezuela, Argentina, Vietnam, Indonesia and Colombia). As we transition to whatever new yield environment materializes, these bonds will likely act as defensive investments that can perform well during periods of risk aversion, especially if the U.S. dollar is rallying.
During the early part of the reporting period, the Fund used derivatives, specifically currency forwards to hedge the currency component of fixed income holdings. The use of such derivatives did not materially impact performance.
Outlook
We see a combination of headwinds and tailwinds for emerging markets debt in the coming months, in part due to the risk of higher U.S. interest rates and a stronger U.S. dollar, resulting from the Fed’s tapering of bond purchases.
Starting with the headwinds: we will simply say that higher U.S. rates pressured emerging markets debt last time around, and, thus, it is reasonable to expect a repetition, assuming that U.S. interest rates rise (especially at the longer end of the yield curve). The U.S. curve flattened significantly in the first six months of 2014, in part due to greater purchases of longer-term bonds by central banks, and in part due to negative macroeconomic surprises in the U.S. Traditionally, a higher Fed target rate is associated with bear-flattening of the Treasury curve, however, the expectation of a more robust growth and higher inflation can temporarily steepen the curve, presenting greater downside risk for longer-term rates and duration.
In addition, several large emerging markets economies — Turkey, South Africa and Russia — continue to face problems (weak growth momentum, high inflation and low real interest rates) and this may further limit flows into the asset class in the near term.
Finally, there’s a risk of elevated commodity prices in the event of stronger growth in China and the U.S., and on-going political noise in Iraq, which will increase inflation pressures in many emerging markets.
The tailwinds, on the other hand, are pretty significant. Most important, low debts and deficits are meaningful, while the orthodox policy response (higher interest rates and weaker foreign exchange) should allow for a speedier correction of many macroeconomic imbalances.
Finally, emerging markets bonds continue to pay higher real interest rates than developed markets bonds, despite the superior fundamentals of emerging markets’ economies. Through our continuing research, we believe that emerging markets bonds seem to offer superior risk/return to developed markets bonds.
The Fund is subject to risks associated with its investments in emerging markets securities. Investing in foreign denominated and/or domiciled securities may involve heightened risk due to currency fluctuations, and economic and political risks, which may be enhanced in emerging markets. As the Fund may invest in securities denominated in foreign currencies and some of the income received by the Fund will be in foreign currencies, changes in currency exchange rates may negatively impact the Fund’s return. Derivatives may involve certain costs and risks such as liquidity, interest rate, market, credit, management and the risk that a position could not be closed when most advantageous. The Fund may also be subject to credit risk, interest rate risk, sovereign debt risk, tax risk, non-diversification risk and risks associated with non-investment grade securities. Please see the prospectus and summary prospectus for information on these and other risk considerations.
We thoroughly appreciate your participation in the Van Eck VIP Unconstrained Emerging Markets Bond Fund, and we look forward to helping you meet your investment goals in the future.
 |  | |
| | | |
| Eric Fine | David Austerweil | |
| Portfolio Manager | Deputy Portfolio Manager | |
July 17, 2014
The performance quoted represents past performance. Past performance is no guarantee of future results; current performance may be lower or higher than the performance data quoted. Performance information reflects temporary waivers of expenses and/or fees and does not include insurance/annuity fees and expenses. Investment returns would have been reduced had these fees/expenses been included. Investment return and the value of the shares of the Fund will fluctuate so that an investor’s shares, when redeemed, may be worth more or less than their original cost. Fund returns assume that dividends and capital gains distributions have been reinvested in the Fund at NAV. Index returns assume that dividends of the Index constituents in the Index have been reinvested. Performance information current to the most recent month end is available by calling 1.800.826.2333.
The Fund is only available to life insurance and annuity companies to fund their variable annuity and variable life insurance products. These contracts offer life insurance and tax benefits to the beneficial owners of the Fund. Your insurance or annuity company charges, fees and expenses for these benefits are not reflected in this report or in the Fund’s performance, since they are not direct expenses of the Fund. Had these fees been included, returns would have been lower. For insurance products, performance figures do not reflect the cost for insurance and if they did, the performance shown would be significantly lower. A review of your particular life and/or annuity contract will provide you with much greater detail regarding these costs and benefits.
All indices are unmanaged and include the reinvestment of all dividends, but do not reflect the payment of transaction costs, advisory fees or expenses that are associated with an investment in the Fund. An index’s performance is not illustrative of the Fund’s performance. Indices are not securities in which investments can be made. Results reflect past performance and do not guarantee future results.
| 1 | The J.P. Morgan Government Bond Index-Emerging Markets Global Diversified (GBI-EM) tracks local currency bonds issued by Emerging Markets governments. The index spans over 15 countries. |
| | |
| 2 | Emerging markets local currency bonds are bonds denominated in the local currency of the issuer. |
| | |
| 3 | The J.P. Morgan Emerging Markets Bond Index Global Diversified (EMBI) tracks returns for actively traded external debt instruments in emerging markets, and is also J.P. Morgan’s most liquid U.S-dollar emerging markets debt benchmark. |
| | |
| 4 | Hard currency refers to currencies that are generally widely accepted around the world such as the U.S. dollar, euro or yen. |
| | |
| 5 | The carry of any asset is the cost or benefit of owning that asset. |
VAN ECK VIP UNCONSTRAINED EMERGING MARKETS BOND FUND
EXPLANATION OF EXPENSES
(unaudited)
As a shareholder of the Fund, you incur two types of costs: (1) transaction costs, including program fees on purchase payments; and (2) ongoing costs, including management fees and other Fund expenses. This disclosure is intended to help you understand the ongoing costs (in dollars) of investing in the Fund and to compare these costs with the ongoing costs of investing in other mutual funds.
The disclosure is based on an investment of $1,000 invested at the beginning of the period and held for the entire period, January 1, 2014 to June 30, 2014.
Actual Expenses
The first line in the table below provides information about account values and actual expenses. You may use the information in this line, together with the amount you invested, to estimate the expenses that you paid over the period. Simply divide your account value by $1,000 (for example, an $8,600 account value divided by $1,000 = 8.6), then multiply the result by the number in the first line under the heading entitled “Expenses Paid During the Period.”
Hypothetical Example for Comparison Purposes
The second line in the table below provides information about hypothetical account values and hypothetical expenses based on the Fund’s actual expense ratio and an assumed rate of return of 5% per year before expenses, which is not the Fund’s actual return. The hypothetical account values and expenses may not be used to estimate the actual ending account balance or expenses you paid for the period. You may use this information to compare the ongoing costs of investing in the Fund and other funds. To do so, compare this 5% hypothetical example with the 5% hypothetical examples that appear in the shareholder reports of other funds.
Please note that the expenses shown in the table are meant to highlight your ongoing costs only and do not reflect any transactional costs, such as fees on purchase payments. Therefore, the second line of the table is useful in comparing ongoing costs only, and will not help you determine the relative costs of owning different funds. In addition, if these transactional costs were included, your costs would have been higher.
Van Eck VIP Unconstrained Emerging Markets Bond Fund
| | | | | Expenses Paid |
| | | Beginning | Ending | During the Period* |
| | | Account Value | Account Value | January 1, 2014 – |
| | | January 1, 2014 | June 30, 2014 | June 30, 2014 |
| Initial Class | Actual | $ 1,000.00 | $ 1,099.60 | $ 5.73 |
| | Hypothetical** | $ 1,000.00 | $ 1,019.34 | $ 5.51 |
| * | Expenses are equal to the Fund’s annualized expense ratio (for the six months ended June 30, 2014), of 1.10% multiplied by the average account value over the period, multiplied by the number of days in the most recent fiscal half year divided by the number of days in the fiscal year (to reflect the one-half year period). |
| | |
| ** | Assumes annual return of 5% before expenses |
SCHEDULE OF INVESTMENTS
June 30, 2014 (unaudited)
| Principal | | | | | | |
| Amount | | | | | Value | |
| |
| CORPORATE BONDS: 76.2% |
| |
| Argentina: 4.5% | | | | |
| USD | 19,000 | | | IRSA Inversiones y Representaciones S.A.
8.50%, 07/10/14 (c) Reg S | | $ | 18,899 | |
| | 2,000,000 | | | YPF S.A.
7.72%, 08/15/18 (f) Reg S | | | 2,037,500 | |
| | | | | | | | 2,056,399 | |
| Bermuda: 2.9% | | | | |
| | 1,200,000 | | | Inkia Energy Ltd.
8.38%, 04/04/16 (c) Reg S | | | 1,341,000 | |
| British Virgin Islands: 2.9% | | | | |
| | 1,350,000 | | | OAS Financial Ltd.
8.88%, 04/25/18 (c) Reg S | | | 1,346,625 | |
| Cayman Islands: 5.6% | | | | |
| | 1,278,000 | | | Marfrig Overseas Ltd.
9.50%, 05/04/15 (c) Reg S | | | 1,386,630 | |
| | 374,000 | | | Minerva Overseas II Ltd.
10.88%, 11/15/15 (c) Reg S | | | 411,400 | |
| | 426,000 | | | Minerva Overseas Ltd.
9.50%, 02/01/17 Reg S | | | 457,950 | |
| | 341,000 | | | Odebrecht Finance Ltd.
5.25%, 06/27/29 144A | | | 342,876 | |
| | | | | | | | 2,598,856 | |
| Israel: 3.0% | | | | |
| | | | | Delek & Avner Tamar Bond Ltd. | | | | |
| | 382,000 | | | 4.44%, 12/30/20 144A | | | 386,784 | |
| | 287,000 | | | 5.08%, 12/30/23 144A | | | 292,778 | |
| | 669,000 | | | 5.41%, 12/30/25 144A | | | 691,000 | |
| | | | | | | | 1,370,562 | |
| Luxembourg: 7.2% | | | | |
| | 487,000 | | | Minerva Luxembourg S.A.
8.75%, 04/03/19 (c) 144A | | | 513,785 | |
| | 1,384,000 | | | Tonon Luxembourg S.A.
10.50%, 05/14/17 (c) 144A | | | 1,456,660 | |
| | | | | Virgolino de Oliveira Finance S.A. | | | | |
| | 208,000 | | | 10.50%, 01/28/15 (c) Reg S | | | 168,480 | |
| | 1,168,000 | | | 10.88%, 01/13/18 (c) 144A | | | 1,162,160 | |
| | | | | | | | 3,301,085 | |
| Mexico: 8.8% | | | | |
| | 120,000 | | | Corp GEO, SAB de CV
9.25%, 06/30/15 (c) (d) Reg S | | | 15,000 | |
| | 1,234,000 | | | Fermaca Enterprises S de RL de CV
6.38%, 03/30/38 144A | | | 1,292,615 | |
| | 165,000 | | | Grupo Bimbo SAB de CV
3.88%, 06/27/24 144A | | | 165,086 | |
| | 1,150,000 | | | Servicios Corporativos Javer SAPI de CV
9.88%, 04/06/16 (c) Reg S | | | 1,262,125 | |
| | | | | Trust F/1401 | | | | |
| | 409,000 | | | 5.25%, 12/15/24 144A | | | 430,473 | |
| | 200,000 | | | 6.95%, 01/30/44 Reg S | | | 222,500 | |
| | 600,000 | | | 6.95%, 01/30/44 144A | | | 667,500 | |
| | | | | | | | 4,055,299 | |
| Principal | | | | | | |
| Amount | | | | | Value | |
| | | | | |
| Panama: 5.0% | | | | |
| | 1,298,000 | | | AES Panama S.A.
6.35%, 12/21/16 Reg S | | $ | 1,349,920 | |
| | 908,000 | | | Avianca Holdings S.A.
8.38%, 05/10/17 (c) Reg S | | | 975,828 | |
| | | | | | | | 2,325,748 | |
| Peru: 6.1% | | | | |
| | 94,000 | | | Abengoa Transmision Sur S.A.
6.88%, 04/30/43 144A | | | 104,340 | |
| | 1,130,000 | | | Banco de Credito del Peru
9.75%, 11/06/19 (c) Reg S | | | 1,381,425 | |
| | 1,200,000 | | | Corp Lindley S.A.
6.75%, 11/23/21 Reg S | | | 1,332,000 | |
| | | | | | | | 2,817,765 | |
| Singapore: 2.7% | | | | |
| | | | | Theta Capital Pte Ltd. | | | | |
| | 788,000 | | | 6.13%, 11/14/16 (c) Reg S | | | 803,444 | |
| | 454,000 | | | 7.00%, 04/11/18 (c) Reg S | | | 464,238 | |
| | | | | | | | 1,267,682 | |
| Spain: 0.5% | | | | |
| | 205,000 | | | CEMEX Espana S.A.
9.88%, 04/30/16 (c) Reg S | | | 236,263 | |
| Sri Lanka: 1.0% | | | | |
| | 460,000 | | | Bank of Ceylon
5.33%, 04/16/18 Reg S | | | 469,200 | |
| United Arab Emirates: 3.2% | | | | |
| | 1,300,000 | | | DP World Ltd.
6.85%, 07/02/37 Reg S | | | 1,456,000 | |
| United Kingdom: 1.5% | | | | |
| | | | | AngloGold Ashanti Holdings Plc | | | | |
| | 374,000 | | | 5.13%, 08/01/22 | | | 365,386 | |
| | 288,000 | | | 8.50%, 07/30/16 (c) | | | 323,640 | |
| | | | | | | | 689,026 | |
| United States: 3.0% | | | | |
| | 1,320,000 | | | Rolta LLC
10.75%, 05/16/16 (c) Reg S | | | 1,371,150 | |
| Venezuela: 13.2% | | | | |
| | | | | Petroleos de Venezuela S.A. | | | | |
| | 5,232,000 | | | 8.50%, 11/02/17 Reg S | | | 4,906,569 | |
| | 1,450,000 | | | 9.75%, 05/17/35 Reg S | | | 1,191,175 | |
| | | | | | | | 6,097,744 | |
| Vietnam: 5.1% | | | | |
| | 1,929,000 | | | Debt and Asset Trading Corp.
1.00%, 07/17/14 (c) Reg S | | | 1,003,080 | |
| | | | | Vingroup JSC | | | | |
| | 592,000 | | | 11.63%, 11/07/16 (c) Reg S | | | 667,480 | |
| | 608,000 | | | 11.63%, 11/07/16 (c) 144A | | | 685,520 | |
| | | | | | | | 2,356,080 | |
| Total Corporate Bonds | | | | |
| (Cost: $33,894,819) | | | 35,156,484 | |
See Notes to Financial Statements
VAN ECK VIP UNCONSTRAINED EMERGING MARKETS BOND FUND
SCHEDULE OF INVESTMENTS
(unaudited) (continued)
| Principal | | | | | | |
| Amount | | | | | Value | |
| | | | | | | | | |
| FOREIGN GOVERNMENT OBLIGATIONS: 19.6% | | | | |
| | | | | |
| Argentina: 8.6% | | | | |
| | 511,000 | | | Argentina Bonar Bonds
8.75%, 05/07/24 | | $ | 473,633 | |
| | | | | Argentine Republic Government International Bond | | | | |
| EUR | 2,697,163 | | | 7.82%, 12/31/33 (d) | | | 2,991,513 | |
| USD | 584,650 | | | 8.28%, 12/31/33 (d) | | | 493,444 | |
| | | | | | | | 3,958,590 | |
| Israel: 7.5% | | | | |
| | | | | Israel Government Bond | | | | |
| ILS | 3,399,000 | | | 2.25%, 05/31/19 | | | 1,018,264 | |
| | 7,400,000 | | | 4.25%, 03/31/23 | | | 2,428,183 | |
| | | | | | | | 3,446,447 | |
| Netherlands: 2.3% | | | | |
| USD | 991,000 | | | Republic of Angola Via Northern Lights III BV
7.00%, 08/16/19 Reg S | | | 1,084,104 | |
| Venezuela: 1.1% | | | | |
| | 500,000 | | | Venezuela Government International Bond
8.50%, 10/08/14 | | | 502,500 | |
| Vietnam: 0.1% | | | | |
| | 44,650 | | | Vietnam Government International Bond
4.00%, 08/04/14 (c) (s) | | | 41,022 | |
| Total Foreign Government Obligations | | | | |
| (Cost: $8,634,978) | | | 9,032,663 | |
| Number of | | | | | | |
| Shares | | | | | Value | |
| | | | | | | | | |
| MONEY MARKET FUND: 1.8% | | | | |
| (Cost: $824,729) | | | | |
| | 824,729 | | | AIM Treasury Portfolio - Institutional Class | | $ | 824,729 | |
| Total Investments: 97.6% | | | | |
| (Cost: $43,354,526) | | | 45,013,876 | |
| Other assets less liabilities: 2.4% | | | 1,090,481 | |
| NET ASSETS: 100.0% | | $ | 46,104,357 | |
| EUR | — | Euro |
| ILS | — | Israeli Sheqel |
| USD | — | United States Dollar |
| (c) | Callable Security - the redemption date shown is when the security may be redeemed by the issuer |
| (d) | Security in default |
| (f) | Floating Rate Bond - coupon reflects the rate in effect at the end of the reporting period |
| (s) | Step Bond - coupon increases periodically based upon a predetermined schedule. The rate shown reflects the rate in effect at the end of the reporting period |
| Reg S | Security was purchased pursuant to Regulation S under the Securities Act of 1933, which exempts from registration securities offered and sold outside of the United States. Such a security cannot be sold in the United States without either an effective registration statement filed pursuant to the Securities Act of 1933, or pursuant to an exemption from registration. |
| 144A | Security exempt from registration under Rule 144A of the Securities Act of 1933, as amended, or otherwise restricted. These securities may be resold in transactions exempt from registration, unless otherwise noted, and the value amounted to $8,191,577, or 17.8% of net assets. |
| Summary of Investments | | % of | | | |
| by Sector (unaudited) | | Investments | | Value | |
| Basic Materials | | | 1.5 | % | | $ | 689,026 | |
| Consumer, Cyclical | | | 6.0 | | | | 2,695,903 | |
| Consumer, Non-cyclical | | | 17.9 | | | | 8,052,201 | |
| Energy | | | 24.1 | | | | 10,846,806 | |
| Financial | | | 15.1 | | | | 6,813,759 | |
| Government | | | 20.1 | | | | 9,032,663 | |
| Industrial | | | 4.3 | | | | 1,940,764 | |
| Technology | | | 3.1 | | | | 1,371,150 | |
| Utilities | | | 6.1 | | | | 2,746,875 | |
| Money Market Fund | | | 1.8 | | | | 824,729 | |
| | | | 100.0 | % | | $ | 45,013,876 | |
The summary of inputs used to value the Fund’s investments as of June 30, 2014 is as follows:
| | | | | | Level 2 | | | Level 3 | | | |
| | | Level 1 | | | Significant | | | Significant | | | |
| | | Quoted | | | Observable | | | Unobservable | | | |
| | | Prices | | | Inputs | | | Inputs | | Value | |
| Corporate Bonds* | | $ | — | | | $ | 35,156,484 | | | | $ | — | | | $ | 35,156,484 | |
| Foreign Government Obligations* | | | — | | | | 9,032,663 | | | | | — | | | | 9,032,663 | |
| Money Market Fund | | | 824,729 | | | | — | | | | | — | | | | 824,729 | |
| Total | | $ | 824,729 | | | $ | 44,189,147 | | | | $ | — | | | $ | 45,013,876 | |
* See Schedule of Investments for security type and geographic country breakouts.
See Notes to Financial Statements
STATEMENT OF ASSETS AND LIABILITIES
June 30, 2014 (unaudited)
| Assets: | | | | |
| Investments, at value (Cost $43,354,526) | | $ | 45,013,876 | |
| Cash | | | 627,771 | |
| Cash denominated in foreign currency, at value (Cost $37,016) | | | 39,924 | |
| Receivables: | | | | |
| Investments sold | | | 564,255 | |
| Shares of beneficial interest sold | | | 36,448 | |
| Dividends and interest | | | 707,326 | |
| Total assets | | | 46,989,600 | |
| | | | | |
| Liabilities: | | | | |
| Payables: | | | | |
| Investments purchased | | | 613,275 | |
| Shares of beneficial interest redeemed | | | 73,065 | |
| Due to Adviser | | | 27,194 | |
| Deferred Trustee fees | | | 13,307 | |
| Accrued expenses | | | 158,402 | |
| Total liabilities | | | 885,243 | |
| NET ASSETS | | $ | 46,104,357 | |
| Shares of beneficial interest outstanding | | | 4,590,647 | |
| Net asset value, redemption and offering price per share | | $ | 10.04 | |
| | | | | |
| Net Assets consist of: | | | | |
| Aggregate paid in capital | | $ | 42,182,171 | |
| Net unrealized appreciation | | | 1,663,479 | |
| Undistributed net investment income | | | 1,410,088 | |
| Accumulated net realized gain | | | 848,619 | |
| | | $ | 46,104,357 | |
See Notes to Financial Statements
VAN ECK VIP UNCONSTRAINED EMERGING MARKETS BOND FUND
STATEMENT OF OPERATIONS
For the Six Months Ended June 30, 2014 (unaudited)
| Income: | | | | | | | | |
| Dividends | | | | | | $ | 21,291 | |
| Interest | | | | | | | 1,666,764 | |
| Total income | | | | | | | 1,688,055 | |
| | | | | | | | | |
| Expenses: | | | | | | | | |
| Management fees | | $ | 221,935 | | | | | |
| Transfer agent fees | | | 12,339 | | | | | |
| Custodian fees | | | 35,710 | | | | | |
| Professional fees | | | 31,554 | | | | | |
| Reports to shareholders | | | 20,015 | | | | | |
| Trustees’ fees and expenses | | | 1,045 | | | | | |
| Interest | | | 671 | | | | | |
| Total expenses | | | 323,269 | | | | | |
| Waiver of management fees | | | (78,539 | ) | | | | |
| Net expenses | | | | | | | 244,730 | |
| Net investment income | | | | | | | 1,443,325 | |
| | | | | | | | | |
| Net realized gain (loss) on: | | | | | | | | |
| Investments | | | | | | | 926,118 | |
| Forward foreign currency contracts, foreign currency transactions and foreign denominated assets and liabilities | | | | | | | (57,446 | ) |
| Net realized gain | | | | | | | 868,672 | |
| | | | | | | | | |
| Net change in unrealized appreciation (depreciation) on: | | | | | | | | |
| Investments | | | | | | | 1,911,023 | |
| Forward foreign currency contracts, foreign currency transactions and foreign denominated assets and liabilities | | | | | | | 6,519 | |
| Net change in unrealized appreciation (depreciation) | | | | | | | 1,917,542 | |
| Net Increase in Net Assets Resulting from Operations | | | | | | $ | 4,229,539 | |
See Notes to Financial Statements
STATEMENT OF CHANGES IN NET ASSETS
| | | Six Months Ended
June 30,
2014 | | Year Ended
December 31,
2013 |
| | | (unaudited) | | |
| Operations: | | | | | | | | | | |
| Net investment income | | | $ | 1,443,325 | | | | $ | 2,268,857 | |
| Net realized gain | | | | 868,672 | | | | | 3,367,716 | |
| Net change in unrealized appreciation (depreciation) | | | | 1,917,542 | | | | | (10,314,860 | ) |
| Net increase (decrease) in net assets resulting from operations | | | | 4,229,539 | | | | | (4,678,287 | ) |
| | | | | | | | | | | |
| Dividends and Distributions to shareholders from: | | | | | | | | | | |
| Net investment income | | | | (2,183,316 | ) | | | | (1,121,981 | ) |
| Net realized gains | | | | (3,489,372 | ) | | | | (9,085 | ) |
| Total dividends and distributions | | | | (5,672,688 | ) | | | | (1,131,066 | ) |
| | | | | | | | | | | |
| Share transactions*: | | | | | | | | | | |
| Proceeds from sale of shares | | | | 15,802,486 | | | | | 7,097,510 | |
| Reinvestment of dividends and distributions | | | | 5,672,688 | | | | | 1,131,066 | |
| Cost of shares redeemed | | | | (13,784,183 | ) | | | | (17,092,122 | ) |
| Net increase (decrease) in net assets resulting from share transactions | | | | 7,690,991 | | | | | (8,863,546 | ) |
| Total increase (decrease) in net assets | | | | 6,247,842 | | | | | (14,672,899 | ) |
| | | | | | | | | | | |
| Net Assets: | | | | | | | | | | |
| Beginning of period | | | | 39,856,515 | | | | | 54,529,414 | |
| End of period (including undistributed net investment income of $1,410,088 and $2,150,079, respectively) | | | $ | 46,104,357 | | | | $ | 39,856,515 | |
| | | | | | | | | | | |
* Shares of beneficial interest issued, reinvested and redeemed
(unlimited number of $.001 par value shares authorized): | | | | | | | | | | |
| Shares sold | | | | 1,608,491 | | | | | 648,683 | |
| Shares reinvested | | | | 633,112 | | | | | 97,338 | |
| Shares redeemed | | | | (1,410,746 | ) | | | | (1,561,786 | ) |
| Net increase (decrease) | | | | 830,857 | | | | | (815,765 | ) |
See Notes to Financial Statements
VAN ECK VIP UNCONSTRAINED EMERGING MARKETS BOND FUND
FINANCIAL HIGHLIGHTS
For a share outstanding throughout each period:
| | | For the Six
Months Ended
June 30, | | Year Ended December 31, | |
| | | 2014 | | 2013 | | | 2012 | | | 2011 | | | 2010 | | | 2009 | |
| | | (unaudited) | | | | | | | | | | |
| Net asset value, beginning of period | | | $10.60 | | | $11.92 | | | $11.71 | | | $12.03 | | | $11.75 | | | $11.52 | |
| Income from investment operations: | | | | | | | | | | | | | | | | | | | |
| Net investment income (loss) | | | 0.29 | | | 0.60 | | | 0.24 | | | 0.27 | | | 0.31 | | | 0.34 | |
| Net realized and unrealized gain (loss) on investments | | | 0.60 | | | (1.67 | ) | | 0.39 | | | 0.62 | | | (0.02 | ) | | 0.30 | |
| Total from investment operations | | | 0.89 | | | (1.07 | ) | | 0.63 | | | 0.89 | | | 0.29 | | | 0.64 | |
| Less dividends and distributions from: | | | | | | | | | | | | | | | | | | | |
| Net investment income | | | (0.56 | ) | | (0.25 | ) | | (0.26 | ) | | (0.96 | ) | | (0.42 | ) | | (0.41 | ) |
| Net realized gains | | | (0.89 | ) | | — | (b) | | (0.16 | ) | | (0.25 | ) | | — | | | — | |
| Total dividends and distributions | | | (1.45 | ) | | (0.25 | ) | | (0.42 | ) | | (1.21 | ) | | (0.42 | ) | | (0.41 | ) |
| Settlement payments from unaffiliated third parties | | | — | | | — | | | — | | | — | | | 0.41 | (c) | | — | |
| Redemption fees | | | — | | | — | | | — | (b) | | — | (b) | | — | (b) | | — | (b) |
| Net asset value, end of period | | | $10.04 | | | $10.60 | | | $11.92 | | | $11.71 | | | $12.03 | | | $11.75 | |
| Total return (a) | | | 9.96 | %(e) | | (9.17 | )% | | 5.55 | % | | 8.14 | % | | 6.20 | %(c) | | 5.98 | % |
| | | | | | | | | | | | | | | | | | | | |
| | | | | | | | | | | | | | | | | | | | |
| Ratios/Supplemental Data | | | | | | | | | | | | | | | | | | | |
| Net Assets, end of period (000’s) | | | $46,104 | | | $39,857 | | | $54,529 | | | $43,854 | | | $35,688 | | | $33,757 | |
| Ratio of gross expenses to average net assets | | | 1.46 | %(d) | | 1.43 | % | | 1.18 | % | | 1.22 | % | | 1.30 | % | | 1.31 | % |
| Ratio of net expenses to average net assets | | | 1.10 | %(d) | | 1.10 | % | | 1.10 | % | | 1.10 | % | | 1.10 | % | | 1.10 | % |
| Ratio of net expenses, excluding interest expense, to average net assets | | | 1.10 | %(d) | | 1.10 | % | | 1.10 | % | | 1.10 | % | | 1.10 | % | | 1.10 | % |
| Ratio of net investment income to average net assets | | | 6.50 | %(d) | | 4.87 | % | | 2.10 | % | | 2.33 | % | | 2.60 | % | | 2.95 | % |
| Portfolio turnover rate | | | 242 | %(e) | | 483 | % | | 0 | % | | 23 | % | | 35 | % | | 0 | % |
| (a) | Total return is calculated assuming an initial investment made at the net asset value at the beginning of period, reinvestment of any dividends and distributions at net asset value on the dividend/distributions payment date and a redemption at the net asset value on the last day of the period. The return does not reflect the deduction of taxes that a shareholder would pay on Fund dividends/distributions or the redemption of Fund shares. |
| (b) | Amount represents less than $0.005 per share |
| (c) | For the year ended December 31, 2010, the Fund received settlement payments from unaffiliated third parties which represented 3.71% of the Initial Class Shares total return. |
| (d) | Annualized |
| (e) | Not annualized |
See Notes to Financial Statements
NOTES TO FINANCIAL STATEMENTS
June 30, 2014 (unaudited)
Note 1—Fund Organization—Van Eck VIP Trust (the “Trust”) is registered under the Investment Company Act of 1940, as amended, as an open-end management investment company. The Trust was organized as a Massachusetts business trust on January 7, 1987. The Van Eck VIP Unconstrained Emerging Markets Bond Fund (the “Fund”) is a non-diversified series of the Trust and seeks high total return (income plus capital appreciation) by investing globally, primarily in a variety of debt securities. Effective May 1, 2013, the Fund implemented changes to its principal strategy. The Fund currently offers a single class of shares: Initial Class Shares.
Note 2—Significant Accounting Policies—The preparation of financial statements in conformity with U.S. generally accepted accounting principles (“GAAP”) requires management to make estimates and assumptions that affect the reported amounts and disclosures in the financial statements. Actual results could differ from those estimates.
The Fund is an investment company and is following accounting and reporting requirements of Accounting Standard Codification (“ASC”) 946 Financial Services—Investment Companies.
The following is a summary of significant accounting policies followed by the Fund.
| A. | Security Valuation—The Fund values its investments in securities and other assets and liabilities carried at fair value daily. Fair value is the price that would be received to sell an asset or paid to transfer a liability in an orderly transaction between market participants on the measurement date. Bonds and notes are fair valued by a pricing service which utilizes models that incorporate observable data such as sales of similar securities, broker quotes, yields, bids, offers and reference data and are categorized as Level 2 in the fair value hierarchy. Short-term obligations purchased with more than sixty days remaining to maturity are valued at market value. Short-term obligations purchased with sixty days or less to maturity are valued at amortized cost, which with accrued interest approximates fair value. Money market fund investments are valued at net asset value. Forward foreign currency contracts are valued at the spot currency rate plus an amount (“points”), which reflects the differences in interest rates between the U.S. and foreign markets and are categorized as Level 2 in the fair value hierarchy. Securities for which quotations are not available are stated at fair value as determined by the Pricing Committee of Van Eck Associates Corporation (the “Adviser”) appointed by the Board of Trustees. The Pricing Committee provides oversight of the Fund’s valuation policies and procedures, which are approved by the Fund’s Board of Trustees. Among other things, these procedures allow the Fund to utilize independent pricing services, quotations from securities dealers, and other market sources to determine fair value. The Pricing Committee convenes regularly to review the fair value of financial instruments for which market prices are not readily available. The Pricing Committee employs various methods for calibrating the valuation approaches utilized to determine fair value, including a regular review of key inputs and assumptions, transactional back-testing and disposition analysis. |
Certain factors such as economic conditions, political events, market trends, the nature of and duration of any restrictions on disposition, trading in similar securities of the issuer or comparable issuers and other security specific information are used to determine the fair value for these securities. Depending on the relative significance of valuation inputs, these securities may be classified either as Level 2 or Level 3 in the fair value hierarchy. The price which the Fund may realize upon sale of an investment may differ materially from the value presented on the Schedule of Investments.
The Fund utilizes various methods to measure the fair value of its investments on a recurring basis which includes a hierarchy that prioritizes inputs to valuation methods used to measure fair value. The fair value hierarchy gives highest priority to unadjusted quoted prices in active markets for identical assets and liabilities (Level 1 measurements) and the lowest priority to unobservable inputs (Level 3 measurements). The inputs or methodologies used for valuing securities are not necessarily an indication of the risk associated with investing in those securities. The transfers between levels of the fair value hierarchy assume the financial instruments were transferred at the beginning of the reporting period. The three levels of the fair value hierarchy are described below:
| | Level 1 – | Quoted prices in active markets for identical securities. |
| | | |
| | Level 2 – | Significant observable inputs (including quoted prices for similar securities, interest rates, prepayment speeds, credit risk, etc.). |
| | | |
| | Level 3 – | Significant unobservable inputs (including the Fund’s own assumptions in determining the fair value of investments). |
A summary of the inputs, the levels used to value the Fund’s investments, and transfers between levels are located in the Schedule of Investments. Additionally, tables that reconcile the valuation of the Fund’s Level 3 investments and that present additional information about valuation methodologies and unobservable inputs, if applicable, are located in the Schedule of Investments.
| B. | Federal Income Taxes—It is the Fund’s policy to comply with the provisions of the Internal Revenue Code applicable to regulated investment companies and to distribute all of its taxable income to its shareholders. Therefore, no federal income tax provision is required. |
VAN ECK VIP UNCONSTRAINED EMERGING MARKETS BOND FUND
NOTES TO FINANCIAL STATEMENTS
(unaudited) (continued)
| C. | Currency Translation—Assets and liabilities denominated in foreign currencies and commitments under foreign currency contracts are translated into U.S. dollars at the closing prices of such currencies each business day. Purchases and sales of investments are translated at the exchange rates prevailing when such investments are acquired or sold. Income and expenses are translated at the exchange rates prevailing when accrued. The portion of realized and unrealized gains and losses on investments that result from fluctuations in foreign currency exchange rates is not separately disclosed. Recognized gains or losses attributable to foreign currency fluctuations on foreign currency denominated assets, other than investments, and liabilities are recorded as net realized gain (loss) on forward foreign currency contracts, foreign currency transactions and foreign denominated assets and liabilities in the Statement of Operations. |
| | |
| D. | Dividends and Distributions to Shareholders—Dividends to shareholders from net investment income and distributions from net realized capital gains, if any, are declared and paid annually. Income dividends and capital gain distributions are determined in accordance with U.S. income tax regulations, which may differ from such amounts determined in accordance with GAAP. |
| | |
| E. | Use of Derivative Instruments—The Fund may make investments in derivative instruments, including, but not limited to, options, futures, swaps and other derivatives relating to foreign currency transactions. A derivative is an instrument whose value is derived from underlying assets, indices, reference rates or a combination of these factors. Derivative instruments may be privately negotiated contracts (often referred to as over-the-counter (“OTC”) derivatives) or they may be listed and traded on an exchange. Derivative contracts may involve future commitments to purchase or sell financial instruments or commodities at specified terms on a specified date, or to exchange interest payment streams or currencies based on a notional or contractual amount. Derivative instruments may involve a high degree of financial risk. The use of derivative instruments also involves the risk of loss if the investment adviser is incorrect in its expectation of the timing or level of fluctuations in securities prices, interest rates or currency prices. Investments in derivative instruments also include the risk of default by the counterparty, the risk that the investment may not be liquid and the risk that a small movement in the price of the underlying security or benchmark may result in a disproportionately large movement, unfavorable or favorable, in the price of the derivative instrument. GAAP requires enhanced disclosures about the Fund’s derivative instruments and hedging activities. At June 30, 2014, the Fund held no derivative instruments. |
| | |
| | The impact of transactions in derivative instruments, during the period ended June 30, 2014, were as follows: |
| | |
| | | Foreign Currency |
| | | Risk |
| Realized gain (loss): | | | | | | |
| Forward foreign currency contacts1 | | | $ | (9,125 | ) | |
| Net change in appreciation (depreciation): | | | | | | |
| Forward foreign currency contracts2 | | | | (5,192 | ) | |
| | | | | | | |
| 1 | Statement of Operations location: Net realized gain (loss) on forward foreign currency contracts, foreign currency transactions and foreign denominated assets and liabilities |
| | |
| 2 | Statement of Operations location: Net change in unrealized appreciation (depreciation) on forward foreign currency contracts, foreign currency transactions and foreign denominated assets and liabilities |
Forward Foreign Currency Contracts—The Fund is subject to foreign currency risk in the normal course of pursuing its investment objectives. The Fund may buy and sell forward foreign currency contracts to settle purchases and sales of foreign denominated securities, gain currency exposure or to hedge foreign denominated assets. Realized gains and losses from forward foreign currency contracts, if any, are included in realized gain (loss) on forward foreign currency contracts, foreign currency transactions and foreign denominated assets and liabilities in the Statement of Operations. The Fund may incur additional risk from investments in forward foreign currency contracts if the counterparty is unable to fulfill its obligation or there are unanticipated movements of the foreign currency relative to the U.S. dollar. The Fund held forward foreign currency contracts for two months during the period ended June 30, 2014 with an average unrealized depreciation of $2,390. At June 30, 2014, the Fund held no forward foreign currency contracts.
| F. | Other—Security transactions are accounted for on trade date. Realized gains and losses are calculated on the identified cost basis. Dividend income is recorded on the ex-dividend date. Interest income, including amortization of premiums and discounts, is accrued as earned. Estimated foreign taxes that are expected to be withheld from proceeds at the sale of certain foreign investments are accrued by the Fund and decrease the unrealized gain on investments. The Fund received regulatory settlement payments during 2010 from unaffiliated third parties which is included in the Financial Highlights. The Fund received redemption fees from Class R1 Shares prior to its closing on April 30, 2012 which are reflected in the Financial Highlights. |
| | |
| | |
| | In the normal course of business, the Fund enters into contracts that contain a variety of general indemnifications. The Fund’s maximum exposure under these agreements is unknown as this would involve future claims that may be made against the Fund that have not yet occurred. However, the Adviser believes the risk of loss under these arrangements to be remote. |
Note 3—Investment Management and Other Agreements—The Adviser is the investment adviser to the Fund. The Adviser receives a management fee, calculated daily and payable monthly based on an annual rate of 1.00% of the first $500 million of average daily net assets, 0.90% of the next $250 million of average daily net assets and 0.70% of the average daily net assets in excess of $750 million. The Adviser has agreed, at least until May 1, 2015, to waive management fees and/or assume expenses (excluding acquired fund fees and expenses, interest expense, trading expenses, dividends and interest payments on securities sold short, taxes, and extraordinary expenses) from exceeding 1.10% of the Fund’s average daily net assets for Initial Class Shares. For the period ended June 30, 2014, the Adviser waived management fees in the amount of $78,539. Certain officers and trustees of the Trust are officers, directors or stockholders of the Adviser and Van Eck Securities Corporation, the distributor.
Note 4—Investments—For the period ended June 30, 2014, the cost of purchases and proceeds from sales of investments, excluding U.S. government securities and short-term obligations, aggregated $105,658,168 and $102,974,117, respectively.
Note 5—Income Taxes—For Federal income tax purposes, the identified cost of investments owned at June 30, 2014 was $43,385,814 and net unrealized appreciation aggregated $1,628,062 of which $1,738,668 related to appreciated securities and $110,606 related to depreciated securities.
The tax character of dividends and distributions paid to shareholders during the year ended December 31, 2013 were as follows:
| | | Year Ended
December 31, 2013 |
| Ordinary income | | | $ | 1,131,066 | |
| Long-term capital gains | | | | — | |
| Total | | | $ | 1,131,066 | |
The Fund recognizes the tax benefits of uncertain tax positions only where the position is “more-likely-than-not” to be sustained assuming examination by applicable tax authorities. Management has analyzed the Fund’s tax positions, and has concluded that no liability for unrecognized tax benefits should be recorded related to uncertain tax positions taken on return filings for open tax years (tax years ended December 31, 2010-2013), or expected to be taken in the Fund’s current tax year. The Fund does not have exposure for additional years that might still be open in certain foreign jurisdictions. Therefore, no provision for income tax is required in the Fund’s financial statements.
The Fund recognizes interest and penalties, if any, related to uncertain tax positions as income tax expense in the Statement of Operations. During the period ended June 30, 2014, the Fund did not incur any interest or penalties.
Note 6—Concentration of Risk—The Fund may purchase securities on foreign exchanges. Securities of foreign issuers involve special risks and considerations not typically associated with investing in U.S. issuers. These risks include devaluation of currencies, less reliable information about issuers, different security transaction clearance and settlement practices and future adverse political and economic developments. These risks are heightened for investments in emerging markets countries. Moreover, securities of many foreign issuers and their markets may be less liquid and their prices more volatile than those of comparable U.S. issuers. The Fund may invest in debt securities which are rated below investment grade by rating agencies. Such securities involve more risk of default than higher rated securities and are subject to greater price variability.
At June 30, 2014, the aggregate shareholder accounts of six insurance companies own approximately 49%, 23%, 8%, 6%, 6% and 5% of the Initial Class Shares.
Note 7—Trustee Deferred Compensation Plan—The Trust has a Deferred Compensation Plan (the “Deferred Plan”) for Trustees under which the Trustees can elect to defer receipt of their trustee fees until retirement, disability or termination from the Board of Trustees. The fees otherwise payable to the participating Trustees are deemed invested in shares of eligible Funds of the Trust and the Van Eck Funds (another registered investment company managed by the Adviser) as directed by the Trustees.
The expense for the Deferred Plan is included in “Trustees’ fees and expenses” in the Statement of Operations. The liability for the Deferred Plan is shown as “Deferred Trustee fees” in the Statement of Assets and Liabilities.
Note 8—Bank Line of Credit—The Trust may participate with Van Eck Funds (collectively the “VE/VIP Funds”) in a $30 million committed credit facility (the “Facility”) to be utilized for temporary financing until the settlement of sales or purchases of portfolio securities, the repurchase or redemption of shares of the Fund and other temporary or emergency purposes. The VE/VIP Funds have agreed to pay commitment fees, pro rata, based on the unused but available balance. Interest is charged to the VE/VIP Funds at rates based on prevailing market rates in effect at the time of borrowings. During the period ended June 30, 2014, the average
VAN ECK VIP UNCONSTRAINED EMERGING MARKETS BOND FUND
NOTES TO FINANCIAL STATEMENTS
(unaudited) (continued)
daily loan balance during the 11 day period for which a loan was outstanding amounted to $1,484,594 and the average interest rate was 1.35%. At June 30, 2014, the Fund had no outstanding borrowings under the Facility.
Note 9—Securities Lending—To generate additional income, the Fund may lend its securities pursuant to a securities lending agreement with State Street Bank & Trust Co., the securities lending agent and also the Fund’s custodian. During the period ended June 30, 2014, the Fund had no securities lending activity.
Note 10—Subsequent Event Review—The Fund has evaluated subsequent events and transactions for potential recognition or disclosure through the date the financial statements were issued.
VAN ECK VIP UNCONSTRAINED EMERGING MARKETS BOND FUND
APPROVAL OF ADVISORY AGREEMENT
June 30, 2014 (unaudited)
The Investment Company Act of 1940, as amended (the “1940 Act”), provides, in substance, that an investment advisory agreement between a fund and its investment adviser may be entered into only if it is approved, and may continue in effect from year to year after an initial two-year period only if its continuance is approved, at least annually by the fund’s board of trustees, including by a vote of a majority of the trustees who are not “interested persons” of the fund as defined in the 1940 Act (the “Independent Trustees”), cast in person at a meeting called for the purpose of considering such approval. On June 25, 2014, the Board of Trustees (the “Board”) of Van Eck VIP Trust (the “Trust”), which is comprised exclusively of Independent Trustees, voted to approve the continuation of the existing advisory agreement (the “Advisory Agreement”) between the Van Eck VIP Unconstrained Emerging Markets Bond Fund (the “Fund”) and its investment adviser, Van Eck Associates Corporation (together with its affiliated companies, the “Adviser”). Information regarding the material factors considered and related conclusions reached by the Board in approving the continuation of the Advisory Agreement is set forth below.
In considering the continuation of the Advisory Agreement, the Board reviewed and considered information that had been provided by the Adviser throughout the year at regular and special meetings of the Board and its committees, including information requested by the Board and furnished by the Adviser for meetings of the Board held on June 5, 2014 and June 24 and 25, 2014 specifically for the purpose of considering the continuation of the Advisory Agreement. The written and oral reports provided to the Board included, among other things, the following:
| n | Information about the overall organization of the Adviser and the Adviser’s short-term and long-term business plans with respect to its mutual fund operations and other lines of business; |
| | |
| n | The consolidated financial statements of the Adviser for the past three fiscal years; |
| | |
| n | A copy of the Advisory Agreement and descriptions of the services provided by the Adviser thereunder; |
| | |
| n | Information regarding the qualifications, education and experience of the investment professionals responsible for portfolio management, investment research and trading activities for the Fund, the structure of their compensation and the resources available to support these activities; |
| | |
| n | A report prepared by an independent consultant comparing the Fund’s investment performance (including, where relevant, total returns, standard deviations, Sharpe ratios, information ratios, beta and alpha) with respect to a representative class of shares of the Fund for the one-, three-, five- and ten-year periods ended March 31, 2014 with those of (i) a universe of mutual funds selected by the independent consultant with similar portfolio holding characteristics, share class attributes and other operational characteristics as the Fund (the “Category”), (ii) a sub-group of funds selected from the Category by the independent consultant further limited to approximate more closely the Fund’s investment style, expense structure and asset size (the “Peer Group”) and (iii) an appropriate benchmark index; |
| | |
| n | A report prepared by an independent consultant comparing the advisory fees and other expenses of a representative class of shares of the Fund during its fiscal year ended December 31, 2013 with a similar share class of each fund in the (i) Category and (ii) Peer Group; |
| | |
| n | An analysis of the profitability of the Adviser with respect to its services for the Fund and the Van Eck complex of mutual funds as a whole (the “Van Eck Complex”); |
| | |
| n | Information regarding other investment products and services offered by the Adviser involving investment objectives and strategies similar to the Fund (“Comparable Products”), including the fees charged by the Adviser for managing the Comparable Products, a description of material differences and similarities in the services provided by the Adviser for the Fund and the Comparable Products, the size of the Comparable Products, the performance of the Comparable Products and identity of the individuals responsible for managing the Comparable Products; |
| | |
| n | Information concerning the Adviser’s compliance program, the resources devoted to compliance efforts undertaken by the Adviser on behalf of the Fund, and reports regarding a variety of compliance-related issues; |
| | |
| n | Information with respect to the Adviser’s brokerage practices, including the Adviser’s processes for monitoring best execution of portfolio transactions and the benefits received by the Adviser from research acquired with soft dollars; |
| | |
| n | Information regarding the procedures used by the Adviser in monitoring the valuation of portfolio securities, including the methodologies used in making fair value determinations; |
| | |
| n | Information regarding the Adviser’s policies and practices with respect to personal investing by the Adviser and its employees, including reports regarding the administration of the Adviser’s code of ethics and the Adviser’s policy with respect to investments in the Fund by the Adviser’s investment personnel; |
VAN ECK VIP UNCONSTRAINED EMERGING MARKETS BOND FUND
APPROVAL OF ADVISORY AGREEMENT
(unaudited) (continued)
| n | Descriptions of other administrative and other non-investment management services provided by the Adviser for the Fund, including the Adviser’s activities in managing relationships with the Fund’s custodian, transfer agent and other service providers; and |
| | |
| n | Other information provided by the Adviser in its response to a comprehensive questionnaire prepared by independent legal counsel on behalf of the Independent Trustees. |
In determining whether to approve the continuation of the Advisory Agreement, the Board considered, among other things, the following: (1) the nature, quality, extent and cost of the investment management, administrative and other non-investment management services provided by the Adviser; (2) the nature, quality and extent of the services performed by the Adviser in interfacing with, and monitoring the services performed by, third parties, such as the Fund’s custodian, transfer agent, sub-accounting agent and independent auditors, and the Adviser’s commitment and efforts to review the quality and pricing of third party service providers to the Fund with a view to reducing non-management expenses of the Fund; (3) the terms of the Advisory Agreement and the services performed thereunder; (4) the willingness of the Adviser to reduce the overall expenses of the Fund from time to time, if necessary or appropriate, by means of waiving a portion of its fees or paying expenses of the Fund; (5) the quality of the services, procedures and processes used to determine the value of the Fund’s assets and the actions taken to monitor and test the effectiveness of such services, procedures and processes; (6) the ongoing efforts of, and resources devoted by, the Adviser with respect to the development and implementation of a comprehensive compliance program; (7) the responsiveness of the Adviser to inquiries from, and examinations by, regulatory authorities, including the Securities and Exchange Commission; (8) the resources committed by the Adviser in recent periods to information technology; and (9) the ability of the Adviser to attract and retain quality professional personnel to perform investment advisory and administrative services for the Fund.
The Board considered the fact that the Adviser is managing other investment products, including exchange-traded funds, hedge funds, separate accounts and UCITs, one or more of which may invest in the same financial markets and may be managed by the same investment professionals according to a similar investment objective and/or strategy as the Fund. The Board concluded that the management of these products contributes to the Adviser’s financial stability and is helpful to the Adviser in attracting and retaining quality portfolio management personnel for the Fund. In addition, the Board concluded that the Adviser has established appropriate procedures to monitor conflicts of interest involving the management of the Fund and the other products and for resolving any such conflicts of interest in a fair and equitable manner.
The performance data and the advisory fee and expense ratio data described below for the Fund is based on data for a representative class of shares of the Fund. The performance data is for periods on an annualized basis ended March 31, 2014, and the advisory fee and expense ratio data is as of the Fund’s fiscal year end of December 31, 2013.
Performance. The Board noted that, at the recommendation of the Adviser and in an effort to enhance the performance and long-term viability of the Fund, the Board had approved material changes to the Fund’s principal investment strategies, which became effective May 1, 2013. The Board further noted that, in light of these changes, the performance of the Fund compared to other similarly managed funds prior to May 1, 2013 was not relevant to the Board’s consideration of the Advisory Agreement. The Board then noted, based on a review of comparative annualized total returns, that the Fund had underperformed its Category and Peer Group medians over the one-year period. The Board also noted that the Fund had outperformed it benchmark index for the one-year period. The Board concluded that, in light of the recent changes to the Fund’s principal investment strategies, the Board needs more time to evaluate the effectiveness of the changes.
Fees and Expenses. Fees and Expenses. The Board noted that the advisory fee for the Fund was higher than the median advisory fees for the Fund’s Category and Peer Group and that the total expense ratio for the Fund, net of waivers or reimbursements, was higher than the median expense ratio for its Category and Peer Group. The Board also noted that the Adviser makes use of a complex and unique proprietary strategy for managing the Fund’s portfolio and that the Adviser has agreed to waive fees or pay expenses of the Fund through April 2015 to the extent necessary to prevent the expense ratio of the Fund from exceeding a specified maximum amount. On the basis of the foregoing, and in light of the nature, extent and quality of the services provided by the Adviser, the Board concluded that the advisory fee charged to the Fund is reasonable.
Profitability and Economies of Scale. The Board considered the profits, if any, realized by the Adviser from managing the Fund and other mutual funds in the Van Eck Complex and the methodology used to determine such profits, including the results of an analysis of the methodology performed by an independent consultant in 2013 on behalf of the Board and its independent counsel. The Board noted that the levels of profitability reported on a fund-by-fund basis varied widely depending on such factors as the size, type of fund and operating history. The Board further noted that, in evaluating the
reasonableness of the Adviser’s profits from managing any particular Fund, it would be appropriate to consider the size of the Adviser relative to other firms in the investment management industry and the impact on the Adviser’s profits of the volatility of the markets in which the Funds invest and the volatility of cash flows into and out of the Funds through various market cycles. Based on its review of the foregoing information, and in light of the nature, extent and quality of the services provided by the Adviser, the Board concluded that the profits realized by the Adviser, if any, are not excessive. In this regard, the Board also considered the extent to which the Adviser may realize economies of scale as the Fund grows and whether the Fund’s fee schedule, which includes breakpoints, reflects these economies of scale for the benefit of shareholders. The Board concluded that, with respect to the Fund, the economies of scale being realized, if any, are currently being shared by the Adviser and the Fund, and that adding or modifying existing breakpoints would not be warranted at this time for the Fund.
Conclusion. In determining the material factors to be considered in evaluating the Advisory Agreement and the weight to be given to such factors, the members of the Board relied upon the advice of independent legal counsel and their own business judgment. The Board did not consider any single factor as controlling in determining whether to approve the continuation of the Advisory Agreement and each member of the Board may have placed varying emphasis on particular factors considered in reaching a conclusion. Moreover, this summary description does not necessarily identify all of the factors considered or conclusions reached by the Board. Based on its consideration of the foregoing factors and conclusions, and such other factors and conclusions as it deemed relevant, the Board (comprised exclusively of Independent Trustees) concluded that the continuation of the Advisory Agreement is in the interests of shareholders and, accordingly, the Board approved the continuation of the Advisory Agreement for an additional one-year period.
This report must be preceded or accompanied by a Van Eck VIP (the “Trust”) Prospectus, which includes more complete information. An investor should consider the investment objective, risks, and charges and expenses of the Fund carefully before investing. The prospectus contains this and other information about the investment company. Please read the prospectus carefully before investing.
Additional information about the Trust’s Board of Trustees/Officers and a description of the policies and procedures the Trust uses to determine how to vote proxies relating to portfolio securities are provided in the Statement of Additional Information. The Statement of Information and information regarding how the Trust voted proxies relating to portfolio securities during the most recent twelve month period ending June 30 is available, without charge, by calling 800.826.2333, or by visiting vaneck.com, or on the Securities and Exchange Commission’s website at http://www.sec.gov.
The Trust files its complete schedule of portfolio holdings with the Securities and Exchange Commission for the first and third quarters of each fiscal year on Form N-Q. The Trust’s Form N-Qs are available on the Commission’s website at http://www.sec.gov and may be reviewed and copied at the Commission’s Public Reference Room in Washington, D.C. Information on the operation of the Public Reference Room may be obtained by calling 202.942.8090. The Fund’s complete schedule of portfolio holdings is also available by calling 800.826.2333 or by visiting vaneck.com.

| Investment Adviser: | Van Eck Associates Corporation |
| Distributor: | Van Eck Securities Corporation |
| | 335 Madison Avenue, New York, NY 10017 |
| | vaneck.com |
| Account Assistance: | 800.544.4653 |
| | | | | SEMI-ANNUAL REPORT
JUNE 30, 2014
(unaudited) |
| | |  |
| | | | | |
| | | | | |
| | | Van Eck VIP Trust Van Eck VIP Global Gold Fund |
| | | | | |
| | | | | |
| | | | | |
| | | | | |
| | | | | |
| | | |  |
| | | | | |
The information contained in this shareholder letter represents the personal opinions of the investment team members and may differ from those of other portfolio managers or of the firm as a whole. This information is not intended to be a forecast of future events, a guarantee of future results or investment advice. Also, unless otherwise specifically noted, any discussion of the Fund’s holdings and the Fund’s performance, and the views of the investment team members are as of June 30, 2014 and are subject to change.
VAN ECK VIP GLOBAL GOLD FUND
(unaudited)
Dear Shareholder:
The Class S shares of the Van Eck VIP Global Gold Fund (the “Fund”) rose 35.15% during the six months ended June 30, 2014. To compare, the NYSE Arca Gold Miners Net Total Return Index1 (GDMNTR) was up 25.11% for the same period. The Fund’s outperformance relative to the benchmark was primarily due to effective stock selection and larger exposure to junior gold equities, which outperformed their senior and intermediate peers.
Gold Sector Overview
| ■ | Gold closed at $1,327.32 per ounce on June 30, up $121.67, or 10.1%, for the first half of 2014. |
| ■ | The main driver, in our opinion, was an outbreak of geopolitical risk around the world. Early in the year, tensions in Thailand, Venezuela, Turkey, and Ukraine threatened regional, and possibly global, commerce and financial stability, and were supportive of gold as a safe haven, driving it to an intra-day high of $1,392 per ounce on March 17. |
| ■ | Gold later declined as tensions steadied in Ukraine. This, combined with stronger than expected U.S. data reports, a stronger U.S. dollar, and gains in U.S. equities, sent gold down to a second quarter low of $1,240 per ounce on June 3. |
| ■ | In June, growing Middle East tensions once again created demand for gold, as a hedge against geopolitical risk, bringing it back above the $1,300 per ounce level. This triggered technical trading and short covering, pushing prices higher. |
| ■ | Inflation statistics released on June 17 were, in our opinion, also supportive of gold. The consumer price index rose 0.4% in May. This brings the annualized rate for the first five months of 2014 to 2.6%, while the core rate (excluding food and energy) stands at an annualized 2.3%. Taken alone, no one would consider these numbers problematic. However, to have inflation edging higher at the same time as first quarter GDP growth fell 2.9% raises concerns. |
| ■ | Also, on June 18, the Federal Open Market Committee announced a lower long-run growth and interest rate forecast, which is positive for gold. |
| ■ | Importantly, flows out of global gold bullion exchange-traded products (ETPs) stabilized, with holdings declining only 2.5% year to date as of the end of June. This compares to a drop of over 20% during the same period last year. |
Gold stocks also experienced healthy gains during the first half of 2014, outperforming gold. The positive performance of gold and gold shares this year reflects some shifts in market sentiment. The most significant is the realization that local geopolitical risks have the potential to disrupt global economic well-being. This is supportive of gold. Meanwhile, the gold equity sector has been reclaiming its status as an effective investment for leveraged exposure to gold. Companies continue to focus on increasing their operating margins, maintaining healthy balance sheets, exercising capital discipline, and meeting expectations. This has helped them regain credibility in the markets and has attracted investors who see an opportunity for entry following the oversold levels gold stocks reached at the end of 2013. During the period, gold mining companies reported their fourth quarter 2013, and first quarter 2014, financial results, with most companies meeting or exceeding earnings-per-share expectations. Overall, results suggest to us that, compared to previous years, companies are, in general, being successful in turning around the sector to deliver better profitability and returns to shareholders. The companies are now in better shape fundamentally than we’ve seen in quite a while. In addition, a pick-up in merger & acquisition activity during the first half of the year provided some positive momentum for gold stocks.
Fund Review
The Fund maintained an emphasis on companies that have strong balance sheets and favorable cost structures, as well as royalty and streaming companies, which have no operating costs. The Fund continues to be almost fully invested in equities, positioned to benefit from what we expect will be an outperformance of gold stocks relative to the metal in a rising gold price environment. As of the end of June 2014, the Fund’s cash position represented 2.3% of assets.
Most of the stocks in the portfolio posted gains during the first half of 2014. Royal Gold (4.4% of Fund’s net assets†), one of the Fund’s top holdings, outperformed significantly and gained 65.8% during the period. We believe that this was driven primarily by the company’s attractive royalty business model, which keeps the company cash flow positive, even at low gold prices, and also by the company’s excellent track record of growth. Osisko Mining (1.6% of Fund’s net assets†) also outperformed during the half (up 79.7%), as a result of the company’s takeover by Yamana Gold (6.5% of Fund’s net assets†) and Agnico-Eagle Mines (5.1% of Fund’s net assets†), which was completed on June 16. Yamana Gold underperformed, down 3.6%, likely due to slightly weaker than expected first quarter results and the effect of the Osisko acquisition. Yamana is guiding stronger operating results for the second half of 2014, and we view its acquisition of a stake in Osisko as positive. Small-cap gold mining stocks, as represented by the Market Vectors Junior Gold Miners Index2 (MVGDXJTR), gained 36.6% during the first half of 2014, outperforming relative to both gold and the larger companies.
VAN ECK VIP GLOBAL GOLD FUND
(unaudited)
Outlook
Gold is showing some strength so far this summer, a season that normally experiences demand weakness. We see this as very constructive and it could bode well for gold in the fall, as stronger demand develops. Geopolitical risk has been the dominant driver of the gold market this year. While geopolitical risk is supportive of gold, historically it has not been a longer-term driver. Elevated levels of financial risk are generally needed in order to generate longer-term momentum for gold. We see financial risks building that could become drivers as we move into 2015.
Markets are largely ignoring risk and the level of complacency should have contrarian investors on alert. A number of financial metrics indicate a heightened tolerance for risk. The stock market continues to make all-time highs, while the future CBOE Volatility Index3 (VIX) and the St. Louis Fed Financial Stress Index4 are near the record low levels last seen in 2007, before the 2008 financial melt-down. Corporate bond spreads are also down to 2007 levels. The sovereign debt of European nations is higher now than it was during the sovereign debt crisis. Yet 10-year sovereign yields are near record lows. Even central banks are now buying equities, as the Swiss, Danish, and Chinese have disclosed recently.
In our view, zero interest rate policies, led by the Federal Reserve and followed by the European Central Bank and the Bank of Japan, are responsible for the complacency toward risk and the reach for yield. Yet it seems policy makers are oblivious to the potential for unintended consequences of their policies. We were flabbergasted by Fed Chairwoman Yellen’s comments in a July 3, 2014 interview reported in the Wall Street Journal: “Monetary policy faces significant limitations as a tool to promote financial stability. Its effects on financial vulnerabilities, such as excessive leverage and maturity transformations, are not well understood”. And: “The potential cost, in terms of diminished macroeconomic performance, is likely to be too great to give financial stability risks a central role in monetary policy decisions.” We had thought that after experiencing a crisis that nearly destroyed the financial system, Ms. Yellen might see a stronger role for the Fed in reducing the odds of another. Ms. Yellen’s comments suggest that the Fed is either incapable of, or unwilling to, use the tools at its disposal to moderate the credit cycle in order to help reduce the severity of the downturns.
It is our view that, until significant fundamental changes are made in the way the monetary system is managed, the markets will continue to be prone to financial risks that are highly disruptive. Gold or gold-related investments were among the best performing asset classes during the ‘30s, ‘70s, and ‘00s (2000 – 2010), the three most financially destructive decades of the past century. We believe the financial system remains vulnerable, and Ms. Yellen’s comments only add to our conviction.
The Fund is subject to the risks associated with concentrating its assets in the gold industry, which can be significantly affected by international economic, monetary and political developments. The Fund’s overall portfolio may decline in value due to developments specific to the gold industry. The Fund’s investments in foreign securities involve risks related to adverse political and economic developments unique to a country or a region, currency fluctuations or controls, and the possibility of arbitrary action by foreign governments, including the takeover of property without adequate compensation or imposition of prohibitive taxation. The Fund is subject to risks associated with investments in debt securities, derivatives, commodity-linked instruments, illiquid securities, asset-backed securities, CMOs and small- or mid-cap companies. The Fund is also subject to inflation risk, short sales risk, market risk, non-diversification risk and leverage risk. Please see the prospectus for information on these and other risk considerations.
We appreciate your continued investment in the Van Eck VIP Global Gold Fund, and we look forward to helping you meet your investment goals in the future.
 | |  |
| | | |
| Joseph M. Foster | | Imaru Casanova |
| Portfolio Manager | | Deputy Portfolio Manager |
| | | |
| July 10, 2014 | | |
The performance quoted represents past performance. Past performance is no guarantee of future results; current performance may be lower or higher than the performance data quoted. Performance information reflects temporary waivers of expenses and/or fees and does not include insurance/annuity fees and expenses. Investment returns would have been reduced had these fees/expenses been included. Investment return and the value of the shares of the Fund will fluctuate so that an investor’s shares, when redeemed, may be worth more or less than their original cost. Fund returns assume that dividends and capital gains distributions have been reinvested in the Fund at NAV. Index returns assume that dividends of the Index constituents in the Index have been reinvested. Performance information current to the most recent month end is available by calling 1.800.826.2333.
The Fund is only available to life insurance and annuity companies to fund their variable annuity and variable life insurance products. These contracts offer life insurance and tax benefits to the beneficial owners of the Fund. Your insurance or annuity company charges, fees and expenses for these benefits are not reflected in this report or in the Fund’s performance, since they are not direct expenses of the Fund. Had these fees been included, returns would have been lower. For insurance products, performance figures do not reflect the cost for insurance and if they did, the performance shown would be significantly lower. A review of your particular life and/or annuity contract will provide you with much greater detail regarding these costs and benefits.
| † | All Fund assets referenced are Total Net Assets as of June 30, 2014. |
All indices listed are unmanaged indices and include the reinvestment of all dividends, but do not reflect the payment of transaction costs, advisory fees or expenses that are associated with an investment in the Fund. An index’s performance is not illustrative of the Fund’s performance. Indices are not securities in which investments can be made.
| 1 | NYSE Arca Gold Miners Net Total Return Index (GDMNTR) is a market capitalization-weighted index comprised of publicly traded companies involved primarily in the mining for gold. |
| | |
| 2 | Market Vectors® Junior Gold Miners Index (MVGDXJTR) is a rules-based, modified market capitalization-weighted, flat-adjusted index comprised of a focused group of small- and mid-cap companies in the gold or silver mining industry. |
| | |
| 3 | CBOE Volatility Index (VIX) is a popular measure of the implied volatility of S&P 500® Index options, representing one measure of the market’s expectation of stock market volatility over the next 30 day period. |
| | |
| 4 | St. Louis Fed Financial Stress Index measures the degree of financial stress in the markets and is constructed from 18 weekly data series. |
VAN ECK VIP GLOBAL GOLD FUND
TOP TEN EQUITY HOLDINGS*
June 30, 2014 (unaudited)
Randgold Resources Ltd.
(United Kingdom, 8.9%)
Randgold explores, develops and operates mines and mineral interests in sub-Saharan Africa. The group operates producing mines and projects in Mali, Cote d’Ivoire, Democratic Republic of Congo, and Senegal.
Eldorado Gold Corp.
(Canada, 6.8%)
Eldorado is a growing mid-tier gold producer with mines and projects in Turkey, China, Greece, Romania and Brazil. The company is positioned to become a major gold company, with production expected to grow to more than 1 million ounces of gold annually within the next five years.
Yamana Gold, Inc.
(Canada, 6.5%)
Yamana Gold is an intermediate gold producer with a focus in the Americas. The company has producing, development stage, and exploration stage properties throughout Brazil, Argentina, Chile, Mexico, and Canada.
New Gold, Inc.
(Canada, 5.7%)
New Gold acquires, explores, and develops gold properties, with operating assets currently in the United States, Canada, Mexico and Australia. In addition, the company has development and exploration projects in Canada and Chile.
Agnico-Eagle Mines Ltd.
(Canada, 5.1%)
Agnico-Eagle Mines is a gold producer with operations primarily in northwestern Quebec, northern Mexico, northern Finland and Nunavut. The company also has exploration activities in Canada, Europe, Latin America, and the United States. Agnico-Eagle focuses on the exploration, development, and expansion of its gold properties primarily from underground operations.
Goldcorp, Inc.
(Canada, 4.9%)
Goldcorp is a major gold producer in the Americas, with operations and projects in Canada, United States, Mexico, Central and South America. Goldcorp owns the Red Lake Mine in Ontario, Canada, considered the richest grade gold mine in the world.
Tahoe Resources, Inc.
(U.S., 4.8%)
Tahoe Resources is on its way to becoming one of the world’s largest primary silver producers, having declared commercial production at its Escobal silver mine in Guatemala in January 2014.
B2Gold Corp.
(Canada, 4.7%)
B2Gold is a gold exploration and production company. The company is a Vancouver-based gold producer with mines in Nicaragua and a portfolio of development and exploration assets in Nicaragua, Colombia and Uruguay.
Franco-Nevada Corp.
(Canada, 4.7%)
Franco-Nevada is a resource royalty and investment company. The company owns a diversified portfolio of precious and base metal royalties, oil and natural gas royalties and other interests, including assets in production, under development or in the exploration phase mostly located in geopolitically secure countries.
Royal Gold, Inc.
(U.S., 4.4%)
Royal Gold acquires and manages precious metals royalties. The company seeks to acquire existing royalties and/or finance projects that are in production or near production in exchange for royalty interests. Royal Gold’s gold-focused portfolio contains royalties ranging from those in production and development to those in the evaluation and exploration stages.
| * | Percentage of net assets.
Portfolio is subject to change.
Company descriptions courtesy of bloomberg.com |
VAN ECK VIP GLOBAL GOLD FUND
EXPLANATION OF EXPENSES
(unaudited)
As a shareholder of the Fund, you incur two types of costs: (1) transaction costs, including program fees on purchase payments; and (2) ongoing costs, including management fees and other Fund expenses. This disclosure is intended to help you understand the ongoing costs (in dollars) of investing in the Fund and to compare these costs with the ongoing costs of investing in other mutual funds.
The disclosure is based on an investment of $1,000 invested at the beginning of the period and held for the entire period, January 1, 2014 to June 30, 2014.
Actual Expenses
The first line in the table below provides information about account values and actual expenses. You may use the information in this line, together with the amount you invested, to estimate the expenses that you paid over the period. Simply divide your account value by $1,000 (for example, an $8,600 account value divided by $1,000 = 8.6), then multiply the result by the number in the first line under the heading entitled “Expenses Paid During the Period.”
Hypothetical Example for Comparison Purposes
The second line in the table below provides information about hypothetical account values and hypothetical expenses based on the Fund’s actual expense ratio and an assumed rate of return of 5% per year before expenses, which is not the Fund’s actual return. The hypothetical account values and expenses may not be used to estimate the actual ending account balance or expenses you paid for the period. You may use this information to compare the ongoing costs of investing in the Fund and other funds. To do so, compare this 5% hypothetical example with the 5% hypothetical examples that appear in the shareholder reports of other funds.
Please note that the expenses shown in the table are meant to highlight your ongoing costs only and do not reflect any transactional costs, such as fees on purchase payments. Therefore, the second line of the table is useful in comparing ongoing costs only, and will not help you determine the relative costs of owning different funds. In addition, if these transactional costs were included, your costs would have been higher.
Van Eck VIP Global Gold Fund
| | | | | | | | Expenses Paid |
| | | | Beginning | | Ending | | During the Period* |
| | | | Account Value | | Account Value | | January 1, 2014 – |
| | | | January 1, 2014 | | June 30, 2014 | | June 30, 2014 |
| Class S | Actual | | $1,000.00 | | $1,351.50 | | $8.45 |
| | Hypothetical** | | $1,000.00 | | $1,017.60 | | $7.25 |
| * | Expenses are equal to the Fund’s annualized expense ratio (for the six months ended June 30, 2014), of 1.45% multiplied by the average account value over the period, multiplied by the number of days in the most recent fiscal half year divided by the number of days in the fiscal year (to reflect the one-half year period). |
| | |
| ** | Assumes annual return of 5% before expenses |
VAN ECK VIP GLOBAL GOLD FUND
CONSOLIDATED SCHEDULE OF INVESTMENTS
June 30, 2014 (unaudited)
| Number of | | | | | |
| Shares | | | | Value | |
| | | | | |
| COMMON STOCKS: 97.7% | | | | |
| | | | | |
| Australia: 6.0% | | | | |
| | 99,000 | | | Evolution Mining Ltd. # | | $ | 66,206 | |
| | 194,768 | | | Gold Road Resources Ltd. * # | | | 53,378 | |
| | 66,000 | | | Gryphon Minerals Ltd. * # | | | 10,103 | |
| | 21,000 | | | Newcrest Mining Ltd. * # | | | 210,916 | |
| | 14,000 | | | OceanaGold Corp. (CAD) * | | | 43,428 | |
| | 74,000 | | | Papillon Resources Ltd. * # | | | 133,592 | |
| | | | | | | | 517,623 | |
| Canada: 68.6% | | | | |
| | 6,538 | | | Agnico-Eagle Mines Ltd. | | | 250,341 | |
| | 5,000 | | | Agnico-Eagle Mines Ltd. (USD) | | | 191,500 | |
| | 9,000 | | | Alamos Gold, Inc. | | | 91,008 | |
| | 43,000 | | | Argonaut Gold, Inc. * | | | 178,117 | |
| | 21,000 | | | Asanko Gold, Inc. * | | | 54,712 | |
| | 17,000 | | | Asanko Gold, Inc. (USD) * | | | 44,030 | |
| | 71,000 | | | AuRico Gold, Inc. (USD) | | | 302,460 | |
| | 67,000 | | | B2Gold Corp. * | | | 195,277 | |
| | 72,000 | | | B2Gold Corp. (USD) * | | | 210,240 | |
| | 17,000 | | | Bear Creek Mining Corp. * | | | 47,795 | |
| | 26,000 | | | Belo Sun Mining Corp. * | | | 4,264 | |
| | 21,000 | | | Castle Mountain Mining Co. Ltd. * | | | 13,383 | |
| | 8,000 | | | Cayden Resources, Inc. * | | | 13,870 | |
| | 29,000 | | | Continental Gold Ltd. * | | | 95,122 | |
| | 12,000 | | | Eastmain Resources, Inc. * | | | 4,780 | |
| | 76,000 | | | Eldorado Gold Corp. (USD) | | | 580,640 | |
| | 15,000 | | | Fortuna Silver Mines, Inc. (USD) * | | | 82,650 | |
| | 7,000 | | | Franco-Nevada Corp. (USD) | | | 401,380 | |
| | 12,000 | | | Gold Canyon Resources, Inc. * | | | 3,824 | |
| | 15,000 | | | Goldcorp, Inc. (USD) | | | 418,650 | |
| | 22,000 | | | Guyana Goldfields, Inc. * | | | 53,193 | |
| | 38,000 | | | Klondex Mines Ltd. * | | | 71,224 | |
| | 2,500 | | | New Gold, Inc. * | | | 15,862 | |
| | 74,500 | | | New Gold, Inc. (USD) * | | | 474,565 | |
| | 48,000 | | | Orezone Gold Corp. * | | | 39,136 | |
| | 9,000 | | | Osisko Gold Royalties Ltd. * | | | 135,373 | |
| | 9,000 | | | Premier Gold Mines Ltd. * | | | 24,882 | |
| | 6,000 | | | Pretium Resources, Inc. * | | | 49,651 | |
| | 23,500 | | | Primero Mining Corp. (USD) * | | | 188,235 | |
| | 6,000 | | | Probe Mines Ltd. * | | | 15,295 | |
| | 45,200 | | | Rio Alto Mining Ltd. * | | | 105,052 | |
| | 38,000 | | | Romarco Minerals, Inc. * | | | 31,695 | |
| | 77,900 | | | Roxgold, Inc. * | | | 62,054 | |
| | 6,000 | | | Rubicon Minerals Corp. * | | | 8,884 | |
| | 31,000 | | | Rubicon Minerals Corp. (USD) * | | | 45,570 | |
| | 42,000 | | | Sabina Gold & Silver Corp. * | | | 34,244 | |
| | 26,000 | | | Semafo, Inc. | | | 122,075 | |
| | 13,000 | | | Silver Wheaton Corp. (USD) | | | 341,510 | |
| | 45,000 | | | Sulliden Gold Corp. Ltd. * | | | 58,198 | |
| | 45,914 | | | Timmins Gold Corp. * | | | 82,185 | |
| | 120,000 | | | Torex Gold Resources, Inc. * | | | 183,309 | |
| | 23,824 | | | Yamana Gold, Inc. | | | 196,030 | |
| | 44,000 | | | Yamana Gold, Inc. (USD) | | | 361,680 | |
| | | | | | | | 5,883,945 | |
| Number of | | | | | |
| Shares | | | | Value | |
| | | | | |
| Mexico: 1.9% | | | | |
| | 11,000 | | | Fresnillo Plc (GBP) # | | $ | 165,303 | |
| South Africa: 1.8% | | | | |
| | 9,000 | | | AngloGold Ashanti Ltd. (ADR) * | | | 154,890 | |
| United Kingdom: 9.7% | | | | |
| | 63,000 | | | Amara Mining Plc * # | | | 24,597 | |
| | 37,600 | | | Lydian International Ltd. (CAD) * | | | 44,751 | |
| | 9,000 | | | Randgold Resources Ltd. (ADR) | | | 761,400 | |
| | | | | | | | 830,748 | |
| United States: 9.7% | | | | |
| | 39,000 | | | Midway Gold Corp. * | | | 35,100 | |
| | 5,000 | | | Royal Gold, Inc. | | | 380,600 | |
| | 15,700 | | | Tahoe Resources, Inc. (CAD) * | | | 411,094 | |
| | | | | | | | 826,794 | |
Total Common Stocks
(Cost: $7,420,359) | | | 8,379,303 | |
| | | | | |
MONEY MARKET FUND: 2.6%
(Cost: $223,937) | | | | |
| | 223,937 | | | AIM Treasury Portfolio – Institutional Class | | | 223,937 | |
Total Investments: 100.3%
(Cost: $7,644,296) | | | 8,603,240 | |
| Liabilities in excess of other assets: (0.3)% | | | (22,310 | ) |
| NET ASSETS: 100.0% | | $ | 8,580,930 | |
| ADR | — | American Depositary Receipt |
| CAD | — | Canadian Dollar |
| GBP | — | British Pound |
| USD | — | United States Dollar |
| * | Non-income producing |
| # | Indicates a fair valued security which has not been valued utilizing an independent quote, but has been valued pursuant to guidelines established by the Board of Trustees. The aggregate value of fair valued securities is $664,095 which represents 7.7% of net assets. |
See Notes to Financial Statements
| Summary of Investments | | % of | | | | |
| by Sector (unaudited) | | Investments | | Value | | |
| Diversified Metals & Mining | | | 1.8 | % | | $ | 157,946 | | |
| Gold | | | 82.6 | | | | 7,101,781 | | |
| Precious Metals & Minerals | | | 8.1 | | | | 695,416 | | |
| Silver | | | 4.9 | | | | 424,160 | | |
| Money Market Fund | | | 2.6 | | | | 223,937 | | |
| | | | 100.0 | % | | $ | 8,603,240 | | |
The summary of inputs used to value the Fund’s investments as of June 30, 2014 is as follows:
| | | | | | Level 2 | | | Level 3 | | | | |
| | | Level 1 | | | Significant | | | Significant | | | | |
| | | Quoted | | | Observable | | | Unobservable | | | | |
| | | Prices | | | Inputs | | | Inputs | | | Value | |
| Common Stocks | | | | | | | | | | | | | | | | |
| Australia | | $ | 43,428 | | | $ | 474,195 | | | $ | — | | | $ | 517,623 | |
| Canada | | | 5,883,945 | | | | — | | | | — | | | | 5,883,945 | |
| Mexico | | | — | | | | 165,303 | | | | — | | | | 165,303 | |
| South Africa | | | 154,890 | | | | — | | | | — | | | | 154,890 | |
| United Kingdom | | | 806,151 | | | | 24,597 | | | | — | | | | 830,748 | |
| United States | | | 826,794 | | | | — | | | | — | | | | 826,794 | |
| Money Market Fund | | | 223,937 | | | | — | | | | — | | | | 223,937 | |
| Total | | $ | 7,939,145 | | | $ | 664,095 | | | $ | — | | | $ | 8,603,240 | |
See Notes to Financial Statements
VAN ECK VIP GLOBAL GOLD FUND
CONSOLIDATED STATEMENT OF ASSETS AND LIABILITIES
June 30, 2014 (unaudited)
| Assets: | | | | |
| Investments, at value (Cost $7,644,296) | | $ | 8,603,240 | |
| Cash | | | 10,359 | |
| Cash denominated in foreign currency, at value (Cost $1,037) | | | 1,047 | |
| Receivables: | | | | |
| Investments sold | | | 93,511 | |
| Due from Adviser | | | 537 | |
| Dividends | | | 2,166 | |
| Total assets | | | 8,710,860 | |
| | | | | |
| Liabilities: | | | | |
| Payables: | | | | |
| Investments purchased | | | 87,635 | |
| Shares of beneficial interest redeemed | | | 8,728 | |
| Due to Distributor | | | 1,571 | |
| Deferred Trustee fees | | | 797 | |
| Accrued expenses | | | 31,199 | |
| Total liabilities | | | 129,930 | |
| NET ASSETS | | $ | 8,580,930 | |
| Shares of beneficial interest outstanding | | | 930,823 | |
| Net asset value, redemption and offering price per share | | $ | 9.22 | |
| | | | | |
| Net Assets consist of: | | | | |
| Aggregate paid in capital | | $ | 7,652,881 | |
| Net unrealized appreciation | | | 958,885 | |
| Accumulated net investment loss | | | (50,805 | ) |
| Accumulated net realized gain | | | 19,969 | |
| | | $ | 8,580,930 | |
See Notes to Financial Statements
CONSOLIDATED STATEMENT OF OPERATIONS
For the six months ended June 30, 2014 (unaudited)
| Income: | | | | | | |
| Dividends (net of foreign taxes withheld of $2,723) | | | | | | $ | 20,748 | |
| | | | | | | | | |
| Expenses: | | | | | | | | |
| Management fees | | $ | 24,930 | | | | | |
| Distribution fees | | | 8,310 | | | | | |
| Transfer agent fees | | | 6,847 | | | | | |
| Administration fees | | | 8,310 | | | | | |
| Custodian fees | | | 13,075 | | | | | |
| Professional fees | | | 16,222 | | | | | |
| Reports to shareholders | | | 8,451 | | | | | |
| Trustees’ fees and expenses | | | 1,061 | | | | | |
| Other | | | 313 | | | | | |
| Total expenses | | | 87,519 | | | | | |
| Waiver of management fees | | | (24,930 | ) | | | | |
| Expenses assumed by the Adviser | | | (14,232 | ) | | | | |
| Net expenses | | | | | | | 48,357 | |
| Net investment loss | | | | | | | (27,609 | ) |
| | | | | | | | | |
| Net realized gain on: | | | | | | | | |
| Investments | | | | | | | 140,414 | |
| Foreign currency transactions and foreign denominated assets and liabilities | | | | | | | 2,400 | |
| Net realized gain | | | | | | | 142,814 | |
| | | | | | | | | |
| Net change in unrealized appreciation (depreciation) on: | | | | | | | | |
| Investments | | | | | | | 1,764,353 | |
| Foreign currency transactions and foreign denominated assets and liabilities | | | | | | | (62 | ) |
| Net change in unrealized appreciation (depreciation) | | | | | | | 1,764,291 | |
| Net Increase in Net Assets Resulting from Operations | | | | | | $ | 1,879,496 | |
See Notes to Financial Statements
VAN ECK VIP GLOBAL GOLD FUND
CONSOLIDATED STATEMENT OF CHANGES IN NET ASSETS
| | | For the
Six Months
Ended June 30,
2014 | | For the Period
April 26, 2013(a)
through
December 31,
2013 |
| | | | (unaudited) | | | | | |
| Operations: | | | | | | | | | | |
| Net investment loss | | | $ | (27,609 | ) | | | $ | (12,753 | ) |
| Net realized gain (loss) | | | | 142,814 | | | | | (115,212 | ) |
| Net change in unrealized appreciation (depreciation) | | | | 1,764,291 | | | | | (805,406 | ) |
| Net increase (decrease) in net assets resulting from operations | | | | 1,879,496 | | | | | (933,371 | ) |
| | | | | | | | | | | |
| Dividends to shareholders from: | | | | | | | | | | |
| Net investment income | | | | (22,846 | ) | | | | — | |
| | | | | | | | | | | |
| Share transactions*: | | | | | | | | | | |
| Proceeds from sale of shares | | | | 2,811,833 | | | | | 6,475,588 | |
| Reinvestment of dividends | | | | 22,846 | | | | | — | |
| Cost of shares redeemed | | | | (930,861 | ) | | | | (721,755 | ) |
| Net increase in net assets resulting from share transactions | | | | 1,903,818 | | | | | 5,753,833 | |
| Total increase in net assets | | | | 3,760,468 | | | | | 4,820,462 | |
| | | | | | | | | | | |
| Net Assets: | | | | | | | | | | |
| Beginning of period | | | | 4,820,462 | | | | | — | |
| End of period (including accumulated net investment loss of ($50,805) and ($350), respectively) | | | $ | 8,580,930 | | | | $ | 4,820,462 | |
| | | | | | | | | | | |
| * | Shares of beneficial interest issued, reinvested and redeemed
(unlimited number of $.001 par value shares authorized): | | | | | | | | | | |
| Shares sold | | | | 342,504 | | | | | 787,693 | |
| Shares reinvested | | | | 3,018 | | | | | — | |
| Shares redeemed | | | | (118,710 | ) | | | | (83,682 | ) |
| Net increase | | | | 226,812 | | | | | 704,011 | |
| (a) | Commencement of operations |
See Notes to Financial Statements
FINANCIAL HIGHLIGHTS
For a share outstanding throughout the period:
| | | For the
Six Months
Ended
June 30, 2014 | | For the Period
April 26, 2013(a)
through
December 31,
2013 |
| | | (unaudited) | | | |
| Net asset value, beginning of period | | | $6.85 | | | | $8.88 | |
| Income from investment operations: | | | | | | | | |
| Net investment loss | | | (0.02 | ) | | | (0.02 | ) |
| Net realized and unrealized gain (loss) on investments | | | 2.42 | | | | (2.01 | ) |
| Total from investment operations | | | 2.40 | | | | (2.03 | ) |
| Less dividends from: | | | | | | | | |
| Net investment income | | | (0.03 | ) | | | — | |
| Net asset value, end of period | | | $9.22 | | | | $6.85 | |
| Total return (b) | | | 35.15 | %(c) | | | (22.86 | )%(c) |
| | | | | | | | | |
| | | | | | | | | |
| Ratios/Supplemental Data | | | | | | | | |
| Net Assets, end of period (000’s) | | | $8,581 | | | | $4,820 | |
| Ratio of gross expenses to average net assets | | | 2.62 | %(d) | | | 4.82 | %(d) |
| Ratio of net expenses to average net assets | | | 1.45 | %(d) | | | 1.45 | %(d) |
| Ratio of net expenses, excluding interest expense, to average net assets | | | 1.45 | %(d) | | | 1.45 | %(d) |
| Ratio of net investment loss to average net assets | | | (0.83 | )%(d) | | | (0.55 | )%(d) |
| Portfolio turnover rate | | | 24 | %(c) | | | 33 | %(c) |
| (a) | Commencement of operations |
| (b) | Total return is calculated assuming an initial investment made at the net asset value at the beginning of period, reinvestment of any dividends and distributions at net asset value on the dividend/distributions payment date and a redemption at the net asset value on the last day of the period. The return does not reflect the deduction of taxes that a shareholder would pay on Fund dividends/distributions or the redemption of Fund shares |
| (c) | Not annualized |
| (d) | Annualized |
See Notes to Financial Statements
VAN ECK VIP GLOBAL GOLD FUND
NOTES TO CONSOLIDATED FINANCIAL STATEMENTS
June 30, 2014 (unaudited)
Note 1—Fund Organization—Van Eck VIP Trust (the “Trust”) is registered under the Investment Company Act of 1940, as amended, as an open-end management investment company. The Trust was organized as a Massachusetts business trust on January 7, 1987. The Van Eck VIP Global Gold Fund (the “Fund”) is a non-diversified series of the Trust and seeks long-term capital appreciation by investing in common stocks of gold-mining companies or directly in gold bullion and other metals. The Fund may effect certain investments through the VIP Gold Fund Subsidiary (the “Subsidiary”), a wholly-owned subsidiary. The Fund currently offers a single class of shares: Class S shares.
Note 2—Significant Accounting Policies—The preparation of financial statements in conformity with U.S. generally accepted accounting principles (“GAAP”) requires management to make estimates and assumptions that affect the reported amounts and disclosures in the financial statements. Actual results could differ from those estimates.
The Fund is an investment company and is following accounting and reporting requirements of Accounting Standard Codification (“ASC”) 946 Financial Services - Investment Companies.
The following is a summary of significant accounting policies followed by the Fund.
| A. | Security Valuation—The Fund values its investments in securities and other assets and liabilities carried at fair value daily. Fair value is the price that would be received to sell an asset or paid to transfer a liability in an orderly transaction between market participants on the measurement date. Securities traded on national exchanges or traded on the NASDAQ National Market System are valued at the last sales price reported at the close of each business day. Securities traded on the NASDAQ Stock Market are valued at the NASDAQ official closing price. Over-the-counter securities not included in the NASDAQ National Market System and listed securities for which no sale was reported are valued at the mean of the bid and ask prices. To the extent these securities are actively traded they are categorized as Level 1 in the fair value hierarchy (as described below). Certain foreign securities, whose values may be affected by market direction or events occurring before the Fund’s pricing time (4:00 p.m. Eastern Standard Time) but after the last close of the securities’ primary market, are fair valued using a pricing service and are categorized as Level 2 in the fair value hierarchy. The pricing service considers the correlation of the trading patterns of the foreign security to intraday trading in the U.S. market, based on indices of domestic securities and other appropriate indicators such as prices of relevant ADR’s and futures contracts. The Fund may also fair value securities in other situations, such as, when a particular foreign market is closed but the Fund is open. Short-term obligations purchased with more than sixty days remaining to maturity are valued at market value. Short-term obligations purchased with sixty days or less to maturity are valued at amortized cost, which with accrued interest approximates fair value. Money market fund investments are valued at net asset value and are classified as Level 1 in the fair value hierarchy. Forward foreign currency contracts are valued at the spot currency rate plus an amount (“points”), which reflects the differences in interest rates between the U.S. and foreign markets. Securities for which quotations are not available are stated at fair value as determined by the Pricing Committee of Van Eck Associates Corporation (the “Adviser”) appointed by the Board of Trustees. The Pricing Committee provides oversight of the Fund’s valuation policies and procedures, which are approved by the Fund’s Board of Trustees. Among other things, these procedures allow the Fund to utilize independent pricing services, quotations from securities dealers, and other market sources to determine fair value. The Pricing Committee convenes regularly to review the fair value of financial instruments for which market prices are not readily available. The Pricing Committee employs various methods for calibrating the valuation approaches utilized to determine fair value, including a regular review of key inputs and assumptions, transactional back-testing and disposition analysis. |
| | |
| | Certain factors such as economic conditions, political events, market trends, the nature of and duration of any restrictions on disposition, trading in similar securities of the issuer or comparable issuers and other security specific information are used to determine the fair value for these securities. Depending on the relative significance of valuation inputs, these securities may be classified either as Level 2 or Level 3 in the fair value hierarchy. The price which the Fund may realize upon sale of an investment may differ materially from the value presented in the Consolidated Schedule of Investments. |
| | |
| | The Fund utilizes various methods to measure the fair value of its investments on a recurring basis which includes a hierarchy that prioritizes inputs to valuation methods used to measure fair value. The fair value hierarchy gives highest priority to unadjusted quoted prices in active markets for identical assets and liabilities (Level 1 measurements) and the lowest priority to unobservable inputs (Level 3 measurements). The inputs or methodologies used for valuing securities are not necessarily an indication of the risk associated with investing in those securities. The transfers between levels of the fair value hierarchy assume the financial instruments were transferred at the beginning of the reporting period. The three levels of the fair value hierarchy are described below: |
| | Level 1 – | Quoted prices in active markets for identical securities. |
| | | |
| | Level 2 – | Significant observable inputs (including quoted prices for similar securities, interest rates, prepayment speeds, credit risk, etc.). |
| | | |
| | Level 3 – | Significant unobservable inputs (including the Fund’s own assumptions in determining the fair value of investments). |
| | A summary of the inputs, the levels used to value the Fund’s investments, and transfers between levels are located in the Consolidated Schedule of Investments. Additionally, tables that reconcile the valuation of the Fund’s Level 3 investments and that present additional information about valuation methodologies and unobservable inputs, if applicable, are located in the Consolidated Schedule of Investments. |
| | |
| B. | Basis for Consolidation—The Subsidiary, a Cayman Islands exempted company, was incorporated on January 25, 2013. The Subsidiary acts as an investment vehicle in order to effect certain investments on behalf of the Fund. All interfund account balances and transactions between the Fund and Subsidiary have been eliminated in consolidation. As of June 30, 2014, the Fund held $14,230 in its Subsidiary, representing 0.2% of the Fund’s net assets. |
| | |
| C. | Federal Income Taxes—It is the Fund’s policy to comply with the provisions of the Internal Revenue Code applicable to regulated investment companies and to distribute all of its taxable income to its shareholders. Therefore, no federal income tax provision is required. |
| | |
| D. | Currency Translation—Assets and liabilities denominated in foreign currencies and commitments under foreign currency contracts are translated into U.S. dollars at the closing prices of such currencies each business day. Purchases and sales of investments are translated at the exchange rates prevailing when such investments are acquired or sold. Income and expenses are translated at the exchange rates prevailing when accrued. The portion of realized and unrealized gains and losses on investments that result from fluctuations in foreign currency exchange rates is not separately disclosed. Recognized gains or losses attributable to foreign currency fluctuations on foreign currency denominated assets, other than investments, and liabilities are recorded as net realized gain (loss) on foreign currency transactions and foreign denominated assets and liabilities in the Consolidated Statement of Operations. |
| | |
| E. | Dividends and Distributions to Shareholders—Dividends to shareholders from net investment income and distributions from net realized capital gains, if any, are declared and paid annually. Income dividends and capital gain distributions are determined in accordance with U.S. income tax regulations, which may differ from such amounts determined in accordance with GAAP. |
| | |
| F. | Use of Derivative Instruments—The Fund may make investments in derivative instruments, including, but not limited to, options, futures, swaps and other derivatives relating to foreign currency transactions. A derivative is an instrument whose value is derived from underlying assets, indices, reference rates or a combination of these factors. Derivative instruments may be privately negotiated contracts (often referred to as over-the-counter (“OTC”) derivatives) or they may be listed and traded on an exchange. Derivative contracts may involve future commitments to purchase or sell financial instruments at specified terms on a specified date, or to exchange interest payment streams or currencies based on a notional or contractual amount. Derivative instruments may involve a high degree of financial risk. The use of derivative instruments also involves the risk of loss if the investment adviser is incorrect in its expectation of the timing or level of fluctuations in securities prices, interest rates or currency prices. Investments in derivative instruments also include the risk of default by the counterparty, the risk that the investment may not be liquid and the risk that a small movement in the price of the underlying security or benchmark may result in a disproportionately large movement, unfavorable or favorable, in the price of the derivative instrument. GAAP requires enhanced disclosures about the Fund’s derivative instruments and hedging activities. The Fund held no derivative instruments outstanding during the period ended June 30, 2014. |
| | |
| | Forward Foreign Currency Contracts—The Fund is subject to foreign currency risk in the normal course of pursuing its investment objectives. The Fund may buy and sell forward foreign currency contracts to settle purchases and sales of foreign denominated securities, gain currency exposure or to hedge foreign denominated assets. Realized gains and losses from forward foreign currency contracts, if any, are included in realized gain (loss) on foreign currency transactions and foreign denominated assets and liabilities in the Consolidated Statement of Operations. The Fund may incur additional risk from investments in forward foreign currency contracts if the counterparty is unable to fulfill its obligation or there are unanticipated movements of the foreign currency relative to the U.S. dollar. The Fund held no forward foreign currency contracts during the period ended June 30, 2014. |
| | |
| G. | Other—Security transactions are accounted for on trade date. Dividend income is recorded on the ex-dividend date except that certain dividends from foreign securities are recognized upon notification of the ex-dividend date. Realized gains and losses are calculated on the identified cost basis. Interest income, including amortization of premiums and discounts, is accrued as earned. Estimated foreign taxes that are expected to be withheld from proceeds at the sale of certain foreign investments are accrued by the Fund and decrease the unrealized gain on investments. |
| | |
| | In the normal course of business, the Fund enters into contracts that contain a variety of general indemnifications. The Fund’s maximum exposure under these agreements is unknown as this would involve future claims that may be made against the Fund that have not yet occurred. However, the Adviser believes the risk of loss under these arrangements to be remote. |
VAN ECK VIP GLOBAL GOLD FUND
NOTES TO CONSOLIDATED FINANCIAL STATEMENTS
(unaudited) (continued)
Note 3—Investment Management and Other Agreements—The Adviser is the investment adviser to the Fund. The Adviser receives a management fee, calculated daily and payable monthly based on an annual rate of 0.75% of the first $500 million of the Fund’s average daily net assets, 0.65% of the next $250 million of average daily net assets and 0.50% of the average daily net assets in excess of $750 million. The Adviser has agreed, at least until May 1, 2015, to waive management fees and/or assume expenses (excluding acquired fund fees and expenses, interest expense, trading expenses, dividends and interest payments on securities sold short, taxes, and extraordinary expenses) from exceeding 1.45% of the Fund’s average daily net assets. For the period ended June 30, 2014, the Adviser waived management fees in the amount of $24,930 and assumed expenses in the amount of $14,232. Certain officers and trustees of the Trust are officers, directors or stockholders of the Adviser and Van Eck Securities Corporation, (the “Distributor”).
The Adviser also performs accounting and administrative services for the Fund. The Adviser is paid a monthly fee at a rate of 0.25% of the average daily net assets for the Fund per year on the first $750 million of the average daily net assets and 0.20% per year of the average daily net assets in excess of $750 million. During the period ended June 30, 2014, the Adviser received $8,310 from the Fund pursuant to this contract.
Note 4—12b-1 Plans of Distribution—The Fund and the Distributor are parties to a distribution agreement dated April 26, 2013. The Fund has adopted a Distribution Plan (the “Plan”) in accordance with Rule 12b-1 under the 1940 Act. Pursuant to the Plan, the Fund is authorized to incur distribution expenses which will principally be payments to securities dealers who have sold shares and serviced shareholder accounts and payments to the Distributor, for reimbursement of other actual promotion and distribution expenses incurred by the Distributor on behalf of the Fund. The amount paid in any one year is 0.25% of the Fund’s average daily net assets.
Note 5—Investments—For the period ended June 30, 2014, the cost of purchases and proceeds from sales of investments, excluding U.S. government securities and short-term obligations, aggregated $3,380,028 and $1,555,641, respectively.
Note 6—Income Taxes—For Federal income tax purposes, the identified cost of investments owned at June 30, 2014 was $7,750,452 and net unrealized appreciation aggregated $852,788 of which $1,194,549 related to appreciated securities and $341,761 related to depreciated securities.
The Fund recognizes the tax benefits of uncertain tax positions only where the position is “more-likely-than-not” to be sustained assuming examination by applicable tax authorities. Management has analyzed the Fund’s tax positions, and has concluded that no liability for unrecognized tax benefits should be recorded related to uncertain tax positions expected to be taken on return filings for open tax years (tax year ended December 31, 2013) or expected to be taken in the Fund’s current year. Therefore, no provision for income tax is required in the Fund’s consolidated financial statements.
The Fund recognizes interest and penalties, if any, related to uncertain tax positions as income tax expense in the Consolidated Statement of Operations. During the period ended June 30, 2014, the Fund did not incur any interest or penalties.
Note 7—Concentration of Risk—The Fund may purchase securities on foreign exchanges. Securities of foreign issuers involve special risks and considerations not typically associated with investing in U.S. issuers. These risks include devaluation of currencies, less reliable information about issuers, different securities transaction clearance and settlement practices, and future adverse political and economic developments. These risks are heightened for investments in emerging market countries. Moreover, securities of many foreign issuers and their markets may be less liquid and their prices more volatile than those of comparable U.S. issuers. The Fund may concentrate its investments in companies which are significantly engaged in the exploration, development, production and distribution of gold and other natural resources such as strategic and other metals, minerals, forest products, oil, natural gas and coal and by investing in gold bullion and coins. In addition, the Fund may invest up to 25% of its net assets in gold and silver coins, gold, silver, platinum and palladium bullion and exchange traded funds that invest in such coins and bullion and derivatives on the foregoing. Since the Fund may so concentrate, it may be subject to greater risks and market fluctuations than other more diversified portfolios. The production and marketing of gold and other natural resources may be affected by actions and changes in governments. In addition, gold and natural resources may be cyclical in nature.
At June 30, 2014, Van Eck Securities Corp. owns approximately 12% of the Class S Shares of the outstanding shares of beneficial interest. Additionally, the aggregate shareholder accounts of two insurance companies own approximately 72% and 14% of the Class S Shares of the outstanding shares of beneficial interest.
Note 8—Trustee Deferred Compensation Plan—The Trust has a Deferred Compensation Plan (the “Deferred Plan”) for Trustees under which the Trustees can elect to defer receipt of their trustee fees until retirement, disability or termination from the Board of Trustees. The fees otherwise payable to the participating Trustees are deemed invested in shares of eligible Funds of the Trust and the Van Eck Funds (another registered investment company managed by the Adviser) as directed by the Trustees.
The expense for the Deferred Plan is included in “Trustees’ fees and expenses” in the Consolidated Statement of Operations. The liability for the Deferred Plan is shown as “Deferred Trustee fees” in the Consolidated Statement of Assets and Liabilities.
Note 9—Bank Line of Credit—The Trust may participate with Van Eck Funds (collectively the “VE/VIP Funds”) in a $30 million committed credit facility (the “Facility”) to be utilized for temporary financing until the settlement of sales or purchases of portfolio securities, the repurchase or redemption of shares of the Fund and other temporary or emergency purposes. The VE/VIP Funds have agreed to pay commitment fees, pro rata, based on the unused but available balance. Interest is charged to the VE/VIP Funds at rates based on prevailing market rates in effect at the time of borrowings. During the period ended June 30, 2014, the Fund had no borrowings under the Facility.
Note 10—Securities Lending—To generate additional income, the Fund may lend its securities pursuant to a securities lending agreement with State Street Bank & Trust Co., the securities lending agent and also the Fund’s custodian. During the period ended June 30, 2014, the Fund had no securities lending activity.
Note 11—Subsequent Event Review—The Fund has evaluated subsequent events and transactions for potential recognition or disclosure through the date the consolidated financial statements were issued.
VAN ECK VIP GLOBAL GOLD FUND
APPROVAL OF ADVISORY AGREEMENT
June 30, 2014 (unaudited)
The Investment Company Act of 1940, as amended (the “1940 Act”), provides, in substance, that an investment advisory agreement between a fund and its investment adviser may be entered into only if it is approved, and may continue in effect from year to year after an initial two-year period only if its continuance is approved, at least annually by the fund’s board of trustees, including by a vote of a majority of the trustees who are not “interested persons” of the fund as defined in the 1940 Act (the “Independent Trustees”), cast in person at a meeting called for the purpose of considering such approval. On June 25, 2014, the Board of Trustees (the “Board”) of Van Eck VIP Trust (the “Trust”), which is comprised exclusively of Independent Trustees, voted to approve the continuation of the existing advisory agreement (the “Advisory Agreement”) between the Van Eck VIP Global Gold Fund (the “Fund”) and its investment adviser, Van Eck Associates Corporation (together with its affiliated companies, the “Adviser”). Information regarding the material factors considered and related conclusions reached by the Board in approving the continuation of the Advisory Agreement is set forth below.
In considering the continuation of the Advisory Agreement, the Board reviewed and considered information that had been provided by the Adviser throughout the year at regular and special meetings of the Board and its committees, including information requested by the Board and furnished by the Adviser for meetings of the Board held on June 5, 2014 and June 24 and 25, 2014 specifically for the purpose of considering the continuation of the Advisory Agreement. The written and oral reports provided to the Board included, among other things, the following:
| ■ | Information about the overall organization of the Adviser and the Adviser’s short-term and long-term business plans with respect to its mutual fund operations and other lines of business; |
| | |
| ■ | The consolidated financial statements of the Adviser for the past three fiscal years; |
| | |
| ■ | A copy of the Advisory Agreement and descriptions of the services provided by the Adviser thereunder; |
| | |
| ■ | Information regarding the qualifications, education and experience of the investment professionals responsible for portfolio management, investment research and trading activities for the Fund, the structure of their compensation and the resources available to support these activities; |
| | |
| ■ | A report prepared by an independent consultant comparing the Fund’s investment performance (including, where relevant, total returns, standard deviations, Sharpe ratios, information ratios, beta and alpha) with respect to a representative class of shares of the Fund for the one-, three-, five- and ten-year periods ended March 31, 2014 with those of (i) a universe of mutual funds selected by the independent consultant with similar portfolio holding characteristics, share class attributes and other operational characteristics as the Fund (the “Category”), (ii) a sub-group of funds selected from the Category by the independent consultant further limited to approximate more closely the Fund’s investment style, expense structure and asset size (the “Peer Group”) and (iii) an appropriate benchmark index; |
| | |
| ■ | A report prepared by an independent consultant comparing the advisory fees and other expenses of a representative class of shares of the Fund during its fiscal year ended December 31, 2013 with a similar share class of each fund in the (i) Category and (ii) Peer Group; |
| | |
| ■ | A supplemental report prepared by an independent consultant comparing total management fees, which include both combined advisory and administrative fees (the “Management Fees”), and separately, the administrative fees, with respect to a representative class of shares of the Fund during its fiscal year ended December 31, 2013 with those of the Fund’s (i) Category and (ii) Peer Group; |
| | |
| ■ | An analysis of the profitability of the Adviser with respect to its services for the Fund and the Van Eck complex of mutual funds as a whole (the “Van Eck Complex”); |
| | |
| ■ | Information regarding other investment products and services offered by the Adviser involving investment objectives and strategies similar to the Fund (“Comparable Products”), including the fees charged by the Adviser for managing the Comparable Products, a description of material differences and similarities in the services provided by the Adviser for the Fund and the Comparable Products, the size of the Comparable Products, the performance of the Comparable Products and identity of the individuals responsible for managing the Comparable Products; |
| | |
| ■ | Information concerning the Adviser’s compliance program, the resources devoted to compliance efforts undertaken by the Adviser on behalf of the Fund, and reports regarding a variety of compliance-related issues; |
| | |
| ■ | Information with respect to the Adviser’s brokerage practices, including the Adviser’s processes for monitoring best execution of portfolio transactions and the benefits received by the Adviser from research acquired with soft dollars; |
| | |
| ■ | Information regarding the procedures used by the Adviser in monitoring the valuation of portfolio securities, including the methodologies used in making fair value determinations; |
| ■ | Information regarding the Adviser’s policies and practices with respect to personal investing by the Adviser and its employees, including reports regarding the administration of the Adviser’s code of ethics and the Adviser’s policy with respect to investments in the Fund by the Adviser’s investment personnel; |
| | |
| ■ | Descriptions of other administrative and other non-investment management services provided by the Adviser for the Fund, including the Adviser’s activities in managing relationships with the Fund’s custodian, transfer agent and other service providers; and |
| | |
| ■ | Other information provided by the Adviser in its response to a comprehensive questionnaire prepared by independent legal counsel on behalf of the Independent Trustees. |
In determining whether to approve the continuation of the Advisory Agreement, the Board considered, among other things, the following: (1) the nature, quality, extent and cost of the investment management, administrative and other non-investment management services provided by the Adviser; (2) the nature, quality and extent of the services performed by the Adviser in interfacing with, and monitoring the services performed by, third parties, such as the Fund’s custodian, transfer agent, sub-accounting agent and independent auditors, and the Adviser’s commitment and efforts to review the quality and pricing of third party service providers to the Fund with a view to reducing non-management expenses of the Fund; (3) the terms of the Advisory Agreement and the services performed thereunder; (4) the willingness of the Adviser to reduce the overall expenses of the Fund from time to time, if necessary or appropriate, by means of waiving a portion of its fees or paying expenses of the Fund; (5) the quality of the services, procedures and processes used to determine the value of the Fund’s assets and the actions taken to monitor and test the effectiveness of such services, procedures and processes; (6) the ongoing efforts of, and resources devoted by, the Adviser with respect to the development and implementation of a comprehensive compliance program; (7) the responsiveness of the Adviser to inquiries from, and examinations by, regulatory authorities, including the Securities and Exchange Commission; (8) the resources committed by the Adviser in recent periods to information technology; and (9) the ability of the Adviser to attract and retain quality professional personnel to perform investment advisory and administrative services for the Fund.
The Board considered the fact that the Adviser is managing other investment products, including exchange-traded funds, hedge funds, separate accounts and UCITs, one or more of which may invest in the same financial markets and may be managed by the same investment professionals according to a similar investment objective and/or strategy as the Fund. The Board concluded that the management of these products contributes to the Adviser’s financial stability and is helpful to the Adviser in attracting and retaining quality portfolio management personnel for the Fund. In addition, the Board concluded that the Adviser has established appropriate procedures to monitor conflicts of interest involving the management of the Fund and the other products and for resolving any such conflicts of interest in a fair and equitable manner.
The performance data and the advisory fee and expense ratio data described below for the Fund is based on data for a representative class of shares of the Fund. The performance data is for periods on an annualized basis ended March 31, 2014, and the advisory fee and expense ratio data is as of the Fund’s fiscal year end of December 31, 2013.
Performance. The Board noted that the Fund commenced operations on April 26, 2013. In light of the Fund’s brief operating history, the Board concluded that additional time is needed to evaluate the performance of the Fund.
Fees and Expenses. The Board noted that the Fund pays an advisory fee, as well as a separate administrative fee. The Board further noted that the fees payable for advisory services were lower than the median advisory fees of its Peer Group, but higher than the median advisory fees of its Category. The Board also noted that the Fund’s total expense ratio, net of waivers or reimbursements, was lower than the median expense ratio of its Peer Group, but higher than the median expense ratio of its Category. The Board further noted that the Management Fees (which include both advisory and administrative fees) were lower than the median Management Fees of its Peer Group, but higher than the median Management Fees of its Category. The Board also noted that the Adviser has agreed to waive fees or pay expenses of the Fund through April 2015 to the extent necessary to prevent the expense ratio of the Fund from exceeding a specified maximum amount. On the basis of the foregoing, and in light of the nature, extent and quality of the services provided by the Adviser, the Board concluded that the advisory fee charged to the Fund is reasonable.
Profitability and Economies of Scale. The Board considered the profits, if any, realized by the Adviser from managing the Fund and other mutual funds in the Van Eck Complex and the methodology used to determine such profits, including the results of an analysis of the methodology performed by an independent consultant in 2013 on behalf of the Board and its independent counsel. The Board noted that the levels of profitability reported on a fund-by-fund basis varied widely depending on such factors as the size, type of fund and operating history The Board further noted that, in evaluating the
VAN ECK VIP GLOBAL GOLD FUND
APPROVAL OF ADVISORY AGREEMENT
(unaudited) (continued)
reasonableness of the Adviser’s profits from managing any particular Fund, it would be appropriate to consider the size of the Adviser relative to other firms in the investment management industry and the impact on the Adviser’s profits of the volatility of the markets in which the Funds invest and the volatility of cash flows into and out of the Funds through various market cycles. Based on its review of the foregoing information, and in light of the nature, extent and quality of the services provided by the Adviser, the Board concluded that the profits realized by the Adviser, if any, are not excessive. In this regard, the Board also considered the extent to which the Adviser may realize economies of scale as the Fund grows and whether the Fund’s fee schedule, which includes breakpoints, reflects these economies of scale for the benefit of shareholders. The Board concluded that, with respect to the Fund, the economies of scale being realized, if any, are currently being shared by the Adviser and the Fund, and that adding or modifying existing breakpoints would not be warranted at this time for the Fund.
Conclusion. In determining the material factors to be considered in evaluating the Advisory Agreement and the weight to be given to such factors, the members of the Board relied upon the advice of independent legal counsel and their own business judgment. The Board did not consider any single factor as controlling in determining whether to approve the continuation of the Advisory Agreement and each member of the Board may have placed varying emphasis on particular factors considered in reaching a conclusion. Moreover, this summary description does not necessarily identify all of the factors considered or conclusions reached by the Board. Based on its consideration of the foregoing factors and conclusions, and such other factors and conclusions as it deemed relevant, the Board (comprised exclusively of Independent Trustees) concluded that the continuation of the Advisory Agreement is in the interests of shareholders and, accordingly, the Board approved the continuation of the Advisory Agreement for an additional one-year period.
This report must be preceded or accompanied by a Van Eck VIP (the “Trust”) Prospectus, which includes more complete information. An investor should consider the investment objective, risks, and charges and expenses of the Fund carefully before investing. The prospectus contains this and other information about the investment company. Please read the prospectus carefully before investing.
Additional information about the Trust’s Board of Trustees/Officers and a description of the policies and procedures the Trust uses to determine how to vote proxies relating to portfolio securities are provided in the Statement of Additional Information. The Statement of Information and information regarding how the Trust voted proxies relating to portfolio securities during the most recent twelve month period ending June 30 is available, without charge, by calling 800.826.2333, or by visiting vaneck.com, or on the Securities and Exchange Commission’s website at http://www.sec.gov.
The Trust files its complete schedule of portfolio holdings with the Securities and Exchange Commission for the first and third quarters of each fiscal year on Form N-Q. The Trust’s Form N-Qs are available on the Commission’s website at http://www.sec.gov and may be reviewed and copied at the Commission’s Public Reference Room in Washington, D.C. Information on the operation of the Public Reference Room may be obtained by calling 202.942.8090. The Fund’s complete schedule of portfolio holdings is also available by calling 800.826.2333 or by visiting vaneck.com.

| Investment Adviser: | Van Eck Associates Corporation |
| Distributor: | Van Eck Securities Corporation |
| | 335 Madison Avenue, New York, NY 10017 |
| | vaneck.com |
| Account Assistance: | 800.544.4653 |
| | |
| vaneck.com | |
VIPGGSAR
| | | | | SEMI-ANNUAL REPORT
JUNE 30, 2014
(unaudited) |
| | |  |
| | | | | |
| | | | | |
| | | Van Eck VIP Trust Van Eck VIP Multi-Manager Alternatives Fund |
| | | | | |
| | | | | |
| | | | | |
| | | | | |
| | | | | |
| | | |  |
| | | | | |
The information contained in this shareholder letter represents the personal opinions of the investment team members and may differ from those of other portfolio managers or of the firm as a whole. This information is not intended to be a forecast of future events, a guarantee of future results or investment advice. Also, unless otherwise specifically noted, any discussion of the Fund’s holdings and the Fund’s performance, and the views of the investment team members are as of June 30, 2014, and are subject to change.

Van Eck VIP Trust
Supplement dated August 14, 2014 (“Supplement”)
to the Prospectuses of Van Eck VIP Multi-Manager Alternatives Fund
dated May 1, 2014
This Supplement updates certain information contained in the above-dated Prospectuses for Van Eck VIP Trust (the “Trust”) regarding the Van Eck VIP Multi-Manager Alternatives Fund (the “Fund”), a series of the Trust. You may obtain copies of the Fund’s Prospectuses and Statement of Additional Information free of charge, upon request, by calling toll-free 1.800.826.2333 or by visiting the Van Eck website at www.vaneck.com.
The Prospectuses for the Fund are supplemented as follows:
| 1. | The section of each Prospectus entitled “Principal Investment Strategies – Event-Driven Strategies” is supplemented by: |
| | | |
| | a. | Replacing the first sentence of such section with the following: |
| | | |
| | | Event-driven strategies seek to benefit from events that disrupt price relationships across securities. These events include corporate events, such as mergers, acquisitions and spin-offs, and other events, such as macroeconomic shocks and index re-balances; and |
| | | |
| | b. | Adding the following as the second type of strategy described in such section: |
| | | |
| | | Index Arbitrage: An index arbitrage strategy seeks to exploit the potential mispricing of securities as between the underlying holdings of an index and the financial products that seek to track such index. |
| | | |
| 2. | The section of each Prospectus entitled “How The Fund Is Managed – Management of the Fund – Sub-Advisers” is supplemented by: |
| | |
| | a. | Removing the references to and the information for Dix Hills Partners, LLC; |
| | | |
| | b. | Removing the references to and the information for Millrace Asset Group, Inc.; and |
| | | |
| | c. | Adding the following immediately after the information for Horizon Asset Management LLC on the top of page 22: |
| | | |
| | | Hunting Hill Global Capital, LLC (“Hunting Hill”), 420 Lexington Avenue, New York, NY 10112, has been registered with the SEC since September of 2013. Hunting Hill is an investment adviser for the Fund, as well as other pooled investment vehicles and separate accounts. With respect to the Fund, Hunting Hill employs a global event driven strategy. As of June 30, 2014, Hunting Hill’s assets under management were approximately $150 million. |
| | | |
| PLEASE RETAIN THIS SUPPLEMENT FOR YOUR FUTURE REFERENCE |
IMPORTANT NOTICE REGARDING THE
INTERNET AVAILABILITY OF INFORMATION STATEMENT
The Information Statement is available at http:/www.vaneck.com/vip-mma
Van Eck VIP Trust
Van Eck VIP Multi-Manager Alternatives Fund
335 Madison Avenue, 19th Floor
New York, New York 10017
August 14, 2014
This communication presents only an overview of the more complete Information Statement that is available to you on the Internet relating to the Van Eck VIP Multi-Manager Alternatives Fund (the “Fund”), a series of Van Eck VIP Trust (the “Trust”). We encourage you to access and review all of the important information contained in the Information Statement.
Van Eck Associates Corporation (the “Adviser”), the investment adviser to the Fund, subject to the oversight of the Board of Trustees (the “Board”) of the Trust, may select sub-advisers for the Fund and supervise, monitor and evaluate the performance of each sub-adviser. We want to inform you that, at the recommendation of the Adviser, the Board has approved an investment sub-advisory agreement (the “Sub-Advisory Agreement”) with Hunting Hill Global Capital, LLC (the “Sub-Adviser”) pursuant to which the Sub-Adviser serves as a new sub-adviser to the Fund. The Sub-Adviser entered into the Sub-Advisory Agreement with the Adviser with respect to the Fund and began to manage and assumed investment sub-advisory responsibility with respect to its allocated portion of the Fund’s portfolio on August 11, 2014.
Additional information about the Adviser, the Sub-Adviser, the Sub-Advisory Agreement, and the Board’s approval of the Sub-Advisory Agreement is contained in the Information Statement.
Please note that, pursuant to the terms of an exemptive order issued by the Securities and Exchange Commission, the Adviser is permitted, subject to supervision and approval of the Board, to enter into and materially amend sub-advisory agreements without seeking shareholder approval. Therefore, we are not asking you for a proxy, and you are requested not to send us a proxy.
By sending you this notice, the Fund is notifying you that it is making the Information Statement available to you via the Internet in lieu of mailing you a paper copy. The full Information Statement is available for printing on the Fund’s website at http:/www.vaneck.com/vip-mma until at least November 14, 2014. A paper or email copy of the full Information Statement may be obtained, without charge, by contacting the Fund at 1.800.826.2333. If you would like to receive a paper or email copy of the full Information Statement, you must request one.
VAN ECK VIP MULTI-MANAGER ALTERNATIVES FUND
(unaudited)
Dear Shareholder:
The Initial Class shares of the Van Eck VIP Multi-Manager Alternatives Fund (the “Fund”) returned 1.09% for the six months ended June 30, 2014. The Fund underperformed its benchmark, the HFRX Global Hedge Fund Index1, which returned 1.77% during the period. The Morningstar Multialternative Category of Funds2 returned 2.98%.
The trailing 90-day standard deviation for the most recent period, ending June 30, 2014, was an annualized 5.96%. A review of each of the underlying sub-strategies reveals that the Fund generated strong performance within the long/short equity, multi-strategy, volatility, and event-driven allocations, but performance was weaker within the fixed income and global macro allocations.
Overview
Equities and fixed income investments delivered impressive results during the first half of 2014. The S&P 500® Index3 returned 7.14% and the Barclays Aggregate Bond Index4 returned 3.93%. The markets remained hyper-focused on the U.S. Federal Reserve’s (the “Fed”) exit strategy for its quantitative easing program. The Fed continues to communicate its intent to wind-down the asset-purchase program based on the strengthening economy, but will maintain an ultra-low target range of zero to 0.25% for the federal funds rate to support maximum employment and asset price stability.
Within the equity markets, large-cap stocks, as represented by the Russell Top 200 Index5, outperformed small-cap stocks, as represented by the Russell 2000 Index6, by 3.45%. Developed international and emerging markets equities, as represented by the MSCI EAFE Index7 and the MSCI Emerging Markets Index8, returned 5.14% and 6.32%, respectively. The fixed income markets benefited from declining interest rates during the period. The yield of the 10-year U.S. Treasury note began the year just above 3% but declined to as low as 2.44% in May.
Fund Review
| Asset Allocation | | Current Allocations |
| | | | | | | | |
 | | Name | | Investment Strategy | | %
Allocation |
| | Coe Capital Management, LLC | | Long/Short Equity | | 12.40% |
| | Long/Short Equity* | | Long/Short Equity (Index-Based) | | 11.89% |
| | Horizon Asset Management, LLC | | Multi-Strategy | | 12.98% |
| | Tiburon Capital Management, LLC | | Event-Driven | | 15.69% |
| | Volatility Premium Capture** | | Volatility (Index-Based) | | 14.89% |
| | Tactical*** | | | | 20.13% |
| | Cash | | | | 12.02% |
| | TOTAL | | | | 100.00% |
| | | | | | |
| | Source: Van Eck Global | | | | |
| | * | Long/Short Equity tracks the Market Vectors North America Long/Short Equity Index |
| | ** | Volatility Premium Capture tracks the Market Vectors Volatility Premium Capture Index |
| | *** | The tactical allocation is calculated as the sum of the long positions and does not include short or derivative positions. |
| | | |
The Fund’s Investment Committee continued to target the Fund’s volatility towards the mid-point of its 4%-6% range, while remaining well diversified across the long/short equity‡, event-driven‡, multi-strategy‡ and volatility‡ strategies. In an effort to reduce the Fund’s overall expenses, the Investment Committee allocated an increasing proportion of the Fund’s assets to alternative beta strategies managed by Van Eck. The alternative beta strategies are designed to deliver, consistently and efficiently, the market returns of various alternative investment disciplines.
The alternative beta strategies to which allocations were made during the first half of the year were the Long/Short Equity strategy and Volatility Premium Capture strategy. The Long/Short Equity (“MVLSNA”) strategy seeks to track the Market Vectors North America Long/Short Equity Index9. The Volatility Premium Capture (“CAP”) strategy seeks to track the Market Vectors Volatility Premium Capture Index10.
Portfolio allocations that were removed during the period include RiverPark Advisors LLC (“RiverPark”), SW Asset Management, LLC (“SW”), Millrace Asset Group, LLC (“Millrace”), the AQR Managed Futures Fund (“AQR”), and a structured note from Deutsche Bank that tracks both the Equity Mean Reversion Index and the ProVol Index.
VAN ECK VIP MULTI-MANAGER ALTERNATIVES FUND
(unaudited)
The Fund’s aggregate allocation to long/short equity strategies generated strong performance relative to the Market Vectors North America Long/Short Equity Index. Coe Capital (“Coe”) generated a return of 6.75% during the first half of the year. Coe benefited from stock selection within the materials, consumer discretionary and industrials sectors, but performance was hindered by portfolio hedges and positions within the information technology sector. The Long/Short Equity strategy was added to the Fund on March 3, 2014 and returned 3.17% during the period thereafter to June 30, 2014. The Long/Short Equity strategy benefited from the rebound in domestic equities, especially small-cap growth stocks, in May and June. RiverPark returned 0.59% and had strong stock selection within the consumer discretionary and financial sectors, but was negatively impacted by holdings in the information technology and materials sectors. Millrace returned -2.23%, due primarily to losses within the information technology sector. The negative returns of Millrace within the information technology sector were slightly offset by investments within the consumer discretionary and industrials sectors, and broad market and sector-specific shorts.
The Fund’s allocation to global macro strategies returned -4.86% vs the HRFX Macro Index11 with a return of -0.73%. AQR, our only material allocation to global macro strategies during the first half of the year, returned a disappointing -4.95% as the strategy continued to struggle as a result of rapid trend reversals across markets. The Investment Committee removed the allocation to AQR at the beginning of March and the Fund does not currently have exposure to a dedicated global macro sub-adviser. The Investment Committee will continue to evaluate new global macro sub-advisors for potential future allocations.
The Fund’s allocation to event-driven strategies returned 4.72% compared to a return of 1.63% for the Market Vectors Global Event Driven Index12. Within event-driven strategies, the Fund is currently allocated to Tiburon Capital (“Tiburon”). Tiburon generated a return of 5.01%, as it benefited from stock selection within the consumer discretionary and information technology sectors. Fixed income positions within the consumer discretionary sector were also large contributors for Tiburon. The largest detractors from performance for Tiburon were portfolio hedges across long equity index put option contracts and short broad market and sector-specific ETFs.
The Fund’s allocation to fixed income strategies returned -1.63% vs. the HFRX Fixed Income Credit Index13 with a return of 3.39%. SW, our only dedicated fixed income sub-adviser, generated a return of -1.63%. Positions that detracted from SW’s performance were focused in South America and Eastern Europe, while the losses were offset by hedges and gains within Brazil.
The Fund’s allocation to Horizon Asset Management, LLC, a multi-strategy sub-adviser that invests across the capital structure and utilizes option contracts, returned 4.16%. Horizon benefited from holdings within the financial and materials sectors, and price appreciation on closed-end bond funds.
The Fund’s allocation to the CAP strategy returned 6.83% during the first half of the year. The CAP strategy writes out-of-the-money put-option contracts on a diversified index of large-cap equities while incorporating the level of risk in the market. During the period, the CAP strategy benefited from the continued rise, and a few periods of heighted volatility, within the equity markets.
The tactical allocation returned 1.79%. The largest contributors to performance for the tactical allocation were hedged gold and energy equity positions. The largest detractors from performance were hedged emerging markets equity positions and a short position on long-term U.S. Treasury bonds.
Outlook
We continue to believe that the Fund remains well diversified across alternative strategies to navigate periods of heightened volatility and the potential of rising interest rates. We have achieved this positioning by investing in strategies that seek to exploit idiosyncratic market opportunities across asset classes and limiting exposure to traditional fixed income securities.
As the Fund implements a fund-of-funds strategy, an investor in the Fund will bear the operating expenses of the “Underlying Funds” in which the Fund invests. The total expenses borne by an investor in the Fund will be higher than if the investor invested directly in the Underlying Funds, and the returns may therefore be lower. The Fund, the Sub-Advisers and the Underlying Funds may use aggressive investment strategies, including absolute return strategies, which are riskier than those used by typical mutual funds. If the Fund and Sub-Advisers are unsuccessful in applying these investment strategies, the Fund and you may lose more money than if you had invested in another fund that did not invest aggressively. The Fund is subject to risks associated with the Sub-Advisers making trading decisions independently, investing in other investment companies, using a particular style or set of styles, basing investment decisions on historical relationships and correlations, trading frequently, using leverage, making short sales, being non-diversified, and investing in securities with low correlation
to the market. The Fund is also subject to risks associated with investments in foreign markets, emerging market securities, small cap companies, debt securities, derivatives, commodity-linked instruments, illiquid securities, asset-backed securities, and CMOs.
We appreciate your investment in the Van Eck VIP Multi-Manager Alternatives Fund, and we look forward to helping you meet your investment goals in the future.
 | |  |
| | | |
Stephen H. Scott
Co-Portfolio Manager
Investment Committee Co-Chair | | Jan F. van Eck
Co-Portfolio Manager
Investment Committee Co-Chair |
| | | |
| July 18, 2013 | | |
The performance quoted represents past performance. Past performance is no guarantee of future results; current performance may be lower or higher than the performance data quoted. Performance information reflects temporary waivers of expenses and/or fees and does not include insurance/annuity fees and expenses. Investment returns would have been reduced had these fees/expenses been included. Investment return and the value of the shares of the Fund will fluctuate so that an investor’s shares, when redeemed, may be worth more or less than their original cost. Fund returns assume that dividends and capital gains distributions have been reinvested in the Fund at NAV. Index returns assume that dividends of the Index constituents in the Index have been reinvested. Performance information current to the most recent month end is available by calling 1.800.826.2333.
The Fund is only available to life insurance and annuity companies to fund their variable annuity and variable life insurance products. These contracts offer life insurance and tax benefits to the beneficial owners of the Fund. Your insurance or annuity company charges, fees and expenses for these benefits are not reflected in this report or in the Fund’s performance, since they are not direct expenses of the Fund. Had these fees been included, returns would have been lower. For insurance products, performance figures do not reflect the cost for insurance and if they did, the performance shown would be significantly lower. A review of your particular life and/or annuity contract will provide you with much greater detail regarding these costs and benefits.
| † | All Fund assets referenced are Total Net Assets as of June 30, 2014. |
| | |
| All indices are unmanaged and include the reinvestment of all dividends, but do not reflect the payment of transaction costs, advisory fees or expenses that are associated with an investment in the Fund. An index’s performance is not illustrative of the Fund’s performance. Indices are not securities in which investments can be made. Results reflect past performance and do not guarantee future results. |
| | |
| 1 | HFRX Global Hedge Fund Index is designed to be representative of the overall composition of the hedge fund universe. It is comprised of eight strategies: convertible arbitrage, distressed securities, equity hedge, equity market neutral, event driven, macro, merger arbitrage, and relative value arbitrage. The strategies are asset weighted based on the distribution of assets in the hedge fund industry. |
| | |
| 2 | Morningstar Multialternative Category of Funds uses a combination of alternative strategies such as taking long and short positions in equity and debt, trading futures, or using convertible arbitrage, among others. Funds in this category have a majority of their assets exposed to alternative strategies and include both funds with static allocations to alternative strategies and funds tactically allocating among alternative strategies and asset classes. |
| | |
| 3 | S&P 500® Index consists of 500 widely held common stocks, covering industrials, utility, financial and transportation sectors. |
| | |
| 4 | Barclays Aggregate Bond Index represents securities that are SEC-registered, taxable and dollar denominated. The index covers the U.S. investment-grade fixed-rate bond market, with index components for government and corporate securities, mortgage pass-through securities and asset-backed securities. |
| | |
| 5 | Russell Top 200 Index measures the performance of the largest cap segment of the U.S. equity universe. The Russell Top 200 Index is a subset of the Russell 3000® Index. It includes approximately 200 of the largest securities based on a combination of their market cap and current index membership and represents approximately 68% of the U.S. market. |
| | |
| 6 | Russell 2000 Index measures the performance of the small-cap segment of the U.S. equity universe. The Russell 2000 Index is a subset of the Russell 3000® Index representing approximately 10% of the total market capitalization of that index. It includes approximately 2000 of the smallest securities based on a combination of their market cap and current index membership. |
| | |
| 7 | MSCI EAFE (Europe, Australasia and Far East) Index is a market-capitalization weighted index designed to measure the equity market performance of developed markets outside of the U.S. and Canada. The index includes a selection of stocks from 21 developed markets: Austria, Belgium, Denmark, Finland, France, Germany, Ireland, Italy, the Netherlands, Norway, Portugal, Spain, Sweden, Switzerland, United Kingdom, Israel, Australia, New Zealand, Singapore, Hong Kong, and Japan |
VAN ECK VIP MULTI-MANAGER ALTERNATIVES FUND
(unaudited)
| 8 | MSCI Emerging Markets Index is a free float-adjusted market capitalization index that is designed to measure equity market performance of emerging markets, is calculated with dividends reinvested. The Index covers 2,700 securities of the publicly traded equities in each industry for 21 emerging markets that are currently classified as emerging markets countries. |
| | |
| 9 | Market Vectors® North America Long/Short Equity Index seeks to capture the systematic returns (beta) of hedge funds with similar investment styles that invest in the same asset classes and geographic markets. |
| | |
| 10 | Market Vectors® Volatility Premium Capture Index is designed to systematically harvest put-options risk premiums on the SPDR S&P 500 ETF by selling levered uncovered put-option contracts, one standard deviation out of the money to help manage risk. The positions are collateralized with short-term U.S. Treasuries. |
| | |
| 11 | HRFX Macro Index is a hedge fund benchmark on strategies that include long/short positions in equity, fixed income, currency and futures markets based on a top-down analysis on a broader view of the world economy. |
| | |
| 12 | Market Vectors® Global Event Driven Index seeks to capture the systematic returns (beta) of hedge funds with similar investment styles that invest in the same asset classes and geographic markets. |
| | |
| 13 | HFRX Fixed Income Credit Index is a hedge fund benchmark on strategies that utilize a broad continuum of credit sub-strategies, including corporate, sovereign, distressed, convertible, asset-backed, capital structure arbitrage and other relative value and event-driven sub-strategies to realize the spreads of various related credit instruments. |
| | |
| ‡ | Strategy Definitions |
| | |
| | A long/short equity strategy seeks to invest in securities believed to be undervalued or offer high growth opportunities while also attempting to reduce overall market risk or take advantage of an anticipated decline in the price of an overvalued company or index by using short sales or options on common stocks or indexes to hedge risk. This strategy may also use derivatives, including options, financial futures and options on futures. Long and short positions may not be invested in equal dollars and, as such, may not seek to neutralize general market risks. |
| | |
| | Event-driven strategies seek to benefit from price movements caused by anticipated corporate events, such as mergers, acquisitions, spin-offs or other special situations. |
| | |
| | Global macro and emerging markets strategies seek to profit from directional changes in currencies, stock markets, commodity prices and market volatility. This strategy may utilize positions held through individual securities, ETFs, derivative contracts, swaps or other financial instruments linked to major market, sector or country indices, fixed income securities, currencies and commodities. This strategy may invest in a limited number of securities, issuers, industries or countries which may result in higher volatility. |
| | |
| | Fixed income strategies buy and short different debt securities. |
| | |
| | Directional or tactical trading attempts to exploit broad market trends in equities, interest rates or commodity prices. |
| | |
| | Multi-strategy refers to a broad investment mandate that seeks to deliver absolute returns by employing various investment disciplines, across asset classes and publicly-traded financial instruments. |
| | |
| | Volatility strategies trade volatility as an asset class, employing arbitrage, directional, market neutral or a mix of types of strategies, and include exposures which can be long, short, neutral or variable to the direction of implied volatility, and includes various financial instruments. |
SECTOR WEIGHTING NET EXPOSURE**
(unaudited)
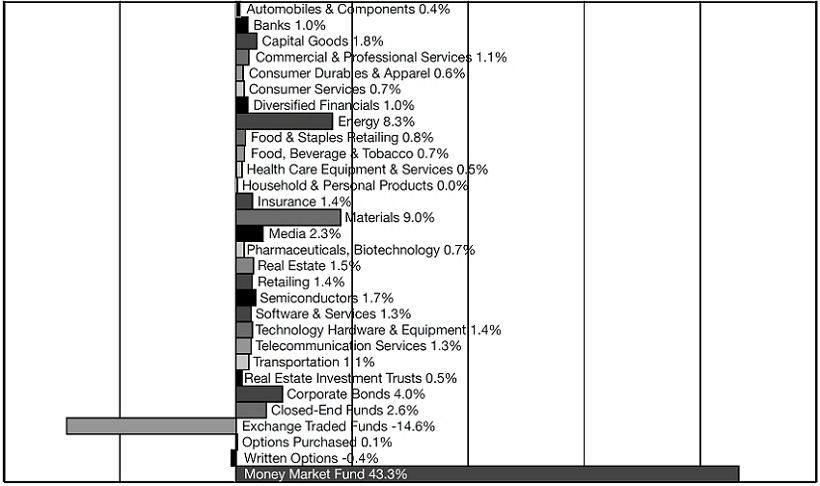
| -20% | -10% | 0% | 10% | 20% | 30% | 40% | 50% |
As of June 30, 2014. Portfolio subject to change.
**Net exposure was calculated by adding long and short positions.
VAN ECK VIP MULTI-MANAGER ALTERNATIVES FUND
EXPLANATION OF EXPENSES
(unaudited)
As a shareholder of the Fund, you incur two types of costs: (1) transaction costs, including program fees on purchase payments; and (2) ongoing costs, including management fees and other Fund expenses. This disclosure is intended to help you understand the ongoing costs (in dollars) of investing in the Fund and to compare these costs with the ongoing costs of investing in other mutual funds.
The disclosure is based on an investment of $1,000 invested at the beginning of the period and held for the entire period, January 1, 2014 to June 30, 2014.
Actual Expenses
The first line in the table below provides information about account values and actual expenses. You may use the information in this line, together with the amount you invested, to estimate the expenses that you paid over the period. Simply divide your account value by $1,000 (for example, an $8,600 account value divided by $1,000 = 8.6), then multiply the result by the number in the first line under the heading entitled “Expenses Paid During the Period.”
Hypothetical Example for Comparison Purposes
The second line in the table below provides information about hypothetical account values and hypothetical expenses based on the Fund’s actual expense ratio and an assumed rate of return of 5% per year before expenses, which is not the Fund’s actual return. The hypothetical account values and expenses may not be used to estimate the actual ending account balance or expenses you paid for the period. You may use this information to compare the ongoing costs of investing in the Fund and other funds. To do so, compare this 5% hypothetical example with the 5% hypothetical examples that appear in the shareholder reports of other funds.
Please note that the expenses shown in the table are meant to highlight your ongoing costs only and do not reflect any transactional costs, such as fees on purchase payments. Therefore, the second line of the table is useful in comparing ongoing costs only, and will not help you determine the relative costs of owning different funds. In addition, if these transactional costs were included, your costs would have been higher.
Van Eck VIP Multi-Manager Alternatives Fund
| | | | | Beginning
Account Value
January 1, 2014 | | Ending
Account Value
June 30, 2014 | | Expenses Paid
During the Period*
January 1, 2014 -
June 30, 2014 |
| Initial Class | | Actual | | $1,000.00 | | $1,010.90 | | $8.68 |
| | | Hypothetical** | | $1,000.00 | | $1,016.17 | | $8.70 |
| Class S | | Actual | | $1,000.00 | | $1,010.00 | | $9.82 |
| | | Hypothetical** | | $1,000.00 | | $1,015.03 | | $9.84 |
| * | Expenses are equal to the Fund’s annualized expense ratio (for the six months ended June 30, 2014), of 1.74% on Initial Class and 1.97% on Class S Shares, multiplied by the average account value over the period, multiplied by the number of days in the most recent fiscal half divided by the number of days in the fiscal year (to reflect the one-half year period). |
| | |
| ** | Assumes annual return of 5% before expenses |
SCHEDULE OF INVESTMENTS
June 30, 2014 (unaudited)
| Number of | | | | | |
| Shares | | | | Value | |
| | | | | | |
| COMMON STOCKS: 42.9% | | | | |
| | | | | |
| Automobiles & Components: 0.7% | | | | |
| | 741 | | | General Motors Co. | | $ | 26,898 | |
| | 186 | | | Hyundai Motor Co. (KRW) # | | | 42,170 | |
| | 38 | | | Icahn Enterprises LP | | | 3,789 | |
| | | | | | | | 72,857 | |
| Banks: 1.0% | | | | |
| | 323 | | | Credicorp Ltd. | | | 50,217 | |
| | 7,413 | | | Kasikornbank PCL (NVDR) (THB) # | | | 46,592 | |
| | | | | | | | 96,809 | |
| Capital Goods: 1.9% | | | | |
| | 445 | | | Beacon Roofing Supply, Inc. * | | | 14,738 | |
| | 168 | | | Colfax Corp. * | | | 12,523 | |
| | 190 | | | Danaher Corp. | | | 14,959 | |
| | 185 | | | EnerSys, Inc. | | | 12,726 | |
| | 424 | | | EnPro Industries, Inc. * | | | 31,020 | |
| | 118 | | | Greenbrier Cos, Inc. * | | | 6,797 | |
| | 440 | | | Ingersoll-Rand Plc | | | 27,504 | |
| | 111 | | | Quanex Building Products Corp. | | | 1,984 | |
| | 724 | | | Quanta Services, Inc. * | | | 25,036 | |
| | 259 | | | Stanley Black & Decker, Inc. | | | 22,745 | |
| | 116 | | | United Rentals, Inc. * | | | 12,149 | |
| | 366 | | | USG Corp. * | | | 11,028 | |
| | | | | | | | 193,209 | |
| Commercial & Professional Services: 1.1% | | | | |
| | 1,242 | | | KAR Auction Services, Inc. | | | 39,583 | |
| | 600 | | | Mobile Mini, Inc. | | | 28,734 | |
| | 534 | | | Ritchie Bros Auctioneers, Inc. | | | 13,163 | |
| | 989 | | | The ADT Corp. | | | 34,556 | |
| | | | | | | | 116,036 | |
| Consumer Durables & Apparel: 0.7% | | | | |
| | 680 | | | Brookfield Residential Properties, Inc. * | | | 14,109 | |
| | 27,336 | | | Guinness Peat Group Plc * | | | 16,150 | |
| | 220 | | | Skechers USA, Inc. * | | | 10,054 | |
| | 437 | | | Tempur-Pedic International, Inc. * | | | 26,089 | |
| | | | | | | | 66,402 | |
| Consumer Services: 0.9% | | | | |
| | 40 | | | Ascent Capital Group, Inc. * | | | 2,640 | |
| | 73 | | | Burger King Worldwide, Inc. | | | 1,987 | |
| | 2,135 | | | Service Corp. International | | | 44,237 | |
| | 4,014 | | | The Wendy’s Co. | | | 34,239 | |
| | 706 | | | Tropicana Entertainment, Inc. * | | | 12,461 | |
| | | | | | | | 95,564 | |
| Diversified Financials: 1.0% | | | | |
| | 1,189 | | | Dundee Corp. * | | | 19,190 | |
| | 2,042 | | | Imperial Holdings, Inc. * | | | 13,926 | |
| | 547 | | | Leucadia National Corp. | | | 14,342 | |
| | 127 | | | Oaktree Capital Group LLC | | | 6,349 | |
| | 500 | | | Onex Corp. | | | 31,000 | |
| | 231 | | | Partners Value Fund, Inc. * | | | 6,171 | |
| | 69 | | | Texas Pacific Land Trust
(Royalty Trust) | | | 11,048 | |
| | | | | | | | 102,026 | |
| Number of | | | | | |
| Shares | | | | Value | |
| | | | | | |
| Energy: 8.4% | | | | |
| | 17,116 | | | Afren Plc (GBP) * # | | $ | 42,402 | |
| | 599 | | | Anadarko Petroleum Corp. | | | 65,573 | |
| | 827 | | | Cameron International Corp. * | | | 55,996 | |
| | 430 | | | Cimarex Energy Co. | | | 61,688 | |
| | 418 | | | Concho Resources, Inc. * | | | 60,401 | |
| | 1,283 | | | Consol Energy, Inc. | | | 59,108 | |
| | 862 | | | Energy XXI Bermuda Ltd. | | | 20,369 | |
| | 518 | | | EOG Resources, Inc. | | | 60,533 | |
| | 26,600 | | | Ezion Holdings Ltd. (SGD) # | | | 44,417 | |
| | 361 | | | Goodrich Petroleum Corp. * | | | 9,964 | |
| | 918 | | | Halcon Resources Corp. * | | | 6,692 | |
| | 866 | | | Halliburton Co. | | | 61,495 | |
| | 215 | | | ION Geophysical Corp. * | | | 907 | |
| | 1,444 | | | Marathon Oil Corp. | | | 57,644 | |
| | 344 | | | Newpark Resources, Inc. * | | | 4,286 | |
| | 110 | | | ONEOK Partners LP | | | 6,446 | |
| | 661 | | | Phillips 66 | | | 53,164 | |
| | 274 | | | Pioneer Natural Resources Co. | | | 62,968 | |
| | 524 | | | Schlumberger Ltd. | | | 61,806 | |
| | 716 | | | SM Energy Co. | | | 60,216 | |
| | 20 | | | TPT Acquisition, Inc. * # ø § | | | 195 | |
| | 37 | | | Vermilion Energy, Inc. | | | 2,579 | |
| | | | | | | | 858,849 | |
| Food & Staples Retailing: 0.8% | | | | |
| | 791 | | | Magnit OAO (GDR) Reg S | | | 46,669 | |
| | 868 | | | Safeway, Inc. | | | 29,807 | |
| | | | | | | | 76,476 | |
| Food, Beverage & Tobacco: 0.9% | | | | |
| | 164,000 | | | China Huishan Dairy Holdings
Co. Ltd. (HKD) * # | | | 35,924 | |
| | 8 | | | Crimson Wine Group Ltd. * | | | 72 | |
| | 303 | | | Philip Morris International, Inc. | | | 25,546 | |
| | 139 | | | Pilgrim’s Pride Corp. * | | | 3,803 | |
| | 1,052 | | | Vector Group Ltd. | | | 21,755 | |
| | | | | | | | 87,100 | |
| Health Care Equipment & Services: 0.7% | | | | |
| | 554 | | | Abaxis, Inc. | | | 24,549 | |
| | 336 | | | Abbott Laboratories | | | 13,742 | |
| | 643 | | | Air Methods Corp. * | | | 33,211 | |
| | | | | | | | 71,502 | |
| Household & Personal Products: 0.1% | | | | |
| | 139 | | | WD-40 Co. | | | 10,456 | |
| Insurance: 1.4% | | | | |
| | 1,174 | | | Assured Guaranty Ltd. | | | 28,763 | |
| | 3,700 | | | BB Seguridade Participacoes S.A. | | | 54,324 | |
| | 1,705 | | | Fidelity National Financial, Inc. | | | 55,856 | |
| | | | | | | | 138,943 | |
| Materials: 9.0% | | | | |
| | 605 | | | Agnico-Eagle Mines Ltd. (CAD) | | | 23,157 | |
| | 11,710 | | | Argonaut Gold, Inc. (CAD) * | | | 48,506 | |
| | 284 | | | Ashland, Inc. | | | 30,882 | |
| | 18,366 | | | B2Gold Corp. * | | | 53,629 | |
| | 14,900 | | | Continental Gold Ltd. (CAD) * | | | 48,873 | |
| | 336 | | | Eagle Materials, Inc. | | | 31,678 | |
| | 8,975 | | | Eldorado Gold Corp. | | | 68,569 | |
See Notes to Financial Statements
VAN ECK VIP MULTI-MANAGER ALTERNATIVES FUND
SCHEDULE OF INVESTMENTS
(unaudited) (continued)
| Number of | | | | | |
| Shares | | | | Value | |
| | | | | | |
| Materials: (continued) | | | | |
| | 13,600 | | | Fortuna Silver Mines, Inc. (CAD) * | | $ | 75,198 | |
| | 2,074 | | | Goldcorp, Inc. | | | 57,885 | |
| | 23,200 | | | Guyana Goldfields, Inc. (CAD) * | | | 56,095 | |
| | 299 | | | Hi-Crush Partners LP | | | 19,602 | |
| | 1,315 | | | MAG Silver Corp. * | | | 12,440 | |
| | 10,301 | | | New Gold, Inc. * | | | 65,617 | |
| | 976 | | | Norbord, Inc. | | | 23,946 | |
| | 833 | | | Osisko Gold Royalties Ltd. (CAD) * | | | 12,522 | |
| | 45,462 | | | Papillon Resources Ltd. (AUD) * # | | | 82,072 | |
| | 665 | | | Platform Specialty Products Corp. * | | | 18,640 | |
| | 679 | | | Randgold Resources Ltd. (ADR) | | | 57,443 | |
| | 920 | | | SunCoke Energy, Inc. * | | | 19,780 | |
| | 2,392 | | | Tahoe Resources, Inc. * | | | 62,670 | |
| | 308 | | | The Dow Chemical Co. | | | 15,850 | |
| | 326 | | | US Silica Holdings, Inc. | | | 18,073 | |
| | 2,204 | | | Yamana Gold, Inc. (CAD) | | | 18,133 | |
| | | | | | | | 921,260 | |
| Media: 2.4% | | | | |
| | 448 | | | CBS Corp. | | | 27,839 | |
| | 284 | | | DISH Network Corp. * | | | 18,483 | |
| | 2,328 | | | Gray Television, Inc. * | | | 30,567 | |
| | 366 | | | Liberty Media Corp. * | | | 50,025 | |
| | 1,672 | | | News Corp. * | | | 29,996 | |
| | 781 | | | Starz - Liberty Capital * | | | 23,266 | |
| | 391 | | | Tribune Co. * | | | 33,255 | |
| | 408 | | | Viacom, Inc. | | | 35,386 | |
| | | | | | | | 248,817 | |
| Pharmaceuticals, Biotechnology: 0.7% | | | | |
| | 92 | | | AstraZeneca Plc (ADR) | | | 6,837 | |
| | 254 | | | BioMarin Pharmaceutical, Inc. * | | | 15,801 | |
| | 461 | | | GlaxoSmithKline PCL (GBP) | | | 12,274 | |
| | 74 | | | Johnson & Johnson | | | 7,742 | |
| | 478 | | | Pfizer, Inc. | | | 14,187 | |
| | 492 | | | Zoetis, Inc. | | | 15,877 | |
| | | | | | | | 72,718 | |
| Real Estate: 1.5% | | | | |
| | 21,200 | | | China Vanke Co. Ltd. (HKD) * | | | 37,255 | |
| | 2,378 | | | Dream Unlimited Corp. * | | | 34,552 | |
| | 79,000 | | | Franshion Properties China Ltd. (HKD) # | | | 20,890 | |
| | 409 | | | The Howard Hughes Corp. * | | | 64,552 | |
| | | | | | | | 157,249 | |
| Retailing: 1.6% | | | | |
| | 296 | | | ANN, Inc. * | | | 12,177 | |
| | 314 | | | Conn’s, Inc. * | | | 15,508 | |
| | 1,103 | | | FTD Cos, Inc. * | | | 35,064 | |
| | 149 | | | Lands’ End, Inc. * | | | 5,003 | |
| | 1,130 | | | Liberty Interactive Corp. * | | | 33,177 | |
| | 688 | | | Sears Holdings Corp. * | | | 27,492 | |
| | 212 | | | Sears Hometown and Outlet Stores, Inc. * | | | 4,552 | |
| | 831 | | | The Finish Line, Inc. | | | 24,714 | |
| | | | | | | | 157,687 | |
| Semiconductors: 1.9% | | | | |
| | 873 | | | Applied Micro Circuits Corp. * | | | 9,437 | |
| | 2,028 | | | Atmel Corp. * | | | 19,002 | |
| | 817 | | | PMC - Sierra, Inc. * | | | 6,217 | |
| | 1,721 | | | RF Micro Devices, Inc. * | | | 16,504 | |
| | 33 | | | Samsung Electronics Co. Ltd. (KRW) # | | | 43,096 | |
| Number of | | | | | |
| Shares | | | | Value | |
| | | | | | |
| Semiconductors: (continued) | | | | |
| | 499 | | | Skyworks Solutions, Inc. | | $ | 23,433 | |
| | 2,129 | | | Taiwan Semiconductor
Manufacturing Co. Ltd. (ADR) | | | 45,539 | |
| | 1,199 | | | Ultratech, Inc. * | | | 26,594 | |
| | | | | | | | 189,822 | |
| Software & Services: 1.9% | | | | |
| | 851 | | | Activision Blizzard, Inc. | | | 18,977 | |
| | 245 | | | Baidu, Inc. (ADR) * | | | 45,768 | |
| | 354 | | | Citrix Systems, Inc. * | | | 22,143 | |
| | 6,493 | | | Demand Media, Inc. * | | | 31,296 | |
| | 519 | | | Euronet Worldwide, Inc. * | | | 25,037 | |
| | 576 | | | InterActiveCorp. | | | 39,877 | |
| | 333 | | | Textura Corp. * | | | 7,872 | |
| | | | | | | | 190,970 | |
| Technology Hardware & Equipment: 1.4% | | | | |
| | 210 | | | Arrow Electronics, Inc. * | | | 12,686 | |
| | 560 | | | Benchmark Electronics, Inc. * | | | 14,269 | |
| | 1,228 | | | CDC Corp. * # § | | | 737 | |
| | 670 | | | Ciena Corp. * | | | 14,512 | |
| | 412 | | | EchoStar Corp. * | | | 21,811 | |
| | 845 | | | Jabil Circuit, Inc. | | | 17,661 | |
| | 35 | | | MTS Systems Corp. | | | 2,372 | |
| | 1,082 | | | Radware Ltd. * | | | 18,253 | |
| | 587 | | | Riverbed Technology, Inc. * | | | 12,110 | |
| | 388 | | | Rogers Corp. * | | | 25,744 | |
| | 23,336 | | | Trident Microsystems, Inc. * # § | | | 525 | |
| | | | | | | | 140,680 | |
| Telecommunication Services: 1.3% | | | | |
| | 2,670 | | | Globalstar, Inc. * | | | 11,348 | |
| | 736 | | | RingCentral, Inc. * | | | 11,136 | |
| | 256 | | | Telephone & Data Systems, Inc. | | | 6,684 | |
| | 202 | | | United States Cellular Corp. * | | | 8,242 | |
| | 1,076 | | | Verizon Communications, Inc. | | | 52,649 | |
| | 1,765 | | | Vivendi SA (EUR) | | | 43,192 | |
| | | | | | | | 133,251 | |
| Transportation: 1.6% | | | | |
| | 853 | | | ArcBest Corp. | | | 37,114 | |
| | 293 | | | Con-way, Inc. | | | 14,770 | |
| | 332 | | | Copa Holdings SA (Class A) | | | 47,333 | |
| | 569 | | | Hertz Global Holdings, Inc. * | | | 15,949 | |
| | 184 | | | Landstar System, Inc. | | | 11,776 | |
| | 633 | | | Roadrunner Transportation Systems, Inc. * | | | 17,787 | |
| | 142 | | | Ryder System, Inc. | | | 12,509 | |
| | 420 | | | Swift Transportation Co. * | | | 10,597 | |
| | | | | | | | 167,835 | |
Total Common Stocks
(Cost: $3,973,005) (a) | | | 4,366,518 | |
| REAL ESTATE INVESTMENT TRUSTS: 0.6% | | | | |
| | | | | |
| Real Estate: 0.6% | | | | |
| | 1,314 | | | NorthStar Realty Finance Corp. | | | 22,837 | |
| | 147 | | | Summit Hotel Properties, Inc. | | | 1,558 | |
| | 178 | | | Weyerhaeuser Co. (Preferred Security) | | | | |
| | | | | 07/01/16 | | | 10,102 | |
| | 1,678 | | | Winthrop Realty Trust | | | 25,757 | |
Total Real Estate Investment Trusts
(Cost: $44,169) (a) | | | 60,254 | |
See Notes to Financial Statements
| Principal | | | | | |
| Amount | | | | Value | |
| | | | | | |
| CORPORATE BONDS: 4.4% | | | | |
| | | | | |
| Basic Materials: 0.5% | | | | |
| | | | | Momentive Performance Materials, Inc. | | | | |
| | $21,000 | | | 8.88%, 10/15/15 (c) (d) | | $ | 22,523 | |
| | 51,000 | | | 11.50%, 08/11/14 (c) (d) | | | 16,320 | |
| | | | | Royal Gold, Inc. | | | | |
| | 10,000 | | | 2.88%, 06/15/19 | | | 10,769 | |
| | | | | | | | 49,612 | |
| Consumer, Cyclical: 2.0% | | | | |
| | | | | Chukchansi Economic Development Authority | | | | |
| | 24,851 | | | 9.75%, 05/30/16 (c) 144A | | | 17,768 | |
| | | | | Claire’s Stores, Inc. | | | | |
| | 40,000 | | | 8.88%, 03/15/15 (c) | | | 35,000 | |
| | | | | JC Penney Corp., Inc. | | | | |
| | 30,000 | | | 6.38%, 10/15/36 | | | 24,675 | |
| | | | | Logan’s Roadhouse, Inc. | | | | |
| | 39,000 | | | 10.75%, 08/11/14 (c) | | | 31,883 | |
| | | | | Navistar International Corp. | | | | |
| | 10,000 | | | 8.25%, 11/01/14 (c) | | | 10,475 | |
| | | | | Neebo, Inc. | | | | |
| | 42,600 | | | 15.00%, 08/11/14 (c) 144A | | | 44,464 | |
| | | | | The Bon-Ton Department Stores, Inc. | | | | |
| | 26,000 | | | 10.63%, 08/11/14 (c) | | | 26,163 | |
| | | | | Toys R Us - Delaware, Inc. | | | | |
| | 16,000 | | | 7.38%, 08/11/14 (c) 144A | | | 14,880 | |
| | | | | | | | 205,308 | |
| Energy: 0.1% | | | | |
| | | | | Chesapeake Energy Corp. | | | | |
| | 9,000 | | | 2.50%, 05/15/17 (c) (p) | | | 9,686 | |
| | | | | Pengrowth Energy Corp. | | | | |
| | CAD 5,000 | | | 6.25%, 03/31/17 | | | 4,937 | |
| | | | | | | | 14,623 | |
| Financial: 0.5% | | | | |
| | | | | Banco Cruzeiro do Sul SA | | | | |
| $150,000 | | | 8.50%, 02/20/15 * (d) Reg S | | | 39,750 | |
| | | | | Nuveen Investments, Inc. | | | | |
| | 12,000 | | | 5.50%, 09/15/15 | | | 12,390 | |
| | | | | | | | 52,140 | |
| Industrial: 0.2% | | | | |
| | | | | Tervita Corp. | | | | |
| | 18,000 | | | 9.75%, 11/01/15 (c) Reg S | | | 17,550 | |
| Technology: 0.1% | | | | |
| | | | | SunGard Data Systems, Inc. | | | | |
| | 10,000 | | | 6.63%, 11/01/15 (c) | | | 10,575 | |
| Telecommunication Services: 1.0% | | | | |
| | | | | Alaska Communications Systems
Group, Inc. | | | | |
| | 40,000 | | | 6.25%, 05/01/18 | | | 32,900 | |
| | | | | IAC/InterActiveCorp. | | | | |
| | 10,000 | | | 4.75%, 12/15/17 (c) | | | 9,888 | |
| | | | | NII Capital Corp. | | | | |
| | 48,000 | | | 10.00%, 08/11/14 (c) | | | 15,120 | |
| | | | | NII International Telecom SCA | | | | |
| | 17,000 | | | 11.38%, 02/15/17 (c) 144A | | | 15,173 | |
| | | | | United States Cellular Corp. | | | | |
| | 21,000 | | | 6.70%, 12/15/33 | | | 21,565 | |
| Principal | | | | | |
| Amount | | | | Value | |
| | | | | | |
| Telecommunication Services: (continued) | | | | |
| | | | | WebMD Health Corp. | | | | |
| | $5,000 | | | 2.50%, 01/31/18 | | $ | 5,281 | |
| | | | | | | | 99,927 | |
Total Corporate Bonds
(Cost: $443,774) (a) | | | 449,735 | |
| | | | | | | |
| Number | | | | | | |
| of Shares | | | | | | |
| | | | | |
| CLOSED-END FUNDS: 2.6% | | | | |
| | 695 | | | Avenue Income Credit Strategies Fund | | | 12,496 | |
| | 1,095 | | | DoubleLine Income Solutions Fund | | | 24,594 | |
| | 781 | | | DoubleLine Opportunistic Credit Fund | | | 18,471 | |
| | 445 | | | First Trust Strategic High Income Fund II | | | 7,276 | |
| | 870 | | | Helios High Income Fund, Inc. | | | 7,987 | |
| | 1,220 | | | Helios Multi-Sector High Income
Fund, Inc. | | | 8,589 | |
| | 620 | | | JZ Capital Partners Ltd. (GBP) | | | 4,685 | |
| | 1,033 | | | LMP Corporate Loan Fund, Inc. | | | 12,417 | |
| | 440 | | | Montgomery Street Income
Securities, Inc. | | | 7,339 | |
| | 750 | | | Nuveen Credit Strategies Income Fund | | | 7,020 | |
| | 326 | | | PCM Fund, Inc. | | | 3,994 | |
| | 1,368 | | | PIMCO Dynamic Credit Income Fund | | | 32,586 | |
| | 1,170 | | | PIMCO Dynamic Income Fund | | | 39,885 | |
| | 997 | | | PIMCO Income Opportunity Fund | | | 29,172 | |
| | 1,158 | | | PIMCO Income Strategy Fund | | | 14,290 | |
| | 1,331 | | | PIMCO Income Strategy Fund II | | | 14,721 | |
| | 1,158 | | | Western Asset High Income
Opportunity Fund, Inc. | | | 7,064 | |
| | 685 | | | Western Asset Mortgage Defined
Opportunity Fund, Inc. | | | 16,851 | |
Total Closed-End Funds
(Cost: $259,640) (a) | | | 269,437 | |
| EXCHANGE TRADED FUNDS: 7.2% | | | | |
| | 1,365 | | | iShares Russell 2000 Growth ETF | | | 188,943 | |
| | 658 | | | iShares Russell 2000 Value ETF | | | 67,945 | |
| | 76 | | | iShares Silver Trust * | | | 1,539 | |
| | 2,442 | | | SPDR S&P 500 ETF Trust | | | 477,948 | |
Total Exchange Traded Funds
(Cost: $710,114) (a) | | | 736,375 | |
| OPTIONS PURCHASED: 0.1% | | | | |
| | 300 | | | CBS Corp. Put | | | | |
| | | | | ($58, expiring 07/19/14) | | | 90 | |
| | 1,100 | | | CBS Corp. Call | | | | |
| | | | | ($80, expiring 07/19/14) | | | 22 | |
| | 3,600 | | | iShares 20+ Year Treasury Bond ETF Put | | | | |
| | | | | ($105, expiring 01/17/15) | | | 4,752 | |
| | 2,800 | | | iShares Russell 2000 ETF Put | | | | |
| | | | | ($111, expiring 07/19/14) | | | 560 | |
| | 900 | | | Lorillard, Inc. Call | | | | |
| | | | | ($63, expiring 09/20/14) | | | 2,565 | |
| | 1,300 | | | Powershares QQQ Trust Series 1 Put | | | | |
| | | | | ($88, expiring 08/16/14) | | | 364 | |
| | 1,300 | | | Powershares QQQ Trust Series 1 Call | | | | |
| | | | | ($97, expiring 08/16/14) | | | 429 | |
| | 1,800 | | | Powershares QQQ Trust Series 1 Put | | | | |
| | | | | ($84, expiring 06/19/15) | | | 18 | |
See Notes to Financial Statements
VAN ECK VIP MULTI-MANAGER ALTERNATIVES FUND
SCHEDULE OF INVESTMENTS
(unaudited) (continued)
| Number of | | | | | |
| Shares | | | | Value | |
| | | | | | |
| OPTIONS PURCHASED: (continued) | | | | |
| | 1,700 | | | SPDR S&P 500 ETF Trust Put | | | | |
| | | | | ($188, expiring 07/19/14) | | $ | 544 | |
| | 1,300 | | | SPDR S&P 500 ETF Trust Put | | | | |
| | | | | ($193, expiring 08/16/14) | | | 2,366 | |
Total Options Purchased
(Cost: $28,159) | | | 11,710 | |
| MONEY MARKET FUND: 43.3% | | | | |
| (Cost: $4,407,958) | | | | |
| | 4,407,958 | | | AIM Treasury Portfolio - Institutional Class | | | 4,407,958 | |
Total Investments: 101.1%
(Cost: $9,866,819) | | | 10,301,987 | |
| Liabilities in excess of other assets: (1.1)% | | | (114,053 | ) |
| NET ASSETS: 100.0% | | $ | 10,187,934 | |
| SECURITIES SOLD SHORT: (25.2)% | | | | |
| | | | | |
| COMMON STOCKS: (2.9)% | | | | |
| | | | | |
| Automobiles & Components: (0.3)% | | | | |
| | (532 | ) | | Thor Industries, Inc. | | $ | (30,255 | ) |
| Capital Goods: (0.1)% | | | | |
| | (1,454 | ) | | Builders FirstSource, Inc. * | | | (10,875 | ) |
| | (77 | ) | | Continental Building Products, Inc. * | | | (1,186 | ) |
| | | | | | | | (12,061 | ) |
| Consumer Durables & Apparel: (0.1)% | | | | |
| | (395 | ) | | Steven Madden Ltd. * | | | (13,548 | ) |
| Consumer Services: (0.2)% | | | | |
| | (513 | ) | | Del Frisco’s Restaurant Group, Inc. * | | | (14,138 | ) |
| Energy: (0.1)% | | | | |
| | (41 | ) | | CARBO Ceramics, Inc. | | | (6,319 | ) |
| Food, Beverage & Tobacco: (0.2)% | | | | |
| | (277 | ) | | Dr Pepper Snapple Group, Inc. | | | (16,227 | ) |
| Health Care Equipment & Services: (0.2)% | | | | |
| | (503 | ) | | Hanger, Inc. * | | | (15,819 | ) |
| Household & Personal Products: (0.1)% | | | | |
| | (185 | ) | | Nu Skin Enterprises, Inc. | | | (13,683 | ) |
| Materials: (0.0)% | | | | |
| | (221 | ) | | Commercial Metals Co. | | | (3,826 | ) |
| Media: (0.1)% | | | | |
| | (201 | ) | | CBS Corp. | | | (12,490 | ) |
| Retailing: (0.2)% | | | | |
| | (404 | ) | | Hibbett Sports, Inc. * | | | (21,885 | ) |
| Semiconductors: (0.2)% | | | | |
| | (367 | ) | | Lattice Semiconductor Corp. * | | | (3,028 | ) |
| | (128 | ) | | Maxim Integrated Products, Inc. | | | (4,328 | ) |
| | (148 | ) | | Power Integrations, Inc. | | | (8,516 | ) |
| | (48 | ) | | Synaptics, Inc. * | | | (4,351 | ) |
| | | | | | | | (20,223 | ) |
| Software & Services: (0.6)% | | | | |
| | (297 | ) | | Activision Blizzard, Inc. | | | (6,622 | ) |
| | (849 | ) | | Callidus Software, Inc. * | | | (10,137 | ) |
| | (382 | ) | | DealerTrack Holdings, Inc. * | | | (17,320 | ) |
| Number of | | | | | |
| Shares | | | | Value | |
| | | | | | |
| Software & Services: (continued) | | | | |
| | (278 | ) | | Jack Henry & Associates, Inc. | | $ | (16,522 | ) |
| | (480 | ) | | QLIK Technologies, Inc. * | | | (10,858 | ) |
| | | | | | | | (61,459 | ) |
| Transportation: (0.5)% | | | | |
| | (883 | ) | | Heartland Express, Inc. | | | (18,843 | ) |
| | (236 | ) | | Hub Group, Inc. * | | | (11,894 | ) |
| | (753 | ) | | Werner Enterprises, Inc. | | | (19,962 | ) |
| | | | | | | | (50,699 | ) |
| Total Common Stocks | | | | |
| (Proceeds: $(283,345)) | | | (292,632 | ) |
| REAL ESTATE INVESTMENT TRUST: (0.1)% | | | | |
| (Proceeds: $(11,600)) | | | | |
| Real Estate: (0.1)% | | | | |
| | (698 | ) | | NorthStar Realty Finance Corp. * | | | (11,600 | ) |
| | | | | | | | | |
| Principal | | | | | | |
| Amount | | | | | | |
| | | | | |
| CORPORATE BONDS: (0.4)% | | | | |
| Consumer, Cyclical: (0.1)% | | | | |
| $(19,000 | ) | | Toys R Us, Inc.
7.38%,10/15/18 | | | (14,392 | ) |
| | | | | |
| Software & Services: (0.3)% | | | | |
| | | | | IAC/InterActiveCorp. | | | | |
| | (30,000 | ) | | 4.88%,11/30/18 (c) | | | (31,425 | ) |
Total Corporate Bonds
(Proceeds: $(45,684)) | | | (45,817 | ) |
| | | | | | | |
| Number | | | | | | |
| of Shares | | | | | | |
| | | | | |
| EXCHANGE TRADED FUNDS: (21.8)% | | | | |
| | (3,079 | ) | | Consumer Staples Select Sector SPDR Fund | | | (137,385 | ) |
| | (5,613 | ) | | Direxion Daily Emerging Markets Bull 3X Shares | | | (173,554 | ) |
| | (79 | ) | | Energy Select Sector SPDR Fund | | | (7,908 | ) |
| | (1,238 | ) | | Industrial Select Sector SPDR Fund | | | (66,927 | ) |
| | (1,504 | ) | | iShares Barclays 20+ Year Treasury Bond Fund | | | (170,734 | ) |
| | (1,074 | ) | | iShares Russell 2000 ETF | | | (127,602 | ) |
| | (763 | ) | | iShares Silver Trust * | | | (15,451 | ) |
| | (24,560 | ) | | Market Vectors Gold Miners ETF ‡ | | | (649,612 | ) |
| | (2,782 | ) | | Market Vectors Oil Services ETF ‡ | | | (160,688 | ) |
| | (277 | ) | | Market Vectors Semiconductor ETF ‡ | | | (13,709 | ) |
| | (277 | ) | | Materials Select Sector SPDR Fund | | | (13,750 | ) |
| | (238 | ) | | Powershares QQQ Trust, Series 1 | | | (22,351 | ) |
| | (504 | ) | | SPDR Barclays High Yield Bond ETF | | | (21,032 | ) |
| | (109 | ) | | SPDR S&P MidCap 400 ETF Trust | | | (28,401 | ) |
| | (6,204 | ) | | SPDR S&P Oil & Gas Exploration &
Production ETF | | | (510,465 | ) |
| | (2,566 | ) | | Technology Select Sector SPDR Fund | | | (98,407 | ) |
Total Exchange Traded Funds
(Proceeds: $(2,154,220)) | | | (2,217,976 | ) |
Total Securities Sold Short
(Proceeds: $(2,494,849)) | | $ | (2,568,025 | ) |
See Notes to Financial Statements
| Number of | | | | | | |
| Shares | | | | Value | |
| | | | |
| WRITTEN OPTIONS: (0.4)% | | | |
| | (1,100 | ) | | CBS Corp. Put | | | | |
| | | | | ($80, expiring 07/19/14) | | | $ (19,932 | ) |
| | (3,100 | ) | | iShares 20+ Year Treasury Bond ETF Put | | | | |
| | | | | ($100, expiring 01/17/15) | | | (1,798 | ) |
| | (900 | ) | | Lorillard, Inc. Put | | | | |
| | | | | ($50, expiring 09/20/14) | | | (495 | ) |
| | (700 | ) | | Powershares QQQ Trust Series 1 Put | | | | |
| | | | | ($80, expiring 06/19/15) | | | (7 | ) |
| | (700 | ) | | Powershares QQQ Trust Series 1 Put | | | | |
| | | | | ($79, expiring 06/19/15) | | | (7 | ) |
| | (400 | ) | | S&P500 EMINI OPTN Put | | | | |
| | | | | ($1875, expiring 08/15/14) | | | (4,000 | ) |
| Number of | | | | | | |
| Shares | | | | Value | |
| | | | | | |
| | WRITTEN OPTIONS: (continued) | | | | |
| | (800 | ) | | S&P500 EMINI OPTN Put | | | | |
| | | | | ($1900, expiring 08/15/14) | | $ | (10,800 | ) |
| | (400 | ) | | S&P500 EMINI OPTN Put | | | | |
| | | | | ($1850, expiring 07/18/14) | | | (840 | ) |
| | (1,700 | ) | | SPDR S&P 500 ETF Trust Put | | | | |
| | | | | ($182, expiring 07/19/14) | | | (238 | ) |
| | (1,300 | ) | | SPDR S&P 500 ETF Trust Put | | | | |
| | | | | ($183, expiring 08/16/14) | | | (728 | ) |
| | Total Written Options
(Premiums received: $(53,435)) | | $ | (38,845 | ) |
| ADR | — | | American Depositary Receipt |
| AUD | — | | Australian Dollar |
| CAD | — | | Canadian Dollar |
| EUR | — | | Euro |
| GBP | — | | British Pound |
| GDR | — | | Global Depositary Receipt |
| HKD | — | | Hong Kong Dollar |
| KRW | — | | Korean Won |
| NVDR | — | | Non-Voting Depositary Receipt |
| SGD | — | | Singapore Dollar |
| THB | — | | Thai Baht |
| (a) | All or a portion of these securities are segregated for securities sold short and written options. Total value of the securities segregated, including cash on deposit with broker, is $7,305,103. |
| (c) | Callable Security - the redemption date shown is when the security may be redeemed by the issuer |
| (d) | Security in default |
| (p) | Puttable Security - the redemption date shown is when the security may be redeemed by the investor |
| ‡ | Affiliated issuer - as defined under the Investment Company Act of 1940. |
| * | Non-income producing |
| # | Indicates a fair valued security which has not been valued utilizing an independent quote, but has been valued pursuant to guidelines established by the Board of Trustees. The aggregate value of fair valued securities is $359,020 which represents 3.5% of net assets. |
| § | Illiquid Security - the aggregate value of illiquid securities is $1,457 which represents 0.0% of net assets. |
| ø | Restricted Security - the aggregate value of restricted securities is $195, or 0.0% of net assets. |
| Reg S | Security was purchased pursuant to Regulation S under the Securities Act of 1933, which exempts from registration securities offered and sold outside of the United States. Such a security cannot be sold in the United States without either an effective registration statement filed pursuant to the Securities Act of 1933, or pursuant to an exemption from registration. |
| 144A | Security exempt from registration under Rule 144A of the Securities Act of 1933, as amended, or otherwise restricted. These securities may be resold in transactions exempt from registration, unless otherwise noted, and the value amounted to $92,285, or 0.9% of net assets. |
Restricted securities held by the Fund as of June 30, 2014 are as follows:
| | | Acquisition | | Number | | | | | | | | % of |
| Security | | Date | | of Shares | | Acquisition Cost | | Value | | Net Assets |
| TPT Acquisition, Inc. | | | 10/02/2012 | | | | 20 | | | | $2,329 | | | | $195 | | | | 0.0% | |
A summary of the Fund’s transactions in securities of affiliates for the period ended June 30, 2014 is set forth below:
| | | Value as of | | | | Sales | | Realized | | Dividend | | Value as of | |
| Affiliates | | December 31, 2013 | | Purchases | | Proceeds | | Loss | | Income | | June 30, 2014 | |
| Market Vectors Gold Miners ETF(1) | | | $ | (292,723 | ) | | | $ | — | | | | $ | 255,782 | | | | $ | — | | | | $ | — | | | | $ | (649,612 | ) | |
| Market Vectors Oil Services ETF(1) | | | | — | | | | | — | | | | | 139,747 | | | | | — | | | | | — | | | | | (160,688 | ) | |
| Market Vectors Semiconductor ETF(1) | | | | (23,634 | ) | | | | 51,111 | | | | | 38,140 | | | | | (2,663 | ) | | | | — | | | | | (13,709 | ) | |
| | | | $ | (316,357 | ) | | | $ | 51,111 | | | | $ | 433,669 | | | | $ | (2,663 | ) | | | $ | — | | | | $ | (824,009 | ) | |
| (1) | Represents short position at June 30, 2014. |
See Notes to Financial Statements
VAN ECK VIP MULTI-MANAGER ALTERNATIVES FUND
SCHEDULE OF INVESTMENTS
(unaudited) (continued)
| Summary of Investments | | % of | | | |
| by Sector (unaudited) | | Investments | | Value | |
| Consumer Discretionary | | | 6.2 | % | | | $641,328 | |
| Consumer Staples | | | 1.7 | | | | 174,032 | |
| Energy | | | 8.3 | | | | 858,849 | |
| Financials | | | 5.4 | | | | 555,281 | |
| Gold | | | 1.3 | | | | 138,167 | |
| Health Care | | | 1.4 | | | | 144,220 | |
| Industrials | | | 4.6 | | | | 477,080 | |
| Information Technology | | | 5.1 | | | | 521,471 | |
| Materials | | | 7.6 | | | | 783,093 | |
| Telecommunication Services | | | 1.3 | | | | 133,251 | |
| Closed-End Funds | | | 2.6 | | | | 269,437 | |
| Corporate Bonds | | | 4.4 | | | | 449,735 | |
| Exchange Traded Funds | | | 7.1 | | | | 736,375 | |
| Options Purchased | | | 0.2 | | | | 11,710 | |
| Money Market Fund | | | 42.8 | | | | 4,407,958 | |
| | | | 100.0 | % | | $ | 10,301,987 | |
The summary of inputs used to value the Fund’s investments as of June 30, 2014 is as follows:
| | | | | | Level 2 | | | Level 3 | | | |
| | | Level 1 | | | Significant | | | Significant | | | |
| | | Quoted | | | Observable | | | Unobservable | | | |
| Long positions | | Prices | | | Inputs | | | Inputs | | Value | |
| Common Stocks | | | | | | | | | | | | | | | | | |
| Automobiles & Components | | $ | 30,687 | | | $ | 42,170 | | | | $ | — | | | $ | 72,857 | |
| Banks | | | 50,217 | | | | 46,592 | | | | | — | | | | 96,809 | |
| Capital Goods | | | 193,209 | | | | — | | | | | — | | | | 193,209 | |
| Commercial & Professional Services | | | 116,036 | | | | — | | | | | — | | | | 116,036 | |
| Consumer Durables & Apparel | | | 66,402 | | | | — | | | | | — | | | | 66,402 | |
| Consumer Services | | | 95,564 | | | | — | | | | | — | | | | 95,564 | |
| Diversified Financials | | | 102,026 | | | | — | | | | | — | | | | 102,026 | |
| Energy | | | 771,835 | | | | 86,819 | | | | | 195 | | | | 858,849 | |
| Food & Staples Retailing | | | 76,476 | | | | — | | | | | — | | | | 76,476 | |
| Food, Beverage & Tobacco | | | 51,176 | | | | 35,924 | | | | | — | | | | 87,100 | |
| Health Care Equipment & Services | | | 71,502 | | | | — | | | | | — | | | | 71,502 | |
| Household & Personal Products | | | 10,456 | | | | — | | | | | — | | | | 10,456 | |
| Insurance | | | 138,943 | | | | — | | | | | — | | | | 138,943 | |
| Materials | | | 839,188 | | | | 82,072 | | | | | — | | | | 921,260 | |
| Media | | | 248,817 | | | | — | | | | | — | | | | 248,817 | |
| Pharmaceuticals, Biotechnology | | | 72,718 | | | | — | | | | | — | | | | 72,718 | |
| Real Estate | | | 136,359 | | | | 20,890 | | | | | — | | | | 157,249 | |
| Retailing | | | 157,687 | | | | — | | | | | — | | | | 157,687 | |
| Semiconductors | | | 146,726 | | | | 43,096 | | | | | — | | | | 189,822 | |
| Software & Services | | | 190,970 | | | | — | | | | | — | | | | 190,970 | |
| Technology Hardware & Equipment | | | 139,418 | | | | — | | | | | 1,262 | | | | 140,680 | |
| Telecommunication Services | | | 133,251 | | | | — | | | | | — | | | | 133,251 | |
| Transportation | | | 167,835 | | | | — | | | | | — | | | | 167,835 | |
| Real Estate Investment Trusts* | | | 60,254 | | | | — | | | | | — | | | | 60,254 | |
| Corporate Bonds* | | | — | | | | 449,735 | | | | | — | | | | 449,735 | |
| Closed-End Funds | | | 269,437 | | | | — | | | | | — | | | | 269,437 | |
| Exchange Traded Funds | | | 736,375 | | | | — | | | | | — | | | | 736,375 | |
| Options Purchased | | | 11,710 | | | | — | | | | | — | | | | 11,710 | |
| Money Market Fund | | | 4,407,958 | | | | — | | | | | — | | | | 4,407,958 | |
| Total | | $ | 9,493,232 | | | $ | 807,298 | | | | $ | 1,457 | | | $ | 10,301,987 | |
See Notes to Financial Statements
| | | | | | Level 2 | | | Level 3 | | | |
| | | Level 1 | | | Significant | | | Significant | | | |
| | | Quoted | | | Observable | | | Unobservable | | | |
| Short positions | | Prices | | | Inputs | | | Inputs | | Value | |
| Common Stocks* | | $ | (292,632 | ) | | | $ | — | | | | $ | — | | | | $ | (292,632 | ) |
| Real Estate Investment Trust* | | | (11,600 | ) | | | | — | | | | | — | | | | | (11,600 | ) |
| Corporate Bonds* | | | — | | | | | (45,817 | ) | | | | — | | | | | (45,817 | ) |
| Exchange Traded Funds | | | (2,217,976 | ) | | | | — | | | | | — | | | | | (2,217,976 | ) |
| Total | | $ | (2,522,208 | ) | | | $ | (45,817 | ) | | | $ | — | | | | $ | (2,568,025 | ) |
| Other Financial Instruments | | | | | | | | | | | | | | | | | | | |
| Written Options | | $ | (38,845 | ) | | | $ | — | | | | $ | — | | | | $ | (38,845 | ) |
* See Schedule of Investments for security type and industry sector breakouts.
The following table reconciles the valuation of the Fund’s Level 3 investment securities and related transactions during the period ended June 30, 2014:
| | | Common Stocks |
| | | Long Positions |
| | | | | Technology Hardware |
| | | Energy | | & Equipment |
| Balance as of December 31, 2013 | | | $ | — | | | | $ | 1,041 | |
| Realized gain (loss) | | | | — | | | | | — | |
| Net change in unrealized appreciation (depreciation) | | | | (165 | ) | | | | 221 | |
| Purchases | | | | — | | | | | — | |
| Sales | | | | — | | | | | — | |
| Transfers in and/or out of level 3 | | | | 360 | | | | | — | |
| Balance as of June 30, 2014 | | | $ | 195 | | | | $ | 1,262 | |
Transfers from Level 2 to Level 3 resulted primarily from limited trading activity.
See Notes to Financial Statements
VAN ECK VIP MULTI-MANAGER ALTERNATIVES FUND
STATEMENT OF ASSETS AND LIABILITIES
June 30, 2014 (unaudited)
| Assets: | | | | |
| Investments, at value (Cost $9,866,819) | | $ | 10,301,987 | |
| Cash | | | 14,137 | |
| Deposits with broker for securities sold short and written options | | | 2,470,301 | |
| Cash denominated in foreign currency, at value (Cost $520) | | | 523 | |
| Receivables: | | | | |
| Investments sold | | | 192,355 | |
| Shares of beneficial interest sold | | | 84,827 | |
| Due from Adviser | | | 40,136 | |
| Dividends and interest | | | 32,693 | |
| Prepaid expenses | | | 21 | |
| Total assets | | | 13,136,980 | |
| | | | | |
| Liabilities: | | | | |
| Securities sold short: | | | | |
| Unaffiliated issuers (proceeds $1,646,099) | | | 1,744,016 | |
| Affiliated issuers (proceeds $848,750) | | | 824,009 | |
| Written options, at value (premiums received $53,435) | | | 38,845 | |
| Payables: | | | | |
| Dividends and interest on securities sold short | | | 1,849 | |
| Investments purchased | | | 197,591 | |
| Shares of beneficial interest redeemed | | | 168 | |
| Deferred Trustee fees | | | 2,688 | |
| Accrued expenses | | | 139,880 | |
| Total liabilities | | | 2,949,046 | |
| NET ASSETS | | $ | 10,187,934 | |
| | | | | |
| Initial Class Shares: | | | | |
| Net Assets | | $ | 10,161,747 | |
| Shares of beneficial interest outstanding | | | 986,640 | |
| Net asset value, redemption and offering price per share | | | $10.30 | |
| Class S Shares: | | | | |
| Net Assets | | $ | 26,187 | |
| Shares of beneficial interest outstanding | | | 2,556 | |
| Net asset value, redemption and offering price per share | | | $10.25 | |
| | | | | |
| Net Assets consist of: | | | | |
| Aggregate paid in capital | | $ | 9,469,103 | |
| Net unrealized appreciation | | | 367,174 | |
| Accumulated net investment loss | | | (23,255 | ) |
| Accumulated net realized gain | | | 374,912 | |
| | | $ | 10,187,934 | |
See Notes to Financial Statements
STATEMENT OF OPERATIONS
For the Six Months Ended June 30, 2014 (unaudited)
| Income: | | | | | | | | |
| Dividends (net of foreign taxes withheld of $758) | | | | | | $ | 55,403 | |
| Interest | | | | | | | 13,316 | |
| Total income | | | | | | | 68,719 | |
| | | | | | | | | |
| Expenses: | | | | | | | | |
| Management fees | | $ | 73,890 | | | | | |
| Distribution fees – Class S Shares | | | 32 | | | | | |
| Transfer agent fees – Initial Class Shares | | | 9,704 | | | | | |
| Transfer agent fees – Class S Shares | | | 7,263 | | | | | |
| Custodian fees | | | 77,989 | | | | | |
| Professional fees | | | 50,677 | | | | | |
| Reports to shareholders | | | 13,465 | | | | | |
| Trustees’ fees and expenses | | | 958 | | | | | |
| Dividends on securities sold short | | | 11,022 | | | | | |
| Interest on securities sold short | | | 755 | | | | | |
| Other | | | 2,112 | | | | | |
| Total expenses | | | 247,867 | | | | | |
| Waiver of management fees | | | (73,890 | ) | | | | |
| Expenses assumed by the Adviser | | | (86,974 | ) | | | | |
| Net expenses | | | | | | | 87,003 | |
| Net investment loss | | | | | | | (18,284 | ) |
| | | | | | | | | |
| Net realized gain (loss) on: | | | | | | | | |
| Investments (net of foreign taxes of $178) | | | | | | | 399,370 | |
| Securities sold short – unaffiliated issuers | | | | | | | (50,316 | ) |
| Securities sold short – affiliated issuers | | | | | | | (2,663 | ) |
| Forward foreign currency contracts, foreign currency transactions and foreign denominated assets and liabilities | | | | | | | (1,400 | ) |
| Swap contracts | | | | | | | 9,306 | |
| Options purchased | | | | | | | (27,000 | ) |
| Written options | | | | | | | 103,435 | |
| Net realized gain | | | | | | | 430,732 | |
| | | | | | | | | |
| Net change in unrealized appreciation (depreciation) on: | | | | | | | | |
| Investments, options purchased, and written options | | | | | | | (149,655 | ) |
| Securities sold short – unaffiliated issuers | | | | | | | (34,307 | ) |
| Securities sold short – affiliated issuers | | | | | | | (122,429 | ) |
| Foreign currency transactions and foreign denominated assets and liabilities | | | | | | | (9 | ) |
| Net change in unrealized appreciation (depreciation) | | | | | | | (306,400 | ) |
| Net Increase in Net Assets Resulting from Operations | | | | | | $ | 106,048 | |
See Notes to Financial Statements
VAN ECK VIP MULTI-MANAGER ALTERNATIVES FUND
STATEMENT OF CHANGES IN NET ASSETS
| | | Six Months Ended
June 30,
2014 | | Year Ended
December 31,
2013 |
| | | (unaudited) | | | | | |
| Operations: | | | | | | | | | | |
| Net investment loss | | | $ | (18,284 | ) | | | $ | (56,092 | ) |
| Net realized gain | | | | 430,732 | | | | | 242,121 | |
| Net change in unrealized appreciation (depreciation) | | | | (306,400 | ) | | | | 278,612 | |
| Net increase in net assets resulting from operations | | | | 106,048 | | | | | 464,641 | |
| | | | | | | | | | | |
| Distributions to shareholders from: | | | | | | | | | | |
| Net realized gains | | | | | | | | | | |
| Initial Class Shares | | | | (137,687 | ) | | | | (52,025 | ) |
| Class S Shares | | | | (353 | ) | | | | (143 | ) |
| | | | | (138,040 | ) | | | | (52,168 | ) |
| | | | | | | | | | | |
| Share transactions*: | | | | | | | | | | |
| Proceeds from sale of shares | | | | | | | | | | |
| Initial Class Shares | | | | 1,190,677 | | | | | 4,008,252 | |
| Class S Shares | | | | — | | | | | — | |
| | | | | 1,190,677 | | | | | 4,008,252 | |
| Reinvestment of distributions | | | | | | | | | | |
| Initial Class Shares | | | | 137,687 | | | | | 52,025 | |
| Class S Shares | | | | 353 | | | | | 143 | |
| | | | | 138,040 | | | | | 52,168 | |
| Cost of shares redeemed | | | | | | | | | | |
| Initial Class Shares | | | | (1,009,123 | ) | | | | (3,567,521 | ) |
| Class S Shares | | | | — | | | | | (10 | ) |
| | | | | (1,009,123 | ) | | | | (3,567,531 | ) |
| Net increase in net assets resulting from share transactions | | | | 319,594 | | | | | 492,889 | |
| Total increase in net assets | | | | 287,602 | | | | | 905,362 | |
| Net Assets: | | | | | | | | | | |
| Beginning of period | | | | 9,900,332 | | | | | 8,994,970 | |
| End of period (including accumulated net investment loss of ($23,255) and ($4,971), respectively) | | | $ | 10,187,934 | | | | $ | 9,900,332 | |
| | | | | | | | | | | |
| * | Shares of beneficial interest issued, reinvested and redeemed
(unlimited number of $.001 par value shares authorized): | | | | | | | | | | |
| Initial Class Shares: | | | | | | | | | | |
| Shares sold | | | | 116,565 | | | | | 404,124 | |
| Shares reinvested | | | | 13,646 | | | | | 5,250 | |
| Shares redeemed | | | | (99,345 | ) | | | | (360,242 | ) |
| Net increase | | | | 30,866 | | | | | 49,132 | |
| | | | | | | | | | | |
| Class S Shares: | | | | | | | | | | |
| Shares sold | | | | — | | | | | �� | |
| Shares reinvested | | | | 35 | | | | | 14 | |
| Shares redeemed | | | | — | | | | | (1 | ) |
| Net increase | | | | 35 | | | | | 13 | |
See Notes to Financial Statements
FINANCIAL HIGHLIGHTS
For a share outstanding throughout each period:
| | | Initial Class Shares |
| | | For the Six
Months Ended
June 30, | | | Year Ended December 31, |
| | | 2014 | | | 2013 | | | | 2012 | | | | 2011 | | | | 2010 | | | | 2009 | |
| | | (unaudited) | | | | | | | | | | | | | | | |
| Net asset value, beginning of period | | | $10.33 | | | | $9.89 | | | | $9.76 | | | | $10.13 | | | | $9.64 | | | | $9.01 | |
| Income from investment operations: | | | | | | | | | | | | | | | | | | | | | | | | |
| Net investment loss | | | (0.02 | ) | | | (0.05 | ) | | | (0.15 | ) | | | (0.15 | ) | | | (0.10 | ) | | | (0.01 | ) |
| Net realized and unrealized gain (loss) on investments | | | 0.13 | | | | 0.55 | | | | 0.28 | | | | (0.07 | ) | | | 0.59 | | | | 1.19 | |
| Total from investment operations | | | 0.11 | | | | 0.50 | | | | 0.13 | | | | (0.22 | ) | | | 0.49 | | | | 1.18 | |
| Less dividends and distributions from: | | | | | | | | | | | | | | | | | | | | | | | | |
| Net investment income | | | — | | | | — | | | | — | | | | (0.09 | ) | | | — | | | | (0.02 | ) |
| Net realized gains | | | (0.14 | ) | | | (0.06 | ) | | | — | | | | (0.06 | ) | | | — | | | | (0.53 | ) |
| Total dividends and distributions | | | (0.14 | ) | | | (0.06 | ) | | | — | | | | (0.15 | ) | | | — | | | | (0.55 | ) |
| Net asset value, end of period | | | $10.30 | | | | $10.33 | | | | $9.89 | | | | $9.76 | | | | $10.13 | | | | $9.64 | |
| Total return (b) | | | 1.09 | %(d) | | | 5.05 | % | | | 1.33 | % | | | (2.27 | )% | | | 5.08 | % | | | 13.75 | % |
| | | | | | | | | | | | | | | | | | | | | | | | | |
| | | | | | | | | | | | | | | | | | | | | | | | | |
| Ratios/Supplemental Data | | | | | | | | | | | | | | | | | | | | | | | | |
| Net Assets, end of period (000’s) | | | $10,162 | | | | $9,874 | | | | $8,969 | | | | $8,979 | | | | $7,642 | | | | $7,631 | |
| Ratio of gross expenses to average net assets (c) | | | 4.80 | %(e) | | | 4.76 | % | | | 5.15 | % | | | 3.98 | % | | | 4.54 | % | | | 4.64 | % |
| Ratio of net expenses to average net assets (c) | | | 1.74 | %(e) | | | 2.39 | % | | | 2.78 | % | | | 2.38 | % | | | 2.46 | % | | | 2.56 | % |
| Ratio of net expenses, excluding interest and dividends on securities sold short and interest expense,to average net assets (c) | | | 1.50 | %(e) | | | 2.03 | % | | | 2.15 | % | | | 2.14 | % | | | 2.15 | % | | | 2.09 | % |
| Ratio of net investment loss to average net assets (c) | | | (0.35 | )%(e) | | | (0.59 | )% | | | (1.47 | )% | | | (1.84 | )% | | | (1.04 | )% | | | (0.14 | )% |
| Portfolio turnover rate | | | 141 | %(d) | | | 255 | % | | | 240 | % | | | 247 | % | | | 334 | % | | | 220 | % |
| | | | | | | | | | | | | | | | | | | | | | | | | |
| | | | | | | | | | | | | | | | | | | | | | | | | |
| | | Class S Shares | | | | | | | | | | | | |
| | | For the Six
Months Ended
June 30,
2014 | | Year Ended
December 31,
2013 | | For the Period
April 30, 2012 (a)
through
December 31,
2012 | | | | | | | | | | | | |
| | | (unaudited) | | | | | | | | | | | | | | | | | | |
| Net asset value, beginning of period | | | $10.29 | | | | $9.88 | | | | $9.98 | | | | | | | | | | | | | |
| Income from investment operations: | | | | | | | | | | | | | | | | | | | | | | | | |
| Net investment loss | | | (0.03 | ) | | | (0.08 | ) | | | (0.09 | ) | | | | | | | | | | | | |
| Net realized and unrealized gain (loss) on investments | | | 0.13 | | | | 0.55 | | | | (0.01 | ) | | | | | | | | | | | | |
| Total from investment operations | | | 0.10 | | | | 0.47 | | | | (0.10 | ) | | | | | | | | | | | | |
| Less distributions from: | | | | | | | | | | | | | | | | | | | | | | | | |
| Net realized gains | | | (0.14 | ) | | | (0.06 | ) | | | — | | | | | | | | | | | | | |
| Net asset value, end of period | | | $10.25 | | | | $10.29 | | | | $9.88 | | | | | | | | | | | | | |
| Total return (b) | | | 1.00 | %(d) | | | 4.75 | % | | | (1.00 | )%(d) | | | | | | | | | | | | |
| | | | | | | | | | | | | | | | | | | | | | | | | |
| | | | | | | | | | | | | | | | | | | | | | | | | |
| Ratios/Supplemental Data | | | | | | | | | | | | | | | | | | | | | | | | |
| Net Assets, end of period (000’s) | | | $26 | | | | $26 | | | | $25 | | | | | | | | | | | | | |
| Ratio of gross expenses to average net assets (c) | | | 61.54 | %(e) | | | 65.50 | % | | | 5.61 | %(e) | | | | | | | | | | | | |
| Ratio of net expenses to average net assets (c) | | | 1.97 | %(e) | | | 2.64 | % | | | 3.01 | %(e) | | | | | | | | | | | | |
| Ratio of net expenses, excluding interest and dividends on securities sold short and interest expense, to average net assets (c) | | | 1.75 | %(e) | | | 2.29 | % | | | 2.40 | %(e) | | | | | | | | | | | | |
| Ratio of net investment loss to average net assets (c) | | | (0.55 | )%(e) | | | (0.86 | )% | | | (1.37 | )%(e) | | | | | | | | | | | | |
| Portfolio turnover rate | | | 141 | %(d) | | | 255 | % | | | 240 | %(d)(f) | | | | | | | | | | | | |
| (a) | Commencement of operations |
| (b) | Total return is calculated assuming an initial investment made at the net asset value at the beginning of period, reinvestment of any dividends and distributions at net asset value on the dividend/distributions payment date and a redemption at the net asset value on the last day of the period. The return does not reflect the deduction of taxes that a shareholder would pay on Fund dividends/distributions or the redemption of Fund shares. |
| (c) | The ratios presented do not reflect the Fund’s proportionate share of income and expenses from the Fund’s investments in underlying Funds. |
| (d) | Not annualized |
| (e) | Annualized |
| (f) | Portfolio turnover is calculated at the fund level and represents a twelve month period. |
See Notes to Financial Statements
VAN ECK VIP MULTI-MANAGER ALTERNATIVES FUND
NOTES TO FINANCIAL STATEMENTS
June 30, 2014 (unaudited)
Note 1—Fund Organization—Van Eck VIP Trust (the “Trust”) is registered under the Investment Company Act of 1940, as amended, as an open-end management investment company. The Trust was organized as a Massachusetts business trust on January 7, 1987. The Van Eck VIP Multi-Manager Alternatives Fund (the “Fund”) is a non-diversified series of the Trust and seeks to achieve consistent absolute (positive) returns in various market cycles. The Fund offers two classes of shares: Initial Class Shares and Class S Shares. The two classes are identical except Class S Shares are subject to a distribution fee.
Note 2—Significant Accounting Policies—The preparation of financial statements in conformity with U.S. generally accepted accounting principles (“GAAP”) requires management to make estimates and assumptions that affect the reported amounts and disclosures in the financial statements. Actual results could differ from those estimates.
The Fund is an investment company and is following accounting and reporting requirements of Accounting Standard Codification (“ASC”) 946 Financial Services – Investment Companies.
The following is a summary of significant accounting policies followed by the Fund.
| A. | Security Valuation—The Fund values its investments in securities and other assets and liabilities carried at fair value daily. Fair value is the price that would be received to sell an asset or paid to transfer a liability in an orderly transaction between market participants on the measurement date. Securities traded on national exchanges or traded on the NASDAQ National Market System are valued at the last sales price as reported at the close of each business day. Securities traded on the NASDAQ Stock Market are valued at the NASDAQ official closing price. Over-the-counter securities not included in the NASDAQ National Market System and listed securities for which no sale was reported are valued at the mean of the bid and ask prices. To the extent these securities are actively traded they are categorized as Level 1 in the fair value hierarchy (as described below). Certain foreign securities, whose values may be affected by market direction or events occurring before the Fund’s pricing time (4:00 p.m. Eastern Standard Time) but after the close of the securities’ primary market, are fair valued using a pricing service and are categorized as Level 2 in the fair value hierarchy. The pricing service considers the correlation of the trading patterns of the foreign security to intraday trading in the U.S. markets, based on indices of domestic securities and other appropriate indicators such as prices of relevant ADR’s and futures contracts. The Fund may also fair value securities in other situations, such as, when a particular foreign market is closed but the Fund is open. Bonds and notes are fair valued using a pricing service which utilizes models that incorporate observable data such as sales of similar securities, broker quotes, yields, bids, offers and reference data and are categorized as Level 2 in the fair value hierarchy. Short-term obligations with more than sixty days remaining to maturity are valued at market value. Short-term obligations with sixty days or less to maturity are valued at amortized cost, which with accrued interest approximates market value. Exchange traded funds as well as closed-end publicly listed fund investments are valued at their official market closing price and are categorized as Level 1 in the fair value hierarchy. Open-end mutual fund investments (including money market funds) are valued at their closing net asset value each business day and are categorized as Level 1 in the fair value hierarchy. Futures contracts are valued using the closing price reported at the close of the respective exchange and are categorized as Level 1 in the fair value hierarchy. Forward foreign currency contracts are valued at the spot currency rate plus an amount (“points”), which reflects the differences in interest rates between the U.S. and foreign markets and are classified as Level 2 in the fair value hierarchy. Securities for which quotations are not readily available are stated at fair value as determined by the Pricing Committee of Van Eck Associates Corporation (the “Adviser”) appointed by the Board of Trustees. The Pricing Committee provides oversight of the Fund’s valuation policies and procedures, which are approved by the Fund’s Board of Trustees. Among other things, these procedures allow the Fund to utilize independent pricing services, quotations from securities dealers, and other market sources to determine fair value. The Pricing Committee convenes regularly to review the fair value of financial instruments for which market prices are not readily available. The Pricing Committee employs various methods for calibrating the valuation approaches utilized to determine fair value, including a regular review of key inputs and assumptions, transactional back-testing and disposition analysis. |
| | |
| | Certain factors such as economic conditions, political events, market trends, the nature of and duration of any restrictions on disposition, trading in similar securities of the issuer or comparable issuers and other security specific information are used to determine the fair value for these securities. Depending on the relative significance of valuation inputs, these securities may be classified either as Level 2 or Level 3 in the fair value hierarchy. The price which the Fund may realize upon sale of an investment may differ materially from the value presented in the Schedule of Investments. |
| | |
| | The Fund utilizes various methods to measure the fair value of its investments on a recurring basis which includes a hierarchy that prioritizes inputs to valuation methods used to measure fair value. The fair value hierarchy gives highest priority to unadjusted quoted prices in active markets for identical assets and liabilities (Level 1 measurements) and the lowest priority to unobservable inputs (Level 3 measurements). The inputs or methodologies used for valuing securities are not necessarily an indication of the risk |
| | associated with investing in those securities. The transfers between levels of the fair value hierarchy assume the financial instruments were transferred at the beginning of the reporting period. The three levels of the fair value hierarchy are described below: |
| | Level 1 — | Quoted prices in active markets for identical securities. |
| | | |
| | Level 2 — | Significant observable inputs (including quoted prices for similar securities, interest rates, prepayment speeds, credit risk, etc.). |
| | | |
| | Level 3 — | Significant unobservable inputs (including the Fund’s own assumptions in determining the fair value of investments). |
| | A summary of the inputs, the levels used to value the Fund’s investments, and transfers between levels are located in the Schedule of Investments. Additionally, tables that reconcile the valuation of the Fund’s Level 3 investments and that present additional information about valuation methodologies and unobservable inputs, if applicable, are located in the Schedule of Investments. |
| | |
| B. | Federal Income Taxes—It is the Fund’s policy to comply with the provisions of the Internal Revenue Code applicable to regulated investment companies and to distribute all of its taxable income to its shareholders. Therefore, no federal income tax provision is required. |
| | |
| C. | Dividends and Distributions to Shareholders—Dividends to shareholders from net investment income and distributions from net realized capital gains, if any, are declared and paid annually. Income dividends and capital gain distributions are determined in accordance with U.S. income tax regulations, which may differ from such amounts determined in accordance with GAAP. |
| | |
| D. | Securities Sold Short—A short sale occurs when a Fund sells a security, which it does not own, by borrowing it from a broker. Proceeds from securities sold short are reported as liabilities on the Statement of Assets and Liabilities and are marked to market daily in accordance with the fair value methodology described in Note 2A. Gains and losses are classified as realized when short positions are closed. In the event that the value of the security that the Fund sold short declines, the Fund will gain as it repurchases the security in the market at the lower price. If the price of the security increases, the Fund will suffer a loss, as it will have to repurchase the security at the higher price. Short sales may incur higher transaction costs than regular securities transactions. Dividends and interest on short sales are recorded as an expense by the Fund on the ex-dividend date or interest payment date, respectively. Cash as collected is deposited in a segregated account with brokers, maintained by the Fund, for its open short sales. Until the Fund replaces the borrowed security, the Fund maintains securities or permissible liquid assets in a segregated account with a broker or custodian sufficient to cover its short positions. Securities sold short at June 30, 2014 are reflected in the Schedule of Investments. |
| | |
| E. | Currency Translation—Assets and liabilities denominated in foreign currencies and commitments under foreign currency contracts are translated into U.S. dollars at the closing prices of such currencies each business day. Purchases and sales of investments are translated at the exchange rates prevailing when such investments are acquired or sold. Income and expenses are translated at the exchange rates prevailing when accrued. The portion of realized and unrealized gains and losses on investments that result from fluctuations in foreign currency exchange rates is not separately disclosed. Recognized gains or losses attributable to foreign currency fluctuations on foreign currency denominated assets, other than investments, and liabilities are recorded as net realized gain (loss) on forward foreign currency contracts, foreign currency transactions and foreign denominated assets and liabilities in the Statement of Operations. |
| | |
| F. | Restricted Securities—The Fund may invest in securities that are subject to legal or contractual restrictions on resale. These securities generally may be resold in transactions exempt from registration or to the public if the securities are registered. Disposal of these securities may involve time-consuming negotiations and expense, and prompt sale at an acceptable price may be difficult. Information regarding restricted securities is included at the end of the Fund’s Schedule of Investments. |
| | |
| G. | Structured Notes—The Fund may invest in structured notes whose values are based on the price movements of a referenced security or index. The value of these structured notes will rise and fall in response to changes in the referenced security or index. On the maturity date of each structured note, the Fund will receive a payment from a counterparty based on the value of the referenced security or index (notional amount multiplied by the price of the referenced security or index) and record a realized gain or loss. |
| | |
| | Structured notes may present a greater degree of market risk than many types of securities and may be more volatile and less liquid than less complex securities. Structured notes are also subject to the risks that the issuer of the structured notes may fail to perform its contractual obligations. At June 30, 2014, the Fund held no structured notes. |
| | |
| H. | Use of Derivative Instruments—The Fund may make investments in derivative instruments, including, but not limited to, options, futures, swaps and other derivatives relating to foreign currency transactions. A derivative is an instrument whose value is derived from underlying assets, indices, reference rates or a combination of these factors. Derivative instruments may be |
VAN ECK VIP MULTI-MANAGER ALTERNATIVES FUND
NOTES TO FINANCIAL STATEMENTS
(unaudited) (continued)
| | privately negotiated contracts (often referred to as over the counter (“OTC”) derivatives) or they may be listed and traded on an exchange. Derivative contracts may involve future commitments to purchase or sell financial instruments or commodities at specified terms on a specified date, or to exchange interest payment streams or currencies based on a notional or contractual amount. Derivative instruments may involve a high degree of financial risk. The use of derivatives instruments also involves the risk of loss if the investment adviser is incorrect in its expectation of the timing or level of fluctuations in securities prices, interest rates or currency prices. Investments in derivative instruments also include the risk of default by the counterparty, the risk that the investment may not be liquid and the risk that a small movement in the price of the underlying security or benchmark may result in a disproportionately large movement, unfavorable or favorable, in the price of the derivative instruments. |
Credit Default Swaps—The Fund may enter into credit default swaps, which may have as reference obligations one or more securities or a basket of securities that are or are not currently held by the Fund. The protection “buyer” in a credit default contract is generally obligated to pay the protection “seller” an upfront or a periodic stream of payments over the term of the contract provided that no credit event such as a default, on a reference obligation has occurred. If a credit event occurs, the seller generally must pay the buyer the “par value” (full notional value) of the swap in exchange for an equal face amount of deliverable obligations of the reference entity described in the swap or the seller may be required to deliver the related net cash amount, if the swap is cash settled. The Fund may enter into a credit default swap contract for investment purposes, to manage its credit risk and to provide protection against defaults of the issuers. The Fund held credit default swap contracts for two months during the period ended June 30, 2014 with an average monthly notional amount of $250,000. At June 30, 2014, the Fund held no credit default swaps.
Forward Foreign Currency Contracts—The Fund is subject to foreign currency risk in the normal course of pursuing its investment objectives. The Fund may buy and sell forward foreign currency contracts to settle purchases and sales of foreign denominated securities, gain currency exposure or to hedge foreign denominated assets. Realized gains and losses from forward foreign currency contracts, if any, are included in realized gain (loss) on forward foreign currency contracts, foreign currency transactions and foreign denominated assets and liabilities in the Statement of Operations. The Fund may incur additional risk from investments in forward foreign currency contracts if the counterparty is unable to fulfill its obligation or there are unanticipated movements of the foreign currency relative to the U.S. dollar. The Fund held forward foreign currency contracts for three months during the period ended June 30, 2014 with an average unrealized depreciation of $39. At June 30, 2014, the Fund held no forward foreign currency contracts.
Futures Contracts—The Fund is subject to equity price risk in the normal course of pursuing its investment objectives. The Fund may buy and sell futures contracts. The Fund may engage in these transactions to seek performance that corresponds to the index and in managing cash flows. A futures contract is an agreement between two parties to buy or sell a specified instrument at a set price on a future date. Realized gains and losses from futures contracts, if any, are reported separately. During the period ended June 30, 2014, the Fund held no futures contracts.
Option Contracts—The Fund is subject to equity price risk, interest rate risk and commodity price risk in the normal course of pursuing their investment objectives. The Fund may invest in call and put options on securities, currencies and commodities to gain exposure to or hedge against changes in the value of equities, interest rates, or commodities. Call and put options gives the Fund the right, but not the obligation, to buy (calls) or sell (puts) the instrument underlying the option at a specified price. The premium paid on the option, should it be exercised, will, on a call, increase the cost of the instrument acquired and, on a put, reduce the proceeds received from the sale of the instrument underlying the option. If the options are not exercised, the premium paid will be recorded as a realized loss upon expiration. The Fund may incur additional risk to the extent the value of the underlying instrument does not correlate with the movement of the option value.
The Fund may also write call or put options in order to gain exposure or to protect against changes in the markets or in an attempt to enhance income or gains. As a writer of an option, the Fund receives a premium. The Fund keeps the premium whether or not the option is exercised. The premium will be recorded, upon expiration of the option, as a realized gain on the Statement of Operations. If the option is exercised, the Fund must sell, in the case of a written call, or buy, in the case of a written put, the underlying instrument at the exercise price. The Funds may write covered puts and calls. A covered call or put option is an option in which the Fund owns the instrument underlying the call or put. A covered call sold exposes the Fund during the term of the option to possible loss of opportunity to realize appreciation in the market price of the underlying instrument or to possible continued holding of an underlying instrument which might otherwise have been sold to protect against a decline in the market price. A covered put exposes the Fund during the term of the option to a decline in price of the underlying instrument. The Fund maintains securities or permissible liquid assets in a segregated account with a broker or custodian sufficient to cover its put option positions. The Fund may incur additional risk from investments in written currency options if there are unanticipated movements in the underlying currencies. Transactions in put and call options written during the period ended June 30, 2014 were as follows:
| | | Number of
Contracts | | Premiums |
| Options outstanding at December 31, 2013 | | | (107 | ) | | $ | (14,423 | ) |
| Options opened | | | — | | | | — | |
| Options written | | | (1,120 | ) | | | (200,637 | ) |
| Options exercised | | | 31 | | | | 2,314 | |
| Options expired | | | 158 | | | | 13,308 | |
| Options closed | | | 911 | | | | 146,003 | |
| Options outstanding at June 30, 2014 | | | (127 | ) | | $ | (53,435 | ) |
At June 30, 2014, the Fund had the following derivative instruments:
| | | Liability derivatives |
| | | Equity risk |
| Written options1 | | $38,845 |
| | 1 | Statement of Assets and Liabilities location: Written options, at value |
The impact of transactions in derivative instruments, during the period ended June 30, 2014, were as follows:
| | | Equity risk | | Foreign Currency risk | | Credit risk |
| Realized gain(loss): | | | | | | | | | | | | |
| Forward foreign currency contacts1 | | | $ — | | | | $(564 | ) | | $ | — | |
| Written options2 | | | 103,435 | | | | — | | | | — | |
| Swap contracts3 | | | — | | | | — | | | | 9,306 | |
| Net change in appreciation (depreciation): | | | | | | | | | | | | |
| Written options4 | | | 9,374 | | | | — | | | | — | |
| | 1 | Statement of Operations location: Net realized loss on forward foreign currency contracts, foreign currency transactions and foreign denominated assets and liabilities |
| | 2 | Statement of Operations location: Net realized gain on written options |
| | 3 | Statement of Operations location: Net realized gain on swap contracts |
| | 4 | Statement of Operations location: Net change in unrealized appreciation (depreciation) on investments, options purchased and written options |
| I. | Offsetting Assets and Liabilities—In the ordinary course of business, the Fund enter into transactions subject to enforceable master netting agreements or other similar agreements. Generally, the right of setoff in those agreements allows the Fund to set off any exposure to a specific counterparty with any collateral received or delivered to that counterparty based on the terms of the agreements. The Fund may pledge or receive cash and/or securities as collateral for derivative instruments. Collateral held at June 30, 2014 is presented in the Schedule of Investments. |
| | |
| | The tables below present both gross and net information about the derivative instruments eligible for offset in the Statement of Assets and Liabilities or are subject to an agreement similar to master netting agreement, as well as financial collateral received or pledged (including cash collateral) as of June 30, 2014. Collateral, if any, is disclosed up to an amount of 100% of the net amount of unrealized gain/loss for the respective financial instruments. In general, collateral received or pledged exceeds the net amount of the unrealized gain/loss or market value of financial instruments. |
| | | Gross
Amounts of
Recognized
Assets | | Gross Amounts
Offset in the
Statement of Assets
and Liabilities | | Net Amounts of
Assets Presented
in the Statement
of Assets and
Liabilities | | Financial
Instruments
and
Collateral
Received | | Net
Amount |
| Written options, at value | | | $ — | | | | $38,845 | | | | $38,845 | | | | $(38,845 | ) | | | $ — | |
| J. | Other—Security transactions are accounted for on trade date. Dividend income is recorded on the ex-dividend date except that certain dividends from foreign securities are recognized upon notification of the ex-dividend date. Interest income, including amortization of premiums and discounts, is accrued as earned. Realized gains and losses are calculated on the identified cost basis. Estimated foreign taxes that are expected to be withheld from proceeds at the sale of certain foreign investments are accrued by the Fund and decrease net unrealized appreciation (depreciation) on investments. |
| | |
| | In the normal course of business, the Fund enters into contracts that contain a variety of general indemnifications. The Fund’s maximum exposure under these agreements is unknown as this would involve future claims that may be made against the Fund that have not yet occurred. However, the Adviser believes the risk of loss under these arrangements to be remote. |
VAN ECK VIP MULTI-MANAGER ALTERNATIVES FUND
NOTES TO FINANCIAL STATEMENTS
(unaudited) (continued)
Note 3—Investment Management and Other Agreements—The Adviser is the investment adviser to the Fund. The Adviser receives a management fee at an annual rate of: (i) 1.00% of the Fund’s average daily net assets that are managed by the Adviser, and not by a sub-adviser, and that are invested in underlying funds (exchange traded funds, open and closed end mutual funds); and (ii) 1.60% of the Fund’s average daily net assets with respect to all other assets of the Fund.
The Adviser has agreed, at least until May 1, 2015, to voluntarily waive or limit management fees and/or assume expenses (excluding acquired fund fees and expenses, interest expense, trading expenses, dividends and interest payments on securities sold short, taxes and extraordinary expenses) from exceeding 1.50% of average daily net assets for Initial Class Shares and 1.75% for Class S Shares.
For the period ended June 30, 2014, the Adviser waived management fees in the amount of $73,890 and assumed other expenses of $86,974. The Adviser offsets the management fees it charges the Fund by the amount it collects as a management fee from an underlying fund managed by the Adviser, as a result of an investment of the Fund’s assets in such underlying funds. There was no offset of management fees from any underlying funds managed by the Adviser for the period ended June 30, 2014.
As of June 30, 2014, the Fund had three sub-advisers: Coe Capital Management, LLC, Horizon Asset Management, LLC, and Tiburon Capital Management. The Adviser directly paid sub-advisory fees to the sub-advisers at a rate of 1.00% of the portion of the average daily net assets of the Fund managed by each of the sub-advisers.
Certain officers and trustees of the Trust are officers, directors or stockholders of the Adviser and Van Eck Securities Corporation, (the “Distributor”).
Note 4—12b-1 Plans of Distribution—The Fund and the Distributor are parties to a distribution agreement dated May 1, 2012. The Fund has adopted a Distribution Plan (the “Plan”) for Class S Shares in accordance with Rule 12b-1 under the 1940 Act. Pursuant to the Plan, the Fund is authorized to incur distribution expenses for its Class S Shares which will principally be payments to securities dealers who have sold shares and serviced shareholder accounts and payments to the Distributor, for reimbursement of other actual promotion and distribution expenses incurred by the Distributor on behalf of the Fund. The amount paid in any one year is 0.25% of average daily net assets for Class S Shares.
Note 5—Investments—For the period ended June 30, 2014, the cost of purchases and proceeds from sales of investments, excluding U.S. government securities and short-term obligations, aggregated $7,619,632 and $9,289,476, respectively. Proceeds of short sales and the cost of purchases of short sale covers aggregated $4,842,633 and $4,512,347, respectively.
Note 6—Income Taxes—For Federal income tax purposes, the identified cost of investments owned at June 30, 2014 was $9,908,488 and net unrealized appreciation aggregated $393,499 of which $583,020 related to appreciated securities and $189,521 related to depreciated securities.
The tax character of dividends and distributions paid to shareholders during the year ended December 31, 2013 were as follows:
| | | Year Ended
December 31, 2013 |
| Long-term capital gains | | | $52,168 | |
The Fund recognizes the tax benefits of uncertain tax positions only where the position is “more-likely-than-not” to be sustained assuming examination by applicable tax authorities. Management has analyzed the Fund’s tax positions, and has concluded that no liability for unrecognized tax benefits should be recorded related to uncertain tax positions taken on return filings for open tax years (tax years ended December 31, 2010-2013), or expected to be taken in the Fund’s current tax year. The Fund does not have exposure for additional years that might still be open in certain foreign jurisdictions. Therefore, no provision for income tax is required in the Fund’s financial statements.
The Fund recognizes interest and penalties, if any, related to uncertain tax positions as income tax expense on the Statement of Operations. During the period ended June 30, 2014, the Fund did not incur any interest or penalties.
Note 7—Concentration of Risk—At June 30, 2014, Van Eck Securities Corp. owns approximately 16% of the Initial Class Shares and 100% of the Class S Shares of the outstanding shares of beneficial interest. Additionally, the aggregate shareholder accounts of five insurance companies own approximately 31%, 18%, 17%, 9% and 6% of Initial Class Shares of the outstanding shares of beneficial interest.
The Fund may invest in debt securities which are rated as below investment grade by rating agencies. Such securities involve more risk of default than do higher rated securities and are subject to greater price variability.
The Fund may invest in closed-end funds that may trade at a discount or premium to their net asset value. A closed-end fund may be leveraged as part of its investment strategy. As a result, the Fund may be indirectly exposed to the effects of leverage through
its investment in the underlying funds. Investments in underlying funds that use leverage may cause the value of the Fund’s shares to be more volatile than if the Fund invested in underlying funds that do not utilize leverage.
Note 8—Bank Line of Credit—The Trust may participate with Van Eck Funds (collectively the “VE/VIP Funds”) in a $30 million committed credit facility (the “Facility”) to be utilized for temporary financing until the settlement of sales or purchases of portfolio securities, the repurchase or redemption of shares of the Fund and other temporary or emergency purposes. The VE/VIP Funds have agreed to pay commitment fees, pro rata, based on the unused but available balance. Interest is charged to the VE/VIP Funds at rates based on prevailing market rates in effect at the time of borrowings. During the period ended June 30, 2014, the average daily loan balance during the 1 day period for which a loan was outstanding amounted to $15,017 and the average interest rate was 1.34%. At June 30, 2014, the Fund had no outstanding borrowings under the Facility.
Note 9—Trustee Deferred Compensation Plan—The Trust has a Deferred Compensation Plan (the “Deferred Plan”) for Trustees under which the Trustees can elect to defer receipt of their trustee fees until retirement, disability or termination from the Board of Trustees. The fees otherwise payable to the participating Trustees are deemed invested in shares of eligible Funds of the Trust and the Van Eck Funds (another registered investment company managed by the Adviser) as directed by the Trustees.
The expense for the Deferred Plan is included in “Trustees’ fees and expenses” in the Statement of Operations. The liability for the Deferred Plan is shown as “Deferred Trustee fees” in the Statement of Assets and Liabilities.
Note 10—Subsequent Event Review—The Fund has evaluated subsequent events and transactions for potential recognition or disclosure through the date the financial statements were issued.
VAN ECK VIP MULTI-MANAGER ALTERNATIVES FUND
APPROVAL OF ADVISORY AND SUB-ADVISORY AGREEMENTS
June 30, 2014 (unaudited)
Approval of Advisory and Sub-Advisory Agreements
The Investment Company Act of 1940, as amended (the “1940 Act”), provides, in substance, that an investment advisory agreement between a fund and its investment adviser may be entered into only if it is approved, and may continue in effect from year to year after an initial two-year period only if its continuance is approved, at least annually by the fund’s board of trustees, including by a vote of a majority of the trustees who are not “interested persons” of the fund as defined in the 1940 Act (the “Independent Trustees”), cast in person at a meeting called for the purpose of considering such approval. On June 25, 2014, the Board of Trustees (the “Board”) of Van Eck VIP Trust (the “Trust”), which is comprised exclusively of Independent Trustees, voted to approve the continuation of the existing advisory between the Van Eck VIP Multi-Manager Alternatives Fund (the “Fund”) and its investment adviser, Van Eck Associates Corporation (together with its affiliated companies, the “Adviser”), and the existing sub-advisory agreement between each Sub-Adviser (as defined below) and the Adviser (collectively, the “Advisory Agreements”). Information regarding the material factors considered and related conclusions reached by the Board in approving the continuation of the Advisory Agreements is set forth below.
In considering the continuation of the Advisory Agreements, the Board reviewed and considered information that had been provided throughout the year by the Adviser and Coe Capital Management, LLC (“Coe”), Horizon Asset Management LLC (“Horizon”), RiverPark Advisors, LLC (“RiverPark”), SW Asset Management, LLC (“SW”) and Tiburon Capital Management, LLC (“Tiburon” and, collectively with Coe, Horizon, RiverPark and SW, the “Sub-Advisers”). Such information had been provided throughout the year at regular and special meetings of the Board and its committees, including information requested by the Board and furnished by the Adviser and the Sub-Advisers for meetings of the Board held on June 5, 2014 and June 24 and 25, 2014 specifically for the purpose of considering the continuation of the Advisory Agreements. The written and oral reports provided to the Board included, among other things, the following:
| n | Information about the overall organization of the Adviser and the Adviser’s short-term and long-term business plans with respect to its mutual fund operations and other lines of business; |
| | |
| n | The consolidated financial statements of the Adviser for the past three fiscal years; |
| | |
| n | Copies of the Advisory Agreements and descriptions of the services provided by the Adviser and each Sub-Adviser thereunder; |
| | |
| n | Information regarding each Sub-Adviser’s organization, personnel, investment strategies and key compliance procedures; |
| | |
| n | Information regarding the qualifications, education and experience of the investment professionals responsible for portfolio management, investment research and trading activities for the Fund, the structure of their compensation and the resources available to support these activities; |
| | |
| n | A report prepared by an independent consultant comparing the Fund’s investment performance (including, where relevant, total returns, standard deviations, Sharpe ratios, information ratios, beta and alpha) with respect to a representative class of shares of the Fund for the one-, three- and five- year periods ended March 31, 2014 with those of (i) a universe of mutual funds selected by the independent consultant with similar portfolio holding characteristics, share class attributes and other operational characteristics as the Fund (the “Category”), (ii) a sub-group of funds selected from the Category by the independent consultant further limited to approximate more closely the Fund’s investment style, expense structure and asset size (the “Peer Group”) and (iii) an appropriate benchmark index; |
| | |
| n | A report prepared by an independent consultant comparing the advisory fees and other expenses of a representative class of shares of the Fund during its fiscal year ended December 31, 2013 with a similar share class of each fund in the (i) Category and (ii) Peer Group; |
| | |
| n | Materials prepared by the Adviser comparing the investment performance of each asset class or sub-asset class in which the Adviser directly invests the assets of the Fund with that of an appropriate benchmark year-to-date and for one-, three- and five-year periods (or since the Adviser began to directly invest in such asset class or sub-asset class if less) ended March 31, 2014; |
| | |
| n | An analysis of the profitability of the Adviser with respect to its services for the Fund and the Van Eck complex of mutual funds as a whole (the “Van Eck Complex”); |
| | |
| n | Information regarding other investment products and services offered by the Adviser and each Sub-Adviser involving investment objectives and strategies similar to the Fund (“Comparable Products”), including the fees charged by the Adviser and the Sub-Adviser for managing the Comparable Products, a description of material differences and similarities in the services provided by the Adviser and the Sub-Adviser for the Fund and the Comparable Products, the |
| | size of the Comparable Products, the performance of the Comparable Products and identity of the individuals responsible for managing the Comparable Products; |
| | |
| n | Information concerning the Adviser’s and Sub-Adviser’s compliance program, the resources devoted to compliance efforts undertaken by the Adviser and the Sub-Advisers on behalf of the Fund, and reports regarding a variety of compliance-related issues; |
| | |
| n | Information with respect to the Adviser’s and each Sub-Adviser’s brokerage practices, if any, including the Adviser’s and Sub-Adviser’s processes for monitoring best execution of portfolio transactions and the benefits received by the Adviser and Sub-Adviser from research acquired with soft dollars; |
| | |
| n | Information regarding the procedures used by the Adviser in monitoring the valuation of portfolio securities, including the methodologies used in making fair value determinations; |
| | |
| n | Information regarding the Adviser’s and each Sub-Adviser’s policies and practices with respect to personal investing by the Adviser, Sub-Adviser and their employees, including reports regarding the administration of the Adviser’s and Sub-Adviser’s codes of ethics and the Adviser’s policy with respect to investments in the Fund by the Adviser’s investment personnel; |
| | |
| n | Descriptions of other administrative and other non-investment management services provided by the Adviser for the Fund, including the Adviser’s activities in managing relationships with the Fund’s custodian, Sub-Advisers, transfer agent and other service providers; |
| | |
| n | Materials prepared by the Adviser comparing the investment performance of the portion of the Fund’s assets managed by each Sub-Adviser with that of an appropriate benchmark year-to-date and for one-, three- and five-year periods (or since the Sub-Adviser began to manage a portion of the Fund’s assets if less) ended March 31, 2014; and |
| | |
| n | Other information provided by the Adviser and each Sub-Adviser in response to comprehensive questionnaires prepared by independent legal counsel on behalf of the Independent Trustees. |
In determining whether to approve the continuation of the Advisory Agreements, the Board considered, among other things, the following: (1) the nature, quality, extent and cost of the investment management, administrative and other non-investment services provided by the Sub-Advisers; (2) the capabilities and background of the Adviser’s and Sub-Advisers’ investment personnel, and the overall capabilities, experience, resources and strengths of each Adviser and Sub-Adviser in managing investment companies and other accounts utilizing similar investment strategies; (3) the nature, quality, extent and cost of the investment management, administrative and other non-investment services provided by the Adviser, including its services in overseeing the services provided by each Sub-Adviser; (4) the nature, quality and extent of the services performed by the Adviser in interfacing with, and monitoring the services performed by, third parties, such as the Fund’s custodian, transfer agent, sub-accounting agent and independent auditors, and the Adviser’s commitment and efforts to review the quality and pricing of third party service providers to the Fund with a view to reducing non-management expenses of the Fund; (5) the terms of the Advisory Agreement and the services performed thereunder; (6) the willingness of the Adviser to reduce the overall expenses of the Fund from time to time, if necessary or appropriate, by means of waiving a portion of its fees or paying expenses of the Fund; (7) the quality of the services, procedures and processes used to determine the value of the Fund’s assets and the actions taken to monitor and test the effectiveness of such services, procedures and processes; (8) the ongoing efforts of, and resources devoted by, the Adviser with respect to the development and implementation of a comprehensive compliance program; (9) the responsiveness of the Adviser to inquiries from, and examinations by, regulatory authorities, including the Securities and Exchange Commission; (10) the resources committed by the Adviser in recent periods to information technology; (11) the ability of the Adviser and each Sub-Adviser to attract and retain quality professional personnel to perform a variety of investment advisory and administrative services for the Fund; (12) the Adviser’s assessment of the financial resources of each Sub-Adviser; and (13) the affirmative recommendation from the Adviser to approve the continuation of each sub-advisory agreement.
The Board considered the fact that the Adviser is managing other investment products, including exchange-traded funds, hedge funds, separate accounts and UCITs, one or more of which may invest in the same financial markets and may be managed by the same investment professionals according to a similar investment objective and/or strategy as the Fund. The Board concluded that the management of these products contributes to the Adviser’s financial stability and is helpful to the Adviser in attracting and retaining quality portfolio management personnel for the Fund. In addition, the Board concluded that the Adviser has established appropriate procedures to monitor conflicts of interest involving the management of the Fund and the other products and for resolving any such conflicts of interest in a fair and equitable manner.
VAN ECK VIP MULTI-MANAGER ALTERNATIVES FUND
APPROVAL OF ADVISORY AND SUB-ADVISORY AGREEMENTS
(continued) (unaudited)
The performance data and the advisory fee and expense ratio data described below for the Fund is based on data for a representative class of shares of the Fund. The performance data is for periods on an annualized basis ended March 31, 2014, and the advisory fee and expense ratio data is as of the Fund’s fiscal year end of December 31, 2013.
Performance. The Board noted, based on a review of comparative annualized total returns, that the Fund had outperformed its Category and Peer Group medians over the one-year period and its Peer Group median over the ten-year period and had the same return as its Category median over the ten-year period, but underperformed its Category and Peer Group medians over the three- and five-year periods. The Board also noted that the Fund had outperformed its benchmark index over the three-, five- and ten-year periods, but had underperformed its benchmark index over the one-year period. The Board further noted that, at the recommendation of the Adviser, the Board had approved material changes to the Fund’s principal investment strategies in an effort to enhance the performance and long-term viability of the Fund, as well as reduce the total expense ratio of the Fund. The Board also noted that such changes were effective May 1, 2014 and concluded that additional time is needed to evaluate the effectiveness of the changes.
Fees and Expenses. The Board noted that the fees payable for advisory services were higher than the Fund’s Category and Peer Group and that the Fund’s total expense ratio, net of waivers or reimbursements, was higher than the median expense ratios for the Fund’s Category and Peer Group. The Board further noted the nature, quality, extent and cost of the investment management and other non-investment services provided by the Adviser to manage a multi-asset, multi-manager product of this type, including the Adviser’s services in overseeing the services provided by each Sub-Adviser. The Board also noted that the Adviser continues to waive fees and pay expenses of the Fund and has agreed to continue doing so through April 2015 to the extent necessary to prevent the expense ratio of the Fund from exceeding a specified maximum amount (which amount was lowered effective May 1, 2014). On the basis of the foregoing, and in light of the nature, extent and quality of the services provided by the Adviser, the Board concluded that the advisory and sub-advisory fees charged to the Fund are reasonable.
Profitability and Economies of Scale. The Board considered the profits, if any, realized by the Adviser from managing the Fund and other mutual funds in the Van Eck Complex and the methodology used to determine such profits, including the results of an analysis of the methodology performed recently by an independent consultant on behalf of the Board and its independent counsel. The Board noted that the levels of profitability reported on a fund-by-fund basis varied widely depending on such factors as the size, type of fund and operating history. The Board further noted that, in evaluating the reasonableness of the Adviser’s profits from managing any particular Fund, it would be appropriate to consider the size of the Adviser relative to other firms in the investment management industry and the impact on the Adviser’s profits of the volatility of the markets in which the Funds invest and the volatility of cash flows into and out of the Funds through various market cycles. Based on its review of the foregoing information, and in light of the nature, extent and quality of the services provided by the Adviser, the Board concluded that the profits realized by the Adviser, if any, are not excessive. In view of the fact that none of the Sub-Advisers is affiliated with the Adviser, the Board concluded that the profitability of the Sub-Advisers was not a relevant factor in its renewal deliberations regarding the Sub-Advisers. The Board also considered the extent to which the Adviser may realize economies of scale as the Fund grows and whether the Fund’s fee schedule, which includes breakpoints, reflects these economies of scale for the benefit of shareholders. The Board concluded that, with respect to the Fund, the economies of scale being realized, if any, are currently being shared by the Adviser and the Fund, and that adding or modifying existing breakpoints would not be warranted at this time for the Fund.
Sub-Advisers. The Board concluded that each Sub-Adviser continues to be qualified to manage the Fund’s assets in accordance with the Fund’s investment objective and policies. The Board also concluded that each Sub-Adviser’s investment strategies are appropriate for pursuing the Fund’s investment objective and are complementary to the investment strategies employed by the Fund’s other Sub-Advisers.
Conclusion. In determining the material factors to be considered in evaluating each Advisory Agreement and the weight to be given to such factors, the members of the Board relied upon the advice of independent legal counsel and their own business judgment. The Board did not consider any single factor as controlling in determining whether to approve the continuation of an Advisory Agreement and each member of the Board may have placed varying emphasis on particular factors considered in reaching a conclusion. Moreover, this summary description does not necessarily identify all of the factors considered or conclusions reached by the Board. Based on its consideration of the foregoing factors and conclusions, and such other factors and conclusions as it deemed relevant, the Board (comprised exclusively of Independent Trustees) concluded that the continuation of each Advisory Agreement is in the interests of shareholders and, accordingly, the Board approved the continuation of each Advisory Agreement for an additional one-year period.
Approval of New Sub-Advisory Agreement
The Investment Company Act of 1940, as amended (the “1940 Act”), provides, in substance, that an investment advisory agreement between a fund and its investment adviser may be entered into only if it is approved, and may continue in effect from year to year after an initial two-year period only if its continuance is approved, at least annually by the fund’s board of trustees, including by a vote of a majority of the trustees who are not “interested persons” of the fund as defined in the 1940 Act (the “Independent Trustees”), cast in person at a meeting called for the purpose of considering such approval.
At an in-person meeting held on June 24-25, 2014 (the “Meeting”), the Board of Trustees of each Fund (the “Board”), which is comprised exclusively of Independent Trustees, considered authorizing Van Eck Associates Corporation (together with its affiliated companies, the “Adviser”) to enter into a new sub-advisory agreement (the “Sub-Advisory Agreement”) with respect to the Fund, for an initial two-year term with Hunting Hill Global Capital, LLC, to serve as a sub-adviser for the Fund (the “New Sub-Adviser”).
In considering the approval of the Sub-Advisory Agreement, the Board reviewed and considered information that had been provided throughout the year by the Adviser at regular and special meetings of the Board and its committees, including information furnished by the Adviser and the New Sub-Adviser for the Meeting. This information included, among other things, information about the Adviser’s short-term and long-term business plans with respect to the Fund; a description of the terms of the Sub-Advisory Agreement, including the services to be provided and fees to be paid thereunder; and information regarding the New Sub-Adviser’s organization, personnel, investment processes and strategies, key compliance procedures and performance record in managing other accounts utilizing investment processes and strategies that are the same or similar to those to be utilized by the New Sub-Adviser in managing assets of the Fund.
In considering whether to approve the Sub-Advisory Agreement, the Board evaluated the following factors: (1) the nature, quality, extent and cost of the investment management, administrative and other non-investment services to be provided by the New Sub-Adviser; (2) the capabilities and background of the New Sub-Adviser’s investment personnel, and the overall capabilities, experience, resources and strengths of the New Sub-Adviser in managing investment companies and other accounts utilizing similar investment strategies; (3) the terms of the Sub-Advisory Agreement and the reasonableness of the fees paid by the Fund for the services described therein; (4) the willingness and ability of the New Sub-Adviser to implement its investment strategy for the Fund with a small amount of assets at the inception of the sub-advisory relationship; (5) the scalability of the New Sub-Adviser’s processes and procedures over time; and (6) the Fund’s structure and the manner in which the New Sub-Adviser’s investment strategy will assist the Fund in pursuing its investment objective. The Board also met with representatives from the New Sub-Adviser.
In considering the proposal to approve the Sub-Advisory Agreement, the Board noted that the New Sub-Adviser is experienced in deploying global event driven strategies. The Board also considered the importance to the Fund of having access to investment advisers with experience running certain types of investment strategies and the relatively small number of investment advisers available to the Fund with experience in deploying such strategies, including global event driven strategies.
The Board concluded that the New Sub-Adviser is qualified to manage the Fund’s assets in accordance with the Fund’s investment objective and policies. The Board also concluded that the New Sub-Adviser’s investment strategies are appropriate for pursuing the Fund’s investment objective and are complementary to the investment strategies employed by the Fund’s other sub-advisers. The Board further concluded that the fees payable to the New Sub-Adviser for sub-advisory services are reasonable.
In view of the fact that the New Sub-Adviser is not affiliated with the Adviser, the Board concluded that the profitability of the New Sub-Adviser was not a relevant factor in its consideration of the Sub-Advisory Agreement.
In determining the material factors to be considered in evaluating the Sub-Advisory Agreement and the weight to be given to such factors, the members of the Board relied upon the advice of independent legal counsel and their own business judgment. The Board did not consider any single factor as controlling in determining whether to approve the Sub-Advisory Agreement and each member of the Board may have placed varying emphasis on particular factors considered in reaching a conclusion. Moreover, this summary description does not necessarily identify all of the factors considered or conclusions reached by the Board. Based on its consideration of the foregoing factors and conclusions, and such other factors and conclusions as it deemed relevant, the Board (comprised exclusively of Independent Trustees) concluded that entering into the Sub-Advisory Agreement is in the interests of shareholders, and accordingly, the Board approved entering into the Sub-Advisory Agreement.
This report must be preceded or accompanied by a Van Eck VIP (the “Trust”) Prospectus, which includes more complete information. An investor should consider the investment objective, risks, and charges and expenses of the Fund carefully before investing. The prospectus contains this and other information about the investment company. Please read the prospectus carefully before investing.
Additional information about the Trust’s Board of Trustees/Officers and a description of the policies and procedures the Trust uses to determine how to vote proxies relating to portfolio securities are provided in the Statement of Additional Information. The Statement of Information and information regarding how the Trust voted proxies relating to portfolio securities during the most recent twelve month period ending June 30 is available, without charge, by calling 800.826.2333, or by visiting vaneck.com, or on the Securities and Exchange Commission’s website at http://www.sec.gov.
The Trust files its complete schedule of portfolio holdings with the Securities and Exchange Commission for the first and third quarters of each fiscal year on Form N-Q. The Trust’s Form N-Qs are available on the Commission’s website at http://www.sec.gov and may be reviewed and copied at the Commission’s Public Reference Room in Washington, D.C. Information on the operation of the Public Reference Room may be obtained by calling 202.942.8090. The Fund’s complete schedule of portfolio holdings is also available by calling 800.826.2333 or by visiting vaneck.com.

| Investment Adviser: | Van Eck Associates Corporation |
| Distributor: | Van Eck Securities Corporation |
| | 335 Madison Avenue, New York, NY 10017 |
| | vaneck.com |
| Account Assistance: | 800.544.4653 |
Item 2. CODE OF ETHICS.

  Not applicable.

Item 3. AUDIT COMMITTEE FINANCIAL EXPERT.

  Not applicable.

Item 4. PRINCIPAL ACCOUNTANT FEES AND SERVICES.

  Not applicable.


Item 5. AUDIT COMMITTEE OF LISTED REGISTRANTS.

     Not applicable.

Item 6. SCHEDULE OF INVESTMENTS.

     Information included in Item 1.

Item 7. DISCLOSURE OF PROXY VOTING POLICIES AND PROCEDURES FOR CLOSED-END
        MANAGEMENT INVESTMENT COMPANIES.

     Not applicable.

Item 8. PORTFOLIO MANAGER OF CLOSED-END MANAGEMENT INVESTMENT COMPANIES.

     Not applicable.

Item 9. PURCHASE OF EQUITY SECURITIES BY CLOSED-END MANAGEMENT INVESTMENT
        COMPANY AND AFFILIATED PURCHASERS.

     Not applicable.

Item 10. SUBMISSION OF MATTERS TO A VOTE OF SECURITY HOLDERS.

     Not applicable.

Item 11. CONTROLS AND PROCEDURES.

(a)  The registrant's principal executive and principal financial officers, or
     persons performing similar functions, have concluded that the registrant's
     disclosure controls and procedures (as defined in Rule 30a-3(c) under the
     Investment Company Act of 1940, as amended (the "1940 Act") (17 CFR
     270.30a-3(c)) are effective, as of a date within 90 days of the filing
     date of the report that includes the disclosure required by this paragraph,
     based on their evaluation of these controls and procedures required
     by Rule 30a-3(b) under the 1940 Act (17 CFR 270.30a-3(b)) and Rules
     13a-15(b) or 15d-15(b) under the Securities Exchange Act of 1934,
     as amended (17 CFR 240.13a-15(b) or 240.15d-15(b)).

(b)  There were no changes in the registrant's internal control over financial
     reporting (as defined in Rule 30a-3(d) under the 1940 Act (17 CFR
     270.30a-3(d)) that occurred during the second fiscal quarter of the period
     covered by this report that has materially affected, or is reasonably
     likely to materially affect, the registrant's internal control over
     financial reporting.


Item 12. EXHIBITS.

(a)(1) Not applicable.

(a)(2) A separate certification for each principal executive officer and
       principal financial officer of the registrant as required by Rule 30a-2
       under the Act (17 CFR 270.30a-2(a)) is attached as Exhibit 99.CERT.

(b)  Certification pursuant to Section 906 of the Sarbanes-Oxley Act of 2002 is
     furnished as Exhibit 99.906CERT.
                                   SIGNATURES


Pursuant to the requirements of the Securities Exchange Act of 1934 and the
Investment Company Act of 1940, the registrant has duly caused this report to be
signed on its behalf by the undersigned, thereunto duly authorized.

(Registrant) VAN ECK VIP TRUST

By (Signature and Title) /s/ John J. Crimmins, Treasurer & Chief Financial Officer
                         ---------------------------------------------------------
Date September 5, 2014
     --------------------

Pursuant to the requirements of the Securities Exchange Act of 1934 and the
Investment Company Act of 1940, this report has been signed below by the
following persons on behalf of the registrant and in the capacities and on the
dates indicated.

By (Signature and Title) /s/ Jan F. van Eck, Chief Executive Officer
                        --------------------------------------------
Date September 5, 2014
     --------------------

By (Signature and Title)  /s/ John J. Crimmins, Treasurer & Chief Financial Officer
                        -----------------------------------------------------------

Date September 5, 2014
     --------------------