Item 1. Report to Shareholders
| | | | | SEMI-ANNUAL REPORT
JUNE 30, 2013
(unaudited) |
| | |  |
| | | | | |
| | | | | |
| | | | | |
| | | Van Eck VIP Trust Van Eck VIP Emerging Markets Fund |
| | | | | |
| | | | | |
| | | | | |
| | | | | |
| | | | | |
| | | | | |
| | | | | |
| | | | | |
| | | | | |
| | | | | |
| | | | | |
| | | | | |
| | | |  |
| | | | | |
Van Eck VIP Emerging Markets Fund
The information contained in these shareholder letters represent the personal opinions of the investment team members and may differ from those of other portfolio managers or of the firm as a whole. This information is not intended to be a forecast of future events, a guarantee of future results or investment advice. Also, unless otherwise specifically noted, any discussion of the Fund’s holdings and the Fund’s performance, and the views of the investment team members are as of June 30, 2013 and are subject to change.
VAN ECK VIP EMERGING MARKETS FUND
Dear Shareholder:
The Initial Class shares of the Van Eck VIP Emerging Markets Fund (the “Fund”) advanced 0.89% for the six months ended June 30, 2013. The Fund substantially outperformed its benchmark index, the MSCI Emerging Markets (MSCI EM) Index1, which returned -9.40%. The MSCI EM Index is dominated by large-cap emerging market stocks. The Fund also notably outpaced the MSCI EM Small Cap Index2, returned -3.46%, for the same period.
The Fund outperformed the MSCI EM Index primarily because of effective stock selection virtually across the board but most especially in China/Hong Kong, South Korea and Russia, as the Fund’s core principles of bottom-up stock selection with a focus on structural “growth at a reasonable price” (GARP) were rewarded during the semi-annual period. China has been particularly fruitful because the current skepticism about the country’s economic prospects has meant that even the best structural growth companies have been ignored. This has meant that the Fund has been able to buy great businesses at very attractive valuations and reap the benefits of improving reported earnings and outlook over time.
Through our “structural growth at a reasonable price” investment strategy, we build the portfolio from the bottom up, on a stock-by-stock basis. Naturally, our investment process favors consumer sectors where we find more structural growth from emerging market characteristics like growing middle classes and increasing urbanization. At a country level, our investment process favors countries with higher GDP growth. At a sector level, the Fund is currently overweight consumer discretionary and healthcare. At a country level, Fund is currently overweight China, India and Frontier Markets in the Middle East North Africa region.
Overview
| ■ | Investors’ favorable view toward emerging market equities, which provided investors with solid annual returns for the decade ending December 2012, notably cooled during the first half of 2013, as two positive anchors were challenged-the “tapering” of the Federal Reserve’s accommodative monetary policy and the lower trajectory of China’s economic growth. |
| | |
| ■ | While many long-run secular themes in emerging markets remained a robust-rising share of global GDP, demographics, healthy balance sheets, growing middle class and more, but several factors impacted the investment outlook for the asset class during the semi-annual period. |
| | |
| ■ | First, the possible end of the long bond bull market in the U.S. had significant ramifications in emerging markets. Lower rates in many countries are fundamentally justified, but the reflux of foreign funds from countries, such as Indonesia (see chart), Brazil and Turkey in late spring caused a significant rise in yields and foreign exchange weakness. Higher cost of debt can eat into many companies’ margins. |
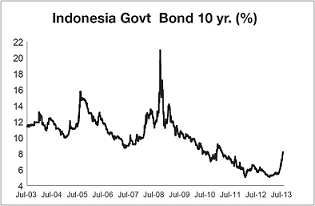
Source: Bloomberg. Past performance is no guarantee of future results; current performance may be lower or higher than the performance data quoted.
| ■ | Second, the newsreels of political unrest in various countries provided a vivid backdrop for fashionable negativity. |
| | |
| ■ | Finally, the performance of corporations in the emerging markets was far from stellar, with slow earnings per share growth materializing, disappointing more upbeat expectations. |
VAN ECK VIP EMERGING MARKETS FUND
Fund Review
Individual contributors to the Fund’s performance were well diversified among sectors, but overall, stock selection was strongest in materials, consumer staples and financials.
Among the strongest individual contributors to the Fund’s results was Mexican pawn shop operator First Cash Financial Services. We initiated the investment in January 2010 on the belief that then-current expectations for the company’s growth were too conservative and that increasingly apparent growth would be incrementally rewarded by a higher market rating. We exited the position toward the end of this semi-annual period with the stock having achieved an annualized return of more than 30%.
Another significant contributor to the Fund was Central American airline Copa Holdings (1.1% of Fund net assets†). Copa Holdings’ main operations are based in Panama, and the company has been able to add a significant amount of capacity over the past five years. This holding is a good example of GARP principles at work, as the company was able to grow earnings above the pace of its competitors while trading at a valuation discount to comparable companies. Copa Holdings has delivered almost a 50% annualized return since the Fund initially invested in it in 2009.
We feel that structural growth is one of the best ways to achieve long-term capital appreciation and gives investors the opportunity to bypass some of the volatility found in more cyclical industries. Simply put, structural growth is the ability of a company to sustainably grow revenues, earnings or cash flows at multiples of the macroeconomic growth rates seen in the markets in which they operate. For instance, one structural growth company the Fund benefited from holding is Chinese Internet company Tencent Holdings (1.6% of Fund net assets†). With leading positions in China’s rapidly growing social network and online gaming markets, Tencent Holdings has delivered a compound annual growth rate in net income in excess of 50% over the past five years, far outpacing the 8.8% average annual GDP growth rate in China over the same period.
Of course, there were some disappointments, too. In February 2013, the Fund took a position in Wockhardt (0.5% of Fund net assets†), a pharmaceutical company in India. Unfortunately, the company hit a roadblock when one of its facilities was effectively banned from exporting to the U.S. The direct impact from this action was likely incorporated into its share price, which was more than halved, but it is apparent to us the stock is likely to suffer from a de-rating rather than the re-rating it enjoyed when we initiated the position. We substantially cut the fund’s position in Wockhardt by the end of June.
Another poor performer during the semi-annual period was Volga Gas (0.5% of Fund net assets†), a deep value, smaller-cap independent gas exploration and production company based in the Volga region of Russia. We maintained the Fund’s position in Volga Gas, as we believe the key catalyst for its stock may come in the third quarter of 2013 with the completion of its gas plant upgrade, which is anticipated to substantially increase production and, consequently, free cash flow as well.
As important for us as structural growth is the “at a reasonable price” part of our investment approach. During the semi-annual period, we significantly trimmed the Fund’s weighting in consumer staples, because we believe valuations in some of the more widely held companies have become excessive and we believe therefore unsustainable. For example, the relative valuation of consumer staples in China relative to consumer discretionary has not been as high as that seen during the first half of 2013 in the last decade. While the earnings stream of these companies tends to be relatively reliable, we believe valuations in the sector make the stocks vulnerable.
Outlook
After declining during the first half of 2013, perhaps the primary attribute emerging market equities can offer now is valuation. In some cases, valuations are as cheap or even cheaper than in 2009. We constantly hear pessimism being reflected from sell-side meetings with investors. This gives us a great deal of comfort that the new reality of higher U.S. interest rates and a tempering of the pace of growth in China have been largely priced in. Regarding China, we expect that by most measures, year on year growth rates will continue to decelerate. However, on the positive side, we expect significant and positive structural reforms to become apparent as we move through the second half of 2013. Areas where we expect gradual change would include interest rate liberalization (see chart below), currency internationalization, household registration, local government financing, property taxation and agricultural land reform. These should not be underestimated.
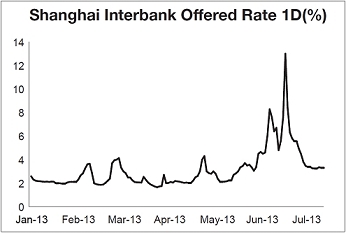
Source: Bloomberg. Past performance is no guarantee of future results; current performance may be lower or higher than the performance data quoted.
In our view, while global economic growth may well remain below trend, at the margin, it will improve. Economic surprises in emerging markets are becoming less negative. Meanwhile, for all the talk of tapering, global monetary policy is likely, we believe, to remain accommodative for some time to come.
The strains apparent during the first half of 2013 present opportunity, in our view, going forward. The asset class will grow at the expense of developed markets over the longer term—of that we feel confident. Fundamentally, our strategy of bottom-up stock picking focused on structural growth at a reasonable price has let us pick what we consider to be the best parts of the emerging markets while avoiding the large legacy cyclical parastatals that have hurt many other emerging market portfolios. (A parastatal is a company owned or controlled wholly or partly by the government.)
More broadly, we anticipate the second half of 2013 should continue to support our GARP and structural growth-seeking investment approach and should, above all else, prove that stock selection remains paramount. The Fund has the ability to invest in large-cap and mega-cap stocks where there is a well-priced story of structural growth, but it also has the flexibility to be able to avoid many of the unattractive larger-cap names. Regardless of broader market conditions, we intend to continue to be relentless in our pursuit of attractive investments in emerging market equities.
The Fund is subject to the risks associated with its investments in emerging market securities, which tend to be more volatile and less liquid than securities traded in developed countries. The Fund’s investments in foreign securities involve risks related to adverse political and economic developments unique to a country or a region, currency fluctuations or controls, and the possibility of arbitrary action by foreign governments, including the takeover of property without adequate compensation or imposition of prohibitive taxation. The Fund is subject to risks associated with investments in debt securities, derivatives, commodity-linked instruments, illiquid securities, asset-backed securities, CMOs and small or mid-cap companies. The Fund is also subject to inflation risk, short-sales risk, market risk, nondiversification risk and leverage risk. Please see the prospectus for information on these and other risk considerations.
We thoroughly appreciate your participation in the Van Eck VIP Emerging Markets Fund, and we look forward to helping you meet your investment goals in the future.
Investment Team Members:
| David A. Semple | Edward M. Kuczma | Angus Shillington |
| Portfolio Manager | Analyst | Analyst |
| | | |
| July 17, 2013 | | |
VAN ECK VIP EMERGING MARKETS FUND
| † | All Fund assets referenced are Total Net Assets as of June 30, 2013. |
| | |
| | All indices listed are unmanaged indices and include the reinvestment of all dividends, but do not reflect the payment of transaction costs, advisory fees or expenses that are associated with an investment in the Fund. An index’s performance is not illustrative of the Fund’s performance. Indices are not securities in which investments can be made. |
| | |
| 1 | MSCI Emerging Markets Index (MSCI EM), a free float-adjusted market capitalization index that is designed to measure equity market performance of emerging markets, is calculated with dividends reinvested. The Index covers 2,700 securities of the publicly traded equities in each industry for 21 emerging markets that are currently classified as emerging markets countries. The Index consists of the following 21 emerging markets country indices: Brazil, Chile, China, Colombia, Czech Republic, Egypt, Hungary, India, Indonesia, Korea, Malaysia, Mexico, Morocco, Peru, Philippines, Poland, Russia, South Africa, Taiwan, Thailand, and Turkey. |
| | |
| 2 | MSCI EM Small Cap Index is a subset of the MSCI EM Index, which provides an exhaustive representation of the small cap size segment. |
TOP TEN EQUITY HOLDINGS*
June 30, 2013* (unaudited)
Samsung Electronics Co. Ltd.
(South Korea, 6.5%)
Samsung manufactures a wide range of consumer and industrial electronic equipment and products such as semiconductors, monitors, televisions and home appliances. The company also produces Internet access network systems and telecommunications equipment including mobile phones.
Genting Hong Kong Ltd.
(Hong Kong, 2.7%)
Genting Hong Kong operates cruise ships and cruise related activities under the companies’ brands. The company also operates in the land-based integrated leisure and entertainment complex sector.
Magnit OJSC
(Russia, 2.2%)
Magnit retails food and operates a chain of discount supermarkets.
Apollo Hospitals Enterprise Ltd.
(India, 2.1%)
Apollo Hospitals owns and operates hospitals in India. The company also runs a 24-hour pharmacy network via over 120 outlets across India. Apollo Hospitals also runs clinics and offer managed care and family health plans and has a variety of locations in Chennai, Hyderabad, Delhi, Dubai, Vizag, Bilaspur and Chengannur.
Ezion Holdings Ltd.
(Singapore, 2.0%)
Ezion Holdings offers provision of offshore marine logistics and support services, and provides development, ownership, and chartering of strategic offshore assets.
Kasikornbank PCL
(Thailand, 1.7%)
Kasikornbank provides commercial banking services including personal and commercial banking, international trade, as well as investment banking services, to its customers throughout Thailand.
Sberbank RF
(Russia, 1.6%)
Sberbank attracts deposits and offers commercial banking services. The bank offers time deposits, corporate banking, securities brokerage,credit, foreign exchange services and sponsors credit cards.
Tencent Holdings Ltd.
(China, 1.6%)
Tencent Holdings provides Internet, mobile, and telecommunication value-added services in China. The company has an instant messaging community in China. Tencent also provides online advertising services.
Franshion Properties China Ltd.
(China, 1.6%)
Franshion Properties invests in and develops real estate projects in the Peoples Republic of China.
DEN Networks Ltd.
(India, 1.5%)
DEN Networks Ltd. is a cable television company that distributes analog and digital cable television services across India.
| * | Percentage of net assets. Portfolio is subject to change. |
| | Company descriptions courtesy of Bloomberg.com |
VAN ECK VIP EMERGING MARKETS FUND
EXPLANATION OF EXPENSES
(unaudited)
As a shareholder of the Fund, you incur two types of costs: (1) transaction costs, including program fees on purchase payments; and (2) ongoing costs, including management fees and other Fund expenses. This disclosure is intended to help you understand the ongoing costs (in dollars) of investing in the Fund and to compare these costs with the ongoing costs of investing in other mutual funds.
The disclosure is based on an investment of $1,000 invested at the beginning of the period and held for the entire period, January 1, 2013 to June 30, 2013.
Actual Expenses
The first line in the table below provides information about account values and actual expenses. You may use the information in this line, together with the amount you invested, to estimate the expenses that you paid over the period. Simply divide your account value by $1,000 (for example, an $8,600 account value divided by $1,000 = 8.6), then multiply the result by the number in the first line under the heading entitled “Expenses Paid During the Period.”
Hypothetical Example for Comparison Purposes
The second line in the table below provides information about hypothetical account values and hypothetical expenses based on the Fund’s actual expense ratio and an assumed rate of return of 5% per year before expenses, which is not the Fund’s actual return. The hypothetical account values and expenses may not be used to estimate the actual ending account balance or expenses you paid for the period. You may use this information to compare the ongoing costs of investing in the Fund and other funds. To do so, compare this 5% hypothetical example with the 5% hypothetical examples that appear in the shareholder reports of other funds.
Please note that the expenses shown in the table are meant to highlight your ongoing costs only and do not reflect any transactional costs, such as fees on purchase payments. Therefore, the second line of the table is useful in comparing ongoing costs only, and will not help you determine the relative costs of owning different funds. In addition, if these transactional costs were included, your costs would have been higher.
Van Eck VIP Emerging Markets Fund
| | | | | Beginning
Account Value
January 1, 2013 | | Ending
Account Value
June 30, 2013 | | Expenses Paid
During the Period*
January 1, 2013 –
June 30, 2013 |
| Initial Class | | Actual | | $1,000.00 | | $1,008.90 | | $6.02 |
| | | Hypothetical** | | $1,000.00 | | $1,018.80 | | $6.05 |
| * | Expenses are equal to the Fund’s annualized expense ratio (for the six months ended June 30, 2013), of 1.21% multiplied by the average account value over the period, multiplied by the number of days in the most recent fiscal half year divided by the number of days in the fiscal year (to reflect the one-half year period). |
| | |
| ** | Assumes annual return of 5% before expenses |
SCHEDULE OF INVESTMENTS
June 30, 2013 (unaudited)
Number of
Shares | | | | | Value | |
| COMMON STOCKS: 82.3% | | | | |
| | | | | |
| Brazil: 6.3% | | | | |
| | 190,000 | | BR Malls Participacoes S.A. | | $ | 1,701,302 | |
| | 228,000 | | BR Properties S.A. | | | 1,941,426 | |
| | 219,000 | | Brazil Hospitality Group S.A. * | | | 1,570,350 | |
| | 88,000 | | Cosan S.A. Industria e Comercio | | | 1,706,088 | |
| | 272,000 | | Estacio Participacoes S.A. | | | 1,950,389 | |
| | 84,000 | | Localiza Rent a Car S.A. | | | 1,189,594 | |
| | | | | | | 10,059,149 | |
| | | | | |
| China / Hong Kong: 21.5% | | | | |
| | 2,309,000 | | Baoxin Auto Group Ltd. # | | | 1,463,218 | |
| | 2,189,608 | | Beijing Capital International Airport Co. Ltd. # | | | 1,425,664 | |
| | 2,620,000 | | Boer Power Holdings Ltd. # | | | 1,692,508 | |
| | 1,119,400 | | Brilliance China Automotive Holdings Ltd. * # | | | 1,247,016 | |
| | 2,730,000 | | China Hongqiao Group Ltd. # | | | 1,375,325 | |
| | 64,900 | | China Medical System Holdings Ltd. # | | | 58,107 | |
| | 1,995,000 | | China Singyes Solar Technologies Holdings Ltd. # | | | 2,081,008 | |
| | 640,000 | | CIMC Enric Holdings Ltd. # | | | 988,832 | |
| | 7,400,000 | | Franshion Properties China Ltd. # | | | 2,470,654 | |
| | 491,000 | | Galaxy Entertainment Group Ltd. * # | | | 2,375,585 | |
| | 9,547,000 | | Genting Hong Kong Ltd. (USD) * # | | | 4,236,949 | |
| | 444,000 | | Great Wall Motor Co. Ltd. # | | | 1,891,660 | |
| | 1,504,000 | | Greatview Aseptic Packaging Co. Ltd. # | | | 928,459 | |
| | 760,000 | | Haier Electronics Group Co. Ltd. # | | | 1,209,243 | |
| | 907,000 | | Kunlun Energy Co. Ltd. # | | | 1,603,460 | |
| | 19,630,000 | | REXLot Holdings Ltd. # | | | 1,287,318 | |
| | 1,224,000 | | Sunac China Holdings Ltd. # | | | 804,306 | |
| | 557,000 | | Techtronic Industries Co. # | | | 1,328,031 | |
| | 63,600 | | Tencent Holdings Ltd. # | | | 2,483,402 | |
| | 8,113,000 | | Tiangong International Co. Ltd. # | | | 1,996,926 | |
| | 1,692,000 | | Xinyi Glass Holdings Ltd. # | | | 1,308,504 | |
| | | | | | | 34,256,175 | |
| | | | | |
| India: 13.1% | | | | |
| | 188,400 | | Apollo Hospitals Enterprise Ltd. # | | | 3,361,622 | |
| | 767,000 | | DEN Networks Ltd. * # | | | 2,435,495 | |
| | 259,700 | | Glenmark Pharmaceuticals Ltd. # | | | 2,376,335 | |
| | 88,300 | | Jammu & Kashmir Bank Ltd. # | | | 1,831,993 | |
| | 83,000 | | Larsen & Toubro Ltd. # | | | 1,958,573 | |
| | 821,000 | | Mundra Port & Special Economic Zone Ltd. # | | | 2,096,291 | |
| | 116,400 | | Persistent Systems Ltd. # | | | 977,361 | |
| | 287,800 | | Phoenix Mills Ltd. | | | 1,210,770 | |
| | 180,000 | | Shriram Transport Finance Co. Ltd. # | | | 2,160,613 | |
| | 49,690 | | Wockhardt Ltd. * | | | 835,846 | |
| | 198,000 | | Yes Bank Ltd. # | | | 1,589,207 | |
| | | | | | | 20,834,106 | |
| | | | | |
| Indonesia: 1.3% | | | | |
| | 1,780,000 | | Bank Rakyat Indonesia Tbk PT # | | | 1,381,991 | |
| | 5,350,000 | | Express Transindo Utama Tbk PT * # | | | 725,723 | |
| | | | | | | 2,107,714 | |
| | | | | |
| Israel: 0.0% | | | | |
| | 182,500 | | Queenco Leisure International Ltd. (GDR) * # § Reg S | | | 70,577 | |
Number of
Shares | | | | | Value | |
| Malaysia: 0.8% | | | | |
| | 1,290,000 | | AirAsia Bhd # | | $ | 1,297,993 | |
| | | | | |
| Mexico: 0.9% | | | | |
| | 856,000 | | Credito Real S.A.B. de C.V. * | | | 1,420,341 | |
| | | | | |
| Nigeria: 2.7% | | | | |
| | 10,300,000 | | First Bank Nigeria Holdings Plc # | | | 1,130,238 | |
| | 10,350,000 | | Guaranty Trust Bank Plc # | | | 1,543,464 | |
| | 267,672 | | Nestle Nigeria Plc | | | 1,597,468 | |
| | | | | | | 4,271,170 | |
| | | | | |
| Panama: 1.1% | | | | |
| | 12,800 | | Copa Holdings S.A. (Class A) (USD) | | | 1,678,336 | |
| | | | | |
| Philippines: 0.7% | | | | |
| | 315,000 | | Security Bank Corp. # | | | 1,101,482 | |
| | | | | |
| Portugal: 1.1% | | | | |
| | 83,000 | | Jeronimo Martins, SGPS S.A. # | | | 1,749,352 | |
| | | | | |
| Russia: 4.7% | | | | |
| | 35,300 | | Eurasia Drilling Co. Ltd. (GDR) Reg S | | | 1,312,842 | |
| | 15,500 | | Magnit OJSC # | | | 3,562,372 | |
| | 889,000 | | Sberbank RF (USD) # | | | 2,537,266 | |
| | | | | | | 7,412,480 | |
| | | | | |
| Singapore: 2.4% | | | | |
| | 1,874,000 | | Ezion Holdings Ltd. # | | | 3,124,852 | |
| | 495,000 | | OSIM International Ltd. # | | | 765,769 | |
| | | | | | | 3,890,621 | |
| | | | | |
| South Africa: 1.1% | | | | |
| | 80,000 | | Imperial Holdings Ltd. # | | | 1,698,250 | |
| | | | | |
| South Korea: 5.4% | | | | |
| | 80,200 | | Cheil Worldwide, Inc. * # | | | 1,721,631 | |
| | 82,900 | | GSretail Co. Ltd. # | | | 2,116,993 | |
| | 6,730 | | Hyundai Mobis Co. Ltd. # | | | 1,602,229 | |
| | 2,705 | | Samsung Electronics Co. Ltd. # | | | 3,161,668 | |
| | | | | | | 8,602,521 | |
| | | | | |
| Switzerland: 1.0% | | | | |
| | 13,200 | | Dufry A.G. * # | | | 1,599,002 | |
| | | | | |
| Taiwan: 3.4% | | | | |
| | 610,000 | | Chailease Holding Co. Ltd. # | | | 1,427,723 | |
| | 274,000 | | Cleanaway Co. Ltd. # | | | 2,082,924 | |
| | 138,600 | | Wowprime Corp. # | | | 1,860,973 | |
| | | | | | | 5,371,620 | |
| | | | | |
| Thailand: 2.8% | | | | |
| | 628,000 | | CP All PCL # | | | 786,699 | |
| | 100,000 | | Kasikornbank PCL # | | | 610,527 | |
| | 338,000 | | Kasikornbank PCL (NVDR) (THB) # | | | 2,063,581 | |
| | 2,166,000 | | Thai Beverage PCL (SGD) # | | | 1,007,059 | |
| | | | | | | 4,467,866 | |
| | | | | |
| Turkey: 2.4% | | | | |
| | 490,000 | | Aksa Enerji Uretim A.S. * # | | | 860,391 | |
| | 170,000 | | Dogus Otomotiv Servis ve Ticaret A.S. # | | | 861,979 | |
| | 197,330 | | TAV Havalimanlari Holding A.S. # | | | 1,154,164 | |
| | 106,000 | | Turkiye Halk Bankasi A.S. # | | | 898,136 | |
| | | | | | | 3,774,670 | |
See Notes to Financial Statements
VAN ECK VIP EMERGING MARKETS FUND
SCHEDULE OF INVESTMENTS
(continued)
Number of
Shares | | | | | Value | |
| United Arab Emirates: 1.0% | | | | |
| | 89,000 | | Al Noor Hospitals Group Plc (GBP) * | | $ | 857,534 | |
| | 165,000 | | NMC Health Plc (GBP) | | | 677,583 | |
| | | | | | | 1,535,117 | |
| | | | | |
| United Kingdom: 6.1% | | | | |
| | 1,115,000 | | Afren Plc * # | | | 2,198,003 | |
| | 45,000 | | Bank of Georgia Holdings Plc # | | | 1,140,957 | |
| | 1,235,312 | | Hirco Plc * # | | | 486,550 | |
| | 129,000 | | International Personal Finance Plc # | | | 980,241 | |
| | 210,000 | | Ophir Energy Plc * # | | | 1,141,799 | |
| | 1,560,007 | | Raven Russia Ltd. # | | | 1,656,260 | |
| | 627,000 | | Volga Gas Plc * # | | | 813,966 | |
| | 125,000 | | Zhaikmunai LP (GDR) Reg S | | | 1,375,000 | |
| | | | | | | 9,792,776 | |
| | | | | |
| United States: 2.5% | | | | |
| | 36,200 | | Coach, Inc. | | | 2,066,658 | |
| | 796,900 | | Samsonite International S.A. (HKD) # | | | 1,916,016 | |
| | | | | | | 3,982,674 | |
| | | | | |
Total Common Stocks
(Cost: $118,310,955) | | | 130,973,992 | |
| | | | | |
| PREFERRED STOCKS: 5.7% | | | | |
| | | | | |
| Brazil: 0.0% | | | | |
| | 5,773 | | Banco ABC Brasil S.A. # | | | 34,953 | |
| | | | | |
| Russia: 1.2% | | | | |
| | 855 | | AK Transneft OAO # | | | 1,864,594 | |
| | | | | |
| South Korea: 4.5% | | | | |
| | 9,220 | | Samsung Electronics Co. Ltd. # | | | 7,110,262 | |
| | | | | |
Total Preferred Stocks
(Cost: $8,286,882) | | | 9,009,809 | |
Number of
Shares | | | | Value | |
| REAL ESTATE INVESTMENT TRUSTS: 1.4% | | | | |
| | | | | |
| Mexico: 0.7% | | | | |
| | 536,000 | | TF Administradora Industrial,
S. de R.L. de C.V. | | $ | 1,117,300 | |
| | | | | |
| Turkey: 0.7% | | | | |
| | 850,000 | | Emlak Konut Gayrimenkul
Yatirim Ortakligi A.S. # | | | 1,197,279 | |
| | | | | |
Total Real Estate Investment Trusts
(Cost: $2,669,658) | | | 2,314,579 | |
| | | | | |
| WARRANTS: 3.3% | | | | |
| | | | | |
| Luxembourg: 2.7% | | | | |
| | 73,900 | | Deutsche Bank AG, London Branch,
aXess Warrants (USD 0.00,
expiring 12/01/14) # * (a) | | | 2,344,965 | |
| | 195,000 | | Deutsche Bank AG, London Branch,
aXess Warrants (USD 0.00,
expiring 09/27/16) # * (b) | | | 1,934,297 | |
| | | | | | | 4,279,262 | |
| | | | | |
| Philippines: 0.6% | | | | |
| | 19,400,000 | | Megaworld Corp. (PHP 1.00,
expiring 12/14/14) * | | | 965,509 | |
| | | | | |
Total Warrants
(Cost: $4,091,925) | | | 5,244,771 | |
| | | | | |
MONEY MARKET FUND: 4.9%
(Cost: $7,806,143) | | | | |
| | | | | | | | |
| | 7,806,143 | | AIM Treasury Portfolio - Institutional Class | | | 7,806,143 | |
| | | | | |
Total Investments: 97.6%
(Cost: $141,165,563) | | | 155,349,294 | |
| Other assets less liabilities: 2.4% | | | 3,833,644 | |
| NET ASSETS: 100.0% | | $ | 159,182,938 | |
| GBP | British Pound |
| GDR | Global Depositary Receipt |
| HKD | Hong Kong Dollar |
| NVDR | Non-Voting Depositary Receipt |
| PHP | Philippine Peso |
| SGD | Singapore Dollar |
| THB | Thai Baht |
| USD | United States Dollar |
| (a) | Issue price $21.53. The security is linked to the performance of Herfy Food Services Co. |
| (b) | Issue price $8.53. The security is linked to the performance of The Saudi British Bank. |
| * | Non-income producing |
| # | Indicates a fair valued security which has not been valued utilizing an independent quote, but has been valued pursuant to guidelines |
| | established by the Board of Trustees. The aggregate value of fair valued securities is $122,368,815 which represents 76.9% of net assets. |
| § | Illiquid Security — the aggregate value of illiquid securities is $70,577 which represents 0.0% of net assets. |
| Reg S | Security was purchased pursuant to Regulation S under the Securities Act of 1933, which exempts from registration securities offered |
| | and sold outside of the United States. Such a security cannot be sold in the United States without either an effective registration |
| | statement filed pursuant to the Securities Act of 1933, or pursuant to an exemption from registration. |
See Notes to Financial Statements
Restricted securities held by the Fund as of June 30, 2013 are as follows:
| Security | | Acquisition
Date | | Number of
Shares | | Acquisition
Cost | | | Value | | | % of
Net Assets |
Queenco Leisure International Ltd.
(GDR) | | 07/03/2007 | | 182,500 | | | | $3,490,971 | | | | | $70,577 | | | | 0.0 | % | |
Summary of Investments
by Sector (unaudited) | | % of
Investments | | Value |
| Basic Materials | | | 2.2 | % | | $ | 3,372,251 | |
| Communications | | | 4.3 | | | | 6,640,528 | |
| Consumer Discretionary | | | 1.5 | | | | 2,344,965 | |
| Consumer, Cyclical | | | 18.5 | | | | 28,670,309 | |
| Consumer, Non-cyclical | | | 19.8 | | | | 30,693,250 | |
| Diversified | | | 1.1 | | | | 1,698,250 | |
| Energy | | | 7.3 | | | | 11,298,496 | |
| Financial | | | 24.0 | | | | 37,338,366 | |
| Industrial | | | 8.6 | | | | 13,377,054 | |
| Technology | | | 7.2 | | | | 11,249,291 | |
| Utilities | | | 0.5 | | | | 860,391 | |
| Money Market Fund | | | 5.0 | | | | 7,806,143 | |
| | | | 100.0 | % | | $ | 155,349,294 | |
The summary of inputs used to value the Fund’s investments as of June 30, 2013 is as follows:
| | | Level 1
Quoted
Prices | | Level 2
Significant
Observable
Inputs | | Level 3
Significant
Unobservable
Inputs | | Value |
| Common Stocks | | | | | | | | | | | | | | | | | | | | |
| Brazil | | | $ | 10,059,149 | | | | $ | — | | | | $ | — | | | | $ | 10,059,149 | |
| China / Hong Kong | | | | — | | | | | 34,256,175 | | | | | — | | | | | 34,256,175 | |
| India | | | | 2,046,616 | | | | | 18,787,490 | | | | | — | | | | | 20,834,106 | |
| Indonesia | | | | — | | | | | 2,107,714 | | | | | — | | | | | 2,107,714 | |
| Israel | | | | — | | | | | 70,577 | | | | | — | | | | | 70,577 | |
| Malaysia | | | | — | | | | | 1,297,993 | | | | | — | | | | | 1,297,993 | |
| Mexico | | | | 1,420,341 | | | | | — | | | | | — | | | | | 1,420,341 | |
| Nigeria | | | | 1,597,468 | | | | | 2,673,702 | | | | | — | | | | | 4,271,170 | |
| Panama | | | | 1,678,336 | | | | | — | | | | | — | | | | | 1,678,336 | |
| Philippines | | | | — | | | | | 1,101,482 | | | | | — | | | | | 1,101,482 | |
| Portugal | | | | — | | | | | 1,749,352 | | | | | — | | | | | 1,749,352 | |
| Russia | | | | 1,312,842 | | | | | 6,099,638 | | | | | — | | | | | 7,412,480 | |
| Singapore | | | | — | | | | | 3,890,621 | | | | | — | | | | | 3,890,621 | |
| South Africa | | | | — | | | | | 1,698,250 | | | | | — | | | | | 1,698,250 | |
| South Korea | | | | — | | | | | 8,602,521 | | | | | — | | | | | 8,602,521 | |
| Switzerland | | | | — | | | | | 1,599,002 | | | | | — | | | | | 1,599,002 | |
| Taiwan | | | | — | | | | | 5,371,620 | | | | | — | | | | | 5,371,620 | |
| Thailand | | | | — | | | | | 4,467,866 | | | | | — | | | | | 4,467,866 | |
| Turkey | | | | — | | | | | 3,774,670 | | | | | — | | | | | 3,774,670 | |
| United Arab Emirates | | | | 1,535,117 | | | | | — | | | | | — | | | | | 1,535,117 | |
| United Kingdom | | | | 1,375,000 | | | | | 8,417,776 | | | | | — | | | | | 9,792,776 | |
| United States | | | | 2,066,658 | | | | | 1,916,016 | | | | | — | | | | | 3,982,674 | |
| Preferred Stocks* | | | | — | | | | | 9,009,809 | | | | | — | | | | | 9,009,809 | |
| Real Estate Investment Trusts | | | | | | | | | | | | | | | | | | | | |
| Mexico | | | | 1,117,300 | | | | | — | | | | | — | | | | | 1,117,300 | |
| Turkey | | | | — | | | | | 1,197,279 | | | | | — | | | | | 1,197,279 | |
| Warrants | | | | | | | | | | | | | | | | | | | | |
| Luxembourg | | | | — | | | | | 4,279,262 | | | | | — | | | | | 4,279,262 | |
| Philippines | | | | 965,509 | | | | | — | | | | | — | | | | | 965,509 | |
| Money Market Fund | | | | 7,806,143 | | | | | — | | | | | — | | | | | 7,806,143 | |
| Total | | | $ | 32,980,479 | | | | $ | 122,368,815 | | | | $ | — | | | | $ | 155,349,294 | |
| * | See Schedule of Investments for security type and geographic sector breakouts. |
During the period ended June 30, 2013, transfers of securities from Level 1 to Level 2 were $3,703,198 and transfers from Level 2 to Level 1 were $1,244,002. These transfers resulted primarily from changes in certain foreign securities valuation methodologies between the last close of the securities’ primary market (Level 1) and valuation by a pricing service (Level 2), which takes into account market direction or events occurring before the Fund’s pricing time but after the last local close, as described in the Notes to Financial Statements.
See Notes to Financial Statements
VAN ECK VIP EMERGING MARKETS FUND
STATEMENT OF ASSETS AND LIABILITIES
June 30, 2013 (unaudited)
| Assets: | | | | |
| Investments, at value (Cost $141,165,563) | | $ | 155,349,294 | |
| Cash denominated in foreign currency, at value (Cost $4,005,250) | | | 3,969,502 | |
| Receivables: | | | | |
| Shares of beneficial interest sold | | | 52,790 | |
| Dividends and interest | | | 494,472 | |
| Prepaid expenses | | | 85 | |
| Total assets | | | 159,866,143 | |
| | | | | |
| Liabilities: | | | | |
| Payables: | | | | |
| Shares of beneficial interest redeemed | | | 176,051 | |
| Due to Adviser | | | 135,306 | |
| Deferred Trustee fees | | | 32,230 | |
| Accrued expenses | | | 339,618 | |
| Total liabilities | | | 683,205 | |
| NET ASSETS | | $ | 159,182,938 | |
| Shares of beneficial interest outstanding | | | 11,863,303 | |
| Net asset value, redemption and offering price per share | | | $13.42 | |
| | | | | |
| Net Assets consist of: | | | | |
| Aggregate paid in capital | | $ | 127,119,046 | |
| Net unrealized appreciation | | | 14,042,322 | |
| Accumulated net investment loss | | | (456,916 | ) |
| Accumulated net realized gain | | | 18,478,486 | |
| | | $ | 159,182,938 | |
See Notes to Financial Statements
STATEMENT OF OPERATIONS
For the Six Months Ended June 30, 2013 (unaudited)
| Income: | | | | | |
| Dividends (net of foreign taxes withheld of $127,635) | | | | $ | 1,792,577 | |
| | | | | | | |
| Expenses: | | | | | | |
| Management fees | | 872,325 | | | | |
| Transfer agent fees | | 16,363 | | | | |
| Custodian fees | | 107,839 | | | | |
| Professional fees | | 23,472 | | | | |
| Reports to shareholders | | 28,112 | | | | |
| Insurance | | 3,303 | | | | |
| Trustees’ fees and expenses | | 2,090 | | | | |
| Interest | | 45 | | | | |
| Other | | 750 | | | | |
| Total expenses | | 1,054,299 | | | | |
| Net investment income | | | | | 738,278 | |
| | | | | | | |
| Net realized gain (loss) on: | | | | | | |
| Investments (net of foreign taxes of $245,654) | | | | | 18,865,206 | |
| Foreign currency transactions and foreign denominated assets and liabilities | | | | | (140,526 | ) |
| Net realized gain | | | | | 18,724,680 | |
| | | | | | | |
| Net change in unrealized appreciation (depreciation) on: | | | | | | |
| Investments (net of foreign taxes of $102,147) | | | | | (17,019,319 | ) |
| Foreign currency transactions and foreign denominated assets and liabilities | | | | | (97,951 | ) |
| Net change in unrealized appreciation (depreciation) | | | | | (17,117,270 | ) |
| Net Increase in Net Assets Resulting from Operations | | | | $ | 2,345,688 | |
See Notes to Financial Statements
VAN ECK VIP EMERGING MARKETS FUND
STATEMENT OF CHANGES IN NET ASSETS
| | | Six Months
Ended
June 30, 2013 | | | Year Ended
December 31,
2012 | |
| | | (unaudited) | | | | | |
| Operations: | | | | | | | | |
| Net investment income | | $ | 738,278 | | | $ | 774,434 | |
| Net realized gain | | | 18,724,680 | | | | 1,326,748 | |
| Net change in unrealized appreciation (depreciation) | | | (17,117,270 | ) | | | 38,775,051 | |
| Net increase in net assets resulting from operations | | | 2,345,688 | | | | 40,876,233 | |
| | | | | | | | | |
| Dividends to shareholders from: | | | | | | | | |
| Net investment income | | | | | | | | |
| Initial Class Shares | | | (2,678,236 | ) | | | — | |
| | | | | | | | | |
| Share transactions*: | | | | | | | | |
| Proceeds from sale of shares | | | | | | | | |
| Initial Class Shares | | | 16,295,008 | | | | 34,259,256 | |
| Class R1 Shares | | | — | | | | 2,241,883 | |
| | | | 16,295,008 | | | | 36,501,139 | |
| Transfer of shares due to conversion (a) | | | | | | | | |
| Initial Class Shares | | | — | | | | 43,797,702 | |
| Class R1 Shares | | | — | | | | (43,797,702 | ) |
| | | | — | | | | — | |
| Reinvestment of dividends | | | | | | | | |
| Initial Class Shares | | | 2,678,236 | | | | — | |
| Cost of shares redeemed | | | | | | | | |
| Initial Class Shares | | | (30,914,070 | ) | | | (48,645,802 | ) |
| Class R1 Shares | | | — | | | | (1,992,136 | ) |
| Redemption fees | | | — | | | | 2,004 | |
| | | | (30,914,070 | ) | | | (50,635,934 | ) |
| Net decrease in net assets resulting from share transactions | | | (11,940,826 | ) | | | (14,134,795 | ) |
| Total increase (decrease) in net assets | | | (12,273,374 | ) | | | 26,741,438 | |
| | | | | | | | | |
| Net Assets: | | | | | | | | |
| Beginning of period | | | 171,456,312 | | | | 144,714,874 | |
End of period (including undistributed (accumulated) net investment income (loss)
of ($456,916) and $1,483,042, respectively) | | $ | 159,182,938 | | | $ | 171,456,312 | |
| | | | | | | | | |
| * Shares of beneficial interest issued, reinvested and redeemed | | | | | | | | |
| (unlimited number of $.001 par value shares authorized): | | | | | | | | |
| | | | | | | | | |
| Initial Class Shares: | | | | | | | | |
| Shares sold | | | 1,158,093 | | | | 2,850,659 | |
| Shares transferred (a) | | | — | | | | 3,523,548 | |
| Shares reinvested | | | 190,622 | | | | — | |
| Shares redeemed | | | (2,181,445 | ) | | | (4,095,218 | ) |
| Net increase (decrease) | | | (832,730 | ) | | | 2,278,989 | |
| | | | | | | | | |
| Class R1 Shares: | | | | | | | | |
| Shares sold | | | — | | | | 183,963 | |
| Shares transferred (a) | | | — | | | | (3,526,385 | ) |
| Shares reinvested | | | — | | | | — | |
| Shares redeemed | | | — | | | | (164,472 | ) |
| Net decrease | | | — | | | | (3,506,894 | ) |
| (a) | At the close of business on April 30, 2012, the Fund closed the Class R1 Shares and all outstanding Class R1 Shares were converted to Initial Class Shares. |
See Notes to Financial Statements
FINANCIAL HIGHLIGHTS
For a share outstanding throughout each period:
| | | Initial Class Shares | |
| | | For the Six
Months Ended | | Year Ended December 31, | |
| | | June 30, 2013 | | 2012 | | | 2011 | | | 2010 | | | 2009 | | | 2008 | |
| | | (unaudited) | | | | | | | | | | | | | | | |
| Net asset value, beginning of period | | | | $13.50 | | | | $10.40 | | | | $14.14 | | | | $11.22 | | | | $5.89 | | | | $27.71 | |
| Income from investment operations: | | | | | | | | | | | | | | | | | | | | | | | | | |
| Net investment income | | | | 0.05 | | | | 0.07 | | | | 0.05 | (b) | | | 0.01 | | | | 0.04 | | | | 0.07 | |
| Net realized and unrealized gain (loss) on investments | | | | 0.08 | | | | 3.03 | | | | (3.66 | ) | | | 2.93 | | | | 5.83 | | | | (12.20 | ) |
| Payment by the Adviser | | | | — | | | | — | | | | — | | | | — | | | | 0.04 | (c) | | | — | |
| Total from investment operations | | | | 0.13 | | | | 3.10 | | | | (3.61 | ) | | | 2.94 | | | | 5.91 | | | | (12.13 | ) |
| Less dividends and distributions from: | | | | | | | | | | | | | | | | | | | | | | | | | |
| Net investment income | | | | (0.21 | ) | | | — | | | | (0.13 | ) | | | (0.07 | ) | | | (0.01 | ) | | | — | |
| Net realized gains | | | | — | | | | — | | | | — | | | | — | | | | (0.57 | ) | | | (9.69 | ) |
| Total dividends and distributions | | | | (0.21 | ) | | | — | | | | (0.13 | ) | | | (0.07 | ) | | | (0.58 | ) | | | (9.69 | ) |
| Settlement payments from unaffiliated third parties | | | | — | | | | — | | | | — | | | | 0.05 | | | | — | | | | — | |
| Redemption fees | | | | — | | | | — | (e) | | | — | (e) | | | — | (e) | | | — | (e) | | | — | (e) |
| Net asset value, end of period | | | | $13.42 | | | | $13.50 | | | | $10.40 | | | | $14.14 | | | | $11.22 | | | | $5.89 | |
| Total return (a) | | | | 0.89 | %(g) | | | 29.81 | % | | | (25.74 | )% | | | 26.84 | %(d) | | | 113.17 | %(c) | | | (64.77 | )% |
| Ratios/Supplemental Data | | | | | | | | | | | | | | | | | | | | | | | | | |
| Net Assets, end of period (000’s) | | | $159,183 | | | $171,456 | | | $108,286 | | | $176,522 | | | $166,991 | | | $76,566 | |
| Ratio of gross expenses to average net assets | | | | 1.21 | %(f) | | | 1.23 | % | | | 1.26 | % | | | 1.28 | % | | | 1.22 | % | | | 1.29 | % |
| Ratio of net expenses to average net assets | | | | 1.21 | %(f) | | | 1.23 | % | | | 1.26 | % | | | 1.28 | % | | | 1.22 | % | | | 1.29 | % |
| Ratio of net expenses, excluding interest expense, to average net assets | | | | 1.21 | %(f) | | | 1.23 | % | | | 1.26 | % | | | 1.28 | % | | | 1.21 | % | | | 1.29 | % |
| Ratio of net investment income to average net assets | | | | 0.85 | %(f) | | | 0.55 | % | | | 0.36 | % | | | 0.17 | % | | | 0.49 | % | | | 0.53 | % |
| Portfolio turnover rate | | | | 97 | %(g) | | | 93 | % | | | 95 | % | | | 96 | % | | | 68 | % | | | 45 | % |
| (a) | Total return is calculated assuming an initial investment made at the net asset value at the beginning of period, reinvestment of any dividends and distributions at net asset value on the dividend/distributions payment date and a redemption on the last day of the period. The return does not reflect the deduction of taxes that a shareholder would pay on Fund dividends/distributions or the redemption of Fund shares. |
| (b) | Calculated based upon average shares outstanding |
| (c) | For the year ended December 31, 2009, 0.70% of the total return, representing $0.04 per share, consisted of a reimbursement by the Adviser for an investment loss. |
| (d) | For the year ended December 31, 2010, the Fund received settlement payments from unaffiliated third parties which represented 0.46% of the Initial Class Shares total return. |
| (e) | Amount represents less than $0.005 per share |
| (f) | Annualized |
| (g) | Not annualized |
See Notes to Financial Statements
VAN ECK VIP EMERGING MARKETS FUND
NOTES TO FINANCIAL STATEMENTS
June 30, 2013 (unaudited)
Note 1—Fund Organization—Van Eck VIP Trust (the “Trust”) is registered under the Investment Company Act of 1940, as amended, as an open-end management investment company. The Trust was organized as a Massachusetts business trust on January 7, 1987. The Van Eck VIP Emerging Markets Fund (the “Fund”) is a non-diversified series of the Trust and seeks long-term capital appreciation by investing primarily in equity securities in emerging markets around the world. The Fund currently offers a single class of shares: Initial Class Shares. At the close of business on April 30, 2012, the Fund closed the Class R1 Shares and Class R1 Shares outstanding were converted to Initial Class Shares.
Note 2—Significant Accounting Policies—The preparation of financial statements in conformity with U.S. generally accepted accounting principles (“GAAP”) requires management to make estimates and assumptions that affect the reported amounts and disclosures in the financial statements. Actual results could differ from those estimates.
The following is a summary of significant accounting policies followed by the Fund.
| A. | Security Valuation—The Fund values its investments in securities and other assets and liabilities carried at fair value daily. Fair value is the price that would be received to sell an asset or paid to transfer a liability in an orderly transaction between market participants on the measurement date. Securities traded on national exchanges or traded on the NASDAQ National Market System are valued at the last sales price as reported at the close of each business day. Securities traded on the NASDAQ Stock Market are valued at the NASDAQ official closing price. Over-the-counter securities not included in the NASDAQ National Market System and listed securities for which no sale was reported are valued at the mean of the bid and ask prices. To the extent these securities are actively traded they are categorized as Level 1 in the fair value hierarchy (as described below). Certain foreign securities, whose values may be affected by market direction or events occurring before the Fund’s pricing time (4:00 p.m. Eastern Time) but after the last close of the securities’ primary market, are fair valued using a pricing service and are categorized as Level 2 in the fair value hierarchy. The pricing service considers the correlation of the trading patterns of the foreign security to intraday trading in the U.S. markets, based on indices of domestic securities and other appropriate indicators such as prices of relevant ADR’s and futures contracts. The Fund may also fair value securities in other situations, such as, when a particular foreign market is closed but the Fund is open. Short-term obligations with more than sixty days remaining to maturity are valued at market value. Short-term obligations with sixty days or less to maturity are valued at amortized cost, which with accrued interest approximates fair value. Money market fund investments are valued at net asset value and are categorized as Level 1 in the fair value hierarchy. Forward foreign currency contracts are valued at the spot currency rate plus an amount (“points”), which reflects the differences in interest rates between the U.S. and foreign markets. Securities for which quotations are not available are stated at fair value as determined by the Pricing Committee of Van Eck Associates Corporation (the “Adviser”) appointed by the Board of Trustees. The Pricing Committee provides oversight of the Fund’s valuation policies and procedures, which are approved by the Fund’s Board of Trustees. Among other things, these procedures allow the Fund to utilize independent pricing services, quotations from broker dealers, and other market sources to determine fair value. The Pricing Committee convenes regularly to review the fair value of financial instruments for which market prices are not readily available. The Pricing Committee employs various methods for calibrating the valuation approaches utilized to determine fair value, including a regular review of key inputs and assumptions, transactional back-testing and disposition analysis. |
| | |
| | Certain factors such as economic conditions, political events, market trends, the nature of and duration of any restrictions on disposition, trading in similar securities of the issuer or comparable issuers and other security specific information are used to determine the fair value for these securities. Depending on the relative significance of valuation inputs, these securities may be classified either as Level 2 or Level 3 in the fair value hierarchy. The price which the Fund may realize upon sale of an investment may differ materially from the value presented in the Schedule of Investments. |
| | |
| | The Fund utilizes various methods to measure the fair value of its investments on a recurring basis which includes a hierarchy that prioritizes inputs to valuation methods used to measure fair value. The fair value hierarchy gives highest priority to unadjusted quoted prices in active markets for identical assets and liabilities (Level 1 measurements) and the lowest priority to unobservable inputs (Level 3 measurements). The inputs or methodologies used for valuing securities are not necessarily an indication of the risk associated with investing in those securities. The transfers between levels of the fair value hierarchy assume the financial instruments were transferred at the beginning of the reporting period. The three levels of the fair value hierarchy are described below: |
| Level 1 – | Quoted prices in active markets for identical securities. |
| | | |
| Level 2 – | Significant observable inputs (including quoted prices for similar securities, interest rates, prepayment speeds, credit risk, etc.). |
| | | |
| Level 3 – | Significant unobservable inputs (including the Fund’s own assumptions in determining the fair value of investments). |
See Notes to Financial Statements
| | A summary of the inputs, the levels used to value the Fund’s investments, and transfers between levels are located in the Schedule of Investments. Additionally, tables that reconcile the valuation of the Fund’s Level 3 investments and that present additional information about valuation methodologies and unobservable inputs, if applicable, are located in the Schedule of Investments. |
| | |
| B. | Federal Income Taxes—It is the Fund’s policy to comply with the provisions of the Internal Revenue Code applicable to regulated investment companies and to distribute all of its taxable income to its shareholders. Therefore, no federal income tax provision is required. |
| | |
| C. | Currency Translation—Assets and liabilities denominated in foreign currencies and commitments under foreign currency contracts are translated into U.S. dollars at the closing prices of such currencies each business day. Purchases and sales of investments are translated at the exchange rates prevailing when such investments are acquired or sold. Income and expenses are translated at the exchange rates prevailing when accrued. The portion of realized and unrealized gains and losses on investments that result from fluctuations in foreign currency exchange rates is not separately disclosed. Recognized gains or losses attributable to foreign currency fluctuations on foreign currency denominated assets, other than investments, and liabilities are recorded as net realized gain (loss) on foreign currency transactions and foreign denominated assets and liabilities in the Statement of Operations. |
| | |
| D. | Dividends and Distributions to Shareholders—Dividends to shareholders from net investment income and distributions from net realized capital gains, if any, are declared and paid annually. Income dividends and capital gain distributions are determined in accordance with U.S. income tax regulations, which may differ from such amounts determined in accordance with GAAP. |
| | |
| E. | Restricted Securities—The Fund may invest in securities that are subject to legal or contractual restrictions on resale. These securities generally may be resold in transactions exempt from registration or to the public if the securities are registered. Disposal of these securities may involve time-consuming negotiations and expense, and prompt sale at an acceptable price may be difficult. Information regarding restricted securities is included at the end of the Fund’s Schedule of Investments. |
| | |
| F. | Warrants—The Fund may invest in warrants whose values are linked to indices or underlying instruments. The Fund may use these warrants to gain exposure to markets that might be difficult to invest in through conventional securities. Warrants may be more volatile than their linked indices or underlying instruments. Potential losses are limited to the amount of the original investment. The Fund has invested in aXess warrants that are linked to the shares of an underlying security and are issued by Deutsche Bank AG London. The warrants are obligations of the issuer and are not secured by any collateral. The warrants may be exercised by the Fund during the exercise period. If the warrants have not been exercised on the last day of the exercise period, the warrants will be automatically exercised on that day. Warrants held at June 30, 2013 are reflected in the Schedule of Investments. |
| | |
| G. | Use of Derivative Instruments—The Fund may make investments in derivative instruments, including, but not limited to, options, futures, swaps and other derivatives relating to foreign currency transactions. A derivative is an instrument whose value is derived from underlying assets, indices, reference rates or a combination of these factors. Derivative instruments may be privately negotiated contracts (often referred to as over-the-counter (“OTC”) derivatives) or they may be listed and traded on an exchange. Derivative contracts may involve future commitments to purchase or sell financial instruments or commodities at specified terms on a specified date, or to exchange interest payment streams or currencies based on a notional or contractual amount. Derivative instruments may involve a high degree of financial risk. The use of derivative instruments also involves the risk of loss if the investment adviser is incorrect in its expectation of the timing or level of fluctuations in securities prices, interest rates or currency prices. Investments in derivative instruments also include the risk of default by the counterparty, the risk that the investment may not be liquid and the risk that a small movement in the price of the underlying security or benchmark may result in a disproportionately large movement, unfavorable or favorable, in the price of the derivative instrument. GAAP requires enhanced disclosures about the Fund’s derivatives instruments and hedging activities. The Fund held no derivative instruments during the period ended June 30, 2013. |
| | Forward Foreign Currency Contracts—The Fund is subject to foreign currency risk in the normal course of pursuing its investment objectives. The Fund may buy and sell forward foreign currency contracts to settle purchases and sales of foreign denominated securities or to hedge foreign denominated assets. Realized gains and losses from forward foreign currency contracts, if any, are included in realized gain (loss) on foreign currency transactions and foreign denominated assets and liabilities in the Statement of Operations. The Fund may incur additional risk from investments in forward foreign currency contracts if the counterparty is unable to fulfill its obligation or there are unanticipated movements of the foreign currency relative to the U.S. dollar. The Fund held no forward foreign currency contracts during the period ended June 30, 2013. |
VAN ECK VIP EMERGING MARKETS FUND
NOTES TO FINANCIAL STATEMENTS
(continued)
| H. | Other—Security transactions are accounted for on trade date. Dividend income is recorded on the ex-dividend date except that certain dividends from foreign securities are recognized upon notification of the ex-dividend date. Realized gains and losses are calculated on the specific identified cost basis. Interest income, including amortization of premiums and discounts, is accrued as earned. Estimated foreign taxes that are expected to be withheld from proceeds at the sale of certain foreign investments are accrued by the Fund and decrease the unrealized gain on investments. The Fund received regulatory settlement payments during 2010 from unaffiliated third parties which is included in the Financial Highlights. The Fund received redemption fees from Class R1 Shares prior to its closing on April 30, 2012 and is reflected in the Statement of Changes in Net Assets and Financial Highlights. |
| | |
| | Prior to the closing of Class R1 Shares on April 30, 2012, income, expenses (excluding class-specific expenses) and realized/unrealized gains/losses were allocated proportionately to each class of shares based upon the relative net asset value of outstanding shares of each class at the beginning of the day (after adjusting for current capital share activity of the respective classes). Class-specific expenses were charged directly to the applicable class of shares. |
| | |
| | In the normal course of business, the Fund enters into contracts that contain a variety of general indemnifications. The Fund’s maximum exposure under these agreements is unknown as this would involve future claims that may be made against the Fund that have not yet occurred. However, the Adviser believes the risk of loss under these arrangements to be remote. |
Note 3—Investment Management and Other Agreements—The Adviser is the investment adviser to the Fund. The Adviser receives a management fee, calculated daily and payable monthly based on an annual rate of 1.00% of the Fund’s average daily net assets. The Adviser has agreed, at least until May 1, 2014, to waive management fees and/or assume expenses excluding interest, taxes, and extraordinary expenses exceeding 1.50% of the Fund’s average daily net assets. For the period ended June 30, 2013, no management fees were waived nor were any expenses assumed by the Adviser. Certain of the officers and trustees of the Trust are officers, directors or stockholders of the Adviser and Van Eck Securities Corporation, the distributor.
Note 4—Investments—For the period ended June 30, 2013, the cost of purchases and proceeds from sales of investments, excluding U.S. government securities and short-term obligations, aggregated $86,553,722 and $104,632,087, respectively.
Note 5—Income Taxes—For Federal income tax purposes, the identified cost of investments owned at June 30, 2013 was $142,537,967 and net unrealized appreciation aggregated $12,811,327 of which $24,979,665 related to appreciated securities and $12,168,338 related to depreciated securities.
The tax character of dividends and distributions paid to shareholders were as follows:
| | | As of
June 30, 2013 | | | Year Ended
December 31, 2012 | |
| Ordinary income | | | $ | 2,678,236 | | | | | $ | — | | |
On December 22, 2010, the Regulated Investment Company Modernization Act of 2010 (the “Act”) was enacted, which changed various technical rules governing the tax treatment of regulated investment companies. The changes are generally effective for taxable years beginning after the date of enactment. One of the more prominent changes addresses capital loss carryforwards. Under the Act, the Fund is permitted to carryforward capital losses incurred in taxable years beginning after the date of enactment for an unlimited period. However, any losses incurred during those future taxable years will be required to be utilized prior to the losses incurred in pre-enactment taxable years, which carry an expiration date. As a result of this ordering rule, pre-enactment capital loss carryforwards may be more likely to expire unused. Additionally, post-enactment capital loss carryforwards will retain their character as either short-term or long-term capital losses rather than being considered all short-term as permitted under previous regulation.
During the year ended December 31, 2012, the Fund utilized $194,804 of capital loss carryforwards. The remainder of the capital loss carryforwards of $21,487 expires on December 31, 2017.
The Fund recognizes the tax benefits of uncertain tax positions only where the position is “more-likely-than-not” to be sustained assuming examination by applicable tax authorities. Management has analyzed the Fund’s tax positions, and has concluded that no liability for unrecognized tax benefits should be recorded related to uncertain tax positions taken on return filings for open tax years (tax years ended December 31, 2009-2012), or expected to be taken in the Fund’s current tax year. The Fund does not have exposure for additional years that might still be open in certain foreign jurisdictions. Therefore, no provision for income tax is required in the Fund’s financial statements.
The Fund recognizes interest and penalties, if any, related to uncertain tax positions as income tax expense in the Statement of Operations. During the period ended June 30, 2013, the Fund did not incur any interest or penalties.
Note 6—Concentration of Risk—The Fund may purchase securities on foreign exchanges. Securities of foreign issuers involve special risks and considerations not typically associated with investing in U.S. issuers. These risks include devaluation of currencies, less reliable information about issuers, different securities transaction clearance and settlement practices, and future adverse political and economic developments. These risks are heightened for investments in emerging market countries. Moreover, securities of many foreign issuers and their markets may be less liquid and their prices more volatile than those of comparable U.S. issuers.
At June 30, 2013, the aggregate shareholder accounts of two insurance companies own approximately 75% and 8% of the Initial Class Shares.
Note 7—Trustee Deferred Compensation Plan—The Trust has a Deferred Compensation Plan (the “Deferred Plan”) for Trustees under which the Trustees can elect to defer receipt of their trustee fees until retirement, disability or termination from the Board of Trustees. The fees otherwise payable to the participating Trustees are deemed invested in shares of eligible Funds of the Trust and the Van Eck Funds (another registered investment company managed by the Adviser) as directed by the Trustees.
The expense for the Deferred Plan is included in “Trustees’ fees and expenses” in the Statement of Operations. The liability for the Deferred Plan is shown as “Deferred Trustee fees” in the Statement of Assets and Liabilities.
Note 8—Bank Line of Credit—The Trust may participate with Van Eck Funds (collectively the “VE/VIP Funds”) in a $20 million committed credit facility (the “Facility”) to be utilized for temporary financing until the settlement of sales or purchases of portfolio securities, the repurchase or redemption of shares of the Fund at the request of the shareholders and other temporary or emergency purposes. The VE/VIP Funds have agreed to pay commitment fees, pro rata, based on the unused but available balance. Interest is charged to the VE/VIP Funds at rates based on prevailing market rates in effect at the time of borrowings. During the period ended June 30, 2013, the average daily loan balance during the 1 day period for which a loan was outstanding amounted to $133,480 and the average interest rate was 1.43%. At June 30, 2013, the Fund had no outstanding borrowings under the Facility.
Note 9—Securities Lending—To generate additional income, the Fund may lend its securities pursuant to a securities lending agreement with State Street Bank & Trust Co., the securities lending agent and also the Fund’s custodian. During the period ended June 30, 2013, the Fund had no securities lending activity.
Note 10—Recent Accounting Pronouncements—The Fund has adopted Accounting Standards Update (“ASU”) No. 2011-11, Balance Sheet (Topic 210) Disclosures about Offsetting Assets and Liabilities, as clarified by ASU No. 2013-01 “Clarifying the Scope of Disclosures about Offsetting Assets and Liabilities” which requires entities to disclose gross and net information about derivative instruments, repurchase and reverse-repurchase agreements, and securities borrowing and lending transactions that are either: (1) offset in accordance with GAAP, or (2) subject to enforceable master netting arrangement or similar agreements, irrespective of whether they are offset in accordance with GAAP. In addition, ASU No. 2011-11 requires disclosure of collateral received and posted in connection with master netting agreements or similar arrangements. Additional disclosure requirements of ASU No. 2011-11 and ASU No. 2013-01, if any, are reflected in Note 2 to the Fund’s financial statements.
Note 11—Subsequent Event Review—The Fund has evaluated subsequent events and transactions for potential recognition or disclosure through the date the financial statements were issued.
Effective July 26, 2013, the VE/VIP Funds increased the line of credit from $20 million to $30 million.
VAN ECK VIP EMERGING MARKETS FUND
APPROVAL OF ADVISORY AGREEMENT
The Investment Company Act of 1940, as amended (the “1940 Act”), provides, in substance, that an investment advisory agreement between a fund and its investment adviser may be entered into only if it is approved, and may continue in effect from year to year after an initial two-year period only if its continuance is approved, at least annually by the fund’s board of trustees, including by a vote of a majority of the trustees who are not “interested persons” of the fund as defined in the 1940 Act (the “Independent Trustees”), cast in person at a meeting called for the purpose of considering such approval.
On June 25, 2013, the Board of Trustees (the “Board”) of Van Eck VIP Trust (the “Trust”), which is comprised exclusively of Independent Trustees, voted to approve the continuation of the existing advisory agreement (the “Advisory Agreement”) between Van Eck VIP Emerging Markets Fund (the “Fund”) and its investment adviser, Van Eck Associates Corporation (together with its affiliated companies, the “Adviser”). Information regarding the material factors considered and related conclusions reached by the Board in approving the continuation of the Advisory Agreement is set forth below.
In considering the continuation of the Advisory Agreement, the Board reviewed and considered information that had been provided by the Adviser throughout the year at regular and special meetings of the Board and its committees, including information requested by the Board and furnished by the Adviser for meetings of the Board held on June 4, 2013 and June 24 and 25, 2013 specifically for the purpose of considering the continuation of the Advisory Agreement. The written and oral reports provided to the Board included, among other things, the following:
| ■ | Information about the overall organization of the Adviser and the Adviser’s short-term and long-term business plans with respect to its mutual fund operations and other lines of business; |
| | |
| ■ | The consolidated financial statements of the Adviser for the past three fiscal years; |
| | |
| ■ | A copy of the Advisory Agreement and descriptions of the services provided by the Adviser thereunder; |
| | |
| ■ | Information regarding the qualifications, education and experience of the investment professionals responsible for portfolio management, investment research and trading activities for the Fund, the structure of their compensation and the resources available to support these activities; |
| | |
| ■ | A report prepared by an independent consultant comparing the Fund’s investment performance (including, where relevant, total returns, standard deviations, Sharpe ratios, information ratios, beta and alpha) with respect to a representative class of shares of the Fund for the one-, three-, five- and ten-year periods ended March 31, 2013 with those of (i) a universe of mutual funds selected by the independent consultant with similar portfolio holding characteristics, share class attributes and other operational characteristics as the Fund (the “Category”), (ii) a sub-group of funds selected from the Category by the independent consultant further limited to approximate more closely the Fund’s investment style, expense structure and asset size (the “Peer Group”) and (iii) an appropriate benchmark index; |
| | |
| ■ | A report prepared by an independent consultant comparing the advisory fees and other expenses of a representative class of shares of the Fund during its fiscal year ended December 31, 2012 with a similar share class of each fund in the (i) Category and (ii) Peer Group; |
| | |
| ■ | An analysis of the profitability of the Adviser with respect to its services for the Fund and the Van Eck complex of mutual funds as a whole (the “Van Eck Complex”); |
| | |
| ■ | Information regarding other investment products and services offered by the Adviser involving investment objectives and strategies similar to the Fund (“Comparable Products”), including the fees charged by the Adviser for managing the Comparable Products, a description of material differences and similarities in the services provided by the Adviser for the Fund and the Comparable Products, the size of the Comparable Products, the performance of the Comparable Products and identity of the individuals responsible for managing the Comparable Products; |
| | |
| ■ | Information concerning the Adviser’s compliance program, the resources devoted to compliance efforts undertaken by the Adviser on behalf of the Fund, and reports regarding a variety of compliance-related issues; |
| | |
| ■ | Information with respect to the Adviser’s brokerage practices, including the Adviser’s processes for monitoring best execution of portfolio transactions and the benefits received by the Adviser from research acquired with soft dollars; |
| | |
| ■ | Information regarding the procedures used by the Adviser in monitoring the valuation of portfolio securities, including the methodologies used in making fair value determinations; |
| | |
| ■ | Information regarding the Adviser’s policies and practices with respect to personal investing by the Adviser and its employees, including reports regarding the administration of the Adviser’s code of ethics and the Adviser’s policy with respect to investments in the Fund by the Adviser’s investment personnel; |
| ■ | Descriptions of other administrative and other non-investment management services provided by the Adviser for the Fund, including the Adviser’s activities in managing relationships with the Fund’s custodian, transfer agent and other service providers; and |
| | |
| ■ | Other information provided by the Adviser in its response to a comprehensive questionnaire prepared by independent legal counsel on behalf of the Independent Trustees. |
In determining whether to approve the continuation of the Advisory Agreement, the Board considered, among other things, the following: (1) the nature, quality, extent and cost of the investment management, administrative and other non-investment management services provided by the Adviser; (2) the nature, quality and extent of the services performed by the Adviser in interfacing with, and monitoring the services performed by, third parties, such as the Fund’s custodian, transfer agent, sub-accounting agent and independent auditors, and the Adviser’s commitment and efforts to review the quality and pricing of third party service providers to the Fund with a view to reducing non-management expenses of the Fund; (3) the terms of the Advisory Agreement and the services performed thereunder; (4) the willingness of the Adviser to reduce the overall expenses of the Fund from time to time, if necessary or appropriate, by means of waiving a portion of its fees or paying expenses of the Fund; (5) the quality of the services, procedures and processes used to determine the value of the Fund’s assets and the actions taken to monitor and test the effectiveness of such services, procedures and processes; (6) the ongoing efforts of, and resources devoted by, the Adviser with respect to the development and implementation of a comprehensive compliance program; (7) the responsiveness of the Adviser to inquiries from, and examinations by, regulatory authorities, including the Securities and Exchange Commission; (8) the resources committed by the Adviser in recent periods to information technology; and (9) the ability of the Adviser to attract and retain quality professional personnel to perform investment advisory and administrative services for the Fund.
The Board considered the fact that the Adviser is managing other investment products, including exchange-traded funds, hedge funds, separate accounts and UCITs, one or more of which may invest in the same financial markets and may be managed by the same investment professionals according to a similar investment objective and/or strategy as the Fund. The Board concluded that the management of these products contributes to the Adviser’s financial stability and is helpful to the Adviser in attracting and retaining quality portfolio management personnel for the Fund. In addition, the Board concluded that the Adviser has established appropriate procedures to monitor conflicts of interest involving the management of the Fund and the other products and for resolving any such conflicts of interest in a fair and equitable manner.
The performance data and the advisory fee and expense ratio data described below for the Fund is based on data for a representative class of shares of the Fund. The performance data is for periods on an annualized basis ended March 31, 2013, and the advisory fee and expense ratio data is as of the Fund’s fiscal year end of December 31, 2012.
Performance. The Board noted, based on a review of comparative annualized total returns, that the Fund had outperformed its Category and Peer Group medians, as well as its benchmark index, over the one-, three-, five- and ten-year periods. The Board concluded that the performance of the Fund was satisfactory.
Fees and Expenses. The Board noted that the fees payable for advisory services were lower than the median advisory fees of its Category and Peer Group and that the Fund’s total expense ratio, net of waivers or reimbursements, was lower than the median expense ratio of its Peer Group and equal to the median expense ratio of its Category. The Board also noted that the Adviser has agreed to waive fees or pay expenses of the Fund through April 2014 to the extent necessary to prevent the expense ratio of the Fund from exceeding a specified maximum amount. On the basis of the foregoing, and in light of the nature, extent and quality of the services provided by the Adviser, the Board concluded that the advisory fee charged to the Fund is reasonable.
Profitability and Economies of Scale. The Board considered the profits, if any, realized by the Adviser from managing the Fund and other mutual funds in the Van Eck Complex and the methodology used to determine such profits, including the results of an analysis of the methodology performed recently by an independent consultant on behalf of the Board and its independent counsel. The Board noted that the levels of profitability reported on a fund-by-fund basis varied widely depending on such factors as the size, type of fund and operating history. The Board further noted that, in evaluating the reasonableness of the Adviser’s profits from managing any particular Fund, it would be appropriate to consider the size of the Adviser relative to other firms in the investment management industry and the impact on the Adviser’s profits of the volatility of the markets in which the Funds invest and the volatility of cash flows into and out of the Funds through various market cycles. Based on its review of the foregoing information, and in light of the nature, extent and quality of the services provided by the Adviser, the Board concluded that the profits realized by the Adviser, if any, are not excessive. In this regard, the Board also considered the extent to which the Adviser may realize economies of scale as the Fund grows and whether the Fund’s fee schedule reflects these economies of scale for the benefit of shareholders. The Board concluded
VAN ECK VIP EMERGING MARKETS FUND
APPROVAL OF ADVISORY AGREEMENT
(continued)
that, with respect to the Fund, the economies of scale being realized, if any, are currently being shared by the Adviser and the Fund, and that adding breakpoints would not be warranted at this time for the Fund.
Conclusion. In determining the material factors to be considered in evaluating the Advisory Agreement and the weight to be given to such factors, the members of the Board relied upon the advice of independent legal counsel and their own business judgment. The Board did not consider any single factor as controlling in determining whether to approve the continuation of the Advisory Agreement and each member of the Board may have placed varying emphasis on particular factors considered in reaching a conclusion. Moreover, this summary description does not necessarily identify all of the factors considered or conclusions reached by the Board. Based on its consideration of the foregoing factors and conclusions, and such other factors and conclusions as it deemed relevant, the Board (comprised exclusively of Independent Trustees) concluded that the continuation of the Advisory Agreement is in the interests of shareholders and, accordingly, the Board approved the continuation of the Advisory Agreement for an additional one-year period.
This report must be preceded or accompanied by a Van Eck VIP (the “Trust”) Prospectus, which includes more complete information. An investor should consider the investment objective, risks, and charges and expenses of the Fund carefully before investing. The prospectus contains this and other information about the investment company. Please read the prospectus carefully before investing.
Additional information about the Trust’s Board of Trustees/Officers and a description of the policies and procedures the Trust uses to determine how to vote proxies relating to portfolio securities are provided in the Statement of Additional Information. The Statement of Information and information regarding how the Trust voted proxies relating to portfolio securities during the most recent twelve month period ending June 30 is available, without charge, by calling 800.826.2333, or by visiting vaneck.com, or on the Securities and Exchange Commission’s website at http://www.sec.gov.
The Trust files its complete schedule of portfolio holdings with the Securities and Exchange Commission for the first and third quarters of each fiscal year on Form N-Q. The Trust’s Form N-Qs are available on the Commission’s website at http://www.sec.gov and may be reviewed and copied at the Commission’s Public Reference Room in Washington, D.C. Information on the operation of the Public Reference Room may be obtained by calling 202.942.8090. The Fund’s complete schedule of portfolio holdings is also available by calling 800.826.2333 or by visiting vaneck.com.

| Investment Adviser: | Van Eck Associates Corporation |
| Distributor: | Van Eck Securities Corporation |
| | 335 Madison Avenue, New York, NY 10017 |
| | vaneck.com |
| Account Assistance: | 800.544.4653 |
Item 2. CODE OF ETHICS.

     Not applicable.

Item 3. AUDIT COMMITTEE FINANCIAL EXPERT.

     Not applicable.

Item 4. PRINCIPAL ACCOUNTANT FEES AND SERVICES.

     Not applicable.

Item 5. AUDIT COMMITTEE OF LISTED REGISTRANTS.

     Not applicable.

Item 6. SCHEDULE OF INVESTMENTS.

     Information included in Item 1.

Item 7. DISCLOSURE OF PROXY VOTING POLICIES AND PROCEDURES FOR CLOSED-END
        MANAGEMENT INVESTMENT COMPANIES.

     Not applicable.

Item 8. PORTFOLIO MANAGER OF CLOSED-END MANAGEMENT INVESTMENT COMPANIES.

     Not applicable.

Item 9. PURCHASE OF EQUITY SECURITIES BY CLOSED-END MANAGEMENT INVESTMENT
        COMPANY AND AFFILIATED PURCHASERS.

     Not applicable.

Item 10. SUBMISSION OF MATTERS TO A VOTE OF SECURITY HOLDERS.

     No changes.

Item 11. CONTROLS AND PROCEDURES.

(a)  The Chief Executive Officer and the Chief Financial Officer have concluded
     that the Van Eck VIP Emerging Markets Fund disclosure controls and procedures
     (as defined in Rule 30a-3(c) under the Investment Company Act) provide
     reasonable assurances that material information relating to the Van Eck VIP
     Emerging Markets Fund is made known to them by the appropriate persons,
     based on their evaluation of these controls and procedures as of a date
     within 90 days of the filing date of this report.

(b)   There were no changes in the registrant's internal control over financial
      reporting (as defined in Rule 30a-3(d) under the 1940 Act (17 CFR
      270.30a-3(d)) that occurred during the second fiscal quarter of the period
      covered by this report that has materially affected, or is reasonably
      likely to materially affect, the registrant's internal control over
      financial reporting.


Item 12. EXHIBITS.

(a)(1) Not applicable.

(a)(2) A separate certification for each principal executive officer and
       principal financial officer of the registrant as required by Rule 30a-2
       under the Act (17 CFR 270.30a-2) is attached as Exhibit 99.CERT.

(b)  Certification pursuant to Section 906 of the Sarbanes-Oxley Act of 2002 is
     furnished as Exhibit 99.906CERT.
                                   SIGNATURES


Pursuant to the requirements of the Securities Exchange Act of 1934 and the
Investment Company Act of 1940, the registrant has duly caused this report to be
signed on its behalf by the undersigned, thereunto duly authorized.

(Registrant) VAN ECK VIP TRUST - VAN ECK VIP EMERGING MARKETS FUND

By (Signature and Title) /s/ John J. Crimmins, Treasurer & CFO
                         -------------------------------------
Date   September 6, 2013
      ------------------

Pursuant to the requirements of the Securities Exchange Act of 1934 and the
Investment Company Act of 1940, this report has been signed below by the
following persons on behalf of the registrant and in the capacities and on the
dates indicated.

By (Signature and Title) /s/ Jan F. van Eck, CEO
                        --------------------------
Date   September 6, 2013
      ------------------

By (Signature and Title)  /s/ John J. Crimmins, Treasurer and CFO
                         ----------------------------------------
Date   September 6, 2013
      ------------------