UNITED STATES
SECURITIES AND EXCHANGE COMMISSION
WASHINGTON, D.C. 20549
FORMN-CSR
CERTIFIED SHAREHOLDER REPORT OF REGISTERED
MANAGEMENT INVESTMENT COMPANIES
Investment Company Act file number:811-05088
THE AB PORTFOLIOS
(Exact name of registrant as specified in charter)
1345 Avenue of the Americas, New York, New York 10105
(Address of principal executive offices) (Zip code)
Joseph J. Mantineo
AllianceBernstein L.P.
1345 Avenue of the Americas
New York, New York 10105
(Name and address of agent for service)
Registrant’s telephone number, including area code: (800)221-5672
Date of fiscal year end: August 31, 2019
Date of reporting period: February 28, 2019
| ITEM 1. | REPORTS TO STOCKHOLDERS. |
FEB 02.28.19

SEMI-ANNUAL REPORT
AB ALL MARKET TOTAL RETURN PORTFOLIO

Beginning January 1, 2021, as permitted by new regulations adopted by the Securities and Exchange Commission, the Fund’s annual and semi-annual shareholder reports will no longer be sent by mail, unless you specifically request paper copies of the reports. Instead, the reports will be made available on a website, and you will be notified by mail each time a report is posted and provided with a website address to access the report.
If you already elected to receive shareholder reports electronically, you will not be affected by this change and you need not take any action. You may elect to receive shareholder reports and other communications from the Fund electronically at any time by contacting your financial intermediary (such as a broker-dealer or bank) or, if you are a direct investor, by calling the Fund at (800) 221 5672.
You may elect to receive all future reports in paper form free of charge. If you invest through a financial intermediary, you can contact your financial intermediary to request that you continue to receive paper copies of your shareholder reports; if you invest directly with the Fund, you can call the Fund at (800) 221 5672. Your election to receive reports in paper form will apply to all funds held in your account with your financial intermediary or, if you invest directly, to all AB Mutual Funds you hold.
| | |
| |
| Investment Products Offered | | • Are Not FDIC Insured• May Lose Value• Are Not Bank Guaranteed |
Investors should consider the investment objectives, risks, charges and expenses of the Fund carefully before investing. For copies of our prospectus or summary prospectus, which contain this and other information, visit us online at www.abfunds.com or contact your AB representative. Please read the prospectus and/or summary prospectus carefully before investing.
This shareholder report must be preceded or accompanied by the Fund’s prospectus for individuals who are not current shareholders of the Fund.
You may obtain a description of the Fund’s proxy voting policies and procedures, and information regarding how the Fund voted proxies relating to portfolio securities during the most recent12-month period ended June 30, without charge. Simply visit AB’s website at www.abfunds.com, or go to the Securities and Exchange Commission’s (the “Commission”) website at www.sec.gov, or call AB at (800) 227 4618.
The Fund files its complete schedule of portfolio holdings with the Commission for the first and third quarters of each fiscal year as an exhibit to its reports on Form N-PORT. The Fund’s Form N-PORT reports are available on the Commission’s website at www.sec.gov. The Fund’s Forms N-PORT may also be reviewed and copied at the Commission’s Public Reference Room in Washington, DC; information on the operation of the Public Reference Room may be obtained by calling (800) SEC 0330. AB publishes full portfolio holdings for the Fund monthly at www.abfunds.com.
AllianceBernstein Investments, Inc. (ABI) is the distributor of the AB family of mutual funds. ABI is a member of FINRA and is an affiliate of AllianceBernstein L.P., the Adviser of the funds.
The [A/B] logo is a registered service mark of AllianceBernstein and AllianceBernstein® is a registered service mark used by permission of the owner, AllianceBernstein L.P.
| | |
| FROM THE PRESIDENT | |  |
Dear Shareholder,
We are pleased to provide this report for AB All Market Total Return Portfolio (the “Fund”). Please review the discussion of Fund performance, the market conditions during the reporting period and the Fund’s investment strategy.
As always, AB strives to keep clients ahead of what’s next by:
| + | | Transforming uncommon insights into uncommon knowledge with a global research scope |
| + | | Navigating markets with seasoned investment experience and sophisticated solutions |
| + | | Providing thoughtful investment insights and actionable ideas |
Whether you’re an individual investor or a multi-billion-dollar institution, we put knowledge and experience to work for you.
AB’s global research organization connects and collaborates across platforms and teams to deliver impactful insights and innovative products. Better insights lead to better opportunities—anywhere in the world.
For additional information about AB’s range of products and shareholder resources, please log on to www.abfunds.com.
Thank you for your investment in the AB Mutual Funds.
Sincerely,

Robert M. Keith
President and Chief Executive Officer, AB Mutual Funds
| | |
| |
| abfunds.com | | AB ALL MARKET TOTAL RETURN PORTFOLIO | 1 |
SEMI-ANNUAL REPORT
April 09, 2019
This report provides management’s discussion of fund performance for AB All Market Total Return Portfolio for the semi-annual reporting period ended February 28, 2019.
The Fund’s investment objective is to achieve the highest total return consistent with the Adviser’s determination of reasonable risk.
NAV RETURNS AS OF FEBRUARY 28, 2019(unaudited)
| | | | | | | | |
| | |
| | | 6 Months | | | 12 Months | |
| | |
| AB ALL MARKET TOTAL RETURN PORTFOLIO | | | | | | | | |
| | |
| Class A Shares | | | -0.54% | | | | 1.10% | |
| | |
| Class B Shares1 | | | -0.81% | | | | 0.41% | |
| | |
| Class C Shares | | | -0.89% | | | | 0.35% | |
| | |
| Advisor Class Shares2 | | | -0.40% | | | | 1.37% | |
| | |
| Class R Shares2 | | | -0.68% | | | | 0.69% | |
| | |
| Class K Shares2 | | | -0.47% | | | | 1.03% | |
| | |
| Class I Shares2 | | | -0.33% | | | | 1.35% | |
| | |
| Primary Benchmark: MSCI ACWI (net) | | | -2.92% | | | | -0.84% | |
| | |
Bloomberg Barclays Global Aggregate Bond Index
(USD hedged) | | | 2.55% | | | | 3.94% | |
| 1 | Effective January 31, 2009, Class B shares are no longer available for purchase to new investors. Please see Note A for additional information. |
| 2 | Please note that these share classes are for investors purchasing shares through accounts established under certain fee-based programs sponsored and maintained by certain broker-dealers and financial intermediaries, institutional pension plans and/or investment advisory clients of, and certain other persons associated with, the Adviser and its affiliates or the Fund. |
INVESTMENT RESULTS
The table above shows the Fund’s performance compared to its primary benchmark, the Morgan Stanley Capital International All Country World Index (“MSCI ACWI”) (net), and the Bloomberg Barclays Global Aggregate Bond Index (USD hedged), for the six- and 12-month periods ended February 28, 2019.
During both periods, all share classes of the Fund outperformed the primary benchmark and underperformed the Bloomberg Barclays Global Aggregate Bond Index (USD hedged), before sales charges. Equity markets were turbulent during both periods; the Fund’s more diversified approach, which balances exposures to equities, bonds, commodities and alternative strategies, outperformed the all-equity benchmark.
| | |
| |
| 2 | AB ALL MARKET TOTAL RETURN PORTFOLIO | | abfunds.com |
For the six-month period, equities and fixed-income assets contributed to absolute performance, while alternative strategies detracted. Security selection within equities contributed, while selection in fixed-income assets and alternative strategies detracted.
During the 12-month period, fixed-income assets contributed to absolute performance, while alternative strategies and equity holdings detracted. Overall allocations within fixed income and alternative strategies contributed. Security selection within equities contributed, while selection in fixed-income assets and alternative strategies detracted.
The Fund utilized derivatives for hedging and investment purposes in the form of futures, currency forwards, credit default swaps, interest rate swaps and written swaptions, which contributed to absolute performance for both periods, while variance swaps, purchased options and written options detracted; total return swaps, inflation swaps and purchased swaptions contributed for the six-month period, but detracted for the12-month period.
MARKET REVIEW AND INVESTMENT STRATEGY
During the six-month period ended February 28, 2019, US and non-US equities declined, although emerging-market equities posted modest gains. In the US, growth-style stocks outperformed value-style stocks, and small-cap stocks outperformed their large-cap peers. Global trade tensions and rising interest rates weighed on stock market performance. In Europe, Brexit uncertainty, Italian budget issues and German economic woes persisted. Slowing global growth was an increasing concern more broadly. Global equities plummeted at the end of 2018 amid increased volatility, but recouped some losses in January and February, as corporate earnings were above analyst estimates and many central banks shared more dovish monetary policy outlooks.
Fixed-income markets had generally positive returns. Global high yield, developed-market treasuries and investment-grade securities rallied. Emerging-market debt sectors rallied, amid positive idiosyncratic developments and a more favorable macro backdrop, particularly a more patient US Federal Reserve (the “Fed”). Developed-market treasury yield curves moved in different directions (bond yields move inversely to price). The Fed increased interest rates quarterly in 2018 and began to formally reduce its balance sheet before surprising markets with a more dovish tone at the beginning of 2019. Although the European Central Bank formally ended its bond-buying program, the bank also turned more dovish in 2019, putting credit-easing measures back on the table. Meanwhile, the People’s Bank of China started the new year by cutting its reserve requirement ratio.
| | |
| |
| abfunds.com | | AB ALL MARKET TOTAL RETURN PORTFOLIO | 3 |
The Fund’s Senior Investment Management Team (the “Team”) strives to provide the highest total return consistent with reasonable risk. The Team’s global multi-asset strategy focuses on growth and defensively managing market volatility. The Team utilizes a rigorous quantitative research toolset with fundamental expertise across all regions and markets.
INVESTMENT POLICIES
The Adviser allocates the Fund’s investments primarily among a number of asset classes, including equity securities, fixed-income securities, and a number of alternative asset classes and alternative investment strategies. The Fund pursues a global strategy, typically investing in securities of issuers located in the United States and in other countries throughout the world, including emerging-market countries. Under normal circumstances, at least 40% of the Fund’s net assets will be invested in securities of non-US issuers.
Equity securities will primarily be large-capitalization securities, but will include small- and mid-capitalization securities to a lesser extent, and will include derivatives related to equity securities. In selecting equity securities for the Fund, the Adviser will use fundamental and quantitative analysis with the goal of generating returns primarily from security selection rather than price movements in equity securities generally. Fixed-income securities include corporate and sovereign debt securities as well as interest rate derivatives and credit derivatives such as credit default swaps. Fixed-income securities also include debt securities with lower credit ratings (commonly known as “junk bonds”). In selecting fixed-income securities for the Fund, the Adviser will attempt to take advantage of inefficiencies that it believes exist in the global fixed-income markets. These inefficiencies arise from investor behavior, market complexity and the investment limitations to which investors are subject.
Alternative investments include various instruments the returns on which are expected to have low correlation with returns on equity and fixed-income securities, such as commodities and related derivatives, real estate-related securities and inflation-indexed securities. Alternative investment strategies that may be pursued by the Fund directly or indirectly through investment in other registered investment companies include (i) long/short equity strategies through which the Fund takes long positions in certain securities in the expectation that they will increase in value and takes short positions in other securities in the expectation that they will decrease in value; (ii) strategies that consider macroeconomic and technical factors to identify and exploit opportunities across global asset classes; and (iii) event-driven strategies that invest in the securities of companies that are expected to
| | |
| |
| 4 | AB ALL MARKET TOTAL RETURN PORTFOLIO | | abfunds.com |
(continued on next page)
become the subject of major corporate events and companies in which an active role in company management has been taken or sought by a third-party investor.
The Adviser will adjust the Fund’s asset class exposure utilizing both fundamental analysis and the Adviser’s Dynamic Asset Allocation (“DAA”) approach. DAA comprises a series of analytical and forecasting tools employed by the Adviser to gauge fluctuations in the risk/return profile of various asset classes. DAA seeks to adjust the Fund’s investment exposure in changing market conditions and thereby reduce overall portfolio volatility by mitigating the effects of market fluctuations, while preserving consistent long-term return potential. For example, the Adviser may seek to reduce the Fund’s risk exposure to one or more assets classes when DAA suggests that market risks relevant to those asset classes are rising but return opportunities are declining. In addition to merely increasing or decreasing asset class exposure by buying or selling securities of that asset class, the Adviser may pursue DAA implementation for the Fund by utilizing derivatives.
The Adviser intends to utilize a variety of derivatives in its management of the Fund. As noted above, the Adviser may use derivatives to gain exposure to various asset classes, and may cause the Fund to enter into derivatives in making the adjustments called for by DAA. As a result of the use of derivatives, the Fund will frequently be leveraged, with net investment exposure substantially in excess of net assets.
While the Fund may seek to gain exposure to physical commodities traded in the commodities markets through investments in a variety of derivative instruments, the Adviser expects that the Fund will seek to gain such exposure to commodities and commodities-related instruments and derivatives primarily through investments in AB All Market Total Return Portfolio (Cayman), Ltd., a wholly-owned subsidiary of the Fund organized under the laws of the Cayman Islands (the “Subsidiary”). The Subsidiary is advised by the Adviser and has the same investment objective and substantially similar investment policies and restrictions as the Fund except that the Subsidiary, unlike the Fund, may invest, without limitation, in commodities and commodities-related instruments. The Fund will be subject to the risks associated with the commodities, derivatives and other instruments in which the Subsidiary invests, to the extent of its investment in the Subsidiary. The Fund limits its investment in the Subsidiary to no more than 25% of its total assets. Investment in the Subsidiary is expected to provide the Fund with commodity exposure within the limitations of federal tax requirements that apply to the Fund.
Currency exchange rate fluctuations can have a dramatic impact on returns. The Fund’s foreign currency exposures will come from
(continued on next page)
| | |
| |
| abfunds.com | | AB ALL MARKET TOTAL RETURN PORTFOLIO | 5 |
investment in securities priced or denominated in foreign currencies and from direct holdings in foreign currencies and currency-related derivatives. The Adviser may seek to hedge all or a portion of the currency exposure resulting from Fund investments or decide not to hedge this exposure. The Adviser may seek investment opportunities by taking long or short positions in currencies through the use of currency-related derivatives.
| | |
| |
| 6 | AB ALL MARKET TOTAL RETURN PORTFOLIO | | abfunds.com |
DISCLOSURES AND RISKS
Benchmark Disclosure
All indices are unmanaged and do not reflect fees and expenses associated with the active management of a mutual fund portfolio. The MSCI ACWI (net, free float-adjusted, market capitalization weighted) represents the equity market performance of developed and emerging markets. The Bloomberg Barclays Global Aggregate Bond Index (USD hedged) represents the performance of global investment-grade developed fixed-income markets, hedged to the US dollar. MSCI makes no express or implied warranties or representations, and shall have no liability whatsoever with respect to any MSCI data contained herein. The MSCI data may not be further redistributed or used as a basis for other indices, any securities or financial products. This report is not approved, reviewed or produced by MSCI. Net returns include the reinvestment of dividends after deduction of non-US withholding tax. An investor cannot invest directly in an index or average, and their results are not indicative of the performance for any specific investment, including the Fund.
A Word About Risk
Market Risk: The value of the Fund’s assets will fluctuate as the stock, bond or commodities markets fluctuate. The value of its investments may decline, sometimes rapidly and unpredictably, simply because of economic changes or other events that affect large portions of the market. It includes the risk that a particular style of investing, such as growth or value, may be underperforming the stock market generally.
Allocation Risk: The allocation of investments among different investment styles, such as equity or debt, growth or value, US or non-US securities, or diversification strategies, may have a more significant effect on the Fund’s net asset value (“NAV”) when one of these investments is performing more poorly than another.
Credit Risk: An issuer or guarantor of a fixed-income security, or the counterparty to a derivatives or other contract, may be unable or unwilling to make timely payments of interest or principal, or to otherwise honor its obligations. The issuer or guarantor may default, causing a loss of the full principal amount of a security and accrued interest. The degree of risk for a particular security may be reflected in its credit rating. There is the possibility that the credit rating of a fixed-income security may be downgraded after purchase, which may adversely affect the value of the security. Investments in fixed-income securities with lower ratings (commonly known as “junk bonds”) are subject to a higher probability that an issuer will default or fail to meet its payment obligations.
High-Yield Debt Securities Risk: Investments in fixed-income securities with lower ratings (commonly known as “junk bonds”) tend to have a higher probability that an issuer will default or fail to meet its payment obligations.
| | |
| |
| abfunds.com | | AB ALL MARKET TOTAL RETURN PORTFOLIO | 7 |
DISCLOSURES AND RISKS(continued)
These securities may be subject to greater price volatility due to such factors as specific corporate developments, interest-rate sensitivity, negative perceptions of the junk bond market generally and less secondary market liquidity.
Interest-Rate Risk: Changes in interest rates will affect the value of the Fund’s investments in fixed-income securities. When interest rates rise, the value of existing investments in fixed-income securities tends to fall and this decrease in value may not be offset by higher income from new investments. Interest-rate risk is generally greater for fixed-income securities with longer maturities or durations.
Inflation Risk: This is the risk that the value of assets or income from investments will be less in the future as inflation decreases the value of money. As inflation increases, the value of the Fund’s assets can decline as can the value of the Fund’s distributions. This risk is significantly greater for fixed-income securities with longer maturities.
Foreign (Non-US) Risk: Investments in securities of non-US issuers may involve more risk than those of US issuers. These securities may fluctuate more widely in price and may be less liquid due to adverse market, economic, political, regulatory or other factors.
Currency Risk: Fluctuations in currency exchange rates may negatively affect the value of the Fund’s investments or reduce its returns.
Emerging-Market Risk: Investments in emerging-market countries may have more risk because the markets are less developed and less liquid as well as being subject to increased economic, political, regulatory or other uncertainties.
Alternative Investments Risk: Many alternative investments can be volatile and may be illiquid. Their performance may have little correlation with the performance of equity or fixed-income markets, and they may not perform in accordance with expectations.
Capitalization Risk: Investments in small- and mid-capitalization companies may be more volatile than investments in large-capitalization companies. Investments in small-capitalization companies may have additional risks because these companies have limited product lines, markets or financial resources.
Derivatives Risk: Derivatives may be illiquid, difficult to price, and leveraged so that small changes may produce disproportionate losses for the Fund, and may be subject to counterparty risk to a greater degree than more traditional investments.
| | |
| |
| 8 | AB ALL MARKET TOTAL RETURN PORTFOLIO | | abfunds.com |
DISCLOSURES AND RISKS(continued)
Leverage Risk: To the extent the Fund uses leveraging techniques, its NAV may be more volatile because leverage tends to exaggerate the effect of changes in interest rates and any increase or decrease in the value of the Fund’s investments.
Commodity Risk: Investing in commodities and commodity-linked derivative instruments may subject the Fund to greater volatility than investments in traditional securities. The value of commodity-linked derivative instruments may be affected by overall market movements, commodity index volatility, changes in interest rates, or factors affecting a particular industry or commodity, such as drought, floods, weather, livestock disease, embargoes, tariffs and international economic, political and regulatory developments.
Subsidiary Risk: By investing in the Subsidiary, the Fund is indirectly exposed to the risks associated with the Subsidiary. The derivatives and other investments held by the Subsidiary are generally similar to those that are permitted to be held by the Fund and are subject to the same risks that apply to similar investments if held directly by the Fund. The Subsidiary is not registered under the Investment Company Act of 1940, as amended (the “1940 Act”), and, unless otherwise noted in the prospectus, is not subject to all of the investor protections of the 1940 Act. However, the Fund wholly owns and controls the Subsidiary, and the Fund and the Subsidiary are managed by the Adviser, making it unlikely the Subsidiary will take actions contrary to the interests of the Fund or its shareholders. In addition, changes in federal tax laws applicable to the Fund or interpretations thereof could limit the Fund’s ability to gain exposure to commodities investments through investments in the Subsidiary.
Short Sale Risk: The Fund is subject to short sale risk because it may engage in short sales either directly or indirectly through investment in the Underlying Portfolio. Short sales involve the risk that the Fund or Underlying Portfolio will incur a loss by subsequently buying a security at a higher price than the price at which it sold the security. The amount of such loss is theoretically unlimited, as it will be based on the increase in value of the security sold short. In contrast, the risk of loss from a long position is limited to the Fund’s or Underlying Portfolio’s investment in the security, because the price of the security cannot fall below zero. The Fund or Underlying Portfolio may not always be able to close out a short position on favorable terms.
Management Risk: The Fund is subject to management risk because it is an actively managed investment fund. The Adviser will apply its investment techniques and risk analyses in making investment decisions for the Fund, but there is no guarantee that its techniques will produce the intended results.
| | |
| |
| abfunds.com | | AB ALL MARKET TOTAL RETURN PORTFOLIO | 9 |
DISCLOSURES AND RISKS(continued)
These risks are fully discussed in the Fund’s prospectus. As with all investments, you may lose money by investing in the Fund.
An Important Note About Historical Performance
The investment return and principal value of an investment in the Fund will fluctuate as the prices of the individual securities in which it invests fluctuate, so that your shares, when redeemed, may be worth more or less than their original cost. Performance shown in this report represents past performance and does not guarantee future results. Current performance may be lower or higher than the performance information shown. You may obtain performance information current to the most recent month-end by visiting www.abfunds.com. The performance shown for periods prior to April 24, 2017 is based on the Fund’s prior principal strategies and may not be representative of the Fund’s performance under its current principal strategies.
All fees and expenses related to the operation of the Fund have been deducted. NAV returns do not reflect sales charges; if sales charges were reflected, the Fund’s quoted performance would be lower. SEC returns reflect the applicable sales charges for each share class: a 4.25% maximum front-end sales charge for Class A shares; the applicable contingent deferred sales charge for Class B shares (4% year 1, 3% year 2, 2% year 3, 1% year 4) and a 1%1-year contingent deferred sales charge for Class C shares. Returns for the different share classes will vary due to different expenses associated with each class. Performance assumes reinvestment of distributions and does not account for taxes.
| | |
| |
| 10 | AB ALL MARKET TOTAL RETURN PORTFOLIO | | abfunds.com |
HISTORICAL PERFORMANCE
AVERAGE ANNUAL RETURNS AS OF FEBRUARY 28, 2019(unaudited)
| | | | | | | | |
| | |
| | | NAV
Returns | | | SEC Returns
(reflects applicable
sales charges) | |
| | |
| CLASS A SHARES | | | | | | | | |
| | |
| 1 Year | | | 1.10% | | | | -3.22% | |
| | |
| 5 Years | | | 3.38% | | | | 2.48% | |
| | |
| 10 Years | | | 9.40% | | | | 8.93% | |
| | |
| CLASS B SHARES | | | | | | | | |
| | |
| 1 Year | | | 0.41% | | | | -3.59% | |
| | |
| 5 Years | | | 2.61% | | | | 2.61% | |
| | |
| 10 Years1 | | | 8.76% | | | | 8.76% | |
| | |
| CLASS C SHARES | | | | | | | | |
| | |
| 1 Year | | | 0.35% | | | | -0.65% | |
| | |
| 5 Years | | | 2.61% | | | | 2.61% | |
| | |
| 10 Years | | | 8.61% | | | | 8.61% | |
| | |
| ADVISOR CLASS SHARES2 | | | | | | | | |
| | |
| 1 Year | | | 1.37% | | | | 1.37% | |
| | |
| 5 Years | | | 3.63% | | | | 3.63% | |
| | |
| 10 Years | | | 9.71% | | | | 9.71% | |
| | |
| CLASS R SHARES2 | | | | | | | | |
| | |
| 1 Year | | | 0.69% | | | | 0.69% | |
| | |
| 5 Years | | | 2.96% | | | | 2.96% | |
| | |
| 10 Years | | | 8.98% | | | | 8.98% | |
| | |
| CLASS K SHARES2 | | | | | | | | |
| | |
| 1 Year | | | 1.03% | | | | 1.03% | |
| | |
| 5 Years | | | 3.28% | | | | 3.28% | |
| | |
| 10 Years | | | 9.32% | | | | 9.32% | |
| | |
| CLASS I SHARES2 | | | | | | | | |
| | |
| 1 Year | | | 1.35% | | | | 1.35% | |
| | |
| 5 Years | | | 3.62% | | | | 3.62% | |
| | |
| 10 Years | | | 9.69% | | | | 9.69% | |
The Fund’s current prospectus fee table shows the Fund’s total annual operating expense ratios as 1.23%, 2.00%, 1.98%, 0.98%, 1.64%, 1.33% and 1.01% for Class A, Class B, Class C, Advisor Class, Class R, Class K and Class I shares, respectively. The Financial Highlights section of this report sets forth expense ratio data for the current reporting period; the expense ratios shown above may differ from the expense ratios in the Financial Highlights section since they are based on different time periods.
| 1 | Assumes conversion of Class B shares into Class A shares after eight years. |
| 2 | These share classes are offered at NAV to eligible investors and their SEC returns are the same as their NAV returns. Please note that these share classes are for investors purchasing shares through accounts established under certain fee-based programs sponsored and maintained by certain broker-dealers and financial intermediaries, institutional pension plans and/or investment advisory clients of, and certain other persons associated with, the Adviser and its affiliates or the Fund. |
| | |
| |
| abfunds.com | | AB ALL MARKET TOTAL RETURN PORTFOLIO | 11 |
HISTORICAL PERFORMANCE(continued)
SEC AVERAGE ANNUAL RETURNS
AS OF THE MOST RECENT CALENDAR QUARTER-END
MARCH 31, 2019(unaudited)
| | | | |
| |
| | | SEC Returns
(reflects applicable
sales charges) | |
| |
| CLASS A SHARES | | | | |
| |
| 1 Year | | | -2.16% | |
| |
| 5 Years | | | 2.80% | |
| |
| 10 Years | | | 8.42% | |
| |
| CLASS B SHARES | | | | |
| |
| 1 Year | | | -2.57% | |
| |
| 5 Years | | | 2.92% | |
| |
| 10 Years1 | | | 8.25% | |
| |
| CLASS C SHARES | | | | |
| |
| 1 Year | | | 0.45% | |
| |
| 5 Years | | | 2.91% | |
| |
| 10 Years | | | 8.10% | |
| |
| ADVISOR CLASS SHARES2 | | | | |
| |
| 1 Year | | | 2.45% | |
| |
| 5 Years | | | 3.95% | |
| |
| 10 Years | | | 9.19% | |
| |
| CLASS R SHARES2 | | | | |
| |
| 1 Year | | | 1.72% | |
| |
| 5 Years | | | 3.26% | |
| |
| 10 Years | | | 8.46% | |
| |
| CLASS K SHARES2 | | | | |
| |
| 1 Year | | | 2.06% | |
| |
| 5 Years | | | 3.59% | |
| |
| 10 Years | | | 8.81% | |
| |
| CLASS I SHARES2 | | | | |
| |
| 1 Year | | | 2.35% | |
| |
| 5 Years | | | 3.92% | |
| |
| 10 Years | | | 9.16% | |
| 1 | Assumes conversion of Class B shares into Class A shares after eight years. |
| 2 | Please note that these share classes are for investors purchasing shares through accounts established under certain fee-based programs sponsored and maintained by certain broker-dealers and financial intermediaries, institutional pension plans and/or investment advisory clients of, and certain other persons associated with, the Adviser and its affiliates or the Fund. |
| | |
| |
| 12 | AB ALL MARKET TOTAL RETURN PORTFOLIO | | abfunds.com |
EXPENSE EXAMPLE
(unaudited)
As a shareholder of the Fund, you incur two types of costs: (1) transaction costs, including sales charges (loads) on purchase payments, contingent deferred sales charges on redemptions and (2) ongoing costs, including management fees; distribution(12b-1) fees; and other Fund expenses. This example is intended to help you understand your ongoing costs (in dollars) of investing in the Fund and to compare these costs with the ongoing costs of investing in other mutual funds.
The Example is based on an investment of $1,000 invested at the beginning of the period and held for the entire period as indicated below.
Actual Expenses
The table below provides information about actual account values and actual expenses. You may use the information, together with the amount you invested, to estimate the expenses that you paid over the period. Simply divide your account value by $1,000 (for example, an $8,600 account value divided by $1,000 = 8.6), then multiply the result by the number under the heading entitled “Expenses Paid During Period” to estimate the expenses you paid on your account during this period.
Hypothetical Example for Comparison Purposes
The table below also provides information about hypothetical account values and hypothetical expenses based on the Fund’s actual expense ratio and an assumed annual rate of return of 5% before expenses, which is not the Fund’s actual return. The hypothetical account values and expenses may not be used to estimate the actual ending account balance or expenses you paid for the period. You may use this information to compare the ongoing costs of investing in the Fund and other funds by comparing this 5% hypothetical example with the 5% hypothetical examples that appear in the shareholder reports of other funds.
Please note that the expenses shown in the table are meant to highlight your ongoing costs only and do not reflect any transactional costs, such as sales charges (loads), or contingent deferred sales charges on redemptions. Therefore, the hypothetical example is useful in comparing ongoing costs only, and will not help you determine the relative total costs of owning different funds. In addition, if these transactional costs were included, your costs would have been higher.
| | |
| |
| abfunds.com | | AB ALL MARKET TOTAL RETURN PORTFOLIO | 13 |
EXPENSE EXAMPLE(continued)
| | | | | | | | | | | | | | | | | | | | | | | | |
| | | Beginning
Account
Value
September 1,
2018 | | | Ending
Account
Value
February 28,
2019 | | | Expenses
Paid
During
Period* | | | Annualized
Expense
Ratio* | | | Total
Expenses
Paid
During
Period+ | | | Total
Annualized
Expense
Ratio+ | |
| Class A | | | | | | | | | | | | | | | | |
Actual | | $ | 1,000 | | | $ | 994.60 | | | $ | 4.45 | | | | 0.90 | % | | $ | 5.09 | | | | 1.03 | % |
Hypothetical** | | $ | 1,000 | | | $ | 1,020.33 | | | $ | 4.51 | | | | 0.90 | % | | $ | 5.16 | | | | 1.03 | % |
| Class B | | | | | | | | | | | | | | | | |
Actual | | $ | 1,000 | | | $ | 991.90 | | | $ | 8.25 | | | | 1.67 | % | | $ | 8.89 | | | | 1.80 | % |
Hypothetical** | | $ | 1,000 | | | $ | 1,016.51 | | | $ | 8.35 | | | | 1.67 | % | | $ | 9.00 | | | | 1.80 | % |
| Class C | | | | | | | | | | | | | | | | |
Actual | | $ | 1,000 | | | $ | 991.10 | | | $ | 8.15 | | | | 1.65 | % | | $ | 8.79 | | | | 1.78 | % |
Hypothetical** | | $ | 1,000 | | | $ | 1,016.61 | | | $ | 8.25 | | | | 1.65 | % | | $ | 8.90 | | | | 1.78 | % |
| Advisor Class | | | | | | | | | | | | | |
Actual | | $ | 1,000 | | | $ | 996.00 | | | $ | 3.22 | | | | 0.65 | % | | $ | 3.86 | | | | 0.78 | % |
Hypothetical** | | $ | 1,000 | | | $ | 1,021.57 | | | $ | 3.26 | | | | 0.65 | % | | $ | 3.91 | | | | 0.78 | % |
| Class R | | | | | | | | | | | | | | | | |
Actual | | $ | 1,000 | | | $ | 993.20 | | | $ | 6.47 | | | | 1.31 | % | | $ | 7.12 | | | | 1.44 | % |
Hypothetical** | | $ | 1,000 | | | $ | 1,018.30 | | | $ | 6.56 | | | | 1.31 | % | | $ | 7.20 | | | | 1.44 | % |
| Class K | | | | | | | | | | | | | | | | |
Actual | | $ | 1,000 | | | $ | 995.30 | | | $ | 4.90 | | | | 0.99 | % | | $ | 5.54 | | | | 1.12 | % |
Hypothetical** | | $ | 1,000 | | | $ | 1,019.89 | | | $ | 4.96 | | | | 0.99 | % | | $ | 5.61 | | | | 1.12 | % |
| Class I | | | | | | | | | | | | | | | | |
Actual | | $ | 1,000 | | | $ | 996.70 | | | $ | 3.32 | | | | 0.67 | % | | $ | 3.96 | | | | 0.80 | % |
Hypothetical** | | $ | 1,000 | | | $ | 1,021.47 | | | $ | 3.36 | | | | 0.67 | % | | $ | 4.01 | | | | 0.80 | % |
| * | Expenses are equal to the classes’ annualized expense ratios, multiplied by the average account value over the period, multiplied by 181/365 (to reflect the one-half year period). |
| ** | Assumes 5% annual return before expenses. |
| + | In connection with the Fund’s investments in affiliated/unaffiliated underlying portfolios, the Fund incurs no direct expenses, but bears proportionate shares of the fees and expenses (i.e., operating, administrative and investment advisory fees) of the affiliated/unaffiliated underlying portfolios. The Adviser has contractually agreed to waive its fees from the Fund in an amount equal to the Fund’s pro rata share of certain acquired fund fees and expenses of the affiliated underlying portfolios. The Fund’s total expenses are equal to the classes’ annualized expense ratio plus the Fund’s pro rata share of the weighted average expense ratio of the affiliated/unaffiliated underlying portfolios in which it invests, multiplied by the average account value over the period, multiplied by 181/365 (to reflect the one-half year period). |
| | |
| |
| 14 | AB ALL MARKET TOTAL RETURN PORTFOLIO | | abfunds.com |
PORTFOLIO SUMMARY
February 28, 2019(unaudited)
PORTFOLIO STATISTICS
Net Assets ($mil): $724.2
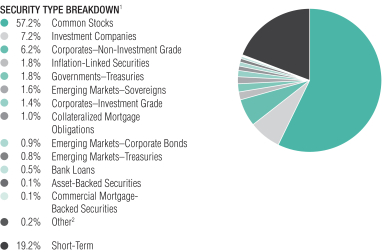
| 1 | All data are as of February 28, 2019. The Fund’s security type breakdown is expressed as a percentage of total investments (excluding security lending collateral) and may vary over time. The Fund also enters into derivative transactions, which may be used for hedging or investment purposes (see “Consolidated Portfolio of Investments” section of the report for additional details). |
| 2 | “Other” represents less than 0.1% weightings in the following security types: Collateralized Loan Obligations, Local Governments–Regional Bonds, Local Governments–US Municipal Bonds, Mortgage Pass-Throughs, Options Purchased–Calls, Options Purchased–Puts, Preferred Stocks, Quasi-Sovereigns and Warrants. |
| | |
| |
| abfunds.com | | AB ALL MARKET TOTAL RETURN PORTFOLIO | 15 |
CONSOLIDATED PORTFOLIO OF INVESTMENTS
February 28, 2019(unaudited)
| | | | | | | | | | | | |
| Company | | | | | Shares | | | U.S. $ Value | |
| |
COMMON STOCKS – 56.1% | | | | | | | | | | | | |
Information Technology – 11.9% | | | | | | | | | | | | |
Communications Equipment – 0.6% | | | | | | | | | | | | |
ARRIS International PLC(a) | | | | | | | 48,100 | | | $ | 1,523,808 | |
F5 Networks, Inc.(a) | | | | | | | 633 | | | | 106,433 | |
Finisar Corp.(a) | | | | | | | 62,449 | | | | 1,529,376 | |
Juniper Networks, Inc. | | | | | | | 25,012 | | | | 677,325 | |
Telefonaktiebolaget LM Ericsson – Class B | | | | | | | 16,023 | | | | 146,053 | |
| | | | | | | | | | | | |
| | | | | | | | | | | 3,982,995 | |
| | | | | | | | | | | | |
Electronic Equipment, Instruments & Components – 0.7% | | | | | | | | | | | | |
Amphenol Corp. – Class A | | | | | | | 45,938 | | | | 4,316,794 | |
Hitachi Ltd. | | | | | | | 9,400 | | | | 282,567 | |
IPG Photonics Corp.(a) | | | | | | | 5,148 | | | | 798,095 | |
| | | | | | | | | | | | |
| | | | | | | | | | | 5,397,456 | |
| | | | | | | | | | | | |
IT Services – 3.6% | | | | | | | | | | | | |
Accenture PLC – Class A | | | | | | | 270 | | | | 43,573 | |
Akamai Technologies, Inc.(a) | | | | | | | 10,672 | | | | 743,411 | |
Amadeus IT Group SA – Class A | | | | | | | 13,050 | | | | 981,651 | |
Amdocs Ltd. | | | | | | | 6,967 | | | | 387,156 | |
Automatic Data Processing, Inc. | | | | | | | 16,715 | | | | 2,557,896 | |
Booz Allen Hamilton Holding Corp. | | | | | | | 29,666 | | | | 1,568,145 | |
Capgemini SE | | | | | | | 6,890 | | | | 823,548 | |
CGI, Inc.(a) | | | | | | | 5,204 | | | | 348,911 | |
Cognizant Technology Solutions Corp. – Class A | | | | | | | 34,568 | | | | 2,453,637 | |
Fidelity National Information Services, Inc. | | | | | | | 6,760 | | | | 731,094 | |
First Data Corp. – Class A(a) | | | | | | | 58,627 | | | | 1,473,883 | |
Goodman Networks, Inc.(a)(b)(c)(d) | | | | | | | 3,005 | | | | – 0 | – |
Luxoft Holding, Inc.(a) | | | | | | | 12,862 | | | | 749,726 | |
Mastercard, Inc. – Class A | | | | | | | 32,340 | | | | 7,269,061 | |
Paychex, Inc. | | | | | | | 18,510 | | | | 1,425,640 | |
Total System Services, Inc. | | | | | | | 7,890 | | | | 744,816 | |
Visa, Inc. – Class A | | | | | | | 27,188 | | | | 4,027,087 | |
| | | | | | | | | | | | |
| | | | | | | | | | | 26,329,235 | |
| | | | | | | | | | | | |
Semiconductors & Semiconductor Equipment – 1.5% | | | | | | | | | | | | |
ASML Holding NV | | | | | | | 6,840 | | | | 1,251,286 | |
Integrated Device Technology, Inc.(a) | | | | | | | 30,794 | | | | 1,488,274 | |
Intel Corp. | | | | | | | 47,121 | | | | 2,495,528 | |
KLA-Tencor Corp. | | | | | | | 6,263 | | | | 723,343 | |
NXP Semiconductors NV | | | | | | | 9,290 | | | | 848,363 | |
Taiwan Semiconductor Manufacturing Co., Ltd. (Sponsored ADR) | | | | | | | 24,210 | | | | 945,400 | |
Texas Instruments, Inc. | | | | | | | 7,023 | | | | 742,893 | |
| | |
| |
| 16 | AB ALL MARKET TOTAL RETURN PORTFOLIO | | abfunds.com |
CONSOLIDATED PORTFOLIO OF INVESTMENTS(continued)
| | | | | | | | | | | | |
| Company | | | | | Shares | | | U.S. $ Value | |
| |
Versum Materials, Inc. | | | | | | | 31,215 | | | $ | 1,529,535 | |
Xilinx, Inc. | | | | | | | 6,750 | | | | 845,775 | |
| | | | | | | | | | | | |
| | | | | | | | | | | 10,870,397 | |
| | | | | | | | | | | | |
Software – 4.4% | | | | | | | | | | | | |
Avaya Holdings Corp.(a) | | | | | | | 8,861 | | | | 137,257 | |
Cadence Design Systems, Inc.(a) | | | | | | | 15,303 | | | | 876,097 | |
Check Point Software Technologies Ltd.(a) | | | | | | | 12,430 | | | | 1,520,189 | |
Citrix Systems, Inc. | | | | | | | 6,685 | | | | 705,268 | |
Constellation Software, Inc./Canada | | | | | | | 1,526 | | | | 1,303,098 | |
Fortinet, Inc.(a) | | | | | | | 9,898 | | | | 859,047 | |
Gemalto NV(a) | | | | | | | 18,706 | | | | 1,083,006 | |
Microsoft Corp. | | | | | | | 131,548 | | | | 14,737,323 | |
Nice Ltd.(a) | | | | | | | 19,050 | | | | 2,246,931 | |
Oracle Corp. | | | | | | | 48,488 | | | | 2,527,679 | |
Oracle Corp. Japan | | | | | | | 18,300 | | | | 1,368,635 | |
Red Hat, Inc.(a) | | | | | | | 9,195 | | | | 1,679,007 | |
SAP SE | | | | | | | 7,021 | | | | 751,433 | |
ServiceNow, Inc.(a) | | | | | | | 1,060 | | | | 253,806 | |
Symantec Corp. | | | | | | | 32,899 | | | | 739,899 | |
VMware, Inc. – Class A | | | | | | | 4,852 | | | | 833,622 | |
| | | | | | | | | | | | |
| | | | | | | | | | | 31,622,297 | |
| | | | | | | | | | | | |
Technology Hardware, Storage & Peripherals – 1.1% | | | | | | | | | | | | |
Apple, Inc. | | | | | | | 33,353 | | | | 5,775,072 | |
Samsung Electronics Co., Ltd. | | | | | | | 56,501 | | | | 2,261,273 | |
Travelport Worldwide Ltd. | | | | | | | 1,124 | | | | 17,669 | |
| | | | | | | | | | | | |
| | | | | | | | | | | 8,054,014 | |
| | | | | | | | | | | | |
| | | | | | | | | | | 86,256,394 | |
| | | | | | | | | | | | |
Financials – 9.3% | | | | | | | | | | | | |
Banks – 3.6% | | | | | | | | | | | | |
Banco do Brasil SA | | | | | | | 11,500 | | | | 154,919 | |
Bank LeumiLe-Israel BM | | | | | | | 85,600 | | | | 566,139 | |
Bank of America Corp. | | | | | | | 1,531 | | | | 44,522 | |
Bank of China Ltd. – Class A | | | | | | | 284,900 | | | | 163,589 | |
Bank of Communications Co., Ltd. – Class A | | | | | | | 59,800 | | | | 57,237 | |
Blue Hills Bancorp, Inc. | | | | | | | 42,663 | | | | 1,061,455 | |
China CITIC Bank Corp., Ltd. | | | | | | | 190,500 | | | | 186,633 | |
China Everbright Bank Co., Ltd. | | | | | | | 266,300 | | | | 168,435 | |
China Minsheng Banking Corp., Ltd. | | | | | | | 111,587 | | | | 108,973 | |
Chongqing Rural Commercial Bank Co., Ltd. – Class H | | | | | | | 281,000 | | | | 175,805 | |
Citigroup, Inc. | | | | | | | 25,644 | | | | 1,640,703 | |
DBS Group Holdings Ltd. | | | | | | | 161,200 | | | | 2,955,399 | |
DNB ASA | | | | | | | 28,577 | | | | 547,362 | |
| | |
| |
| abfunds.com | | AB ALL MARKET TOTAL RETURN PORTFOLIO | 17 |
CONSOLIDATED PORTFOLIO OF INVESTMENTS(continued)
| | | | | | | | | | | | |
| Company | | | | | Shares | | | U.S. $ Value | |
| |
Fidelity Southern Corp. | | | | | | | 4,140 | | | $ | 134,881 | |
Fifth Third Bancorp | | | | | | | 26,894 | | | | 741,737 | |
Hang Seng Bank Ltd. | | | | | | | 23,900 | | | | 591,856 | |
Industrial Bank of Korea | | | | | | | 10,544 | | | | 130,683 | |
JPMorgan Chase & Co. | | | | | | | 9,448 | | | | 985,993 | |
Jyske Bank A/S | | | | | | | 66,772 | | | | 2,614,605 | |
Mebuki Financial Group, Inc. | | | | | | | 92,900 | | | | 252,206 | |
Mitsubishi UFJ Financial Group, Inc. | | | | | | | 109,800 | | | | 569,795 | |
Oversea-Chinese Banking Corp., Ltd. | | | | | | | 22,900 | | | | 186,829 | |
PNC Financial Services Group, Inc. (The) | | | | | | | 3,790 | | | | 477,616 | |
Royal Bank of Canada | | | | | | | 25,625 | | | | 2,002,759 | |
SunTrust Banks, Inc. | | | | | | | 23,344 | | | | 1,514,325 | |
TCF Financial Corp. | | | | | | | 63,686 | | | | 1,458,409 | |
Toronto-Dominion Bank (The) | | | | | | | 29,769 | | | | 1,707,032 | |
Wells Fargo & Co. | | | | | | | 78,710 | | | | 3,926,842 | |
Westpac Banking Corp. | | | | | | | 40,870 | | | | 782,299 | |
| | | | | | | | | | | | |
| | | | | | | | | | | 25,909,038 | |
| | | | | | | | | | | | |
Capital Markets – 3.1% | | | | | | | | | | | | |
BinckBank NV | | | | | | | 105,178 | | | | 748,804 | |
BlackRock, Inc. – Class A | | | | | | | 2,050 | | | | 908,601 | |
Cboe Global Markets, Inc. | | | | | | | 6,373 | | | | 611,234 | |
Charles Schwab Corp. (The) | | | | | | | 125,370 | | | | 5,768,274 | |
China Cinda Asset Management Co., Ltd. – Class H | | | | | | | 609,000 | | | | 176,820 | |
China Huarong Asset Management Co., Ltd.(e) | | | | | | | 806,000 | | | | 184,805 | |
CME Group, Inc. – Class A | | | | | | | 6,260 | | | | 1,138,757 | |
Daiwa Securities Group, Inc. | | | | | | | 51,200 | | | | 259,971 | |
Intercontinental Exchange, Inc. | | | | | | | 13,910 | | | | 1,073,156 | |
Investment Technology Group, Inc. | | | | | | | 33,476 | | | | 1,011,979 | |
Julius Baer Group Ltd.(a) | | | | | | | 73,878 | | | | 3,219,009 | |
Korea Investment Holdings Co., Ltd.(a) | | | | | | | 2,722 | | | | 155,753 | |
Macquarie Group Ltd. | | | | | | | 3,990 | | | | 364,306 | |
Moody’s Corp. | | | | | | | 8,630 | | | | 1,494,026 | |
NH Investment & Securities Co., Ltd.(a) | | | | | | | 12,933 | | | | 149,791 | |
Partners Group Holding AG | | | | | | | 1,150 | | | | 830,896 | |
S&P Global, Inc. | | | | | | | 10,097 | | | | 2,023,136 | |
Singapore Exchange Ltd. | | | | | | | 439,400 | | | | 2,544,550 | |
| | | | | | | | | | | | |
| | | | | | | | | | | 22,663,868 | |
| | | | | | | | | | | | |
Consumer Finance – 0.1% | | | | | | | | | | | | |
Ally Financial, Inc. | | | | | | | 7,550 | | | | 204,530 | |
Synchrony Financial | | | | | | | 9,950 | | | | 324,469 | |
| | | | | | | | | | | | |
| | | | | | | | | | | 528,999 | |
| | | | | | | | | | | | |
Diversified Financial Services – 0.1% | | | | | | | | | | | | |
Berkshire Hathaway, Inc. – Class B(a) | | | | | | | 841 | | | | 169,293 | |
Far East Horizon Ltd. | | | | | | | 99,000 | | | | 110,480 | |
Pargesa Holding SA | | | | | | | 8,983 | | | | 737,001 | |
| | | | | | | | | | | | |
| | | | | | | | | | | 1,016,774 | |
| | | | | | | | | | | | |
| | |
| |
| 18 | AB ALL MARKET TOTAL RETURN PORTFOLIO | | abfunds.com |
CONSOLIDATED PORTFOLIO OF INVESTMENTS(continued)
| | | | | | | | | | | | |
| Company | | | | | Shares | | | U.S. $ Value | |
| |
Insurance – 2.4% | | | | | | | | | | | | |
Admiral Group PLC | | | | | | | 20,000 | | | $ | 579,126 | |
Aegon NV | | | | | | | 76,406 | | | | 409,964 | |
Arthur J Gallagher & Co. | | | | | | | 18,010 | | | | 1,445,843 | |
Athene Holding Ltd. – Class A(a) | | | | | | | 16,451 | | | | 732,892 | |
Direct Line Insurance Group PLC | | | | | | | 89,910 | | | | 425,045 | |
Everest Re Group Ltd. | | | | | | | 6,592 | | | | 1,490,517 | |
Fidelity National Financial, Inc. | | | | | | | 54,108 | | | | 1,898,650 | |
Japan Post Holdings Co., Ltd. | | | | | | | 24,800 | | | | 301,467 | |
Jardine Lloyd Thompson Group PLC | | | | | | | 59,396 | | | | 1,503,120 | |
Legal & General Group PLC | | | | | | | 154,943 | | | | 576,563 | |
Lincoln National Corp. | | | | | | | 11,363 | | | | 710,415 | |
Marsh & McLennan Cos., Inc. | | | | | | | 6,320 | | | | 587,886 | |
MetLife, Inc. | | | | | | | 7,435 | | | | 335,988 | |
NN Group NV | | | | | | | 45,320 | | | | 1,972,578 | |
PICC Property & Casualty Co., Ltd. – Class H | | | | | | | 152,000 | | | | 181,928 | |
Poste Italiane SpA(e) | | | | | | | 44,623 | | | | 402,299 | |
Prudential Financial, Inc. | | | | | | | 8,558 | | | | 820,284 | |
Sampo Oyj – Class A | | | | | | | 10,690 | | | | 514,293 | |
Stewart Information Services Corp. | | | | | | | 29,655 | | | | 1,273,089 | |
Swiss Re AG | | | | | | | 8,480 | | | | 838,249 | |
| | | | | | | | | | | | |
| | | | | | | | | | | 17,000,196 | |
| | | | | | | | | | | | |
| | | | | | | | | | | 67,118,875 | |
| | | | | | | | | | | | |
Health Care – 8.0% | | | | | | | | | | | | |
Biotechnology – 1.5% | | | | | | | | | | | | |
Amgen, Inc. | | | | | | | 3,893 | | | | 739,982 | |
Celgene Corp.(a) | | | | | | | 59,109 | | | | 4,913,140 | |
Gilead Sciences, Inc. | | | | | | | 58,760 | | | | 3,820,575 | |
Spark Therapeutics, Inc.(a) | | | | | | | 4,403 | | | | 498,860 | |
Vertex Pharmaceuticals, Inc.(a) | | | | | | | 3,080 | | | | 581,350 | |
| | | | | | | | | | | | |
| | | | | | | | | | | 10,553,907 | |
| | | | | | | | | | | | |
Health Care Equipment & Supplies – 1.6% | | | | | | | | | | | | |
Abbott Laboratories | | | | | | | 89,869 | | | | 6,975,632 | |
Baxter International, Inc. | | | | | | | 10,858 | | | | 811,418 | |
Koninklijke Philips NV | | | | | | | 11,693 | | | | 465,290 | |
Medtronic PLC | | | | | | | 10,333 | | | | 935,137 | |
ResMed, Inc. | | | | | | | 268 | | | | 27,451 | |
Stryker Corp. | | | | | | | 1,210 | | | | 228,097 | |
West Pharmaceutical Services, Inc. | | | | | | | 18,523 | | | | 1,940,284 | |
| | | | | | | | | | | | |
| | | | | | | | | | | 11,383,309 | |
| | | | | | | | | | | | |
Health Care Providers & Services – 1.2% | | | | | | | | | | | | |
Anthem, Inc. | | | | | | | 19,740 | | | | 5,936,410 | |
Centene Corp.(a) | | | | | | | 11,002 | | | | 669,912 | |
CVS Health Corp. | | | | | | | 774 | | | | 44,760 | |
Humana, Inc. | | | | | | | 1,186 | | | | 338,057 | |
| | |
| |
| abfunds.com | | AB ALL MARKET TOTAL RETURN PORTFOLIO | 19 |
CONSOLIDATED PORTFOLIO OF INVESTMENTS(continued)
| | | | | | | | | | | | |
| Company | | | | | Shares | | | U.S. $ Value | |
| |
McKesson Corp. | | | | | | | 5,951 | | | $ | 756,729 | |
UnitedHealth Group, Inc. | | | | | | | 3,893 | | | | 942,963 | |
| | | | | | | | | | | | |
| | | | | | | | | | | 8,688,831 | |
| | | | | | | | | | | | |
Life Sciences Tools & Services – 0.8% | | | | | | | | | | | | |
IQVIA Holdings, Inc.(a) | | | | | | | 33,287 | | | | 4,663,509 | |
Pacific Biosciences of California, Inc.(a) | | | | | | | 103,085 | | | | 753,551 | |
Sartorius Stedim Biotech | | | | | | | 3,475 | | | | 408,751 | |
| | | | | | | | | | | | |
| | | | | | | | | | | 5,825,811 | |
| | | | | | | | | | | | |
Pharmaceuticals – 2.9% | | | | | | | | | | | | |
Astellas Pharma, Inc. | | | | | | | 48,800 | | | | 756,625 | |
Bausch Health Cos., Inc.(a) | | | | | | | 13,200 | | | | 313,562 | |
Bristol-Myers Squibb Co. | | | | | | | 18,510 | | | | 956,227 | |
BTG PLC(a) | | | | | | | 23,345 | | | | 257,927 | |
Eli Lilly & Co. | | | | | | | 7,958 | | | | 1,005,016 | |
Endo International PLC(a) | | | | | | | 3,078 | | | | 33,827 | |
Horizon Pharma PLC(a) | | | | | | | 1,435 | | | | 41,629 | |
Johnson & Johnson | | | | | | | 7,577 | | | | 1,035,321 | |
Merck & Co., Inc. | | | | | | | 39,418 | | | | 3,204,290 | |
Novo Nordisk A/S – Class B | | | | | | | 21,520 | | | | 1,055,031 | |
Pfizer, Inc. | | | | | | | 62,296 | | | | 2,700,532 | |
Roche Holding AG | | | | | | | 15,526 | | | | 4,308,841 | |
Sanofi | | | | | | | 11,981 | | | | 999,088 | |
UCB SA | | | | | | | 4,608 | | | | 386,061 | |
Zoetis, Inc. | | | | | | | 45,990 | | | | 4,333,637 | |
| | | | | | | | | | | | |
| | | | | | | | | | | 21,387,614 | |
| | | | | | | | | | | | |
| | | | | | | | | | | 57,839,472 | |
| | | | | | | | | | | | |
Consumer Discretionary – 6.8% | | | | | | | | | | | | |
Auto Components – 0.6% | | | | | | | | | | | | |
Aptiv PLC | | | | | | | 48,460 | | | | 4,027,511 | |
Atd New Holdings, Inc.(a)(b)(c) | | | | | | | 2,609 | | | | 46,962 | |
| | | | | | | | | | | | |
| | | | | | | | | | | 4,074,473 | |
| | | | | | | | | | | | |
Automobiles – 0.0% | | | | | | | | | | | | |
BAIC Motor Corp., Ltd.(e) | | | | | | | 133,500 | | | | 84,857 | |
| | | | | | | | | | | | |
| | | |
Diversified Consumer Services – 0.8% | | | | | | | | | | | | |
H&R Block, Inc. | | | | | | | 27,729 | | | | 669,655 | |
Laureate Education, Inc. – Class A(a) | | | | | | | 3,231 | | | | 49,402 | |
Service Corp. International/US | | | | | | | 97,183 | | | | 4,017,545 | |
Sotheby’s(a) | | | | | | | 29,566 | | | | 1,297,061 | |
| | | | | | | | | | | | |
| | | | | | | | | | | 6,033,663 | |
| | | | | | | | | | | | |
Hotels, Restaurants & Leisure – 1.8% | | | | | | | | | | | | |
Aristocrat Leisure Ltd. | | | | | | | 60,970 | | | | 1,065,019 | |
Caesars Entertainment Corp.(a) | | | | | | | 5,492 | | | | 47,341 | |
Choice Hotels International, Inc. | | | | | | | 7,129 | | | | 569,179 | |
Compass Group PLC | | | | | | | 80,008 | | | | 1,766,979 | |
| | |
| |
| 20 | AB ALL MARKET TOTAL RETURN PORTFOLIO | | abfunds.com |
CONSOLIDATED PORTFOLIO OF INVESTMENTS(continued)
| | | | | | | | | | | | |
| Company | | | | | Shares | | | U.S. $ Value | |
| |
eDreams ODIGEO SA(a) | | | | | | | 29,487 | | | $ | 93,912 | |
Las Vegas Sands Corp. | | | | | | | 29,452 | | | | 1,809,236 | |
McDonald’s Corp. | | | | | | | 6,880 | | | | 1,264,819 | |
Starbucks Corp. | | | | | | | 91,868 | | | | 6,454,646 | |
| | | | | | | | | | | | |
| | | | | | | | | | | 13,071,131 | |
| | | | | | | | | | | | |
Household Durables – 0.1% | | | | | | | | | | | | |
Auto Trader Group PLC(e) | | | | | | | 100,510 | | | | 634,514 | |
Hovnanian Enterprises, Inc. – Class A(a) | | | | | | | 7,965 | | | | 5,393 | |
| | | | | | | | | | | | |
| | | | | | | | | | | 639,907 | |
| | | | | | | | | | | | |
Internet & Direct Marketing Retail – 1.0% | | | | | | | | | | | | |
Amazon.com, Inc.(a) | | | | | | | 1,075 | | | | 1,762,817 | |
Booking Holdings, Inc.(a) | | | | | | | 2,742 | | | | 4,653,284 | |
Nutrisystem, Inc. | | | | | | | 28,494 | | | | 1,233,220 | |
| | | | | | | | | | | | |
| | | | | | | | | | | 7,649,321 | |
| | | | | | | | | | | | |
Media – 0.2% | | | | | | | | | | | | |
Clear Channel Outdoor Holdings, Inc. – Class A(a) | | | | | | | 7,440 | | | | 40,771 | |
Tribune Media Co. – Class A | | | | | | | 32,438 | | | | 1,499,609 | |
| | | | | | | | | | | | |
| | | | | | | | | | | 1,540,380 | |
| | | | | | | | | | | | |
Multiline Retail – 0.3% | | | | | | | | | | | | |
Dollar General Corp. | | | | | | | 11,400 | | | | 1,350,444 | |
Lotte Shopping Co., Ltd. | | | | | | | 801 | | | | 135,954 | |
Next PLC | | | | | | | 8,032 | | | | 541,706 | |
| | | | | | | | | | | | |
| | | | | | | | | | | 2,028,104 | |
| | | | | | | | | | | | |
Specialty Retail – 1.7% | | | | | | | | | | | | |
AutoZone, Inc.(a) | | | | | | | 1,130 | | | | 1,061,036 | |
Home Depot, Inc. (The) | | | | | | | 12,027 | | | | 2,226,678 | |
O’Reilly Automotive, Inc.(a) | | | | | | | 2,256 | | | | 839,142 | |
Ross Stores, Inc. | | | | | | | 19,937 | | | | 1,890,626 | |
TJX Cos., Inc. (The) | | | | | | | 31,330 | | | | 1,606,916 | |
Ulta Salon Cosmetics & Fragrance, Inc.(a) | | | | | | | 14,628 | | | | 4,571,104 | |
| | | | | | | | | | | | |
| | | | | | | | | | | 12,195,502 | |
| | | | | | | | | | | | |
Textiles, Apparel & Luxury Goods – 0.3% | | | | | | | | | | | | |
Samsonite International SA(a)(e) | | | | | | | 659,700 | | | | 1,960,490 | |
| | | | | | | | | | | | |
| | | | | | | | | | | 49,277,828 | |
| | | | | | | | | | | | |
Industrials – 5.7% | | | | | | | | | | | | |
Aerospace & Defense – 1.3% | | | | | | | | | | | | |
Arconic, Inc. | | | | | | | 34,769 | | | | 642,879 | |
BAE Systems PLC | | | | | | | 96,250 | | | | 593,446 | |
Boeing Co. (The) | | | | | | | 4,190 | | | | 1,843,432 | |
Esterline Technologies Corp.(a) | | | | | | | 9,814 | | | | 1,194,855 | |
Harris Corp. | | | | | | | 4,660 | | | | 768,574 | |
L3 Technologies, Inc. | | | | | | | 7,382 | | | | 1,563,138 | |
| | |
| |
| abfunds.com | | AB ALL MARKET TOTAL RETURN PORTFOLIO | 21 |
CONSOLIDATED PORTFOLIO OF INVESTMENTS(continued)
| | | | | | | | | | | | |
| Company | | | | | Shares | | | U.S. $ Value | |
| |
Raytheon Co. | | | | | | | 12,120 | | | $ | 2,260,380 | |
Spirit AeroSystems Holdings, Inc. – Class A | | | | | | | 8,491 | | | | 838,911 | |
| | | | | | | | | | | | |
| | | | | | | | | | | 9,705,615 | |
| | | | | | | | | | | | |
Air Freight & Logistics – 0.1% | | | | | | | | | | | | |
CH Robinson Worldwide, Inc. | | | | | | | 5,956 | | | | 538,303 | |
Hyundai Glovis Co., Ltd. | | | | | | | 1,068 | | | | 132,295 | |
| | | | | | | | | | | | |
| | | | | | | | | | | 670,598 | |
| | | | | | | | | | | | |
Airlines – 0.2% | | | | | | | | | | | | |
Qantas Airways Ltd. | | | | | | | 207,000 | | | | 841,571 | |
United Continental Holdings, Inc.(a) | | | | | | | 8,070 | | | | 708,627 | |
| | | | | | | | | | | | |
| | | | | | | | | | | 1,550,198 | |
| | | | | | | | | | | | |
Building Products – 0.8% | | | | | | | | | | | | |
Allegion PLC | | | | | | | 45,248 | | | | 4,070,510 | |
Lennox International, Inc. | | | | | | | 530 | | | | 129,983 | |
LIXIL Group Corp. | | | | | | | 18,700 | | | | 253,343 | |
USG Corp. | | | | | | | 34,497 | | | | 1,487,166 | |
| | | | | | | | | | | | |
| | | | | | | | | | | 5,941,002 | |
| | | | | | | | | | | | |
Commercial Services & Supplies – 0.5% | | | | | | | | | | | | |
Republic Services, Inc. – Class A | | | | | | | 10,530 | | | | 825,868 | |
Secom Co., Ltd. | | | | | | | 28,400 | | | | 2,456,580 | |
Toppan Printing Co., Ltd. | | | | | | | 16,700 | | | | 266,014 | |
| | | | | | | | | | | | |
| | | | | | | | | | | 3,548,462 | |
| | | | | | | | | | | | |
Construction & Engineering – 0.1% | | | | | | | | | | | | |
Daelim Industrial Co., Ltd. | | | | | | | 1,826 | | | | 151,739 | |
GS Engineering & Construction Corp. | | | | | | | 4,040 | | | | 153,641 | |
Obayashi Corp. | | | | | | | 28,500 | | | | 277,799 | |
Willscot Corp.(c)(d) | | | | | | | 1,235 | | | | 12,585 | |
| | | | | | | | | | | | |
| | | | | | | | | | | 595,764 | |
| | | | | | | | | | | | |
Consumer Cyclical - Automotive – 0.0% | | | | | | | | | | | | |
Exide Technologies(a)(b)(d)(f) | | | | | | | 2,460 | | | | 172 | |
Exide Technologies/Old(a)(b)(d)(f) | | | | | | | 1,244 | | | | 87 | |
| | | | | | | | | | | | |
| | | | | | | | | | | 259 | |
| | | | | | | | | | | | |
Electrical Equipment – 0.0% | | | | | | | | | | | | |
Emerson Electric Co. | | | | | | | 1,156 | | | | 78,781 | |
| | | | | | | | | | | | |
| | | |
Industrial Conglomerates – 0.0% | | | | | | | | | | | | |
SK Holdings Co., Ltd. | | | | | | | 672 | | | | 162,821 | |
| | | | | | | | | | | | |
| | | |
Machinery – 0.9% | | | | | | | | | | | | |
Dover Corp. | | | | | | | 39,070 | | | | 3,537,007 | |
Kone Oyj – Class B(g) | | | | | | | 27,610 | | | | 1,348,983 | |
Mitsubishi Heavy Industries Ltd. | | | | | | | 7,500 | | | | 305,853 | |
PACCAR, Inc. | | | | | | | 11,560 | | | | 783,768 | |
Stanley Black & Decker, Inc. | | | | | | | 5,708 | | | | 755,911 | |
Weichai Power Co., Ltd. – Class H | | | | | | | 110,000 | | | | 153,146 | |
| | | | | | | | | | | | |
| | | | | | | | | | | 6,884,668 | |
| | | | | | | | | | | | |
| | |
| |
| 22 | AB ALL MARKET TOTAL RETURN PORTFOLIO | | abfunds.com |
CONSOLIDATED PORTFOLIO OF INVESTMENTS(continued)
| | | | | | | | | | | | |
| Company | | | | | Shares | | | U.S. $ Value | |
| |
Professional Services – 1.5% | | | | | | | | | | | | |
Experian PLC | | | | | | | 31,390 | | | $ | 816,600 | |
RELX PLC | | | | | | | 153,142 | | | | 3,515,290 | |
Robert Half International, Inc. | | | | | | | 10,960 | | | | 747,362 | |
Verisk Analytics, Inc. – Class A(a) | | | | | | | 34,270 | | | | 4,332,756 | |
Wolters Kluwer NV | | | | | | | 18,190 | | | | 1,198,656 | |
| | | | | | | | | | | | |
| | | | | | | | | | | 10,610,664 | |
| | | | | | | | | | | | |
Road & Rail – 0.1% | | | | | | | | | | | | |
ALD SA(e) | | | | | | | 43,783 | | | | 631,738 | |
| | | | | | | | | | | | |
| | | |
Trading Companies & Distributors – 0.0% | | | | | | | | | | | | |
Emeco Holdings Ltd.(a) | | | | | | | 4,397 | | | | 6,661 | |
| | | | | | | | | | | | |
| | | |
Transportation Infrastructure – 0.2% | | | | | | | | | | | | |
Airports of Thailand PCL | | | | | | | 71,900 | | | | 154,010 | |
Flughafen Zurich AG | | | | | | | 5,443 | | | | 969,046 | |
Zhejiang Expressway Co., Ltd. – Class H | | | | | | | 154,000 | | | | 160,719 | |
| | | | | | | | | | | | |
| | | | | | | | | | | 1,283,775 | |
| | | | | | | | | | | | |
| | | | | | | | | | | 41,671,006 | |
| | | | | | | | | | | | |
Communication Services – 5.6% | | | | | | | | | | | | |
Diversified Telecommunication Services – 0.9% | | | | | | | | | | | | |
China Communications Services Corp., Ltd. – Class H | | | | | | | 190,000 | | | | 191,144 | |
Elisa Oyj | | | | | | | 9,356 | | | | 392,582 | |
HKT Trust & HKT Ltd. – Class SS | | | | | | | 1,356,000 | | | | 2,117,846 | |
LG Uplus Corp. | | | | | | | 9,547 | | | | 127,146 | |
Nippon Telegraph & Telephone Corp. | | | | | | | 37,400 | | | | 1,616,527 | |
Spark New Zealand Ltd. | | | | | | | 102,876 | | | | 261,157 | |
Telenor ASA | | | | | | | 20,515 | | | | 400,080 | |
TELUS Corp. | | | | | | | 16,830 | | | | 611,326 | |
Verizon Communications, Inc. | | | | | | | 14,101 | | | | 802,629 | |
| | | | | | | | | | | | |
| | | | | | | | | | | 6,520,437 | |
| | | | | | | | | | | | |
Entertainment – 0.4% | | | | | | | | | | | | |
Daiichikosho Co., Ltd. | | | | | | | 12,600 | | | | 622,567 | |
Live Nation Entertainment, Inc.(a) | | | | | | | 12,631 | | | | 714,409 | |
NCSoft Corp. | | | | | | | 353 | | | | 144,739 | |
Netflix, Inc.(a) | | | | | | | 703 | | | | 251,744 | |
Twenty-First Century Fox, Inc. – Class B | | | | | | | 12,380 | | | | 620,981 | |
Viacom, Inc. – Class B | | | | | | | 23,725 | | | | 693,245 | |
| | | | | | | | | | | | |
| | | | | | | | | | | 3,047,685 | |
| | | | | | | | | | | | |
Interactive Media & Services – 2.2% | | | | | | | | | | | | |
Alphabet, Inc. – Class A(a) | | | | | | | 837 | | | | 942,922 | |
Alphabet, Inc. – Class C(a) | | | | | | | 9,075 | | | | 10,163,274 | |
Autohome, Inc. (ADR)(a)(g) | | | | | | | 6,560 | | | | 616,968 | |
Facebook, Inc. – Class A(a) | | | | | | | 26,740 | | | | 4,317,173 | |
Twitter, Inc.(a) | | | | | | | 3,170 | | | | 97,573 | |
| | | | | | | | | | | | |
| | | | | | | | | | | 16,137,910 | |
| | | | | | | | | | | | |
| | |
| |
| abfunds.com | | AB ALL MARKET TOTAL RETURN PORTFOLIO | 23 |
CONSOLIDATED PORTFOLIO OF INVESTMENTS(continued)
| | | | | | | | | | | | |
| Company | | | | | Shares | | | U.S. $ Value | |
| |
Media – 1.0% | | | | | | | | | | | | |
CBS Corp. – Class B | | | | | | | 14,198 | | | $ | 712,881 | |
Charter Communications, Inc. – Class A(a) | | | | | | | 193 | | | | 66,568 | |
Comcast Corp. – Class A | | | | | | | 32,438 | | | | 1,254,377 | |
DISH Network Corp. – Class A(a) | | | | | | | 609 | | | | 19,799 | |
Multichoice Group Ltd. | | | | | | | 12,910 | | | | 96,227 | |
Naspers Ltd. – Class N | | | | | | | 12,910 | | | | 2,784,287 | |
Omnicom Group, Inc. | | | | | | | 11,130 | | | | 842,541 | |
Quebecor, Inc. – Class B | | | | | | | 40,290 | | | | 978,815 | |
| | | | | | | | | | | | |
| | | | | | | | | | | 6,755,495 | |
| | | | | | | | | | | | |
Wireless Telecommunication Services – 1.1% | | | | | | | | | | | | |
China Mobile Ltd. | | | | | | | 124,000 | | | | 1,309,746 | |
DiGi.Com Bhd | | | | | | | 147,100 | | | | 164,233 | |
Globe Telecom, Inc. | | | | | | | 4,160 | | | | 152,620 | |
KDDI Corp. | | | | | | | 100,800 | | | | 2,436,304 | |
Millicom International Cellular SA | | | | | | | 11,028 | | | | 663,730 | |
SK Telecom Co., Ltd. | | | | | | | 603 | | | | 139,662 | |
SoftBank Group Corp. | | | | | | | 22,800 | | | | 2,115,710 | |
Sprint Corp.(a) | | | | | | | 189,563 | | | | 1,203,725 | |
| | | | | | | | | | | | |
| | | | | | | | | | | 8,185,730 | |
| | | | | | | | | | | | |
| | | | | | | | | | | 40,647,257 | |
| | | | | | | | | | | | |
Consumer Staples – 2.8% | | | | | | | | | | | | |
Beverages – 0.3% | | | | | | | | | | | | |
Ambev SA | | | | | | | 114,900 | | | | 527,063 | |
Coca-Cola Amatil Ltd. | | | | | | | 47,456 | | | | 268,342 | |
PepsiCo, Inc. | | | | | | | 5,830 | | | | 674,181 | |
Wuliangye Yibin Co., Ltd. – Class A | | | | | | | 75,190 | | | | 803,102 | |
| | | | | | | | | | | | |
| | | | | | | | | | | 2,272,688 | |
| | | | | | | | | | | | |
Food & Staples Retailing – 0.9% | | | | | | | | | | | | |
Casino Guichard Perrachon SA | | | | | | | 6,020 | | | | 318,338 | |
Colruyt SA | | | | | | | 3,817 | | | | 272,247 | |
Dairy Farm International Holdings Ltd. | | | | | | | 18,300 | | | | 163,808 | |
Empire Co., Ltd. – Class A | | | | | | | 13,972 | | | | 324,575 | |
Koninklijke Ahold Delhaize NV | | | | | | | 58,444 | | | | 1,506,232 | |
Kroger Co. (The) | | | | | | | 25,720 | | | | 754,368 | |
Seven & i Holdings Co., Ltd.(g) | | | | | | | 11,100 | | | | 488,529 | |
Southeastern Grocers, Inc. Npv(a)(b)(c)(d) | | | | | | | 2,013 | | | | 71,461 | |
Sysco Corp. | | | | | | | 11,220 | | | | 757,911 | |
Walgreens Boots Alliance, Inc. | | | | | | | 10,305 | | | | 733,613 | |
Walmart, Inc. | | | | | | | 14,650 | | | | 1,450,203 | |
| | | | | | | | | | | | |
| | | | | | | | | | | 6,841,285 | |
| | | | | | | | | | | | |
Food Products – 0.3% | | | | | | | | | | | | |
Danone SA | | | | | | | 9,315 | | | | 703,555 | |
Marine Harvest ASA(a)(g) | | | | | | | 17,245 | | | | 397,964 | |
| | |
| |
| 24 | AB ALL MARKET TOTAL RETURN PORTFOLIO | | abfunds.com |
CONSOLIDATED PORTFOLIO OF INVESTMENTS(continued)
| | | | | | | | | | | | |
| Company | | | | | Shares | | | U.S. $ Value | |
| |
Nestle Malaysia Bhd | | | | | | | 4,300 | | | $ | 156,265 | |
Salmar ASA | | | | | | | 18,950 | | | | 907,829 | |
| | | | | | | | | | | | |
| | | | | | | | | | | 2,165,613 | |
| | | | | | | | | | | | |
Household Products – 0.3% | | | | | | | | | | | | |
Kimberly-Clark Corp. | | | | | | | 718 | | | | 83,884 | |
Procter & Gamble Co. (The) | | | | | | | 24,150 | | | | 2,379,982 | |
| | | | | | | | | | | | |
| | | | | | | | | | | 2,463,866 | |
| | | | | | | | | | | | |
Personal Products – 0.3% | | | | | | | | | | | | |
L’Oreal SA | | | | | | | 4,942 | | | | 1,246,420 | |
Unilever PLC | | | | | | | 11,570 | | | | 615,962 | |
| | | | | | | | | | | | |
| | | | | | | | | | | 1,862,382 | |
| | | | | | | | | | | | |
Tobacco – 0.7% | | | | | | | | | | | | |
Altria Group, Inc. | | | | | | | 15,326 | | | | 803,236 | |
British American Tobacco PLC | | | | | | | 33,424 | | | | 1,225,427 | |
Imperial Brands PLC | | | | | | | 27,900 | | | | 929,693 | |
KT&G Corp. | | | | | | | 1,770 | | | | 165,932 | |
Philip Morris International, Inc. | | | | | | | 20,256 | | | | 1,761,057 | |
| | | | | | | | | | | | |
| | | | | | | | | | | 4,885,345 | |
| | | | | | | | | | | | |
| | | | | | | | | | | 20,491,179 | |
| | | | | | | | | | | | |
Energy – 2.0% | | | | | | | | | | | | |
Energy Equipment & Services – 0.1% | | | | | | | | | | | | |
Helmerich & Payne, Inc. | | | | | | | 12,490 | | | | 676,958 | |
| | | | | | | | | | | | |
| | | |
Oil, Gas & Consumable Fuels – 1.9% | | | | | | | | | | | | |
Berry Petroleum Corp. | | | | | | | 9,528 | | | | 121,291 | |
BP PLC | | | | | | | 30,721 | | | | 217,790 | |
CHC Group LLC(a)(f) | | | | | | | 2,966 | | | | 148 | |
Chevron Corp. | | | | | | | 5,027 | | | | 601,129 | |
Denbury Resources, Inc.(a) | | | | | | | 2,348 | | | | 4,508 | |
Encana Corp. | | | | | | | 213,272 | | | | 1,546,214 | |
Equinor ASA | | | | | | | 39,680 | | | | 892,481 | |
Exxon Mobil Corp. | | | | | | | 3,422 | | | | 270,441 | |
Galp Energia SGPS SA | | | | | | | 9,687 | | | | 158,823 | |
Gazprom PJSC (Sponsored ADR) | | | | | | | 33,560 | | | | 158,403 | |
GS Holdings Corp. | | | | | | | 3,130 | | | | 149,060 | |
Halcon Resources Corp.(a)(g) | | | | | | | 579 | | | | 869 | |
HollyFrontier Corp. | | | | | | | 8,418 | | | | 431,002 | |
K2016470219 South Africa Ltd. – Series A(a)(b)(c)(d) | | | | | | | 465,862 | | | | – 0 | – |
K2016470219 South Africa Ltd. – Series B(a)(b)(c)(d) | | | | | | | 73,623 | | | | – 0 | – |
Kinder Morgan, Inc./DE | | | | | | | 36,500 | | | | 699,340 | |
LUKOIL PJSC (Sponsored ADR) | | | | | | | 17,354 | | | | 1,449,927 | |
Marathon Petroleum Corp. | | | | | | | 6,921 | | | | 429,171 | |
Paragon Litigation – Class A(b)(c) | | | | | | | 649 | | | | 528 | |
Paragon Litigation – Class B(b)(c) | | | | | | | 974 | | | | 34,821 | |
| | |
| |
| abfunds.com | | AB ALL MARKET TOTAL RETURN PORTFOLIO | 25 |
CONSOLIDATED PORTFOLIO OF INVESTMENTS(continued)
| | | | | | | | | | | | |
| Company | | | | | Shares | | | U.S. $ Value | |
| |
Peabody Energy Corp. | | | | | | | 1,456 | | | $ | 44,918 | |
Petroleo Brasileiro SA | | | | | | | 8,900 | | | | 70,752 | |
Phillips 66 | | | | | | | 4,780 | | | | 460,601 | |
Roan Resources, Inc.(a) | | | | | | | 99 | | | | 769 | |
Royal Dutch Shell PLC – Class B | | | | | | | 123,696 | | | | 3,880,375 | |
Tervita Corp.(a) | | | | | | | 62,228 | | | | 334,323 | |
TOTAL SA | | | | | | | 16,944 | | | | 964,430 | |
Triangle Petroleum Corp.(a) | | | | | | | 7,408 | | | | 122 | |
Valero Energy Corp. | | | | | | | 6,221 | | | | 507,385 | |
Vantage Drilling International(a)(b)(c) | | | | | | | 200 | | | | 51,200 | |
| | | | | | | | | | | | |
| | | | | | | | | | | 13,480,821 | |
| | | | | | | | | | | | |
| | | | | | | | | | | 14,157,779 | |
| | | | | | | | | | | | |
Materials – 1.6% | | | | | | | | | | | | |
Chemicals – 1.0% | | | | | | | | | | | | |
BASF SE | | | | | | | 33,409 | | | | 2,542,997 | |
CF Industries Holdings, Inc. | | | | | | | 8,388 | | | | 353,974 | |
Covestro AG(e) | | | | | | | 5,290 | | | | 301,198 | |
Ecolab, Inc. | | | | | | | 15,740 | | | | 2,658,643 | |
Indorama Ventures PCL | | | | | | | 90,700 | | | | 148,229 | |
Ingevity Corp.(a) | | | | | | | 2 | | | | 230 | |
Methanex Corp. | | | | | | | 4,296 | | | | 241,806 | |
Mitsubishi Chemical Holdings Corp. | | | | | | | 31,900 | | | | 235,907 | |
Sinopec Shanghai Petrochemical Co., Ltd. | | | | | | | 213,400 | | | | 175,992 | |
Sinopec Shanghai Petrochemical Co., Ltd. – Class H | | | | | | | 280,000 | | | | 141,959 | |
Sumitomo Chemical Co., Ltd. | | | | | | | 52,800 | | | | 262,534 | |
| | | | | | | | | | | | |
| | | | | | | | | | | 7,063,469 | |
| | | | | | | | | | | | |
Containers & Packaging – 0.2% | | | | | | | | | | | | |
Bemis Co., Inc. | | | | | | | 28,467 | | | | 1,505,904 | |
RPC Group PLC | | | | | | | 11,207 | | | | 117,467 | |
Westrock Co. | | | | | | | 16 | | | | 598 | |
| | | | | | | | | | | | |
| | | | | | | | | | | 1,623,969 | |
| | | | | | | | | | | | |
Metals & Mining – 0.3% | | | | | | | | | | | | |
Artsonig Pty Ltd.(b)(c)(d) | | | | | | | 51,133 | | | | 767 | |
BHP Group Ltd. | | | | | | | 7,580 | | | | 200,198 | |
Cia Siderurgica Nacional SA(a) | | | | | | | 56,300 | | | | 196,053 | |
Constellium NV – Class A(a) | | | | | | | 8,939 | | | | 84,563 | |
Goldcorp, Inc. | | | | | | | 142,046 | | | | 1,497,165 | |
Maanshan Iron & Steel Co., Ltd. – Class H | | | | | | | 342,000 | | | | 162,873 | |
Neenah Enterprises, Inc.(a)(b)(c)(d) | | | | | | | 10,896 | | | | 32,797 | |
| | | | | | | | | | | | |
| | | | | | | | | | | 2,174,416 | |
| | | | | | | | | | | | |
Paper & Forest Products – 0.1% | | | | | | | | | | | | |
Mondi PLC | | | | | | | 23,549 | | | | 539,100 | |
| | | | | | | | | | | | |
| | | | | | | | | | | 11,400,954 | |
| | | | | | | | | | | | |
| | |
| |
| 26 | AB ALL MARKET TOTAL RETURN PORTFOLIO | | abfunds.com |
CONSOLIDATED PORTFOLIO OF INVESTMENTS(continued)
| | | | | | | | | | | | |
| Company | | | | | Shares | | | U.S. $ Value | |
| |
Utilities – 1.2% | | | | | | | | | | | | |
Electric Utilities – 0.7% | | | | | | | | | | | | |
CEZ AS | | | | | | | 6,466 | | | $ | 156,653 | |
EDP – Energias de Portugal SA | | | | | | | 310,750 | | | | 1,139,365 | |
Electricite de France SA | | | | | | | 24,190 | | | | 351,198 | |
Enel SpA | | | | | | | 75,480 | | | | 456,438 | |
Exelon Corp. | | | | | | | 16,838 | | | | 818,158 | |
Manila Electric Co. | | | | | | | 23,630 | | | | 167,940 | |
Orsted A/S(e) | | | | | | | 5,920 | | | | 429,697 | |
PPL Corp. | | | | | | | 23,666 | | | | 761,335 | |
Red Electrica Corp. SA | | | | | | | 9,760 | | | | 210,866 | |
Terna Rete Elettrica Nazionale SpA | | | | | | | 63,052 | | | | 392,260 | |
| | | | | | | | | | | | |
| | | | | | | | | | | 4,883,910 | |
| | | | | | | | | | | | |
Gas Utilities – 0.1% | | | | | | | | | | | | |
Tokyo Gas Co., Ltd. | | | | | | | 28,800 | | | | 793,928 | |
| | | | | | | | | | | | |
| | | |
Independent Power and Renewable Electricity Producers – 0.1% | | | | | | | | | | | | |
AES Corp./VA | | | | | | | 45,645 | | | | 786,463 | |
| | | | | | | | | | | | |
| | | |
Multi-Utilities – 0.2% | | | | | | | | | | | | |
Ameren Corp. | | | | | | | 9,660 | | | | 688,179 | |
CenterPoint Energy, Inc. | | | | | | | 24,008 | | | | 723,601 | |
| | | | | | | | | | | | |
| | | | | | | | | | | 1,411,780 | |
| | | | | | | | | | | | |
Water Utilities – 0.1% | | | | | | | | | | | | |
Guangdong Investment Ltd. | | | | | | | 584,000 | | | | 1,119,472 | |
| | | | | | | | | | | | |
| | | | | | | | | | | 8,995,553 | |
| | | | | | | | | | | | |
Real Estate – 1.2% | | | | | | | | | | | | |
Equity Real Estate Investment Trusts (REITs) – 0.7% | | | | | | | | | | | | |
Fibra Uno Administracion SA de CV | | | | | | | 115,701 | | | | 160,757 | |
Host Hotels & Resorts, Inc. | | | | | | | 38,817 | | | | 761,201 | |
InfraREIT, Inc. | | | | | | | 25,773 | | | | 550,254 | |
Lamar Advertising Co. – Class A | | | | | | | 6,030 | | | | 467,747 | |
Merlin Properties Socimi SA | | | | | | | 78,170 | | | | 1,012,580 | |
National Retail Properties, Inc. | | | | | | | 5,696 | | | | 296,762 | |
Nippon Building Fund, Inc. | | | | | | | 193 | | | | 1,256,696 | |
Stockland | | | | | | | 109,900 | | | | 273,327 | |
| | | | | | | | | | | | |
| | | | | | | | | | | 4,779,324 | |
| | | | | | | | | | | | |
Real Estate Management & Development – 0.5% | | | | | | | | | | | | |
Agile Group Holdings Ltd. | | | | | | | 124,000 | | | | 154,952 | |
Aroundtown SA | | | | | | | 42,879 | | | | 360,051 | |
CBRE Group, Inc. – Class A(a) | | | | | | | 38,702 | | | | 1,925,812 | |
Guangzhou R&F Properties Co., Ltd. – Class H | | | | | | | 80,800 | | | | 151,076 | |
| | |
| |
| abfunds.com | | AB ALL MARKET TOTAL RETURN PORTFOLIO | 27 |
CONSOLIDATED PORTFOLIO OF INVESTMENTS(continued)
| | | | | | | | | | | | |
| Company | | | | | Shares | | | U.S. $ Value | |
| |
Nomura Real Estate Holdings, Inc. | | | | | | | 13,900 | | | $ | 263,425 | |
Vonovia SE | | | | | | | 21,980 | | | | 1,063,863 | |
| | | | | | | | | | | | |
| | | | | | | | | | | 3,919,179 | |
| | | | | | | | | | | | |
| | | | | | | | | | | 8,698,503 | |
| | | | | | | | | | | | |
Total Common Stocks
(cost $364,274,042) | | | | | | | | | | | 406,554,800 | |
| | | | | | | | | | | | |
| | | | | | | | | | | | |
INVESTMENT COMPANIES – 7.0% | | | | | | | | | | | | |
Funds and Investment Trusts – 7.0%(h) | | | | | | | | | | | | |
iShares iBoxx High Yield Corporate Bond ETF(g) | | | | | | | 127,590 | | | | 10,940,842 | |
iShares JP Morgan USD Emerging Markets Bond ETF | | | | | | | 6,100 | | | | 664,107 | |
iShares Russell 2000 ETF | | | | | | | 591 | | | | 92,657 | |
VanEck Vectors JP Morgan EM Local Currency Bond ETF – Class E | | | | | | | 93,525 | | | | 3,192,008 | |
Vanguard Globalex-U.S. Real Estate ETF | | | | | | | 295,083 | | | | 16,802,026 | |
Vanguard Real Estate ETF | | | | | | | 229,947 | | | | 19,313,249 | |
| | | | | | | | | | | | |
| | | |
Total Investment Companies
(cost $50,093,778) | | | | | | | | | | | 51,004,889 | |
| | | | | | | | | | | | |
| | | |
| | | | | | Principal
Amount
(000) | | | | |
CORPORATES –NON-INVESTMENT GRADE – 6.0% | | | | | | | | | | | | |
Industrial – 4.8% | | | | | | | | | | | | |
Basic – 0.4% | | | | | | | | | | | | |
AK Steel Corp.
7.00%, 3/15/27 | | | $ | | | | 133 | | | | 112,235 | |
CF Industries, Inc.
3.45%, 6/01/23 | | | | | | | 78 | | | | 75,498 | |
5.375%, 3/15/44 | | | | | | | 53 | | | | 46,389 | |
Cleveland-Cliffs, Inc.
5.75%, 3/01/25 | | | | | | | 101 | | | | 98,654 | |
Commercial Metals Co.
5.375%, 7/15/27 | | | | | | | 140 | | | | 132,124 | |
Constellium NV
5.75%, 5/15/24(e) | | | | | | | 250 | | | | 245,612 | |
Crown Americas LLC/Crown Americas Capital Corp. VI
4.75%, 2/01/26 | | | | | | | 102 | | | | 102,362 | |
Eldorado Gold Corp.
6.125%, 12/15/20(e) | | | | | | | 102 | | | | 99,080 | |
ERP Iron Ore, LLC
9.039%, 12/31/19(a)(b)(c)(d)(i)(j) | | | | | | | 17 | | | | 17,028 | |
| | |
| |
| 28 | AB ALL MARKET TOTAL RETURN PORTFOLIO | | abfunds.com |
CONSOLIDATED PORTFOLIO OF INVESTMENTS(continued)
| | | | | | | | | | | | |
| | | | | | Principal
Amount
(000) | | | U.S. $ Value | |
| |
Freeport-McMoRan, Inc.
3.55%, 3/01/22 | | | $ | | | | 204 | | | $ | 201,685 | |
3.875%, 3/15/23 | | | | | | | 186 | | | | 182,843 | |
Grinding Media,Inc./Moly-Cop AltaSteel Ltd.
7.375%, 12/15/23(e) | | | | | | | 100 | | | | 100,010 | |
Joseph T Ryerson & Son, Inc.
11.00%, 5/15/22(e) | | | | | | | 301 | | | | 317,746 | |
Kraton Polymers LLC/Kraton Polymers Capital Corp.
5.25%, 5/15/26(e) | | | EUR | | | | 100 | | | | 113,536 | |
Magnetation LLC/Mag Finance Corp.
11.00%, 5/15/18(a)(b)(k)(l) | | | $ | | | | 146 | | | | 1 | |
Momentive Performance Materials, Inc.
3.88%, 10/24/21 | | | | | | | 85 | | | | 91,708 | |
8.875%, 10/15/20(a)(b)(d)(f) | | | | | | | 85 | | | | – 0 | – |
OCI NV
5.00%, 4/15/23(e) | | | EUR | | | | 100 | | | | 120,001 | |
Pactiv LLC
7.95%, 12/15/25 | | | $ | | | | 60 | | | | 58,693 | |
Peabody Energy Corp.
6.00%, 3/31/22(e) | | | | | | | 13 | | | | 12,883 | |
Reynolds Group Issuer, Inc./Reynolds Group Issuer LLC/Reynolds Group Issuer Lu
5.125%, 7/15/23(e) | | | | | | | 152 | | | | 151,974 | |
Sealed Air Corp.
6.875%, 7/15/33(e) | | | | | | | 170 | | | | 177,269 | |
SPCM SA
4.875%, 9/15/25(e) | | | | | | | 142 | | | | 139,010 | |
Starfruit Finco BV/Starfruit US Holdco LLC
8.00%, 10/01/26(e) | | | | | | | 150 | | | | 149,571 | |
United States Steel Corp.
6.25%, 3/15/26 | | | | | | | 36 | | | | 34,150 | |
6.875%, 8/15/25 | | | | | | | 103 | | | | 101,918 | |
Valvoline, Inc.
5.50%, 7/15/24 | | | | | | | 17 | | | | 17,059 | |
WR Grace & Co.-Conn
5.625%, 10/01/24(e) | | | | | | | 23 | | | | 23,582 | |
| | | | | | | | | | | | |
| | | | | | | | | | | 2,922,621 | |
| | | | | | | | | | | | |
Capital Goods – 0.3% | | | | | | | | | | | | |
ARD Finance SA
7.125% (7.125% Cash or 7.875% PIK), 9/15/23(j) | | | | | | | 200 | | | | 200,622 | |
Ardagh Packaging Finance PLC/Ardagh Holdings USA, Inc.
7.25%, 5/15/24(e) | | | | | | | 7 | | | | 7,372 | |
| | |
| |
| abfunds.com | | AB ALL MARKET TOTAL RETURN PORTFOLIO | 29 |
CONSOLIDATED PORTFOLIO OF INVESTMENTS(continued)
| | | | | | | | | | | | |
| | | | | | Principal
Amount
(000) | | | U.S. $ Value | |
| |
Ball Corp.
4.375%, 12/15/20 | | | $ | | | | 88 | | | $ | 89,536 | |
5.00%, 3/15/22 | | | | | | | 142 | | | | 147,863 | |
BBA US Holdings, Inc.
5.375%, 5/01/26(e) | | | | | | | 50 | | | | 50,929 | |
Bombardier, Inc.
5.75%, 3/15/22(e) | | | | | | | 364 | | | | 365,136 | |
7.50%, 3/15/25(e)(g) | | | | | | | 22 | | | | 22,187 | |
BWAY Holding Co.
4.75%, 4/15/24(e) | | | EUR | | | | 105 | | | | 120,975 | |
7.25%, 4/15/25(e)(g) | | | $ | | | | 140 | | | | 132,818 | |
Clean Harbors, Inc.
5.125%, 6/01/21 | | | | | | | 120 | | | | 120,685 | |
Cleaver-Brooks, Inc.
7.875%, 3/01/23(e) | | | | | | | 65 | | | | 63,700 | |
Colfax Corp.
6.00%, 2/15/24(e) | | | | | | | 23 | | | | 23,794 | |
6.375%, 2/15/26(e) | | | | | | | 24 | | | | 25,015 | |
Gates Global LLC/Gates Global Co.
6.00%, 7/15/22(e) | | | | | | | 49 | | | | 49,381 | |
GFL Environmental, Inc.
5.625%, 5/01/22(e) | | | | | | | 157 | | | | 151,638 | |
Hulk Finance Corp.
7.00%, 6/01/26(e) | | | | | | | 8 | | | | 7,611 | |
JELD-WEN, Inc.
4.625%, 12/15/25(e) | | | | | | | 17 | | | | 15,989 | |
4.875%, 12/15/27(e) | | | | | | | 23 | | | | 21,439 | |
Owens-Brockway Glass Container, Inc.
5.00%, 1/15/22(e) | | | | | | | 47 | | | | 48,851 | |
Stevens Holding Co., Inc.
6.125%, 10/01/26(e) | | | | | | | 18 | | | | 18,454 | |
TransDigm UK Holdings PLC
6.875%, 5/15/26(e) | | | | | | | 265 | | | | 258,136 | |
TransDigm, Inc.
6.50%, 7/15/24 | | | | | | | 145 | | | | 146,457 | |
| | | | | | | | | | | | |
| | | | | | | | | | | 2,088,588 | |
| | | | | | | | | | | | |
Communications - Media – 0.5% | |
Altice Financing SA
6.625%, 2/15/23(e) | | | | | | | 162 | | | | 166,327 | |
7.50%, 5/15/26(e) | | | | | | | 285 | | | | 275,743 | |
Altice France SA/France
7.375%, 5/01/26(e) | | | | | | | 450 | | | | 441,387 | |
CCO Holdings LLC/CCO Holdings Capital Corp.
5.125%,2/15/23-5/01/27(e) | | | | | | | 223 | | | | 223,614 | |
5.25%, 9/30/22 | | | | | | | 15 | | | | 15,160 | |
| | |
| |
| 30 | AB ALL MARKET TOTAL RETURN PORTFOLIO | | abfunds.com |
CONSOLIDATED PORTFOLIO OF INVESTMENTS(continued)
| | | | | | | | | | | | |
| | | | | | Principal
Amount
(000) | | | U.S. $ Value | |
| |
5.375%, 5/01/25(e) | | | $ | | | | 30 | | | $ | 30,444 | |
5.875%, 5/01/27(e) | | | | | | | 48 | | | | 49,530 | |
CSC Holdings LLC
5.375%, 2/01/28(e) | | | | | | | 200 | | | | 196,536 | |
6.625%, 10/15/25(e) | | | | | | | 6 | | | | 6,758 | |
10.875%, 10/15/25(e) | | | | | | | 236 | | | | 273,666 | |
DISH DBS Corp.
5.00%, 3/15/23(g) | | | | | | | 38 | | | | 34,054 | |
5.875%, 11/15/24 | | | | | | | 20 | | | | 16,853 | |
6.75%, 6/01/21 | | | | | | | 69 | | | | 70,459 | |
Gray Television, Inc.
5.125%, 10/15/24(e) | | | | | | | 150 | | | | 148,945 | |
5.875%, 7/15/26(e) | | | | | | | 85 | | | | 85,940 | |
iHeartCommunications, Inc.
6.875%, 6/15/18(a)(b)(c)(k) | | | | | | | 121 | | | | 12,666 | |
9.00%, 12/15/19(a)(i) | | | | | | | 175 | | | | 122,478 | |
11.25%, 3/01/21(a)(e)(i) | | | | | | | 25 | | | | 15,398 | |
Meredith Corp. Co. Guar
6.875%, 2/01/26 | | | | | | | 203 | | | | 209,658 | |
Netflix, Inc.
4.875%, 4/15/28 | | | | | | | 336 | | | | 327,805 | |
Radiate Holdco LLC/Radiate Finance, Inc.
6.625%, 2/15/25(e) | | | | | | | 43 | | | | 40,090 | |
6.875%, 2/15/23(e) | | | | | | | 60 | | | | 57,692 | |
RR Donnelley & Sons Co.
7.875%, 3/15/21 | | | | | | | 70 | | | | 72,057 | |
Sinclair Television Group, Inc.
5.125%, 2/15/27(e) | | | | | | | 150 | | | | 140,594 | |
6.125%, 10/01/22 | | | | | | | 41 | | | | 41,925 | |
TEGNA, Inc.
5.125%, 7/15/20 | | | | | | | 62 | | | | 61,981 | |
UPC Holding BV
5.50%, 1/15/28(e) | | | | | | | 217 | | | | 220,771 | |
Ziggo Bond Co. BV
5.875%, 1/15/25(e) | | | | | | | 44 | | | | 42,762 | |
Ziggo BV
5.50%, 1/15/27(e) | | | | | | | 268 | | | | 257,992 | |
| | | | | | | | | | | | |
| | | | | | | | | | | 3,659,285 | |
| | | | | | | | | | | | |
Communications - Telecommunications – 0.4% | | | | | | | | | | | | |
C&W Senior Financing DAC
6.875%, 9/15/27(e) | | | | | | | 200 | | | | 196,418 | |
CBT-Mobile USA, Inc.
6.50%,1/15/24-1/15/26(a)(b)(c)(d) | | | | | | | 150 | | | | – 0 | – |
CenturyLink, Inc.
Series S
6.45%, 6/15/21 | | | | | | | 63 | | | | 65,146 | |
Series T
5.80%, 3/15/22 | | | | | | | 93 | | | | 95,282 | |
| | |
| |
| abfunds.com | | AB ALL MARKET TOTAL RETURN PORTFOLIO | 31 |
CONSOLIDATED PORTFOLIO OF INVESTMENTS(continued)
| | | | | | | | | | | | |
| | | | | | Principal
Amount
(000) | | | U.S. $ Value | |
| |
Embarq Corp.
7.995%, 6/01/36 | | | $ | | | | 178 | | | $ | 172,502 | |
Frontier Communications Corp.
7.125%, 1/15/23 | | | | | | | 155 | | | | 93,369 | |
7.625%, 4/15/24 | | | | | | | 133 | | | | 77,085 | |
7.875%, 1/15/27 | | | | | | | 31 | | | | 15,819 | |
8.75%, 4/15/22(g) | | | | | | | 64 | | | | 43,498 | |
11.00%, 9/15/25 | | | | | | | 131 | | | | 83,873 | |
Hughes Satellite Systems Corp.
6.50%, 6/15/19 | | | | | | | 71 | | | | 71,457 | |
7.625%, 6/15/21 | | | | | | | 47 | | | | 50,166 | |
Intelsat Jackson Holdings SA
5.50%, 8/01/23 | | | | | | | 268 | | | | 244,897 | |
8.00%, 2/15/24(e) | | | | | | | 25 | | | | 25,883 | |
9.50%, 9/30/22(e) | | | | | | | 107 | | | | 124,134 | |
9.75%, 7/15/25(e) | | | | | | | 147 | | | | 153,025 | |
Level 3 Financing, Inc.
5.25%, 3/15/26 | | | | | | | 164 | | | | 161,521 | |
Level 3 Parent LLC
5.75%, 12/01/22 | | | | | | | 18 | | | | 18,603 | |
Qwest Corp.
6.75%, 12/01/21 | | | | | | | 123 | | | | 130,842 | |
6.875%, 9/15/33 | | | | | | | 27 | | | | 26,414 | |
Sable International Finance Ltd.
6.875%, 8/01/22(e) | | | | | | | 102 | | | | 106,173 | |
Sprint Capital Corp.
6.875%, 11/15/28 | | | | | | | 150 | | | | 148,270 | |
Sprint Communications, Inc.
7.00%, 3/01/20(e) | | | | | | | 149 | | | | 153,668 | |
T-Mobile USA, Inc.
6.50%,1/15/24-1/15/26 | | | | | | | 152 | | | | 157,961 | |
Telecom Italia Capital SA
6.375%, 11/15/33 | | | | | | | 136 | | | | 127,779 | |
7.20%, 7/18/36 | | | | | | | 148 | | | | 148,527 | |
7.721%, 6/04/38 | | | | | | | 68 | | | | 69,819 | |
Zayo Group LLC/Zayo Capital, Inc.
5.75%, 1/15/27(e) | | | | | | | 205 | | | | 198,821 | |
| | | | | | | | | | | | |
| | | | | | | | | | | 2,960,952 | |
| | | | | | | | | | | | |
Consumer Cyclical - Automotive – 0.2% | | | | | | | | | | | | |
American Axle & Manufacturing, Inc.
6.25%, 4/01/25(g) | | | | | | | 125 | | | | 124,822 | |
BCD Acquisition, Inc.
9.625%, 9/15/23(e) | | | | | | | 245 | | | | 258,292 | |
Cooper-Standard Automotive, Inc.
5.625%, 11/15/26(e) | | | | | | | 87 | | | | 77,774 | |
Dana, Inc.
5.50%, 12/15/24 | | | | | | | 33 | | | | 32,818 | |
| | |
| |
| 32 | AB ALL MARKET TOTAL RETURN PORTFOLIO | | abfunds.com |
CONSOLIDATED PORTFOLIO OF INVESTMENTS(continued)
| | | | | | | | | | | | |
| | | | | | Principal
Amount
(000) | | | U.S. $ Value | |
| |
Exide Technologies
7.00%, 4/30/25(b)(j)(l)(m) | | | $ | | | | 244 | | | $ | 126,978 | |
11.00% (11.00% Cash or 7.00% PIK), 4/30/22(b)(j)(l) | | | | | | | 89 | | | | 70,561 | |
IHO Verwaltungs GmbH
4.125% (4.125% Cash or 4.875% PIK), 9/15/21(e)(j) | | | | | | | 142 | | | | 140,317 | |
Meritor, Inc.
6.25%, 2/15/24 | | | | | | | 69 | | | | 70,394 | |
Navistar International Corp.
6.625%, 11/01/25(e) | | | | | | | 132 | | | | 136,206 | |
Tenneco, Inc.
5.00%, 7/15/26 | | | | | | | 167 | | | | 142,925 | |
Titan International, Inc.
6.50%, 11/30/23 | | | | | | | 144 | | | | 134,257 | |
| | | | | | | | | | | | |
| | | | | | | | | | | 1,315,344 | |
| | | | | | | | | | | | |
Consumer Cyclical - Entertainment – 0.0% | | | | | | | | | | | | |
AMC Entertainment Holdings, Inc.
5.75%, 6/15/25(g) | | | | | | | 10 | | | | 9,647 | |
5.875%, 11/15/26 | | | | | | | 162 | | | | 145,904 | |
National CineMedia LLC
5.75%, 8/15/26 | | | | | | | 33 | | | | 30,473 | |
| | | | | | | | | | | | |
| | | | | | | | | | | 186,024 | |
| | | | | | | | | | | | |
Consumer Cyclical - Other – 0.4% | | | | | | | | | | | | |
Beazer Homes USA, Inc.
5.875%, 10/15/27 | | | | | | | 88 | | | | 76,769 | |
6.75%, 3/15/25 | | | | | | | 64 | | | | 59,721 | |
8.75%, 3/15/22 | | | | | | | 155 | | | | 162,367 | |
Caesars Entertainment Corp.
5.00%, 10/01/24(b)(m) | | | | | | | 26 | | | | 37,697 | |
Cirsa Finance International SARL
6.25%, 12/20/23(e) | | | EUR | | | | 110 | | | | 131,669 | |
Five Point Operating Co. LP/Five Point Capital Corp.
7.875%, 11/15/25(e) | | | $ | | | | 173 | | | | 167,492 | |
International Game Technology PLC
6.50%, 2/15/25(e) | | | | | | | 200 | �� | | | 212,858 | |
K. Hovnanian Enterprises, Inc.
5.00%, 11/01/21 | | | | | | | 103 | | | | 81,730 | |
10.00%, 7/15/22(e) | | | | | | | 220 | | | | 175,980 | |
10.50%, 7/15/24(e) | | | | | | | 219 | | | | 152,744 | |
KB Home
7.00%, 12/15/21 | | | | | | | 54 | | | | 57,155 | |
7.50%, 9/15/22 | | | | | | | 25 | | | | 26,920 | |
8.00%, 3/15/20 | | | | | | | 14 | | | | 14,753 | |
| | |
| |
| abfunds.com | | AB ALL MARKET TOTAL RETURN PORTFOLIO | 33 |
CONSOLIDATED PORTFOLIO OF INVESTMENTS(continued)
| | | | | | | | | | | | |
| | | | | | Principal
Amount
(000) | | | U.S. $ Value | |
| |
Lennar Corp.
4.50%, 11/15/19 | | | $ | | | | 148 | | | $ | 149,021 | |
6.25%, 12/15/21 | | | | | | | 55 | | | | 57,877 | |
Marriott Ownership Resorts, Inc./ILG LLC
6.50%, 9/15/26(e) | | | | | | | 151 | | | | 156,193 | |
MDC Holdings, Inc.
5.50%, 1/15/24 | | | | | | | 14 | | | | 14,472 | |
5.625%, 2/01/20 | | | | | | | 57 | | | | 57,706 | |
6.00%, 1/15/43 | | | | | | | 270 | | | | 230,491 | |
Meritage Homes Corp.
7.00%, 4/01/22 | | | | | | | 11 | | | | 11,331 | |
PulteGroup, Inc.
5.00%, 1/15/27 | | | | | | | 21 | | | | 20,511 | |
6.00%, 2/15/35 | | | | | | | 130 | | | | 118,490 | |
7.875%, 6/15/32 | | | | | | | 151 | | | | 163,019 | |
Shea Homes LP/Shea Homes Funding Corp.
5.875%, 4/01/23(e) | | | | | | | 18 | | | | 17,133 | |
6.125%, 4/01/25(e) | | | | | | | 146 | | | | 136,812 | |
Standard Industries, Inc./NJ
6.00%, 10/15/25(e) | | | | | | | 74 | | | | 77,653 | |
Stars Group Holdings BV/Stars Group USCo-Borrower LLC
7.00%, 7/15/26(e) | | | | | | | 122 | | | | 124,713 | |
Sugarhouse HSP Gaming Prop Mezz LP/Sugarhouse HSP Gaming Finance Corp.
5.875%, 5/15/25(e) | | | | | | | 197 | | | | 194,864 | |
Taylor Morrison Communities, Inc./Taylor Morrison Holdings II, Inc.
5.625%, 3/01/24(e) | | | | | | | 183 | | | | 180,581 | |
Toll Brothers Finance Corp.
4.875%, 3/15/27 | | | | | | | 27 | | | | 26,415 | |
5.875%, 2/15/22 | | | | | | | 86 | | | | 89,970 | |
| | | | | | | | | | | | |
| | | | | | | | | | | 3,185,107 | |
| | | | | | | | | | | | |
Consumer Cyclical - Restaurants – 0.1% | | | | | | | | | | | | |
Golden Nugget, Inc.
8.75%, 10/01/25(e) | | | | | | | 140 | | | | 144,262 | |
IRB Holding Corp.
6.75%, 2/15/26(e) | | | | | | | 247 | | | | 233,064 | |
| | | | | | | | | | | | |
| | | | | | | | | | | 377,326 | |
| | | | | | | | | | | | |
Consumer Cyclical - Retailers – 0.1% | | | | | | | | | | | | |
JC Penney Corp., Inc.
6.375%, 10/15/36 | | | | | | | 37 | | | | 13,802 | |
L Brands, Inc.
6.875%, 11/01/35 | | | | | | | 142 | | | | 122,226 | |
7.00%, 5/01/20 | | | | | | | 106 | | | | 110,277 | |
| | |
| |
| 34 | AB ALL MARKET TOTAL RETURN PORTFOLIO | | abfunds.com |
CONSOLIDATED PORTFOLIO OF INVESTMENTS(continued)
| | | | | | | | | | | | |
| | | | | | Principal
Amount
(000) | | | U.S. $ Value | |
| |
PetSmart, Inc.
7.125%, 3/15/23(e) | | | $ | | | | 154 | | | $ | 105,094 | |
Sonic Automotive, Inc.
5.00%, 5/15/23 | | | | | | | 135 | | | | 127,996 | |
6.125%, 3/15/27 | | | | | | | 47 | | | | 42,249 | |
William Carter Co. (The)
5.625%, 3/15/27(e) | | | | | | | 44 | | | | 44,000 | |
| | | | | | | | | | | | |
| | | | | | | | | | | 565,644 | |
| | | | | | | | | | | | |
ConsumerNon-Cyclical – 0.6% | | | | | | | | | | | | |
Acadia Healthcare Co., Inc.
5.625%, 2/15/23 | | | | | | | 139 | | | | 137,973 | |
Air Medical Group Holdings, Inc.
6.375%, 5/15/23(e)(g) | | | | | | | 85 | | | | 71,917 | |
Albertsons Cos. LLC/Safeway, Inc./New Albertsons LP/Albertson’s LLC
5.75%, 3/15/25 | | | | | | | 60 | | | | 56,696 | |
6.625%, 6/15/24 | | | | | | | 213 | | | | 213,666 | |
Aveta, Inc.
10.50%, 3/01/21(a)(b)(d)(l) | | | | | | | 1,149 | | | | – 0 | – |
Bausch Health Americas, Inc.
8.50%, 1/31/27(e) | | | | | | | 19 | | | | 19,736 | |
Bausch Health Cos., Inc.
5.50%, 3/01/23(e) | | | | | | | 152 | | | | 151,710 | |
5.625%, 12/01/21(e) | | | | | | | 140 | | | | 140,214 | |
5.875%, 5/15/23(e) | | | | | | | 190 | | | | 189,430 | |
Catalent Pharma Solutions, Inc.
4.875%, 1/15/26(e) | | | | | | | 55 | | | | 54,405 | |
CHS/Community Health Systems, Inc.
6.25%, 3/31/23 | | | | | | | 134 | | | | 128,962 | |
8.125%, 6/30/24(e) | | | | | | | 97 | | | | 80,911 | |
DaVita, Inc.
5.00%, 5/01/25 | | | | | | | 150 | | | | 144,844 | |
Diamond BC BV
5.625%, 8/15/25(e) | | | EUR | | | | 123 | | | | 126,772 | |
Endo Finance LLC
5.75%, 1/15/22(e)(g) | | | $ | | | | 174 | | | | 162,700 | |
Endo Finance LLC/Endo Finco, Inc.
5.375%, 1/15/23(e) | | | | | | | 28 | | | | 23,112 | |
Envision Healthcare Corp.
8.75%, 10/15/26(e)(g) | | | | | | | 20 | | | | 18,048 | |
First Quality Finance Co., Inc.
4.625%, 5/15/21(e) | | | | | | | 233 | | | | 233,595 | |
Hadrian Merger Sub, Inc.
8.50%, 5/01/26(e) | | | | | | | 98 | | | | 90,167 | |
Kinetic Concepts, Inc./KCI USA, Inc.
7.875%, 2/15/21(e) | | | | | | | 118 | | | | 120,965 | |
| | |
| |
| abfunds.com | | AB ALL MARKET TOTAL RETURN PORTFOLIO | 35 |
CONSOLIDATED PORTFOLIO OF INVESTMENTS(continued)
| | | | | | | | | | | | |
| | | | | | Principal
Amount
(000) | | | U.S. $ Value | |
| |
Lamb Weston Holdings, Inc.
4.625%, 11/01/24(e) | | | $ | | | | 140 | | | $ | 140,698 | |
Mallinckrodt International Finance SA
4.75%, 4/15/23(g) | | | | | | | 2 | | | | 1,626 | |
Mallinckrodt International Finance SA/
Mallinckrodt CB LLC
5.50%, 4/15/25(e)(g) | | | | | | | 52 | | | | 42,047 | |
5.625%, 10/15/23(e)(g) | | | | | | | 78 | | | | 68,302 | |
5.75%, 8/01/22(e)(g) | | | | | | | 305 | | | | 286,530 | |
MEDNAX, Inc.
5.25%, 12/01/23(e) | | | | | | | 24 | | | | 24,354 | |
MPH Acquisition Holdings LLC
7.125%, 6/01/24(e) | | | | | | | 140 | | | | 140,360 | |
Post Holdings, Inc.
5.00%, 8/15/26(e) | | | | | | | 250 | | | | 240,615 | |
5.625%, 1/15/28(e) | | | | | | | 105 | | | | 101,885 | |
RegionalCare Hospital Partners Holdings, Inc./LifePoint Health, Inc.
9.75%, 12/01/26(e)(g) | | | | | | | 328 | | | | 337,102 | |
Spectrum Brands, Inc.
5.75%, 7/15/25 | | | | | | | 140 | | | | 137,001 | |
6.625%, 11/15/22(g) | | | | | | | 26 | | | | 26,864 | |
Sunshine Mid BV
6.50%, 5/15/26(e) | | | EUR | | | | 103 | | | | 115,699 | |
Tenet Healthcare Corp.
4.50%, 4/01/21 | | | $ | | | | 47 | | | | 48,194 | |
6.75%, 6/15/23(g) | | | | | | | 84 | | | | 86,087 | |
8.125%, 4/01/22 | | | | | | | 369 | | | | 393,570 | |
Vizient, Inc.
10.375%, 3/01/24(e) | | | | | | | 87 | | | | 94,440 | |
| | | | | | | | | | | | |
| | | | | | | | | | | 4,451,197 | |
| | | | | | | | | | | | |
Energy – 1.1% | | | | | | | | | | | | |
Alta Mesa Holdings LP/Alta Mesa Finance Services Corp.
7.875%, 12/15/24 | | | | | | | 56 | | | | 17,876 | |
Antero Resources Corp.
5.125%, 12/01/22 | | | | | | | 114 | | | | 114,147 | |
Berry Petroleum Co. LLC
6.375%, 9/15/22(a)(b)(c)(d) | | | | | | | 135 | | | | – 0 | – |
7.00%, 2/15/26(e) | | | | | | | 71 | | | | 71,053 | |
Bruin E&P Partners LLC
8.875%, 8/01/23(e) | | | | | | | 124 | | | | 121,190 | |
California Resources Corp.
5.50%, 9/15/21 | | | | | | | 45 | | | | 36,275 | |
8.00%, 12/15/22(e)(g) | | | | | | | 418 | | | | 334,057 | |
Carrizo Oil & Gas, Inc.
6.25%, 4/15/23(g) | | | | | | | 58 | | | | 57,197 | |
8.25%, 7/15/25 | | | | | | | 169 | | | | 176,343 | |
| | |
| |
| 36 | AB ALL MARKET TOTAL RETURN PORTFOLIO | | abfunds.com |
CONSOLIDATED PORTFOLIO OF INVESTMENTS(continued)
| | | | | | | | | | |
| | | | | Principal
Amount
(000) | | | U.S. $ Value | |
| |
Cheniere Corpus Christi Holdings LLC
5.875%, 3/31/25 | | $ | | | 81 | | | $ | 86,662 | |
Cheniere Energy Partners LP
5.25%, 10/01/25 | | | | | 110 | | | | 111,609 | |
Chesapeake Energy Corp.
6.125%, 2/15/21 | | | | | 199 | | | | 203,543 | |
6.875%, 11/15/20 | | | | | 1 | | | | 1,464 | |
8.00%, 6/15/27(g) | | | | | 110 | | | | 108,872 | |
Covey Park Energy LLC/Covey Park Finance Corp.
7.50%, 5/15/25(e) | | | | | 41 | | | | 38,216 | |
Denbury Resources, Inc.
7.50%, 2/15/24(e) | | | | | 104 | | | | 93,061 | |
9.25%, 3/31/22(e) | | | | | 63 | | | | 63,488 | |
Diamond Offshore Drilling, Inc.
4.875%, 11/01/43 | | | | | 367 | | | | 231,426 | |
7.875%, 8/15/25(g) | | | | | 43 | | | | 40,644 | |
Energy Transfer LP
4.25%, 3/15/23 | | | | | 108 | | | | 109,391 | |
7.50%, 10/15/20 | | | | | 152 | | | | 161,794 | |
Ensco PLC
4.50%, 10/01/24(g) | | | | | 16 | | | | 12,676 | |
5.20%, 3/15/25(g) | | | | | 220 | | | | 171,306 | |
EP Energy LLC/Everest Acquisition Finance, Inc.
7.75%, 9/01/22 | | | | | 357 | | | | 142,232 | |
9.375%, 5/01/24(e) | | | | | 100 | | | | 47,205 | |
Genesis Energy LP/Genesis Energy Finance Corp.
5.625%, 6/15/24 | | | | | 51 | | | | 47,427 | |
6.25%, 5/15/26 | | | | | 159 | | | | 147,918 | |
6.50%, 10/01/25 | | | | | 42 | | | | 40,306 | |
6.75%, 8/01/22 | | | | | 26 | | | | 26,604 | |
Gulfport Energy Corp.
6.00%, 10/15/24 | | | | | 54 | | | | 49,024 | |
6.375%,5/15/25-1/15/26 | | | | | 280 | | | | 246,882 | |
Hess Infrastructure Partners LP/Hess Infrastructure Partners Finance Corp.
5.625%, 2/15/26(e) | | | | | 197 | | | | 197,985 | |
HighPoint Operating Corp.
7.00%, 10/15/22(g) | | | | | 81 | | | | 77,654 | |
8.75%, 6/15/25 | | | | | 26 | | | | 25,297 | |
Hilcorp Energy I LP/Hilcorp Finance Co.
5.75%, 10/01/25(e) | | | | | 240 | | | | 238,038 | |
Indigo Natural Resources LLC
6.875%, 2/15/26(e) | | | | | 135 | | | | 117,670 | |
| | |
| |
| abfunds.com | | AB ALL MARKET TOTAL RETURN PORTFOLIO | 37 |
CONSOLIDATED PORTFOLIO OF INVESTMENTS(continued)
| | | | | | | | | | |
| | | | | Principal
Amount
(000) | | | U.S. $ Value | |
| |
Murphy Oil Corp.
5.875%, 12/01/42 | | $ | | | 51 | | | $ | 43,732 | |
Murphy Oil USA, Inc.
5.625%, 5/01/27 | | | | | 6 | | | | 5,726 | |
6.00%, 8/15/23 | | | | | 109 | | | | 111,759 | |
Nabors Industries, Inc.
4.625%, 9/15/21(g) | | | | | 139 | | | | 136,132 | |
5.50%, 1/15/23(g) | | | | | 228 | | | | 214,576 | |
5.75%, 2/01/25 | | | | | 34 | | | | 30,112 | |
Nine Energy Service, Inc.
8.75%, 11/01/23(e) | | | | | 68 | | | | 68,015 | |
Noble Holding International Ltd.
7.75%, 1/15/24(g) | | | | | 196 | | | | 174,440 | |
7.95%, 4/01/25 | | | | | 48 | | | | 42,540 | |
Parkland Fuel Corp.
6.00%, 4/01/26(e) | | | | | 142 | | | | 139,579 | |
PDC Energy, Inc.
5.75%, 5/15/26 | | | | | 217 | | | | 209,279 | |
Precision Drilling Corp.
7.125%, 1/15/26(e) | | | | | 105 | | | | 103,339 | |
QEP Resources, Inc.
5.25%, 5/01/23 | | | | | 60 | | | | 57,865 | |
5.375%, 10/01/22 | | | | | 81 | | | | 80,486 | |
Range Resources Corp.
4.875%, 5/15/25(g) | | | | | 27 | | | | 25,083 | |
5.00%,8/15/22-3/15/23 | | | | | 220 | | | | 216,026 | |
5.875%, 7/01/22 | | | | | 13 | | | | 13,138 | |
Rowan Cos., Inc.
4.75%, 1/15/24 | | | | | 160 | | | | 128,800 | |
5.85%, 1/15/44 | | | | | 86 | | | | 56,190 | |
Sanchez Energy Corp.
7.25%, 2/15/23(e)(g) | | | | | 103 | | | | 89,038 | |
SandRidge Energy, Inc.
7.50%, 2/15/23(a)(b)(c)(d) | | | | | 69 | | | | – 0 | – |
8.125%, 10/15/22(b)(c)(d) | | | | | 113 | | | | – 0 | – |
SemGroup Corp.
6.375%, 3/15/25(g) | | | | | 78 | | | | 73,418 | |
7.25%, 3/15/26 | | | | | 70 | | | | 67,736 | |
SemGroup Corp./Rose Rock Finance Corp.
5.625%, 11/15/23 | | | | | 29 | | | | 27,048 | |
SM Energy Co.
5.00%, 1/15/24 | | | | | 176 | | | | 165,628 | |
5.625%, 6/01/25(g) | | | | | 15 | | | | 14,100 | |
6.625%, 1/15/27(g) | | | | | 98 | | | | 93,443 | |
Southern Star Central Corp.
5.125%, 7/15/22(e) | | | | | 85 | | | | 84,340 | |
| | |
| |
| 38 | AB ALL MARKET TOTAL RETURN PORTFOLIO | | abfunds.com |
CONSOLIDATED PORTFOLIO OF INVESTMENTS(continued)
| | | | | | | | | | | | |
| | | | | | Principal
Amount
(000) | | | U.S. $ Value | |
| |
SRC Energy, Inc.
6.25%, 12/01/25 | | | $ | | | | 106 | | | $ | 96,455 | |
Sunoco LP/Sunoco Finance Corp.
5.50%, 2/15/26 | | | | | | | 180 | | | | 178,675 | |
5.875%, 3/15/28 | | | | | | | 136 | | | | 134,543 | |
Targa Resources Partners LP/Targa Resources Partners Finance Corp.
4.25%, 11/15/23 | | | | | | | 45 | | | | 44,829 | |
5.875%, 4/15/26(e) | | | | | | | 112 | | | | 116,607 | |
Transocean Phoenix 2 Ltd.
7.75%, 10/15/24(e) | | | | | | | 121 | | | | 127,054 | |
Transocean Pontus Ltd.
6.125%, 8/01/25(e) | | | | | | | 61 | | | | 62,208 | |
Transocean, Inc.
6.80%, 3/15/38 | | | | | | | 154 | | | | 116,318 | |
7.50%, 1/15/26(e) | | | | | | | 103 | | | | 99,186 | |
9.00%, 7/15/23(e) | | | | | | | 24 | | | | 24,876 | |
Vantage Drilling International
7.50%, 11/01/19(a)(b)(c)(d) | | | | | | | 111 | | | | – 0 | – |
Vine Oil & Gas LP/Vine Oil & Gas Finance Corp.
8.75%, 4/15/23(e) | | | | | | | 246 | | | | 199,506 | |
Weatherford International LLC
9.875%, 3/01/25 | | | | | | | 114 | | | | 81,212 | |
Weatherford International Ltd.
5.875%, 7/01/21(m) | | | | | | | 88 | | | | 67,382 | |
7.75%, 6/15/21(g) | | | | | | | 102 | | | | 91,013 | |
9.875%, 2/15/24 | | | | | | | 50 | | | | 36,081 | |
Whiting Petroleum Corp.
1.25%, 4/01/20(m) | | | | | | | 67 | | | | 64,634 | |
5.75%, 3/15/21 | | | | | | | 38 | | | | 38,458 | |
6.25%, 4/01/23(g) | | | | | | | 42 | | | | 42,018 | |
6.625%, 1/15/26(g) | | | | | | | 125 | | | | 122,475 | |
WPX Energy, Inc.
5.75%, 6/01/26 | | | | | | | 65 | | | | 65,569 | |
| | | | | | | | | | | | |
| | | | | | | | | | | 8,047,199 | |
| | | | | | | | | | | | |
Other Industrial – 0.1% | | | | | | | | | | | | |
Algeco Global Finance PLC
8.00%, 2/15/23(e) | | | | | | | 200 | | | | 199,672 | |
American Builders & Contractors Supply Co., Inc.
5.75%, 12/15/23(e) | | | | | | | 178 | | | | 183,109 | |
Global Partners LP/GLP Finance Corp. 6.25%, 7/15/22 | | | | | | | 205 | | | | 202,482 | |
7.00%, 6/15/23 | | | | | | | 28 | | | | 28,056 | |
H&E Equipment Services, Inc.
5.625%, 9/01/25 | | | | | | | 58 | | | | 57,491 | |
| | |
| |
| abfunds.com | | AB ALL MARKET TOTAL RETURN PORTFOLIO | 39 |
CONSOLIDATED PORTFOLIO OF INVESTMENTS(continued)
| | | | | | | | | | | | |
| | | | | | Principal
Amount
(000) | | | U.S. $ Value | |
| |
KAR Auction Services, Inc.
5.125%, 6/01/25(e) | | | $ | | | | 62 | | | $ | 60,310 | |
Laureate Education, Inc.
8.25%, 5/01/25(e) | | | | | | | 109 | | | | 117,480 | |
| | | | | | | | | | | | |
| | | | | | | | | | | 848,600 | |
| | | | | | | | | | | | |
Services – 0.3% | | | | | | | | | | | | |
ADT Security Corp. (The)
3.50%, 7/15/22 | | | | | | | 57 | | | | 55,713 | |
Aptim Corp.
7.75%, 6/15/25(e)(g) | | | | | | | 122 | | | | 95,346 | |
APX Group, Inc.
7.875%, 12/01/22 | | | | | | | 300 | | | | 298,479 | �� |
8.75%, 12/01/20 | | | | | | | 81 | | | | 80,045 | |
Aramark Services, Inc.
5.00%, 2/01/28(e) | | | | | | | 98 | | | | 96,781 | |
5.125%, 1/15/24 | | | | | | | 16 | | | | 16,699 | |
Carlson Travel, Inc.
9.50%, 12/15/24(e) | | | | | | | 200 | | | | 190,560 | |
Carriage Services, Inc.
6.625%, 6/01/26(e) | | | | | | | 87 | | | | 89,192 | |
GEO Group, Inc. (The)
5.125%, 4/01/23 | | | | | | | 115 | | | | 109,146 | |
5.875%,1/15/22-10/15/24 | | | | | | | 39 | | | | 38,290 | |
6.00%, 4/15/26 | | | | | | | 140 | | | | 129,819 | |
Monitronics International, Inc.
9.125%, 4/01/20(f) | | | | | | | 120 | | | | 23,417 | |
Nielsen Co. Luxembourg SARL (The)
5.50%, 10/01/21(e) | | | | | | | 68 | | | | 68,783 | |
Prime Security Services Borrower LLC/Prime Finance, Inc.
9.25%, 5/15/23(e) | | | | | | | 255 | | | | 268,388 | |
Refinitiv US Holdings, Inc.
6.25%, 5/15/26(e) | | | | | | | 41 | | | | 41,308 | |
8.25%, 11/15/26(e) | | | | | | | 37 | | | | 36,252 | |
Sabre GLBL, Inc.
5.25%, 11/15/23(e) | | | | | | | 135 | | | | 138,408 | |
Team Health Holdings, Inc.
6.375%, 2/01/25(e)(g) | | | | | | | 50 | | | | 40,239 | |
Verscend Escrow Corp.
9.75%, 8/15/26(e) | | | | | | | 119 | | | | 122,327 | |
| | | | | | | | | | | | |
| | | | | | | | | | | 1,939,192 | |
| | | | | | | | | | | | |
Technology – 0.2% | | | | | | | | | | | | |
Banff Merger Sub, Inc.
9.75%, 9/01/26(e) | | | | | | | 252 | | | | 244,493 | |
CommScope Finance LLC
5.50%, 3/01/24(e) | | | | | | | 63 | | | | 64,130 | |
6.00%, 3/01/26(e) | | | | | | | 83 | | | | 85,033 | |
8.25%, 3/01/27(e) | | | | | | | 106 | | | | 109,993 | |
| | |
| |
| 40 | AB ALL MARKET TOTAL RETURN PORTFOLIO | | abfunds.com |
CONSOLIDATED PORTFOLIO OF INVESTMENTS(continued)
| | | | | | | | | | | | |
| | | | | | Principal
Amount
(000) | | | U.S. $ Value | |
| |
CommScope, Inc.
5.00%, 6/15/21(e) | | | $ | | | | 50 | | | $ | 50,183 | |
Conduent Finance, Inc./Conduent Business Services LLC
10.50%, 12/15/24(e) | | | | | | | 1 | | | | 965 | |
Dell International LLC/EMC Corp.
5.875%, 6/15/21(e) | | | | | | | 78 | | | | 79,559 | |
Dell, Inc.
6.50%, 4/15/38 | | | | | | | 43 | | | | 41,260 | |
Goodman Networks, Inc.
8.00%, 5/11/22(b) | | | | | | | 48 | | | | 23,851 | |
Infor US, Inc.
6.50%, 5/15/22 | | | | | | | 140 | | | | 142,802 | |
Iron Mountain, Inc.
4.375%, 6/01/21(e) | | | | | | | 50 | | | | 49,750 | |
Nokia Oyj
6.625%, 5/15/39 | | | | | | | 34 | | | | 35,695 | |
Sanmina Corp.
4.375%, 6/01/19(e) | | | | | | | 89 | | | | 88,699 | |
Solera LLC/Solera Finance, Inc.
10.50%, 3/01/24(e) | | | | | | | 188 | | | | 203,284 | |
Western Digital Corp.
4.75%, 2/15/26 | | | | | | | 132 | | | | 124,780 | |
| | | | | | | | | | | | |
| | | | | | | | | | | 1,344,477 | |
| | | | | | | | | | | | |
Transportation - Services – 0.1% | | | | | | | | | | | | |
Hertz Corp. (The)
7.375%, 1/15/21(g) | | | | | | | 260 | | | | 260,000 | |
Hertz Holdings Netherlands BV
5.50%, 3/30/23(e) | | | EUR | | | | 160 | | | | 186,125 | |
United Rentals North America, Inc.
4.875%, 1/15/28 | | | $ | | | | 140 | | | | 133,542 | |
5.75%, 11/15/24 | | | | | | | 36 | | | | 37,216 | |
XPO Logistics, Inc.
6.125%, 9/01/23(e) | | | | | | | 30 | | | | 29,674 | |
6.75%, 8/15/24(e) | | | | | | | 200 | | | | 201,316 | |
| | | | | | | | | | | | |
| | | | | | | | | | | 847,873 | |
| | | | | | | | | | | | |
| | | | | | | | | | | 34,739,429 | |
| | | | | | | | | | | | |
Financial Institutions – 1.1% | | | | | | | | | | | | |
Banking – 0.6% | | | | | | | | | | | | |
Allied Irish Banks PLC
7.375%, 12/03/20(e)(n) | | | EUR | | | | 200 | | | | 244,552 | |
Ally Financial, Inc.
4.125%, 3/30/20 | | | $ | | | | 295 | | | | 296,636 | |
8.00%, 11/01/31 | | | | | | | 116 | | | | 142,154 | |
Banco Bilbao Vizcaya Argentaria SA
6.75%, 2/18/20(e)(n) | | | EUR | | | | 200 | | | | 234,883 | |
| | |
| |
| abfunds.com | | AB ALL MARKET TOTAL RETURN PORTFOLIO | 41 |
CONSOLIDATED PORTFOLIO OF INVESTMENTS(continued)
| | | | | | | | | | | | |
| | | | | | Principal
Amount
(000) | | | U.S. $ Value | |
| |
Banco de Sabadell SA
6.50%, 5/18/22(e)(n) | | | EUR | | | | 200 | | | $ | 215,508 | |
Banco Santander SA
6.75%, 4/25/22(e)(n) | | | | | | | 300 | | | | 365,121 | |
Barclays Bank PLC
6.86%, 6/15/32(e)(n) | | | $ | | | | 35 | | | | 36,400 | |
Barclays PLC
7.25%, 3/15/23(e)(n) | | | GBP | | | | 200 | | | | 276,212 | |
Citigroup, Inc.
5.95%, 1/30/23(n) | | | $ | | | | 365 | | | | 371,877 | |
Citizens Financial Group, Inc.
Series B
6.00%, 7/06/23(n) | | | | | | | 116 | | | | 111,523 | |
Credit Suisse Group AG
6.25%, 12/18/24(e)(n) | | | | | | | 200 | | | | 200,682 | |
7.50%, 12/11/23(e)(n) | | | | | | | 200 | | | | 214,434 | |
Goldman Sachs Group, Inc. (The)
Series P
5.00%, 11/10/22(n) | | | | | | | 210 | | | | 192,694 | |
Lloyds Banking Group PLC
7.625%, 6/27/23(e)(n) | | | GBP | | | | 260 | | | | 368,156 | |
Royal Bank of Scotland Group PLC
8.625%, 8/15/21(n) | | | $ | | | | 0 | ** | | | 473 | |
Societe Generale SA
7.375%, 9/13/21(e)(n) | | | | | | | 200 | | | | 207,178 | |
8.00%,9/29/25(e)(n) | | | | | | | 200 | | | | 211,722 | |
UBS Group Funding Switzerland AG
7.00%, 2/19/25(e)(n) | | | | | | | 400 | | | | 423,304 | |
UniCredit SpA
9.25%, 6/03/22(e)(n) | | | EUR | | | | 200 | | | | 251,945 | |
| | | | | | | | | | | | |
| | | | | | | | | | | 4,365,454 | |
| | | | | | | | | | | | |
Brokerage – 0.0% | | | | | | | | | | | | |
Lehman Brothers Holdings, Inc.
5.625%, 1/24/13(a)(b)(c)(k) | | | $ | | | | 1,030 | | | | 20,077 | |
LPL Holdings, Inc.
5.75%, 9/15/25(e) | | | | | | | 199 | | | | 200,840 | |
| | | | | | | | | | | | |
| | | | | | | | | | | 220,917 | |
| | | | | | | | | | | | |
Finance – 0.2% | | | | | | | | | | | | |
Compass Group Diversified Holdings LLC
8.00%, 5/01/26(e) | | | | | | | 105 | | | | 109,074 | |
Curo Group Holdings Corp.
8.25%, 9/01/25(e) | | | | | | | 207 | | | | 177,507 | |
Enova International, Inc.
8.50%,9/01/24-9/15/25(e) | | | | | | | 245 | | | | 233,062 | |
goeasy Ltd.
7.875%, 11/01/22(e) | | | | | | | 62 | | | | 65,290 | |
| | |
| |
| 42 | AB ALL MARKET TOTAL RETURN PORTFOLIO | | abfunds.com |
CONSOLIDATED PORTFOLIO OF INVESTMENTS(continued)
| | | | | | | | | | | | |
| | | | | | Principal
Amount
(000) | | | U.S. $ Value | |
| |
Navient Corp.
5.00%, 10/26/20 | | | $ | | | | 115 | | | $ | 116,286 | |
5.50%, 1/25/23 | | | | | | | 194 | | | | 191,555 | |
5.875%, 3/25/21 | | | | | | | 1 | | | | 1,452 | |
6.50%, 6/15/22 | | | | | | | 79 | | | | 80,966 | |
7.25%,1/25/22-9/25/23 | | | | | | | 85 | | | | 88,770 | |
8.00%, 3/25/20 | | | | | | | 237 | | | | 247,426 | |
SLM Corp.
5.125%, 4/05/22 | | | | | | | 30 | | | | 29,759 | |
TMX Finance LLC/TitleMax Finance Corp.
11.125%, 4/01/23(e) | | | | | | | 112 | | | | 103,868 | |
| | | | | | | | | | | | |
| | | | | | | | | | | 1,445,015 | |
| | | | | | | | | | | | |
Insurance – 0.1% | | | | | | | | | | | | |
Ambac Assurance Corp.
5.10%, 6/07/20(b)(e) | | | | | | | 5 | | | | 6,658 | |
Liberty Mutual Group, Inc.
7.80%, 3/15/37(e) | | | | | | | 298 | | | | 339,561 | |
Polaris Intermediate Corp.
8.50%, 12/01/22(e)(j) | | | | | | | 266 | | | | 262,985 | |
WellCare Health Plans, Inc.
5.375%, 8/15/26(e) | | | | | | | 78 | | | | 80,177 | |
| | | | | | | | | | | | |
| | | | | | | | | | | 689,381 | |
| | | | | | | | | | | | |
Other Finance – 0.1% | | | | | | | | | | | | |
Intrum AB
2.75%, 7/15/22(e) | | | EUR | | | | 130 | | | | 144,995 | |
LHC3 PLC
4.125%, 8/15/24(e)(j) | | | | | | | 146 | | | | 167,777 | |
NVA Holdings, Inc./United States
6.875%, 4/01/26(e) | | | $ | | | | 101 | | | | 97,543 | |
Tempo Acquisition LLC/Tempo Acquisition Finance Corp.
6.75%, 6/01/25(e) | | | | | | | 217 | | | | 219,428 | |
Travelport Corporate Finance PLC
6.00%, 3/15/26(e) | | | | | | | 57 | | | | 60,647 | |
| | | | | | | | | | | | |
| | | | | | | | | | | 690,390 | |
| | | | | | | | | | | | |
REITS – 0.1% | | | | | | | | | | | | |
Iron Mountain, Inc.
5.25%, 3/15/28(e) | | | | | | | 205 | | | | 196,736 | |
MGM Growth Properties Operating Partnership LP/MGP FinanceCo-Issuer, Inc.
5.75%, 2/01/27(e) | | | | | | | 105 | | | | 107,414 | |
MPT Operating Partnership LP/MPT Finance Corp.
5.00%, 10/15/27 | | | | | | | 30 | | | | 29,856 | |
| | |
| |
| abfunds.com | | AB ALL MARKET TOTAL RETURN PORTFOLIO | 43 |
CONSOLIDATED PORTFOLIO OF INVESTMENTS(continued)
| | | | | | | | | | | | |
| | | | | | Principal
Amount
(000) | | | U.S. $ Value | |
| |
5.25%, 8/01/26 | | | $ | | | | 96 | | | $ | 97,780 | |
5.50%, 5/01/24 | | | | | | | 5 | | | | 5,080 | |
| | | | | | | | | | | | |
| | | | | | | | | | | 436,866 | |
| | | | | | | | | | | | |
| | | | | | | | | | | 7,848,023 | |
| | | | | | | | | | | | |
Utility – 0.1% | | | | | | | | | | | | |
Electric – 0.1% | | | | | | | | | | | | |
AES Corp./VA
4.875%, 5/15/23 | | | | | | | 75 | | | | 75,839 | |
Calpine Corp.
5.375%, 1/15/23 | | | | | | | 172 | | | | 170,065 | |
5.50%, 2/01/24 | | | | | | | 36 | | | | 34,303 | |
5.75%, 1/15/25 | | | | | | | 89 | | | | 84,772 | |
NRG Energy, Inc.
5.75%, 1/15/28 | | | | | | | 100 | | | | 102,500 | |
Talen Energy Supply LLC
4.60%, 12/15/21 | | | | | | | 4 | | | | 3,600 | |
6.50%, 6/01/25(g) | | | | | | | 163 | | | | 145,718 | |
10.50%, 1/15/26(e) | | | | | | | 133 | | | | 138,702 | |
Texas Competitive/TCEH
11.50%, 10/01/20(a)(b)(d)(l) | | | | | | | 142 | | | | – 0 | – |
Vistra Energy Corp.
5.875%, 6/01/23 | | | | | | | 18 | | | | 18,923 | |
7.375%, 11/01/22 | | | | | | | 0 | ** | | | 439 | |
7.625%, 11/01/24 | | | | | | | 16 | | | | 17,333 | |
Vistra Operations Co. LLC
5.625%, 2/15/27(e) | | | | | | | 140 | | | | 144,207 | |
| | | | | | | | | | | | |
| | | | | | | | | | | 936,401 | |
| | | | | | | | | | | | |
Natural Gas – 0.0% | | | | | | | | | | | | |
NGL Energy Partners LP/NGL Energy Finance Corp.
7.50%, 11/01/23 | | | | | | | 227 | | | | 234,216 | |
| | | | | | | | | | | | |
| | | | | | | | | | | 1,170,617 | |
| | | | | | | | | | | | |
Total Corporates –Non-Investment Grade
(cost $45,688,205) | | | | | | | | | | | 43,758,069 | |
| | | | | | | | | | | | |
| | | | | | | | | | | | |
INFLATION-LINKED SECURITIES – 1.8% | | | | | | | | | | | | |
Japan – 1.8% | | | | | | | | | | | | |
Japanese Government CPI Linked Bond
Series 22
0.10%, 3/10/27
(cost $13,232,667) | | | JPY | | | | 1,382,156 | | | | 12,821,387 | |
| | | | | | | | | | | | |
| | | | | | | | | | | | |
GOVERNMENTS – TREASURIES – 1.8% | | | | | | | | | | | | |
Colombia – 0.1% | | | | | | | | | | | | |
Colombian TES
Series B
10.00%, 7/24/24 | | | COP | | | | 1,391,900 | | | | 532,920 | |
| | | | | | | | | | | | |
| | |
| |
| 44 | AB ALL MARKET TOTAL RETURN PORTFOLIO | | abfunds.com |
CONSOLIDATED PORTFOLIO OF INVESTMENTS(continued)
| | | | | | | | | | | | |
| | | | | | Principal
Amount
(000) | | | U.S. $ Value | |
| |
Malaysia – 0.0% | | | | | | | | | | | | |
Malaysia Government Bond
Series 3/04
5.734%, 7/30/19 | | | MYR | | | | 1,169 | | | $ | 290,202 | |
| | | | | | | | | | | | |
| | | |
Mexico – 0.1% | | | | | | | | | | | | |
Mexican Bonos
Series M 20
7.50%, 6/03/27 | | | MXN | | | | 9,211 | | | | 459,638 | |
| | | | | | | | | | | | |
| | | |
Russia – 0.1% | | | | | | | | | | | | |
Russian Federal Bond – OFZ
Series 6217
7.50%, 8/18/21 | | | RUB | | | | 40,638 | | | | 613,484 | |
| | | | | | | | | | | | |
| | | |
United States – 1.5% | | | | | | | | | | | | |
U.S. Treasury Notes
1.625%, 5/15/26(o) | | | $ | | | | 1,714 | | | | 1,601,786 | |
1.75%, 9/30/22(o) | | | | | | | 1,551 | | | | 1,511,256 | |
2.25%,2/15/27-8/15/27(o) | | | | | | | 7,800 | | | | 7,560,281 | |
| | | | | | | | | | | | |
| | | | | | | | | | | 10,673,323 | |
| | | | | | | | | | | | |
Uruguay – 0.0% | | | | | | | | | | | | |
Uruguay Government International Bond
8.50%, 3/15/28(e) | | | UYU | | | | 3,101 | | | | 83,580 | |
9.875%, 6/20/22(e) | | | | | | | 2,522 | | | | 77,166 | |
| | | | | | | | | | | | |
| | | | | | | | | | | 160,746 | |
| | | | | | | | | | | | |
Total Governments – Treasuries
(cost $12,987,774) | | | | | | | | | | | 12,730,313 | |
| | | | | | | | | | | | |
| | | | | | | | | | | | |
EMERGING MARKETS – SOVEREIGNS – 1.6% | | | | | | | | | | | | |
Angola – 0.1% | | | | | | | | | | | | |
Angolan Government International Bond
9.50%, 11/12/25(e) | | | $ | | | | 386 | | | | 437,628 | |
| | | | | | | | | | | | |
| | | |
Bahrain – 0.1% | | | | | | | | | | | | |
Bahrain Government International Bond
6.75%, 9/20/29(e) | | | | | | | 200 | | | | 208,000 | |
7.00%, 10/12/28(e) | | | | | | | 200 | | | | 211,250 | |
| | | | | | | | | | | | |
| | | | | | | | | | | 419,250 | |
| | | | | | | | | | | | |
Brazil – 0.1% | | | | | | | | | | | | |
Brazilian Government International Bond
4.625%, 1/13/28(g) | | | | | | | 435 | | | | 432,057 | |
| | | | | | | | | | | | |
| | | |
Cameroon – 0.0% | | | | | | | | | | | | |
Republic of Cameroon International Bond
9.50%, 11/19/25(e) | | | | | | | 200 | | | | 214,250 | |
| | | | | | | | | | | | |
| | |
| |
| abfunds.com | | AB ALL MARKET TOTAL RETURN PORTFOLIO | 45 |
CONSOLIDATED PORTFOLIO OF INVESTMENTS(continued)
| | | | | | | | | | | | |
| | | | | | Principal
Amount
(000) | | | U.S. $ Value | |
| |
Costa Rica – 0.0% | | | | | | | | | | | | |
Costa Rica Government International Bond
4.37%, 5/22/19(l) | | | $ | | | | 107 | | | $ | 107,401 | |
| | | | | | | | | | | | |
| | | |
Dominican Republic – 0.1% | | | | | | | | | | | | |
Dominican Republic International Bond
5.95%, 1/25/27(e) | | | | | | | 220 | | | | 228,434 | |
8.625%, 4/20/27(e) | | | | | | | 425 | | | | 493,531 | |
| | | | | | | | | | | | |
| | | | | | | | | | | 721,965 | |
| | | | | | | | | | | | |
Ecuador – 0.1% | |
Ecuador Government International Bond
8.875%, 10/23/27(e) | | | | | | | 500 | | | | 497,453 | |
10.50%, 3/24/20(e) | | | | | | | 205 | | | | 213,459 | |
| | | | | | | | | | | | |
| | | | | | | | | | | 710,912 | |
| | | | | | | | | | | | |
Egypt – 0.1% | |
Egypt Government International Bond
6.125%, 1/31/22(e) | | | | | | | 407 | | | | 413,614 | |
6.20%, 3/01/24(e) | | | | | | | 445 | | | | 451,662 | |
| | | | | | | | | | | | |
| | | | | | | | | | | 865,276 | |
| | | | | | | | | | | | |
El Salvador – 0.0% | |
El Salvador Government International Bond
7.375%, 12/01/19(e) | | | | | | | 200 | | | | 202,603 | |
| | | | | | | | | | | | |
|
Gabon – 0.1% | |
Gabon Government International Bond
6.375%, 12/12/24(e) | | | | | | | 360 | | | | 346,950 | |
| | | | | | | | | | | | |
|
Ghana – 0.0% | |
Ghana Government International Bond
10.75%, 10/14/30(e) | | | | | | | 248 | | | | 297,910 | |
| | | | | | | | | | | | |
|
Honduras – 0.1% | |
Honduras Government International Bond
6.25%, 1/19/27(e) | | | | | | | 180 | | | | 186,204 | |
7.50%, 3/15/24(e) | | | | | | | 200 | | | | 216,553 | |
| | | | | | | | | | | | |
| | | | | | | | | | | 402,757 | |
| | | | | | | | | | | | |
Ivory Coast – 0.1% | |
Ivory Coast Government International Bond
6.375%, 3/03/28(e) | | | | | | | 635 | | | | 620,712 | |
| | | | | | | | | | | | |
|
Jamaica – 0.0% | |
Jamaica Government International Bond
7.875%, 7/28/45 | | | | | | | 200 | | | | 237,491 | |
| | | | | | | | | | | | |
| | |
| |
| 46 | AB ALL MARKET TOTAL RETURN PORTFOLIO | | abfunds.com |
CONSOLIDATED PORTFOLIO OF INVESTMENTS(continued)
| | | | | | | | | | | | |
| | | | | | Principal
Amount
(000) | | | U.S. $ Value | |
| |
Lebanon – 0.0% | |
Lebanon Government International Bond
Series G
6.20%, 2/26/25(e) | | | $ | | | | 87 | | | $ | 74,059 | |
6.60%, 11/27/26(e) | | | | | | | 133 | | | | 113,050 | |
6.65%, 4/22/24(e) | | | | | | | 45 | | | | 39,544 | |
Series G
6.00%, 5/20/19(e) | | | | | | | 62 | | | | 61,457 | |
| | | | | | | | | | | | |
| | | | | | | | | | | 288,110 | |
| | | | | | | | | | | | |
Mongolia – 0.1% | | | | | | | | | | | | |
Mongolia Government International Bond
5.125%, 12/05/22(e) | | | | | | | 270 | | | | 268,313 | |
10.875%, 4/06/21(e) | | | | | | | 200 | | | | 221,750 | |
| | | | | | | | | | | | |
| | | | | | | | | | | 490,063 | |
| | | | | | | | | | | | |
Nigeria – 0.1% | | | | | | | | | | | | |
Nigeria Government International Bond
6.50%, 11/28/27(e) | | | | | | | 200 | | | | 196,750 | |
6.75%, 1/28/21(e) | | | | | | | 200 | | | | 207,500 | |
7.625%, 11/21/25(e) | | | | | | | 550 | | | | 583,000 | |
| | | | | | | | | | | | |
| | | | | | | | | | | 987,250 | |
| | | | | | | | | | | | |
Oman – 0.1% | | | | | | | | | | | | |
Oman Government International Bond
4.125%, 1/17/23(e) | | | | | | | 600 | | | | 577,500 | |
| | | | | | | | | | | | |
| | | |
Senegal – 0.1% | | | | | | | | | | | | |
Senegal Government International Bond
6.25%, 5/23/33(e) | | | | | | | 365 | | | | 346,294 | |
| | | | | | | | | | | | |
| | | |
South Africa – 0.1% | | | | | | | | | | | | |
Republic of South Africa Government International Bond
5.875%, 9/16/25 | | | | | | | 550 | | | | 576,812 | |
| | | | | | | | | | | | |
| | | |
Sri Lanka – 0.0% | | | | | | | | | | | | |
Sri Lanka Government International Bond
6.20%, 5/11/27(e) | | | | | | | 220 | | | | 204,060 | |
| | | | | | | | | | | | |
| | | |
Turkey – 0.1% | | | | | | | | | | | | |
Turkey Government International Bond
7.25%, 12/23/23 | | | | | | | 416 | | | | 434,200 | |
7.375%, 2/05/25 | | | | | | | 135 | | | | 141,412 | |
7.50%, 11/07/19 | | | | | | | 136 | | | | 138,550 | |
| | | | | | | | | | | | |
| | | | | | | | | | | 714,162 | |
| | | | | | | | | | | | |
Ukraine – 0.1% | | | | | | | | | | | | |
Ukraine Government International Bond
7.75%,9/01/23-9/01/24(e) | | | | | | | 765 | | | | 726,712 | |
| | | | | | | | | | | | |
| | |
| |
| abfunds.com | | AB ALL MARKET TOTAL RETURN PORTFOLIO | 47 |
CONSOLIDATED PORTFOLIO OF INVESTMENTS(continued)
| | | | | | | | | | | | |
| | | | | | Principal
Amount
(000) | | | U.S. $ Value | |
| |
Venezuela – 0.0% | | | | | | | | | | | | |
Venezuela Government International Bond
9.25%, 9/15/27(a)(c)(i) | | | $ | | | | 815 | | | $ | 254,688 | |
| | | | | | | | | | | | |
| | | |
Total Emerging Markets – Sovereigns
(cost $11,334,213) | | | | | | | | | | | 11,182,813 | |
| | | | | | | | | | | | |
| | | | | | | | | | | | |
CORPORATES – INVESTMENT GRADE – 1.4% | | | | | | | | | | | | |
Financial Institutions – 0.8% | | | | | | | | | | | | |
Banking – 0.5% | | | | | | | | | | | | |
Axis Bank Ltd./Dubai
3.25%, 5/21/20(e) | | | | | | | 200 | | | | 198,414 | |
Bank of America Corp.
Series AA
6.10%, 3/17/25(n) | | | | | | | 243 | | | | 257,031 | |
Series DD
6.30%, 3/10/26(n) | | | | | | | 114 | | | | 123,957 | |
Series Z
6.50%, 10/23/24(n) | | | | | | | 7 | | | | 7,594 | |
BNP Paribas SA
7.625%, 3/30/21(e)(n) | | | | | | | 142 | | | | 149,333 | |
BPCE SA
5.70%, 10/22/23(e) | | | | | | | 200 | | | | 210,189 | |
Citigroup Capital XVIII
1.793% (Sterling LIBOR 3 Month + 0.89%), 6/28/67(p) | | | GBP | | | | 185 | | | | 221,971 | |
Credit Agricole SA
8.125%, 12/23/25(e)(n) | | | $ | | | | 400 | | | | 446,768 | |
Credit Suisse Group Funding Guernsey Ltd.
3.80%, 6/09/23 | | | | | | | 222 | | | | 221,849 | |
Deutsche Bank AG/New York NY
3.375%, 5/12/21 | | | | | | | 121 | | | | 118,245 | |
DNB Bank ASA
6.50%, 3/26/22(e)(n) | | | | | | | 201 | | | | 206,041 | |
HSBC Holdings PLC
6.00%, 9/29/23(e)(n) | | | EUR | | | | 220 | | | | 280,851 | |
Morgan Stanley
5.00%, 11/24/25 | | | $ | | | | 211 | | | | 221,759 | |
Royal Bank of Scotland Group PLC
6.125%, 12/15/22 | | | | | | | 315 | | | | 332,300 | |
Santander Holdings USA, Inc.
4.40%, 7/13/27 | | | | | | | 141 | | | | 137,699 | |
Standard Chartered PLC
3.95%, 1/11/23(e) | | | | | | | 142 | | | | 141,323 | |
Swedbank AB
6.00%, 3/17/22(e)(n) | | | | | | | 200 | | | | 195,538 | |
| | |
| |
| 48 | AB ALL MARKET TOTAL RETURN PORTFOLIO | | abfunds.com |
CONSOLIDATED PORTFOLIO OF INVESTMENTS(continued)
| | | | | | | | | | | | |
| | | | | | Principal
Amount
(000) | | | U.S. $ Value | |
| |
Wells Fargo & Co.
4.125%, 8/15/23 | | | $ | | | | 212 | | | $ | 218,086 | |
| | | | | | | | | | | | |
| | | | | | | | | | | 3,688,948 | |
| | | | | | | | | | | | |
Insurance – 0.3% | | | | | | | | | | | | |
Allstate Corp. (The)
6.50%, 5/15/57 | | | | | | | 191 | | | | 202,194 | |
American International Group, Inc.
8.175%, 5/15/58 | | | | | | | 110 | | | | 127,510 | |
Assicurazioni Generali SpA
5.50%, 10/27/47(e) | | | EUR | | | | 185 | | | | 228,979 | |
Caisse Nationale de Reassurance Mutuelle Agricole Groupama
6.00%, 1/23/27 | | | | | | | 200 | | | | 270,538 | |
CNP Assurances
4.50%, 6/10/47(e) | | | | | | | 200 | | | | 253,735 | |
MetLife, Inc.
6.40%, 12/15/36 | | | $ | | | | 275 | | | | 291,464 | |
Nationwide Mutual Insurance Co.
9.375%, 8/15/39(e) | | | | | | | 75 | | | | 115,376 | |
Prudential Financial, Inc.
5.20%, 3/15/44 | | | | | | | 44 | | | | 43,511 | |
5.625%, 6/15/43 | | | | | | | 126 | | | | 130,761 | |
SCOR SE
3.00%, 6/08/46(e) | | | EUR | | | | 100 | | | | 119,422 | |
| | | | | | | | | | | | |
| | | | | | | | | | | 1,783,490 | |
| | | | | | | | | | | | |
REITS – 0.0% | | | | | | | | | | | | |
GLP Capital LP/GLP Financing II, Inc.
5.375%, 11/01/23 | | | $ | | | | 18 | | | | 18,323 | |
HCP, Inc.
4.25%, 11/15/23 | | | | | | | 118 | | | | 120,883 | |
Senior Housing Properties Trust
6.75%, 12/15/21 | | | | | | | 21 | | | | 22,261 | |
Spirit Realty LP
4.45%, 9/15/26 | | | | | | | 13 | | | | 12,568 | |
| | | | | | | | | | | | |
| | | | | | | | | | | 174,035 | |
| | | | | | | | | | | | |
| | | | | | | | | | | 5,646,473 | |
| | | | | | | | | | | | |
Industrial – 0.5% | | | | | | | | | | | | |
Basic – 0.1% | | | | | | | | | | | | |
ArcelorMittal
6.75%, 3/01/41 | | | | | | | 54 | | | | 57,954 | |
7.00%, 10/15/39 | | | | | | | 53 | | | | 58,133 | |
Equate Petrochemical BV
3.00%, 3/03/22(e) | | | | | | | 255 | | | | 249,390 | |
Fresnillo PLC
5.50%, 11/13/23(e) | | | | | | | 200 | | | | 208,500 | |
| | |
| |
| abfunds.com | | AB ALL MARKET TOTAL RETURN PORTFOLIO | 49 |
CONSOLIDATED PORTFOLIO OF INVESTMENTS(continued)
| | | | | | | | | | | | |
| | | | | | Principal
Amount
(000) | | | U.S. $ Value | |
| |
Glencore Finance Canada Ltd.
6.00%, 11/15/41(e) | | | $ | | | | 11 | | | $ | 11,406 | |
Glencore Funding LLC
4.00%, 4/16/25(e)(g) | | | | | | | 12 | | | | 11,850 | |
| | | | | | | | | | | | |
| | | | | | | | | | | 597,233 | |
| | | | | | | | | | | | |
Capital Goods – 0.0% | | | | | | | | | | | | |
General Electric Co.
Series D
5.00%, 1/21/21(n) | | | | | | | 122 | | | | 114,911 | |
| | | | | | | | | | | | |
| | | |
Communications - Telecommunications – 0.1% | | | | | | | | | | | | |
Sprint Spectrum Co. LLC/Sprint Spectrum Co. II LLC/Sprint Spectrum Co. III LLC
4.738%, 3/20/25(e) | | | | | | | 330 | | | | 330,769 | |
| | | | | | | | | | | | |
| | | |
Consumer Cyclical - Automotive – 0.0% | | | | | | | | | | | | |
General Motors Co.
5.20%, 4/01/45 | | | | | | | 140 | | | | 121,964 | |
6.25%, 10/02/43 | | | | | | | 185 | | | | 182,830 | |
| | | | | | | | | | | | |
| | | | | | | | | | | 304,794 | |
| | | | | | | | | | | | |
Consumer Cyclical - Entertainment – 0.0% | |
Silversea Cruise Finance Ltd.
7.25%, 2/01/25(e) | | | | | | | 213 | | | | 230,565 | |
| | | | | | | | | | | | |
|
ConsumerNon-Cyclical – 0.2% | |
Anheuser-Busch InBev Finance, Inc.
2.65%, 2/01/21 | | | | | | | 45 | | | | 45,191 | |
Constellation Brands, Inc.
3.75%, 5/01/21 | | | | | | | 49 | | | | 49,491 | |
CVS Health Corp.
4.78%, 3/25/38 | | | | | | | 265 | | | | 257,516 | |
HCA, Inc.
4.25%, 10/15/19 | | | | | | | 451 | | | | 453,403 | |
6.50%, 2/15/20 | | | | | | | 370 | | | | 380,929 | |
Universal Health Services, Inc.
4.75%, 8/01/22(e) | | | | | | | 151 | | | | 152,755 | |
| | | | | | | | | | | | |
| | | | | | | | | | | 1,339,285 | |
| | | | | | | | | | | | |
Energy – 0.1% | |
Cenovus Energy, Inc.
6.75%, 11/15/39 | | | | | | | 4 | | | | 3,734 | |
Ecopetrol SA
5.375%, 6/26/26 | | | | | | | 90 | | | | 94,635 | |
5.875%, 5/28/45 | | | | | | | 37 | | | | 37,153 | |
Energy Transfer Operating LP
6.125%, 12/15/45 | | | | | | | 135 | | | | 140,392 | |
| | |
| |
| 50 | AB ALL MARKET TOTAL RETURN PORTFOLIO | | abfunds.com |
CONSOLIDATED PORTFOLIO OF INVESTMENTS(continued)
| | | | | | | | | | | | |
| | | | | | Principal
Amount
(000) | | | U.S. $ Value | |
| |
Energy Transfer Partners LP/Regency Energy Finance Corp.
4.50%, 11/01/23 | | | $ | | | | 95 | | | $ | 97,492 | |
Kinder Morgan, Inc./DE
4.30%, 6/01/25 | | | | | | | 140 | | | | 143,463 | |
Series G
7.75%, 1/15/32 | | | | | | | 28 | | | | 34,794 | |
Shell International Finance BV
2.25%, 11/10/20 | | | | | | | 275 | | | | 272,822 | |
| | | | | | | | | | | | |
| | | | | | | | | | | 824,485 | |
| | | | | | | | | | | | |
Technology – 0.0% | |
Dell International LLC/EMC Corp.
6.02%, 6/15/26(e) | | | | | | | 20 | | | | 21,226 | |
Seagate HDD Cayman
4.75%, 1/01/25 | | | | | | | 68 | | | | 65,500 | |
4.875%, 6/01/27 | | | | | | | 252 | | | | 235,322 | |
| | | | | | | | | | | | |
| | | | | | | | | | | 322,048 | |
| | | | | | | | | | | | |
| | | | | | | | | | | 4,064,090 | |
| | | | | | | | | | | | |
Utility – 0.1% | | | | | | | | | | | | |
Electric – 0.1% | |
DPL, Inc.
6.75%, 10/01/19 | | | | | | | 31 | | | | 31,243 | |
Duke Energy Corp.
3.95%, 10/15/23 | | | | | | | 209 | | | | 214,125 | |
Israel Electric Corp., Ltd.
Series 6
5.00%, 11/12/24(e) | | | | | | | 200 | | | | 207,750 | |
| | | | | | | | | | | | |
| | | | | | | | | | | 453,118 | |
| | | | | | | | | | | | |
Total Corporates – Investment Grade
(cost $10,502,433) | | | | | | | | | | | 10,163,681 | |
| | | | | |
| | | | | | | | | | | | |
COLLATERALIZED MORTGAGE OBLIGATIONS – 1.0% | | | | | | | | | | | | |
Risk Share Floating Rate – 1.0% | | | | | | | | | | | | |
Bellemeade Re Ltd.
Series2018-2A, Class M1B
3.84% (LIBOR 1 Month + 1.35%), 8/25/28(e)(p) | | | | | | | 254 | | | | 253,169 | |
Series2018-3A, Class M2
5.24% (LIBOR 1 Month + 2.75%), 10/25/27(e)(p) | | | | | | | 150 | | | | 150,346 | |
Eagle RE Ltd.
Series2018-1, Class M2
5.49% (LIBOR 1 Month + 3.00%), 11/25/28(e)(p) | | | | | | | 150 | | | | 150,589 | |
| | |
| |
| abfunds.com | | AB ALL MARKET TOTAL RETURN PORTFOLIO | 51 |
CONSOLIDATED PORTFOLIO OF INVESTMENTS(continued)
| | | | | | | | | | |
| | | | | Principal
Amount
(000) | | | U.S. $ Value | |
| |
Federal Home Loan Mortgage Corp. Structured Agency Credit Risk Debt Notes
Series2013-DN1, Class M2
9.64% (LIBOR 1 Month + 7.15%), 7/25/23(p) | | $ | | | 34 | | | $ | 40,181 | |
Series2013-DN2, Class M2
6.74% (LIBOR 1 Month + 4.25%), 11/25/23(p) | | | | | 114 | | | | 124,822 | |
Series2014-DN1, Class M3
6.99% (LIBOR 1 Month + 4.50%),
2/25/24(p) | | | | | 89 | | | | 99,351 | |
Series2014-HQ2, Class M3
6.24% (LIBOR 1 Month + 3.75%), 9/25/24(p) | | | | | 131 | | | | 144,224 | |
Series2014-HQ3, Class M3
7.24% (LIBOR 1 Month + 4.75%), 10/25/24(p) | | | | | 368 | | | | 406,537 | |
Series 2017-HQA1, Class M2
6.04% (LIBOR 1 Month + 3.55%), 8/25/29(p) | | | | | 450 | | | | 486,893 | |
Federal National Mortgage Association Connecticut Avenue Securities
Series2013-C01, Class M2
7.74% (LIBOR 1 Month + 5.25%), 10/25/23(p) | | | | | 34 | | | | 38,870 | |
Series2014-C01, Class M2
6.89% (LIBOR 1 Month + 4.40%), 1/25/24(p) | | | | | 66 | | | | 73,214 | |
Series2014-C02, Class 1M2
5.09% (LIBOR 1 Month + 2.60%), 5/25/24(p) | | | | | 228 | | | | 240,011 | |
Series2014-C03, Class 1M2
5.49% (LIBOR 1 Month + 3.00%), 7/25/24(p) | | | | | 199 | | | | 211,825 | |
Series2014-C04, Class 1M2
7.39% (LIBOR 1 Month + 4.90%), 11/25/24(p) | | | | | 206 | | | | 232,498 | |
Series2014-C04, Class 2M2
7.49% (LIBOR 1 Month + 5.00%), 11/25/24(p) | | | | | 395 | | | | 440,410 | |
Series2015-C01, Class 1M2
6.79% (LIBOR 1 Month + 4.30%), 2/25/25(p) | | | | | 236 | | | | 257,696 | |
Series2015-C01, Class 2M2
7.04% (LIBOR 1 Month + 4.55%), 2/25/25(p) | | | | | 124 | | | | 133,719 | |
| | |
| |
| 52 | AB ALL MARKET TOTAL RETURN PORTFOLIO | | abfunds.com |
CONSOLIDATED PORTFOLIO OF INVESTMENTS(continued)
| | | | | | | | | | | | |
| | | | | | Principal
Amount
(000) | | | U.S. $ Value | |
| |
Series2015-C02, Class 1M2
6.49% (LIBOR 1 Month + 4.00%), 5/25/25(p) | | | $ | | | | 236 | | | $ | 256,753 | |
Series2015-C02, Class 2M2
6.49% (LIBOR 1 Month + 4.00%), 5/25/25(p) | | | | | | | 210 | | | | 224,662 | |
Series2015-C03, Class 1M2
7.49% (LIBOR 1 Month + 5.00%), 7/25/25(p) | | | | | | | 12 | | | | 13,892 | |
Series2015-C03, Class 2M2
7.49% (LIBOR 1 Month + 5.00%), 7/25/25(p) | | | | | | | 293 | | | | 324,219 | |
Series2015-C04, Class 2M2
8.04% (LIBOR 1 Month + 5.55%), 4/25/28(p) | | | | | | | 311 | | | | 349,448 | |
Series2016-C01, Class 2M2
9.44% (LIBOR 1 Month + 6.95%), 8/25/28(p) | | | | | | | 204 | | | | 236,628 | |
Series2016-C03, Class 2M2
8.39% (LIBOR 1 Month + 5.90%), 10/25/28(p) | | | | | | | 421 | | | | 480,307 | |
Series2016-C05, Class 2M2
6.94% (LIBOR 1 Month + 4.45%), 1/25/29(p) | | | | | | | 465 | | | | 511,144 | |
Series2016-C07, Class 2M2
6.84% (LIBOR 1 Month + 4.35%), 5/25/29(p) | | | | | | | 475 | | | | 517,812 | |
Series2017-C01, Class 1B1
8.24% (LIBOR 1 Month + 5.75%), 7/25/29(p) | | | | | | | 440 | | | | 517,143 | |
Series2018-C01, Class 1B1
6.04% (LIBOR 1 Month + 3.55%), 7/25/30(p) | | | | | | | 107 | | | | 107,299 | |
Series2018-R07, Class 1B1
6.84% (LIBOR 1 Month + 4.35%), 4/25/31(e)(p) | | | | | | | 51 | | | | 51,866 | |
Home Re Ltd.
Series2018-1, Class M2
5.49% (LIBOR 1 Month + 3.00%), 10/25/28(e)(p) | | | | | | | 235 | | | | 235,671 | |
| | | | | | | | | | | | |
| | | | | | | | | | | 7,311,199 | |
| | | | | | | | | | | | |
Agency Fixed Rate – 0.0% | | | | | | | | | | | | |
Federal National Mortgage Association Grantor Trust
Series2004-T5, Class AB4
3.152%, 5/28/35(b) | | | | | | | 96 | | | | 89,263 | |
| | | | | | | | | | | | |
| | |
| |
| abfunds.com | | AB ALL MARKET TOTAL RETURN PORTFOLIO | 53 |
CONSOLIDATED PORTFOLIO OF INVESTMENTS(continued)
| | | | | | | | | | | | |
| | | | | | Principal
Amount
(000) | | | U.S. $ Value | |
| |
Non-Agency Fixed Rate – 0.0% | | | | | | | | | | | | |
Alternative Loan Trust
Series 2006-28CB, Class A14
6.25%, 10/25/36 | | | $ | | | | 13 | | | $ | 10,383 | |
CSMC Mortgage-Backed Trust
Series2006-7, Class 3A12
6.25%, 8/25/36 | | | | | | | 17 | | | | 13,489 | |
| | | | | | | | | | | | |
| | | | | | | | | | | 23,872 | |
| | | | | | | | | | | | |
Total Collateralized Mortgage Obligations
(cost $7,336,244) | | | | | | | | | | | 7,424,334 | |
| | | | | | | | | | | | |
| | | | | | | | | | | | |
EMERGING MARKETS – CORPORATE BONDS – 0.9% | | | | | | | | | | | | |
Industrial – 0.7% | | | | | | | | | | | | |
Basic – 0.2% | | | | | | | | | | | | |
Consolidated Energy Finance SA
6.875%, 6/15/25(e) | | | | | | | 200 | | | | 195,364 | |
CSN Resources SA
7.625%, 2/13/23(e) | | | | | | | 200 | | | | 200,750 | |
First Quantum Minerals Ltd.
7.00%, 2/15/21(e) | | | | | | | 33 | | | | 33,003 | |
7.25%,5/15/22-4/01/23(e)(g) | | | | | | | 542 | | | | 536,950 | |
Vedanta Resources PLC
6.375%, 7/30/22(e) | | | | | | | 220 | | | | 206,800 | |
| | | | | | | | | | | | |
| | | | | | | | | | | 1,172,867 | |
| | | | | | | | | | | | |
Capital Goods – 0.0% | | | | | | | | | | | | |
Odebrecht Finance Ltd.
5.25%, 6/27/29(a)(e)(i) | | | | | | | 200 | | | | 24,000 | |
| | | | | | | | | | | | |
| | | |
Communications - Telecommunications – 0.1% | | | | | | | | | | | | |
Digicel Group One Ltd.
8.25%, 12/30/22(e)(g) | | | | | | | 149 | | | | 99,859 | |
Digicel Group Two Ltd.
8.25%, 9/30/22(e) | | | | | | | 153 | | | | 64,260 | |
Millicom International Cellular SA
5.125%, 1/15/28(e)(g) | | | | | | | 200 | | | | 189,500 | |
MTN Mauritius Investments Ltd.
6.50%, 10/13/26(e) | | | | | | | 200 | | | | 200,750 | |
| | | | | | | | | | | | |
| | | | | | | | | | | 554,369 | |
| | | | | | | | | | | | |
Consumer Cyclical - Other – 0.1% | | | | | | | | | | | | |
Wynn Macau Ltd.
4.875%, 10/01/24(e) | | | | | | | 214 | | | | 205,064 | |
5.50%, 10/01/27(e) | | | | | | | 214 | | | | 202,899 | |
| | | | | | | | | | | | |
| | | | | | | | | | | 407,963 | |
| | | | | | | | | | | | |
| | |
| |
| 54 | AB ALL MARKET TOTAL RETURN PORTFOLIO | | abfunds.com |
CONSOLIDATED PORTFOLIO OF INVESTMENTS(continued)
| | | | | | | | | | | | |
| | | | | | Principal
Amount
(000) | | | U.S. $ Value | |
| |
Consumer Cyclical - Retailers – 0.0% | |
K2016470219 South Africa Ltd.
3.00%, 12/31/22(b)(j)(l) | | | $ | | | | 36 | | | $ | 11 | |
K2016470260 South Africa Ltd.
25.00%, 12/31/22(b)(j)(l) | | | | | | | 12 | | | | 309 | |
| | | | | | | | | | | | |
| | | | | | | | | | | 320 | |
| | | | | | | | | | | | |
ConsumerNon-Cyclical – 0.2% | |
Cosan Ltd.
5.95%, 9/20/24(e) | | | | | | | 360 | | | | 369,119 | |
MARB BondCo PLC
6.875%, 1/19/25(e) | | | | | | | 200 | | | | 194,468 | |
Minerva Luxembourg SA
6.50%, 9/20/26(e) | | | | | | | 220 | | | | 211,750 | |
Natura Cosmeticos SA
5.375%, 2/01/23(e) | | | | | | | 200 | | | | 201,626 | |
Rede D’or Finance SARL
4.95%, 1/17/28(e) | | | | | | | 200 | | | | 188,850 | |
Teva Pharmaceutical Finance Netherlands III BV
1.70%, 7/19/19 | | | | | | | 94 | | | | 92,970 | |
2.80%, 7/21/23 | | | | | | | 152 | | | | 138,176 | |
3.15%, 10/01/26 | | | | | | | 55 | | | | 45,595 | |
Tonon Luxembourg SA
7.25%, 1/24/20(a)(b)(i)(j)(l) | | | | | | | 14 | | | | 306 | |
Virgolino de Oliveira Finance SA
10.50%, 1/28/18(a)(b)(k)(l) | | | | | | | 434 | | | | 21,501 | |
| | | | | | | | | | | | |
| | | | | | | | | | | 1,464,361 | |
| | | | | | | | | | | | |
Energy – 0.1% | |
CHC Group LLC/CHC Finance Ltd.
Series AI
Zero Coupon, 10/01/20(f) | | | | | | | 158 | | | | 110,933 | |
Cosan Luxembourg SA
7.00%, 1/20/27(e) | | | | | | | 200 | | | | 213,451 | |
Petrobras Global Finance BV
6.125%, 1/17/22 | | | | | | | 3 | | | | 3,507 | |
6.25%, 3/17/24 | | | | | | | 210 | | | | 222,285 | |
8.75%, 5/23/26 | | | | | | | 208 | | | | 245,586 | |
YPF SA
16.50%, 5/09/22(e) | | | ARS | | | | 2,493 | | | | 42,048 | |
| | | | | | | | | | | | |
| | | | | | | | | | | 837,810 | |
| | | | | | | | | | | | |
Transportation - Airlines – 0.0% | |
Guanay Finance Ltd.
6.00%, 12/15/20(e) | | | $ | | | | 10 | | | | 10,091 | |
Latam Finance Ltd.
6.875%, 4/11/24(e) | | | | | | | 285 | | | | 288,503 | |
| | | | | | | | | | | | |
| | | | | | | | | | | 298,594 | |
| | | | | | | | | | | | |
| | |
| |
| abfunds.com | | AB ALL MARKET TOTAL RETURN PORTFOLIO | 55 |
CONSOLIDATED PORTFOLIO OF INVESTMENTS(continued)
| | | | | | | | | | | | |
| | | | | | Principal
Amount
(000) | | | U.S. $ Value | |
| |
Transportation - Services – 0.0% | |
Rumo Luxembourg SARL
7.375%, 2/09/24(e) | | | $ | | | | 200 | | | $ | 214,000 | |
| | | | | | | | | | | | |
| | | | | | | | | | | 4,974,284 | |
| | | | | | | | | | | | |
Financial Institutions – 0.1% | | | | | | | | | | | | |
Banking – 0.1% | | | | | | | | | | | | |
Akbank TAS
5.00%, 10/24/22(e) | | | | | | | 150 | | | | 142,500 | |
Fidelity Bank PLC
10.50%, 10/16/22(e) | | | | | | | 200 | | | | 203,500 | |
Turkiye Vakiflar Bankasi TAO
5.75%, 1/30/23(e) | | | | | | | 200 | | | | 186,750 | |
| | | | | | | | | | | | |
| | | | | | | | | | | 532,750 | |
| | | | | | | | | | | | |
Finance – 0.0% | | | | | | | | | | | | |
Unifin Financiera SAB de CV SOFOM ENR
7.00%, 1/15/25(e) | | | | | | | 200 | | | | 180,260 | |
| | | | | | | | | | | | |
| | | |
Insurance – 0.0% | | | | | | | | | | | | |
Ambac LSNI LLC
7.803% (LIBOR 3 Month + 5.00%), 2/12/23(b)(e)(p) | | | | | | | 21 | | | | 21,375 | |
| | | | | | | | | | | | |
| | | |
REITS – 0.0% | | | | | | | | | | | | |
China Evergrande Group
8.25%, 3/23/22(e) | | | | | | | 200 | | | | 190,789 | |
Yuzhou Properties Co., Ltd.
7.90%, 5/11/21(e) | | | | | | | 200 | | | | 203,703 | |
| | | | | | | | | | | | |
| | | | | | | | | | | 394,492 | |
| | | | | | | | | | | | |
| | | | | | | | | | | 1,128,877 | |
| | | | | | | | | | | | |
Utility – 0.1% | | | | | | | | | | | | |
Electric – 0.1% | | | | | | | | | | | | |
Genneia SA
8.75%, 1/20/22(e)(g) | | | | | | | 90 | | | | 83,700 | |
Light Servicos de Eletricidade SA/Light Energia SA
7.25%, 5/03/23(e) | | | | | | | 243 | | | | 246,029 | |
Terraform Global Operating LLC
6.125%, 3/01/26(l) | | | | | | | 37 | | | | 35,598 | |
| | | | | | | | | | | | |
| | | | | | | | | | | 365,327 | |
| | | | | | | | | | | | |
Total Emerging Markets – Corporate Bonds
(cost $6,854,755) | | | | | | | | | | | 6,468,488 | |
| | | | | |
| | | | | | | | | | | | |
| | |
| |
| 56 | AB ALL MARKET TOTAL RETURN PORTFOLIO | | abfunds.com |
CONSOLIDATED PORTFOLIO OF INVESTMENTS(continued)
| | | | | | | | | | | | |
| | | | | | Principal
Amount
(000) | | | U.S. $ Value | |
| |
EMERGING MARKETS – TREASURIES – 0.8% | | | | | | | | | | | | |
Argentina – 0.1% | |
Argentina POM Politica Monetaria
Series POM
65.51% (ARLLMONP), 6/21/20(p) | | | ARS | | | | 6,332 | | | $ | 175,288 | |
Argentine Bonos del Tesoro
15.50%, 10/17/26 | | | | | | | 2,158 | | | | 45,210 | |
16.00%, 10/17/23 | | | | | | | 6,755 | | | | 153,332 | |
18.20%, 10/03/21 | | | | | | | 14,265 | | | | 288,955 | |
| | | | | | | | | | | | |
| | | | | | | | | | | 662,785 | |
| | | | | | | | | | | | |
Brazil – 0.5% | | | | | | | | | | | | |
Brazil Letras do Tesouro Nacional
Series LTN
Zero Coupon, 10/01/19 | | | BRL | | | | 6,500 | | | | 1,668,327 | |
Brazil Notas do Tesouro Nacional
Series F
10.00%, 1/01/21 | | | | | | | 8,037 | | | | 2,237,602 | |
| | | | | | | | | | | | |
| | | | | | | | | | | 3,905,929 | |
| | | | | | | | | | | | |
Dominican Republic – 0.1% | | | | | | | | | | | | |
Dominican Republic International Bond
16.00%, 7/10/20(l) | | | DOP | | | | 13,700 | | | | 293,427 | |
| | | | | | | | | | | | |
| | | |
South Africa – 0.0% | | | | | | | | | | | | |
Republic of South Africa Government Bond
Series R186
10.50%, 12/21/26 | | | ZAR | | | | 3,037 | | | | 236,914 | |
| | | | | | | | | | | | |
| | | |
Turkey – 0.1% | | | | | | | | | | | | |
Turkey Government Bond
11.10%, 5/15/19 | | | TRY | | | | 4,030 | | | | 739,543 | |
| | | | | | | | | | | | |
| | | |
Total Emerging Markets – Treasuries
(cost $7,152,498) | | | | | | | | | | | 5,838,598 | |
| | | | | | | | | | | | |
| | | | | | | | | | | | |
BANK LOANS – 0.5% | | | | | | | | | | | | |
Industrial – 0.5% | | | | | | | | | | | | |
Basic – 0.0% | | | | | | | | | | | | |
Foresight Energy LLC
8.379% (LIBOR 3 Month + 5.75%), 3/28/22(q) | | | $ | | | | 29 | | | | 28,902 | |
| | | | | | | | | | | | |
| | | |
Capital Goods – 0.0% | | | | | | | | | | | | |
Brookfield WEC Holdings Inc. (fka Westinghouse Electric Company LLC)
6.243% (LIBOR 1 Month + 3.75%), 8/01/25(q) | | | | | | | 106 | | | | 105,850 | |
9.243% (LIBOR 1 Month + 6.75%), 8/03/26(b)(q) | | | | | | | 37 | | | | 37,143 | |
| | |
| |
| abfunds.com | | AB ALL MARKET TOTAL RETURN PORTFOLIO | 57 |
CONSOLIDATED PORTFOLIO OF INVESTMENTS(continued)
| | | | | | | | | | | | |
| | | | | | Principal
Amount
(000) | | | U.S. $ Value | |
| |
Gardner Denver, Inc.
5.243% (LIBOR 1 Month + 2.75%), 7/30/24(q) | | | $ | | | | 34 | | | $ | 34,061 | |
| | | | | | | | | | | | |
| | | | | | | | | | | 177,054 | |
| | | | | | | | | | | | |
Communications - Telecommunications – 0.0% | | | | | | | | | | | | |
Intelsat Jackson Holdings S.A.
6.625%, 1/02/24 | | | | | | | 15 | | | | 14,822 | |
6.979% (LIBOR 1 Month + 4.50%), 1/02/24(q) | | | | | | | 9 | | | | 8,866 | |
West Corporation
6.629% (LIBOR 1 Month + 4.00%), 10/10/14(q) | | | | | | | 0 | ** | | | 354 | |
6.630% (LIBOR 3 Month + 4.00%), 10/10/14(q) | | | | | | | 148 | | | | 139,759 | |
| | | | | | | | | | | | |
| | | | | | | | | | | 163,801 | |
| | | | | | | | | | | | |
Consumer Cyclical - Automotive – 0.0% | | | | | | | | | | | | |
Navistar, Inc.
6.020% (LIBOR 1 Month + 3.50%), 11/06/24(q) | | | | | | | 46 | | | | 45,931 | |
| | | | | | | | | | | | |
| | | |
Consumer Cyclical - Entertainment – 0.0% | | | | | | | | | | | | |
Seaworld Parks & Entertainment, Inc. (fka SW Acquisitions Co., Inc.)
5.493% (LIBOR 1 Month + 3.00%), 4/01/24(q) | | | | | | | 60 | | | | 59,573 | |
| | | | | | | | | | | | |
| | | |
Consumer Cyclical - Other – 0.1% | | | | | | | | | | | | |
Caesars Resort Collection, LLC (fka Caesars Growth Properties Holdings, LLC)
5.243% (LIBOR 1 Month + 2.75%), 12/23/24(q) | | | | | | | 186 | | | | 185,086 | |
Stars Group Holdings B.V.
6.303% (LIBOR 3 Month + 3.50%), 7/10/25(q) | | | | | | | 36 | | | | 36,251 | |
| | | | | | | | | | | | |
| | | | | | | | | | | 221,337 | |
| | | | | | | | | | | | |
Consumer Cyclical - Retailers – 0.0% | | | | | | | | | | | | |
Serta Simmons Bedding, LLC
10.494% (LIBOR 1 Month + 8.00%), 11/08/24(q) | | | | | | | 118 | | | | 79,113 | |
Specialty Building Products Holdings, LLC
8.243% (LIBOR 1 Month + 5.75%), 10/01/25(b)(q) | | | | | | | 140 | | | | 136,681 | |
| | | | | | | | | | | | |
| | | | | | | | | | | 215,794 | |
| | | | | | | | | | | | |
| | |
| |
| 58 | AB ALL MARKET TOTAL RETURN PORTFOLIO | | abfunds.com |
CONSOLIDATED PORTFOLIO OF INVESTMENTS(continued)
| | | | | | | | | | | | |
| | | | | | Principal
Amount
(000) | | | U.S. $ Value | |
| |
ConsumerNon-Cyclical – 0.2% | | | | | | | | | | | | |
Air Medical Group Holdings, Inc.
5.744% (LIBOR 1 Month + 3.25%), 4/28/22(q) | | | $ | | | | 298 | | | $ | 288,514 | |
Alphabet Holding Company, Inc. (fka Nature’s Bounty)
10.243% (LIBOR 1 Month + 7.75%), 9/26/25(q) | | | | | | | 263 | | | | 220,356 | |
athenahealth, Inc.
7.197% (LIBOR 3 Month + 4.50%), 2/11/26(b)(q) | | | | | | | 267 | | | | 265,602 | |
BI-LO, LLC
10.739% (LIBOR 3 Month + 8.00%), 5/31/24(q) | | | | | | | 168 | | | | 161,544 | |
10.779% (LIBOR 3 Month + 8.00%), 5/31/24(q) | | | | | | | 161 | | | | 154,098 | |
10.783% (LIBOR 3 Month + 8.00%), 5/31/24(q) | | | | | | | 168 | | | | 161,544 | |
Owens & Minor, Inc.
7.009% (LIBOR 1 Month + 4.50%), 4/30/25(b)(q) | | | | | | | 93 | | | | 79,848 | |
Regionalcare Hospital Partners Holdings, Inc.
6.981% (LIBOR 1 Month + 4.50%), 11/16/25(q) | | | | | | | 126 | | | | 125,790 | |
Vizient, Inc.
5.243% (LIBOR 1 Month + 2.75%), 2/13/23(q) | | | | | | | 2 | | | | 1,572 | |
| | | | | | | | | | | | |
| | | | | | | | | | | 1,458,868 | |
| | | | | | | | | | | | |
Energy – 0.1% | | | | | | | | | | | | |
California Resources Corporation
12.868% (LIBOR 1 Month + 10.38%), 12/31/21(q) | | | | | | | 113 | | | | 117,982 | |
Triton Solar Us Acquisition Co.
8.493% (LIBOR 1 Month + 6.00%), 10/29/24(b)(q) | | | | | | | 273 | | | | 251,208 | |
| | | | | | | | | | | | |
| | | | | | | | | | | 369,190 | |
| | | | | | | | | | | | |
Other Industrial – 0.0% | | | | | | | | | | | | |
American Tire Distributors, Inc.
10.129% (LIBOR 3 Month + 7.50%), 9/02/24(c)(q) | | | | | | | 73 | | | | 66,146 | |
Travelport Finance (Luxembourg) SARL
5.184% (LIBOR 3 Month + 2.50%), 3/17/25(q) | | | | | | | 55 | | | | 55,275 | |
| | | | | | | | | | | | |
| | | | | | | | | | | 121,421 | |
| | | | | | | | | | | | |
| | |
| |
| abfunds.com | | AB ALL MARKET TOTAL RETURN PORTFOLIO | 59 |
CONSOLIDATED PORTFOLIO OF INVESTMENTS(continued)
| | | | | | | | | | | | |
| | | | | | Principal
Amount
(000) | | | U.S. $ Value | |
| |
Services – 0.0% | | | | | | | | | | | | |
Financial & Risk US Holdings, Inc. (fka Refinitiv)
6.243% (LIBOR 1 Month + 3.75%), 10/01/25(q) | | | $ | | | | 45 | | | $ | 44,285 | |
Verscend Holding Corp.
6.993% (LIBOR 1 Month + 4.50%), 8/27/25(b)(q) | | | | | | | 91 | | | | 90,777 | |
| | | | | | | | | | | | |
| | | | | | | | | | | 135,062 | |
| | | | | | | | | | | | |
Technology – 0.1% | | | | | | | | | | | | |
Boxer Parent Company Inc.
(fka BMC Software, Inc.)
7.053% (LIBOR 3 Month + 4.25%), 10/02/25(q) | | | | | | | 100 | | | | 99,337 | |
MTS Systems Corporation
5.740% (LIBOR 1 Month + 3.25%), 7/05/23(b)(q) | | | | | | | 56 | | | | 54,777 | |
Solera, LLC (Solera Finance, Inc.)
5.243% (LIBOR 1 Month + 2.75%), 3/03/23(q) | | | | | | | 144 | | | | 143,009 | |
Veritas US Inc.
6.993% (LIBOR 1 Month + 4.50%), 1/27/23(q) | | | | | | | 75 | | | | 70,381 | |
7.303% (LIBOR 3 Month + 4.50%), 1/27/23(q) | | | | | | | 25 | | | | 23,074 | |
| | | | | | | | | | | | |
| | | | | | | | | | | 390,578 | |
| | | | | | | | | | | | |
Total Bank Loans
(cost $3,491,334) | | | | | | | | | | | 3,387,511 | |
| | | | | | | | | | | | |
| | | | | | | | | | | | |
ASSET-BACKED SECURITIES – 0.1% | | | | | | | | | | | | |
Other ABS - Fixed Rate – 0.1% | | | | | | | | | | | | |
Marlette Funding Trust
Series2018-3A, Class C
4.63%, 9/15/28(b)(e) | | | | | | | 125 | | | | 126,635 | |
SoFi Consumer Loan Program LLC
Series2017-6, Class C
4.02%, 11/25/26(b)(e) | | | | | | | 360 | | | | 360,115 | |
Taco Bell Funding LLC
Series2016-1A, Class A23
4.97%, 5/25/46(b)(e) | | | | | | | 38 | | | | 39,727 | |
| | | | | | | | | | | | |
| | | | | | | | | | | 526,477 | |
| | | | | | | | | | | | |
Home Equity Loans - Fixed Rate – 0.0% | | | | | | | | | | | | |
CWABS Asset-Backed Certificates Trust
Series2005-7, Class AF5W
5.054%, 10/25/35(b) | | | | | | | 140 | | | | 138,842 | |
| | |
| |
| 60 | AB ALL MARKET TOTAL RETURN PORTFOLIO | | abfunds.com |
CONSOLIDATED PORTFOLIO OF INVESTMENTS(continued)
| | | | | | | | | | | | |
| | | | | | Principal
Amount
(000) | | | U.S. $ Value | |
| |
GSAA Home Equity Trust
Series2006-6, Class AF5
6.241%, 3/25/36(b) | | | $ | | | | 180 | | | $ | 87,367 | |
| | | | | | | | | | | | |
| | | | | | | | | | | 226,209 | |
| | | | | | | | | | | | |
Autos - Fixed Rate – 0.0% | | | | | | | | | | | | |
CPS Auto Trust
Series2018-C, Class D
4.40%, 6/17/24(e) | | | | | | | 120 | | | | 121,254 | |
| | | | | | | | | | | | |
| | | |
Home Equity Loans - Floating Rate – 0.0% | | | | | | | | | | | | |
ABFC Trust
Series2003-WF1, Class A2
3.615% (LIBOR 1 Month + 1.13%), 12/25/32(b)(p) | | | | | | | 36 | | | | 36,043 | |
Lehman XS Trust
Series2007-6, Class 3A5
4.74%, 5/25/37(b) | | | | | | | 49 | | | | 47,915 | |
| | | | | | | | | | | | |
| | | | | | | | | | | 83,958 | |
| | | | | | | | | | | | |
Total Asset-Backed Securities
(cost $950,691) | | | | | | | | | | | 957,898 | |
| | | | | | | | | | | | |
| | | | | | | | | | | | |
COMMERCIAL MORTGAGE-BACKED SECURITIES – 0.1% | | | | | | | | | | | | |
Non-Agency Fixed Rate CMBS – 0.1% | | | | | | | | | | | | |
Citigroup Commercial Mortgage Trust
Series 2014-GC23, Class D
4.50%, 7/10/47(b)(e) | | | | | | | 35 | | | | 32,914 | |
GS Mortgage Securities Trust
Series 2014-GC18, Class D
4.991%, 1/10/47(b)(e) | | | | | | | 71 | | | | 63,701 | |
JP Morgan Chase Commercial Mortgage Securities Trust
Series2012-CBX, Class E
5.191%, 6/15/45(b)(e) | | | | | | | 298 | | | | 278,630 | |
JPMBB Commercial Mortgage Securities Trust
Series2013-C17, Class D
4.891%, 1/15/47(b)(e) | | | | | | | 71 | | | | 70,196 | |
Morgan Stanley Capital I Trust
Series2005-IQ9, Class D
5.00%, 7/15/56(b)(c) | | | | | | | 105 | | | | 97,745 | |
| | | | | | | | | | | | |
| | | | | | | | | | | 543,186 | |
| | | | | | | | | | | | |
| | |
| |
| abfunds.com | | AB ALL MARKET TOTAL RETURN PORTFOLIO | 61 |
CONSOLIDATED PORTFOLIO OF INVESTMENTS(continued)
| | | | | | | | | | | | |
| | | | | | Principal
Amount
(000) | | | U.S. $ Value | |
| |
Non-Agency Floating Rate CMBS – 0.0% | | | | | | | | | | | | |
CLNS Trust
Series 2017-IKPR, Class F
7.017% (LIBOR 1 Month + 4.50%), 6/11/32(b)(e)(p) | | | $ | | | | 110 | | | $ | 110,412 | |
DBWF Mortgage Trust
Series 2018-GLKS, Class E
5.50% (LIBOR 1 Month + 3.02%), 11/19/35(b)(e)(p) | | | | | | | 100 | | | | 100,379 | |
| | | | | | | | | | | | |
| | | | | | | | | | | 210,791 | |
| | | | | | | | | | | | |
Total Commercial Mortgage-Backed Securities
(cost $766,856) | | | | | | | | | | | 753,977 | |
| | | | | | | | | | | | |
| | | | | | | | | | | | |
COLLATERALIZED LOAN OBLIGATIONS – 0.1% | | | | | | | | | | | | |
CLO - Floating Rate – 0.1% | | | | | | | | | | | | |
Dryden Senior Loan Fund
Series2017-49A, Class E
9.08% (LIBOR 3 Month + 6.30%), 7/18/30(b)(e)(p) | | | | | | | 250 | | | | 243,241 | |
Rockford Tower CLO Ltd.
Series2017-2A, Class D
6.237% (LIBOR 3 Month + 3.45%), 10/15/29(b)(e)(p) | | | | | | | 306 | | | | 305,731 | |
| | | | | | | | | | | | |
| | | |
Total Collateralized Loan Obligations
(cost $560,827) | | | | | | | | | | | 548,972 | |
| | | | | | | | | | | | |
| | | | | | | | | | | | |
LOCAL GOVERNMENTS – REGIONAL BONDS – 0.0% | | | | | | | | | | | | |
Argentina – 0.0% | | | | | | | | | | | | |
Provincia de Buenos Aires/Argentina
7.875%, 6/15/27(e)
(cost $257,234) | | | | | | | 341 | | | | 270,398 | |
| | | | | | | | | | | | |
| | | | | | | | | | | | |
LOCAL GOVERNMENTS – US MUNICIPAL BONDS – 0.0% | | | | | | | | | | | | |
United States – 0.0% | | | | | | | | | | | | |
State of California
Series 2010
7.60%, 11/01/40 | | | | | | | 60 | | | | 89,995 | |
7.95%, 3/01/36 | | | | | | | 130 | | | | 136,261 | |
| | | | | | | | | | | | |
Total Local Governments – US Municipal Bonds
(cost $225,931) | | | | | | | | | | | 226,256 | |
| | | | | | | | | | | | |
| | |
| |
| 62 | AB ALL MARKET TOTAL RETURN PORTFOLIO | | abfunds.com |
CONSOLIDATED PORTFOLIO OF INVESTMENTS(continued)
| | | | | | | | | | | | |
| | | | | | Notional Amount | | | U.S. $ Value | |
| |
OPTIONS PURCHASED – PUTS – 0.0% | | | | | | | | | | | | |
Options on Forward Contracts – 0.0% | | | | | | | | | | | | |
EUR/USD
Expiration: Mar 2019; Contracts: 7,373,000;
Exercise Price: EUR 0.89;
Counterparty: JPMorgan Chase Bank, NA(a) | | �� | EUR | | | | 7,373,000 | | | $ | 2,608 | |
EUR/USD
Expiration: Mar 2019; Contracts: 7,375,000;
Exercise Price: EUR 0.89;
Counterparty: Morgan Stanley Capital Services LLC(a) | | | EUR | | | | 7,375,000 | | | | 2,449 | |
AUD/USD
Expiration: Jun 2019; Contracts: 13,200,000;
Exercise Price: AUD 1.45;
Counterparty: Morgan Stanley Capital Services LLC(a) | | | AUD | | | | 13,200,000 | | | | 92,155 | |
| | | | | | | | | | | | |
| | | |
Total Options Purchased – Puts
(premiums paid $186,884) | | | | | | | | | | | 97,212 | |
| | | | | | | | | | | | |
| | | |
| | | | | | Shares | | | | |
PREFERRED STOCKS – 0.0% | | | | | | | | | | | | |
Utility – 0.0% | | | | | | | | | | | | |
Electric – 0.0% | | | | | | | | | | | | |
SCE Trust III
Series H
5.75%(g) | | | | | | | 1,027 | | | | 24,751 | |
| | | | | | | | | | | | |
| | | |
Financial Institutions – 0.0% | | | | | | | | | | | | |
Banking – 0.0% | | | | | | | | | | | | |
GMAC Capital Trust I
Series 2
8.469% | | | | | | | 868 | | | | 22,559 | |
| | | | | | | | | | | | |
| | | |
Industrial – 0.0% | | | | | | | | | | | | |
Consumer Cyclical - Other – 0.0% | | | | | | | | | | | | |
Hovnanian Enterprises, Inc.
7.625% | | | | | | | 1,190 | | | | 3,285 | |
| | | | | | | | | | | | |
| | | |
Energy – 0.0% | | | | | | | | | | | | |
Sanchez Energy Corp.
Series A
4.875% | | | | | | | 2,338 | | | | 444 | |
| | | | | | | | | | | | |
| | |
| |
| abfunds.com | | AB ALL MARKET TOTAL RETURN PORTFOLIO | 63 |
CONSOLIDATED PORTFOLIO OF INVESTMENTS(continued)
| | | | | | | | | | | | |
| Company | | | | | Shares | | | U.S. $ Value | |
| |
Technology – 0.0% | | | | | | | | | | | | |
Goodman Networks, Inc.
0.00%(a)(b)(c)(d) | | | | | | | 3,576 | | | $ | – 0 | – |
| | | | | | | | | | | | |
| | | | | | | | | | | 3,729 | |
| | | | | | | | | | | | |
Total Preferred Stocks
(cost $126,090) | | | | | | | | | | | 51,039 | |
| | | | | | | | | | | | |
| | | | | | | | | | | | |
| | | |
| | | | | | Principal
Amount
(000) | | | | |
QUASI-SOVEREIGNS – 0.0% | | | | | | | | | | | | |
Quasi-Sovereign Bonds – 0.0% | | | | | | | | | | | | |
Mexico – 0.0% | | | | | | | | | | | | |
Petroleos Mexicanos
6.50%, 1/23/29
(cost $40,982) | | | $ | | | | 41 | | | | 38,993 | |
| | | | | | | | | | | | |
| | | |
| | | | | | Shares | | | | |
WARRANTS – 0.0% | | | | | | | | | | | | |
Information Technology – 0.0% | | | | | | | | | | | | |
Software – 0.0% | | | | | | | | | | | | |
Avaya Holdings Corp.,
expiring 12/15/22(a) | | | | | | | 4,686 | | | | 7,029 | |
| | | | | | | | | | | | |
| | | |
Industrials – 0.0% | | | | | | | | | | | | |
Construction & Engineering – 0.0% | | | | | | | | | | | | |
Willscot Corp.,
expiring 11/29/22(a)(b)(c)(d) | | | | | | | 1,913 | | | | 2,984 | |
| | | | | | | | | | | | |
| | | |
Energy – 0.0% | | | | | | | | | | | | |
Oil, Gas & Consumable Fuels – 0.0% | | | | | | | | | | | | |
Midstates Petroleum Co., Inc.,
expiring(a)(c) | | | | | | | 2,090 | | | | 314 | |
SandRidge Energy, Inc.,A-CW22,
expiring 10/04/22(a) | | | | | | | 4,803 | | | | 48 | |
SandRidge Energy, Inc.,B-CW22,
expiring 10/04/22(a) | | | | | | | 2,019 | | | | 20 | |
| | | | | | | | | | | | |
| | | | | | | | | | | 382 | |
| | | | | | | | | | | | |
Total Warrants
(cost $20,248) | | | | | | | | | | | 10,395 | |
| | | | | | | | | | | | |
| | |
| |
| 64 | AB ALL MARKET TOTAL RETURN PORTFOLIO | | abfunds.com |
CONSOLIDATED PORTFOLIO OF INVESTMENTS(continued)
| | | | | | | | | | | | |
| | | | | | Notional Amount | | | U.S. $ Value | |
| |
OPTIONS PURCHASED – CALLS – 0.0% | | | | | | | | | | | | |
Options on Forward Contracts – 0.0% | | | | | | | | | | | | |
TRY/EUR
Expiration: Mar 2019; Contracts: 18,200,741;
Exercise Price: TRY 5.99;
Counterparty: JPMorgan Chase Bank, NA(a)
(premiums paid $44,823) | | | TRY | | | | 18,200,741 | | | $ | 7,818 | |
| | | | | | | | | | | | |
| | | |
| | | | | | Principal
Amount
(000) | | | | |
MORTGAGE PASS-THROUGHS – 0.0% | | | | | | | | | | | | |
Agency Fixed Rate30-Year – 0.0% | | | | | | | | | | | | |
Federal National Mortgage Association
Series 2006
5.00%, 1/01/36
(cost $177) | | | $ | | | | 0 | ** | | | 174 | |
| | | | | | | | | | | | |
| | | | | | | | | | | | |
SHORT-TERM INVESTMENTS – 18.9% | | | | | | | | | | | | |
Governments – Treasuries – 10.0% | | | | | | | | | | | | |
Japan – 10.0% | | | | | | | | | | | | |
Japan Treasury Discount Bill
Series 810
Zero Coupon, 5/09/19
(cost $73,350,441) | | | JPY | | | | 8,030,000 | | | | 72,067,926 | |
| | | | | | | | | | | | |
| | | |
| | | | | | Shares | | | | |
Investment Companies – 8.6% | | | | | | | | | | | | |
AB Fixed Income Shares, Inc. – Government Money Market Portfolio – Class AB, 2.35%(h)(r)(s)
(cost $62,495,707) | | | | | | | 62,495,707 | | | | 62,495,707 | |
| | | | | | | | | | | | |
| | | |
| | | | | | Principal
Amount
(000) | | | | |
U.S. Treasury Bills – 0.3% | | | | | | | | | | | | |
U.S. Treasury Bill
Zero Coupon, 5/09/19(o)
(cost $1,990,927) | | | $ | | | | 2,000 | | | | 1,990,819 | |
| | | | | | | | | | | | |
| | | |
Total Short-Term Investments
(cost $137,837,075) | | | | | | | | | | | 136,554,452 | |
| | | | | | | | | | | | |
| | | |
Total Investments Before Security Lending Collateral for Securities Loaned – 98.1%
(cost $673,965,761) | | | | | | | | | | | 710,852,467 | |
| | | | | | | | | | | | |
| | |
| |
| abfunds.com | | AB ALL MARKET TOTAL RETURN PORTFOLIO | 65 |
CONSOLIDATED PORTFOLIO OF INVESTMENTS(continued)
| | | | | | | | | | | | |
| Company | | | | | Shares | | | U.S. $ Value | |
| |
INVESTMENTS OF CASH COLLATERAL FOR SECURITIES LOANED – 2.6% | | | | | | | | | | | | |
Investment Companies – 2.6% | | | | | | | | | | | | |
AB Fixed Income Shares, Inc. – Government Money Market Portfolio – Class AB, 2.35%(h)(r)(s)
(cost $18,793,508) | | | | | | | 18,793,508 | | | $ | 18,793,508 | |
| | | | | | | | | | | | |
| | | |
Total Investments – 100.7%
(cost $692,759,269) | | | | | | | | | | | 729,645,975 | |
Other assets less liabilities – (0.7)% | | | | | | | | | | | (5,400,238 | ) |
| | | | | | | | | | | | |
| | | |
Net Assets – 100.0% | | | | | | | | | | $ | 724,245,737 | |
| | | | | | | | | | | | |
FUTURES (see Note D)
| | | | | | | | | | | | | | | | | | | | | | | | | | |
| Description | | Number of
Contracts | | | Expiration
Month | | | Notional
(000) | | | Original Value | | | Value at
February 28,
2019 | | | Unrealized
Appreciation/
(Depreciation) | |
Purchased Contracts | |
10 Yr Japan Bond (OSE) Futures | | | 130 | | | | March 2019 | | | JPY | | | 13,000,000 | | | $ | 177,191,719 | | | $ | 178,138,429 | | | $ | 946,710 | |
Amsterdam Index Futures | | | 13 | | | | March 2019 | | | EUR | | | 3 | | | | 1,575,272 | | | | 1,599,995 | | | | 24,723 | |
DAX Index Futures | | | 9 | | | | March 2019 | | | EUR | | | 0 | *** | | | 2,777,751 | | | | 2,948,269 | | | | 170,518 | |
Euro Buxl 30 Yr Bond Futures | | | 98 | | | | March 2019 | | | EUR | | | 9,800 | | | | 19,881,590 | | | | 20,514,946 | | | | 633,356 | |
Euro-BOBL Futures | | | 135 | | | | March 2019 | | | EUR | | | 13,500 | | | | 20,314,676 | | | | 20,379,908 | | | | 65,232 | |
Euro-Bund Futures | | | 165 | | | | March 2019 | | | EUR | | | 16,500 | | | | 30,533,953 | | | | 31,025,240 | | | | 491,287 | |
Euro-CAC40 10 Futures | | | 64 | | | | March 2019 | | | EUR | | | 1 | | | | 3,677,952 | | | | 3,813,822 | | | | 135,870 | |
Euro-Schatz Futures | | | 202 | | | | March 2019 | | | EUR | | | 20,200 | | | | 25,709,752 | | | | 25,691,148 | | | | (18,604 | ) |
FTSE/MIB Index Futures | | | 9 | | | | March 2019 | | | EUR | | | 0 | *** | | | 972,471 | | | | 1,057,231 | | | | 84,760 | |
IBEX 35 Index Futures | | | 13 | | | | March 2019 | | | EUR | | | 0 | *** | | | 1,326,783 | | | | 1,374,008 | | | | 47,225 | |
Long Gilt Futures | | | 234 | | | | June 2019 | | | GBP | | | 23,400 | | | | 39,494,309 | | | | 39,040,917 | | | | (453,392 | ) |
Mini MSCI Emerging Markets Futures | | | 793 | | | | March 2019 | | | USD | | | 40 | | | | 39,787,209 | | | | 41,501,655 | | | | 1,714,446 | |
MSCI EAFE Futures | | | 132 | | | | March 2019 | | | USD | | | 7 | | | | 11,732,797 | | | | 12,335,400 | | | | 602,603 | |
| | |
| |
| 66 | AB ALL MARKET TOTAL RETURN PORTFOLIO | | abfunds.com |
CONSOLIDATED PORTFOLIO OF INVESTMENTS(continued)
| | | | | | | | | | | | | | | | | | | | | | | | | | | | |
| Description | | Number of
Contracts | | | Expiration
Month | | | Notional
(000) | | | Original Value | | | Value at
February 28,
2019 | | | Unrealized
Appreciation/
(Depreciation) | |
OMXS30 Index Futures | | | 289 | | | | March 2019 | | | | SEK | | | | 29 | | | $ | 4,837,084 | | | $ | 4,918,883 | | | $ | 81,799 | |
S&P 500E-Mini Futures | | | 236 | | | | March 2019 | | | | USD | | | | 12 | | | | 31,383,679 | | | | 32,859,460 | | | | 1,475,781 | |
S&P Mid 400E-Mini Futures | | | 48 | | | | March 2019 | | | | USD | | | | 5 | | | | 8,545,827 | | | | 9,171,840 | | | | 626,013 | |
TOPIX Index Futures | | | 11 | | | | March 2019 | | | | JPY | | | | 110 | | | | 1,534,005 | | | | 1,584,892 | | | | 50,887 | |
U.S.T-Note 2 Yr (CBT) Futures | | | 44 | | | | June 2019 | | | | USD | | | | 8,800 | | | | 9,336,992 | | | | 9,336,594 | | | | (398 | ) |
U.S.T-Note 5 Yr (CBT) Futures | | | 312 | | | | June 2019 | | | | USD | | | | 31,200 | | | | 35,758,477 | | | | 35,743,500 | | | | (14,977 | ) |
U.S.T-Note 10 Yr (CBT) Futures | | | 249 | | | | June 2019 | | | | USD | | | | 24,900 | | | | 30,516,805 | | | | 30,378,000 | | | | (138,805 | ) |
U.S. Ultra Bond (CBT) Futures | | | 194 | | | | June 2019 | | | | USD | | | | 19,400 | | | | 31,385,084 | | | | 30,961,188 | | | | (423,896 | ) |
|
Sold Contracts | |
10 Yr Australian Bond Futures | | | 98 | | | | March 2019 | | | | AUD | | | | 9,800 | | | | 9,215,532 | | | | 9,385,559 | | | | (170,027 | ) |
10 Yr Canadian Bond Futures | | | 60 | | | | June 2019 | | | | CAD | | | | 6,000 | | | | 6,214,424 | | | | 6,187,621 | | | | 26,803 | |
10 Yr Mini Japan Government Bond Futures | | | 334 | | | | March 2019 | | | | JPY | | | | 3,340,000 | | | | 45,706,962 | | | | 45,731,916 | | | | (24,954 | ) |
Euro Buxl 30 Yr Bond Futures | | | 25 | | | | March 2019 | | | | EUR | | | | 2,500 | | | | 5,185,196 | | | | 5,233,406 | | | | (48,210 | ) |
Euro STOXX 50 Index Futures | | | 219 | | | | March 2019 | | | | EUR | | | | 2 | | | | 7,567,018 | | | | 8,215,366 | | | | (648,348 | ) |
Euro-BOBL Futures | | | 65 | | | | March 2019 | | | | EUR | | | | 6,500 | | | | 9,816,776 | | | | 9,812,548 | | | | 4,228 | |
Euro-Bund Futures | | | 53 | | | | March 2019 | | | | EUR | | | | 5,300 | | | | 9,901,290 | | | | 9,965,683 | | | | (64,393 | ) |
Euro-Schatz Futures | | | 78 | | | | March 2019 | | | | EUR | | | | 7,800 | | | | 9,931,536 | | | | 9,920,344 | | | | 11,192 | |
FTSE 100 Index Futures | | | 37 | | | | March 2019 | | | | GBP | | | | 0 | *** | | | 3,310,725 | | | | 3,472,297 | | | | (161,572 | ) |
Hang Seng Index Futures | | | 19 | | | | March 2019 | | | | HKD | | | | 1 | | | | 3,503,688 | | | | 3,469,244 | | | | 34,444 | |
MSCI Singapore Index ETS Futures | | | 129 | | | | March 2019 | | | | SGD | | | | 13 | | | | 3,487,942 | | | | 3,433,003 | | | | 54,939 | |
S&P 500E-Mini Futures | | | 47 | | | | March 2019 | | | | USD | | | | 2 | | | | 6,392,571 | | | | 6,544,045 | | | | (151,474 | ) |
S&P/TSX 60 Index Futures | | | 17 | | | | March 2019 | | | | CAD | | | | 3 | | | | 2,286,810 | | | | 2,460,701 | | | | (173,891 | ) |
SPI 200 Futures | | | 31 | | | | March 2019 | | | | AUD | | | | 1 | | | | 3,040,282 | | | | 3,380,390 | | | | (340,108 | ) |
TOPIX Index Futures | | | 31 | | | | March 2019 | | | | JPY | | | | 310 | | | | 4,305,017 | | | | 4,466,514 | | | | (161,497 | ) |
U.S. 10 Yr Ultra Futures | | | 23 | | | | June 2019 | | | | USD | | | | 2,300 | | | | 2,988,351 | | | | 2,977,422 | | | | 10,929 | |
U.S.T-Note 5 Yr (CBT) Futures | | | 32 | | | | June 2019 | | | | USD | | | | 3,200 | | | | 3,667,459 | | | | 3,666,000 | | | | 1,459 | |
U.S.T-Note 10 Yr (CBT) Futures | | | 44 | | | | June 2019 | | | | USD | | | | 4,400 | | | | 5,384,096 | | | | 5,368,000 | | | | 16,096 | |
U.S. Ultra Bond Futures (CBT) | | | 16 | | | | June 2019 | | | | USD | | | | 1,600 | | | | 2,599,883 | | | | 2,553,500 | | | | 46,383 | |
| | | | | | | | | | | | | | | | | | | | | | | | | | | | |
| | | | | | | | | | | | | | | | | | | | | | | | | | $ | 4,363,137 | |
| | | | | | | | | | | | | | | | | | | | | | | | | | | | |
| | |
| |
| abfunds.com | | AB ALL MARKET TOTAL RETURN PORTFOLIO | 67 |
CONSOLIDATED PORTFOLIO OF INVESTMENTS(continued)
FORWARD CURRENCY EXCHANGE CONTRACTS (see Note D)
| | | | | | | | | | | | | | | | |
| Counterparty | | Contracts to
Deliver
(000) | | | In Exchange
For
(000) | | | Settlement
Date | | | Unrealized
Appreciation/
(Depreciation) | |
Bank of America, NA | | CLP | 4,460,196 | | | USD | 6,551 | | | | 3/15/19 | | | $ | (249,923 | ) |
Bank of America, NA | | RUB | 95,011 | | | USD | 1,424 | | | | 3/07/19 | | | | (16,047 | ) |
Bank of America, NA | | CAD | 2,839 | | | USD | 2,129 | | | | 3/07/19 | | | | (28,659 | ) |
Bank of America, NA | | EUR | 491 | | | USD | 561 | | | | 4/10/19 | | | | 737 | |
Bank of America, NA | | USD | 726 | | | CAD | 966 | | | | 3/15/19 | | | | 8,378 | |
Bank of America, NA | | TRY | 2,524 | | | EUR | 410 | | | | 3/28/19 | | | | 1,779 | |
Barclays Bank PLC | | KRW | 6,722,287 | | | USD | 5,990 | | | | 3/15/19 | | | | 15,550 | |
Barclays Bank PLC | | JPY | 567,766 | | | USD | 5,243 | | | | 3/15/19 | | | | 145,015 | |
Barclays Bank PLC | | RUB | 48,406 | | | USD | 724 | | | | 3/07/19 | | | | (10,360 | ) |
Barclays Bank PLC | | INR | 70,943 | | | USD | 985 | | | | 3/18/19 | | | | (15,300 | ) |
Barclays Bank PLC | | CNY | 39,610 | | | USD | 5,768 | | | | 3/15/19 | | | | (147,261 | ) |
Barclays Bank PLC | | SEK | 37,696 | | | USD | 4,253 | | | | 3/15/19 | | | | 167,624 | |
Barclays Bank PLC | | CNY | 23,813 | | | USD | 3,512 | | | | 6/17/19 | | | | (38,068 | ) |
Barclays Bank PLC | | ILS | 16,549 | | | USD | 4,525 | | | | 4/16/19 | | | | (53,779 | ) |
Barclays Bank PLC | | NOK | 12,322 | | | USD | 1,446 | | | | 4/12/19 | | | | 3,935 | |
Barclays Bank PLC | | BRL | 19,145 | | | USD | 5,128 | | | | 3/06/19 | | | | 31,162 | |
Barclays Bank PLC | | ZAR | 11,277 | | | USD | 803 | | | | 3/15/19 | | | | 3,613 | |
Barclays Bank PLC | | BRL | 7,499 | | | USD | 2,006 | | | | 4/02/19 | | | | 13,569 | |
Barclays Bank PLC | | BRL | 4,173 | | | USD | 1,115 | | | | 3/15/19 | | | | 4,758 | |
Barclays Bank PLC | | EUR | 2,553 | | | USD | 2,938 | | | | 3/15/19 | | | | 31,011 | |
Barclays Bank PLC | | GBP | 2,141 | | | USD | 2,714 | | | | 3/15/19 | | | | (127,036 | ) |
Barclays Bank PLC | | CAD | 966 | | | USD | 726 | | | | 3/15/19 | | | | (8,316 | ) |
Barclays Bank PLC | | USD | 888 | | | TRY | 4,789 | | | | 3/28/19 | | | | (4,502 | ) |
Barclays Bank PLC | | USD | 1,596 | | | CAD | 2,124 | | | | 3/15/19 | | | | 18,289 | |
Barclays Bank PLC | | USD | 4,053 | | | AUD | 5,676 | | | | 3/15/19 | | | | (25,740 | ) |
Barclays Bank PLC | | USD | 5,126 | | | BRL | 19,145 | | | | 3/06/19 | | | | (28,634 | ) |
Barclays Bank PLC | | USD | 3,116 | | | BRL | 11,646 | | | | 4/02/19 | | | | (21,073 | ) |
Barclays Bank PLC | | USD | 4,682 | | | TWD | 143,520 | | | | 3/14/19 | | | | (24,433 | ) |
Barclays Bank PLC | | USD | 1,094 | | | RUB | 71,854 | | | | 3/07/19 | | | | (4,894 | ) |
Barclays Bank PLC | | USD | 1,455 | | | INR | 102,563 | | | | 3/18/19 | | | | (9,644 | ) |
Barclays Bank PLC | | USD | 2,144 | | | PHP | 113,199 | | | | 6/17/19 | | | | 26,473 | |
Barclays Bank PLC | | USD | 2,155 | | | PHP | 113,647 | | | | 3/15/19 | | | | 35,400 | |
Barclays Bank PLC | | USD | 1,462 | | | JPY | 160,070 | | | | 3/15/19 | | | | (24,797 | ) |
Barclays Bank PLC | | USD | 5,378 | | | INR | 379,530 | | | | 3/15/19 | | | | (26,387 | ) |
Barclays Bank PLC | | USD | 32 | | | IDR | 457,519 | | | | 5/09/19 | | | | 335 | |
Barclays Bank PLC | | USD | 2,931 | | | KRW | 3,280,421 | | | | 5/16/19 | | | | (9,713 | ) |
Barclays Bank PLC | | USD | 2,089 | | | IDR | 29,627,798 | | | | 6/17/19 | | | | (26,606 | ) |
Barclays Bank PLC | | USD | 7,499 | | | IDR | 106,662,838 | | | | 3/15/19 | | | | 26,895 | |
BNP Paribas SA | | COP | 1,719,239 | | | USD | 553 | | | | 3/15/19 | | | | (4,462 | ) |
BNP Paribas SA | | HUF | 516,550 | | | USD | 1,864 | | | | 6/17/19 | | | | (10,689 | ) |
BNP Paribas SA | | PLN | 10,734 | | | USD | 2,857 | | | | 3/15/19 | | | | 19,784 | |
BNP Paribas SA | | AUD | 2,315 | | | USD | 1,652 | | | | 3/15/19 | | | | 9,046 | |
BNP Paribas SA | | EUR | 3,098 | | | PLN | 13,340 | | | | 4/08/19 | | | | (4,618 | ) |
BNP Paribas SA | | SEK | 10,186 | | | NOK | 9,405 | | | | 4/12/19 | | | | (5,263 | ) |
BNP Paribas SA | | TRY | 11,588 | | | EUR | 1,871 | | | | 4/10/19 | | | | 12,772 | |
BNP Paribas SA | | USD | 7,835 | | | NZD | 11,650 | | | | 3/15/19 | | | | 100,505 | |
BNP Paribas SA | | USD | 1,080 | | | ZAR | 14,924 | | | | 4/17/19 | | | | (26,316 | ) |
Citibank, NA | | COP | 4,540,612 | | | USD | 1,425 | | | | 3/15/19 | | | | (47,849 | ) |
Citibank, NA | | TWD | 120,288 | | | USD | 3,914 | | | | 3/15/19 | | | | 10,399 | |
Citibank, NA | | CZK | 55,781 | | | USD | 2,492 | | | | 3/15/19 | | | | 15,920 | |
| | |
| |
| 68 | AB ALL MARKET TOTAL RETURN PORTFOLIO | | abfunds.com |
CONSOLIDATED PORTFOLIO OF INVESTMENTS(continued)
| | | | | | | | | | | | | | | | |
| Counterparty | | Contracts to
Deliver
(000) | | | In Exchange
For
(000) | | | Settlement
Date | | | Unrealized
Appreciation/
(Depreciation) | |
Citibank, NA | | SEK | 23,092 | | | USD | 2,505 | | | | 4/12/19 | | | $ | (3,137 | ) |
Citibank, NA | | BRL | 6,500 | | | USD | 1,721 | | | | 10/10/19 | | | | 20,733 | |
Citibank, NA | | EUR | 5,682 | | | USD | 6,545 | | | | 6/17/19 | | | | 24,749 | |
Citibank, NA | | CNY | 1,573 | | | USD | 228 | | | | 3/20/19 | | | | (7,394 | ) |
Citibank, NA | | EUR | 1,916 | | | USD | 2,172 | | | | 4/10/19 | | | | (14,214 | ) |
Citibank, NA | | CLP | 578 | | | USD | 1 | | | | 3/15/19 | | | | (17 | ) |
Citibank, NA | | USD | 1,409 | | | CHF | 1,382 | | | | 3/13/19 | | | | (23,523 | ) |
Citibank, NA | | CHF | 1,465 | | | SEK | 13,662 | | | | 4/12/19 | | | | 10,064 | |
Citibank, NA | | USD | 3,463 | | | GBP | 2,624 | | | | 4/09/19 | | | | 23,921 | |
Citibank, NA | | USD | 2,169 | | | CAD | 2,879 | | | | 3/15/19 | | | | 19,952 | |
Citibank, NA | | USD | 698 | | | TRY | 3,743 | | | | 3/28/19 | | | | (7,541 | ) |
Citibank, NA | | USD | 2,200 | | | BRL | 8,222 | | | | 4/02/19 | | | | (15,143 | ) |
Citibank, NA | | USD | 3,516 | | | PLN | 13,181 | | | | 4/08/19 | | | | (28,804 | ) |
Citibank, NA | | USD | 5,222 | | | SEK | 46,717 | | | | 4/12/19 | | | | (147,730 | ) |
Citibank, NA | | USD | 3,663 | | | TWD | 111,859 | | | | 3/14/19 | | | | (32,409 | ) |
Citibank, NA | | USD | 8,821 | | | MXN | 172,411 | | | | 3/15/19 | | | | 105,118 | |
Citibank, NA | | USD | 4,435 | | | RUB | 296,630 | | | | 6/17/19 | | | | 1,750 | |
Citibank, NA | | USD | 3,750 | | | JPY | 407,657 | | | | 12/13/19 | | | | (8,869 | ) |
Citibank, NA | | USD | 1,013 | | | CLP | 677,508 | | | | 3/15/19 | | | | 19,749 | |
Credit Suisse International | | CNY | 29,924 | | | USD | 4,350 | | | | 3/20/19 | | | | (117,847 | ) |
Credit Suisse International | | TRY | 5,770 | | | USD | 1,068 | | | | 3/28/19 | | | | 3,254 | |
Credit Suisse International | | EUR | 3,348 | | | USD | 3,791 | | | | 3/13/19 | | | | (20,202 | ) |
Credit Suisse International | | NOK | 2,415 | | | USD | 282 | | | | 4/12/19 | | | | (1,191 | ) |
Credit Suisse International | | NZD | 2,384 | | | USD | 1,635 | | | | 3/15/19 | | | | 11,131 | |
Credit Suisse International | | AUD | 2,179 | | | USD | 1,608 | | | | 6/28/19 | | | | 59,625 | |
Credit Suisse International | | EUR | 96 | | | TRY | 604 | | | | 5/03/19 | | | | (533 | ) |
Credit Suisse International | | EUR | 100 | | | ZAR | 1,573 | | | | 6/04/19 | | | | (4,164 | ) |
Credit Suisse International | | TRY | 182 | | | EUR | 29 | | | | 5/03/19 | | | | 189 | |
Credit Suisse International | | NZD | 317 | | | AUD | 302 | | | | 7/29/19 | | | | (1,380 | ) |
Credit Suisse International | | EUR | 1,285 | | | TRY | 8,167 | | | | 3/25/19 | | | | 45,232 | |
Credit Suisse International | | TRY | 2,524 | | | EUR | 409 | | | | 3/28/19 | | | | 1,012 | |
Credit Suisse International | | USD | 1,460 | | | ILS | 5,288 | | | | 4/16/19 | | | | 2,780 | |
Credit Suisse International | | USD | 6,176 | | | CAD | 8,116 | | | | 6/17/19 | | | | 6,343 | |
Credit Suisse International | | USD | 834 | | | ZAR | 11,277 | | | | 3/15/19 | | | | (34,437 | ) |
Credit Suisse International | | USD | 3,297 | | | TRY | 18,733 | | | | 3/15/19 | | | | 184,127 | |
Credit Suisse International | | USD | 3,147 | | | CNY | 21,575 | | | | 3/20/19 | | | | 74,533 | |
Credit Suisse International | | USD | 4,130 | | | SEK | 37,696 | | | | 3/15/19 | | | | (44,733 | ) |
Credit Suisse International | | USD | 2,025 | | | CZK | 45,808 | | | | 3/15/19 | | | | 8,129 | |
Deutsche Bank AG | | INR | 92,596 | | | USD | 1,269 | | | | 3/18/19 | | | | (36,398 | ) |
Deutsche Bank AG | | AUD | 1,527 | | | USD | 1,081 | | | | 4/23/19 | | | | (3,129 | ) |
Deutsche Bank AG | | AUD | 302 | | | NZD | 317 | | | | 7/29/19 | | | | 1,370 | |
Deutsche Bank AG | | USD | 1,752 | | | INR | 125,048 | | | | 3/18/19 | | | | 9,873 | |
Goldman Sachs Bank USA | | COP | 5,842,645 | | | USD | 1,865 | | | | 6/17/19 | | | | (22,309 | ) |
Goldman Sachs Bank USA | | JPY | 4,244,355 | | | USD | 39,047 | | | | 5/16/19 | | | | 748,691 | |
Goldman Sachs Bank USA | | INR | 150,459 | | | USD | 2,102 | | | | 3/18/19 | | | | (18,772 | ) |
Goldman Sachs Bank USA | | INR | 224,355 | | | USD | 3,178 | | | | 3/18/19 | | | �� | 16,345 | |
Goldman Sachs Bank USA | | RUB | 50,203 | | | USD | 752 | | | | 3/07/19 | | | | (9,493 | ) |
Goldman Sachs Bank USA | | BRL | 11,646 | | | USD | 3,115 | | | | 3/06/19 | | | | 14,638 | |
Goldman Sachs Bank USA | | BRL | 7,499 | | | USD | 1,983 | | | | 3/06/19 | | | | (13,646 | ) |
Goldman Sachs Bank USA | | TRY | 422 | | | EUR | 67 | | | | 5/03/19 | | | | 372 | |
Goldman Sachs Bank USA | | USD | 1,451 | | | EUR | 1,285 | | | | 3/13/19 | | | | 12,133 | |
Goldman Sachs Bank USA | | USD | 537 | | | PLN | 2,013 | | | | 4/08/19 | | | | (4,081 | ) |
| | |
| |
| abfunds.com | | AB ALL MARKET TOTAL RETURN PORTFOLIO | 69 |
CONSOLIDATED PORTFOLIO OF INVESTMENTS(continued)
| | | | | | | | | | | | | | | | |
| Counterparty | | Contracts to
Deliver
(000) | | | In Exchange
For
(000) | | | Settlement
Date | | | Unrealized
Appreciation/
(Depreciation) | |
Goldman Sachs Bank USA | | USD | 2,177 | | | CHF | 2,171 | | | | 3/13/19 | | | $ | 423 | |
Goldman Sachs Bank USA | | EUR | 2,591 | | | TRY | 16,697 | | | | 4/10/19 | | | | 100,713 | |
Goldman Sachs Bank USA | | USD | 2,006 | | | BRL | 7,499 | | | | 3/06/19 | | | | (9,425 | ) |
Goldman Sachs Bank USA | | USD | 3,327 | | | NOK | 28,299 | | | | 4/12/19 | | | | (14,074 | ) |
Goldman Sachs Bank USA | | USD | 3,079 | | | BRL | 11,646 | | | | 3/06/19 | | | | 21,192 | |
Goldman Sachs Bank USA | | USD | 4,310 | | | MYR | 17,546 | | | | 8/21/19 | | | | (16,759 | ) |
Goldman Sachs Bank USA | | USD | 2,709 | | | TWD | 83,062 | | | | 3/14/19 | | | | (13,067 | ) |
Goldman Sachs Bank USA | | USD | 2,047 | | | INR | 144,780 | | | | 3/18/19 | | | | (6,672 | ) |
Goldman Sachs Bank USA | | USD | 5,653 | | | RUB | 382,298 | | | | 3/15/19 | | | | 136,866 | |
Goldman Sachs Bank USA | | USD | 1,417 | | | CLP | 953,051 | | | | 3/15/19 | | | | 35,856 | |
HSBC Bank USA | | JPY | 3,790,000 | | | USD | 34,816 | | | | 5/16/19 | | | | 617,847 | |
HSBC Bank USA | | JPY | 921,908 | | | USD | 8,353 | | | | 4/11/19 | | | | 57,137 | |
HSBC Bank USA | | INR | 587,026 | | | USD | 8,069 | | | | 3/18/19 | | | | (203,824 | ) |
HSBC Bank USA | | TWD | 64,700 | | | USD | 2,115 | | | | 3/14/19 | | | | 15,629 | |
HSBC Bank USA | | AUD | 1,221 | | | USD | 873 | | | | 6/28/19 | | | | 5,296 | |
HSBC Bank USA | | USD | 1,640 | | | EUR | 1,444 | | | | 4/10/19 | | | | 8,087 | |
HSBC Bank USA | | USD | 2,070 | | | EUR | 1,814 | | | | 4/08/19 | | | | (543 | ) |
HSBC Bank USA | | PLN | 5,554 | | | EUR | 1,284 | | | | 4/08/19 | | | | (4,604 | ) |
HSBC Bank USA | | USD | 644 | | | TWD | 19,690 | | | | 3/14/19 | | | | (4,937 | ) |
HSBC Bank USA | | USD | 7,299 | | | KRW | 8,171,507 | | | | 5/16/19 | | | | (22,813 | ) |
JPMorgan Chase Bank, NA | | KRW | 478,969 | | | USD | 428 | | | | 5/16/19 | | | | 1,085 | |
JPMorgan Chase Bank, NA | | MXN | 10,599 | | | USD | 548 | | | | 3/22/19 | | | | (622 | ) |
JPMorgan Chase Bank, NA | | CHF | 9,069 | | | USD | 9,237 | | | | 3/13/19 | | | | 142,003 | |
JPMorgan Chase Bank, NA | | GBP | 957 | | | USD | 1,232 | | | | 6/17/19 | | | | (42,952 | ) |
JPMorgan Chase Bank, NA | | ZAR | 1,573 | | | EUR | 100 | | | | 6/04/19 | | | | 4,164 | |
JPMorgan Chase Bank, NA | | USD | 542 | | | PLN | 2,031 | | | | 4/08/19 | | | | (4,325 | ) |
JPMorgan Chase Bank, NA | | TRY | 8,167 | | | EUR | 1,285 | | | | 3/25/19 | | | | (45,229 | ) |
Morgan Stanley Capital Services, Inc. | | JPY | 1,449,193 | | | USD | 12,941 | | | | 3/15/19 | | | | (70,899 | ) |
Morgan Stanley Capital Services, Inc. | | JPY | 161,048 | | | USD | 1,489 | | | | 12/13/19 | | | | 11,402 | |
Morgan Stanley Capital Services, Inc. | | INR | 154,290 | | | USD | 2,153 | | | | 3/18/19 | | | | (21,776 | ) |
Morgan Stanley Capital Services, Inc. | | BRL | 6,879 | | | USD | 1,838 | | | | 6/17/19 | | | | 20,530 | |
Morgan Stanley Capital Services, Inc. | | PLN | 5,580 | | | USD | 1,462 | | | | 4/08/19 | | | | (14,393 | ) |
Morgan Stanley Capital Services, Inc. | | CNY | 4,764 | | | USD | 689 | | | | 3/20/19 | | | | (22,630 | ) |
Morgan Stanley Capital Services, Inc. | | PEN | 4,461 | | | USD | 1,329 | | | | 3/15/19 | | | | (23,555 | ) |
Morgan Stanley Capital Services, Inc. | | EUR | 2,936 | | | USD | 3,389 | | | | 4/10/19 | | | | 38,456 | |
Morgan Stanley Capital Services, Inc. | | CAD | 1,886 | | | USD | 1,413 | | | | 3/07/19 | | | | (20,629 | ) |
Morgan Stanley Capital Services, Inc. | | NZD | 1,588 | | | USD | 1,091 | | | | 4/26/19 | | | | 8,640 | |
Morgan Stanley Capital Services, Inc. | | AUD | 1,080 | | | USD | 800 | | | | 6/28/19 | | | | 32,707 | |
Morgan Stanley Capital Services, Inc. | | USD | 1,895 | | | EUR | 1,674 | | | | 3/13/19 | | | | 10,215 | |
| | |
| |
| 70 | AB ALL MARKET TOTAL RETURN PORTFOLIO | | abfunds.com |
CONSOLIDATED PORTFOLIO OF INVESTMENTS(continued)
| | | | | | | | | | | | | | | | |
| Counterparty | | Contracts to
Deliver
(000) | | | In Exchange
For
(000) | | | Settlement
Date | | | Unrealized
Appreciation/
(Depreciation) | |
Morgan Stanley Capital Services, Inc. | | USD | 4,440 | | | AUD | 6,012 | | | | 6/28/19 | | | $ | (167,184 | ) |
Morgan Stanley Capital Services, Inc. | | USD | 2,899 | | | CAD | 3,839 | | | | 3/07/19 | | | | 18,857 | |
Morgan Stanley Capital Services, Inc. | | USD | 2,159 | | | TWD | 66,564 | | | | 3/14/19 | | | | 838 | |
Morgan Stanley Capital Services, Inc. | | USD | 2,474 | | | INR | 177,406 | | | | 3/18/19 | | | | 26,351 | |
Morgan Stanley Capital Services, Inc. | | USD | 1,475 | | | KRW | 1,642,225 | | | | 5/16/19 | | | | (12,744 | ) |
Morgan Stanley Capital Services, Inc. | | USD | 1,765 | | | COP | 5,555,991 | | | | 3/15/19 | | | | 37,395 | |
Natwest Markets PLC | | COP | 6,757,057 | | | USD | 2,169 | | | | 3/15/19 | | | | (22,720 | ) |
Natwest Markets PLC | | CLP | 678,690 | | | USD | 1,010 | | | | 3/15/19 | | | | (25,069 | ) |
Natwest Markets PLC | | JPY | 160,982 | | | USD | 1,488 | | | | 12/13/19 | | | | 10,469 | |
Natwest Markets PLC | | AUD | 4,080 | | | USD | 2,896 | | | | 4/23/19 | | | | (702 | ) |
Natwest Markets PLC | | CHF | 2,319 | | | USD | 2,375 | | | | 3/15/19 | | | | 48,812 | |
Natwest Markets PLC | | TRY | 1,657 | | | USD | 307 | | | | 3/28/19 | | | | 1,525 | |
Natwest Markets PLC | | EUR | 1,256 | | | USD | 1,447 | | | | 4/10/19 | | | | 13,884 | |
Natwest Markets PLC | | USD | 2,538 | | | AUD | 3,565 | | | | 4/23/19 | | | | (7,272 | ) |
Natwest Markets PLC | | USD | 683 | | | TRY | 3,726 | | | | 3/28/19 | | | | 3,832 | |
Natwest Markets PLC | | USD | 565 | | | TWD | 17,206 | | | | 3/14/19 | | | | (6,632 | ) |
Natwest Markets PLC | | USD | 2,092 | | | INR | 148,469 | | | | 3/18/19 | | | | 435 | |
Natwest Markets PLC | | USD | 2,733 | | | CLP | 1,789,180 | | | | 3/15/19 | | | | (5,117 | ) |
Natwest Markets PLC | | USD | 2,144 | | | CLP | 1,428,478 | | | | 3/15/19 | | | | 33,783 | |
Natwest Markets PLC | | USD | 726 | | | COP | 2,238,287 | | | | 3/15/19 | | | | (487 | ) |
Natwest Markets PLC | | USD | 722 | | | COP | 2,246,291 | | | | 3/15/19 | | | | 7,006 | |
Standard Chartered Bank | | TWD | 164,521 | | | USD | 5,337 | | | | 3/14/19 | | | | (2,651 | ) |
Standard Chartered Bank | | INR | 98,571 | | | USD | 1,388 | | | | 3/18/19 | | | | (1,560 | ) |
Standard Chartered Bank | | TWD | 37,043 | | | USD | 1,215 | | | | 3/14/19 | | | | 12,762 | |
Standard Chartered Bank | | ZAR | 14,924 | | | USD | 1,085 | | | | 4/17/19 | | | | 31,665 | |
Standard Chartered Bank | | EUR | 2,547 | | | USD | 2,915 | | | | 4/10/19 | | | | 8,417 | |
Standard Chartered Bank | | CAD | 1,533 | | | USD | 1,159 | | | | 3/07/19 | | | | (6,125 | ) |
Standard Chartered Bank | | USD | 4,717 | | | EUR | 4,120 | | | | 4/10/19 | | | | (16,044 | ) |
Standard Chartered Bank | | USD | 2,056 | | | CNY | 14,214 | | | | 3/20/19 | | | | 66,848 | |
Standard Chartered Bank | | USD | 881 | | | KRW | 983,534 | | | | 5/16/19 | | | | (4,884 | ) |
State Street Bank & Trust Co. | | JPY | 160,735 | | | USD | 1,460 | | | | 4/11/19 | | | | 14,058 | |
State Street Bank & Trust Co. | | THB | 47,195 | | | USD | 1,514 | | | | 6/17/19 | | | | 12,887 | |
State Street Bank & Trust Co. | | THB | 31,324 | | | USD | 980 | | | | 3/15/19 | | | | (13,821 | ) |
State Street Bank & Trust Co. | | NOK | 3,501 | | | USD | 410 | | | | 3/15/19 | | | | 1,173 | |
State Street Bank & Trust Co. | | ZAR | 3,412 | | | USD | 247 | | | | 4/17/19 | | | | 6,153 | |
State Street Bank & Trust Co. | | EUR | 1,576 | | | USD | 1,810 | | | | 4/10/19 | | | | 12,226 | |
State Street Bank & Trust Co. | | TRY | 771 | | | USD | 139 | | | | 3/28/19 | | | | (3,185 | ) |
State Street Bank & Trust Co. | | EUR | 1,203 | | | USD | 1,380 | | | | 3/15/19 | | | | 11,336 | |
State Street Bank & Trust Co. | | SGD | 356 | | | USD | 262 | | | | 4/17/19 | | | | (1,360 | ) |
State Street Bank & Trust Co. | | EUR | 335 | | | USD | 380 | | | | 3/15/19 | | | | (1,289 | ) |
State Street Bank & Trust Co. | | EUR | 268 | | | USD | 307 | | | | 6/17/19 | | | | (383 | ) |
State Street Bank & Trust Co. | | EUR | 220 | | | USD | 250 | | | | 4/10/19 | | | | (731 | ) |
State Street Bank & Trust Co. | | AUD | 205 | | | USD | 146 | | | | 4/23/19 | | | | 460 | |
State Street Bank & Trust Co. | | GBP | 198 | | | USD | 261 | | | | 4/09/19 | | | | (1,485 | ) |
State Street Bank & Trust Co. | | GBP | 281 | | | USD | 370 | | | | 3/15/19 | | | | (2,710 | ) |
State Street Bank & Trust Co. | | GBP | 171 | | | USD | 220 | | | | 6/17/19 | | | | (7,100 | ) |
| | |
| |
| abfunds.com | | AB ALL MARKET TOTAL RETURN PORTFOLIO | 71 |
CONSOLIDATED PORTFOLIO OF INVESTMENTS(continued)
| | | | | | | | | | | | | | | | |
| Counterparty | | Contracts to
Deliver
(000) | | | In Exchange
For
(000) | | | Settlement
Date | | | Unrealized
Appreciation/
(Depreciation) | |
State Street Bank & Trust Co. | | EUR | 58 | | | USD | 67 | | | | 6/17/19 | | | $ | 20 | |
State Street Bank & Trust Co. | | USD | 73 | | | CHF | 73 | | | | 3/13/19 | | | | 142 | |
State Street Bank & Trust Co. | | USD | 677 | | | EUR | 592 | | | | 4/10/19 | | | | (2,019 | ) |
State Street Bank & Trust Co. | | USD | 389 | | | EUR | 344 | | | | 3/14/19 | | | | 2,268 | |
State Street Bank & Trust Co. | | USD | 89 | | | MXN | 1,706 | | | | 3/22/19 | | | | (713 | ) |
State Street Bank & Trust Co. | | USD | 444 | | | TRY | 2,463 | | | | 3/28/19 | | | | 10,177 | |
State Street Bank & Trust Co. | | USD | 341 | | | SEK | 3,051 | | | | 4/12/19 | | | | (9,215 | ) |
UBS AG | | CAD | 788 | | | USD | 591 | | | | 3/07/19 | | | | (8,042 | ) |
UBS AG | | USD | 522 | | | NZD | 766 | | | | 4/26/19 | | | | 240 | |
UBS AG | | USD | 775 | | | JPY | 85,291 | | | | 4/11/19 | | | | (7,738 | ) |
| | | | | | | | | | | | | | | | |
| | | | | | | | | | | | | | $ | 1,266,854 | |
| | | | | | | | | | | | | | | | |
CURRENCY OPTIONS WRITTEN (see Note D)
| | | | | | | | | | | | | | | | | | | | | | | | | | | | | | | | |
Description/
Counterparty | | Exercise
Price | | | Expiration
Month | | | Contracts | | | Notional
Amount
(000) | | | Premiums
Received | | | U.S. $
Value | |
Call | | | | | | | | | | | | | | | | | | | | | | | | | | | | | | | | |
AUD vs. USD/
Morgan Stanley Capital Services LLC(t) | | | AUD | | | | 1.280 | | | | 06/2019 | | | | 13,200,000 | | | | AUD | | | | 13,200 | | | $ | 137,041 | | | $ | (6,264 | ) |
NZD vs. CAD/
Deutsche Bank AG(t) | | | NZD | | | | 1.010 | | | | 07/2019 | | | | 1,545,300 | | | | NZD | | | | 1,545 | | | | 5,084 | | | | (5,514 | ) |
Put | | | | | | | | | | | | | | | | | | | | | | | | | | | | | | | | |
CNH vs. USD/
BNP Paribas SA(t) | | | CNH | | | | 7.000 | | | | 04/2019 | | | | 7,665,000 | | | | CNH | | | | 7,665 | | | | 3,698 | | | | (404 | ) |
NZD vs. CAD/
JPMorgan Chase Bank, NA(t) | | | NZD | | | | 1.160 | | | | 07/2019 | | | | 1,615,000 | | | | NZD | | | | 1,615 | | | | 7,320 | | | | (7,044 | ) |
SGD vs. CHF/
UBS AG(t) | | | SGD | | | | 1.550 | | | | 06/2019 | | | | 930,000 | | | | SGD | | | | 930 | | | | 2,811 | | | | (460 | ) |
TRY vs. EUR/
Goldman Sachs Bank USA(t) | | | TRY | | | | 6.830 | | | | 05/2019 | | | | 3,280,608 | | | | TRY | | | | 3,281 | | | | 6,133 | | | | (3,563 | ) |
TRY vs. EUR/
JPMorgan Chase Bank, NA(t) | | | TRY | | | | 6.990 | | | | 03/2019 | | | | 21,219,519 | | | | TRY | | | | 21,220 | | | | 44,823 | | | | (2,802 | ) |
ZAR vs. EUR/
JPMorgan Chase Bank, NA(t) | | | ZAR | | | | 16.650 | | | | 05/2019 | | | | 8,075,250 | | | | ZAR | | | | 8,075 | | | | 8,130 | | | | (12,570 | ) |
| | | | | | | | | | | | | | | | | | | | | | | | | | | | | | | | |
| | | | | | | | | | | | | | | | | | | | | | | | | | $ | 215,040 | | | $ | (38,621 | ) |
| | | | | | | | | | | | | | | | | | | | | | | | | | | | | | | | |
| | |
| |
| 72 | AB ALL MARKET TOTAL RETURN PORTFOLIO | | abfunds.com |
CONSOLIDATED PORTFOLIO OF INVESTMENTS(continued)
CENTRALLY CLEARED CREDIT DEFAULT SWAPS (see Note D)
| | | | | | | | | | | | | | | | | | | | | | | | | | | | |
| Description | | Fixed
Rate
(Pay)
Receive | | | Payment
Frequency | | | Implied
Credit
Spread at
February 28,
2019 | | | Notional
Amount
(000) | | | Market
Value | | | Upfront
Premiums
Paid
(Received) | | | Unrealized
Appreciation/
(Depreciation) | |
Buy Contracts | |
CDX-NAHY Series 29, 5 Year Index, 12/20/22* | | | (5.00 | )% | | | Quarterly | | | | 3.02 | % | | US | D 5 | | | $ | (377 | ) | | $ | (327 | ) | | $ | (50 | ) |
CDX-NAHY Series 29, 5 Year Index, 12/20/22* | | | (5.00 | ) | | | Quarterly | | | | 3.02 | | | USD | 3,401 | | | | (261,382 | ) | | | (206,854 | ) | | | (54,528 | ) |
CDX-NAHY Series 29, 5 Year Index, 12/20/22* | | | (5.00 | ) | | | Quarterly | | | | 3.02 | | | USD | 3,616 | | | | (277,954 | ) | | | (237,962 | ) | | | (39,992 | ) |
CDX-NAHY Series 30, 5 Year Index, 6/20/23* | | | (5.00 | ) | | | Quarterly | | | | 3.19 | | | USD | 1,441 | | | | (111,849 | ) | | | (96,505 | ) | | | (15,344 | ) |
iTraxxx Xover Series 28, 5 Year Index, 12/20/22* | | | (5.00 | ) | | | Quarterly | | | | 2.65 | | | EUR | 1,914 | | | | (203,398 | ) | | | (218,688 | ) | | | 15,290 | |
|
Sale Contracts | |
CDX-NAHY Series 29, 5 Year Index, 12/20/22* | | | 5.00 | | | | Quarterly | | | | 3.02 | | | USD | 5 | | | | 377 | | | | 351 | | | | 26 | |
CDX-NAHY Series 31, 5 Year Index, 12/20/23* | | | 5.00 | | | | Quarterly | | | | 3.46 | | | USD | 2,768 | | | | 200,843 | | | | 105,128 | | | | 95,715 | |
CDX-NAHY Series 31, 5 Year Index, 12/20/23* | | | 5.00 | | | | Quarterly | | | | 3.46 | | | USD | 1,270 | | | | 92,172 | | | | 48,116 | | | | 44,056 | |
CDX-NAIG Series 28, 5 Year Index, 6/20/22* | | | 1.00 | | | | Quarterly | | | | 0.43 | | | USD | 84,550 | | | | 1,684,616 | | | | 1,326,523 | | | | 358,093 | |
iTraxxx Europe Series 27, 5 Year Index, 6/20/22* | | | 1.00 | | | | Quarterly | | | | 0.33 | | | EUR | 37,100 | | | | 1,022,833 | | | | 876,273 | | | | 146,560 | |
| | |
| |
| abfunds.com | | AB ALL MARKET TOTAL RETURN PORTFOLIO | 73 |
CONSOLIDATED PORTFOLIO OF INVESTMENTS(continued)
| | | | | | | | | | | | | | | | | | | | | | | | | | | | |
| Description | | Fixed
Rate
(Pay)
Receive | | | Payment
Frequency | | | Implied
Credit
Spread at
February 28,
2019 | | | Notional
Amount
(000) | | | Market
Value | | | Upfront
Premiums
Paid
(Received) | | | Unrealized
Appreciation/
(Depreciation) | |
iTraxxx Xover Series 30, 5 Year Index, 12/20/23* | | | 5.00 | % | | | Quarterly | | | | 2.76 | % | | EUR | 4,436 | | | $ | 542,590 | | | $ | 452,993 | | | $ | 89,597 | |
| | | | | | | | | | | | | | | | | | | | | | | | | | | | |
| | | | | | | | | | | | | | | | | | $ | 2,688,471 | | | $ | 2,049,048 | | | $ | 639,423 | |
| | | | | | | | | | | | | | | | | | | | | | | | | | | | |
CENTRALLY CLEARED INTEREST RATE SWAPS (see Note D)
| | | | | | | | | | | | | | | | | | | | | | | | | | | | | | |
| | | | | | | | | Rate Type | | | | | | | | | | | | |
Notional
Amount
(000) | | | Termination
Date | | | Payments
made
by the
Fund | | | Payments
received
by the
Fund | | | Payment
Frequency
Paid/
Received | | Market
Value | | | Upfront
Premiums
Paid
(Received) | | | Unrealized
Appreciation/
(Depreciation) | |
| GBP | | | 450 | | | | 12/17/28 | | |
| 6 Month
LIBOR |
| | | 1.479% | | | Semi-Annual/ Semi-Annual | | $ | 3 | | | $ | — | | | $ | 3 | |
| GBP | | | 450 | | | | 12/17/28 | | | | 1.600% | | |
| 6 Month
LIBOR |
| | Semi-Annual/ Semi-Annual | | | (6,867 | ) | | | — | | | | (6,867 | ) |
| NOK | | | 141,690 | | | | 1/11/29 | | |
| 6 Month
NIBOR |
| | | 2.100% | | | Semi-Annual/ Annual | | | 35,320 | | | | — | | | | 35,320 | |
| SEK | | | 138,360 | | | | 1/11/29 | | |
| 3 Month
STIBOR |
| | | 1.080% | | | Quarterly/ Annual | | | 136,141 | | | | — | | | | 136,141 | |
| CHF | | | 14,970 | | | | 1/11/29 | | |
| 6 Month
LIBOR |
| | | 0.299% | | | Semi-Annual/ Annual | | | 121,440 | | | | — | | | | 121,440 | |
| NZD | | | 3,780 | | | | 1/11/29 | | |
| 3 Month
BKBM |
| | | 2.653% | | | Quarterly/ Semi-Annual | | | 44,875 | | | | — | | | | 44,875 | |
| NOK | | | 19,040 | | | | 2/08/29 | | |
| 6 Month
NIBOR |
| | | 2.072% | | | Semi-Annual/ Annual | | | (2,586 | ) | | | — | | | | (2,586 | ) |
| | | | | | | | | | | | | | | | | | | | | | | | | | | | | | |
| | | | | | | | | | | | | | | | | | | | $ | 328,326 | | | $ | — | | | $ | 328,326 | |
| | | | | | | | | | | | | | | | | | | | | | | | | | | | | | |
CREDIT DEFAULT SWAPS (see Note D)
| | | | | | | | | | | | | | | | | | | | | | | | | | | | |
Swap Counterparty & Referenced Obligation | | Fixed
Rate
(Pay)
Receive | | | Payment
Frequency | | | Implied
Credit
Spread at
February 28,
2019 | | | Notional
Amount
(000) | | | Market
Value | | | Upfront
Premiums
Paid
(Received) | | | Unrealized
Appreciation/
(Depreciation) | |
Buy Contracts | | | | | | | | | | | | | | | | | |
Barclays Bank PLC | | | | | | | | | | | | | | | | | |
Argentine Republic, 7.500%, 4/22/26, 12/20/23* | | | (5.00 | )% | | | Quarterly | | | | 6.70 | % | | USD | 32 | | | $ | 1,713 | | | $ | 2,621 | | | $ | (908 | ) |
Citibank, NA | | | | | | | | | | | | | | | | | | | | | |
Argentine Republic, 7.500%, 4/22/26, 12/20/23* | | | (5.00 | ) | | | Quarterly | | | | 6.70 | | | USD | 34 | | | | 1,819 | | | | 2,493 | | | | (674 | ) |
| | |
| |
| 74 | AB ALL MARKET TOTAL RETURN PORTFOLIO | | abfunds.com |
CONSOLIDATED PORTFOLIO OF INVESTMENTS(continued)
| | | | | | | | | | | | | | | | | | | | | | | | | | | | |
Swap Counterparty & Referenced Obligation | | Fixed
Rate
(Pay)
Receive | | | Payment
Frequency | | | Implied
Credit
Spread at
February 28,
2019 | | | Notional
Amount
(000) | | | Market
Value | | | Upfront
Premiums
Paid
(Received) | | | Unrealized
Appreciation/
(Depreciation) | |
Argentine Republic, 7.500%, 4/22/26, 12/20/23* | | | (5.00 | ) % | | | Quarterly | | | | 6.70 | % | | USD | 50 | | | $ | 2,676 | | | $ | 4,298 | | | $ | (1,622 | ) |
Morgan Stanley & Co. International PLC | | | | | | | | | | | | | | | | | |
Argentine Republic, 7.500%, 4/22/26, 12/20/23* | | | (5.00 | ) | | | Quarterly | | | | 6.70 | | | USD | 64 | | | | 3,425 | | | | 5,710 | | | | (2,285 | ) |
Argentine Republic, 7.500%, 4/22/26, 12/20/23* | | | (5.00 | ) | | | Quarterly | | | | 6.70 | | | USD | 31 | | | | 1,659 | | | | 2,167 | | | | (508 | ) |
Argentine Republic, 7.500%, 4/22/26, 12/20/23* | | | (5.00 | ) | | | Quarterly | | | | 6.70 | | | USD | 36 | | | | 1,927 | | | | 2,054 | | | | (127 | ) |
Argentine Republic, 7.500%, 4/22/26, 12/20/23* | | | (5.00 | ) | | | Quarterly | | | | 6.70 | | | USD | 64 | | | | 3,425 | | | | 4,803 | | | | (1,378 | ) |
Argentine Republic, 7.500%, 4/22/26, 12/20/23* | | | (5.00 | ) | | | Quarterly | | | | 6.70 | | | USD | 32 | | | | 1,713 | | | | 2,348 | | | | (635 | ) |
Argentine Republic, 7.500%, 4/22/26, 12/20/23* | | | (5.00 | ) | | | Quarterly | | | | 6.70 | | | USD | 31 | | | | 1,659 | | | | 2,274 | | | | (615 | ) |
| | | | | |
Sale Contracts | | | | | | | | | | | | | | | | | | | | | |
Barclays Bank PLC | | | | | | | | | | | | | | | | | | | | | |
Federative Republic of Brazil, 4.250%, 1/07/25, 6/20/23* | | | 1.00 | | | | Quarterly | | | | 1.38 | | | USD | 206 | | | | (2,925 | ) | | | (6,681 | ) | | | 3,756 | |
Federative Republic of Brazil, 4.250%, 1/07/25, 6/20/23* | | | 1.00 | | | | Quarterly | | | | 1.38 | | | USD | 189 | | | | (2,684 | ) | | | (6,130 | ) | | | 3,446 | |
| | |
| |
| abfunds.com | | AB ALL MARKET TOTAL RETURN PORTFOLIO | 75 |
CONSOLIDATED PORTFOLIO OF INVESTMENTS(continued)
| | | | | | | | | | | | | | | | | | | | | | | | | | | | |
Swap Counterparty & Referenced Obligation | | Fixed
Rate
(Pay)
Receive | | | Payment
Frequency | | | Implied
Credit
Spread at
February 28,
2019 | | | Notional
Amount
(000) | | | Market
Value | | | Upfront
Premiums
Paid
(Received) | | | Unrealized
Appreciation/
(Depreciation) | |
Citibank, NA | | | | | | | | | | | | | | | | | | | | | |
Republic of Turkey, 11.875%, 1/15/30, 12/20/23* | | | 1.00 | % | | | Quarterly | | | | 3.01 | % | | USD | 460 | | | $ | (38,198 | ) | | $ | (50,294 | ) | | $ | 12,096 | |
Citigroup Global Markets, Inc. | | | | | | | | | | | | | | | | | |
CDX-
CMBX.NA.BB Series 6, 5/11/63* | | | 5.00 | | | | Monthly | | | | 13.85 | | | USD | 2,500 | | | | (580,611 | ) | | | (446,969 | ) | | | (133,642 | ) |
Credit Suisse International | | | | | | | | | | | | | | | | | |
CDX-
CMBX.NA.
BBB- Series 6, 5/11/63* | | | 3.00 | | | | Monthly | | | | 7.20 | | | USD | 5,800 | | | | (702,186 | ) | | | (584,295 | ) | | | (117,891 | ) |
Deutsche Bank AG | | | | | | | | | | | | | | | | | | | | | |
CDX-
CMBX.NA.BB Series 6, 5/11/63* | | | 5.00 | | | | Monthly | | | | 13.85 | | | USD | 2,500 | | | | (580,611 | ) | | | (456,498 | ) | | | (124,113 | ) |
Goldman Sachs International | | | | | | | | | | | | | |
Avis Budget Group, Inc., 5.250%, 3/15/25, 12/20/23* | | | 5.00 | | | | Quarterly | | | | 2.73 | | | USD | 110 | | | | 11,822 | | | | 6,829 | | | | 4,993 | |
HSBC Bank USA | | | | | | | | | | | | | | | | | |
Republic of Turkey, 11.875%, 1/15/30, 12/20/23* | | | 1.00 | | | | Quarterly | | | | 3.01 | | | USD | 85 | | | | (7,058 | ) | | | (9,166 | ) | | | 2,108 | |
Republic of Turkey, 11.875%, 1/15/30, 12/20/23* | | | 1.00 | | | | Quarterly | | | | 3.01 | | | USD | 85 | | | | (7,058 | ) | | | (9,263 | ) | | | 2,205 | |
JPMorgan Chase Bank, NA | | | | | | | | | | | | | | | | | |
Republic of Turkey, 11.875%, 1/15/30, 12/20/23* | | | 1.00 | | | | Quarterly | | | | 3.01 | | | USD | 13 | | | | (1,080 | ) | | | (1,409 | ) | | | 329 | |
Republic of Turkey, 11.875%, 1/15/30, 12/20/23* | | | 1.00 | | | | Quarterly | | | | 3.01 | | | USD | 13 | | | | (1,079 | ) | | | (1,418 | ) | | | 339 | |
| | |
| |
| 76 | AB ALL MARKET TOTAL RETURN PORTFOLIO | | abfunds.com |
CONSOLIDATED PORTFOLIO OF INVESTMENTS(continued)
| | | | | | | | | | | | | | | | | | | | | | | | | | | | |
Swap Counterparty & Referenced Obligation | | Fixed
Rate
(Pay)
Receive | | | Payment
Frequency | | | Implied
Credit
Spread at
February 28,
2019 | | | Notional
Amount
(000) | | | Market
Value | | | Upfront
Premiums
Paid
(Received) | | | Unrealized
Appreciation/
(Depreciation) | |
Republic of Turkey, 11.875%, 1/15/30, 12/20/23* | | | 1.00 | % | | | Quarterly | | | | 3.01 | % | | USD | 157 | | | $ | (13,037 | ) | | $ | (17,131 | ) | | $ | 4,094 | |
Republic of Turkey, 11.875%, 1/15/30, 12/20/23* | | | 1.00 | | | | Quarterly | | | | 3.01 | | | USD | 7 | | | | (582 | ) | | | (825 | ) | | | 243 | |
Republic of Turkey, 11.875%, 1/15/30, 12/20/23* | | | 1.00 | | | | Quarterly | | | | 3.01 | | | USD | 78 | | | | (6,477 | ) | | | (9,192 | ) | | | 2,715 | |
Republic of Turkey, 11.875%, 1/15/30, 12/20/23* | | | 1.00 | | | | Quarterly | | | | 3.01 | | | USD | 34 | | | | (2,823 | ) | | | (3,730 | ) | | | 907 | |
Republic of Turkey, 11.875%, 1/15/30, 12/20/23* | | | 1.00 | | | | Quarterly | | | | 3.01 | | | USD | 34 | | | | (2,823 | ) | | | (3,750 | ) | | | 927 | |
Republic of Turkey, 11.875%, 1/15/30, 12/20/23* | | | 1.00 | | | | Quarterly | | | | 3.01 | | | USD | 52 | | | | (4,318 | ) | | | (6,032 | ) | | | 1,714 | |
Republic of Turkey, 11.875%, 1/15/30, 12/20/23* | | | 1.00 | | | | Quarterly | | | | 3.01 | | | USD | 32 | | | | (2,657 | ) | | | (3,712 | ) | | | 1,055 | |
Republic of Turkey, 11.875%, 1/15/30, 12/20/23* | | | 1.00 | | | | Quarterly | | | | 3.01 | | | USD | 34 | | | | (2,823 | ) | | | (3,956 | ) | | | 1,133 | |
Republic of Turkey, 11.875%, 1/15/30, 12/20/23* | | | 1.00 | | | | Quarterly | | | | 3.01 | | | USD | 86 | | | | (7,141 | ) | | | (9,343 | ) | | | 2,202 | |
Republic of Turkey, 11.875%, 1/15/30, 12/20/23* | | | 1.00 | | | | Quarterly | | | | 3.01 | | | USD | 86 | | | | (7,141 | ) | | | (9,343 | ) | | | 2,202 | |
| | |
| |
| abfunds.com | | AB ALL MARKET TOTAL RETURN PORTFOLIO | 77 |
CONSOLIDATED PORTFOLIO OF INVESTMENTS(continued)
| | | | | | | | | | | | | | | | | | | | | | | | | | | | |
Swap Counterparty & Referenced Obligation | | Fixed
Rate
(Pay)
Receive | | | Payment
Frequency | | | Implied
Credit
Spread at
February 28,
2019 | | | Notional
Amount
(000) | | | Market
Value | | | Upfront
Premiums
Paid
(Received) | | | Unrealized
Appreciation/
(Depreciation) | |
Republic of Turkey, 11.875%, 1/15/30, 12/20/23* | | | 1.00 | % | | | Quarterly | | | | 3.01 | % | | USD | 6 | | | $ | (499 | ) | | $ | (650 | ) | | $ | 151 | |
Republic of Turkey, 11.875%, 1/15/30, 12/20/23* | | | 1.00 | | | | Quarterly | | | | 3.01 | | | USD | 78 | | | | (6,477 | ) | | | (8,446 | ) | | | 1,969 | |
Republic of Turkey, 11.875%, 1/15/30, 12/20/23* | | | 1.00 | | | | Quarterly | | | | 3.01 | | | USD | 156 | | | | (12,954 | ) | | | (16,905 | ) | | | 3,951 | |
Morgan Stanley & Co. International PLC | | | | | |
Republic of Turkey, 11.875%, 1/15/30, 12/20/23* | | | 1.00 | | | | Quarterly | | | | 3.01 | | | USD | 86 | | | | (7,141 | ) | | | (10,489 | ) | | | 3,348 | |
Morgan Stanley Capital Services LLC | | | | | | | | | |
Republic of South Africa, 5.500%, 3/09/20, 6/20/23* | | | 1.00 | | | | Quarterly | | | | 1.60 | | | USD | 330 | | | | (7,534 | ) | | | (7,742 | ) | | | 208 | |
| | | | | | | | | | | | | | | | | | | | | | | | | | | | |
| | | | | | | | | | | | | | | | | | $ | (1,976,079 | ) | | $ | (1,647,772 | ) | | $ | (328,307 | ) |
| | | | | | | | | | | | | | | | | | | | | | | | | | | | |
INFLATION (CPI) SWAPS (see Note D)
| | | | | | | | | | | | | | | | | | | | | | | | | | | | |
| | | | Rate Type | | | | | | | |
Swap
Counterparty | | Notional Amount (000) | | | Termination
Date | | | Payments
made
by the
Fund | | | Payments
received
by the
Fund | | | Payment
Frequency
Paid/
Received | | | Unrealized
Appreciation/
(Depreciation) | |
Bank of America, NA | | | USD | | | | 45,900 | | | | 7/31/21 | | | | 2.230 | % | | | CPI | # | | | Maturity | | | $ | (642,643 | ) |
Bank of America, NA | | | USD | | | | 29,970 | | | | 7/31/21 | | | | 2.230 | % | | | CPI | # | | | Maturity | | | | (419,608 | ) |
| | | | | | | | | | | | | | | | | | | | | | | | | | | | |
| | | | | | | | | | | | | | | | | | | | | | | | | | $ | (1,062,251 | ) |
| | | | | | | | | | | | | | | | | | | | | | | | | | | | |
| # | Variable interest rate based on the rate of inflation as determined by the Consumer Price Index (CPI). |
| | |
| |
| 78 | AB ALL MARKET TOTAL RETURN PORTFOLIO | | abfunds.com |
CONSOLIDATED PORTFOLIO OF INVESTMENTS(continued)
TOTAL RETURN SWAPS (see Note D)
| | | | | | | | | | | | | | | | | | | | | | | | | | |
Counterparty &
Referenced
Obligation | | # of Shares
or Units | | | Rate Paid/
Received | | Payment
Frequency | | | Notional
Amount
(000) | | | Maturity
Date | | | Unrealized
Appreciation/
(Depreciation) | |
Receive Total Return on Reference Obligation | | | | | | | | | |
Barclays Bank PLC | | | | | | | | | | | | | | | | | | | | |
Barclays Capital US Inflation Linked Bonds 1 to 10 Year | | | 134,300,000 | | | LIBOR | | | Maturity | | | | USD | | | | 134,300 | | | | 5/01/19 | | | $ | (64,866 | ) |
Citibank, NA | | | | | | | | | | | | | | | | | | | | | | | | | | |
CGABROE3(1) | | | 170,980 | | | LIBOR Plus 0.20% | | | Quarterly | | | | USD | | | | 18,750 | | | | 1/15/20 | | | | 55,435 | |
Goldman Sachs International | | | | | | | | | | | | | | | | | |
GSABLJHB(2) | | | 9,888,965 | | | LIBOR Plus 0.20% | | | Quarterly | | | | JPY | | | | 814,554 | | | | 2/17/20 | | | | 159,801 | |
Russell 2000 Total Return Index | | | 1,310 | | | LIBOR | | | Quarterly | | | | USD | | | | 10,260 | | | | 5/15/19 | | | | 32,937 | |
JPMorgan Chase Bank, NA | | | | | | | | | | | | | | | | | | | | |
iBoxx $ Liquid High Yield Index | | | 3,460,000 | | | LIBOR | | | Maturity | | | | USD | | | | 3,460 | | | | 3/20/19 | | | | 144,002 | |
JPQABACP(3) | | | 377,614 | | | 0.17% | | | Maturity | | | | USD | | | | 35,476 | | | | 6/17/19 | | | | (1,931,056 | ) |
Morgan Stanley Capital Services LLC | | | | | | | | | | | | | | | | | | | | |
Bloomberg Agriculture Subindex | | | 16,875 | | | 0.18% | | | Annual | | | | USD | | | | 1,336 | | | | 10/15/19 | | | | (10,942 | ) |
Bloomberg Commodity Index | | | 266,125 | | | 0.12% | | | Maturity | | | | USD | | | | 50,992 | | | | 3/15/19 | | | | 1,647,580 | |
Markit iBoxx EUR Liquid High Yield Index | | | 510,000 | | | EURIBOR | | | Quarterly | | | | EUR | | | | 510 | | | | 3/20/19 | | | | 8,179 | |
| |
Pay Total Return on Reference Obligation | | | | | |
Citibank, NA | | | | | | | | | | | | | | | | | | | | | | | | | | |
Russell 1000 Index Total Return | | | 2,122 | | | LIBOR Plus 0.24% | | | Quarterly | | | | USD | | | | 18,659 | | | | 11/15/19 | | | | (45,433 | ) |
Goldman Sachs & Co. | | | | | | | | | | | | | | | | | | | | |
BB&T Corp. | | | 10,070 | | | LIBOR Minus 0.30% | | | Monthly | | | | USD | | | | 506 | | | | 1/05/21 | | | | (6,819 | ) |
BB&T Corp. | | | 20,160 | | | LIBOR Plus 0.35% | | | Monthly | | | | USD | | | | 998 | | | | 1/05/21 | | | | (28,207 | ) |
Chemical Financial Corp. | | | 32,358 | | | LIBOR Minus 0.30% | | | Monthly | | | | USD | | | | 1,465 | | | | 1/05/21 | | | | (15,208 | ) |
Entegris, Inc. | | | 4,909 | | | LIBOR Minus 0.30% | | | Monthly | | | | USD | | | | 162 | | | | 1/05/21 | | | | (11,299 | ) |
Entegris, Inc. | | | 14,225 | | | LIBOR Minus 0.30% | | | Monthly | | | | USD | | | | 476 | | | | 1/05/21 | | | | (26,011 | ) |
| | |
| |
| abfunds.com | | AB ALL MARKET TOTAL RETURN PORTFOLIO | 79 |
CONSOLIDATED PORTFOLIO OF INVESTMENTS(continued)
| | | | | | | | | | | | | | | | | | | | | | | | | | |
Counterparty &
Referenced
Obligation | | # of Shares
or Units | | | Rate Paid/
Received | | Payment
Frequency | | | Notional
Amount
(000) | | | Maturity
Date | | | Unrealized
Appreciation/
(Depreciation) | |
Entegris, Inc. | | | 15,826 | | | LIBOR Plus 0.30% | | | Annual | | | | USD | | | | 524 | | | | 1/05/21 | | | $ | (34,121 | ) |
Goldman Sachs International | | | | | | | | | | | | | |
GSABSJHB(4) | | | 9,888,965 | | | LIBOR Minus 0.20% | | | Quarterly | | | | JPY | | | | 868,647 | | | | 2/17/20 | | | | (130,390 | ) |
S&P 500 Total Return Index | | | 21,354 | | | LIBOR Plus 0.13% | | | Quarterly | | | | USD | | | | 118,158 | | | | 5/15/19 | | | | (330,466 | ) |
Morgan Stanley Capital Services LLC | | | | | |
Ameris Bancorp | | | 2,601 | | | LIBOR Minus 0.30% | | | Monthly | | | | USD | | | | 107 | | | | 1/27/21 | | | | 808 | |
Ameris Bancorp | | | 697 | | | LIBOR Minus 0.30% | | | Annual | | | | USD | | | | 29 | | | | 1/27/21 | | | | 2 | |
Amcor Ltd. | | | 145,181 | | | BBR Plus 0.50% | | | Monthly | | | | AUD | | | | 1,972 | | | | 1/27/21 | | | | (147,672 | ) |
Bristol-Meyers Squibb Co. | | | 17,059 | | | LIBOR Plus 0.30% | | | Annual | | | | USD | | | | 838 | | | | 1/27/21 | | | | (40,604 | ) |
EnCana Corp. | | | 213,271 | | | LIBOR Plus 0.30% | | | Monthly | | | | USD | | | | 1,455 | | | | 1/27/21 | | | | (87,593 | ) |
Fiserv, Inc. | | | 17,763 | | | LIBOR Plus 0.30% | | | Annual | | | | USD | | | | 1,481 | | | | 1/27/21 | | | | (19,721 | ) |
Fidelity National Financial, Inc. | | | 3,132 | | | LIBOR Minus 0.30% | | | Monthly | | | | USD | | | | 111 | | | | 1/27/21 | | | | 1,424 | |
Fidelity National Financial, Inc. | | | 8,642 | | | LIBOR Minus 0.30% | | | Monthly | | | | USD | | | | 303 | | | | 1/27/21 | | | | 178 | |
Fidelity National Financial, Inc. | | | 843 | | | LIBOR Minus 0.30% | | | Monthly | | | | USD | | | | 30 | | | | 1/27/21 | | | | 31 | |
Fidelity National Financial, Inc. | | | 1,180 | | | LIBOR Minus 0.30% | | | Monthly | | | | USD | | | | 41 | | | | 1/27/21 | | | | (475 | ) |
Fidelity National Financial, Inc. | | | 3,542 | | | LIBOR Minus 0.30% | | | Monthly | | | | USD | | | | 123 | | | | 1/27/21 | | | | (1,150 | ) |
Harris Corp. | | | 9,596 | | | LIBOR Plus 0.30% | | | Annual | | | | USD | | | | 1,356 | | | | 1/27/21 | | | | (223,216 | ) |
II-VI, Inc. | | | 1,096 | | | LIBOR Minus 0.30% | | | Monthly | | | | USD | | | | 42 | | | | 1/27/21 | | | | (4,090 | ) |
II-VI, Inc. | | | 4,346 | | | LIBOR Minus 0.30% | | | Monthly | | | | USD | | | | 167 | | | | 1/27/21 | | | | (17,583 | ) |
II-VI, Inc. | | | 8,409 | | | LIBOR Plus 0.30% | | | Annual | | | | USD | | | | 284 | | | | 1/27/21 | | | | (72,286 | ) |
Independent Bank Corp. | | | 1,748 | | | LIBOR Plus 0.30% | | | Monthly | | | | USD | | | | 138 | | | | 1/27/21 | | | | (10,585 | ) |
Independent Bank Corp. | | | 8,098 | | | LIBOR Plus 0.30% | | | Annual | | | | USD | | | | 633 | | | | 1/27/21 | | | | (54,619 | ) |
KLA Corp. | | | 6,263 | | | LIBOR Plus 0.30% | | | Annual | | | | USD | | | | 611 | | | | 1/27/21 | | | | (110,567 | ) |
Newmont Mining Corp. | | | 5,635 | | | LIBOR Minus 0.30% | | | Monthly | | | | USD | | | | 191 | | | | 1/27/21 | | | | (1,542 | ) |
Newmont Mining Corp. | | | 40,956 | | | LIBOR Plus 0.30% | | | Annual | | | | USD | | | | 1,349 | | | | 1/27/21 | | | | (44,636 | ) |
T-Mobile US, Inc. | | | 19,449 | | | LIBOR Plus 0.30% | | | Annual | | | | USD | | | | 1,325 | | | | 1/27/21 | | | | (75,386 | ) |
Tivity Health, Inc. | | | 6,100 | | | LIBOR Plus 0.30% | | | Monthly | | | | USD | | | | 134 | | | | 1/27/21 | | | | 3,770 | |
| | |
| |
| 80 | AB ALL MARKET TOTAL RETURN PORTFOLIO | | abfunds.com |
CONSOLIDATED PORTFOLIO OF INVESTMENTS(continued)
| | | | | | | | | | | | | | | | | | | | | | | | | | |
Counterparty &
Referenced
Obligation | | # of Shares
or Units | | | Rate Paid/
Received | | Payment
Frequency | | | Notional
Amount
(000) | | | Maturity
Date | | | Unrealized
Appreciation/
(Depreciation) | |
UBS AG | | | | | | | | | | | | | | | | | | | | | | | | | | |
FTSE EPRANAREIT Developed Real Estate Index | | | 1,096 | | | LIBOR Plus 0.17% | | | Quarterly | | | | USD | | | | 5,139 | | | | 1/15/20 | | | $ | (604,976 | ) |
| | | | | | | | | | | | | | | | | | | | | | | | | | |
| | | | | | | | | | | | | | | | | | | | | | | | $ | (2,097,372 | ) |
| | | | | | | | | | | | | | | | | | | | | | | | | | |
VARIANCE SWAPS (see Note D)
| | | | | | | | | | | | | | | | | | | | | | | | | | | | |
Swap Counterparty & Referenced
Obligation | | Volatility
Strike
Rate | | | Payment
Frequency | | | Notional
Amount
(000) | | | Market
Value | | | Upfront Premiums
(Paid)
Received | | | Unrealized
Appreciation/
(Depreciation) | |
Buy Contracts | |
Bank of America, NA | | | | | | | | | | | | | |
Russell 2000 Index 4/18/19* | | | 25.10 | % | | | Maturity | | | | USD | | | | 1,062 | | | $ | (632,318 | ) | | $ | — | | | $ | (632,318 | ) |
Citibank, NA | | | | | | | | | | | | | |
Nasdaq 100 Stock Index 5/17/19* | | | 20.90 | | | | Maturity | | | | USD | | | | 700 | | | | (122,808 | ) | | | — | | | | (122,808 | ) |
S&P 500 Index 5/17/19* | | | 17.60 | | | | Maturity | | | | USD | | | | 832 | | | | (103,569 | ) | | | — | | | | (103,569 | ) |
Deutsche Bank AG | | | | | | | | | | | | | |
AUD/JPY 4/16/20* | | | 12.25 | | | | Maturity | | | | AUD | | | | 200 | | | | (4,856 | ) | | | — | | | | (4,856 | ) |
AUD/JPY 5/7/20* | | | 12.22 | | | | Maturity | | | | AUD | | | | 119 | | | | (2,500 | ) | | | — | | | | (2,500 | ) |
Goldman Sachs Bank USA | | | | | | | | | | | | | |
AUD/JPY 3/10/20* | | | 12.90 | | | | Maturity | | | | AUD | | | | 40 | | | | (1,980 | ) | | | — | | | | (1,980 | ) |
AUD/JPY 3/11/20* | | | 12.80 | | | | Maturity | | | | AUD | | | | 48 | | | | (2,176 | ) | | | — | | | | (2,176 | ) |
JPMorgan Chase Bank, NA | | | | | | | | | | | | | |
S&P/ASX 200 Index 4/18/19* | | | 17.69 | | | | Maturity | | | | AUD | | | | 704 | | | | (383,931 | ) | | | — | | | | (383,931 | ) |
UBS AG | | | | | | | | | | | | | |
S&P/ASX 200 Index 5/16/19* | | | 14.75 | | | | Maturity | | | | AUD | | | | 789 | | | | (159,622 | ) | | | — | | | | (159,622 | ) |
|
Sale Contracts | |
Citibank, NA | | | | | | | | | | | | | |
Nasdaq 100 Stock Index 3/15/19* | | | 18.55 | | | | Maturity | | | | USD | | | | 387 | | | | 201,692 | | | | — | | | | 201,692 | |
Russell 2000 Index 3/15/19* | | | 16.65 | | | | Maturity | | | | USD | | | | 624 | | | | 249,227 | | | | — | | | | 249,227 | |
Russell 2000 Index 4/18/19* | | | 17.55 | | | | Maturity | | | | USD | | | | 739 | | | | 130,385 | | | | — | | | | 130,385 | |
S&P 500 Index 3/15/19* | | | 15.00 | | | | Maturity | | | | USD | | | | 140 | | | | 57,230 | | | | — | | | | 57,230 | |
SPDR S&P 500 ETF Trust 3/1/19* | | | 10.85 | | | | Maturity | | | | USD | | | | 2 | | | | 487 | | | | — | | | | 487 | |
JPMorgan Chase Bank, NA | | | | | | | | | | | | | |
S&P/ASX 200 Index 3/21/19* | | | 12.90 | | | | Maturity | | | | AUD | | | | 264 | | | | 110,291 | | | | — | | | | 110,291 | |
| | |
| |
| abfunds.com | | AB ALL MARKET TOTAL RETURN PORTFOLIO | 81 |
CONSOLIDATED PORTFOLIO OF INVESTMENTS(continued)
| | | | | | | | | | | | | | | | | | | | | | | | | | | | |
Swap Counterparty & Referenced
Obligation | | Volatility
Strike
Rate | | | Payment
Frequency | | | Notional
Amount
(000) | | | Market
Value | | | Upfront Premiums
(Paid)
Received | | | Unrealized
Appreciation/
(Depreciation) | |
UBS AG | | | | | | | | | | | | | |
S&P/ASX 200 Index 4/18/19* | | | 13.65 | % | | | Maturity | | | | AUD | | | | 538 | | | $ | 129,868 | | | $ | — | | | $ | 129,868 | |
SPDR S&P 500 ETF Trust 3/1/19* | | | 10.70 | | | | Maturity | | | | USD | | | | 2 | | | | – 0 | – | | | — | | | | – 0 | – |
| | | | | | | | | | | | | | | | | | | | | | | | | | | | |
| | | | | | | | | | | | | | | | | | $ | (534,580 | ) | | $ | – 0 | – | | $ | (534,580 | ) |
| | | | | | | | | | | | | | | | | | | | | | | | | | | | |
| ** | Principal amount less than 500. |
| *** | Notional amount less than 500. |
| (a) | Non-income producing security. |
| (b) | Security in which significant unobservable inputs (Level 3) were used in determining fair value. |
| (d) | Fair valued by the Adviser. |
| (e) | Security is exempt from registration under Rule 144A of the Securities Act of 1933. These securities are considered restricted, but liquid and may be resold in transactions exempt from registration, normally to qualified institutional buyers. At February 28, 2019, the aggregate market value of these securities amounted to $50,303,425 or 6.9% of net assets. |
| (f) | Restricted and illiquid security. |
| | | | | | | | | | | | | | | | |
Restricted & Illiquid
Securities | | Acquisition
Date | | | Cost | | | Market
Value | | | Percentage of
Net Assets | |
CHC Group LLC | | | 4/26/17 | | | $ | 34,109 | | | $ | 148 | | | | 0.00 | % |
CHC Group LLC/CHC Finance Ltd. Series AI
Zero Coupon, 10/01/20 | | | 4/26/17 | | | | 194,146 | | | | 110,933 | | | | 0.02 | % |
Exide Technologies | | | 4/26/17 | | | | 2,165 | | | | 172 | | | | 0.00 | % |
Exide Technologies/Old | | | 3/30/17 | | | | 1,094 | | | | 87 | | | | 0.00 | % |
Momentive Performance Materials, Inc.
8.875%, 10/15/20 | | | 4/26/17 | | | | – 0 | – | | | – 0 | – | | | 0.00 | % |
Monitronics International, Inc.
9.125%, 04/01/20 | | | 4/19/18 | | | | 109,613 | | | | 23,417 | | | | 0.00 | % |
| (g) | Represents entire or partial securities out on loan. See Note E for securities lending information. |
| (h) | To obtain a copy of the fund’s shareholder report, please go to the Securities and Exchange Commission’s website at www.sec.gov. Additionally, shareholder reports for AB funds can be obtained by calling AB at (800)227-4618. |
| (j) | Pay-In-Kind Payments (PIK). The issuer may pay cash interest and/or interest in additional debt securities. Rates shown are the rates in effect at February 28, 2019. |
| (k) | Defaulted matured security. |
| | |
| |
| 82 | AB ALL MARKET TOTAL RETURN PORTFOLIO | | abfunds.com |
CONSOLIDATED PORTFOLIO OF INVESTMENTS(continued)
| (l) | Security is exempt from registration under Rule 144A of the Securities Act of 1933. These securities, which represent 0.08% of net assets as of February 28, 2019, are considered illiquid and restricted. Additional information regarding such securities follows: |
| | | | | | | | | | | | | | | | |
144A/Restricted & Illiquid
Securities | | Acquisition
Date | | | Cost | | | Market
Value | | | Percentage of
Net Assets | |
Aveta, Inc.
10.50%, 3/01/21 | | | 12/15/17 | | | $ | – 0 | – | | $ | – 0 | – | | | 0.00 | % |
Costa Rica Government International Bond
4.37%, 5/22/19 | | | 1/09/18 | | | | 106,850 | | | | 107,401 | | | | 0.01 | % |
Dominican Republic International Bond
16.00%, 7/10/20 | | | 6/02/17 | | | | 314,106 | | | | 293,427 | | | | 0.04 | % |
Exide Technologies
7.00%, 4/30/25 | | | 12/01/18 | | | | 156,576 | | | | 126,978 | | | | 0.02 | % |
Exide Technologies
11.00%, 4/30/22 | | | 12/01/18 | | | | 78,550 | | | | 70,561 | | | | 0.01 | % |
K2016470219 South Africa Ltd.
3.00%, 12/31/22 | | | 4/26/17 | | | | 9,335 | | | | 11 | | | | 0.00 | % |
K2016470260 South Africa Ltd.
25.00%, 12/31/22 | | | 4/26/17 | | | | 14,525 | | | | 309 | | | | 0.00 | % |
Magnetation LLC/Mag Finance Corp.
11.00%, 5/15/18 | | | 4/26/17 | | | | 15 | | | | 1 | | | | 0.00 | % |
Terraform Global Operating LLC
6.125%, 3/01/26 | | | 2/08/18 | | | | 37,000 | | | | 35,598 | | | | 0.00 | % |
Texas Competitive/TCEH
11.50%, 10/01/20 | | | 4/26/17 | | | | – 0 | – | | | – 0 | – | | | 0.00 | % |
Tonon Luxembourg SA
7.25%, 1/24/20 | | | 4/26/17 | | | | 1,486 | | | | 306 | | | | 0.00 | % |
Virgolino de Oliveira Finance SA
10.50%, 1/28/18 | | | 4/26/17 | | | | 33,435 | | | | 21,501 | | | | 0.00 | % |
| (n) | Securities are perpetual and, thus, do not have a predetermined maturity date. The date shown, if applicable, reflects the next call date. |
| (o) | Position, or a portion thereof, has been segregated to collateralize OTC derivatives outstanding. |
| (p) | Floating Rate Security. Stated interest/floor/ceiling rate was in effect at February 28, 2019. |
| (q) | The stated coupon rate represents the greater of the LIBOR or the LIBOR floor rate plus a spread at February 28, 2019. |
| (r) | Affiliated investments. |
| (s) | The rate shown represents the7-day yield as of period end. |
| (t) | One contract relates to 1 share. |
| | |
| |
| abfunds.com | | AB ALL MARKET TOTAL RETURN PORTFOLIO | 83 |
CONSOLIDATED PORTFOLIO OF INVESTMENTS(continued)
| | |
Currency Abbreviations: ARS – Argentine Peso AUD – Australian Dollar BRL – Brazilian Real CAD – Canadian Dollar CHF – Swiss Franc CLP – Chilean Peso CNH – Chinese Yuan Renminbi (Offshore) CNY – Chinese Yuan Renminbi COP – Colombian Peso CZK – Czech Koruna DOP – Dominican Peso EUR – Euro GBP – Great British Pound HKD – Hong Kong Dollar HUF – Hungarian Forint IDR – Indonesian Rupiah ILS – Israeli Shekel | | INR – Indian Rupee JPY – Japanese Yen KRW – South Korean Won MXN – Mexican Peso MYR – Malaysian Ringgit NOK – Norwegian Krone NZD – New Zealand Dollar PEN – Peruvian Sol PHP – Philippine Peso PLN – Polish Zloty RUB – Russian Ruble SEK – Swedish Krona SGD – Singapore Dollar THB – Thailand Baht TRY – Turkish Lira TWD – New Taiwan Dollar USD – United States Dollar UYU – Uruguayan Peso ZAR – South African Rand |
Glossary:
ABS – Asset-Backed Securities
ADR – American Depositary Receipt
ARLLMONP – Argentina Blended Policy Rate
ASX – Australian Stock Exchange
BBR – Bank of England Base Rate
BKBM – Bank Bill Benchmark (New Zealand)
BOBL – Bundesobligationen
CAC – Cotation Assistée en Continu (Continuous Assisted Quotation)
CBT – Chicago Board of Trade
CDX-CMBX.NA – North American Commercial Mortgage-Backed Index
CDX-NAHY – North American High Yield Credit Default Swap Index
CDX-NAIG – North American Investment Grade Credit Default Swap Index
CMBS – Commercial Mortgage-Backed Securities
CPI – Consumer Price Index
DAX – Deutscher Aktien Index (German Stock Index)
EAFE – Europe, Australia, and Far East
ETF – Exchange Traded Fund
ETS – Emission Trading Scheme
EURIBOR – Euro Interbank Offered Rate
FTSE – Financial Times Stock Exchange
IBEX – International Business Exchange
LIBOR – London Interbank Offered Rates
MIB – Milano Italia Borsa
MSCI – Morgan Stanley Capital International
NIBOR – Norwegian Interbank Offered Rate
OMXS – Stockholm Stock Exchange
OSE – Osaka Securities Exchange
PJSC – Public Joint Stock Company
SPDR – Standard & Poor’s Depository Receipt
SPI – Share Price Index
STIBOR – Stockholm Interbank Offered Rate
TOPIX – Tokyo Price Index
TSX – Toronto Stock Exchange
| | |
| |
| 84 | AB ALL MARKET TOTAL RETURN PORTFOLIO | | abfunds.com |
CONSOLIDATED PORTFOLIO OF INVESTMENTS(continued)
| (1) | The following table represents the 50 largest equity basket holdings underlying the total return swap with CGABROE3 as of February 28, 2019. |
| | | | | | | | | | | | |
| Security Description | | Shares | | | Notional Value
as of 2/28/19 | | | Percent of
Basket’s Value | |
Progressive Corp. (The) | | | 7,137 | | | $ | 521,032 | | | | 2.8 | % |
Discover Financial Services | | | 7,019 | | | | 505,404 | | | | 2.7 | % |
Apple, Inc. | | | 2,882 | | | | 498,546 | | | | 2.6 | % |
Facebook, Inc. | | | 3,054 | | | | 491,668 | | | | 2.6 | % |
Exxon Mobil Corp. | | | 6,027 | | | | 476,166 | | | | 2.5 | % |
T Rowe Price Group, Inc. | | | 4,722 | | | | 472,180 | | | | 2.5 | % |
TJX Cos, Inc. (The) | | | 9,227 | | | | 470,565 | | | | 2.5 | % |
Ross Stores, Inc. | | | 4,950 | | | | 470,289 | | | | 2.5 | % |
Visa, Inc. | | | 3,175 | | | | 469,967 | | | | 2.5 | % |
3M Co. | | | 2,269 | | | | 469,625 | | | | 2.5 | % |
PepsiCo, Inc. | | | 3,913 | | | | 453,912 | | | | 2.4 | % |
Pfizer, Inc. | | | 10,076 | | | | 433,251 | | | | 2.3 | % |
UnitedHealth Group, Inc. | | | 1,786 | | | | 432,141 | | | | 2.3 | % |
Comcast Corp. | | | 10,467 | | | | 408,212 | | | | 2.2 | % |
Walt Disney Co. (The) | | | 3,385 | | | | 382,456 | | | | 2.0 | % |
Linde PLC | | | 2,121 | | | | 366,888 | | | | 1.9 | % |
Accenture PLC | | | 2,167 | | | | 348,872 | | | | 1.9 | % |
Texas Instruments, Inc. | | | 3,270 | | | | 346,652 | | | | 1.8 | % |
American Tower Corp. | | | 1,857 | | | | 326,764 | | | | 1.7 | % |
Las Vegas Sands Corp. | | | 5,345 | | | | 326,075 | | | | 1.7 | % |
Biogen, Inc. | | | 985 | | | | 323,224 | | | | 1.7 | % |
MarketAxess Holdings, Inc. | | | 1,284 | | | | 313,325 | | | | 1.7 | % |
Netflix, Inc. | | | 874 | | | | 312,943 | | | | 1.7 | % |
Costco Wholesale Corp. | | | 1,333 | | | | 291,914 | | | | 1.6 | % |
Automatic Data Processing, Inc. | | | 1,815 | | | | 277,651 | | | | 1.5 | % |
Ulta Beauty, Inc. | | | 856 | | | | 267,173 | | | | 1.4 | % |
SEI Investments Co. | | | 5,040 | | | | 267,135 | | | | 1.4 | % |
Illumina, Inc. | | | 843 | | | | 263,872 | | | | 1.4 | % |
Zoetis, Inc. | | | 2,780 | | | | 261,324 | | | | 1.4 | % |
Erie Indemnity Co. | | | 1,301 | | | | 231,567 | | | | 1.2 | % |
Edwards Lifesciences Corp. | | | 1,356 | | | | 229,092 | | | | 1.2 | % |
Regeneron Pharmaceuticals, Inc. | | | 515 | | | | 221,946 | | | | 1.2 | % |
Credit Acceptance Corp. | | | 497 | | | | 218,758 | | | | 1.2 | % |
Eaton Vance Corp. | | | 5,150 | | | | 216,318 | | | | 1.1 | % |
Applied Materials, Inc. | | | 5,507 | | | | 209,269 | | | | 1.1 | % |
Align Technology, Inc. | | | 783 | | | | 202,688 | | | | 1.1 | % |
Lam Research Corp. | | | 1,129 | | | | 198,623 | | | | 1.1 | % |
ON Semiconductor Corp. | | | 8,912 | | | | 187,155 | | | | 1.0 | % |
Paychex, Inc. | | | 2,332 | | | | 179,602 | | | | 1.0 | % |
Dominion Energy, Inc. | | | 2,397 | | | | 177,353 | | | | 0.9 | % |
Paycom Software, Inc. | | | 939 | | | | 170,978 | | | | 0.9 | % |
Cintas Corp. | | | 815 | | | | 168,671 | | | | 0.9 | % |
Fastenal Co. | | | 2,647 | | | | 166,768 | | | | 0.9 | % |
Laboratory Corp. of America Holdings | | | 1,117 | | | | 165,323 | | | | 0.9 | % |
NVR, Inc. | | | 62 | | | | 161,979 | | | | 0.9 | % |
Broadridge Financial Solutions | | | 1,573 | | | | 158,917 | | | | 0.8 | % |
CDW Corp./DE | | | 1,652 | | | | 155,252 | | | | 0.8 | % |
F5 Networks, Inc. | | | 917 | | | | 154,068 | | | | 0.8 | % |
Exelon Corp. | | | 3,072 | | | | 150,524 | | | | 0.8 | % |
Fair Isaac Corp. | | | 598 | | | | 148,391 | | | | 0.8 | % |
Other | | | 61,067 | | | | 3,704,137 | | | | 19.7 | % |
| | |
| |
| abfunds.com | | AB ALL MARKET TOTAL RETURN PORTFOLIO | 85 |
CONSOLIDATED PORTFOLIO OF INVESTMENTS(continued)
| (2) | The following table represents the 50 largest equity basket holdings underlying the total return swap with GSABLJHB as of February 28, 2019. |
| | | | | | | | | | | | |
| Security Description | | Shares | | | Notional Value as
of 2/28/19 | | | Percent of
Basket’s Value | |
Sumitomo Dainippon Pharma Co., Ltd. | | | 5,793 | | | JPY | 15,914,423 | | | | 1.9 | % |
FamilyMart UNY Holdings Co., Ltd. | | | 4,614 | | | | 14,648,514 | | | | 1.7 | % |
Eisai Co., Ltd. | | | 1,476 | | | | 13,568,268 | | | | 1.6 | % |
Kikkoman Corp. | | | 2,232 | | | | 12,364,569 | | | | 1.5 | % |
Suzuken Co., Ltd./Aichi Japan | | | 1,950 | | | | 11,896,801 | | | | 1.4 | % |
Alfresa Holdings Corp. | | | 3,559 | | | | 11,476,372 | | | | 1.4 | % |
Fast Retailing Co., Ltd. | | | 216 | | | | 11,280,048 | | | | 1.3 | % |
Medipal Holdings Corp. | | | 4,267 | | | | 11,076,383 | | | | 1.3 | % |
Showa Shell Sekiyu KK | | | 6,467 | | | | 10,799,191 | | | | 1.3 | % |
TIS, Inc. | | | 2,053 | | | | 10,636,382 | | | | 1.3 | % |
Shiseido Co., Ltd. | | | 1,439 | | | | 10,576,563 | | | | 1.3 | % |
Tokyo Gas Co., Ltd. | | | 3,430 | | | | 10,512,669 | | | | 1.3 | % |
Sumitomo Realty & Development | | | 2,375 | | | | 9,890,929 | | | | 1.2 | % |
Dai Nippon Printing Co., Ltd. | | | 3,791 | | | | 9,774,273 | | | | 1.2 | % |
Sony Financial Holdings, Inc. | | | 4,615 | | | | 9,715,440 | | | | 1.2 | % |
Konica Minolta, Inc. | | | 8,893 | | | | 9,604,904 | | | | 1.2 | % |
Taiyo Nippon Sanso Corp. | | | 6,085 | | | | 9,571,459 | | | | 1.1 | % |
Mitsui Fudosan Co., Ltd. | | | 3,605 | | | | 9,510,743 | | | | 1.1 | % |
Mitsubishi Estate Co., Ltd. | | | 4,868 | | | | 9,312,220 | | | | 1.1 | % |
Yokogawa Electric Corp. | | | 4,312 | | | | 9,244,107 | | | | 1.1 | % |
Sompo Holdings, Inc. | | | 2,207 | | | | 9,175,259 | | | | 1.1 | % |
Nichirei Corp. | | | 3,269 | | | | 9,053,992 | | | | 1.1 | % |
SoftBank Group Corp. | | | 878 | | | | 9,030,051 | | | | 1.1 | % |
Iida Group Holdings Co., Ltd. | | | 4,392 | | | | 8,932,809 | | | | 1.1 | % |
Marui Group Co., Ltd. | | | 4,557 | | | | 8,927,672 | | | | 1.1 | % |
Kyowa Hakko Kirin Co., Ltd. | | | 4,097 | | | | 8,709,853 | | | | 1.0 | % |
Electric Power Development Co. | | | 3,121 | | | | 8,688,142 | | | | 1.0 | % |
Casio Computer Co., Ltd. | | | 5,719 | | | | 8,641,035 | | | | 1.0 | % |
Hitachi Capital Corp. | | | 3,268 | | | | 8,619,806 | | | | 1.0 | % |
SBI Holdings, Inc./Japan | | | 3,676 | | | | 8,616,277 | | | | 1.0 | % |
Nippon Electric Glass Co., Ltd. | | | 2,841 | | | | 8,549,934 | | | | 1.0 | % |
Toyoda Gosei Co., Ltd. | | | 3,373 | | | | 8,507,255 | | | | 1.0 | % |
Nippon Express Co., Ltd. | | | 1,294 | | | | 8,504,644 | | | | 1.0 | % |
Sumitomo Heavy Industries Ltd. | | | 2,208 | | | | 8,413,894 | | | | 1.0 | % |
Toyota Tsusho Corp. | | | 2,363 | | | | 8,354,433 | | | | 1.0 | % |
TDK Corp. | | | 949 | | | | 8,258,284 | | | | 1.0 | % |
Yokohama Rubber Co., Ltd. (The) | | | 3,623 | | | | 8,228,229 | | | | 1.0 | % |
Kirin Holdings Co., Ltd. | | | 3,299 | | | | 8,210,784 | | | | 1.0 | % |
Sanwa Holdings Corp. | | | 6,352 | | | | 8,200,360 | | | | 1.0 | % |
Oji Holdings Corp. | | | 12,386 | | | | 8,199,704 | | | | 1.0 | % |
Isuzu Motors Ltd. | | | 5,137 | | | | 8,198,664 | | | | 1.0 | % |
Trend Micro, Inc./Japan | | | 1,489 | | | | 8,173,280 | | | | 1.0 | % |
Idemitsu Kosan Co., Ltd. | | | 2,063 | | | | 8,150,048 | | | | 1.0 | % |
NGK Spark Plug Co., Ltd. | | | 3,424 | | | | 8,101,831 | | | | 1.0 | % |
Fukuoka Financial Group, Inc. | | | 3,360 | | | | 8,089,957 | | | | 1.0 | % |
Keikyu Corp. | | | 4,380 | | | | 8,084,634 | | | | 1.0 | % |
Fuji Electric Co., Ltd. | | | 2,300 | | | | 8,048,880 | | | | 1.0 | % |
Kose Corp. | | | 443 | | | | 7,982,767 | | | | 1.0 | % |
DIC Corp. | | | 2,243 | | | | 7,941,636 | | | | 1.0 | % |
Kyocera Corp. | | | 1,286 | | | | 7,895,973 | | | | 0.9 | % |
Other | | | 230,776 | | | | 358,489,839 | | | | 43.1 | % |
| | |
| |
| 86 | AB ALL MARKET TOTAL RETURN PORTFOLIO | | abfunds.com |
CONSOLIDATED PORTFOLIO OF INVESTMENTS(continued)
| (3) | The following table represents the 50 largest (long/short) equity basket holdings underlying the total return swap with JPQABACP as of February 28, 2019. |
| | | | | | | | | | | | |
| Security Description | | Shares | | | Notional Value
as of 2/28/19 | | | Percent of
Basket’s Value | |
MSCI ACWI IMI Index (USD) | | | (20,456 | ) | | $ | (35,614,556 | ) | | | (106.2 | %) |
Royal Dutch Shell PLC | | | 1,506 | | | | 4,733,856 | | | | 14.1 | % |
BP PLC | | | 2,931 | | | | 2,081,958 | | | | 6.2 | % |
Chevron Corp. | | | 17,350 | | | | 2,081,958 | | | | 6.2 | % |
Exxon Mobil Corp. | | | 25,420 | | | | 2,008,201 | | | | 6.0 | % |
TOTAL SA | | | 35,213 | | | | 2,004,848 | | | | 6.0 | % |
EOG Resources, Inc. | | | 14,694 | | | | 1,381,267 | | | | 4.1 | % |
Glencore PLC | | | 2,927 | | | | 1,183,464 | | | | 3.5 | % |
PetroChina Co., Ltd. | | | 1,684,298 | | | | 1,072,829 | | | | 3.2 | % |
Repsol SA | | | 58,099 | | | | 992,366 | | | | 3.0 | % |
Agnico Eagle Mines Ltd. | | | 21,288 | | | | 905,199 | | | | 2.7 | % |
Boliden AB | | | 29,479 | | | | 807,974 | | | | 2.4 | % |
Alcoa Corp. | | | 24,250 | | | | 727,512 | | | | 2.2 | % |
Anadarko Petroleum Corp. | | | 15,925 | | | | 700,691 | | | | 2.1 | % |
Vale SA | | | 58,112 | | | | 697,339 | | | | 2.1 | % |
Mosaic Co. (The) | | | 22,170 | | | | 687,281 | | | | 2.1 | % |
LUKOIL PJSC | | | 8,079 | | | | 670,518 | | | | 2.0 | % |
First Quantum Minerals Ltd. | | | 53,279 | | | | 606,819 | | | | 1.8 | % |
Halliburton Co. | | | 19,358 | | | | 600,113 | | | | 1.8 | % |
Antofagasta PLC | | | 420 | | | | 523,004 | | | | 1.6 | % |
Motor Oil Hellas Corinth Refineries SA | | | 21,170 | | | | 506,241 | | | | 1.5 | % |
Rio Tinto PLC | | | 83 | | | | 476,068 | | | | 1.4 | % |
Continental Resources, Inc./OK | | | 10,281 | | | | 462,657 | | | | 1.4 | % |
C&J Energy Services, Inc. | | | 25,835 | | | | 439,189 | | | | 1.3 | % |
MMC Norilsk Nickel PJSC | | | 20,754 | | | | 435,837 | | | | 1.3 | % |
Aker BP ASA | | | 11,066 | | | | 375,490 | | | | 1.1 | % |
JXTG Holdings, Inc. | | | 78,797 | | | | 368,785 | | | | 1.1 | % |
Tupras Turkiye Petrol Rafineri | | | 13,536 | | | | 365,432 | | | | 1.1 | % |
Yamato Kogyo Co., Ltd. | | | 13,087 | | | | 362,080 | | | | 1.1 | % |
Origin Energy Ltd. | | | 70,012 | | | | 348,669 | | | | 1.0 | % |
Lundin Mining Corp. | | | 58,030 | | | | 308,438 | | | | 0.9 | % |
Newcrest Mining Ltd. | | | 17,475 | | | | 298,380 | | | | 0.9 | % |
SM Energy Co. | | | 18,439 | | | | 295,028 | | | | 0.9 | % |
S-Oil Corp. | | | 3,280 | | | | 291,675 | | | | 0.9 | % |
Johnson Matthey PLC | | | 67 | | | | 274,912 | | | | 0.8 | % |
Concho Resources, Inc. | | | 2,438 | | | | 268,207 | | | | 0.8 | % |
Norsk Hydro ASA | | | 65,492 | | | | 268,207 | | | | 0.8 | % |
Petroleo Brasileiro SA | | | 22,910 | | | | 244,739 | | | | 0.7 | % |
Sumitomo Metal Mining Co., Ltd. | | | 7,890 | | | | 231,329 | | | | 0.7 | % |
Sasol Ltd. | | | 75 | | | | 227,976 | | | | 0.7 | % |
Inpex Corp. | | | 23,089 | | | | 224,623 | | | | 0.7 | % |
Detour Gold Corp. | | | 22,416 | | | | 221,271 | | | | 0.7 | % |
Polyus PJSC | | | 5,315 | | | | 217,918 | | | | 0.7 | % |
Cosan SA | | | 17,717 | | | | 207,861 | | | | 0.6 | % |
OZ Minerals Ltd. | | | 26,389 | | | | 187,745 | | | | 0.6 | % |
Whiting Petroleum Corp. | | | 7,683 | | | | 184,392 | | | | 0.6 | % |
APERAM SA | | | 4,873 | | | | 160,924 | | | | 0.5 | % |
Industrias Penoles SAB de CV | | | 11,907 | | | | 157,572 | | | | 0.5 | % |
Incitec Pivot Ltd. | | | 67,543 | | | | 144,161 | | | | 0.4 | % |
Gran Tierra Energy, Inc. | | | 60,343 | | | | 137,456 | | | | 0.4 | % |
Other | | | 241,670 | | | | 355,375 | | | | 1.0 | % |
| | |
| |
| abfunds.com | | AB ALL MARKET TOTAL RETURN PORTFOLIO | 87 |
CONSOLIDATED PORTFOLIO OF INVESTMENTS(continued)
| (4) | The following table represents the 50 largest equity basket holdings underlying the total return swap with GSABSJHB as of February 28, 2019. |
| | | | | | | | | | | | |
| Security Description | | Shares | | | Notional Value as
of 2/28/19 | | | Percent of
Basket’s Value | |
Keihan Holdings Co., Ltd. | | | (2,905 | ) | | JPY | (13,391,792 | ) | | | (1.5 | %) |
Asahi Intecc Co., Ltd. | | | (2,479 | ) | | | (13,261,574 | ) | | | (1.5 | %) |
Bandai Namco Holdings, Inc. | | | (2,670 | ) | | | (12,653,941 | ) | | | (1.4 | %) |
Nissan Chemical Corp. | | | (2,220 | ) | | | (12,478,977 | ) | | | (1.4 | %) |
Kyushu Railway Co. | | | (2,938 | ) | | | (11,195,098 | ) | | | (1.3 | %) |
Oriental Land Co., Ltd./Japan | | | (914 | ) | | | (11,182,176 | ) | | | (1.3 | %) |
Astellas Pharma, Inc. | | | (6,301 | ) | | | (10,824,370 | ) | | | (1.2 | %) |
Ezaki Glico Co., Ltd. | | | (1,882 | ) | | | (10,612,030 | ) | | | (1.2 | %) |
Azbil Corp. | | | (4,114 | ) | | | (10,111,493 | ) | | | (1.1 | %) |
West Japan Railway Co. | | | (1,203 | ) | | | (10,092,984 | ) | | | (1.1 | %) |
McDonald’s Holdings Co. Japan Ltd. | | | (2,012 | ) | | | (10,041,352 | ) | | | (1.1 | %) |
Marubeni Corp. | | | (12,165 | ) | | | (9,670,826 | ) | | | (1.1 | %) |
KDDI Corp. | | | (3,582 | ) | | | (9,629,125 | ) | | | (1.1 | %) |
SCSK Corp. | | | (1,916 | ) | | | (9,329,312 | ) | | | (1.1 | %) |
Park24 Co., Ltd. | | | (3,473 | ) | | | (9,286,577 | ) | | | (1.1 | %) |
MEIJI Holdings Co., Ltd. | | | (1,040 | ) | | | (9,171,944 | ) | | | (1.0 | %) |
NTT DOCOMO, Inc. | | | (3,532 | ) | | | (9,155,277 | ) | | | (1.0 | %) |
Japan Post Insurance Co., Ltd. | | | (3,567 | ) | | | (8,985,583 | ) | | | (1.0 | %) |
Nippon Telegraph & Telephone Corp. | | | (1,856 | ) | | | (8,911,076 | ) | | | (1.0 | %) |
Fuji Media Holdings, Inc. | | | (5,382 | ) | | | (8,772,536 | ) | | | (1.0 | %) |
Japan Airlines Co., Ltd. | | | (2,133 | ) | | | (8,669,431 | ) | | | (1.0 | %) |
Daito Trust Construction Co., Ltd. | | | (558 | ) | | | (8,609,338 | ) | | | (1.0 | %) |
Tobu Railway Co., Ltd. | | | (2,752 | ) | | | (8,557,423 | ) | | | (1.0 | %) |
ANA Holdings, Inc. | | | (2,064 | ) | | | (8,529,287 | ) | | | (1.0 | %) |
Otsuka Holdings Co., Ltd. | | | (1,813 | ) | | | (8,417,442 | ) | | | (1.0 | %) |
Zenkoku Hosho Co., Ltd. | | | (2,036 | ) | | | (8,337,994 | ) | | | (0.9 | %) |
Rakuten, Inc. | | | (9,482 | ) | | | (8,306,060 | ) | | | (0.9 | %) |
Nissan Motor Co., Ltd. | | | (8,591 | ) | | | (8,264,188 | ) | | | (0.9 | %) |
Japan Post Bank Co., Ltd. | | | (6,614 | ) | | | (8,220,879 | ) | | | (0.9 | %) |
Makita Corp. | | | (1,999 | ) | | | (7,884,551 | ) | | | (0.9 | %) |
Hoshizaki Corp. | | | (1,032 | ) | | | (7,782,025 | ) | | | (0.9 | %) |
Nihon M&A Center, Inc. | | | (2,767 | ) | | | (7,776,197 | ) | | | (0.9 | %) |
Japan Tobacco, Inc. | | | (2,744 | ) | | | (7,774,272 | ) | | | (0.9 | %) |
Canon, Inc. | | | (2,412 | ) | | | (7,721,039 | ) | | | (0.9 | %) |
Yamaguchi Financial Group, Inc. | | | (7,432 | ) | | | (7,714,596 | ) | | | (0.9 | %) |
Teijin Ltd. | | | (4,037 | ) | | | (7,537,964 | ) | | | (0.9 | %) |
Nitori Holdings Co., Ltd. | | | (532 | ) | | | (7,391,801 | ) | | | (0.8 | %) |
Rinnai Corp. | | | (980 | ) | | | (7,337,837 | ) | | | (0.8 | %) |
Takeda Pharmaceutical Co., Ltd. | | | (1,597 | ) | | | (7,138,692 | ) | | | (0.8 | %) |
Aozora Bank Ltd. | | | (2,212 | ) | | | (7,099,554 | ) | | | (0.8 | %) |
Shimamura Co., Ltd. | | | (750 | ) | | | (7,061,321 | ) | | | (0.8 | %) |
Toray Industries, Inc. | | | (9,097 | ) | | | (7,059,069 | ) | | | (0.8 | %) |
Ono Pharmaceutical Co., Ltd. | | | (3,072 | ) | | | (7,028,603 | ) | | | (0.8 | %) |
Kansai Paint Co., Ltd. | | | (3,428 | ) | | | (7,016,334 | ) | | | (0.8 | %) |
Ryohin Keikaku Co., Ltd. | | | (251 | ) | | | (6,643,146 | ) | | | (0.8 | %) |
Sumitomo Metal Mining Co., Ltd. | | | (2,033 | ) | | | (6,636,787 | ) | | | (0.8 | %) |
Seria Co., Ltd. | | | (1,758 | ) | | | (6,626,431 | ) | | | (0.8 | %) |
Sundrug Co., Ltd. | | | (1,900 | ) | | | (6,478,100 | ) | | | (0.7 | %) |
Hikari Tsushin, Inc. | | | (322 | ) | | | (6,423,047 | ) | | | (0.7 | %) |
Aeon Co., Ltd. | | | (2,715 | ) | | | (6,369,129 | ) | | | (0.7 | %) |
Other | | | (166,751 | ) | | | (447,913,991 | ) | | | (50.7 | %) |
See notes to consolidated financial statements.
| | |
| |
| 88 | AB ALL MARKET TOTAL RETURN PORTFOLIO | | abfunds.com |
CONSOLIDATED STATEMENT OF ASSETS & LIABILITIES
February 28, 2019(unaudited)
| | | | |
| Assets | |
Investments in securities, at value | | | | |
Unaffiliated issuers (cost $611,470,054) | | $ | 648,356,760 | (a) |
Affiliated issuers (cost $81,289,215 — including investment of cash collateral for securities loaned of $18,793,508) | | | 81,289,215 | |
Cash | | | 11,089 | |
Cash collateral due from broker | | | 14,070,844 | |
Foreign currencies, at value (cost $5,333,744) | | | 5,418,114 | |
Unrealized appreciation on forward currency exchange contracts | | | 3,791,029 | |
Receivable for investment securities sold and foreign currency transactions | | | 3,551,916 | |
Unaffiliated interest and dividends receivable | | | 2,366,900 | |
Unrealized appreciation on total return swaps | | | 2,054,147 | |
Unrealized appreciation on variance swaps | | | 879,180 | |
Affiliated dividends receivable | | | 120,093 | |
Receivable for shares of beneficial interest sold | | | 81,531 | |
Market value on credit default swaps (net premiums paid $35,597) | | | 31,838 | |
Other assets | | | 134,737 | |
| | | | |
Total assets | | | 762,157,393 | |
| | | | |
| Liabilities | |
Options written, at value (premiums received $215,040) | | | 38,621 | |
Payable for collateral received on securities loaned | | | 18,793,508 | |
Unrealized depreciation on total return swaps | | | 4,151,519 | |
Payable for investment securities purchased and foreign currency transactions | | | 2,669,366 | |
Unrealized depreciation on forward currency exchange contracts | | | 2,524,175 | |
Cash collateral due to broker | | | 2,426,000 | |
Market value on credit default swaps (net premiums received $1,683,369) | | | 2,007,917 | |
Unrealized depreciation on variance swaps | | | 1,413,760 | |
Unrealized depreciation on inflation swaps | | | 1,062,251 | |
Payable for variation margin on futures | | | 1,049,636 | |
Payable for shares of beneficial interest redeemed | | | 729,093 | |
Advisory fee payable | | | 297,863 | |
Payable for variation margin on centrally cleared swaps | | | 203,033 | |
Distribution fee payable | | | 155,405 | |
Payable for terminated total return swaps | | | 75,670 | |
Transfer Agent fee payable | | | 74,503 | |
Trustees’ fees payable | | | 6,294 | |
Accrued expenses and other liabilities | | | 233,042 | |
| | | | |
Total liabilities | | | 37,911,656 | |
| | | | |
Net Assets | | $ | 724,245,737 | |
| | | | |
| Composition of Net Assets | |
Shares of beneficial interest, at par | | $ | 492 | |
Additionalpaid-in capital | | | 723,635,266 | |
Distributable earnings | | | 609,979 | |
| | | | |
| | $ | 724,245,737 | |
| | | | |
| (a) | Includes securities on loan with a value of $18,195,608 (see Note E). |
See notes to consolidated financial statements.
| | |
| |
| abfunds.com | | AB ALL MARKET TOTAL RETURN PORTFOLIO | 89 |
CONSOLIDATED STATEMENT OF ASSETS & LIABILITIES(continued)
Net Asset Value Per Share—unlimited shares authorized, $.00001 par value
| | | | | | | | | | | | |
| Class | | Net Assets | | | Shares
Outstanding | | | Net Asset
Value | |
| |
| A | | $ | 575,636,947 | | | | 39,119,159 | | | $ | 14.71 | * |
| |
| B | | $ | 5,341,354 | | | | 363,683 | | | $ | 14.69 | |
| |
| C | | $ | 48,505,902 | | | | 3,340,333 | | | $ | 14.52 | |
| |
| Advisor | | $ | 80,568,616 | | | | 5,427,611 | | | $ | 14.84 | |
| |
| R | | $ | 4,091,124 | | | | 280,387 | | | $ | 14.59 | |
| |
| K | | $ | 9,868,205 | | | | 673,278 | | | $ | 14.66 | |
| |
| I | | $ | 233,589 | | | | 15,575 | | | $ | 15.00 | |
| |
| * | The maximum offering price per share for Class A shares was $15.36 which reflects a sales charge of 4.25%. |
See notes to consolidated financial statements.
| | |
| |
| 90 | AB ALL MARKET TOTAL RETURN PORTFOLIO | | abfunds.com |
CONSOLIDATED STATEMENT OF OPERATIONS
Six Months Ended February 28, 2019(unaudited)
| | | | | | | | |
| Investment Income | | | | | | | | |
Dividends | | | | | | | | |
Unaffiliated issuers (net of foreign taxes withheld of $73,040) | | $ | 4,691,682 | | | | | |
Affiliated issuers | | | 551,897 | | | | | |
Interest | | | 3,310,775 | | | | | |
Securities lending income | | | 75,506 | | | | | |
Other income | | | 3,893 | | | $ | 8,633,753 | |
| | | | | | | | |
| Expenses | | | | | | | | |
Advisory fee (see Note B) | | | 1,992,174 | | | | | |
Distribution fee—Class A | | | 716,585 | | | | | |
Distribution fee—Class B | | | 27,108 | | | | | |
Distribution fee—Class C | | | 261,337 | | | | | |
Distribution fee—Class R | | | 10,369 | | | | | |
Distribution fee—Class K | | | 13,210 | | | | | |
Transfer agency—Class A | | | 300,382 | | | | | |
Transfer agency—Class B | | | 3,435 | | | | | |
Transfer agency—Class C | | | 28,562 | | | | | |
Transfer agency—Advisor Class | | | 41,161 | | | | | |
Transfer agency—Class R | | | 5,407 | | | | | |
Transfer agency—Class K | | | 10,607 | | | | | |
Transfer agency—Class I | | | 134 | | | | | |
Custodian | | | 191,021 | | | | | |
Printing | | | 74,418 | | | | | |
Audit and tax | | | 62,212 | | | | | |
Registration fees | | | 44,609 | | | | | |
Legal | | | 17,793 | | | | | |
Trustees’ fees | | | 12,439 | | | | | |
Miscellaneous | | | 49,774 | | | | | |
| | | | | | | | |
Total expenses | | | 3,862,737 | | | | | |
Less: expenses waived and reimbursed by the Adviser (see Notes B & E) | | | (458,921 | ) | | | | |
| | | | | | | | |
Net expenses | | | | | | | 3,403,816 | |
| | | | | | | | |
Net investment income | | | | | | | 5,229,937 | |
| | | | | | | | |
See notes to consolidated financial statements.
| | |
| |
| abfunds.com | | AB ALL MARKET TOTAL RETURN PORTFOLIO | 91 |
CONSOLIDATED STATEMENT OF OPERATIONS(continued)
| | | | | | | | |
| Realized and Unrealized Gain (Loss) on Investment and Foreign Currency Transactions | | | | | | | | |
Net realized gain (loss) on: | | | | | | | | |
Affiliated Underlying Portfolios | | | | | | $ | (16,941,928 | ) |
Investment transactions(a) | | | | | | | 7,383,868 | |
Forward currency exchange contracts | | | | | | | 266,203 | |
Futures | | | | | | | (4,829,094 | ) |
Options written | | | | | | | (1,963,044 | ) |
Swaps | | | | | | | (2,012,232 | ) |
Swaptions written | | | | | | | 97,434 | |
Foreign currency transactions | | | | | | | 235,404 | |
Net change in unrealized appreciation/depreciation of: | | | | | | | | |
Affiliated Underlying Portfolios | | | | | | | 12,603,393 | |
Investments | | | | | | | (14,748,215 | ) |
Forward currency exchange contracts | | | | | | | 81,969 | |
Futures | | | | | | | 6,070,372 | |
Options written | | | | | | | 101,490 | |
Swaps | | | | | | | 2,664,546 | |
Swaptions written | | | | | | | (12,204 | ) |
Foreign currency denominated assets and liabilities | | | | | | | 151,860 | |
| | | | | | | | |
Net loss on investment and foreign currency transactions | | | | | | | (10,850,178 | ) |
| | | | | | | | |
Net Decrease in Net Assets from Operations | | | | | | $ | (5,620,241 | ) |
| | | | | | | | |
| (a) | Net of foreign capital gains taxes of $3,790. |
See notes to consolidated financial statements.
| | |
| |
| 92 | AB ALL MARKET TOTAL RETURN PORTFOLIO | | abfunds.com |
CONSOLIDATED STATEMENT OF CHANGES IN NET ASSETS
| | | | | | | | |
| | | Six Months Ended
February 28, 2019
(unaudited) | | | Year Ended
August 31,
2018 | |
| Increase (Decrease) in Net Assets from Operations | | | | | | | | |
Net investment income | | $ | 5,229,937 | | | $ | 11,390,029 | |
Net realized loss on investment transactions | | | (17,763,389 | ) | | | (2,002,267 | ) |
Net change in unrealized appreciation/depreciation of investments and foreign currency denominated assets and liabilities | | | 6,913,211 | | | | 5,876,324 | |
Contributions from Affiliates (see Note B) | | | – 0 | – | | | 5,436 | |
| | | | | | | | |
Net increase (decrease) in net assets from operations | | | (5,620,241 | ) | | | 15,269,522 | |
| Distributions to Shareholders | | | | | | | | |
Class A | | | – 0 | – | | | (8,377,199 | ) |
Class B | | | – 0 | – | | | (37,962 | ) |
Class C | | | – 0 | – | | | (218,557 | ) |
Advisor Class | | | – 0 | – | | | (1,244,557 | ) |
Class R | | | – 0 | – | | | (55,740 | ) |
Class K | | | – 0 | – | | | (289,893 | ) |
| Transactions in Shares of Beneficial Interest | | | | | | | | |
Net decrease | | | (60,164,201 | ) | | | (136,659,908 | ) |
| | | | | | | | |
Total decrease | | | (65,784,442 | ) | | | (131,614,294 | ) |
| Net Assets | | | | | | | | |
Beginning of period | | | 790,030,179 | | | | 921,644,473 | |
| | | | | | | | |
End of period | | $ | 724,245,737 | | | $ | 790,030,179 | |
| | | | | | | | |
See notes to consolidated financial statements.
| | |
| |
| abfunds.com | | AB ALL MARKET TOTAL RETURN PORTFOLIO | 93 |
NOTES TO CONSOLIDATED FINANCIAL STATEMENTS
February 28, 2019(unaudited)
NOTE A
Significant Accounting Policies
The AB Portfolios (the “Company”) was organized as a Massachusetts Business Trust on March 26, 1987 and is registered under the Investment Company Act of 1940 as a diversified, open end management investment company. The Company operates as a series company currently comprised of six series. Each series is considered to be a separate entity for financial reporting and tax purposes. This report relates only to the AB All Market Total Return Portfolio (formerly AB Balanced Wealth Strategy) (the “Fund”). As part of the Fund’s investment strategy, the Fund seeks to gain exposure to commodities and commodities-related instruments and derivatives primarily through investments in AB All Market Total Return Portfolio (Cayman), Ltd., a wholly-owned subsidiary of the Fund organized under the laws of the Cayman Islands (the “Subsidiary”). The Subsidiary commenced operations on April 26, 2017. The Fund is the sole shareholder of the Subsidiary and it is intended that the Fund will remain the sole shareholder and will continue to control the Subsidiary. Under the Articles of Association of the Subsidiary, shares issued by the Subsidiary confer upon a shareholder the right to receive notice of, to attend and to vote at general meetings of the Subsidiary and shall confer upon the shareholder rights in awinding-up or repayment of capital and the right to participate in the profits or assets of the Subsidiary. As of February 28, 2019, net assets of the Fund were $724,245,737, of which $14,324,550, or approximately 2%, represented the Fund’s ownership of all issued shares and voting rights of the Subsidiary. This report presents the consolidated financial statements of the Fund and the Subsidiary. All intercompany transactions and balances have been eliminated in consolidation. The Fund offers Class A, Class B, Class C, Advisor Class, Class R, Class K and Class I shares. Class T shares have been authorized but currently are not offered. Class A shares are sold with afront-end sales charge of up to 4.25% for purchases not exceeding $1,000,000. With respect to purchases of $1,000,000 or more, Class A shares redeemed within one year of purchase may be subject to a contingent deferred sales charge of 1%. Class B shares are currently sold with a contingent deferred sales charge which declines from 4% to 0% depending on the period of time the shares are held. Effective January 31, 2009, sales of Class B shares of the Fund to new investors were suspended. Class B shares will only be issued (i) upon the exchange of Class B shares from another AB mutual fund, (ii) for purposes of dividend reinvestment, (iii) through the Fund’s Automatic Investment Program (the “Program”) for accounts that established the Program prior to January 31, 2009, and (iv) for purchases of additional shares by Class B shareholders as of January 31, 2009. The ability to establish a new Program for accounts containing Class B shares was suspended as of January 31, 2009. Class B shares will automatically
| | |
| |
| 94 | AB ALL MARKET TOTAL RETURN PORTFOLIO | | abfunds.com |
NOTES TO CONSOLIDATED FINANCIAL STATEMENTS(continued)
convert to Class A shares eight years after the end of the calendar month of purchase. Class C shares are subject to a contingent deferred sales charge of 1% on redemptions made within the first year after purchase, and 0% after the first year of purchase. Class C shares will automatically convert to Class A shares ten years after the end of the calendar month of purchase. Class R and Class K shares are sold without an initial or contingent deferred sales charge. Advisor Class and Class I shares are sold without an initial or contingent deferred sales charge and are not subject to ongoing distribution expenses. All eight classes of shares have identical voting, dividend, liquidation and other rights, except that the classes bear different distribution and transfer agency expenses. Each class has exclusive voting rights with respect to its distribution plan. The consolidated financial statements have been prepared in conformity with U.S. generally accepted accounting principles (“U.S. GAAP”) which require management to make certain estimates and assumptions that affect the reported amounts of assets and liabilities in the consolidated financial statements and amounts of income and expenses during the reporting period. Actual results could differ from those estimates. The Fund is an investment company under U.S. GAAP and follows the accounting and reporting guidance applicable to investment companies. The following is a summary of significant accounting policies followed by the Fund.
1. Security Valuation
Portfolio securities are valued at their current market value determined on the basis of market quotations or, if market quotations are not readily available or are deemed unreliable, at “fair value” as determined in accordance with procedures established by and under the general supervision of the Company’s Board of Trustees (the “Board”).
In general, the market values of securities which are readily available and deemed reliable are determined as follows: securities listed on a national securities exchange (other than securities listed on the NASDAQ Stock Market, Inc. (“NASDAQ”)) or on a foreign securities exchange are valued at the last sale price at the close of the exchange or foreign securities exchange. If there has been no sale on such day, the securities are valued at the last traded price from the previous day. Securities listed on more than one exchange are valued by reference to the principal exchange on which the securities are traded; securities listed only on NASDAQ are valued in accordance with the NASDAQ Official Closing Price; listed or over the counter (“OTC”) market put or call options are valued at the mid level between the current bid and ask prices. If either a current bid or current ask price is unavailable, AllianceBernstein L.P. (the “Adviser”) will have discretion to determine the best valuation (e.g., last trade price in the case of listed options); open futures are valued using the closing settlement price or, in the absence of such a price, the most recent quoted bid price.
| | |
| |
| abfunds.com | | AB ALL MARKET TOTAL RETURN PORTFOLIO | 95 |
NOTES TO CONSOLIDATED FINANCIAL STATEMENTS(continued)
If there are no quotations available for the day of valuation, the last available closing settlement price is used; U.S. Government securities and any other debt instruments having 60 days or less remaining until maturity are generally valued at market by an independent pricing vendor, if a market price is available. If a market price is not available, the securities are valued at amortized cost. This methodology is commonly used for short term securities that have an original maturity of 60 days or less, as well as short term securities that had an original term to maturity that exceeded 60 days. In instances when amortized cost is utilized, the Valuation Committee (the “Committee”) must reasonably conclude that the utilization of amortized cost is approximately the same as the fair value of the security. Such factors the Committee will consider include, but are not limited to, an impairment of the creditworthiness of the issuer or material changes in interest rates. Fixed-income securities, including mortgage-backed and asset-backed securities, may be valued on the basis of prices provided by a pricing service or at a price obtained from one or more of the major broker-dealers. In cases where broker-dealer quotes are obtained, the Adviser may establish procedures whereby changes in market yields or spreads are used to adjust, on a daily basis, a recently obtained quoted price on a security. Swaps and other derivatives are valued daily, primarily using independent pricing services, independent pricing models using market inputs, as well as third party broker-dealers or counterparties. Open end mutual funds are valued at the closing net asset value per share, while exchange traded funds are valued at the closing market price per share.
Securities for which market quotations are not readily available (including restricted securities) or are deemed unreliable are valued at fair value as deemed appropriate by the Adviser. Factors considered in making this determination may include, but are not limited to, information obtained by contacting the issuer, analysts, analysis of the issuer’s financial statements or other available documents. In addition, the Fund may use fair value pricing for securities primarily traded innon-U.S. markets because most foreign markets close well before the Fund values its securities at 4:00 p.m., Eastern Time. The earlier close of these foreign markets gives rise to the possibility that significant events, including broad market moves, may have occurred in the interim and may materially affect the value of those securities. To account for this, the Fund generally values many of its foreign equity securities using fair value prices based on third party vendor modeling tools to the extent available.
2. Fair Value Measurements
In accordance with U.S. GAAP regarding fair value measurements, fair value is defined as the price that the Fund would receive to sell an asset or pay to transfer a liability in an orderly transaction between market participants at the
| | |
| |
| 96 | AB ALL MARKET TOTAL RETURN PORTFOLIO | | abfunds.com |
NOTES TO CONSOLIDATED FINANCIAL STATEMENTS(continued)
measurement date. U.S. GAAP establishes a framework for measuring fair value, and a three-level hierarchy for fair value measurements based upon the transparency of inputs to the valuation of an asset or liability (including those valued based on their market values as described in Note A.1 above). Inputs may be observable or unobservable and refer broadly to the assumptions that market participants would use in pricing the asset or liability. Observable inputs reflect the assumptions market participants would use in pricing the asset or liability based on market data obtained from sources independent of the Fund. Unobservable inputs reflect the Fund’s own assumptions about the assumptions that market participants would use in pricing the asset or liability based on the best information available in the circumstances. Each investment is assigned a level based upon the observability of the inputs which are significant to the overall valuation. The three-tier hierarchy of inputs is summarized below.
| | • | | Level 1—quoted prices in active markets for identical investments |
| | • | | Level 2—other significant observable inputs (including quoted prices for similar investments, interest rates, prepayment speeds, credit risk, etc.) |
| | • | | Level 3—significant unobservable inputs (including the Fund’s own assumptions in determining the fair value of investments) |
The fair value of debt instruments, such as bonds, andover-the-counter derivatives is generally based on market price quotations, recently executed market transactions (where observable) or industry recognized modeling techniques and are generally classified as Level 2. Pricing vendor inputs to Level 2 valuations may include quoted prices for similar investments in active markets, interest rate curves, coupon rates, currency rates, yield curves, option adjusted spreads, default rates, credit spreads and other unique security features in order to estimate the relevant cash flows which are then discounted to calculate fair values. If these inputs are unobservable and significant to the fair value, these investments will be classified as Level 3. In addition,non-agency rated investments are classified as Level 3.
Where readily available market prices or relevant bid prices are not available for certain equity investments, such investments may be valued based on similar publicly traded investments, movements in relevant indices since last available prices or based upon underlying company fundamentals and comparable company data (such as multiples to earnings or other multiples to equity). Where an investment is valued using an observable input, such as another publicly traded security, the investment will be classified as Level 2. If management determines that an adjustment is appropriate based on restrictions on resale, illiquidity or uncertainty, and such adjustment is a significant component of the valuation, the investment will be
| | |
| |
| abfunds.com | | AB ALL MARKET TOTAL RETURN PORTFOLIO | 97 |
NOTES TO CONSOLIDATED FINANCIAL STATEMENTS(continued)
classified as Level 3. An investment will also be classified as Level 3 where management uses company fundamentals and other significant inputs to determine the valuation.
Options are valued using market-based inputs to models, broker or dealer quotations, or alternative pricing sources with reasonable levels of price transparency, where such inputs and models are available. Alternatively, the values may be obtained through unobservable management determined inputs and/or management’s proprietary models. Where models are used, the selection of a particular model to value an option depends upon the contractual terms of, and specific risks inherent in, the option as well as the availability of pricing information in the market. Valuation models require a variety of inputs, including contractual terms, market prices, measures of volatility and correlations of such inputs. Exchange traded options generally will be classified as Level 2. For options that do not trade on exchange but trade in liquid markets, inputs can generally be verified and model selection does not involve significant management judgment. Options are classified within Level 2 on the fair value hierarchy when all of the significant inputs can be corroborated to market evidence. Otherwise such instruments are classified as Level 3.
Valuations of mortgage-backed or other asset-backed securities, by pricing vendors, are based on both proprietary and industry recognized models and discounted cash flow techniques. Significant inputs to the valuation of these instruments are value of the collateral, the rates and timing of delinquencies, the rates and timing of prepayments, and default and loss expectations, which are driven in part by housing prices for residential mortgages. Significant inputs are determined based on relative value analyses, which incorporate comparisons to instruments with similar collateral and risk profiles, including relevant indices. Mortgage and asset-backed securities for which management has collected current observable data through pricing services are generally categorized within Level 2. Those investments for which current observable data has not been provided are classified as Level 3.
Bank loan prices are provided by third party pricing services and consist of a composite of the quotes received by the vendor into a consensus price. Certain bank loans are classified as Level 3, as significant input used in the fair value measurement of these instruments is the market quotes that are received by the vendor and these inputs are not observable.
Other fixed income investments, includingnon-U.S. government and corporate debt, are generally valued using quoted market prices, if available, which are typically impacted by current interest rates, maturity dates and any perceived credit risk of the issuer. Additionally, in the absence of
| | |
| |
| 98 | AB ALL MARKET TOTAL RETURN PORTFOLIO | | abfunds.com |
NOTES TO CONSOLIDATED FINANCIAL STATEMENTS(continued)
quoted market prices, these inputs are used by pricing vendors to derive a valuation based upon industry or proprietary models which incorporate issuer specific data with relevant yield/spread comparisons with more widely quoted bonds with similar key characteristics. Those investments for which there are observable inputs are classified as Level 2. Where the inputs are not observable, the investments are classified as Level 3.
The following table summarizes the valuation of the Fund’s investments by the above fair value hierarchy levels as of February 28, 2019:
| | | | | | | | | | | | | | | | |
Investments in Securities: | | Level 1 | | | Level 2 | | | Level 3 | | | Total | |
Assets: | | | | | | | | | | | | | | | | |
Common Stocks: | | | | | | | | | | | | | | | | |
Information Technology | | $ | 76,143,017 | | | $ | 10,113,377 | | | $ | 0 | (a) | | $ | 86,256,394 | |
Financials | | | 41,487,812 | | | | 25,631,063 | | | | – 0 | – | | | 67,118,875 | |
Health Care | | | 49,459,785 | | | | 8,379,687 | | | | – 0 | – | | | 57,839,472 | |
Consumer Discretionary | | | 43,041,347 | | | | 6,189,519 | | | | 46,962 | | | | 49,277,828 | |
Industrials | | | 27,120,796 | | | | 14,549,951 | | | | 259 | | | | 41,671,006 | |
Communication Services | | | 27,517,605 | | | | 13,129,652 | | | | – 0 | – | | | 40,647,257 | |
Consumer Staples | | | 10,568,411 | | | | 9,851,307 | | | | 71,461 | | | | 20,491,179 | |
Energy | | | 7,808,271 | | | | 6,262,959 | | | | 86,549 | (a) | | | 14,157,779 | |
Materials | | | 6,687,165 | | | | 4,680,225 | | | | 33,564 | | | | 11,400,954 | |
Utilities | | | 3,777,736 | | | | 5,217,817 | | | | – 0 | – | | | 8,995,553 | |
Real Estate | | | 4,162,533 | | | | 4,535,970 | | | | – 0 | – | | | 8,698,503 | |
Investment Companies | | | 51,004,889 | | | | – 0 | – | | | – 0 | – | | | 51,004,889 | |
Corporates –Non-Investment Grade | | | – 0 | – | | | 43,442,552 | | | | 315,517 | (a) | | | 43,758,069 | |
Inflation-Linked Securities | | | – 0 | – | | | 12,821,387 | | | | – 0 | – | | | 12,821,387 | |
Governments – Treasuries | | | – 0 | – | | | 12,730,313 | | | | – 0 | – | | | 12,730,313 | |
Emerging Markets – Sovereigns | | | – 0 | – | | | 11,182,813 | | | | – 0 | – | | | 11,182,813 | |
Corporates – Investment Grade | | | – 0 | – | | | 10,163,681 | | | | – 0 | – | | | 10,163,681 | |
Collateralized Mortgage Obligations | | | – 0 | – | | | 7,335,071 | | | | 89,263 | | | | 7,424,334 | |
Emerging Markets – Corporate Bonds | | | – 0 | – | | | 6,424,986 | | | | 43,502 | | | | 6,468,488 | |
Emerging Markets – Treasuries | | | – 0 | – | | | 5,838,598 | | | | – 0 | – | | | 5,838,598 | |
Bank Loans | | | – 0 | – | | | 2,471,475 | | | | 916,036 | | | | 3,387,511 | |
Asset-Backed Securities | | | – 0 | – | | | 121,254 | | | | 836,644 | | | | 957,898 | |
Commercial Mortgage-Backed Securities | | | – 0 | – | | | – 0 | – | | | 753,977 | | | | 753,977 | |
Collateralized Loan Obligations | | | – 0 | – | | | – 0 | – | | | 548,972 | | | | 548,972 | |
Local Governments – Regional Bonds | | | – 0 | – | | | 270,398 | | | | – 0 | – | | | 270,398 | |
Local Governments – US Municipal Bonds | | | – 0 | – | | | 226,256 | | | | – 0 | – | | | 226,256 | |
Options Purchased – Puts | | | – 0 | – | | | 97,212 | | | | – 0 | – | | | 97,212 | |
Preferred Stocks | | | 50,595 | | | | 444 | | | | 0 | (a) | | | 51,039 | |
Quasi-Sovereigns | | | – 0 | – | | | 38,993 | | | | – 0 | – | | | 38,993 | |
Warrants | | | 7,411 | | | | – 0 | – | | | 2,984 | | | | 10,395 | |
Options Purchased – Calls | | | – 0 | – | | | 7,818 | | | | – 0 | – | | | 7,818 | |
Mortgage Pass-Throughs | | | – 0 | – | | | 174 | | | | – 0 | – | | | 174 | |
| | |
| |
| abfunds.com | | AB ALL MARKET TOTAL RETURN PORTFOLIO | 99 |
NOTES TO CONSOLIDATED FINANCIAL STATEMENTS(continued)
| | | | | | | | | | | | | | | | |
Investments in Securities: | | Level 1 | | | Level 2 | | | Level 3 | | | Total | |
Short-Term Investments: | | | | | | | | | | | | | | | | |
Governments – Treasuries | | $ | – 0 | – | | $ | 72,067,926 | | | $ | – 0 | – | | $ | 72,067,926 | |
Investment Companies | | | 62,495,707 | | | | – 0 | – | | | – 0 | – | | | 62,495,707 | |
U.S. Treasury Bills | | | – 0 | – | | | 1,990,819 | | | | – 0 | – | | | 1,990,819 | |
Investments of Cash Collateral for Securities Loaned in Affiliated Money Market Fund | | | 18,793,508 | | | | – 0 | – | | | – 0 | – | | | 18,793,508 | |
| | | | | | | | | | | | | | | | |
Total Investments in Securities | | | 430,126,588 | | | | 295,773,697 | | | | 3,745,690 | | | | 729,645,975 | |
Other Financial Instruments(b): | | | | | | | | | | | | | | | | |
Assets: | | | | | | | | | | | | | | | | |
Futures | | | 6,672,518 | | | | 685,165 | | | | – 0 | – | | | 7,357,683 | (c) |
Forward Currency Exchange Contracts | | | – 0 | – | | | 3,791,029 | | | | – 0 | – | | | 3,791,029 | |
Centrally Cleared Credit Default Swaps | | | – 0 | – | | | 3,543,431 | | | | – 0 | – | | | 3,543,431 | (c) |
Centrally Cleared Interest Rate Swaps | | | – 0 | – | | | 337,779 | | | | – 0 | – | | | 337,779 | (c) |
Credit Default Swaps | | | – 0 | – | | | 31,838 | | | | – 0 | – | | | 31,838 | |
Total Return Swaps | | | – 0 | – | | | 2,054,147 | | | | – 0 | – | | | 2,054,147 | |
Variance Swaps | | | – 0 | – | | | 879,180 | | | | – 0 | – | | | 879,180 | |
Liabilities: | | | | | | | | | | | | | | | | |
Futures | | | (1,683,021 | ) | | | (1,311,525 | ) | | | – 0 | – | | | (2,994,546 | )(c) |
Forward Currency Exchange Contracts | | | – 0 | – | | | (2,524,175 | ) | | | – 0 | – | | | (2,524,175 | ) |
Currency Options Written | | | – 0 | – | | | (38,621 | ) | | | – 0 | – | | | (38,621 | ) |
Centrally Cleared Credit Default Swaps | | | – 0 | – | | | (854,960 | ) | | | – 0 | – | | | (854,960 | )(c) |
Centrally Cleared Interest Rate Swaps | | | – 0 | – | | | (9,453 | ) | | | – 0 | – | | | (9,453 | )(c) |
Credit Default Swaps | | | – 0 | – | | | (2,007,917 | ) | | | – 0 | – | | | (2,007,917 | ) |
Inflation (CPI) Swaps | | | – 0 | – | | | (1,062,251 | ) | | | – 0 | – | | | (1,062,251 | ) |
Total Return Swaps | | | – 0 | – | | | (4,151,519 | ) | | | – 0 | – | | | (4,151,519 | ) |
Variance Swaps | | | – 0 | – | | | (1,413,760 | ) | | | – 0 | – | | | (1,413,760 | ) |
| | | | | | | | | | | | | | | | |
Total(d) | | $ | 435,116,085 | | | $ | 293,722,085 | | | $ | 3,745,690 | | | $ | 732,583,860 | |
| | | | | | | | | | | | | | | | |
| (a) | The Fund held securities with zero market value at period end. |
| (b) | Other financial instruments are derivative instruments, such as futures, forwards and swaps, which are valued at the unrealized appreciation/(depreciation) on the instrument. Other financial instruments may also include swaps with upfront premiums, options written and swaptions written which are valued at market value. |
| (c) | Only variation margin receivable/(payable) at period end is reported within the statement of assets and liabilities. This amount reflects cumulative unrealized appreciation/(depreciation) on futures and centrally cleared swaps as reported in the portfolio of investments. Where applicable, centrally cleared swaps with upfront premiums are presented here at market value. |
| (d) | There were de minimis transfers under 1% of net assets between Level 1 and Level 2 during the reporting period. |
The Fund recognizes all transfers between levels of the fair value hierarchy assuming the financial instruments were transferred at the beginning of the reporting period.
| | |
| |
| 100 | AB ALL MARKET TOTAL RETURN PORTFOLIO | | abfunds.com |
NOTES TO CONSOLIDATED FINANCIAL STATEMENTS(continued)
The following is a reconciliation of investments in which significant unobservable inputs (Level 3) were used in determining fair value.
| | | | | | | | | | | | |
| | | Common Stocks(a) | | | Corporates -
Non-Investment
Grade(a) | | | Collateralized
Mortgage
Obligations | |
Balance as of 8/31/18 | | $ | 115,925 | | | $ | 398,204 | | | $ | 89,411 | |
Accrued discounts/(premiums) | | | – 0 | – | | | 557 | | | | 161 | |
Realized gain (loss) | | | – 0 | – | | | 890 | | | | – 0 | – |
Change in unrealized appreciation/depreciation | | | 28,821 | | | | (78,562 | ) | | | (309 | ) |
Purchases/Payups | | | 43,049 | | | | 11,278 | | | | – 0 | – |
Sales/Paydowns | | | – 0 | – | | | (16,850 | ) | | | – 0 | – |
Transfers in to Level 3 | | | 51,000 | | | | – 0 | – | | | – 0 | – |
Transfers out of Level 3 | | | – 0 | – | | | – 0 | – | | | – 0 | – |
| | | | | | | | | | | | |
Balance as of 2/28/19 | | $ | 238,795 | | | $ | 315,517 | | | $ | 89,263 | |
| | | | | | | | | | | | |
Net change in unrealized appreciation/depreciation from investments held as of 2/28/19(b) | | $ | 28,821 | | | $ | (78,087 | ) | | $ | (309 | ) |
| | | | | | | | | | | | |
| | | |
| | | Emerging Markets -
Corporate Bonds | | | Bank Loans | | | Asset-Backed
Securities | |
Balance as of 8/31/18 | | $ | 53,398 | | | $ | 378,526 | | | $ | 917,472 | |
Accrued discounts/(premiums) | | | 1,920 | | | | 1,276 | | | | 910 | |
Realized gain (loss) | | | 780 | | | | (9,629 | ) | | | 1,854 | |
Change in unrealized appreciation/depreciation | | | (13,410 | ) | | | (13,730 | ) | | | 1,273 | |
Purchases/Payups | | | 1,914 | | | | 655,612 | | | | – 0 | – |
Sales/Paydowns | | | (1,100 | ) | | | (63,704 | ) | | | (84,865 | ) |
Transfers in to Level 3 | | | – 0 | – | | | 198,445 | | | | – 0 | – |
Transfers out of Level 3 | | | – 0 | – | | | (230,760 | ) | | | – 0 | – |
| | | | | | | | | | | | |
Balance as of 2/28/19 | | $ | 43,502 | | | $ | 916,036 | | | $ | 836,644 | |
| | | | | | | | | | | | |
Net change in unrealized appreciation/depreciation from investments held as of 2/28/19(b) | | $ | (13,410 | ) | | $ | (13,730 | ) | | $ | 333 | |
| | | | | | | | | | | | |
| | | |
| | | Commercial
Mortgage-Backed
Securities | | | Collateralized
Loan
Obligations | | | Preferred
Stocks(a) | |
Balance as of 8/31/18 | | $ | 779,178 | | | $ | 736,867 | | | $ | – 0 | – |
Accrued discounts/(premiums) | | | 198 | | | | 11 | | | | – 0 | – |
Realized gain (loss) | | | 196 | | | | 4,912 | | | | – 0 | – |
Change in unrealized appreciation/depreciation | | | 8,236 | | | | (15,224 | ) | | | – 0 | – |
Purchases/Payups | | | 99,500 | | | | – 0 | – | | | – 0 | – |
Sales/Paydowns | | | (133,331 | ) | | | (177,594 | ) | | | – 0 | – |
Transfers in to Level 3 | | | – 0 | – | | | – 0 | – | | | – 0 | – |
Transfers out of Level 3 | | | – 0 | – | | | – 0 | – | | | – 0 | – |
| | | | | | | | | | | | |
Balance as of 2/28/19 | | $ | 753,977 | | | $ | 548,972 | | | $ | – 0 | – |
| | | | | | | | | | | | |
Net change in unrealized appreciation/depreciation from investments held as of 2/28/19(b) | | $ | 9,917 | | | $ | (10,206 | ) | | $ | – 0 | – |
| | | | | | | | | | | | |
| | |
| |
| abfunds.com | | AB ALL MARKET TOTAL RETURN PORTFOLIO | 101 |
NOTES TO CONSOLIDATED FINANCIAL STATEMENTS(continued)
| | | | | | | | | | | | |
| | | Warrants | | | Total | | | | |
Balance as of 8/31/18 | | $ | 8,723 | | | $ | 3,477,704 | | | | | |
Accrued discounts/(premiums) | | | – 0 | – | | | 5,033 | | | | | |
Realized gain (loss) | | | – 0 | – | | | (997 | ) | | | | |
Change in unrealized appreciation/depreciation | | | (5,739 | ) | | | (88,644 | ) | | | | |
Purchases/Payups | | | – 0 | – | | | 811,353 | | | | | |
Sales/Paydowns | | | – 0 | – | | | (477,444 | ) | | | | |
Transfers in to Level 3 | | | – 0 | – | | | 249,445 | | | | | |
Transfers out of Level 3 | | | – 0 | – | | | (230,760 | ) | | | | |
| | | | | | | | | | | | |
Balance as of 2/28/19 | | $ | 2,984 | | | $ | 3,745,690 | (c) | | | | |
| | | | | | | | | | | | |
Net change in unrealized appreciation/depreciation from investments held as of 2/28/19(b) | | $ | (5,739 | ) | | $ | (82,410 | ) | | | | |
| | | | | | | | | | | | |
| (a) | The Fund held securities with zero market value at period end. |
| (b) | The unrealized appreciation/depreciation is included in net change in unrealized appreciation/depreciation on investments and other financial instruments in the accompanying consolidated statement of operations. |
| (c) | There were de minimis transfers under 1% of net assets during the reporting period. |
The Adviser established the Committee to oversee the pricing and valuation of all securities held in the Fund. The Committee operates under pricing and valuation policies and procedures established by the Adviser and approved by the Board, including pricing policies which set forth the mechanisms and processes to be employed on a daily basis to implement these policies and procedures. In particular, the pricing policies describe how to determine market quotations for securities and other instruments. The Committee’s responsibilities include: 1) fair value and liquidity determinations (and oversight of any third parties to whom any responsibility for fair value and liquidity determinations is delegated), and 2) regular monitoring of the Adviser’s pricing and valuation policies and procedures and modification or enhancement of these policies and procedures (or recommendation of the modification of these policies and procedures) as the Committee believes appropriate.
The Committee is also responsible for monitoring the implementation of the pricing policies by the Adviser’s Pricing Group (the “Pricing Group”) and any third party which performs certain pricing functions in accordance with the pricing policies. The Pricing Group is responsible for the oversight of the third party on aday-to-day basis. The Committee and the Pricing Group perform a series of activities to provide reasonable assurance of the accuracy of prices including: 1) periodic vendor due diligence meetings, review of methodologies, new developments and processes at vendors, 2) daily comparison of security valuation versus prior day for all securities that exceeded established thresholds, and 3) daily review of unpriced, stale, and variance reports with exceptions reviewed by senior management and the Committee.
| | |
| |
| 102 | AB ALL MARKET TOTAL RETURN PORTFOLIO | | abfunds.com |
NOTES TO CONSOLIDATED FINANCIAL STATEMENTS(continued)
In addition, several processes outside of the pricing process are used to monitor valuation issues including: 1) performance and performance attribution reports are monitored for anomalous impacts based upon benchmark performance, and 2) portfolio managers review all portfolios for performance and analytics (which are generated using the Adviser’s prices).
3. Currency Translation
Assets and liabilities denominated in foreign currencies and commitments under forward currency exchange contracts are translated into U.S. dollars at the mean of the quoted bid and ask prices of such currencies against the U.S. dollar. Purchases and sales of portfolio securities are translated into U.S. dollars at the rates of exchange prevailing when such securities were acquired or sold. Income and expenses are translated into U.S. dollars at rates of exchange prevailing when accrued.
Net realized gain or loss on foreign currency transactions represents foreign exchange gains and losses from sales and maturities of foreign fixed income investments, holding of foreign currencies, currency gains or losses realized between the trade and settlement dates on foreign investment transactions, and the difference between the amounts of dividends, interest and foreign withholding taxes recorded on the Fund’s books and the U.S. dollar equivalent amounts actually received or paid. Net unrealized currency gains and losses from valuing foreign currency denominated assets and liabilities at period end exchange rates are reflected as a component of net unrealized appreciation or depreciation of foreign currency denominated assets and liabilities.
4. Taxes
It is the Fund’s policy to meet the requirements of the Internal Revenue Code applicable to regulated investment companies and to distribute all of its investment company taxable income and net realized gains, if any, to shareholders. Therefore, no provisions for federal income or excise taxes are required. The Fund may be subject to taxes imposed by countries in which it invests. Such taxes are generally based on income and/or capital gains earned or repatriated. Taxes are accrued and applied to net investment income, net realized gains and net unrealized appreciation/depreciation as such income and/or gains are earned.
If, during a taxable year, the Subsidiary’s taxable losses (and other deductible items) exceed its income and gains, the net loss will not pass through to the Fund as a deductible amount for Federal income tax purposes. Note that the loss from the Subsidiary’s contemplated activities also cannot be carried forward to reduce future Subsidiary’s income in subsequent years. However, if the Subsidiary’s taxable gains exceed its losses and other deductible items during a taxable year, the net gain will pass through to the Fund as income for Federal income tax purposes.
| | |
| |
| abfunds.com | | AB ALL MARKET TOTAL RETURN PORTFOLIO | 103 |
NOTES TO CONSOLIDATED FINANCIAL STATEMENTS(continued)
In accordance with U.S. GAAP requirements regarding accounting for uncertainties in income taxes, management has analyzed the Fund’s tax positions taken or expected to be taken on federal and state income tax returns for all open tax years (the current and the prior three tax years) and has concluded that no provision for income tax is required in the Fund’s consolidated financial statements.
5. Investment Income and Investment Transactions
Dividend income is recorded on theex-dividend date or as soon as the Fund is informed of the dividend. Interest income is accrued daily. Investment gains or losses are determined on the identified cost basis. The Fund amortizes premiums and accretes discounts as adjustments to interest income. Investment transactions are accounted for on the date the securities are purchased or sold.
6. Class Allocations
All income earned and expenses incurred by the Fund are borne on apro-rata basis by each outstanding class of shares, based on the proportionate interest in the Fund represented by the net assets of such class, except for class specific expenses which are allocated to the respective class. Expenses of the Company are charged proportionately to each series or based on other appropriate methods. Realized and unrealized gains and losses are allocated among the various share classes based on respective net assets.
7. Dividends and Distributions
Dividends and distributions to shareholders, if any, are recorded on theex-dividend date. Income dividends and capital gains distributions are determined in accordance with federal tax regulations and may differ from those determined in accordance with U.S. GAAP. To the extent these differences are permanent, such amounts are reclassified within the capital accounts based on their federal tax basis treatment; temporary differences do not require such reclassification.
NOTE B
Advisory Fee and Other Transactions with Affiliates
Under the terms of the investment advisory agreement (the “Advisory Agreement”), the Fund pays the Adviser an advisory fee at an annual rate of .55% of the first $2.5 billion, .45% of the next $2.5 billion and .40% in excess of $5 billion of the Fund’s average daily net assets. The fee is accrued daily and paid monthly.
During 2017, AXA S.A. (“AXA”), a French holding company for the AXA Group, a worldwide leader in life, property and casualty and health insurance and asset management, announced its intention to pursue the sale of a minority stake in its subsidiary, AXA Equitable Holdings, Inc.
| | |
| |
| 104 | AB ALL MARKET TOTAL RETURN PORTFOLIO | | abfunds.com |
NOTES TO CONSOLIDATED FINANCIAL STATEMENTS(continued)
(“AXA Equitable”), the holding company for a diversified financial services organization, through an initial public offering (“IPO”). AXA Equitable is the holding company for a diverse group of financial services companies, including AllianceBernstein L.P., the investment adviser to the Funds (“the Adviser”). In March 2018, AXA announced its intention to sell its entire interest in AXA Equitable over time, subject to market conditions and other factors (the “Plan”). During the second quarter of 2018, AXA Equitable completed the IPO, and, in the fourth quarter of 2018, and in the first quarter of 2019, AXA completed public offerings of additional shares of AXA Equitable’s common stock and simultaneously sold shares to AXA Equitable pursuant to a separate agreement with it. AXA also granted the underwriters of the offering an option to purchase additional shares of AXA Equitable, which was exercised. As a result of the foregoing sales of AXA Equitable shares, as of March 25, 2019, AXA owns approximately 48.3% of the shares of common stock of AXA Equitable. Contemporaneously with the IPO, AXA sold $862.5 million aggregate principal amount of its 7.25% mandatorily exchangeable notes (the “MxB Notes”) due May 15, 2021, and exchangeable into up to 43,125,000 shares of common stock (or approximately 7% of the outstanding shares of common stock of AXA Equitable). AXA retains ownership (including voting rights) of such shares of common stock until the MxB Notes are exchanged, which may be on a date that is earlier than the maturity date at AXA’s option upon the occurrence of certain events.
It is anticipated that one or more of the transactions contemplated by the Plan may ultimately result in the indirect transfer of a “controlling block” of voting securities of the Adviser (a “Change of Control Event”) and therefore may be deemed an “assignment” causing a termination of each Fund’s current investment advisory agreement. In order to ensure that the existing investment advisory services could continue uninterrupted, at meetings held in late July through early August 2018, the Boards of Directors/Trustees (each a “Board” and collectively, the “Boards”) approved new investment advisory agreements with the Adviser, in connection with the Plan. The Boards also agreed to call and hold a joint meeting of shareholders on October 11, 2018, for shareholders of each Fund to (1) approve the new investment advisory agreement with the Adviser that would be effective after the first Change of Control Event and (2) approve any future advisory agreement approved by the Board and that has terms not materially different from the current agreement, in the event there are subsequent Change of Control Events arising from completion of the Plan that terminate the advisory agreement after the first Change of Control Event. Approval of a future advisory agreement means that shareholders may not have another opportunity to vote on a new agreement with the Adviser even upon a change of control, as long as no single person or group of persons acting together gains “control” (as defined in the 1940 Act) of AXA Equitable.
| | |
| |
| abfunds.com | | AB ALL MARKET TOTAL RETURN PORTFOLIO | 105 |
NOTES TO CONSOLIDATED FINANCIAL STATEMENTS(continued)
At the December 11, 2018 adjourned shareholder meeting, shareholders approved the new and future investment advisory agreements.
The Subsidiary has entered into a separate agreement with the Adviser for the management of the Subsidiary’s portfolio. The Adviser receives no compensation from the Subsidiary for its services under the agreement.
During the year ended August 31, 2018, the Adviser reimbursed the Fund $5,436 for trading losses incurred due to a trade entry error.
The Fund compensates AllianceBernstein Investor Services, Inc. (“ABIS”), a wholly-owned subsidiary of the Adviser, under a Transfer Agency Agreement for providing personnel and facilities to perform transfer agency services for the Fund. ABIS may make payments to intermediaries that provide omnibus account services,sub-accounting services and/or networking services. Such compensation retained by ABIS amounted to $120,701 for the six months ended February 28, 2019.
AllianceBernstein Investments, Inc. (the “Distributor”), a wholly-owned subsidiary of the Adviser, serves as the distributor of the Fund’s shares. The Distributor has advised the Fund that it has retainedfront-end sales charges of $2,913 from the sale of Class A shares and received $2,969, $1,291 and $788 in contingent deferred sales charges imposed upon redemptions by shareholders of Class A, Class B and Class C shares, respectively, for the six months ended February 28, 2019.
The Fund may invest in AB Government Money Market Portfolio (the “Government Money Market Portfolio”) which has a contractual annual advisory fee rate of .20% of the portfolio’s average daily net assets and bears its own expenses. Effective August 1, 2018, the Adviser has contractually agreed to waive .10% of the advisory fee of Government Money Market Portfolio (resulting in a net advisory fee of .10%) until August 31, 2019. In connection with the investment by the Fund in Government Money Market Portfolio, the Adviser has contractually agreed to waive its advisory fee from the Fund in an amount equal to the Fund’s pro rata share of the effective advisory fee of Government Money Market Portfolio, as borne indirectly by the Fund as an acquired fund fee and expense. For the six months ended February 28, 2019, such waiver amounted to $22,330.
In connection with the Fund’s investments in AB All Market Alternative Return Portfolio, the Adviser has contractually agreed to waive and reimburse expenses payable by the Fund in an amount equal to the Fund’s pro rata share of the effective advisory fees and other expenses of the portfolio, as borne indirectly by the Fund as an acquired fund fee and
| | |
| |
| 106 | AB ALL MARKET TOTAL RETURN PORTFOLIO | | abfunds.com |
NOTES TO CONSOLIDATED FINANCIAL STATEMENTS(continued)
expense. This fee waiver and/or expense reimbursement will remain in effect until December 31, 2019. For the six months ended February 28, 2019, such waivers amounted to $435,612.
A summary of the Fund’s transactions in AB mutual funds for the six months ended February 28, 2019 is as follows:
| | | | | | | | | | | | | | | | | | | | | | | | | | | | | | | | |
| | | | Distributions | |
| Fund | | Market
Value
8/31/18
(000) | | | Purchases
at Cost
(000) | | | Sales
Proceeds
(000) | | | Realized
Gain
(Loss)
(000) | | | Change in
Unrealized
Appr./
(Depr.)
(000) | | | Market
Value
2/28/19
(000) | | | Dividend
Income
(000) | | | Realized
Gains
(000) | |
Government Money Market Portfolio | | $ | 56,111 | | | $ | 228,446 | | | $ | 222,062 | | | $ | – 0 | – | | $ | – 0 | – | | $ | 62,495 | | | $ | 489 | | | $ | – 0 | – |
AB Cap Fund, Inc. – AB All Market Alternative Return Portfolio | | | 125,226 | | | | – 0 | – | | | 120,887 | | | | (16,942 | ) | | | 12,603 | | | | – 0 | – | | | – 0 | – | | | – 0 | – |
Government Money Market Portfolio* | | | 8,545 | | | | 43,003 | | | | 32,754 | | | | – 0 | – | | | – 0 | – | | | 18,794 | | | | 63 | | | | – 0 | – |
| | | | | | | | | | | | | | | | | | | | | | | | | | | | | | | | |
Total | | | | | | | | | | | | | | $ | (16,942 | ) | | $ | 12,603 | | | $ | 81,289 | | | $ | 552 | | | $ | – 0 | – |
| | | | | | | | | | | | | | | | | | | | | | | | | | | | | | | | |
| * | Investments of cash collateral for securities lending transactions (see Note E). |
Brokerage commissions paid on investment transactions for the six months ended February 28, 2019 amounted to $206,368, of which $0 and $0, respectively, was paid to Sanford C. Bernstein & Co. LLC and Sanford C. Bernstein Limited, affiliates of the Adviser.
NOTE C
Distribution Plan
The Fund has adopted a Plan for each class of shares of the Fund pursuant to Rule12b-1 under the Investment Company Act of 1940 (each a “Plan” and collectively the “Plans”). Under the Plans, the Fund pays distribution and servicing fees to the Distributor at an annual rate of up to .50% of the Fund’s average daily net assets attributable to Class A shares, 1% of the Fund’s average daily net assets attributable to both Class B and Class C shares, .50% of the Fund’s average daily net assets attributable to Class R shares and .25% of the Fund’s average daily net assets attributable to Class K shares. There are no distribution and servicing fees on the Advisor Class and Class I shares. The fees are accrued daily and paid monthly. Effective August 1, 2014, payments under the Plan in respect of
| | |
| |
| abfunds.com | | AB ALL MARKET TOTAL RETURN PORTFOLIO | 107 |
NOTES TO CONSOLIDATED FINANCIAL STATEMENTS(continued)
Class A shares are limited to an annual rate of .25% of the Fund’s Class A share’s average daily net assets. The Plans provide that the Distributor will use such payments in their entirety for distribution assistance and promotional activities. The Fund is not obligated under the Plan to pay any distribution services fee in excess of the amounts set forth above. The purpose of the payments to the Distributor under the Plan is to compensate the Distributor for its distribution services with respect to the sale of the Fund’s shares. Since the Distributor’s compensation is not directly tied to its expenses, the amount of compensation received by it under the Plan during any year may be more or less than its actual expenses. For this reason, the Plan is characterized by the staff of the Securities Exchange Commission as being a “compensation” plan.
In the event that a Plan is terminated or not continued, no distribution services fees (other than current amounts accrued but not yet paid) would be owed by the Fund to the Distributor with respect to the relevant class. The Plans also provide that the Adviser may use its own resources to finance the distribution of the Fund’s shares.
NOTE D
Investment Transactions
Purchases and sales of investment securities (excluding short-term investments) for the six months ended February 28, 2019 were as follows:
| | | | | | | | |
| | | Purchases | | | Sales | |
Investment securities (excluding U.S. government securities) | | $ | 234,554,389 | | | $ | 364,533,674 | |
U.S. government securities | | | 50,862 | | | | – 0 | – |
The cost of investments for federal income tax purposes was substantially the same as the cost for financial reporting purposes. Accordingly, gross unrealized appreciation and unrealized depreciation are as follows:
| | | | |
Gross unrealized appreciation | | $ | 69,630,053 | |
Gross unrealized depreciation | | | (29,991,698 | ) |
| | | | |
Net unrealized appreciation | | $ | 39,638,355 | |
| | | | |
1. Derivative Financial Instruments
The Fund may use derivatives in an effort to earn income and enhance returns, to replace more traditional direct investments, to obtain exposure to otherwise inaccessible markets (collectively, “investment purposes”), or to hedge or adjust the risk profile of its portfolio.
| | |
| |
| 108 | AB ALL MARKET TOTAL RETURN PORTFOLIO | | abfunds.com |
NOTES TO CONSOLIDATED FINANCIAL STATEMENTS(continued)
The principal types of derivatives utilized by the Fund, as well as the methods in which they may be used are:
The Fund may buy or sell futures for investment purposes or for the purpose of hedging its portfolio against adverse effects of potential movements in the market. The Fund bears the market risk that arises from changes in the value of these instruments and the imperfect correlation between movements in the price of the futures and movements in the price of the assets, reference rates or indices which they are designed to track. Among other things, the Fund may purchase or sell futures for foreign currencies or options thereon fornon-hedging purposes as a means of making direct investment in foreign currencies, as described below under “Currency Transactions”.
At the time the Fund enters into futures, the Fund deposits and maintains as collateral an initial margin with the broker, as required by the exchange on which the transaction is effected. Such amount is shown as cash collateral due from broker on the consolidated statement of assets and liabilities. Pursuant to the contract, the Fund agrees to receive from or pay to the broker an amount of cash equal to the daily fluctuation in the value of the contract. Such receipts or payments are known as variation margin and are recorded by the Fund as unrealized gains or losses. Risks may arise from the potential inability of a counterparty to meet the terms of the contract. The credit/counterparty risk for exchange-traded futures is generally less than privately negotiated futures, since the clearinghouse, which is the issuer or counterparty to each exchange-traded future, has robust risk mitigation standards, including the requirement to provide initial and variation margin. When the contract is closed, the Fund records a realized gain or loss equal to the difference between the value of the contract at the time it was opened and the time it was closed.
Use of long futures subjects the Fund to risk of loss in excess of the amounts shown on the consolidated statement of assets and liabilities, up to the notional value of the futures. Use of short futures subjects the Fund to unlimited risk of loss. Under some circumstances, futures exchanges may establish daily limits on the amount that the price of futures can vary from the previous day’s settlement price, which could effectively prevent liquidation of unfavorable positions.
During the six months ended February 28, 2019, the Fund held futures for hedging andnon-hedging purposes.
| | |
| |
| abfunds.com | | AB ALL MARKET TOTAL RETURN PORTFOLIO | 109 |
NOTES TO CONSOLIDATED FINANCIAL STATEMENTS(continued)
| | • | | Forward Currency Exchange Contracts |
The Fund may enter into forward currency exchange contracts in order to hedge its exposure to changes in foreign currency exchange rates on its foreign portfolio holdings, to hedge certain firm purchase and sale commitments denominated in foreign currencies and fornon-hedging purposes as a means of making direct investments in foreign currencies, as described below under “Currency Transactions”.
A forward currency exchange contract is a commitment to purchase or sell a foreign currency at a future date at a negotiated forward rate. The gain or loss arising from the difference between the original contract and the closing of such contract would be included in net realized gain or loss on forward currency exchange contracts. Fluctuations in the value of open forward currency exchange contracts are recorded for financial reporting purposes as unrealized appreciation and/or depreciation by the Fund. Risks may arise from the potential inability of a counterparty to meet the terms of a contract and from unanticipated movements in the value of a foreign currency relative to the U.S. dollar.
During the six months ended February 28, 2019, the Fund held forward currency exchange contracts for hedging andnon-hedging purposes.
For hedging and investment purposes, the Fund may purchase and write (sell) put and call options on U.S. and foreign securities, including government securities, and foreign currencies that are traded on U.S. and foreign securities exchanges andover-the-counter markets. Among other things, the Fund may use options transactions fornon-hedging purposes as a means of making direct investments in foreign currencies, as described below under “Currency Transactions” and may use options strategies involving the purchase and/or writing of various combinations of call and/or put options, for hedging and investment purposes.
The risk associated with purchasing an option is that the Fund pays a premium whether or not the option is exercised. Additionally, the Fund bears the risk of loss of the premium and change in market value should the counterparty not perform under the contract. If a put or call option purchased by the Fund were permitted to expire without being sold or exercised, its premium would represent a loss to the Fund. Put and call options purchased are accounted for in the same manner as portfolio securities. The cost of securities acquired through the exercise of call options is increased by premiums paid. The proceeds from securities sold through the exercise of put options are decreased by the premiums paid.
| | |
| |
| 110 | AB ALL MARKET TOTAL RETURN PORTFOLIO | | abfunds.com |
NOTES TO CONSOLIDATED FINANCIAL STATEMENTS(continued)
When the Fund writes an option, the premium received by the Fund is recorded as a liability and is subsequently adjusted to the current market value of the option written. The Fund’s maximum payment for written put options equates to the number of shares multiplied by the strike price, as included on the Portfolio of Investments. In certain circumstances maximum payout amounts may be partially offset by recovery values of the respective referenced assets and upfront premium received upon entering into the contract. Premiums received from written options which expire unexercised are recorded by the Fund on the expiration date as realized gains from options written. The difference between the premium received and the amount paid on effecting a closing purchase transaction, including brokerage commissions, is also treated as a realized gain, or if the premium received is less than the amount paid for the closing purchase transaction, as a realized loss. If a call option is exercised, the premium received is added to the proceeds from the sale of the underlying security or currency in determining whether the Fund has realized a gain or loss. If a put option is exercised, the premium received reduces the cost basis of the security or currency purchased by the Fund. In writing an option, the Fund bears the market risk of an unfavorable change in the price of the security or currency underlying the written option. Exercise of an option written by the Fund could result in the Fund selling or buying a security or currency at a price different from the current market value.
The Fund may also invest in options on swap agreements, also called “swaptions”. A swaption is an option that gives the buyer the right, but not the obligation, to enter into a swap on a future date in exchange for paying a market-based “premium”. A receiver swaption gives the owner the right to receive the total return of a specified asset, reference rate, or index. A payer swaption gives the owner the right to pay the total return on a specified asset, reference rate, or index. Swaptions also include options that allow an existing swap to be terminated or extended by one of the counterparties. In certain circumstances maximum payout amounts may be partially offset by recovery values of the respective referenced assets and upfront premium received upon entering into the contract.
During the six months ended February 28, 2019, the Fund held purchased options for hedging andnon-hedging purposes. During the six months ended February 28, 2019, the Fund held written options for hedging andnon-hedging purposes.
During the six months ended February 28, 2019, the Fund held purchased swaptions for hedging andnon-hedging purposes. During the six months ended February 28, 2019, the Fund held written swaptions for hedging andnon-hedging purposes.
| | |
| |
| abfunds.com | | AB ALL MARKET TOTAL RETURN PORTFOLIO | 111 |
NOTES TO CONSOLIDATED FINANCIAL STATEMENTS(continued)
The Fund may enter into swaps to hedge its exposure to interest rates, credit risk, equity markets or currencies. The Fund may also enter into swaps fornon-hedging purposes as a means of gaining market exposures, making direct investments in foreign currencies, as described below under “Currency Transactions” or in order to take a “long” or “short” position with respect to an underlying referenced asset described below under “Total Return Swaps”. A swap is an agreement that obligates two parties to exchange a series of cash flows at specified intervals based upon or calculated by reference to changes in specified prices or rates for a specified amount of an underlying asset. The payment flows are usually netted against each other, with the difference being paid by one party to the other. In addition, collateral may be pledged or received by the Fund in accordance with the terms of the respective swaps to provide value and recourse to the Fund or its counterparties in the event of default, bankruptcy or insolvency by one of the parties to the swap.
Risks may arise as a result of the failure of the counterparty to the swap to comply with the terms of the swap. The loss incurred by the failure of a counterparty is generally limited to the net interim payment to be received by the Fund, and/or the termination value at the end of the contract. Therefore, the Fund considers the creditworthiness of each counterparty to a swap in evaluating potential counterparty risk. This risk is mitigated by having a netting arrangement between the Fund and the counterparty and by the posting of collateral by the counterparty to the Fund to cover the Fund’s exposure to the counterparty. Additionally, risks may arise from unanticipated movements in interest rates or in the value of the underlying securities. The Fund accrues for the interim payments on swaps on a daily basis, with the net amount recorded within unrealized appreciation/depreciation of swaps on the consolidated statement of assets and liabilities, where applicable. Once the interim payments are settled in cash, the net amount is recorded as realized gain/(loss) on swaps on the consolidated statement of operations, in addition to any realized gain/(loss) recorded upon the termination of swaps. Upfront premiums paid or received for OTC swaps are recognized as cost or proceeds on the consolidated statement of assets and liabilities and are amortized on a straight line basis over the life of the contract. Amortized upfront premiums are included in net realized gain/(loss) from swaps on the consolidated statement of operations. Fluctuations in the value of swaps are recorded as a component of net change in unrealized appreciation/depreciation of swaps on the consolidated statement of operations.
| | |
| |
| 112 | AB ALL MARKET TOTAL RETURN PORTFOLIO | | abfunds.com |
NOTES TO CONSOLIDATED FINANCIAL STATEMENTS(continued)
Certain standardized swaps, including certain interest rate swaps and credit default swaps, are (or soon will be) subject to mandatory central clearing. Cleared swaps are transacted through futures commission merchants (“FCMs”) that are members of central clearinghouses, with the clearinghouse serving as central counterparty, similar to transactions in futures contracts. Centralized clearing will be required for additional categories of swaps on aphased-in basis based on requirements published by the Securities and Exchange Commission and Commodity Futures Trading Commission.
At the time the Fund enters into a centrally cleared swap, the Fund deposits and maintains as collateral an initial margin with the broker, as required by the clearinghouse on which the transaction is effected. Such amount is shown as cash collateral due from broker on the consolidated statement of assets and liabilities. Pursuant to the contract, the Fund agrees to receive from or pay to the broker an amount of cash equal to the daily fluctuation in the value of the contract. Such receipts or payments are known as variation margin and are recorded by the Fund as unrealized gains or losses. Risks may arise from the potential inability of a counterparty to meet the terms of the contract. The credit/counterparty risk for centrally cleared swaps is generally less thannon-centrally cleared swaps, since the clearinghouse, which is the issuer or counterparty to each centrally cleared swap, has robust risk mitigation standards, including the requirement to provide initial and variation margin. When the contract is closed, the Fund records a realized gain or loss equal to the difference between the value of the contract at the time it was opened and the time it was closed.
Interest Rate Swaps:
The Fund is subject to interest rate risk exposure in the normal course of pursuing its investment objectives. Because the Fund holds fixed rate bonds, the value of these bonds may decrease if interest rates rise. To help hedge against this risk and to maintain its ability to generate income at prevailing market rates, the Fund may enter into interest rate swaps. Interest rate swaps are agreements between two parties to exchange cash flows based on a notional amount. The Fund may elect to pay a fixed rate and receive a floating rate, or, receive a fixed rate and pay a floating rate on a notional amount.
In addition, the Fund may also enter into interest rate swap transactions to preserve a return or spread on a particular investment or portion of its portfolio, or protecting against an increase in the price of securities the Fund anticipates purchasing at a later date. Interest rate swaps involve the exchange by a Fund with another party of their respective commitments to pay or receive interest (e.g., an exchange
| | |
| |
| abfunds.com | | AB ALL MARKET TOTAL RETURN PORTFOLIO | 113 |
NOTES TO CONSOLIDATED FINANCIAL STATEMENTS(continued)
of floating rate payments for fixed rate payments) computed based on a contractually-based principal (or “notional”) amount. Interest rate swaps are entered into on a net basis (i.e., the two payment streams are netted out, with the Fund receiving or paying, as the case may be, only the net amount of the two payments).
During the six months ended February 28, 2019, the Fund held interest rate swaps for hedging andnon-hedging purposes.
Inflation (CPI) Swaps:
Inflation swap agreements are contracts in which one party agrees to pay the cumulative percentage increase in a price index (the Consumer Price Index with respect to CPI swaps) over the term of the swap (with some lag on the inflation index), and the other pays a compounded fixed rate. Inflation swaps may be used to protect the net asset value, or NAV, of a Fund against an unexpected change in the rate of inflation measured by an inflation index since the value of these agreements is expected to increase if there are unexpected inflation increases.
During the six months ended February 28, 2019, the Fund held inflation (CPI) swaps for hedging andnon-hedging purposes.
Credit Default Swaps:
The Fund may enter into credit default swaps, including to manage its exposure to the market or certain sectors of the market, to reduce its risk exposure to defaults by corporate and sovereign issuers held by the Fund, or to create exposure to corporate or sovereign issuers to which it is not otherwise exposed. The Fund may purchase credit protection (“Buy Contract”) or provide credit protection (“Sale Contract”) on the referenced obligation of the credit default swap. During the term of the swap, the Fund receives/(pays) fixed payments from/(to) the respective counterparty, calculated at the agreed upon rate applied to the notional amount. If the Fund is a buyer/(seller) of protection and a credit event occurs, as defined under the terms of the swap, the Fund will either (i) receive from the seller/(pay to the buyer) of protection an amount equal to the notional amount of the swap (the “Maximum Payout Amount”) and deliver/(take delivery of) the referenced obligation or (ii) receive/(pay) a net settlement amount in the form of cash or securities equal to the notional amount of the swap less the recovery value of the referenced obligation.
In certain circumstances Maximum Payout Amounts may be partially offset by recovery values of the respective referenced obligations, upfront premium received upon entering into the agreement, or net amounts received from settlement of buy protection credit default swaps entered into by the Fund for the same referenced obligations
| | |
| |
| 114 | AB ALL MARKET TOTAL RETURN PORTFOLIO | | abfunds.com |
NOTES TO CONSOLIDATED FINANCIAL STATEMENTS(continued)
with the same counterparty. As of February 28, 2019, the Fund had Buy Contracts outstanding with respect to the same referenced obligation and same counterparty for its Sales Contracts which may partially offset the Maximum Payout Amount in the amount of $5,000.
Credit default swaps may involve greater risks than if a Fund had invested in the referenced obligation directly. Credit default swaps are subject to general market risk, liquidity risk, counterparty risk and credit risk. If the Fund is a buyer of protection and no credit event occurs, it will lose the payments it made to its counterparty. If the Fund is a seller of protection and a credit event occurs, the value of the referenced obligation received by the Fund coupled with the periodic payments previously received, may be less than the Maximum Payout Amount it pays to the buyer, resulting in a net loss to the Fund.
Implied credit spreads over U.S. Treasuries of comparable maturity utilized in determining the market value of credit default swaps on issuers as of period end are disclosed in the portfolio of investments. The implied spreads serve as an indicator of the current status of the payment/performance risk and typically reflect the likelihood of default by the issuer of the referenced obligation. The implied credit spread of a particular reference obligation also reflects the cost of buying/selling protection and may reflect upfront payments required to be made to enter into the agreement. Widening credit spreads typically represent a deterioration of the referenced obligation’s credit soundness and greater likelihood of default or other credit event occurring as defined under the terms of the agreement. A credit spread identified as “Defaulted” indicates a credit event has occurred for the referenced obligation.
During the six months ended February 28, 2019, the Fund held credit default swaps for hedging andnon-hedging purposes.
Total Return Swaps:
The Fund may enter into total return swaps in order to take a “long” or “short” position with respect to an underlying referenced asset. The Fund is subject to market price volatility of the underlying referenced asset. A total return swap involves commitments to pay interest in exchange for a market linked return based on a notional amount. To the extent that the total return of the security, group of securities or index underlying the transaction exceeds or falls short of the offsetting interest obligation, the Fund will receive a payment from or make a payment to the counterparty.
During the six months ended February 28, 2019, the Fund held total return swaps for hedging andnon-hedging purposes.
| | |
| |
| abfunds.com | | AB ALL MARKET TOTAL RETURN PORTFOLIO | 115 |
NOTES TO CONSOLIDATED FINANCIAL STATEMENTS(continued)
Variance Swaps:
The Fund may enter into variance swaps to hedge equity market risk or adjust exposure to the equity markets. Variance swaps are contracts in which two parties agree to exchange cash payments based on the difference between the stated level of variance and the actual variance realized on underlying asset(s) or index(es). Actual “variance” as used here is defined as the sum of the square of the returns on the reference asset(s) or index(es) (which in effect is a measure of its “volatility”) over the length of the contract term. So the parties to a variance swap can be said to exchange actual volatility for a contractually stated rate of volatility.
During the six months ended February 28, 2019, the Fund held variance swaps for hedging andnon-hedging purposes.
The Fund typically enters into International Swaps and Derivatives Association, Inc. Master Agreements (“ISDA Master Agreement”) with its OTC derivative contract counterparties in order to, among other things, reduce its credit risk to OTC counterparties. ISDA Master Agreements include provisions for general obligations, representations, collateral and events of default or termination. Under an ISDA Master Agreement, the Fund typically may offset with the OTC counterparty certain derivative financial instruments’ payables and/or receivables with collateral held and/or posted and create one single net payment(close-out netting) in the event of default or termination. In the event of a default by an OTC counterparty, the return of collateral with market value in excess of the Fund’s net liability, held by the defaulting party, may be delayed or denied.
The Fund’s ISDA Master Agreements may contain provisions for early termination of OTC derivative transactions in the event the net assets of the Fund decline below specific levels (“net asset contingent features”). If these levels are triggered, the Fund’s OTC counterparty has the right to terminate such transaction and require the Fund to pay or receive a settlement amount in connection with the terminated transaction. If OTC derivatives were held at period end, please refer to netting arrangements by the OTC counterparty tables below for additional details.
| | |
| |
| 116 | AB ALL MARKET TOTAL RETURN PORTFOLIO | | abfunds.com |
NOTES TO CONSOLIDATED FINANCIAL STATEMENTS(continued)
During the six months ended February 28, 2019, the Fund had entered into the following derivatives:
| | | | | | | | | | | | |
| | | Asset Derivatives | | | Liability Derivatives | |
Derivative Type | | Consolidated
Statement of
Assets and
Liabilities
Location | | Fair Value | | | Consolidated
Statement of
Assets and
Liabilities
Location | | Fair Value | |
Interest rate contracts | | Receivable/Payable for variation margin on futures | | $ | 2,253,675 | * | | Receivable/Payable for variation margin on futures | | $ | 1,357,656 | * |
| | | | |
Equity contracts | | Receivable/Payable for variation margin on futures | | | 5,104,008 | * | | Receivable/Payable for variation margin on futures | | | 1,636,890 | * |
| | | | |
Credit contracts | | Receivable/Payable for variation margin on centrally cleared swaps | | | 749,337 | * | | Receivable/Payable for variation margin on centrally cleared swaps | | | 109,914 | * |
| | | | |
Interest rate contracts | | Receivable/Payable for variation margin on centrally cleared swaps | | | 337,779 | * | | Receivable/Payable for variation margin on centrally cleared swaps | | | 9,453 | * |
| | | | |
Foreign currency contracts | | Unrealized appreciation on forward currency exchange contracts | | | 3,791,029 | | | Unrealized depreciation on forward currency exchange contracts | | | 2,524,175 | |
| | | | |
Foreign exchange contracts | | Investments in securities, at value | | | 105,030 | | | | | | | |
| | | | |
Foreign exchange contracts | | | | | | | | Options written, at value | | | 38,621 | |
| | | | |
Interest rate contracts | | | | | | | | Unrealized depreciation on inflation swaps | | | 1,062,251 | |
| | | | |
Credit contracts | | Market value on credit default swaps | | | 31,838 | | | Market value on credit default swaps | | | 2,007,917 | |
| | | | |
Credit contracts | | Unrealized appreciation on total return swaps | | | 152,181 | | | | | | | |
| | | | |
Interest rate contracts | | | | | | | | Unrealized depreciation on total return swaps | | | 64,866 | |
| | |
| |
| abfunds.com | | AB ALL MARKET TOTAL RETURN PORTFOLIO | 117 |
NOTES TO CONSOLIDATED FINANCIAL STATEMENTS(continued)
| | | | | | | | | | | | |
| | | Asset Derivatives | | | Liability Derivatives | |
Derivative Type | | Consolidated
Statement of
Assets and
Liabilities
Location | | Fair Value | | | Consolidated
Statement of
Assets and
Liabilities
Location | | Fair Value | |
| | | | |
Equity contracts | | Unrealized appreciation on total return swaps | | $ | 254,386 | | | Unrealized depreciation on total return swaps | | $ | 4,075,711 | |
| | | | |
Commodity contracts | | Unrealized appreciation on total return swaps | | | 1,647,580 | | | Unrealized depreciation on total return swaps | | | 10,942 | |
| | | | |
Foreign currency contracts | | | | | | | | Unrealized appreciation on variance swaps | | | 11,512 | |
| | | | |
Equity contracts | | Unrealized appreciation on variance swaps | | | 879,180 | | | Unrealized appreciation on variance swaps | | | 1,402,248 | |
| | | | | | | | | | | | |
Total | | | | $ | 15,306,023 | | | | | $ | 14,312,156 | |
| | | | | | | | | | | | |
| * | Only variation margin receivable/payable at period end is reported within the consolidated statement of assets and liabilities. This amount reflects cumulative unrealized appreciation/(depreciation) on futures and centrally cleared swaps as reported in the consolidated portfolio of investments. |
| | | | | | | | | | |
Derivative Type | | Location of
Gain or (Loss)
on Derivatives
Within Consolidated
Statement of
Operations | | Realized Gain
or (Loss) on
Derivatives | | | Change in
Unrealized
Appreciation or
(Depreciation) | |
Interest rate contracts | | Net realized gain (loss) on futures; Net change in unrealized appreciation/depreciation of futures | | $ | 3,890,363 | | | $ | 605,761 | |
| | | |
Equity contracts | | Net realized gain (loss) on futures; Net change in unrealized appreciation/depreciation of futures | | | (8,475,512 | ) | | | 4,353,076 | |
| | | |
Commodity contracts | | Net realized gain (loss) on futures; Net change in unrealized appreciation/depreciation of futures | | | (243,945 | ) | | | 1,111,535 | |
| | |
| |
| 118 | AB ALL MARKET TOTAL RETURN PORTFOLIO | | abfunds.com |
NOTES TO CONSOLIDATED FINANCIAL STATEMENTS(continued)
| | | | | | | | | | |
Derivative Type | | Location of
Gain or (Loss)
on Derivatives
Within Consolidated
Statement of
Operations | | Realized Gain
or (Loss) on
Derivatives | | | Change in
Unrealized
Appreciation or
(Depreciation) | |
| | | |
Foreign currency contracts | | Net realized gain (loss) on forward currency exchange contracts; Net change in unrealized appreciation/depreciation of forward currency exchange contracts | | $ | 266,203 | | | $ | 81,969 | |
| | | |
Interest rate contracts | | Net realized gain (loss) on investment transactions; Net change in unrealized appreciation/depreciation of investments | | | 451 | | | | 8,428 | |
| | | |
Foreign exchange contracts | | Net realized gain (loss) on investment transactions; Net change in unrealized appreciation/depreciation of investments | | | (761,277 | ) | | | (119,247 | ) |
| | | |
Credit contracts | | Net realized gain (loss) on investment transactions; Net change in unrealized appreciation/depreciation of investments | | | 1,821 | | | | – 0 | – |
| | | |
Equity contracts | | Net realized gain (loss) on investment transactions; Net change in unrealized appreciation/depreciation of investments | | | (204,403 | ) | | | 10,766 | |
| | | |
Foreign exchange contracts | | Net realized gain (loss) on options written; Net change in unrealized appreciation/depreciation of options written | | | 700,069 | | | | 284,887 | |
| | |
| |
| abfunds.com | | AB ALL MARKET TOTAL RETURN PORTFOLIO | 119 |
NOTES TO CONSOLIDATED FINANCIAL STATEMENTS(continued)
| | | | | | | | | | |
Derivative Type | | Location of
Gain or (Loss)
on Derivatives
Within Consolidated
Statement of
Operations | | Realized Gain
or (Loss) on
Derivatives | | | Change in
Unrealized
Appreciation or
(Depreciation) | |
| | | |
Equity contracts | | Net realized gain (loss) on options written; Net change in unrealized appreciation/depreciation of options written | | $ | (2,663,113 | ) | | $ | (183,397 | ) |
| | | |
Interest rate contracts | | Net realized gain (loss) on swaptions written; Net change in unrealized appreciation/depreciation of swaptions written | | | 75,174 | | | | (12,204 | ) |
| | | |
Credit contracts | | Net realized gain (loss) on swaptions written; Net change in unrealized appreciation/depreciation of swaptions written | | | 22,260 | | | | – 0 | – |
| | | |
Foreign currency contracts | | Net realized gain (loss) on swaps; Net change in unrealized appreciation/depreciation of swaps | | | 7,731 | | | | (12,299 | ) |
| | | |
Interest rate contracts | | Net realized gain (loss) on swaps; Net change in unrealized appreciation/depreciation of swaps | | | 463,132 | | | | (1,625,642 | ) |
| | | |
Credit contracts | | Net realized gain (loss) on swaps; Net change in unrealized appreciation/depreciation of swaps | | | (30,499 | ) | | | 889,083 | |
| | | |
Equity contracts | | Net realized gain (loss) on swaps; Net change in unrealized appreciation/depreciation of swaps | | | 1,695,071 | | | | (405,705 | ) |
| | | |
Commodity contracts | | Net realized gain (loss) on swaps; Net change in unrealized appreciation/depreciation of swaps | | | (4,147,667 | ) | | | 3,819,109 | |
| | | | | | | | | | |
Total | | | | $ | (9,404,141) | | | $ | 8,806,120 | |
| | | | | | | | | | |
| | |
| |
| 120 | AB ALL MARKET TOTAL RETURN PORTFOLIO | | abfunds.com |
NOTES TO CONSOLIDATED FINANCIAL STATEMENTS(continued)
The following table represents the average monthly volume of the Fund’s derivative transactions during the six months ended February 28, 2019:
| | | | |
Futures: | | | | |
Average original value of buy contracts | | $ | 537,961,551 | |
Average original value of sale contracts | | $ | 75,496,488 | |
Forward Currency Exchange Contracts: | | | | |
Average principal amount of buy contracts | | $ | 195,890,151 | |
Average principal amount of sale contracts | | $ | 279,199,237 | |
Purchased Options: | | | | |
Average notional amount | | $ | 42,281,014 | |
Purchased Swaptions: | | | | |
Average notional amount | | $ | 3,172,400 | (a) |
Options Written: | | | | |
Average notional amount | | $ | 32,309,641 | |
Swaptions Written: | | | | |
Average notional amount | | $ | 9,734,012 | (b) |
Inflation Swaps: | | | | |
Average notional amount | | $ | 75,870,000 | |
Centrally Cleared Interest Rate Swaps: | | | | |
Average notional amount | | $ | 47,191,141 | (b) |
Credit Default Swaps: | | | | |
Average notional amount of buy contracts | | $ | 262,000 | (c) |
Average notional amount of sale contracts | | $ | 12,550,857 | |
Centrally Cleared Credit Default Swaps: | | | | |
Average notional amount of buy contracts | | $ | 40,352,947 | |
Average notional amount of sale contracts | | $ | 143,808,762 | |
Total Return Swaps: | | | | |
Average notional amount | | $ | 426,809,945 | |
Variance Swaps: | | | | |
Average notional amount | | $ | 2,216,834 | |
| (a) | Positions were open for four months during the period. |
| (b) | Positions were open for five months during the period. |
| (c) | Positions were open for three months during the period. |
For financial reporting purposes, the Fund does not offset derivative assets and derivative liabilities that are subject to netting arrangements in the consolidated statement of assets and liabilities.
All OTC derivatives held at period end were subject to netting arrangements. The following table presents the Fund’s derivative assets and liabilities by OTC counterparty net of amounts available for offset under ISDA Master Agreements (“MA”) and net of the related collateral received/pledged by the Fund as of February 28, 2019. Exchange-traded derivatives and centrally cleared swaps are not subject to netting arrangements and as such are excluded from the table.
| | |
| |
| abfunds.com | | AB ALL MARKET TOTAL RETURN PORTFOLIO | 121 |
NOTES TO CONSOLIDATED FINANCIAL STATEMENTS(continued)
AB All Market Total Return Portfolio
| | | | | | | | | | | | | | | | | | | | |
Counterparty | | Derivatives
Assets
Subject
to a MA | | | Derivatives
Available
for Offset | | | Cash
Collateral
Received* | | | Security
Collateral
Received* | | | Net
Amount of
Derivatives
Assets | |
Bank of America, NA | | $ | 10,894 | | | $ | (10,894 | ) | | $ | – 0 | – | | $ | – 0 | – | | $ | – 0 | – |
Barclays Bank PLC | | | 525,342 | | | | (525,342 | ) | | | – 0 | – | | | – 0 | – | | | – 0 | – |
BNP Paribas SA | | | 142,107 | | | | (51,752 | ) | | | – 0 | – | | | – 0 | – | | | 90,355 | |
Citibank, NA | | | 951,306 | | | | (646,638 | ) | | | – 0 | – | | | – 0 | – | | | 304,668 | |
Credit Suisse International | | | 396,355 | | | | (396,355 | ) | | | – 0 | – | | | – 0 | – | | | – 0 | – |
Deutsche Bank AG | | | 11,243 | | | | (11,243 | ) | | | – 0 | – | | | – 0 | – | | | – 0 | – |
Goldman Sachs & Co./Goldman Sachs Bank USA/Goldman Sachs International | | | 1,291,789 | | | | (718,538 | ) | | | – 0 | – | | | – 0 | – | | | 573,251 | |
HSBC Bank USA | | | 703,996 | | | | (250,837 | ) | | | – 0 | – | | | – 0 | – | | | 453,159 | |
JPMorgan Chase Bank, NA | | | 411,971 | | | | (411,971 | ) | | | – 0 | – | | | – 0 | – | | | – 0 | – |
Morgan Stanley & Co. International PLC/Morgan Stanley Capital Services LLC/Morgan Stanley Capital Services, Inc. | | | 328,195 | | | | (328,195 | ) | | | – 0 | – | | | – 0 | – | | | – 0 | – |
Natwest Markets PLC | | | 119,746 | | | | (67,999 | ) | | | – 0 | – | | | – 0 | – | | | 51,747 | |
Standard Chartered Bank | | | 119,692 | | | | (31,264 | ) | | | – 0 | – | | | – 0 | – | | | 88,428 | |
State Street Bank & Trust Co. | | | 70,900 | | | | (44,011 | ) | | | – 0 | – | | | – 0 | – | | | 26,889 | |
UBS AG | | | 130,108 | | | | (130,108 | ) | | | – 0 | – | | | – 0 | – | | | – 0 | – |
| | | | | | | | | | | | | | | | | | | | |
Total | | $ | 5,213,644 | | | $ | (3,625,147 | ) | | $ | – 0 | – | | $ | – 0 | – | | $ | 1,588,497 | ^ |
| | | | | | | | | | | | | | | | | | | | |
| | | | | |
Counterparty | | Derivatives
Liabilities
Subject
to a MA | | | Derivatives
Available
for Offset | | | Cash
Collateral
Pledged* | | | Security
Collateral
Pledged* | | | Net
Amount of
Derivatives
Liabilities | |
Bank of America, NA | | $ | 1,989,198 | | | $ | (10,894 | ) | | $ | – 0 | – | | $ | (1,978,304 | ) | | $ | – 0 | – |
Barclays Bank PLC | | | 677,018 | | | | (525,342 | ) | | | – 0 | – | | | (151,676 | ) | | | – 0 | – |
BNP Paribas SA | | | 51,752 | | | | (51,752 | ) | | | – 0 | – | | | – 0 | – | | | – 0 | – |
Citibank, NA | | | 646,638 | | | | (646,638 | ) | | | – 0 | – | | | – 0 | – | | | – 0 | – |
Citigroup Global Markets, Inc. | | | 580,611 | | | | – 0 | – | | | – 0 | – | | | (493,526 | ) | | | 87,085 | |
Credit Suisse International | | | 926,673 | | | | (396,355 | ) | | | – 0 | – | | | (530,318 | ) | | | – 0 | – |
Deutsche Bank AG | | | 633,008 | | | | (11,243 | ) | | | – 0 | – | | | (508,688 | ) | | | 113,077 | |
Goldman Sachs & Co./Goldman Sachs Bank USA/Goldman Sachs International | | | 718,538 | | | | (718,538 | ) | | | – 0 | – | | | – 0 | – | | | – 0 | – |
HSBC Bank USA | | | 250,837 | | | | (250,837 | ) | | | – 0 | – | | | – 0 | – | | | – 0 | – |
JPMorgan Chase Bank, NA | | | 2,502,442 | | | | (411,971 | ) | | | – 0 | – | | | (2,090,471 | ) | | | – 0 | – |
| | |
| |
| 122 | AB ALL MARKET TOTAL RETURN PORTFOLIO | | abfunds.com |
NOTES TO CONSOLIDATED FINANCIAL STATEMENTS(continued)
| | | | | | | | | | | | | | | | | | | | |
Counterparty | | Derivatives
Liabilities
Subject
to a MA | | | Derivatives
Available
for Offset | | | Cash
Collateral
Pledged* | | | Security
Collateral
Pledged* | | | Net
Amount of
Derivatives
Liabilities | |
Morgan Stanley & Co. International PLC/Morgan Stanley Capital Services LLC/Morgan Stanley Capital Services, Inc. | | $ | 1,286,474 | | | $ | (328,195 | ) | | $ | – 0 | – | | $ | (841,178 | ) | | $ | 117,101 | |
Natwest Markets PLC | | | 67,999 | | | | (67,999 | ) | | | – 0 | – | | | – 0 | – | | | – 0 | – |
Standard Chartered Bank | | | 31,264 | | | | (31,264 | ) | | | – 0 | – | | | – 0 | – | | | – 0 | – |
State Street Bank & Trust Co. | | | 44,011 | | | | (44,011 | ) | | | – 0 | – | | | – 0 | – | | | – 0 | – |
UBS AG | | | 780,838 | | | | (130,108 | ) | | | – 0 | – | | | (613,012 | ) | | | 37,718 | |
| | | | | | | | | | | | | | | | | | | | |
Total | | $ | 11,187,301 | | | $ | (3,625,147 | ) | | $ | – 0 | – | | $ | (7,207,173 | ) | | $ | 354,981 | ^ |
| | | | | | | | | | | | | | | | | | | | |
| * | The actual collateral received/pledged may be more than the amount reported due to over-collateralization. |
| ^ | Net amount represents the net receivable/payable that would be due from/to the counterparty in the event of default or termination. The net amount from OTC financial derivative instruments can only be netted across transactions governed under the same master agreement with the same counterparty. |
AB All Market Total Return Portfolio (Cayman), Ltd.
| | | | | | | | | | | | | | | | | | | | |
Counterparty | | Derivatives
Assets
Subject
to a MA | | | Derivatives
Available
for Offset | | | Cash
Collateral
Received* | | | Security
Collateral
Received* | | | Net
Amount of
Derivatives
Assets | |
Morgan Stanley Capital Services LLC | | $ | 1,647,580 | | | $ | (10,942 | ) | | $ | (1,636,638 | ) | | $ | – 0 | – | | $ | – 0 | – |
| | | | | | | | | | | | | | | | | | | | |
Total | | $ | 1,647,580 | | | $ | (10,942 | ) | | $ | (1,636,638 | ) | | $ | – 0 | – | | $ | 0 | ^ |
| | | | | | | | | | | | | | | | | | | | |
| | | | | |
Counterparty | | Derivative
Liabilities
Subject
to a MA | | | Derivative
Available
for Offset | | | Cash
Collateral
Pledged* | | | Security
Collateral
Pledged* | | | Net
Amount of
Derivatives
Liabilities | |
Morgan Stanley Capital Services LLC | | $ | 10,942 | | | $ | (10,942 | ) | | $ | – 0 | – | | $ | – 0 | – | | $ | – 0 | – |
| | | | | | | | | | | | | | | | | | | | |
Total | | $ | 10,942 | | | $ | (10,942 | ) | | $ | – 0 | – | | $ | – 0 | – | | $ | 0 | ^ |
| | | | | | | | | | | | | | | | | | | | |
| * | The actual collateral received/pledged may be more than the amount reported due to over-collateralization. |
| ^ | Net amount represents the net receivable/payable that would be due from/to the counterparty in the event of default or termination. The net amount from OTC financial derivative instruments can only be netted across transactions governed under the same master agreement with the same counterparty. |
2. Currency Transactions
The Fund may invest innon-U.S. Dollar-denominated securities on a currency hedged or unhedged basis. The Fund may seek investment opportunities by taking long or short positions in currencies through the use of
| | |
| |
| abfunds.com | | AB ALL MARKET TOTAL RETURN PORTFOLIO | 123 |
NOTES TO CONSOLIDATED FINANCIAL STATEMENTS(continued)
currency-related derivatives, including forward currency exchange contracts, futures and options on futures, swaps, and other options. The Fund may enter into transactions for investment opportunities when it anticipates that a foreign currency will appreciate or depreciate in value but securities denominated in that currency are not held by the Fund and do not present attractive investment opportunities. Such transactions may also be used when the Adviser believes that it may be more efficient than a direct investment in a foreign currency-denominated security. The Fund may also conduct currency exchange contracts on a spot basis (i.e., for cash at the spot rate prevailing in the currency exchange market for buying or selling currencies).
NOTE E
Securities Lending
The Fund may enter into securities lending transactions. Under the Fund’s securities lending program, all loans of securities will be collateralized continually by cash collateral and/ornon-cash collateral.Non-cash collateral will include only securities issued or guaranteed by the U.S. government or its agencies or instrumentalities. If a loan is collateralized by cash, the Fund will be compensated for the loan from a portion of the net return from the income earned on cash collateral after a rebate is paid to the borrower (in some cases, this rebate may be a “negative rebate” or fee paid by the borrower to the Fund in connection with the loan), and payments are made for fees of the securities lending agent and for certain other administrative expenses. If the Fund receivesnon-cash collateral, the Fund will receive a fee from the borrower generally equal to a negotiated percentage of the market value of the loaned securities. The Fund will have the right to call a loan and obtain the securities loaned at any time on notice to the borrower within the normal and customary settlement time for the securities. While the securities are on loan, the borrower is obligated to pay the Fund amounts equal to any income or other distributions from the securities. The Fund will not be able to exercise voting rights with respect to any securities during the existence of a loan, but will have the right to regain ownership of loaned securities in order to exercise voting or other ownership rights. The lending agent has agreed to indemnify the Fund in the case of default of any securities borrower. Collateral received and securities loaned are marked to market daily to ensure that the securities loaned are secured by collateral. The lending agent currently invests the cash collateral received in Government Money Market Portfolio, an eligible money market vehicle, in accordance with the investment restrictions of the Fund, and as approved by the Board. The collateral received on securities loaned is recorded as an asset as well as a corresponding liability in the consolidated statement of assets and liabilities. When the Fund lends securities, its investment performance will continue to reflect changes in the value of the securities loaned. At February 28, 2019, the Fund had
| | |
| |
| 124 | AB ALL MARKET TOTAL RETURN PORTFOLIO | | abfunds.com |
NOTES TO CONSOLIDATED FINANCIAL STATEMENTS(continued)
securities on loan with a value of $18,195,608 and had received cash collateral which has been invested into Government Money Market Portfolio of $18,793,508. The cash collateral will be adjusted on the next business day to maintain the required collateral amount. The Fund earned securities lending income of $75,506 and $63,055 from the borrowers and Government Money Market Portfolio, respectively, for the six months ended February 28, 2019; these amounts are reflected in the consolidated statement of operations. In connection with the cash collateral investment by the Fund in the Government Money Market Portfolio, the Adviser has agreed to waive a portion of the Fund’s share of the advisory fees of Government Money Market Portfolio, as borne indirectly by the Fund as an acquired fund fee and expense. For the six months ended February 28, 2019, such waiver amounted to $979. A principal risk of lending portfolio securities is that the borrower may fail to return the loaned securities upon termination of the loan and that the collateral will not be sufficient to replace the loaned securities.
NOTE F
Shares of Beneficial Interest
Transactions in shares of beneficial interest for each class were as follows:
| | | | | | | | | | | | | | | | | | | | | | | | |
| | | | | | | | | | | | | | | | | | | | | | | | |
| | | Shares | | | | | | Amount | | | | |
| | | Six Months Ended
February 28, 2019
(unaudited) | | | Year Ended
August 31, 2018 | | | | | | Six Months Ended
February 28, 2019
(unaudited) | | | Year Ended
August 31, 2018 | | | | |
| | | | | | | | |
Class A | | | | | | | | | | | | | | | | | | | | | | | | |
Shares sold | | | 478,611 | | | | 1,079,900 | | | | | | | $ | 6,780,641 | | | $ | 15,939,312 | | | | | |
| | | | | |
Shares issued in reinvestment of dividends | | | – 0 | – | | | 519,128 | | | | | | | | – 0 | – | | | 7,703,868 | | | | | |
| | | | | |
Shares converted from Class B | | | 31,575 | | | | 146,595 | | | | | | | | 452,784 | | | | 2,155,088 | | | | | |
| | | | | |
Shares converted from Class C | | | 401,972 | | | | 1,410,748 | | | | | | | | 5,777,284 | | | | 20,687,511 | | | | | |
| | | | | |
Shares redeemed | | | (3,772,843 | ) | | | (7,991,450 | ) | | | | | | | (53,770,934 | ) | | | (118,060,979 | ) | | | | |
| | | | | |
Net decrease | | | (2,860,685 | ) | | | (4,835,079 | ) | | | | | | $ | (40,760,225 | ) | | $ | (71,575,200 | ) | | | | |
| | | | | |
| | | | | | | | | | | | | | | | | | | | | | | | |
Class B | | | | | | | | | | | | | | | | | | | | | | | | |
Shares sold | | | 7,122 | | | | 20,523 | | | | | | | $ | 101,700 | | | $ | 303,624 | | | | | |
| | | | | |
Shares issued in reinvestment of dividends | | | – 0 | – | | | 2,444 | | | | | | | | – 0 | – | | | 36,537 | | | | | |
| | | | | |
Shares converted to Class A | | | (31,578 | ) | | | (146,064 | ) | | | | | | | (452,784 | ) | | | (2,155,088 | ) | | | | |
| | | | | |
Shares redeemed | | | (16,730 | ) | | | (69,200 | ) | | | | | | | (238,328 | ) | | | (1,026,106 | ) | | | | |
| | | | | |
Net decrease | | | (41,186 | ) | | | (192,297 | ) | | | | | | $ | (589,412 | ) | | $ | (2,841,033 | ) | | | | |
| | | | | |
| | |
| |
| abfunds.com | | AB ALL MARKET TOTAL RETURN PORTFOLIO | 125 |
NOTES TO CONSOLIDATED FINANCIAL STATEMENTS(continued)
| | | | | | | | | | | | | | | | | | | | | | | | |
| | | | | | | | | | | | | | | | | | | | | | | | |
| | | Shares | | | | | | Amount | | | | |
| | | Six Months Ended
February 28, 2019
(unaudited) | | | Year Ended
August 31, 2018 | | | | | | Six Months Ended
February 28, 2019
(unaudited) | | | Year Ended
August 31, 2018 | | | | |
| | | | | | | | |
Class C | | | | | | | | | | | | | | | | | | | | | | | | |
Shares sold | | | 35,957 | | | | 141,598 | | | | | | | $ | 503,339 | | | $ | 2,072,554 | | | | | |
| | | | | |
Shares issued in reinvestment of dividends | | | – 0 | – | | | 12,596 | | | | | | | | – 0 | – | | | 186,164 | | | | | |
| | | | | |
Shares converted to Class A | | | (406,477 | ) | | | (1,422,213 | ) | | | | | | | (5,777,284 | ) | | | (20,687,511 | ) | | | | |
| | | | | |
Shares redeemed | | | (486,342 | ) | | | (1,600,537 | ) | | | | | | | (6,870,727 | ) | | | (23,385,272 | ) | | | | |
| | | | | |
Net decrease | | | (856,862 | ) | | | (2,868,556 | ) | | | | | | $ | (12,144,672 | ) | | $ | (41,814,065 | ) | | | | |
| | | | | |
| | | | | | | | | | | | | | | | | | | | | | | | |
| Advisor Class | | | | | | | | | | | | | | | | | | | | | | | | |
Shares sold | | | 500,630 | | | | 1,116,494 | | | | | | | $ | 7,206,752 | | | $ | 16,595,977 | | | | | |
| | | | | |
Shares issued in reinvestment of dividends | | | – 0 | – | | | 69,270 | | | | | | | | – 0 | – | | | 1,034,204 | | | | | |
| | | | | |
Shares redeemed | | | (595,385 | ) | | | (1,804,611 | ) | | | | | | | (8,568,332 | ) | | | (26,809,697 | ) | | | | |
| | | | | |
Net decrease | | | (94,755 | ) | | | (618,847 | ) | | | | | | $ | (1,361,580 | ) | | $ | (9,179,516 | ) | | | | |
| | | | | |
| | | | | | | | | | | | | | | | | | | | | | | | |
| Class R | | | | | | | | | | | | | | | | | | | | | | | | |
Shares sold | | | 104,216 | | | | 39,661 | | | | | | | $ | 1,467,379 | | | $ | 580,933 | | | | | |
| | | | | |
Shares issued in reinvestment of dividends | | | – 0 | – | | | 3,769 | | | | | | | | – 0 | – | | | 55,741 | | | | | |
| | | | | |
Shares redeemed | | | (124,303 | ) | | | (166,537 | ) | | | | | | | (1,753,524 | ) | | | (2,446,974 | ) | | | | |
| | | | | |
Net decrease | | | (20,087 | ) | | | (123,107 | ) | | | | | | $ | (286,145 | ) | | $ | (1,810,300 | ) | | | | |
| | | | | |
| | | | | | | | | | | | | | | | | | | | | | | | |
| Class K | | | | | | | | | | | | | | | | | | | | | | | | |
Shares sold | | | 68,242 | | | | 273,709 | | | | | | | $ | 958,502 | | | $ | 3,984,014 | | | | | |
| | | | | |
Shares issued in reinvestment of dividends | | | – 0 | – | | | 19,587 | | | | | | | | – 0 | – | | | 289,892 | | | | | |
| | | | | |
Shares redeemed | | | (415,331 | ) | | | (933,374 | ) | | | | | | | (5,984,935 | ) | | | (13,725,366 | ) | | | | |
| | | | | |
Net decrease | | | (347,089 | ) | | | (640,078 | ) | | | | | | $ | (5,026,433 | ) | | $ | (9,451,460 | ) | | | | |
| | | | | |
| | | | | | | | | | | | | | | | | | | | | | | | |
| Class I | | | | | | | | | | | | | | | | | | | | | | | | |
Shares sold | | | 330 | | | | 838 | | | | | | | $ | 4,718 | | | $ | 12,538 | | | | | |
| | | | | |
Shares redeemed | | | (31 | ) | | | (59 | ) | | | | | | | (452 | ) | | | (872 | ) | | | | |
| | | | | |
Net increase | | | 299 | | | | 779 | | | | | | | $ | 4,266 | | | $ | 11,666 | | | | | |
| | | | | |
NOTE G
Risks Involved in Investing in the Fund
Allocation Risk—The allocation of investments among different investment styles, such as equity or debt, growth or value, U.S. ornon-U.S. securities, or diversification strategies, may have a more significant effect on the Fund’s net asset value, or NAV, when one of these investments is performing more poorly than another.
| | |
| |
| 126 | AB ALL MARKET TOTAL RETURN PORTFOLIO | | abfunds.com |
NOTES TO CONSOLIDATED FINANCIAL STATEMENTS(continued)
Interest Rate Risk and Credit Risk—Interest rate risk is the risk that changes in interest rates will affect the value of the Fund’s investments in fixed-income debt securities such as bonds or notes. Increases in interest rates may cause the value of the Fund’s investments to decline. Credit risk is the risk that the issuer or guarantor of a debt security, or the counterparty to a derivative contract, will be unable or unwilling to make timely principal and/or interest payments, or to otherwise honor its obligations. The degree of risk for a particular security may be reflected in its credit rating. Credit risk is greater for medium quality and lower-rated securities. Lower-rated debt securities and similar unrated securities (commonly known as “junk bonds”) have speculative elements or are predominantly speculative risks.
High Yield Debt Securities Risk—Investments in fixed-income securities with lower ratings (commonly known as “junk bonds”) tend to have a higher probability that an issuer will default or fail to meet its payment obligations. These securities may be subject to greater price volatility due to such factors as specific corporate developments, interest rate sensitivity, negative perceptions of the junk bond market generally and less secondary market liquidity.
Inflation Risk—This is the risk that the value of assets or income from investments will be less in the future as inflation decreases the value of money. As inflation increases, the value of the Fund’s assets can decline as can the value of the Fund’s distributions. This risk is significantly greater for fixed-income securities with longer maturities.
Foreign(Non-U.S.) Risk—Investments in securities ofnon-U.S. issuers may involve more risk than those of U.S. issuers. These securities may fluctuate more widely in price and may be less liquid due to adverse market, economic, political, regulatory or other factors.
Currency Risk—Fluctuations in currency exchange rates may negatively affect the value of the Fund’s investments or reduce its returns.
Emerging Market Risk—Investments in emerging market countries may have more risk because the markets are less developed and less liquid as well as being subject to increased economic, political, regulatory or other uncertainties.
Alternative Investments Risk—Many alternative investments can be volatile and may be illiquid. Their performance may have little correlation with the performance of equity or fixed-income markets, and they may not perform in accordance with expectations.
| | |
| |
| abfunds.com | | AB ALL MARKET TOTAL RETURN PORTFOLIO | 127 |
NOTES TO CONSOLIDATED FINANCIAL STATEMENTS(continued)
Capitalization Risk—Investments in small- andmid-capitalization companies may be more volatile than investments in large-capitalization companies. Investments in small-capitalization companies may have additional risks because these companies have limited product lines, markets or financial resources.
Derivatives Risk—The Fund may enter into derivative transactions such as forwards, options, futures and swaps. Derivatives may be illiquid, difficult to price, and leveraged so that small changes may produce disproportionate losses for the Fund, and subject to counterparty risk to a greater degree than more traditional investments. Derivatives may result in significant losses, including losses that are far greater than the value of the derivatives reflected on the consolidated statement of assets and liabilities.
Leverage Risk—When the Fund borrows money or otherwise leverages its investments, its performance may be volatile because leverage tends to exaggerate the effect of any increase or decrease in the value of the Fund’s investments. The Fund may create leverage through the use of reverse repurchase arrangements, forward currency exchange contracts, forward commitments, dollar rolls or futures or by borrowing money. The use of other types of derivative instruments by the Fund, such as options and swaps, may also result in a form of leverage. Leverage may result in higher returns to the Fund than if the Fund were not leveraged, but may also adversely affect returns, particularly if the market is declining.
Commodity Risk—Investing in commodities and commodity-linked derivative instruments may subject the Fund to greater volatility than investments in traditional securities. The value of commodity-linked derivative instruments may be affected by overall market movements, commodity index volatility, changes in interest rates, or factors affecting a particular industry or commodity, such as drought, floods, weather, livestock disease, embargoes, tariffs and international economic, political and regulatory developments.
Subsidiary Risk—By investing in the Subsidiary, the Fund is indirectly exposed to the risks associated with the Subsidiary. The derivatives and other investments held by the Subsidiary are generally similar to those that are permitted to be held by the Fund and are subject to the same risks that apply to similar investments if held directly by the Fund. The Subsidiary is not registered under the Investment Company Act of 1940, as amended (the “1940 Act”), and, unless otherwise noted in the Fund’s prospectus, is not subject to all of the investor protections of the 1940 Act. However, the Fund wholly owns and controls the Subsidiary, and the Fund and the Subsidiary are managed by the Adviser, making it unlikely the Subsidiary will take actions contrary to the interests of the Fund or its
| | |
| |
| 128 | AB ALL MARKET TOTAL RETURN PORTFOLIO | | abfunds.com |
NOTES TO CONSOLIDATED FINANCIAL STATEMENTS(continued)
shareholders. In addition, changes in federal tax laws applicable to the Fund or interpretations thereof could limit the Fund’s ability to gain exposure to commodities investments through investments in the Subsidiary.
Short Sale Risk—The Fund is subject to short sale risk because it may engage in short sales either directly or indirectly through investment in the Underlying Portfolio. Short sales involve the risk that the Fund or Underlying Portfolio will incur a loss by subsequently buying a security at a higher price than the price at which it sold the security. The amount of such loss is theoretically unlimited, as it will be based on the increase in value of the security sold short. In contrast, the risk of loss from a long position is limited to the Fund’s or Underlying Portfolio’s investment in the security, because the price of the security cannot fall below zero. The Fund or Underlying Portfolio may not always be able to close out a short position on favorable terms.
Indemnification Risk—In the ordinary course of business, the Fund enters into contracts that contain a variety of indemnifications. The Fund’s maximum exposure under these arrangements is unknown. However, the Fund has not had prior claims or losses pursuant to these indemnification provisions and expects the risk of loss thereunder to be remote. Therefore, the Fund has not accrued any liability in connection with these indemnification provisions.
NOTE H
Joint Credit Facility
A number ofopen-end mutual funds managed by the Adviser, including the Fund, participate in a $325 million revolving credit facility (the “Facility”) intended to provide short-term financing, if necessary, subject to certain restrictions in connection with abnormal redemption activity. Commitment fees related to the Facility are paid by the participating funds and are included in miscellaneous expenses in the consolidated statement of operations. The Fund did not utilize the Facility during the six months ended February 28, 2019.
NOTE I
Distributions to Shareholders
The tax character of distributions to be paid for the year ending August 31, 2019 will be determined at the end of the current fiscal year. The tax character of distributions paid during the fiscal years ended August 31, 2018 and August 31, 2017 were as follows:
| | | | | | | | |
| | | 2018 | | | 2017 | |
Distributions paid from: | | | | | | | | |
Ordinary income | | $ | 10,223,908 | | | $ | 29,567,238 | |
| | | | | | | | |
Total taxable distributions paid | | $ | 10,223,908 | | | $ | 29,567,238 | |
| | | | | | | | |
| | |
| |
| abfunds.com | | AB ALL MARKET TOTAL RETURN PORTFOLIO | 129 |
NOTES TO CONSOLIDATED FINANCIAL STATEMENTS(continued)
As of August 31, 2018, the components of accumulated earnings/(deficit) on a tax basis were as follows:
| | | | |
Accumulated capital and other losses | | $ | (10,549,065 | )(a) |
Other losses | | | (16,163,352 | )(b) |
Unrealized appreciation/(depreciation) | | | 33,135,192 | (c) |
| | | | |
Total accumulated earnings/(deficit) | | $ | 6,422,775 | (d) |
| | | | |
| (a) | As of August 31, 2018, the Fund had a net capital loss carryforward of $10,545,484. During the fiscal year, the Fund utilized $20,734,110 of capital loss carryforwards to offset current year net realized gains. As of August 31, 2018, the cumulative deferred loss on straddles was $3,581. |
| (b) | As of August 31, 2018, the fund had a qualified late-year ordinary loss deferral of $16,163,352. |
| (c) | The differences between book-basis andtax-basis unrealized appreciation/(depreciation) are attributable primarily to the tax deferral of losses on wash sales, the tax treatment of swaps, the tax treatment of passive foreign investment companies (PFICs), the recognition for tax purposes of unrealized gains/losses on certain derivative instruments, and the tax treatment of earnings from the Subsidiary. |
| (d) | The difference between book-basis andtax-basis components of accumulated earnings/(deficit) is attributable primarily to the tax treatment of defaulted securities. |
For tax purposes, net capital losses may be carried over to offset future capital gains, if any. Funds are permitted to carry forward capital losses incurred in taxable years beginning after December 22, 2010 for an indefinite period. These post-December 22, 2010 capital losses must be utilized prior to the earlier capital losses, which are subject to expiration. Post-December 22, 2010 capital loss carryforwards will retain their character as either short-term or long-term capital losses rather than being considered short-term as under previous regulation.
As of August 31, 2018, the Fund had a net capital loss carryforward of $10,545,484 which will expire as follows:
| | | | |
Short-Term
Amount | | Long-Term
Amount | | Expiration |
| $10,545,484 | | n/a | | 8/31/2019 |
NOTE J
Recent Accounting Pronouncements
In March 2017, the Financial Accounting Standards Board issued an Accounting Standards Update, ASU2017-08, Receivables—Nonrefundable Fees and Other Costs (Subtopic310-20), Premium Amortization on Purchased Callable Debt Securities which amends the amortization period for certain purchased callable debt securities held at a premium, shortening such period to the earliest call date. The ASU2017-08 does not require any accounting change for debt securities held at a discount; the discount continues to be amortized to maturity. The ASU2017-08 is effective for fiscal years, and interim periods within those fiscal years, beginning after December 15, 2018. At this time, management is evaluating the implications of these changes on the consolidated financial statements.
| | |
| |
| 130 | AB ALL MARKET TOTAL RETURN PORTFOLIO | | abfunds.com |
NOTES TO CONSOLIDATED FINANCIAL STATEMENTS(continued)
In August 2018, the Financial Accounting Standards Board issued an Accounting Standards Update, ASU2018-13, Fair Value Measurement (Topic 820), Disclosure Framework—Changes to the Disclosure Requirements for Fair Value Measurement which removes, modifies and adds disclosures to Topic 820. The amendments in this ASU2018-13 apply to all entities that are required, under existing U.S. GAAP, to make disclosures about recurring or nonrecurring fair value measurements. The amendments in this ASU2018-13 are effective for all entities for fiscal years, and interim periods within those fiscal years, beginning after December 15, 2019. At this time, management is evaluating the implications of these changes on the consolidated financial statements.
In October 2018, the U.S. Securities and Exchange Commission adopted amendments to certain disclosure requirements included in RegulationS-X that had become “redundant, duplicative, overlapping, outdated or superseded, in light of the other Commission disclosure requirements, GAAP or changes in the information environment.” The compliance date for the amendments to RegulationS-X was November 5, 2018 (for reporting period end dates of September 30, 2018 or after). Management has adopted the amendments which simplified certain disclosure requirements on the consolidated financial statements.
NOTE K
Subsequent Events
Management has evaluated subsequent events for possible recognition or disclosure in the consolidated financial statements through the date the consolidated financial statements are issued. Management has determined that there are no material events that would require disclosure in the Fund’s consolidated financial statements through this date.
| | |
| |
| abfunds.com | | AB ALL MARKET TOTAL RETURN PORTFOLIO | 131 |
CONSOLIDATED FINANCIAL HIGHLIGHTS
Selected Data For A Share Of Beneficial Interest Outstanding Throughout Each Period
| | | | | | | | | | | | | | | | | | | | | | | | |
| | | Class A | |
| | | Six Months
Ended
February 28,
2019†
(unaudited) | | | Year Ended August 31, | |
| | | 2018† | | | 2017† | | | 2016 | | | 2015 | | | 2014 | |
| | | | |
| | | | | | | | | | | | | | | | | | | | | | | | |
Net asset value, beginning of period | | | $ 14.78 | | | | $ 14.71 | | | | $ 13.85 | | | | $ 13.49 | | | | $ 14.31 | | | | $ 12.74 | |
| | | | |
Income From Investment Operations | | | | | | | | | | | | | | | | | | | | | | | | |
| | | | | | |
Net investment income(a)(b) | | | .10 | | | | .20 | | | | .44 | | | | .38 | | | | .43 | | | | .39 | |
| | | | | | |
Net realized and unrealized gain (loss) on investment transactions | | | (.17 | ) | | | .05 | | | | .85 | | | | .29 | | | | (.93 | ) | | | 1.56 | |
| | | | | | |
Contributions from Affiliates | | | – 0 | – | | | .00 | (c) | | | – 0 | – | | | – 0 | – | | | – 0 | – | | | – 0 | – |
| | | | |
Net increase (decrease) in net asset value from operations | | | (.07 | ) | | | .25 | | | | 1.29 | | | | .67 | | | | (.50 | ) | | | 1.95 | |
| | | | |
Less: Dividends | | | | | | | | | | | | | | | | | | | | | | | | |
| | | | | | |
Dividends from net investment income | | | – 0 | – | | | (.18 | ) | | | (.43 | ) | | | (.31 | ) | | | (.32 | ) | | | (.38 | ) |
| | | | |
Net asset value, end of period | | | $ 14.71 | | | | $ 14.78 | | | | $ 14.71 | | | | $ 13.85 | | | | $ 13.49 | | | | $ 14.31 | |
| | | | |
| | | | | | |
Total Return | | | | | | | | | | | | | | | | | | | | | | | | |
| | | | | | |
Total investment return based on net asset value(d)* | | | (.54 | )% | | | 1.79 | % | | | 9.61 | % | | | 5.13 | % | | | (3.46 | )% | | | 15.56 | % |
| | | | | | |
Ratios/Supplemental Data | | | | | | | | | | | | | | | | | | | | | | | | |
| | | | | | |
Net assets, end of period (000’s omitted) | | | $575,637 | | | | $620,635 | | | | $688,485 | | | | $684,917 | | | | $713,524 | | | | $782,044 | |
| | | | | | |
Ratio to average net assets of: | | | | | | | | | | | | | | | | | | | | | | | | |
| | | | | | |
Expenses, net of waivers/reimbursements(e)‡ | | | .90 | %^ | | | .84 | % | | | .83 | % | | | .86 | % | | | .85 | % | | | .98 | % |
| | | | | | |
Expenses, before waivers/reimbursements(e)‡ | | | 1.03 | %^ | | | 1.03 | % | | | .97 | % | | | .94 | % | | | .93 | % | | | .99 | % |
| | | | | | |
Net investment income(b) | | | 1.48 | %^ | | | 1.38 | % | | | 3.14 | % | | | 2.89 | % | | | 3.07 | % | | | 2.87 | % |
| | | | | | |
Portfolio turnover rate | | | 37 | % | | | 38 | % | | | 108 | % | | | 14 | % | | | 9 | % | | | 15 | % |
| | | | | | | | | | | | | | | | | | | | | | | | |
| |
‡ Expense ratios exclude the estimated acquired fund fees of the affiliated/unaffiliated underlying | |
portfolios | | | .13 | %^ | | | .20 | % | | | .31 | % | | | .31 | % | | | .27 | % | | | .05 | % |
See footnote summary on page 139.
| | |
| |
| 132 | AB ALL MARKET TOTAL RETURN PORTFOLIO | | abfunds.com |
CONSOLIDATED FINANCIAL HIGHLIGHTS(continued)
Selected Data For A Share Of Beneficial Interest Outstanding Throughout Each Period
| | | | | | | | | | | | | | | | | | | | | | | | |
| | | Class B | |
| | | Six Months
Ended
February 28,
2019†
(unaudited) | | | Year Ended August 31, | |
| | | 2018† | | | 2017† | | | 2016 | | | 2015 | | | 2014 | |
| | | | |
| | | | | | | | | | | | | | | | | | | | | | | | |
Net asset value, beginning of period | | | $ 14.81 | | | | $ 14.73 | | | | $ 13.76 | | | | $ 13.32 | | | | $ 14.13 | | | | $ 12.64 | |
| | | | |
Income From Investment Operations | | | | | | | | | | | | | | | | | | | | | | | | |
| | | | | | |
Net investment
income(a)(b) | | | .05 | | | | .09 | | | | .36 | | | | .33 | | | | .39 | | | | .33 | |
| | | | | | |
Net realized and unrealized gain (loss) on investment transactions | | | (.17 | ) | | | .06 | | | | .83 | | | | .24 | | | | (.98 | ) | | | 1.50 | |
| | | | | | |
Contributions from Affiliates | | | – 0 | – | | | .00 | (c) | | | – 0 | – | | | – 0 | – | | | – 0 | – | | | – 0 | – |
| | | | |
Net increase (decrease) in net asset value from operations | | | (.12 | ) | | | .15 | | | | 1.19 | | | | .57 | | | | (.59 | ) | | | 1.83 | |
| | | | |
Less: Dividends | | | | | | | | | | | | | | | | | | | | | | | | |
| | | | | | |
Dividends from net investment income | | | – 0 | – | | | (.07 | ) | | | (.22 | ) | | | (.13 | ) | | | (.22 | ) | | | (.34 | ) |
| | | | |
Net asset value, end of period | | | $ 14.69 | | | | $ 14.81 | | | | $ 14.73 | | | | $ 13.76 | | | | $ 13.32 | | | | $ 14.13 | |
| | | | |
| | | | | | |
Total Return | | | | | | | | | | | | | | | | | | | | | | | | |
| | | | | | |
Total investment return based on net asset value(d)* | | | (.81 | )% | | | .96 | % | | | 8.82 | % | | | 4.33 | % | | | (4.19 | )% | | | 14.75 | % |
| | | | | | |
Ratios/Supplemental Data | | | | | | | | | | | | | | | | | | | | | | | | |
| | | | | | |
Net assets, end of period (000’s omitted) | | | $5,341 | | | | $5,995 | | | | $8,798 | | | | $19,162 | | | | $52,097 | | | | $118,556 | |
| | | | | | |
Ratio to average net assets of: | | | | | | | | | | | | | | | | | | | | | | | | |
| | | | | | |
Expenses, net of waivers/reimbursements(e)‡ | | | 1.67 | %^ | | | 1.60 | % | | | 1.60 | % | | | 1.62 | % | | | 1.61 | % | | | 1.69 | % |
| | | | | | |
Expenses, before waivers/reimbursements(e)‡ | | | 1.80 | %^ | | | 1.80 | % | | | 1.73 | % | | | 1.70 | % | | | 1.69 | % | | | 1.70 | % |
| | | | | | |
Net investment income(b) | | | .71 | %^ | | | .61 | % | | | 2.57 | % | | | 2.50 | % | | | 2.79 | % | | | 2.41 | % |
| | | | | | |
Portfolio turnover rate | | | 37 | % | | | 38 | % | | | 108 | % | | | 14 | % | | | 9 | % | | | 15 | % |
| | | | | | | | | | | | | | | | | | | | | | | | |
| |
‡ Expense ratios exclude the estimated acquired fund fees of the affiliated/unaffiliated underlying | |
portfolios | | | .13 | %^ | | | .20 | % | | | .31 | % | | | .31 | % | | | .27 | % | | | .05 | % |
See footnote summary on page 139.
| | |
| |
| abfunds.com | | AB ALL MARKET TOTAL RETURN PORTFOLIO | 133 |
CONSOLIDATED FINANCIAL HIGHLIGHTS(continued)
Selected Data For A Share Of Beneficial Interest Outstanding Throughout Each Period
| | | | | | | | | | | | | | | | | | | | | | | | |
| | | Class C | |
| | | Six Months
Ended
February 28,
2019†
(unaudited) | | | Year Ended August 31, | |
| | | 2018† | | | 2017† | | | 2016 | | | 2015 | | | 2014 | |
| | | | |
| | | | | | | | | | | | | | | | | | | | | | | | |
Net asset value, beginning of period | | | $ 14.64 | | | | $ 14.53 | | | | $ 13.68 | | | | $ 13.32 | | | | $ 14.15 | | | | $ 12.66 | |
| | | | |
Income From Investment Operations | | | | | | | | | | | | | | | | | | | | | | | | |
| | | | | | |
Net investment income(a)(b) | | | .05 | | | | .09 | | | | .38 | | | | .29 | | | | .33 | | | | .30 | |
| | | | | | |
Net realized and unrealized gain (loss) on investment transactions | | | (.17 | ) | | | .06 | | | | .79 | | | | .27 | | | | (.92 | ) | | | 1.54 | |
| | | | | | |
Contributions from Affiliates | | | – 0 | – | | | .00 | (c) | | | – 0 | – | | | – 0 | – | | | – 0 | – | | | – 0 | – |
| | | | |
Net increase (decrease) in net asset value from operations | | | (.12 | ) | | | .15 | | | | 1.17 | | | | .56 | | | | (.59 | ) | | | 1.84 | |
| | | | |
Less: Dividends | | | | | | | | | | | | | | | | | | | | | | | | |
| | | | | | |
Dividends from net investment income | | | – 0 | – | | | (.04 | ) | | | (.32 | ) | | | (.20 | ) | | | (.24 | ) | | | (.35 | ) |
| | | | |
Net asset value, end of period | | | $ 14.52 | | | | $ 14.64 | | | | $ 14.53 | | | | $ 13.68 | | | | $ 13.32 | | | | $ 14.15 | |
| | | | |
| | | | | | |
Total Return | | | | | | | | | | | | | | | | | | | | | | | | |
| | | | | | |
Total investment return based on net asset value(d)* | | | (.89 | )% | | | 1.01 | % | | | 8.84 | % | | | 4.31 | % | | | (4.19 | )% | | | 14.74 | % |
| | | | | | |
Ratios/Supplemental Data | | | | | | | | | | | | | | | | | | | | | | | | |
| | | | | | |
Net assets, end of period (000’s omitted) | | | $48,506 | | | | $61,466 | | | | $102,696 | | | | $198,792 | | | | $220,663 | | | | $266,720 | |
| | | | | | |
Ratio to average net assets of: | | | | | | | | | | | | | | | | | | | | | | | | |
| | | | | | |
Expenses, net of waivers/reimbursements(e)‡ | | | 1.65 | %^ | | | 1.58 | % | | | 1.59 | % | | | 1.61 | % | | | 1.60 | % | | | 1.69 | % |
| | | | | | |
Expenses, before waivers/reimbursements(e)‡ | | | 1.78 | %^ | | | 1.78 | % | | | 1.71 | % | | | 1.69 | % | | | 1.68 | % | | | 1.69 | % |
| | | | | | |
Net investment income(b) | | | .73 | %^ | | | .63 | % | | | 2.73 | % | | | 2.17 | % | | | 2.40 | % | | | 2.20 | % |
| | | | | | |
Portfolio turnover rate | | | 37 | % | | | 38 | % | | | 108 | % | | | 14 | % | | | 9 | % | | | 15 | % |
| | | | | | | | | | | | | | | | | | | | | | | | |
| |
‡ Expense ratios exclude the estimated acquired fund fees of the affiliated/unaffiliated underlying | |
portfolios | | | .13 | %^ | | | .20 | % | | | .31 | % | | | .31 | % | | | .27 | % | | | .05 | % |
See footnote summary on page 139.
| | |
| |
| 134 | AB ALL MARKET TOTAL RETURN PORTFOLIO | | abfunds.com |
CONSOLIDATED FINANCIAL HIGHLIGHTS(continued)
Selected Data For A Share Of Beneficial Interest Outstanding Throughout Each Period
| | | | | | | | | | | | | | | | | | | | | | | | |
| | | Advisor Class | |
| | | Six Months
Ended
February 28,
2019†
(unaudited) | | | Year Ended August 31, | |
| | | 2018† | | | 2017† | | | 2016 | | | 2015 | | | 2014 | |
| | | | |
| | | | | | | | | | | | | | | | | | | | | | | | |
Net asset value, beginning of period | | | $ 14.90 | | | | $ 14.80 | | | | $ 13.93 | | | | $ 13.58 | | | | $ 14.40 | | | | $ 12.79 | |
| | | | |
Income From Investment Operations | | | | | | | | | | | | | | | | | | | | | | | | |
| | | | | | |
Net investment income(a)(b) | | | .12 | | | | .24 | | | | .48 | | | | .42 | | | | .48 | | | | .43 | |
| | | | | | |
Net realized and unrealized gain (loss) on investment transactions | | | (.18 | ) | | | .07 | | | | .86 | | | | .28 | | | | (.94 | ) | | | 1.57 | |
| | | | | | |
Contributions from Affiliates | | | – 0 | – | | | .00 | (c) | | | – 0 | – | | | – 0 | – | | | – 0 | – | | | – 0 | – |
| | | | |
Net increase (decrease) in net asset value from operations | | | (.06 | ) | | | .31 | | | | 1.34 | | | | .70 | | | | (.46 | ) | | | 2.00 | |
| | | | |
Less: Dividends | | | | | | | | | | | | | | | | | | | | | | | | |
| | | | | | |
Dividends from net investment income | | | – 0 | – | | | (.21 | ) | | | (.47 | ) | | | (.35 | ) | | | (.36 | ) | | | (.39 | ) |
| | | | |
Net asset value, end of period | | | $ 14.84 | | | | $ 14.90 | | | | $ 14.80 | | | | $ 13.93 | | | | $ 13.58 | | | | $ 14.40 | |
| | | | |
| | | | | | |
Total Return | | | | | | | | | | | | | | | | | | | | | | | | |
| | | | | | |
Total investment return based on net asset value(d)* | | | (.40 | )% | | | 2.02 | % | | | 9.99 | % | | | 5.30 | % | | | (3.21 | )% | | | 15.94 | % |
| | | | | | |
Ratios/Supplemental Data | | | | | | | | | | | | | | | | | | | | | | | | |
| | | | | | |
Net assets, end of period (000’s omitted) | | | $80,569 | | | | $82,258 | | | | $90,911 | | | | $88,863 | | | | $94,932 | | | | $109,579 | |
| | | | | | |
Ratio to average net assets of: | | | | | | | | | | | | | | | | | | | | | | | | |
| | | | | | |
Expenses, net of waivers/reimbursements(e)‡ | | | .65 | %^ | | | .59 | % | | | .59 | % | | | .61 | % | | | .60 | % | | | .68 | % |
| | | | | | |
Expenses, before waivers/reimbursements(e)‡ | | | .78 | %^ | | | .78 | % | | | .72 | % | | | .69 | % | | | .68 | % | | | .69 | % |
| | | | | | |
Net investment income(b) | | | 1.73 | %^ | | | 1.63 | % | | | 3.40 | % | | | 3.16 | % | | | 3.42 | % | | | 3.17 | % |
| | | | | | |
Portfolio turnover rate | | | 37 | % | | | 38 | % | | | 108 | % | | | 14 | % | | | 9 | % | | | 15 | % |
| | | | | | | | | | | | | | | | | | | | | | | | |
| |
‡ Expense ratios exclude the estimated acquired fund fees of the affiliated/unaffiliated underlying | |
portfolios | | | .13 | %^ | | | .20 | % | | | .31 | % | | | .31 | % | | | .27 | % | | | .05 | % |
See footnote summary on page 139.
| | |
| |
| abfunds.com | | AB ALL MARKET TOTAL RETURN PORTFOLIO | 135 |
CONSOLIDATED FINANCIAL HIGHLIGHTS(continued)
Selected Data For A Share Of Beneficial Interest Outstanding Throughout Each Period
| | | | | | | | | | | | | | | | | | | | | | | | |
| | | Class R | |
| | | Six Months
Ended
February 28,
2019†
(unaudited) | | | Year Ended August 31, | |
| | | 2018† | | | 2017† | | | 2016 | | | 2015 | | | 2014 | |
| | | | |
| | | | | | | | | | | | | | | | | | | | | | | | |
Net asset value, beginning of period | | | $ 14.69 | | | | $ 14.63 | | | | $ 13.77 | | | | $ 13.39 | | | | $ 14.21 | | | | $ 12.69 | |
| | | | |
Income From Investment Operations | | | | | | | | | | | | | | | | | | | | | | | | |
| | | | | | |
Net investment income(a)(b) | | | .08 | | | | .14 | | | | .38 | | | | .36 | | | | .38 | | | | .41 | |
| | | | | | |
Net realized and unrealized gain (loss) on investment transactions | | | (.18 | ) | | | .06 | | | | .85 | | | | .25 | | | | (.92 | ) | | | 1.47 | |
| | | | | | |
Contributions from Affiliates | | | – 0 | – | | | .00 | (c) | | | – 0 | – | | | – 0 | – | | | – 0 | – | | | – 0 | – |
| | | | |
Net increase (decrease) in net asset value from operations | | | (.10 | ) | | | .20 | | | | 1.23 | | | | .61 | | | | (.54 | ) | | | 1.88 | |
| | | | |
Less: Dividends | | | | | | | | | | | | | | | | | | | | | | | | |
| | | | | | |
Dividends from net investment income | | | – 0 | – | | | (.14 | ) | | | (.37 | ) | | | (.23 | ) | | | (.28 | ) | | | (.36 | ) |
| | | | |
Net asset value, end of period | | | $ 14.59 | | | | $ 14.69 | | | | $ 14.63 | | | | $ 13.77 | | | | $ 13.39 | | | | $ 14.21 | |
| | | | |
| | | | | | |
Total Return | | | | | | | | | | | | | | | | | | | | | | | | |
| | | | | | |
Total investment return based on net asset value(d)* | | | (.68 | )% | | | 1.34 | % | | | 9.17 | % | | | 4.69 | % | | | (3.82 | )% | | | 15.09 | % |
| | | | | | |
Ratios/Supplemental Data | | | | | | | | | | | | | | | | | | | | | | | | |
| | | | | | |
Net assets, end of period (000’s omitted) | | | $4,091 | | | | $4,414 | | | | $6,196 | | | | $6,381 | | | | $10,762 | | | | $11,761 | |
| | | | | | |
Ratio to average net assets of: | | | | | | | | | | | | | | | | | | | | | | | | |
| | | | | | |
Expenses, net of waivers/reimbursements(e)‡ | | | 1.31 | %^ | | | 1.25 | % | | | 1.25 | % | | | 1.27 | % | | | 1.26 | % | | | 1.34 | % |
| | | | | | |
Expenses, before waivers/reimbursements(e)‡ | | | 1.44 | %^ | | | 1.44 | % | | | 1.38 | % | | | 1.35 | % | | | 1.34 | % | | | 1.35 | % |
| | | | | | |
Net investment income(b) | | | 1.07 | %^ | | | .97 | % | | | 2.69 | % | | | 2.70 | % | | | 2.71 | % | | | 3.05 | % |
| | | | | | |
Portfolio turnover rate | | | 37 | % | | | 38 | % | | | 108 | % | | | 14 | % | | | 9 | % | | | 15 | % |
| | | | | | | | | | | | | | | | | | | | | | | | |
| |
‡ Expense ratios exclude the estimated acquired fund fees of the affiliated/unaffiliated underlying | |
portfolios | | | .13 | %^ | | | .20 | % | | | .31 | % | | | .31 | % | | | .27 | % | | | .05 | % |
See footnote summary on page 139.
| | |
| |
| 136 | AB ALL MARKET TOTAL RETURN PORTFOLIO | | abfunds.com |
CONSOLIDATED FINANCIAL HIGHLIGHTS(continued)
Selected Data For A Share Of Beneficial Interest Outstanding Throughout Each Period
| | | | | | | | | | | | | | | | | | | | | | | | |
| | | Class K | |
| | | Six Months
Ended
February 28,
2019†
(unaudited) | | | Year Ended August 31, | |
| | | 2018† | | | 2017† | | | 2016 | | | 2015 | | | 2014 | |
| | | | |
| | | | | | | | | | | | | | | | | | | | | | | | |
Net asset value, beginning of period | | | $ 14.73 | | | | $ 14.66 | | | | $ 13.80 | | | | $ 13.44 | | | | $ 14.26 | | | | $ 12.71 | |
| | | | |
Income From Investment Operations | | | | | | | | | | | | | | | | | | | | | | | | |
| | | | | | |
Net investment income(a)(b) | | | .10 | | | | .19 | | | | .41 | | | | .38 | | | | .38 | | | | .35 | |
| | | | | | |
Net realized and unrealized gain (loss) on investment transactions | | | (.17 | ) | | | .06 | | | | .86 | | | | .28 | | | | (.89 | ) | | | 1.58 | |
| | | | | | |
Contributions from Affiliates | | | – 0 | – | | | .00 | (c) | | | – 0 | – | | | – 0 | – | | | – 0 | – | | | – 0 | – |
| | | | |
Net increase (decrease) in net asset value from operations | | | (.07 | ) | | | .25 | | | | 1.27 | | | | .66 | | | | (.51 | ) | | | 1.93 | |
| | | | |
Less: Dividends | | | | | | | | | | | | | | | | | | | | | | | | |
| | | | | | |
Dividends from net investment income | | | – 0 | – | | | (.18 | ) | | | (.41 | ) | | | (.30 | ) | | | (.31 | ) | | | (.38 | ) |
| | | | |
Net asset value, end of period | | | $ 14.66 | | | | $ 14.73 | | | | $ 14.66 | | | | $ 13.80 | | | | $ 13.44 | | | | $ 14.26 | |
| | | | |
| | | | | | |
Total Return | | | | | | | | | | | | | | | | | | | | | | | | |
| | | | | | |
Total investment return based on net asset value(d)* | | | (.47 | )% | | | 1.60 | % | | | 9.56 | % | | | 5.04 | % | | | (3.55 | )% | | | 15.44 | % |
| | | | | | |
Ratios/Supplemental Data | | | | | | | | | | | | | | | | | | | | | | | | |
| | | | | | |
Net assets, end of period (000’s omitted) | | | $9,868 | | | | $15,032 | | | | $23,344 | | | | $27,129 | | | | $30,439 | | | | $29,819 | |
| | | | | | |
Ratio to average net assets of: | | | | | | | | | | | | | | | | | | | | | | | | |
| | | | | | |
Expenses, net of waivers/reimbursements(e)‡ | | | .99 | %^ | | | .94 | % | | | .94 | % | | | .95 | % | | | .95 | % | | | 1.03 | % |
| | | | | | |
Expenses, before waivers/reimbursements(e)‡ | | | 1.12 | %^ | | | 1.13 | % | | | 1.07 | % | | | 1.03 | % | | | 1.03 | % | | | 1.04 | % |
| | | | | | |
Net investment income(b) | | | 1.41 | %^ | | | 1.28 | % | | | 2.95 | % | | | 2.85 | % | | | 2.74 | % | | | 2.59 | % |
| | | | | | |
Portfolio turnover rate | | | 37 | % | | | 38 | % | | | 108 | % | | | 14 | % | | | 9 | % | | | 15 | % |
| | | | | | | | | | | | | | | | | | | | | | | | |
| |
‡ Expense ratios exclude the estimated acquired fund fees of the affiliated/unaffiliated underlying | |
portfolios | | | .13 | %^ | | | .20 | % | | | .31 | % | | | .31 | % | | | .27 | % | | | .05 | % |
See footnote summary on page 139.
| | |
| |
| abfunds.com | | AB ALL MARKET TOTAL RETURN PORTFOLIO | 137 |
CONSOLIDATED FINANCIAL HIGHLIGHTS(continued)
Selected Data For A Share Of Beneficial Interest Outstanding Throughout Each Period
| | | | | | | | | | | | | | | | | | | | | | | | |
| | | Class I | |
| | | Six Months
Ended
February 28,
2019†
(unaudited) | | | Year Ended August 31, | |
| | | 2018† | | | 2017† | | | 2016 | | | 2015 | | | 2014 | |
| | | | |
| | | | | | | | | | | | | | | | | | | | | | | | |
Net asset value, beginning of period | | | $ 15.05 | | | | $ 14.76 | | | | $ 13.89 | | | | $ 13.54 | | | | $ 14.35 | | | | $ 12.76 | |
| | | | |
Income From Investment Operations | | | | | | | | | | | | | | | | | | | | | | | | |
| | | | | | |
Net investment income(a)(b) | | | .12 | | | | .24 | | | | .47 | | | | .42 | | | | .49 | | | | .43 | |
| | | | | | |
Net realized and unrealized gain (loss) on investment transactions | | | (.17 | ) | | | .05 | | | | .87 | | | | .27 | | | | (.95 | ) | | | 1.55 | |
| | | | | | |
Contributions from Affiliates | | | – 0 | – | | | .00 | (c) | | | – 0 | – | | | – 0 | – | | | – 0 | – | | | – 0 | – |
| | | | |
Net increase (decrease) in net asset value from operations | | | (.05 | ) | | | .29 | | | | 1.34 | | | | .69 | | | | (.46 | ) | | | 1.98 | |
| | | | |
Less: Dividends | | | | | | | | | | | | | | | | | | | | | | | | |
| | | | | | |
Dividends from net investment income | | | – 0 | – | | | – 0 | – | | | (.47 | ) | | | (.34 | ) | | | (.35 | ) | | | (.39 | ) |
| | | | |
Net asset value, end of period | | | $ 15.00 | | | | $ 15.05 | | | | $ 14.76 | | | | $ 13.89 | | | | $ 13.54 | | | | $ 14.35 | |
| | | | |
| | | | | | |
Total Return | | | | | | | | | | | | | | | | | | | | | | | | |
| | | | | | |
Total investment return based on net asset value(d)* | | | (.33 | )% | | | 1.97 | % | | | 9.92 | % | | | 5.28 | % | | | (3.18 | )% | | | 15.82 | % |
| | | | | | |
Ratios/Supplemental Data | | | | | | | | | | | | | | | | | | | | | | | | |
| | | | | | |
Net assets, end of period (000’s omitted) | | | $234 | | | | $230 | | | | $214 | | | | $11,299 | | | | $11,912 | | | | $14,204 | |
| | | | | | |
Ratio to average net assets of: | | | | | | | | | | | | | | | | | | | | | | | | |
| | | | | | |
Expenses, net of waivers/reimbursements(e)‡ | | | .67 | %^ | | | .62 | % | | | .61 | % | | | .63 | % | | | .62 | % | | | .70 | % |
| | | | | | |
Expenses, before waivers/reimbursements(e)‡ | | | .80 | %^ | | | .81 | % | | | .74 | % | | | .71 | % | | | .70 | % | | | .71 | % |
| | | | | | |
Net investment income(b) | | | 1.71 | %^ | | | 1.60 | % | | | 3.33 | % | | | 3.14 | % | | | 3.45 | % | | | 3.14 | % |
| | | | | | |
Portfolio turnover rate | | | 37 | % | | | 38 | % | | | 108 | % | | | 14 | % | | | 9 | % | | | 15 | % |
| | | | | | | | | | | | | | | | | | | | | | | | |
| |
‡ Expense ratios exclude the estimated acquired fund fees of the affiliated/unaffiliated underlying | |
portfolios | | | .13 | %^ | | | .20 | % | | | .31 | % | | | .31 | % | | | .27 | % | | | .05 | % |
See footnote summary on page 139.
| | |
| |
| 138 | AB ALL MARKET TOTAL RETURN PORTFOLIO | | abfunds.com |
CONSOLIDATED FINANCIAL HIGHLIGHTS(continued)
Selected Data For A Share Of Beneficial Interest Outstanding Throughout Each Period
| (a) | Based on average shares outstanding. |
| (b) | Net of fees and expenses waived/reimbursed by the Adviser. |
| (c) | Amount is less than $.005. |
| (d) | Total investment return is calculated assuming an initial investment made at the net asset value at the beginning of the period, reinvestment of all dividends and distributions at net asset value during the period, and redemption on the last day of the period. Initial sales charges or contingent deferred sales charges are not reflected in the calculation of total investment return. Total return does not reflect the deduction of taxes that a shareholder would pay on fund distributions or the redemption of fund shares. Total investment return calculated for a period of less than one year is not annualized. |
| (e) | In connection with the Fund’s investments in affiliated underlying portfolios, the Fund incurs no direct expenses, but bears proportionate shares of the fees and expenses (i.e., operating, administrative and investment advisory fees) of the affiliated underlying portfolios. The Adviser has contractually agreed to waive its fees from the Fund in an amount equal to the Fund’s pro rata share of certain acquired fund fees and expenses, and for the six months ended February 28, 2019 and the years ended August 31, 2018 and August 31, 2017, such waivers amounted to .13% (annualized), .19% and .13%, respectively. |
| * | Includes the impact of proceeds received and credited to the Fund resulting from class action settlements, which enhanced the Fund’s performance for the years ended August 31, 2018 and August 31, 2017 by .03% and .03%, respectively. |
| † | Consolidated (see Note A). |
See notes to consolidated financial statements.
| | |
| |
| abfunds.com | | AB ALL MARKET TOTAL RETURN PORTFOLIO | 139 |
RESULTS OF SHAREHOLDERS MEETING
(unaudited)
A Special Meeting of Shareholders of The AB Portfolios (the “Company”)—AB All Market Total Return Portfolio (the “Fund”) was held on October 11, 2018, and adjourned until December 11, 2018. A description of each proposal and the number of shares voted at the Meeting are as follows (the proposal numbers shown below correspond to the proposal number in the Fund’s proxy statement):
| 1. | To approve and vote upon the election of Trustees for the Company, each such Trustee to serve for a term of indefinite duration and until his or her successor is duly elected and qualifies. |
| | | | | | | | |
Trustee: | | Voted
For: | | | Authority
Withheld: | |
Michael J. Downey | | | 112,255,334 | | | | 2,874,198 | |
William H. Foulk, Jr.* | | | 112,062,437 | | | | 3,067,095 | |
Nancy P. Jacklin | | | 112,466,540 | | | | 2,662,992 | |
Robert M. Keith | | | 112,388,936 | | | | 2,740,596 | |
Carol C. McMullen | | | 112,486,090 | | | | 2,643,442 | |
Gary L. Moody | | | 112,308,212 | | | | 2,821,321 | |
Marshall C. Turner, Jr. | | | 112,101,288 | | | | 3,028,244 | |
Earl D. Weiner | | | 112,176,204 | | | | 2,953,328 | |
| 2. | To vote upon the approval of new advisory agreements for the Fund with AllianceBernstein L.P. |
| | | | | | | | | | | | | | |
Voted
For | | | Voted
Against | | | Abstained | | | Broker-Non
Votes | |
| | 19,332,149 | | | | 295,016 | | | | 1,207,443 | | | | 7,556,403 | |
| * | Mr. Foulk retired on December 31, 2018. |
| | |
| |
| 140 | AB ALL MARKET TOTAL RETURN PORTFOLIO | | abfunds.com |
BOARD OF TRUSTEES
TRUSTEES
| | |
Marshall C. Turner, Jr.(1),Chairman Michael J. Downey(1) Nancy P. Jacklin(1) | | Robert M. Keith,President and Chief Executive Officer Carol C. McMullen(1) Garry L. Moody(1) Earl D. Weiner(1) |
| |
| OFFICERS | | |
Alexander Barenboym(2),Vice President Daniel J. Loewy(2),Vice President Emilie D. Wrapp,Clerk Michael B. Reyes,Senior Analyst | | Joseph J. Mantineo,Treasurer and Chief Financial Officer Phyllis J. Clarke,Controller and Chief Accounting Officer Vincent S. Noto,ChiefCompliance Officer |
| | |
Custodian and Accounting Agent State Street Bank and Trust Company
State Street Corporation CCB/5
1 Iron Street
Boston, MA 02210 Principal Underwriter AllianceBernstein Investments, Inc.
1345 Avenue of the Americas
New York, NY 10105 Legal Counsel Seward & Kissel LLP
One Battery Park Plaza
New York, NY 10004 | | Transfer Agent AllianceBernstein Investor
Services, Inc.
P.O. Box 786003
San Antonio, TX 78278-6003
Toll-Free (800) 221-5672 Independent Registered Public Accounting Firm Ernst & Young LLP
5 Times Square
New York, NY 10036 |
| 1 | Member of the Audit Committee, the Governance and Nominating Committee and the Independent Directors Committee. |
| 2 | The day-to-day management of, and investment decisions for, the Fund’s portfolio are made by the Adviser’s Multi-Asset Solutions Team. Messrs. Barenboym and Loewy are the investment professionals primarily responsible for the day-to-day management of the AB All Market Total Return Portfolio’s portfolio. |
| | |
| |
| abfunds.com | | AB ALL MARKET TOTAL RETURN PORTFOLIO | 141 |
Information Regarding the Review and Approval of the Fund’s Proposed New Advisory Agreement and Interim Advisory Agreement in the Context of Potential Assignments
As described in more detail in the Proxy Statement for the AB Funds dated August 20, 2018, the Boards of the AB Funds, at a meeting held onJuly 31-August 2, 2018, approved new advisory agreements with the Adviser (the “Proposed Agreements”) for the AB Funds, including The AB Portfolios in respect of AB All Market Total Return Portfolio (formerly AB Balanced Wealth Strategy) (the “Fund”), in connection with the planned disposition by AXA S.A. of its remaining shares of AXA Equitable Holdings, Inc. (the indirect holder of a majority of the partnership interests in the Adviser and the indirect parent of AllianceBernstein Corporation, the general partner of the Adviser) in one or more transactions and the related potential for one or more “assignments” (within the meaning of section 2(a)(4) of the Investment Company Act) of the advisory agreements for the AB Funds, including the Fund’s Advisory Agreement, resulting in the automatic termination of such advisory agreements.
At the same meeting, the AB Boards also considered and approved interim advisory agreements with the Adviser (the “Interim Advisory Agreements”) for the AB Funds, including the Fund, to be effective only in the event that stockholder approval of a Proposed Agreement had not been obtained as of the date of one or more transactions resulting in an “assignment” of the Adviser’s advisory agreements, resulting in the automatic termination of such advisory agreements.
The shareholders of the Fund subsequently approved the Proposed Agreements at an annual meeting of shareholders called for the purpose of electing Directors and voting on the Proposed Agreements.
A discussion regarding the basis for the Boards’ approvals at the meeting held onJuly 31-August 2, 2018 is set forth below.
At a meeting of the AB Boards held on July31-August 2, 2018, the Adviser presented its recommendation that the Boards consider and approve the Proposed Agreements. Section 15(c) of the 1940 Act provides that, after an initial period, a Fund’s Current Agreement and currentsub-advisory agreement, as applicable, will remain in effect only if the Board, including a majority of the Independent Directors, annually reviews and approves them. Each of the Current Agreements had been approved by a Board within theone-year period prior to approval of its related Proposed Agreement, except that the Current Agreements for certain FlexFee funds were approved in February 2017. In connection with their approval of the Proposed Agreements, the Boards considered their conclusions in connection with their most recent approvals of the Current Agreements, in particular in cases where the last approval of a Current Agreement was relatively recent, including the Boards’ general satisfaction with the nature and quality of services being provided and, as applicable, in the case of certain Funds,
| | |
| |
| 142 | AB ALL MARKET TOTAL RETURN PORTFOLIO | | abfunds.com |
actions taken or to be taken in an effort to improve investment performance or reduce expense ratios. The Directors also reviewed updated information provided by the Adviser in respect of each Fund. Also in connection with their approval of the Proposed Agreements, the Boards considered a representation made to them at that time by the Adviser that there were no additional developments not already disclosed to the Boards since their most recent approvals of the Current Agreements that would be a material consideration to the Boards in connection with their consideration of the Proposed Agreements, except for matters disclosed to the Boards by the Adviser. The Directors considered the fact that each Proposed Agreement would have corresponding terms and conditions identical to those of the corresponding Current Agreement with the exception of the effective date and initial term under the Proposed Agreement.
The Directors considered their knowledge of the nature and quality of the services provided by the Adviser to each Fund gained from their experience as directors or trustees of registered investment companies advised by the Adviser, their overall confidence in the Adviser’s integrity and competence they have gained from that experience, the Adviser’s initiative in identifying and raising potential issues with the Directors and its responsiveness, frankness and attention to concerns raised by the Directors in the past, including the Adviser’s willingness to consider and implement organizational and operational changes designed to improve investment results and the services provided to the Funds. The Directors noted that they have four regular meetings each year, at each of which they review extensive materials and information from the Adviser, including information on the investment performance of each Fund.
The Directors also considered all factors they believed relevant, including the specific matters discussed below. During the course of their deliberations, the Directors evaluated, among other things, the reasonableness of the management fees of the Funds they oversee. The Directors did not identify any particular information that wasall-important or controlling, and different Directors may have attributed different weights to the various factors. The Directors determined that the selection of the Adviser to manage the Funds, and the overall arrangements between the Funds and the Adviser, as provided in the Proposed Agreements, including the management fees, were fair and reasonable in light of the services performed under the Current Agreements and to be performed under the Proposed Agreements, expenses incurred and to be incurred and such other matters as the Directors considered relevant in the exercise of their business judgment. The material factors and conclusions that formed the basis for the Directors’ determinations included the following:
Nature, Extent and Quality of Services Provided
The Directors considered the scope and quality of services to be provided by the Adviser under the Proposed Agreements, including the quality of the investment research capabilities of the Adviser and the other resources
| | |
| |
| abfunds.com | | AB ALL MARKET TOTAL RETURN PORTFOLIO | 143 |
it has dedicated to performing services for the Funds. They also considered the information that had been provided to them by the Adviser concerning the anticipated implementation of the Plan and the Adviser’s representation that it did not anticipate that such implementation would affect the management or structure of the Adviser, have a material adverse effect on the Adviser, or adversely affect the quality of the services provided to the Funds by the Adviser and its affiliates. The Directors noted that the Adviser from time to time reviews each Fund’s investment strategies and from time to time proposes changes intended to improve the Fund’s relative or absolute performance for the Directors’ consideration. They also noted the professional experience and qualifications of each Fund’s portfolio management team and other senior personnel of the Adviser. The Directors also considered that certain Proposed Agreements, similar to the corresponding Current Agreements, provide that the Funds will reimburse the Adviser for the cost to it of providing certain clerical, accounting, administrative and other services to the Funds by employees of the Adviser or its affiliates. Requests for these reimbursements are made on a quarterly basis and subject to approval by the Directors. The Directors noted that the Adviser did not request any reimbursements from certain Funds in the Fund’s latest fiscal year reviewed. The Directors noted that the methodology to be used to determine the reimbursement amounts had been reviewed by an independent consultant retained by the Funds’ former Senior Officer/Independent Compliance Officer. The quality of administrative and other services, including the Adviser’s role in coordinating the activities of the Funds’ other service providers, also was considered. The Directors of each Fund concluded that, overall, they were satisfied with the nature, extent and quality of services to be provided to the Funds under the Proposed Agreement for the Fund.
Costs of Services to be Provided and Profitability
The Directors reviewed a schedule of the revenues and expenses and related notes indicating the profitability of each Fund to the Adviser for calendar years 2016 and 2017, as applicable, that had been prepared with an expense allocation methodology arrived at in consultation with an independent consultant retained by the Funds’ former Senior Officer/Independent Compliance Officer. The Directors noted the assumptions and methods of allocation used by the Adviser in preparing fund-specific profitability data and understood that there are a number of potentially acceptable allocation methodologies for information of this type. The Directors noted that the profitability information reflected all revenues and expenses of the Adviser’s relationship with a Fund, including those relating to its subsidiaries that provide transfer agency, distribution and brokerage services to the Fund, as applicable. The Directors recognized that it is difficult to make comparisons of the profitability of the Proposed Agreements with the profitability of fund advisory contracts for unaffiliated funds because comparative information is not generally publicly available and is affected by numerous factors. The Directors focused on the profitability of
| | |
| |
| 144 | AB ALL MARKET TOTAL RETURN PORTFOLIO | | abfunds.com |
the Adviser’s relationship with each Fund before taxes and distribution expenses, as applicable. The Directors noted that certain Funds were not profitable to the Adviser in one or more periods reviewed. The Directors concluded that the Adviser’s level of profitability from its relationship with the other Funds was not unreasonable. The Directors were unable to consider historical information about the profitability of certain Funds that had recently commenced operations and for which historical profitability information was not available. The Adviser agreed to provide the Directors with profitability information in connection with future proposed continuances of the Proposed Agreements.
Fall-Out Benefits
The Directors considered the other benefits to the Adviser and its affiliates from their relationships with the Funds, including, but not limited to, as applicable, benefits relating to soft dollar arrangements (whereby investment advisers receive brokerage and research services from brokers that execute agency transactions for their clients) in the case of certain Funds;12b-1 fees and sales charges received by the principal underwriter (which is a wholly owned subsidiary of the Adviser) in respect of certain classes of the shares of most of the Funds; brokerage commissions paid by certain Funds to brokers affiliated with the Adviser; and transfer agency fees paid by most of the Funds to a wholly owned subsidiary of the Adviser. The Directors recognized that the Adviser’s profitability would be somewhat lower, and that a Fund’s unprofitability to the Adviser would be exacerbated, without these benefits. The Directors understood that the Adviser also might derive reputational and other benefits from its association with the Funds.
Investment Results
In addition to the information reviewed by the Directors in connection with the Board meeting at which the Proposed Agreements were approved, the Directors receive detailed performance information for the Funds at each regular Board meeting during the year.
The Boards’ consideration of each Proposed Agreement was informed by their most recent approval of the related Current Agreement, and, in the case of certain Funds, their discussion with the Adviser of the reasons for those Funds’ underperformance in certain periods. The Directors also reviewed updated performance information and, in some cases, discussed with the Adviser the reasons for changes in performance or continued underperformance. On the basis of this review, the Directors concluded that each Fund’s investment performance was acceptable.
Management Fees and Other Expenses
The Directors considered the management fee rate payable by each Fund to the Adviser and information prepared by an independent service provider (the ‘‘15(c) provider’’) concerning management fee rates payable by
| | |
| |
| abfunds.com | | AB ALL MARKET TOTAL RETURN PORTFOLIO | 145 |
other funds in the same category as the Fund. The Directors recognized that it is difficult to make comparisons of management fees because there are variations in the services that are included in the fees paid by other funds. The Directors compared each Fund’s contractual management fee rate with a peer group median, and where applicable, took into account the impact on the management fee rate of the administrative expense reimbursement paid to the Adviser in the latest fiscal year. In the case of the ACS Funds, the Directors noted that the management fee rate is zero but also were cognizant that the Adviser is indirectly compensated by the wrap fee program sponsors that use the ACS Funds as an investment vehicle for their clients.
The Directors also considered the Adviser’s fee schedule for other clients pursuing a similar investment style to each Fund. For this purpose, they reviewed the relevant advisory fee information from the Adviser’s Form ADV and in a report from the Funds’ Senior Analyst and noted the differences between a Fund’s fee schedule, on the one hand, and the Adviser’s institutional fee schedule and the schedule of fees charged by the Adviser to any offshore funds and for services to anysub-advised funds pursuing a similar investment strategy as the Fund, on the other, as applicable. The Directors noted that the Adviser may, in some cases, agree to fee rates with large institutional clients that are lower than those reviewed by the Directors and that they had previously discussed with the Adviser its policies in respect of such arrangements. The Adviser also informed the Directors that, in the case of certain Funds, there were no institutional products managed by the Adviser that have a substantially similar investment style. The Directors also discussed these matters with their independent fee consultant.
The Adviser reviewed with the Directors the significantly greater scope of the services it provides to each Fund relative to institutional, offshore fund andsub-advised fund clients, as applicable. In this regard, the Adviser noted, among other things, that, compared to institutional and offshore orsub-advisory accounts, each Fund, as applicable, (i) demands considerably more portfolio management, research and trading resources due to significantly higher daily cash flows (in the case ofopen-end Funds); (ii) has more tax and regulatory restrictions and compliance obligations; (iii) must prepare and file or distribute regulatory and other communications about fund operations; and (iv) must provide shareholder servicing to retail investors. The Adviser also reviewed the greater legal risks presented by the large and changing population of Fund shareholders who may assert claims against the Adviser in individual or class actions, and the greater entrepreneurial risk in offering new fund products, which require substantial investment to launch, may not succeed, and generally must be priced to compete with larger, more established funds resulting in lack of profitability to the Adviser until a new fund achieves scale. In light of the substantial differences in services rendered by the Adviser to institutional,
| | |
| |
| 146 | AB ALL MARKET TOTAL RETURN PORTFOLIO | | abfunds.com |
offshore fund andsub-advised fund clients as compared to the Funds, and the different risk profile, the Directors considered these fee comparisons inapt and did not place significant weight on them in their deliberations.
The Directors noted that many of the Funds may invest in shares of exchange-traded funds (‘‘ETFs’’), subject to the restrictions and limitations of the 1940 Act as these may be varied as a result of exemptive orders issued by the SEC. The Directors also noted that ETFs pay advisory fees pursuant to their advisory contracts. The Directors concluded, based on the Adviser’s explanation of how it uses ETFs when they are the most cost-effective way to obtain desired exposures, in some cases pending purchases of underlying securities, that each Fund’s management fee would be for services that would be in addition to, rather than duplicative of, the services provided under the advisory contracts of the ETFs.
With respect to each Fund’s management fee, the Directors considered the total expense ratio of the Fund in comparison to a peer group and peer universe selected by the 15(c) service provider. The Directors also considered the Adviser’s expense caps for certain Funds. The Directors view expense ratio information as relevant to their evaluation of the Adviser’s services because the Adviser is responsible for coordinating services provided to a Fund by others.
The Boards’ consideration of each Proposed Agreement was informed by their most recent approval of the related Current Agreement, and, in the case of certain Funds, their discussion with the Adviser of the reasons for those Funds’ expense ratios in certain periods. The Directors also reviewed updated expense ratio information and, in some cases, discussed with the Adviser the reasons for the expense ratios of certain Funds. On the basis of this review, the Directors concluded that each Fund’s expense ratio was acceptable.
The Directors did not consider comparative expense information for the ACS Funds because those Funds do not bear ordinary expenses.
Economies of Scale
The Directors noted that the management fee schedules for certain Funds do not contain breakpoints and that they had discussed their strong preference for breakpoints in advisory contracts with the Adviser. The Directors took into consideration prior presentations by an independent consultant on economies of scale in the mutual fund industry and for the Funds, and by the Adviser concerning certain of its views on economies of scale. The Directors also had requested and received from the Adviser certain updates on economies of scale in advance of the Board meeting. The Directors believe that economies of scale may be realized (if at all) by the Adviser across a variety of products and services, and not only in respect of a single fund. The Directors noted that there is no established
| | |
| |
| abfunds.com | | AB ALL MARKET TOTAL RETURN PORTFOLIO | 147 |
methodology for setting breakpoints that give effect to the fund-specific services provided by a fund’s adviser and to the economies of scale that an adviser may realize in its overall mutual fund business or those components of it which directly or indirectly affect a fund’s operations. The Directors observed that in the mutual fund industry as a whole, as well as among funds similar to each Fund, there is no uniformity or pattern in the fees and asset levels at which breakpoints (if any) apply. The Directors also noted that the advisory agreements for many funds do not have breakpoints at all. The Directors informed the Adviser that they would monitor the asset levels of the Funds without breakpoints and their profitability to the Adviser and anticipated revisiting the question of breakpoints in the future if circumstances warrant doing so.
The Directors did not consider the extent to which fee levels in the Advisory Agreement for the ACS Funds reflect economies of scale because that Advisory Agreement does not provide for any compensation to be paid to the Adviser by the ACS Funds and the expense ratio of each of those Funds is zero.
Interim Advisory Agreements
In approving the Interim Advisory Agreements, the Boards, with the assistance of independent counsel, considered similar factors to those considered in approving the Proposed Agreements. The Interim Advisory Agreements approved by the Boards are identical to the Proposed Agreements, as well as the Current Agreements, in all material respects except for their proposed effective and termination dates and provisions intended to comply with the requirements of the relevant SEC rule, such as provisions requiring escrow of advisory fees. Under the Interim Advisory Agreements, the Adviser would continue to manage a Fund pursuant to an Interim Advisory Agreement until a new advisory agreement was approved by stockholders or until the end of the150-day period, whichever would occur earlier. All fees earned by the Adviser under an Interim Advisory Agreement would be held in escrow pending shareholder approval of the Proposed Agreement. Upon approval of a new advisory agreement by stockholders, the escrowed management fees would be paid to the Adviser, and the Interim Advisory Agreement would terminate.
Information Regarding the Review and Approval of the Fund’s Current Advisory Agreement
The disinterested trustees (the “directors”) of The AB Portfolios (the “Company”) unanimously approved the continuance of the Company’s Advisory Agreement with the Adviser in respect of AB All Market Total Return Portfolio (formerly AB Balanced Wealth Strategy) (the “Fund”) at a meeting held onJuly 31-August 2, 2018 (the “Meeting”).
Prior to approval of the continuance of the Advisory Agreement, the directors had requested from the Adviser, and received and evaluated,
| | |
| |
| 148 | AB ALL MARKET TOTAL RETURN PORTFOLIO | | abfunds.com |
extensive materials. They reviewed the proposed continuance of the Advisory Agreement with the Adviser and with experienced counsel who are independent of the Adviser, who advised on the relevant legal standards. The directors also reviewed additional materials, including materials from an outside consultant, who acted as their independent fee consultant, and comparative analytical data prepared by the Senior Analyst for the Fund. The directors also discussed the proposed continuance in private sessions with counsel.
The directors considered their knowledge of the nature and quality of the services provided by the Adviser to the Fund gained from their experience as directors or trustees of most of the registered investment companies advised by the Adviser, their overall confidence in the Adviser’s integrity and competence they have gained from that experience, the Adviser’s initiative in identifying and raising potential issues with the directors and its responsiveness, frankness and attention to concerns raised by the directors in the past, including the Adviser’s willingness to consider and implement organizational and operational changes designed to improve investment results and the services provided to the AB Funds. The directors noted that they have four regular meetings each year, at each of which they review extensive materials and information from the Adviser, including information on the investment performance of the Fund.
The directors also considered all factors they believed relevant, including the specific matters discussed below. During the course of their deliberations, the directors evaluated, among other things, the reasonableness of the advisory fee. The directors did not identify any particular information that wasall-important or controlling, and different directors may have attributed different weights to the various factors. The directors determined that the selection of the Adviser to manage the Fund and the overall arrangements between the Fund and the Adviser, as provided in the Advisory Agreement, including the advisory fee, were fair and reasonable in light of the services performed, expenses incurred and such other matters as the directors considered relevant in the exercise of their business judgment. The material factors and conclusions that formed the basis for the directors’ determinations included the following:
Nature, Extent and Quality of Services Provided
The directors considered the scope and quality of services provided by the Adviser under the Advisory Agreement, including the quality of the investment research capabilities of the Adviser and the other resources it has dedicated to performing services for the Fund. The directors noted that the Adviser from time to time reviews the Fund’s investment strategies and from time to time proposes changes intended to improve the Fund’s relative or absolute performance for the directors’ consideration. They also noted the professional experience and qualifications of the Fund’s portfolio management team and other senior personnel of the Adviser. The quality
| | |
| |
| abfunds.com | | AB ALL MARKET TOTAL RETURN PORTFOLIO | 149 |
of administrative and other services, including the Adviser’s role in coordinating the activities of the Fund’s other service providers, also was considered. The directors concluded that, overall, they were satisfied with the nature, extent and quality of services provided to the Fund under the Advisory Agreement.
Costs of Services Provided and Profitability
The directors reviewed a schedule of the revenues and expenses and related notes indicating the profitability of the Fund to the Adviser for calendar years 2016 and 2017 that had been prepared with an expense allocation methodology arrived at in consultation with an independent consultant retained by the Fund’s former Senior Officer/Independent Compliance Officer. The directors noted the assumptions and methods of allocation used by the Adviser in preparing fund-specific profitability data and understood that there are a number of potentially acceptable allocation methodologies for information of this type. The directors noted that the profitability information reflected all revenues and expenses of the Adviser’s relationship with the Fund, including those relating to its subsidiaries that provide transfer agency, distribution and brokerage services to the Fund. The directors recognized that it is difficult to make comparisons of the profitability of the Advisory Agreement with the profitability of fund advisory contracts for unaffiliated funds because comparative information is not generally publicly available and is affected by numerous factors. The directors focused on the profitability of the Adviser’s relationship with the Fund before taxes and distribution expenses. The directors concluded that the Adviser’s level of profitability from its relationship with the Fund in 2016 was not unreasonable. The directors noted that the Fund was not profitable to the Adviser in 2017.
Fall-Out Benefits
The directors considered the other benefits to the Adviser and its affiliates from their relationships with the Fund and the underlying funds advised by the Adviser in which the Fund invests, including, but not limited to, benefits relating to soft dollar arrangements (whereby investment advisers receive brokerage and research services from brokers that execute agency transactions for their clients);12b-1 fees and sales charges received by the Fund’s principal underwriter (which is a wholly owned subsidiary of the Adviser) in respect of certain classes of the Fund’s shares; brokerage commissions paid by the Fund to brokers affiliated with the Adviser; and transfer agency fees paid by the Fund to a wholly owned subsidiary of the Adviser. The directors recognized that the Fund’s recent unprofitability to the Adviser would be exacerbated without these benefits. The directors understood that the Adviser also might derive reputational and other benefits from its association with the Fund.
Investment Results
In addition to the information reviewed by the directors in connection with the Meeting at which continuance of the Advisory Agreement was
| | |
| |
| 150 | AB ALL MARKET TOTAL RETURN PORTFOLIO | | abfunds.com |
approved, the directors receive detailed performance information for the Fund at each regular Board meeting during the year.
At the Meeting, the directors reviewed performance information prepared by an independent service provider (the “15(c) service provider”), showing the performance of the Class A Shares of the Fund against a group of similar funds (“peer group”) and a larger group of similar funds (“peer universe”), each selected by the 15(c) service provider, and information prepared by the Adviser showing performance of the Class A Shares against a broad-based securities market index, in each case for the1-,3-,5- and10-year periods ended May 31, 2018 and (in the case of comparisons with the broad-based securities market index) for the period from inception. Based on their review, the directors concluded that the Fund’s investment performance was acceptable.
Advisory Fees and Other Expenses
The directors considered the advisory fee rate payable by the Fund to the Adviser and information prepared by the 15(c) service provider concerning advisory fee rates payable by other funds in the same category as the Fund. The directors recognized that it is difficult to make comparisons of advisory fees because there are variations in the services that are included in the fees paid by other funds. The directors compared the Fund’s contractual effective advisory fee rate with a peer group median.
The directors also considered the Adviser’s fee schedule for other clients pursuing a similar investment style. For this purpose, they reviewed the relevant advisory fee information from the Adviser’s Form ADV and in a report from the Fund’s Senior Analyst and noted the differences between the Fund’s fee schedule, on the one hand, and the Adviser’s institutional fee schedule and the schedule of fees charged by the Adviser to any offshore funds and for services to anysub-advised funds pursuing a similar investment strategy as the Fund, on the other. The directors noted that the Adviser may, in some cases, agree to fee rates with large institutional clients that are lower than those reviewed by the directors and that they had previously discussed with the Adviser its policies in respect of such arrangements. The directors also discussed these matters with their independent fee consultant.
The Adviser reviewed with the directors the significantly greater scope of the services it provides to the Fund relative to institutional, offshore fund andsub-advised fund clients. In this regard, the Adviser noted, among other things, that, compared to institutional and offshore orsub-advisory accounts, the Fund (i) demands considerably more portfolio management, research and trading resources due to significantly higher daily cash flows; (ii) has more tax and regulatory restrictions and compliance obligations; (iii) must prepare and file or distribute regulatory and other communications about fund operations; and (iv) must provide shareholder servicing to retail
| | |
| |
| abfunds.com | | AB ALL MARKET TOTAL RETURN PORTFOLIO | 151 |
investors. The Adviser also reviewed the greater legal risks presented by the large and changing population of Fund shareholders who may assert claims against the Adviser in individual or class actions, and the greater entrepreneurial risk in offering new fund products, which require substantial investment to launch, may not succeed, and generally must be priced to compete with larger, more established funds resulting in lack of profitability to the Adviser until a new fund achieves scale. In light of the substantial differences in services rendered by the Adviser to institutional, offshore fund andsub-advised fund clients as compared to the Fund, the directors considered these fee comparisons inapt and did not place significant weight on them in their deliberations.
The directors also considered the total expense ratio of the Class A shares of the Fund in comparison to a peer group and a peer universe selected by the 15(c) service provider. The Class A expense ratio of the Fund was based on the Fund’s latest fiscal year. The directors noted that it was likely that the expense ratios of some of the other funds in the Fund’s category were lowered by waivers or reimbursements by those funds’ investment advisers, which in some cases might be voluntary or temporary. The directors view expense ratio information as relevant to their evaluation of the Adviser’s services because the Adviser is responsible for coordinating services provided to the Fund by others. Based on their review, the directors concluded that the Fund’s expense ratio was acceptable.
Economies of Scale
The directors noted that the advisory fee schedules for the Fund contains breakpoints that reduce the fee rates on assets above specified levels. The directors took into consideration prior presentations by an independent consultant on economies of scale in the mutual fund industry and for the AB Funds, and by the Adviser concerning certain of its views on economies of scale. The directors also had requested and received from the Adviser certain updates on economies of scale in advance of the Meeting. The directors believe that economies of scale may be realized (if at all) by the Adviser across a variety of products and services, and not only in respect of a single fund. The directors noted that there is no established methodology for setting breakpoints that give effect to the fund-specific services provided by a fund’s adviser and to the economies of scale that an adviser may realize in its overall mutual fund business or those components of it which directly or indirectly affect a fund’s operations. The directors observed that in the mutual fund industry as a whole, as well as among funds similar to the Fund, there is no uniformity or pattern in the fees and asset levels at which breakpoints (if any) apply. The directors also noted that the advisory agreements for many funds do not have breakpoints at all. Having taken these factors into account, the directors concluded that the Fund’s shareholders would benefit from a sharing of economies of scale in the event the Fund’s net assets exceed a breakpoint in the future.
| | |
| |
| 152 | AB ALL MARKET TOTAL RETURN PORTFOLIO | | abfunds.com |
This page is not part of the Shareholder Report or the Financial Statements.
AB FAMILY OF FUNDS
US EQUITY
US CORE
Core Opportunities Fund
FlexFee™ US Thematic Portfolio
Select US Equity Portfolio
US GROWTH
Concentrated Growth Fund
Discovery Growth Fund
FlexFee™ Large Cap Growth Portfolio
Growth Fund
Large Cap Growth Fund
Small Cap Growth Portfolio
US VALUE
Discovery Value Fund
Equity Income Fund
Relative Value Fund
Small Cap Value Portfolio
Value Fund
INTERNATIONAL/ GLOBAL EQUITY
INTERNATIONAL/ GLOBAL CORE
FlexFee™ International Strategic Core Portfolio
Global Core Equity Portfolio
International Portfolio
International Strategic Core Portfolio
Sustainable Global Thematic Fund
Tax-Managed International Portfolio
Tax-Managed Wealth Appreciation Strategy
Wealth Appreciation Strategy
INTERNATIONAL/ GLOBAL GROWTH
Concentrated International Growth Portfolio
FlexFee™ Emerging Markets Growth Portfolio
INTERNATIONAL/ GLOBAL EQUITY(continued)
Sustainable International Thematic Fund
INTERNATIONAL/ GLOBAL VALUE
All China Equity Portfolio
International Value Fund
FIXED INCOME
MUNICIPAL
High Income Municipal Portfolio
Intermediate California Municipal Portfolio
Intermediate Diversified Municipal Portfolio
Intermediate New York Municipal Portfolio
Municipal Bond Inflation Strategy
Tax-Aware Fixed Income Portfolio
National Portfolio
Arizona Portfolio
California Portfolio
Massachusetts Portfolio
Minnesota Portfolio
New Jersey Portfolio
New York Portfolio
Ohio Portfolio
Pennsylvania Portfolio
Virginia Portfolio
TAXABLE
Bond Inflation Strategy
FlexFee™ High Yield Portfolio
FlexFee™ International Bond Portfolio
Global Bond Fund
High Income Fund
Income Fund
Intermediate Bond Portfolio
Limited Duration High Income Portfolio
Short Duration Portfolio
ALTERNATIVES
All Market Real Return Portfolio
Global Real Estate Investment Fund
Select US Long/Short Portfolio
Unconstrained Bond Fund
MULTI-ASSET
All Market Income Portfolio
All Market Total Return Portfolio
Conservative Wealth Strategy
Emerging Markets Multi-Asset Portfolio
Global Risk Allocation Fund
Tax-Managed All Market Income Portfolio
TARGET-DATE
Multi-Manager Select Retirement Allocation Fund
Multi-Manager Select 2010 Fund
Multi-Manager Select 2015 Fund
Multi-Manager Select 2020 Fund
Multi-Manager Select 2025 Fund
Multi-Manager Select 2030 Fund
Multi-Manager Select 2035 Fund
Multi-Manager Select 2040 Fund
Multi-Manager Select 2045 Fund
Multi-Manager Select 2050 Fund
Multi-Manager Select 2055 Fund
Multi-Manager Select 2060 Fund
CLOSED-END FUNDS
Alliance California Municipal Income Fund
AllianceBernstein Global High Income Fund
AllianceBernstein National Municipal Income Fund
We also offer Government Money Market Portfolio, which serves as the money market fund exchange vehicle for the AB mutual funds. You could lose money by investing in the Fund. Although the Fund seeks to preserve the value of your investment at $1.00 per share, it cannot guarantee it will do so. The Fund may impose a fee upon sale of your shares or may temporarily suspend your ability to sell shares if the Fund’s liquidity falls below required minimums because of market conditions or other factors. An investment in the Fund is not insured or guaranteed by the Federal Deposit Insurance Corporation or any other government agency. The Fund’s sponsor has no legal obligation to provide financial support to the Fund, and you should not expect that the sponsor will provide financial support to the Fund at any time.
Investors should consider the investment objectives, risks, charges and expenses of the Fund carefully before investing. For copies of our prospectus or summary prospectus, which contain this and other information, visit us online at www.abfunds.com or contact your AB representative. Please read the prospectus and/or summary prospectus carefully before investing.
| | |
| |
| abfunds.com | | AB ALL MARKET TOTAL RETURN PORTFOLIO | 153 |
NOTES
| | |
| |
| 154 | AB ALL MARKET TOTAL RETURN PORTFOLIO | | abfunds.com |
NOTES
| | |
| |
| abfunds.com | | AB ALL MARKET TOTAL RETURN PORTFOLIO | 155 |
NOTES
| | |
| |
| 156 | AB ALL MARKET TOTAL RETURN PORTFOLIO | | abfunds.com |
NOTES
| | |
| |
| abfunds.com | | AB ALL MARKET TOTAL RETURN PORTFOLIO | 157 |
NOTES
| | |
| |
| 158 | AB ALL MARKET TOTAL RETURN PORTFOLIO | | abfunds.com |
NOTES
| | |
| |
| abfunds.com | | AB ALL MARKET TOTAL RETURN PORTFOLIO | 159 |
NOTES
| | |
| |
| 160 | AB ALL MARKET TOTAL RETURN PORTFOLIO | | abfunds.com |
AB ALL MARKET TOTAL RETURN PORTFOLIO
1345 Avenue of the Americas
New York, NY 10105
800 221 5672
AMTR-0152-0219 
FEB 02.28.19

SEMI-ANNUAL REPORT
AB CONSERVATIVE WEALTH STRATEGY

Beginning January 1, 2021, as permitted by new regulations adopted by the Securities and Exchange Commission, the Fund’s annual and semi-annual shareholder reports will no longer be sent by mail, unless you specifically request paper copies of the reports. Instead, the reports will be made available on a website, and you will be notified by mail each time a report is posted and provided with a website address to access the report.
If you already elected to receive shareholder reports electronically, you will not be affected by this change and you need not take any action. You may elect to receive shareholder reports and other communications from the Fund electronically at any time by contacting your financial intermediary (such as a broker-dealer or bank) or, if you are a direct investor, by calling the Fund at (800) 221 5672.
You may elect to receive all future reports in paper form free of charge. If you invest through a financial intermediary, you can contact your financial intermediary to request that you continue to receive paper copies of your shareholder reports; if you invest directly with the Fund, you can call the Fund at (800) 221 5672. Your election to receive reports in paper form will apply to all funds held in your account with your financial intermediary or, if you invest directly, to all AB Mutual Funds you hold.
| | |
| |
| Investment Products Offered | | • Are Not FDIC Insured• May Lose Value• Are Not Bank Guaranteed |
Investors should consider the investment objectives, risks, charges and expenses of the Fund carefully before investing. For copies of our prospectus or summary prospectus, which contain this and other information, visit us online at www.abfunds.com or contact your AB representative. Please read the prospectus and/or summary prospectus carefully before investing.
This shareholder report must be preceded or accompanied by the Fund’s prospectus for individuals who are not current shareholders of the Fund.
You may obtain a description of the Fund’s proxy voting policies and procedures, and information regarding how the Fund voted proxies relating to portfolio securities during the most recent12-month period ended June 30, without charge. Simply visit AB’s website at www.abfunds.com, or go to the Securities and Exchange Commission’s (the “Commission”) website at www.sec.gov, or call AB at (800) 227 4618.
The Fund files its complete schedule of portfolio holdings with the Commission for the first and third quarters of each fiscal year as an exhibit to its reports on Form N-PORT. The Fund’s Form N-PORT reports are available on the Commission’s website at www.sec.gov. The Fund’s Forms N-PORT may also be reviewed and copied at the Commission’s Public Reference Room in Washington, DC; information on the operation of the Public Reference Room may be obtained by calling (800) SEC 0330. AB publishes full portfolio holdings for the Fund monthly at www.abfunds.com.
AllianceBernstein Investments, Inc. (ABI) is the distributor of the AB family of mutual funds. ABI is a member of FINRA and is an affiliate of AllianceBernstein L.P., the Adviser of the funds.
The [A/B] logo is a registered service mark of AllianceBernstein and AllianceBernstein® is a registered service mark used by permission of the owner, AllianceBernstein L.P.
| | |
| FROM THE PRESIDENT | |  |
Dear Shareholder,
We are pleased to provide this report for AB Conservative Wealth Strategy (the “Fund”). Please review the discussion of Fund performance, the market conditions during the reporting period and the Fund’s investment strategy.
As always, AB strives to keep clients ahead of what’s next by:
| + | | Transforming uncommon insights into uncommon knowledge with a global research scope |
| + | | Navigating markets with seasoned investment experience and sophisticated solutions |
| + | | Providing thoughtful investment insights and actionable ideas |
Whether you’re an individual investor or a multi-billion-dollar institution, we put knowledge and experience to work for you.
AB’s global research organization connects and collaborates across platforms and teams to deliver impactful insights and innovative products. Better insights lead to better opportunities—anywhere in the world.
For additional information about AB’s range of products and shareholder resources, please log on to www.abfunds.com.
Thank you for your investment in the AB Mutual Funds.
Sincerely,

Robert M. Keith
President and Chief Executive Officer, AB Mutual Funds
| | |
| |
| abfunds.com | | AB CONSERVATIVE WEALTH STRATEGY | 1 |
SEMI-ANNUAL REPORT
April 16, 2019
This report provides management’s discussion of fund performance for AB Conservative Wealth Strategy for the semi-annual reporting period ended February 28, 2019.
The Fund’s investment objective is to achieve a high total return without, in the opinion of the Adviser, undue risk to principal.
NAV RETURNS AS OF FEBRUARY 28, 2019 (unaudited)
| | | | | | | | |
| | |
| | | 6 Months | | | 12 Months | |
| | |
| AB CONSERVATIVE WEALTH STRATEGY | | | | | | | | |
| | |
| Class A Shares | | | -0.27% | | | | 0.98% | |
| | |
| Class B Shares1 | | | -0.65% | | | | 0.16% | |
| | |
| Class C Shares | | | -0.66% | | | | 0.25% | |
| | |
| Advisor Class Shares2 | | | -0.16% | | | | 1.16% | |
| | |
| Class R Shares2 | | | -0.49% | | | | 0.59% | |
| | |
| Class K Shares2 | | | -0.29% | | | | 0.88% | |
| | |
| Class I Shares2 | | | -0.19% | | | | 1.12% | |
| | |
Primary Benchmark:
Bloomberg Barclays Global Aggregate Bond Index (USD hedged) | | | 2.55% | | | | 3.94% | |
| | |
| MSCI ACWI (net) | | | -2.92% | | | | -0.84% | |
| 1 | Effective January 31, 2009, Class B shares are no longer available for purchase to new investors. Please see Note A for additional information. |
| 2 | Please note that these share classes are for investors purchasing shares through accounts established under certain fee-based programs sponsored and maintained by certain broker-dealers and financial intermediaries, institutional pension plans and/or investment advisory clients of, and certain other persons associated with, the Adviser and its affiliates or the Fund. |
INVESTMENT RESULTS
The table above shows the Fund’s performance compared to its primary benchmark, the Bloomberg Barclays Global Aggregate Bond Index (USD hedged), and the Morgan Stanley Capital International All Country World Index (“MSCI ACWI”) (net), for the six- and 12-month periods ended February 28, 2019.
For the six-month period, all share classes of the Fund underperformed the primary benchmark, but outperformed the MSCI ACWI (net), before sales charges. Overall within the Fund, fixed income was the largest contributor to returns, relative to the benchmark. Equities modestly contributed to performance, while diversifiers detracted. Diversifiers include alternative asset classes and alternative investment strategies that are expected to have low correlation with returns on equities and fixed-income securities.
| | |
| |
| 2 | AB CONSERVATIVE WEALTH STRATEGY | | abfunds.com |
These investments can include commodities and related derivatives, real-estate related securities and inflation-linked securities. Overall security selection within the Fund was negative, particularly in diversifiers and fixed-income assets. However, equity security selection was positive.
For the 12-month period, all share classes of the Fund underperformed the primary benchmark, but outperformed the MSCI ACWI (net), before sales charges. Overall within the Fund, equities and fixed income were large contributors to performance, while diversifiers detracted. Security selection within the Fund detracted, especially in debt and diversifiers; however, equity security selection contributed.
The Fund utilized derivatives for hedging and investment purposes. For both periods, forwards, interest-rate swaps and credit default swaps contributed to returns, while purchased options, written options, variance swaps and inflation swaps detracted, on an absolute basis. Futures and total return swaps contributed for the six-month period and detracted for the 12-month period.
MARKET REVIEW AND INVESTMENT STRATEGY
US stock indices reached record highs in October, however experienced large pull-backs in December amid a more challenging global growth environment and potential US Federal Reserve (the “Fed”) rate hikes continuing in 2019. Fixed-income assets remained flat through the year and provided downside protection for more risk-averse investors. US and China trade tensions existed through 2018 and talks heated up in 2019 between the two countries to reach agreement on a deal. The US dollar rose significantly during the 12-month period and has continued its strength in 2019. During January and February, global stocks and bonds rose sharply. Easing trade tensions between the US and China, more dovish commentary from the Fed and generally strong corporate earnings helped stocks sustain their rally through the end of the period.
The Fund’s Senior Investment Management Team (the “Team”) uses a global, multi-asset strategy focusing on moderate growth and defensively managing market volatility. The Team’s dedicated multi-asset investment professionals utilize a rigorous quantitative research toolset in collaboration with fundamental expertise across all regions and markets.
INVESTMENT POLICIES
The Adviser allocates the Fund’s investments among a number of asset classes, including fixed-income securities, equity securities, and alternative asset classes and alternative investment strategies. The Fund seeks to have generally greater exposure to fixed-income securities than equity securities or alternative asset classes and
(continued on next page)
| | |
| |
| abfunds.com | | AB CONSERVATIVE WEALTH STRATEGY | 3 |
alternative investment strategies. The Fund pursues a global strategy, typically investing in securities of issuers located in the United States and in other countries throughout the world, including emerging-market countries. Investments will be made either directly or indirectly through underlying registered investment companies advised by the Adviser (each an “Underlying Portfolio”), although a majority of the Fund’s assets are expected to be invested directly.
The Fund’s investments in fixed-income securities may include corporate and sovereign debt securities as well as interest rate derivatives and credit derivatives such as credit default swaps. In selecting fixed-income securities for the Fund, the Adviser attempts to take advantage of inefficiencies that it believes exist in the global fixed-income markets. These inefficiencies arise from investor behavior, market complexity and the investment limitations to which investors are subject. The Adviser intends to gain exposure to high-yield debt securities (commonly known as “junk bonds”) through investment in the AB High Income Fund, an Underlying Portfolio, and may, in the future, gain such exposure through direct investments in high-yield debt securities. Fixed-income securities in which the Fund or AB High Income Fund may invest may be of any credit quality or maturity.
The Fund’s investments in equity securities will consist primarily of securities of large-capitalization companies and derivatives related to such securities. In selecting equity securities for the Fund, the Adviser intends to use fundamental and quantitative analysis with the goal of generating returns primarily from security selection rather than price movements in equity securities generally.
The Fund may invest in alternative investments the returns on which are expected to have low correlation with returns on equity and fixed-income securities, such as real-estate related securities and inflation-indexed securities. Alternative investment strategies that may be pursued by the Fund directly or indirectly through investment in other registered investment companies include (i) long/short equity strategies through which the Fund takes long positions in certain securities in the expectation that they will increase in value and takes short positions in other securities in the expectation that they will decrease in value; (ii) strategies that consider macroeconomic and technical factors to identify and exploit opportunities across global asset classes; and (iii) event-driven strategies that invest in the securities of companies that are expected to become the subject of major corporate events and companies in which an active role in company management has been taken or sought by a third-party investor. In order to gain exposure to real-estate related securities, the Adviser intends to
| | |
| |
| 4 | AB CONSERVATIVE WEALTH STRATEGY | | abfunds.com |
(continued on next page)
invest a portion of the Fund’s assets in the AB All Market Real Return Portfolio, an Underlying Portfolio.
The Adviser seeks to adjust the Fund’s asset class exposure utilizing both fundamental analysis and the Adviser’s Dynamic Asset Allocation (“DAA”) approach. DAA comprises a series of analytical and forecasting tools employed by the Adviser to gauge fluctuations in the risk/return profile of various asset classes. DAA seeks to adjust the Fund’s investment exposure in changing market conditions and thereby reduce overall portfolio volatility by mitigating the effects of market fluctuations, while preserving consistent long-term return potential. For example, the Adviser may seek to reduce the Fund’s risk exposure to one or more assets classes when DAA suggests that market risks relevant to those asset classes are rising but return opportunities are declining. In addition to merely increasing or decreasing asset class exposure by buying or selling securities of that asset class, the Adviser may pursue DAA implementation for the Fund by utilizing derivatives.
The Adviser intends to utilize a variety of derivatives in its management of the Fund. As noted above, the Adviser may use derivatives to gain exposure to various asset classes, and may cause the Fund to enter into derivatives in making the adjustments called for by DAA. As a result of the use of derivatives, the Fund will frequently be leveraged, with net investment exposure in excess of net assets.
Currency exchange rate fluctuations can have a dramatic impact on returns. The Fund’s foreign currency exposures will come from investment in securities priced or denominated in foreign currencies and from direct holdings in foreign currencies and currency-related derivatives. The Adviser may seek to hedge all or a portion of the currency exposure resulting from Fund investments or decide not to hedge this exposure. The Adviser may seek investment opportunities by taking long or short positions in currencies through the use of currency-related derivatives.
| | |
| |
| abfunds.com | | AB CONSERVATIVE WEALTH STRATEGY | 5 |
DISCLOSURES AND RISKS
Benchmark Disclosure
All indices are unmanaged and do not reflect fees and expenses associated with the active management of a mutual fund portfolio. The Bloomberg Barclays Global Aggregate Bond Index (USD hedged) represents the performance of global investment-grade developed fixed-income markets, hedged to the US dollar. The MSCI ACWI (net, free float-adjusted, market capitalization weighted) represents the equity market performance of developed and emerging markets. MSCI makes no express or implied warranties or representations, and shall have no liability whatsoever with respect to any MSCI data contained herein. The MSCI data may not be further redistributed or used as a basis for other indices, any securities or financial products. This report is not approved, reviewed or produced by MSCI. Net returns include the reinvestment of dividends after deduction of non-US withholding tax. An investor cannot invest directly in an index or average, and their results are not indicative of the performance for any specific investment, including the Fund.
A Word About Risk
Market Risk: The value of the Fund’s assets will fluctuate as the stock, bond or commodities markets fluctuate. The value of its investments may decline, sometimes rapidly and unpredictably, simply because of economic changes or other events that affect large portions of the market. It includes the risk that a particular style of investing, such as growth or value, may be underperforming the stock market generally.
Allocation Risk: The allocation of investments among different investment styles, such as equity or debt, growth or value, US or non-US securities, or diversification strategies, may have a more significant effect on the Fund’s net asset value (“NAV”) when one of these investments is performing more poorly than another.
Credit Risk: An issuer or guarantor of a fixed-income security, or the counterparty to a derivatives or other contract, may be unable or unwilling to make timely payments of interest or principal, or to otherwise honor its obligations. The issuer or guarantor may default, causing a loss of the full principal amount of a security and accrued interest. The degree of risk for a particular security may be reflected in its credit rating. There is the possibility that the credit rating of a fixed-income security may be downgraded after purchase, which may adversely affect the value of the security. Investments in fixed-income securities with lower ratings (commonly known as “junk bonds”) are subject to a higher probability that an issuer will default or fail to meet its payment obligations.
High-Yield Debt Securities Risk: Investments in fixed-income securities with lower ratings (commonly known as “junk bonds”) tend to have a
| | |
| |
| 6 | AB CONSERVATIVE WEALTH STRATEGY | | abfunds.com |
DISCLOSURES AND RISKS(continued)
higher probability that an issuer will default or fail to meet its payment obligations. These securities may be subject to greater price volatility due to such factors as specific corporate developments, interest-rate sensitivity, negative perceptions of the junk bond market generally and less secondary market liquidity.
Interest-Rate Risk: Changes in interest rates will affect the value of the Fund’s investments in fixed-income securities and in Underlying Portfolios that invest in fixed-income securities. When interest rates rise, the value of existing investments in fixed-income securities tends to fall and this decrease in value may not be offset by higher income from new investments. Interest-rate risk is generally greater for fixed-income securities with longer maturities or durations.
Foreign (Non-US) Risk: Investments in securities of non-US issuers may involve more risk than those of US issuers. These securities may fluctuate more widely in price and may be less liquid due to adverse market, economic, political, regulatory or other factors.
Currency Risk: Fluctuations in currency exchange rates may negatively affect the value of the Fund’s investments or reduce its returns.
Emerging-Market Risk: Investments in emerging-market countries may have more risk because the markets are less developed and less liquid as well as being subject to increased economic, political, regulatory or other uncertainties.
Alternative Investments Risk: Many alternative investments can be volatile and may be illiquid. Their performance may have little correlation with the performance of equity or fixed-income markets, and they may not perform in accordance with expectations.
Derivatives Risk: Derivatives may be illiquid, difficult to price, and leveraged so that small changes may produce disproportionate losses for the Fund, and may be subject to counterparty risk to a greater degree than more traditional investments.
Leverage Risk: To the extent the Fund uses leveraging techniques, its NAV may be more volatile because leverage tends to exaggerate the effect of changes in interest rates and any increase or decrease in the value of the Fund’s investments.
Investment in Other Investment Companies Risk: As with other investments, investments in other investment companies are subject to market and selection risk. In addition, shareholders of the Fund bear both their proportionate share of expenses in the Fund (including management
| | |
| |
| abfunds.com | | AB CONSERVATIVE WEALTH STRATEGY | 7 |
DISCLOSURES AND RISKS(continued)
fees) and, indirectly, the expenses of the investment companies (to the extent these expenses are not waived or reimbursed by the Adviser).
Management Risk: The Fund is subject to management risk because it is an actively managed investment fund. The Adviser will apply its investment techniques and risk analyses in making investment decisions for the Fund, but there is no guarantee that its techniques will produce the intended results.
These risks are fully discussed in the Fund’s prospectus. As with all investments, you may lose money by investing in the Fund.
An Important Note About Historical Performance
The investment return and principal value of an investment in the Fund will fluctuate as the prices of the individual securities in which it invests fluctuate, so that your shares, when redeemed, may be worth more or less than their original cost. Performance shown in this report represents past performance and does not guarantee future results. Current performance may be lower or higher than the performance information shown. You may obtain performance information current to the most recent month-end by visiting www.abfunds.com. The performance shown for periods prior to July 14, 2017 is based on the Fund’s prior principal strategies and may not be representative of the Fund’s performance under its current principal strategies.
All fees and expenses related to the operation of the Fund have been deducted. NAV returns do not reflect sales charges; if sales charges were reflected, the Fund’s quoted performance would be lower. SEC returns reflect the applicable sales charges for each share class: a 4.25% maximum front-end sales charge for Class A shares; the applicable contingent deferred sales charge for Class B shares (4% year 1, 3% year 2, 2% year 3, 1% year 4) and a 1%1-year contingent deferred sales charge for Class C shares. Returns for the different share classes will vary due to different expenses associated with each class. Performance assumes reinvestment of distributions and does not account for taxes.
| | |
| |
| 8 | AB CONSERVATIVE WEALTH STRATEGY | | abfunds.com |
HISTORICAL PERFORMANCE
AVERAGE ANNUAL RETURNS AS OF FEBRUARY 28, 2019(unaudited)
| | | | | | | | |
| | |
| | | NAV Returns | | | SEC Returns
(reflects applicable
sales charges) | |
| | |
| CLASS A SHARES | | | | | | | | |
| | |
| 1 Year | | | 0.98% | | | | -3.29% | |
| | |
| 5 Years | | | 2.62% | | | | 1.72% | |
| | |
| 10 Years | | | 6.19% | | | | 5.72% | |
| | |
| CLASS B SHARES | | | | | | | | |
| | |
| 1 Year | | | 0.16% | | | | -3.84% | |
| | |
| 5 Years | | | 1.84% | | | | 1.84% | |
| | |
| 10 Years1 | | | 5.57% | | | | 5.57% | |
| | |
| CLASS C SHARES | | | | | | | | |
| | |
| 1 Year | | | 0.25% | | | | -0.75% | |
| | |
| 5 Years | | | 1.85% | | | | 1.85% | |
| | |
| 10 Years | | | 5.42% | | | | 5.42% | |
| | |
| ADVISOR CLASS SHARES2 | | | | | | | | |
| | |
| 1 Year | | | 1.16% | | | | 1.16% | |
| | |
| 5 Years | | | 2.86% | | | | 2.86% | |
| | |
| 10 Years | | | 6.48% | | | | 6.48% | |
| | |
| CLASS R SHARES2 | | | | | | | | |
| | |
| 1 Year | | | 0.59% | | | | 0.59% | |
| | |
| 5 Years | | | 2.20% | | | | 2.20% | |
| | |
| 10 Years | | | 5.79% | | | | 5.79% | |
| | |
| CLASS K SHARES2 | | | | | | | | |
| | |
| 1 Year | | | 0.88% | | | | 0.88% | |
| | |
| 5 Years | | | 2.52% | | | | 2.52% | |
| | |
| 10 Years | | | 6.12% | | | | 6.12% | |
| | |
| CLASS I SHARES2 | | | | | | | | |
| | |
| 1 Year | | | 1.12% | | | | 1.12% | |
| | |
| 5 Years | | | 2.82% | | | | 2.82% | |
| | |
| 10 Years | | | 6.45% | | | | 6.45% | |
The Fund’s current prospectus fee table shows the Fund’s total annual operating expense ratios as 1.50%, 2.26%, 2.23%, 1.25%, 1.91%, 1.61% and 1.19% for Class A, Class B, Class C, Advisor Class, Class R, Class K and Class I shares, respectively, gross of any fee waivers or expense reimbursements. Contractual fee waivers and/or expense reimbursement agreements reduced the Fund’s annual operating expense ratios to 1.29%, 2.05%, 2.02%, 1.04%, 1.70%, 1.40% and 0.98% for Class A, Class B, Class C, Advisor Class, Class R, Class K and Class I shares, respectively. These waivers/reimbursement agreements may not be terminated before December 31, 2019. Absent reimbursements or waivers, performance would have been lower. The net and gross expenses shown include the total operating expenses of the Fund and the indirect expenses of the Fund’s Underlying Portfolios, as based upon the allocation of the Fund’s assets among the Underlying Portfolios. The Financial Highlights section of this report sets forth expense ratio data for the current reporting period; the expense ratios shown above may differ from the expense ratios in the Financial Highlights section since they are based on different time periods.
| | |
| |
| abfunds.com | | AB CONSERVATIVE WEALTH STRATEGY | 9 |
HISTORICAL PERFORMANCE(continued)
| 1 | Assumes conversion of Class B shares into Class A shares after eight years. |
| 2 | These share classes are offered at NAV to eligible investors and their SEC returns are the same as their NAV returns. Please note that these share classes are for investors purchasing shares through accounts established under certain fee-based programs sponsored and maintained by certain broker-dealers and financial intermediaries, institutional pension plans and/or investment advisory clients of, and certain other persons associated with, the Adviser and its affiliates or the Fund. |
| | |
| |
| 10 | AB CONSERVATIVE WEALTH STRATEGY | | abfunds.com |
HISTORICAL PERFORMANCE(continued)
SEC AVERAGE ANNUAL RETURNS
AS OF THE MOST RECENT CALENDAR QUARTER-END
MARCH 31, 2019(unaudited)
| | | | |
| |
| | | SEC Returns
(reflects applicable
sales charges) | |
| |
| CLASS A SHARES | | | | |
| |
| 1 Year | | | -2.64% | |
| |
| 5 Years | | | 1.97% | |
| |
| 10 Years | | | 5.43% | |
| |
| CLASS B SHARES | | | | |
| |
| 1 Year | | | -3.10% | |
| |
| 5 Years | | | 2.07% | |
| |
| 10 Years1 | | | 5.28% | |
| |
| CLASS C SHARES | | | | |
| |
| 1 Year | | | -0.08% | |
| |
| 5 Years | | | 2.07% | |
| |
| 10 Years | | | 5.12% | |
| |
| ADVISOR CLASS SHARES2 | | | | |
| |
| 1 Year | | | 1.91% | |
| |
| 5 Years | | | 3.11% | |
| |
| 10 Years | | | 6.19% | |
| |
| CLASS R SHARES2 | | | | |
| |
| 1 Year | | | 1.25% | |
| |
| 5 Years | | | 2.44% | |
| |
| 10 Years | | | 5.49% | |
| |
| CLASS K SHARES2 | | | | |
| |
| 1 Year | | | 1.63% | |
| |
| 5 Years | | | 2.76% | |
| |
| 10 Years | | | 5.81% | |
| |
| CLASS I SHARES2 | | | | |
| |
| 1 Year | | | 1.86% | |
| |
| 5 Years | | | 3.05% | |
| |
| 10 Years | | | 6.15% | |
| 1 | Assumes conversion of Class B shares into Class A shares after eight years. |
| 2 | Please note that these share classes are for investors purchasing shares through accounts established under certain fee-based programs sponsored and maintained by certain broker-dealers and financial intermediaries, institutional pension plans and/or investment advisory clients of, and certain other persons associated with, the Adviser and its affiliates or the Fund. |
| | |
| |
| abfunds.com | | AB CONSERVATIVE WEALTH STRATEGY | 11 |
EXPENSE EXAMPLE
(unaudited)
As a shareholder of the Fund, you incur two types of costs: (1) transaction costs, including sales charges (loads) on purchase payments, contingent deferred sales charges on redemptions and (2) ongoing costs, including management fees; distribution(12b-1) fees; and other Fund expenses. This example is intended to help you understand your ongoing costs (in dollars) of investing in the Fund and to compare these costs with the ongoing costs of investing in other mutual funds.
The Example is based on an investment of $1,000 invested at the beginning of the period and held for the entire period as indicated below.
Actual Expenses
The table below provides information about actual account values and actual expenses. You may use the information, together with the amount you invested, to estimate the expenses that you paid over the period. Simply divide your account value by $1,000 (for example, an $8,600 account value divided by $1,000 = 8.6), then multiply the result by the number under the heading entitled “Expenses Paid During Period” to estimate the expenses you paid on your account during this period.
Hypothetical Example for Comparison Purposes
The table below also provides information about hypothetical account values and hypothetical expenses based on the Fund’s actual expense ratio and an assumed annual rate of return of 5% before expenses, which is not the Fund’s actual return. The hypothetical account values and expenses may not be used to estimate the actual ending account balance or expenses you paid for the period. You may use this information to compare the ongoing costs of investing in the Fund and other funds by comparing this 5% hypothetical example with the 5% hypothetical examples that appear in the shareholder reports of other funds.
Please note that the expenses shown in the table are meant to highlight your ongoing costs only and do not reflect any transactional costs, such as sales charges (loads), or contingent deferred sales charges on redemptions. Therefore, the hypothetical example is useful in comparing ongoing costs only, and will not help you determine the relative total costs of owning different funds. In addition, if these transactional costs were included, your costs would have been higher.
| | |
| |
| 12 | AB CONSERVATIVE WEALTH STRATEGY | | abfunds.com |
EXPENSE EXAMPLE(continued)
| | | | | | | | | | | | | | | | | | | | | | | | |
| | | Beginning
Account
Value
September 1,
2018 | | | Ending
Account
Value
February 28,
2019 | | | Expenses
Paid
During
Period* | | | Annualized
Expense
Ratio* | | | Total
Expenses
Paid
During
Period+ | | | Total
Annualized
Expense
Ratio+ | |
| Class A | | | | | | | | | | | | | | | | | | | | | | | | |
Actual | | $ | 1,000 | | | $ | 997.30 | | | $ | 5.00 | | | | 1.01 | % | | $ | 6.09 | | | | 1.23 | % |
Hypothetical** | | $ | 1,000 | | | $ | 1,019.79 | | | $ | 5.06 | | | | 1.01 | % | | $ | 6.16 | | | | 1.23 | % |
| Class B | | | | | | | | | | | | | | | | | | | | | | | | |
Actual | | $ | 1,000 | | | $ | 993.50 | | | $ | 8.80 | | | | 1.78 | % | | $ | 9.89 | | | | 2.00 | % |
Hypothetical** | | $ | 1,000 | | | $ | 1,015.97 | | | $ | 8.90 | | | | 1.78 | % | | $ | 9.99 | | | | 2.00 | % |
| Class C | | | | | | | | | | | | | | | | | | | | | | | | |
Actual | | $ | 1,000 | | | $ | 993.40 | | | $ | 8.70 | | | | 1.76 | % | | $ | 9.79 | | | | 1.98 | % |
Hypothetical** | | $ | 1,000 | | | $ | 1,016.07 | | | $ | 8.80 | | | | 1.76 | % | | $ | 9.89 | | | | 1.98 | % |
| Advisor Class | | | | | | | | | | | | | | | | | | | | | | | | |
Actual | | $ | 1,000 | | | $ | 998.40 | | | $ | 3.77 | | | | 0.76 | % | | $ | 4.86 | | | | 0.98 | % |
Hypothetical** | | $ | 1,000 | | | $ | 1,021.03 | | | $ | 3.81 | | | | 0.76 | % | | $ | 4.91 | | | | 0.98 | % |
| Class R | | | | | | | | | | | | | | | | | | | | | | | | |
Actual | | $ | 1,000 | | | $ | 995.10 | | | $ | 6.93 | | | | 1.40 | % | | $ | 8.01 | | | | 1.62 | % |
Hypothetical** | | $ | 1,000 | | | $ | 1,017.85 | | | $ | 7.00 | | | | 1.40 | % | | $ | 8.10 | | | | 1.62 | % |
| Class K | | | | | | | | | | | | | | | | | | | | | | | | |
Actual | | $ | 1,000 | | | $ | 997.10 | | | $ | 5.45 | | | | 1.10 | % | | $ | 6.54 | | | | 1.32 | % |
Hypothetical** | | $ | 1,000 | | | $ | 1,019.34 | | | $ | 5.51 | | | | 1.10 | % | | $ | 6.61 | | | | 1.32 | % |
| Class I | | | | | | | | | | | | | | | | | | | | | | | | |
Actual | | $ | 1,000 | | | $ | 998.10 | | | $ | 3.86 | | | | 0.78 | % | | $ | 4.95 | | | | 1.00 | % |
Hypothetical** | | $ | 1,000 | | | $ | 1,020.93 | | | $ | 3.91 | | | | 0.78 | % | | $ | 5.01 | | | | 1.00 | % |
| * | Expenses are equal to the classes’ annualized expense ratios, multiplied by the average account value over the period, multiplied by 181/365 (to reflect theone-half year period). |
| ** | Assumes 5% annual return before expenses. |
| + | In connection with the Fund’s investments in affiliated/unaffiliated underlying portfolios, the Fund incurs no direct expenses, but bears proportionate shares of the fees and expenses (i.e., operating, administrative and investment advisory fees) of the affiliated/unaffiliated underlying portfolios. The Adviser has contractually agreed to waive its fees from the Fund in an amount equal to the Fund’s pro rata share of certain acquired fund fees and expenses of the affiliated underlying portfolios. The Fund’s total expenses are equal to the classes’ annualized expense ratio plus the Fund’s pro rata share of the weighted average expense ratio of the affiliated/unaffiliated underlying portfolios in which it invests, multiplied by the average account value over the period, multiplied by 181/365 (to reflect theone-half year period). |
| | |
| |
| abfunds.com | | AB CONSERVATIVE WEALTH STRATEGY | 13 |
PORTFOLIO SUMMARY
February 28, 2019(unaudited)
PORTFOLIO STATISTICS
Net Assets ($mil): $182.2
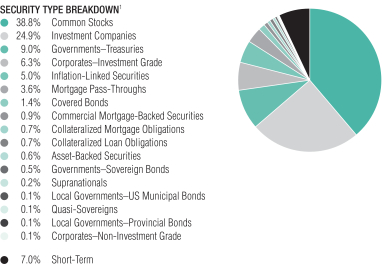
| 1 | All data are as of February 28, 2019. The Fund’s security type breakdown is expressed as a percentage of total investments (excluding security lending collateral) and may vary over time. The Fund also enters into derivative transactions, which may be used for hedging or investment purposes (see “Portfolio of Investments” section of the report for additional details). |
| | |
| |
| 14 | AB CONSERVATIVE WEALTH STRATEGY | | abfunds.com |
PORTFOLIO OF INVESTMENTS
February 28, 2019(unaudited)
| | | | | | | | | | | | |
| Company | | | | |
Shares | | | U.S. $ Value | |
| |
COMMON STOCKS – 38.6% | | | | | | | | | | | | |
Information Technology – 8.2% | | | | | | | | | | | | |
Communications Equipment – 0.4% | | | | | | | | | | | | |
ARRIS International PLC(a) | | | | | | | 8,942 | | | $ | 283,282 | |
F5 Networks, Inc.(a) | | | | | | | 105 | | | | 17,655 | |
Finisar Corp.(a) | | | | | | | 11,609 | | | | 284,304 | |
Juniper Networks, Inc. | | | | | | | 4,277 | | | | 115,821 | |
Telefonaktiebolaget LM Ericsson – Class B | | | | | | | 2,756 | | | | 25,122 | |
| | | | | | | | | | | | |
| | | | | | | | | | | 726,184 | |
| | | | | | | | | | | | |
Electronic Equipment, Instruments & Components – 0.5% | | | | | | | | | | | | |
Amphenol Corp. – Class A | | | | | | | 8,337 | | | | 783,428 | |
Hitachi Ltd. | | | | | | | 1,600 | | | | 48,097 | |
IPG Photonics Corp.(a) | | | | | | | 877 | | | | 135,961 | |
| | | | | | | | | | | | |
| | | | | | | | | | | 967,486 | |
| | | | | | | | | | | | |
IT Services – 2.5% | | | | | | | | | | | | |
Accenture PLC – Class A | | | | | | | 41 | | | | 6,617 | |
Akamai Technologies, Inc.(a) | | | | | | | 1,825 | | | | 127,129 | |
Amadeus IT Group SA – Class A | | | | | | | 2,230 | | | | 167,746 | |
Amdocs Ltd. | | | | | | | 1,287 | | | | 71,519 | |
Automatic Data Processing, Inc. | | | | | | | 2,895 | | | | 443,022 | |
Booz Allen Hamilton Holding Corp. | | | | | | | 5,136 | | | | 271,489 | |
Capgemini SE | | | | | | | 1,165 | | | | 139,250 | |
CGI, Inc.(a) | | | | | | | 890 | | | | 59,671 | |
Cognizant Technology Solutions Corp. – Class A | | | | | | | 5,902 | | | | 418,924 | |
Fidelity National Information Services, Inc. | | | | | | | 1,140 | | | | 123,291 | |
First Data Corp. – Class A(a) | | | | | | | 10,898 | | | | 273,976 | |
Luxoft Holding, Inc.(a) | | | | | | | 2,392 | | | | 139,430 | |
Mastercard, Inc. – Class A | | | | | | | 5,720 | | | | 1,285,684 | |
Paychex, Inc. | | | | | | | 3,230 | | | | 248,775 | |
Total System Services, Inc. | | | | | | | 1,320 | | | | 124,608 | |
Visa, Inc. – Class A | | | | | | | 4,662 | | | | 690,535 | |
| | | | | | | | | | | | |
| | | | | | | | | | | 4,591,666 | |
| | | | | | | | | | | | |
Semiconductors & Semiconductor Equipment – 1.1% | | | | | | | | | | | | |
ASML Holding NV | | | | | | | 1,140 | | | | 208,548 | |
Integrated Device Technology, Inc.(a) | | | | | | | 5,724 | | | | 276,641 | |
Intel Corp. | | | | | | | 7,970 | | | | 422,091 | |
KLA-Tencor Corp. | | | | | | | 1,165 | | | | 134,488 | |
NXP Semiconductors NV | | | | | | | 1,560 | | | | 142,459 | |
Taiwan Semiconductor Manufacturing Co., Ltd. (Sponsored ADR) | | | | | | | 4,430 | | | | 172,992 | |
Texas Instruments, Inc. | | | | | | | 1,172 | | | | 123,974 | |
Versum Materials, Inc. | | | | | | | 5,802 | | | | 284,298 | |
| | |
| |
| abfunds.com | | AB CONSERVATIVE WEALTH STRATEGY | 15 |
PORTFOLIO OF INVESTMENTS(continued)
| | | | | | | | | | | | |
| Company | | | | |
Shares | | | U.S. $ Value | |
| |
Xilinx, Inc. | | | | | | | 1,153 | | | $ | 144,471 | |
| | | | | | | | | | | | |
| | | | | | | | | | | 1,909,962 | |
| | | | | | | | | | | | |
Software – 3.0% | | | | | | | | | | | | |
Cadence Design Systems, Inc.(a) | | | | | | | 2,617 | | | | 149,823 | |
Check Point Software Technologies Ltd.(a) | | | | | | | 2,210 | | | | 270,283 | |
Citrix Systems, Inc. | | | | | | | 1,143 | | | | 120,587 | |
Constellation Software, Inc./Canada | | | | | | | 260 | | | | 222,022 | |
Fortinet, Inc.(a) | | | | | | | 1,693 | | | | 146,935 | |
Gemalto NV(a) | | | | | | | 3,478 | | | | 201,363 | |
Microsoft Corp. | | | | | | | 22,957 | | | | 2,571,873 | |
Nice Ltd.(a) | | | | | | | 3,275 | | | | 386,283 | |
Oracle Corp. | | | | | | | 8,554 | | | | 445,920 | |
Oracle Corp. Japan | | | | | | | 3,100 | | | | 231,845 | |
Red Hat, Inc.(a) | | | | | | | 1,693 | | | | 309,142 | |
SAP SE | | | | | | | 1,206 | | | | 129,074 | |
ServiceNow, Inc.(a) | | | | | | | 181 | | | | 43,339 | |
Symantec Corp. | | | | | | | 5,626 | | | | 126,529 | |
VMware, Inc. – Class A | | | | | | | 830 | | | | 142,602 | |
| | | | | | | | | | | | |
| | | | | | | | | | | 5,497,620 | |
| | | | | | | | | | | | |
Technology Hardware, Storage & Peripherals – 0.7% | | | | | | | | | | | | |
Apple, Inc. | | | | | | | 4,769 | | | | 825,752 | |
Samsung Electronics Co., Ltd. | | | | | | | 9,708 | | | | 388,532 | |
| | | | | | | | | | | | |
| | | | | | | | | | | 1,214,284 | |
| | | | | | | | | | | | |
| | | | | | | | | | | 14,907,202 | |
| | | | | | | | | | | | |
Financials – 6.5% | | | | | | | | | | | | |
Banks – 2.5% | | | | | | | | | | | | |
Banco do Brasil SA | | | | | | | 1,900 | | | | 25,595 | |
Bank LeumiLe-Israel BM | | | | | | | 14,010 | | | | 92,659 | |
Bank of America Corp. | | | | | | | 279 | | | | 8,113 | |
Bank of China Ltd. – Class A | | | | | | | 49,796 | | | | 28,593 | |
Bank of Communications Co., Ltd. – Class A | | | | | | | 10,900 | | | | 10,433 | |
Blue Hills Bancorp, Inc. | | | | | | | 7,931 | | | | 197,323 | |
China CITIC Bank Corp., Ltd. | | | | | | | 33,000 | | | | 32,330 | |
China Everbright Bank Co., Ltd. | | | | | | | 46,545 | | | | 29,440 | |
China Minsheng Banking Corp., Ltd. | | | | | | | 20,400 | | | | 19,922 | |
Chongqing Rural Commercial Bank Co., Ltd. – Class H | | | | | | | 49,000 | | | | 30,656 | |
Citigroup, Inc. | | | | | | | 4,445 | | | | 284,391 | |
DBS Group Holdings Ltd. | | | | | | | 28,300 | | | | 518,845 | |
DNB ASA | | | | | | | 4,645 | | | | 88,970 | |
Fidelity Southern Corp. | | | | | | | 769 | | | | 25,054 | |
Fifth Third Bancorp | | | | | | | 4,599 | | | | 126,840 | |
Hang Seng Bank Ltd. | | | | | | | 4,300 | | | | 106,484 | |
Industrial Bank of Korea | | | | | | | 1,923 | | | | 23,834 | |
| | |
| |
| 16 | AB CONSERVATIVE WEALTH STRATEGY | | abfunds.com |
PORTFOLIO OF INVESTMENTS(continued)
| | | | | | | | | | | | |
| Company | | | | |
Shares | | | U.S. $ Value | |
| |
JPMorgan Chase & Co. | | | | | | | 1,616 | | | $ | 168,646 | |
Jyske Bank A/S | | | | | | | 11,620 | | | | 455,007 | |
Mebuki Financial Group, Inc. | | | | | | | 15,900 | | | | 43,165 | |
Mitsubishi UFJ Financial Group, Inc. | | | | | | | 20,300 | | | | 105,345 | |
Oversea-Chinese Banking Corp., Ltd. | | | | | | | 3,900 | | | | 31,818 | |
PNC Financial Services Group, Inc. (The) | | | | | | | 680 | | | | 85,694 | |
Royal Bank of Canada | | | | | | | 4,434 | | | | 346,546 | |
SunTrust Banks, Inc. | | | | | | | 4,341 | | | | 281,601 | |
TCF Financial Corp. | | | | | | | 11,840 | | | | 271,136 | |
Toronto-Dominion Bank (The) | | | | | | | 5,178 | | | | 296,920 | |
Wells Fargo & Co. | | | | | | | 13,521 | | | | 674,563 | |
Westpac Banking Corp. | | | | | | | 6,920 | | | | 132,457 | |
| | | | | | | | | | | | |
| | | | | | | | | | | 4,542,380 | |
| | | | | | | | | | | | |
Capital Markets – 2.2% | | | | | | | | | | | | |
BinckBank NV | | | | | | | 19,556 | | | | 139,227 | |
BlackRock, Inc. – Class A | | | | | | | 350 | | | | 155,127 | |
Cboe Global Markets, Inc. | | | | | | | 1,089 | | | | 104,446 | |
Charles Schwab Corp. (The) | | | | | | | 22,090 | | | | 1,016,361 | |
China Cinda Asset Management Co., Ltd. – Class H | | | | | | | 105,000 | | | | 30,486 | |
China Huarong Asset Management Co., Ltd.(b) | | | | | | | 134,000 | | | | 30,724 | |
CME Group, Inc. – Class A | | | | | | | 1,100 | | | | 200,101 | |
Daiwa Securities Group, Inc. | | | | | | | 8,800 | | | | 44,682 | |
Intercontinental Exchange, Inc. | | | | | | | 2,400 | | | | 185,160 | |
Investment Technology Group, Inc. | | | | | | | 6,224 | | | | 188,152 | |
Julius Baer Group Ltd.(a) | | | | | | | 12,915 | | | | 562,732 | |
Korea Investment Holdings Co., Ltd.(a) | | | | | | | 451 | | | | 25,806 | |
Macquarie Group Ltd. | | | | | | | 681 | | | | 62,178 | |
Moody’s Corp. | | | | | | | 1,460 | | | | 252,755 | |
NH Investment & Securities Co., Ltd.(a) | | | | | | | 2,150 | | | | 24,902 | |
Partners Group Holding AG | | | | | | | 195 | | | | 140,891 | |
S&P Global, Inc. | | | | | | | 1,775 | | | | 355,657 | |
Singapore Exchange Ltd. | | | | | | | 75,400 | | | | 436,639 | |
| | | | | | | | | | | | |
| | | | | | | | | | | 3,956,026 | |
| | | | | | | | | | | | |
Consumer Finance – 0.1% | | | | | | | | | | | | |
Ally Financial, Inc. | | | | | | | 1,291 | | | | 34,973 | |
Synchrony Financial | | | | | | | 1,702 | | | | 55,502 | |
| | | | | | | | | | | | |
| | | | | | | | | | | 90,475 | |
| | | | | | | | | | | | |
Diversified Financial Services – 0.1% | | | | | | | | | | | | |
Berkshire Hathaway, Inc. – Class B(a) | | | | | | | 146 | | | | 29,390 | |
Far East Horizon Ltd. | | | | | | | 18,000 | | | | 20,087 | |
Pargesa Holding SA | | | | | | | 1,630 | | | | 133,732 | |
| | | | | | | | | | | | |
| | | | | | | | | | | 183,209 | |
| | | | | | | | | | | | |
Insurance – 1.6% | | | | | | | | | | | | |
Admiral Group PLC | | | | | | | 3,600 | | | | 104,243 | |
| | |
| |
| abfunds.com | | AB CONSERVATIVE WEALTH STRATEGY | 17 |
PORTFOLIO OF INVESTMENTS(continued)
| | | | | | | | | | | | |
| Company | | | | |
Shares | | | U.S. $ Value | |
| |
Aegon NV | | | | | | | 13,068 | | | $ | 70,118 | |
Arthur J Gallagher & Co. | | | | | | | 3,140 | | | | 252,079 | |
Athene Holding Ltd. – Class A(a) | | | | | | | 2,814 | | | | 125,364 | |
Direct Line Insurance Group PLC | | | | | | | 16,230 | | | | 76,727 | |
Everest Re Group Ltd. | | | | | | | 1,158 | | | | 261,835 | |
Fidelity National Financial, Inc. | | | | | | | 9,430 | | | | 330,899 | |
Japan Post Holdings Co., Ltd. | | | | | | | 4,200 | | | | 51,055 | |
Jardine Lloyd Thompson Group PLC | | | | | | | 11,042 | | | | 279,437 | |
Legal & General Group PLC | | | | | | | 26,499 | | | | 98,606 | |
Lincoln National Corp. | | | | | | | 1,944 | | | | 121,539 | |
Marsh & McLennan Cos., Inc. | | | | | | | 1,040 | | | | 96,741 | |
MetLife, Inc. | | | | | | | 1,263 | | | | 57,075 | |
NN Group NV | | | | | | | 7,824 | | | | 340,544 | |
PICC Property & Casualty Co., Ltd. – Class H | | | | | | | 26,000 | | | | 31,119 | |
Poste Italiane SpA(b) | | | | | | | 7,631 | | | | 68,797 | |
Prudential Financial, Inc. | | | | | | | 1,464 | | | | 140,324 | |
Sampo Oyj – Class A | | | | | | | 1,930 | | | | 92,852 | |
Stewart Information Services Corp. | | | | | | | 5,513 | | | | 236,673 | |
Swiss Re AG | | | | | | | 1,460 | | | | 144,321 | |
| | | | | | | | | | | | |
| | | | | | | | | | | 2,980,348 | |
| | | | | | | | | | | | |
| | | | | | | | | | | 11,752,438 | |
| | | | | | | | | | | | |
Health Care – 5.5% | | | | | | | | | | | | |
Biotechnology – 1.0% | | | | | | | | | | | | |
Amgen, Inc. | | | | | | | 666 | | | | 126,593 | |
Celgene Corp.(a) | | | | | | | 10,030 | | | | 833,694 | |
Gilead Sciences, Inc. | | | | | | | 10,150 | | | | 659,953 | |
Spark Therapeutics, Inc.(a) | | | | | | | 819 | | | | 92,793 | |
Vertex Pharmaceuticals, Inc.(a) | | | | | | | 526 | | | | 99,282 | |
| | | | | | | | | | | | |
| | | | | | | | | | | 1,812,315 | |
| | | | | | | | | | | | |
Health Care Equipment & Supplies – 1.1% | | | | | | | | | | | | |
Abbott Laboratories | | | | | | | 15,755 | | | | 1,222,903 | |
Baxter International, Inc. | | | | | | | 1,857 | | | | 138,774 | |
Koninklijke Philips NV | | | | | | | 2,000 | | | | 79,584 | |
Medtronic PLC | | | | | | | 1,767 | | | | 159,914 | |
ResMed, Inc. | | | | | | | 49 | | | | 5,019 | |
Stryker Corp. | | | | | | | 206 | | | | 38,833 | |
West Pharmaceutical Services, Inc. | | | | | | | 3,927 | | | | 411,353 | |
| | | | | | | | | | | | |
| | | | | | | | | | | 2,056,380 | |
| | | | | | | | | | | | |
Health Care Providers & Services – 0.8% | | | | | | | | | | | | |
Anthem, Inc. | | | | | | | 3,381 | | | | 1,016,768 | |
Centene Corp.(a) | | | | | | | 1,986 | | | | 120,927 | |
CVS Health Corp. | | | | | | | 142 | | | | 8,212 | |
Humana, Inc. | | | | | | | 202 | | | | 57,578 | |
McKesson Corp. | | | | | | | 1,017 | | | | 129,322 | |
UnitedHealth Group, Inc. | | | | | | | 658 | | | | 159,381 | |
| | | | | | | | | | | | |
| | | | | | | | | | | 1,492,188 | |
| | | | | | | | | | | | |
| | |
| |
| 18 | AB CONSERVATIVE WEALTH STRATEGY | | abfunds.com |
PORTFOLIO OF INVESTMENTS(continued)
| | | | | | | | | | | | |
| Company | | | | |
Shares | | | U.S. $ Value | |
| |
Life Sciences Tools & Services – 0.6% | | | | | | | | | | | | |
IQVIA Holdings, Inc.(a) | | | | | | | 6,038 | | | $ | 845,924 | |
Pacific Biosciences of California, Inc.(a) | | | | | | | 19,164 | | | | 140,089 | |
Sartorius Stedim Biotech | | | | | | | 595 | | | | 69,987 | |
| | | | | | | | | | | | |
| | | | | | | | | | | 1,056,000 | |
| | | | | | | | | | | | |
Pharmaceuticals – 2.0% | | | | | | | | | | | | |
Astellas Pharma, Inc. | | | | | | | 8,300 | | | | 128,688 | |
Bausch Health Cos., Inc.(a) | | | | | | | 2,258 | | | | 53,638 | |
Bristol-Myers Squibb Co. | | | | | | | 3,300 | | | | 170,478 | |
BTG PLC(a) | | | | | | | 4,228 | | | | 46,713 | |
Eli Lilly & Co. | | | | | | | 1,334 | | | | 168,471 | |
Johnson & Johnson | | | | | | | 1,296 | | | | 177,086 | |
Merck & Co., Inc. | | | | | | | 6,708 | | | | 545,293 | |
Novo Nordisk A/S – Class B | | | | | | | 3,700 | | | | 181,395 | |
Pfizer, Inc. | | | | | | | 10,733 | | | | 465,275 | |
Roche Holding AG | | | | | | | 2,674 | | | | 742,101 | |
Sanofi | | | | | | | 2,013 | | | | 167,862 | |
UCB SA | | | | | | | 787 | | | | 65,936 | |
Zoetis, Inc. | | | | | | | 8,261 | | | | 778,434 | |
| | | | | | | | | | | | |
| | | | | | | | | | | 3,691,370 | |
| | | | | | | | | | | | |
| | | | | | | | | | | 10,108,253 | |
| | | | | | | | | | | | |
Consumer Discretionary – 4.7% | | | | | | | | | | | | |
Auto Components – 0.4% | | | | | | | | | | | | |
Aptiv PLC | | | | | | | 8,800 | | | | 731,368 | |
| | | | | | | | | | | | |
| | | |
Automobiles – 0.0% | | | | | | | | | | | | |
BAIC Motor Corp., Ltd.(b) | | | | | | | 22,000 | | | | 13,984 | |
| | | | | | | | | | | | |
| | | |
Diversified Consumer Services – 0.6% | | | | | | | | | | | | |
H&R Block, Inc. | | | | | | | 4,741 | | | | 114,495 | |
Service Corp. International/US | | | | | | | 16,623 | | | | 687,195 | |
Sotheby’s(a) | | | | | | | 5,042 | | | | 221,193 | |
| | | | | | | | | | | | |
| | | | | | | | | | | 1,022,883 | |
| | | | | | | | | | | | |
Hotels, Restaurants & Leisure – 1.2% | | | | | | | | | | | | |
Aristocrat Leisure Ltd. | | | | | | | 10,500 | | | | 183,413 | |
Choice Hotels International, Inc. | | | | | | | 1,280 | | | | 102,195 | |
Compass Group PLC | | | | | | | 13,708 | | | | 302,742 | |
Las Vegas Sands Corp. | | | | | | | 5,014 | | | | 308,010 | |
McDonald’s Corp. | | | | | | | 1,190 | | | | 218,770 | |
Starbucks Corp. | | | | | | | 15,289 | | | | 1,074,205 | |
| | | | | | | | | | | | |
| | | | | | | | | | | 2,189,335 | |
| | | | | | | | | | | | |
Household Durables – 0.1% | | | | | | | | | | | | |
Auto Trader Group PLC(b) | | | | | | | 18,120 | | | | 114,390 | |
| | | | | | | | | | | | |
| | |
| |
| abfunds.com | | AB CONSERVATIVE WEALTH STRATEGY | 19 |
PORTFOLIO OF INVESTMENTS(continued)
| | | | | | | | | | | | |
| Company | | | | |
Shares | | | U.S. $ Value | |
| |
Internet & Direct Marketing Retail – 0.7% | | | | | | | | | | | | |
Amazon.com, Inc.(a) | | | | | | | 183 | | | $ | 300,089 | |
Booking Holdings, Inc.(a) | | | | | | | 470 | | | | 797,609 | |
Nutrisystem, Inc. | | | | | | | 5,297 | | | | 229,254 | |
| | | | | | | | | | | | |
| | | | | | | | | | | 1,326,952 | |
| | | | | | | | | | | | |
Media – 0.1% | | | | | | | | | | | | |
Tribune Media Co. – Class A | | | | | | | 6,031 | | | | 278,813 | |
| | | | | | | | | | | | |
| | | |
Multiline Retail – 0.2% | | | | | | | | | | | | |
Dollar General Corp. | | | | | | | 1,970 | | | | 233,366 | |
Lotte Shopping Co., Ltd. | | | | | | | 146 | | | | 24,781 | |
Next PLC | | | | | | | 1,374 | | | | 92,667 | |
| | | | | | | | | | | | |
| | | | | | | | | | | 350,814 | |
| | | | | | | | | | | | |
Specialty Retail – 1.2% | | | | | | | | | | | | |
AutoZone, Inc.(a) | | | | | | | 194 | | | | 182,160 | |
Home Depot, Inc. (The) | | | | | | | 2,055 | | | | 380,462 | |
O’Reilly Automotive, Inc.(a) | | | | | | | 385 | | | | 143,205 | |
Ross Stores, Inc. | | | | | | | 3,470 | | | | 329,060 | |
TJX Cos., Inc. (The) | | | | | | | 5,472 | | | | 280,659 | |
Ulta Salon Cosmetics & Fragrance, Inc.(a) | | | | | | | 2,516 | | | | 786,225 | |
| | | | | | | | | | | | |
| | | | | | | | | | | 2,101,771 | |
| | | | | | | | | | | | |
Textiles, Apparel & Luxury Goods – 0.2% | | | | | | | | | | | | |
Samsonite International SA(a)(b) | | | | | | | 114,368 | | | | 339,878 | |
| | | | | | | | | | | | |
| | | | | | | | | | | 8,470,188 | |
| | | | | | | | | | | | |
Industrials – 3.9% | | | | | | | | | | | | |
Aerospace & Defense – 0.9% | | | | | | | | | | | | |
Arconic, Inc. | | | | | | | 5,946 | | | | 109,941 | |
BAE Systems PLC | | | | | | | 17,400 | | | | 107,283 | |
Boeing Co. (The) | | | | | | | 735 | | | | 323,371 | |
Esterline Technologies Corp.(a) | | | | | | | 1,824 | | | | 222,072 | |
Harris Corp. | | | | | | | 780 | | | | 128,646 | |
L3 Technologies, Inc. | | | | | | | 1,372 | | | | 290,521 | |
Raytheon Co. | | | | | | | 2,067 | | | | 385,495 | |
Spirit AeroSystems Holdings, Inc. – Class A | | | | | | | 1,452 | | | | 143,458 | |
| | | | | | | | | | | | |
| | | | | | | | | | | 1,710,787 | |
| | | | | | | | | | | | |
Air Freight & Logistics – 0.1% | |
CH Robinson Worldwide, Inc. | | | | | | | 1,011 | | | | 91,374 | |
Hyundai Glovis Co., Ltd. | | | | | | | 186 | | | | 23,040 | |
| | | | | | | | | | | | |
| | | | | | | | | | | 114,414 | |
| | | | | | | | | | | | |
Airlines – 0.1% | |
Qantas Airways Ltd. | | | | | | | 35,423 | | | | 144,014 | |
United Continental Holdings, Inc.(a) | | | | | | | 1,380 | | | | 121,178 | |
| | | | | | | | | | | | |
| | | | | | | | | | | 265,192 | |
| | | | | | | | | | | | |
| | |
| |
| 20 | AB CONSERVATIVE WEALTH STRATEGY | | abfunds.com |
PORTFOLIO OF INVESTMENTS(continued)
| | | | | | | | | | | | |
| Company | | | | |
Shares | | | U.S. $ Value | |
| |
Building Products – 0.6% | |
Allegion PLC | | | | | | | 7,391 | | | $ | 664,894 | |
Lennox International, Inc. | | | | | | | 92 | | | | 22,563 | |
LIXIL Group Corp. | | | | | | | 3,200 | | | | 43,353 | |
USG Corp. | | | | | | | 6,413 | | | | 276,465 | |
| | | | | | | | | | | | |
| | | | | | | | | | | 1,007,275 | |
| | | | | | | | | | | | |
Commercial Services & Supplies – 0.3% | |
Republic Services, Inc. – Class A | | | | | | | 1,780 | | | | 139,605 | |
Secom Co., Ltd. | | | | | | | 4,900 | | | | 423,847 | |
Toppan Printing Co., Ltd. | | | | | | | 2,800 | | | | 44,601 | |
| | | | | | | | | | | | |
| | | | | | | | | | | 608,053 | |
| | | | | | | | | | | | |
Construction & Engineering – 0.1% | |
Daelim Industrial Co., Ltd. | | | | | | | 303 | | | | 25,179 | |
GS Engineering & Construction Corp. | | | | | | | 672 | | | | 25,556 | |
Obayashi Corp. | | | | | | | 4,900 | | | | 47,762 | |
| | | | | | | | | | | | |
| | | | | | | | | | | 98,497 | |
| | | | | | | | | | | | |
Electrical Equipment – 0.0% | | | | | | | | | | | | |
Emerson Electric Co. | | | | | | | 189 | | | | 12,880 | |
| | | | | | | | | | | | |
|
Industrial Conglomerates – 0.0% | |
SK Holdings Co., Ltd. | | | | | | | 112 | | | | 27,137 | |
| | | | | | | | | | | | |
|
Machinery – 0.6% | |
Dover Corp. | | | | | | | 6,760 | | | | 611,983 | |
Kone Oyj – Class B(c) | | | | | | | 4,740 | | | | 231,589 | |
Mitsubishi Heavy Industries Ltd. | | | | | | | 1,300 | | | | 53,014 | |
PACCAR, Inc. | | | | | | | 1,976 | | | | 133,973 | |
Stanley Black & Decker, Inc. | | | | | | | 966 | | | | 127,927 | |
Weichai Power Co., Ltd. – Class H | | | | | | | 19,000 | | | | 26,453 | |
| | | | | | | | | | | | |
| | | | | | | | | | | 1,184,939 | |
| | | | | | | | | | | | |
Professional Services – 1.0% | |
Experian PLC | | | | | | | 5,310 | | | | 138,138 | |
RELX PLC | | | | | | | 26,381 | | | | 605,561 | |
Robert Half International, Inc. | | | | | | | 1,873 | | | | 127,720 | |
Verisk Analytics, Inc. – Class A(a) | | | | | | | 5,850 | | | | 739,615 | |
Wolters Kluwer NV | | | | | | | 3,140 | | | | 206,915 | |
| | | | | | | | | | | | |
| | | | | | | | | | | 1,817,949 | |
| | | | | | | | | | | | |
Road & Rail – 0.1% | | | | | | | | | | | | |
ALD SA(b) | | | | | | | 7,782 | | | | 112,285 | |
| | | | | | | | | | | | |
|
Transportation Infrastructure – 0.1% | |
Airports of Thailand PCL | | | | | | | 13,000 | | | | 27,846 | |
Flughafen Zurich AG | | | | | | | 950 | | | | 169,134 | |
Zhejiang Expressway Co., Ltd. – Class H | | | | | | | 26,000 | | | | 27,134 | |
| | | | | | | | | | | | |
| | | | | | | | | | | 224,114 | |
| | | | | | | | | | | | |
| | | | | | | | | | | 7,183,522 | |
| | | | | | | | | | | | |
| | |
| |
| abfunds.com | | AB CONSERVATIVE WEALTH STRATEGY | 21 |
PORTFOLIO OF INVESTMENTS(continued)
| | | | | | | | | | | | |
| Company | | | | |
Shares | | | U.S. $ Value | |
| |
Communication Services – 3.8% | |
Diversified Telecommunication Services – 0.6% | |
China Communications Services Corp., Ltd. – Class H | | | | | | | 30,000 | | | $ | 30,181 | |
Elisa Oyj | | | | | | | 1,600 | | | | 67,137 | |
HKT Trust & HKT Ltd. – Class SS | | | | | | | 237,000 | | | | 370,154 | |
LG Uplus Corp. | | | | | | | 1,740 | | | | 23,173 | |
Nippon Telegraph & Telephone Corp. | | | | | | | 6,500 | | | | 280,947 | |
Spark New Zealand Ltd. | | | | | | | 17,594 | | | | 44,664 | |
Telenor ASA | | | | | | | 3,508 | | | | 68,412 | |
TELUS Corp. | | | | | | | 2,990 | | | | 108,608 | |
Verizon Communications, Inc. | | | | | | | 2,412 | | | | 137,291 | |
| | | | | | | | | | | | |
| | | | | | | | | | | 1,130,567 | |
| | | | | | | | | | | | |
Entertainment – 0.3% | |
Daiichikosho Co., Ltd. | | | | | | | 2,100 | | | | 103,761 | |
Live Nation Entertainment, Inc.(a) | | | | | | | 2,160 | | | | 122,170 | |
NCSoft Corp. | | | | | | | 61 | | | | 25,011 | |
Netflix, Inc.(a) | | | | | | | 119 | | | | 42,614 | |
Twenty-First Century Fox, Inc. – Class B | | | | | | | 2,116 | | | | 106,139 | |
Viacom, Inc. – Class B | | | | | | | 4,057 | | | | 118,545 | |
| | | | | | | | | | | | |
| | | | | | | | | | | 518,240 | |
| | | | | | | | | | | | |
Interactive Media & Services – 1.5% | |
Alphabet, Inc. – Class A(a) | | | | | | | 142 | | | | 159,970 | |
Alphabet, Inc. – Class C(a) | | | | | | | 1,527 | | | | 1,710,118 | |
Autohome, Inc. (ADR)(a)(c) | | | | | | | 1,122 | | | | 105,524 | |
Facebook, Inc. – Class A(a) | | | | | | | 4,594 | | | | 741,702 | |
Twitter, Inc.(a) | | | | | | | 580 | | | | 17,852 | |
| | | | | | | | | | | | |
| | | | | | | | | | | 2,735,166 | |
| | | | | | | | | | | | |
Media – 0.6% | |
CBS Corp. – Class B | | | | | | | 2,427 | | | | 121,860 | |
Comcast Corp. – Class A | | | | | | | 5,597 | | | | 216,436 | |
Multichoice Group Ltd.(a) | | | | | | | 2,230 | | | | 16,621 | |
Naspers Ltd. – Class N | | | | | | | 2,230 | | | | 480,942 | |
Omnicom Group, Inc. | | | | | | | 1,904 | | | | 144,133 | |
Quebecor, Inc. – Class B | | | | | | | 6,860 | | | | 166,658 | |
| | | | | | | | | | | | |
| | | | | | | | | | | 1,146,650 | |
| | | | | | | | | | | | |
Wireless Telecommunication Services – 0.8% | |
China Mobile Ltd. | | | | | | | 21,000 | | | | 221,812 | |
DiGi.Com Bhd | | | | | | | 25,500 | | | | 28,470 | |
Globe Telecom, Inc. | | | | | | | 690 | | | | 25,314 | |
KDDI Corp. | | | | | | | 17,300 | | | | 418,136 | |
Millicom International Cellular SA | | | | | | | 1,885 | | | | 113,450 | |
SK Telecom Co., Ltd. | | | | | | | 105 | | | | 24,319 | |
SoftBank Group Corp. | | | | | | | 3,900 | | | | 361,898 | |
Sprint Corp.(a) | | | | | | | 35,240 | | | | 223,774 | |
| | | | | | | | | | | | |
| | | | | | | | | | | 1,417,173 | |
| | | | | | | | | | | | |
| | | | | | | | | | | 6,947,796 | |
| | | | | | | | | | | | |
| | |
| |
| 22 | AB CONSERVATIVE WEALTH STRATEGY | | abfunds.com |
PORTFOLIO OF INVESTMENTS(continued)
| | | | | | | | | | | | |
| Company | | | | |
Shares | | | U.S. $ Value | |
| |
Consumer Staples – 1.9% | |
Beverages – 0.2% | |
Ambev SA | | | | | | | 20,000 | | | $ | 91,743 | |
Coca-Cola Amatil Ltd. | | | | | | | 8,116 | | | | 45,892 | |
PepsiCo, Inc. | | | | | | | 970 | | | | 112,171 | |
Wuliangye Yibin Co., Ltd. – Class A | | | | | | | 13,480 | | | | 143,979 | |
| | | | | | | | | | | | |
| | | | | | | | | | | 393,785 | |
| | | | | | | | | | | | |
Food & Staples Retailing – 0.6% | |
Casino Guichard Perrachon SA(c) | | | | | | | 1,029 | | | | 54,414 | |
Colruyt SA | | | | | | | 653 | | | | 46,575 | |
Dairy Farm International Holdings Ltd. | | | | | | | 3,000 | | | | 26,854 | |
Empire Co., Ltd. – Class A | | | | | | | 2,389 | | | | 55,497 | |
Koninklijke Ahold Delhaize NV | | | | | | | 10,040 | | | | 258,753 | |
Kroger Co. (The) | | | | | | | 4,399 | | | | 129,023 | |
Seven & i Holdings Co., Ltd.(c) | | | | | | | 2,000 | | | | 88,023 | |
Sysco Corp. | | | | | | | 1,890 | | | | 127,670 | |
Walgreens Boots Alliance, Inc. | | | | | | | 1,762 | | | | 125,437 | |
Walmart, Inc. | | | | | | | 2,550 | | | | 252,424 | |
| | | | | | | | | | | | |
| | | | | | | | | | | 1,164,670 | |
| | | | | | | | | | | | |
Food Products – 0.2% | |
Danone SA | | | | | | | 1,649 | | | | 124,548 | |
Marine Harvest ASA(a)(c) | | | | | | | 2,949 | | | | 68,054 | |
Nestle Malaysia Bhd | | | | | | | 800 | | | | 29,073 | |
Salmar ASA | | | | | | | 3,250 | | | | 155,696 | |
| | | | | | | | | | | | |
| | | | | | | | | | | 377,371 | |
| | | | | | | | | | | | |
Household Products – 0.2% | |
Kimberly-Clark Corp. | | | | | | | 119 | | | | 13,903 | |
Procter & Gamble Co. (The) | | | | | | | 4,250 | | | | 418,837 | |
| | | | | | | | | | | | |
| | | | | | | | | | | 432,740 | |
| | | | | | | | | | | | |
Personal Products – 0.2% | |
L’Oreal SA | | | | | | | 832 | | | | 209,838 | |
Unilever PLC | | | | | | | 2,090 | | | | 111,267 | |
| | | | | | | | | | | | |
| | | | | | | | | | | 321,105 | |
| | | | | | | | | | | | |
Tobacco – 0.5% | |
Altria Group, Inc. | | | | | | | 2,621 | | | | 137,367 | |
British American Tobacco PLC | | | | | | | 5,779 | | | | 211,876 | |
Imperial Brands PLC | | | | | | | 4,770 | | | | 158,947 | |
KT&G Corp. | | | | | | | 320 | | | | 29,999 | |
Philip Morris International, Inc. | | | | | | | 3,541 | | | | 307,855 | |
| | | | | | | | | | | | |
| | | | | | | | | | | 846,044 | |
| | | | | | | | | | | | |
| | | | | | | | | | | 3,535,715 | |
| | | | | | | | | | | | |
Energy – 1.3% | |
Energy Equipment & Services – 0.1% | |
Helmerich & Payne, Inc. | | | | | | | 2,135 | | | | 115,717 | |
| | | | | | | | | | | | |
| | |
| |
| abfunds.com | | AB CONSERVATIVE WEALTH STRATEGY | 23 |
PORTFOLIO OF INVESTMENTS(continued)
| | | | | | | | | | | | |
| Company | | | | |
Shares | | | U.S. $ Value | |
| | | | |
Oil, Gas & Consumable Fuels – 1.2% | |
BP PLC | | | | | | | 5,254 | | | $ | 37,247 | |
Chevron Corp. | | | | | | | 893 | | | | 106,785 | |
Encana Corp. | | | | | | | 39,648 | | | | 287,448 | |
Equinor ASA | | | | | | | 6,770 | | | | 152,271 | |
Exxon Mobil Corp. | | | | | | | 585 | | | | 46,233 | |
Galp Energia SGPS SA | | | | | | | 1,693 | | | | 27,758 | |
Gazprom PJSC (Sponsored ADR) | | | | | | | 5,865 | | | | 27,683 | |
GS Holdings Corp. | | | | | | | 570 | | | | 27,145 | |
HollyFrontier Corp. | | | | | | | 1,439 | | | | 73,677 | |
Kinder Morgan, Inc./DE | | | | | | | 6,090 | | | | 116,684 | |
LUKOIL PJSC (Sponsored ADR)(c) | | | | | | | 3,024 | | | | 252,655 | |
Marathon Petroleum Corp. | | | | | | | 1,183 | | | | 73,358 | |
Petroleo Brasileiro SA | | | | | | | 1,500 | | | | 11,924 | |
Phillips 66 | | | | | | | 817 | | | | 78,726 | |
Royal Dutch Shell PLC – Class B | | | | | | | 21,396 | | | | 671,198 | |
TOTAL SA | | | | | | | 2,897 | | | | 164,893 | |
Valero Energy Corp. | | | | | | | 1,064 | | | | 86,780 | |
| | | | | | | | | | | | |
| | | | | | | | | | | 2,242,465 | |
| | | | | | | | | | | | |
| | | | | | | | | | | 2,358,182 | |
| | | | | | | | | | | | |
Materials – 1.1% | |
Chemicals – 0.7% | |
BASF SE | | | | | | | 5,842 | | | | 444,676 | |
CF Industries Holdings, Inc. | | | | | | | 1,434 | | | | 60,515 | |
Covestro AG(b) | | | | | | | 960 | | | | 54,660 | |
Ecolab, Inc. | | | | | | | 2,864 | | | | 483,758 | |
Indorama Ventures PCL | | | | | | | 16,500 | | | | 26,966 | |
Methanex Corp. | | | | | | | 735 | | | | 41,370 | |
Mitsubishi Chemical Holdings Corp. | | | | | | | 5,500 | | | | 40,674 | |
Sinopec Shanghai Petrochemical Co., Ltd. | | | | | | | 35,516 | | | | 29,290 | |
Sinopec Shanghai Petrochemical Co., Ltd. – Class H | | | | | | | 48,000 | | | | 24,336 | |
Sumitomo Chemical Co., Ltd. | | | | | | | 9,000 | | | | 44,750 | |
| | | | | | | | | | | | |
| | | | | | | | | | | 1,250,995 | |
| | | | | | | | | | | | |
Containers & Packaging – 0.1% | |
Bemis Co., Inc. | | | | | | | 5,292 | | | | 279,947 | |
RPC Group PLC | | | | | | | 2,084 | | | | 21,843 | |
| | | | | | | | | | | | |
| | | | | | | | | | | 301,790 | |
| | | | | | | | | | | | |
Metals & Mining – 0.2% | |
BHP Group Ltd. | | | | | | | 1,296 | | | | 34,229 | |
Cia Siderurgica Nacional SA(a) | | | | | | | 9,300 | | | | 32,385 | |
Goldcorp, Inc. | | | | | | | 26,407 | | | | 278,330 | |
Maanshan Iron & Steel Co., Ltd. – Class H | | | | | | | 56,000 | | | | 26,669 | |
| | | | | | | | | | | | |
| | | | | | | | | | | 371,613 | |
| | | | | | | | | | | | |
| | |
| |
| 24 | AB CONSERVATIVE WEALTH STRATEGY | | abfunds.com |
PORTFOLIO OF INVESTMENTS(continued)
| | | | | | | | | | | | |
| Company | | | | |
Shares | | | U.S. $ Value | |
| |
Paper & Forest Products – 0.1% | |
Mondi PLC | | | | | | | 4,252 | | | $ | 97,340 | |
| | | | | | | | | | | | |
| | | | | | | | | | | 2,021,738 | |
| | | | | | | | | | | | |
Utilities – 0.9% | |
Electric Utilities – 0.5% | |
CEZ AS | | | | | | | 1,075 | | | | 26,044 | |
EDP – Energias de Portugal SA | | | | | | | 53,560 | | | | 196,378 | |
Electricite de France SA | | | | | | | 4,137 | | | | 60,062 | |
Enel SpA | | | | | | | 12,909 | | | | 78,063 | |
Exelon Corp. | | | | | | | 2,880 | | | | 139,939 | |
Manila Electric Co. | | | | | | | 3,930 | | | | 27,931 | |
Orsted A/S(b) | | | | | | | 1,012 | | | | 73,455 | |
PPL Corp. | | | | | | | 4,047 | | | | 130,192 | |
Red Electrica Corp. SA | | | | | | | 1,669 | | | | 36,059 | |
Terna Rete Elettrica Nazionale SpA | | | | | | | 10,782 | | | | 67,077 | |
| | | | | | | | | | | | |
| | | | | | | | | | | 835,200 | |
| | | | | | | | | | | | |
Gas Utilities – 0.1% | |
Tokyo Gas Co., Ltd. | | | | | | | 5,200 | | | | 143,348 | |
| | | | | | | | | | | | |
| | | |
Independent Power and Renewable Electricity Producers – 0.1% | | | | | | | | | | | | |
AES Corp./VA | | | | | | | 7,806 | | | | 134,497 | |
| | | | | | | | | | | | |
|
Multi-Utilities – 0.1% | |
Ameren Corp. | | | | | | | 1,730 | | | | 123,245 | |
CenterPoint Energy, Inc. | | | | | | | 4,105 | | | | 123,725 | |
| | | | | | | | | | | | |
| | | | | | | | | | | 246,970 | |
| | | | | | | | | | | | |
Water Utilities – 0.1% | |
Guangdong Investment Ltd. | | | | | | | 98,000 | | | | 187,857 | |
| | | | | | | | | | | | |
| | | | | | | | | | | 1,547,872 | |
| | | | | | | | | | | | |
Real Estate – 0.8% | |
Equity Real Estate Investment Trusts (REITs) – 0.4% | | | | | | | | | | | | |
Fibra Uno Administracion SA de CV | | | | | | | 20,222 | | | | 28,097 | |
Host Hotels & Resorts, Inc. | | | | | | | 6,639 | | | | 130,191 | |
InfraREIT, Inc. | | | | | | | 4,794 | | | | 102,352 | |
Lamar Advertising Co. – Class A | | | | | | | 1,110 | | | | 86,103 | |
Merlin Properties Socimi SA | | | | | | | 14,090 | | | | 182,516 | |
National Retail Properties, Inc. | | | | | | | 974 | | | | 50,745 | |
Nippon Building Fund, Inc. | | | | | | | 33 | | | | 214,875 | |
Stockland | | | | | | | 18,796 | | | | 46,746 | |
| | | | | | | | | | | | |
| | | | | | | | | | | 841,625 | |
| | | | | | | | | | | | |
Real Estate Management & Development – 0.4% | | | | | | | | | | | | |
Agile Group Holdings Ltd. | | | | | | | 20,000 | | | | 24,992 | |
| | |
| |
| abfunds.com | | AB CONSERVATIVE WEALTH STRATEGY | 25 |
PORTFOLIO OF INVESTMENTS(continued)
| | | | | | | | | | | | |
| Company | | | | |
Shares | | | U.S. $ Value | |
| |
Aroundtown SA | | | | | | | 7,333 | | | $ | 61,575 | |
CBRE Group, Inc. – Class A(a) | | | | | | | 6,714 | | | | 334,089 | |
Guangzhou R&F Properties Co., Ltd. – Class H | | | | | | | 14,000 | | | | 26,176 | |
Nomura Real Estate Holdings, Inc. | | | | | | | 2,400 | | | | 45,484 | |
Vonovia SE | | | | | | | 3,750 | | | | 181,505 | |
| | | | | | | | | | | | |
| | | | | | | | | | | 673,821 | |
| | | | | | | | | | | | |
| | | | | | | | | | | 1,515,446 | |
| | | | | | | | | | | | |
Total Common Stocks
(cost $63,956,497) | | | | | | | | | | | 70,348,352 | |
| | | | | | | | | | | | |
| | | | | | | | | | | | |
INVESTMENT COMPANIES – 24.8% | |
Funds and Investment Trusts – 24.8%(d) | |
AB All Market Real Return Portfolio – Class Z(e) | | | | | | | 2,835,419 | | | | 23,874,231 | |
AB High Income Fund, Inc. – Class Z(e) | | | | | | | 2,274,261 | | | | 18,535,223 | |
iShares iBoxx High Yield Corporate Bond ETF(c) | | | | | | | 22,060 | | | | 1,891,645 | |
VanEck Vectors JP Morgan EM Local Currency Bond ETF – Class E | | | | | | | 26,015 | | | | 887,892 | |
| | | | | | | | | | | | |
| | | |
Total Investment Companies
(cost $46,996,954) | | | | | | | | | | | 45,188,991 | |
| | | | | | | | | | | | |
| | | |
| | | | | | Principal
Amount
(000) | | | | |
GOVERNMENTS – TREASURIES – 9.0% | | | | | | | | | | | | |
Australia – 0.7% | | | | | | | | | | | | |
Australia Government Bond
Series 128
5.75%, 7/15/22(b) | | | AUD | | | | 750 | | | | 602,882 | |
Series 138
3.25%, 4/21/29(b) | | | | | | | 750 | | | | 585,384 | |
| | | | | | | | | | | | |
| | | | | | | | | | | 1,188,266 | |
| | | | | | | | | | | | |
| | | |
Austria – 0.2% | | | | | | | | | | | | |
Republic of Austria Government Bond
0.50%, 2/20/29(b) | | | EUR | | | | 359 | | | | 407,185 | |
| | | | | | | | | | | | |
| | | |
Belgium – 0.6% | | | | | | | | | | | | |
Kingdom of Belgium Government Bond
Series 71
3.75%, 6/22/45(b) | | | | | | | 80 | | | | 134,406 | |
Series 72
2.60%, 6/22/24(b) | | | | | | | 262 | | | | 339,097 | |
Series 81
0.80%, 6/22/27(b) | | | | | | | 202 | | | | 236,254 | |
| | |
| |
| 26 | AB CONSERVATIVE WEALTH STRATEGY | | abfunds.com |
PORTFOLIO OF INVESTMENTS(continued)
| | | | | | | | | | |
| | | | | Principal
Amount
(000) | | | U.S. $ Value | |
| |
Series 87
0.90%, 6/22/29(b) | | EUR | | | 123 | | | $ | 142,965 | |
Series 88
1.70%, 6/22/50(b) | | | | | 171 | | | | 194,272 | |
| | | | | | | | | | |
| | | | | | | | | 1,046,994 | |
| | | | | | | | | | |
| | | |
Chile – 0.2% | | | | | | | | | | |
Bonos de la Tesoreria de la Republica en pesos
4.50%, 3/01/26 | | CLP | | | 210,000 | | | | 326,740 | |
| | | | | | | | | | |
| | | |
Finland – 0.2% | | | | | | | | | | |
Finland Government Bond
0.50%, 9/15/29(b) | | EUR | | | 348 | | | | 394,194 | |
| | | | | | | | | | |
| | | |
France – 0.6% | | | | | | | | | | |
French Republic Government Bond OAT
0.50%, 5/25/26(b) | | | | | 745 | | | | 864,517 | |
1.75%, 6/25/39(b) | | | | | 240 | | | | 296,157 | |
| | | | | | | | | | |
| | | | | | | | | 1,160,674 | |
| | | | | | | | | | |
Germany – 0.6% | | | | | | | | | | |
Bundesrepublik Deutschland Bundesanleihe
0.50%, 2/15/28(b) | | | | | 661 | | | | 780,852 | |
2.50%,7/04/44-8/15/46(b) | | | | | 209 | | | | 336,888 | |
| | | | | | | | | | |
| | | | | | | | | 1,117,740 | |
| | | | | | | | | | |
| | | |
Ireland – 0.2% | | | | | | | | | | |
Ireland Government Bond
1.00%, 5/15/26(b) | | EUR | | | 339 | | | | 402,924 | |
| | | | | | | | | | |
| | | |
Italy – 0.9% | | | | | | | | | | |
Italy Buoni Poliennali Del Tesoro
1.35%, 4/15/22 | | | | | 410 | | | | 469,316 | |
1.85%, 5/15/24 | | | | | 95 | | | | 108,107 | |
2.20%, 6/01/27 | | | | | 289 | | | | 321,856 | |
3.35%, 3/01/35(b) | | | | | 153 | | | | 175,126 | |
3.85%, 9/01/49(b) | | | | | 327 | | | | 375,208 | |
5.50%, 11/01/22(b) | | | | | 108 | | | | 140,631 | |
| | | | | | | | | | |
| | | | | | | | | 1,590,244 | |
| | | | | | | | | | |
Japan – 0.5% | | | | | | | | | | |
Japan Government Twenty Year Bond
Series 112
2.10%, 6/20/29 | | JPY | | | 14,450 | | | | 157,770 | |
Series 143
1.60%, 3/20/33 | | | | | 27,400 | | | | 294,464 | |
Series 158
0.50%, 9/20/36 | | | | | 29,000 | | | | 267,196 | |
| | |
| |
| abfunds.com | | AB CONSERVATIVE WEALTH STRATEGY | 27 |
PORTFOLIO OF INVESTMENTS(continued)
| | | | | | | | | | |
| | | | | Principal
Amount
(000) | | | U.S. $ Value | |
| |
Series 159
0.60%, 12/20/36 | | JPY | | | 28,400 | | | $ | 266,132 | |
| | | | | | | | | | |
| | | | | | | | | 985,562 | |
| | | | | | | | | | |
Malaysia – 0.3% | | | | | | | | | | |
Malaysia Government Bond
Series 0114
4.181%, 7/15/24 | | MYR | | | 521 | | | | 130,049 | |
Series 0217
4.059%, 9/30/24 | | | | | 523 | | | | 129,772 | |
Series 0218
3.757%, 4/20/23 | | | | | 948 | | | | 233,489 | |
Series 0313
3.48%, 3/15/23 | | | | | 460 | | | | 111,865 | |
| | | | | | | | | | |
| | | | | | | | | 605,175 | |
| | | | | | | | | | |
| | | |
Netherlands – 0.3% | | | | | | | | | | |
Netherlands Government Bond
0.75%, 7/15/27(b) | | EUR | | | 530 | | | | 631,007 | |
| | | | | | | | | | |
| | | |
Poland – 0.1% | | | | | | | | | | |
Republic of Poland Government Bond
Series 725
3.25%, 7/25/25 | | PLN | | | 496 | | | | 136,320 | |
| | | | | | | | | | |
| | | |
Singapore – 0.2% | | | | | | | | | | |
Singapore Government Bond
2.75%, 3/01/46 | | SGD | | | 330 | | | | 247,350 | |
3.375%, 9/01/33 | | | | | 73 | | | | 59,681 | |
| | | | | | | | | | |
| | | | | | | | | 307,031 | |
| | | | | | | | | | |
Spain – 0.6% | | | | | | | | | | |
Spain Government Bond
1.95%, 4/30/26(b) | | EUR | | | 327 | | | | 402,267 | |
2.35%, 7/30/33(b) | | | | | 565 | | | | 693,455 | |
2.90%, 10/31/46(b) | | | | | 20 | | | | 25,300 | |
| | | | | | | | | | |
| | | | | | | | | 1,121,022 | |
| | | | | | | | | | |
United Kingdom – 0.6% | | | | | | | | | | |
United Kingdom Gilt
1.50%, 7/22/47(b) | | GBP | | | 176 | | | | 217,050 | |
1.625%, 10/22/28(b) | | | | | 585 | | | | 799,324 | |
| | | | | | | | | | |
| | | | | | | | | 1,016,374 | |
| | | | | | | | | | |
United States – 2.2% | | | | | | | | | | |
U.S. Treasury Bonds
2.50%, 2/15/46(f) | | U.S.$ | | | 1,442 | | | | 1,286,215 | |
3.125%, 8/15/44 | | | | | 101 | | | | 101,726 | |
5.375%, 2/15/31 | | | | | 327 | | | | 413,959 | |
| | |
| |
| 28 | AB CONSERVATIVE WEALTH STRATEGY | | abfunds.com |
PORTFOLIO OF INVESTMENTS(continued)
| | | | | | | | | | |
| | | | | Principal
Amount
(000) | | | U.S. $ Value | |
| |
U.S. Treasury Notes
1.50%, 8/15/26 | | U.S.$ | | | 1,275 | | | $ | 1,177,383 | |
1.875%, 7/31/22(f) | | | | | 787 | | | | 770,818 | |
2.125%, 5/15/25 | | | | | 184 | | | | 179,347 | |
| | | | | | | | | | |
| | | | | | | | | 3,929,448 | |
| | | | | | | | | | |
| | | |
Uruguay – 0.0% | | | | | | | | | | |
Uruguay Government International Bond
8.50%, 3/15/28(b) | | UYU | | | 1,317 | | | | 35,496 | |
| | | | | | | | | | |
| | | |
Total Governments – Treasuries
(cost $16,341,133) | | | | | | | | | 16,402,396 | |
| | | | | | | | | | |
| | | | | | | | | | |
CORPORATES – INVESTMENT GRADE – 6.3% | | | | | | | | | | |
Industrial – 3.1% | | | | | | | | | | |
Basic – 0.2% | | | | | | | | | | |
DowDuPont, Inc.
4.205%, 11/15/23 | | U.S.$ | | | 100 | | | | 103,169 | |
Glencore Finance Europe Ltd.
1.875%, 9/13/23(b) | | EUR | | | 100 | | | | 115,869 | |
Glencore Funding LLC
4.00%, 3/27/27(b) | | U.S.$ | | | 62 | | | | 59,030 | |
SABIC Capital II BV
4.00%, 10/10/23(b) | | | | | 200 | | | | 202,624 | |
| | | | | | | | | | |
| | | | | | | | | 480,692 | |
| | | | | | | | | | |
Capital Goods – 0.3% | | | | | | | | | | |
Molex Electronic Technologies LLC
2.878%, 4/15/20(b) | | | | | 230 | | | | 228,634 | |
United Technologies Corp.
1.15%, 5/18/24 | | EUR | | | 115 | | | | 131,993 | |
1.25%, 5/22/23 | | | | | 125 | | | | 144,998 | |
Wabtec Corp.
4.15%, 3/15/24(g) | | U.S.$ | | | 37 | | | | 36,925 | |
| | | | | | | | | | |
| | | | | | | | | 542,550 | |
| | | | | | | | | | |
Communications - Media – 0.2% | | | | | | | | | | |
CBS Corp.
4.00%, 1/15/26 | | | | | 9 | | | | 8,925 | |
4.20%, 6/01/29 | | | | | 69 | | | | 67,898 | |
5.50%, 5/15/33 | | | | | 40 | | | | 42,563 | |
Charter Communications Operating LLC/Charter Communications Operating Capital
4.908%, 7/23/25 | | | | | 78 | | | | 80,757 | |
Comcast Corp.
4.60%, 8/15/45 | | | | | 45 | | | | 45,757 | |
| | |
| |
| abfunds.com | | AB CONSERVATIVE WEALTH STRATEGY | 29 |
PORTFOLIO OF INVESTMENTS(continued)
| | | | | | | | | | |
| | | | | Principal
Amount
(000) | | | U.S. $ Value | |
| |
Warner Media LLC
3.55%, 6/01/24 | | U.S.$ | | | 115 | | | $ | 114,508 | |
| | | | | | | | | | |
| | | | | | | | | 360,408 | |
| | | | | | | | | | |
Communications - Telecommunications – 0.1% | | | | | | | | | | |
Bell Canada, Inc.
4.70%, 9/11/23 | | CAD | | | 52 | | | | 42,224 | |
Rogers Communications, Inc.
4.00%, 6/06/22 | | | | | 66 | | | | 52,019 | |
| | | | | | | | | | |
| | | | | | | | | 94,243 | |
| | | | | | | | | | |
Consumer Cyclical - Automotive – 0.3% | | | | | | | | | | |
BMW Finance NV
1.00%, 11/14/24(b) | | EUR | | | 105 | | | | 120,137 | |
Daimler AG
1.00%, 11/15/27(b) | | | | | 90 | | | | 97,354 | |
General Motors Co.
5.15%, 4/01/38 | | U.S.$ | | | 60 | | | | 53,799 | |
General Motors Financial Co., Inc.
3.70%, 5/09/23 | | | | | 25 | | | | 24,609 | |
5.10%, 1/17/24 | | | | | 120 | | | | 122,680 | |
Harley-Davidson Financial Services, Inc.
4.05%, 2/04/22(b) | | | | | 115 | | | | 115,293 | |
Volkswagen Leasing GmbH
2.625%, 1/15/24(b) | | EUR | | | 60 | | | | 71,908 | |
| | | | | | | | | | |
| | | | | | | | | 605,780 | |
| | | | | | | | | | |
| | | |
Consumer Cyclical - Entertainment – 0.1% | | | | | | | | | | |
Carnival Corp.
1.625%, 2/22/21 | | | | | 242 | | | | 283,055 | |
| | | | | | | | | | |
| | | |
ConsumerNon-Cyclical – 0.7% | | | | | | | | | | |
Abbott Ireland Financing DAC
0.875%, 9/27/23(b) | | | | | 105 | | | | 120,256 | |
Altria Group, Inc.
1.00%, 2/15/23 | | | | | 150 | | | | 170,327 | |
Amgen, Inc.
4.663%, 6/15/51 | | U.S.$ | | | 100 | | | | 95,732 | |
BAT Capital Corp.
3.222%, 8/15/24 | | | | | 120 | | | | 115,306 | |
CVS Health Corp.
4.30%, 3/25/28 | | | | | 90 | | | | 90,033 | |
Reynolds American, Inc.
4.45%, 6/12/25 | | | | | 72 | | | | 72,673 | |
6.875%, 5/01/20 | | | | | 97 | | | | 100,863 | |
Takeda Pharmaceutical Co., Ltd.
1.125%, 11/21/22(b) | | EUR | | | 155 | | | | 178,501 | |
| | |
| |
| 30 | AB CONSERVATIVE WEALTH STRATEGY | | abfunds.com |
PORTFOLIO OF INVESTMENTS(continued)
| | | | | | | | | | |
| | | | | Principal
Amount
(000) | | | U.S. $ Value | |
| |
4.40%, 11/26/23(b) | | U.S.$ | | | 200 | | | $ | 206,512 | |
Tyson Foods, Inc.
4.00%, 3/01/26 | | | | | 35 | | | | 35,098 | |
4.35%, 3/01/29 | | | | | 38 | | | | 38,265 | |
4.55%, 6/02/47 | | | | | 45 | | | | 40,252 | |
| | | | | | | | | | |
| | | | | | | | | 1,263,818 | |
| | | | | | | | | | |
Energy – 0.3% | | | | | | | | | | |
Energy Transfer Operating LP
4.50%, 4/15/24(c) | | | | | 55 | | | | 56,578 | |
Hess Corp.
4.30%, 4/01/27 | | | | | 78 | | | | 75,441 | |
Marathon Petroleum Corp.
4.75%,12/15/23-9/15/44(b) | | | | | 155 | | | | 157,335 | |
Occidental Petroleum Corp.
4.20%, 3/15/48 | | | | | 45 | | | | 45,139 | |
Plains All American Pipeline LP/PAA Finance Corp.
3.60%, 11/01/24 | | | | | 103 | | | | 100,442 | |
Williams Cos., Inc. (The)
3.90%, 1/15/25 | | | | | 78 | | | | 78,405 | |
4.50%, 11/15/23 | | | | | 35 | | | | 36,158 | |
| | | | | | | | | | |
| | | | | | | | | 549,498 | |
| | | | | | | | | | |
| | | |
Services – 0.1% | | | | | | | | | | |
Equifax, Inc.
3.30%, 12/15/22 | | | | | 160 | | | | 157,984 | |
| | | | | | | | | | |
| | | |
Technology – 0.6% | | | | | | | | | | |
Apple, Inc.
2.513%, 8/19/24 | | CAD | | | 120 | | | | 90,250 | |
4.65%, 2/23/46 | | U.S.$ | | | 40 | | | | 43,035 | |
Broadcom Corp./Broadcom Cayman Finance Ltd.
3.625%, 1/15/24 | | | | | 31 | | | | 30,110 | |
3.875%, 1/15/27 | | | | | 33 | | | | 30,572 | |
Fidelity National Information Services, Inc.
0.40%, 1/15/21 | | EUR | | | 135 | | | | 153,923 | |
International Business Machines Corp.
0.875%, 1/31/25 | | | | | 165 | | | | 188,582 | |
KLA-Tencor Corp.
4.125%, 11/01/21 | | U.S.$ | | | 145 | | | | 147,591 | |
4.65%, 11/01/24 | | | | | 91 | | | | 95,270 | |
Seagate HDD Cayman
4.75%, 1/01/25 | | | | | 72 | | | | 69,326 | |
Tencent Holdings Ltd.
3.375%, 5/02/19(b) | | | | | 200 | | | | 200,097 | |
| | | | | | | | | | |
| | | | | | | | | 1,048,756 | |
| | | | | | | | | | |
| | |
| |
| abfunds.com | | AB CONSERVATIVE WEALTH STRATEGY | 31 |
PORTFOLIO OF INVESTMENTS(continued)
| | | | | | | | | | | | |
| | | | | | Principal
Amount
(000) | | | U.S. $ Value | |
| |
Transportation - Services – 0.2% | | | | | | | | | | | | |
FedEx Corp.
0.70%, 5/13/22 | | | EUR | | | | 145 | | | $ | 166,223 | |
Penske Truck Leasing Co. Lp/PTL Finance Corp.
3.375%, 2/01/22(b) | | | U.S.$ | | | | 146 | | | | 144,863 | |
| | | | | | | | | | | | |
| | | | | | | | | | | 311,086 | |
| | | | | | | | | | | | |
| | | | | | | | | | | 5,697,870 | |
| | | | | | | | | | | | |
Financial Institutions – 2.9% | | | | | | | | | | | | |
Banking – 2.0% | | | | | | | | | | | | |
Banco Santander SA
3.25%, 4/04/26(b) | | | EUR | | | | 100 | | | | 121,137 | |
Bank of America Corp.
1.379%, 2/07/25(b) | | | | | | | 105 | | | | 122,239 | |
2.375%, 6/19/24(b) | | | | | | | 100 | | | | 123,061 | |
3.124%, 1/20/23 | | | U.S.$ | | | | 115 | | | | 114,496 | |
Barclays Bank PLC
6.625%, 3/30/22(b) | | | EUR | | | | 83 | | | | 108,325 | |
Barclays PLC
3.684%, 1/10/23 | | | U.S.$ | | | | 200 | | | | 197,988 | |
Citigroup, Inc.
0.75%, 10/26/23(b) | | | EUR | | | | 104 | | | | 118,607 | |
Compass Bank
5.50%, 4/01/20 | | | U.S.$ | | | | 147 | | | | 150,187 | |
Cooperatieve Rabobank UA
4.375%, 8/04/25 | | | | | | | 250 | | | | 254,985 | |
Danske Bank A/S
0.875%, 5/22/23(b) | | | EUR | | | | 160 | | | | 177,040 | |
Fifth Third Bancorp
2.30%, 3/01/19 | | | U.S.$ | | | | 64 | | | | 64,000 | |
Goldman Sachs Group, Inc. (The)
2.00%, 7/27/23(b) | | | EUR | | | | 98 | | | | 116,613 | |
3.307%, 10/31/25 | | | CAD | | | | 145 | | | | 108,858 | |
Lloyds Banking Group PLC
4.375%, 3/22/28 | | | U.S.$ | | | | 265 | | | | 265,082 | |
Mitsubishi UFJ Financial Group, Inc.
0.872%, 9/07/24(b) | | | EUR | | | | 100 | | | | 114,191 | |
Morgan Stanley
3.00%, 2/07/24 | | | CAD | | | | 145 | | | | 109,388 | |
Series G
1.375%, 10/27/26 | | | EUR | | | | 111 | | | | 125,891 | |
1.75%, 3/11/24 | | | | | | | 100 | | | | 118,205 | |
Rabobank Capital Funding Trust IV
5.556%, 12/31/19(b)(h) | | | GBP | | | | 36 | | | | 49,073 | |
Santander Holdings USA, Inc.
4.40%, 7/13/27 | | | U.S.$ | | | | 118 | | | | 115,238 | |
| | |
| |
| 32 | AB CONSERVATIVE WEALTH STRATEGY | | abfunds.com |
PORTFOLIO OF INVESTMENTS(continued)
| | | | | | | | | | | | |
| | | | | | Principal
Amount
(000) | | | U.S. $ Value | |
| |
UBS Group Funding Switzerland AG
1.50%, 11/30/24(b) | | | EUR | | | | 200 | | | $ | 232,146 | |
UniCredit SpA
3.75%, 4/12/22(b) | | | U.S.$ | | | | 200 | | | | 195,322 | |
US Bancorp
0.85%, 6/07/24 | | | EUR | | | | 103 | | | | 118,145 | |
Series J
5.30%, 4/15/27(h) | | | U.S.$ | | | | 46 | | | | 46,108 | |
Wells Fargo & Co.
1.375%, 6/30/22(b) | | | GBP | | | | 170 | | | | 221,364 | |
2.125%, 6/04/24(b) | | | EUR | | | | 100 | | | | 121,765 | |
| | | | | | | | | | | | |
| | | | | | | | | | | 3,609,454 | |
| | | | | | | | | | | | |
| | | |
Brokerage – 0.1% | | | | | | | | | | | | |
SURA Asset Management SA
4.875%, 4/17/24(b)(c) | | | U.S.$ | | | | 107 | | | | 110,076 | |
| | | | | | | | | | | | |
| | | |
Finance – 0.0% | | | | | | | | | | | | |
Synchrony Financial
4.50%, 7/23/25 | | | | | | | 93 | | | | 90,968 | |
| | | | | | | | | | | | |
| | | |
Insurance – 0.7% | | | | | | | | | | | | |
Aon PLC
2.875%, 5/14/26 | | | EUR | | | | 135 | | | | 165,934 | |
Berkshire Hathaway, Inc.
1.125%, 3/16/27 | | | | | | | 140 | | | | 160,053 | |
Chubb INA Holdings, Inc.
1.55%, 3/15/28 | | | | | | | 100 | | | | 115,764 | |
CNP Assurances
4.25%, 6/05/45(b) | | | | | | | 100 | | | | 126,267 | |
Credit Agricole Assurances SA
4.75%, 9/27/48(b) | | | | | | | 100 | | | | 124,835 | |
Massachusetts Mutual Life Insurance Co.
8.875%, 6/01/39(b) | | | U.S.$ | | | | 21 | | | | 31,691 | |
Muenchener Rueckversicherungs-Gesellschaft AG in Muenchen
3.25%, 5/26/49(b) | | | EUR | | | | 100 | | | | 121,293 | |
6.25%, 5/26/42(b) | | | | | | | 100 | | | | 133,394 | |
Nationwide Mutual Insurance Co.
9.375%, 8/15/39(b) | | | U.S.$ | | | | 41 | | | | 62,978 | |
Prudential Financial, Inc.
5.625%, 6/15/43 | | | | | | | 98 | | | | 101,651 | |
Swiss Re America Holding Corp.
7.00%, 2/15/26 | | | | | | | 77 | | | | 90,714 | |
UnitedHealth Group, Inc.
4.75%, 7/15/45 | | | | | | | 40 | | | | 43,469 | |
| | | | | | | | | | | | |
| | | | | | | | | | | 1,278,043 | |
| | | | | | | | | | | | |
| | |
| |
| abfunds.com | | AB CONSERVATIVE WEALTH STRATEGY | 33 |
PORTFOLIO OF INVESTMENTS(continued)
| | | | | | | | | | | | |
| | | | | | Principal
Amount
(000) | | | U.S. $ Value | |
| |
REITS – 0.1% | | | | | | | | | | | | |
Healthcare Trust of America Holdings LP
3.375%, 7/15/21 | | | U.S.$ | | | | 47 | | | $ | 46,701 | |
Welltower, Inc.
4.00%, 6/01/25 | | | | | | | 171 | | | | 172,524 | |
| | | | | | | | | | | | |
| | | | | | | | | | | 219,225 | |
| | | | | | | | | | | | |
| | | | | | | | | | | 5,307,766 | |
| | | | | | | | | | | | |
Utility – 0.3% | | | | | | | | | | | | |
Electric – 0.1% | | | | | | | | | | | | |
Exelon Corp.
5.15%, 12/01/20 | | | | | | | 32 | | | | 32,843 | |
Iberdrola Finanzas SA
7.375%, 1/29/24 | | | GBP | | | | 50 | | | | 82,192 | |
TECO Finance, Inc.
5.15%, 3/15/20 | | | U.S.$ | | | | 56 | | | | 57,148 | |
| | | | | | | | | | | | |
| | | | | | | | | | | 172,183 | |
| | | | | | | | | | | | |
Other Utility – 0.2% | | | | | | | | | | | | |
Severn Trent Utilities Finance PLC
3.625%, 1/16/26(b) | | | GBP | | | | 150 | | | | 213,452 | |
Yorkshire Water Finance PLC
6.588%, 2/21/23 | | | | | | | 80 | | | | 125,267 | |
| | | | | | | | | | | | |
| | | | | | | | | | | 338,719 | |
| | | | | | | | | | | | |
| | | | | | | | | | | 510,902 | |
| | | | | | | | | | | | |
Total Corporates – Investment Grade
(cost $11,553,723) | | | | | | | | | | | 11,516,538 | |
| | | | | | | | | | | | |
| | | | | | | | | | | | |
| INFLATION-LINKED SECURITIES – 5.0% | | | | | | | | | | | | |
Japan – 4.4% | | | | | | | | | | | | |
Japanese Government CPI Linked Bond
Series 21
0.10%, 3/10/26 | | | JPY | | | | 124,899 | | | | 1,158,753 | |
Series 22
0.10%, 3/10/27 | | | | | | | 612,077 | | | | 5,677,854 | |
Series 23
0.10%, 3/10/28 | | | | | | | 120,818 | | | | 1,122,046 | |
| | | | | | | | | | | | |
| | | | | | | | | | | 7,958,653 | |
| | | | | | | | | | | | |
New Zealand – 0.1% | | | | | | | | | | | | |
New Zealand Government Inflation Linked Bond
Series 925
2.00%, 9/20/25(b) | | | NZD | | | | 195 | | | | 141,558 | |
| | | | | | | | | | | | |
| | |
| |
| 34 | AB CONSERVATIVE WEALTH STRATEGY | | abfunds.com |
PORTFOLIO OF INVESTMENTS(continued)
| | | | | | | | | | | | |
| | | | | | Principal
Amount
(000) | | | U.S. $ Value | |
| |
United States – 0.5% | | | | | | | | | | | | |
U.S. Treasury Inflation Index
0.125%,7/15/22-7/15/26 (TIPS) | | | U.S.$ | | | | 1,041 | | | $ | 1,017,641 | |
| | | | | | | | | | | | |
| | | |
Total Inflation-Linked Securities
(cost $9,230,144) | | | | | | | | | | | 9,117,852 | |
| | | | | | | | | | | | |
| | | | | | | | | | | | |
MORTGAGE PASS-THROUGHS – 3.6% | | | | | | | | | | | | |
Agency Fixed Rate30-Year – 3.4% | | | | | | | | | | | | |
Federal Home Loan Mortgage Corp.
Series 2019
4.50%, 3/01/49, TBA | | | | | | | 890 | | | | 922,089 | |
Federal Home Loan Mortgage Corp. Gold
Series 2007
5.50%, 7/01/35 | | | | | | | 32 | | | | 34,303 | |
Series 2018
4.00%, 12/01/48 | | | | | | | 229 | | | | 235,217 | |
4.50%, 11/01/48 | | | | | | | 240 | | | | 252,217 | |
Series 2019
4.50%, 2/01/49 | | | | | | | 180 | | | | 188,975 | |
Federal National Mortgage Association
Series 2003
5.50%, 4/01/33 | | | | | | | 25 | | | | 26,864 | |
Series 2004
5.50%,4/01/34-5/01/34 | | | | | | | 24 | | | | 26,008 | |
Series 2005
5.50%, 2/01/35 | | | | | | | 18 | | | | 19,258 | |
Series 2018
3.50%,3/01/48-4/01/48 | | | | | | | 1,140 | | | | 1,144,479 | |
4.00%,8/01/48-9/01/48 | | | | | | | 691 | | | | 709,111 | |
4.50%, 9/01/48 | | | | | | | 894 | | | | 935,683 | |
Series 2019
4.50%, 3/01/49, TBA | | | | | | | 906 | | | | 937,569 | |
5.00%, 3/01/49, TBA | | | | | | | 710 | | | | 744,502 | |
| | | | | | | | | | | | |
| | | | | | | | | | | 6,176,275 | |
| | | | | | | | | | | | |
Other Agency Fixed Rate Programs – 0.2% | | | | | | | | | | | | |
Canadian Mortgage Pools
6.125%, 12/15/24 | | | CAD | | | | 295 | | | | 257,595 | |
| | | | | | | | | | | | |
| | | |
Agency ARMs – 0.0% | | | | | | | | | | | | |
Federal Home Loan Mortgage Corp.
Series 2011
4.324% (LIBOR 12 Month + 1.76%), 5/01/38(i) | | | U.S.$ | | | | 38 | | | | 39,433 | |
| | |
| |
| abfunds.com | | AB CONSERVATIVE WEALTH STRATEGY | 35 |
PORTFOLIO OF INVESTMENTS(continued)
| | | | | | | | | | | | |
| | | | | | Principal
Amount
(000) | | | U.S. $ Value | |
| |
Federal National Mortgage Association
Series 2003
4.81% (LIBOR 12 Month + 1.81%), 12/01/33(i) | | | U.S.$ | | | | 23 | | | $ | 23,981 | |
| | | | | | | | | | | | |
| | | | | | | | | | | 63,414 | |
| | | | | | | | | | | | |
Total Mortgage Pass-Throughs
(cost $6,472,924) | | | | | | | | | | | 6,497,284 | |
| | | | | | | | | | | | |
| | | | | | | | | | | | |
| COVERED BONDS – 1.4% | | | | | | | | | | | | |
Banco de Sabadell SA
0.875%, 11/12/21(b) | | | EUR | | | | 100 | | | | 116,332 | |
Bank of Montreal
0.75%, 9/21/22(b) | | | | | | | 170 | | | | 198,061 | |
Canadian Imperial Bank of Commerce
Zero Coupon, 7/25/22(b) | | | | | | | 177 | | | | 201,004 | |
Credit Suisse AG/Guernsey
0.75%, 9/17/21(b) | | | | | | | 110 | | | | 127,641 | |
1.75%, 1/15/21(b) | | | | | | | 166 | | | | 195,452 | |
Danske Bank A/S
0.125%, 2/14/22(b) | | | | | | | 100 | | | | 114,142 | |
1.25%, 6/11/21(b) | | | | | | | 100 | | | | 117,231 | |
DNB Boligkreditt AS
2.75%, 3/21/22(b) | | | | | | | 160 | | | | 197,385 | |
3.875%, 6/16/21(b) | | | | | | | 147 | | | | 182,498 | |
Nationwide Building Society
4.375%, 2/28/22(b) | | | | | | | 150 | | | | 192,613 | |
Santander UK PLC
1.625%, 11/26/20(b) | | | | | | | 156 | | | | 182,803 | |
Stadshypotek AB
0.625%, 11/10/21(b) | | | | | | | 305 | | | | 353,711 | |
UBS AG/London
1.375%, 4/16/21(b) | | | | | | | 169 | | | | 198,301 | |
4.00%, 4/08/22(b) | | | | | | | 84 | | | | 107,266 | |
| | | | | | | | | | | | |
| | | |
Total Covered Bonds
(cost $2,400,831) | | | | | | | | | | | 2,484,440 | |
| | | | | | | | | | | | |
| | | | | | | | | | | | |
COMMERCIAL MORTGAGE-BACKED SECURITIES – 0.9% | | | | | | | | | | | | |
Non-Agency Floating Rate CMBS – 0.6% | | | | | | | | | | | | |
Ashford Hospitality Trust
Series 2018-ASHF, Class A
3.389% (LIBOR 1 Month + 0.90%), 4/15/35(b)(i) | | | U.S.$ | | | | 177 | | | | 175,549 | |
Series 2018-KEYS, Class A
3.489% (LIBOR 1 Month + 1.00%), 5/15/35(b)(i) | | | | | | | 100 | | | | 99,936 | |
| | |
| |
| 36 | AB CONSERVATIVE WEALTH STRATEGY | | abfunds.com |
PORTFOLIO OF INVESTMENTS(continued)
| | | | | | | | | | | | |
| | | | | | Principal
Amount
(000) | | | U.S. $ Value | |
| |
BHMS
Series 2018-ATLS, Class A
3.739% (LIBOR 1 Month + 1.25%), 7/15/35(b)(i) | | | U.S.$ | | | | 140 | | | $ | 139,784 | |
Braemar Hotels & Resorts Trust
Series 2018-PRME, Class A
3.309% (LIBOR 1 Month + 0.82%), 6/15/35(b)(i) | | | | | | | 100 | | | | 98,784 | |
DBWF Mortgage Trust
Series 2018-GLKS, Class A
3.51% (LIBOR 1 Month + 1.03%), 11/19/35(b)(i) | | | | | | | 140 | | | | 139,825 | |
Invitation Homes Trust
Series 2018-SFR4, Class A
3.581% (LIBOR 1 Month + 1.10%), 1/17/38(b)(i) | | | | | | | 175 | | | | 174,647 | |
MSCG Trust
Series 2018-SELF, Class A
3.389% (LIBOR 1 Month + 0.90%), 10/15/37(b)(i) | | | | | | | 150 | | | | 149,530 | |
Natixis Commercial Mortgage Securities Trust
Series 2018-850T, Class A
3.272% (LIBOR 1 Month + 0.78%), 7/15/33(b)(i) | | | | | | | 110 | | | | 109,720 | |
RETL
Series2018-RVP, Class A
3.589% (LIBOR 1 Month + 1.10%), 3/15/33(b)(i) | | | | | | | 63 | | | | 62,902 | |
| | | | | | | | | | | | |
| | | | | | | | | | | 1,150,677 | |
| | | | | | | | | | | | |
Non-Agency Fixed Rate CMBS – 0.3% | | | | | | | | | | | | |
Citigroup Commercial Mortgage Trust
Series 2013-GC11, Class B
3.732%, 4/10/46(j) | | | | | | | 160 | | | | 160,009 | |
GS Mortgage Securities Trust
Series2013-G1, Class A1
2.059%, 4/10/31(b) | | | | | | | 65 | | | | 63,766 | |
Series2013-G1, Class A2
3.557%, 4/10/31(b) | | | | | | | 134 | | | | 133,413 | |
WFRBS Commercial Mortgage Trust
Series2014-C20, Class AS
4.176%, 5/15/47 | | | | | | | 120 | | | | 123,310 | |
| | | | | | | | | | | | |
| | | | | | | | | | | 480,498 | |
| | | | | | | | | | | | |
Total Commercial Mortgage-Backed Securities
(cost $1,631,367) | | | | | | | | | | | 1,631,175 | |
| | | | | | | | | | | | |
| | |
| |
| abfunds.com | | AB CONSERVATIVE WEALTH STRATEGY | 37 |
PORTFOLIO OF INVESTMENTS(continued)
| | | | | | | | | | | | |
| | | | | | Principal
Amount
(000) | | | U.S. $ Value | |
| |
COLLATERALIZED MORTGAGE OBLIGATIONS – 0.7% | | | | | | | | | | | | |
Risk Share Floating Rate – 0.7% | | | | | | | | | | | | |
Bellemeade Re Ltd.
Series2018-2A, Class M1B
3.84% (LIBOR 1 Month + 1.35%), 8/25/28(b)(i) | | | U.S.$ | | | | 150 | | | $ | 149,628 | |
Eagle RE Ltd.
Series2018-1, Class M1
4.19% (LIBOR 1 Month + 1.70%), 11/25/28(b)(i) | | | | | | | 175 | | | | 175,397 | |
Federal Home Loan Mortgage Corp. Structured Agency Credit Risk Debt Notes
Series2014-DN1, Class M2
4.69% (LIBOR 1 Month + 2.20%), 2/25/24(i) | | | | | | | 151 | | | | 153,133 | |
Series 2015-DNA2, Class M2
5.09% (LIBOR 1 Month + 2.60%), 12/25/27(i) | | | | | | | 72 | | | | 72,943 | |
Series 2016-DNA2, Class M2
4.69% (LIBOR 1 Month + 2.20%), 10/25/28(i) | | | | | | | 91 | | | | 91,981 | |
Series 2017-DNA2, Class M1
3.69% (LIBOR 1 Month + 1.20%), 10/25/29(i) | | | | | | | 211 | | | | 212,492 | |
Federal National Mortgage Association Connecticut Avenue Securities
Series2014-C01, Class M1
4.09% (LIBOR 1 Month + 1.60%), 1/25/24(i) | | | | | | | 15 | | | | 15,460 | |
Series2014-C04, Class 2M2
7.49% (LIBOR 1 Month + 5.00%), 11/25/24(i) | | | | | | | 108 | | | | 120,452 | |
Series2016-C02, Class 1M1
4.64% (LIBOR 1 Month + 2.15%), 9/25/28(i) | | | | | | | 1 | | | | 1,214 | |
Series2016-C03, Class 1M1
4.49% (LIBOR 1 Month + 2.00%), 10/25/28(i) | | | | | | | 26 | | | | 25,972 | |
Series2016-C04, Class 1M1
3.94% (LIBOR 1 Month + 1.45%), 1/25/29(i) | | | | | | | 33 | | | | 33,316 | |
Series2016-C05, Class 2M1
3.84% (LIBOR 1 Month + 1.35%), 1/25/29(i) | | | | | | | 9 | | | | 9,456 | |
Series2016-C06, Class 1M1
3.79% (LIBOR
1 Month + 1.30%), 4/25/29(i) | | | | | | | 151 | | | | 151,402 | |
| | |
| |
| 38 | AB CONSERVATIVE WEALTH STRATEGY | | abfunds.com |
PORTFOLIO OF INVESTMENTS(continued)
| | | | | | | | | | | | |
| | | | | | Principal
Amount
(000) | | | U.S. $ Value | |
| |
Series2016-C07, Class 2M1
3.79% (LIBOR 1 Month + 1.30%), 5/25/29(i) | | U.S.$ | | | | | 11 | | | $ | 10,943 | |
Series2017-C02, Class 2M1
3.64% (LIBOR 1 Month + 1.15%), 9/25/29(i) | | | | | | | 58 | | | | 58,476 | |
| | | | | | | | | | | | |
| | | | | | | | | | | 1,282,265 | |
| | | | | | | | | | | | |
| | | |
Agency Fixed Rate – 0.0% | | | | | | | | | | | | |
Federal National Mortgage Association Grantor Trust
Series2004-T5, Class AB4
3.152%, 5/28/35(j) | | | | | | | 33 | | | | 30,342 | |
| | | | | | | | | | | | |
| | | |
Non-Agency Fixed Rate – 0.0% | | | | | | | | | | | | |
Citigroup Mortgage Loan Trust, Inc.
Series2005-2, Class 1A4
3.934%, 5/25/35 | | | | | | | 28 | | | | 28,655 | |
| | | | | | | | | | | | |
| | | |
Total Collateralized Mortgage Obligations
(cost $1,337,239) | | | | | | | | | | | 1,341,262 | |
| | | | | | | | | | | | |
| | | | | | | | | | | | |
COLLATERALIZED LOAN OBLIGATIONS – 0.7% | | | | | | | | | | | | |
CLO - Floating Rate – 0.7% | | | | | | | | | | | | |
Halcyon Loan Advisors Funding Ltd.
Series2018-1A, Class A2
4.269% (LIBOR 3 Month + 1.80%),
7/21/31(b)(i)(j) | | | | | | | 250 | | | | 245,863 | |
Marble Point CLO XI Ltd.
Series2017-2A, Class A
3.96% (LIBOR 3 Month + 1.18%),
12/18/30(b)(i)(j) | | | | | | | 250 | | | | 247,557 | |
Neuberger Berman Loan Advisers CLO Ltd.
Series2018-29A, Class B1
4.286% (LIBOR 3 Month + 1.70%), 10/19/31(b)(i)(j) | | | | | | | 250 | | | | 246,596 | |
Rockford Tower CLO Ltd.
Series2017-3A, Class A
3.951% (LIBOR 3 Month + 1.19%), 10/20/30(b)(i)(j) | | | | | | | 250 | | | | 248,895 | |
TIAA CLO II Ltd.
Series2017-1A, Class A
4.041% (LIBOR 3 Month + 1.28%),
4/20/29(b)(i)(j) | | | | | | | 250 | | | | 249,127 | |
| | | | | | | | | | | | |
| | | |
Total Collateralized Loan Obligations
(cost $1,249,922) | | | | | | | | | | | 1,238,038 | |
| | | | | | | | | | | | |
| | |
| |
| abfunds.com | | AB CONSERVATIVE WEALTH STRATEGY | 39 |
PORTFOLIO OF INVESTMENTS(continued)
| | | | | | | | | | | | |
| | | | | | Principal
Amount
(000) | | | U.S. $ Value | |
| |
ASSET-BACKED SECURITIES – 0.6% | | | | | | | | | | | | |
Autos - Fixed Rate – 0.4% | | | | | | | | | | | | |
Avis Budget Rental Car Funding AESOP LLC
Series2018-2A, Class C
4.95%, 3/20/25(b) | | U.S.$ | | | | | 120 | | | $ | 123,340 | |
DT Auto Owner Trust
Series2018-1A, Class A
2.59%, 5/17/21(b) | | | | | | | 8 | | | | 8,294 | |
Flagship Credit Auto Trust
Series2018-3, Class D
4.15%, 12/16/24(b) | | | | | | | 78 | | | | 78,619 | |
Hertz Vehicle Financing II LP
Series2016-1A, Class A
2.32%, 3/25/20(b) | | | | | | | 166 | | | | 165,940 | |
Series2017-1A, Class A
2.96%, 10/25/21(b) | | | | | | | 140 | | | | 139,154 | |
Series2019-1A, Class B
4.10%, 3/25/23(b) | | | | | | | 165 | | | | 165,573 | |
| | | | | | | | | | | | |
| | | | | | | | | | | 680,920 | |
| | | | | | | | | | | | |
Other ABS - Fixed Rate – 0.2% | | | | | | | | | | | | |
SBA Tower Trust
Series2014-1A, Class C
2.898%, 10/15/44(b)(j) | | | | | | | 104 | | | | 103,946 | |
Series2014-2A, Class C
3.869%, 10/15/49(b)(j) | | | | | | | 85 | | | | 85,802 | |
SoFi Consumer Loan Program LLC
Series2017-2, Class A
3.28%, 2/25/26(b)(j) | | | | | | | 54 | | | | 53,800 | |
SoFi Consumer Loan Program Trust
Series2018-1, Class B
3.65%, 2/25/27(b)(j) | | | | | | | 115 | | | | 114,898 | |
| | | | | | | | | | | | |
| | | | | | | | | | | 358,446 | |
| | | | | | | | | | | | |
Home Equity Loans - Floating Rate – 0.0% | | | | | | | | | | | | |
ABFC Trust
Series2003-WF1, Class A2
3.615% (LIBOR 1 Month + 1.13%), 12/25/32(i)(j) | | | | | | | 12 | | | | 12,252 | |
| | | | | | | | | | | | |
| | | |
Total Asset-Backed Securities
(cost $1,044,899) | | | | | | | | | | | 1,051,618 | |
| | | | | | | | | | | | |
| | | | | | | | | | | | |
| | |
| |
| 40 | AB CONSERVATIVE WEALTH STRATEGY | | abfunds.com |
PORTFOLIO OF INVESTMENTS(continued)
| | | | | | | | | | | | |
| | | | | | Principal
Amount
(000) | | | U.S. $ Value | |
| |
GOVERNMENTS – SOVEREIGN BONDS – 0.5% | | | | | | | | | | | | |
Indonesia – 0.1% | | | | | | | | | | | | |
Indonesia Government International Bond
4.45%, 2/11/24 | | U.S.$ | | | | | 235 | | | $ | 241,138 | |
| | | | | | | | | | | | |
| | | |
Qatar – 0.2% | | | | | | | | | | | | |
Qatar Government International Bond
3.875%, 4/23/23(b) | | | | | | | 200 | | | | 204,500 | |
5.25%, 1/20/20(b) | | | | | | | 100 | | | | 102,000 | |
| | | | | | | | | | | | |
| | | | | | | | | | | 306,500 | |
| | | | | | | | | | | | |
Saudi Arabia – 0.2% | | | | | | | | | | | | |
Saudi Government International Bond
2.875%, 3/04/23(b) | | | | | | | 200 | | | | 196,750 | |
4.375%, 4/16/29(b) | | | | | | | 200 | | | | 204,156 | |
| | | | | | | | | | | | |
| | | | | | | | | | | 400,906 | |
| | | | | | | | | | | | |
Total Governments – Sovereign Bonds
(cost $932,502) | | | | | | | | | | | 948,544 | |
| | | | | | | | | | | | |
| | | | | | | | | | | | |
SUPRANATIONALS – 0.2% | | | | | | | | | | | | |
Supranational – 0.2% | | | | | | | | | | | | |
European Financial Stability Facility
0.125%, 10/17/23(b)
(cost $363,908) | | | EUR | | | | 311 | | | | 356,152 | |
| | | | | | | | | | | | |
| | | | | | | | | | | | |
LOCAL GOVERNMENTS – US MUNICIPAL BONDS – 0.1% | | | | | | | | | | | | |
United States – 0.1% | | | | | | | | | | | | |
State of California
Series 2010
7.625%, 3/01/40
(cost $237,125) | | | U.S.$ | | | | 165 | | | | 241,723 | |
| | | | | | | | | | | | |
| | | | | | | | | | | | |
QUASI-SOVEREIGNS – 0.1% | | | | | | | | | | | | |
Quasi-Sovereign Bonds – 0.1% | | | | | | | | | | | | |
China – 0.1% | | | | | | | | | | | | |
State Grid Overseas Investment 2016 Ltd.
2.25%, 5/04/20(b)
(cost $199,869) | | | | | | | 200 | | | | 197,403 | |
| | | | | | | | | | | | |
| | | | | | | | | | | | |
LOCAL GOVERNMENTS – PROVINCIAL BONDS – 0.1% | | | | | | | | | | | | |
Canada – 0.1% | | | | | | | | | | | | |
Province of Ontario Canada
2.90%, 6/02/28 | | | CAD | | | | 57 | | | | 44,146 | |
| | |
| |
| abfunds.com | | AB CONSERVATIVE WEALTH STRATEGY | 41 |
PORTFOLIO OF INVESTMENTS(continued)
| | | | | | | | | | | | |
| | | | | | Principal
Amount
(000) | | | U.S. $ Value | |
| |
Province of Quebec Canada
2.75%, 9/01/27 | | | CAD | | | | 141 | | | $ | 108,552 | |
| | | | | | | | | | | | |
| | | |
Total Local Governments – Provincial Bonds
(cost $156,389) | | | | | | | | | | | 152,698 | |
| | | | | | | | | | | | |
| | | | | | | | | | | | |
CORPORATES –NON-INVESTMENT GRADE – 0.1% | | | | | | | | | | | | |
Industrial – 0.1% | | | | | | | | | | | | |
Energy – 0.1% | | | | | | | | | | | | |
EnLink Midstream Partners LP
4.15%, 6/01/25
(cost $142,998) | | | U.S.$ | | | | 144 | | | | 137,833 | |
| | | | | | | | | | | | |
| | | |
| | | | | | Notional
Amount | | | | |
OPTIONS PURCHASED – PUTS – 0.0% | | | | | | | | | | | | |
Options on Forward Contracts – 0.0% | | | | | | | | | | | | |
AUD/USD
Expiration: Jun 2019; Contracts: 1,529,000; Exercise Price: AUD 1.45;
Counterparty: Morgan Stanley Capital Services LLC(a) | | | AUD | | | | 1,529,000 | | | | 10,675 | |
EUR/USD
Expiration: Mar 2019; Contracts: 960,000; Exercise Price: EUR 0.89;
Counterparty: Morgan Stanley Capital Services LLC(a) | | | EUR | | | | 960,000 | | | | 319 | |
EUR/USD
Expiration: Mar 2019; Contracts: 967,000; Exercise Price: EUR 0.89;
Counterparty: JPMorgan Chase Bank, NA(a) | | | EUR | | | | 967,000 | | | | 342 | |
| | | | | | | | | | | | |
| | | |
Total Options Purchased – Puts
(premiums paid $22,314) | | | | | | | | | | | 11,336 | |
| | | | | | | | | | | | |
| | | |
OPTIONS PURCHASED – CALLS – 0.0% | | | | | | | | | | | | |
Options on Forward Contracts – 0.0% | | | | | | | | | | | | |
TRY/EUR
Expiration: Mar 2019; Contracts: 2,822,703; Exercise Price: TRY 5.99;
Counterparty: JPMorgan Chase Bank, NA(a)
(premiums paid 6,951) | | | TRY | | | | 2,822,703 | | | | 1,212 | |
| | | | | | | | | | | | |
| | | | | | | | | | | | |
| | |
| |
| 42 | AB CONSERVATIVE WEALTH STRATEGY | | abfunds.com |
PORTFOLIO OF INVESTMENTS(continued)
| | | | | | | | | | | | |
| Company | | | | |
Shares | | | U.S. $ Value | |
| |
SHORT-TERM INVESTMENTS – 7.0% | | | | | | | | | | | | |
Investment Companies – 7.0% | | | | | | | | | | | | |
AB Fixed Income Shares, Inc. – Government Money Market Portfolio – Class AB, 2.35%(d)(e)(k)
(cost $12,709,360) | | | | | | | 12,709,360 | | | $ | 12,709,360 | |
| | | | | | | | | | | | |
Total Investments Before Security Lending Collateral for Securities Loaned – 99.7%
(cost $176,987,049) | | | | | | | | | | | 181,574,207 | |
| | | | | | | | | | | | |
INVESTMENTS OF CASH COLLATERAL FOR SECURITIES LOANED – 1.6% | | | | | | | | | | | | |
Investment Companies – 1.6% | | | | | | | | | | | | |
AB Fixed Income Shares, Inc. – Government Money Market Portfolio – Class AB, 2.35%(d)(e)(k)
(cost $2,905,070) | | | | | | | 2,905,070 | | | | 2,905,070 | |
| | | | | | | | | | | | |
| | | |
Total Investments – 101.3%
(cost $179,892,119) | | | | | | | | | | | 184,479,277 | |
Other assets less liabilities – (1.3)% | | | | | | | | | | | (2,292,307 | ) |
| | | | | | | | | | | | |
| | | |
Net Assets – 100.0% | | | | | | | | | | $ | 182,186,970 | |
| | | | | | | | | | | | |
FUTURES (see Note D)
| | | | | | | | | | | | | | | | | | | | | | | | | | | | |
| Description | | Number of
Contracts | | | Expiration
Month | | | Notional
(000) | | | Original
Value | | | Value at
February 28,
2019 | | | Unrealized
Appreciation/
(Depreciation) | |
Purchased Contracts | |
10 Yr Japan Bond (OSE) Futures | | | 17 | | | | March 2019 | | | | JPY | | | | 1,700,000 | | | $ | 23,162,258 | | | $ | 23,295,025 | | | $ | 132,767 | |
Amsterdam Index Futures | | | 2 | | | | March 2019 | | | | EUR | | | | 0 | ** | | | 242,349 | | | | 246,153 | | | | 3,804 | |
Dax Index Futures | | | 2 | | | | March 2019 | | | | EUR | | | | 0 | ** | | | 617,278 | | | | 655,171 | | | | 37,893 | |
Euro-CAC40 10 Futures | | | 11 | | | | March 2019 | | | | EUR | | | | 0 | ** | | | 632,148 | | | | 655,501 | | | | 23,353 | |
Euro-Schatz Futures | | | 8 | | | | March 2019 | | | | EUR | | | | 800 | | | | 1,018,208 | | | | 1,017,471 | | | | (737 | ) |
FTSE/MIB Index Futures | | | 2 | | | | March 2019 | | | | EUR | | | | 0 | ** | | | 216,105 | | | | 234,940 | | | | 18,835 | |
IBEX 35 Index Futures | | | 3 | | | | March 2019 | | | | EUR | | | | 0 | ** | | | 306,181 | | | | 317,079 | | | | 10,898 | |
| | |
| |
| abfunds.com | | AB CONSERVATIVE WEALTH STRATEGY | 43 |
PORTFOLIO OF INVESTMENTS(continued)
| | | | | | | | | | | | | | | | | | | | | | | | | | | | |
| Description | | Number of
Contracts | | | Expiration
Month | | | Notional
(000) | | | Original
Value | | | Value at
February 28,
2019 | | | Unrealized
Appreciation/
(Depreciation) | |
Long Gilt Futures | | | 21 | | | | June 2019 | | | | GBP | | | | 2,100 | | | $ | 3,544,361 | | | $ | 3,503,672 | | | $ | (40,689 | ) |
Mini MSCI Emerging Markets Futures | | | 133 | | | | March 2019 | | | | USD | | | | 7 | | | | 6,572,379 | | | | 6,960,555 | | | | 388,176 | |
OMXS30 Index Futures | | | 53 | | | | March 2019 | | | | SEK | | | | 5 | | | | 887,077 | | | | 902,079 | | | | 15,002 | |
Russell 2000E-Mini Futures | | | 24 | | | | March 2019 | | | | USD | | | | 1 | | | | 1,749,126 | | | | 1,890,600 | | | | 141,474 | |
S&P Mid 400E-Mini Futures | | | 9 | | | | March 2019 | | | | USD | | | | 1 | | | | 1,602,343 | | | | 1,719,720 | | | | 117,377 | |
U.S. 10 Yr Ultra Futures | | | 20 | | | | June 2019 | | | | USD | | | | 2,000 | | | | 2,598,621 | | | | 2,589,062 | | | | (9,559 | ) |
U.S.T-Note 2 Yr (CBT) Futures | | | 22 | | | | June 2019 | | | | USD | | | | 4,400 | | | | 4,668,332 | | | | 4,668,297 | | | | (35 | ) |
U.S.T-Note 5 Yr (CBT) Futures | | | 16 | | | | June 2019 | | | | USD | | | | 1,600 | | | | 1,833,770 | | | | 1,833,000 | | | | (770 | ) |
U.S.T-Note 10 Yr (CBT) Futures | | | 12 | | | | June 2019 | | | | USD | | | | 1,200 | | | | 1,470,681 | | | | 1,464,000 | | | | (6,681 | ) |
U.S. Ultra Bond (CBT) Futures | | | 34 | | | | June 2019 | | | | USD | | | | 3,400 | | | | 5,500,973 | | | | 5,426,188 | | | | (74,785 | ) |
|
Sold Contracts | |
10 Yr Australian Bond Futures | | | 15 | | | | March 2019 | | | | AUD | | | | 1,500 | | | | 1,410,540 | | | | 1,436,565 | | | | (26,025 | ) |
10 Yr Canadian Bond Futures | | | 17 | | | | June 2019 | | | | CAD | | | | 1,700 | | | | 1,760,753 | | | | 1,753,159 | | | | 7,594 | |
10 Yr Mini Japan Government Bond Futures | | | 71 | | | | March 2019 | | | | JPY | | | | 710,000 | | | | 9,708,181 | | | | 9,721,455 | | | | (13,274 | ) |
Euro Buxl 30 Yr Bond Futures | | | 1 | | | | March 2019 | | | | EUR | | | | 100 | | | | 210,586 | | | | 209,336 | | | | 1,250 | |
Euro STOXX 50 Index Futures | | | 40 | | | | March 2019 | | | | EUR | | | | 0 | ** | | | 1,379,356 | | | | 1,500,523 | | | | (121,167 | ) |
Euro-BOBL Futures | | | 14 | | | | March 2019 | | | | EUR | | | | 1,400 | | | | 2,104,858 | | | | 2,113,472 | | | | (8,614 | ) |
| | |
| |
| 44 | AB CONSERVATIVE WEALTH STRATEGY | | abfunds.com |
PORTFOLIO OF INVESTMENTS(continued)
| | | | | | | | | | | | | | | | | | | | | | | | | | | | |
| Description | | Number of
Contracts | | | Expiration
Month | | | Notional
(000) | | | Original
Value | | | Value at
February 28,
2019 | | | Unrealized
Appreciation/
(Depreciation) | |
Euro-Bund Futures | | | 4 | | | | March 2019 | | | | EUR | | | | 400 | | | $ | 753,362 | | | $ | 752,127 | | | $ | 1,235 | |
FTSE 100 Index Futures | | | 7 | | | | March 2019 | | | | GBP | | | | 0 | ** | | | 616,142 | | | | 656,921 | | | | (40,779 | ) |
Hang Seng Index Futures | | | 2 | | | | March 2019 | | | | HKD | | | | 0 | ** | | | 368,810 | | | | 365,184 | | | | 3,626 | |
MSCI EAFE Future | | | 6 | | | | March 2019 | | | | USD | | | | 0 | ** | | | 551,939 | | | | 560,700 | | | | (8,761 | ) |
MSCI Singapore Index ETS Futures | | | 19 | | | | March 2019 | | | | SGD | | | | 2 | | | | 513,728 | | | | 505,636 | | | | 8,092 | |
S&P 500E-Mini Futures | | | 149 | | | | March 2019 | | | | USD | | | | 7 | | | | 19,748,368 | | | | 20,746,015 | | | | (997,647 | ) |
S&P/TSX 60 Index Futures | | | 5 | | | | March 2019 | | | | CAD | | | | 1 | | | | 684,496 | | | | 723,736 | | | | (39,240 | ) |
SPI 200 Futures | | | 5 | | | | March 2019 | | | | AUD | | | | 0 | ** | | | 503,175 | | | | 545,224 | | | | (42,049 | ) |
TOPIX Index Futures | | | 5 | | | | March 2019 | | | | JPY | | | | 50 | | | | 683,456 | | | | 720,406 | | | | (36,950 | ) |
| | | | | | | | | | | | | | | | | | | | | | | | | | | | |
| | | | | | | | | | $ | (556,386 | ) |
| | | | | | | | | | | | | | | | | | | | | | | | | | | | |
FORWARD CURRENCY EXCHANGE CONTRACTS (see Note D)
| | | | | | | | | | | | | | | | | | | | |
| Counterparty | | Contracts to
Deliver
(000) | | | In Exchange
For
(000) | | | Settlement
Date | | | Unrealized
Appreciation/
(Depreciation) | |
Australia and New Zealand Banking Group Ltd. | | AUD | | | 1,679 | | | USD | | | 1,196 | | | | 4/23/19 | | | $ | 4,136 | |
Bank of America, NA | | CLP | | | 827,259 | | | USD | | | 1,215 | | | | 3/15/19 | | | | (46,355 | ) |
Bank of America, NA | | RUB | | | 14,370 | | | USD | | | 215 | | | | 3/07/19 | | | | (2,427 | ) |
Barclays Bank PLC | | KRW | | | 1,246,823 | | | USD | | | 1,111 | | | | 3/15/19 | | | | 2,884 | |
Barclays Bank PLC | | JPY | | | 105,307 | | | USD | | | 972 | | | | 3/15/19 | | | | 26,897 | |
Barclays Bank PLC | | INR | | | 20,999 | | | USD | | | 293 | | | | 3/18/19 | | | | (3,219 | ) |
Barclays Bank PLC | | RUB | | | 7,688 | | | USD | | | 115 | | | | 3/07/19 | | | | (1,645 | ) |
Barclays Bank PLC | | CNY | | | 7,347 | | | USD | | | 1,070 | | | | 3/15/19 | | | | (27,313 | ) |
Barclays Bank PLC | | SEK | | | 6,992 | | | USD | | | 789 | | | | 3/15/19 | | | | 31,090 | |
Barclays Bank PLC | | CNY | | | 4,208 | | | USD | | | 621 | | | | 6/17/19 | | | | (6,727 | ) |
Barclays Bank PLC | | ILS | | | 1,939 | | | USD | | | 530 | | | | 4/16/19 | | | | (6,301 | ) |
Barclays Bank PLC | | BRL | | | 1,757 | | | USD | | | 471 | | | | 3/06/19 | | | | 3,279 | |
Barclays Bank PLC | | BRL | | | 774 | | | USD | | | 207 | | | | 3/15/19 | | | | 882 | |
Barclays Bank PLC | | USD | | | 752 | | | AUD | | | 1,053 | | | | 3/15/19 | | | | (4,774 | ) |
Barclays Bank PLC | | USD | | | 470 | | | BRL | | | 1,757 | | | | 3/06/19 | | | | (2,208 | ) |
Barclays Bank PLC | | USD | | | 470 | | | BRL | | | 1,757 | | | | 4/02/19 | | | | (3,179 | ) |
Barclays Bank PLC | | USD | | | 165 | | | RUB | | | 10,804 | | | | 3/07/19 | | | | (736 | ) |
Barclays Bank PLC | | USD | | | 1,020 | | | TWD | | | 31,252 | | | | 3/14/19 | | | | (5,260 | ) |
Barclays Bank PLC | | USD | | | 226 | | | INR | | | 15,939 | | | | 3/18/19 | | | | (1,499 | ) |
Barclays Bank PLC | | USD | | | 383 | | | PHP | | | 20,246 | | | | 6/17/19 | | | | 4,735 | |
Barclays Bank PLC | | USD | | | 400 | | | PHP | | | 21,079 | | | | 3/15/19 | | | | 6,566 | |
Barclays Bank PLC | | USD | | | 997 | | | INR | | | 70,394 | | | | 3/15/19 | | | | (4,894 | ) |
Barclays Bank PLC | | USD | | | 443 | | | KRW | | | 495,379 | | | | 5/16/19 | | | | (1,467 | ) |
Barclays Bank PLC | | USD | | | 356 | | | IDR | | | 5,046,569 | | | | 6/17/19 | | | | (4,532 | ) |
Barclays Bank PLC | | USD | | | 1,391 | | | IDR | | | 19,783,393 | | | | 3/15/19 | | | | 4,988 | |
BNP Paribas SA | | PLN | | | 1,991 | | | USD | | | 530 | | | | 3/15/19 | | | | 3,669 | |
| | |
| |
| abfunds.com | | AB CONSERVATIVE WEALTH STRATEGY | 45 |
PORTFOLIO OF INVESTMENTS(continued)
| | | | | | | | | | | | | | | | | | | | |
| Counterparty | | Contracts to
Deliver
(000) | | | In Exchange
For
(000) | | | Settlement
Date | | | Unrealized
Appreciation/
(Depreciation) | |
BNP Paribas SA | | EUR | | | 220 | | | SEK | | | 2,332 | | | | 4/10/19 | | | $ | 1,750 | |
BNP Paribas SA | | EUR | | | 475 | | | PLN | | | 2,044 | | | | 4/08/19 | | | | (708 | ) |
BNP Paribas SA | | USD | | | 1,060 | | | CAD | | | 1,409 | | | | 3/07/19 | | | | 11,533 | |
BNP Paribas SA | | USD | | | 1,453 | | | NZD | | | 2,161 | | | | 3/15/19 | | | | 18,641 | |
Citibank, NA | | COP | | | 842,174 | | | USD | | | 264 | | | | 3/15/19 | | | | (8,875 | ) |
Citibank, NA | | CLP | | | 226,003 | | | USD | | | 338 | | | | 3/15/19 | | | | (6,588 | ) |
Citibank, NA | | JPY | | | 59,747 | | | USD | | | 541 | | | | 4/11/19 | | | | 3,680 | |
Citibank, NA | | TWD | | | 22,311 | | | USD | | | 726 | | | | 3/15/19 | | | | 1,929 | |
Citibank, NA | | GBP | | | 1,260 | | | USD | | | 1,663 | | | | 4/09/19 | | | | (11,374 | ) |
Citibank, NA | | EUR | | | 1,081 | | | USD | | | 1,245 | | | | 6/17/19 | | | | 4,709 | |
Citibank, NA | | SEK | | | 1,062 | | | USD | | | 115 | | | | 4/12/19 | | | | (230 | ) |
Citibank, NA | | USD | | | 529 | | | GBP | | | 401 | | | | 4/09/19 | | | | 3,656 | |
Citibank, NA | | USD | | | 343 | | | BRL | | | 1,283 | | | | 4/02/19 | | | | (2,362 | ) |
Citibank, NA | | USD | | | 540 | | | PLN | | | 2,026 | | | | 4/08/19 | | | | (4,427 | ) |
Citibank, NA | | USD | | | 800 | | | SEK | | | 7,156 | | | | 4/12/19 | | | | (22,630 | ) |
Citibank, NA | | USD | | | 565 | | | TWD | | | 17,270 | | | | 3/14/19 | | | | (5,004 | ) |
Citibank, NA | | USD | | | 1,636 | | | MXN | | | 31,978 | | | | 3/15/19 | | | | 19,497 | |
Citibank, NA | | USD | | | 789 | | | RUB | | | 52,778 | | | | 6/17/19 | | | | 311 | |
Citibank, NA | | USD | | | 583 | | | JPY | | | 63,336 | | | | 12/13/19 | | | | (1,378 | ) |
Citibank, NA | | USD | | | 158 | | | CLP | | | 105,436 | | | | 3/15/19 | | | | 3,073 | |
Credit Suisse International | | CNY | | | 4,639 | | | USD | | | 674 | | | | 3/20/19 | | | | (18,269 | ) |
Credit Suisse International | | NOK | | | 987 | | | USD | | | 115 | | | | 4/12/19 | | | | (486 | ) |
Credit Suisse International | | EUR | | | 437 | | | USD | | | 495 | | | | 3/13/19 | | | | (2,640 | ) |
Credit Suisse International | | EUR | | | 199 | | | TRY | | | 1,267 | | | | 3/25/19 | | | | 7,015 | |
Credit Suisse International | | USD | | | 1,118 | | | CAD | | | 1,469 | | | | 6/17/19 | | | | 1,148 | |
Credit Suisse International | | USD | | | 486 | | | CNY | | | 3,329 | | | | 3/20/19 | | | | 11,500 | |
Credit Suisse International | | USD | | | 611 | | | TRY | | | 3,474 | | | | 3/15/19 | | | | 34,151 | |
Credit Suisse International | | USD | | | 766 | | | SEK | | | 6,992 | | | | 3/15/19 | | | | (8,297 | ) |
Deutsche Bank AG | | INR | | | 15,944 | | | USD | | | 218 | | | | 3/18/19 | | | | (6,267 | ) |
Deutsche Bank AG | | USD | | | 290 | | | INR | | | 20,720 | | | | 3/18/19 | | | | 1,636 | |
Goldman Sachs Bank USA | | INR | | | 23,055 | | | USD | | | 322 | | | | 3/18/19 | | | | (2,876 | ) |
Goldman Sachs Bank USA | | INR | | | 34,306 | | | USD | | | 486 | | | | 3/18/19 | | | | 2,517 | |
Goldman Sachs Bank USA | | BRL | | | 1,757 | | | USD | | | 470 | | | | 3/06/19 | | | | 2,208 | |
Goldman Sachs Bank USA | | EUR | | | 399 | | | TRY | | | 2,571 | | | | 4/10/19 | | | | 15,509 | |
Goldman Sachs Bank USA | | USD | | | 465 | | | BRL | | | 1,757 | | | | 3/06/19 | | | | 3,197 | |
Goldman Sachs Bank USA | | USD | | | 671 | | | MYR | | | 2,733 | | | | 8/21/19 | | | | (2,610 | ) |
Goldman Sachs Bank USA | | USD | | | 733 | | | NOK | | | 6,237 | | | | 4/12/19 | | | | (3,102 | ) |
Goldman Sachs Bank USA | | USD | | | 414 | | | TWD | | | 12,710 | | | | 3/14/19 | | | | (2,000 | ) |
Goldman Sachs Bank USA | | USD | | | 319 | | | INR | | | 22,593 | | | | 3/18/19 | | | | (1,041 | ) |
Goldman Sachs Bank USA | | USD | | | 1,048 | | | RUB | | | 70,907 | | | | 3/15/19 | | | | 25,385 | |
Goldman Sachs Bank USA | | USD | | | 216 | | | CLP | | | 145,499 | | | | 3/15/19 | | | | 5,474 | |
HSBC Bank USA | | JPY | | | 490,227 | | | USD | | | 4,442 | | | | 4/11/19 | | | | 30,383 | |
HSBC Bank USA | | INR | | | 90,618 | | | USD | | | 1,246 | | | | 3/18/19 | | | | (31,596 | ) |
HSBC Bank USA | | TWD | | | 10,098 | | | USD | | | 330 | | | | 3/14/19 | | | | 2,439 | |
HSBC Bank USA | | USD | | | 646 | | | EUR | | | 566 | | | | 4/10/19 | | | | (435 | ) |
HSBC Bank USA | | USD | | | 1,026 | | | KRW | | | 1,148,257 | | | | 5/16/19 | | | | (3,206 | ) |
JPMorgan Chase Bank, NA | | CHF | | | 1,149 | | | USD | | | 1,170 | | | | 3/13/19 | | | | 17,991 | |
JPMorgan Chase Bank, NA | | USD | | | 237 | | | PLN | | | 890 | | | | 4/08/19 | | | | (1,895 | ) |
JPMorgan Chase Bank, NA | | TRY | | | 1,267 | | | EUR | | | 199 | | | | 3/25/19 | | | | (7,014 | ) |
JPMorgan Chase Bank, NA | | USD | | | 586 | | | CNY | | | 3,961 | | | | 3/20/19 | | | | 5,824 | |
Morgan Stanley Capital Services, Inc. | | JPY | | | 634,557 | | | USD | | | 5,667 | | | | 3/15/19 | | | | (31,044 | ) |
| | |
| |
| 46 | AB CONSERVATIVE WEALTH STRATEGY | | abfunds.com |
PORTFOLIO OF INVESTMENTS(continued)
| | | | | | | | | | | | | | | | | | | | |
| Counterparty | | Contracts to
Deliver
(000) | | | In Exchange
For
(000) | | | Settlement
Date | | | Unrealized
Appreciation/
(Depreciation) | |
Morgan Stanley Capital Services, Inc. | | INR | | | 23,421 | | | USD | | | 327 | | | | 3/18/19 | | | $ | (3,306 | ) |
Morgan Stanley Capital Services, Inc. | | NZD | | | 903 | | | USD | | | 620 | | | | 4/26/19 | | | | 4,911 | |
Morgan Stanley Capital Services, Inc. | | PEN | | | 827 | | | USD | | | 246 | | | | 3/15/19 | | | | (4,369 | ) |
Morgan Stanley Capital Services, Inc. | | CNY | | | 743 | | | USD | | | 107 | | | | 3/20/19 | | | | (3,529 | ) |
Morgan Stanley Capital Services, Inc. | | USD | | | 248 | | | EUR | | | 219 | | | | 3/13/19 | | | | 1,335 | |
Morgan Stanley Capital Services, Inc. | | USD | | | 514 | | | AUD | | | 696 | | | | 6/28/19 | | | | (19,366 | ) |
Morgan Stanley Capital Services, Inc. | | USD | | | 327 | | | TWD | | | 10,091 | | | | 3/14/19 | | | | 127 | |
Morgan Stanley Capital Services, Inc. | | USD | | | 385 | | | INR | | | 27,584 | | | | 3/18/19 | | | | 4,092 | |
Morgan Stanley Capital Services, Inc. | | USD | | | 222 | | | KRW | | | 247,249 | | | | 5/16/19 | | | | (1,919 | ) |
Morgan Stanley Capital Services, Inc. | | USD | | | 275 | | | COP | | | 865,020 | | | | 3/15/19 | | | | 5,822 | |
Natwest Markets PLC | | COP | | | 1,023,587 | | | USD | | | 329 | | | | 3/15/19 | | | | (3,442 | ) |
Natwest Markets PLC | | CLP | | | 103,921 | | | USD | | | 155 | | | | 3/15/19 | | | | (3,839 | ) |
Natwest Markets PLC | | USD | | | 250 | | | TWD | | | 7,604 | | | | 3/14/19 | | | | (2,931 | ) |
Natwest Markets PLC | | USD | | | 327 | | | INR | | | 23,172 | | | | 3/18/19 | | | | 68 | |
Natwest Markets PLC | | USD | | | 569 | | | CLP | | | 372,514 | | | | 3/15/19 | | | | (1,149 | ) |
Natwest Markets PLC | | USD | | | 328 | | | CLP | | | 218,587 | | | | 3/15/19 | | | | 5,170 | |
Natwest Markets PLC | | USD | | | 109 | | | COP | | | 337,212 | | | | 3/15/19 | | | | (73 | ) |
Natwest Markets PLC | | USD | | | 110 | | | COP | | | 340,981 | | | | 3/15/19 | | | | 1,063 | |
Standard Chartered Bank | | TWD | | | 20,029 | | | USD | | | 650 | | | | 3/14/19 | | | | (366 | ) |
Standard Chartered Bank | | INR | | | 15,183 | | | USD | | | 214 | | | | 3/18/19 | | | | (240 | ) |
Standard Chartered Bank | | TWD | | | 22,164 | | | USD | | | 724 | | | | 3/14/19 | | | | 4,190 | |
Standard Chartered Bank | | CNY | | | 3,963 | | | USD | | | 573 | | | | 3/20/19 | | | | (18,813 | ) |
Standard Chartered Bank | | CAD | | | 3,197 | | | USD | | | 2,417 | | | | 3/07/19 | | | | (12,774 | ) |
Standard Chartered Bank | | USD | | | 724 | | | EUR | | | 633 | | | | 4/10/19 | | | | (2,464 | ) |
Standard Chartered Bank | | USD | | | 317 | | | CNY | | | 2,194 | | | | 3/20/19 | | | | 10,318 | |
State Street Bank & Trust Co. | | JPY | | | 48,630 | | | USD | | | 450 | | | | 12/13/19 | | | | 3,312 | |
State Street Bank & Trust Co. | | JPY | | | 24,299 | | | USD | | | 221 | | | | 4/11/19 | | | | 2,127 | |
State Street Bank & Trust Co. | | EUR | | | 13,923 | | | USD | | | 16,072 | | | | 4/10/19 | | | | 185,589 | |
State Street Bank & Trust Co. | | CZK | | | 10,346 | | | USD | | | 462 | | | | 3/15/19 | | | | 2,800 | |
State Street Bank & Trust Co. | | THB | | | 8,539 | | | USD | | | 274 | | | | 6/17/19 | | | | 2,332 | |
State Street Bank & Trust Co. | | THB | | | 5,764 | | | USD | | | 180 | | | | 3/15/19 | | | | (2,543 | ) |
State Street Bank & Trust Co. | | SEK | | | 3,038 | | | USD | | | 330 | | | | 4/12/19 | | | | (339 | ) |
State Street Bank & Trust Co. | | ZAR | | | 2,328 | | | USD | | | 169 | | | | 4/17/19 | | | | 4,961 | |
State Street Bank & Trust Co. | | ZAR | | | 2,092 | | | USD | | | 149 | | | | 3/15/19 | | | | 441 | |
State Street Bank & Trust Co. | | NOK | | | 1,867 | | | USD | | | 219 | | | | 4/12/19 | | | | 606 | |
State Street Bank & Trust Co. | | ILS | | | 1,739 | | | USD | | | 475 | | | | 4/16/19 | | | | (5,618 | ) |
State Street Bank & Trust Co. | | TRY | | | 873 | | | USD | | | 161 | | | | 3/28/19 | | | | 436 | |
State Street Bank & Trust Co. | | PLN | | | 840 | | | USD | | | 220 | | | | 4/08/19 | | | | (2,167 | ) |
State Street Bank & Trust Co. | | AUD | | | 845 | | | USD | | | 599 | | | | 4/23/19 | | | | (584 | ) |
State Street Bank & Trust Co. | | CAD | | | 735 | | | USD | | | 551 | | | | 3/07/19 | | | | (7,639 | ) |
State Street Bank & Trust Co. | | CHF | | | 430 | | | USD | | | 441 | | | | 3/15/19 | | | | 9,076 | |
State Street Bank & Trust Co. | | EUR | | | 1,506 | | | USD | | | 1,713 | | | | 4/10/19 | | | | (5,594 | ) |
| | |
| |
| abfunds.com | | AB CONSERVATIVE WEALTH STRATEGY | 47 |
PORTFOLIO OF INVESTMENTS(continued)
| | | | | | | | | | | | | | | | | | | | |
| Counterparty | | Contracts to
Deliver
(000) | | | In Exchange
For
(000) | | | Settlement
Date | | | Unrealized
Appreciation/
(Depreciation) | |
State Street Bank & Trust Co. | | SGD | | | 478 | | | USD | | | 352 | | | | 4/17/19 | | | $ | (1,822 | ) |
State Street Bank & Trust Co. | | CHF | | | 350 | | | USD | | | 358 | | | | 3/13/19 | | | | 6,112 | |
State Street Bank & Trust Co. | | AUD | | | 697 | | | USD | | | 510 | | | | 6/28/19 | | | | 15,133 | |
State Street Bank & Trust Co. | | GBP | | | 210 | | | USD | | | 270 | | | | 6/17/19 | | | | (9,781 | ) |
State Street Bank & Trust Co. | | PLN | | | 152 | | | USD | | | 41 | | | | 4/08/19 | | | | 342 | |
State Street Bank & Trust Co. | | TRY | | | 119 | | | USD | | | 22 | | | | 3/28/19 | | | | (493 | ) |
State Street Bank & Trust Co. | | GBP | | | 92 | | | USD | | | 121 | | | | 4/09/19 | | | | (1,488 | ) |
State Street Bank & Trust Co. | | EUR | | | 176 | | | USD | | | 202 | | | | 3/15/19 | | | | 1,547 | |
State Street Bank & Trust Co. | | GBP | | | 139 | | | USD | | | 179 | | | | 3/15/19 | | | | (5,578 | ) |
State Street Bank & Trust Co. | | EUR | | | 62 | | | USD | | | 70 | | | | 3/15/19 | | | | (238 | ) |
State Street Bank & Trust Co. | | EUR | | | 50 | | | USD | | | 57 | | | | 6/17/19 | | | | (71 | ) |
State Street Bank & Trust Co. | | MXN | | | 34 | | | USD | | | 2 | | | | 3/22/19 | | | | 4 | |
State Street Bank & Trust Co. | | EUR | | | 11 | | | USD | | | 13 | | | | 6/17/19 | | | | 4 | |
State Street Bank & Trust Co. | | USD | | | 859 | | | EUR | | | 747 | | | | 4/10/19 | | | | (6,850 | ) |
State Street Bank & Trust Co. | | USD | | | 113 | | | GBP | | | 88 | | | | 3/15/19 | | | | 3,427 | |
State Street Bank & Trust Co. | | EUR | | | 118 | | | PLN | | | 509 | | | | 4/10/19 | | | | 191 | |
State Street Bank & Trust Co. | | USD | | | 193 | | | EUR | | | 168 | | | | 3/15/19 | | | | (1,939 | ) |
State Street Bank & Trust Co. | | USD | | | 219 | | | EUR | | | 194 | | | | 3/13/19 | | | | 1,856 | |
State Street Bank & Trust Co. | | USD | | | 216 | | | CHF | | | 212 | | | | 3/13/19 | | | | (3,583 | ) |
State Street Bank & Trust Co. | | USD | | | 248 | | | EUR | | | 219 | | | | 4/10/19 | | | | 1,525 | |
State Street Bank & Trust Co. | | CHF | | | 221 | | | SEK | | | 2,057 | | | | 4/12/19 | | | | 1,514 | |
State Street Bank & Trust Co. | | USD | | | 304 | | | EUR | | | 267 | | | | 6/17/19 | | | | 2,018 | |
State Street Bank & Trust Co. | | USD | | | 321 | | | EUR | | | 281 | | | | 4/08/19 | | | | (99 | ) |
State Street Bank & Trust Co. | | EUR | | | 299 | | | GBP | | | 264 | | | | 4/10/19 | | | | 8,839 | |
State Street Bank & Trust Co. | | USD | | | 330 | | | CHF | | | 329 | | | | 3/13/19 | | | | 72 | |
State Street Bank & Trust Co. | | USD | | | 694 | | | CAD | | | 921 | | | | 3/07/19 | | | | 6,185 | |
State Street Bank & Trust Co. | | USD | | | 244 | | | NZD | | | 358 | | | | 4/26/19 | | | | 118 | |
State Street Bank & Trust Co. | | USD | | | 402 | | | CAD | | | 534 | | | | 3/15/19 | | | | 3,452 | |
State Street Bank & Trust Co. | | USD | | | 394 | | | AUD | | | 552 | | | | 4/23/19 | | | | (1,447 | ) |
State Street Bank & Trust Co. | | USD | | | 106 | | | TRY | | | 568 | | | | 3/28/19 | | | | (1,172 | ) |
State Street Bank & Trust Co. | | USD | | | 105 | | | TRY | | | 570 | | | | 3/28/19 | | | | 527 | |
State Street Bank & Trust Co. | | USD | | | 221 | | | ILS | | | 799 | | | | 4/16/19 | | | | 293 | |
State Street Bank & Trust Co. | | PLN | | | 837 | | | EUR | | | 193 | | | | 4/08/19 | | | | (700 | ) |
State Street Bank & Trust Co. | | SEK | | | 1,531 | | | NOK | | | 1,414 | | | | 4/12/19 | | | | (724 | ) |
State Street Bank & Trust Co. | | TRY | | | 1,747 | | | EUR | | | 282 | | | | 4/10/19 | | | | 1,598 | |
State Street Bank & Trust Co. | | USD | | | 155 | | | ZAR | | | 2,092 | | | | 3/15/19 | | | | (6,639 | ) |
State Street Bank & Trust Co. | | USD | | | 169 | | | ZAR | | | 2,328 | | | | 4/17/19 | | | | (4,199 | ) |
State Street Bank & Trust Co. | | USD | | | 333 | | | NOK | | | 2,840 | | | | 4/12/19 | | | | (848 | ) |
State Street Bank & Trust Co. | | USD | | | 375 | | | SEK | | | 3,358 | | | | 4/12/19 | | | | (10,145 | ) |
State Street Bank & Trust Co. | | USD | | | 377 | | | CZK | | | 8,529 | | | | 3/15/19 | | | | 1,206 | |
State Street Bank & Trust Co. | | USD | | | 123 | | | JPY | | | 13,489 | | | | 4/11/19 | | | | (1,215 | ) |
State Street Bank & Trust Co. | | USD | | | 150 | | | JPY | | | 16,834 | | | | 3/15/19 | | | | 902 | |
| | | | | | | | | | | | | | | | | | | | |
| | | $ | 158,938 | |
| | | | | | | | | | | | | | | | | | | | |
| | |
| |
| 48 | AB CONSERVATIVE WEALTH STRATEGY | | abfunds.com |
PORTFOLIO OF INVESTMENTS(continued)
CURRENCY OPTIONS WRITTEN (see Note D)
| | | | | | | | | | | | | | | | | | | | | | | | |
Description/
Counterparty | | Exercise
Price | | | Expiration
Month | | | Contracts | | | Notional
Amount
(000) | | | Premiums
Received | | | U.S. $
Value | |
Call | |
AUD vs. USD/ Morgan Stanley Capital Services LLC(l) | | AUD | 1.280 | | | | 06/2019 | | | | 1,529,000 | | | AUD | 1,529 | | | $ | 15,874 | | | $ | (726 | ) |
|
Put | |
TRY vs. EUR/
JPMorgan Chase Bank, NA(l) | | TRY | 6.990 | | | | 03/2019 | | | | 3,290,877 | | | TRY | 3,291 | | | | 6,951 | | | | (434 | ) |
| | | | | | | | | | | | | | | | | | | | | | | | |
| | | | | | | | | | | | | | | | | | $ | 22,825 | | | $ | (1,160 | ) |
| | | | | | | | | | | | | | | | | | | | | | | | |
CENTRALLY CLEARED CREDIT DEFAULT SWAPS (see Note D)
| | | | | | | | | | | | | | | | | | | | | | | | | | | | |
Description | | Fixed
Rate
(Pay)
Receive | | | Payment
Frequency | | | Implied
Credit
Spread at
February 28,
2019 | | | Notional
Amount
(000) | | | Market
Value | | | Upfront
Premiums
Paid
(Received) | | | Unrealized
Appreciation/
(Depreciation) | |
Buy Contracts | |
iTraxxx Australia Series 30, 5 Year Index, 12/20/23* | | | (1.00 | )% | | | Quarterly | | | | 0.69 | % | | USD | 1,200 | | | $ | (19,067 | ) | | $ | (12,430 | ) | | $ | (6,637 | ) |
|
Sale Contracts | |
CDX-NAIG Series 28, 5 Year Index, 6/20/22* | | | 1.00 | | | | Quarterly | | | | 0.43 | | | USD | 15,820 | | | | 315,206 | | | | 211,723 | | | | 103,483 | |
CDX-NAIG Series 31, 5 Year Index, 12/20/23* | | | 1.00 | | | | Quarterly | | | | 0.60 | | | USD | 1,200 | | | | 23,761 | | | | 20,238 | | | | 3,523 | |
iTraxxx Europe Series 27, 5 Year Index, 6/20/22* | | | 1.00 | | | | Quarterly | | | | 0.33 | | | EUR | 6,710 | | | | 184,992 | | | | 118,819 | | | | 66,173 | |
iTraxxx Europe Series 29, 5 Year Index, 6/20/23* | | | 1.00 | | | | Quarterly | | | | 0.51 | | | EUR | 240 | | | | 6,226 | | | | 5,436 | | | | 790 | |
| | | | | | | | | | | | | | | | | | | | | | | | | | | | |
| | | | | | | | | | | | | | | | | | $ | 511,118 | | | $ | 343,786 | | | $ | 167,332 | |
| | | | | | | | | | | | | | | | | | | | | | | | | | | | |
| | |
| |
| abfunds.com | | AB CONSERVATIVE WEALTH STRATEGY | 49 |
PORTFOLIO OF INVESTMENTS(continued)
CENTRALLY CLEARED INTEREST RATE SWAPS (see Note D)
| | | | | | | | | | | | | | | | | | | | | | | | | | | | | | | | |
| | | | | | | | | Rate Type | | | | | | | | | | | | | |
Notional Amount (000) | | | Termination
Date | | | Payments
made
by the
Fund | | | Payments
received
by the
Fund | | | Payment
Frequency
Paid/
Received | | | Market Value | | | Upfront
Premiums
Paid
(Received) | | | Unrealized
Appreciation/
(Depreciation) | |
| USD | | | 5,350 | | | | 9/10/20 | | |
| 3 Month
LIBOR |
| | | 2.824% | | |
| Quarterly/
Semi-Annual |
| | $ | 53,351 | | | $ | — | | | $ | 53,351 | |
| USD | | | 2,220 | | | | 9/10/23 | | |
| 3 Month
LIBOR |
| | | 2.883% | | |
| Quarterly/
Semi-Annual |
| | | 48,135 | | | | — | | | | 48,135 | |
| EUR | | | 1,650 | | | | 1/15/24 | | |
| 6 Month
EURIBOR |
| | | 0.201% | | |
| Semi-Annual/
Annual |
| | | 5,806 | | | | — | | | | 5,806 | |
| NOK | | | 26,230 | | | | 1/11/29 | | |
| 6 Month
NIBOR |
| | | 2.100% | | |
| Semi-Annual/
Annual |
| | | 6,539 | | | | — | | | | 6,539 | |
| SEK | | | 25,620 | | | | 1/11/29 | | |
| 3 Month
STIBOR |
| | | 1.080% | | |
| Quarterly/
Annual |
| | | 25,210 | | | | — | | | | 25,210 | |
| CHF | | | 2,720 | | | | 1/11/29 | | |
| 6 Month
LIBOR |
| | | 0.299% | | |
| Semi-Annual/
Annual |
| | | 22,065 | | | | — | | | | 22,065 | |
| NZD | | | 690 | | | | 1/11/29 | | |
| 3 Month
BKBM |
| | | 2.653% | | |
| Quarterly/
Semi-Annual |
| | | 8,192 | | | | — | | | | 8,192 | |
| USD | | | 1,010 | | | | 9/10/48 | | |
| 3 Month
LIBOR |
| | | 2.980% | | |
| Semi-Annual/
Quarterly |
| | | (29,865 | ) | | | — | | | | (29,865 | ) |
| | | | | | | | | | | | | | | | | | | | | | | | | | | | | | | | |
| | | | | | | | | | | | | | | | | | | | | | $ | 139,433 | | | $ | — | | | $ | 139,433 | |
| | | | | | | | | | | | | | | | | | | | | | | | | | | | | | | | |
CREDIT DEFAULT SWAPS (see Note D)
| | | | | | | | | | | | | | | | | | | | | | | | | | | | |
Swap
Counterparty & Referenced
Obligation | | Fixed
Rate
(Pay)
Receive | | | Payment
Frequency | | | Implied
Credit
Spread at
February 28,
2019 | | | Notional
Amount
(000) | | | Market
Value | | | Upfront
Premiums
Paid
(Received) | | | Unrealized
Appreciation/
(Depreciation) | |
Sale Contracts | | | | | | | | | | | | | | | | | | | | | | | | | | | | |
Credit Suisse International | | | | | | | | | | | | | | | | | | | | | | | | | | | | |
CDX-CMBX.NA.A Series 6, 5/11/63* | | | 2.00 | % | | | Monthly | | | | 2.69 | % | | USD | 1,529 | | | $ | (31,243 | ) | | $ | (29,447 | ) | | $ | (1,796 | ) |
Deutsche Bank AG | | | | | | | | | | | | | | | | | | | | | | | | | | | | |
CDX-CMBX.NA.A Series 6, 5/11/63* | | | 2.00 | | | | Monthly | | | | 2.69 | | | | 370 | | | | (7,560 | ) | | | (15,405 | ) | | | 7,845 | |
CDX-CMBX.NA.A Series 6, 5/11/63* | | | 2.00 | | | | Monthly | | | | 2.69 | | | | 53 | | | | (1,083 | ) | | | (508 | ) | | | (575 | ) |
Goldman Sachs International | | | | | | | | | | | | | | | | | | | | | | | | | | | | |
CDX-CMBX.NA.A Series 6, 5/11/63* | | | 2.00 | | | | Monthly | | | | 2.69 | | | | 56 | | | | (1,145 | ) | | | (409 | ) | | | (736 | ) |
| | |
| |
| 50 | AB CONSERVATIVE WEALTH STRATEGY | | abfunds.com |
PORTFOLIO OF INVESTMENTS(continued)
| | | | | | | | | | | | | | | | | | | | | | | | | | | | |
Swap
Counterparty & Referenced
Obligation | | Fixed
Rate
(Pay)
Receive | | | Payment
Frequency | | | Implied
Credit
Spread at
February 28,
2019 | | | Notional
Amount
(000) | | | Market
Value | | | Upfront
Premiums
Paid
(Received) | | | Unrealized
Appreciation/
(Depreciation) | |
CDX-CMBX.NA.A Series 6, 5/11/63* | | | 2.00 | % | | | Monthly | | | | 2.69 | % | | USD | 55 | | | $ | (1,123 | ) | | $ | (338 | ) | | $ | (785 | ) |
CDX-CMBX.NA.A Series 6, 5/11/63* | | | 2.00 | | | | Monthly | | | | 2.69 | | | | 111 | | | | (2,268 | ) | | | (640 | ) | | | (1,628 | ) |
Morgan Stanley & Co. International PLC | | | | | | | | | | | | | | | | | | | | | | | | | | | | |
CDX-CMBX.NA.A Series 6, 5/11/63* | | | 2.00 | | | | Monthly | | | | 2.69 | | | | 6 | | | | (122 | ) | | | (113 | ) | | | (9 | ) |
| | | | | | | | | | | | | | | | | | | | | | | | | | | | |
| | | | | | | | | | | | | | | | | | $ | (44,544 | ) | | $ | (46,860 | ) | | $ | 2,316 | |
| | | | | | | | | | | | | | | | | | | | | | | | | | | | |
INFLATION (CPI) SWAPS (see Note D)
| | | | | | | | | | | | | | | | | | | | | | |
| | | Rate Type | | | | | | | |
Swap
Counterparty | | Notional
Amount
(000) | | | Termination
Date | | Payments
made
by the
Fund | | | Payments
received
by the
Fund | | | Payment
Frequency
Paid/
Received | | | Unrealized
Appreciation/
(Depreciation) | |
Bank of America, NA | | USD | 6,116 | | | 7/31/21 | | | 2.230 | % | | | CPI | # | | | Maturity | | | $ | (85,630 | ) |
Bank of America, NA | | USD | 3,994 | | | 7/31/21 | | | 2.230 | % | | | CPI | # | | | Maturity | | | | (55,920 | ) |
Barclays Bank PLC | | USD | 23,020 | | | 7/18/22 | | | 1.937 | % | | | CPI | # | | | Maturity | | | | 91,973 | |
Goldman Sachs International | | USD | 1,230 | | | 1/18/23 | | | 2.206 | % | | | CPI | # | | | Maturity | | | | (13,919 | ) |
| | | | | | | | | | | | | | | | | | | | | | |
| | | $ | (63,496 | ) |
| | | | | | | | | | | | | | | | | | | | | | |
| # | Variable interest rate based on the rate of inflation as determined by the Consumer Price Index (CPI). |
TOTAL RETURN SWAPS (see Note D)
| | | | | | | | | | | | | | | | | | | | |
Counterparty &
Referenced
Obligation | | # of Shares
or Units | | | Rate Paid/
Received | | Payment
Frequency | | Notional
Amount
(000) | | | Maturity
Date | | | Unrealized
Appreciation/
(Depreciation) | |
Receive Total Return on Reference Obligation | |
Citibank, NA | | | | | | | | | |
CGABROE3(1) | | | 44,140 | | | LIBOR Plus 0.20% | | Quarterly | | USD | 4,841 | | | | 1/15/20 | | | $ | 14,311 | |
| | |
| |
| abfunds.com | | AB CONSERVATIVE WEALTH STRATEGY | 51 |
PORTFOLIO OF INVESTMENTS(continued)
| | | | | | | | | | | | | | | | | | | | | | |
Counterparty &
Referenced
Obligation | | # of Shares
or Units | | | Rate Paid/
Received | | Payment
Frequency | | | Notional
Amount
(000) | | | Maturity
Date | | | Unrealized
Appreciation/
(Depreciation) | |
Goldman Sachs International | | | | | | | | | | | | | | | | | | | | | | |
GSABLJHB(2) | | | 2,760,485 | | | LIBOR Plus 0.20% | | | Quarterly | | | JPY | 227,381 | | | | 2/17/20 | | | $ | 44,608 | |
JPMorgan Chase Bank, NA | | | | | | | | | | | | | | | | | | | | | | |
JPQABACP | | | 10,897 | | | 0.17% | | | Maturity | | | USD | 1,024 | | | | 6/17/19 | | | | (55,725 | ) |
| | | |
Pay Total Return on Reference Obligation | | | | | | | | | | | | | |
Citibank, NA | | | | | | | | | | | | | | | | | | | | | | |
Russell 1000 Index Total Return | | | 548 | | | LIBOR Plus 0.24% | | | Quarterly | | | USD | 4,819 | | | | 11/15/19 | | | | (11,733 | ) |
Goldman Sachs & Co. | | | | | | | | | | | | | | | | | | | | | | |
BB&T Corp. | | | 1,872 | | | LIBOR Minus 0.30% | | | Monthly | | | USD | 94 | | | | 1/05/21 | | | | (1,268 | ) |
BB&T Corp. | | | 3,749 | | | LIBOR Plus 0.35% | | | Monthly | | | USD | 186 | | | | 1/05/21 | | | | (5,245 | ) |
Chemical Financial Corp. | | | 6,015 | | | LIBOR Minus 0.30% | | | Monthly | | | USD | 272 | | | | 1/05/21 | | | | (2,827 | ) |
Entegris, Inc. | | | 912 | | | LIBOR Minus 0.30% | | | Monthly | | | USD | 30 | | | | 1/05/21 | | | | (2,099 | ) |
Entegris, Inc. | | | 2,644 | | | LIBOR Minus 0.30% | | | Monthly | | | USD | 88 | | | | 1/05/21 | | | | (4,835 | ) |
Entegris, Inc. | | | 2,942 | | | LIBOR Plus 0.30% | | | Annual | | | USD | 97 | | | | 1/05/21 | | | | (6,343 | ) |
Goldman Sachs International | | | | | | | | | | | | | | | | | | | | | | |
GSABSJHB(3) | | | 2,760,485 | | | LIBOR Minus 0.20% | | | Quarterly | | | JPY | 242,481 | | | | 2/17/20 | | | | (36,398 | ) |
Morgan Stanley Capital Services LLC | | | | | | | | | | | | | | | | | | | | | | |
Amcor Ltd. | | | 26,989 | | | BBR Plus 0.50% | | | Monthly | | | AUD | 367 | | | | 1/27/21 | | | | (27,452 | ) |
Ameris Bancorp | | | 483 | | | LIBOR Minus 0.30% | | | Monthly | | | USD | 20 | | | | 1/27/21 | | | | 150 | |
Ameris Bancorp | | | 130 | | | LIBOR Minus 0.30% | | | Annual | | | USD | 5 | | | | 1/27/21 | | | | – 0 | – |
Bristol-Myers Squibb Co. | | | 3,172 | | | LIBOR Plus 0.30% | | | Annual | | | USD | 156 | | | | 1/27/21 | | | | (7,550 | ) |
Encana Corp. | | | 39,648 | | | LIBOR Plus 0.30% | | | Monthly | | | USD | 270 | | | | 1/27/21 | | | | (16,284 | ) |
Fidelity National Financial, Inc. | | | 582 | | | LIBOR Minus 0.30% | | | Monthly | | | USD | 21 | | | | 1/27/21 | | | | 265 | |
Fidelity National Financial, Inc. | | | 1,606 | | | LIBOR Minus 0.30% | | | Monthly | | | USD | 56 | | | | 1/27/21 | | | | 33 | |
Fidelity National Financial, Inc. | | | 157 | | | LIBOR Minus 0.30% | | | Monthly | | | USD | 6 | | | | 1/27/21 | | | | 6 | |
| | |
| |
| 52 | AB CONSERVATIVE WEALTH STRATEGY | | abfunds.com |
PORTFOLIO OF INVESTMENTS(continued)
| | | | | | | | | | | | | | | | | | | | | | |
Counterparty &
Referenced
Obligation | | # of Shares
or Units | | | Rate Paid/
Received | | Payment
Frequency | | | Notional
Amount
(000) | | | Maturity
Date | | | Unrealized
Appreciation/
(Depreciation) | |
Fidelity National Financial, Inc. | | | 220 | | | LIBOR Minus 0.30% | | | Monthly | | | USD | 8 | | | | 1/27/21 | | | $ | (89 | ) |
Fidelity National Financial, Inc. | | | 658 | | | LIBOR Minus 0.30% | | | Monthly | | | USD | 23 | | | | 1/27/21 | | | | (214 | ) |
Fiserv, Inc. | | | 3,302 | | | LIBOR Plus 0.30% | | | Annual | | | USD | 275 | | | | 1/27/21 | | | | (3,666 | ) |
Harris Corp. | | | 1,783 | | | LIBOR Plus 0.30% | | | Annual | | | USD | 252 | | | | 1/27/21 | | | | (41,475 | ) |
II-VI, Inc. | | | 204 | | | LIBOR Minus 0.30% | | | Monthly | | | USD | 8 | | | | 1/27/21 | | | | (761 | ) |
II-VI, Inc. | | | 808 | | | LIBOR Minus 0.30% | | | Monthly | | | USD | 31 | | | | 1/27/21 | | | | (3,269 | ) |
II-VI, Inc. | | | 1,562 | | | LIBOR Plus 0.30% | | | Annual | | | USD | 53 | | | | 1/27/21 | | | | (13,427 | ) |
Independent Bank Corp. | | | 325 | | | LIBOR Plus 0.30% | | | Monthly | | | USD | 26 | | | | 1/27/21 | | | | (1,968 | ) |
Independent Bank Corp. | | | 1,505 | | | LIBOR Plus 0.30% | | | Annual | | | USD | 118 | | | | 1/27/21 | | | | (10,151 | ) |
KLA Corp. | | | 1,164 | | | LIBOR Plus 0.30% | | | Annual | | | USD | 114 | | | | 1/27/21 | | | | (20,549 | ) |
Newmont Mining Corp. | | | 1,048 | | | LIBOR Minus 0.30% | | | Monthly | | | USD | 35 | | | | 1/27/21 | | | | (287 | ) |
Newmont Mining Corp. | | | 7,613 | | | LIBOR Plus 0.30% | | | Annual | | | USD | 251 | | | | 1/27/21 | | | | (8,297 | ) |
T-Mobile US, Inc. | | | 3,615 | | | LIBOR Plus 0.30% | | | Annual | | | USD | 246 | | | | 1/27/21 | | | | (14,012 | ) |
Tivity Health, Inc. | | | 1,134 | | | LIBOR Plus 0.30% | | | Monthly | | | USD | 25 | | | | 1/27/21 | | | | 701 | |
UBS AG | | | | | | | | | | | | | | | | | | | | | | |
FTSE EPRANAREIT Developed Real Estate Index | | | 191 | | | LIBOR Plus 0.17% | | | Quarterly | | | USD | 896 | | | | 1/15/20 | | | | (105,429 | ) |
| | | | | | | | | | | | | | | | | | | | | | |
| | | | | | | | | | | | | | | | $ | (341,279 | ) |
| | | | | | | | | | | | | | | | | | | | | | |
VARIANCE SWAPS (see Note D)
| | | | | | | | | | | | | | | | | | | | | | | | |
Swap Counterparty &
Referenced Obligation | | Volatility
Strike
Rate | | | Payment
Frequency | | | Notional
Amount
(000) | | | Market
Value | | | Upfront
Premiums
(Paid)
Received | | | Unrealized
Appreciation/
(Depreciation) | |
Buy Contracts | | | | | | | | | | | | | | | | | | | | | | | | |
Bank of America, NA | | | | | | | | | | | | | | | | | | | | | | | | |
Russell 2000 Index 4/18/19* | | | 25.10 | % | | | Maturity | | | USD | 192 | | | $ | (114,498 | ) | | $ | – 0 | – | | $ | (114,498 | ) |
Citibank, NA | | | | | | | | | | | | | | | | | | | | | | | | |
Nasdaq 100 Stock Index 5/17/19* | | | 20.90 | | | | Maturity | | | USD | 120 | | | | (21,136 | ) | | | – 0 | – | | | (21,136 | ) |
S&P 500 Index 5/17/19* | | | 17.60 | | | | Maturity | | | USD | 143 | | | | (17,825 | ) | | | – 0 | – | | | (17,825 | ) |
JPMorgan Chase Bank, NA | | | | | | | | | | | | | | | | | | | | | | | | |
S&P/ASX 200 Index 4/18/19* | | | 17.69 | | | | Maturity | | | AUD | 128 | | | | (69,837 | ) | | | – 0 | – | | | (69,837 | ) |
| | |
| |
| abfunds.com | | AB CONSERVATIVE WEALTH STRATEGY | 53 |
PORTFOLIO OF INVESTMENTS(continued)
| | | | | | | | | | | | | | | | | | | | | | | | |
Swap Counterparty &
Referenced Obligation | | Volatility
Strike
Rate | | | Payment
Frequency | | | Notional
Amount
(000) | | | Market
Value | | | Upfront
Premiums
(Paid)
Received | | | Unrealized
Appreciation/
(Depreciation) | |
UBS AG | | | | | | | | | | | | | | | | | | | | | | | | |
S&P/ASX 200 Index 5/16/19* | | | 14.75 | % | | | Maturity | | | AUD | 136 | | | $ | (27,470 | ) | | $ | – 0 | – | | $ | (27,470 | ) |
| | | | | | |
Sale Contracts | | | | | | | | | | | | | | | | | | | | | | | | |
Citibank, NA | | | | | | | | | | | | | | | | | | | | | | | | |
Nasdaq 100 Stock Index 3/15/19* | | | 18.55 | | | | Maturity | | | USD | 67 | | | | 34,713 | | | | – 0 | – | | | 34,713 | |
Russell 2000 Index 3/15/19* | | | 16.65 | | | | Maturity | | | USD | 107 | | | | 42,893 | | | | – 0 | – | | | 42,893 | |
Russell 2000 Index 4/18/19* | | | 17.55 | | | | Maturity | | | USD | 134 | | | | 23,610 | | | | – 0 | – | | | 23,610 | |
S&P 500 Index 3/15/19* | | | 15.00 | | | | Maturity | | | USD | 24 | | | | 9,848 | | | | – 0 | – | | | 9,848 | |
JPMorgan Chase Bank, NA | | | | | | | | | | | | | | | | | | | | | | | | |
S&P/ASX 200 Index 3/21/19* | | | 12.90 | | | | Maturity | | | AUD | 45 | | | | 18,980 | | | | – 0 | – | | | 18,980 | |
UBS AG | | | | | | | | | | | | | | | | | | | | | | | | |
S&P/ASX 200 Index 4/18/19* | | | 13.65 | | | | Maturity | | | AUD | 98 | | | | 23,623 | | | | – 0 | – | | | 23,623 | |
| | | | | | | | | | | | | | | | | | | | | | | | |
| | | | | | | | | | | | | | $ | (97,099 | ) | | $ | – 0 | – | | $ | (97,099 | ) |
| | | | | | | | | | | | | | | | | | | | | | | | |
| ** | Notional amount less than 500. |
| (a) | Non-income producing security. |
| (b) | Security is exempt from registration under Rule 144A of the Securities Act of 1933. These securities are considered restricted, but liquid and may be resold in transactions exempt from registration, normally to qualified institutional buyers. At February 28, 2019, the aggregate market value of these securities amounted to $22,578,453 or 12.4% of net assets. |
| (c) | Represents entire or partial securities out on loan. See Note E for securities lending information. |
| (d) | To obtain a copy of the fund’s shareholder report, please go to the Securities and Exchange Commission’s website at www.sec.gov. Additionally, shareholder reports for AB funds can be obtained by calling AB at (800)227-4618. |
| (e) | Affiliated investments. |
| (f) | Position, or a portion thereof, has been segregated to collateralize OTC derivatives outstanding. |
| (g) | Coupon rate adjusts periodically based upon a predetermined schedule. Stated interest rate in effect at February 28, 2019. |
| (h) | Securities are perpetual and, thus, do not have a predetermined maturity date. The date shown, if applicable, reflects the next call date. |
| (i) | Floating Rate Security. Stated interest/floor/ceiling rate was in effect at February 28, 2019. |
| (j) | Security in which significant unobservable inputs (Level 3) were used in determining fair value. |
| (k) | The rate shown represents the7-day yield as of period end. |
| (l) | One contract relates to 1 share. |
| | |
| |
| 54 | AB CONSERVATIVE WEALTH STRATEGY | | abfunds.com |
PORTFOLIO OF INVESTMENTS(continued)
Currency Abbreviation:
AUD – Australian Dollar
BRL – Brazilian Real
CAD – Canadian Dollar
CHF – Swiss Franc
CLP – Chilean Peso
CNY – Chinese Yuan Renminbi
COP – Colombian Peso
CZK – Czech Koruna
EUR – Euro
GBP – Great British Pound
HKD – Hong Kong Dollar
IDR – Indonesian Rupiah
ILS – Israeli Shekel
INR – Indian Rupee
JPY – Japanese Yen
KRW – South Korean Won
MXN – Mexican Peso
MYR – Malaysian Ringgit
NOK – Norwegian Krone
NZD – New Zealand Dollar
PEN – Peruvian Sol
PHP – Philippine Peso
PLN – Polish Zloty
RUB – Russian Ruble
SEK – Swedish Krona
SGD – Singapore Dollar
THB – Thailand Baht
TRY – Turkish Lira
TWD – New Taiwan Dollar
USD – United States Dollar
UYU – Uruguayan Peso
ZAR – South African Rand
Glossary:
ABS – Asset-Backed Securities
ADR – American Depositary Receipt
ARMs – Adjustable Rate Mortgages
ASX – Australian Stock Exchange
BBR – Bank of England Base Rate
BKBM – Bank Bill Benchmark (New Zealand)
BOBL – Bundesobligationen
CDX-CMBX.NA – North American Commercial Mortgage-Backed Index
CDX-NAIG – North American Investment Grade Credit Default Swap Index
CMBS – Commercial Mortgage-Backed Securities
CME – Chicago Mercantile Exchange
CPI – Consumer Price Index
EAFE – Europe, Australia, and Far East
ETF – Exchange Traded Fund
EURIBOR – Euro Interbank Offered Rate
FTSE – Financial Times Stock Exchange
IBEX – International Business Exchange
LIBOR – London Interbank Offered Rates
MIB – Milano Italia Borsa
MSCI – Morgan Stanley Capital International
NIBOR – Norwegian Interbank Offered Rate
OAT – Obligations Assimilables du Trésor
OSE – Osaka Securities Exchange
PJSC – Public Joint Stock Company
SPI – Share Price Index
STIBOR – Stockholm Interbank Offered Rate
TBA – To Be Announced
TIPS – Treasury Inflation Protected Security
TOPIX – Tokyo Price Index
TSX – Toronto Stock Exchange
| | |
| |
| abfunds.com | | AB CONSERVATIVE WEALTH STRATEGY | 55 |
PORTFOLIO OF INVESTMENTS(continued)
| (1) | The following table represents the 50 largest equity basket holdings underlying the total return swap with CGABROE3 as of February 28, 2019. |
| | | | | | | | | | | | |
| Security Description | | Shares | | | Notional Value
as of 2/28/19 | | | Percent of
Basket’s Value | |
Progressive Corp. (The) | | | 184,259 | | | $ | 13,450,898 | | | | 2.8 | % |
Discover Financial Services | | | 181,215 | | | | 13,047,448 | | | | 2.7 | % |
Apple, Inc. | | | 74,395 | | | | 12,870,408 | | | | 2.6 | % |
Facebook, Inc. | | | 78,838 | | | | 12,692,844 | | | | 2.6 | % |
Exxon Mobil Corp. | | | 155,603 | | | | 12,292,645 | | | | 2.5 | % |
T Rowe Price Group, Inc. | | | 121,897 | | | | 12,189,749 | | | | 2.5 | % |
TJX Cos, Inc. (The) | | | 238,197 | | | | 12,148,058 | | | | 2.5 | % |
Ross Stores, Inc. | | | 127,799 | | | | 12,140,928 | | | | 2.5 | % |
Visa, Inc. | | | 81,977 | | | | 12,132,626 | | | | 2.5 | % |
3M Co. | | | 58,569 | | | | 12,123,781 | | | | 2.5 | % |
PepsiCo, Inc. | | | 101,018 | | | | 11,718,139 | | | | 2.4 | % |
Pfizer, Inc. | | | 260,111 | | | | 11,184,755 | | | | 2.3 | % |
UnitedHealth Group, Inc. | | | 46,100 | | | | 11,156,114 | | | | 2.3 | % |
Comcast Corp. | | | 270,214 | | | | 10,538,351 | | | | 2.2 | % |
Walt Disney Co. (The) | | | 87,376 | | | | 9,873,439 | | | | 2.0 | % |
Linde PLC | | | 54,749 | | | | 9,471,539 | | | | 1.9 | % |
Accenture PLC | | | 55,941 | | | | 9,006,452 | | | | 1.9 | % |
Texas Instruments, Inc. | | | 84,426 | | | | 8,949,140 | | | | 1.8 | % |
American Tower Corp. | | | 47,930 | | | | 8,435,712 | | | | 1.7 | % |
Las Vegas Sands Corp. | | | 137,999 | | | | 8,417,923 | | | | 1.7 | % |
Biogen, Inc. | | | 25,440 | | | | 8,344,320 | | | | 1.7 | % |
MarketAxess Holdings, Inc. | | | 33,151 | | | | 8,088,753 | | | | 1.7 | % |
Netflix, Inc. | | | 22,567 | | | | 8,078,911 | | | | 1.7 | % |
Costco Wholesale Corp. | | | 34,411 | | | | 7,536,030 | | | | 1.6 | % |
Automatic Data Processing, Inc. | | | 46,848 | | | | 7,167,807 | | | | 1.5 | % |
Ulta Beauty, Inc. | | | 22,107 | | | | 6,897,305 | | | | 1.4 | % |
SEI Investments Co. | | | 130,120 | | | | 6,896,338 | | | | 1.4 | % |
Illumina, Inc. | | | 21,764 | | | | 6,812,090 | | | | 1.4 | % |
Zoetis, Inc. | | | 71,769 | | | | 6,746,302 | | | | 1.4 | % |
Erie Indemnity Co. | | | 33,585 | | | | 5,978,104 | | | | 1.2 | % |
Edwards Lifesciences Corp. | | | 34,995 | | | | 5,914,207 | | | | 1.2 | % |
Regeneron Pharmaceuticals, Inc. | | | 13,294 | | | | 5,729,741 | | | | 1.2 | % |
Credit Acceptance Corp. | | | 12,835 | | | | 5,647,422 | | | | 1.2 | % |
Eaton Vance Corp. | | | 132,963 | | | | 5,584,448 | | | | 1.1 | % |
Applied Materials, Inc. | | | 142,170 | | | | 5,402,465 | | | | 1.1 | % |
Align Technology, Inc. | | | 20,203 | | | | 5,232,561 | | | | 1.1 | % |
Lam Research Corp. | | | 29,134 | | | | 5,127,623 | | | | 1.1 | % |
ON Semiconductor Corp. | | | 230,075 | | | | 4,831,580 | | | | 1.0 | % |
Paychex, Inc. | | | 60,216 | | | | 4,636,596 | | | | 1.0 | % |
Dominion Energy, Inc. | | | 61,872 | | | | 4,578,526 | | | | 0.9 | % |
Paycom Software, Inc. | | | 24,252 | | | | 4,413,938 | | | | 0.9 | % |
Cintas Corp. | | | 21,036 | | | | 4,354,390 | | | | 0.9 | % |
Fastenal Co. | | | 68,338 | | | | 4,305,268 | | | | 0.9 | % |
Laboratory Corp. of America Holdings | | | 28,838 | | | | 4,267,951 | | | | 0.9 | % |
NVR, Inc. | | | 1,596 | | | | 4,181,628 | | | | 0.9 | % |
Broadridge Financial Solutions | | | 40,620 | | | | 4,102,590 | | | | 0.8 | % |
CDW Corp./DE | | | 42,638 | | | | 4,007,961 | | | | 0.8 | % |
F5 Networks, Inc. | | | 23,675 | | | | 3,977,409 | | | | 0.8 | % |
| | |
| |
| 56 | AB CONSERVATIVE WEALTH STRATEGY | | abfunds.com |
PORTFOLIO OF INVESTMENTS(continued)
| | | | | | | | | | | | |
| Security Description | | Shares | | | Notional Value
as of 2/28/19 | | | Percent of
Basket’s Value | |
Exelon Corp. | | | 79,304 | | | $ | 3,885,910 | | | | 0.8 | % |
Fair Isaac Corp. | | | 15,447 | | | | 3,830,853 | | | | 0.8 | % |
Other | | | 1,576,495 | | | | 95,625,583 | | | | 19.7 | % |
| (2) | The following table represents the 50 largest equity basket holdings underlying the total return swap with GSABLJHB as of February 28, 2019. |
| | | | | | | | | | | | |
| Security Description | | Shares | | | Notional Value
as of 2/28/19 | | | Percent of
Basket’s Value | |
Sumitomo Dainippon Pharma Co., Ltd. | | | 1,617 | | | JPY | 4,442,480 | | | | 1.9 | % |
FamilyMart UNY Holdings Co., Ltd. | | | 1,288 | | | | 4,089,104 | | | | 1.7 | % |
Eisai Co., Ltd. | | | 412 | | | | 3,787,555 | | | | 1.6 | % |
Kikkoman Corp. | | | 623 | | | | 3,451,545 | | | | 1.5 | % |
Suzuken Co., Ltd./Aichi Japan | | | 544 | | | | 3,320,968 | | | | 1.4 | % |
Alfresa Holdings Corp. | | | 993 | | | | 3,203,606 | | | | 1.4 | % |
Fast Retailing Co., Ltd. | | | 60 | | | | 3,148,803 | | | | 1.3 | % |
Medipal Holdings Corp. | | | 1,191 | | | | 3,091,950 | | | | 1.3 | % |
Showa Shell Sekiyu KK | | | 1,805 | | | | 3,014,573 | | | | 1.3 | % |
TIS, Inc. | | | 573 | | | | 2,969,125 | | | | 1.3 | % |
Shiseido Co., Ltd. | | | 402 | | | | 2,952,427 | | | | 1.3 | % |
Tokyo Gas Co., Ltd. | | | 957 | | | | 2,934,591 | | | | 1.3 | % |
Sumitomo Realty & Development | | | 663 | | | | 2,761,033 | | | | 1.2 | % |
Dai Nippon Printing Co., Ltd. | | | 1,058 | | | | 2,728,469 | | | | 1.2 | % |
Sony Financial Holdings, Inc. | | | 1,288 | | | | 2,712,046 | | | | 1.2 | % |
Konica Minolta, Inc. | | | 2,483 | | | | 2,681,190 | | | | 1.2 | % |
Taiyo Nippon Sanso Corp. | | | 1,699 | | | | 2,671,854 | | | | 1.1 | % |
Mitsui Fudosan Co., Ltd. | | | 1,006 | | | | 2,654,905 | | | | 1.1 | % |
Mitsubishi Estate Co., Ltd. | | | 1,359 | | | | 2,599,488 | | | | 1.1 | % |
Yokogawa Electric Corp. | | | 1,204 | | | | 2,580,474 | | | | 1.1 | % |
Sompo Holdings, Inc. | | | 616 | | | | 2,561,255 | | | | 1.1 | % |
Nichirei Corp. | | | 912 | | | | 2,527,404 | | | | 1.1 | % |
SoftBank Group Corp. | | | 245 | | | | 2,520,721 | | | | 1.1 | % |
Iida Group Holdings Co., Ltd. | | | 1,226 | | | | 2,493,576 | | | | 1.1 | % |
Marui Group Co., Ltd. | | | 1,272 | | | | 2,492,142 | | | | 1.1 | % |
Kyowa Hakko Kirin Co., Ltd. | | | 1,144 | | | | 2,431,338 | | | | 1.0 | % |
Electric Power Development Co. | | | 871 | | | | 2,425,278 | | | | 1.0 | % |
Casio Computer Co., Ltd. | | | 1,596 | | | | 2,412,128 | | | | 1.0 | % |
Hitachi Capital Corp. | | | 912 | | | | 2,406,202 | | | | 1.0 | % |
SBI Holdings, Inc./Japan | | | 1,026 | | | | 2,405,217 | | | | 1.0 | % |
Nippon Electric Glass Co., Ltd. | | | 793 | | | | 2,386,697 | | | | 1.0 | % |
Toyoda Gosei Co., Ltd. | | | 942 | | | | 2,374,783 | | | | 1.0 | % |
Nippon Express Co., Ltd. | | | 361 | | | | 2,374,055 | | | | 1.0 | % |
Sumitomo Heavy Industries Ltd. | | | 616 | | | | 2,348,722 | | | | 1.0 | % |
Toyota Tsusho Corp. | | | 660 | | | | 2,332,124 | | | | 1.0 | % |
TDK Corp. | | | 265 | | | | 2,305,284 | | | | 1.0 | % |
Yokohama Rubber Co., Ltd. (The) | | | 1,011 | | | | 2,296,894 | | | | 1.0 | % |
Kirin Holdings Co., Ltd. | | | 921 | | | | 2,292,024 | | | | 1.0 | % |
Sanwa Holdings Corp. | | | 1,773 | | | | 2,289,114 | | | | 1.0 | % |
Oji Holdings Corp. | | | 3,458 | | | | 2,288,931 | | | | 1.0 | % |
Isuzu Motors Ltd. | | | 1,434 | | | | 2,288,641 | | | | 1.0 | % |
Trend Micro, Inc./Japan | | | 416 | | | | 2,281,555 | | | | 1.0 | % |
Idemitsu Kosan Co., Ltd. | | | 576 | | | | 2,275,070 | | | | 1.0 | % |
| | |
| |
| abfunds.com | | AB CONSERVATIVE WEALTH STRATEGY | 57 |
PORTFOLIO OF INVESTMENTS(continued)
| | | | | | | | | | | | |
| Security Description | | Shares | | | Notional Value
as of 2/28/19 | | | Percent of
Basket’s Value | |
NGK Spark Plug Co., Ltd. | | | 956 | | | | JPY 2,261,610 | | | | 1.0 | % |
Fukuoka Financial Group, Inc. | | | 938 | | | | 2,258,295 | | | | 1.0 | % |
Keikyu Corp. | | | 1,223 | | | | 2,256,809 | | | | 1.0 | % |
Fuji Electric Co., Ltd. | | | 642 | | | | 2,246,829 | | | | 1.0 | % |
Kose Corp. | | | 124 | | | | 2,228,374 | | | | 1.0 | % |
DIC Corp. | | | 626 | | | | 2,216,892 | | | | 1.0 | % |
Kyocera Corp. | | | 359 | | | | 2,204,145 | | | | 0.9 | % |
Other | | | 64,421 | | | | 100,071,729 | | | | 43.1 | % |
| (3) | The following table represents the 50 largest equity basket holdings underlying the total return swap with GSABSJHB as of February 28, 2019. |
| | | | | | | | | | | | |
| Security Description | | Shares | | | Notional Value
as of 2/28/19 | | | Percent of
Basket’s Value | |
Keihan Holdings Co., Ltd. | | | (811 | ) | | JPY | (3,738,292 | ) | | | (1.5 | %) |
Asahi Intecc Co., Ltd. | | | (692 | ) | | | (3,701,942 | ) | | | (1.5 | %) |
Bandai Namco Holdings, Inc. | | | (745 | ) | | | (3,532,322 | ) | | | (1.4 | %) |
Nissan Chemical Corp. | | | (620 | ) | | | (3,483,482 | ) | | | (1.4 | %) |
Kyushu Railway Co. | | | (820 | ) | | | (3,125,090 | ) | | | (1.3 | %) |
Oriental Land Co., Ltd./Japan | | | (255 | ) | | | (3,121,482 | ) | | | (1.3 | %) |
Astellas Pharma, Inc. | | | (1,759 | ) | | | (3,021,601 | ) | | | (1.2 | %) |
Ezaki Glico Co., Ltd. | | | (525 | ) | | | (2,962,327 | ) | | | (1.2 | %) |
Azbil Corp. | | | (1,148 | ) | | | (2,822,603 | ) | | | (1.1 | %) |
West Japan Railway Co. | | | (336 | ) | | | (2,817,436 | ) | | | (1.1 | %) |
McDonald’s Holdings Co. Japan Ltd. | | | (562 | ) | | | (2,803,023 | ) | | | (1.1 | %) |
Marubeni Corp. | | | (3,396 | ) | | | (2,699,592 | ) | | | (1.1 | %) |
KDDI Corp. | | | (1,000 | ) | | | (2,687,951 | ) | | | (1.1 | %) |
SCSK Corp. | | | (535 | ) | | | (2,604,259 | ) | | | (1.1 | %) |
Park24 Co., Ltd. | | | (969 | ) | | | (2,592,330 | ) | | | (1.1 | %) |
MEIJI Holdings Co., Ltd. | | | (290 | ) | | | (2,560,330 | ) | | | (1.0 | %) |
NTT DOCOMO, Inc. | | | (986 | ) | | | (2,555,678 | ) | | | (1.0 | %) |
Japan Post Insurance Co., Ltd. | | | (996 | ) | | | (2,508,308 | ) | | | (1.0 | %) |
Nippon Telegraph & Telephone Corp. | | | (518 | ) | | | (2,487,509 | ) | | | (1.0 | %) |
Fuji Media Holdings, Inc. | | | (1,502 | ) | | | (2,448,836 | ) | | | (1.0 | %) |
Japan Airlines Co., Ltd. | | | (595 | ) | | | (2,420,055 | ) | | | (1.0 | %) |
Daito Trust Construction Co., Ltd. | | | (156 | ) | | | (2,403,280 | ) | | | (1.0 | %) |
Tobu Railway Co., Ltd. | | | (768 | ) | | | (2,388,788 | ) | | | (1.0 | %) |
ANA Holdings, Inc. | | | (576 | ) | | | (2,380,934 | ) | | | (1.0 | %) |
Otsuka Holdings Co., Ltd. | | | (506 | ) | | | (2,349,712 | ) | | | (1.0 | %) |
Zenkoku Hosho Co., Ltd. | | | (568 | ) | | | (2,327,535 | ) | | | (0.9 | %) |
Rakuten, Inc. | | | (2,647 | ) | | | (2,318,620 | ) | | | (0.9 | %) |
Nissan Motor Co., Ltd. | | | (2,398 | ) | | | (2,306,932 | ) | | | (0.9 | %) |
Japan Post Bank Co., Ltd. | | | (1,846 | ) | | | (2,294,842 | ) | | | (0.9 | %) |
Makita Corp. | | | (558 | ) | | | (2,200,957 | ) | | | (0.9 | %) |
Hoshizaki Corp. | | | (288 | ) | | | (2,172,337 | ) | | | (0.9 | %) |
Nihon M&A Center, Inc. | | | (772 | ) | | | (2,170,710 | ) | | | (0.9 | %) |
Japan Tobacco, Inc. | | | (766 | ) | | | (2,170,173 | ) | | | (0.9 | %) |
Canon, Inc. | | | (673 | ) | | | (2,155,313 | ) | | | (0.9 | %) |
Yamaguchi Financial Group, Inc. | | | (2,075 | ) | | | (2,153,514 | ) | | | (0.9 | %) |
Teijin Ltd. | | | (1,127 | ) | | | (2,104,208 | ) | | | (0.9 | %) |
Nitori Holdings Co., Ltd. | | | (149 | ) | | | (2,063,407 | ) | | | (0.8 | %) |
Rinnai Corp. | | | (273 | ) | | | (2,048,343 | ) | | | (0.8 | %) |
| | |
| |
| 58 | AB CONSERVATIVE WEALTH STRATEGY | | abfunds.com |
PORTFOLIO OF INVESTMENTS(continued)
| | | | | | | | | | | | |
| Security Description | | Shares | | | Notional Value
as of 2/28/19 | | | Percent of
Basket’s Value | |
Takeda Pharmaceutical Co., Ltd. | | | (446 | ) | | | JPY (1,992,752 | ) | | | (0.8 | %) |
Aozora Bank Ltd. | | | (617 | ) | | | (1,981,826 | ) | | | (0.8 | %) |
Shimamura Co., Ltd. | | | (209 | ) | | | (1,971,154 | ) | | | (0.8 | %) |
Toray Industries, Inc. | | | (2,539 | ) | | | (1,970,525 | ) | | | (0.8 | %) |
Ono Pharmaceutical Co., Ltd. | | | (858 | ) | | | (1,962,021 | ) | | | (0.8 | %) |
Kansai Paint Co., Ltd. | | | (957 | ) | | | (1,958,596 | ) | | | (0.8 | %) |
Ryohin Keikaku Co., Ltd. | | | (70 | ) | | | (1,854,421 | ) | | | (0.8 | %) |
Sumitomo Metal Mining Co., Ltd. | | | (568 | ) | | | (1,852,646 | ) | | | (0.8 | %) |
Seria Co., Ltd. | | | (491 | ) | | | (1,849,755 | ) | | | (0.8 | %) |
Sundrug Co., Ltd. | | | (530 | ) | | | (1,808,349 | ) | | | (0.7 | %) |
Hikari Tsushin, Inc. | | | (90 | ) | | | (1,792,981 | ) | | | (0.7 | %) |
Aeon Co., Ltd. | | | (758 | ) | | | (1,777,930 | ) | | | (0.7 | %) |
Other | | | (46,548 | ) | | | (125,034,304 | ) | | | (50.7 | %) |
See notes to financial statements.
| | |
| |
| abfunds.com | | AB CONSERVATIVE WEALTH STRATEGY | 59 |
STATEMENT OF ASSETS & LIABILITIES
February 28, 2019(unaudited)
| | | | |
| Assets | | | | |
Investments in securities, at value | | | | |
Unaffiliated issuers (cost $120,046,106) | | $ | 126,455,393 | (a) |
Affiliated issuers (cost $59,846,013—including investment of cash collateral for securities loaned of $2,905,070) | | | 58,023,884 | |
Cash collateral due from broker | | | 2,717,601 | |
Foreign currencies, at value (cost $638,013) | | | 641,013 | |
Receivable for investment securities sold and foreign currency transactions | | | 1,385,065 | |
Unrealized appreciation on forward currency exchange contracts | | | 629,923 | |
Unaffiliated interest and dividends receivable | | | 420,616 | |
Unrealized appreciation on variance swaps | | | 153,667 | |
Affiliated dividends receivable | | | 115,315 | |
Unrealized appreciation on inflation swaps | | | 91,973 | |
Unrealized appreciation on total return swaps | | | 60,074 | |
Receivable for shares of beneficial interest sold | | | 5,545 | |
Other assets | | | 73,413 | |
| | | | |
Total assets | | | 190,773,482 | |
| | | | |
| Liabilities | | | | |
Due to custodian | | | 13,667 | |
Options written, at value (premiums received $22,825) | | | 1,160 | |
Payable for investment securities purchased and foreign currency transactions | | | 3,699,727 | |
Payable for collateral received on securities loaned | | | 2,905,070 | |
Unrealized depreciation on forward currency exchange contracts | | | 470,985 | |
Unrealized depreciation on total return swaps | | | 401,353 | |
Unrealized depreciation on variance swaps | | | 250,766 | |
Payable for shares of beneficial interest redeemed | | | 219,413 | |
Unrealized depreciation on inflation swaps | | | 155,469 | |
Payable for variation margin on futures | | | 84,647 | |
Payable for variation margin on centrally cleared swaps | | | 82,560 | |
Advisory fee payable | | | 55,604 | |
Distribution fee payable | | | 45,787 | |
Market value on credit default swaps (net premiums received $46,860) | | | 44,544 | |
Transfer Agent fee payable | | | 16,544 | |
Payable for terminated total return swaps | | | 12,120 | |
Trustees’ fees payable | | | 6,294 | |
Accrued expenses and other liabilities | | | 120,802 | |
| | | | |
Total liabilities | | | 8,586,512 | |
| | | | |
Net Assets | | $ | 182,186,970 | |
| | | | |
| Composition of Net Assets | | | | |
Shares of beneficial interest, at par | | $ | 152 | |
Additionalpaid-in capital | | | 179,575,311 | |
Distributable earnings | | | 2,611,507 | |
| | | | |
| | $ | 182,186,970 | |
| | | | |
| (a) | Includes securities on loan with a value of $2,822,498 (see Note E). |
See notes to financial statements.
| | |
| |
| 60 | AB CONSERVATIVE WEALTH STRATEGY | | abfunds.com |
STATEMENT OF ASSETS & LIABILITIES(continued)
Net Asset Value Per Share—unlimited shares authorized, $.00001 par value
| | | | | | | | | | | | |
| Class | | Net Assets | | | Shares Outstanding | | | Net Asset Value | |
| |
| A | | $ | 145,806,922 | | | | 12,143,731 | | | $ | 12.01 | * |
| |
| B | | $ | 839,683 | | | | 68,435 | | | $ | 12.27 | |
| |
| C | | $ | 18,575,519 | | | | 1,549,361 | | | $ | 11.99 | |
| |
| Advisor | | $ | 6,454,168 | | | | 535,461 | | | $ | 12.05 | |
| |
| R | | $ | 4,193,225 | | | | 348,618 | | | $ | 12.03 | |
| |
| K | | $ | 6,307,562 | | | | 526,215 | | | $ | 11.99 | |
| |
| I | | $ | 9,891 | | | | 812 | | | $ | 12.18 | |
| |
| * | The maximum offering price per share for Class A shares was $12.54 which reflects a sales charge of 4.25%. |
See notes to financial statements.
| | |
| |
| abfunds.com | | AB CONSERVATIVE WEALTH STRATEGY | 61 |
STATEMENT OF OPERATIONS
Six Months Ended February 28, 2019(unaudited)
| | | | | | | | |
| Investment Income | | | | | | | | |
Dividends | | | | | | | | |
Unaffiliated issuers (net of foreign taxes withheld of $14,872) | | $ | 663,053 | | | | | |
Affiliated issuers | | | 1,192,533 | | | | | |
Interest (net of foreign taxes withheld of $301) | | | 558,512 | | | | | |
Securities lending income | | | 15,235 | | | | | |
Other income | | | 110 | | | $ | 2,429,443 | |
| | | | | | | | |
| Expenses | | | | | | | | |
Advisory fee (see Note B) | | | 511,695 | | | | | |
Distribution fee—Class A | | | 185,726 | | | | | |
Distribution fee—Class B | | | 4,651 | | | | | |
Distribution fee—Class C | | | 96,449 | | | | | |
Distribution fee—Class R | | | 9,654 | | | | | |
Distribution fee—Class K | | | 7,934 | | | | | |
Transfer agency—Class A | | | 79,921 | | | | | |
Transfer agency—Class B | | | 612 | | | | | |
Transfer agency—Class C | | | 10,748 | | | | | |
Transfer agency—Advisor Class | | | 3,787 | | | | | |
Transfer agency—Class R | | | 4,854 | | | | | |
Transfer agency—Class K | | | 6,348 | | | | | |
Transfer agency—Class I | | | 6 | | | | | |
Custodian | | | 106,638 | | | | | |
Registration fees | | | 43,131 | | | | | |
Audit and tax | | | 41,381 | | | | | |
Printing | | | 25,113 | | | | | |
Legal | | | 22,449 | | | | | |
Trustees’ fees | | | 12,439 | | | | | |
Miscellaneous | | | 16,960 | | | | | |
| | | | | | | | |
Total expenses before bank overdraft expense | | | 1,190,496 | | | | | |
Bank overdraft expense | | | 5,148 | | | | | |
| | | | | | | | |
Total expenses | | | 1,195,644 | | | | | |
Less: expenses waived and reimbursed by the Adviser (see Notes B & E) | | | (180,569 | ) | | | | |
| | | | | | | | |
Net expenses | | | | | | | 1,015,075 | |
| | | | | | | | |
Net investment income | | | | | | | 1,414,368 | |
| | | | | | | | |
See notes to financial statements.
| | |
| |
| 62 | AB CONSERVATIVE WEALTH STRATEGY | | abfunds.com |
STATEMENT OF OPERATIONS(continued)
| | | | | | | | |
| Realized and Unrealized Gain (Loss) on Investment and Foreign Currency Transactions | | | | | | | | |
Net realized gain (loss) on: | | | | | | | | |
Affiliated Underlying Portfolios | | | | | | $ | (2,306,897 | ) |
Investment transactions(a) | | | | | | | 1,391,880 | |
Forward currency exchange contracts | | | | | | | 350,575 | |
Futures | | | | | | | 121,338 | |
Options written | | | | | | | (404,526 | ) |
Swaps | | | | | | | 427,078 | |
Foreign currency transactions | | | | | | | 221,955 | |
Net change in unrealized appreciation/depreciation of: | | | | | | | | |
Affiliated Underlying Portfolios | | | | | | | (127,177 | ) |
Investments | | | | | | | (1,896,882 | ) |
Forward currency exchange contracts | | | | | | | (217,156 | ) |
Futures | | | | | | | 668,256 | |
Options written | | | | | | | (22,108 | ) |
Swaps | | | | | | | (672,616 | ) |
Foreign currency denominated assets and liabilities | | | | | | | 3,092 | |
| | | | | | | | |
Net loss on investment and foreign currency transactions | | | | | | | (2,463,188 | ) |
| | | | | | | | |
Net Decrease in Net Assets from Operations | | | | | | $ | (1,048,820 | ) |
| | | | | | | | |
| (a) | Net of foreign capital gains taxes of $588. |
See notes to financial statements.
| | |
| |
| abfunds.com | | AB CONSERVATIVE WEALTH STRATEGY | 63 |
STATEMENT OF CHANGES IN NET ASSETS
| | | | | | | | |
| | | Six Months Ended
February 28, 2019
(unaudited) | | | Year Ended
August 31,
2018 | |
| Increase (Decrease) in Net Assets from Operations | | | | | | | | |
Net investment income | | $ | 1,414,368 | | | $ | 2,782,199 | |
Net realized loss on investment transactions | | | (198,597 | ) | | | (1,265,904 | ) |
Net change in unrealized appreciation/depreciation of investments and foreign currency denominated assets and liabilities | | | (2,264,591 | ) | | | 3,117,869 | |
| | | | | | | | |
Net increase (decrease) in net assets from operations | | | (1,048,820 | ) | | | 4,634,164 | |
Distributions to Shareholders* | | | | | | | | |
Class A | | | (1,166,247 | ) | | | (9,850,368 | ) |
Class B | | | – 0 | – | | | (56,946 | ) |
Class C | | | – 0 | – | | | (1,498,377 | ) |
Advisor Class | | | (74,104 | ) | | | (525,912 | ) |
Class R | | | (15,968 | ) | | | (213,832 | ) |
Class K | | | (44,323 | ) | | | (384,932 | ) |
Class I | | | (105 | ) | | | (1,841 | ) |
Return of capital | | | | | | | | |
Class A | | | – 0 | – | | | (2,552,102 | ) |
Class B | | | – 0 | – | | | (13,216 | ) |
Class C | | | – 0 | – | | | (350,112 | ) |
Advisor Class | | | – 0 | – | | | (137,962 | ) |
Class R | | | – 0 | – | | | (53,905 | ) |
Class K | | | – 0 | – | | | (99,145 | ) |
Class I | | | – 0 | – | | | (452 | ) |
| Transactions in Shares of Beneficial Interest | | | | | | | | |
Net decrease | | | (18,476,090 | ) | | | (24,160,136 | ) |
| | | | | | | | |
Total decrease | | | (20,825,657 | ) | | | (35,265,074 | ) |
| Net Assets | | | | | | | | |
Beginning of period | | | 203,012,627 | | | | 238,277,701 | |
| | | | | | | | |
End of period | | $ | 182,186,970 | | | $ | 203,012,627 | |
| | | | | | | | |
| * | The prior year’s amounts have been reclassified to conform with the current year’s presentation. See Note J, Recent Accounting Pronouncements, in the Notes to Financial Statements for more information. |
See notes to financial statements.
| | |
| |
| 64 | AB CONSERVATIVE WEALTH STRATEGY | | abfunds.com |
NOTES TO FINANCIAL STATEMENTS
February 28, 2019(unaudited)
NOTE A
Significant Accounting Policies
The AB Portfolios (the “Company”) was organized as a Massachusetts Business Trust on March 26, 1987 and is registered under the Investment Company Act of 1940 as a diversified, open end management investment company. The Company operates as a series company currently comprised of six series. Each series is considered to be a separate entity for financial reporting and tax purposes. This report relates only to the AB Conservative Wealth Strategy (the “Fund”). The Fund offers Class A, Class B, Class C, Advisor Class, Class R, Class K and Class I shares. Class T shares have been authorized but currently are not offered. Class A shares are sold with afront-end sales charge of up to 4.25% for purchases not exceeding $1,000,000. With respect to purchases of $1,000,000 or more, Class A shares redeemed within one year of purchase may be subject to a contingent deferred sales charge of 1%. Class B shares are currently sold with a contingent deferred sales charge which declines from 4% to 0% depending on the period of time the shares are held. Effective January 31, 2009, sales of Class B shares of the Fund to new investors were suspended. Class B shares will only be issued (i) upon the exchange of Class B shares from another AB mutual fund, (ii) for purposes of dividend reinvestment, (iii) through the Fund’s Automatic Investment Program (the “Program”) for accounts that established the Program prior to January 31, 2009, and (iv) for purchases of additional shares by Class B shareholders as of January 31, 2009. The ability to establish a new Program for accounts containing Class B shares was suspended as of January 31, 2009. Class B shares will automatically convert to Class A shares eight years after the end of the calendar month of purchase. Class C shares are subject to a contingent deferred sales charge of 1% on redemptions made within the first year after purchase, and 0% after the first year of purchase. Class C shares will automatically convert to Class A shares ten years after the end of the calendar month of purchase. Class R and Class K shares are sold without an initial or contingent deferred sales charge. Advisor Class and Class I shares are sold without an initial or contingent deferred sales charge and are not subject to ongoing distribution expenses. All eight classes of shares have identical voting, dividend, liquidation and other rights, except that the classes bear different distribution and transfer agency expenses. Each class has exclusive voting rights with respect to its distribution plan. The financial statements have been prepared in conformity with U.S. generally accepted accounting principles (“U.S. GAAP”) which require management to make certain estimates and assumptions that affect the reported amounts of assets and liabilities in the financial statements and amounts of income and expenses during the reporting period. Actual results could differ from those estimates. The Fund is an investment company under U.S. GAAP
| | |
| |
| abfunds.com | | AB CONSERVATIVE WEALTH STRATEGY | 65 |
NOTES TO FINANCIAL STATEMENTS(continued)
and follows the accounting and reporting guidance applicable to investment companies. The following is a summary of significant accounting policies followed by the Fund.
1. Security Valuation
Portfolio securities are valued at their current market value determined on the basis of market quotations or, if market quotations are not readily available or are deemed unreliable, at “fair value” as determined in accordance with procedures established by and under the general supervision of the Company’s Board of Trustees (the “Board”).
In general, the market values of securities which are readily available and deemed reliable are determined as follows: securities listed on a national securities exchange (other than securities listed on the NASDAQ Stock Market, Inc. (“NASDAQ”)) or on a foreign securities exchange are valued at the last sale price at the close of the exchange or foreign securities exchange. If there has been no sale on such day, the securities are valued at the last traded price from the previous day. Securities listed on more than one exchange are valued by reference to the principal exchange on which the securities are traded; securities listed only on NASDAQ are valued in accordance with the NASDAQ Official Closing Price; listed or over the counter (“OTC”) market put or call options are valued at the mid level between the current bid and ask prices. If either a current bid or current ask price is unavailable, AllianceBernstein L.P. (the “Adviser”) will have discretion to determine the best valuation (e.g., last trade price in the case of listed options); open futures are valued using the closing settlement price or, in the absence of such a price, the most recent quoted bid price. If there are no quotations available for the day of valuation, the last available closing settlement price is used; U.S. Government securities and any other debt instruments having 60 days or less remaining until maturity are generally valued at market by an independent pricing vendor, if a market price is available. If a market price is not available, the securities are valued at amortized cost. This methodology is commonly used for short term securities that have an original maturity of 60 days or less, as well as short term securities that had an original term to maturity that exceeded 60 days. In instances when amortized cost is utilized, the Valuation Committee (the “Committee”) must reasonably conclude that the utilization of amortized cost is approximately the same as the fair value of the security. Such factors the Committee will consider include, but are not limited to, an impairment of the creditworthiness of the issuer or material changes in interest rates. Fixed-income securities, including mortgage-backed and asset-backed securities, may be valued on the basis of prices provided by a pricing service or at a price obtained from one or more of the major broker-dealers. In cases where broker-dealer quotes are obtained, the Adviser may establish procedures whereby changes in market yields or
| | |
| |
| 66 | AB CONSERVATIVE WEALTH STRATEGY | | abfunds.com |
NOTES TO FINANCIAL STATEMENTS(continued)
spreads are used to adjust, on a daily basis, a recently obtained quoted price on a security. Swaps and other derivatives are valued daily, primarily using independent pricing services, independent pricing models using market inputs, as well as third party broker-dealers or counterparties. Open end mutual funds are valued at the closing net asset value per share, while exchange traded funds are valued at the closing market price per share.
Securities for which market quotations are not readily available (including restricted securities) or are deemed unreliable are valued at fair value as deemed appropriate by the Adviser. Factors considered in making this determination may include, but are not limited to, information obtained by contacting the issuer, analysts, analysis of the issuer’s financial statements or other available documents. In addition, the Fund may use fair value pricing for securities primarily traded innon-U.S. markets because most foreign markets close well before the Fund values its securities at 4:00 p.m., Eastern Time. The earlier close of these foreign markets gives rise to the possibility that significant events, including broad market moves, may have occurred in the interim and may materially affect the value of those securities. To account for this, the Fund generally values many of its foreign equity securities using fair value prices based on third party vendor modeling tools to the extent available.
2. Fair Value Measurements
In accordance with U.S. GAAP regarding fair value measurements, fair value is defined as the price that the Fund would receive to sell an asset or pay to transfer a liability in an orderly transaction between market participants at the measurement date. U.S. GAAP establishes a framework for measuring fair value, and a three-level hierarchy for fair value measurements based upon the transparency of inputs to the valuation of an asset or liability (including those valued based on their market values as described in Note A.1 above). Inputs may be observable or unobservable and refer broadly to the assumptions that market participants would use in pricing the asset or liability. Observable inputs reflect the assumptions market participants would use in pricing the asset or liability based on market data obtained from sources independent of the Fund. Unobservable inputs reflect the Fund’s own assumptions about the assumptions that market participants would use in pricing the asset or liability based on the best information available in the circumstances. Each investment is assigned a level based upon the observability of the inputs which are significant to the overall valuation. The three-tier hierarchy of inputs is summarized below.
| | • | | Level 1—quoted prices in active markets for identical investments |
| | • | | Level 2—other significant observable inputs (including quoted prices for similar investments, interest rates, prepayment speeds, credit risk, etc.) |
| | |
| |
| abfunds.com | | AB CONSERVATIVE WEALTH STRATEGY | 67 |
NOTES TO FINANCIAL STATEMENTS(continued)
| | • | | Level 3—significant unobservable inputs (including the Fund’s own assumptions in determining the fair value of investments) |
The fair value of debt instruments, such as bonds, andover-the-counter derivatives is generally based on market price quotations, recently executed market transactions (where observable) or industry recognized modeling techniques and are generally classified as Level 2. Pricing vendor inputs to Level 2 valuations may include quoted prices for similar investments in active markets, interest rate curves, coupon rates, currency rates, yield curves, option adjusted spreads, default rates, credit spreads and other unique security features in order to estimate the relevant cash flows which are then discounted to calculate fair values. If these inputs are unobservable and significant to the fair value, these investments will be classified as Level 3. In addition,non-agency rated investments are classified as Level 3.
Where readily available market prices or relevant bid prices are not available for certain equity investments, such investments may be valued based on similar publicly traded investments, movements in relevant indices since last available prices or based upon underlying company fundamentals and comparable company data (such as multiples to earnings or other multiples to equity). Where an investment is valued using an observable input, such as another publicly traded security, the investment will be classified as Level 2. If management determines that an adjustment is appropriate based on restrictions on resale, illiquidity or uncertainty, and such adjustment is a significant component of the valuation, the investment will be classified as Level 3. An investment will also be classified as Level 3 where management uses company fundamentals and other significant inputs to determine the valuation.
Options are valued using market-based inputs to models, broker or dealer quotations, or alternative pricing sources with reasonable levels of price transparency, where such inputs and models are available. Alternatively, the values may be obtained through unobservable management determined inputs and/or management’s proprietary models. Where models are used, the selection of a particular model to value an option depends upon the contractual terms of, and specific risks inherent in, the option as well as the availability of pricing information in the market. Valuation models require a variety of inputs, including contractual terms, market prices, measures of volatility and correlations of such inputs. Exchange traded options generally will be classified as Level 2. For options that do not trade on exchange but trade in liquid markets, inputs can generally be verified and model selection does not involve significant management judgment. Options are classified within Level 2 on the fair value hierarchy when all of the significant inputs can be corroborated to market evidence. Otherwise such instruments are classified as Level 3.
| | |
| |
| 68 | AB CONSERVATIVE WEALTH STRATEGY | | abfunds.com |
NOTES TO FINANCIAL STATEMENTS(continued)
Valuations of mortgage-backed or other asset-backed securities, by pricing vendors, are based on both proprietary and industry recognized models and discounted cash flow techniques. Significant inputs to the valuation of these instruments are value of the collateral, the rates and timing of delinquencies, the rates and timing of prepayments, and default and loss expectations, which are driven in part by housing prices for residential mortgages. Significant inputs are determined based on relative value analyses, which incorporate comparisons to instruments with similar collateral and risk profiles, including relevant indices. Mortgage and asset-backed securities for which management has collected current observable data through pricing services are generally categorized within Level 2. Those investments for which current observable data has not been provided are classified as Level 3.
Other fixed income investments, includingnon-U.S. government and corporate debt, are generally valued using quoted market prices, if available, which are typically impacted by current interest rates, maturity dates and any perceived credit risk of the issuer. Additionally, in the absence of quoted market prices, these inputs are used by pricing vendors to derive a valuation based upon industry or proprietary models which incorporate issuer specific data with relevant yield/spread comparisons with more widely quoted bonds with similar key characteristics. Those investments for which there are observable inputs are classified as Level 2. Where the inputs are not observable, the investments are classified as Level 3.
The following table summarizes the valuation of the Fund’s investments by the above fair value hierarchy levels as of February 28, 2019:
| | | | | | | | | | | | | | | | |
Investments in Securities: | | Level 1 | | | Level 2 | | | Level 3 | | | Total | |
Assets: | | | | | | | | | | | | | | | | |
Common Stocks: | | | | | | | | | | | | | | | | |
Information Technology | | $ | 13,182,705 | | | $ | 1,724,497 | | | $ | – 0 | – | | $ | 14,907,202 | |
Financials | | | 7,292,099 | | | | 4,460,339 | | | | – 0 | – | | | 11,752,438 | |
Health Care | | | 8,672,700 | | | | 1,435,553 | | | | – 0 | – | | | 10,108,253 | |
Consumer Discretionary | | | 7,398,333 | | | | 1,071,855 | | | | – 0 | – | | | 8,470,188 | |
Industrials | | | 4,673,681 | | | | 2,509,841 | | | | – 0 | – | | | 7,183,522 | |
Communication Services | | | 4,697,306 | | | | 2,250,490 | | | | – 0 | – | | | 6,947,796 | |
Consumer Staples | | | 1,826,341 | | | | 1,709,374 | | | | – 0 | – | | | 3,535,715 | |
Energy | | | 1,277,670 | | | | 1,080,512 | | | | – 0 | – | | | 2,358,182 | |
Materials | | | 1,203,271 | | | | 818,467 | | | | – 0 | – | | | 2,021,738 | |
Utilities | | | 651,598 | | | | 896,274 | | | | – 0 | – | | | 1,547,872 | |
Real Estate | | | 731,577 | | | | 783,869 | | | | – 0 | – | | | 1,515,446 | |
Investment Companies | | | 45,188,991 | | | | – 0 | – | | | – 0 | – | | | 45,188,991 | |
Governments – Treasuries | | | – 0 | – | | | 16,402,396 | | | | – 0 | – | | | 16,402,396 | |
Corporates – Investment Grade | | | – 0 | – | | | 11,516,538 | | | | – 0 | – | | | 11,516,538 | |
Inflation-Linked Securities | | | – 0 | – | | | 9,117,852 | | | | – 0 | – | | | 9,117,852 | |
| | |
| |
| abfunds.com | | AB CONSERVATIVE WEALTH STRATEGY | 69 |
NOTES TO FINANCIAL STATEMENTS(continued)
| | | | | | | | | | | | | | | | |
Investments in Securities: | | Level 1 | | | Level 2 | | | Level 3 | | | Total | |
Mortgage Pass-Throughs | | $ | – 0 | – | | $ | 6,497,284 | | | $ | – 0 | – | | $ | 6,497,284 | |
Covered Bonds | | | – 0 | – | | | 2,484,440 | | | | – 0 | – | | | 2,484,440 | |
Commercial Mortgage-Backed Securities | | | – 0 | – | | | 1,471,166 | | | | 160,009 | | | | 1,631,175 | |
Collateralized Mortgage Obligations | | | – 0 | – | | | 1,310,920 | | | | 30,342 | | | | 1,341,262 | |
Collateralized Loan Obligations | | | – 0 | – | | | – 0 | – | | | 1,238,038 | | | | 1,238,038 | |
Asset-Backed Securities | | | – 0 | – | | | 680,920 | | | | 370,698 | | | | 1,051,618 | |
Governments – Sovereign Bonds | | | – 0 | – | | | 948,544 | | | | – 0 | – | | | 948,544 | |
Supranationals | | | – 0 | – | | | 356,152 | | | | – 0 | – | | | 356,152 | |
Local Governments – US Municipal Bonds | | | – 0 | – | | | 241,723 | | | | – 0 | – | | | 241,723 | |
Quasi-Sovereigns | | | – 0 | – | | | 197,403 | | | | – 0 | – | | | 197,403 | |
Local Governments – Provincial Bonds | | | – 0 | – | | | 152,698 | | | | – 0 | – | | | 152,698 | |
Corporates –Non-Investment Grade | | | – 0 | – | | | 137,833 | | | | – 0 | – | | | 137,833 | |
Options Purchased – Puts | | | – 0 | – | | | 11,336 | | | | – 0 | – | | | 11,336 | |
Options Purchased – Calls | | | – 0 | – | | | 1,212 | | | | – 0 | – | | | 1,212 | |
Short-Term Investments | | | 12,709,360 | | | | – 0 | – | | | – 0 | – | | | 12,709,360 | |
Investments of Cash Collateral for Securities Loaned in Affiliated Money Market Fund | | | 2,905,070 | | | | – 0 | – | | | – 0 | – | | | 2,905,070 | |
| | | | | | | | | | | | | | | | |
Total Investments in Securities | | | 112,410,702 | | | | 70,269,488 | | | | 1,799,087 | | | | 184,479,277 | |
Other Financial Instruments(a): | | | | | | | | | | | | | | | | |
Assets: | | | | | | | | | | | | | | | | |
Futures | | | 789,873 | | | | 121,503 | | | | – 0 | – | | | 911,376 | (b) |
Forward Currency Exchange Contracts | | | – 0 | – | | | 629,923 | | | | – 0 | – | | | 629,923 | |
Centrally Cleared Credit Default Swaps | | | – 0 | – | | | 530,185 | | | | – 0 | – | | | 530,185 | (b) |
Centrally Cleared Interest Rate Swaps | | | – 0 | – | | | 169,298 | | | | – 0 | – | | | 169,298 | (b) |
Inflation (CPI) Swaps | | | – 0 | – | | | 91,973 | | | | – 0 | – | | | 91,973 | |
Total Return Swaps | | | – 0 | – | | | 60,074 | | | | – 0 | – | | | 60,074 | |
Variance Swaps | | | – 0 | – | | | 153,667 | | | | – 0 | – | | | 153,667 | |
Liabilities: | | | | | | | | | | | | | | | | |
Futures | | | (1,226,817 | ) | | | (240,945 | ) | | | – 0 | – | | | (1,467,762 | )(b) |
Forward Currency Exchange Contracts | | | – 0 | – | | | (470,985 | ) | | | – 0 | – | | | (470,985 | ) |
Currency Options Written | | | – 0 | – | | | (1,160 | ) | | | – 0 | – | | | (1,160 | ) |
Centrally Cleared Credit Default Swaps | | | – 0 | – | | | (19,067 | ) | | | – 0 | – | | | (19,067 | )(b) |
Centrally Cleared Interest Rate Swaps | | | – 0 | – | | | (29,865 | ) | | | – 0 | – | | | (29,865 | )(b) |
Credit Default Swaps | | | – 0 | – | | | (44,544 | ) | | | – 0 | – | | | (44,544 | ) |
Inflation (CPI) Swaps | | | – 0 | – | | | (155,469 | ) | | | – 0 | – | | | (155,469 | ) |
| | |
| |
| 70 | AB CONSERVATIVE WEALTH STRATEGY | | abfunds.com |
NOTES TO FINANCIAL STATEMENTS(continued)
| | | | | | | | | | | | | | | | |
Investments in Securities: | | Level 1 | | | Level 2 | | | Level 3 | | | Total | |
Total Return Swaps | | $ | – 0 | – | | $ | (401,353 | ) | | $ | – 0 | – | | $ | (401,353 | ) |
Variance Swaps | | | – 0 | – | | | (250,766 | ) | | | – 0 | – | | | (250,766 | ) |
| | | | | | | | | | | | | | | | |
Total(c) | | $ | 111,973,758 | | | $ | 70,411,957 | | | $ | 1,799,087 | | | $ | 184,184,802 | |
| | | | | | | | | | | | | | | | |
| (a) | Other financial instruments are derivative instruments, such as futures, forwards and swaps, which are valued at the unrealized appreciation/(depreciation) on the instrument. Other financial instruments may also include swaps with upfront premiums, options written and swaptions written which are valued at market value. |
| (b) | Only variation margin receivable/(payable) at period end is reported within the statement of assets and liabilities. This amount reflects cumulative unrealized appreciation/(depreciation) on futures and centrally cleared swaps as reported in the portfolio of investments. Where applicable, centrally cleared swaps with upfront premiums are presented here at market value. |
| (c) | There were de minimis transfers under 1% of net assets between Level 1 and Level 2 during the reporting period. |
The Fund recognizes all transfers between levels of the fair value hierarchy assuming the financial instruments were transferred at the beginning of the reporting period.
The following is a reconciliation of investments in which significant unobservable inputs (Level 3) were used in determining fair value.
| | | | | | | | | | | | |
| | | Commercial
Mortgage-Backed
Securities | | | Collateralized
Mortgage
Obligations | | | Collateralized
Loan
Obligations | |
Balance as of 8/31/18 | | $ | 9,382 | | | $ | 30,393 | | | $ | 749,998 | |
Accrued discounts/(premiums) | | | – 0 | – | | | 60 | | | | – 0 | – |
Realized gain (loss) | | | 65 | | | | – 0 | – | | | – 0 | – |
Change in unrealized appreciation/depreciation | | | (337 | ) | | | (111 | ) | | | (11,882 | ) |
Purchases/Payups | | | 160,281 | | | | – 0 | – | | | 249,922 | |
Sales/Paydowns | | | (9,382 | ) | | | – 0 | – | | | – 0 | – |
Transfers in to Level 3 | | | – 0 | – | | | – 0 | – | | | 250,000 | |
Transfers out of Level 3 | | | – 0 | – | | | – 0 | – | | | – 0 | – |
| | | | | | | | | | | | |
Balance as of 2/28/19 | | $ | 160,009 | | | $ | 30,342 | | | $ | 1,238,038 | |
| | | | | | | | | | | | |
Net change in unrealized appreciation/depreciation from investments held as of 2/28/19(a) | | $ | (272 | ) | | $ | (111 | ) | | $ | (11,882 | ) |
| | | | | | | | | | | | |
| | | |
| | | Asset-Backed
Securities | | | Total | | | | |
Balance as of 8/31/18 | | $ | 388,628 | | | $ | 1,178,401 | | | | | |
Accrued discounts/(premiums) | | | 10 | | | | 70 | | | | | |
Realized gain (loss) | | | 24 | | | | 89 | | | | | |
Change in unrealized appreciation/depreciation | | | 1,964 | | | | (10,366 | ) | | | | |
Purchases/Payups | | | – 0 | – | | | 410,203 | | | | | |
Sales/Paydowns | | | (19,928 | ) | | | (29,310 | ) | | | | |
Transfers in to Level 3 | | | – 0 | – | | | 250,000 | (b) | | | | |
| | |
| |
| abfunds.com | | AB CONSERVATIVE WEALTH STRATEGY | 71 |
NOTES TO FINANCIAL STATEMENTS(continued)
| | | | | | | | | | | | |
| | | |
| | | Asset-Backed
Securities | | | Total | | | | |
Transfers out of Level 3 | | $ | – 0 | – | | $ | – 0 | – | | | | |
| | | | | | | | | | | | |
Balance as of 2/28/19 | | $ | 370,698 | | | $ | 1,799,087 | | | | | |
| | | | | | | | | | | | |
Net change in unrealized appreciation/depreciation from investments held as of 2/28/19(a) | | $ | 1,964 | | | $ | (10,301 | ) | | | | |
| | | | | | | | | | | | |
| (a) | The unrealized appreciation/depreciation is included in net change in unrealized appreciation/depreciation on investments and other financial instruments in the accompanying statement of operations. |
| (b) | There were de minimis transfers under 1% of net assets during the reporting period. |
The Adviser established the Committee to oversee the pricing and valuation of all securities held in the Fund. The Committee operates under pricing and valuation policies and procedures established by the Adviser and approved by the Board, including pricing policies which set forth the mechanisms and processes to be employed on a daily basis to implement these policies and procedures. In particular, the pricing policies describe how to determine market quotations for securities and other instruments. The Committee’s responsibilities include: 1) fair value and liquidity determinations (and oversight of any third parties to whom any responsibility for fair value and liquidity determinations is delegated), and 2) regular monitoring of the Adviser’s pricing and valuation policies and procedures and modification or enhancement of these policies and procedures (or recommendation of the modification of these policies and procedures) as the Committee believes appropriate.
The Committee is also responsible for monitoring the implementation of the pricing policies by the Adviser’s Pricing Group (the “Pricing Group”) and any third party which performs certain pricing functions in accordance with the pricing policies. The Pricing Group is responsible for the oversight of the third party on aday-to-day basis. The Committee and the Pricing Group perform a series of activities to provide reasonable assurance of the accuracy of prices including: 1) periodic vendor due diligence meetings, review of methodologies, new developments and processes at vendors, 2) daily comparison of security valuation versus prior day for all securities that exceeded established thresholds, and 3) daily review of unpriced, stale, and variance reports with exceptions reviewed by senior management and the Committee.
In addition, several processes outside of the pricing process are used to monitor valuation issues including: 1) performance and performance attribution reports are monitored for anomalous impacts based upon benchmark performance, and 2) portfolio managers review all portfolios for performance and analytics (which are generated using the Adviser’s prices).
| | |
| |
| 72 | AB CONSERVATIVE WEALTH STRATEGY | | abfunds.com |
NOTES TO FINANCIAL STATEMENTS(continued)
3. Currency Translation
Assets and liabilities denominated in foreign currencies and commitments under forward currency exchange contracts are translated into U.S. dollars at the mean of the quoted bid and ask prices of such currencies against the U.S. dollar. Purchases and sales of portfolio securities are translated into U.S. dollars at the rates of exchange prevailing when such securities were acquired or sold. Income and expenses are translated into U.S. dollars at rates of exchange prevailing when accrued.
Net realized gain or loss on foreign currency transactions represents foreign exchange gains and losses from sales and maturities of foreign fixed income investments, holding of foreign currencies, currency gains or losses realized between the trade and settlement dates on foreign investment transactions, and the difference between the amounts of dividends, interest and foreign withholding taxes recorded on the Fund’s books and the U.S. dollar equivalent amounts actually received or paid. Net unrealized currency gains and losses from valuing foreign currency denominated assets and liabilities at period end exchange rates are reflected as a component of net unrealized appreciation or depreciation of foreign currency denominated assets and liabilities.
4. Taxes
It is the Fund’s policy to meet the requirements of the Internal Revenue Code applicable to regulated investment companies and to distribute all of its investment company taxable income and net realized gains, if any, to shareholders. Therefore, no provisions for federal income or excise taxes are required. The Fund may be subject to taxes imposed by countries in which it invests. Such taxes are generally based on income and/or capital gains earned or repatriated. Taxes are accrued and applied to net investment income, net realized gains and net unrealized appreciation/depreciation as such income and/or gains are earned.
In accordance with U.S. GAAP requirements regarding accounting for uncertainties in income taxes, management has analyzed the Fund’s tax positions taken or expected to be taken on federal and state income tax returns for all open tax years (the current and the prior three tax years) and has concluded that no provision for income tax is required in the Fund’s financial statements.
5. Investment Income and Investment Transactions
Dividend income is recorded on theex-dividend date or as soon as the Fund is informed of the dividend. Interest income is accrued daily. Investment transactions are accounted for on the date the securities are purchased or sold. Investment gains or losses are determined on the identified cost basis. The Fund amortizes premiums and accretes discounts as adjustments to interest income.
| | |
| |
| abfunds.com | | AB CONSERVATIVE WEALTH STRATEGY | 73 |
NOTES TO FINANCIAL STATEMENTS(continued)
6. Class Allocations
All income earned and expenses incurred by the Fund are borne on apro-rata basis by each outstanding class of shares, based on the proportionate interest in the Fund represented by the net assets of such class, except for class specific expenses which are allocated to the respective class. Expenses of the Company are charged proportionately to each series or based on other appropriate methods. Realized and unrealized gains and losses are allocated among the various share classes based on respective net assets.
7. Dividends and Distributions
Dividends and distributions to shareholders, if any, are recorded on theex-dividend date. Income dividends and capital gains distributions are determined in accordance with federal tax regulations and may differ from those determined in accordance with U.S. GAAP. To the extent these differences are permanent, such amounts are reclassified within the capital accounts based on their federal tax basis treatment; temporary differences do not require such reclassification.
NOTE B
Advisory Fee and Other Transactions with Affiliates
Under the terms of the investment advisory agreement (the “Advisory Agreement”), the Fund pays the Adviser an advisory fee at an annual rate of .55% of the first $2.5 billion, .45% of the next $2.5 billion and .40% in excess of $5 billion of the Fund’s average daily net assets. The fee is accrued daily and paid monthly.
During 2017, AXA S.A. (“AXA”), a French holding company for the AXA Group, a worldwide leader in life, property and casualty and health insurance and asset management, announced its intention to pursue the sale of a minority stake in its subsidiary, AXA Equitable Holdings, Inc. (“AXA Equitable”), the holding company for a diversified financial services organization, through an initial public offering (“IPO”). AXA Equitable is the holding company for a diverse group of financial services companies, including AllianceBernstein L.P., the investment adviser to the Funds (“the Adviser”). In March 2018, AXA announced its intention to sell its entire interest in AXA Equitable over time, subject to market conditions and other factors (the “Plan”). During the second quarter of 2018, AXA Equitable completed the IPO, and, in the fourth quarter of 2018, and in the first quarter of 2019, AXA completed public offerings of additional shares of AXA Equitable’s common stock and simultaneously sold shares to AXA Equitable pursuant to a separate agreement with it. AXA also granted the underwriters of the offering an option to purchase additional shares of AXA Equitable, which was exercised. As a result of the foregoing sales of AXA Equitable shares, as of March 25, 2019, AXA owns approximately 48.3%
| | |
| |
| 74 | AB CONSERVATIVE WEALTH STRATEGY | | abfunds.com |
NOTES TO FINANCIAL STATEMENTS(continued)
of the shares of common stock of AXA Equitable. Contemporaneously with the IPO, AXA sold $862.5 million aggregate principal amount of its 7.25% mandatorily exchangeable notes (the “MxB Notes”) due May 15, 2021, and exchangeable into up to 43,125,000 shares of common stock (or approximately 7% of the outstanding shares of common stock of AXA Equitable). AXA retains ownership (including voting rights) of such shares of common stock until the MxB Notes are exchanged, which may be on a date that is earlier than the maturity date at AXA’s option upon the occurrence of certain events.
It is anticipated that one or more of the transactions contemplated by the Plan may ultimately result in the indirect transfer of a “controlling block” of voting securities of the Adviser (a “Change of Control Event”) and therefore may be deemed an “assignment” causing a termination of each Fund’s current investment advisory agreement. In order to ensure that the existing investment advisory services could continue uninterrupted, at meetings held in late July through early August 2018, the Boards of Directors/Trustees (each a “Board” and collectively, the “Boards”) approved new investment advisory agreements with the Adviser, in connection with the Plan. The Boards also agreed to call and hold a joint meeting of shareholders on October 11, 2018, for shareholders of each Fund to (1) approve the new investment advisory agreement with the Adviser that would be effective after the first Change of Control Event and (2) approve any future advisory agreement approved by the Board and that has terms not materially different from the current agreement, in the event there are subsequent Change of Control Events arising from completion of the Plan that terminate the advisory agreement after the first Change of Control Event. Approval of a future advisory agreement means that shareholders may not have another opportunity to vote on a new agreement with the Adviser even upon a change of control, as long as no single person or group of persons acting together gains “control” (as defined in the 1940 Act) of AXA Equitable.
At the December 11, 2018 adjourned shareholder meeting, shareholders approved the new and future investment advisory agreements.
The Fund may invest in AB Government Money Market Portfolio (the “Government Money Market Portfolio”) which has a contractual annual advisory fee rate of ..20% of the portfolio’s average daily net assets and bears its own expenses. Effective August 1, 2018, the Adviser has contractually agreed to waive .10% of the advisory fee of Government Money Market Portfolio (resulting in a net advisory fee of .10%) until August 31, 2019. In connection with the investment by the Fund in Government Money Market Portfolio, the Adviser has contractually agreed to waive its advisory fee from the Fund in an amount equal to the Fund’s pro rata
| | |
| |
| abfunds.com | | AB CONSERVATIVE WEALTH STRATEGY | 75 |
NOTES TO FINANCIAL STATEMENTS(continued)
share of the effective advisory fee of Government Money Market Portfolio, as borne indirectly by the Fund as an acquired fund fee and expense. For the six months ended February 28, 2019, such waiver amounted to $3,931.
In connection with the Fund’s investments in AB All Market Alternative Return Portfolio (“AMAR”), the Adviser has contractually agreed to waive its fees and/or reimburse expenses payable by the Fund in an amount equal to the benefit to the Adviser of reduced waivers and/or reimbursements under the expense limitation undertaking in place for the AMAR as a result of the investment of Fund assets in AMAR. In connection with the Fund’s investments in other AB mutual funds, the Adviser has contractually agreed to waive fees and/or reimburse the expenses payable to the Adviser by the Fund in an amount equal to the Fund’s pro rata share of the effective advisory fees of AB mutual funds, as paid by the Fund as an acquired fund fee and expense. These fee waivers and/or expense reimbursements will remain in effect until December 31, 2019. For the six months ended February 28, 2019, such waivers and/or reimbursements amounted to $176,551.
A summary of the Fund’s transactions in AB mutual funds for the six months ended February 28, 2019 is as follows:
| | | | | | | | | | | | | | | | | | | | | | | | | | | | | | | | |
| | | | | | | | | | | | | | | | | | | | | Distributions | |
| Fund | | Market
Value 8/31/18
(000) | | | Purchases
at Cost
(000) | | | Sales
Proceeds
(000) | | | Realized
Gain
(Loss)
(000) | | | Change in
Unrealized
Appr./
(Depr.)
(000) | | | Market
Value
2/28/19
(000) | | | Dividend
Income
(000) | | | Realized
Gains
(000) | |
Government Money Market Portfolio | | $ | 1,824 | | | $ | 48,260 | | | $ | 37,374 | | | $ | – 0 | – | | $ | – 0 | – | | $ | 12,710 | | | $ | 89 | | | $ | – 0 | – |
AB Cap Fund, Inc. – AB All Market Alternative Return Portfolio | | | 16,364 | | | | – 0 | – | | | 15,797 | | | | (2,087 | ) | | | 1,520 | | | | – 0 | – | | | – 0 | – | | | – 0 | – |
AB Bond Fund, Inc. – AB All Market Real Return Portfolio | | | 20,431 | | | | 6,133 | | | | 1,282 | | | | (2 | ) | | | (1,406 | ) | | | 23,874 | | | | 456 | | | | – 0 | – |
AB High Income Fund, Inc. | | | 20,301 | | | | 646 | | | | 1,954 | | | | (218 | ) | | | (241 | ) | | | 18,535 | | | | 643 | | | | – 0 | – |
| | |
| |
| 76 | AB CONSERVATIVE WEALTH STRATEGY | | abfunds.com |
NOTES TO FINANCIAL STATEMENTS(continued)
| | | | | | | | | | | | | | | | | | | | | | | | | | | | | | | | |
| | | | | | | | | | | | | | | | | | | | | Distributions | |
| Fund | | Market
Value 8/31/18
(000) | | | Purchases
at Cost
(000) | | | Sales
Proceeds
(000) | | | Realized
Gain
(Loss)
(000) | | | Change in
Unrealized
Appr./
(Depr.)
(000) | | | Market
Value
2/28/19
(000) | | | Dividend
Income
(000) | | | Realized
Gains
(000) | |
Government Money Market Portfolio* | | $ | 385 | | | $ | 10,825 | | | $ | 8,305 | | | $ | – 0 | – | | $ | – 0 | – | | $ | 2,905 | | | $ | 5 | | | $ | – 0 | – |
| | | | | | | | | | | | | | | | | | | | | | | | | | | | | | | | |
Total | | | | | | | | | | | | | | $ | (2,307 | ) | | $ | (127 | ) | | $ | 58,024 | | | $ | 1,193 | | | $ | – 0 | – |
| | | | | | | | | | | | | | | | | | | | | | | | | | | | | | | | |
| * | Investments of cash collateral for securities lending transactions (see Note E). |
The Fund compensates AllianceBernstein Investor Services, Inc. (“ABIS”), a wholly-owned subsidiary of the Adviser, under a Transfer Agency Agreement for providing personnel and facilities to perform transfer agency services for the Fund. ABIS may make payments to intermediaries that provide omnibus account services,sub-accounting services and/or networking services. Such compensation retained by ABIS amounted to $32,354 for the six months ended February 28, 2019.
AllianceBernstein Investments, Inc. (the “Distributor”), a wholly-owned subsidiary of the Adviser, serves as the distributor of the Fund’s shares. The Distributor has advised the Fund that it has retainedfront-end sales charges of $1,262 from the sale of Class A shares and received $91, $80 and $231 in contingent deferred sales charges imposed upon redemptions by shareholders of Class A, Class B and Class C shares, respectively, for the six months ended February 28, 2019.
Brokerage commissions paid on investment transactions for the six months ended February 28, 2019 amounted to $36,516, of which $0 and $0, respectively, was paid to Sanford C. Bernstein & Co. LLC and Sanford C. Bernstein Limited, affiliates of the Adviser.
NOTE C
Distribution Plans
The Fund has adopted a Plan for each class of shares of the Fund pursuant to Rule12b-1 under the Investment Company Act of 1940 (each a “Plan” and collectively the “Plans”). Under the Plans, the Fund pays distribution and servicing fees to the Distributor at an annual rate of up to .50% of the Fund’s average daily net assets attributable to Class A shares, 1% of the Fund’s average daily net assets attributable to both Class B and Class C shares, .50% of the Fund’s average daily net assets attributable to Class R shares and .25% of the Fund’s average daily net assets attributable to Class K shares. There are no distribution and servicing fees on the Advisor Class and Class I shares. Effective August 1, 2014, payments under the Plan in respect of Class A shares are limited to an annual rate of
| | |
| |
| abfunds.com | | AB CONSERVATIVE WEALTH STRATEGY | 77 |
NOTES TO FINANCIAL STATEMENTS(continued)
.25% of the Fund’s Class A share’s average daily net assets. The Plans provide that the Distributor will use such payments in their entirety for distribution assistance and promotional activities. The Fund is not obligated under the Plans to pay any distribution services fee in excess of the amounts set forth above. The purpose of the payments to the Distributor under the Plans is to compensate the Distributor for its distribution services with respect to the sale of the Fund’s shares. Since the Distributor’s compensation is not directly tied to its expenses, the amount of compensation received by it under the Plan during any year may be more or less than its actual expenses. For this reason, the Plans are characterized by the staff of the Securities and Exchange Commission as being of the “compensation” plan.
In the event that a Plan is terminated or not continued, no distribution services fees (other than current amounts accrued but not yet paid) would be owed by the Fund to the Distributor with respect to the relevant class. The Plans also provide that the Adviser may use its own resources to finance the distribution of the Fund’s shares. The fees are accrued daily and paid monthly.
NOTE D
Investment Transactions
Purchases and sales of investment securities (excluding short-term investments) for the six months ended February 28, 2019 were as follows:
| | | | | | | | |
| | | Purchases | | | Sales | |
Investment securities (excluding U.S. government securities) | | $ | 66,942,139 | | | $ | 91,325,134 | |
U.S. government securities | | | 24,624,415 | | | | 28,024,631 | |
The cost of investments for federal income tax purposes was substantially the same as the cost for financial reporting purposes. Accordingly, gross unrealized appreciation and unrealized depreciation are as follows:
| | | | |
Gross unrealized appreciation | | $ | 10,880,655 | |
Gross unrealized depreciation | | | (6,862,073 | ) |
| | | | |
Net unrealized appreciation | | $ | 4,018,582 | |
| | | | |
1. Derivative Financial Instruments
The Fund may use derivatives in an effort to earn income and enhance returns, to replace more traditional direct investments, to obtain exposure to otherwise inaccessible markets (collectively, “investment purposes”), or to hedge or adjust the risk profile of its portfolio.
| | |
| |
| 78 | AB CONSERVATIVE WEALTH STRATEGY | | abfunds.com |
NOTES TO FINANCIAL STATEMENTS(continued)
The principal types of derivatives utilized by the Fund, as well as the methods in which they may be used are:
The Fund may buy or sell futures for investment purposes or for the purpose of hedging its portfolio against adverse effects of potential movements in the market. The Fund bears the market risk that arises from changes in the value of these instruments and the imperfect correlation between movements in the price of the futures and movements in the price of the assets, reference rates or indices which they are designed to track. Among other things, the Fund may purchase or sell futures for foreign currencies or options thereon fornon-hedging purposes as a means of making direct investment in foreign currencies, as described below under “Currency Transactions”.
At the time the Fund enters into futures, the Fund deposits and maintains as collateral an initial margin with the broker, as required by the exchange on which the transaction is effected. Such amount is shown as cash collateral due from broker on the statement of assets and liabilities. Pursuant to the contract, the Fund agrees to receive from or pay to the broker an amount of cash equal to the daily fluctuation in the value of the contract. Such receipts or payments are known as variation margin and are recorded by the Fund as unrealized gains or losses. Risks may arise from the potential inability of a counterparty to meet the terms of the contract. The credit/counterparty risk for exchange-traded futures is generally less than privately negotiated futures, since the clearinghouse, which is the issuer or counterparty to each exchange-traded future, has robust risk mitigation standards, including the requirement to provide initial and variation margin. When the contract is closed, the Fund records a realized gain or loss equal to the difference between the value of the contract at the time it was opened and the time it was closed.
Use of long futures subjects the Fund to risk of loss in excess of the amounts shown on the statement of assets and liabilities, up to the notional value of the futures. Use of short futures subjects the Fund to unlimited risk of loss. Under some circumstances, futures exchanges may establish daily limits on the amount that the price of futures can vary from the previous day’s settlement price, which could effectively prevent liquidation of unfavorable positions.
During the six months ended February 28, 2019, the Fund held futures for hedging andnon-hedging purposes.
| | • | | Forward Currency Exchange Contracts |
The Fund may enter into forward currency exchange contracts in order to hedge its exposure to changes in foreign currency exchange
| | |
| |
| abfunds.com | | AB CONSERVATIVE WEALTH STRATEGY | 79 |
NOTES TO FINANCIAL STATEMENTS(continued)
rates on its foreign portfolio holdings, to hedge certain firm purchase and sale commitments denominated in foreign currencies and fornon-hedging purposes as a means of making direct investments in foreign currencies, as described below under “Currency Transactions”.
A forward currency exchange contract is a commitment to purchase or sell a foreign currency at a future date at a negotiated forward rate. The gain or loss arising from the difference between the original contract and the closing of such contract would be included in net realized gain or loss on forward currency exchange contracts. Fluctuations in the value of open forward currency exchange contracts are recorded for financial reporting purposes as unrealized appreciation and/or depreciation by the Fund. Risks may arise from the potential inability of a counterparty to meet the terms of a contract and from unanticipated movements in the value of a foreign currency relative to the U.S. dollar.
During the six months ended February 28, 2019, the Fund held forward currency exchange contracts for hedging andnon-hedging purposes.
For hedging and investment purposes, the Fund may purchase and write (sell) put and call options on U.S. and foreign securities, including government securities, and foreign currencies that are traded on U.S. and foreign securities exchanges andover-the-counter markets. Among other things, the Fund may use options transactions fornon-hedging purposes as a means of making direct investments in foreign currencies, as described below under “Currency Transactions” and may use options strategies involving the purchase and/or writing of various combinations of call and/or put options, for hedging and investment purposes.
The risk associated with purchasing an option is that the Fund pays a premium whether or not the option is exercised. Additionally, the Fund bears the risk of loss of the premium and change in market value should the counterparty not perform under the contract. If a put or call option purchased by the Fund were permitted to expire without being sold or exercised, its premium would represent a loss to the Fund. Put and call options purchased are accounted for in the same manner as portfolio securities. The cost of securities acquired through the exercise of call options is increased by premiums paid. The proceeds from securities sold through the exercise of put options are decreased by the premiums paid.
When the Fund writes an option, the premium received by the Fund is recorded as a liability and is subsequently adjusted to the current
| | |
| |
| 80 | AB CONSERVATIVE WEALTH STRATEGY | | abfunds.com |
NOTES TO FINANCIAL STATEMENTS(continued)
market value of the option written. The Fund’s maximum payment for written put options equates to the number of shares multiplied by the strike price, as included on the Portfolio of Investments. In certain circumstances maximum payout amounts may be partially offset by recovery values of the respective referenced assets and upfront premium received upon entering into the contract. Premiums received from written options which expire unexercised are recorded by the Fund on the expiration date as realized gains from options written. The difference between the premium received and the amount paid on effecting a closing purchase transaction, including brokerage commissions, is also treated as a realized gain, or if the premium received is less than the amount paid for the closing purchase transaction, as a realized loss. If a call option is exercised, the premium received is added to the proceeds from the sale of the underlying security or currency in determining whether the Fund has realized a gain or loss. If a put option is exercised, the premium received reduces the cost basis of the security or currency purchased by the Fund. In writing an option, the Fund bears the market risk of an unfavorable change in the price of the security or currency underlying the written option. Exercise of an option written by the Fund could result in the Fund selling or buying a security or currency at a price different from the current market value.
During the six months ended February 28, 2019, the Fund held purchased options for hedging andnon-hedging purposes. During the six months ended February 28, 2019, the Fund held written options for hedging andnon-hedging purposes.
The Fund may enter into swaps to hedge its exposure to interest rates, credit risk, equity markets or currencies. The Fund may also enter into swaps fornon-hedging purposes as a means of gaining market exposures, making direct investments in foreign currencies, as described below under “Currency Transactions” or in order to take a “long” or “short” position with respect to an underlying referenced asset described below under “Total Return Swaps”.
A swap is an agreement that obligates two parties to exchange a series of cash flows at specified intervals based upon or calculated by reference to changes in specified prices or rates for a specified amount of an underlying asset. The payment flows are usually netted against each other, with the difference being paid by one party to the other. In addition, collateral may be pledged or received by the Fund in accordance with the terms of the respective swaps to provide value and recourse to the Fund or its counterparties in the event of default, bankruptcy or insolvency by one of the parties to the swap.
| | |
| |
| abfunds.com | | AB CONSERVATIVE WEALTH STRATEGY | 81 |
NOTES TO FINANCIAL STATEMENTS(continued)
Risks may arise as a result of the failure of the counterparty to the swap to comply with the terms of the swap. The loss incurred by the failure of a counterparty is generally limited to the net interim payment to be received by the Fund, and/or the termination value at the end of the contract. Therefore, the Fund considers the creditworthiness of each counterparty to a swap in evaluating potential counterparty risk. This risk is mitigated by having a netting arrangement between the Fund and the counterparty and by the posting of collateral by the counterparty to the Fund to cover the Fund’s exposure to the counterparty. Additionally, risks may arise from unanticipated movements in interest rates or in the value of the underlying securities. The Fund accrues for the interim payments on swaps on a daily basis, with the net amount recorded within unrealized appreciation/depreciation of swaps on the statement of assets and liabilities, where applicable. Once the interim payments are settled in cash, the net amount is recorded as realized gain/(loss) on swaps on the statement of operations, in addition to any realized gain/(loss) recorded upon the termination of swaps. Upfront premiums paid or received for OTC swaps are recognized as cost or proceeds on the statement of assets and liabilities and are amortized on a straight line basis over the life of the contract. Amortized upfront premiums are included in net realized gain/(loss) from swaps on the statement of operations. Fluctuations in the value of swaps are recorded as a component of net change in unrealized appreciation/depreciation of swaps on the statement of operations.
Certain standardized swaps, including certain interest rate swaps and credit default swaps, are (or soon will be) subject to mandatory central clearing. Cleared swaps are transacted through futures commission merchants (“FCMs”) that are members of central clearinghouses, with the clearinghouse serving as central counterparty, similar to transactions in futures contracts. Centralized clearing will be required for additional categories of swaps on aphased-in basis based on requirements published by the Securities and Exchange Commission and Commodity Futures Trading Commission.
At the time the Fund enters into a centrally cleared swap, the Fund deposits and maintains as collateral an initial margin with the broker, as required by the clearinghouse on which the transaction is effected. Such amount is shown as cash collateral due from broker on the statement of assets and liabilities. Pursuant to the contract, the Fund agrees to receive from or pay to the broker an amount of cash equal to the daily fluctuation in the value of the contract. Such receipts or payments are known as variation margin and are recorded by the Fund as unrealized gains or losses. Risks may arise from the potential inability of a counterparty to meet the terms of the contract. The
| | |
| |
| 82 | AB CONSERVATIVE WEALTH STRATEGY | | abfunds.com |
NOTES TO FINANCIAL STATEMENTS(continued)
credit/counterparty risk for centrally cleared swaps is generally less thannon-centrally cleared swaps, since the clearinghouse, which is the issuer or counterparty to each centrally cleared swap, has robust risk mitigation standards, including the requirement to provide initial and variation margin. When the contract is closed, the Fund records a realized gain or loss equal to the difference between the value of the contract at the time it was opened and the time it was closed.
Interest Rate Swaps:
The Fund is subject to interest rate risk exposure in the normal course of pursuing its investment objectives. Because the Fund holds fixed rate bonds, the value of these bonds may decrease if interest rates rise. To help hedge against this risk and to maintain its ability to generate income at prevailing market rates, the Fund may enter into interest rate swaps. Interest rate swaps are agreements between two parties to exchange cash flows based on a notional amount. The Fund may elect to pay a fixed rate and receive a floating rate, or, receive a fixed rate and pay a floating rate on a notional amount.
In addition, the Fund may also enter into interest rate swap transactions to preserve a return or spread on a particular investment or portion of its portfolio, or protecting against an increase in the price of securities the Fund anticipates purchasing at a later date. Interest rate swaps involve the exchange by a Fund with another party of their respective commitments to pay or receive interest (e.g., an exchange of floating rate payments for fixed rate payments) computed based on a contractually-based principal (or “notional”) amount. Interest rate swaps are entered into on a net basis (i.e., the two payment streams are netted out, with the Fund receiving or paying, as the case may be, only the net amount of the two payments).
During the six months ended February 28, 2019, the Fund held interest rate swaps for hedging andnon-hedging purposes.
Inflation (CPI) Swaps:
Inflation swap agreements are contracts in which one party agrees to pay the cumulative percentage increase in a price index (the Consumer Price Index with respect to CPI swaps) over the term of the swap (with some lag on the inflation index), and the other pays a compounded fixed rate. Inflation swaps may be used to protect the net asset value, or NAV, of a Fund against an unexpected change in the rate of inflation measured by an inflation index since the value of these agreements is expected to increase if there are unexpected inflation increases.
During the six months ended February 28, 2019, the Fund held inflation (CPI) swaps for hedging andnon-hedging purposes.
| | |
| |
| abfunds.com | | AB CONSERVATIVE WEALTH STRATEGY | 83 |
NOTES TO FINANCIAL STATEMENTS(continued)
Credit Default Swaps:
The Fund may enter into credit default swaps, including to manage its exposure to the market or certain sectors of the market, to reduce its risk exposure to defaults by corporate and sovereign issuers held by the Fund, or to create exposure to corporate or sovereign issuers to which it is not otherwise exposed. The Fund may purchase credit protection (“Buy Contract”) or provide credit protection (“Sale Contract”) on the referenced obligation of the credit default swap. During the term of the swap, the Fund receives/(pays) fixed payments from/(to) the respective counterparty, calculated at the agreed upon rate applied to the notional amount. If the Fund is a buyer/(seller) of protection and a credit event occurs, as defined under the terms of the swap, the Fund will either (i) receive from the seller/(pay to the buyer) of protection an amount equal to the notional amount of the swap (the “Maximum Payout Amount”) and deliver/(take delivery of) the referenced obligation or (ii) receive/(pay) a net settlement amount in the form of cash or securities equal to the notional amount of the swap less the recovery value of the referenced obligation.
In certain circumstances Maximum Payout Amounts may be partially offset by recovery values of the respective referenced obligations, upfront premium received upon entering into the agreement, or net amounts received from settlement of buy protection credit default swaps entered into by the Fund for the same referenced obligations with the same counterparty. As of February 28, 2019, the Fund did not have Buy Contracts outstanding with respect to the same referenced obligations and same counterparty for its Sale Contracts outstanding.
Credit default swaps may involve greater risks than if a Fund had invested in the referenced obligation directly. Credit default swaps are subject to general market risk, liquidity risk, counterparty risk and credit risk. If the Fund is a buyer of protection and no credit event occurs, it will lose the payments it made to its counterparty. If the Fund is a seller of protection and a credit event occurs, the value of the referenced obligation received by the Fund coupled with the periodic payments previously received, may be less than the Maximum Payout Amount it pays to the buyer, resulting in a net loss to the Fund.
Implied credit spreads over U.S. Treasuries of comparable maturity utilized in determining the market value of credit default swaps on issuers as of period end are disclosed in the portfolio of investments. The implied spreads serve as an indicator of the current status of the payment/performance risk and typically reflect the likelihood of default by the issuer of the referenced obligation. The implied credit spread of
| | |
| |
| 84 | AB CONSERVATIVE WEALTH STRATEGY | | abfunds.com |
NOTES TO FINANCIAL STATEMENTS(continued)
a particular reference obligation also reflects the cost of buying/selling protection and may reflect upfront payments required to be made to enter into the agreement. Widening credit spreads typically represent a deterioration of the referenced obligation’s credit soundness and greater likelihood of default or other credit event occurring as defined under the terms of the agreement. A credit spread identified as “Defaulted” indicates a credit event has occurred for the referenced obligation.
During the six months ended February 28, 2019, the Fund held credit default swaps for hedging andnon-hedging purposes.
Total Return Swaps:
The Fund may enter into total return swaps in order to take a “long” or “short” position with respect to an underlying referenced asset. The Fund is subject to market price volatility of the underlying referenced asset. A total return swap involves commitments to pay interest in exchange for a market linked return based on a notional amount. To the extent that the total return of the security, group of securities or index underlying the transaction exceeds or falls short of the offsetting interest obligation, the Fund will receive a payment from or make a payment to the counterparty.
During the six months ended February 28, 2019, the Fund held total return swaps for hedging andnon-hedging purposes.
Variance Swaps:
The Fund may enter into variance swaps to hedge equity market risk or adjust exposure to the equity markets. Variance swaps are contracts in which two parties agree to exchange cash payments based on the difference between the stated level of variance and the actual variance realized on underlying asset(s) or index(es). Actual “variance” as used here is defined as the sum of the square of the returns on the reference asset(s) or index(es) (which in effect is a measure of its “volatility”) over the length of the contract term. So the parties to a variance swap can be said to exchange actual volatility for a contractually stated rate of volatility.
During the six months ended February 28, 2019, the Fund held variance swaps for hedging andnon-hedging purposes.
The Fund typically enters into International Swaps and Derivatives Association, Inc. Master Agreements (“ISDA Master Agreement”) with its OTC derivative contract counterparties in order to, among other things, reduce its credit risk to OTC counterparties. ISDA Master Agreements include provisions for general obligations, representations, collateral and events of default or termination. Under an ISDA Master Agreement, the Fund typically
| | |
| |
| abfunds.com | | AB CONSERVATIVE WEALTH STRATEGY | 85 |
NOTES TO FINANCIAL STATEMENTS(continued)
may offset with the OTC counterparty certain derivative financial instruments’ payables and/or receivables with collateral held and/or posted and create one single net payment(close-out netting) in the event of default or termination. In the event of a default by an OTC counterparty, the return of collateral with market value in excess of the Fund’s net liability, held by the defaulting party, may be delayed or denied.
The Fund’s ISDA Master Agreements may contain provisions for early termination of OTC derivative transactions in the event the net assets of the Fund decline below specific levels (“net asset contingent features”). If these levels are triggered, the Fund’s OTC counterparty has the right to terminate such transaction and require the Fund to pay or receive a settlement amount in connection with the terminated transaction. If OTC derivatives were held at period end, please refer to netting arrangements by the OTC counterparty tables below for additional details.
During the six months ended February 28, 2019, the Fund had entered into the following derivatives:
| | | | | | | | | | | | |
| | | Asset Derivatives | | | Liability Derivatives | |
Derivative Type | | Statement of
Assets and
Liabilities
Location | | Fair Value | | | Statement of
Assets and
Liabilities
Location | | Fair Value | |
Interest rate contracts | |
Receivable/Payable for variation margin on futures | |
$ |
142,846 |
* | |
Receivable/Payable for variation margin on futures | |
$ |
181,168 |
* |
| | | | |
Equity contracts | | Receivable/Payable for variation margin on futures | |
| 768,530
| *
| | Receivable/Payable for variation margin on futures | | | 1,286,594 | * |
| | | | |
Credit contracts | | Receivable/Payable for variation margin on centrally cleared swaps | | | 173,969 | * | | Receivable/Payable for variation margin on centrally cleared swaps | | | 6,637 | * |
| | | | |
Interest rate contracts | |
Receivable/Payable for variation margin on centrally cleared swaps | |
|
169,298 |
* | |
Receivable/Payable for variation margin on centrally cleared swaps | |
|
29,865 |
* |
| | | | |
Foreign currency contracts | |
Unrealized appreciation on forward currency exchange contracts | |
|
629,923 |
| |
Unrealized depreciation on forward currency exchange contracts | |
|
470,985 |
|
| | |
| |
| 86 | AB CONSERVATIVE WEALTH STRATEGY | | abfunds.com |
NOTES TO FINANCIAL STATEMENTS(continued)
| | | | | | | | | | | | |
| | | Asset Derivatives | | | Liability Derivatives | |
Derivative Type | | Statement of
Assets and
Liabilities
Location | | Fair Value | | | Statement of
Assets and
Liabilities
Location | | Fair Value | |
| | | | |
Foreign exchange contracts | | Investments in securities, at value | | $ | 12,548 | | | | | | | |
| | | | |
Foreign exchange contracts | | | | | | | | Options written, at value | | $ | 1,160 | |
| | | | |
Interest rate contracts | | Unrealized appreciation on inflation swaps | | | 91,973 | | | Unrealized depreciation on inflation swaps | | | 155,469 | |
| | | | |
Credit contracts | | | | | | | | Market value on credit default swaps | | | 44,544 | |
| | | | |
Equity contracts | | Unrealized appreciation on total return swaps | | | 60,074 | | | Unrealized depreciation on total return swaps | | | 401,353 | |
| | | | |
Equity contracts | | Unrealized appreciation on variance swaps | | | 153,667 | | | Unrealized depreciation on variance swaps | | | 250,766 | |
| | | | | | | | | | | | |
Total | | | | $ | 2,202,828 | | | | | $ | 2,828,541 | |
| | | | | | | | | | | | |
| * | Only variation margin receivable/payable at period end is reported within the statement of assets and liabilities. This amount reflects cumulative unrealized appreciation/(depreciation) on futures and centrally cleared swaps as reported in the portfolio of investments. |
| | | | | | | | | | |
Derivative Type | | Location of Gain or
(Loss) on Derivatives
Within Statement of
Operations | | Realized Gain
or (Loss) on
Derivatives | | | Change in
Unrealized
Appreciation or
(Depreciation) | |
Interest rate contracts | | Net realized gain (loss) on futures; Net change in unrealized appreciation/depreciation of futures | | $ | 473,123 | | | $ | 32,306 | |
| | | |
Equity contracts | | Net realized gain (loss) on futures; Net change in unrealized appreciation/depreciation of futures | | | (351,785 | ) | | | 635,950 | |
| | |
| |
| abfunds.com | | AB CONSERVATIVE WEALTH STRATEGY | 87 |
NOTES TO FINANCIAL STATEMENTS(continued)
| | | | | | | | | | |
Derivative Type | | Location of Gain or
(Loss) on Derivatives
Within Statement of
Operations | | Realized Gain
or (Loss) on
Derivatives | | | Change in
Unrealized
Appreciation or
(Depreciation) | |
| | | |
Foreign currency contracts | | Net realized gain (loss) on forward currency exchange contracts; Net change in unrealized appreciation/depreciation of forward currency exchange contracts | | $ | 350,575 | | | $ | (217,156 | ) |
| | | |
Foreign exchange contracts | | Net realized gain (loss) on investment transactions; Net change in unrealized appreciation/depreciation of investments | | | (93,473 | ) | | | (17,571 | ) |
| | | |
Equity contracts | | Net realized gain (loss) on investment transactions; Net change in unrealized appreciation/depreciation of investments | | | (43,738 | ) | | | – 0 | – |
| | | |
Foreign exchange contracts | | Net realized gain (loss) on options written; Net change in unrealized appreciation/depreciation of options written | | | 81,021 | | | | 12,552 | |
| | | |
Equity contracts | | Net realized gain (loss) on options written; Net change in unrealized appreciation/depreciation of options written | | | (485,547 | ) | | | (34,660 | ) |
| | | |
Interest rate contracts | | Net realized gain (loss) on swaps; Net change in unrealized appreciation/depreciation of swaps | | | 42,347 | | | | (537,126 | ) |
| | | |
Credit contracts | | Net realized gain (loss) on swaps; Net change in unrealized appreciation/depreciation of swaps | | | (32,299 | ) | | | 156,021 | |
| | | |
Equity contracts | | Net realized gain (loss) on swaps; Net change in unrealized appreciation/depreciation of swaps | | | 417,030 | | | | (291,511 | ) |
| | | | | | | | | | |
Total | | | | $ | 357,254 | | | $ | (261,195 | ) |
| | | | | | | | | | |
| | |
| |
| 88 | AB CONSERVATIVE WEALTH STRATEGY | | abfunds.com |
NOTES TO FINANCIAL STATEMENTS(continued)
The following table represents the average monthly volume of the Fund’s derivative transactions during the six months ended February 28, 2019:
| | | | |
Futures: | | | | |
Average original value of buy contracts | | $ | 67,936,163 | |
Average original value of sale contracts | | $ | 35,668,695 | |
Forward Currency Exchange Contracts: | | | | |
Average principal amount of buy contracts | | $ | 35,017,328 | |
Average principal amount of sale contracts | | $ | 66,715,757 | |
Purchased Options: | | | | |
Average notional amount | | $ | 5,406,638 | |
Options Written: | | | | |
Average notional amount | | $ | 3,221,562 | |
Inflation Swaps: | | | | |
Average notional amount | | $ | 36,472,857 | |
Centrally Cleared Interest Rate Swaps: | | | | |
Average notional amount | | $ | 12,840,644 | |
Credit Default Swaps: | | | | |
Average notional amount of sale contracts | | $ | 1,741,429 | |
Centrally Cleared Credit Default Swaps: | | | | |
Average notional amount of buy contracts | | $ | 6,227,200 | |
Average notional amount of sale contracts | | $ | 25,626,895 | |
Total Return Swaps: | | | | |
Average notional amount | | $ | 18,914,495 | |
Variance Swaps: | | | | |
Average notional amount | | $ | 1,036,499 | (a) |
| (a) | Positions were open for two months during the period. |
For financial reporting purposes, the Fund does not offset derivative assets and derivative liabilities that are subject to netting arrangements in the statement of assets and liabilities.
All OTC derivatives held at period end were subject to netting arrangements. The following table presents the Fund’s derivative assets and liabilities by OTC counterparty net of amounts available for offset under ISDA Master Agreements (“MA”) and net of the related collateral received/pledged by the Fund as of February 28, 2019. Exchange-traded derivatives and centrally cleared swaps are not subject to netting arrangements and as such are excluded from the table.
| | | | | | | | | | | | | | | | | | | | |
Counterparty | | Derivatives
Assets
Subject
to a MA | | | Derivatives
Available
for Offset | | | Cash
Collateral
Received* | | | Security
Collateral
Received* | | | Net Amount of
Derivatives
Assets | |
Australia and New Zealand Banking Group Ltd. | | $ | 4,136 | | | $ | – 0 | – | | $ | – 0 | – | | $ | – 0 | – | | $ | 4,136 | |
Barclays Bank PLC | | | 173,294 | | | | (73,754 | ) | | | – 0 | – | | | – 0 | – | | | 99,540 | |
BNP Paribas SA | | | 35,593 | | | | (708 | ) | | | – 0 | – | | | – 0 | – | | | 34,885 | |
Citibank, NA | | | 162,230 | | | | (113,562 | ) | | | – 0 | – | | | – 0 | – | | | 48,668 | |
| | |
| |
| abfunds.com | | AB CONSERVATIVE WEALTH STRATEGY | 89 |
NOTES TO FINANCIAL STATEMENTS(continued)
| | | | | | | | | | | | | | | | | | | | |
Counterparty | | Derivatives
Assets
Subject
to a MA | | | Derivatives
Available
for Offset | | | Cash
Collateral
Received* | | | Security
Collateral
Received* | | | Net Amount of
Derivatives
Assets | |
Credit Suisse International | | $ | 53,814 | | | $ | (53,814 | ) | | $ | – 0 | – | | $ | – 0 | – | | $ | – 0 | – |
Deutsche Bank AG | | | 1,636 | | | | (1,636 | ) | | | – 0 | – | | | – 0 | – | | | – 0 | – |
Goldman Sachs Bank USA/Goldman Sachs International | | | 98,898 | | | | (89,099 | ) | | | – 0 | – | | | – 0 | – | | | 9,799 | |
HSBC Bank USA | | | 32,822 | | | | (32,822 | ) | | | – 0 | – | | | – 0 | – | | | – 0 | – |
JPMorgan Chase Bank, NA | | | 44,349 | | | | (44,349 | ) | | | – 0 | – | | | – 0 | – | | | – 0 | – |
Morgan Stanley & Co. International PLC/Morgan Stanley Capital Services LLC/Morgan Stanley Capital Services, Inc. | | | 28,436 | | | | (28,436 | ) | | | – 0 | – | | | – 0 | – | | | – 0 | – |
Natwest Markets PLC | | | 6,301 | | | | (6,301 | ) | | | – 0 | – | | | – 0 | – | | | – 0 | – |
Standard Chartered Bank | | | 14,508 | | | | (14,508 | ) | | | – 0 | – | | | – 0 | – | | | – 0 | – |
State Street Bank & Trust Co. | | | 268,545 | | | | (83,515 | ) | | | – 0 | – | | | – 0 | – | | | 185,030 | |
UBS AG | | | 23,623 | | | | (23,623 | ) | | | – 0 | – | | | – 0 | – | | | – 0 | – |
| | | | | | | | | | | | | | | | | | | | |
Total | | $ | 948,185 | | | $ | (566,127 | ) | | $ | – 0 | – | | $ | – 0 | – | | $ | 382,058 | ^ |
| | | | | | | | | | | | | | | | | | | | |
| | | | | |
Counterparty | | Derivatives
Liabilities
Subject
to a MA | | | Derivatives
Available
for Offset | | | Cash
Collateral
Pledged* | | | Security
Collateral
Pledged* | | | Net Amount of
Derivatives
Liabilities | |
Bank of America, NA | | $ | 304,830 | | | $ | – 0 | – | | $ | – 0 | – | | $ | (259,323 | ) | | $ | 45,507 | |
Barclays Bank PLC | | | 73,754 | | | | (73,754 | ) | | | – 0 | – | | | – 0 | – | | | – 0 | – |
BNP Paribas SA | | | 708 | | | | (708 | ) | | | – 0 | – | | | – 0 | – | | | – 0 | – |
Citibank, NA | | | 113,562 | | | | (113,562 | ) | | | – 0 | – | | | – 0 | – | | | – 0 | – |
Credit Suisse International | | | 60,935 | | | | (53,814 | ) | | | – 0 | – | | | – 0 | – | | | 7,121 | |
Deutsche Bank AG | | | 14,910 | | | | (1,636 | ) | | | – 0 | – | | | – 0 | – | | | 13,274 | |
Goldman Sachs & Co./Goldman Sachs Bank USA/Goldman Sachs International | | | 89,099 | | | | (89,099 | ) | | | – 0 | – | | | – 0 | – | | | – 0 | – |
HSBC Bank USA | | | 35,237 | | | | (32,822 | ) | | | – 0 | – | | | – 0 | – | | | 2,415 | |
JPMorgan Chase Bank, NA | | | 134,905 | | | | (44,349 | ) | | | – 0 | – | | | – 0 | – | | | 90,556 | |
| | |
| |
| 90 | AB CONSERVATIVE WEALTH STRATEGY | | abfunds.com |
NOTES TO FINANCIAL STATEMENTS(continued)
| | | | | | | | | | | | | | | | | | | | |
Counterparty | | Derivatives
Liabilities
Subject
to a MA | | | Derivatives
Available
for Offset | | | Cash
Collateral
Pledged* | | | Security
Collateral
Pledged* | | | Net Amount of
Derivatives
Liabilities | |
Morgan Stanley & Co. International PLC/Morgan Stanley Capital Services LLC/Morgan Stanley Capital Services, Inc. | | $ | 233,832 | | | $ | (28,436 | ) | | $ | – 0 | – | | $ | – 0 | – | | $ | 205,396 | |
Natwest Markets PLC | | | 11,434 | | | | (6,301 | ) | | | – 0 | – | | | – 0 | – | | | 5,133 | |
Standard Chartered Bank | | | 34,657 | | | | (14,508 | ) | | | – 0 | – | | | – 0 | – | | | 20,149 | |
State Street Bank & Trust Co. | | | 83,515 | | | | (83,515 | ) | | | – 0 | – | | | – 0 | – | | | – 0 | – |
UBS AG | | | 132,899 | | | | (23,623 | ) | | | – 0 | – | | | – 0 | – | | | 109,276 | |
| | | | | | | | | | | | | | | | | | | | |
Total | | $ | 1,324,277 | | | $ | (566,127 | ) | | $ | – 0 | – | | $ | (259,323 | ) | | $ | 498,827 | ^ |
| | | | | | | | | | | | | | | | | | | | |
| * | The actual collateral received/pledged may be more than the amount reported due to over-collateralization. |
| ^ | Net amount represents the net receivable/payable that would be due from/to the counterparty in the event of default or termination. The net amount from OTC financial derivative instruments can only be netted across transactions governed under the same master agreement with the same counterparty. |
2. Currency Transactions
The Fund may invest innon-U.S. Dollar-denominated securities on a currency hedged or unhedged basis. The Fund may seek investment opportunities by taking long or short positions in currencies through the use of currency-related derivatives, including forward currency exchange contracts, futures and options on futures, swaps, and other options. The Fund may enter into transactions for investment opportunities when it anticipates that a foreign currency will appreciate or depreciate in value but securities denominated in that currency are not held by the Fund and do not present attractive investment opportunities. Such transactions may also be used when the Adviser believes that it may be more efficient than a direct investment in a foreign currency-denominated security. The Fund may also conduct currency exchange contracts on a spot basis (i.e., for cash at the spot rate prevailing in the currency exchange market for buying or selling currencies).
NOTE E
Securities Lending
The Fund may enter into securities lending transactions. Under the Fund’s securities lending program, all loans of securities will be collateralized continually by cash collateral and/ornon-cash collateral.Non-cash collateral will include only securities issued or guaranteed by the U.S. government or its agencies or instrumentalities. If a loan is collateralized by cash, the Fund will be compensated for the loan from a portion of the net return from the
| | |
| |
| abfunds.com | | AB CONSERVATIVE WEALTH STRATEGY | 91 |
NOTES TO FINANCIAL STATEMENTS(continued)
income earned on cash collateral after a rebate is paid to the borrower (in some cases, this rebate may be a “negative rebate” or fee paid by the borrower to the Fund in connection with the loan), and payments are made for fees of the securities lending agent and for certain other administrative expenses. If the Fund receivesnon-cash collateral, the Fund will receive a fee from the borrower generally equal to a negotiated percentage of the market value of the loaned securities. The Fund will have the right to call a loan and obtain the securities loaned at any time on notice to the borrower within the normal and customary settlement time for the securities. While the securities are on loan, the borrower is obligated to pay the Fund amounts equal to any income or other distributions from the securities. The Fund will not be able to exercise voting rights with respect to any securities during the existence of a loan, but will have the right to regain ownership of loaned securities in order to exercise voting or other ownership rights. The lending agent has agreed to indemnify the Fund in the case of default of any securities borrower. Collateral received and securities loaned are marked to market daily to ensure that the securities loaned are secured by collateral. The lending agent currently invests the cash collateral received in Government Money Market Portfolio, an eligible money market vehicle, in accordance with the investment restrictions of the Fund, and as approved by the Board. The collateral received on securities loaned is recorded as an asset as well as a corresponding liability in the statement of assets and liabilities. When the Fund lends securities, its investment performance will continue to reflect changes in the value of the securities loaned. At February 28, 2019, the Fund had securities on loan with a value of $2,822,498 and had received cash collateral which has been invested into Government Money Market Portfolio of $2,905,070. The cash collateral will be adjusted on the next business day to maintain the required collateral amount. The Fund earned securities lending income of $15,235 and $5,430 from the borrowers and Government Money Market Portfolio, respectively, for the six months ended February 28, 2019; these amounts are reflected in the statement of operations. In connection with the cash collateral investment by the Fund in the Government Money Market Portfolio, the Adviser has agreed to waive a portion of the Fund’s share of the advisory fees of Government Money Market Portfolio, as borne indirectly by the Fund as an acquired fund fee and expense. For the six months ended February 28, 2019, such waiver amounted to $87. A principal risk of lending portfolio securities is that the borrower may fail to return the loaned securities upon termination of the loan and that the collateral will not be sufficient to replace the loaned securities.
| | |
| |
| 92 | AB CONSERVATIVE WEALTH STRATEGY | | abfunds.com |
NOTES TO FINANCIAL STATEMENTS(continued)
NOTE F
Shares of Beneficial Interest
Transactions in shares of beneficial interest for each class were as follows:
| | | | | | | | | | | | | | | | | | | | | | | | |
| | | | | | | | | | | | |
| | | Shares | | | | | | Amount | | | | |
| | | Six Months Ended
February 28, 2019
(unaudited) | | | Year Ended
August 31,
2018 | | | | | | Six Months Ended
February 28, 2019
(unaudited) | | | Year Ended
August 31,
2018 | | | | |
| | | | | | | | |
| Class A | | | | | |
Shares sold | | | 244,674 | | | | 698,626 | | | | | | | $ | 2,866,335 | | | $ | 8,786,849 | | | | | |
| | | | | |
Shares issued in reinvestment of dividends | | | 92,047 | | | | 924,025 | | | | | | | | 1,051,174 | | | | 11,208,429 | | | | | |
| | | | | |
Shares converted from Class B | | | 7,953 | | | | 22,576 | | | | | | | | 94,580 | | | | 277,100 | | | | | |
| | | | | |
Shares converted from Class C | | | 191,108 | | | | 856,851 | | | | | | | | 2,284,281 | | | | 10,418,142 | | | | | |
| | | | | |
Shares redeemed | | | (1,618,116 | ) | | | (2,935,476 | ) | | | | | | | (19,090,992 | ) | | | (36,171,038 | ) | | | | |
| | | | | |
Net decrease | | | (1,082,334 | ) | | | (433,398 | ) | | | | | | $ | (12,794,622 | ) | | $ | (5,480,518 | ) | | | | |
| | | | | |
| | | | | | | | | | | | | | | | | | | | | | | | |
| Class B | | | | | | | | | | | | | | | | | | | | | | | | |
Shares sold | | | 724 | | | | 5,741 | | | | | | | $ | 8,700 | | | $ | 72,401 | | | | | |
| | | | | |
Shares issued in reinvestment of dividends | | | – 0 | – | | | 5,154 | | | | | | | | – 0 | – | | | 63,965 | | | | | |
| | | | | |
Shares converted to Class A | | | (7,795 | ) | | | (22,220 | ) | | | | | | | (94,580 | ) | | | (277,100 | ) | | | | |
| | | | | |
Shares redeemed | | | (9,075 | ) | | | (20,082 | ) | | | | | | | (109,888 | ) | | | (252,278 | ) | | | | |
| | | | | |
Net decrease | | | (16,146 | ) | | | (31,407 | ) | | | | | | $ | (195,768 | ) | | $ | (393,012 | ) | | | | |
| | | | | |
| | | | | | | | | | | | | | | | | | | | | | | | |
Class C | | | | | | | | | | | | | | | | | | | | | | | | |
Shares sold | | | 51,107 | | | | 96,338 | | | | | | | $ | 602,833 | | | $ | 1,181,595 | | | | | |
| | | | | |
Shares issued in reinvestment of dividends | | | – 0 | – | | | 134,905 | | | | | | | | – 0 | – | | | 1,635,037 | | | | | |
| | | | | |
Shares converted to Class A | | | (192,090 | ) | | | (861,155 | ) | | | | | | | (2,284,281 | ) | | | (10,418,142 | ) | | | | |
| | | | | |
Shares redeemed | | | (136,194 | ) | | | (854,508 | ) | | | | | | | (1,598,190 | ) | | | (10,605,679 | ) | | | | |
| | | | | |
Net decrease | | | (277,177 | ) | | | (1,484,420 | ) | | | | | | $ | (3,279,638 | ) | | $ | (18,207,189 | ) | | | | |
| | | | | |
| | | | | | | | | | | | | | | | | | | | | | | | |
Advisor Class | | | | | | | | | | | | | | | | | | | | | | | | |
Shares sold | | | 71,129 | | | | 222,564 | | | | | | | $ | 846,201 | | | $ | 2,755,457 | | | | | |
| | | | | |
Shares issued in reinvestment of dividends | | | 5,464 | | | | 48,553 | | | | | | | | 62,624 | | | | 590,896 | | | | | |
| | | | | |
Shares redeemed | | | (260,145 | ) | | | (273,175 | ) | | | | | | | (3,100,460 | ) | | | (3,396,486 | ) | | | | |
| | | | | |
Net decrease | | | (183,552 | ) | | | (2,058 | ) | | | | | | $ | (2,191,635 | ) | | $ | (50,133 | ) | | | | |
| | | | | |
| | |
| |
| abfunds.com | | AB CONSERVATIVE WEALTH STRATEGY | 93 |
NOTES TO FINANCIAL STATEMENTS(continued)
| | | | | | | | | | | | | | | | | | | | | | | | |
| | | | | | | | | | | | | | | | | | | | | | | | |
| | | Shares | | | | | | Amount | | | | |
| | | Six Months Ended
February 28, 2019
(unaudited) | | | Year Ended
August 31,
2018 | | | | | | Six Months Ended
February 28, 2019
(unaudited) | | | Year Ended
August 31,
2018 | | | | |
| | | | | | | | |
| Class R | | | | | |
Shares sold | | | 175,103 | | | | 69,338 | | | | | | | $ | 2,059,308 | | | $ | 849,934 | | | | | |
| | | | | |
Shares issued in reinvestment of dividends | | | 1,395 | | | | 22,000 | | | | | | | | 15,968 | | | | 267,737 | | | | | |
| | | | | |
Shares redeemed | | | (148,988 | ) | | | (89,933 | ) | | | | | | | (1,750,075 | ) | | | (1,098,935 | ) | | | | |
| | | | | |
Net increase | | | 27,510 | | | | 1,405 | | | | | | | $ | 325,201 | | | $ | 18,736 | | | | | |
| | | | | |
| | | | | | | | | | | | | | | | | | | | | | | | |
| Class K | | | | | |
Shares sold | | | 9,494 | | | | 117,076 | | | | | | | $ | 111,638 | | | $ | 1,413,580 | | | | | |
| | | | | |
Shares issued in reinvestment of dividends | | | 3,888 | | | | 39,973 | | | | | | | | 44,322 | | | | 484,073 | | | | | |
| | | | | |
Shares redeemed | | | (43,275 | ) | | | (157,286 | ) | | | | | | | (495,593 | ) | | | (1,921,336 | ) | | | | |
| | | | | |
Net decrease | | | (29,893 | ) | | | (237 | ) | | | | | | $ | (339,633 | ) | | $ | (23,683 | ) | | | | |
| | | | | |
| | | | | | | | | | | | | | | | | | | | | | | | |
| Class I | | | | | |
Shares sold | | | 1 | | | | 967 | | | | | | | $ | 5 | | | $ | 12,013 | | | | | |
| | | | | |
Shares issued in reinvestment of dividends | | | 0 | (a) | | | 186 | | | | | | | | 0 | (b) | | | 2,294 | | | | | |
| | | | | |
Shares redeemed | | | – 0 | – | | | (3,134 | ) | | | | | | | – 0 | – | | | (38,644 | ) | | | | |
| | | | | |
Net increase (decrease) | | | 1 | | | | (1,981 | ) | | | | | | $ | 5 | | | $ | (24,337 | ) | | | | |
| | | | | |
| (a) | Share amount is less than one full share. |
| (b) | Amount is less than $.50. |
NOTE G
Risks Involved in Investing in the Fund
Interest Rate Risk and Credit Risk—Interest rate risk is the risk that changes in interest rates will affect the value of the Fund’s investments in fixed-income debt securities such as bonds or notes. Increases in interest rates may cause the value of the Fund’s investments to decline. Credit risk is the risk that the issuer or guarantor of a debt security, or the counterparty to a derivative contract, will be unable or unwilling to make timely principal and/or interest payments, or to otherwise honor its obligations. The degree of risk for a particular security may be reflected in its credit rating. Credit risk is greater for medium quality and lower-rated securities. Lower-rated debt securities and similar unrated securities (commonly known as “junk bonds”) have speculative elements or are predominantly speculative risks.
Allocation Risk—The allocation of investments among different investment styles, such as equity or debt, growth or value, U.S. ornon-U.S. securities,
| | |
| |
| 94 | AB CONSERVATIVE WEALTH STRATEGY | | abfunds.com |
NOTES TO FINANCIAL STATEMENTS(continued)
or diversification strategies, may have a more significant effect on the Fund’s net asset value, or NAV, when one of these investments is performing more poorly than another.
High Yield Debt Securities Risk—Investments in fixed-income securities with lower ratings (commonly known as “junk bonds”) tend to have a higher probability that an issuer will default or fail to meet its payment obligations. These securities may be subject to greater price volatility due to such factors as specific corporate developments, interest rate sensitivity, negative perceptions of the junk bond market generally and less secondary market liquidity.
Foreign(Non-U.S.) Risk—Investments in securities ofnon-U.S. issuers may involve more risk than those of U.S. issuers. These securities may fluctuate more widely in price and may be less liquid due to adverse market, economic, political, regulatory or other factors.
Currency Risk—Fluctuations in currency exchange rates may negatively affect the value of the Fund’s investments or reduce its returns.
Emerging Market Risk—Investments in emerging market countries may have more risk because the markets are less developed and less liquid as well as being subject to increased economic, political, regulatory or other uncertainties.
Alternative Investments Risk—Many alternative investments can be volatile and may be illiquid. Their performance may have little correlation with the performance of equity or fixed-income markets, and they may not perform in accordance with expectations.
Derivatives Risk—The Fund may enter into derivative transactions such as forwards, options, futures and swaps. Derivatives may be illiquid, difficult to price, and leveraged so that small changes may produce disproportionate losses for the Fund, and subject to counterparty risk to a greater degree than more traditional investments. Derivatives may result in significant losses, including losses that are far greater than the value of the derivatives reflected on the statement of assets and liabilities.
Leverage Risk—When the Fund borrows money or otherwise leverages its investments, its performance may be volatile because leverage tends to exaggerate the effect of any increase or decrease in the value of the Fund’s investments. The Fund may create leverage through the use of reverse repurchase arrangements, forward currency exchange contracts, forward commitments, dollar rolls or futures or by borrowing money. The use of other types of derivative instruments by the Fund, such as options and swaps, may also result in a form of leverage. Leverage may result in
| | |
| |
| abfunds.com | | AB CONSERVATIVE WEALTH STRATEGY | 95 |
NOTES TO FINANCIAL STATEMENTS(continued)
higher returns to the Fund than if the Fund were not leveraged, but may also adversely affect returns, particularly if the market is declining.
Investment in Other Investment Companies Risk—As with other investments, investments in other investment companies, are subject to market and selection risk. In addition, shareholders of the Fund bear both their proportionate share of expenses in the Fund (including management fees) and, indirectly, the expenses of the investment companies (to the extent these expenses are not waived or reimbursed by the Adviser).
Indemnification Risk—In the ordinary course of business, the Fund enters into contracts that contain a variety of indemnifications. The Fund’s maximum exposure under these arrangements is unknown. However, the Fund has not had prior claims or losses pursuant to these indemnification provisions and expects the risk of loss thereunder to be remote. Therefore, the Fund has not accrued any liability in connection with these indemnification provisions.
NOTE H
Joint Credit Facility
A number ofopen-end mutual funds managed by the Adviser, including the Fund, participate in a $325 million revolving credit facility (the “Facility”) intended to provide short-term financing, if necessary, subject to certain restrictions in connection with abnormal redemption activity. Commitment fees related to the Facility are paid by the participating funds and are included in miscellaneous expenses in the statement of operations. The Fund did not utilize the Facility during the six months ended February 28, 2019.
NOTE I
Distributions to Shareholders
The tax character of distributions to be paid for the year ending August 31, 2019 will be determined at the end of the current fiscal year. The tax character of distributions paid during the fiscal years ended August 31, 2018 and August 31, 2017 were as follows:
| | | | | | | | |
| | | 2018 | | | 2017 | |
Distributions paid from: | | | | | | | | |
Ordinary income | | $ | 9,480,247 | | | $ | 5,985,414 | |
Net long-term capital gains | | | 3,051,961 | | | | – 0 | – |
| | | | | | | | |
Total taxable distributions paid | | | 12,532,208 | | | | 5,985,414 | |
Return of capital | | | 3,206,894 | | | | – 0 | – |
| | | | | | | | |
Total distributions | | $ | 15,739,102 | | | $ | 5,985,414 | |
| | | | | | | | |
| | |
| |
| 96 | AB CONSERVATIVE WEALTH STRATEGY | | abfunds.com |
NOTES TO FINANCIAL STATEMENTS(continued)
As of August 31, 2018, the components of accumulated earnings/(deficit) on a tax basis were as follows:
| | | | |
Accumulated capital and other losses | | $ | (1,842,107 | )(a) |
Unrealized appreciation/(depreciation) | | | 6,803,181 | (b) |
| | | | |
Total accumulated earnings/(deficit) | | $ | 4,961,074 | |
| | | | |
| (a) | As of August 31, 2018, the Fund had a net capital loss carryforward of $1,822,474 and a cumulative deferred loss on straddles of $19,633. |
| (b) | The differences between book-basis andtax-basis unrealized appreciation/(depreciation) are attributable primarily to the tax deferral of losses on wash sales, the tax treatment of swaps, passive foreign investment companies (PFICs) and treasury inflation-protected securities, and the recognition for tax purposes of unrealized gains/losses on certain derivative instruments. |
For tax purposes, net realized capital losses may be carried over to offset future capital gains, if any. Funds are permitted to carry forward capital losses for an indefinite period, and such losses will retain their character as either short-term or long-term capital losses. As of August 31, 2018, the Fund had a net short-term capital loss carryforward of $377,905 and a net long-term capital loss carryforward of $1,444,569, which may be carried forward for an indefinite period.
NOTE J
Recent Accounting Pronouncements
In March 2017, the Financial Accounting Standards Board issued an Accounting Standards Update, ASU2017-08, Receivables—Nonrefundable Fees and Other Costs (Subtopic310-20), Premium Amortization on Purchased Callable Debt Securities which amends the amortization period for certain purchased callable debt securities held at a premium, shortening such period to the earliest call date. The ASU2017-08 does not require any accounting change for debt securities held at a discount; the discount continues to be amortized to maturity. The ASU2017-08 is effective for fiscal years, and interim periods within those fiscal years, beginning after December 15, 2018. At this time, management is evaluating the implications of these changes on the financial statements.
In August 2018, the Financial Accounting Standards Board issued an Accounting Standards Update, ASU2018-13, Fair Value Measurement (Topic 820), Disclosure Framework—Changes to the Disclosure Requirements for Fair Value Measurement which removes, modifies and adds disclosures to Topic 820. The amendments in this ASU2018-13 apply to all entities that are required, under existing U.S. GAAP, to make disclosures about recurring or nonrecurring fair value measurements. The amendments in this ASU2018-13 are effective for all entities for fiscal years, and interim periods within those fiscal years, beginning after December 15, 2019. At this time, management is evaluating the implications of these changes on the financial statements.
| | |
| |
| abfunds.com | | AB CONSERVATIVE WEALTH STRATEGY | 97 |
NOTES TO FINANCIAL STATEMENTS(continued)
In October 2018, the U.S. Securities and Exchange Commission adopted amendments to certain disclosure requirements included in RegulationS-X that had become “redundant, duplicative, overlapping, outdated or superseded, in light of the other Commission disclosure requirements, GAAP or changes in the information environment.” The compliance date for the amendments to RegulationS-X was November 5, 2018 (for reporting period end dates of September 30, 2018 or after). Management has adopted the amendments which simplified certain disclosure requirements on the financial statements.
NOTE K
Subsequent Events
Management has evaluated subsequent events for possible recognition or disclosure in the financial statements through the date the financial statements are issued. Management has determined that there are no material events that would require disclosure in the Fund’s financial statements through this date.
| | |
| |
| 98 | AB CONSERVATIVE WEALTH STRATEGY | | abfunds.com |
FINANCIAL HIGHLIGHTS
Selected Data For A Share Of Beneficial Interest Outstanding Throughout Each Period
| | | | | | | | | | | | | | | | | | | | | | | | |
| | | Class A | |
| | | Six Months Ended February 28, 2019 (unaudited) | | | Year Ended August 31, | |
| | | 2018 | | | 2017 | | | 2016 | | | 2015 | | | 2014 | |
| | | | |
| | | | | | | | | | | | | | | | | | | | | | | | |
Net asset value, beginning of period | | | $ 12.14 | | | | $ 12.79 | | | | $ 12.38 | | | | $ 12.18 | | | | $ 12.43 | | | | $ 11.59 | |
| | | | |
Income From Investment Operations | | | | | | | | | | | | | | | | | | | | | | | | |
| | | | | | |
Net investment income(a)(b) | | | .09 | | | | .17 | | | | .38 | | | | .27 | | | | .28 | | | | .23 | |
| | | | | | |
Net realized and unrealized gain (loss) on investment transactions | | | (.13 | ) | | | .10 | | | | .34 | | | | .19 | | | | (.48 | ) | | | .82 | |
| | | | |
Net increase (decrease) in net asset value from operations | | | (.04 | ) | | | .27 | | | | .72 | | | | .46 | | | | (.20 | ) | | | 1.05 | |
| | | | |
Less: Dividends and Distributions | | | | | | | | | | | | | | | | | | | | | | | | |
| | | | | | |
Dividends from net investment income | | | (.09 | ) | | | (.56 | ) | | | (.31 | ) | | | (.26 | ) | | | (.05 | ) | | | (.21 | ) |
| | | | | | |
Distributions from net realized gain on investment transactions | | | – 0 | – | | | (.17 | ) | | | – 0 | – | | | – 0 | – | | | – 0 | – | | | – 0 | – |
| | | | | | |
Return of capital | | | – 0 | – | | | (.19 | ) | | | – 0 | – | | | – 0 | – | | | – 0 | – | | | – 0 | – |
| | | | |
Total dividends and distributions | | | (.09 | ) | | | (.92 | ) | | | (.31 | ) | | | (.26 | ) | | | (.05 | ) | | | (.21 | ) |
| | | | |
Net asset value, end of period | | | $ 12.01 | | | | $ 12.14 | | | | $ 12.79 | | | | $ 12.38 | | | | $ 12.18 | | | | $ 12.43 | |
| | | | |
| | | | | | |
Total Return | | | | | | | | | | | | | | | | | | | | | | | | |
| | | | | | |
Total investment return based on net asset value(c)* | | | (.27 | )% | | | 2.14 | % | | | 5.93 | % | | | 3.86 | % | | | (1.59 | )% | | | 9.20 | % |
| | | | | | |
Ratios/Supplemental Data | | | | | | | | | | | | | | | | | | | | | | | | |
| | | | | | |
Net assets, end of period (000’s omitted) | | | $145,807 | | | | $160,517 | | | | $174,667 | | | | $180,380 | | | | $189,751 | | | | $209,189 | |
| | | | | | |
Ratio to average net assets of: | | | | | | | | | | | | | | | | | | | | | | | | |
| | | | | | |
Expenses, net of waivers/reimbursements(d)(e)‡ | | | 1.01 | %^ | | | 1.04 | % | | | 1.01 | % | | | .94 | % | | | .92 | % | | | 1.02 | % |
| | | | | | |
Expenses, before waivers/reimbursements(d)(e)‡ | | | 1.20 | %^ | | | 1.25 | % | | | 1.09 | % | | | 1.00 | % | | | .98 | % | | | 1.03 | % |
| | | | | | |
Net investment income(b) | | | 1.60 | %^ | | | 1.36 | % | | | 3.08 | % | | | 2.20 | % | | | 2.28 | % | | | 1.88 | % |
| | | | | | |
Portfolio turnover rate | | | 51 | % | | | 90 | % | | | 86 | % | | | 5 | % | | | 6 | % | | | 11 | % |
| | | | | | | | | | | | | | | | | | | | | | | | |
| |
‡ Expense ratios exclude the estimated acquired fund fees of the affiliated/unaffiliated underlying | |
portfolios | | | .22 | %^ | | | .25 | % | | | .22 | % | | | .24 | % | | | .21 | % | | | .04 | % |
See footnote summary on page 106.
| | |
| |
| abfunds.com | | AB CONSERVATIVE WEALTH STRATEGY | 99 |
FINANCIAL HIGHLIGHTS(continued)
Selected Data For A Share Of Beneficial Interest Outstanding Throughout Each Period
| | | | | | | | | | | | | | | | | | | | | | | | |
| | | Class B | |
| | | Six Months
Ended
February 28,
2019
(unaudited) | | | Year Ended August 31, | |
| | | 2018 | | | 2017 | | | 2016 | | | 2015 | | | 2014 | |
| | | | |
| | | | | | | | | | | | | | | | | | | | | | | | |
Net asset value, beginning of period | | | $ 12.35 | | | | $ 12.85 | | | | $ 12.23 | | | | $ 12.00 | | | | $ 12.29 | | | | $ 11.50 | |
| | | | |
Income From Investment Operations | | | | | | | | | | | | | | | | | | | | | | | | |
| | | | | | |
Net investment income(a)(b) | | | .05 | | | | .08 | | | | .29 | | | | .21 | | | | .22 | | | | .15 | |
| | | | | | |
Net realized and unrealized gain (loss) on investment transactions | | | (.13 | ) | | | .09 | | | | .33 | | | | .16 | | | | (.51 | ) | | | .81 | |
| | | | |
Net increase (decrease) in net asset value from operations | | | (.08 | ) | | | .17 | | | | .62 | | | | .37 | | | | (.29 | ) | | | .96 | |
| | | | |
Less: Dividends and Distributions | | | | | | | | | | | | | | | | | | | | | | | | |
| | | | | | |
Dividends from net investment income | | | – 0 | – | | | (.37 | ) | | | – 0 | – | | | (.14 | ) | | | – 0 | – | | | (.17 | ) |
| | | | | | |
Distributions from net realized gain on investment transactions | | | – 0 | – | | | (.17 | ) | | | – 0 | – | | | – 0 | – | | | – 0 | – | | | – 0 | – |
| | | | | | |
Return of capital | | | – 0 | – | | | (.13 | ) | | | – 0 | – | | | – 0 | – | | | – 0 | – | | | – 0 | – |
| | | | |
Total dividends and distributions | | | – 0 | – | | | (.67 | ) | | | – 0 | – | | | (.14 | ) | | | – 0 | – | | | (.17 | ) |
| | | | |
Net asset value, end of period | | | $ 12.27 | | | | $ 12.35 | | | | $ 12.85 | | | | $ 12.23 | | | | $ 12.00 | | | | $ 12.29 | |
| | | | |
| | | | | | |
Total Return | | | | | | | | | | | | | | | | | | | | | | | | |
| | | | | | |
Total investment return based on net asset value(c)* | | | (.65 | )% | | | 1.32 | % | | | 5.07 | % | | | 3.11 | % | | | (2.36 | )% | | | 8.46 | % |
| | | | | | |
Ratios/Supplemental Data | | | | | | | | | | | | | | | | | | | | | | | | |
| | | | | | |
Net assets, end of period (000’s omitted) | | | $840 | | | | $1,045 | | | | $1,490 | | | | $5,150 | | | | $18,706 | | | | $37,181 | |
| | | | | | |
Ratio to average net assets of: | | | | | | | | | | | | | | | | | | | | | | | | |
| | | | | | |
Expenses, net of waivers/reimbursements(d)(e)‡ | | | 1.78 | %^ | | | 1.80 | % | | | 1.76 | % | | | 1.69 | % | | | 1.68 | % | | | 1.73 | % |
| | | | | | |
Expenses, before waivers/reimbursements(d)(e)‡ | | | 1.97 | %^ | | | 2.01 | % | | | 1.84 | % | | | 1.75 | % | | | 1.74 | % | | | 1.74 | % |
| | | | | | |
Net investment income(b) | | | .83 | %^ | | | .60 | % | | | 2.37 | % | | | 1.77 | % | | | 1.80 | % | | | 1.28 | % |
| | | | | | |
Portfolio turnover rate | | | 51 | % | | | 90 | % | | | 86 | % | | | 5 | % | | | 6 | % | | | 11 | % |
| | | | | | | | | | | | | | | | | | | | | | | | |
| |
‡ Expense ratios exclude the estimated acquired fund fees of the affiliated/unaffiliated underlying | |
portfolios | | | .22 | %^ | | | .25 | % | | | .22 | % | | | .24 | % | | | .21 | % | | | .04 | % |
See footnote summary on page 106.
| | |
| |
| 100 | AB CONSERVATIVE WEALTH STRATEGY | | abfunds.com |
FINANCIAL HIGHLIGHTS(continued)
Selected Data For A Share Of Beneficial Interest Outstanding Throughout Each Period
| | | | | | | | | | | | | | | | | | | | | | | | |
| | | Class C | |
| | | Six Months
Ended
February 28,
2019 (unaudited) | | | Year Ended August 31, | |
| | | 2018 | | | 2017 | | | 2016 | | | 2015 | | | 2014 | |
| | | | |
| | | | | | | | | | | | | | | | | | | | | | | | |
Net asset value, beginning of period | | | $ 12.07 | | | | $ 12.58 | | | | $ 12.17 | | | | $ 12.00 | | | | $ 12.29 | | | | $ 11.50 | |
| | | | |
Income From Investment Operations | | | | | | | | | | | | | | | | | | | | | | | | |
| | | | | | |
Net investment income(a)(b) | | | .05 | | | | .08 | | | | .29 | | | | .17 | | | | .19 | | | | .14 | |
| | | | | | |
Net realized and unrealized gain (loss) on investment transactions | | | (.13 | ) | | | .09 | | | | .32 | | | | .19 | | | | (.48 | ) | | | .82 | |
| | | | |
Net increase (decrease) in net asset value from operations | | | (.08 | ) | | | .17 | | | | .61 | | | | .36 | | | | (.29 | ) | | | .96 | |
| | | | |
Less: Dividends and Distributions | | | | | | | | | | | | | | | | | | | | | | | | |
| | | | | | |
Dividends from net investment income | | | – 0 | – | | | (.38 | ) | | | (.20 | ) | | | (.19 | ) | | | – 0 | – | | | (.17 | ) |
| | | | | | |
Distributions from net realized gain on investment transactions | | | – 0 | – | | | (.17 | ) | | | – 0 | – | | | – 0 | – | | | – 0 | – | | | – 0 | – |
| | | | | | |
Return of capital | | | – 0 | – | | | (.13 | ) | | | – 0 | – | | | – 0 | – | | | – 0 | – | | | – 0 | – |
| | | | |
Total dividends and distributions | | | – 0 | – | | | (.68 | ) | | | (.20 | ) | | | (.19 | ) | | | – 0 | – | | | (.17 | ) |
| | | | |
Net asset value, end of period | | | $ 11.99 | | | | $ 12.07 | | | | $ 12.58 | | | | $ 12.17 | | | | $ 12.00 | | | | $ 12.29 | |
| | | | |
| | | | | | |
Total Return | | | | | | | | | | | | | | | | | | | | | | | | |
| | | | | | |
Total investment return based on net asset value(c)* | | | (.66 | )% | | | 1.37 | % | | | 5.12 | % | | | 3.09 | % | | | (2.36 | )% | | | 8.47 | % |
| | | | | | |
Ratios/Supplemental Data | | | | | | | | | | | | | | | | | | | | | | | | |
| | | | | | |
Net assets, end of period (000’s omitted) | | | $18,576 | | | | $22,039 | | | | $41,637 | | | | $73,686 | | | | $83,574 | | | | $95,109 | |
| | | | | | |
Ratio to average net assets of: | | | | | | | | | | | | | | | | | | | | | | | | |
| | | | | | |
Expenses, net of waivers/reimbursements(d)(e)‡ | | | 1.76 | %^ | | | 1.77 | % | | | 1.75 | % | | | 1.69 | % | | | 1.68 | % | | | 1.73 | % |
| | | | | | |
Expenses, before waivers/reimbursements(d)(e)‡ | | | 1.95 | %^ | | | 1.98 | % | | | 1.82 | % | | | 1.75 | % | | | 1.74 | % | | | 1.73 | % |
| | | | | | |
Net investment income(b) | | | .84 | %^ | | | .64 | % | | | 2.41 | % | | | 1.45 | % | | | 1.54 | % | | | 1.20 | % |
| | | | | | |
Portfolio turnover rate | | | 51 | % | | | 90 | % | | | 86 | % | | | 5 | % | | | 6 | % | | | 11 | % |
| | | | | | | | | | | | | | | | | | | | | | | | |
| |
‡ Expense ratios exclude the estimated acquired fund fees of the affiliated/unaffiliated underlying | |
portfolios | | | .22 | %^ | | | .25 | % | | | .22 | % | | | .24 | % | | | .21 | % | | | .04 | % |
See footnote summary on page 106.
| | |
| |
| abfunds.com | | AB CONSERVATIVE WEALTH STRATEGY | 101 |
FINANCIAL HIGHLIGHTS(continued)
Selected Data For A Share Of Beneficial Interest Outstanding Throughout Each Period
| | | | | | | | | | | | | | | | | | | | | | | | |
| | | Advisor Class | |
| | | Six Months
Ended
February 28,
2019 (unaudited) | | | Year Ended August 31, | |
| | | 2018 | | | 2017 | | | 2016 | | | 2015 | | | 2014 | |
| | | | |
| | | | | | | | | | | | | | | | | | | | | | | | |
Net asset value, beginning of period | | | $ 12.20 | | | | $ 12.86 | | | | $ 12.45 | | | | $ 12.24 | | | | $ 12.48 | | | | $ 11.62 | |
| | | | |
Income From Investment Operations | | | | | | | | | | | | | | | | | | | | | | | | |
| | | | | | |
Net investment income(a)(b) | | | .11 | | | | .20 | | | | .41 | | | | .32 | | | | .33 | | | | .24 | |
| | | | | | |
Net realized and unrealized gain (loss) on investment transactions | | | (.14 | ) | | | .10 | | | | .33 | | | | .17 | | | | (.49 | ) | | | .85 | |
| | | | |
Net increase (decrease) in net asset value from operations | | | (.03 | ) | | | .30 | | | | .74 | | | | .49 | | | | (.16 | ) | | | 1.09 | |
| | | | |
Less: Dividends and Distributions | | | | | | | | | | | | | | | | | | | | | | | | |
| | | | | | |
Dividends from net investment income | | | (.12 | ) | | | (.59 | ) | | | (.33 | ) | | | (.28 | ) | | | (.08 | ) | | | (.23 | ) |
| | | | | | |
Distributions from net realized gain on investment transactions | | | – 0 | – | | | (.17 | ) | | | – 0 | – | | | – 0 | – | | | – 0 | – | | | – 0 | – |
| | | | | | |
Return of capital | | | – 0 | – | | | (.20 | ) | | | – 0 | – | | | – 0 | – | | | – 0 | – | | | – 0 | – |
| | | | |
Total dividends and distributions | | | (.12 | ) | | | (.96 | ) | | | (.33 | ) | | | (.28 | ) | | | (.08 | ) | | | (.23 | ) |
| | | | |
Net asset value, end of period | | | $ 12.05 | | | | $ 12.20 | | | | $ 12.86 | | | | $ 12.45 | | | | $ 12.24 | | | | $ 12.48 | |
| | | | |
| | | | | | |
Total Return | | | | | | | | | | | | | | | | | | | | | | | | |
| | | | | | |
Total investment return based on net asset value(c)* | | | (.16 | )% | | | 2.39 | % | | | 6.15 | % | | | 4.12 | % | | | (1.31 | )% | | | 9.52 | % |
| | | | | | |
Ratios/Supplemental Data | | | | | | | | | | | | | | | | | | | | | | | | |
| | | | | | |
Net assets, end of period (000’s omitted) | | | $6,454 | | | | $8,772 | | | | $9,274 | | | | $12,277 | | | | $13,802 | | | | $16,800 | |
| | | | | | |
Ratio to average net assets of: | | | | | | | | | | | | | | | | | | | | | | | | |
| | | | | | |
Expenses, net of waivers/reimbursements(d)(e)‡ | | | .76 | %^ | | | .79 | % | | | .75 | % | | | .69 | % | | | .67 | % | | | .72 | % |
| | | | | | |
Expenses, before waivers/reimbursements(d)(e)‡ | | | .95 | %^ | | | 1.00 | % | | | .83 | % | | | .75 | % | | | .73 | % | | | .73 | % |
| | | | | | |
Net investment income(b) | | | 1.86 | %^ | | | 1.60 | % | | | 3.26 | % | | | 2.60 | % | | | 2.66 | % | | | 1.97 | % |
| | | | | | |
Portfolio turnover rate | | | 51 | % | | | 90 | % | | | 86 | % | | | 5 | % | | | 6 | % | | | 11 | % |
| | | | | | | | | | | | | | | | | | | | | | | | |
| |
‡ Expense ratios exclude the estimated acquired fund fees of the affiliated/unaffiliated underlying | |
portfolios | | | .22 | %^ | | | .25 | % | | | .22 | % | | | .24 | % | | | .21 | % | | | .04 | % |
See footnote summary on page 106.
| | |
| |
| 102 | AB CONSERVATIVE WEALTH STRATEGY | | abfunds.com |
FINANCIAL HIGHLIGHTS(continued)
Selected Data For A Share Of Beneficial Interest Outstanding Throughout Each Period
| | | | | | | | | | | | | | | | | | | | | | | | |
| | | Class R | |
| | | Six Months
Ended
February 28,
2019 (unaudited) | | | Year Ended August 31, | |
| | | 2018 | | | 2017 | | | 2016 | | | 2015 | | | 2014 | |
| | | | |
| | | | | | | | | | | | | | | | | | | | | | | | |
Net asset value, beginning of period | | | $ 12.13 | | | | $ 12.76 | | | | $ 12.36 | | | | $ 12.15 | | | | $ 12.42 | | | | $ 11.60 | |
| | | | |
Income From Investment Operations | | | | | | | | | | | | | | | | | | | | | | | | |
| | | | | | |
Net investment income(a)(b) | | | .07 | | | | .12 | | | | .33 | | | | .25 | | | | .25 | | | | .19 | |
| | | | | | |
Net realized and unrealized gain (loss) on investment transactions | | | (.12 | ) | | | .09 | | | | .32 | | | | .17 | | | | (.50 | ) | | | .82 | |
| | | | |
Net increase (decrease) in net asset value from operations | | | (.05 | ) | | | .21 | | | | .65 | | | | .42 | | | | (.25 | ) | | | 1.01 | |
| | | | |
Less: Dividends and Distributions | | | | | | | | | | | | | | | | | | | | | | | | |
| | | | | | |
Dividends from net investment income | | | (.05 | ) | | | (.50 | ) | | | (.25 | ) | | | (.21 | ) | | | (.02 | ) | | | (.19 | ) |
| | | | | | |
Distributions from net realized gain on investment transactions | | | – 0 | – | | | (.17 | ) | | | – 0 | – | | | – 0 | – | | | – 0 | – | | | – 0 | – |
| | | | | | |
Return of capital | | | – 0 | – | | | (.17 | ) | | | – 0 | – | | | – 0 | – | | | – 0 | – | | | – 0 | – |
| | | | |
Total dividends and distributions | | | (.05 | ) | | | (.84 | ) | | | (.25 | ) | | | (.21 | ) | | | (.02 | ) | | | (.19 | ) |
| | | | |
Net asset value, end of period | | | $ 12.03 | | | | $ 12.13 | | | | $ 12.76 | | | | $ 12.36 | | | | $ 12.15 | | | | $ 12.42 | |
| | | | |
| | | | | | |
Total Return | | | | | | | | | | | | | | | | | | | | | | | | |
| | | | | | |
Total investment return based on net asset value(c)* | | | (.49 | )% | | | 1.73 | % | | | 5.42 | % | | | 3.56 | % | | | (2.02 | )% | | | 8.84 | % |
| | | | | | |
Ratios/Supplemental Data | | | | | | | | | | | | | | | | | | | | | | | | |
| | | | | | |
Net assets, end of period (000’s omitted) | | | $4,193 | | | | $3,896 | | | | $4,078 | | | | $4,532 | | | | $5,632 | | | | $7,237 | |
| | | | | | |
Ratio to average net assets of: | | | | | | | | | | | | | | | | | | | | | | | | |
| | | | | | |
Expenses, net of waivers/reimbursements(d)(e)‡ | | | 1.40 | %^ | | | 1.45 | % | | | 1.42 | % | | | 1.34 | % | | | 1.34 | % | | | 1.39 | % |
| | | | | | |
Expenses, before waivers/reimbursements(d)(e)‡ | | | 1.60 | %^ | | | 1.66 | % | | | 1.50 | % | | | 1.40 | % | | | 1.40 | % | | | 1.39 | % |
| | | | | | |
Net investment income(b) | | | 1.21 | %^ | | | .94 | % | | | 2.63 | % | | | 2.03 | % | | | 2.00 | % | | | 1.54 | % |
| | | | | | |
Portfolio turnover rate | | | 51 | % | | | 90 | % | | | 86 | % | | | 5 | % | | | 6 | % | | | 11 | % |
| | | | | | | | | | | | | | | | | | | | | | | | |
| |
‡ Expense ratios exclude the estimated acquired fund fees of the affiliated/unaffiliated underlying | |
portfolios | | | .22 | %^ | | | .25 | % | | | .22 | % | | | .24 | % | | | .21 | % | | | .04 | % |
See footnote summary on page 106.
| | |
| |
| abfunds.com | | AB CONSERVATIVE WEALTH STRATEGY | 103 |
FINANCIAL HIGHLIGHTS(continued)
Selected Data For A Share Of Beneficial Interest Outstanding Throughout Each Period
| | | | | | | | | | | | | | | | | | | | | | | | |
| | | Class K | |
| | | Six Months
Ended
February 28,
2019 (unaudited) | | | Year Ended August 31, | |
| | | 2018 | | | 2017 | | | 2016 | | | 2015 | | | 2014 | |
| | | | |
| | | | | | | | | | | | | | | | | | | | | | | | |
Net asset value, beginning of period | | | $ 12.11 | | | | $ 12.75 | | | | $ 12.35 | | | | $ 12.15 | | | | $ 12.41 | | | | $ 11.57 | |
| | | | |
Income From Investment Operations | | | | | | | | | | | | | | | | | | | | | | | | |
| | | | | | |
Net investment income(a)(b) | | | .09 | | | | .15 | | | | .37 | | | | .25 | | | | .27 | | | | .24 | |
| | | | | | |
Net realized and unrealized gain (loss) on investment transactions | | | (.13 | ) | | | .11 | | | | .32 | | | | .20 | | | | (.49 | ) | | | .81 | |
| | | | |
Net increase (decrease) in net asset value from operations | | | (.04 | ) | | | .26 | | | | .69 | | | | .45 | | | | (.22 | ) | | | 1.05 | |
| | | | |
Less: Dividends and Distributions | | | | | | | | | | | | | | | | | | | | | | | | |
| | | | | | |
Dividends from net investment income | | | (.08 | ) | | | (.55 | ) | | | (.29 | ) | | | (.25 | ) | | | (.04 | ) | | | (.21 | ) |
| | | | | | |
Distributions from net realized gain on investment transactions | | | – 0 | – | | | (.17 | ) | | | – 0 | – | | | – 0 | – | | | – 0 | – | | | – 0 | – |
| | | | | | |
Return of capital | | | – 0 | – | | | (.18 | ) | | | – 0 | – | | | – 0 | – | | | – 0 | – | | | – 0 | – |
| | | | |
Total dividends and distributions | | | (.08 | ) | | | (.90 | ) | | | (.29 | ) | | | (.25 | ) | | | (.04 | ) | | | (.21 | ) |
| | | | |
Net asset value, end of period | | | $ 11.99 | | | | $ 12.11 | | | | $ 12.75 | | | | $ 12.35 | | | | $ 12.15 | | | | $ 12.41 | |
| | | | |
| | | | | | |
Total Return | | | | | | | | | | | | | | | | | | | | | | | | |
| | | | | | |
Total investment return based on net asset value(c)* | | | (.29 | )% | | | 2.07 | % | | | 5.72 | % | | | 3.82 | % | | | (1.73 | )% | | | 9.22 | % |
| | | | | | |
Ratios/Supplemental Data | | | | | | | | | | | | | | | | | | | | | | | | |
| | | | | | |
Net assets, end of period (000’s omitted) | | | $6,307 | | | | $6,734 | | | | $7,096 | | | | $7,277 | | | | $8,204 | | | | $8,611 | |
| | | | | | |
Ratio to average net assets of: | | | | | | | | | | | | | | | | | | | | | | | | |
| | | | | | |
Expenses, net of waivers/reimbursements(d)(e)‡ | | | 1.10 | %^ | | | 1.15 | % | | | 1.11 | % | | | 1.03 | % | | | 1.01 | % | | | 1.08 | % |
| | | | | | |
Expenses, before waivers/reimbursements(d)(e)‡ | | | 1.29 | %^ | | | 1.36 | % | | | 1.19 | % | | | 1.09 | % | | | 1.07 | % | | | 1.08 | % |
| | | | | | |
Net investment income(b) | | | 1.52 | %^ | | | 1.23 | % | | | 2.96 | % | | | 2.08 | % | | | 2.19 | % | | | 1.97 | % |
| | | | | | |
Portfolio turnover rate | | | 51 | % | | | 90 | % | | | 86 | % | | | 5 | % | | | 6 | % | | | 11 | % |
| | | | | | | | | | | | | | | | | | | | | | | | |
| |
‡ Expense ratios exclude the estimated acquired fund fees of the affiliated/unaffiliated underlying | |
portfolios | | | .22 | %^ | | | .25 | % | | | .22 | % | | | .24 | % | | | .21 | % | | | .04 | % |
See footnote summary on page 106.
| | |
| |
| 104 | AB CONSERVATIVE WEALTH STRATEGY | | abfunds.com |
FINANCIAL HIGHLIGHTS(continued)
Selected Data For A Share Of Beneficial Interest Outstanding Throughout Each Period
| | | | | | | | | | | | | | | | | | | | | | | | |
| | | Class I | |
| | | Six Months
Ended
February 28,
2019
(unaudited) | | | Year Ended August 31, | |
| | | 2018 | | | 2017 | | | 2016 | | | 2015 | | | 2014 | |
| | | | |
| | | | | | | | | | | | | | | | | | | | | | | | |
Net asset value, beginning of period | | | $ 12.34 | | | | $ 12.82 | | | | $ 12.42 | | | | $ 12.21 | | | | $ 12.46 | | | | $ 11.60 | |
| | | | |
Income From Investment Operations | | | | | | | | | | | | | | | | | | | | | | | | |
| | | | | | |
Net investment income(a)(b) | | | .11 | | | | .25 | | | | .40 | | | | .29 | | | | .41 | | | | .31 | |
| | | | | | |
Net realized and unrealized gain (loss) on investment transactions | | | (.14 | ) | | | .05 | | | | .34 | | | | .20 | | | | (.59 | ) | | | .78 | |
| | | | |
Net increase (decrease) in net asset value from operations | | | (.03 | ) | | | .30 | | | | .74 | | | | .49 | | | | (.18 | ) | | | 1.09 | |
| | | | |
Less: Dividends and Distributions | | | | | | | | | | | | | | | | | | | | | | | | |
| | | | | | |
Dividends from net investment income | | | (.13 | ) | | | (.46 | ) | | | (.34 | ) | | | (.28 | ) | | | (.07 | ) | | | (.23 | ) |
| | | | | | |
Distributions from net realized gain on investment transactions | | | – 0 | – | | | (.17 | ) | | | – 0 | – | | | – 0 | – | | | – 0 | – | | | – 0 | – |
| | | | | | |
Return of capital | | | – 0 | – | | | (.15 | ) | | | – 0 | – | | | – 0 | – | | | – 0 | – | | | – 0 | – |
| | | | |
Total dividends and distributions | | | (.13 | ) | | | (.78 | ) | | | (.34 | ) | | | (.28 | ) | | | (.07 | ) | | | (.23 | ) |
| | | | |
Net asset value, end of period | | | $ 12.18 | | | | $ 12.34 | | | | $ 12.82 | | | | $ 12.42 | | | | $ 12.21 | | | | $ 12.46 | |
| | | | |
| | | | | | |
Total Return | | | | | | | | | | | | | | | | | | | | | | | | |
| | | | | | |
Total investment return based on net asset value(c)* | | | (.19 | )% | | | 2.34 | % | | | 6.09 | % | | | 4.11 | % | | | (1.41 | )% | | | 9.54 | % |
| | | | | | |
Ratios/Supplemental Data | | | | | | | | | | | | | | | | | | | | | | | | |
| | | | | | |
Net assets, end of period (000’s omitted) | | | $10 | | | | $10 | | | | $36 | | | | $453 | | | | $454 | | | | $538 | |
| | | | | | |
Ratio to average net assets of: | | | | | | | | | | | | | | | | | | | | | | | | |
| | | | | | |
Expenses, net of waivers/reimbursements(d)(e)‡ | | | .78 | %^ | | | .73 | % | | | .78 | % | | | .72 | % | | | .70 | % | | | .75 | % |
| | | | | | |
Expenses, before waivers/reimbursements(d)(e)‡ | | | .96 | %^ | | | .94 | % | | | .86 | % | | | .77 | % | | | .76 | % | | | .75 | % |
| | | | | | |
Net investment income(b) | | | 1.80 | %^ | | | 1.99 | % | | | 3.25 | % | | | 2.41 | % | | | 3.32 | % | | | 2.56 | % |
| | | | | | |
Portfolio turnover rate | | | 51 | % | | | 90 | % | | | 86 | % | | | 5 | % | | | 6 | % | | | 11 | % |
| | | | | | | | | | | | | | | | | | | | | | | | |
| |
‡ Expense ratios exclude the estimated acquired fund fees of the affiliated/unaffiliated underlying | |
portfolios | | | .22 | %^ | | | .25 | % | | | .22 | % | | | .24 | % | | | .21 | % | | | .04 | % |
See footnote summary on page 106.
| | |
| |
| abfunds.com | | AB CONSERVATIVE WEALTH STRATEGY | 105 |
FINANCIAL HIGHLIGHTS(continued)
Selected Data For A Share Of Beneficial Interest Outstanding Throughout Each Period
| (a) | Based on average shares outstanding. |
| (b) | Net of fees and expenses waived/reimbursed by the Adviser. |
| (c) | Total investment return is calculated assuming an initial investment made at the net asset value at the beginning of the period, reinvestment of all dividends and distributions at net asset value during the period, and redemption on the last day of the period. Initial sales charges or contingent deferred sales charges are not reflected in the calculation of total investment return. Total return does not reflect the deduction of taxes that a shareholder would pay on fund distributions or the redemption of fund shares. Total investment return calculated for a period of less than one year is not annualized. |
| (d) | In connection with the Fund’s investments in affiliated underlying portfolios, the Fund incurs no direct expenses, but bears proportionate shares of the fees and expenses (i.e., operating, administrative and investment advisory fees) of the affiliated underlying portfolios. The Adviser has contractually agreed to waive its fees from the Fund in an amount equal to the Fund’s pro rata share of certain acquired fund fees and expenses, and for the six months ended February 28, 2019 and the years ended August 31, 2018 and August 31, 2017, such waivers amounted to .19% (annualized), .21% and .08%, respectively. |
| (e) | The expense ratios presented below exclude interest/bank overdraft expense: |
| | | | | | | | | | | | | | | | | | | | | | | | |
| | | Six Months
Ended
February 28,
2019 (unaudited) | | | Year Ended August 31, | |
| | | 2018 | | | 2017 | | | 2016 | | | 2015 | | | 2014 | |
| | | | |
Class A | | | | | | | | | | | | | | | | | | | | | | | | |
| | | | | | |
Net of waivers/reimbursements | | | 1.00 | %^ | | | N/A | | | | N/A | | | | N/A | | | | N/A | | | | N/A | |
| | | | | | |
Before waivers/reimbursements | | | 1.20 | %^ | | | N/A | | | | N/A | | | | N/A | | | | N/A | | | | N/A | |
Class B | | | | | | | | | | | | | | | | | | | | | | | | |
| | | | | | |
Net of waivers/reimbursements | | | 1.77 | %^ | | | N/A | | | | N/A | | | | N/A | | | | N/A | | | | N/A | |
| | | | | | |
Before waivers/reimbursements | | | 1.97 | %^ | | | N/A | | | | N/A | | | | N/A | | | | N/A | | | | N/A | |
Class C | | | | | | | | | | | | | | | | | | | | | | | | |
| | | | | | |
Net of waivers/reimbursements | | | 1.75 | %^ | | | N/A | | | | N/A | | | | N/A | | | | N/A | | | | N/A | |
| | | | | | |
Before waivers/reimbursements | | | 1.95 | %^ | | | N/A | | | | N/A | | | | N/A | | | | N/A | | | | N/A | |
Advisor Class | | | | | | | | | | | | | | | | | | | | | | | | |
| | | | | | |
Net of waivers/reimbursements | | | .75 | %^ | | | N/A | | | | N/A | | | | N/A | | | | N/A | | | | N/A | |
| | | | | | |
Before waivers/reimbursements | | | .94 | %^ | | | N/A | | | | N/A | | | | N/A | | | | N/A | | | | N/A | |
Class R | | | | | | | | | | | | | | | | | | | | | | | | |
| | | | | | |
Net of waivers/reimbursements | | | 1.40 | %^ | | | N/A | | | | N/A | | | | N/A | | | | N/A | | | | N/A | |
| | | | | | |
Before waivers/reimbursements | | | 1.59 | %^ | | | N/A | | | | N/A | | | | N/A | | | | N/A | | | | N/A | |
Class K | | | | | | | | | | | | | | | | | | | | | | | | |
| | | | | | |
Net of waivers/reimbursements | | | 1.09 | %^ | | | N/A | | | | N/A | | | | N/A | | | | N/A | | | | N/A | |
| | | | | | |
Before waivers/reimbursements | | | 1.29 | %^ | | | N/A | | | | N/A | | | | N/A | | | | N/A | | | | N/A | |
Class I | | | | | | | | | | | | | | | | | | | | | | | | |
| | | | | | |
Net of waivers/reimbursements | | | .78 | %^ | | | N/A | | | | N/A | | | | N/A | | | | N/A | | | | N/A | |
| | | | | | |
Before waivers/reimbursements | | | .96 | %^ | | | N/A | | | | N/A | | | | N/A | | | | N/A | | | | N/A | |
| * | Includes the impact of proceeds received and credited to the Fund resulting from class action settlements, which enhanced the Fund’s performance for the years ended August 31, 2018 and August 31, 2017 by .03% and .28%, respectively. |
See notes to financial statements.
| | |
| |
| 106 | AB CONSERVATIVE WEALTH STRATEGY | | abfunds.com |
RESULTS OF SHAREHOLDERS MEETING
(unaudited)
A Special Meeting of Shareholders of The AB Portfolios (the “Company”)—AB Conservative Wealth Strategy (the “Fund”) was held on October 11, 2018, and adjourned until December 11, 2018. A description of each proposal and the number of shares voted at the Meeting are as follows (the proposal numbers shown below correspond to the proposal number in the Fund’s proxy statement):
| 1. | To approve and vote upon the election of Trustees for the Company, each such Trustee to serve for a term of indefinite duration and until his or her successor is duly elected and qualifies. |
| | | | | | | | |
Trustee: | | Voted
For: | | | Authority
Withheld: | |
Michael J. Downey | | | 112,255,334 | | | | 2,874,198 | |
William H. Foulk, Jr.* | | | 112,062,437 | | | | 3,067,095 | |
Nancy P. Jacklin | | | 112,466,540 | | | | 2,662,992 | |
Robert M. Keith | | | 112,388,936 | | | | 2,740,596 | |
Carol C. McMullen | | | 112,486,090 | | | | 2,643,442 | |
Gary L. Moody | | | 112,308,212 | | | | 2,821,321 | |
Marshall C. Turner, Jr. | | | 112,101,288 | | | | 3,028,244 | |
Earl D. Weiner | | | 112,176,204 | | | | 2,953,328 | |
| 2. | To vote upon the approval of new advisory agreements for the Fund with AllianceBernstein L.P. |
| | | | | | | | | | | | | | |
Voted
For | | | Voted
Against | | | Abstained | | | Broker-Non
Votes | |
| | 6,618,378 | | | | 132,809 | | | | 422,807 | | | | 1,921,311 | |
| * | Mr. Foulk retired on December 31, 2018. |
| | |
| |
| abfunds.com | | AB CONSERVATIVE WEALTH STRATEGY | 107 |
TRUSTEES
| | |
Marshall C. Turner, Jr.(1),Chairman Michael J. Downey(1) Nancy P. Jacklin(1) | | Robert M. Keith,President and Chief Executive Officer Carol C. McMullen(1) Garry L. Moody(1) Earl D. Weiner(1) |
| |
| OFFICERS | | |
Alexander Barenboym(2),
Vice President Daniel J. Loewy(2),Vice President Emilie D. Wrapp,Clerk Michael B. Reyes,Senior Analyst | | Joseph J. Mantineo,Treasurer and Chief Financial Officer Phyllis J. Clarke,Controller and Chief Accounting Officer Vincent S. Noto,ChiefCompliance Officer |
| | |
Custodian and Accounting Agent State Street Bank and Trust Company
State Street Corporation CCB/5
1 Iron Street
Boston, MA 02210 Principal Underwriter AllianceBernstein Investments, Inc.
1345 Avenue of the Americas
New York, NY 10105 Legal Counsel Seward & Kissel LLP
One Battery Park Plaza
New York, NY 10004 | | Transfer Agent AllianceBernstein Investor Services, Inc.
P.O. Box 786003
San Antonio, TX 78278-6003
Toll-Free (800) 221-5672 Independent Registered Public Accounting Firm Ernst & Young LLP
5 Times Square
New York, NY 10036 |
| 1 | Member of the Audit Committee, the Governance and Nominating Committee and the Independent Directors Committee. |
| 2 | The day-to-day management of, and investment decisions for, the Strategy’s portfolio are made by the Adviser’s Multi-Asset Solutions Team. Messrs. Barenboym and Loewy are the investment professionals primarily responsible for the day-to-day management of the AB Conservative Wealth Strategy’s portfolio. |
| | |
| |
| 108 | AB CONSERVATIVE WEALTH STRATEGY | | abfunds.com |
Information Regarding the Review and Approval of the Fund’s Proposed New Advisory Agreement and Interim Advisory Agreement in the Context of Potential Assignments
As described in more detail in the Proxy Statement for the AB Funds dated August 20, 2018, the Boards of the AB Funds, at a meeting held onJuly 31-August 2, 2018, approved new advisory agreements with the Adviser (the “Proposed Agreements”) for the AB Funds, including The AB Portfolios in respect of AB Conservative Wealth Strategy (the “Fund”), in connection with the planned disposition by AXA S.A. of its remaining shares of AXA Equitable Holdings, Inc. (the indirect holder of a majority of the partnership interests in the Adviser and the indirect parent of AllianceBernstein Corporation, the general partner of the Adviser) in one or more transactions and the related potential for one or more “assignments” (within the meaning of section 2(a)(4) of the Investment Company Act) of the advisory agreements for the AB Funds, including the Fund’s Advisory Agreement, resulting in the automatic termination of such advisory agreements.
At the same meeting, the AB Boards also considered and approved interim advisory agreements with the Adviser (the “Interim Advisory Agreements”) for the AB Funds, including the Fund, to be effective only in the event that stockholder approval of a Proposed Agreement had not been obtained as of the date of one or more transactions resulting in an “assignment” of the Adviser’s advisory agreements, resulting in the automatic termination of such advisory agreements.
The shareholders of the Fund subsequently approved the Proposed Agreements at an annual meeting of shareholders called for the purpose of electing Directors and voting on the Proposed Agreements.
A discussion regarding the basis for the Boards’ approvals at the meeting held onJuly 31-August 2, 2018 is set forth below.
At a meeting of the AB Boards held on July31-August 2, 2018, the Adviser presented its recommendation that the Boards consider and approve the Proposed Agreements. Section 15(c) of the 1940 Act provides that, after an initial period, a Fund’s Current Agreement and currentsub-advisory agreement, as applicable, will remain in effect only if the Board, including a majority of the Independent Directors, annually reviews and approves them. Each of the Current Agreements had been approved by a Board within theone-year period prior to approval of its related Proposed Agreement, except that the Current Agreements for certain FlexFee funds were approved in February 2017. In connection with their approval of the Proposed Agreements, the Boards considered their conclusions in connection with their most recent approvals of the Current Agreements, in particular in cases where the last approval of a Current Agreement was relatively recent, including the Boards’ general satisfaction with the nature and quality of services being provided and, as applicable, in the case of certain Funds, actions taken or to be taken in an effort to improve investment performance
| | |
| |
| abfunds.com | | AB CONSERVATIVE WEALTH STRATEGY | 109 |
or reduce expense ratios. The Directors also reviewed updated information provided by the Adviser in respect of each Fund. Also in connection with their approval of the Proposed Agreements, the Boards considered a representation made to them at that time by the Adviser that there were no additional developments not already disclosed to the Boards since their most recent approvals of the Current Agreements that would be a material consideration to the Boards in connection with their consideration of the Proposed Agreements, except for matters disclosed to the Boards by the Adviser. The Directors considered the fact that each Proposed Agreement would have corresponding terms and conditions identical to those of the corresponding Current Agreement with the exception of the effective date and initial term under the Proposed Agreement.
The Directors considered their knowledge of the nature and quality of the services provided by the Adviser to each Fund gained from their experience as directors or trustees of registered investment companies advised by the Adviser, their overall confidence in the Adviser’s integrity and competence they have gained from that experience, the Adviser’s initiative in identifying and raising potential issues with the Directors and its responsiveness, frankness and attention to concerns raised by the Directors in the past, including the Adviser’s willingness to consider and implement organizational and operational changes designed to improve investment results and the services provided to the Funds. The Directors noted that they have four regular meetings each year, at each of which they review extensive materials and information from the Adviser, including information on the investment performance of each Fund.
The Directors also considered all factors they believed relevant, including the specific matters discussed below. During the course of their deliberations, the Directors evaluated, among other things, the reasonableness of the management fees of the Funds they oversee. The Directors did not identify any particular information that wasall-important or controlling, and different Directors may have attributed different weights to the various factors. The Directors determined that the selection of the Adviser to manage the Funds, and the overall arrangements between the Funds and the Adviser, as provided in the Proposed Agreements, including the management fees, were fair and reasonable in light of the services performed under the Current Agreements and to be performed under the Proposed Agreements, expenses incurred and to be incurred and such other matters as the Directors considered relevant in the exercise of their business judgment. The material factors and conclusions that formed the basis for the Directors’ determinations included the following:
Nature, Extent and Quality of Services Provided
The Directors considered the scope and quality of services to be provided by the Adviser under the Proposed Agreements, including the quality of the investment research capabilities of the Adviser and the other resources
| | |
| |
| 110 | AB CONSERVATIVE WEALTH STRATEGY | | abfunds.com |
it has dedicated to performing services for the Funds. They also considered the information that had been provided to them by the Adviser concerning the anticipated implementation of the Plan and the Adviser’s representation that it did not anticipate that such implementation would affect the management or structure of the Adviser, have a material adverse effect on the Adviser, or adversely affect the quality of the services provided to the Funds by the Adviser and its affiliates. The Directors noted that the Adviser from time to time reviews each Fund’s investment strategies and from time to time proposes changes intended to improve the Fund’s relative or absolute performance for the Directors’ consideration. They also noted the professional experience and qualifications of each Fund’s portfolio management team and other senior personnel of the Adviser. The Directors also considered that certain Proposed Agreements, similar to the corresponding Current Agreements, provide that the Funds will reimburse the Adviser for the cost to it of providing certain clerical, accounting, administrative and other services to the Funds by employees of the Adviser or its affiliates. Requests for these reimbursements are made on a quarterly basis and subject to approval by the Directors. The Directors noted that the Adviser did not request any reimbursements from certain Funds in the Fund’s latest fiscal year reviewed. The Directors noted that the methodology to be used to determine the reimbursement amounts had been reviewed by an independent consultant retained by the Funds’ former Senior Officer/Independent Compliance Officer. The quality of administrative and other services, including the Adviser’s role in coordinating the activities of the Funds’ other service providers, also was considered. The Directors of each Fund concluded that, overall, they were satisfied with the nature, extent and quality of services to be provided to the Funds under the Proposed Agreement for the Fund.
Costs of Services to be Provided and Profitability
The Directors reviewed a schedule of the revenues and expenses and related notes indicating the profitability of each Fund to the Adviser for calendar years 2016 and 2017, as applicable, that had been prepared with an expense allocation methodology arrived at in consultation with an independent consultant retained by the Funds’ former Senior Officer/Independent Compliance Officer. The Directors noted the assumptions and methods of allocation used by the Adviser in preparing fund-specific profitability data and understood that there are a number of potentially acceptable allocation methodologies for information of this type. The Directors noted that the profitability information reflected all revenues and expenses of the Adviser’s relationship with a Fund, including those relating to its subsidiaries that provide transfer agency, distribution and brokerage services to the Fund, as applicable. The Directors recognized that it is difficult to make comparisons of the profitability of the Proposed Agreements with the profitability of fund advisory contracts for unaffiliated funds because comparative information is not generally publicly available and is affected by numerous factors. The Directors focused on the profitability of
| | |
| |
| abfunds.com | | AB CONSERVATIVE WEALTH STRATEGY | 111 |
the Adviser’s relationship with each Fund before taxes and distribution expenses, as applicable. The Directors noted that certain Funds were not profitable to the Adviser in one or more periods reviewed. The Directors concluded that the Adviser’s level of profitability from its relationship with the other Funds was not unreasonable. The Directors were unable to consider historical information about the profitability of certain Funds that had recently commenced operations and for which historical profitability information was not available. The Adviser agreed to provide the Directors with profitability information in connection with future proposed continuances of the Proposed Agreements.
Fall-Out Benefits
The Directors considered the other benefits to the Adviser and its affiliates from their relationships with the Funds, including, but not limited to, as applicable, benefits relating to soft dollar arrangements (whereby investment advisers receive brokerage and research services from brokers that execute agency transactions for their clients) in the case of certain Funds;12b-1 fees and sales charges received by the principal underwriter (which is a wholly owned subsidiary of the Adviser) in respect of certain classes of the shares of most of the Funds; brokerage commissions paid by certain Funds to brokers affiliated with the Adviser; and transfer agency fees paid by most of the Funds to a wholly owned subsidiary of the Adviser. The Directors recognized that the Adviser’s profitability would be somewhat lower, and that a Fund’s unprofitability to the Adviser would be exacerbated, without these benefits. The Directors understood that the Adviser also might derive reputational and other benefits from its association with the Funds.
Investment Results
In addition to the information reviewed by the Directors in connection with the Board meeting at which the Proposed Agreements were approved, the Directors receive detailed performance information for the Funds at each regular Board meeting during the year.
The Boards’ consideration of each Proposed Agreement was informed by their most recent approval of the related Current Agreement, and, in the case of certain Funds, their discussion with the Adviser of the reasons for those Funds’ underperformance in certain periods. The Directors also reviewed updated performance information and, in some cases, discussed with the Adviser the reasons for changes in performance or continued underperformance. On the basis of this review, the Directors concluded that each Fund’s investment performance was acceptable.
Management Fees and Other Expenses
The Directors considered the management fee rate payable by each Fund to the Adviser and information prepared by an independent service provider (the ‘‘15(c) provider’’) concerning management fee rates payable by
| | |
| |
| 112 | AB CONSERVATIVE WEALTH STRATEGY | | abfunds.com |
other funds in the same category as the Fund. The Directors recognized that it is difficult to make comparisons of management fees because there are variations in the services that are included in the fees paid by other funds. The Directors compared each Fund’s contractual management fee rate with a peer group median, and where applicable, took into account the impact on the management fee rate of the administrative expense reimbursement paid to the Adviser in the latest fiscal year. In the case of the ACS Funds, the Directors noted that the management fee rate is zero but also were cognizant that the Adviser is indirectly compensated by the wrap fee program sponsors that use the ACS Funds as an investment vehicle for their clients.
The Directors also considered the Adviser’s fee schedule for other clients pursuing a similar investment style to each Fund. For this purpose, they reviewed the relevant advisory fee information from the Adviser’s Form ADV and in a report from the Funds’ Senior Analyst and noted the differences between a Fund’s fee schedule, on the one hand, and the Adviser’s institutional fee schedule and the schedule of fees charged by the Adviser to any offshore funds and for services to anysub-advised funds pursuing a similar investment strategy as the Fund, on the other, as applicable. The Directors noted that the Adviser may, in some cases, agree to fee rates with large institutional clients that are lower than those reviewed by the Directors and that they had previously discussed with the Adviser its policies in respect of such arrangements. The Adviser also informed the Directors that, in the case of certain Funds, there were no institutional products managed by the Adviser that have a substantially similar investment style. The Directors also discussed these matters with their independent fee consultant.
The Adviser reviewed with the Directors the significantly greater scope of the services it provides to each Fund relative to institutional, offshore fund andsub-advised fund clients, as applicable. In this regard, the Adviser noted, among other things, that, compared to institutional and offshore orsub-advisory accounts, each Fund, as applicable, (i) demands considerably more portfolio management, research and trading resources due to significantly higher daily cash flows (in the case ofopen-end Funds); (ii) has more tax and regulatory restrictions and compliance obligations; (iii) must prepare and file or distribute regulatory and other communications about fund operations; and (iv) must provide shareholder servicing to retail investors. The Adviser also reviewed the greater legal risks presented by the large and changing population of Fund shareholders who may assert claims against the Adviser in individual or class actions, and the greater entrepreneurial risk in offering new fund products, which require substantial investment to launch, may not succeed, and generally must be priced to compete with larger, more established funds resulting in lack of profitability to the Adviser until a new fund achieves scale. In light of the substantial differences in services rendered by the Adviser to institutional,
| | |
| |
| abfunds.com | | AB CONSERVATIVE WEALTH STRATEGY | 113 |
offshore fund andsub-advised fund clients as compared to the Funds, and the different risk profile, the Directors considered these fee comparisons inapt and did not place significant weight on them in their deliberations.
The Directors noted that many of the Funds may invest in shares of exchange-traded funds (‘‘ETFs’’), subject to the restrictions and limitations of the 1940 Act as these may be varied as a result of exemptive orders issued by the SEC. The Directors also noted that ETFs pay advisory fees pursuant to their advisory contracts. The Directors concluded, based on the Adviser’s explanation of how it uses ETFs when they are the most cost-effective way to obtain desired exposures, in some cases pending purchases of underlying securities, that each Fund’s management fee would be for services that would be in addition to, rather than duplicative of, the services provided under the advisory contracts of the ETFs.
With respect to each Fund’s management fee, the Directors considered the total expense ratio of the Fund in comparison to a peer group and peer universe selected by the 15(c) service provider. The Directors also considered the Adviser’s expense caps for certain Funds. The Directors view expense ratio information as relevant to their evaluation of the Adviser’s services because the Adviser is responsible for coordinating services provided to a Fund by others.
The Boards’ consideration of each Proposed Agreement was informed by their most recent approval of the related Current Agreement, and, in the case of certain Funds, their discussion with the Adviser of the reasons for those Funds’ expense ratios in certain periods. The Directors also reviewed updated expense ratio information and, in some cases, discussed with the Adviser the reasons for the expense ratios of certain Funds. On the basis of this review, the Directors concluded that each Fund’s expense ratio was acceptable.
The Directors did not consider comparative expense information for the ACS Funds because those Funds do not bear ordinary expenses.
Economies of Scale
The Directors noted that the management fee schedules for certain Funds do not contain breakpoints and that they had discussed their strong preference for breakpoints in advisory contracts with the Adviser. The Directors took into consideration prior presentations by an independent consultant on economies of scale in the mutual fund industry and for the Funds, and by the Adviser concerning certain of its views on economies of scale. The Directors also had requested and received from the Adviser certain updates on economies of scale in advance of the Board meeting. The Directors believe that economies of scale may be realized (if at all) by the Adviser across a variety of products and services, and not only in respect of a single fund. The Directors noted that there is no established methodology for setting breakpoints that give effect to the fund-specific
| | |
| |
| 114 | AB CONSERVATIVE WEALTH STRATEGY | | abfunds.com |
services provided by a fund’s adviser and to the economies of scale that an adviser may realize in its overall mutual fund business or those components of it which directly or indirectly affect a fund’s operations. The Directors observed that in the mutual fund industry as a whole, as well as among funds similar to each Fund, there is no uniformity or pattern in the fees and asset levels at which breakpoints (if any) apply. The Directors also noted that the advisory agreements for many funds do not have breakpoints at all. The Directors informed the Adviser that they would monitor the asset levels of the Funds without breakpoints and their profitability to the Adviser and anticipated revisiting the question of breakpoints in the future if circumstances warrant doing so.
The Directors did not consider the extent to which fee levels in the Advisory Agreement for the ACS Funds reflect economies of scale because that Advisory Agreement does not provide for any compensation to be paid to the Adviser by the ACS Funds and the expense ratio of each of those Funds is zero.
Interim Advisory Agreements
In approving the Interim Advisory Agreements, the Boards, with the assistance of independent counsel, considered similar factors to those considered in approving the Proposed Agreements. The Interim Advisory Agreements approved by the Boards are identical to the Proposed Agreements, as well as the Current Agreements, in all material respects except for their proposed effective and termination dates and provisions intended to comply with the requirements of the relevant SEC rule, such as provisions requiring escrow of advisory fees. Under the Interim Advisory Agreements, the Adviser would continue to manage a Fund pursuant to an Interim Advisory Agreement until a new advisory agreement was approved by stockholders or until the end of the150-day period, whichever would occur earlier. All fees earned by the Adviser under an Interim Advisory Agreement would be held in escrow pending shareholder approval of the Proposed Agreement. Upon approval of a new advisory agreement by stockholders, the escrowed management fees would be paid to the Adviser, and the Interim Advisory Agreement would terminate.
Information Regarding the Review and Approval of the Fund’s Current Advisory Agreement
The disinterested trustees (the “directors”) of The AB Portfolios (the “Company”) unanimously approved the continuance of the Company’s Advisory Agreement with the Adviser in respect of AB Conservative Wealth Strategy (the “Fund”) at a meeting held onJuly 31-August 2, 2018 (the “Meeting”).
Prior to approval of the continuance of the Advisory Agreement, the directors had requested from the Adviser, and received and evaluated, extensive materials. They reviewed the proposed continuance of the Advisory Agreement with the Adviser and with experienced counsel who are independent of
| | |
| |
| abfunds.com | | AB CONSERVATIVE WEALTH STRATEGY | 115 |
the Adviser, who advised on the relevant legal standards. The directors also reviewed additional materials, including materials from an outside consultant, who acted as their independent fee consultant, and comparative analytical data prepared by the Senior Analyst for the Fund. The directors also discussed the proposed continuance in private sessions with counsel.
The directors considered their knowledge of the nature and quality of the services provided by the Adviser to the Fund gained from their experience as directors or trustees of most of the registered investment companies advised by the Adviser, their overall confidence in the Adviser’s integrity and competence they have gained from that experience, the Adviser’s initiative in identifying and raising potential issues with the directors and its responsiveness, frankness and attention to concerns raised by the directors in the past, including the Adviser’s willingness to consider and implement organizational and operational changes designed to improve investment results and the services provided to the AB Funds. The directors noted that they have four regular meetings each year, at each of which they review extensive materials and information from the Adviser, including information on the investment performance of the Fund.
The directors also considered all factors they believed relevant, including the specific matters discussed below. During the course of their deliberations, the directors evaluated, among other things, the reasonableness of the advisory fee. The directors did not identify any particular information that wasall-important or controlling, and different directors may have attributed different weights to the various factors. The directors determined that the selection of the Adviser to manage the Fund and the overall arrangements between the Fund and the Adviser, as provided in the Advisory Agreement, including the advisory fee, were fair and reasonable in light of the services performed, expenses incurred and such other matters as the directors considered relevant in the exercise of their business judgment. The material factors and conclusions that formed the basis for the directors’ determinations included the following:
Nature, Extent and Quality of Services Provided
The directors considered the scope and quality of services provided by the Adviser under the Advisory Agreement, including the quality of the investment research capabilities of the Adviser and the other resources it has dedicated to performing services for the Fund. The directors noted that the Adviser from time to time reviews the Fund’s investment strategies and from time to time proposes changes intended to improve the Fund’s relative or absolute performance for the directors’ consideration. They also noted the professional experience and qualifications of the Fund’s portfolio management team and other senior personnel of the Adviser. The quality of administrative and other services, including the Adviser’s role in coordinating the activities of the Fund’s other service providers, also was considered. The directors concluded that, overall, they were satisfied with the nature, extent and quality of services provided to the Fund under the Advisory Agreement.
| | |
| |
| 116 | AB CONSERVATIVE WEALTH STRATEGY | | abfunds.com |
Costs of Services Provided and Profitability
The directors reviewed a schedule of the revenues and expenses and related notes indicating the profitability of the Fund to the Adviser for calendar years 2016 and 2017 that had been prepared with an expense allocation methodology arrived at in consultation with an independent consultant retained by the Fund’s former Senior Officer/Independent Compliance Officer. The directors noted the assumptions and methods of allocation used by the Adviser in preparing fund-specific profitability data and understood that there are a number of potentially acceptable allocation methodologies for information of this type. The directors noted that the profitability information reflected all revenues and expenses of the Adviser’s relationship with the Fund, including those relating to its subsidiaries that provide transfer agency, distribution and brokerage services to the Fund. The directors recognized that it is difficult to make comparisons of the profitability of the Advisory Agreement with the profitability of fund advisory contracts for unaffiliated funds because comparative information is not generally publicly available and is affected by numerous factors. The directors focused on the profitability of the Adviser’s relationship with the Fund before taxes and distribution expenses. The directors concluded that the Adviser’s level of profitability from its relationship with the Fund was not unreasonable.
Fall-Out Benefits
The directors considered the other benefits to the Adviser and its affiliates from their relationships with the Fund and the underlying funds advised by the Adviser in which the Fund invests, including, but not limited to, benefits relating to soft dollar arrangements (whereby investment advisers receive brokerage and research services from brokers that execute agency transactions for their clients);12b-1 fees and sales charges received by the Fund’s principal underwriter (which is a wholly owned subsidiary of the Adviser) in respect of certain classes of the Fund’s shares; brokerage commissions paid by the Fund to brokers affiliated with the Adviser; and transfer agency fees paid by the Fund to a wholly owned subsidiary of the Adviser. The directors recognized that the Adviser’s profitability would be somewhat lower without these benefits. The directors understood that the Adviser also might derive reputational and other benefits from its association with the Fund.
Investment Results
In addition to the information reviewed by the directors in connection with the Meeting at which continuance of the Advisory Agreement was approved, the directors receive detailed performance information for the Fund at each regular Board meeting during the year.
At the Meeting, the directors reviewed performance information prepared by an independent service provider (the “15(c) service provider”), showing the performance of the Class A Shares of the Fund against a group of similar funds (“peer group”) and a larger group of similar funds (“peer universe”), each selected by the 15(c) service provider, and information
| | |
| |
| abfunds.com | | AB CONSERVATIVE WEALTH STRATEGY | 117 |
prepared by the Adviser showing performance of the Class A Shares against a broad-based securities market index, in each case for the1-,3-,5- and10-year periods ended May 31, 2018 and (in the case of comparisons with the broad-based securities market index) for the period from inception. Based on their review, the directors concluded that the Fund’s investment performance was acceptable.
Advisory Fees and Other Expenses
The directors considered the advisory fee rate payable by the Fund to the Adviser and information prepared by the 15(c) service provider concerning advisory fee rates payable by other funds in the same category as the Fund. The directors recognized that it is difficult to make comparisons of advisory fees because there are variations in the services that are included in the fees paid by other funds. The directors compared the Fund’s contractual effective advisory fee rate with a peer group median.
The Adviser informed the directors that there were no institutional products managed by it that have a substantially similar investment style.
The directors noted that the Fund invests in shares of exchange-traded funds (“ETFs”), subject to the restrictions and limitations of the Investment Company Act of 1940 as these may be varied as a result of exemptive orders issued by the SEC. The directors also noted that ETFs pay advisory fees pursuant to their advisory contracts, and that the Adviser had provided, and they had reviewed, information about the expense ratios of the relevant ETFs. The directors concluded, based on the Adviser’s explanation of how it uses ETFs when they are the most cost-effective way to obtain desired exposures, in some cases pending purchases of underlying securities, that the advisory fee for the Fund is for services that are in addition to, rather than duplicative of, the services provided under the advisory contracts of the ETFs.
The directors also considered the total expense ratio of the Class A shares of the Fund in comparison to a peer group and a peer universe selected by the 15(c) service provider. The Class A expense ratio of the Fund was based on the Fund’s latest fiscal year. The directors noted that it was likely that the expense ratios of some of the other funds in the Fund’s category were lowered by waivers or reimbursements by those funds’ investment advisers, which in some cases might be voluntary or temporary. The directors view expense ratio information as relevant to their evaluation of the Adviser’s services because the Adviser is responsible for coordinating services provided to the Fund by others. The directors noted that the Fund’s expense ratio was above the medians. After reviewing and discussing the Adviser’s explanations of the reasons for this, the directors concluded that the Fund’s expense ratio was acceptable.
| | |
| |
| 118 | AB CONSERVATIVE WEALTH STRATEGY | | abfunds.com |
Economies of Scale
The directors noted that the advisory fee schedules for the Fund contains breakpoints that reduce the fee rates on assets above specified levels. The directors took into consideration prior presentations by an independent consultant on economies of scale in the mutual fund industry and for the AB Funds, and by the Adviser concerning certain of its views on economies of scale. The directors also had requested and received from the Adviser certain updates on economies of scale in advance of the Meeting. The directors believe that economies of scale may be realized (if at all) by the Adviser across a variety of products and services, and not only in respect of a single fund. The directors noted that there is no established methodology for setting breakpoints that give effect to the fund-specific services provided by a fund’s adviser and to the economies of scale that an adviser may realize in its overall mutual fund business or those components of it which directly or indirectly affect a fund’s operations. The directors observed that in the mutual fund industry as a whole, as well as among funds similar to the Fund, there is no uniformity or pattern in the fees and asset levels at which breakpoints (if any) apply. The directors also noted that the advisory agreements for many funds do not have breakpoints at all. Having taken these factors into account, the directors concluded that the Fund’s shareholders would benefit from a sharing of economies of scale in the event the Fund’s net assets exceed a breakpoint in the future.
| | |
| |
| abfunds.com | | AB CONSERVATIVE WEALTH STRATEGY | 119 |
This page is not part of the Shareholder Report or the Financial Statements.
AB FAMILY OF FUNDS
US EQUITY
US CORE
Core Opportunities Fund
FlexFee™ US Thematic Portfolio
Select US Equity Portfolio
US GROWTH
Concentrated Growth Fund
Discovery Growth Fund
FlexFee™ Large Cap Growth Portfolio
Growth Fund
Large Cap Growth Fund
Small Cap Growth Portfolio
US VALUE
Discovery Value Fund
Equity Income Fund
Relative Value Fund
Small Cap Value Portfolio
Value Fund
INTERNATIONAL/ GLOBAL EQUITY
INTERNATIONAL/ GLOBAL CORE
FlexFee™ International Strategic Core Portfolio
Global Core Equity Portfolio
International Portfolio
International Strategic Core Portfolio
Sustainable Global Thematic Fund
Tax-Managed International Portfolio
Tax-Managed Wealth Appreciation Strategy
Wealth Appreciation Strategy
INTERNATIONAL/ GLOBAL GROWTH
Concentrated International Growth Portfolio
FlexFee™ Emerging Markets Growth Portfolio
INTERNATIONAL/ GLOBAL EQUITY(continued)
Sustainable International Thematic Fund
INTERNATIONAL/ GLOBAL VALUE
All China Equity Portfolio
International Value Fund
FIXED INCOME
MUNICIPAL
High Income Municipal Portfolio
Intermediate California Municipal Portfolio
Intermediate Diversified Municipal Portfolio
Intermediate New York Municipal Portfolio
Municipal Bond Inflation Strategy
Tax-Aware Fixed Income Portfolio
National Portfolio
Arizona Portfolio
California Portfolio
Massachusetts Portfolio
Minnesota Portfolio
New Jersey Portfolio
New York Portfolio
Ohio Portfolio
Pennsylvania Portfolio
Virginia Portfolio
TAXABLE
Bond Inflation Strategy
FlexFee™ High Yield Portfolio
FlexFee™ International Bond Portfolio
Global Bond Fund
High Income Fund
Income Fund
Intermediate Bond Portfolio
Limited Duration High Income Portfolio
Short Duration Portfolio
ALTERNATIVES
All Market Real Return Portfolio
Global Real Estate Investment Fund
Select US Long/Short Portfolio
Unconstrained Bond Fund
MULTI-ASSET
All Market Income Portfolio
All Market Total Return Portfolio
Conservative Wealth Strategy
Emerging Markets Multi-Asset Portfolio
Global Risk Allocation Fund
Tax-Managed All Market Income Portfolio
TARGET-DATE
Multi-Manager Select Retirement Allocation Fund
Multi-Manager Select 2010 Fund
Multi-Manager Select 2015 Fund
Multi-Manager Select 2020 Fund
Multi-Manager Select 2025 Fund
Multi-Manager Select 2030 Fund
Multi-Manager Select 2035 Fund
Multi-Manager Select 2040 Fund
Multi-Manager Select 2045 Fund
Multi-Manager Select 2050 Fund
Multi-Manager Select 2055 Fund
Multi-Manager Select 2060 Fund
CLOSED-END FUNDS
Alliance California Municipal Income Fund
AllianceBernstein Global High Income Fund
AllianceBernstein National Municipal Income Fund
We also offer Government Money Market Portfolio, which serves as the money market fund exchange vehicle for the AB mutual funds. You could lose money by investing in the Fund. Although the Fund seeks to preserve the value of your investment at $1.00 per share, it cannot guarantee it will do so. The Fund may impose a fee upon sale of your shares or may temporarily suspend your ability to sell shares if the Fund’s liquidity falls below required minimums because of market conditions or other factors. An investment in the Fund is not insured or guaranteed by the Federal Deposit Insurance Corporation or any other government agency. The Fund’s sponsor has no legal obligation to provide financial support to the Fund, and you should not expect that the sponsor will provide financial support to the Fund at any time.
Investors should consider the investment objectives, risks, charges and expenses of the Fund carefully before investing. For copies of our prospectus or summary prospectus, which contain this and other information, visit us online at www.abfunds.com or contact your AB representative. Please read the prospectus and/or summary prospectus carefully before investing.
| | |
| |
| 120 | AB CONSERVATIVE WEALTH STRATEGY | | abfunds.com |
NOTES
| | |
| |
| abfunds.com | | AB CONSERVATIVE WEALTH STRATEGY | 121 |
NOTES
| | |
| |
| 122 | AB CONSERVATIVE WEALTH STRATEGY | | abfunds.com |
NOTES
| | |
| |
| abfunds.com | | AB CONSERVATIVE WEALTH STRATEGY | 123 |
NOTES
| | |
| |
| 124 | AB CONSERVATIVE WEALTH STRATEGY | | abfunds.com |
AB CONSERVATIVE WEALTH STRATEGY
1345 Avenue of the Americas
New York, NY 10105
800 221 5672
CW-0152-0219 
FEB 02.28.19

SEMI-ANNUAL REPORT
ABTAX-MANAGED ALL MARKET INCOME PORTFOLIO

Beginning January 1, 2021, as permitted by new regulations adopted by the Securities and Exchange Commission, the Fund’s annual and semi-annual shareholder reports will no longer be sent by mail, unless you specifically request paper copies of the reports. Instead, the reports will be made available on a website, and you will be notified by mail each time a report is posted and provided with a website address to access the report.
If you already elected to receive shareholder reports electronically, you will not be affected by this change and you need not take any action. You may elect to receive shareholder reports and other communications from the Fund electronically at any time by contacting your financial intermediary (such as a broker-dealer or bank) or, if you are a direct investor, by calling the Fund at (800) 221 5672.
You may elect to receive all future reports in paper form free of charge. If you invest through a financial intermediary, you can contact your financial intermediary to request that you continue to receive paper copies of your shareholder reports; if you invest directly with the Fund, you can call the Fund at (800) 221 5672. Your election to receive reports in paper form will apply to all funds held in your account with your financial intermediary or, if you invest directly, to all AB Mutual Funds you hold.
| | |
| |
| Investment Products Offered | | • Are Not FDIC Insured• May Lose Value• Are Not Bank Guaranteed |
Investors should consider the investment objectives, risks, charges and expenses of the Fund carefully before investing. For copies of our prospectus or summary prospectus, which contain this and other information, visit us online at www.abfunds.com or contact your AB representative. Please read the prospectus and/or summary prospectus carefully before investing.
This shareholder report must be preceded or accompanied by the Fund’s prospectus for individuals who are not current shareholders of the Fund.
You may obtain a description of the Fund’s proxy voting policies and procedures, and information regarding how the Fund voted proxies relating to portfolio securities during the most recent12-month period ended June 30, without charge. Simply visit AB’s website at www.abfunds.com, or go to the Securities and Exchange Commission’s (the “Commission”) website at www.sec.gov, or call AB at (800) 227 4618.
The Fund files its complete schedule of portfolio holdings with the Commission for the first and third quarters of each fiscal year as an exhibit to its reports on Form N-PORT. The Fund’s Form N-PORT reports are available on the Commission’s website at www.sec.gov. The Fund’s Forms N-PORT may also be reviewed and copied at the Commission’s Public Reference Room in Washington, DC; information on the operation of the Public Reference Room may be obtained by calling (800) SEC 0330. AB publishes full portfolio holdings for the Fund monthly at www.abfunds.com.
AllianceBernstein Investments, Inc. (ABI) is the distributor of the AB family of mutual funds. ABI is a member of FINRA and is an affiliate of AllianceBernstein L.P., the Adviser of the funds.
The [A/B] logo is a registered service mark of AllianceBernstein and AllianceBernstein® is a registered service mark used by permission of the owner, AllianceBernstein L.P.
| | |
| FROM THE PRESIDENT | |  |
Dear Shareholder,
We are pleased to provide this report for AB Tax-Managed All Market Income Portfolio (the “Fund”). Please review the discussion of Fund performance, the market conditions during the reporting period and the Fund’s investment strategy.
As always, AB strives to keep clients ahead of what’s next by:
| + | | Transforming uncommon insights into uncommon knowledge with a global research scope |
| + | | Navigating markets with seasoned investment experience and sophisticated solutions |
| + | | Providing thoughtful investment insights and actionable ideas |
Whether you’re an individual investor or a multi-billion-dollar institution, we put knowledge and experience to work for you.
AB’s global research organization connects and collaborates across platforms and teams to deliver impactful insights and innovative products. Better insights lead to better opportunities—anywhere in the world.
For additional information about AB’s range of products and shareholder resources, please log on to www.abfunds.com.
Thank you for your investment in the AB Mutual Funds.
Sincerely,

Robert M. Keith
President and Chief Executive Officer, AB Mutual Funds
| | |
| |
| abfunds.com | | AB TAX-MANAGED ALL MARKET INCOME PORTFOLIO | 1 |
SEMI-ANNUAL REPORT
April 05, 2019
This report provides management’s discussion of fund performance for ABTax-Managed All Market Income Portfolio for the semi-annual reporting period ended February 28, 2019.
The Fund’s investment objective is to seek current income with consideration of capital appreciation.
NAV RETURNS AS OF FEBRUARY 28, 2019(unaudited)
| | | | | | | | |
| | |
| | | 6 Months | | | 12 Months | |
| | |
| ABTAX-MANAGED ALL MARKET INCOME PORTFOLIO | | | | | | | | |
| | |
| Class A Shares | | | 0.00% | | | | 3.21% | |
| | |
| Class B Shares1 | | | -0.41% | | | | 2.46% | |
| | |
| Class C Shares | | | -0.39% | | | | 2.50% | |
| | |
| Advisor Class Shares2 | | | 0.13% | | | | 3.55% | |
| | |
Primary Benchmark:
Bloomberg Barclays5-Year GO Municipal Bond Index | | | 2.48% | | | | 3.73% | |
| | |
| MSCI ACWI (net) | | | -2.92% | | | | -0.84% | |
| 1 | Effective January 31, 2009, Class B shares are no longer available for purchase to new investors. Please see Note A for additional information. |
| 2 | Please note that this share class is for investors purchasing shares through accounts established under certainfee-based programs sponsored and maintained by certain broker-dealers and financial intermediaries, institutional pension plans and/or investment advisory clients of, and certain other persons associated with, the Adviser and its affiliates or the Fund. |
INVESTMENT RESULTS
The table above shows the Fund’s performance compared to its primary benchmark, the Bloomberg Barclays5-Year General Obligation (“GO”) Municipal Bond Index, and the Morgan Stanley Capital International All Country World Index (“MSCI ACWI”) (net) for thesix- and12-month periods ended February 28, 2019.
All share classes of the Fund underperformed the primary benchmark and outperformed the MSCI ACWI (net) for both periods, before sales charges. During both periods, security selection and overall asset allocation within equities and fixed-income holdings detracted from absolute performance. Fixed-income assets and active currency management contributed, as did exposure to high-income municipals and high-quality municipals. For the six-month period, equity assets detracted from absolute performance, though exposure to income equities contributed. During the12-month period, security selection within global high yield detracted, while equity assets contributed.
| | |
| |
| 2 | AB TAX-MANAGED ALL MARKET INCOME PORTFOLIO | | abfunds.com |
The Fund utilized derivatives for hedging and investment purposes in the form of currency forwards, credit default swaps, interest rate swaps and total return swaps, which contributed to absolute performance for both periods, while futures, written options and inflation swaps detracted.
MARKET REVIEW AND INVESTMENT STRATEGY
During thesix-month period ended February 28, 2019, US andnon-US equities declined, although emerging-market equities posted modest gains. In the US, growth-style stocks outperformed value-style stocks, and small-cap stocks outperformed theirlarge-cap peers. Global trade tensions and rising interest rates weighed on stock market performance. In Europe, Brexit uncertainty, Italian budget issues and German economic woes persisted. Slowing global growth was an increasing concern more broadly. Global equities plummeted at the end of 2018 amid increased volatility, but recouped some losses in January and February, as corporate earnings were above analyst estimates and many central banks shared more dovish monetary policy outlooks.
Fixed-income markets had generally positive returns. Global high yield, developed-market treasuries and investment-grade securities rallied. Emerging-market debt sectors rallied, amid positive idiosyncratic developments and a more favorable macro backdrop, particularly a more patient US Federal Reserve (the “Fed”). Developed-market treasury yield curves moved in different directions (bond yields move inversely to price). The Fed increased interest rates quarterly in 2018 and began to formally reduce its balance sheet before surprising markets with a more dovish tone at the beginning of 2019. Although the European Central Bank formally ended its bond-buying program, the bank also turned more dovish in 2019, putting credit-easing measures back on the table. Meanwhile, the People’s Bank of China started the new year by cutting its reserve requirement ratio.
The Fund’s Senior Investment Management Team (the “Team”) seeks current income with consideration of capital appreciation. The Team’s global multi-asset strategy focuses on generating high, stable income for taxable investors. The Team utilizes a rigorous quantitative research toolset with fundamental expertise across all regions and markets.
The municipal components may purchase municipal securities that are insured under policies issued by certain insurance companies. Historically, insured municipal securities typically received a higher credit rating, which meant that the issuer of the securities paid a lower interest rate. As a result of declines in the credit quality and associated downgrades of most bond insurers, insurance has less value than it did in the past. The market now values insured municipal securities primarily based on the credit quality of the issuer of the security with little value given to the insurance feature. In purchasing such insured securities, the Adviser evaluates the risk and
| | |
| |
| abfunds.com | | AB TAX-MANAGED ALL MARKET INCOME PORTFOLIO | 3 |
return of municipal securities through its own research. If an insurance company’s rating is downgraded or the company becomes insolvent, the prices of municipal securities insured by the insurance company may decline. As of February 28, 2019, the Fund’s percentages of total investments in insured bonds and in insured bonds that have beenpre-refunded or escrowed to maturity were 5.23% and 0.00%, respectively.
INVESTMENT POLICIES
The Adviser allocates the Fund’s investments primarily among a broad range of income-producing securities, including common stock of companies that regularly pay dividends (including real estate investment trusts or “REITs”), preferred stocks, fixed-income securities (including those with lower credit ratings) and derivatives related to these types of securities. The Fund pursues a global strategy, typically investing in securities of issuers located in the United States and in other countries throughout the world, including emerging-market countries.
In selecting equity securities for the Fund, the Adviser will focus on securities that have high dividend yields and that it believes are undervalued by the market relative to their long-term earnings potential. In order to provide diversification and the opportunity for increased return, the Adviser will also acquire equity securities for the Fund that are expected to exhibit relatively little correlation with the returns of the Fund’s holdings in high dividend yield equity securities.
The Fund intends to meet the tax requirement for passing municipal bond interest through to Fund shareholders astax-exempt interest dividends, which currently requires that at least 50% of the Fund’s assets be invested intax-exempt debt securities. In the event that the Internal Revenue Code or the related rules, regulations and interpretations of the Internal Revenue Service should in the future change so as to permit the Fund to pass throughtax-exempt dividends when the Fund invests a lesser amount of its assets intax-exempt debt securities, the Fund’s allocations to equity securities may increase. In selectingtax-exempt securities for the Fund’s debt investments, the Adviser may draw on the capabilities of separate investment teams that specialize in different areas that are generally defined by the maturity of the debt securities and/or their ratings. These fixed-income teams draw on the resources and expertise of the Adviser’s fixed-income research staff, which includes fixed-income research analysts and economists.
In addition, the Fund may engage in certain alternative income strategies that generally utilize derivatives to diversify sources of income
(continued on next page)
| | |
| |
| 4 | AB TAX-MANAGED ALL MARKET INCOME PORTFOLIO | | abfunds.com |
and manage risk. For example, the Fund may take long positions in currency derivatives on higher yielding currencies and/or short positions in currency derivatives on lower yielding currencies.
The Adviser will adjust the Fund’s investment exposure utilizing the Adviser’s Dynamic Asset Allocation (“DAA”) approach. DAA comprises a series of analytical and forecasting tools employed by the Adviser to gauge fluctuations in the risk/return profile of various asset classes. DAA seeks to adjust the Fund’s investment exposure in changing market conditions and thereby reduce overall portfolio volatility by mitigating the effects of market fluctuations, while preserving consistent long-term return potential. For example, the Adviser may seek to reduce the Fund’s risk exposure to one or more assets classes when DAA suggests that market risks relevant to those asset classes are rising but return opportunities are declining. In addition to merely increasing or decreasing asset class exposure by buying or selling securities of that asset class, the Adviser may pursue DAA implementation for the Fund by investing in derivatives or exchange-traded funds.
The Adviser intends to utilize a variety of derivatives in its management of the Fund. The Adviser may use derivatives to gain exposure to an asset class, such as using interest rate derivatives to gain exposure to certain bonds. As noted above, the Adviser may separately pursue certain alternative investment strategies that utilize derivatives, and may enter into derivatives in making the adjustments called for by DAA. As a result of the use of derivatives, the Fund will frequently be leveraged in the sense that its gross investment exposure substantially exceeds its net assets.
Currency exchange rate fluctuation can have a dramatic impact on returns. The Fund’s foreign currency exposures will come from investment in securities priced or denominated in foreign currencies and from direct holdings in foreign currencies and currency-related derivatives. The Adviser may seek to hedge all or a portion of the currency exposure resulting from Fund investments or decide not to hedge this exposure.
| | |
| |
| abfunds.com | | AB TAX-MANAGED ALL MARKET INCOME PORTFOLIO | 5 |
DISCLOSURES AND RISKS
Benchmark Disclosure
All indices are unmanaged and do not reflect fees and expenses associated with the active management of a mutual fund portfolio. The Bloomberg Barclays5-Year GO Municipal Bond Index represents the performance of long-term, investment-gradetax-exempt bonds with maturities ranging from four to six years. The MSCI ACWI (net, free float-adjusted, market capitalization weighted) represents the equity market performance of developed and emerging markets. MSCI makes no express or implied warranties or representations, and shall have no liability whatsoever with respect to any MSCI data contained herein. The MSCI data may not be further redistributed or used as a basis for other indices, any securities or financial products. This report is not approved, reviewed or produced by MSCI. Net returns include the reinvestment of dividends after deduction ofnon-US withholding tax. An investor cannot invest directly in an index or average, and their results are not indicative of the performance for any specific investment, including the Fund.
A Word About Risk
Market Risk: The value of the Fund’s assets will fluctuate as the stock or bond market fluctuates. The value of its investments may decline, sometimes rapidly and unpredictably, simply because of economic changes or other events that affect large portions of the market.
Allocation Risk: The allocation of investments among different investment styles, such as equity or debt, growth or value, US ornon-US securities, or diversification strategies, may have a more significant effect on the Fund’s net asset value (“NAV”) when one of these investments is performing more poorly than another.
Credit Risk: An issuer or guarantor of a fixed-income security, or the counterparty to a derivatives or other contract, may be unable or unwilling to make timely payments of interest or principal, or to otherwise honor its obligations. The issuer or guarantor may default, causing a loss of the full principal amount of a security and accrued interest. The degree of risk for a particular security may be reflected in its credit rating. There is the possibility that the credit rating of a fixed-income security may be downgraded after purchase, which may adversely affect the value of the security. Investments in fixed-income securities with lower ratings (commonly known as “junk bonds”) are subject to a higher probability that an issuer will default or fail to meet its payment obligations.
High-Yield Debt Securities Risk: Investments in fixed-income securities with lower ratings (commonly known as “junk bonds”) tend to have a higher probability that an issuer will default or fail to meet its payment obligations. These securities may be subject to greater price volatility due to
| | |
| |
| 6 | AB TAX-MANAGED ALL MARKET INCOME PORTFOLIO | | abfunds.com |
DISCLOSURES AND RISKS(continued)
such factors as specific corporate developments, interest-rate sensitivity, negative perceptions of the junk bond market generally and less secondary market liquidity.
Interest-Rate Risk: Changes in interest rates will affect the value of the Fund’s investments in fixed-income securities. When interest rates rise, the value of existing investments in fixed-income securities tends to fall and this decrease in value may not be offset by higher income from new investments. Interest-rate risk is generally greater for fixed-income securities with longer maturities or durations.
Inflation Risk: This is the risk that the value of assets or income from investments will be less in the future as inflation decreases the value of money. As inflation increases, the value of the Fund’s assets can decline as can the value of the Fund’s distributions. This risk is significantly greater for fixed-income securities with longer maturities.
Municipal Market Risk: This is the risk that special factors may adversely affect the value of municipal securities and have a significant effect on the yield or value of the Fund’s investments in municipal securities. These factors include economic conditions, political or legislative changes, uncertainties related to the tax status of municipal securities, or the rights of investors in these securities. To the extent that the Fund invests more of its assets in a particular state’s municipal securities, the Fund may be vulnerable to events adversely affecting that state, including economic, political and regulatory occurrences, court decisions, terrorism and catastrophic natural disasters, such as hurricanes or earthquakes. The Fund’s investments in certain municipal securities with principal and interest payments that are made from the revenues of a specific project or facility, and not general tax revenues, may have increased risks. Factors affecting the project or facility, such as local business or economic conditions, could have a significant effect on the project’s ability to make payments of principal and interest on these securities.
Real Estate Risk: The Fund’s investments in the real estate market have many of the same risks as direct ownership of real estate, including the risk that the value of real estate could decline due to a variety of factors that affect the real estate market generally. Investments in REITs may have additional risks. REITs are dependent on the capability of their managers, may have limited diversification and could be significantly affected by changes in tax laws.
Foreign(Non-US) Risk: Investments in securities ofnon-US issuers may involve more risk than those of US issuers. These securities may fluctuate more widely in price and may be less liquid due to adverse market, economic, political, regulatory or other factors.
| | |
| |
| abfunds.com | | AB TAX-MANAGED ALL MARKET INCOME PORTFOLIO | 7 |
DISCLOSURES AND RISKS(continued)
Currency Risk: Fluctuations in currency exchange rates may negatively affect the value of the Fund’s investments or reduce its returns.
Emerging-Market Risk: Investments in emerging-market countries may have more risk because the markets are less developed and less liquid as well as being subject to increased economic, political, regulatory or other uncertainties.
Derivatives Risk: Derivatives may be illiquid, difficult to price, and leveraged so that small changes may produce disproportionate losses for the Fund, and may be subject to counterparty risk to a greater degree than more traditional investments.
Leverage Risk: To the extent the Fund uses leveraging techniques, its NAV may be more volatile because leverage tends to exaggerate the effect of changes in interest rates and any increase or decrease in the value of the Fund’s investments.
Liquidity Risk: Liquidity risk occurs when certain investments become difficult to purchase or sell. Difficulty in selling less liquid securities may result in sales at disadvantageous prices affecting the value of your investment in the Fund. Causes of liquidity risk may include low trading volumes and large positions. Foreign fixed-income securities may have more liquidity risk because secondary trading markets for these securities may be smaller and less well developed and the securities may trade less frequently. Liquidity risk may be higher in a rising interest-rate environment, when the value and liquidity of fixed-income securities generally go down.
Management Risk: The Fund is subject to management risk because it is an actively managed investment fund. The Adviser will apply its investment techniques and risk analyses in making investment decisions for the Fund, but there is no guarantee that its techniques will produce the intended results.
These risks are fully discussed in the Fund’s prospectus. As with all investments, you may lose money by investing in the Fund.
An Important Note About Historical Performance
The investment return and principal value of an investment in the Fund will fluctuate as the prices of the individual securities in which it invests fluctuate, so that your shares, when redeemed, may be worth more or less than their original cost. Performance shown in this report represents past performance and does not guarantee future results. Current performance may be lower or higher than the performance information shown. You may obtain performance information current to the most recentmonth-end by visiting
| | |
| |
| 8 | AB TAX-MANAGED ALL MARKET INCOME PORTFOLIO | | abfunds.com |
DISCLOSURES AND RISKS(continued)
www.abfunds.com. The performance shown for periods prior to April 17, 2017 is based on the Fund’s prior principal strategies and may not be representative of the Fund’s performance under its current principal strategies.
All fees and expenses related to the operation of the Fund have been deducted. NAV returns do not reflect sales charges; if sales charges were reflected, the Fund’s quoted performance would be lower. SEC returns reflect the applicable sales charges for each share class: a 4.25% maximumfront-end sales charge for Class A shares; the applicable contingent deferred sales charge for Class B shares (4% year 1, 3% year 2, 2% year 3, 1% year 4) and a 1%1-year contingent deferred sales charge for Class C shares. Returns for the different share classes will vary due to different expenses associated with each class. Performance assumes reinvestment of distributions and does not account for taxes.
| | |
| |
| abfunds.com | | AB TAX-MANAGED ALL MARKET INCOME PORTFOLIO | 9 |
HISTORICAL PERFORMANCE
AVERAGE ANNUAL RETURNS AS OF FEBRUARY 28, 2019(unaudited)
| | | | | | | | |
| | |
| | | NAV Returns | | | SEC Returns
(reflects applicable
sales charges) | |
| | |
| CLASS A SHARES | | | | | | | | |
| | |
| 1 Year | | | 3.21% | | | | -1.15% | |
| | |
| 5 Years | | | 3.09% | | | | 2.20% | |
| | |
| 10 Years | | | 6.60% | | | | 6.14% | |
| | |
| CLASS B SHARES | | | | | | | | |
| | |
| 1 Year | | | 2.46% | | | | -1.42% | |
| | |
| 5 Years | | | 2.30% | | | | 2.30% | |
| | |
| 10 Years1 | | | 5.98% | | | | 5.98% | |
| | |
| CLASS C SHARES | | | | | | | | |
| | |
| 1 Year | | | 2.50% | | | | 1.53% | |
| | |
| 5 Years | | | 2.32% | | | | 2.32% | |
| | |
| 10 Years | | | 5.83% | | | | 5.83% | |
| | |
| ADVISOR CLASS SHARES2 | | | | | | | | |
| | |
| 1 Year | | | 3.55% | | | | 3.55% | |
| | |
| 5 Years | | | 3.36% | | | | 3.36% | |
| | |
| 10 Years | | | 6.90% | | | | 6.90% | |
The Fund’s current prospectus fee table shows the Fund’s total annual operating expense ratios as 1.35%, 2.13%, 2.09% and 1.10% for Class A, Class B, Class C and Advisor Class shares, respectively, gross of any fee waivers or expense reimbursements. Contractual fee waivers and/or expense reimbursement agreements reduced the Fund’s annual operating expense ratios exclusive of acquired fund fees and expenses, interest expense, taxes, extraordinary expenses, and brokerage commissions and other transaction costs to 0.99%, 1.74%, 1.74% and 0.74% for Class A, Class B, Class C and Advisor Class shares, respectively. These waivers/reimbursement agreements may not be terminated before December 31, 2019. Absent reimbursements or waivers, performance would have been lower. The Financial Highlights section of this report sets forth expense ratio data for the current reporting period; the expense ratios shown above may differ from the expense ratios in the Financial Highlights section since they are based on different time periods.
| 1 | Assumes conversion of Class B shares into Class A shares after eight years. |
| 2 | This share class is offered at NAV to eligible investors and the SEC returns are the same as the NAV returns. Please note that this share class is for investors purchasing shares through accounts established under certainfee-based programs sponsored and maintained by certain broker-dealers and financial intermediaries, institutional pension plans and/or investment advisory clients of, and certain other persons associated with, the Adviser and its affiliates or the Fund. |
| | |
| |
| 10 | AB TAX-MANAGED ALL MARKET INCOME PORTFOLIO | | abfunds.com |
HISTORICAL PERFORMANCE(continued)
SEC AVERAGE ANNUAL RETURNS
AS OF THE MOST RECENT CALENDARQUARTER-END
MARCH 31, 2019(unaudited)
| | | | |
| |
| | | SEC Returns
(reflects applicable
sales charges) | |
| |
| CLASS A SHARES | | | | |
| |
| 1 Year | | | 1.51% | |
| |
| 5 Years | | | 2.59% | |
| |
| 10 Years | | | 5.94% | |
| |
| CLASS B SHARES | | | | |
| |
| 1 Year | | | 1.21% | |
| |
| 5 Years | | | 2.72% | |
| |
| 10 Years1 | | | 5.77% | |
| |
| CLASS C SHARES | | | | |
| |
| 1 Year | | | 4.26% | |
| |
| 5 Years | | | 2.74% | |
| |
| 10 Years | | | 5.63% | |
| |
| ADVISOR CLASS SHARES2 | | | | |
| |
| 1 Year | | | 6.29% | |
| |
| 5 Years | | | 3.76% | |
| |
| 10 Years | | | 6.70% | |
| 1 | Assumes conversion of Class B shares into Class A shares after eight years. |
| 2 | Please note that this share class is for investors purchasing shares through accounts established under certainfee-based programs sponsored and maintained by certain broker-dealers and financial intermediaries, institutional pension plans and/or investment advisory clients of, and certain other persons associated with, the Adviser and its affiliates or the Fund. |
| | |
| |
| abfunds.com | | AB TAX-MANAGED ALL MARKET INCOME PORTFOLIO | 11 |
HISTORICAL PERFORMANCE(continued)
RETURNS AFTER TAXES ON DISTRIBUTIONS
AS OF THE MOST RECENT CALENDARQUARTER-END
MARCH 31, 2019(unaudited)
| | | | |
| |
| | | Returns | |
| |
| CLASS A SHARES | | | | |
| |
| 1 Year | | | -0.18% | |
| |
| 5 Years | | | 1.30% | |
| |
| 10 Years | | | 5.18% | |
| |
| CLASS B SHARES | | | | |
| |
| 1 Year | | | -0.32% | |
| |
| 5 Years | | | 1.64% | |
| |
| 10 Years1 | | | 5.10% | |
| |
| CLASS C SHARES | | | | |
| |
| 1 Year | | | 2.71% | |
| |
| 5 Years | | | 1.64% | |
| |
| 10 Years | | | 5.01% | |
| |
| ADVISOR CLASS SHARES2 | | | | |
| |
| 1 Year | | | 4.46% | |
| |
| 5 Years | | | 2.41% | |
| |
| 10 Years | | | 5.90% | |
RETURNS AFTER TAXES ON DISTRIBUTIONS AND SALE OF FUND SHARES
AS OF THE MOST RECENT CALENDARQUARTER-END
MARCH 31, 2019(unaudited)
| | | | |
| |
| | | Returns | |
| |
| CLASS A SHARES | | | | |
| |
| 1 Year | | | 1.71% | |
| |
| 5 Years | | | 1.95% | |
| |
| 10 Years | | | 4.84% | |
| |
| CLASS B SHARES | | | | |
| |
| 1 Year | | | 1.40% | |
| |
| 5 Years | | | 2.01% | |
| |
| 10 Years1 | | | 4.65% | |
| |
| CLASS C SHARES | | | | |
| |
| 1 Year | | | 3.21% | |
| |
| 5 Years | | | 2.05% | |
| |
| 10 Years | | | 4.55% | |
| |
| ADVISOR CLASS SHARES2 | | | | |
| |
| 1 Year | | | 4.63% | |
| |
| 5 Years | | | 2.87% | |
| |
| 10 Years | | | 5.50% | |
(footnotes continued on next page)
| | |
| |
| 12 | AB TAX-MANAGED ALL MARKET INCOME PORTFOLIO | | abfunds.com |
HISTORICAL PERFORMANCE(continued)
| 1 | Assumes conversion of Class B shares into Class A shares after eight years. |
| 2 | Please note that this share class is for investors purchasing shares through accounts established under certainfee-based programs sponsored and maintained by certain broker-dealers and financial intermediaries, institutional pension plans and/or investment advisory clients of, and certain other persons associated with, the Adviser and its affiliates or the Fund. |
| | |
| |
| abfunds.com | | AB TAX-MANAGED ALL MARKET INCOME PORTFOLIO | 13 |
EXPENSE EXAMPLE
(unaudited)
As a shareholder of the Fund, you incur two types of costs: (1) transaction costs, including sales charges (loads) on purchase payments, contingent deferred sales charges on redemptions and (2) ongoing costs, including management fees; distribution(12b-1) fees; and other Fund expenses. This example is intended to help you understand your ongoing costs (in dollars) of investing in the Fund and to compare these costs with the ongoing costs of investing in other mutual funds.
The Example is based on an investment of $1,000 invested at the beginning of the period and held for the entire period as indicated below.
Actual Expenses
The table below provides information about actual account values and actual expenses. You may use the information, together with the amount you invested, to estimate the expenses that you paid over the period. Simply divide your account value by $1,000 (for example, an $8,600 account value divided by $1,000 = 8.6), then multiply the result by the number under the heading entitled “Expenses Paid During Period” to estimate the expenses you paid on your account during this period.
Hypothetical Example for Comparison Purposes
The table below also provides information about hypothetical account values and hypothetical expenses based on the Fund’s actual expense ratio and an assumed annual rate of return of 5% before expenses, which is not the Fund’s actual return. The hypothetical account values and expenses may not be used to estimate the actual ending account balance or expenses you paid for the period. You may use this information to compare the ongoing costs of investing in the Fund and other funds by comparing this 5% hypothetical example with the 5% hypothetical examples that appear in the shareholder reports of other funds.
Please note that the expenses shown in the table are meant to highlight your ongoing costs only and do not reflect any transactional costs, such as sales charges (loads), or contingent deferred sales charges on redemptions. Therefore, the hypothetical example is useful in comparing ongoing costs only, and will not help you determine the relative total costs of owning different funds. In addition, if these transactional costs were included, your costs would have been higher.
| | |
| |
| 14 | AB TAX-MANAGED ALL MARKET INCOME PORTFOLIO | | abfunds.com |
EXPENSE EXAMPLE(continued)
| | | | | | | | | | | | | | | | | | | | | | | | |
| | | Beginning
Account
Value
September 1,
2018 | | | Ending
Account
Value
February 28,
2019 | | | Expenses
Paid
During
Period* | | | Annualized
Expense
Ratio* | | | Total
Expenses
Paid
During
Period+ | | | Total
Annualized
Expense
Ratio+ | |
| Class A | | | | | | | | | | | | | | | | | | | | |
Actual | | $ | 1,000 | | | $ | 1,000.00 | | | $ | 4.91 | | | | 0.99 | % | | | 5.01 | % | | | 1.01 | % |
Hypothetical** | | $ | 1,000 | | | $ | 1,019.89 | | | $ | 4.96 | | | | 0.99 | % | | | 5.06 | % | | | 1.01 | % |
| Class B | | | | | | | | | | | | | | | | | | | | |
Actual | | $ | 1,000 | | | $ | 995.90 | | | $ | 8.61 | | | | 1.74 | % | | | 8.71 | % | | | 1.76 | % |
Hypothetical** | | $ | 1,000 | | | $ | 1,016.17 | | | $ | 8.70 | | | | 1.74 | % | | | 8.80 | % | | | 1.76 | % |
| Class C | | | | | | | | | | | | | | | | | | | | |
Actual | | $ | 1,000 | | | $ | 996.10 | | | $ | 8.61 | | | | 1.74 | % | | | 8.71 | % | | | 1.76 | % |
Hypothetical** | | $ | 1,000 | | | $ | 1,016.17 | | | $ | 8.70 | | | | 1.74 | % | | | 8.80 | % | | | 1.76 | % |
| Advisor Class | | | | | | | | | | | | | | | | | |
Actual | | $ | 1,000 | | | $ | 1,001.30 | | | $ | 3.67 | | | | 0.74 | % | | | 3.77 | % | | | 0.76 | % |
Hypothetical** | | $ | 1,000 | | | $ | 1,021.12 | | | $ | 3.71 | | | | 0.74 | % | | | 3.81 | % | | | 0.76 | % |
| * | Expenses are equal to the classes’ annualized expense ratios, multiplied by the average account value over the period, multiplied by 181/365 (to reflect theone-half year period). |
| ** | Assumes 5% annual return before expenses. |
| + | In connection with the Fund’s investments in affiliated/unaffiliated underlying portfolios, the Fund incurs no direct expenses, but bears proportionate shares of the fees and expenses (i.e., operating, administrative and investment advisory fees) of the affiliated/unaffiliated underlying portfolios. The Adviser has contractually agreed to waive its fees from the Fund in an amount equal to the Fund’s pro rata share of certain acquired fund fees and expenses of the affiliated underlying portfolios. The Fund’s total expenses are equal to the classes’ annualized expense ratio plus the Fund’s pro rata share of the weighted average expense ratio of the affiliated/unaffiliated underlying portfolios in which it invests, multiplied by the average account value over the period, multiplied by 181/365 (to reflect theone-half year period). |
| | |
| |
| abfunds.com | | AB TAX-MANAGED ALL MARKET INCOME PORTFOLIO | 15 |
PORTFOLIO SUMMARY
February 28, 2019(unaudited)
PORTFOLIO STATISTICS
Net Assets ($mil): $103.6
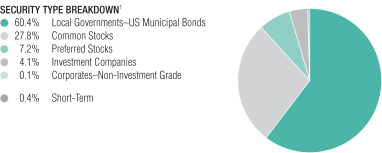
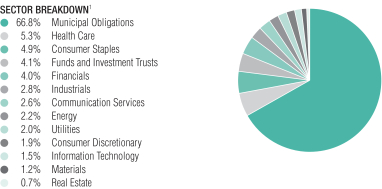
| 1 | All data are as of February 28, 2019. The Fund’s security type and sector breakdowns are expressed as a percentage of total investments and may vary over time. The Fund also enters into derivative transactions, which may be used for hedging or investment purposes (see “Portfolio of Investments” section of the report for additional details). |
Please note: The sector classifications presented herein are based on the Global Industry Classification Standard (GICS) which was developed by Morgan Stanley Capital International and Standard & Poor’s. The components are divided into sector, industry group, and industrysub-indices as classified by the GICS for each of the market capitalization indices in the broad market. These sector classifications are broadly defined. The “Portfolio of Investments” section of the report reflects more specific industry information and is consistent with the investment restrictions discussed in the Fund’s prospectus.
| | |
| |
| 16 | AB TAX-MANAGED ALL MARKET INCOME PORTFOLIO | | abfunds.com |
PORTFOLIO SUMMARY(continued)
February 28, 2019(unaudited)
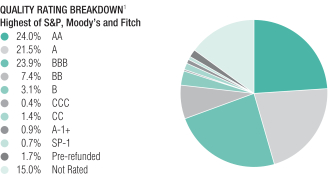
| 1 | All data are as of February 28, 2019. The Fund’s quality rating breakdown is expressed as a percentage of the Fund’s total investments in municipal securities and may vary over time. The Fund also enters into derivative transactions, which may be used for hedging or investment purposes (see “Portfolio of Investments” section of the report for additional details). The quality ratings are determined by using the S&P Global Ratings (“S&P”), Moody’s Investors Services, Inc.(“Moody’s”) and Fitch Ratings, Ltd.(“Fitch”). The Fund considers the credit ratings issued by S&P, Moody’s and Fitch and uses the highest rating issued by the agencies. These ratings are a measure of the quality and safety of a bond or portfolio, based on the issuer’s financial condition. AAA is the highest (best) and D is the lowest (worst). If applicable, thePre-refunded category includes bonds which are secured by US Government securities and therefore are deemed high-quality investment grade by the Adviser. If applicable, Not Applicable (N/A) includesnon-creditworthy investments such as equities, currency contracts, futures and options. If applicable, the Not Rated category includes bonds that are not rated by a nationally recognized statistical rating organization. The Adviser evaluates the creditworthiness ofnon-rated securities based on a number of factors including, but not limited to, cash flows, enterprise value and economic environment. |
| | |
| |
| abfunds.com | | AB TAX-MANAGED ALL MARKET INCOME PORTFOLIO | 17 |
PORTFOLIO OF INVESTMENTS
February 28, 2019(unaudited)
| | | | | | | | |
| | | Principal
Amount
(000) | | | U.S. $ Value | |
| |
MUNICIPAL OBLIGATIONS – 54.4% | |
Long-Term Municipal Bonds – 54.4% | |
Alabama – 1.0% | |
Water Works Board of the City of Birmingham (The)
Series 2010A
5.00%, 1/01/25 | | $ | 1,000 | | | $ | 1,055,850 | |
| | | | | | | | |
|
American Samoa – 0.1% | |
American Samoa Economic Development Authority
(Territory of American Samoa)
7.125%, 9/01/38(a) | | | 100 | | | | 100,508 | |
| | | | | | | | |
|
Arizona – 2.2% | |
Arizona Department of Transportation State Highway Fund Revenue
Series 2011A
5.00%, 7/01/25 | | | 1,685 | | | | 1,808,915 | |
Glendale Industrial Development Authority
(Beatitudes Campus Obligated Group (The))
Series 2017
5.00%, 11/15/40(b) | | | 335 | | | | 334,095 | |
Tempe Industrial Development Authority
(Mirabella at ASU, Inc.)
Series 2017A
6.125%, 10/01/47(a)(b) | | | 110 | | | | 119,018 | |
| | | | | | | | |
| | | | 2,262,028 | |
| | | | | | | | |
California – 1.0% | |
California Infrastructure & Economic Development Bank
(Pacific Gas & Electric Co.)
1.75%, 11/01/26(b)(c)(d) | | | 40 | | | | 36,400 | |
California School Finance Authority
(Bright Star Schools Obligated Group)
Series 2017
5.00%, 6/01/54(a)(b) | | | 250 | | | | 252,335 | |
City of Oroville CA
(Oroville Hospital)
5.25%, 4/01/54 | | | 40 | | | | 43,231 | |
Golden State Tobacco Securitization Corp.
Series 2018A
5.00%, 6/01/47(b) | | | 200 | | | | 192,494 | |
State of California
Series 2017
5.00%, 8/01/26 | | | 440 | | | | 531,977 | |
| | | | | | | | |
| | | | 1,056,437 | |
| | | | | | | | |
| | |
| |
| 18 | AB TAX-MANAGED ALL MARKET INCOME PORTFOLIO | | abfunds.com |
PORTFOLIO OF INVESTMENTS(continued)
| | | | | | | | |
| | | Principal
Amount
(000) | | | U.S. $ Value | |
| |
Colorado – 0.8% | |
City & County of Denver CO Airport System Revenue
(Denver Intl Airport)
Series 2018A
5.00%, 12/01/28 | | $ | 545 | | | $ | 657,335 | |
PV Water & Sanitation Metropolitan District
Zero Coupon, 2/14/39(b) | | | 710 | | | | 149,100 | |
| | | | | | | | |
| | | | | | | 806,435 | |
| | | | | | | | |
Connecticut – 1.2% | |
State of Connecticut Special Tax Revenue
Series 2012
5.00%, 1/01/27 | | | 1,135 | | | | 1,243,563 | |
| | | | | | | | |
|
Delaware – 0.2% | |
Delaware State Economic Development Authority
(Newark Charter School, Inc.)
Series 2012
5.00%, 9/01/42 | | | 225 | | | | 231,770 | |
| | | | | | | | |
|
Florida – 4.6% | |
Cape Coral Health Facilities Authority
(Gulf Care, Inc.)
Series 2015
6.00%, 7/01/50(a)(b) | | | 270 | | | | 285,363 | |
Capital Trust Agency, Inc.
(AVIVA SENIOR LIFE)
Series 2017
5.00%, 7/01/46(a)(b) | | | 340 | | | | 341,357 | |
Capital Trust Agency, Inc.
(Provision Cares Proton Therapy Center – Orlando)
Series 2018A
7.50%, 6/01/48(a)(b) | | | 100 | | | | 102,693 | |
County of Miami-Dade FL
(County of Miami-Dade FL Spl Tax)
Series 2012A
5.00%, 10/01/25 | | | 560 | | | | 618,413 | |
County of Miami-Dade FL Aviation Revenue
Series 2014B
5.00%, 10/01/25 | | | 665 | | | | 766,313 | |
North Broward Hospital District
Series 2017B
5.00%,1/01/37-1/01/48 | | | 425 | | | | 452,543 | |
Overoaks Community Development District
Series2010A-1
6.125%, 5/01/35(b) | | | 15 | | | | 15,017 | |
Series2010A-2
6.125%, 5/01/35(b) | | | 35 | | | | 35,041 | |
| | |
| |
| abfunds.com | | AB TAX-MANAGED ALL MARKET INCOME PORTFOLIO | 19 |
PORTFOLIO OF INVESTMENTS(continued)
| | | | | | | | |
| | | Principal
Amount
(000) | | | U.S. $ Value | |
| |
Sarasota County School Board
Series 2010B
5.00%, 7/01/22(Pre-refunded/ETM) | | $ | 935 | | | $ | 976,617 | |
Tampa Bay Water
Series 2011A
5.00%, 10/01/23 | | | 1,105 | | | | 1,195,345 | |
| | | | | | | | |
| | | | | | | 4,788,702 | |
| | | | | | | | |
Georgia – 1.6% | |
Augusta Development Authority
(AU Health System Obligated Group)
Series 2018
5.00%, 7/01/30 | | | 200 | | | | 230,170 | |
City of Atlanta Department of Aviation
(Hartsfield Jackson Atlanta Intl Airport)
Series 2014A
5.00%, 1/01/28 | | | 625 | | | | 707,087 | |
Main Street Natural Gas, Inc.
(Royal Bank of Canada)
Series 2018C
4.00%, 8/01/48 | | | 450 | | | | 480,303 | |
Private Colleges & Universities Authority
(Savannah College of Art & Design, Inc.)
Series 2014
5.00%, 4/01/44 | | | 210 | | | | 224,757 | |
| | | | | | | | |
| | | | | | | 1,642,317 | |
| | | | | | | | |
Guam – 0.3% | |
Territory of Guam
(Territory of Guam Business Privilege Tax)
Series 2011A
5.125%, 1/01/42 | | | 300 | | | | 307,989 | |
| | | | | | | | |
|
Illinois – 6.9% | |
Chicago Board of Education
Series 2012A
5.00%, 12/01/42 | | | 950 | | | | 955,073 | |
Series 2016A
7.00%, 12/01/44 | | | 100 | | | | 114,765 | |
Series 2017B
6.75%, 12/01/30(a) | | | 135 | | | | 162,591 | |
7.00%, 12/01/42(a) | | | 100 | | | | 118,690 | |
Chicago O’Hare International Airport
(TrIPs Obligated Group)
Series 2018
5.00%, 7/01/33 | | | 105 | | | | 118,418 | |
City of Chicago IL
Series 2014A
5.00%, 1/01/35 | | | 100 | | | | 103,721 | |
| | |
| |
| 20 | AB TAX-MANAGED ALL MARKET INCOME PORTFOLIO | | abfunds.com |
PORTFOLIO OF INVESTMENTS(continued)
| | | | | | | | |
| | | Principal
Amount
(000) | | | U.S. $ Value | |
| |
Illinois Finance Authority
(Ascension Health Credit Group)
Series 2016C
5.00%, 2/15/41 | | $ | 415 | | | $ | 460,330 | |
Illinois Finance Authority
(CHF-Chicago LLC)
Series 2017A
5.00%, 2/15/47 | | | 210 | | | | 223,837 | |
Illinois Finance Authority
(Lutheran Home & Services Obligated Group)
Series 2012
5.75%, 5/15/46(b) | | | 475 | | | | 484,661 | |
Illinois Finance Authority
(Mercy Health Corp.)
Series 2016
5.00%, 12/01/46 | | | 430 | | | | 458,526 | |
Illinois Finance Authority
(Park Place of Elmhurst Obligated Group)
Series 2016A
6.44%, 5/15/55(b) | | | 498 | | | | 439,664 | |
Illinois Finance Authority
(Rosalind Franklin University of Medicine & Science)
Series 2017C
5.00%, 8/01/49 | | | 425 | | | | 452,876 | |
Metropolitan Pier & Exposition Authority
Series 2012
Zero Coupon,12/15/41-12/15/50 | | | 675 | | | | 187,541 | |
Series 2017A
5.00%, 6/15/57 | | | 115 | | | | 119,718 | |
Series 2017B
Zero Coupon, 12/15/54 | | | 150 | | | | 25,661 | |
Railsplitter Tobacco Settlement Authority
Series 2017
5.00%, 6/01/23 | | | 365 | | | | 407,468 | |
State of Illinois
Series 2013
5.00%, 7/01/22 | | | 315 | | | | 334,895 | |
Series 2014
5.00%, 4/01/20 | | | 75 | | | | 76,983 | |
Series 2016
5.00%,2/01/23-2/01/28 | | | 1,170 | | | | 1,253,734 | |
Series 2017A
5.00%, 12/01/25 | | | 135 | | | | 146,038 | |
Series 2017D
5.00%,11/01/24-11/01/28 | | | 480 | | | | 517,204 | |
| | | | | | | | |
| | | | | | | 7,162,394 | |
| | | | | | | | |
| | |
| |
| abfunds.com | | AB TAX-MANAGED ALL MARKET INCOME PORTFOLIO | 21 |
PORTFOLIO OF INVESTMENTS(continued)
| | | | | | | | |
| | | Principal
Amount
(000) | | | U.S. $ Value | |
| |
Indiana – 0.5% | |
Indiana Bond Bank
Series 2007A
5.25%, 10/15/19 | | $ | 460 | | | $ | 468,837 | |
| | | | | | | | |
|
Iowa – 0.5% | |
Iowa Finance Authority
(Iowa Fertilizer Co. LLC)
Series 2013B
5.25%, 12/01/50 | | | 110 | | | | 117,063 | |
Xenia Rural Water District
Series 2016
5.00%, 12/01/31 | | | 340 | | | | 377,176 | |
| | | | | | | | |
| | | | | | | 494,239 | |
| | | | | | | | |
Kansas – 0.3% | |
Wyandotte County-Kansas City Unified Government
(Wyandotte County-Kansas City Unified Government Sales Tax)
Series 2018
4.50%, 6/01/40 | | | 315 | | | | 313,699 | |
| | | | | | | | |
|
Kentucky – 1.1% | |
Kentucky Economic Development Finance Authority
(Baptist Healthcare System Obligated Group)
Series 2017B
5.00%,8/15/37-8/15/46 | | | 620 | | | | 676,190 | |
Kentucky Economic Development Finance Authority
(Owensboro Health, Inc. Obligated Group)
Series 2017A
5.00%, 6/01/37 | | | 315 | | | | 335,780 | |
5.25%, 6/01/41 | | | 150 | | | | 162,309 | |
| | | | | | | | |
| | | | | | | 1,174,279 | |
| | | | | | | | |
Louisiana – 0.4% | |
New Orleans Aviation Board
Series 2017B
5.00%, 1/01/48 | | | 400 | | | | 435,580 | |
| | | | | | | | |
|
Maryland – 1.3% | |
City of Baltimore MD
(Baltimore Hotel Corp.)
Series 2017
5.00%, 9/01/34 | | | 400 | | | | 445,664 | |
City of Baltimore MD
(East Baltimore Research Park Project)
Series 2017A
5.00%, 9/01/38(b) | | | 215 | | | | 226,081 | |
| | |
| |
| 22 | AB TAX-MANAGED ALL MARKET INCOME PORTFOLIO | | abfunds.com |
PORTFOLIO OF INVESTMENTS(continued)
| | | | | | | | |
| | | Principal
Amount
(000) | | | U.S. $ Value | |
| |
County of Frederick MD
(Mount St. Mary’s University, Inc.)
Series 2017A
5.00%, 9/01/45(a) | | $ | 215 | | | $ | 223,131 | |
County of Howard MD
(Downtown Columbia Project)
Series 2017A
4.50%, 2/15/47(a)(b) | | | 500 | | | | 501,170 | |
| | | | | | | | |
| | | | | | | 1,396,046 | |
| | | | | | | | |
Massachusetts – 1.6% | |
Massachusetts Development Finance Agency
(Boston Medical Center Corp. Obligated Group)
Series 2015D
5.00%, 7/01/44 | | | 175 | | | | 187,094 | |
Massachusetts Development Finance Agency
(Lawrence General Hospital Obligated Group)
Series 2017
5.00%, 7/01/47 | | | 320 | | | | 334,279 | |
Massachusetts Development Finance Agency
(Merrimack College)
Series 2012A
5.25%, 7/01/42 | | | 635 | | | | 665,899 | |
Massachusetts Development Finance Agency
(NewBridge on the Charles, Inc.)
Series 2017
5.00%, 10/01/37(a) | | | 200 | | | | 211,416 | |
Massachusetts Development Finance Agency
(ZERO Waste Solutions LLC)
Series 2017
8.00%, 12/01/22(a)(b) | | | 235 | | | | 200,161 | |
Series 2017A
7.75%, 12/01/44(a)(b) | | | 100 | | | | 96,115 | |
| | | | | | | | |
| | | | | | | 1,694,964 | |
| | | | | | | | |
Michigan – 2.6% | | | | | | | | |
City of Detroit MI
5.00%,4/01/36-4/01/37 | | | 65 | | | | 67,818 | |
Grand Rapids Economic Development Corp.
(Beacon Hill at Eastgate)
Series 2017A
5.00%, 11/01/47(b) | | | 325 | | | | 328,393 | |
Michigan Finance Authority
(Great Lakes Water Authority Sewage Disposal System Revenue)
AGM Series 2014C
5.00%, 7/01/28 | | | 325 | | | | 366,528 | |
| | |
| |
| abfunds.com | | AB TAX-MANAGED ALL MARKET INCOME PORTFOLIO | 23 |
PORTFOLIO OF INVESTMENTS(continued)
| | | | | | | | |
| | | Principal
Amount
(000) | | | U.S. $ Value | |
| |
Michigan Finance Authority
(Great Lakes Water Authority Water Supply System Revenue)
AGM Series 2014D2
5.00%, 7/01/28 | | $ | 1,000 | | | $ | 1,127,780 | |
Michigan State Hospital Finance Authority
(Trinity Health Corp.)
Series 2017C
5.00%, 12/01/23 | | | 445 | | | | 507,122 | |
Michigan Tobacco Settlement Finance Authority
(Tobacco Settlement Financing Corp. /MI)
Series 2007A
6.00%, 6/01/48 | | | 305 | | | | 299,684 | |
| | | | | | | | |
| | | | | | | 2,697,325 | |
| | | | | | | | |
Minnesota – 0.1% | | | | | | | | |
City of Bethel MN
(Lodge at Stillwater LLC (The))
Series 2018
5.25%, 6/01/58(b) | | | 100 | | | | 102,666 | |
| | | | | | | | |
| | |
Missouri – 1.0% | | | | | | | | |
Cape Girardeau County Industrial Development Authority
(SoutheastHEALTH Obligated Group)
Series 2017A
5.00%, 3/01/36 | | | 470 | | | | 510,801 | |
Lees Summit Industrial Development Authority
(John Knox Village Obligated Group)
Series 2016A
5.00%, 8/15/46 | | | 500 | | | | 501,835 | |
| | | | | | | | |
| | | | | | | 1,012,636 | |
| | | | | | | | |
Nebraska – 0.5% | | | | | | | | |
Central Plains Energy Project
(Goldman Sachs Group, Inc. (The))
Series 2017A
5.00%, 9/01/42 | | | 455 | | | | 524,337 | |
| | | | | | | | |
| | |
Nevada – 0.1% | | | | | | | | |
State of Nevada Department of Business & Industry
(Fulcrum Sierra Holdings LLC)
Series 2018
6.95%, 2/15/38(a)(b) | | | 100 | | | | 100,682 | |
| | | | | | | | |
| | |
New Jersey – 5.6% | | | | | | | | |
New Jersey Economic Development Authority
(New Jersey Economic Development Authority State Lease)
Series 2013
5.00%, 3/01/30 | | | 685 | | | | 727,778 | |
| | |
| |
| 24 | AB TAX-MANAGED ALL MARKET INCOME PORTFOLIO | | abfunds.com |
PORTFOLIO OF INVESTMENTS(continued)
| | | | | | | | |
| | | Principal
Amount
(000) | | | U.S. $ Value | |
| |
Series 2014P
5.00%, 6/15/29 | | $ | 500 | | | $ | 539,090 | |
New Jersey Economic Development Authority
(North Star Academy Charter School of Newark, Inc.)
Series 2017
5.00%, 7/15/47 | | | 415 | | | | 437,589 | |
New Jersey Economic Development Authority
(NYNJ Link Borrower LLC)
Series 2013
5.25%, 1/01/25 | | | 1,195 | | | | 1,338,842 | |
New Jersey Economic Development Authority
(Port Newark Container Terminal LLC)
Series 2017
5.00%, 10/01/47 | | | 415 | | | | 437,846 | |
New Jersey Transit Corp.
Series 2014A
5.00%, 9/15/20 | | | 300 | | | | 313,590 | |
New Jersey Transportation Trust Fund Authority
(New Jersey Transportation Trust Fund Authority State Lease)
Series 2013A
5.00%, 6/15/20 | | | 840 | | | | 870,811 | |
New Jersey Turnpike Authority
Series 2014A
5.00%, 1/01/29 | | | 675 | | | | 770,425 | |
Tobacco Settlement Financing Corp./NJ
Series 2018B
5.00%, 6/01/46 | | | 390 | | | | 394,867 | |
| | | | | | | | |
| | | | | | | 5,830,838 | |
| | | | | | | | |
New York – 2.9% | | | | | | | | |
County of Nassau NY
Series 2017C
5.00%, 10/01/26 | | | 225 | | | | 267,961 | |
New York City Transitional Finance Authority Building Aid Revenue
(New York City Transitional Finance Authority Building Aid Revenue State Lease)
Series 2018S
5.00%, 7/15/32 | | | 195 | | | | 232,569 | |
New York State Dormitory Authority
(State of New York Pers Income Tax)
Series 2018A
5.00%, 3/15/20 | | | 490 | | | | 507,111 | |
New York State Dormitory Authority
(State University of New York Dormitory Fees)
Series 2013A
5.00%, 7/01/26 | | | 205 | | | | 231,156 | |
| | |
| |
| abfunds.com | | AB TAX-MANAGED ALL MARKET INCOME PORTFOLIO | 25 |
PORTFOLIO OF INVESTMENTS(continued)
| | | | | | | | |
| | | Principal
Amount
(000) | | | U.S. $ Value | |
| |
New York Transportation Development Corp.
(Laguardia Gateway Partners LLC)
Series 2016A
5.00%, 7/01/41 | | $ | 460 | | | $ | 489,104 | |
Triborough Bridge & Tunnel Authority
Series 2012B
5.00%, 11/15/26 | | | 1,000 | | | | 1,115,220 | |
Westchester County Local Development Corp.
(Westchester County Health Care Corp. Obligated Group)
Series 2016
5.00%, 11/01/46 | | | 105 | | | | 112,371 | |
| | | | | | | | |
| | | | | | | 2,955,492 | |
| | | | | | | | |
North Carolina – 0.2% | | | | | | | | |
North Carolina Medical Care Commission
(United Church Homes & Services Obligated Group)
Series 2017
5.00%, 9/01/41(b) | | | 250 | | | | 257,233 | |
| | | | | | | | |
| | |
Ohio – 2.6% | | | | | | | | |
Buckeye Tobacco Settlement Financing Authority
Series2007A-2
5.875%, 6/01/47 | | | 630 | | | | 589,850 | |
Butler County Port Authority
(StoryPoint Obligated Group)
Series2017A-1
6.375%, 1/15/43(a)(b) | | | 225 | | | | 230,774 | |
County of Allen OH Hospital Facilities Revenue
(Mercy Health/OH)
Series 2017A
5.00%, 8/01/28 | | | 315 | | | | 374,604 | |
County of Cuyahoga/OH
(MetroHealth System (The))
Series 2017
5.00%, 2/15/42 | | | 660 | | | | 696,326 | |
County of Miami OH
(Kettering Health Network Obligated Group)
5.00%, 8/01/33(b)(e) | | | 195 | | | | 224,927 | |
Ohio Air Quality Development Authority
(FirstEnergy Generation LLC)
Series 2009C
5.625%, 6/01/49(b)(c)(d) | | | 140 | | | | 140,000 | |
Series 2009D
4.25%, 8/01/29(b) | | | 250 | | | | 250,000 | |
| | |
| |
| 26 | AB TAX-MANAGED ALL MARKET INCOME PORTFOLIO | | abfunds.com |
PORTFOLIO OF INVESTMENTS(continued)
| | | | | | | | |
| | | Principal
Amount
(000) | | | U.S. $ Value | |
| |
Ohio Air Quality Development Authority
(Pratt Paper/OH, Inc.)
Series 2017
4.50%, 1/15/48(a)(b) | | $ | 175 | | | $ | 179,366 | |
Ohio Water Development Authority Water Pollution Control Loan Fund
(FirstEnergy Nuclear Generation LLC)
Series 2016A
4.375%, 6/01/33(b) | | | 45 | | | | 45,000 | |
| | | | | | | | |
| | | | | | | 2,730,847 | |
| | | | | | | | |
Pennsylvania – 2.8% | | | | | | | | |
Allentown Neighborhood Improvement Zone Development Authority
Series 2017
5.00%, 5/01/42(a) | | | 220 | | | | 234,227 | |
Commonwealth of Pennsylvania
Series 2016
5.00%, 9/15/23 | | | 600 | | | | 681,378 | |
Crawford County Hospital Authority
(Meadville Medical Center Obligated Group)
Series 2016A
6.00%, 6/01/51(b) | | | 215 | | | | 229,652 | |
Pennsylvania Economic Development Financing Authority
(PA Bridges Finco LP)
Series 2015
5.00%, 12/31/34 | | | 220 | | | | 241,206 | |
Philadelphia Authority for Industrial Development
(Evangelical Services for the Aging Obligated Group)
Series 2017A
5.00%, 7/01/49 | | | 335 | | | | 337,928 | |
Philadelphia Authority for Industrial Development
(LLPCS Foundation)
Series 2005A
4.60%, 7/01/15(b)(c)(f)(g) | | | 55 | | | | 550 | |
School District of Philadelphia (The)
Series 2018A
5.00%, 9/01/34 | | | 1,000 | | | | 1,132,540 | |
| | | | | | | | |
| | | | | | | 2,857,481 | |
| | | | | | | | |
Puerto Rico – 2.1% | | | | | | | | |
Commonwealth of Puerto Rico
Series 2001A
5.125%, 7/01/31(c)(d) | | | 100 | | | | 60,875 | |
Series 2006A
5.25%,7/01/23-7/01/24 | | | 35 | | | | 21,350 | |
| | |
| |
| abfunds.com | | AB TAX-MANAGED ALL MARKET INCOME PORTFOLIO | 27 |
PORTFOLIO OF INVESTMENTS(continued)
| | | | | | | | |
| | | Principal
Amount
(000) | | | U.S. $ Value | |
| |
Series 2006B
5.25%, 7/01/32(c)(d) | | $ | 10 | | | $ | 6,100 | |
Series 2008A
5.50%, 7/01/32(b) | | | 30 | | | | 18,300 | |
Series 2009C
6.00%, 7/01/39(c)(d) | | | 10 | | | | 6,125 | |
Series 2011A
5.75%, 7/01/24(c)(d) | | | 65 | | | | 39,000 | |
Series 2012A
5.125%, 7/01/37(c)(d) | | | 100 | | | | 48,375 | |
5.50%, 7/01/39(c)(d) | | | 110 | | | | 53,625 | |
Series 2014A
8.00%, 7/01/35(c)(d) | | | 325 | | | | 160,875 | |
GDB Debt Recovery Authority of Puerto Rico
Series 2018
7.50%, 8/20/40(b) | | | 90 | | | | 67,798 | |
Puerto Rico Commonwealth Aqueduct & Sewer Authority
Series 2008A
6.125%, 7/01/24 | | | 30 | | | | 30,600 | |
Series 2012A
5.00%, 7/01/33 | | | 50 | | | | 49,125 | |
5.125%, 7/01/37 | | | 25 | | | | 24,562 | |
5.25%,7/01/29-7/01/42 | | | 110 | | | | 108,700 | |
5.50%, 7/01/28 | | | 30 | | | | 30,150 | |
5.75%, 7/01/37 | | | 30 | | | | 29,850 | |
6.00%, 7/01/47 | | | 30 | | | | 30,075 | |
Puerto Rico Electric Power Authority
Series 2007T
5.00%, 7/01/37(c)(d) | | | 30 | | | | 20,512 | |
Series 2010C
5.00%, 7/01/21(c)(d) | | | 25 | | | | 17,094 | |
Series 2010DDD
5.00%, 7/01/21(c)(d) | | | 15 | | | | 10,256 | |
Series 2012A
5.00%, 7/01/42(c)(d) | | | 90 | | | | 61,537 | |
AGM Series 2007V
5.25%,7/01/27-7/01/31 | | | 370 | | | | 410,587 | |
Puerto Rico Highway & Transportation Authority
NATL Series 2007N
5.25%, 7/01/32 | | | 330 | | | | 351,156 | |
Puerto Rico Industrial Tourist Educational Medical & Envirml Ctl Facs Fing Auth
(AES Puerto Rico LP)
Series 2000
6.625%, 6/01/26 | | | 225 | | | | 219,094 | |
| | |
| |
| 28 | AB TAX-MANAGED ALL MARKET INCOME PORTFOLIO | | abfunds.com |
PORTFOLIO OF INVESTMENTS(continued)
| | | | | | | | |
| | | Principal
Amount
(000) | | | U.S. $ Value | |
| |
Puerto Rico Sales Tax Financing Corp. Sales Tax Revenue
Series 2018A
Zero Coupon,7/01/24-7/01/51(b) | | $ | 94 | | | $ | 26,156 | |
Series 2019A
4.50%, 7/01/34** (b) | | | 0 | ** | | | 57 | |
4.55%, 7/01/40** (b) | | | 0 | ** | | | 67 | |
5.00%, 7/01/58(b) | | | 257 | | | | 243,544 | |
| | | | | | | | |
| | | | | | | 2,145,545 | |
| | | | | | | | |
Tennessee – 0.8% | | | | | | | | |
Bristol Industrial Development Board
(Bristol Industrial Development Board Sales Tax)
Series 2016A
5.125%, 12/01/42(a)(b) | | | 280 | | | | 274,143 | |
Memphis-Shelby County Industrial Development Board
(Graceland, Inc.)
Series 2017A
5.50%, 7/01/37(b) | | | 100 | | | | 105,734 | |
Metropolitan Government Nashville & Davidson County Health & Educational Facs Board
(Trousdale Foundation Obligated Group)
Series 2018A
6.25%, 4/01/49(a)(b) | | | 100 | | | | 103,206 | |
Tennessee Housing Development Agency
Series 2017
4.00%, 7/01/48 | | | 290 | | | | 306,814 | |
| | | | | | | | |
| | | | 789,897 | |
| | | | | | | | |
Texas – 3.5% | | | | | | | | |
City of Houston TX
Series 2017A
5.00%, 3/01/26 | | | 405 | | | | 481,982 | |
Clifton Higher Education Finance Corp
(International American Education Federation, Inc.)
Series 2018D
6.125%, 8/15/48(b) | | | 120 | | | | 123,628 | |
Harris County-Houston Sports Authority
AGM Series 2014A
5.00%, 11/15/25 | | | 615 | | | | 705,694 | |
Irving Hospital Authority
(Baylor Medical Center at Irving)
Series 2017A
5.00%, 10/15/44 | | | 500 | | | | 537,490 | |
New Hope Cultural Education Facilities Finance Corp.
(BSPV – Plano LLC)
7.25%, 12/01/53(b) | | | 80 | | | | 80,542 | |
| | |
| |
| abfunds.com | | AB TAX-MANAGED ALL MARKET INCOME PORTFOLIO | 29 |
PORTFOLIO OF INVESTMENTS(continued)
| | | | | | | | |
| | | Principal
Amount
(000) | | | U.S. $ Value | |
| |
New Hope Cultural Education Facilities Finance Corp.
(Longhorn Village)
Series 2017
5.00%, 1/01/37(b) | | $ | 325 | | | $ | 329,602 | |
Red River Education Finance Corp.
(St. Edward’s University, Inc.)
Series 2016
5.00%, 6/01/46 | | | 90 | | | | 96,125 | |
Tarrant County Cultural Education Facilities Finance Corp.
(CC Young Memorial Home Obligated Group)
Series 2017A
6.375%, 2/15/48(b) | | | 230 | | | | 243,414 | |
Tarrant County Cultural Education Facilities Finance Corp.
(Trinity Terrace Project)
Series2014A-1
5.00%, 10/01/44 | | | 300 | | | | 314,007 | |
Uptown Development Authority
Series 2017A
5.00%, 9/01/40 | | | 625 | | | | 672,075 | |
| | | | | | | | |
| | | | | | | 3,584,559 | |
| | | | | | | | |
Vermont – 0.4% | | | | | | | | |
Vermont Economic Development Authority
(Casella Waste Systems, Inc.)
Series 2013
4.625%, 4/01/36(a) | | | 100 | | | | 100,328 | |
Vermont Economic Development Authority
(Wake Robin Corp.)
Series 2017A
5.00%, 5/01/47(b) | | | 335 | | | | 351,680 | |
| | | | | | | | |
| | | | | | | 452,008 | |
| | | | | | | | |
Virginia – 0.9% | | | | | | | | |
Henrico County Economic Development Authority
(LifeSpire of Virginia Obligated Group)
Series 2017C
5.00%, 12/01/47(b) | | | 325 | | | | 336,615 | |
Richmond Redevelopment & Housing Authority
(American Tobacco Holdings LLC)
Series 2017
5.55%, 1/01/37(a)(b) | | | 220 | | | | 222,906 | |
Tobacco Settlement Financing Corp./VA
Series 2007B1
5.00%, 6/01/47 | | | 410 | | | | 390,558 | |
| | | | | | | | |
| | | | | | | 950,079 | |
| | | | | | | | |
| | |
| |
| 30 | AB TAX-MANAGED ALL MARKET INCOME PORTFOLIO | | abfunds.com |
PORTFOLIO OF INVESTMENTS(continued)
| | | | | | | | |
| | | Principal
Amount
(000) | | | U.S. $ Value | |
| |
Washington – 1.5% | | | | | | | | |
Kalispel Tribe of Indians
Series 2018B
5.25%, 1/01/38(a)(b)(e) | | $ | 155 | | | $ | 165,475 | |
King County Public Hospital District No. 1
Series 2018
5.00%, 12/01/31 | | | 265 | | | | 312,117 | |
Washington Health Care Facilities Authority
(Virginia Mason Medical Center Obligated Group)
Series 2017
5.00%, 8/15/37 | | | 355 | | | | 382,601 | |
Washington State Housing Finance Commission
(Mirabella)
Series 2012A
6.75%, 10/01/47(a)(b) | | | 340 | | | | 362,331 | |
Washington State Housing Finance Commission
(Presbyterian Retirement Communities Northwest Obligated Group)
Series 2016A
5.00%, 1/01/46(a) | | | 315 | | | | 327,591 | |
| | | | | | | | |
| | | | | | | 1,550,115 | |
| | | | | | | | |
West Virginia – 0.1% | | | | | | | | |
West Virginia Economic Development Authority
(Morgantown Energy Associates)
Series 2016
2.875%, 12/15/26 | | | 100 | | | | 96,792 | |
| | | | | | | | |
| | |
Wisconsin – 1.1% | | | | | | | | |
Wisconsin Public Finance Authority
(American Dream at Meadowlands Project)
Series 2017
7.00%, 12/01/50(a)(b) | | | 105 | | | | 117,974 | |
Wisconsin Public Finance Authority
(Bancroft Neurohealth Obligated Group)
Series 2016
5.125%, 6/01/48(a)(b) | | | 160 | | | | 160,323 | |
Wisconsin Public Finance Authority
(Celanese US Holdings LLC)
Series 2016A
5.00%, 1/01/24 | | | 265 | | | | 288,633 | |
Wisconsin Public Finance Authority
(Gannon University)
Series 2017
5.00%,5/01/42-5/01/47 | | | 410 | | | | 434,158 | |
| | |
| |
| abfunds.com | | AB TAX-MANAGED ALL MARKET INCOME PORTFOLIO | 31 |
PORTFOLIO OF INVESTMENTS(continued)
| | | | | | | | |
| | | Principal
Amount
(000) | | | U.S. $ Value | |
| |
Wisconsin Public Finance Authority
(Maryland Proton Treatment Center LLC)
Series2018A-1
6.375%, 1/01/48(a)(b) | | $ | 100 | | | $ | 102,664 | |
| | | | | | | | |
| | | | | | | 1,103,752 | |
| | | | | | | | |
Total Municipal Obligations
(cost $55,351,405) | | | | | | | 56,377,921 | |
| | | | | | | | |
| | |
| | | Shares | | | | |
COMMON STOCKS – 25.0% | | | | | | | | |
Health Care – 4.7% | | | | | | | | |
Biotechnology – 0.6% | | | | | | | | |
AbbVie, Inc. | | | 4,594 | | | | 364,028 | |
Gilead Sciences, Inc. | | | 3,933 | | | | 255,724 | |
| | | | | | | | |
| | | | | | | 619,752 | |
| | | | | | | | |
Health Care Providers & Services – 0.3% | | | | | | | | |
Cardinal Health, Inc. | | | 959 | | | | 52,112 | |
CVS Health Corp. | | | 3,921 | | | | 226,751 | |
Sonic Healthcare Ltd. | | | 1,123 | | | | 19,238 | |
| | | | | | | | |
| | | | | | | 298,101 | |
| | | | | | | | |
Pharmaceuticals – 3.8% | | | | | | | | |
AstraZeneca PLC | | | 3,843 | | | | 313,178 | |
Bristol-Myers Squibb Co. | | | 4,951 | | | | 255,769 | |
GlaxoSmithKline PLC | | | 15,058 | | | | 300,117 | |
Merck & Co., Inc. | | | 8,069 | | | | 655,929 | |
Novartis AG | | | 6,578 | | | | 599,479 | |
Orion Oyj – Class B | | | 368 | | | | 13,138 | |
Pfizer, Inc. | | | 17,785 | | | | 770,980 | |
Roche Holding AG | | | 2,132 | | | | 591,681 | |
Sanofi | | | 3,785 | | | | 315,629 | |
Takeda Pharmaceutical Co., Ltd. | | | 4,502 | | | | 181,174 | |
| | | | | | | | |
| | | | | | | 3,997,074 | |
| | | | | | | | |
| | | | | | | 4,914,927 | |
| | | | | | | | |
Consumer Staples – 4.4% | |
Beverages – 1.0% | |
Coca-Cola Co. (The) | | | 12,258 | | | | 555,778 | |
PepsiCo, Inc. | | | 4,291 | | | | 496,211 | |
| | | | | | | | |
| | | | | | | 1,051,989 | |
| | | | | | | | |
Food & Staples Retailing – 0.1% | |
ICA Gruppen AB | | | 190 | | | | 7,301 | |
Jeronimo Martins SGPS SA | | | 636 | | | | 9,573 | |
Koninklijke Ahold Delhaize NV | | | 3,826 | | | | 98,604 | |
Lawson, Inc. | | | 200 | | | | 12,110 | |
Lenta Ltd. (GDR)(a)(c) | | | 1 | | | | 3 | |
| | | | | | | | |
| | | | | | | 127,591 | |
| | | | | | | | |
| | |
| |
| 32 | AB TAX-MANAGED ALL MARKET INCOME PORTFOLIO | | abfunds.com |
PORTFOLIO OF INVESTMENTS(continued)
| | | | | | | | |
| Company | | Shares | | | U.S. $ Value | |
| |
Food Products – 1.1% | |
Archer-Daniels-Midland Co. | | | 1,758 | | | $ | 74,715 | |
Campbell Soup Co. | | | 560 | | | | 20,171 | |
General Mills, Inc. | | | 1,823 | | | | 85,918 | |
Marine Harvest ASA(c) | | | 1,219 | | | | 28,131 | |
Nestle SA | | | 9,364 | | | | 847,010 | |
Orkla ASA | | | 3,037 | | | | 23,938 | |
WH Group Ltd.(a) | | | 32,164 | | | | 28,522 | |
| | | | | | | | |
| | | | | | | 1,108,405 | |
| | | | | | | | |
Household Products – 0.9% | |
Kimberly-Clark Corp. | | | 1,058 | | | | 123,606 | |
Procter & Gamble Co. (The) | | | 7,552 | | | | 744,250 | |
| | | | | | | | |
| | | | | | | 867,856 | |
| | | | | | | | |
Personal Products – 0.4% | |
Unilever NV | | | 4,682 | | | | 253,566 | |
Unilever PLC | | | 3,431 | | | | 182,659 | |
| | | | | | | | |
| | | | | | | 436,225 | |
| | | | | | | | |
Tobacco – 0.9% | |
Altria Group, Inc. | | | 5,719 | | | | 299,733 | |
Imperial Brands PLC | | | 2,864 | | | | 95,435 | |
Japan Tobacco, Inc. | | | 4,023 | | | | 102,458 | |
Philip Morris International, Inc. | | | 4,716 | | | | 410,009 | |
Swedish Match AB | | | 524 | | | | 24,558 | |
| | | | | | | | |
| | | | | | | 932,193 | |
| | | | | | | | |
| | | | | | | 4,524,259 | |
| | | | | | | | |
Financials – 2.8% | |
Banks – 1.1% | |
Bank LeumiLe-Israel BM | | | 4,410 | | | | 29,167 | |
Bank of Nova Scotia (The) | | | 3,679 | | | | 204,477 | |
Bendigo & Adelaide Bank Ltd. | | | 769 | | | | 5,378 | |
BOC Hong Kong Holdings Ltd. | | | 13,616 | | | | 56,878 | |
Canadian Imperial Bank of Commerce | | | 1,313 | | | | 111,380 | |
DBS Group Holdings Ltd. | | | 5,678 | | | | 104,099 | |
Hang Seng Bank Ltd. | | | 2,276 | | | | 56,362 | |
Oversea-Chinese Banking Corp., Ltd. | | | 9,958 | | | | 81,242 | |
People’s United Financial, Inc. | | | 1,116 | | | | 19,820 | |
Regions Financial Corp. | | | 3,227 | | | | 52,923 | |
Royal Bank of Canada | | | 4,369 | | | | 341,466 | |
United Overseas Bank Ltd. | | | 4,228 | | | | 77,926 | |
| | | | | | | | |
| | | | | | | 1,141,118 | |
| | | | | | | | |
Capital Markets – 0.3% | |
3i Group PLC | | | 3,068 | | | | 38,528 | |
Amundi SA(a) | | | 192 | | | | 12,814 | |
ASX Ltd. | | | 578 | | | | 28,634 | |
CI Financial Corp. | | | 889 | | | | 12,565 | |
CME Group, Inc. – Class A | | | 1,093 | | | | 198,828 | |
| | |
| |
| abfunds.com | | AB TAX-MANAGED ALL MARKET INCOME PORTFOLIO | 33 |
PORTFOLIO OF INVESTMENTS(continued)
| | | | | | | | |
| Company | | Shares | | | U.S. $ Value | |
| |
Eaton Vance Corp. | | | 346 | | | $ | 14,480 | |
IGM Financial, Inc. | | | 603 | | | | 15,754 | |
Investec PLC | | | 2,074 | | | | 13,560 | |
Schroders PLC | | | 389 | | | | 14,120 | |
Singapore Exchange Ltd. | | | 2,352 | | | | 13,620 | |
| | | | | | | | |
| | | | | | | 362,903 | |
| | | | | | | | |
Diversified Financial Services – 0.0% | |
Standard Life Aberdeen PLC | | | 7,459 | | | | 24,417 | |
| | | | | | | | |
|
Insurance – 1.4% | |
Admiral Group PLC | | | 789 | | | | 22,847 | |
Allianz SE | | | 1,304 | | | | 290,267 | |
American Financial Group, Inc./OH | | | 233 | | | | 23,221 | |
Assicurazioni Generali SpA | | | 3,634 | | | | 64,797 | |
Baloise Holding AG | | | 135 | | | | 22,012 | |
Cincinnati Financial Corp. | | | 490 | | | | 42,542 | |
CNP Assurances | | | 598 | | | | 13,816 | |
Direct Line Insurance Group PLC | | | 3,771 | | | | 17,827 | |
Fidelity National Financial, Inc. | | | 852 | | | | 29,897 | |
Gjensidige Forsikring ASA | | | 760 | | | | 13,623 | |
Great-West Lifeco, Inc. | | | 1,064 | | | | 24,466 | |
Hannover Rueck SE | | | 177 | | | | 26,374 | |
Ia Financial Corp., Inc.(c) | | | 348 | | | | 13,352 | |
Insurance Australia Group Ltd. | | | 7,404 | | | | 38,623 | |
Legal & General Group PLC | | | 18,086 | | | | 67,300 | |
Manulife Financial Corp. | | | 5,904 | | | | 99,780 | |
Mapfre SA | | | 2,246 | | | | 6,341 | |
Medibank Pvt Ltd. | | | 9,393 | | | | 18,932 | |
MS&AD Insurance Group Holdings, Inc. | | | 1,324 | | | | 39,858 | |
Power Corp. of Canada | | | 1,025 | | | | 21,879 | |
Power Financial Corp. | | | 898 | | | | 20,042 | |
Principal Financial Group, Inc. | | | 832 | | | | 43,796 | |
Sampo Oyj – Class A | | | 1,393 | | | | 67,017 | |
SCOR SE | | | 637 | | | | 28,659 | |
Sun Life Financial, Inc. | | | 1,765 | | | | 66,820 | |
Swiss Life Holding AG(c) | | | 103 | | | | 44,820 | |
Tokio Marine Holdings, Inc. | | | 2,008 | | | | 98,150 | |
Tryg A/S | | | 382 | | | | 10,412 | |
Zurich Insurance Group AG | | | 459 | | | | 151,418 | |
| | | | | | | | |
| | | | | | | 1,428,888 | |
| | | | | | | | |
| | | | | | | 2,957,326 | |
| | | | | | | | |
Industrials – 2.5% | |
Aerospace & Defense – 0.3% | |
BAE Systems PLC | | | 9,204 | | | | 56,749 | |
Lockheed Martin Corp. | | | 783 | | | | 242,268 | |
Meggitt PLC | | | 2,733 | | | | 19,552 | |
| | |
| |
| 34 | AB TAX-MANAGED ALL MARKET INCOME PORTFOLIO | | abfunds.com |
PORTFOLIO OF INVESTMENTS(continued)
| | | | | | | | |
| Company | | Shares | | | U.S. $ Value | |
| |
Singapore Technologies Engineering Ltd. | | | 4,737 | | | $ | 13,076 | |
| | | | | | | | |
| | | | | | | 331,645 | |
| | | | | | | | |
Air Freight & Logistics – 0.3% | |
Deutsche Post AG | | | 2,898 | | | | 89,882 | |
Kuehne & Nagel International AG | | | 149 | | | | 19,411 | |
Royal Mail PLC | | | 3,163 | | | | 11,887 | |
United Parcel Service, Inc. – Class B | | | 2,104 | | | | 231,861 | |
| | | | | | | | |
| | | | | | | 353,041 | |
| | | | | | | | |
Airlines – 0.0% | |
easyJet PLC | | | 865 | | | | 14,074 | |
Japan Airlines Co., Ltd. | | | 472 | | | | 17,231 | |
| | | | | | | | |
| | | | | | | 31,305 | |
| | | | | | | | |
Building Products – 0.1% | |
Cie de Saint-Gobain | | | 1,700 | | | | 61,181 | |
| | | | | | | | |
|
Commercial Services & Supplies – 0.1% | |
Babcock International Group PLC | | | 1,752 | | | | 12,565 | |
Brambles Ltd. | | | 4,937 | | | | 41,213 | |
G4S PLC | | | 5,104 | | | | 14,205 | |
Societe BIC SA | | | 136 | | | | 12,860 | |
| | | | | | | | |
| | | | | | | 80,843 | |
| | | | | | | | |
Construction & Engineering – 0.2% | |
ACS Actividades de Construccion y Servicios SA | | | 746 | | | | 33,050 | |
Bouygues SA | | | 769 | | | | 29,063 | |
CIMIC Group Ltd. | | | 208 | | | | 7,405 | |
Skanska AB – Class B | | | 1,144 | | | | 20,614 | |
Vinci SA | | | 1,715 | | | | 163,681 | |
| | | | | | | | |
| | | | | | | 253,813 | |
| | | | | | | | |
Electrical Equipment – 0.5% | |
ABB Ltd. | | | 5,473 | | | | 107,758 | |
Eaton Corp. PLC | | | 1,340 | | | | 106,891 | |
Emerson Electric Co. | | | 1,946 | | | | 132,620 | |
Schneider Electric SE | | | 1,832 | | | | 142,357 | |
| | | | | | | | |
| | | | | | | 489,626 | |
| | | | | | | | |
Industrial Conglomerates – 0.3% | |
CK Hutchison Holdings Ltd. | | | 7,998 | | | | 85,099 | |
NWS Holdings Ltd. | | | 2,931 | | | | 7,101 | |
Siemens AG | | | 2,321 | | | | 253,554 | |
Smiths Group PLC | | | 1,149 | | | | 21,822 | |
| | | | | | | | |
| | | | | | | 367,576 | |
| | | | | | | | |
Machinery – 0.4% | |
Amada Holdings Co., Ltd. | | | 1,256 | | | | 13,223 | |
ANDRITZ AG | | | 258 | | | | 12,878 | |
Atlas Copco AB – Class A | | | 1,965 | | | | 53,257 | |
Atlas Copco AB – Class B SHS | | | 1,142 | | | | 28,657 | |
| | |
| |
| abfunds.com | | AB TAX-MANAGED ALL MARKET INCOME PORTFOLIO | 35 |
PORTFOLIO OF INVESTMENTS(continued)
| | | | | | | | |
| Company | | Shares | | | U.S. $ Value | |
| |
Cummins, Inc. | | | 455 | | | $ | 70,111 | |
Komatsu Ltd. | | | 2,703 | | | | 66,369 | |
Kone Oyj – Class B | | | 957 | | | | 46,758 | |
NSK Ltd. | | | 668 | | | | 6,161 | |
PACCAR, Inc. | | | 1,101 | | | | 74,648 | |
SKF AB – Class B | | | 1,360 | | | | 22,842 | |
Wartsila Oyj Abp | | | 1,353 | | | | 21,966 | |
| | | | | | | | |
| | | | | | | 416,870 | |
| | | | | | | | |
Professional Services – 0.1% | | | | | | | | |
Randstad NV | | | 437 | | | | 23,303 | |
SGS SA | | | 18 | | | | 45,832 | |
| | | | | | | | |
| | | | | | | 69,135 | |
| | | | | | | | |
Road & Rail – 0.0% | | | | | | | | |
Aurizon Holdings Ltd. | | | 7,064 | | | | 22,664 | |
ComfortDelGro Corp., Ltd. | | | 4,077 | | | | 7,196 | |
| | | | | | | | |
| | | | | | | 29,860 | |
| | | | | | | | |
Trading Companies & Distributors – 0.1% | | | | | | | | |
ITOCHU Corp. | | | 4,005 | | | | 71,941 | |
| | | | | | | | |
| | |
Transportation Infrastructure – 0.1% | | | | | | | | |
Aena SME SA(a) | | | 209 | | | | 37,274 | |
Auckland International Airport Ltd. | | | 3,438 | | | | 18,178 | |
SATS Ltd. | | | 1,813 | | | | 6,865 | |
| | | | | | | | |
| | | | | | | 62,317 | |
| | | | | | | | |
| | | | | | | 2,619,153 | |
| | | | | | | | |
Communication Services – 2.4% | | | | | | | | |
Diversified Telecommunication Services – 1.7% | | | | | |
AT&T, Inc. | | | 22,240 | | | | 692,109 | |
BCE, Inc. | | | 412 | | | | 18,321 | |
BT Group PLC | | | 24,519 | | | | 69,931 | |
Elisa Oyj | | | 374 | | | | 15,693 | |
HKT Trust & HKT Ltd. – Class SS | | | 13,845 | | | | 21,624 | |
Nippon Telegraph & Telephone Corp. | | | 2,025 | | | | 87,526 | |
Singapore Telecommunications Ltd. | | | 24,215 | | | | 53,928 | |
Spark New Zealand Ltd. | | | 4,368 | | | | 11,088 | |
Swisscom AG | | | 81 | | | | 37,473 | |
Telenor ASA | | | 2,329 | | | | 45,420 | |
TELUS Corp. | | | 540 | | | | 19,615 | |
Verizon Communications, Inc. | | | 12,536 | | | | 713,549 | |
| | | | | | | | |
| | | | | | | 1,786,277 | |
| | | | | | | | |
Media – 0.3% | | | | | | | | |
Axel Springer SE | | | 134 | | | | 7,651 | |
Eutelsat Communications SA | | | 648 | | | | 12,786 | |
Interpublic Group of Cos., Inc. (The) | | | 1,152 | | | | 26,531 | |
ITV PLC | | | 9,763 | | | | 16,960 | |
Omnicom Group, Inc. | | | 666 | | | | 50,416 | |
| | |
| |
| 36 | AB TAX-MANAGED ALL MARKET INCOME PORTFOLIO | | abfunds.com |
PORTFOLIO OF INVESTMENTS(continued)
| | | | | | | | |
| Company | | Shares | | | U.S. $ Value | |
| |
ProSiebenSat.1 Media SE | | | 649 | | | $ | 11,809 | |
Publicis Groupe SA | | | 674 | | | | 37,308 | |
RTL Group SA | | | 181 | | | | 10,200 | |
Shaw Communications, Inc. – Class B | | | 1,222 | | | | 25,202 | |
WPP PLC | | | 3,495 | | | | 38,315 | |
| | | | | | | | |
| | | | | | | 237,178 | |
| | | | | | | | |
Wireless Telecommunication Services – 0.4% | | | | | | | | |
1&1 Drillisch AG | | | 264 | | | | 10,454 | |
KDDI Corp. | | | 5,143 | | | | 124,305 | |
NTT DOCOMO, Inc. | | | 3,831 | | | | 89,185 | |
Rogers Communications, Inc. – Class B | | | 1,052 | | | | 58,126 | |
Vodafone Group PLC | | | 79,129 | | | | 140,956 | |
| | | | | | | | |
| | | | | | | 423,026 | |
| | | | | | | | |
| | | | | | | 2,446,481 | |
| | | | | | | | |
Energy – 2.0% | | | | | | | | |
Oil, Gas & Consumable Fuels – 2.0% | | | | | | | | |
Enagas SA | | | 661 | | | | 18,828 | |
Exxon Mobil Corp. | | | 12,928 | | | | 1,021,700 | |
Galp Energia SGPS SA | | | 1,479 | | | | 24,249 | |
Keyera Corp. | | | 774 | | | | 19,004 | |
Koninklijke Vopak NV | | | 135 | | | | 6,594 | |
Marathon Petroleum Corp. | | | 2,074 | | | | 128,609 | |
Phillips 66 | | | 1,358 | | | | 130,857 | |
Snam SpA | | | 7,121 | | | | 35,151 | |
TOTAL SA | | | 8,172 | | | | 465,139 | |
TransCanada Corp. | | | 2,752 | | | | 123,071 | |
Valero Energy Corp. | | | 1,305 | | | | 106,436 | |
| | | | | | | | |
| | | | | | | 2,079,638 | |
| | | | | | | | |
Utilities – 1.8% | | | | | | | | |
Electric Utilities – 1.1% | | | | | | | | |
Alliant Energy Corp. | | | 639 | | | | 29,311 | |
American Electric Power Co., Inc. | | | 1,458 | | | | 118,317 | |
CK Infrastructure Holdings Ltd. | | | 2,575 | | | | 21,458 | |
CLP Holdings Ltd. | | | 4,847 | | | | 57,433 | |
Duke Energy Corp. | | | 2,128 | | | | 190,796 | |
Edison International | | | 1,030 | | | | 61,687 | |
EDP – Energias de Portugal SA | | | 8,217 | | | | 30,128 | |
Endesa SA | | | 1,174 | | | | 29,573 | |
Eversource Energy | | | 923 | | | | 64,435 | |
Fortis, Inc./Canada | | | 1,320 | | | | 47,596 | |
Iberdrola SA | | | 19,231 | | | | 160,895 | |
OGE Energy Corp. | | | 531 | | | | 22,578 | |
Pinnacle West Capital Corp. | | | 325 | | | | 30,465 | |
Power Assets Holdings Ltd. | | | 4,254 | | | | 29,521 | |
PPL Corp. | | | 2,239 | | | | 72,029 | |
Red Electrica Corp. SA | | | 1,264 | | | | 27,309 | |
SSE PLC | | | 3,210 | | | | 50,515 | |
| | |
| |
| abfunds.com | | AB TAX-MANAGED ALL MARKET INCOME PORTFOLIO | 37 |
PORTFOLIO OF INVESTMENTS(continued)
| | | | | | | | |
| Company | | Shares | | | U.S. $ Value | |
| |
Terna Rete Elettrica Nazionale SpA | | | 3,992 | | | $ | 24,835 | |
Xcel Energy, Inc. | | | 1,537 | | | | 84,320 | |
| | | | | | | | |
| | | | | | | 1,153,201 | |
| | | | | | | | |
Multi-Utilities – 0.7% | | | | | | | | |
Ameren Corp. | | | 764 | | | | 54,427 | |
CMS Energy Corp. | | | 840 | | | | 45,696 | |
Consolidated Edison, Inc. | | | 962 | | | | 79,317 | |
DTE Energy Co. | | | 525 | | | | 64,869 | |
E.ON SE | | | 6,830 | | | | 75,121 | |
Innogy SE(a) | | | 507 | | | | 23,436 | |
National Grid PLC | | | 10,311 | | | | 116,200 | |
Public Service Enterprise Group, Inc. | | | 1,581 | | | | 92,979 | |
Sempra Energy | | | 855 | | | | 102,976 | |
WEC Energy Group, Inc. | | | 931 | | | | 71,017 | |
| | | | | | | | |
| | | | | | | 726,038 | |
| | | | | | | | |
| | | | | | | 1,879,239 | |
| | | | | | | | |
Consumer Discretionary – 1.7% | | | | | | | | |
Auto Components – 0.2% | | | | | | | | |
Bridgestone Corp. | | | 1,824 | | | | 72,251 | |
Cie Generale des Etablissements Michelin SCA – Class B | | | 590 | | | | 70,724 | |
Nokian Renkaat Oyj | | | 439 | | | | 15,537 | |
Sumitomo Rubber Industries Ltd. | | | 457 | | | | 5,891 | |
| | | | | | | | |
| | | | | | | 164,403 | |
| | | | | | | | |
Automobiles – 0.5% | | | | | | | | |
Bayerische Motoren Werke AG | | | 961 | | | | 81,234 | |
Bayerische Motoren Werke AG (Preference Shares) | | | 169 | | | | 12,496 | |
Daimler AG | | | 2,720 | | | | 162,846 | |
General Motors Co. | | | 3,852 | | | | 152,077 | |
Nissan Motor Co., Ltd. | | | 6,548 | | | | 56,740 | |
Subaru Corp. | | | 1,867 | | | | 47,569 | |
Yamaha Motor Co., Ltd. | | | 819 | | | | 16,683 | |
| | | | | | | | |
| | | | | | | 529,645 | |
| | | | | | | | |
Distributors – 0.0% | | | | | | | | |
Genuine Parts Co. | | | 469 | | | | 51,018 | |
| | | | | | | | |
| | |
Diversified Consumer Services – 0.0% | | | | | | | | |
H&R Block, Inc. | | | 712 | | | | 17,195 | |
| | | | | | | | |
| | |
Hotels, Restaurants & Leisure – 0.3% | | | | | | | | |
Carnival Corp. | | | 1,331 | | | | 76,878 | |
Carnival PLC | | | 508 | | | | 28,483 | |
Crown Resorts Ltd. | | | 710 | | | | 5,778 | |
Darden Restaurants, Inc. | | | 397 | | | | 44,508 | |
Flight Centre Travel Group Ltd. | | | 193 | | | | 6,270 | |
GVC Holdings PLC | | | 1,608 | | | | 13,988 | |
Las Vegas Sands Corp. | | | 1,151 | | | | 70,706 | |
| | |
| |
| 38 | AB TAX-MANAGED ALL MARKET INCOME PORTFOLIO | | abfunds.com |
PORTFOLIO OF INVESTMENTS(continued)
| | | | | | | | |
| Company | | Shares | | | U.S. $ Value | |
| |
Sands China Ltd. | | | 7,638 | | | $ | 38,098 | |
Sodexo SA | | | 281 | | | | 30,869 | |
TUI AG | | | 1,306 | | | | 13,857 | |
| | | | | | | �� | |
| | | | | | | 329,435 | |
| | | | | | | | |
Household Durables – 0.2% | | | | | | | | |
Barratt Developments PLC | | | 2,752 | | | | 21,838 | |
Electrolux AB – Class B | | | 683 | | | | 17,853 | |
Garmin Ltd. | | | 343 | | | | 28,802 | |
Iida Group Holdings Co., Ltd. | | | 673 | | | | 12,297 | |
Leggett & Platt, Inc. | | | 342 | | | | 15,534 | |
Persimmon PLC | | | 933 | | | | 30,135 | |
Sekisui House Ltd. | | | 2,060 | | | | 31,015 | |
Taylor Wimpey PLC | | | 9,380 | | | | 22,550 | |
Whirlpool Corp. | | | 189 | | | | 26,745 | |
| | | | | | | | |
| | | | | | | 206,769 | |
| | | | | | | | |
Multiline Retail – 0.3% | | | | | | | | |
Harvey Norman Holdings Ltd. | | | 2,376 | | | | 6,073 | |
Kohl’s Corp. | | | 535 | | | | 36,129 | |
Macy’s, Inc. | | | 970 | | | | 24,046 | |
Marks & Spencer Group PLC | | | 5,528 | | | | 19,977 | |
Next PLC | | | 443 | | | | 29,877 | |
Nordstrom, Inc. | | | 325 | | | | 15,366 | |
Target Corp. | | | 1,490 | | | | 108,234 | |
Wesfarmers Ltd. | | | 3,413 | | | | 80,459 | |
| | | | | | | | |
| | | | | | | 320,161 | |
| | | | | | | | |
Specialty Retail – 0.1% | | | | | | | | |
Gap, Inc. (The) | | | 648 | | | | 16,459 | |
Kingfisher PLC | | | 6,591 | | | | 21,185 | |
L Brands, Inc. | | | 690 | | | | 18,037 | |
| | | | | | | | |
| | | | | | | 55,681 | |
| | | | | | | | |
Textiles, Apparel & Luxury Goods – 0.1% | | | | | | | | |
Hanesbrands, Inc. | | | 1,118 | | | | 20,784 | |
Tapestry, Inc. | | | 938 | | | | 32,774 | |
Yue Yuen Industrial Holdings Ltd. | | | 1,841 | | | | 6,194 | |
| | | | | | | | |
| | | | | | | 59,752 | |
| | | | | | | | |
| | | | | | | 1,734,059 | |
| | | | | | | | |
Information Technology – 1.4% | | | | | | | | |
Communications Equipment – 0.7% | | | | | | | | |
Cisco Systems, Inc. | | | 13,707 | | | | 709,611 | |
| | | | | | | | |
| | |
Electronic Equipment, Instruments & Components – 0.0% | | | | | | | | |
Venture Corp., Ltd. | | | 526 | | | | 6,916 | |
| | | | | | | | |
| | |
IT Services – 0.5% | | | | | | | | |
International Business Machines Corp. | | | 2,769 | | | | 382,482 | |
| | |
| |
| abfunds.com | | AB TAX-MANAGED ALL MARKET INCOME PORTFOLIO | 39 |
PORTFOLIO OF INVESTMENTS(continued)
| | | | | | | | |
| Company | | Shares | | | U.S. $ Value | |
| |
Paychex, Inc. | | | 981 | | | $ | 75,557 | |
Western Union Co. (The) – Class W | | | 1,355 | | | | 24,214 | |
| | | | | | | | |
| | | | | | | 482,253 | |
| | | | | | | | |
Semiconductors & Semiconductor Equipment – 0.1% | | | | | | | | |
Maxim Integrated Products, Inc. | | | 811 | | | | 44,143 | |
Tokyo Electron Ltd. | | | 459 | | | | 62,747 | |
| | | | | | | | |
| | | | | | | 106,890 | |
| | | | | | | | |
Technology Hardware, Storage & Peripherals – 0.1% | | | | | | | | |
Canon, Inc. | | | 2,971 | | | | 85,335 | |
Seagate Technology PLC | | | 816 | | | | 37,993 | |
| | | | | | | | |
| | | | | | | 123,328 | |
| | | | | | | | |
| | | | | | | 1,428,998 | |
| | | | | | | | |
Materials – 1.0% | | | | | | | | |
Chemicals – 0.5% | | | | | | | | |
BASF SE | | | 2,787 | | | | 212,139 | |
Covestro AG(a) | | | 563 | | | | 32,056 | |
EMS-Chemie Holding AG | | | 24 | | | | 13,838 | |
Evonik Industries AG | | | 582 | | | | 16,390 | |
JSR Corp. | | | 383 | | | | 6,369 | |
LyondellBasell Industries NV – Class A | | | 1,020 | | | | 87,230 | |
Mitsubishi Chemical Holdings Corp. | | | 3,747 | | | | 27,710 | |
Mitsubishi Gas Chemical Co., Inc. | | | 803 | | | | 12,295 | |
Nutrien Ltd. | | | 1,885 | | | | 102,605 | |
Solvay SA | | | 230 | | | | 25,731 | |
Sumitomo Chemical Co., Ltd. | | | 4,361 | | | | 21,684 | |
| | | | | | | | |
| | | | | | | 558,047 | |
| | | | | | | | |
Construction Materials – 0.0% | | | | | | | | |
Boral Ltd. | | | 3,431 | | | | 12,108 | |
| | | | | | | | |
| | |
Containers & Packaging – 0.1% | | | | | | | | |
Amcor Ltd./Australia | | | 3,673 | | | | 39,194 | |
International Paper Co. | | | 1,210 | | | | 55,442 | |
| | | | | | | | |
| | | | | | | 94,636 | |
| | | | | | | | |
Metals & Mining – 0.3% | | | | | | | | |
Boliden AB | | | 801 | | | | 21,899 | |
Fortescue Metals Group Ltd. | | | 4,494 | | | | 19,218 | |
Norsk Hydro ASA | | | 2,899 | | | | 11,965 | |
Rio Tinto Ltd. | | | 1,222 | | | | 83,287 | |
Rio Tinto PLC | | | 3,560 | | | | 204,510 | |
voestalpine AG | | | 377 | | | | 11,655 | |
| | | | | | | | |
| | | | | | | 352,534 | |
| | | | | | | | |
Paper & Forest Products – 0.1% | | | | | | | | |
Stora Enso Oyj – Class R | | | 1,697 | | | | 22,729 | |
| | |
| |
| 40 | AB TAX-MANAGED ALL MARKET INCOME PORTFOLIO | | abfunds.com |
PORTFOLIO OF INVESTMENTS(continued)
| | | | | | | | |
| Company | | Shares | | | U.S. $ Value | |
| |
UPM-Kymmene Oyj | | | 1,579 | | | $ | 47,613 | |
| | | | | | | | |
| | | | | | | 70,342 | |
| | | | | | | | |
| | | | | | | 1,087,667 | |
| | | | | | | | |
Real Estate – 0.3% | | | | | | | | |
Real Estate Management & Development – 0.3% | | | | | | | | |
Daito Trust Construction Co., Ltd. | | | 260 | | | | 36,033 | |
First Capital Realty, Inc. | | | 800 | | | | 13,022 | |
Hang Lung Properties Ltd. | | | 6,171 | | | | 14,570 | |
Henderson Land Development Co., Ltd. | | | 4,761 | | | | 26,919 | |
LendLease Group | | | 1,999 | | | | 18,271 | |
New World Development Co., Ltd. | | | 16,979 | | | | 27,108 | |
Sino Land Co., Ltd. | | | 10,511 | | | | 19,568 | |
Sun Hung Kai Properties Ltd. | | | 4,940 | | | | 81,904 | |
Swire Properties Ltd. | | | 3,438 | | | | 13,801 | |
Swiss Prime Site AG(c) | | | 242 | | | | 20,400 | |
Wharf Holdings Ltd. (The) | | | 2,100 | | | | 6,569 | |
| | | | | | | | |
| | | | | | | 278,165 | |
| | | | | | | | |
Total Common Stocks
(cost $24,798,256) | | | | | | | 25,949,912 | |
| | | | | | | | |
| | | | | | | | |
PREFERRED STOCKS – 6.5% | | | | | | | | |
Real Estate – 6.5% | | | | | | | | |
Diversified REITs – 1.1% | | | | | | | | |
Colony Capital, Inc.
Series H
7.125% | | | 8,400 | | | | 177,828 | |
Colony Capital, Inc.
Series I
7.15% | | | 2,525 | | | | 54,363 | |
Global Net Lease, Inc.
Series A
7.25% | | | 5,900 | | | | 151,335 | |
Investors Real Estate Trust
Series C
6.625% | | | 1,675 | | | | 41,038 | |
PS Business Parks, Inc.
Series X
5.25% | | | 10,000 | | | | 239,500 | |
Spirit Realty Capital, Inc.
Series A
6.00% | | | 6,800 | | | | 156,536 | |
VEREIT, Inc.
Series F
6.70% | | | 11,250 | | | | 279,900 | |
| | |
| |
| abfunds.com | | AB TAX-MANAGED ALL MARKET INCOME PORTFOLIO | 41 |
PORTFOLIO OF INVESTMENTS(continued)
| | | | | | | | |
| Company | | Shares | | | U.S. $ Value | |
| |
Vornado Realty Trust
Series K
5.70% | | | 1,600 | | | $ | 40,000 | |
| | | | | | | | |
| | | | | | | 1,140,500 | |
| | | | | | | | |
Hotel & Resort REITs – 1.2% | | | | | | | | |
Ashford Hospitality Trust, Inc.
Series F
7.375% | | | 9,475 | | | | 211,197 | |
Ashford Hospitality Trust, Inc.
Series G
7.375% | | | 1,000 | | | | 21,500 | |
Hersha Hospitality Trust
Series C
6.875% | | | 1,000 | | | | 23,910 | |
Hersha Hospitality Trust
Series E
6.50% | | | 12,600 | | | | 294,084 | |
Pebblebrook Hotel Trust
Series C
6.50% | | | 2,600 | | | | 66,430 | |
Pebblebrook Hotel Trust
Series F
6.30% | | | 5,600 | | | | 138,936 | |
Summit Hotel Properties, Inc.
Series E
6.25% | | | 10,500 | | | | 234,150 | |
Sunstone Hotel Investors, Inc.
Series E
6.95% | | | 8,000 | | | | 213,200 | |
| | | | | | | | |
| | | | | | | 1,203,407 | |
| | | | | | | | |
Industrial REITs – 0.4% | | | | | | | | |
Monmouth Real Estate Investment Corp.
Series C
6.125% | | | 9,500 | | | | 228,380 | |
Rexford Industrial Realty, Inc.
Series A
5.875% | | | 2,250 | | | | 54,720 | |
Rexford Industrial Realty, Inc.
Series B
5.875% | | | 6,850 | | | | 166,832 | |
| | | | | | | | |
| | | | | | | 449,932 | |
| | | | | | | | |
Office REITs – 0.2% | | | | | | | | |
Boston Properties, Inc.
Series B
5.25% | | | 3,100 | | | | 76,880 | |
| | |
| |
| 42 | AB TAX-MANAGED ALL MARKET INCOME PORTFOLIO | | abfunds.com |
PORTFOLIO OF INVESTMENTS(continued)
| | | | | | | | |
| Company | | Shares | | | U.S. $ Value | |
| |
SL Green Realty Corp.
Series I
6.50% | | | 7,100 | | | $ | 184,103 | |
| | | | | | | | |
| | | | | | | 260,983 | |
| | | | | | | | |
Residential REITs – 0.9% | | | | | | | | |
American Homes 4 Rent
Series E
6.35% | | | 4,725 | | | | 121,102 | |
American Homes 4 Rent
Series F
5.875% | | | 9,600 | | | | 235,680 | |
Apartment Investment & Management Co.
Series A
6.875% | | | 9,400 | | | | 245,622 | |
UMH Properties, Inc.
Series C
6.75% | | | 10,300 | | | | 262,959 | |
UMH Properties, Inc.
Series D
6.375% | | | 2,000 | | | | 46,700 | |
| | | | | | | | |
| | | | | | | 912,063 | |
| | | | | | | | |
Retail REITs – 1.8% | | | | | | | | |
Brookfield Property REIT, Inc.
Series A
6.375% | | | 11,025 | | | | 271,105 | |
Cedar Realty Trust, Inc.
Series C
6.50% | | | 9,475 | | | | 194,616 | |
Kimco Realty Corp.
Series J
5.50% | | | 10,200 | | | | 246,024 | |
Pennsylvania Real Estate Investment Trust
Series D
6.875% | | | 3,000 | | | | 61,800 | |
Saul Centers, Inc.
Series C
6.875% | | | 375 | | | | 9,863 | |
Saul Centers, Inc.
Series D
6.125% | | | 10,000 | | | | 235,300 | |
SITE Centers Corp.
Series A
6.375% | | | 15,800 | | | | 390,734 | |
Taubman Centers, Inc.
Series J
6.50% | | | 7,050 | | | | 179,070 | |
Urstadt Biddle Properties, Inc.
Series G
6.75% | | | 1,325 | | | | 33,622 | |
| | |
| |
| abfunds.com | | AB TAX-MANAGED ALL MARKET INCOME PORTFOLIO | 43 |
PORTFOLIO OF INVESTMENTS(continued)
| | | | | | | | |
| Company | | Shares | | | U.S. $ Value | |
| |
Urstadt Biddle Properties, Inc.
Series H
6.25% | | | 8,375 | | | $ | 213,981 | |
| | | | | | | | |
| | | | | | | 1,836,115 | |
| | | | | | | | |
Specialized REITs – 0.9% | | | | | | | | |
Digital Realty Trust, Inc.
Series C
6.625% | | | 9,100 | | | | 242,606 | |
Digital Realty Trust, Inc.
Series G
5.875% | | | 3,650 | | | | 95,484 | |
EPR Properties
Series G
5.75% | | | 9,225 | | | | 209,869 | |
National Storage Affiliates Trust
Series A
6.00% | | | 3,000 | | | | 72,420 | |
Public Storage
Series C
5.125% | | | 11,200 | | | | 266,000 | |
| | | | | | | | |
| | | | | | | 886,379 | |
| | | | | | | | |
Total Preferred Stocks
(cost $6,920,480) | | | | | | | 6,689,379 | |
| | | | | | | | |
| | | | | | | | |
INVESTMENT COMPANIES – 3.7% | | | | | | | | |
Funds and Investment Trusts – 3.7%(h) | | | | | | | | |
Invesco KBW Premium Yield Equity REIT ETF | | | 9,208 | | | | 279,739 | |
iShares International Developed Real Estate ETF | | | 4,416 | | | | 129,654 | |
iShares Mortgage Real Estate ETF | | | 40,020 | | | | 1,730,065 | |
JPMorgan Alerian MLP Index ETN | | | 61,197 | | | | 1,507,894 | |
Vanguard Real Estate ETF | | | 2,068 | | | | 173,691 | |
| | | | | | | | |
| | |
Total Investment Companies
(cost $4,091,336) | | | | | | | 3,821,043 | |
| | | | | | | | |
| | |
| | | Principal
Amount
(000) | | | | |
CORPORATES –NON-INVESTMENT GRADE – 0.1% | | | | | | | | |
Industrial – 0.1% | | | | | | | | |
Energy – 0.1% | | | | | | | | |
California Resources Corp.
8.00%, 12/15/22(a)
(cost $88,811) | | $ | 110 | | | | 87,883 | |
| | | | | | | | |
| | |
| |
| 44 | AB TAX-MANAGED ALL MARKET INCOME PORTFOLIO | | abfunds.com |
PORTFOLIO OF INVESTMENTS(continued)
| | | | | | | | |
| Company | | Principal
Amount
(000) | | | U.S. $ Value | |
| |
SHORT-TERM INVESTMENTS – 0.4% | | | | | | | | |
Short-Term Municipal Notes – 0.4% | | | | | | | | |
County of Richland SC
Series 2019A
3.00%, 2/27/20
(cost $379,580) | | $ | 375 | | | $ | 379,575 | |
| | | | | | | | |
| | |
Total Investments – 90.1%
(cost $91,629,868) | | | | | | | 93,305,713 | |
Other assets less liabilities – 9.9% | | | | | | | 10,308,713 | |
| | | | | | | | |
| | |
Net Assets – 100.0% | | | | | | $ | 103,614,426 | |
| | | | | | | | |
FUTURES (see Note D)
| | | | | | | | | | | | | | | | | | | | | | | | |
| Description | | Number of
Contracts | | | Expiration
Month | | | Notional
(000) | | | Original
Value | | | Value at
February 28,
2019 | | | Unrealized
Appreciation/
(Depreciation) | |
Purchased Contracts | | | | | | | | | | | | | | | | | |
Amsterdam Index Futures | | | 2 | | | | March 2019 | | | EUR | 0 | *** | | $ | 242,350 | | | $ | 246,153 | | | $ | 3,803 | |
Dax Index Futures | | | 13 | | | | March 2019 | | | EUR | 0 | *** | | | 747,085 | | | | 774,683 | | | | 27,598 | |
Euro STOXX 50 Index Futures | | | 2 | | | | March 2019 | | | EUR | 0 | *** | | | 613,992 | | | | 655,171 | | | | 41,179 | |
Euro-CAC40 10 Futures | | | 45 | | | | March 2019 | | | EUR | 0 | *** | | | 1,565,128 | | | | 1,688,089 | | | | 122,961 | |
FTSE 100 Index Futures | | | 6 | | | | March 2019 | | | GBP | 0 | *** | | | 532,329 | | | | 563,075 | | | | 30,746 | |
FTSE/MIB Index Futures | | | 1 | | | | March 2019 | | | EUR | 0 | *** | | | 105,956 | | | | 117,470 | | | | 11,514 | |
IBEX 35 Index Futures | | | 3 | | | | March 2019 | | | EUR | 0 | *** | | | 306,182 | | | | 317,079 | | | | 10,897 | |
Mini MSCI Emerging Markets Futures | | | 19 | | | | March 2019 | | | USD | 1 | | | | 938,438 | | | | 994,365 | | | | 55,927 | |
OMXS30 Index Futures | | | 59 | | | | March 2019 | | | SEK | 6 | | | | 987,501 | | | | 1,004,201 | | | | 16,700 | |
S&P 500E-Mini Futures | | | 53 | | | | March 2019 | | | USD | 3 | | | | 7,020,876 | | | | 7,379,455 | | | | 358,579 | |
S&P TSX 60 Index Futures | | | 4 | | | | March 2019 | | | CAD | 1 | | | | 537,693 | | | | 578,988 | | | | 41,295 | |
SPI 200 Futures | | | 4 | | | | March 2019 | | | AUD | 0 | *** | | | 400,364 | | | | 436,179 | | | | 35,815 | |
Topix Index Futures | | | 7 | | | | March 2019 | | | JPY | 70 | | | | 988,135 | | | | 1,008,568 | | | | 20,433 | |
| | |
| |
| abfunds.com | | AB TAX-MANAGED ALL MARKET INCOME PORTFOLIO | 45 |
PORTFOLIO OF INVESTMENTS(continued)
| | | | | | | | | | | | | | | | | | | | | | | | |
| Description | | Number of
Contracts | | | Expiration
Month | | | Notional
(000) | | | Original
Value | | | Value at
February 28,
2019 | | | Unrealized
Appreciation/
(Depreciation) | |
U.S.T-Note 10 Yr (CBT) Futures | | | 75 | | | | June 2019 | | | USD | 7,500 | | | $ | 9,191,764 | | | $ | 9,150,000 | | | $ | (41,764 | ) |
| | | | |
Sold Contracts | | | | | | | | | | | | | | | | | |
10 Yr Australian Bond Futures | | | 22 | | | | March 2019 | | | AUD | 2,200 | | | | 2,046,623 | | | | 2,106,962 | | | | (60,339 | ) |
10 Yr Canadian Bond Futures | | | 12 | | | | June 2019 | | | CAD | 1,200 | | | | 1,242,887 | | | | 1,237,524 | | | | 5,363 | |
Euro-Bund Futures | | | 4 | | | | March 2019 | | | EUR | 400 | | | | 753,351 | | | | 752,127 | | | | 1,224 | |
Hang Seng Index Futures | | | 3 | | | | March 2019 | | | HKD | 0 | *** | | | 553,213 | | | | 547,775 | | | | 5,438 | |
MSCI Singapore Index ETS Futures | | | 27 | | | | March 2019 | | | SGD | 3 | | | | 730,120 | | | | 718,536 | | | | 11,584 | |
S&P 500E-Mini Futures | | | 10 | | | | March 2019 | | | USD | 1 | | | | 1,328,188 | | | | 1,392,350 | | | | (64,162 | ) |
S&P TSX 60 Index Futures | | | 5 | | | | March 2019 | | | CAD | 1 | | | | 691,153 | | | | 723,736 | | | | (32,583 | ) |
SPI 200 Futures | | | 2 | | | | March 2019 | | | AUD | 0 | *** | | | 195,990 | | | | 218,090 | | | | (22,100 | ) |
| | | | | | | | | | | | | | | | | | | | | | | | |
| | | | | | | | | | | | | | | | | | | | | | $ | 580,108 | |
| | | | | | | | | | | | | | | | | | | | | | | | |
FORWARD CURRENCY EXCHANGE CONTRACTS (see Note D)
| | | | | | | | | | | | | | | | |
| Counterparty | | Contracts to
Deliver
(000) | | | In Exchange
For
(000) | | | Settlement
Date | | | Unrealized
Appreciation/
(Depreciation) | |
Bank of America, NA | | COP | 850,545 | | | USD | 273 | | | | 3/15/19 | | | $ | (3,130 | ) |
Barclays Bank PLC | | BRL | 1,522 | | | USD | 407 | | | | 3/06/19 | | | | 1,913 | |
Barclays Bank PLC | | USD | 408 | | | BRL | 1,522 | | | | 3/06/19 | | | | (2,840 | ) |
Barclays Bank PLC | | PHP | 50,631 | | | USD | 960 | | | | 3/14/19 | | | | (15,729 | ) |
Barclays Bank PLC | | USD | 318 | | | PHP | 16,708 | | | | 3/14/19 | | | | 3,559 | |
Barclays Bank PLC | | AUD | 606 | | | USD | 438 | | | | 3/15/19 | | | | 8,057 | |
Barclays Bank PLC | | EUR | 932 | | | USD | 1,073 | | | | 3/15/19 | | | | 11,323 | |
Barclays Bank PLC | | JPY | 229,216 | | | USD | 2,117 | | | | 3/15/19 | | | | 58,545 | |
Barclays Bank PLC | | NOK | 5,399 | | | USD | 633 | | | | 3/15/19 | | | | 1,912 | |
Barclays Bank PLC | | USD | 526 | | | MXN | 10,825 | | | | 3/15/19 | | | | 34,243 | |
Barclays Bank PLC | | USD | 596 | | | NOK | 4,990 | | | | 3/15/19 | | | | (12,711 | ) |
Barclays Bank PLC | | USD | 862 | | | SEK | 7,640 | | | | 3/15/19 | | | | (33,975 | ) |
Barclays Bank PLC | | USD | 130 | | | INR | 9,176 | | | | 3/18/19 | | | | (651 | ) |
Barclays Bank PLC | | BRL | 1,522 | | | USD | 407 | | | | 4/02/19 | | | | 2,754 | |
Barclays Bank PLC | | CNY | 3,736 | | | USD | 552 | | | | 4/17/19 | | | | (5,825 | ) |
Barclays Bank PLC | | USD | 372 | | | IDR | 5,247,625 | | | | 5/09/19 | | | | (4,623 | ) |
Barclays Bank PLC | | USD | 944 | | | IDR | 13,624,616 | | | | 5/09/19 | | | | 9,983 | |
Barclays Bank PLC | | KRW | 808,168 | | | USD | 718 | | | | 5/16/19 | | | | (1,120 | ) |
BNP Paribas SA | | USD | 517 | | | AUD | 717 | | | | 3/15/19 | | | | (8,362 | ) |
BNP Paribas SA | | USD | 629 | | | GBP | 490 | | | | 3/15/19 | | | | 21,117 | |
BNP Paribas SA | | USD | 1,106 | | | NZD | 1,644 | | | | 3/15/19 | | | | 14,183 | |
Citibank, NA | | USD | 675 | | | RUB | 44,544 | | | | 3/07/19 | | | | 635 | |
Citibank, NA | | USD | 117 | | | TWD | 3,601 | | | | 3/14/19 | | | | (333 | ) |
Citibank, NA | | CLP | 523,909 | | | USD | 784 | | | | 3/15/19 | | | | (15,272 | ) |
| | |
| |
| 46 | AB TAX-MANAGED ALL MARKET INCOME PORTFOLIO | | abfunds.com |
PORTFOLIO OF INVESTMENTS(continued)
| | | | | | | | | | | | | | | | |
| Counterparty | | Contracts to
Deliver
(000) | | | In Exchange
For
(000) | | | Settlement
Date | | | Unrealized
Appreciation/
(Depreciation) | |
Citibank, NA | | USD | 891 | | | EUR | 775 | | | | 3/15/19 | | | $ | (8,495 | ) |
Citibank, NA | | EUR | 939 | | | USD | 1,082 | | | | 6/17/19 | | | | 4,090 | |
Credit Suisse International | | GBP | 490 | | | USD | 617 | | | | 3/15/19 | | | | (32,919 | ) |
Credit Suisse International | | USD | 579 | | | SEK | 5,290 | | | | 3/15/19 | | | | (6,277 | ) |
Credit Suisse International | | USD | 1,014 | | | CAD | 1,333 | | | | 6/17/19 | | | | 1,042 | |
Deutsche Bank AG | | USD | 554 | | | INR | 39,522 | | | | 3/18/19 | | | | 3,120 | |
Goldman Sachs Bank USA | | BRL | 211 | | | USD | 56 | | | | 3/06/19 | | | | (384 | ) |
Goldman Sachs Bank USA | | BRL | 1,311 | | | USD | 353 | | | | 3/06/19 | | | | 3,885 | |
Goldman Sachs Bank USA | | USD | 407 | | | BRL | 1,522 | | | | 3/06/19 | | | | (1,913 | ) |
Goldman Sachs Bank USA | | USD | 733 | | | RUB | 48,932 | | | | 3/07/19 | | | | 9,253 | |
Goldman Sachs Bank USA | | USD | 621 | | | PHP | 32,771 | | | | 3/14/19 | | | | 10,826 | |
Goldman Sachs Bank USA | | USD | 149 | | | TWD | 4,555 | | | | 3/14/19 | | | | (906 | ) |
Goldman Sachs Bank USA | | USD | 731 | | | CAD | 979 | | | | 3/15/19 | | | | 13,098 | |
JPMorgan Chase Bank, NA | | SEK | 9,238 | | | USD | 1,032 | | | | 3/15/19 | | | | 31,277 | |
Morgan Stanley & Co., Inc. | | TWD | 23,392 | | | USD | 770 | | | | 3/14/19 | | | | 10,811 | |
Morgan Stanley & Co., Inc. | | COP | 580,076 | | | USD | 184 | | | | 3/15/19 | | | | (3,904 | ) |
Morgan Stanley & Co., Inc. | | USD | 1,331 | | | JPY | 149,096 | | | | 3/15/19 | | | | 7,294 | |
Natwest Markets PLC | | USD | 609 | | | PHP | 32,405 | | | | 3/14/19 | | | | 15,034 | |
Natwest Markets PLC | | PEN | 570 | | | USD | 171 | | | | 3/15/19 | | | | (1,345 | ) |
Standard Chartered Bank | | CNY | 5,005 | | | USD | 737 | | | | 4/17/19 | | | | (10,291 | ) |
State Street Bank & Trust Co. | | AUD | 380 | | | USD | 272 | | | | 3/15/19 | | | | 2,612 | |
State Street Bank & Trust Co. | | CAD | 751 | | | USD | 564 | | | | 3/15/19 | | | | (6,512 | ) |
State Street Bank & Trust Co. | | CHF | 335 | | | USD | 342 | | | | 3/15/19 | | | | 5,742 | |
State Street Bank & Trust Co. | | CZK | 6,394 | | | USD | 283 | | | | 3/15/19 | | | | (814 | ) |
State Street Bank & Trust Co. | | EUR | 28 | | | USD | 32 | | | | 3/15/19 | | | | 251 | |
State Street Bank & Trust Co. | | NOK | 1,585 | | | USD | 186 | | | | 3/15/19 | | | | 369 | |
State Street Bank & Trust Co. | | NZD | 888 | | | USD | 613 | | | | 3/15/19 | | | | 7,725 | |
State Street Bank & Trust Co. | | PLN | 1,368 | | | USD | 365 | | | | 3/15/19 | | | | 3,119 | |
State Street Bank & Trust Co. | | SEK | 4,713 | | | USD | 526 | | | | 3/15/19 | | | | 15,260 | |
State Street Bank & Trust Co. | | THB | 10,355 | | | USD | 317 | | | | 3/15/19 | | | | (12,063 | ) |
State Street Bank & Trust Co. | | USD | 575 | | | AUD | 801 | | | | 3/15/19 | | | | (6,917 | ) |
State Street Bank & Trust Co. | | USD | 132 | | | CAD | 177 | | | | 3/15/19 | | | | 2,365 | |
State Street Bank & Trust Co. | | USD | 222 | | | CZK | 5,020 | | | | 3/15/19 | | | | 710 | |
State Street Bank & Trust Co. | | USD | 212 | | | EUR | 186 | | | | 3/15/19 | | | | (530 | ) |
State Street Bank & Trust Co. | | USD | 572 | | | MXN | 11,880 | | | | 3/15/19 | | | | 43,558 | |
State Street Bank & Trust Co. | | USD | 398 | | | NOK | 3,373 | | | | 3/15/19 | | | | (3,987 | ) |
State Street Bank & Trust Co. | | USD | 456 | | | NZD | 678 | | | | 3/15/19 | | | | 5,901 | |
State Street Bank & Trust Co. | | USD | 113 | | | SEK | 1,021 | | | | 3/15/19 | | | | (2,586 | ) |
State Street Bank & Trust Co. | | USD | 197 | | | THB | 6,290 | | | | 3/15/19 | | | | 2,775 | |
State Street Bank & Trust Co. | | USD | 436 | | | TRY | 2,449 | | | | 3/15/19 | | | | 19,637 | |
State Street Bank & Trust Co. | | USD | 154 | | | ZAR | 2,082 | | | | 3/15/19 | | | | (6,609 | ) |
State Street Bank & Trust Co. | | ZAR | 2,082 | | | USD | 143 | | | | 3/15/19 | | | | (4,210 | ) |
State Street Bank & Trust Co. | | HUF | 71,174 | | | USD | 257 | | | | 6/17/19 | | | | (1,429 | ) |
State Street Bank & Trust Co. | | NOK | 2,008 | | | USD | 237 | | | | 6/17/19 | | | | 1,670 | |
State Street Bank & Trust Co. | | THB | 6,754 | | | USD | 217 | | | | 6/17/19 | | | | 1,844 | |
State Street Bank & Trust Co. | | USD | 235 | | | MXN | 4,572 | | | | 6/17/19 | | | | (1,363 | ) |
| | | | | | | | | | | | | | | | |
| | | | | | | | | | | | | | $ | 173,467 | |
| | | | | | | | | | | | | | | | |
| | |
| |
| abfunds.com | | AB TAX-MANAGED ALL MARKET INCOME PORTFOLIO | 47 |
PORTFOLIO OF INVESTMENTS(continued)
CALL OPTIONS WRITTEN (see Note D)
| | | | | | | | | | | | | | | | | | | | | | | | | | |
| Description | | Counterparty | | Contracts | | | Exercise
Price | | | Expiration
Month | | | Notional
(000) | | | Premiums
Received | | | U.S. $
Value | |
Euro STOXX 50 Index(i) | | Citibank, NA | | | 270 | | | EUR | 3,250.00 | | | | March 2019 | | | EUR | 878 | | | $ | 13,890 | | | $ | (17,395 | ) |
FTSE 100 Index(i) | | Citibank, NA | | | 50 | | | GBP | 7,200.00 | | | | March 2019 | | | GBP | 360 | | | | 3,677 | | | | (1,103 | ) |
Nikkei 225 Index(i) | | Goldman Sachs International | | | 3,000 | | | JPY | 21,375.00 | | | | March 2019 | | | JPY | 64,125 | | | | 8,228 | | | | (4,741 | ) |
S&P 500 Index(i) | | Goldman Sachs International | | | 1,100 | | | USD | 2,790.00 | | | | March 2019 | | | USD | 3,069 | | | | 43,648 | | | | (25,341 | ) |
| | | | | | | | | | | | | | | | | | | | | | | | | | |
| | | | | | | | | | | | | | | | | | | | $ | 69,443 | | | $ | (48,580 | ) |
| | | | | | | | | | | | | | | | | | | | | | | | | | |
PUT OPTIONS WRITTEN (see Note D)
| | | | | | | | | | | | | | | | | | | | | | | | | | |
| Description | | Counterparty | | Contracts | | | Exercise
Price | | | Expiration
Month | | | Notional
(000) | | | Premiums
Received | | | U.S. $
Value | |
Euro STOXX 50 Index(i) | | Citibank, NA | | | 270 | | | EUR | 3,250.00 | | | | March 2019 | | | EUR | 878 | | | $ | 9,184 | | | $ | (4,525 | ) |
FTSE 100 Index(i) | | Citibank, NA | | | 50 | | | GBP | 7,200.00 | | | | March 2019 | | | GBP | 360 | | | | 8,232 | | | | (10,329 | ) |
Nikkei 225 Index(i) | | Goldman Sachs International | | | 3,000 | | | JPY | 21,375.00 | | | | March 2019 | | | JPY | 64,125 | | | | 7,382 | | | | (4,473 | ) |
S&P 500 Index(i) | | Goldman Sachs International | | | 1,100 | | | USD | 2,790.00 | | | | March 2019 | | | USD | 3,069 | | | | 21,736 | | | | (31,410 | ) |
| | | | | | | | | | | | | | | | | | | | | | | | | | |
| | | | | | | | | | | | | | | | | | | | $ | 46,534 | | | $ | (50,737 | ) |
| | | | | | | | | | | | | | | | | | | | | | | | | | |
CENTRALLY CLEARED INTEREST RATE SWAPS (see Note D)
| | | | | | | | | | | | | | | | | | | | | | | | | | | | |
| | | | | | | | | Rate Type | | | | |
Notional
Amount (000) | | | Termination
Date | | | Payments
made
by the
Fund | | Payments
received
by the
Fund | | | Payment
Frequency
Paid/
Received | | Market Value | | | Upfront
Premiums
Paid
(Received) | | | Unrealized
Appreciation/
(Depreciation) | |
NOK | | | 7,850 | | | | 4/27/27 | | | 6 Month
NIBOR | | | 1.935 | % | | Semi-Annual/
Annual | | $ | 5,995 | | | $ | — | | | $ | 5,995 | |
SEK | | | 1,770 | | | | 6/08/28 | | | 3 Month
STIBOR | | | 1.178 | % | | Quarterly/
Annual | | | 5,839 | | | | — | | | | 5,839 | |
CHF | | | 480 | | | | 7/12/28 | | | 6 Month
LIBOR | | | 0.403 | % | | Semi-Annual/
Annual | | | 11,541 | | | | — | | | | 11,541 | |
CHF | | | 520 | | | | 9/10/28 | | | 6 Month
LIBOR | | | 0.400 | % | | Semi-Annual/
Annual | | | 11,020 | | | | — | | | | 11,020 | |
NOK | | | 1,390 | | | | 10/11/28 | | | 6 Month
NIBOR | | | 2.396 | % | | Semi-Annual/
Annual | | | 5,261 | | | | — | | | | 5,261 | |
NOK | | | 9,670 | | | | 11/13/28 | | | 6 Month
NIBOR | | | 2.322 | % | | Semi-Annual/
Annual | | | 26,933 | | | | — | | | | 26,933 | |
SEK | | | 7,180 | | | | 11/13/28 | | | 3 Month
STIBOR | | | 1.273 | % | | Quarterly/
Annual | | | 23,851 | | | | — | | | | 23,851 | |
CHF | | | 980 | | | | 11/13/28 | | | 6 Month
LIBOR | | | 0.510 | % | | Semi-Annual/
Annual | | | 31,865 | | | | — | | | | 31,865 | |
| | |
| |
| 48 | AB TAX-MANAGED ALL MARKET INCOME PORTFOLIO | | abfunds.com |
PORTFOLIO OF INVESTMENTS(continued)
| | | | | | | | | | | | | | | | | | | | | | | | | | | | | | | | |
| | | | | | | | | Rate Type | | | | |
Notional
Amount (000) | | | Termination
Date | | | Payments
made
by the
Fund | | | Payments
received
by the
Fund | | | Payment
Frequency
Paid/
Received | | | Market Value | | | Upfront
Premiums
Paid
(Received) | | | Unrealized
Appreciation/
(Depreciation) | |
NZD | | | 420 | | | | 11/13/28 | | |
| 3 Month
BKBM |
| | | 3.105 | % | |
| Quarterly/
Semi-Annual |
| | $ | 18,597 | | | $ | — | | | $ | 18,597 | |
NOK | | | 1,230 | | | | 12/11/28 | | |
| 6 Month
NIBOR |
| | | 2.172 | % | |
| Semi-Annual/
Annual |
| | | 1,317 | | | | — | | | | 1,317 | |
SEK | | | 1,100 | | | | 12/11/28 | | |
| 3 Month
STIBOR |
| | | 1.120 | % | |
| Quarterly/
Annual |
| | | 1,818 | | | | — | | | | 1,818 | |
SEK | | | 5,180 | | | | 12/14/28 | | |
| 3 Month
STIBOR |
| | | 1.112 | % | |
| Quarterly/
Annual |
| | | 7,953 | | | | — | | | | 7,953 | |
SEK | | | 2,870 | | | | 1/11/29 | | |
| 3 Month
STIBOR |
| | | 1.080 | % | |
| Quarterly/
Annual |
| | | 2,824 | | | | — | | | | 2,824 | |
NZD | | | 80 | | | | 1/11/29 | | |
| 3 Month
BKBM |
| | | 2.653 | % | |
| Quarterly/
Semi-Annual |
| | | 956 | | | | — | | | | 956 | |
CHF | | | 60 | | | | 1/11/29 | | |
| 6 Month
LIBOR |
| | | 0.299 | % | |
| Semi-Annual/
Annual |
| | | 492 | | | | — | | | | 492 | |
NOK | | | 2,540 | | | | 2/08/29 | | |
| 6 Month
NIBOR |
| | | 2.072 | % | |
| Semi-Annual/
Annual |
| | | (345 | ) | | | — | | | | (345 | ) |
| | | | | | | | | | | | | | | | | | | | | | | | | | | | | | | | |
| | | | | | | | | | | | | | | | | | | | | | $ | 155,917 | | | $ | — | | | $ | 155,917 | |
| | | | | | | | | | | | | | | | | | | | | | | | | | | | | | | | |
CREDIT DEFAULT SWAPS (see Note D)
| | | | | | | | | | | | | | | | | | | | | | | | | | | | |
Swap
Counterparty &
Referenced
Obligation | | Fixed
Rate
(Pay)
Receive | | | Payment
Frequency | | | Implied
Credit
Spread at
February 28,
2019 | | | Notional
Amount
(000) | | | Market
Value | | | Upfront
Premiums
Paid
(Received) | | | Unrealized
Appreciation/
(Depreciation) | |
Sale Contracts | | | | | | | | | | | | | | | | | | | | | | | | | | | | |
Citigroup Global Markets, Inc. | | | | | | | | | | | | | | | | | | | | | | | | | | | | |
CDX-CMBX.
NA.BBB-
Series 6,
5/11/63* | | | 3.00 | % | | | Monthly | | | | 7.20 | % | | USD | 70 | | | $ | (8,480 | ) | | $ | (9,184 | ) | | $ | 704 | |
CDX-CMBX.
NA.BBB- Series 6,
5/11/63* | | | 3.00 | | | | Monthly | | | | 7.20 | | | USD | 8 | | | | (969 | ) | | | (814 | ) | | | (155 | ) |
Credit Suisse International | | | | | | | | | | | | | | | | | | | | | | | | | | | | |
CDX-CMBX.
NA.BBB-
Series 6, 5/11/63* | | | 3.00 | | | | Monthly | | | | 7.20 | | | USD | 138 | | | | (16,719 | ) | | | (17,443 | ) | | | 724 | |
CDX-CMBX.
NA.BBB- Series 6, 5/11/63* | | | 3.00
| | | | Monthly | | | | 7.20 | | | USD | 4 | | | | (485 | ) | | | (509 | ) | | | 24 | |
CDX-CMBX.
NA.BBB- Series 6,
5/11/63* | | | 3.00 | | | | Monthly | | | | 7.20 | | | USD | 3 | | | | (364 | ) | | | (308 | ) | | | (56 | ) |
| | |
| |
| abfunds.com | | AB TAX-MANAGED ALL MARKET INCOME PORTFOLIO | 49 |
PORTFOLIO OF INVESTMENTS(continued)
| | | | | | | | | | | | | | | | | | | | | | | | | | | | |
Swap
Counterparty &
Referenced
Obligation | | Fixed
Rate
(Pay)
Receive | | | Payment
Frequency | | | Implied
Credit
Spread at
February 28,
2019 | | | Notional
Amount
(000) | | | Market
Value | | | Upfront
Premiums
Paid
(Received) | | | Unrealized
Appreciation/
(Depreciation) | |
CDX-CMBX.
NA.BBB-
Series 6,
5/11/63* | | | 3.00 | % | | | Monthly | | | | 7.20 | % | | USD | 54 | | | $ | (6,537 | ) | | $ | (5,549 | ) | | $ | (988 | ) |
CDX-CMBX.
NA.BBB-
Series 6,
5/11/63* | | | 3.00 | | | | Monthly | | | | 7.20 | | | USD | 81 | | | | (9,813 | ) | | | (8,110 | ) | | | (1,703 | ) |
Goldman Sachs International | | | | | | | | | | | | | | | | | | | | | | | | | |
CDX-CMBX.
NA.BBB-
Series 6, 5/11/63* | | | 3.00 | | | | Monthly | | | | 7.20 | | | USD | 149 | | | | (18,039 | ) | | | (21,994 | ) | | | 3,955 | |
CDX-CMBX.
NA.BBB-
Series 6, 5/11/63* | | | 3.00 | | | | Monthly | | | | 7.20 | | | USD | 26 | | | | (3,150 | ) | | | (3,397 | ) | | | 247 | |
CDX-CMBX.
NA.BBB-
Series 6, 5/11/63* | | | 3.00 | | | | Monthly | | | | 7.20 | | | USD | 7 | | | | (848 | ) | | | (915 | ) | | | 67 | |
CDX-CMBX.
NA.BBB-
Series 6, 5/11/63* | | | 3.00 | | | | Monthly | | | | 7.20 | | | USD | 69 | | | | (8,359 | ) | | | (6,706 | ) | | | (1,653 | ) |
| | | | | | | | | | | | | | | | | | | | | | | | | | | | |
| | | | | | | | | | | | | | | | | | $ | (73,763 | ) | | $ | (74,929 | ) | | $ | 1,166 | |
| | | | | | | | | | | | | | | | | | | | | | | | | | | | |
INFLATION (CPI) SWAPS (see Note D)
| | | | | | | | | | | | | | | | | | | | | | | | |
| | | | Rate Type | | | | |
Swap Counterparty | | Notional
Amount
(000) | | | Termination
Date | | | Payments
made
by the
Fund | | | Payments
received
by the
Fund | | | Payment
Frequency
Paid/
Received | | | Unrealized
Appreciation/
(Depreciation) | |
Barclays Bank PLC | | USD | 1,864 | | | | 8/31/20 | | | | 2.235 | % | | | CPI | # | | | Maturity | | | $ | (22,538 | ) |
Barclays Bank PLC | | USD | 1,865 | | | | 9/04/20 | | | | 2.248 | % | | | CPI | # | | | Maturity | | | | (22,575 | ) |
Barclays Bank PLC | | USD | 2,083 | | | | 9/20/20 | | | | 2.263 | % | | | CPI | # | | | Maturity | | | | (25,039 | ) |
Barclays Bank PLC | | USD | 2,079 | | | | 10/15/20 | | | | 2.208 | % | | | CPI | # | | | Maturity | | | | (21,692 | ) |
Barclays Bank PLC | | USD | 1,067 | | | | 10/15/20 | | | | 2.210 | % | | | CPI | # | | | Maturity | | | | (11,185 | ) |
Citibank, NA | | USD | 1,520 | | | | 10/17/20 | | | | 2.220 | % | | | CPI | # | | | Maturity | | | | (16,056 | ) |
JPMorgan Chase Bank, NA | | USD | 1,911 | | | | 8/30/20 | | | | 2.210 | % | | | CPI | # | | | Maturity | | | | (22,066 | ) |
| | | | | | | | | | | | | | | | | | | | | | | | |
| | | $ | (141,151 | ) |
| | | | | | | | | | | | | | | | | | | | | | | | |
| | |
| |
| 50 | AB TAX-MANAGED ALL MARKET INCOME PORTFOLIO | | abfunds.com |
PORTFOLIO OF INVESTMENTS(continued)
TOTAL RETURN SWAPS (see Note D)
| | | | | | | | | | | | | | | | | | | | | | | | |
Counterparty &
Referenced Obligation | | # of Shares
or Units | | | Rate
Paid/
Received | | | Payment
Frequency | | | Notional
Amount
(000) | | | Maturity
Date | | | Unrealized
Appreciation/
(Depreciation) | |
Receive Total Return on Reference Obligation | |
JPMorgan Chase Bank, NA
iBoxx $ Liquid High Yield Index | | | 5,800,000 | | | | LIBOR | | | | Quarterly | | | USD | 5,800 | | | | 3/20/19 | | | $ | 6,713 | |
Pay Total Return on Reference Obligation | |
JPMorgan Chase Bank, NA
iBoxx $ Liquid High Yield Index | | | 5,800,000 | | | | LIBOR | | | | Maturity | | | USD | 5,800 | | | | 3/20/19 | | | | (405,611 | ) |
JPABSAA1(1) | | | 352,015 | | | | 0.00 | % | | | Maturity | | | USD | 35,887 | | | | 3/29/19 | | | | – 0 | – |
| | | | | | | | | | | | | | | | | | | | | | | | |
| | | | | | | | | | | | | | | | | | | | | | $ | (398,898 | ) |
| | | | | | | | | | | | | | | | | | | | | | | | |
| ** | Principal amount less than 500. |
| *** | Notional amount less than 500. |
| (a) | Security is exempt from registration under Rule 144A of the Securities Act of 1933. These securities are considered restricted, but liquid and may be resold in transactions exempt from registration, normally to qualified institutional buyers. At February 28, 2019, the aggregate market value of these securities amounted to $5,618,526 or 5.4% of net assets. |
| (b) | Security in which significant unobservable inputs (Level 3) were used in determining fair value. |
| (c) | Non-income producing security. |
| (e) | When-Issued or delayed delivery security. |
| (f) | Defaulted matured security. |
| (h) | To obtain a copy of the fund’s shareholder report, please go to the Securities and Exchange Commission’s website at www.sec.gov. |
| (i) | One contract relates to 1 share. |
As of February 28, 2019, the Fund’s percentages of investments in municipal bonds that are insured and in insured municipal bonds that have beenpre-refunded or escrowed to maturity are 5.2% and 0.0%, respectively.
| | |
Currency Abbreviations: AUD – Australian Dollar BRL – Brazilian Real CAD – Canadian Dollar CHF – Swiss Franc CLP – Chilean Peso CNY – Chinese Yuan Renminbi COP – Colombian Peso CZK – Czech Koruna EUR – Euro GBP – Great British Pound HKD – Hong Kong Dollar HUF – Hungarian Forint IDR – Indonesian Rupiah INR – Indian Rupee | | JPY – Japanese Yen KRW – South Korean Won MXN – Mexican Peso NOK – Norwegian Krone NZD – New Zealand Dollar PEN – Peruvian Sol PHP – Philippine Peso PLN – Polish Zloty RUB – Russian Ruble SEK – Swedish Krona SGD – Singapore Dollar THB – Thailand Baht TRY – Turkish Lira TWD – New Taiwan Dollar USD – United States Dollar ZAR – South African Rand |
| | |
| |
| abfunds.com | | AB TAX-MANAGED ALL MARKET INCOME PORTFOLIO | 51 |
PORTFOLIO OF INVESTMENTS(continued)
Glossary:
AGM – Assured Guaranty Municipal
ASX – Australian Stock Exchange
BKBM – Bank Bill Benchmark (New Zealand)
CBT – Chicago Board of Trade
ETF – Exchange Traded Fund
ETM – Escrowed to Maturity
ETN – Exchange Traded Note
ETS – Emission Trading Scheme
FTSE – Financial Times Stock Exchange
GDR – Global Depositary Receipt
IBEX – International Business Exchange
LIBOR – London Interbank Offered Rates
MIB – Milano Italia Borsa
MSCI – Morgan Stanley Capital International
NATL – National Interstate Corporation
NIBOR – Norwegian Interbank Offered Rate
REIT – Real Estate Investment Trust
SPI – Share Price Index
STIBOR – Stockholm Interbank Offered Rate
TOPIX – Tokyo Price Index
TSX – Toronto Stock Exchange
| (1) | The following table represents the 50 largest (long/short) equity basket holdings underlying the total return swap with JPABSAA1 as of February 28, 2019. |
| | | | | | | | | | | | |
| Security Description | | Shares | | | Notional Value as of 2/28/19 | | | Percent of
Basket’s
Value | |
S&P 500 Total Return | | | (3,163 | ) | | $ | (17,619,971 | ) | | | (49.1 | )% |
MSCI Daily TR Gross EAFE | | | (1,389 | ) | | | (10,729,880 | ) | | | (29.9 | )% |
J.P. Morgan Cash Index | | | 3,915 | | | | 1,162,703 | | | | 3.2 | % |
MSCI Daily TR Gross Canada | | | (146 | ) | | | (1,076,577 | ) | | | (3.0 | )% |
Roche Holding AG | | | 3,188 | | | | 886,381 | | | | 2.5 | % |
Nice Ltd. | | | 66 | | | | 775,135 | | | | 2.2 | % |
Microsoft Corp | | | 6,761 | | | | 757,192 | | | | 2.1 | % |
Raytheon Corp | | | 4,071 | | | | 757,192 | | | | 2.1 | % |
HKT Trust & HKT Ltd. | | | 467,148 | | | | 714,129 | | | | 2.0 | % |
Royal Dutch Shell PLC | | | 216 | | | | 678,243 | | | | 1.9 | % |
Merck & Co, Inc. | | | 8,240 | | | | 667,478 | | | | 1.9 | % |
Fidelity National Financial, Inc. | | | 18,353 | | | | 642,357 | | | | 1.8 | % |
Ross Stores, Inc. | | | 6,762 | | | | 642,357 | | | | 1.8 | % |
Boeing Co/The | | | 1,403 | | | | 617,237 | | | | 1.7 | % |
Philip Morris International, Inc. | | | 6,930 | | | | 602,883 | | | | 1.7 | % |
Toronto-Dominion Bank/The | | | 10,398 | | | | 592,117 | | | | 1.7 | % |
Apple, Inc. | | | 3,277 | | | | 566,997 | | | | 1.6 | % |
Nippon Telegraph & Telephone Corp | | | 12,897 | | | | 556,231 | | | | 1.6 | % |
Automatic Data Processing, Inc. | | | 3,612 | | | | 552,643 | | | | 1.5 | % |
Booz Allen Hamilton Holding Corp | | | 10,224 | | | | 541,877 | | | | 1.5 | % |
TJX Cos, Inc./The | | | 10,484 | | | | 534,700 | | | | 1.5 | % |
Check Point Software Technolog | | | 4,353 | | | | 531,111 | | | | 1.5 | % |
NN Group NV | | | 12,025 | | | | 520,345 | | | | 1.5 | % |
Royal Bank of Canada | | | 6,607 | | | | 516,757 | | | | 1.4 | % |
RELX PLC | | | 22,533 | | | | 513,168 | | | | 1.4 | % |
Oracle Corp | | | 9,800 | | | | 509,580 | | | | 1.4 | % |
Walmart, Inc. | | | 5,039 | | | | 498,814 | | | | 1.4 | % |
| | |
| |
| 52 | AB TAX-MANAGED ALL MARKET INCOME PORTFOLIO | | abfunds.com |
PORTFOLIO OF INVESTMENTS(continued)
| | | | | | | | | | | | |
| Security Description | | Shares | | | Notional Value as of 2/28/19 | | | Percent of
Basket’s
Value | |
Paychex, Inc. | | | 6,292 | | | $ | 484,459 | | | | 1.4 | % |
Gilead Sciences, Inc. | | | 7,288 | | | | 473,694 | | | | 1.3 | % |
Pfizer, Inc. | | | 11,016 | | | | 473,694 | | | | 1.3 | % |
Oracle Corp Japan | | | 6,297 | | | | 470,105 | | | | 1.3 | % |
Dollar General Corp | | | 3,954 | | | | 466,517 | | | | 1.3 | % |
British American Tobacco PLC | | | 118 | | | | 434,219 | | | | 1.2 | % |
McDonald’s Corp | | | 2,360 | | | | 434,219 | | | | 1.2 | % |
Comcast Corp | | | 11,042 | | | | 430,631 | | | | 1.2 | % |
Nippon Building Fund, Inc. | | | 66 | | | | 430,631 | | | | 1.2 | % |
Wolters Kluwer NV | | | 6,249 | | | | 412,688 | | | | 1.2 | % |
EDP – Energias de Portugal SA | | | 114,504 | | | | 391,156 | | | | 1.1 | % |
Aristocrat Leisure Ltd. | | | 21,790 | | | | 387,568 | | | | 1.1 | % |
Koninklijke Ahold Delhaize NV | | | 14,250 | | | | 373,213 | | | | 1.0 | % |
Home Depot, Inc./The | | | 1,998 | | | | 369,625 | | | | 1.0 | % |
Vonovia SE | | | 7,549 | | | | 369,625 | | | | 1.0 | % |
Novo Nordisk A/S | | | 7,448 | | | | 366,036 | | | | 1.0 | % |
Intercontinental Exchange, Inc. | | | 4,707 | | | | 362,447 | | | | 1.0 | % |
Amadeus IT Group SA | | | 4,727 | | | | 355,270 | | | | 1.0 | % |
Merlin Properties Socimi SA | | | 27,504 | | | | 344,505 | | | | 1.0 | % |
UnitedHealth Group, Inc. | | | 1,424 | | | | 344,505 | | | | 1.0 | % |
Quebecor, Inc. | | | 13,883 | | | | 337,327 | | | | 0.9 | % |
AutoZone, Inc. | | | 352 | | | | 330,150 | | | | 0.9 | % |
Salmar ASA | | | 6,882 | | | | 330,150 | | | | 0.9 | % |
Other | | | 280,513 | | | | 12,527,764 | | | | 34.9 | % |
See notes to financial statements.
| | |
| |
| abfunds.com | | AB TAX-MANAGED ALL MARKET INCOME PORTFOLIO | 53 |
STATEMENT OF ASSETS & LIABILITIES
February 28, 2019(unaudited)
| | | | |
| Assets | |
Investments in securities, at value (cost $91,629,868) | | $ | 93,305,713 | |
Cash | | | 5,322,397 | |
Cash collateral due from broker | | | 1,484,537 | |
Foreign currencies, at value (cost $3,414,848) | | | 3,432,646 | |
Unaffiliated interest and dividends receivable | | | 843,471 | |
Unrealized appreciation on forward currency exchange contracts | | | 391,492 | |
Receivable for terminated total return swaps | | | 388,104 | |
Receivable for investment securities sold | | | 29,040 | |
Affiliated dividends receivable | | | 9,382 | |
Receivable for shares of beneficial interest sold | | | 8,034 | |
Unrealized appreciation on total return swaps | | | 6,713 | |
Other assets | | | 2,507 | |
| | | | |
Total assets | | | 105,224,036 | |
| | | | |
| Liabilities | |
Options written, at value (premiums received $115,977) | | | 99,317 | |
Unrealized depreciation on total return swaps | | | 405,611 | |
Payable for investment securities purchased and foreign currency transactions | | | 278,179 | |
Unrealized depreciation on forward currency exchange contracts | | | 218,025 | |
Payable for variation margin on futures | | | 201,913 | |
Unrealized depreciation on inflation swaps | | | 141,151 | |
Market value on credit default swaps (net premiums received $74,929) | | | 73,763 | |
Payable for variation margin on centrally cleared swaps | | | 26,231 | |
Payable for shares of beneficial interest redeemed | | | 20,947 | |
Distribution fee payable | | | 17,494 | |
Advisory fee payable | | | 17,151 | |
Transfer Agent fee payable | | | 9,814 | |
Trustees’ fees payable | | | 6,295 | |
Accrued expenses and other liabilities | | | 93,719 | |
| | | | |
Total liabilities | | | 1,609,610 | |
| | | | |
Net Assets | | $ | 103,614,426 | |
| | | | |
| Composition of Net Assets | | | | |
Shares of beneficial interest, at par | | $ | 86 | |
Additionalpaid-in capital | | | 102,525,312 | |
Distributable earnings | | | 1,089,028 | |
| | | | |
| | $ | 103,614,426 | |
| | | | |
Net Asset Value Per Share—unlimited shares authorized, $.00001 par value
| | | | | | | | | | | | |
| Class | | Net Assets | | | Shares
Outstanding | | | Net Asset
Value | |
| |
| A | | $ | 63,001,803 | | | | 5,219,168 | | | $ | 12.07 | * |
| |
| B | | $ | 538,987 | | | | 43,555 | | | $ | 12.37 | |
| |
| C | | $ | 6,669,451 | | | | 542,667 | | | $ | 12.29 | |
| |
| Advisor | | $ | 33,404,185 | | | | 2,763,231 | | | $ | 12.09 | |
| |
| * | The maximum offering price per share for Class A shares was $12.61 which reflects a sales charge of 4.25%. |
See notes to financial statements.
| | |
| |
| 54 | AB TAX-MANAGED ALL MARKET INCOME PORTFOLIO | | abfunds.com |
STATEMENT OF OPERATIONS
Six Months Ended February 28, 2019(unaudited)
| | | | | | | | |
| Investment Income | | | | | | | | |
Interest | | $ | 1,132,151 | | | | | |
Dividends | | | | | | | | |
Unaffiliated issuers (net of foreign taxes withheld of $11,564) | | | 828,261 | | | | | |
Affiliated issuers | | | 47,805 | | | $ | 2,008,217 | |
| | | | | | | | |
| Expenses | | | | | | | | |
Advisory fee (see Note B) | | | 287,999 | | | | | |
Distribution fee—Class A | | | 80,328 | | | | | |
Distribution fee—Class B | | | 2,818 | | | | | |
Distribution fee—Class C | | | 33,201 | | | | | |
Transfer agency—Class A | | | 26,735 | | | | | |
Transfer agency—Class B | | | 338 | | | | | |
Transfer agency—Class C | | | 2,886 | | | | | |
Transfer agency—Advisor Class | | | 13,845 | | | | | |
Custodian | | | 79,490 | | | | | |
Audit and tax | | | 36,486 | | | | | |
Registration fees | | | 29,468 | | | | | |
Legal | | | 22,149 | | | | | |
Printing | | | 19,685 | | | | | |
Trustees’ fees | | | 12,439 | | | | | |
Miscellaneous | | | 22,121 | | | | | |
| | | | | | | | |
Total expenses | | | 669,988 | | | | | |
Less: expenses waived and reimbursed by the Adviser (see Note B) | | | (166,817 | ) | | | | |
| | | | | | | | |
Net expenses | | | | | | | 503,171 | |
| | | | | | | | |
Net investment income | | | | | | | 1,505,046 | |
| | | | | | | | |
| Realized and Unrealized Gain (Loss) on Investment and Foreign Currency Transactions | | | | | | | | |
Net realized gain (loss) on: | | | | | | | | |
Investment transactions(a) | | | | | | | (488,749 | ) |
Forward currency exchange contracts | | | | | | | 193,194 | |
Futures | | | | | | | (1,151,800 | ) |
Options written | | | | | | | (446,595 | ) |
Swaps | | | | | | | 408,318 | |
Foreign currency transactions | | | | | | | (91,164 | ) |
Net change in unrealized appreciation/depreciation of: | | | | | | | | |
Investments | | | | | | | (749,638 | ) |
Forward currency exchange contracts | | | | | | | 381,823 | |
Futures | | | | | | | 409,106 | |
Options written | | | | | | | (9,825 | ) |
Swaps | | | | | | | (288,323 | ) |
Foreign currency denominated assets and liabilities | | | | | | | 27,642 | |
| | | | | | | | |
Net loss on investment and foreign currency transactions | | | | | | | (1,806,011 | ) |
| | | | | | | | |
Net Decrease in Net Assets from Operations | | | | | | $ | (300,965 | ) |
| | | | | | | | |
| (a) | Net of foreign capital gains taxes of $233. |
See notes to financial statements.
| | |
| |
| abfunds.com | | AB TAX-MANAGED ALL MARKET INCOME PORTFOLIO | 55 |
STATEMENT OF CHANGES IN NET ASSETS
| | | | | | | | |
| | | Six Months Ended
February 28, 2019
(unaudited) | | | Year Ended
August 31,
2018 | |
| Increase (Decrease) in Net Assets from Operations | | | | | | | | |
Net investment income | | $ | 1,505,046 | | | $ | 3,386,323 | |
Net realized gain (loss) on investment and foreign currency transactions | | | (1,576,796 | ) | | | 2,874,068 | |
Net change in unrealized appreciation/depreciation of investments and foreign currency denominated assets and liabilities | | | (229,215 | ) | | | (3,212,261 | ) |
| | | | | | | | |
Net increase (decrease) in net assets from operations | | | (300,965 | ) | | | 3,048,130 | |
Distributions to Shareholders* | | | | | | | | |
Class A | | | (3,077,931 | ) | | | (8,685,059 | ) |
Class B | | | (24,186 | ) | | | (67,330 | ) |
Class C | | | (281,406 | ) | | | (958,006 | ) |
Advisor Class | | | (1,609,841 | ) | | | (4,693,202 | ) |
| Transactions in Shares of Beneficial Interest | | | | | | | | |
Net decrease | | | (3,514,360 | ) | | | (6,101,101 | ) |
| | | | | | | | |
Total decrease | | | (8,808,689 | ) | | | (17,456,568 | ) |
| Net Assets | | | | | | | | |
Beginning of period | | | 112,423,115 | | | | 129,879,683 | |
| | | | | | | | |
End of period | | $ | 103,614,426 | | | $ | 112,423,115 | |
| | | | | | | | |
| * | The prior year’s amounts have been reclassified to conform with the current year’s presentation. See Note I, Recent Accounting Pronouncements, in the Notes to Financial Statements for more information. |
See notes to financial statements.
| | |
| |
| 56 | AB TAX-MANAGED ALL MARKET INCOME PORTFOLIO | | abfunds.com |
NOTES TO FINANCIAL STATEMENTS
February 28, 2019(unaudited)
NOTE A
Significant Accounting Policies
The AB Portfolios (the “Company”) was organized as a Massachusetts Business Trust on March 26, 1987 and is registered under the Investment Company Act of 1940 as a diversified, open end management investment company. The Company operates as a series company currently comprised of six series. Each series is considered to be a separate entity for financial reporting and tax purposes. This report relates to the ABTax-Managed All Market Income Portfolio (formerly ABTax-Managed Balanced Wealth Strategy) (the “Fund”). The Fund offers Class A, Class B, Class C and Advisor Class shares. Class A shares are sold with afront-end sales charge of up to 4.25% for purchases not exceeding $1,000,000. With respect to purchases of $1,000,000 or more, Class A shares redeemed within one year of purchase may be subject to a contingent deferred sales charge of 1%. Class B shares are currently sold with a contingent deferred sales charge which declines from 4% to 0% depending on the period of time the shares are held. Effective January 31, 2009, sales of Class B shares of the Fund to new investors were suspended. Class B shares will only be issued (i) upon the exchange of Class B shares from another AB mutual fund, (ii) for purposes of dividend reinvestment, (iii) through the Fund’s Automatic Investment Program (the “Program”) for accounts that established the Program prior to January 31, 2009, and (iv) for purchases of additional shares by Class B shareholders as of January 31, 2009. The ability to establish a new Program for accounts containing Class B shares was suspended as of January 31, 2009. Class B shares will automatically convert to Class A shares eight years after the end of the calendar month of purchase. Class C shares are subject to a contingent deferred sales charge of 1% on redemptions made within the first year after purchase, and 0% after the first year of purchase. Class C shares will automatically convert to Class A shares ten years after the end of the calendar month of purchase. Advisor Class shares are sold without any initial or contingent deferred sales charge and are not subject to ongoing distribution expenses. All four classes of shares have identical voting, dividend, liquidation and other rights, except that the classes bear different distribution and transfer agency expenses. Each class has exclusive voting rights with respect to its distribution plan. The financial statements have been prepared in conformity with U.S. generally accepted accounting principles (“U.S. GAAP”) which require management to make certain estimates and assumptions that affect the reported amounts of assets and liabilities in the financial statements and amounts of income and expenses during the reporting period. Actual results could differ from those estimates. The Fund is an investment company under U.S. GAAP and follows the accounting and reporting guidance applicable to investment companies. The following is a summary of significant accounting policies followed by the Fund.
| | |
| |
| abfunds.com | | AB TAX-MANAGED ALL MARKET INCOME PORTFOLIO | 57 |
NOTES TO FINANCIAL STATEMENTS(continued)
1. Security Valuation
Portfolio securities are valued at their current market value determined on the basis of market quotations or, if market quotations are not readily available or are deemed unreliable, at “fair value” as determined in accordance with procedures established by and under the general supervision of the Company’s Board of Trustees (the “Board”).
In general, the market values of securities which are readily available and deemed reliable are determined as follows: securities listed on a national securities exchange (other than securities listed on the NASDAQ Stock Market, Inc. (“NASDAQ”)) or on a foreign securities exchange are valued at the last sale price at the close of the exchange or foreign securities exchange. If there has been no sale on such day, the securities are valued at the last traded price from the previous day. Securities listed on more than one exchange are valued by reference to the principal exchange on which the securities are traded; securities listed only on NASDAQ are valued in accordance with the NASDAQ Official Closing Price; listed or over the counter (“OTC”) market put or call options are valued at the mid level between the current bid and ask prices. If either a current bid or current ask price is unavailable, AllianceBernstein L.P. (the “Adviser”) will have discretion to determine the best valuation (e.g., last trade price in the case of listed options); open futures are valued using the closing settlement price or, in the absence of such a price, the most recent quoted bid price. If there are no quotations available for the day of valuation, the last available closing settlement price is used; U.S. Government securities and any other debt instruments having 60 days or less remaining until maturity are generally valued at market by an independent pricing vendor, if a market price is available. If a market price is not available, the securities are valued at amortized cost. This methodology is commonly used for short term securities that have an original maturity of 60 days or less, as well as short term securities that had an original term to maturity that exceeded 60 days. In instances when amortized cost is utilized, the Valuation Committee (the “Committee”) must reasonably conclude that the utilization of amortized cost is approximately the same as the fair value of the security. Such factors the Committee will consider include, but are not limited to, an impairment of the creditworthiness of the issuer or material changes in interest rates. Fixed-income securities, including mortgage-backed and asset-backed securities, may be valued on the basis of prices provided by a pricing service or at a price obtained from one or more of the major broker-dealers. In cases where broker-dealer quotes are obtained, the Adviser may establish procedures whereby changes in market yields or spreads are used to adjust, on a daily basis, a recently obtained quoted price on a security. Swaps and other derivatives are valued daily, primarily using independent pricing services, independent pricing models using market inputs, as well as third party broker-dealers or counterparties.
| | |
| |
| 58 | AB TAX-MANAGED ALL MARKET INCOME PORTFOLIO | | abfunds.com |
NOTES TO FINANCIAL STATEMENTS(continued)
Open end mutual funds are valued at the closing net asset value per share, while exchange traded funds are valued at the closing market price per share.
Securities for which market quotations are not readily available (including restricted securities) or are deemed unreliable are valued at fair value as deemed appropriate by the Adviser. Factors considered in making this determination may include, but are not limited to, information obtained by contacting the issuer, analysts, analysis of the issuer’s financial statements or other available documents. In addition, the Fund may use fair value pricing for securities primarily traded innon-U.S. markets because most foreign markets close well before the Fund values its securities at 4:00 p.m., Eastern Time. The earlier close of these foreign markets gives rise to the possibility that significant events, including broad market moves, may have occurred in the interim and may materially affect the value of those securities. To account for this, the Fund generally values many of its foreign equity securities using fair value prices based on third party vendor modeling tools to the extent available.
2. Fair Value Measurements
In accordance with U.S. GAAP regarding fair value measurements, fair value is defined as the price that the Fund would receive to sell an asset or pay to transfer a liability in an orderly transaction between market participants at the measurement date. U.S. GAAP establishes a framework for measuring fair value, and a three-level hierarchy for fair value measurements based upon the transparency of inputs to the valuation of an asset or liability (including those valued based on their market values as described in Note A.1 above). Inputs may be observable or unobservable and refer broadly to the assumptions that market participants would use in pricing the asset or liability. Observable inputs reflect the assumptions market participants would use in pricing the asset or liability based on market data obtained from sources independent of the Fund. Unobservable inputs reflect the Fund’s own assumptions about the assumptions that market participants would use in pricing the asset or liability based on the best information available in the circumstances. Each investment is assigned a level based upon the observability of the inputs which are significant to the overall valuation. The three-tier hierarchy of inputs is summarized below.
| | • | | Level 1—quoted prices in active markets for identical investments |
| | • | | Level 2—other significant observable inputs (including quoted prices for similar investments, interest rates, prepayment speeds, credit risk, etc.) |
| | • | | Level 3—significant unobservable inputs (including the Fund’s own assumptions in determining the fair value of investments) |
| | |
| |
| abfunds.com | | AB TAX-MANAGED ALL MARKET INCOME PORTFOLIO | 59 |
NOTES TO FINANCIAL STATEMENTS(continued)
The fair value of debt instruments, such as bonds, andover-the-counter derivatives is generally based on market price quotations, recently executed market transactions (where observable) or industry recognized modeling techniques and are generally classified as Level 2. Pricing vendor inputs to Level 2 valuations may include quoted prices for similar investments in active markets, interest rate curves, coupon rates, currency rates, yield curves, option adjusted spreads, default rates, credit spreads and other unique security features in order to estimate the relevant cash flows which are then discounted to calculate fair values. If these inputs are unobservable and significant to the fair value, these investments will be classified as Level 3. In addition,non-agency rated investments are classified as Level 3.
Where readily available market prices or relevant bid prices are not available for certain equity investments, such investments may be valued based on similar publicly traded investments, movements in relevant indices since last available prices or based upon underlying company fundamentals and comparable company data (such as multiples to earnings or other multiples to equity). Where an investment is valued using an observable input, such as another publicly traded security, the investment will be classified as Level 2. If management determines that an adjustment is appropriate based on restrictions on resale, illiquidity or uncertainty, and such adjustment is a significant component of the valuation, the investment will be classified as Level 3. An investment will also be classified as Level 3 where management uses company fundamentals and other significant inputs to determine the valuation.
Options are valued using market-based inputs to models, broker or dealer quotations, or alternative pricing sources with reasonable levels of price transparency, where such inputs and models are available. Alternatively, the values may be obtained through unobservable management determined inputs and/or management’s proprietary models. Where models are used, the selection of a particular model to value an option depends upon the contractual terms of, and specific risks inherent in, the option as well as the availability of pricing information in the market. Valuation models require a variety of inputs, including contractual terms, market prices, measures of volatility and correlations of such inputs. Exchange traded options generally will be classified as Level 2. For options that do not trade on exchange but trade in liquid markets, inputs can generally be verified and model selection does not involve significant management judgment. Options are classified within Level 2 on the fair value hierarchy when all of the significant inputs can be corroborated to market evidence. Otherwise such instruments are classified as Level 3.
Other fixed income investments, includingnon-U.S. government and corporate debt, are generally valued using quoted market prices, if available, which are typically impacted by current interest rates, maturity dates and
| | |
| |
| 60 | AB TAX-MANAGED ALL MARKET INCOME PORTFOLIO | | abfunds.com |
NOTES TO FINANCIAL STATEMENTS(continued)
any perceived credit risk of the issuer. Additionally, in the absence of quoted market prices, these inputs are used by pricing vendors to derive a valuation based upon industry or proprietary models which incorporate issuer specific data with relevant yield/spread comparisons with more widely quoted bonds with similar key characteristics. Those investments for which there are observable inputs are classified as Level 2. Where the inputs are not observable, the investments are classified as Level 3.
The following table summarizes the valuation of the Fund’s investments by the above fair value hierarchy levels as of February 28, 2019:
| | | | | | | | | | | | | | | | |
Investments in Securities: | | Level 1 | | | Level 2 | | | Level 3 | | | Total | |
Assets: | |
Long-Term Municipal Bonds | | $ | – 0 | – | | $ | 47,041,754 | | | $ | 9,336,167 | | | $ | 56,377,921 | |
Common Stocks: | | | | | | | | | | | | | | | | |
Health Care | | | 2,581,293 | | | | 2,333,634 | | | | – 0 | – | | | 4,914,927 | |
Consumer Staples | | | 2,810,394 | | | | 1,713,865 | | | | – 0 | – | | | 4,524,259 | |
Financials | | | 1,357,488 | | | | 1,599,838 | | | | – 0 | – | | | 2,957,326 | |
Industrials | | | 858,399 | | | | 1,760,754 | | | | – 0 | – | | | 2,619,153 | |
Communication Services | | | 1,641,186 | | | | 805,295 | | | | – 0 | – | | | 2,446,481 | |
Energy | | | 1,529,677 | | | | 549,961 | | | | – 0 | – | | | 2,079,638 | |
Utilities | | | 1,256,251 | | | | 622,988 | | | | – 0 | – | | | 1,879,239 | |
Consumer Discretionary | | | 786,161 | | | | 947,898 | | | | – 0 | – | | | 1,734,059 | |
Information Technology | | | 1,274,000 | | | | 154,998 | | | | – 0 | – | | | 1,428,998 | |
Materials | | | 245,277 | | | | 842,390 | | | | – 0 | – | | | 1,087,667 | |
Real Estate | | | 13,022 | | | | 265,143 | | | | – 0 | – | | | 278,165 | |
Preferred Stocks | | | 6,689,379 | | | | – 0 | – | | | – 0 | – | | | 6,689,379 | |
Investment Companies | | | 3,821,043 | | | | – 0 | – | | | – 0 | – | | | 3,821,043 | |
Corporates – Non-Investment Grade | | | – 0 | – | | | 87,883 | | | | – 0 | – | | | 87,883 | |
Short-Term Investments | | | – 0 | – | | | 379,575 | | | | – 0 | – | | | 379,575 | |
| | | | | | | | | | | | | | | | |
Total Investments in Securities | | | 24,863,570 | | | | 59,105,976 | | | | 9,336,167 | | | | 93,305,713 | |
Other Financial Instruments(a): | | | | | | | | | | | | | | | | |
Assets: | |
Futures | | | 462,388 | | | | 338,668 | | | | – 0 | – | | | 801,056 | (b) |
Forward Currency Exchange Contracts | | | – 0 | – | | | 391,492 | | | | – 0 | – | | | 391,492 | |
Centrally Cleared Interest Rate Swaps | | | – 0 | – | | | 156,262 | | | | – 0 | – | | | 156,262 | (b) |
Total Return Swaps | | | – 0 | – | | | 6,713 | | | | – 0 | – | | | 6,713 | |
Liabilities: | |
Futures | | | (198,848 | ) | | | (22,100 | ) | | | – 0 | – | | | (220,948 | )(b) |
Forward Currency Exchange Contracts | | | – 0 | – | | | (218,025 | ) | | | – 0 | – | | | (218,025 | ) |
Call Options Written | | | – 0 | – | | | (48,580 | ) | | | – 0 | – | | | (48,580 | ) |
Put Options Written | | | – 0 | – | | | (50,737 | ) | | | – 0 | – | | | (50,737 | ) |
Centrally Cleared Interest Rate Swaps | | | – 0 | – | | | (345 | ) | | | – 0 | – | | | (345 | )(b) |
Credit Default Swaps | | | – 0 | – | | | (73,763 | ) | | | – 0 | – | | | (73,763 | ) |
Inflation (CPI) Swaps | | | – 0 | – | | | (141,151 | ) | | | – 0 | – | | | (141,151 | ) |
Total Return Swaps | | | – 0 | – | | | (405,611 | ) | | | – 0 | – | | | (405,611 | ) |
| | | | | | | | | | | | | | | | |
Total(c) | | $ | 25,127,110 | | | $ | 59,038,799 | | | $ | 9,336,167 | | | $ | 93,502,076 | |
| | | | | | | | | | | | | | | | |
| | |
| |
| abfunds.com | | AB TAX-MANAGED ALL MARKET INCOME PORTFOLIO | 61 |
NOTES TO FINANCIAL STATEMENTS(continued)
| (a) | Other financial instruments are derivative instruments, such as futures, forwards and swaps, which are valued at the unrealized appreciation/(depreciation) on the instrument. Other financial instruments may also include swaps with upfront premiums, options written and swaptions written which are valued at market value. |
| (b) | Only variation margin receivable/(payable) at period end is reported within the statement of assets and liabilities. This amount reflects cumulative unrealized appreciation/(depreciation) on futures and centrally cleared swaps as reported in the portfolio of investments. Where applicable, centrally cleared swaps with upfront premiums are presented here at market value. |
| (c) | There were de minimis transfers under 1% of net assets between Level 1 and Level 2 during the reporting period. |
The Fund recognizes all transfers between levels of the fair value hierarchy assuming the financial instruments were transferred at the beginning of the reporting period.
The following is a reconciliation of investments in which significant unobservable inputs (Level 3) were used in determining fair value.
| | | | | | | | |
| | | Long-Term
Municipal Bonds | | | Total | |
Balance as of 8/31/18 | | $ | 8,607,904 | | | $ | 8,607,904 | |
Accrued discounts/(premiums) | | | (7,045 | ) | | | (7,045 | ) |
Realized gain (loss) | | | (285,046 | ) | | | (285,046 | ) |
Change in unrealized appreciation/depreciation | | | 191,476 | | | | 191,476 | |
Purchases | | | 1,311,231 | | | | 1,311,231 | |
Sales | | | (482,353 | ) | | | (482,353 | ) |
Transfers in to Level 3 | | | – 0 | – | | | – 0 | – |
Transfers out of Level 3 | | | – 0 | – | | | – 0 | – |
| | | | | | | | |
Balance as of 2/28/19 | | $ | 9,336,167 | | | $ | 9,336,167 | |
| | | | | | | | |
Net change in unrealized appreciation/depreciation from investments held as of 2/28/19(a) | | $ | (115,109 | ) | | $ | (115,109 | ) |
| | | | | | | | |
| (a) | The unrealized appreciation/depreciation is included in net change in unrealized appreciation/depreciation on investments and other financial instruments in the accompanying statement of operations. |
As of February 28, 2019, all Level 3 securities were priced by third party vendors.
The Adviser established the Committee to oversee the pricing and valuation of all securities held in the Fund. The Committee operates under pricing and valuation policies and procedures established by the Adviser and approved by the Board, including pricing policies which set forth the mechanisms and processes to be employed on a daily basis to implement these policies and procedures. In particular, the pricing policies describe how to determine market quotations for securities and other instruments. The Committee’s responsibilities include: 1) fair value and liquidity determinations (and oversight of any third parties to whom any responsibility for fair value and liquidity determinations is delegated), and 2) regular monitoring of the Adviser’s pricing and valuation policies and procedures and modification or enhancement of these policies and procedures (or recommendation of the modification of these policies and procedures) as the Committee believes appropriate.
| | |
| |
| 62 | AB TAX-MANAGED ALL MARKET INCOME PORTFOLIO | | abfunds.com |
NOTES TO FINANCIAL STATEMENTS(continued)
The Committee is also responsible for monitoring the implementation of the pricing policies by the Adviser’s Pricing Group (the “Pricing Group”) and any third party which performs certain pricing functions in accordance with the pricing policies. The Pricing Group is responsible for the oversight of the third party on aday-to-day basis. The Committee and the Pricing Group perform a series of activities to provide reasonable assurance of the accuracy of prices including: 1) periodic vendor due diligence meetings, review of methodologies, new developments and processes at vendors, 2) daily comparison of security valuation versus prior day for all securities that exceeded established thresholds, and 3) daily review of unpriced, stale, and variance reports with exceptions reviewed by senior management and the Committee.
In addition, several processes outside of the pricing process are used to monitor valuation issues including: 1) performance and performance attribution reports are monitored for anomalous impacts based upon benchmark performance, and 2) portfolio managers review all portfolios for performance and analytics (which are generated using the Adviser’s prices).
3. Currency Translation
Assets and liabilities denominated in foreign currencies and commitments under forward currency exchange contracts are translated into U.S. dollars at the mean of the quoted bid and ask prices of such currencies against the U.S. dollar. Purchases and sales of portfolio securities are translated into U.S. dollars at the rates of exchange prevailing when such securities were acquired or sold. Income and expenses are translated into U.S. dollars at rates of exchange prevailing when accrued.
Net realized gain or loss on foreign currency transactions represents foreign exchange gains and losses from sales and maturities of foreign fixed income investments, holding of foreign currencies, currency gains or losses realized between the trade and settlement dates on foreign investment transactions, and the difference between the amounts of dividends, interest and foreign withholding taxes recorded on the Fund’s books and the U.S. dollar equivalent amounts actually received or paid. Net unrealized currency gains and losses from valuing foreign currency denominated assets and liabilities at period end exchange rates are reflected as a component of net unrealized appreciation or depreciation of foreign currency denominated assets and liabilities.
4. Taxes
It is the Fund’s policy to meet the requirements of the Internal Revenue Code applicable to regulated investment companies and to distribute all of its investment company taxable income and net realized gains, if any, to
| | |
| |
| abfunds.com | | AB TAX-MANAGED ALL MARKET INCOME PORTFOLIO | 63 |
NOTES TO FINANCIAL STATEMENTS(continued)
shareholders. Therefore, no provisions for federal income or excise taxes are required. The Fund may be subject to taxes imposed by countries in which it invests. Such taxes are generally based on income and/or capital gains earned or repatriated. Taxes are accrued and applied to net investment income, net realized gains and net unrealized appreciation/depreciation as such income and/or gains are earned.
In accordance with U.S. GAAP requirements regarding accounting for uncertainties in income taxes, management has analyzed the Fund’s tax positions taken or expected to be taken on federal and state income tax returns for all open tax years (the current and the prior three tax years) and has concluded that no provision for income tax is required in the Fund’s financial statements.
5. Investment Income and Investment Transactions
Dividend income is recorded on theex-dividend date or as soon as the Fund is informed of the dividend. Interest income is accrued daily. Investment gains or losses are determined on the identified cost basis. The Fund amortizes premiums and accretes discounts as adjustments to interest income. Investment transactions are accounted for on the date the securities are purchased or sold.
6. Class Allocations
All income earned and expenses incurred by the Fund are borne on apro-rata basis by each outstanding class of shares, based on the proportionate interest in the Fund represented by the net assets of such class, except for class specific expenses which are allocated to the respective class. Expenses of the Company are charged proportionately to each series or based on other appropriate methods. Realized and unrealized gains and losses are allocated among the various share classes based on respective net assets.
7. Dividends and Distributions
Dividends and distributions to shareholders, if any, are recorded on theex-dividend date. Income dividends and capital gains distributions are determined in accordance with federal tax regulations and may differ from those determined in accordance with U.S. GAAP. To the extent these differences are permanent, such amounts are reclassified within the capital accounts based on their federal tax basis treatment; temporary differences do not require such reclassification.
NOTE B
Advisory Fee and Other Transactions with Affiliates
Under the terms of the investment advisory agreement (the “Advisory Agreement”), the Fund pays the Adviser an advisory fee at an annual rate
| | |
| |
| 64 | AB TAX-MANAGED ALL MARKET INCOME PORTFOLIO | | abfunds.com |
NOTES TO FINANCIAL STATEMENTS(continued)
of .55% of the first $2.5 billion, .45% of the next $2.5 billion and .40% in excess of $5 billion of the Fund’s average daily net assets. The fee is accrued daily and paid monthly. The Adviser has contractually agreed to waive advisory fees and/or to bear certain expenses to the extent necessary to limit total operating expenses (excluding acquired fund fees and expenses, interest expense, taxes, extraordinary expenses, and brokerage commissions and other transactions costs), on an annual basis (the “Expense Caps”) to .99%, 1.74%, 1.74% and .74% of the daily average net assets for the Class A, Class B, Class C and Advisor Class shares, respectively. For the six months ended February 28, 2019, such reimbursement amounted to $164,644. The Expense Caps will remain in effect through December 31, 2019.
During 2017, AXA S.A. (“AXA”), a French holding company for the AXA Group, a worldwide leader in life, property and casualty and health insurance and asset management, announced its intention to pursue the sale of a minority stake in its subsidiary, AXA Equitable Holdings, Inc. (“AXA Equitable”), the holding company for a diversified financial services organization, through an initial public offering (“IPO”). AXA Equitable is the holding company for a diverse group of financial services companies, including AllianceBernstein L.P., the investment adviser to the Funds (“the Adviser”). In March 2018, AXA announced its intention to sell its entire interest in AXA Equitable over time, subject to market conditions and other factors (the “Plan”). During the second quarter of 2018, AXA Equitable completed the IPO, and, as a result, in the fourth quarter of 2018 and in the first quarter of 2019, AXA completed public offerings of additional shares of AXA Equitable’s common stock and simultaneously sold shares to AXA Equitable pursuant to a separate agreement with it. AXA also granted the underwriters of the offering an option to purchase additional shares of AXA Equitable, which was exercised. As a result of the foregoing sales of AXA Equitable shares, as of March 25, 2019, AXA owns approximately 48.3% of the shares of common stock of AXA Equitable. Contemporaneously with the IPO, AXA sold $862.5 million aggregate principal amount of its 7.25% mandatorily exchangeable notes (the “MxB Notes”) due May 15, 2021, and exchangeable into up to 43,125,000 shares of common stock (or approximately 7% of the outstanding shares of common stock of AXA Equitable). AXA retains ownership (including voting rights) of such shares of common stock until the MxB Notes are exchanged, which may be on a date that is earlier than the maturity date at AXA’s option upon the occurrence of certain events.
It is anticipated that one or more of the transactions contemplated by the Plan may ultimately result in the indirect transfer of a “controlling block” of voting securities of the Adviser (a “Change of Control Event”) and therefore may be deemed an “assignment” causing a termination of each Fund’s
| | |
| |
| abfunds.com | | AB TAX-MANAGED ALL MARKET INCOME PORTFOLIO | 65 |
NOTES TO FINANCIAL STATEMENTS(continued)
current investment advisory agreement. In order to ensure that the existing investment advisory services could continue uninterrupted, at meetings held in late July through early August 2018, the Boards of Directors/Trustees (each a “Board” and collectively, the “Boards”) approved new investment advisory agreements with the Adviser, in connection with the Plan. The Boards also agreed to call and hold a joint meeting of shareholders on October 11, 2018, for shareholders of each Fund to (1) approve the new investment advisory agreement with the Adviser that would be effective after the first Change of Control Event and (2) approve any future advisory agreement approved by the Board and that has terms not materially different from the current agreement, in the event there are subsequent Change of Control Events arising from completion of the Plan that terminate the advisory agreement after the first Change of Control Event. Approval of a future advisory agreement means that shareholders may not have another opportunity to vote on a new agreement with the Adviser even upon a change of control, as long as no single person or group of persons acting together gains “control” (as defined in the 1940 Act) of AXA Equitable.
At the December 18, 2018 adjourned shareholder meeting, shareholders approved the new and future investment advisory agreements.
The Fund may invest in AB Government Money Market Portfolio (the “Government Money Market Portfolio”) which has a contractual annual advisory fee rate of .20% of the portfolio’s average daily net assets and bears its own expenses. Effective August 1, 2018, the Adviser has contractually agreed to waive .10% of the advisory fee of Government Money Market Portfolio (resulting in a net advisory fee of .10%) until August 31, 2019. In connection with the investment by the Fund in Government Money Market Portfolio, the Adviser has contractually agreed to waive its advisory fee from the Fund in an amount equal to the Fund’s pro rata share of the effective advisory fee of Government Money Market Portfolio, as borne indirectly by the Fund as an acquired fund fee and expense. For the six months ended February 28, 2019, such waiver amounted to $2,173.
A summary of the Fund’s transactions in AB mutual funds for the six months ended February 28, 2019 is as follows:
| | | | | | | | | | | | | | | | | | | | |
Fund | | Market Value
8/31/18
(000) | | | Purchases
at Cost
(000) | | | Sales
Proceeds
(000) | | | Market Value
2/28/19
(000) | | | Dividend
Income
(000) | |
Government Money Market Portfolio | | $ | 1,665 | | | $ | 27,321 | | | $ | 28,986 | | | $ | – 0 | – | | $ | 48 | |
| | |
| |
| 66 | AB TAX-MANAGED ALL MARKET INCOME PORTFOLIO | | abfunds.com |
NOTES TO FINANCIAL STATEMENTS(continued)
The Fund compensates AllianceBernstein Investor Services, Inc. (“ABIS”), a wholly-owned subsidiary of the Adviser, under a Transfer Agency Agreement for providing personnel and facilities to perform transfer agency services for the Fund. ABIS may make payments to intermediaries that provide omnibus account services,sub-accounting services and/or networking services. Such compensation retained by ABIS amounted to $21,971 for the six months ended February 28, 2019.
AllianceBernstein Investments, Inc. (the “Distributor”), a wholly-owned subsidiary of the Adviser, serves as the distributor of the Fund’s shares. The Distributor has advised the Fund that it has retainedfront-end sales charges of $131 from the sale of Class A shares and received $17, $155 and $130 in contingent deferred sales charges imposed upon redemptions by shareholders of Class A, Class B and Class C shares, respectively, for the six months ended February 28, 2019.
Brokerage commissions paid on investment transactions for the six months ended February 28, 2019 amounted to $10,776, of which $0 and $0, respectively, was paid to Sanford C. Bernstein & Co. LLC and Sanford C. Bernstein Limited, affiliates of the Adviser.
NOTE C
Distribution Plans
The Fund has adopted a Plan for each class of shares of the Fund pursuant to Rule12b-1 under the Investment Company Act of 1940 (each a “Plan” and collectively the “Plans”). Under the Plans, the Fund pays distribution and servicing fees to the Distributor at an annual rate of up to .50% of the Fund’s average daily net assets attributable to Class A shares and 1% of the Fund’s average daily net assets attributable to both Class B and Class C shares. There are no distribution and servicing fees on the Advisor Class shares. The fees are accrued daily and paid monthly. Effective August 1, 2014, payments under the Class A shares are limited to an annual rate of .25% of Class A share’s average daily net assets. The Plans provide that the Distributor will use such payments in their entirety for distribution assistance and promotional activities. The Fund is not obligated under the Plan to pay any distribution services fee in excess of the amounts set forth above. The purpose of the payments to the Distributor under the Plan is to compensate the Distributor for its distribution services with respect to the sale of the Fund’s shares. Since the Distributor’s compensation is not directly tied to its expenses, the amount of compensation received by it under the Plan during any year may be more or less than its actual expenses. For this reason, the Plan is characterized by the staff of the Securities Exchange Commission as being a “compensation” plan.
| | |
| |
| abfunds.com | | AB TAX-MANAGED ALL MARKET INCOME PORTFOLIO | 67 |
NOTES TO FINANCIAL STATEMENTS(continued)
In the event that a Plan is terminated or not continued, no distribution services fees (other than current amounts accrued but not yet paid) would be owed by the Fund to the Distributor with respect to the relevant class. The Plans also provide that the Adviser may use its own resources to finance the distribution of the Fund’s shares.
NOTE D
Investment Transactions
Purchases and sales of investment securities (excluding short-term investments) for the six months ended February 28, 2019 were as follows:
| | | | | | | | |
| | | Purchases | | | Sales | |
Investment securities (excluding
U.S. government securities) | | $ | 9,570,103 | | | $ | 19,670,549 | |
U.S. government securities | | | – 0 | – | | | – 0 | – |
The cost of investments for federal income tax purposes was substantially the same as the cost for financial reporting purposes. Accordingly, gross unrealized appreciation and unrealized depreciation are as follows:
| | | | |
Gross unrealized appreciation | | $ | 5,355,379 | |
Gross unrealized depreciation | | | (3,292,265 | ) |
| | | | |
Net unrealized appreciation | | $ | 2,063,114 | |
| | | | |
1. Derivative Financial Instruments
The Fund may use derivatives in an effort to earn income and enhance returns, to replace more traditional direct investments, to obtain exposure to otherwise inaccessible markets (collectively, “investment purposes”), or to hedge or adjust the risk profile of its portfolio.
The principal types of derivatives utilized by the Fund, as well as the methods in which they may be used are:
The Fund may buy or sell futures for investment purposes or for the purpose of hedging its portfolio against adverse effects of potential movements in the market. The Fund bears the market risk that arises from changes in the value of these instruments and the imperfect correlation between movements in the price of the futures and movements in the price of the assets, reference rates or indices which they are designed to track. Among other things, the Fund may purchase or sell futures for foreign currencies or options thereon fornon-hedging purposes as a means of making direct investment in foreign currencies, as described below under “Currency Transactions”.
| | |
| |
| 68 | AB TAX-MANAGED ALL MARKET INCOME PORTFOLIO | | abfunds.com |
NOTES TO FINANCIAL STATEMENTS(continued)
At the time the Fund enters into futures, the Fund deposits and maintains as collateral an initial margin with the broker, as required by the exchange on which the transaction is effected. Such amount is shown as cash collateral due from broker on the statement of assets and liabilities. Pursuant to the contract, the Fund agrees to receive from or pay to the broker an amount of cash equal to the daily fluctuation in the value of the contract. Such receipts or payments are known as variation margin and are recorded by the Fund as unrealized gains or losses. Risks may arise from the potential inability of a counterparty to meet the terms of the contract. The credit/counterparty risk for exchange-traded futures is generally less than privately negotiated futures, since the clearinghouse, which is the issuer or counterparty to each exchange-traded future, has robust risk mitigation standards, including the requirement to provide initial and variation margin. When the contract is closed, the Fund records a realized gain or loss equal to the difference between the value of the contract at the time it was opened and the time it was closed.
Use of long futures subjects the Fund to risk of loss in excess of the amounts shown on the statement of assets and liabilities, up to the notional value of the futures. Use of short futures subjects the Fund to unlimited risk of loss. Under some circumstances, futures exchanges may establish daily limits on the amount that the price of futures can vary from the previous day’s settlement price, which could effectively prevent liquidation of unfavorable positions.
During the six months ended February 28, 2019, the Fund held futures for hedging andnon-hedging purposes.
| | • | | Forward Currency Exchange Contracts |
The Fund may enter into forward currency exchange contracts in order to hedge its exposure to changes in foreign currency exchange rates on its foreign portfolio holdings, to hedge certain firm purchase and sale commitments denominated in foreign currencies and fornon-hedging purposes as a means of making direct investments in foreign currencies, as described below under “Currency Transactions”.
A forward currency exchange contract is a commitment to purchase or sell a foreign currency at a future date at a negotiated forward rate. The gain or loss arising from the difference between the original contract and the closing of such contract would be included in net realized gain or loss on forward currency exchange contracts. Fluctuations in the value of open forward currency exchange contracts are recorded for financial reporting purposes as unrealized appreciation and/or depreciation by the Fund. Risks may arise from
| | |
| |
| abfunds.com | | AB TAX-MANAGED ALL MARKET INCOME PORTFOLIO | 69 |
NOTES TO FINANCIAL STATEMENTS(continued)
the potential inability of a counterparty to meet the terms of a contract and from unanticipated movements in the value of a foreign currency relative to the U.S. dollar.
During the six months ended February 28, 2019, the Fund held forward currency exchange contracts for hedging andnon-hedging purposes.
For hedging and investment purposes, the Fund may purchase and write (sell) put and call options on U.S. and foreign securities, including government securities, and foreign currencies that are traded on U.S. and foreign securities exchanges andover-the-counter markets. Among other things, the Fund may use options transactions fornon-hedging purposes as a means of making direct investments in foreign currencies, as described below under “Currency Transactions” and may use options strategies involving the purchase and/or writing of various combinations of call and/or put options, for hedging and investment purposes.
The risk associated with purchasing an option is that the Fund pays a premium whether or not the option is exercised. Additionally, the Fund bears the risk of loss of the premium and change in market value should the counterparty not perform under the contract. If a put or call option purchased by the Fund were permitted to expire without being sold or exercised, its premium would represent a loss to the Fund. Put and call options purchased are accounted for in the same manner as portfolio securities. The cost of securities acquired through the exercise of call options is increased by premiums paid. The proceeds from securities sold through the exercise of put options are decreased by the premiums paid.
When the Fund writes an option, the premium received by the Fund is recorded as a liability and is subsequently adjusted to the current market value of the option written. The Fund’s maximum payment for written put options equates to the number of shares multiplied by the strike price, as included on the Portfolio of Investments. In certain circumstances maximum payout amounts may be partially offset by recovery values of the respective referenced assets and upfront premium received upon entering into the contract. Premiums received from written options which expire unexercised are recorded by the Fund on the expiration date as realized gains from options written. The difference between the premium received and the amount paid on effecting a closing purchase transaction, including brokerage commissions, is also treated as a realized gain, or if the premium received is less than the amount paid for the closing purchase transaction, as a realized loss. If a call option is exercised, the premium received is added to the proceeds from the sale of the
| | |
| |
| 70 | AB TAX-MANAGED ALL MARKET INCOME PORTFOLIO | | abfunds.com |
NOTES TO FINANCIAL STATEMENTS(continued)
underlying security or currency in determining whether the Fund has realized a gain or loss. If a put option is exercised, the premium received reduces the cost basis of the security or currency purchased by the Fund. In writing an option, the Fund bears the market risk of an unfavorable change in the price of the security or currency underlying the written option. Exercise of an option written by the Fund could result in the Fund selling or buying a security or currency at a price different from the current market value.
During the six months ended February 28, 2019, the Fund held written options for hedging andnon-hedging purposes.
The Fund may enter into swaps to hedge its exposure to interest rates. The Fund may also enter into swaps fornon-hedging purposes as a means of gaining market exposures, making direct investments in foreign currencies, as described below under “Currency Transactions” or in order to take a “long” or “short” position with respect to an underlying referenced asset described below under “Total Return Swaps”. A swap is an agreement that obligates two parties to exchange a series of cash flows at specified intervals based upon or calculated by reference to changes in specified prices or rates for a specified amount of an underlying asset. The payment flows are usually netted against each other, with the difference being paid by one party to the other. In addition, collateral may be pledged or received by the Fund in accordance with the terms of the respective swaps to provide value and recourse to the Fund or its counterparties in the event of default, bankruptcy or insolvency by one of the parties to the swap.
Risks may arise as a result of the failure of the counterparty to the swap to comply with the terms of the swap. The loss incurred by the failure of a counterparty is generally limited to the net interim payment to be received by the Fund, and/or the termination value at the end of the contract. Therefore, the Fund considers the creditworthiness of each counterparty to a swap in evaluating potential counterparty risk. This risk is mitigated by having a netting arrangement between the Fund and the counterparty and by the posting of collateral by the counterparty to the Fund to cover the Fund’s exposure to the counterparty. Additionally, risks may arise from unanticipated movements in interest rates or in the value of the underlying securities. The Fund accrues for the interim payments on swaps on a daily basis, with the net amount recorded within unrealized appreciation/depreciation of swaps on the statement of assets and liabilities, where applicable. Once the interim payments are settled in cash, the net amount is recorded as realized gain/(loss) on swaps on the statement
| | |
| |
| abfunds.com | | AB TAX-MANAGED ALL MARKET INCOME PORTFOLIO | 71 |
NOTES TO FINANCIAL STATEMENTS(continued)
of operations, in addition to any realized gain/(loss) recorded upon the termination of swaps. Upfront premiums paid or received for OTC swaps are recognized as cost or proceeds on the statement of assets and liabilities and are amortized on a straight line basis over the life of the contract. Amortized upfront premiums are included in net realized gain/(loss) from swaps on the statement of operations. Fluctuations in the value of swaps are recorded as a component of net change in unrealized appreciation/depreciation of swaps on the statement of operations.
Certain standardized swaps, including certain interest rate swaps and credit default swaps, are (or soon will be) subject to mandatory central clearing. Cleared swaps are transacted through futures commission merchants (“FCMs”) that are members of central clearinghouses, with the clearinghouse serving as central counterparty, similar to transactions in futures contracts. Centralized clearing will be required for additional categories of swaps on aphased-in basis based on requirements published by the Securities and Exchange Commission and Commodity Futures Trading Commission.
At the time the Fund enters into a centrally cleared swap, the Fund deposits and maintains as collateral an initial margin with the broker, as required by the clearinghouse on which the transaction is effected. Such amount is shown as cash collateral due from broker on the statement of assets and liabilities. Pursuant to the contract, the Fund agrees to receive from or pay to the broker an amount of cash equal to the daily fluctuation in the value of the contract. Such receipts or payments are known as variation margin and are recorded by the Fund as unrealized gains or losses. Risks may arise from the potential inability of a counterparty to meet the terms of the contract. The credit/counterparty risk for centrally cleared swaps is generally less thannon-centrally cleared swaps, since the clearinghouse, which is the issuer or counterparty to each centrally cleared swap, has robust risk mitigation standards, including the requirement to provide initial and variation margin. When the contract is closed, the Fund records a realized gain or loss equal to the difference between the value of the contract at the time it was opened and the time it was closed.
Interest Rate Swaps:
The Fund is subject to interest rate risk exposure in the normal course of pursuing its investment objectives. Because the Fund holds fixed rate bonds, the value of these bonds may decrease if interest rates rise. To help hedge against this risk and to maintain its ability to generate income at prevailing market rates, the Fund may enter into interest rate swaps. Interest rate swaps are agreements between two parties to exchange cash flows based on a notional amount. The
| | |
| |
| 72 | AB TAX-MANAGED ALL MARKET INCOME PORTFOLIO | | abfunds.com |
NOTES TO FINANCIAL STATEMENTS(continued)
Fund may elect to pay a fixed rate and receive a floating rate, or, receive a fixed rate and pay a floating rate on a notional amount.
In addition, the Fund may also enter into interest rate swap transactions to preserve a return or spread on a particular investment or portion of its portfolio, or protecting against an increase in the price of securities the Fund anticipates purchasing at a later date. Interest rate swaps involve the exchange by a Fund with another party of their respective commitments to pay or receive interest (e.g., an exchange of floating rate payments for fixed rate payments) computed based on a contractually-based principal (or “notional”) amount. Interest rate swaps are entered into on a net basis (i.e., the two payment streams are netted out, with the Fund receiving or paying, as the case may be, only the net amount of the two payments).
During the six months ended February 28, 2019, the Fund held interest rate swaps for hedging andnon-hedging purposes.
Inflation (CPI) Swaps:
Inflation swap agreements are contracts in which one party agrees to pay the cumulative percentage increase in a price index (the Consumer Price Index with respect to CPI swaps) over the term of the swap (with some lag on the inflation index), and the other pays a compounded fixed rate. Inflation swaps may be used to protect the net asset value, or NAV, of a Fund against an unexpected change in the rate of inflation measured by an inflation index since the value of these agreements is expected to increase if there are unexpected inflation increases.
During the six months ended February 28, 2019, the Fund held inflation (CPI) swaps for hedging andnon-hedging purposes.
Credit Default Swaps:
The Fund may enter into credit default swaps, including to manage its exposure to the market or certain sectors of the market, to reduce its risk exposure to defaults by corporate and sovereign issuers held by the Fund, or to create exposure to corporate or sovereign issuers to which it is not otherwise exposed. The Fund may purchase credit protection (“Buy Contract”) or provide credit protection (“Sale Contract”) on the referenced obligation of the credit default swap. During the term of the swap, the Fund receives/(pays) fixed payments from/(to) the respective counterparty, calculated at the agreed upon rate applied to the notional amount. If the Fund is a buyer/(seller) of protection and a credit event occurs, as defined under the terms of the swap, the Fund will either (i) receive from the seller/(pay to the buyer) of protection an amount equal to the notional amount of the swap (the “Maximum Payout Amount”) and deliver/(take delivery of)
| | |
| |
| abfunds.com | | AB TAX-MANAGED ALL MARKET INCOME PORTFOLIO | 73 |
NOTES TO FINANCIAL STATEMENTS(continued)
the referenced obligation or (ii) receive/(pay) a net settlement amount in the form of cash or securities equal to the notional amount of the swap less the recovery value of the referenced obligation.
In certain circumstances Maximum Payout Amounts may be partially offset by recovery values of the respective referenced obligations, upfront premium received upon entering into the agreement, or net amounts received from settlement of buy protection credit default swaps entered into by the Fund for the same referenced obligations with the same counterparty. As of February 28, 2019, the Fund did not have Buy Contracts outstanding with respect to the same referenced obligations and same counterparty for its Sale Contracts outstanding.
Credit default swaps may involve greater risks than if a Fund had invested in the referenced obligation directly. Credit default swaps are subject to general market risk, liquidity risk, counterparty risk and credit risk. If the Fund is a buyer of protection and no credit event occurs, it will lose the payments it made to its counterparty. If the Fund is a seller of protection and a credit event occurs, the value of the referenced obligation received by the Fund coupled with the periodic payments previously received, may be less than the Maximum Payout Amount it pays to the buyer, resulting in a net loss to the Fund.
Implied credit spreads over U.S. Treasuries of comparable maturity utilized in determining the market value of credit default swaps on issuers as of period end are disclosed in the portfolio of investments. The implied spreads serve as an indicator of the current status of the payment/performance risk and typically reflect the likelihood of default by the issuer of the referenced obligation. The implied credit spread of a particular reference obligation also reflects the cost of buying/selling protection and may reflect upfront payments required to be made to enter into the agreement. Widening credit spreads typically represent a deterioration of the referenced obligation’s credit soundness and greater likelihood of default or other credit event occurring as defined under the terms of the agreement. A credit spread identified as “Defaulted” indicates a credit event has occurred for the referenced obligation.
During the six months ended February 28, 2019, the Fund held credit default swaps for hedging andnon-hedging purposes.
Total Return Swaps:
The Fund may enter into total return swaps in order to take a “long” or “short” position with respect to an underlying referenced asset. The Fund is subject to market price volatility of the underlying referenced asset. A total return swap involves commitments to pay interest in exchange for a market linked return based on a notional amount. To
| | |
| |
| 74 | AB TAX-MANAGED ALL MARKET INCOME PORTFOLIO | | abfunds.com |
NOTES TO FINANCIAL STATEMENTS(continued)
the extent that the total return of the security, group of securities or index underlying the transaction exceeds or falls short of the offsetting interest obligation, the Fund will receive a payment from or make a payment to the counterparty.
During the six months ended February 28, 2019, the Fund held total return swaps for hedging andnon-hedging purposes.
The Fund typically enters into International Swaps and Derivatives Association, Inc. Master Agreements (“ISDA Master Agreement”) with its OTC derivative contract counterparties in order to, among other things, reduce its credit risk to OTC counterparties. ISDA Master Agreements include provisions for general obligations, representations, collateral and events of default or termination. Under an ISDA Master Agreement, the Fund typically may offset with the OTC counterparty certain derivative financial instruments’ payables and/or receivables with collateral held and/or posted and create one single net payment(close-out netting) in the event of default or termination. In the event of a default by an OTC counterparty, the return of collateral with market value in excess of the Fund’s net liability, held by the defaulting party, may be delayed or denied.
The Fund’s ISDA Master Agreements may contain provisions for early termination of OTC derivative transactions in the event the net assets of the Fund decline below specific levels (“net asset contingent features”). If these levels are triggered, the Fund’s OTC counterparty has the right to terminate such transaction and require the Fund to pay or receive a settlement amount in connection with the terminated transaction. If OTC derivatives were held at period end, please refer to netting arrangements by the OTC counterparty tables below for additional details.
During the six months ended February 28, 2019, the Fund had entered into the following derivatives:
| | | | | | | | | | | | |
| | | Asset Derivatives | | | Liability Derivatives | |
Derivative Type | | Statement of
Assets and
Liabilities
Location | | Fair Value | | | Statement of
Assets and
Liabilities
Location | | Fair Value | |
Interest rate contracts | | Receivable/Payable for variation margin on futures | | $ | 6,587 | * | | Receivable/Payable for variation margin on futures | | $ | 102,103 | * |
| | | | |
Equity contracts | | Receivable/Payable for variation margin on futures | | | 794,469 | * | | Receivable/Payable for variation margin on futures | | | 118,845 | * |
| | |
| |
| abfunds.com | | AB TAX-MANAGED ALL MARKET INCOME PORTFOLIO | 75 |
NOTES TO FINANCIAL STATEMENTS(continued)
| | | | | | | | | | | | |
| | | Asset Derivatives | | | Liability Derivatives | |
Derivative Type | | Statement of
Assets and
Liabilities
Location | | Fair Value | | | Statement of
Assets and
Liabilities
Location | | Fair Value | |
| | | | |
Interest rate contracts | | Receivable/Payable for variation margin on centrally cleared swaps | | $ | 156,262 | * | | Receivable/Payable for variation margin on centrally cleared swaps | | $ | 345 | * |
| | | | |
Foreign currency contracts | | Unrealized appreciation on forward currency exchange contracts | | | 391,492 | | | Unrealized depreciation on forward currency exchange contracts | | | 218,025 | |
| | | | |
Equity contracts | | | | | | | | Options written, at value | | | 99,317 | |
| | | | |
Interest rate contracts | | | | | | | | Unrealized depreciation on inflation swaps | | | 141,151 | |
| | | | |
Credit contracts | | | | | | | | Market value on credit default swaps | | | 73,763 | |
| | | | |
Credit contracts | | Unrealized appreciation on total return swaps | | | 6,713 | | | Unrealized depreciation on total return swaps | | | 405,611 | |
| | | | | | | | | | | | |
Total | | | | $ | 1,355,523 | | | | | $ | 1,159,160 | |
| | | | | | | | | | | | |
| * | Only variation margin receivable/payable at period end is reported within the statement of assets and liabilities. This amount reflects cumulative unrealized appreciation/(depreciation) on futures and centrally cleared swaps as reported in the portfolio of investments. |
| | | | | | | | | | |
Derivative Type | | Location of Gain
or (Loss) on
Derivatives
Within Statement of
Operations | | Realized Gain
or (Loss) on
Derivatives | | | Change in
Unrealized
Appreciation or
(Depreciation) | |
Interest rate contracts | | Net realized gain (loss) on futures; Net change in unrealized appreciation/depreciation of futures | | $ | (9,892 | ) | | $ | (80,103 | ) |
| | | |
Equity contracts | | Net realized gain (loss) on futures; Net change in unrealized appreciation/depreciation of futures | | | (1,141,908 | ) | | | 489,209 | |
| | |
| |
| 76 | AB TAX-MANAGED ALL MARKET INCOME PORTFOLIO | | abfunds.com |
NOTES TO FINANCIAL STATEMENTS(continued)
| | | | | | | | | | |
Derivative Type | | Location of Gain
or (Loss) on
Derivatives
Within Statement of
Operations | | Realized Gain
or (Loss) on
Derivatives | | | Change in
Unrealized
Appreciation or
(Depreciation) | |
| | | |
Foreign currency contracts | | Net realized gain (loss) on forward currency exchange contracts; Net change in unrealized appreciation/depreciation of forward currency exchange contracts | | $ | 193,194 | | | $ | 381,823 | |
| | | |
Equity contracts | | Net realized gain (loss) on options written; Net change in unrealized appreciation/depreciation of options written | | | (446,595 | ) | | | (9,825 | ) |
| | | |
Interest rate contracts | | Net realized gain (loss) on swaps; Net change in unrealized appreciation/depreciation of swaps | | | 45,950 | | | | 24,708 | |
| | | |
Credit contracts | | Net realized gain (loss) on swaps; Net change in unrealized appreciation/depreciation of swaps | | | 139,781 | | | | (322,457 | ) |
| | | |
Equity contracts | | Net realized gain (loss) on swaps; Net change in unrealized appreciation/depreciation of swaps | | | 222,587 | | | | 9,426 | |
| | | | | | | | | | |
Total | | | | $ | (996,883 | ) | | $ | 492,781 | |
| | | | | | | | | | |
The following table represents the average monthly volume of the Fund’s derivative transactions during the six months ended February 28, 2019:
| | | | |
Futures: | | | | |
Average original value of buy contracts | | $ | 27,695,784 | |
Average original value of sale contracts | | $ | 9,356,195 | |
| |
Forward Currency Exchange Contracts: | | | | |
Average principal amount of buy contracts | | $ | 16,703,997 | |
Average principal amount of sale contracts | | $ | 17,797,939 | |
| |
Options Written: | | | | |
Average notional amount | | $ | 10,673,456 | |
| |
Inflation Swaps: | | | | |
Average notional amount | | $ | 10,758,286 | |
| |
Centrally Cleared Interest Rate Swaps: | | | | |
Average notional amount | | $ | 6,248,105 | |
| |
Credit Default Swaps: | | | | |
Average notional amount of buy contracts | | $ | 539,000 | |
| |
Total Return Swaps: | | | | |
Average notional amount | | $ | 43,803,074 | |
| | |
| |
| abfunds.com | | AB TAX-MANAGED ALL MARKET INCOME PORTFOLIO | 77 |
NOTES TO FINANCIAL STATEMENTS(continued)
For financial reporting purposes, the Fund does not offset derivative assets and derivative liabilities that are subject to netting arrangements in the statement of assets and liabilities.
All OTC derivatives held at period end were subject to netting arrangements. The following table presents the Fund’s derivative assets and liabilities by OTC counterparty net of amounts available for offset under ISDA Master Agreements (“MA”) and net of the related collateral received/pledged by the Fund as of February 28, 2019. Exchange-traded derivatives and centrally cleared swaps are not subject to netting arrangements and as such are excluded from the table.
| | | | | | | | | | | | | | | | | | | | |
Counterparty | | Derivatives
Assets
Subject to a
MA | | | Derivatives
Available
for Offset | | | Cash
Collateral
Received* | | | Security
Collateral
Received* | | | Net Amount of
Derivatives
Assets | |
Barclays Bank PLC | | $ | 132,289 | | | $ | (132,289 | ) | | $ | – 0 | – | | $ | – 0 | – | | $ | – 0 | – |
BNP Paribas SA | | | 35,300 | | | | (8,362 | ) | | | – 0 | – | | | – 0 | – | | | 26,938 | |
Citibank, NA | | | 4,725 | | | | (4,725 | ) | | | – 0 | – | | | – 0 | – | | | – 0 | – |
Credit Suisse International | | | 1,042 | | | | (1,042 | ) | | | – 0 | – | | | – 0 | – | | | – 0 | – |
Deutsche Bank AG | | | 3,120 | | | | – 0 | – | | | – 0 | – | | | – 0 | – | | | 3,120 | |
Goldman Sachs Bank USA/Goldman Sachs International | | | 37,062 | | | | (37,062 | ) | | | – 0 | – | | | – 0 | – | | | – 0 | – |
JPMorgan Chase Bank, NA | | | 37,990 | | | | (37,990 | ) | | | – 0 | – | | | – 0 | – | | | – 0 | – |
Morgan Stanley & Co., Inc. | | | 18,105 | | | | (3,904 | ) | | | – 0 | – | | | – 0 | – | | | 14,201 | |
Natwest Markets PLC | | | 15,034 | | | | (1,345 | ) | | | – 0 | – | | | – 0 | – | | | 13,689 | |
State Street Bank & Trust Co. | | | 113,538 | | | | (47,020 | ) | | | – 0 | – | | | – 0 | – | | | 66,518 | |
| | | | | | | | | | | | | | | | | | | | |
Total | | $ | 398,205 | | | $ | (273,739 | ) | | $ | – 0 | – | | $ | – 0 | – | | $ | 124,466 | ^ |
| | | | | | | | | | | | | | | | | | | | |
| | | | | | | | | | | | | | | | | | | | |
Counterparty | | Derivatives
Liabilities
Subject to a
MA | | | Derivatives
Available
for Offset | | | Cash
Collateral
Pledged* | | | Security
Collateral
Pledged* | | | Net Amount of
Derivatives
Liabilities | |
Bank of America, NA | | $ | 3,130 | | | $ | – 0 | – | | $ | – 0 | – | | $ | – 0 | – | | $ | 3,130 | |
Barclays Bank PLC | | | 180,503 | | | | (132,289 | ) | | | – 0 | – | | | – 0 | – | | | 48,214 | |
BNP Paribas SA | | | 8,362 | | | | (8,362 | ) | | | – 0 | – | | | – 0 | – | | | – 0 | – |
Citibank, NA | | | 73,508 | | | | (4,725 | ) | | | – 0 | – | | | – 0 | – | | | 68,783 | |
Citigroup Global Markets, Inc. | | | 9,449 | | | | – 0 | – | | | – 0 | – | | | – 0 | – | | | 9,449 | |
| | |
| |
| 78 | AB TAX-MANAGED ALL MARKET INCOME PORTFOLIO | | abfunds.com |
NOTES TO FINANCIAL STATEMENTS(continued)
| | | | | | | | | | | | | | | | | | | | |
Counterparty | | Derivatives
Liabilities
Subject to a
MA | | | Derivatives
Available
for Offset | | | Cash
Collateral
Pledged* | | | Security
Collateral
Pledged* | | | Net Amount of
Derivatives
Liabilities | |
Credit Suisse International | | $ | 73,114 | | | $ | (1,042 | ) | | $ | – 0 | – | | $ | – 0 | – | | $ | 72,072 | |
Goldman Sachs Bank USA/Goldman Sachs International | | | 99,564 | | | | (37,062 | ) | | | (62,502 | ) | |
| – 0
| –
| | | – 0 | – |
JPMorgan Chase Bank, NA | | | 427,677 | | | | (37,990 | ) | | | – 0 | – | | | – 0 | – | | | 389,687 | |
Morgan Stanley & Co., Inc. | | | 3,904 | | | | (3,904 | ) | | | – 0 | – | | | – 0 | – | | | – 0 | – |
Natwest Markets PLC | | | 1,345 | | | | (1,345 | ) | | | – 0 | – | | | – 0 | – | | | – 0 | – |
Standard Chartered Bank | | | 10,291 | | | | – 0 | – | | | – 0 | – | | | – 0 | – | | | 10,291 | |
State Street Bank & Trust Co. | | | 47,020 | | | | (47,020 | ) | | | – 0 | – | | | – 0 | – | | | – 0 | – |
| | | | | | | | | | | | | | | | | | | | |
Total | | $ | 937,867 | | | $ | (273,739 | ) | | $ | (62,502 | ) | | $ | – 0 | – | | $ | 601,626 | ^ |
| | | | | | | | | | | | | | | | | | | | |
| * | The actual collateral received/pledged may be more than the amount reported due to over-collateralization. |
| ^ | Net amount represents the net receivable/payable that would be due from/to the counterparty in the event of default or termination. The net amount from OTC financial derivative instruments can only be netted across transactions governed under the same master agreement with the same counterparty. |
2. Currency Transactions
The Fund may invest innon-U.S. Dollar-denominated securities on a currency hedged or unhedged basis. The Fund may seek investment opportunities by taking long or short positions in currencies through the use of currency-related derivatives, including forward currency exchange contracts, futures and options on futures, swaps, and other options. The Fund may enter into transactions for investment opportunities when it anticipates that a foreign currency will appreciate or depreciate in value but securities denominated in that currency are not held by the Fund and do not present attractive investment opportunities. Such transactions may also be used when the Adviser believes that it may be more efficient than a direct investment in a foreign currency-denominated security. The Fund may also conduct currency exchange contracts on a spot basis (i.e., for cash at the spot rate prevailing in the currency exchange market for buying or selling currencies).
| | |
| |
| abfunds.com | | AB TAX-MANAGED ALL MARKET INCOME PORTFOLIO | 79 |
NOTES TO FINANCIAL STATEMENTS(continued)
NOTE E
Shares of Beneficial Interest
Transactions in shares of beneficial interest for each class were as follows:
| | | | | | | | | | | | | | | | | | | | | | | | |
| | | | | | | | | | | | | | | | | | | | | | | | |
| | | Shares | | | | | | Amount | | | | |
| | | Six Months Ended
February 28, 2019
(unaudited) | | | Year Ended
August 31, 2018 | | | | | | Six Months Ended
February 28, 2019
(unaudited) | | | Year Ended
August 31, 2018 | | | | |
| | | | | | | | |
| Class A | | | | | | | | | | | | | | | | | | | | | | | | |
Shares sold | | | 62,831 | | | | 59,319 | | | | | | | $ | 736,473 | | | $ | 776,388 | | | | | |
| | | | | |
Shares issued in reinvestment of dividends and distributions | | | 234,637 | | | | 589,797 | | | | | | | | 2,725,020 | | | | 7,572,682 | | | | | |
| | | | | |
Shares converted from Class B | | | 3,725 | | | | 9,276 | | | | | | | | 45,154 | | | | 122,429 | | | | | |
| | | | | |
Shares converted from Class C | | | 48,025 | | | | 209,112 | | | | | | | | 592,738 | | | | 2,706,653 | | | | | |
| | | | | |
Shares redeemed | | | (566,123 | ) | | | (995,328 | ) | | | | | | | (6,723,087 | ) | | | (12,898,561 | ) | | | | |
| | | | | |
Net decrease | | | (216,905 | ) | | | (127,824 | ) | | | | | | $ | (2,623,702 | ) | | $ | (1,720,409 | ) | | | | |
| | | | | |
| | | | | | | | | | | | | | | | | | | | | | | | |
| Class B | | | | | | | | | | | | | | | | | | | | | | | | |
Shares sold | | | 1,631 | | | | 3,637 | | | | | | | $ | 20,238 | | | $ | 48,126 | | | | | |
| | | | | |
Shares issued in reinvestment of dividends and distributions | | | 1,908 | | | | 4,911 | | | | | | | | 22,636 | | | | 64,560 | | | | | |
| | | | | |
Shares converted to Class A | | | 3,638 | | | | (9,118 | ) | | | | | | | (45,154 | ) | | | (122,429 | ) | | | | |
| | | | | |
Shares redeemed | | | (11,030 | ) | | | (6,107 | ) | | | | | | | (45,882 | ) | | | (79,922 | ) | | | | |
| | | | | |
Net decrease | | | (3,853 | ) | | | (6,677 | ) | | | | | | $ | (48,162 | ) | | $ | (89,665 | ) | | | | |
| | | | | |
| | | | | | | | | | | | | | | | | | | | | | | | |
| Class C | | | | | | | | | | | | | | | | | | | | | | | | |
Shares sold | | | 20,082 | | | | 29,177 | | | | | | | $ | 240,605 | | | $ | 379,376 | | | | | |
| | | | | |
Shares issued in reinvestment of dividends and distributions | | | 21,718 | | | | 65,212 | | | | | | | | 256,037 | | | | 852,359 | | | | | |
| | | | | |
Shares converted to Class A | | | 47,221 | | | | (206,704 | ) | | | | | | | (592,738 | ) | | | (2,706,653 | ) | | | | |
| | | | | |
Shares redeemed | | | (118,696 | ) | | | (175,835 | ) | | | | | | | (299,076 | ) | | | (2,309,610 | ) | | | | |
| | | | | |
Net decrease | | | (29,675 | ) | | | (288,150 | ) | | | | | | $ | (395,172 | ) | | $ | (3,784,528 | ) | | | | |
| | | | | |
| | | | | | | | | | | | | | | | | | | | | | | | |
| Advisor Class | | | | | | | | | | | | | | | | | | | | | | | | |
Shares sold | | | 256,821 | | | | 409,109 | | | | | | | $ | 3,066,472 | | | $ | 5,322,973 | | | | | |
| | | | | |
Shares issued in reinvestment of dividends and distributions | | | 119,684 | | | | 301,378 | | | | | | | | 1,391,485 | | | | 3,875,451 | | | | | |
| | | | | |
Shares redeemed | | | (406,722 | ) | | | (756,015 | ) | | | | | | | (4,905,281 | ) | | | (9,704,923 | ) | | | | |
| | | | | |
Net decrease | | | (30,217 | ) | | | (45,528 | ) | | | | | | $ | (447,324 | ) | | $ | (506,499 | ) | | | | |
| | | | | |
| | |
| |
| 80 | AB TAX-MANAGED ALL MARKET INCOME PORTFOLIO | | abfunds.com |
NOTES TO FINANCIAL STATEMENTS(continued)
NOTE F
Risks Involved in Investing in the Fund
Interest Rate Risk and Credit Risk—Interest rate risk is the risk that changes in interest rates will affect the value of the Fund’s investments in fixed-income debt securities such as bonds or notes. Increases in interest rates may cause the value of the Fund’s investments to decline. Credit risk is the risk that the issuer or guarantor of a debt security, or the counterparty to a derivative contract, will be unable or unwilling to make timely principal and/or interest payments, or to otherwise honor its obligations. The degree of risk for a particular security may be reflected in its credit rating. Credit risk is greater for medium quality and lower-rated securities. Lower-rated debt securities and similar unrated securities (commonly known as “junk bonds”) have speculative elements or are predominantly speculative risks.
Allocation Risk—The allocation of investments among different investment styles, such as equity or debt, growth or value, U.S. ornon-U.S. securities, or diversification strategies, may have a more significant effect on the Fund’s net asset value, or NAV, when one of these investments is performing more poorly than another.
High Yield Securities Risk—Investments in fixed-income securities with ratings below investment grade (commonly known as “junk bonds”) tend to have a higher probability that an issuer will default or fail to meet its payment obligations. These securities may be subject to greater price volatility due to such factors as specific corporate developments, interest rate sensitivity, negative perceptions of the junk bond market generally and less secondary market liquidity.
Inflation Risk—This is the risk that the value of assets or income from investments will be less in the future as inflation decreases the value of money. As inflation increases, the value of the Fund’s assets can decline as can the value of the Fund’s distributions. This risk is significantly greater for fixed-income securities with longer maturities.
Municipal Market Risk—This is the risk that special factors may adversely affect the value of municipal securities and have a significant effect on the yield or value of the Fund’s investments in municipal securities. These factors include economic conditions, political or legislative changes, uncertainties related to the tax status of municipal securities, or the rights of investors in these securities. To the extent that the Fund invest more of its assets in a particular state’s municipal securities, the Fund’s may be vulnerable to events adversely affecting that state, including economic, political and regulatory occurrences, court decisions, terrorism and catastrophic natural disasters, such as hurricanes or earthquakes. The Fund’s investments in certain municipal securities with principal and interest payments
| | |
| |
| abfunds.com | | AB TAX-MANAGED ALL MARKET INCOME PORTFOLIO | 81 |
NOTES TO FINANCIAL STATEMENTS(continued)
that are made from the revenues of a specific project or facility, and not general tax revenues, may have increased risks. Factors affecting the project or facility, such as local business or economic conditions, could have a significant effect on the project’s ability to make payments of principal and interest on these securities.
Real Estate Risk—The Fund’s investments in the real estate market have many of the same risks as direct ownership of real estate, including the risk that the value of real estate could decline due to a variety of factors that affect the real estate market generally. Investments in real estate investment trusts, or “REITs”, may have additional risks. REITs are dependent on the capability of their managers, may have limited diversification, and could be significantly affected by changes in taxes.
Foreign(Non-U.S.) Risk—Investments in securities ofnon-U.S. issuers may involve more risk than those of U.S. issuers. These securities may fluctuate more widely in price and may be less liquid due to adverse market, economic, political, regulatory or other factors.
Currency Risk—Fluctuations in currency exchange rates may negatively affect the value of the Fund’s investments or reduce its returns.
Emerging Market Risk—Investments in emerging market countries may have more risk because the markets are less developed and less liquid as well as being subject to increased economic, political, regulatory or other uncertainties.
Derivatives Risk—The Fund may enter into derivative transactions such as forwards, options, futures and swaps. Derivatives may be illiquid, difficult to price, and leveraged so that small changes may produce disproportionate losses for the Fund, and subject to counterparty risk to a greater degree than more traditional investments. Derivatives may result in significant losses, including losses that are far greater than the value of the derivatives reflected on the statement of assets and liabilities.
Leverage Risk—When the Fund borrows money or otherwise leverages its investments, its performance may be volatile because leverage tends to exaggerate the effect of any increase or decrease in the value of the Fund’s investments. The Fund may create leverage through the use of reverse repurchase arrangements, forward currency exchange contracts, forward commitments, dollar rolls or futures or by borrowing money. The use of other types of derivative instruments by the Fund, such as options and swaps, may also result in a form of leverage. Leverage may result in higher returns to the Fund than if the Fund were not leveraged, but may also adversely affect returns, particularly if the market is declining.
| | |
| |
| 82 | AB TAX-MANAGED ALL MARKET INCOME PORTFOLIO | | abfunds.com |
NOTES TO FINANCIAL STATEMENTS(continued)
Liquidity Risk—Liquidity risk occurs when certain investments are difficult to purchase or sell. Difficulty in selling less liquid securities may result in sales at disadvantageous prices affecting the value of your investment in the Fund. Causes of liquidity risk may include low trading volumes and large positions. Foreign fixed-income securities may have more liquidity risk because secondary trading markets for these securities may be smaller and less well-developed and the securities may trade less frequently. Liquidity risk may be higher in a rising interest rate environment, when the value and liquidity of fixed-income securities generally go down.
Indemnification Risk—In the ordinary course of business, the Fund enters into contracts that contain a variety of indemnifications. The Fund’s maximum exposure under these arrangements is unknown. However, the Fund has not had prior claims or losses pursuant to these indemnification provisions and expects the risk of loss thereunder to be remote. Therefore, the Fund has not accrued any liability in connection with these indemnification provisions.
NOTE G
Joint Credit Facility
A number ofopen-end mutual funds managed by the Adviser, including the Fund, participate in a $325 million revolving credit facility (the “Facility”) intended to provide short-term financing, if necessary, subject to certain restrictions in connection with abnormal redemption activity. Commitment fees related to the Facility are paid by the participating funds and are included in miscellaneous expenses in the statement of operations. The Fund did not utilize the Facility during the six months ended February 28, 2019.
NOTE H
Distributions to Shareholders
The tax character of distributions to be paid for the year ending August 31, 2019 will be determined at the end of the current fiscal year. The tax character of distributions paid during the fiscal years ended August 31, 2018 and August 31, 2017 were as follows:
| | | | | | | | |
| | | 2018 | | | 2017 | |
Distributions paid from: | | | | | | | | |
Ordinary income | | $ | 4,653,335 | | | $ | 915,382 | |
Long-term capital gains | | | 6,716,865 | | | | 744,793 | |
| | | | | | | | |
Total taxable distributions | | | 11,370,200 | | | | 1,660,175 | |
Tax-exempt distributions | | | 3,033,397 | | | | 863,430 | |
| | | | | | | | |
Total distributions paid | | $ | 14,403,597 | | | $ | 2,523,605 | |
| | | | | | | | |
| | |
| |
| abfunds.com | | AB TAX-MANAGED ALL MARKET INCOME PORTFOLIO | 83 |
NOTES TO FINANCIAL STATEMENTS(continued)
As of August 31, 2018, the components of accumulated earnings/(deficit) on a tax basis were as follows:
| | | | |
Undistributed ordinary income | | $ | 2,675,377 | (a) |
Undistributed capital gains | | | 1,532,650 | |
Unrealized appreciation/(depreciation) | | | 2,177,121 | (b) |
| | | | |
Total accumulated earnings/(deficit) | | $ | 6,385,148 | (c) |
| | | | |
| (a) | Includes tax exempt income of $118,183. |
| (b) | The differences between book-basis andtax-basis unrealized appreciation/(depreciation) are attributable primarily to the tax deferral of losses on wash sales, the tax treatment of swaps, the tax treatment of passive foreign investment companies (PFICs), and the recognition for tax purposes of unrealized gains/losses on certain derivative instruments. |
| (c) | The difference between book-basis andtax-basis components of accumulated earnings/(deficit) is attributable primarily to the tax treatment of defaulted securities. |
For tax purposes, net realized capital losses may be carried over to offset future capital gains, if any. Funds are permitted to carry forward capital losses for an indefinite period, and such losses will retain their character as either short-term or long-term capital losses. As of August 31, 2018, the Fund did not have any capital loss carryforwards.
NOTE I
Recent Accounting Pronouncements
In March 2017, the Financial Accounting Standards Board issued an Accounting Standards Update, ASU2017-08, Receivables—Nonrefundable Fees and Other Costs (Subtopic310-20), Premium Amortization on Purchased Callable Debt Securities which amends the amortization period for certain purchased callable debt securities held at a premium, shortening such period to the earliest call date. The ASU2017-08 does not require any accounting change for debt securities held at a discount; the discount continues to be amortized to maturity. The ASU2017-08 is effective for fiscal years, and interim periods within those fiscal years, beginning after December 15, 2018. At this time, management is evaluating the implications of these changes on the financial statements.
In August 2018, the Financial Accounting Standards Board issued an Accounting Standards Update, ASU2018-13, Fair Value Measurement (Topic 820), Disclosure Framework—Changes to the Disclosure Requirements for Fair Value Measurement which removes, modifies and adds disclosures to Topic 820. The amendments in this ASU2018-13 apply to all entities that are required, under existing U.S. GAAP, to make disclosures about recurring or nonrecurring fair value measurements. The amendments in this ASU2018-13 are effective for all entities for fiscal years, and interim periods within those fiscal years, beginning after December 15, 2019. At this time, management is evaluating the implications of these changes on the financial statements.
| | |
| |
| 84 | AB TAX-MANAGED ALL MARKET INCOME PORTFOLIO | | abfunds.com |
NOTES TO FINANCIAL STATEMENTS(continued)
In October 2018, the U.S. Securities and Exchange Commission adopted amendments to certain disclosure requirements included in RegulationS-X that had become “redundant, duplicative, overlapping, outdated or superseded, in light of the other Commission disclosure requirements, GAAP or changes in the information environment.” The compliance date for the amendments to RegulationS-X was November 5, 2018 (for reporting period end dates of September 30, 2018 or after). Management has adopted the amendments which simplified certain disclosure requirements on the financial statements.
NOTE J
Subsequent Events
Management has evaluated subsequent events for possible recognition or disclosure in the financial statements through the date the financial statements are issued. Management has determined that there are no material events that would require disclosure in the Fund’s financial statements through this date.
| | |
| |
| abfunds.com | | AB TAX-MANAGED ALL MARKET INCOME PORTFOLIO | 85 |
FINANCIAL HIGHLIGHTS
Selected Data For A Share Of Beneficial Interest Outstanding Throughout Each Period
| | | | | | | | | | | | | | | | | | | | | | | | |
| | | Class A | |
| | | Six Months
Ended
February 28,
2019 (unaudited) | | | Year Ended August 31, | |
| | | 2018 | | | 2017 | | | 2016 | | | 2015 | | | 2014 | |
| | | | |
| | | | | | | | | | | | | | | | | | | | | | | | |
Net asset value, beginning of period | | | $ 12.68 | | | | $ 13.93 | | | | $ 13.20 | | | | $ 13.32 | | | | $ 14.13 | | | | $ 12.87 | |
| | | | |
Income From Investment Operations | | | | | | | | | | | | | | | | | | | | | | | | |
| | | | | | |
Net investment income(a)(b) | | | .17 | | | | .36 | | | | .34† | | | | .17 | | | | .19 | | | | .28 | |
| | | | | | |
Net realized and unrealized gain (loss) on investment and foreign currency transactions | | | (.20 | ) | | | (.01 | ) | | | .65 | | | | .37 | | | | (.49 | ) | | | 1.24 | |
| | | | | | |
Contributions from Affiliates | | | – 0 | – | | | – 0 | – | | | – 0 | – | | | .00 | (c) | | | – 0 | – | | | – 0 | – |
| | | | |
Net increase (decrease) in net asset value from operations | | | (.03 | ) | | | .35 | | | | .99 | | | | .54 | | | | (.30 | ) | | | 1.52 | |
| | | | |
Less: Dividends and Distributions | | | | | | | | | | | | | | | | | | | | | | | | |
| | | | | | |
Dividends from net investment income | | | (.18 | ) | | | (.69 | ) | | | (.19 | ) | | | (.21 | ) | | | (.06 | ) | | | (.26 | ) |
| | | | | | |
Distributions from net realized gain on investment transactions | | | (.40 | ) | | | (.91 | ) | | | (.07 | ) | | | (.45 | ) | | | (.45 | ) | | | – 0 | – |
| | | | |
Total dividends and distributions | | | (.58 | ) | | | (1.60 | ) | | | (.26 | ) | | | (.66 | ) | | | (.51 | ) | | | (.26 | ) |
| | | | |
Net asset value, end of period | | | $ 12.07 | | | | $ 12.68 | | | | $ 13.93 | | | | $ 13.20 | | | | $ 13.32 | | | | $ 14.13 | |
| | | | |
| | | | | | |
Total Return | | | | | | | | | | | | | | | | | | | | | | | | |
| | | | | | |
Total investment return based on net asset value(d)* | | | 0 | % | | | 2.54 | %+ | | | 7.64 | %†+ | | | 4.19 | % | | | (2.19 | )% | | | 11.89 | % |
| | | | | | |
Ratios/Supplemental Data | | | | | | | | | | | | | | | | | | | | | | | | |
| | | | | | |
Net assets, end of period (000’s omitted) | | | $63,002 | | | | $68,946 | | | | $77,486 | | | | $73,526 | | | | $79,242 | | | | $95,133 | |
| | | | | | |
Ratio to average net assets of: | | | | | | | | | | | | | | | | | | | | | | | | |
| | | | | | |
Expenses, net of waivers/reimbursements(e)(f)‡ | | | .99 | %^ | | | .99 | % | | | 1.08 | % | | | 1.13 | % | | | 1.13 | % | | | 1.19 | % |
| | | | | | |
Expenses, before waivers/reimbursements(e)(f)‡ | | | 1.31 | %^ | | | 1.31 | % | | | 1.25 | % | | | 1.19 | % | | | 1.18 | % | | | 1.20 | % |
| | | | | | |
Net investment income(b) | | | 2.85 | %^ | | | 2.77 | % | | | 2.57 | %† | | | 1.31 | % | | | 1.39 | % | | | 2.03 | % |
| | | | | | |
Portfolio turnover rate | | | 10 | % | | | 50 | % | | | 85 | % | | | 25 | % | | | 29 | % | | | 58 | % |
| | | | | | | | | | | | | | | | | | | | | | | | |
| |
‡ Expense ratios exclude the estimated acquired fund fees of the affiliated/unaffiliated underlying | |
portfolios | | | .02 | %^ | | | .04 | % | | | .11 | % | | | .16 | % | | | .17 | % | | | .01 | % |
See footnote summary on page 90.
| | |
| |
| 86 | AB TAX-MANAGED ALL MARKET INCOME PORTFOLIO | | abfunds.com |
FINANCIAL HIGHLIGHTS(continued)
Selected Data For A Share Of Beneficial Interest Outstanding Throughout Each Period
| | | | | | | | | | | | | | | | | | | | | | | | |
| | | Class B | |
| | | Six Months
Ended
February 28,
2019 (unaudited) | | | Year Ended August 31, | |
| | | 2018 | | | 2017 | | | 2016 | | | 2015 | | | 2014 | |
| | | | |
| | | | | | | | | | | | | | | | | | | | | | | | |
Net asset value, beginning of period | | | $ 12.98 | | | | $ 14.08 | | | | $ 13.27 | | | | $ 13.29 | | | | $ 14.15 | | | | $ 12.90 | |
| | | | |
Income From Investment Operations | | | | | | | | | | | | | | | | | | | | | | | | |
| | | | | | |
Net investment income(a)(b) | | | .13 | | | | .27 | | | | .24† | | | | .08 | | | | .09 | | | | .19 | |
| | | | | | |
Net realized and unrealized gain (loss) on investment and foreign currency transactions | | | (.21 | ) | | | (.01 | ) | | | .64 | | | | .37 | | | | (.50 | ) | | | 1.24 | |
| | | | | | |
Contributions from Affiliates | | | – 0 | – | | | – 0 | – | | | – 0 | – | | | .00 | (c) | | | – 0 | – | | | – 0 | – |
| | | | |
Net increase (decrease) in net asset value from operations | | | (.08 | ) | | | .26 | | | | .88 | | | | .45 | | | | (.41 | ) | | | 1.43 | |
| | | | |
Less: Dividends and Distributions | | | | | | | | | | | | | | | | | | | | | | | | |
| | | | | | |
Dividends from net investment income | | | (.13 | ) | | | (.45 | ) | | | – 0 | – | | | (.02 | ) | | | – 0 | – | | | (.18 | ) |
| | | | | | |
Distributions from net realized gain on investment transactions | | | (.40 | ) | | | (.91 | ) | | | (.07 | ) | | | (.45 | ) | | | (.45 | ) | | | – 0 | – |
| | | | |
Total dividends and distributions | | | (.53 | ) | | | (1.36 | ) | | | (.07 | ) | | | (.47 | ) | | | (.45 | ) | | | (.18 | ) |
| | | | |
Net asset value, end of period | | | $ 12.37 | | | | $ 12.98 | | | | $ 14.08 | | | | $ 13.27 | | | | $ 13.29 | | | | $ 14.15 | |
| | | | |
| | | | | | |
Total Return | | | | | | | | | | | | | | | | | | | | | | | | |
| | | | | | |
Total investment return based on net asset value(d)* | | | (.41 | )% | | | 1.83 | %+ | | | 6.69 | %†+ | | | 3.46 | % | | | (2.98 | )% | | | 11.14 | % |
| | | | | | |
Ratios/Supplemental Data | | | | | | | | | | | | | | | | | | | | | | | | |
| | | | | | |
Net assets, end of period (000’s omitted) | | | $539 | | | | $615 | | | | $762 | | | | $1,342 | | | | $2,322 | | | | $4,631 | |
| | | | | | |
Ratio to average net assets of: | | | | | | | | | | | | | | | | | | | | | | | | |
| | | | | | |
Expenses, net of waivers/reimbursements(e)(f)‡ | | | 1.74 | %^ | | | 1.74 | % | | | 1.88 | % | | | 1.88 | % | | | 1.88 | % | | | 1.91 | % |
| | | | | | |
Expenses, before waivers/reimbursements(e)(f)‡ | | | 2.09 | %^ | | | 2.09 | % | | | 2.03 | % | | | 1.94 | % | | | 1.94 | % | | | 1.91 | % |
| | | | | | |
Net investment income(b) | | | 2.10 | %^ | | | 2.02 | % | | | 1.80 | %† | | | .60 | % | | | .68 | % | | | 1.41 | % |
| | | | | | |
Portfolio turnover rate | | | 10 | % | | | 50 | % | | | 85 | % | | | 25 | % | | | 29 | % | | | 58 | % |
| | | | | | | | | | | | | | | | | | | | | | | | |
| |
‡ Expense ratios exclude the estimated acquired fund fees of the affiliated/unaffiliated underlying | |
portfolios | | | .02 | %^ | | | .04 | % | | | .11 | % | | | .16 | % | | | .17 | % | | | .01 | % |
See footnote summary on page 90.
| | |
| |
| abfunds.com | | AB TAX-MANAGED ALL MARKET INCOME PORTFOLIO | 87 |
FINANCIAL HIGHLIGHTS(continued)
Selected Data For A Share Of Beneficial Interest Outstanding Throughout Each Period
| | | | | | | | | | | | | | | | | | | | | | | | |
| | | Class C | |
| | | Six Months
Ended
February 28,
2019 (unaudited) | | | Year Ended August 31, | |
| | | 2018 | | | 2017 | | | 2016 | | | 2015 | | | 2014 | |
| | | | |
| | | | | | | | | | | | | | | | | | | | | | | | |
Net asset value, beginning of period | | | $ 12.90 | | | | $ 13.93 | | | | $ 13.19 | | | | $ 13.30 | | | | $ 14.17 | | | | $ 12.92 | |
| | | | |
Income From Investment Operations | | | | | | | | | | | | | | | | | | | | | | | | |
| | | | | | |
Net investment income(a)(b) | | | .13 | | | | .27 | | | | .23† | | | | .07 | | | | .09 | | | | .18 | |
| | | | | | |
Net realized and unrealized gain (loss) on investment and foreign currency transactions | | | (.21 | ) | | | (.02 | ) | | | .66 | | | | .37 | | | | (.50 | ) | | | 1.25 | |
| | | | | | |
Contributions from Affiliates | | | – 0 | – | | | – 0 | – | | | – 0 | – | | | .00 | (c) | | | – 0 | – | | | – 0 | – |
| | | | |
Net increase (decrease) in net asset value from operations | | | (.08 | ) | | | .25 | | | | .89 | | | | .44 | | | | (.41 | ) | | | 1.43 | |
| | | | |
Less: Dividends and Distributions | | | | | | | | | | | | | | | | | | | | | | | | |
| | | | | | |
Dividends from net investment income | | | (.13 | ) | | | (.37 | ) | | | (.08 | ) | | | (.10 | ) | | | (.01 | ) | | | (.18 | ) |
| | | | | | |
Distributions from net realized gain on investment transactions | | | (.40 | ) | | | (.91 | ) | | | (.07 | ) | | | (.45 | ) | | | (.45 | ) | | | – 0 | – |
| | | | |
Total dividends and distributions | | | (.53 | ) | | | (1.28 | ) | | | (.15 | ) | | | (.55 | ) | | | (.46 | ) | | | (.18 | ) |
| | | | |
Net asset value, end of period | | | $ 12.29 | | | | $ 12.90 | | | | $ 13.93 | | | | $ 13.19 | | | | $ 13.30 | | | | $ 14.17 | |
| | | | |
| | | | | | |
Total Return | | | | | | | | | | | | | | | | | | | | | | | | |
| | | | | | |
Total investment return based on net asset value(d)* | | | (.39 | )% | | | 1.83 | %+ | | | 6.82 | %†+ | | | 3.40 | % | | | (2.96 | )% | | | 11.17 | % |
| | | | | | |
Ratios/Supplemental Data | | | | | | | | | | | | | | | | | | | | | | | | |
| | | | | | |
Net assets, end of period (000’s omitted) | | | $6,669 | | | | $7,383 | | | | $11,986 | | | | $24,955 | | | | $27,177 | | | | $31,135 | |
| | | | | | |
Ratio to average net assets
of: | | | | | | | | | | | | | | | | | | | | | | | | |
| | | | | | |
Expenses, net of waivers/reimbursements(e)(f)‡ | | | 1.74 | %^ | | | 1.74 | % | | | 1.86 | % | | | 1.89 | % | | | 1.88 | % | | | 1.90 | % |
| | | | | | |
Expenses, before waivers/reimbursements(e)(f)‡ | | | 2.06 | %^ | | | 2.05 | % | | | 1.99 | % | | | 1.94 | % | | | 1.94 | % | | | 1.90 | % |
| | | | | | |
Net investment income(b) | | | 2.09 | %^ | | | 2.02 | % | | | 1.72 | %† | | | .56 | % | | | .63 | % | | | 1.33 | % |
| | | | | | |
Portfolio turnover rate | | | 10 | % | | | 50 | % | | | 85 | % | | | 25 | % | | | 29 | % | | | 58 | % |
| | | | | | | | | | | | | | | | | | | | | | | | |
| |
‡ Expense ratios exclude the estimated acquired fund fees of the affiliated/unaffiliated underlying | |
portfolios | | | .02 | %^ | | | .04 | % | | | .11 | % | | | .16 | % | | | .17 | % | | | .01 | % |
See footnote summary on page 90.
| | |
| |
| 88 | AB TAX-MANAGED ALL MARKET INCOME PORTFOLIO | | abfunds.com |
FINANCIAL HIGHLIGHTS(continued)
Selected Data For A Share Of Beneficial Interest Outstanding Throughout Each Period
| | | | | | | | | | | | | | | | | | | | | | | | |
| | | Advisor Class | |
| | | Six Months
Ended
February 28,
2019 (unaudited) | | | Year Ended August 31, | |
| | | 2018 | | | 2017 | | | 2016 | | | 2015 | | | 2014 | |
| | | | | | | | | | | | | | | | | | | | | | | | |
| | | | | | | | | | | | | | | | | | | | | | | | |
Net asset value, beginning of period | | | $ 12.70 | | | | $ 13.96 | | | | $ 13.24 | | | | $ 13.36 | | | | $ 14.16 | | | | $ 12.88 | |
| | | | | | | | | | | | | | | | | | | | | | | | |
Income From Investment Operations | | | | | | | | | | | | | | | | | | | | | | | | |
| | | | | | |
Net investment income(a)(b) | | | .19 | | | | .39 | | | | .37† | | | | .20 | | | | .22 | | | | .31 | |
| | | | | | |
Net realized and unrealized gain (loss) on investment and foreign currency transactions | | | (.20 | ) | | | .00 | (c) | | | .64 | | | | .38 | | | | (.49 | ) | | | 1.26 | |
| | | | | | |
Contributions from Affiliates | | | – 0 | – | | | – 0 | – | | | – 0 | – | | | .00 | (c) | | | – 0 | – | | | – 0 | – |
| | | | | | | | | | | | | | | | | | | | | | | | |
Net increase (decrease) in net asset value from operations | | | (.01 | ) | | | .39 | | | | 1.01 | | | | .58 | | | | (.27 | ) | | | 1.57 | |
| | | | | | | | | | | | | | | | | | | | | | | | |
Less: Dividends and Distributions | | | | | | | | | | | | | | | | | | | | | | | | |
| | | | | | |
Dividends from net investment income | | | (.20 | ) | | | (.74 | ) | | | (.22 | ) | | | (.25 | ) | | | (.08 | ) | | | (.29 | ) |
| | | | | | |
Distributions from net realized gain on investment transactions | | | (.40 | ) | | | (.91 | ) | | | (.07 | ) | | | (.45 | ) | | | (.45 | ) | | | – 0 | – |
| | | | | | | | | | | | | | | | | | | | | | | | |
Total dividends and distributions | | | (.60 | ) | | | (1.65 | ) | | | (.29 | ) | | | (.70 | ) | | | (.53 | ) | | | (.29 | ) |
| | | | | | | | | | | | | | | | | | | | | | | | |
Net asset value, end of period | | | $ 12.09 | | | | $ 12.70 | | | | $ 13.96 | | | | $ 13.24 | | | | $ 13.36 | | | | $ 14.16 | |
| | | | |
| | | | | | |
Total Return | | | | | | | | | | | | | | | | | | | | | | | | |
| | | | | | |
Total investment return based on net asset value(d)* | | | .13 | % | | | 2.95 | % | | | 7.84 | %†+ | | | 4.48 | % | | | (1.96 | )% | | | 12.29 | % |
| | | | | | |
Ratios/Supplemental Data | | | | | | | | | | | | | | | | | | | | | | | | |
| | | | | | |
Net assets, end of period
(000’s omitted) | | | $33,404 | | | | $35,479 | | | | $39,646 | | | | $39,382 | | | | $40,917 | | | | $40,249 | |
| | | | | | |
Ratio to average net assets of: | | | | | | | | | | | | | | | | | | | | | | | | |
| | | | | | |
Expenses, net of waivers/reimbursements(e)(f)‡ | | | .74 | %^ | | | .74 | % | | | .84 | % | | | .89 | % | | | .88 | % | | | .89 | % |
| | | | | | |
Expenses, before waivers/reimbursements(e)(f)‡ | | | 1.06 | %^ | | | 1.06 | % | | | 1.00 | % | | | .94 | % | | | .94 | % | | | .90 | % |
| | | | | | |
Net investment income(b) | | | 3.10 | %^ | | | 3.02 | % | | | 2.81 | %† | | | 1.55 | % | | | 1.61 | % | | | 2.24 | % |
| | | | | | |
Portfolio turnover rate | | | 10 | % | | | 50 | % | | | 85 | % | | | 25 | % | | | 29 | % | | | 58 | % |
| | | | | | | | | | | | | | | | | | | | | | | | |
| |
‡ Expense ratios exclude the estimated acquired fund fees of the affiliated/unaffiliated underlying | |
portfolios | | | .02 | %^ | | | .04 | % | | | .11 | % | | | .16 | % | | | .17 | % | | | .01 | % |
See footnote summary on page 90.
| | |
| |
| abfunds.com | | AB TAX-MANAGED ALL MARKET INCOME PORTFOLIO | 89 |
FINANCIAL HIGHLIGHTS(continued)
Selected Data For A Share Of Beneficial Interest Outstanding Throughout Each Period
| (a) | Based on average shares outstanding. |
| (b) | Net of expenses waived/reimbursed by the Adviser. |
| (c) | Amount is less than $.005. |
| (d) | Total investment return is calculated assuming an initial investment made at the net asset value at the beginning of the period, reinvestment of all dividends and distributions at net asset value during the period, and redemption on the last day of the period. Initial sales charges or contingent deferred sales charges are not reflected in the calculation of total investment return. Total return does not reflect the deduction of taxes that a shareholder would pay on fund distributions or the redemption of fund shares. Total investment return calculated for a period of less than one year is not annualized. |
| (e) | In connection with the Fund’s investments in affiliated underlying portfolios, the Fund incurs no direct expenses, but bears proportionate shares of the fees and expenses (i.e., operating, administrative and investment advisory fees) of the affiliated underlying portfolios. The Adviser has contractually agreed to waive its fees from the Fund in an amount equal to the Fund’s pro rata share of certain acquired fund fees and expenses, and for the year ended August 31, 2017, such waiver amounted to .04%. |
| (f) | The expense ratios presented below exclude bank overdraft expense: |
| | | | | | | | | | | | | | | | | | | | | | | | |
| | | Six Months Ended
February 28, 2019 | | | Year Ended August 31, | |
| | | (unaudited) | | | 2018 | | | 2017 | | | 2016 | | | 2015 | | | 2014 | |
Class A | | | | | | | | | | | | | | | | | | | | | | | | |
Net of waivers | | | N/A | | | | .99 | % | | | N/A | | | | N/A | | | | N/A | | | | N/A | |
Before waivers | | | N/A | | | | 1.30 | % | | | N/A | | | | N/A | | | | N/A | | | | N/A | |
| | | | | | |
Class B | | | | | | | | | | | | | | | | | | | | | | | | |
Net of waivers | | | N/A | | | | 1.74 | % | | | N/A | | | | N/A | | | | N/A | | | | N/A | |
Before waivers | | | N/A | | | | 2.09 | % | | | N/A | | | | N/A | | | | N/A | | | | N/A | |
| | | | | | |
Class C | | | | | | | | | | | | | | | | | | | | | | | | |
Net of waivers | | | N/A | | | | 1.74 | % | | | N/A | | | | N/A | | | | N/A | | | | N/A | |
Before waivers | | | N/A | | | | 2.04 | % | | | N/A | | | | N/A | | | | N/A | | | | N/A | |
| | | | | | |
Advisor Class | | | | | | | | | | | | | | | | | | | | | | | | |
Net of waivers | | | N/A | | | | .74 | % | | | N/A | | | | N/A | | | | N/A | | | | N/A | |
Before waivers | | | N/A | | | | 1.05 | % | | | N/A | | | | N/A | | | | N/A | | | | N/A | |
| † | For the year ended August 31, 2017, the amount includes a refund for overbilling of prior years’ custody out of pocket fees as follows: |
| | | | |
Net Investment
Income Per Share | | Net Investment
Income Ratio | | Total Return |
| $.012 | | .09% | | .09% |
| * | Includes the impact of proceeds received and credited to the Fund resulting from class action settlements, which enhanced the Fund’s performance for the years ended August 31, 2018, August 31, 2017, August 31, 2016, August 31, 2015 and August 31, 2014 by .01%, .01%, .02%, .05% and .01%, respectively. |
| + | The net asset value and total return include adjustments in accordance with accounting principles generally accepted in the United States of America for financial reporting purposes. As such, the net asset value and total return for shareholder transactions may differ from financial statements. |
See notes to financial statements.
| | |
| |
| 90 | AB TAX-MANAGED ALL MARKET INCOME PORTFOLIO | | abfunds.com |
RESULTS OF SHAREHOLDERS MEETING
(unaudited)
A Special Meeting of Shareholders of The AB Portfolios (the “Company”)—ABTax-Managed All Market Income Portfolio (the “Fund”) was held on October 11, 2018, adjourned until December 11, 2018, and further adjourned until December 18, 2018. A description of each proposal and the number of shares voted at the Meeting are as follows (the proposal numbers shown below correspond to the proposal number in the Fund’s proxy statement):
| 1. | To approve and vote upon the election of Trustees for the Company, each such Trustee to serve for a term of indefinite duration and until his or her successor is duly elected and qualifies. |
December 11, 2018:
| | | | | | | | |
Trustee: | | Voted
For: | | | Authority
Withheld: | |
Michael J. Downey | | | 112,255,334 | | | | 2,874,198 | |
William H. Foulk, Jr.* | | | 112,062,437 | | | | 3,067,095 | |
Nancy P. Jacklin | | | 112,466,540 | | | | 2,662,992 | |
Robert M. Keith | | | 112,388,936 | | | | 2,740,596 | |
Carol C. McMullen | | | 112,486,090 | | | | 2,643,442 | |
Gary L. Moody | | | 112,308,212 | | | | 2,821,321 | |
Marshall C. Turner, Jr. | | | 112,101,288 | | | | 3,028,244 | |
Earl D. Weiner | | | 112,176,204 | | | | 2,953,328 | |
| 2. | To vote upon the approval of new advisory agreements for the Fund with AllianceBernstein L.P. |
December 18, 2018:
| | | | | | | | | | | | | | |
Voted
For | | | Voted
Against | | | Abstained | | | Broker-
Non Votes | |
| | 3,079,157 | | | | 289,772 | | | | 201,030 | | | | 983,790 | |
| * | Mr. Foulk retired on December 31, 2018. |
| | |
| |
| abfunds.com | | AB TAX-MANAGED ALL MARKET INCOME PORTFOLIO | 91 |
BOARD OF TRUSTEES
TRUSTEES
| | |
Marshall C. Turner, Jr.(1),Chairman Michael J. Downey(1) Nancy P. Jacklin(1) | | Robert M. Keith,President and Chief Executive Officer Carol C. McMullen(1) Garry L. Moody(1) Earl D. Weiner(1) |
OFFICERS
| | |
Morgan C. Harting(2), Vice President Daniel J. Loewy(2),Vice President Emilie D. Wrapp,Clerk Michael B. Reyes,Senior Analyst | | Joseph J. Mantineo,Treasurer and Chief Financial Officer Phyllis J. Clarke,Controllerand Chief Accounting Officer Vincent S. Noto,Chief Compliance Officer |
| | |
Custodian and Accounting Agent State Street Bank and Trust Company State Street Corporation CCB/5 1 Iron Street Boston, MA 02210 Principal Underwriter AllianceBernstein Investments, Inc. 1345 Avenue of the Americas New York, NY 10105 Legal Counsel Seward & Kissel LLP One Battery Park Plaza New York, NY 10004 | | Transfer Agent AllianceBernstein Investor Services, Inc. P.O. Box 786003 San Antonio, TX 78278-6003 Toll-Free (800) 221-5672 Independent Registered Public Accounting Firm Ernst & Young LLP 5 Times Square New York, NY 10036 |
| 1 | Member of the Audit Committee, the Governance and Nominating Committee and the Independent Directors Committee. |
| 2 | Theday-to-day management of, and investment decisions for, the Fund’s portfolio are made by the Adviser’s Multi-Asset Solutions Team. Messrs. Harting and Loewy are the investment professionals primarily responsible for theday-to-day management of Tax-Managed All Market Income Portfolio. |
| | |
| |
| 92 | AB TAX-MANAGED ALL MARKET INCOME PORTFOLIO | | abfunds.com |
Information Regarding the Review and Approval of the Fund’s Proposed New Advisory Agreement and Interim Advisory Agreement in the Context of Potential Assignments
As described in more detail in the Proxy Statement for the AB Funds dated August 20, 2018, the Boards of the AB Funds, at a meeting held onJuly 31-August 2, 2018, approved new advisory agreements with the Adviser (the “Proposed Agreements”) for the AB Funds, including The AB Portfolios in respect ofAB Tax-Managed All Market Income Portfolio (formerlyAB Tax-Managed Balanced Wealth Strategy) (the “Fund”), in connection with the planned disposition by AXA S.A. of its remaining shares of AXA Equitable Holdings, Inc. (the indirect holder of a majority of the partnership interests in the Adviser and the indirect parent of AllianceBernstein Corporation, the general partner of the Adviser) in one or more transactions and the related potential for one or more “assignments” (within the meaning of section 2(a)(4) of the Investment Company Act) of the advisory agreements for the AB Funds, including the Fund’s Advisory Agreement, resulting in the automatic termination of such advisory agreements.
At the same meeting, the AB Boards also considered and approved interim advisory agreements with the Adviser (the “Interim Advisory Agreements”) for the AB Funds, including the Fund, to be effective only in the event that stockholder approval of a Proposed Agreement had not been obtained as of the date of one or more transactions resulting in an “assignment” of the Adviser’s advisory agreements, resulting in the automatic termination of such advisory agreements.
The shareholders of the Fund subsequently approved the Proposed Agreements at an annual meeting of shareholders called for the purpose of electing Directors and voting on the Proposed Agreements.
A discussion regarding the basis for the Boards’ approvals at the meeting held onJuly 31-August 2, 2018 is set forth below.
At a meeting of the AB Boards held on July31-August 2, 2018, the Adviser presented its recommendation that the Boards consider and approve the Proposed Agreements. Section 15(c) of the 1940 Act provides that, after an initial period, a Fund’s Current Agreement and currentsub-advisory agreement, as applicable, will remain in effect only if the Board, including a majority of the Independent Directors, annually reviews and approves them. Each of the Current Agreements had been approved by a Board within theone-year period prior to approval of its related Proposed Agreement, except that the Current Agreements for certain FlexFee funds were approved in February 2017. In connection with their approval of the Proposed Agreements, the Boards considered their conclusions in connection with their most recent approvals of the Current Agreements, in particular in cases where the last approval of a Current Agreement was relatively recent, including the Boards’ general satisfaction with the nature and quality of services being provided and, as applicable, in the case of
| | |
| |
| abfunds.com | | AB TAX-MANAGED ALL MARKET INCOME PORTFOLIO | 93 |
certain Funds, actions taken or to be taken in an effort to improve investment performance or reduce expense ratios. The Directors also reviewed updated information provided by the Adviser in respect of each Fund. Also in connection with their approval of the Proposed Agreements, the Boards considered a representation made to them at that time by the Adviser that there were no additional developments not already disclosed to the Boards since their most recent approvals of the Current Agreements that would be a material consideration to the Boards in connection with their consideration of the Proposed Agreements, except for matters disclosed to the Boards by the Adviser. The Directors considered the fact that each Proposed Agreement would have corresponding terms and conditions identical to those of the corresponding Current Agreement with the exception of the effective date and initial term under the Proposed Agreement.
The Directors considered their knowledge of the nature and quality of the services provided by the Adviser to each Fund gained from their experience as directors or trustees of registered investment companies advised by the Adviser, their overall confidence in the Adviser’s integrity and competence they have gained from that experience, the Adviser’s initiative in identifying and raising potential issues with the Directors and its responsiveness, frankness and attention to concerns raised by the Directors in the past, including the Adviser’s willingness to consider and implement organizational and operational changes designed to improve investment results and the services provided to the Funds. The Directors noted that they have four regular meetings each year, at each of which they review extensive materials and information from the Adviser, including information on the investment performance of each Fund.
The Directors also considered all factors they believed relevant, including the specific matters discussed below. During the course of their deliberations, the Directors evaluated, among other things, the reasonableness of the management fees of the Funds they oversee. The Directors did not identify any particular information that wasall-important or controlling, and different Directors may have attributed different weights to the various factors. The Directors determined that the selection of the Adviser to manage the Funds, and the overall arrangements between the Funds and the Adviser, as provided in the Proposed Agreements, including the management fees, were fair and reasonable in light of the services performed under the Current Agreements and to be performed under the Proposed Agreements, expenses incurred and to be incurred and such other matters as the Directors considered relevant in the exercise of their business judgment. The material factors and conclusions that formed the basis for the Directors’ determinations included the following:
Nature, Extent and Quality of Services Provided
The Directors considered the scope and quality of services to be provided by the Adviser under the Proposed Agreements, including the quality of
| | |
| |
| 94 | AB TAX-MANAGED ALL MARKET INCOME PORTFOLIO | | abfunds.com |
the investment research capabilities of the Adviser and the other resources it has dedicated to performing services for the Funds. They also considered the information that had been provided to them by the Adviser concerning the anticipated implementation of the Plan and the Adviser’s representation that it did not anticipate that such implementation would affect the management or structure of the Adviser, have a material adverse effect on the Adviser, or adversely affect the quality of the services provided to the Funds by the Adviser and its affiliates. The Directors noted that the Adviser from time to time reviews each Fund’s investment strategies and from time to time proposes changes intended to improve the Fund’s relative or absolute performance for the Directors’ consideration. They also noted the professional experience and qualifications of each Fund’s portfolio management team and other senior personnel of the Adviser. The Directors also considered that certain Proposed Agreements, similar to the corresponding Current Agreements, provide that the Funds will reimburse the Adviser for the cost to it of providing certain clerical, accounting, administrative and other services to the Funds by employees of the Adviser or its affiliates. Requests for these reimbursements are made on a quarterly basis and subject to approval by the Directors. The Directors noted that the Adviser did not request any reimbursements from certain Funds in the Fund’s latest fiscal year reviewed. The Directors noted that the methodology to be used to determine the reimbursement amounts had been reviewed by an independent consultant retained by the Funds’ former Senior Officer/Independent Compliance Officer. The quality of administrative and other services, including the Adviser’s role in coordinating the activities of the Funds’ other service providers, also was considered. The Directors of each Fund concluded that, overall, they were satisfied with the nature, extent and quality of services to be provided to the Funds under the Proposed Agreement for the Fund.
Costs of Services to be Provided and Profitability
The Directors reviewed a schedule of the revenues and expenses and related notes indicating the profitability of each Fund to the Adviser for calendar years 2016 and 2017, as applicable, that had been prepared with an expense allocation methodology arrived at in consultation with an independent consultant retained by the Funds’ former Senior Officer/Independent Compliance Officer. The Directors noted the assumptions and methods of allocation used by the Adviser in preparing fund-specific profitability data and understood that there are a number of potentially acceptable allocation methodologies for information of this type. The Directors noted that the profitability information reflected all revenues and expenses of the Adviser’s relationship with a Fund, including those relating to its subsidiaries that provide transfer agency, distribution and brokerage services to the Fund, as applicable. The Directors recognized that it is difficult to make comparisons of the profitability of the Proposed Agreements with the profitability of fund advisory contracts for unaffiliated funds because comparative information is not generally publicly available and is
| | |
| |
| abfunds.com | | AB TAX-MANAGED ALL MARKET INCOME PORTFOLIO | 95 |
affected by numerous factors. The Directors focused on the profitability of the Adviser’s relationship with each Fund before taxes and distribution expenses, as applicable. The Directors noted that certain Funds were not profitable to the Adviser in one or more periods reviewed. The Directors concluded that the Adviser’s level of profitability from its relationship with the other Funds was not unreasonable. The Directors were unable to consider historical information about the profitability of certain Funds that had recently commenced operations and for which historical profitability information was not available. The Adviser agreed to provide the Directors with profitability information in connection with future proposed continuances of the Proposed Agreements.
Fall-Out Benefits
The Directors considered the other benefits to the Adviser and its affiliates from their relationships with the Funds, including, but not limited to, as applicable, benefits relating to soft dollar arrangements (whereby investment advisers receive brokerage and research services from brokers that execute agency transactions for their clients) in the case of certain Funds;12b-1 fees and sales charges received by the principal underwriter (which is a wholly owned subsidiary of the Adviser) in respect of certain classes of the shares of most of the Funds; brokerage commissions paid by certain Funds to brokers affiliated with the Adviser; and transfer agency fees paid by most of the Funds to a wholly owned subsidiary of the Adviser. The Directors recognized that the Adviser’s profitability would be somewhat lower, and that a Fund’s unprofitability to the Adviser would be exacerbated, without these benefits. The Directors understood that the Adviser also might derive reputational and other benefits from its association with the Funds.
Investment Results
In addition to the information reviewed by the Directors in connection with the Board meeting at which the Proposed Agreements were approved, the Directors receive detailed performance information for the Funds at each regular Board meeting during the year.
The Boards’ consideration of each Proposed Agreement was informed by their most recent approval of the related Current Agreement, and, in the case of certain Funds, their discussion with the Adviser of the reasons for those Funds’ underperformance in certain periods. The Directors also reviewed updated performance information and, in some cases, discussed with the Adviser the reasons for changes in performance or continued underperformance. On the basis of this review, the Directors concluded that each Fund’s investment performance was acceptable.
Management Fees and Other Expenses
The Directors considered the management fee rate payable by each Fund to the Adviser and information prepared by an independent service provider
| | |
| |
| 96 | AB TAX-MANAGED ALL MARKET INCOME PORTFOLIO | | abfunds.com |
(the ‘‘15(c) provider’’) concerning management fee rates payable by other funds in the same category as the Fund. The Directors recognized that it is difficult to make comparisons of management fees because there are variations in the services that are included in the fees paid by other funds. The Directors compared each Fund’s contractual management fee rate with a peer group median, and where applicable, took into account the impact on the management fee rate of the administrative expense reimbursement paid to the Adviser in the latest fiscal year. In the case of the ACS Funds, the Directors noted that the management fee rate is zero but also were cognizant that the Adviser is indirectly compensated by the wrap fee program sponsors that use the ACS Funds as an investment vehicle for their clients.
The Directors also considered the Adviser’s fee schedule for other clients pursuing a similar investment style to each Fund. For this purpose, they reviewed the relevant advisory fee information from the Adviser’s Form ADV and in a report from the Funds’ Senior Analyst and noted the differences between a Fund’s fee schedule, on the one hand, and the Adviser’s institutional fee schedule and the schedule of fees charged by the Adviser to any offshore funds and for services to anysub-advised funds pursuing a similar investment strategy as the Fund, on the other, as applicable. The Directors noted that the Adviser may, in some cases, agree to fee rates with large institutional clients that are lower than those reviewed by the Directors and that they had previously discussed with the Adviser its policies in respect of such arrangements. The Adviser also informed the Directors that, in the case of certain Funds, there were no institutional products managed by the Adviser that have a substantially similar investment style. The Directors also discussed these matters with their independent fee consultant.
The Adviser reviewed with the Directors the significantly greater scope of the services it provides to each Fund relative to institutional, offshore fund andsub-advised fund clients, as applicable. In this regard, the Adviser noted, among other things, that, compared to institutional and offshore orsub-advisory accounts, each Fund, as applicable, (i) demands considerably more portfolio management, research and trading resources due to significantly higher daily cash flows (in the case ofopen-end Funds); (ii) has more tax and regulatory restrictions and compliance obligations; (iii) must prepare and file or distribute regulatory and other communications about fund operations; and (iv) must provide shareholder servicing to retail investors. The Adviser also reviewed the greater legal risks presented by the large and changing population of Fund shareholders who may assert claims against the Adviser in individual or class actions, and the greater entrepreneurial risk in offering new fund products, which require substantial investment to launch, may not succeed, and generally must be priced to compete with larger, more established funds resulting in lack of profitability to the Adviser until a new fund achieves scale. In light of the substantial differences in services rendered by the Adviser to institutional, offshore fund andsub-advised fund clients as compared to the Funds, and
| | |
| |
| abfunds.com | | AB TAX-MANAGED ALL MARKET INCOME PORTFOLIO | 97 |
the different risk profile, the Directors considered these fee comparisons inapt and did not place significant weight on them in their deliberations.
The Directors noted that many of the Funds may invest in shares of exchange-traded funds (‘‘ETFs’’), subject to the restrictions and limitations of the 1940 Act as these may be varied as a result of exemptive orders issued by the SEC. The Directors also noted that ETFs pay advisory fees pursuant to their advisory contracts. The Directors concluded, based on the Adviser’s explanation of how it uses ETFs when they are the most cost-effective way to obtain desired exposures, in some cases pending purchases of underlying securities, that each Fund’s management fee would be for services that would be in addition to, rather than duplicative of, the services provided under the advisory contracts of the ETFs.
With respect to each Fund’s management fee, the Directors considered the total expense ratio of the Fund in comparison to a peer group and peer universe selected by the 15(c) service provider. The Directors also considered the Adviser’s expense caps for certain Funds. The Directors view expense ratio information as relevant to their evaluation of the Adviser’s services because the Adviser is responsible for coordinating services provided to a Fund by others.
The Boards’ consideration of each Proposed Agreement was informed by their most recent approval of the related Current Agreement, and, in the case of certain Funds, their discussion with the Adviser of the reasons for those Funds’ expense ratios in certain periods. The Directors also reviewed updated expense ratio information and, in some cases, discussed with the Adviser the reasons for the expense ratios of certain Funds. On the basis of this review, the Directors concluded that each Fund’s expense ratio was acceptable.
The Directors did not consider comparative expense information for the ACS Funds because those Funds do not bear ordinary expenses.
Economies of Scale
The Directors noted that the management fee schedules for certain Funds do not contain breakpoints and that they had discussed their strong preference for breakpoints in advisory contracts with the Adviser. The Directors took into consideration prior presentations by an independent consultant on economies of scale in the mutual fund industry and for the Funds, and by the Adviser concerning certain of its views on economies of scale. The Directors also had requested and received from the Adviser certain updates on economies of scale in advance of the Board meeting. The Directors believe that economies of scale may be realized (if at all) by the Adviser across a variety of products and services, and not only in respect of a single fund. The Directors noted that there is no established methodology for setting breakpoints that give effect to the fund-specific services provided by a fund’s adviser and to the economies of scale that
| | |
| |
| 98 | AB TAX-MANAGED ALL MARKET INCOME PORTFOLIO | | abfunds.com |
an adviser may realize in its overall mutual fund business or those components of it which directly or indirectly affect a fund’s operations. The Directors observed that in the mutual fund industry as a whole, as well as among funds similar to each Fund, there is no uniformity or pattern in the fees and asset levels at which breakpoints (if any) apply. The Directors also noted that the advisory agreements for many funds do not have breakpoints at all. The Directors informed the Adviser that they would monitor the asset levels of the Funds without breakpoints and their profitability to the Adviser and anticipated revisiting the question of breakpoints in the future if circumstances warrant doing so.
The Directors did not consider the extent to which fee levels in the Advisory Agreement for the ACS Funds reflect economies of scale because that Advisory Agreement does not provide for any compensation to be paid to the Adviser by the ACS Funds and the expense ratio of each of those Funds is zero.
Interim Advisory Agreements
In approving the Interim Advisory Agreements, the Boards, with the assistance of independent counsel, considered similar factors to those considered in approving the Proposed Agreements. The Interim Advisory Agreements approved by the Boards are identical to the Proposed Agreements, as well as the Current Agreements, in all material respects except for their proposed effective and termination dates and provisions intended to comply with the requirements of the relevant SEC rule, such as provisions requiring escrow of advisory fees. Under the Interim Advisory Agreements, the Adviser would continue to manage a Fund pursuant to an Interim Advisory Agreement until a new advisory agreement was approved by stockholders or until the end of the150-day period, whichever would occur earlier. All fees earned by the Adviser under an Interim Advisory Agreement would be held in escrow pending shareholder approval of the Proposed Agreement. Upon approval of a new advisory agreement by stockholders, the escrowed management fees would be paid to the Adviser, and the Interim Advisory Agreement would terminate.
Information Regarding the Review and Approval of the Fund’s Current Advisory Agreement
The disinterested trustees (the “directors”) of The AB Portfolios (the “Company”) unanimously approved the continuance of the Company’s Advisory Agreement with the Adviser in respect of ABTax-Managed All Market Income Portfolio (formerly ABTax-Managed Balanced Wealth Strategy) (the “Fund”) at a meeting held onJuly 31-August 2, 2018 (the “Meeting”).
Prior to approval of the continuance of the Advisory Agreement, the directors had requested from the Adviser, and received and evaluated, extensive materials. They reviewed the proposed continuance of the Advisory Agreement with the Adviser and with experienced counsel who are
| | |
| |
| abfunds.com | | AB TAX-MANAGED ALL MARKET INCOME PORTFOLIO | 99 |
independent of the Adviser, who advised on the relevant legal standards. The directors also reviewed additional materials, including materials from an outside consultant, who acted as their independent fee consultant, and comparative analytical data prepared by the Senior Analyst for the Fund. The directors also discussed the proposed continuance in private sessions with counsel.
The directors considered their knowledge of the nature and quality of the services provided by the Adviser to the Fund gained from their experience as directors or trustees of most of the registered investment companies advised by the Adviser, their overall confidence in the Adviser’s integrity and competence they have gained from that experience, the Adviser’s initiative in identifying and raising potential issues with the directors and its responsiveness, frankness and attention to concerns raised by the directors in the past, including the Adviser’s willingness to consider and implement organizational and operational changes designed to improve investment results and the services provided to the AB Funds. The directors noted that they have four regular meetings each year, at each of which they review extensive materials and information from the Adviser, including information on the investment performance of the Fund.
The directors also considered all factors they believed relevant, including the specific matters discussed below. During the course of their deliberations, the directors evaluated, among other things, the reasonableness of the advisory fee. The directors did not identify any particular information that wasall-important or controlling, and different directors may have attributed different weights to the various factors. The directors determined that the selection of the Adviser to manage the Fund and the overall arrangements between the Fund and the Adviser, as provided in the Advisory Agreement, including the advisory fee, were fair and reasonable in light of the services performed, expenses incurred and such other matters as the directors considered relevant in the exercise of their business judgment. The material factors and conclusions that formed the basis for the directors’ determinations included the following:
Nature, Extent and Quality of Services Provided
The directors considered the scope and quality of services provided by the Adviser under the Advisory Agreement, including the quality of the investment research capabilities of the Adviser and the other resources it has dedicated to performing services for the Fund. The directors noted that the Adviser from time to time reviews the Fund’s investment strategies and from time to time proposes changes intended to improve the Fund’s relative or absolute performance for the directors’ consideration. They also noted the professional experience and qualifications of the Fund’s portfolio management team and other senior personnel of the Adviser. The quality of administrative and other services, including the Adviser’s role in coordinating the activities of the Fund’s other service providers, also was
| | |
| |
| 100 | AB TAX-MANAGED ALL MARKET INCOME PORTFOLIO | | abfunds.com |
considered. The directors concluded that, overall, they were satisfied with the nature, extent and quality of services provided to the Fund under the Advisory Agreement.
Costs of Services Provided and Profitability
The directors reviewed a schedule of the revenues and expenses and related notes indicating the profitability of the Fund to the Adviser for calendar years 2016 and 2017 that had been prepared with an expense allocation methodology arrived at in consultation with an independent consultant retained by the Fund’s former Senior Officer/Independent Compliance Officer. The directors noted the assumptions and methods of allocation used by the Adviser in preparing fund-specific profitability data and understood that there are a number of potentially acceptable allocation methodologies for information of this type. The directors noted that the profitability information reflected all revenues and expenses of the Adviser’s relationship with the Fund, including those relating to its subsidiaries that provide transfer agency, distribution and brokerage services to the Fund. The directors recognized that it is difficult to make comparisons of the profitability of the Advisory Agreement with the profitability of fund advisory contracts for unaffiliated funds because comparative information is not generally publicly available and is affected by numerous factors. The directors focused on the profitability of the Adviser’s relationship with the Fund before taxes and distribution expenses. The directors concluded that the Adviser’s level of profitability from its relationship with the Fund in 2016 was not unreasonable. The directors noted that the Fund was not profitable to the Adviser in 2017.
Fall-Out Benefits
The directors considered the other benefits to the Adviser and its affiliates from their relationships with the Fund and the underlying fund advised by the Adviser in which the Fund invests, including, but not limited to, benefits relating to soft dollar arrangements (whereby investment advisers receive brokerage and research services from brokers that execute agency transactions for their clients);12b-1 fees and sales charges received by the Fund’s principal underwriter (which is a wholly owned subsidiary of the Adviser) in respect of certain classes of the Fund’s shares; brokerage commissions paid by the Fund to brokers affiliated with the Adviser; and transfer agency fees paid by the Fund to a wholly owned subsidiary of the Adviser. The directors recognized that the Fund’s recent unprofitability to the Adviser would be exacerbated without these benefits. The directors understood that the Adviser also might derive reputational and other benefits from its association with the Fund.
Investment Results
In addition to the information reviewed by the directors in connection with the Meeting at which continuance of the Advisory Agreement was approved, the directors receive detailed performance information for the Fund at each regular Board meeting during the year.
| | |
| |
| abfunds.com | | AB TAX-MANAGED ALL MARKET INCOME PORTFOLIO | 101 |
At the Meeting, the directors reviewed performance information prepared by an independent service provider (the “15(c) service provider”), showing the performance of the Class A Shares of the Fund against a group of similar funds (“peer group”) and a larger group of similar funds (“peer universe”), each selected by the 15(c) service provider, and information prepared by the Adviser showing performance of the Class A Shares against a broad-based securities market index, in each case for the1-,3-,5- and10-year periods ended May 31, 2018 and (in the case of comparisons with the broad-based securities market index) for the period from inception. Based on their review, the directors concluded that the Fund’s investment performance was acceptable.
Advisory Fees and Other Expenses
The directors considered the advisory fee rate payable by the Fund to the Adviser and information prepared by the 15(c) service provider concerning advisory fee rates payable by other funds in the same category as the Fund. The directors recognized that it is difficult to make comparisons of advisory fees because there are variations in the services that are included in the fees paid by other funds. The directors compared the Fund’s contractual effective advisory fee rate with a peer group median.
The directors also considered the Adviser’s fee schedule for other clients pursuing a similar investment style. For this purpose, they reviewed the relevant advisory fee information from the Adviser’s Form ADV and in a report from the Fund’s Senior Analyst and noted the differences between the Fund’s fee schedule, on the one hand, and the Adviser’s institutional fee schedule, on the other. The directors noted that the Adviser may, in some cases, agree to fee rates with large institutional clients that are lower than those reviewed by the directors and that they had previously discussed with the Adviser its policies in respect of such arrangements. The directors also discussed these matters with their independent fee consultant.
The Adviser reviewed with the directors the significantly greater scope of the services it provides to the Fund relative to institutional clients. In this regard, the Adviser noted, among other things, that, compared to institutional accounts, the Fund (i) demands considerably more portfolio management, research and trading resources due to significantly higher daily cash flows; (ii) has more tax and regulatory restrictions and compliance obligations; (iii) must prepare and file or distribute regulatory and other communications about fund operations; and (iv) must provide shareholder servicing to retail investors. The Adviser also reviewed the greater legal risks presented by the large and changing population of Fund shareholders who may assert claims against the Adviser in individual or class actions, and the greater entrepreneurial risk in offering new fund products, which require substantial investment to launch, may not succeed, and generally must be priced to compete with larger, more established funds resulting in lack of profitability to the Adviser until a new fund achieves
| | |
| |
| 102 | AB TAX-MANAGED ALL MARKET INCOME PORTFOLIO | | abfunds.com |
scale. In light of the substantial differences in services rendered by the Adviser to institutional clients as compared to the Fund, the directors considered these fee comparisons inapt and did not place significant weight on them in their deliberations.
The directors also considered the total expense ratio of the Class A shares of the Fund in comparison to a peer group and a peer universe selected by the 15(c) service provider. The Class A expense ratio of the Fund was based on the Fund’s latest fiscal year. The directors considered the effects of any fee waivers and/or expense reimbursements as a result of the Adviser’s expense cap. The directors noted that it was likely that the expense ratios of some of the other funds in the Fund’s category were lowered by waivers or reimbursements by those funds’ investment advisers, which in some cases might be voluntary or temporary. The directors view expense ratio information as relevant to their evaluation of the Adviser’s services because the Adviser is responsible for coordinating services provided to the Fund by others. Based on their review, the directors concluded that the Fund’s expense ratio was acceptable.
Economies of Scale
The directors noted that the advisory fee schedules for the Fund contains breakpoints that reduce the fee rates on assets above specified levels. The directors took into consideration prior presentations by an independent consultant on economies of scale in the mutual fund industry and for the AB Funds, and by the Adviser concerning certain of its views on economies of scale. The directors also had requested and received from the Adviser certain updates on economies of scale in advance of the Meeting. The directors believe that economies of scale may be realized (if at all) by the Adviser across a variety of products and services, and not only in respect of a single fund. The directors noted that there is no established methodology for setting breakpoints that give effect to the fund-specific services provided by a fund’s adviser and to the economies of scale that an adviser may realize in its overall mutual fund business or those components of it which directly or indirectly affect a fund’s operations. The directors observed that in the mutual fund industry as a whole, as well as among funds similar to the Fund, there is no uniformity or pattern in the fees and asset levels at which breakpoints (if any) apply. The directors also noted that the advisory agreements for many funds do not have breakpoints at all. Having taken these factors into account, the directors concluded that the Fund’s shareholders would benefit from a sharing of economies of scale in the event the Fund’s net assets exceed a breakpoint in the future.
| | |
| |
| abfunds.com | | AB TAX-MANAGED ALL MARKET INCOME PORTFOLIO | 103 |
This page is not part of the Shareholder Report or the Financial Statements.
AB FAMILY OF FUNDS
US EQUITY
US CORE
Core Opportunities Fund
FlexFee™ US Thematic Portfolio
Select US Equity Portfolio
US GROWTH
Concentrated Growth Fund
Discovery Growth Fund
FlexFee™ Large Cap Growth Portfolio
Growth Fund
Large Cap Growth Fund
Small Cap Growth Portfolio
US VALUE
Discovery Value Fund
Equity Income Fund
Relative Value Fund
Small Cap Value Portfolio
Value Fund
INTERNATIONAL/ GLOBAL EQUITY
INTERNATIONAL/ GLOBAL CORE
FlexFee™ International Strategic Core Portfolio
Global Core Equity Portfolio
International Portfolio
International Strategic Core Portfolio
Sustainable Global Thematic Fund
Tax-Managed International Portfolio
Tax-Managed Wealth Appreciation Strategy
Wealth Appreciation Strategy
INTERNATIONAL/ GLOBAL GROWTH
Concentrated International Growth Portfolio
FlexFee™ Emerging Markets Growth Portfolio
INTERNATIONAL/ GLOBAL EQUITY(continued)
Sustainable International Thematic Fund
INTERNATIONAL/ GLOBAL VALUE
All China Equity Portfolio
International Value Fund
FIXED INCOME
MUNICIPAL
High Income Municipal Portfolio
Intermediate California Municipal Portfolio
Intermediate Diversified Municipal Portfolio
Intermediate New York Municipal Portfolio
Municipal Bond Inflation Strategy
Tax-Aware Fixed Income Portfolio
National Portfolio
Arizona Portfolio
California Portfolio
Massachusetts Portfolio
Minnesota Portfolio
New Jersey Portfolio
New York Portfolio
Ohio Portfolio
Pennsylvania Portfolio
Virginia Portfolio
TAXABLE
Bond Inflation Strategy
FlexFee™ High Yield Portfolio
FlexFee™ International Bond Portfolio
Global Bond Fund
High Income Fund
Income Fund
Intermediate Bond Portfolio
Limited Duration High Income Portfolio
Short Duration Portfolio
ALTERNATIVES
All Market Real Return Portfolio
Global Real Estate Investment Fund
Select US Long/Short Portfolio
Unconstrained Bond Fund
MULTI-ASSET
All Market Income Portfolio
All Market Total Return Portfolio
Conservative Wealth Strategy
Emerging Markets Multi-Asset Portfolio
Global Risk Allocation Fund
Tax-Managed All Market Income Portfolio
TARGET-DATE
Multi-Manager Select Retirement Allocation Fund
Multi-Manager Select 2010 Fund
Multi-Manager Select 2015 Fund
Multi-Manager Select 2020 Fund
Multi-Manager Select 2025 Fund
Multi-Manager Select 2030 Fund
Multi-Manager Select 2035 Fund
Multi-Manager Select 2040 Fund
Multi-Manager Select 2045 Fund
Multi-Manager Select 2050 Fund
Multi-Manager Select 2055 Fund
Multi-Manager Select 2060 Fund
CLOSED-END FUNDS
Alliance California Municipal Income Fund
AllianceBernstein Global High Income Fund
AllianceBernstein National Municipal Income Fund
We also offer Government Money Market Portfolio, which serves as the money market fund exchange vehicle for the AB mutual funds. You could lose money by investing in the Fund. Although the Fund seeks to preserve the value of your investment at $1.00 per share, it cannot guarantee it will do so. The Fund may impose a fee upon sale of your shares or may temporarily suspend your ability to sell shares if the Fund’s liquidity falls below required minimums because of market conditions or other factors. An investment in the Fund is not insured or guaranteed by the Federal Deposit Insurance Corporation or any other government agency. The Fund’s sponsor has no legal obligation to provide financial support to the Fund, and you should not expect that the sponsor will provide financial support to the Fund at any time.
Investors should consider the investment objectives, risks, charges and expenses of the Fund carefully before investing. For copies of our prospectus or summary prospectus, which contain this and other information, visit us online at www.abfunds.com or contact your AB representative. Please read the prospectus and/or summary prospectus carefully before investing.
| | |
| |
| 104 | AB TAX-MANAGED ALL MARKET INCOME PORTFOLIO | | abfunds.com |
NOTES
| | |
| |
| abfunds.com | | AB TAX-MANAGED ALL MARKET INCOME PORTFOLIO | 105 |
NOTES
| | |
| |
| 106 | AB TAX-MANAGED ALL MARKET INCOME PORTFOLIO | | abfunds.com |
NOTES
| | |
| |
| abfunds.com | | AB TAX-MANAGED ALL MARKET INCOME PORTFOLIO | 107 |
NOTES
| | |
| |
| 108 | AB TAX-MANAGED ALL MARKET INCOME PORTFOLIO | | abfunds.com |
AB TAX-MANAGED ALL MARKET INCOME PORTFOLIO
1345 Avenue of the Americas
New York, NY 10105
800 221 5672
TAMI-0152-0219 
FEB 02.28.19

SEMI-ANNUAL REPORT
AB TAX-MANAGED WEALTH APPRECIATION STRATEGY

Beginning January 1, 2021, as permitted by new regulations adopted by the Securities and Exchange Commission, the Fund’s annual and semi-annual shareholder reports will no longer be sent by mail, unless you specifically request paper copies of the reports. Instead, the reports will be made available on a website, and you will be notified by mail each time a report is posted and provided with a website address to access the report.
If you already elected to receive shareholder reports electronically, you will not be affected by this change and you need not take any action. You may elect to receive shareholder reports and other communications from the Fund electronically at any time by contacting your financial intermediary (such as a broker-dealer or bank) or, if you are a direct investor, by calling the Fund at (800) 221 5672.
You may elect to receive all future reports in paper form free of charge. If you invest through a financial intermediary, you can contact your financial intermediary to request that you continue to receive paper copies of your shareholder reports; if you invest directly with the Fund, you can call the Fund at (800) 221 5672. Your election to receive reports in paper form will apply to all funds held in your account with your financial intermediary or, if you invest directly, to all AB Mutual Funds you hold.
| | |
| |
| Investment Products Offered | | • Are Not FDIC Insured• May Lose Value• Are Not Bank Guaranteed |
Investors should consider the investment objectives, risks, charges and expenses of the Fund carefully before investing. For copies of our prospectus or summary prospectus, which contain this and other information, visit us online at www.abfunds.com or contact your AB representative. Please read the prospectus and/or summary prospectus carefully before investing.
This shareholder report must be preceded or accompanied by the Fund’s prospectus for individuals who are not current shareholders of the Fund.
You may obtain a description of the Fund’s proxy voting policies and procedures, and information regarding how the Fund voted proxies relating to portfolio securities during the most recent12-month period ended June 30, without charge. Simply visit AB’s website at www.abfunds.com, or go to the Securities and Exchange Commission’s (the “Commission”) website at www.sec.gov, or call AB at (800) 227 4618.
The Fund files its complete schedule of portfolio holdings with the Commission for the first and third quarters of each fiscal year as an exhibit to its reports on Form N-PORT. The Fund’s Form N-PORT reports are available on the Commission’s website at www.sec.gov. The Fund’s Forms N-PORT may also be reviewed and copied at the Commission’s Public Reference Room in Washington, DC; information on the operation of the Public Reference Room may be obtained by calling (800) SEC 0330. AB publishes full portfolio holdings for the Fund monthly at www.abfunds.com.
AllianceBernstein Investments, Inc. (ABI) is the distributor of the AB family of mutual funds. ABI is a member of FINRA and is an affiliate of AllianceBernstein L.P., the Adviser of the funds.
The [A/B] logo is a registered service mark of AllianceBernstein and AllianceBernstein® is a registered service mark used by permission of the owner, AllianceBernstein L.P.
| | |
| FROM THE PRESIDENT | |  |
Dear Shareholder,
We are pleased to provide this report for AB Tax-Managed Wealth Appreciation Strategy (the “Fund”). Please review the discussion of Fund performance, the market conditions during the reporting period and the Fund’s investment strategy.
As always, AB strives to keep clients ahead of what’s next by:
| + | | Transforming uncommon insights into uncommon knowledge with a global research scope |
| + | | Navigating markets with seasoned investment experience and sophisticated solutions |
| + | | Providing thoughtful investment insights and actionable ideas |
Whether you’re an individual investor or a multi-billion-dollar institution, we put knowledge and experience to work for you.
AB’s global research organization connects and collaborates across platforms and teams to deliver impactful insights and innovative products. Better insights lead to better opportunities—anywhere in the world.
For additional information about AB’s range of products and shareholder resources, please log on to www.abfunds.com.
Thank you for your investment in the AB Mutual Funds.
Sincerely,

Robert M. Keith
President and Chief Executive Officer, AB Mutual Funds
| | |
| |
| abfunds.com | | AB TAX-MANAGED WEALTH APPRECIATION STRATEGY | 1 |
SEMI-ANNUAL REPORT
April 10, 2019
This report provides management’s discussion of fund performance for AB Tax-Managed Wealth Appreciation Strategy for the semi-annual reporting period ended February 28, 2019.
The Fund’s investment objective is long-term growth of capital.
NAV RETURNS AS OF FEBRUARY 28, 2019(unaudited)
| | | | | | | | |
| | |
| | | 6 Months | | | 12 Months | |
| | |
| AB TAX-MANAGED WEALTH APPRECIATION STRATEGY | | | | | | | | |
| | |
| Class A Shares | | | -3.80% | | | | -1.32% | |
| | |
| Class B Shares1 | | | -4.22% | | | | -2.15% | |
| | |
| Class C Shares | | | -4.19% | | | | -2.11% | |
| | |
| Advisor Class Shares2 | | | -3.69% | | | | -1.11% | |
| | |
| MSCI ACWI (net) | | | -2.92% | | | | -0.84% | |
| 1 | Effective January 31, 2009, Class B shares are no longer available for purchase to new investors. Please see Note A for additional information. |
| 2 | Please note that this share class is for investors purchasing shares through accounts established under certain fee-based programs sponsored and maintained by certain broker-dealers and financial intermediaries, institutional pension plans and/or investment advisory clients of, and certain other persons associated with, the Adviser and its affiliates or the Fund. |
INVESTMENT RESULTS
The table above shows the Fund’s performance compared to its benchmark, the Morgan Stanley Capital International All Country World Index (“MSCI ACWI”) (net), for the six- and 12-month periods ended February 28, 2019.
For both periods, all share classes underperformed the benchmark, before sales charges. For the six-month period, the Fund’s overall allocation of 60% US stocks and 40% non-US stocks detracted from performance, relative to the benchmark, as US equities modestly underperformed. Stock selection in emerging-market, international large-cap and US small/mid-cap value stocks detracted, while stock selection in US large caps contributed.
For the 12- month period, the greater allocation to US stocks contributed as US-based stocks meaningfully outperformed their non-US peers. Stock selection in emerging-market, international large-cap and US small/mid-cap value stocks detracted, while stock selection in US small/mid-cap growth and US large caps contributed.
The Fund did not use derivatives during either period.
| | |
| |
| 2 | AB TAX-MANAGED WEALTH APPRECIATION STRATEGY | | abfunds.com |
MARKET REVIEW AND INVESTMENT STRATEGY
During the six-month period ended February 28, 2019, US and non-US equities declined, although emerging-market equities posted modest gains. In the US, growth-style stocks outperformed value-style stocks, and small-cap stocks outperformed their large-cap peers. Global trade tensions and rising interest rates weighed on stock market performance. In Europe, Brexit uncertainty, Italian budget issues and German economic woes persisted. Slowing global growth was an increasing concern more broadly. Global equities plummeted at the end of 2018 amid increased volatility, but recouped some losses in January and February, as corporate earnings were above analyst estimates and many central banks shared more dovish monetary policy outlooks.
The Fund’s Senior Investment Management Team (the “Team”) seeks improved equity risk control by utilizing the Adviser’s Strategic Equities services as the core equity allocation to US and international markets. This diversified exposure across equity markets and emphasis on a broad set of stocks, which includes companies with historical and projected stable earnings and higher profitability, eliminates the need for diversifiers to limit volatility.
The Team believes this allocation offers the potential to achieve higher returns, with similar levels of volatility, increasing risk-adjusted returns in an all-equity service to meet the long-term growth goal—growth of capital.
INVESTMENT POLICIES
The Fund invests primarily in equity securities, either directly or through underlying investment companies advised by the Adviser (“Underlying Portfolios”). A majority of the Fund’s assets are expected to be invested directly in US large-cap equity securities, primarily common stocks, in accordance with the Adviser’s US Strategic Equities investment strategy (“US Strategic Equities”), as described below. In addition, the Fund seeks to achieve exposure to international large-cap equity securities through investments in the International Strategic Equities Portfolio of Bernstein Fund, Inc. (“Bernstein International Strategic Equities Portfolio”) and the Tax-Managed International Portfolio of Sanford C. Bernstein Fund, Inc. (“SCB Tax-Managed International Portfolio”), each a registered investment company advised by the Adviser. The Fund also invests in other Underlying Portfolios to efficiently gain exposure to certain other types of equity securities, including small- and mid-cap and emerging-market equity securities. An Underlying Portfolio is selected based on the segment of the equity market to which the Underlying Portfolio provides exposure, its investment philosophy, and how it complements and diversifies the Fund’s overall portfolio.
(continued on next page)
| | |
| |
| abfunds.com | | AB TAX-MANAGED WEALTH APPRECIATION STRATEGY | 3 |
Under US Strategic Equities, portfolio managers of the Adviser that specialize in various investment disciplines identify high-conviction large-cap equity securities based on their fundamental investment research for potential investment by the Fund. These securities are then assessed in terms of both this fundamental research and quantitative analysis in creating the Fund’s portfolio. In applying the quantitative analysis, the Adviser considers a number of metrics that historically have provided some indication of favorable future returns, including metrics related to valuation, quality, investor behavior and corporate behavior.
Bernstein International Strategic Equities Portfolio and SCB Tax-Managed International Portfolio focus on investing in non-US large-cap and mid-cap equity securities. Bernstein International Strategic Equities Portfolio follows a strategy similar to US Strategic Equities, but in the international context. In managing SCB Tax-Managed International Portfolio, the Adviser selects stocks by drawing on the capabilities of its separate investment teams specializing in different investment disciplines, including value, growth, stability and others.
Fluctuations in currency exchange rates can have a dramatic impact on the returns of foreign equity securities. The Adviser may employ currency hedging strategies in the Fund or the Underlying Portfolios, including the use of currency-related derivatives, to seek to reduce currency risk in the Fund or the Underlying Portfolios, but it is not required to do so.
The Fund seeks to maximize after-tax returns to shareholders by taking into account the tax impact of buy and sell investment decisions on its shareholders. For example, the Adviser may sell certain securities in order to realize capital losses. Capital losses may be used to offset realized capital gains. To minimize capital gains distributions, the Adviser may sell securities in the Fund with the highest cost basis. The Adviser may monitor the length of time the Fund has held an investment to evaluate whether the investment should be sold at a short-term gain or held for a longer period so that the gain on the investment will be taxed at the lower long-term rate. In making this decision, the Adviser considers whether, in its judgment, the risk of continued exposure to the investment is worth the tax savings of a lower capital gains rate. There can be no assurance that any of these strategies will be effective or that their use will not adversely affect the gross returns of the Fund.
| | |
| |
| 4 | AB TAX-MANAGED WEALTH APPRECIATION STRATEGY | | abfunds.com |
DISCLOSURES AND RISKS
Benchmark Disclosure
The MSCI ACWI is unmanaged and does not reflect fees and expenses associated with the active management of a mutual fund portfolio. The MSCI ACWI (net, free float-adjusted, market capitalization weighted) represents the equity market performance of developed and emerging markets. MSCI makes no express or implied warranties or representations, and shall have no liability whatsoever with respect to any MSCI data contained herein. The MSCI data may not be further redistributed or used as a basis for other indices, any securities or financial products. This report is not approved, reviewed or produced by MSCI. Net returns include the reinvestment of dividends after deduction of non-US withholding tax. An investor cannot invest directly in an index or average, and their results are not indicative of the performance for any specific investment, including the Fund.
A Word About Risk
Market Risk: The value of the Fund’s assets will fluctuate as the stock, bond or commodities markets fluctuate. The value of its investments may decline, sometimes rapidly and unpredictably, simply because of economic changes or other events that affect large portions of the market. It includes the risk that a particular style of investing, such as growth or value, may be underperforming the stock market generally.
Foreign (Non-US) Risk: The Fund’s investments in securities of non-US issuers may involve more risk than those of US issuers. These securities may fluctuate more widely in price and may be less liquid due to adverse market, economic, political, regulatory or other factors.
Currency Risk: Fluctuations in currency exchange rates may negatively affect the value of the Fund’s investments or reduce its returns.
Emerging-Market Risk: Investments in emerging-market countries may have more risk because the markets are less developed and less liquid as well as being subject to increased economic, political, regulatory or other uncertainties.
Capitalization Risk: Investments in small- and mid-capitalization companies may be more volatile than investments in large-capitalization companies. Investments in small- and mid-capitalization companies may have additional risks because these companies have limited product lines, markets, or financial resources.
Investment in Other Investment Companies Risk: As with other investments, investments in other investment companies are subject to market and selection risk. In addition, shareholders of the Fund bear both their proportionate share of expenses in the Fund (including management
| | |
| |
| abfunds.com | | AB TAX-MANAGED WEALTH APPRECIATION STRATEGY | 5 |
DISCLOSURES AND RISKS(continued)
fees) and, indirectly, the expenses of the investment companies (to the extent these expenses are not waived or reimbursed by the Adviser).
Management Risk: The Fund is subject to management risk because it is an actively managed investment fund. The Adviser will apply its investment techniques and risk analyses in making investment decisions for the Fund, but there is no guarantee that its techniques will produce the intended results.
These risks are fully discussed in the Fund’s prospectus. As with all investments, you may lose money by investing in the Fund.
An Important Note About Historical Performance
The investment return and principal value of an investment in the Fund will fluctuate as the prices of the individual securities in which it invests fluctuate, so that your shares, when redeemed, may be worth more or less than their original cost. Performance shown in this report represents past performance and does not guarantee future results. Current performance may be lower or higher than the performance information shown. You may obtain performance information current to the most recent month-end by visiting www.abfunds.com. The performance shown for periods prior to July 14, 2017 is based on the Fund’s prior principal strategies and may not be representative of the Fund’s performance under its current principal strategies.
All fees and expenses related to the operation of the Fund have been deducted. Net asset value (“NAV”) returns do not reflect sales charges; if sales charges were reflected, the Fund’s quoted performance would be lower. SEC returns reflect the applicable sales charges for each share class: a 4.25% maximum front-end sales charge for Class A shares; the applicable contingent deferred sales charge for Class B shares (4% year 1, 3% year 2, 2% year 3, 1% year 4) and a 1% 1-year contingent deferred sales charge for Class C shares. Returns for the different share classes will vary due to different expenses associated with each class. Performance assumes reinvestment of distributions and does not account for taxes.
| | |
| |
| 6 | AB TAX-MANAGED WEALTH APPRECIATION STRATEGY | | abfunds.com |
HISTORICAL PERFORMANCE
AVERAGE ANNUAL RETURNS AS OF FEBRUARY 28, 2019(unaudited)
| | | | | | | | |
| | |
| | | NAV Returns | | | SEC Returns (reflects applicable sales charges) | |
| | |
| CLASS A SHARES | | | | | | | | |
| | |
| 1 Year | | | -1.32% | | | | -5.54% | |
| | |
| 5 Years | | | 5.79% | | | | 4.87% | |
| | |
| 10 Years | | | 11.80% | | | | 11.32% | |
| | |
| CLASS B SHARES | | | | | | | | |
| | |
| 1 Year | | | -2.15% | | | | -5.92% | |
| | |
| 5 Years | | | 4.97% | | | | 4.97% | |
| | |
| 10 Years1 | | | 11.13% | | | | 11.13% | |
| | |
| CLASS C SHARES | | | | | | | | |
| | |
| 1 Year | | | -2.11% | | | | -3.05% | |
| | |
| 5 Years | | | 4.99% | | | | 4.99% | |
| | |
| 10 Years | | | 10.99% | | | | 10.99% | |
| | |
| ADVISOR CLASS SHARES2 | | | | | | | | |
| | |
| 1 Year | | | -1.11% | | | | -1.11% | |
| | |
| 5 Years | | | 6.05% | | | | 6.05% | |
| | |
| 10 Years | | | 12.11% | | | | 12.11% | |
The Fund’s current prospectus fee table shows the Fund’s total annual operating expense ratios as 1.40%, 2.17%, 2.15% and 1.15% for Class A, Class B, Class C and Advisor Class shares, respectively, gross of any fee waivers or expense reimbursements. Contractual fee waivers and/or expense reimbursement agreements reduced the Fund’s annual operating expense ratios to 1.02%, 1.80%, 1.78% and 0.78% for Class A, Class B, Class C and Advisor Class shares, respectively. These waivers/reimbursement agreements may not be terminated before December 31, 2019. Absent reimbursements or waivers, performance would have been lower. The net and gross expenses shown include the total operating expenses of the Fund and the indirect expenses of the Fund’s Underlying Portfolios, as based upon the allocation of the Fund’s assets among the Underlying Portfolios. The Financial Highlights section of this report sets forth expense ratio data for the current reporting period; the expense ratios shown above may differ from the expense ratios in the Financial Highlights section since they are based on different time periods.
| 1 | Assumes conversion of Class B shares into Class A shares after eight years. |
| 2 | This share class is offered at NAV to eligible investors and the SEC returns are the same as the NAV returns. Please note that this share class is for investors purchasing shares through accounts established under certain fee-based programs sponsored and maintained by certain broker-dealers and financial intermediaries, institutional pension plans and/or investment advisory clients of, and certain other persons associated with, the Adviser and its affiliates or the Fund. |
| | |
| |
| abfunds.com | | AB TAX-MANAGED WEALTH APPRECIATION STRATEGY | 7 |
HISTORICAL PERFORMANCE(continued)
SEC AVERAGE ANNUAL RETURNS
AS OF THE MOST RECENT CALENDAR QUARTER-END
MARCH 31, 2019(unaudited)
| | | | |
| |
| | | SEC Returns (reflects applicable sales charges) | |
| |
| CLASS A SHARES | | | | |
| |
| 1 Year | | | -3.27% | |
| |
| 5 Years | | | 5.02% | |
| |
| 10 Years | | | 10.51% | |
| |
| CLASS B SHARES | | | | |
| |
| 1 Year | | | -3.57% | |
| |
| 5 Years | | | 5.12% | |
| |
| 10 Years1 | | | 10.32% | |
| |
| CLASS C SHARES | | | | |
| |
| 1 Year | | | -0.61% | |
| |
| 5 Years | | | 5.16% | |
| |
| 10 Years | | | 10.19% | |
| |
| ADVISOR CLASS SHARES2 | | | | |
| |
| 1 Year | | | 1.27% | |
| |
| 5 Years | | | 6.21% | |
| |
| 10 Years | | | 11.30% | |
| 1 | Assumes conversion of Class B shares into Class A shares after eight years. |
| 2 | Please note that this share class is for investors purchasing shares through accounts established under certain fee-based programs sponsored and maintained by certain broker-dealers and financial intermediaries, institutional pension plans and/or investment advisory clients of, and certain other persons associated with, the Adviser and its affiliates or the Fund. |
| | |
| |
| 8 | AB TAX-MANAGED WEALTH APPRECIATION STRATEGY | | abfunds.com |
HISTORICAL PERFORMANCE(continued)
RETURNS AFTER TAXES ON DISTRIBUTIONS
AS OF THE MOST RECENT CALENDAR QUARTER-END
MARCH 31, 2019(unaudited)
| | | | |
| |
| | | Returns | |
| |
| CLASS A SHARES | | | | |
| |
| 1 Year | | | -4.43% | |
| |
| 5 Years | | | 3.46% | |
| |
| 10 Years | | | 9.53% | |
| |
| CLASS B SHARES | | | | |
| |
| 1 Year | | | -4.50% | |
| |
| 5 Years | | | 3.85% | |
| |
| 10 Years1 | | | 9.52% | |
| |
| CLASS C SHARES | | | | |
| |
| 1 Year | | | -1.55% | |
| |
| 5 Years | | | 3.83% | |
| |
| 10 Years | | | 9.42% | |
| |
| ADVISOR CLASS SHARES2 | | | | |
| |
| 1 Year | | | 0.00% | |
| |
| 5 Years | | | 4.55% | |
| |
| 10 Years | | | 10.25% | |
RETURNS AFTER TAXES ON DISTRIBUTIONS AND SALE OF FUND SHARES
AS OF THE MOST RECENT CALENDAR QUARTER-END
MARCH 31, 2019(unaudited)
| | | | |
| |
| | | Returns | |
| |
| CLASS A SHARES | | | | |
| |
| 1 Year | | | -1.27% | |
| |
| 5 Years | | | 3.65% | |
| |
| 10 Years | | | 8.52% | |
| |
| CLASS B SHARES | | | | |
| |
| 1 Year | | | -1.57% | |
| |
| 5 Years | | | 3.82% | |
| |
| 10 Years1 | | | 8.41% | |
| |
| CLASS C SHARES | | | | |
| |
| 1 Year | | | 0.19% | |
| |
| 5 Years | | | 3.84% | |
| |
| 10 Years | | | 8.31% | |
| |
| ADVISOR CLASS SHARES2 | | | | |
| |
| 1 Year | | | 1.48% | |
| |
| 5 Years | | | 4.56% | |
| |
| 10 Years | | | 9.19% | |
(footnotes continued on next page)
| | |
| |
| abfunds.com | | AB TAX-MANAGED WEALTH APPRECIATION STRATEGY | 9 |
HISTORICAL PERFORMANCE(continued)
| 1 | Assumes conversion of Class B shares into Class A shares after eight years. |
| 2 | Please note that this share class is for investors purchasing shares through accounts established under certain fee-based programs sponsored and maintained by certain broker-dealers and financial intermediaries, institutional pension plans and/or investment advisory clients of, and certain other persons associated with, the Adviser and its affiliates or the Fund. |
| | |
| |
| 10 | AB TAX-MANAGED WEALTH APPRECIATION STRATEGY | | abfunds.com |
EXPENSE EXAMPLE
(unaudited)
As a shareholder of the Fund, you incur two types of costs: (1) transaction costs, including sales charges (loads) on purchase payments, contingent deferred sales charges on redemptions and (2) ongoing costs, including management fees; distribution(12b-1) fees; and other Fund expenses. This example is intended to help you understand your ongoing costs (in dollars) of investing in the Fund and to compare these costs with the ongoing costs of investing in other mutual funds.
The Example is based on an investment of $1,000 invested at the beginning of the period and held for the entire period as indicated below.
Actual Expenses
The table below provides information about actual account values and actual expenses. You may use the information, together with the amount you invested, to estimate the expenses that you paid over the period. Simply divide your account value by $1,000 (for example, an $8,600 account value divided by $1,000 = 8.6), then multiply the result by the number under the heading entitled “Expenses Paid During Period” to estimate the expenses you paid on your account during this period.
Hypothetical Example for Comparison Purposes
The table below also provides information about hypothetical account values and hypothetical expenses based on the Fund’s actual expense ratio and an assumed annual rate of return of 5% before expenses, which is not the Fund’s actual return. The hypothetical account values and expenses may not be used to estimate the actual ending account balance or expenses you paid for the period. You may use this information to compare the ongoing costs of investing in the Fund and other funds by comparing this 5% hypothetical example with the 5% hypothetical examples that appear in the shareholder reports of other funds.
Please note that the expenses shown in the table are meant to highlight your ongoing costs only and do not reflect any transactional costs, such as sales charges (loads), or contingent deferred sales charges on redemptions. Therefore, the hypothetical example is useful in comparing ongoing costs only, and will not help you determine the relative total costs of owning different funds. In addition, if these transactional costs were included, your costs would have been higher.
| | |
| |
| abfunds.com | | AB TAX-MANAGED WEALTH APPRECIATION STRATEGY | 11 |
EXPENSE EXAMPLE(continued)
| | | | | | | | | | | | | | | | | | | | | | | | |
| | | Beginning
Account
Value
September 1,
2018 | | | Ending
Account
Value
February 28,
2019 | | | Expenses
Paid
During
Period* | | | Annualized
Expense
Ratio* | | | Total
Expenses
Paid
During
Period+ | | | Total
Annualized
Expense
Ratio+ | |
| Class A | | | | | | | | | | | | | | | | | | | | | | | | |
Actual | | $ | 1,000 | | | $ | 962.00 | | | $ | 3.06 | | | | 0.63 | % | | $ | 4.96 | | | | 1.02 | % |
Hypothetical** | | $ | 1,000 | | | $ | 1,021.67 | | | $ | 3.16 | | | | 0.63 | % | | $ | 5.11 | | | | 1.02 | % |
| Class B | | | | | | | | | | | | | | | | | | | | | | | | |
Actual | | $ | 1,000 | | | $ | 957.80 | | | $ | 6.84 | | | | 1.41 | % | | $ | 8.74 | | | | 1.80 | % |
Hypothetical** | | $ | 1,000 | | | $ | 1,017.80 | | | $ | 7.05 | | | | 1.41 | % | | $ | 9.00 | | | | 1.80 | % |
| Class C | | | | | | | | | | | | | | | | | | | | | | | | |
Actual | | $ | 1,000 | | | $ | 958.10 | | | $ | 6.70 | | | | 1.38 | % | | $ | 8.59 | | | | 1.77 | % |
Hypothetical** | | $ | 1,000 | | | $ | 1,017.95 | | | $ | 6.90 | | | | 1.38 | % | | $ | 8.85 | | | | 1.77 | % |
| Advisor Class | | | | | | | | | | | | | | | | | | | | | | | | |
Actual | | $ | 1,000 | | | $ | 963.10 | | | $ | 1.85 | | | | 0.38 | % | | $ | 3.75 | | | | 0.77 | % |
Hypothetical** | | $ | 1,000 | | | $ | 1,022.91 | | | $ | 1.91 | | | | 0.38 | % | | $ | 3.86 | | | | 0.77 | % |
| * | Expenses are equal to the classes’ annualized expense ratios, multiplied by the average account value over the period, multiplied by 181/365 (to reflect theone-half year period). |
| ** | Assumes 5% annual return before expenses. |
| + | In connection with the Fund’s investments in affiliated/unaffiliated underlying portfolios, the Fund incurs no direct expenses, but bears proportionate shares of the fees and expenses (i.e., operating, administrative and investment advisory fees) of the affiliated/unaffiliated underlying portfolios. The Adviser has contractually agreed to waive its fees from the Fund in an amount equal to the Fund’s pro rata share of certain acquired fund fees and expenses of the affiliated underlying portfolios. The Fund’s total expenses are equal to the classes’ annualized expense ratio plus the Fund’s pro rata share of the weighted average expense ratio of the affiliated/unaffiliated underlying portfolios in which it invests, multiplied by the average account value over the period, multiplied by 181/365 (to reflect theone-half year period). |
| | |
| |
| 12 | AB TAX-MANAGED WEALTH APPRECIATION STRATEGY | | abfunds.com |
PORTFOLIO SUMMARY
February 28, 2019(unaudited)
PORTFOLIO STATISTICS
Net Assets ($mil): $706.4
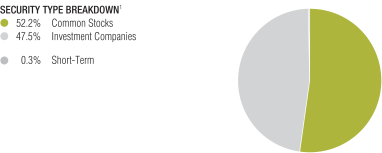
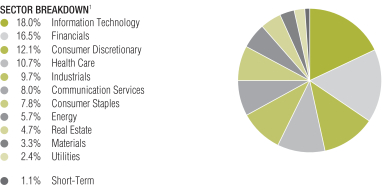
| 1 | All data are as of February 28, 2019. The Fund’s security type and sector breakdowns are expressed as a percentage of total investments and may vary over time. The Fund also enters into derivative transactions, which may be used for hedging or investment purposes (see “Portfolio of Investments” section of the report for additional details). Sectors shown include investments of Underlying Portfolios. |
Please note: The sector classifications presented herein are based on the Global Industry Classification Standard (GICS) which was developed by Morgan Stanley Capital International and Standard & Poor’s. The components are divided into sector, industry group, and industrysub-indices as classified by the GICS for each of the market capitalization indices in the broad market. These sector classifications are broadly defined. The “Portfolio of Investments” section of the report reflects more specific industry information and is consistent with the investment restrictions discussed in the Fund’s prospectus.
| | |
| |
| abfunds.com | | AB TAX-MANAGED WEALTH APPRECIATION STRATEGY | 13 |
PORTFOLIO OF INVESTMENTS
February 28, 2019(unaudited)
| | | | | | | | |
| Company | | Shares | | | U.S. $ Value | |
| |
COMMON STOCKS – 52.1% | | | | | | | | |
Information Technology – 12.0% | | | | | | | | |
Communications Equipment – 1.0% | | | | | | | | |
Cisco Systems, Inc. | | | 92,148 | | | $ | 4,770,502 | |
Nokia Oyj (Sponsored ADR) – Class A | | | 384,028 | | | | 2,338,730 | |
| | | | | | | | |
| | | | | | | 7,109,232 | |
| | | | | | | | |
Electronic Equipment, Instruments & Components – 0.3% | | | | | | | | |
CDW Corp./DE | | | 22,267 | | | | 2,090,649 | |
| | | | | | | | |
| | |
IT Services – 3.1% | | | | | | | | |
Automatic Data Processing, Inc. | | | 15,078 | | | | 2,307,386 | |
Cognizant Technology Solutions Corp. – Class A | | | 31,921 | | | | 2,265,753 | |
Fidelity National Information Services, Inc. | | | 30,084 | | | | 3,253,585 | |
PayPal Holdings, Inc.(a) | | | 21,834 | | | | 2,141,260 | |
Total System Services, Inc. | | | 28,288 | | | | 2,670,387 | |
Visa, Inc. – Class A | | | 62,501 | | | | 9,257,648 | |
| | | | | | | | |
| | | | | | | 21,896,019 | |
| | | | | | | | |
Semiconductors & Semiconductor Equipment – 1.4% | | | | | | | | |
Intel Corp. | | | 16,761 | | | | 887,663 | |
Texas Instruments, Inc. | | | 34,825 | | | | 3,683,789 | |
Xilinx, Inc. | | | 39,275 | | | | 4,921,157 | |
| | | | | | | | |
| | | | | | | 9,492,609 | |
| | | | | | | | |
Software – 3.8% | | | | | | | | |
Adobe, Inc.(a) | | | 11,338 | | | | 2,976,225 | |
Check Point Software Technologies Ltd.(a) | | | 14,536 | | | | 1,777,753 | |
Microsoft Corp. | | | 128,684 | | | | 14,416,468 | |
Oracle Corp. | | | 112,290 | | | | 5,853,678 | |
VMware, Inc. – Class A | | | 12,137 | | | | 2,085,258 | |
| | | | | | | | |
| | | | | | | 27,109,382 | |
| | | | | | | | |
Technology Hardware, Storage & Peripherals – 2.4% | | | | | | | | |
Apple, Inc. | | | 64,070 | | | | 11,093,721 | |
HP, Inc. | | | 121,141 | | | | 2,390,112 | |
Xerox Corp. | | | 115,568 | | | | 3,571,051 | |
| | | | | | | | |
| | | | | | | 17,054,884 | |
| | | | | | | | |
| | | | | | | 84,752,775 | |
| | | | | | | | |
Financials – 7.8% | | | | | | | | |
Banks – 3.6% | | | | | | | | |
Bank of America Corp. | | | 266,733 | | | | 7,756,596 | |
Citigroup, Inc. | | | 68,949 | | | | 4,411,357 | |
JPMorgan Chase & Co. | | | 68,346 | | | | 7,132,589 | |
Wells Fargo & Co. | | | 117,151 | | | | 5,844,663 | |
| | | | | | | | |
| | | | | | | 25,145,205 | |
| | | | | | | | |
| | |
| |
| 14 | AB TAX-MANAGED WEALTH APPRECIATION STRATEGY | | abfunds.com |
PORTFOLIO OF INVESTMENTS(continued)
| | | | | | | | |
| Company | | Shares | | | U.S. $ Value | |
| |
Capital Markets – 1.1% | | | | | | | | |
CME Group, Inc. – Class A | | | 15,540 | | | $ | 2,826,881 | |
Goldman Sachs Group, Inc. (The) | | | 17,238 | | | | 3,390,715 | |
S&P Global, Inc. | | | 8,219 | | | | 1,646,841 | |
| | | | | | | | |
| | | | | | | 7,864,437 | |
| | | | | | | | |
Consumer Finance – 0.5% | | | | | | | | |
Capital One Financial Corp. | | | 4,640 | | | | 387,811 | |
Synchrony Financial | | | 88,337 | | | | 2,880,670 | |
| | | | | | | | |
| | | | | | | 3,268,481 | |
| | | | | | | | |
Diversified Financial Services – 0.9% | | | | | | | | |
Berkshire Hathaway, Inc. – Class B(a) | | | 32,318 | | | | 6,505,613 | |
| | | | | | | | |
| | |
Insurance – 1.7% | | | | | | | | |
Allstate Corp. (The) | | | 1,156 | | | | 109,103 | |
Everest Re Group Ltd. | | | 20,558 | | | | 4,648,369 | |
Fidelity National Financial, Inc. | | | 94,810 | | | | 3,326,883 | |
Progressive Corp. (The) | | | 58,035 | | | | 4,230,752 | |
| | | | | | | | |
| | | | | | | 12,315,107 | |
| | | | | | | | |
| | | | | | | 55,098,843 | |
| | | | | | | | |
Health Care – 6.4% | | | | | | | | |
Biotechnology – 1.3% | | | | | | | | |
Biogen, Inc.(a) | | | 9,942 | | | | 3,261,075 | |
Gilead Sciences, Inc. | | | 64,091 | | | | 4,167,197 | |
Vertex Pharmaceuticals, Inc.(a) | | | 9,241 | | | | 1,744,239 | |
| | | | | | | | |
| | | | | | | 9,172,511 | |
| | | | | | | | |
Health Care Equipment & Supplies – 0.9% | | | | | | | | |
Edwards Lifesciences Corp.(a) | | | 17,730 | | | | 3,001,512 | |
Intuitive Surgical, Inc.(a) | | | 2,145 | | | | 1,174,623 | |
Medtronic PLC | | | 25,222 | | | | 2,282,591 | |
| | | | | | | | |
| | | | | | | 6,458,726 | |
| | | | | | | | |
Health Care Providers & Services – 1.6% | | | | | | | | |
Anthem, Inc. | | | 15,728 | | | | 4,729,882 | |
UnitedHealth Group, Inc. | | | 28,288 | | | | 6,851,919 | |
| | | | | | | | |
| | | | | | | 11,581,801 | |
| | | | | | | | |
Pharmaceuticals – 2.6% | | | | | | | | |
Johnson & Johnson | | | 11,584 | | | | 1,582,838 | |
Merck & Co., Inc. | | | 53,059 | | | | 4,313,166 | |
Pfizer, Inc. | | | 159,874 | | | | 6,930,538 | |
Teva Pharmaceutical Industries Ltd.
(Sponsored ADR)(a) | | | 89,300 | | | | 1,502,919 | |
Zoetis, Inc. | | | 39,761 | | | | 3,746,679 | |
| | | | | | | | |
| | | | | | | 18,076,140 | |
| | | | | | | | |
| | | | | | | 45,289,178 | |
| | | | | | | | |
Consumer Discretionary – 6.1% | | | | | | | | |
Auto Components – 0.6% | | | | | | | | |
Magna International, Inc. – Class A | | | 73,655 | | | | 3,883,828 | |
| | | | | | | | |
| | |
| |
| abfunds.com | | AB TAX-MANAGED WEALTH APPRECIATION STRATEGY | 15 |
PORTFOLIO OF INVESTMENTS(continued)
| | | | | | | | |
| Company | | Shares | | | U.S. $ Value | |
| |
Hotels, Restaurants & Leisure – 0.4% | | | | | | | | |
McDonald’s Corp. | | | 14,040 | | | $ | 2,581,114 | |
Starbucks Corp. | | | 8,366 | | | | 587,795 | |
| | | | | | | | |
| | | | | | | 3,168,909 | |
| | | | | | | | |
Internet & Direct Marketing Retail – 0.3% | | | | | | | | |
Booking Holdings, Inc.(a) | | | 1,265 | | | | 2,146,756 | |
| | | | | | | | |
| | |
Multiline Retail – 0.5% | | | | | | | | |
Dollar General Corp. | | | 30,905 | | | | 3,661,006 | |
| | | | | | | | |
| | |
Specialty Retail – 3.5% | | | | | | | | |
AutoZone, Inc.(a) | | | 4,888 | | | | 4,589,685 | |
Home Depot, Inc. (The) | | | 38,538 | | | | 7,134,925 | |
Ross Stores, Inc. | | | 50,495 | | | | 4,788,441 | |
TJX Cos., Inc. (The) | | | 119,228 | | | | 6,115,204 | |
Ulta Salon Cosmetics & Fragrance, Inc.(a) | | | 5,899 | | | | 1,843,379 | |
| | | | | | | | |
| | | | | | | 24,471,634 | |
| | | | | | | | |
Textiles, Apparel & Luxury Goods – 0.8% | | | | | | | | |
NIKE, Inc. – Class B | | | 65,504 | | | | 5,615,658 | |
| | | | | | | | |
| | | | | | | 42,947,791 | |
| | | | | | | | |
Communication Services – 5.9% | | | | | | | | |
Diversified Telecommunication Services – 0.9% | | | | | | | | |
Verizon Communications, Inc. | | | 105,117 | | | | 5,983,260 | |
| | | | | | | | |
| | |
Entertainment – 0.5% | | | | | | | | |
Walt Disney Co. (The) | | | 34,009 | | | | 3,837,575 | |
| | | | | | | | |
| | |
Interactive Media & Services – 3.0% | | | | | | | | |
Alphabet, Inc. – Class A(a) | | | 1,345 | | | | 1,515,210 | |
Alphabet, Inc. – Class C(a) | | | 10,558 | | | | 11,824,115 | |
Facebook, Inc. – Class A(a) | | | 50,661 | | | | 8,179,218 | |
| | | | | | | | |
| | | | | | | 21,518,543 | |
| | | | | | | | |
Media – 1.1% | | | | | | | | |
Comcast Corp. – Class A | | | 198,933 | | | | 7,692,739 | |
| | | | | | | | |
| | |
Wireless Telecommunication Services – 0.4% | | | | | | | | |
T-Mobile US, Inc.(a) | | | 34,179 | | | | 2,468,066 | |
| | | | | | | | |
| | | | | | | 41,500,183 | |
| | | | | | | | |
Consumer Staples – 3.8% | | | | | | | | |
Beverages – 0.7% | | | | | | | | |
PepsiCo, Inc. | | | 41,258 | | | | 4,771,075 | |
| | | | | | | | |
| | |
Food & Staples Retailing – 1.9% | | | | | | | | |
Costco Wholesale Corp. | | | 20,537 | | | | 4,492,263 | |
US Foods Holding Corp.(a) | | | 99,619 | | | | 3,510,574 | |
Walmart, Inc. | | | 54,375 | | | | 5,382,581 | |
| | | | | | | | |
| | | | | | | 13,385,418 | |
| | | | | | | | |
Household Products – 0.7% | | | | | | | | |
Procter & Gamble Co. (The) | | | 49,573 | | | | 4,885,419 | |
| | | | | | | | |
| | |
| |
| 16 | AB TAX-MANAGED WEALTH APPRECIATION STRATEGY | | abfunds.com |
PORTFOLIO OF INVESTMENTS(continued)
| | | | | | | | |
| Company | | Shares | | | U.S. $ Value | |
| |
Tobacco – 0.5% | | | | | | | | |
Altria Group, Inc. | | | 69,233 | | | $ | 3,628,502 | |
| | | | | | | | |
| | | | | | | 26,670,414 | |
| | | | | | | | |
Industrials – 3.2% | | | | | | | | |
Aerospace & Defense – 1.7% | | | | | | | | |
Boeing Co. (The) | | | 14,023 | | | | 6,169,559 | |
Northrop Grumman Corp. | | | 6,621 | | | | 1,919,825 | |
Raytheon Co. | | | 21,869 | | | | 4,078,569 | |
| | | | | | | | |
| | | | | | | 12,167,953 | |
| | | | | | | | |
Airlines – 0.4% | | | | | | | | |
Delta Air Lines, Inc. | | | 60,757 | | | | 3,012,332 | |
| | | | | | | | |
| | |
Electrical Equipment – 0.0% | | | | | | | | |
Eaton Corp. PLC | | | 3,316 | | | | 264,517 | |
| | | | | | | | |
| | |
Industrial Conglomerates – 0.6% | | | | | | | | |
Honeywell International, Inc. | | | 27,975 | | | | 4,310,108 | |
| | | | | | | | |
| | |
Road & Rail – 0.5% | | | | | | | | |
Norfolk Southern Corp. | | | 18,679 | | | | 3,349,145 | |
| | | | | | | | |
| | | | | | | 23,104,055 | |
| | | | | | | | |
Real Estate – 2.8% | | | | | | | | |
Equity Real Estate Investment Trusts (REITs) – 2.3% | | | | | | | | |
CubeSmart | | | 88,621 | | | | 2,715,347 | |
Mid-America Apartment Communities, Inc. | | | 52,879 | | | | 5,477,207 | |
Regency Centers Corp. | | | 62,513 | | | | 4,078,973 | |
Sun Communities, Inc. | | | 35,017 | | | | 3,976,881 | |
| | | | | | | | |
| | | | | | | 16,248,408 | |
| | | | | | | | |
Real Estate Management & Development – 0.5% | | | | | | | | |
CBRE Group, Inc. – Class A(a) | | | 71,101 | | | | 3,537,986 | |
| | | | | | | | |
| | | | | | | 19,786,394 | |
| | | | | | | | |
Energy – 2.6% | | | | | | | | |
Energy Equipment & Services – 0.2% | | | | | | | | |
National Oilwell Varco, Inc. | | | 57,368 | | | | 1,614,336 | |
| | | | | | | | |
| | |
Oil, Gas & Consumable Fuels – 2.4% | | | | | | | | |
Chevron Corp. | | | 39,474 | | | | 4,720,301 | |
EOG Resources, Inc. | | | 30,759 | | | | 2,891,346 | |
Exxon Mobil Corp. | | | 34,252 | | | | 2,706,935 | |
Marathon Petroleum Corp. | | | 28,994 | | | | 1,797,918 | |
Royal Dutch Shell PLC (Sponsored ADR) | | | 70,313 | | | | 4,472,610 | |
| | | | | | | | |
| | | | | | | 16,589,110 | |
| | | | | | | | |
| | | | | | | 18,203,446 | |
| | | | | | | | |
Utilities – 1.3% | | | | | | | | |
Electric Utilities – 0.8% | | | | | | | | |
American Electric Power Co., Inc. | | | 65,896 | | | | 5,347,460 | |
Edison International | | | 4,800 | | | | 287,472 | |
| | | | | | | | |
| | | | | | | 5,634,932 | |
| | | | | | | | |
| | |
| |
| abfunds.com | | AB TAX-MANAGED WEALTH APPRECIATION STRATEGY | 17 |
PORTFOLIO OF INVESTMENTS(continued)
| | | | | | | | |
| Company | | Shares | | | U.S. $ Value | |
| |
Multi-Utilities – 0.5% | | | | | | | | |
NiSource, Inc. | | | 124,897 | | | $ | 3,369,721 | |
| | | | | | | | |
| | | | | | | 9,004,653 | |
| | | | | | | | |
Materials – 0.2% | | | | | | | | |
Chemicals – 0.2% | | | | | | | | |
Westlake Chemical Corp. | | | 20,613 | | | | 1,440,230 | |
| | | | | | | | |
| | |
Total Common Stocks
(cost $275,206,369) | | | | | | | 367,797,962 | |
| | | | | | | | |
| | | | | | | | |
INVESTMENT COMPANIES – 47.4% | | | | | | | | |
Funds and Investment Trusts – 47.4%(b)(c) | | | | | | | | |
AB Discovery Growth Fund, Inc. – Class Z | | | 1,512,466 | | | | 17,257,232 | |
AB Trust – AB Discovery Value Fund, Inc. – Class Z | | | 854,342 | | | | 16,710,936 | |
Bernstein Fund, Inc. – International Small Cap Portfolio – Class Z | | | 4,026,592 | | | | 42,238,947 | |
Bernstein Fund, Inc. – International Strategic Equities Portfolio – Class Z | | | 12,125,114 | | | | 140,287,571 | |
Bernstein Fund, Inc. – Small Cap Core Portfolio – Class Z | | | 1,761,922 | | | | 19,504,480 | |
Sanford C. Bernstein Fund, Inc. – Emerging Markets Portfolio – Class Z | | | 758,691 | | | | 19,885,304 | |
Sanford C. Bernstein Fund, Inc. –Tax-Managed International Portfolio – Class Z | | | 4,952,805 | | | | 79,145,821 | |
| | | | | | | | |
| | |
Total Investment Companies
(cost $359,748,999) | | | | | | | 335,030,291 | |
| | | | | | | | |
| | | | | | | | |
SHORT-TERM INVESTMENTS – 0.3% | | | | | | | | |
Investment Companies – 0.3% | | | | | | | | |
AB Fixed Income Shares, Inc. – Government Money Market Portfolio – Class AB, 2.35%(b)(c)(d)
(cost $2,044,603) | | | 2,044,603 | | | | 2,044,603 | |
| | | | | | | | |
| | |
Total Investments – 99.8%
(cost $636,999,971) | | | | | | | 704,872,856 | |
Other assets less liabilities – 0.2% | | | | | | | 1,553,665 | |
| | | | | | | | |
| | |
Net Assets – 100.0% | | | | | | $ | 706,426,521 | |
| | | | | | | | |
| (a) | Non-income producing security. |
| (b) | Affiliated investments. |
| (c) | To obtain a copy of the fund’s shareholder report, please go to the Securities and Exchange Commission’s website at www.sec.gov, or call AB at(800) 227-4618. |
| (d) | The rate shown represents the7-day yield as of period end. |
Glossary:
ADR – American Depositary Receipt
See notes to financial statements.
| | |
| |
| 18 | AB TAX-MANAGED WEALTH APPRECIATION STRATEGY | | abfunds.com |
STATEMENT OF ASSETS & LIABILITIES
February 28, 2019(unaudited)
| | | | |
| Assets | |
Investments in securities, at value | | | | |
Unaffiliated issuers (cost $275,206,369) | | $ | 367,797,962 | |
Affiliated issuers (cost $361,793,602) | | | 337,074,894 | |
Cash | | | 845,787 | |
Unaffiliated dividends receivable | | | 784,966 | |
Receivable for shares of beneficial interest sold | | | 619,931 | |
Affiliated dividends receivable | | | 5,050 | |
Other assets | | | 145,320 | |
| | | | |
Total assets | | | 707,273,910 | |
| | | | |
| Liabilities | |
Payable for shares of beneficial interest redeemed | | | 556,227 | |
Advisory fee payable | | | 152,493 | |
Administrative fee payable | | | 28,515 | |
Transfer Agent fee payable | | | 14,707 | |
Distribution fee payable | | | 11,472 | |
Trustees’ fees payable | | | 6,297 | |
Accrued expenses | | | 77,678 | |
| | | | |
Total liabilities | | | 847,389 | |
| | | | |
Net Assets | | $ | 706,426,521 | |
| | | | |
| Composition of Net Assets | |
Shares of beneficial interest, at par | | $ | 460 | |
Additionalpaid-in capital | | | 615,677,729 | |
Distributable earnings | | | 90,748,332 | |
| | | | |
| | $ | 706,426,521 | |
| | | | |
Net Asset Value Per Share—unlimited shares authorized, $.00001 par value
| | | | | | | | | | | | |
| Class | | Net Assets | | | Shares
Outstanding | | | Net Asset
Value | |
| |
| A | | $ | 37,340,221 | | | | 2,437,845 | | | $ | 15.32 | * |
| |
| B | | $ | 228,216 | | | | 14,931 | | | $ | 15.28 | |
| |
| C | | $ | 5,545,356 | | | | 365,787 | | | $ | 15.16 | |
| |
| Advisor | | $ | 663,312,728 | | | | 43,153,579 | | | $ | 15.37 | |
| |
| * | The maximum offering price per share for Class A shares was $16.00 which reflects a sales charge of 4.25%. |
See notes to financial statements.
| | |
| |
| abfunds.com | | AB TAX-MANAGED WEALTH APPRECIATION STRATEGY | 19 |
STATEMENT OF OPERATIONS
Six Months Ended February 28, 2019(unaudited)
| | | | | | | | |
| Investment Income | | | | | | | | |
Dividends | | | | | | | | |
Unaffiliated issuers (net of foreign taxes withheld of $6,798) | | $ | 3,680,038 | | | | | |
Affiliated issuers | | | 6,276,584 | | | $ | 9,956,622 | |
| | | | | | | | |
| Expenses | | | | | | | | |
Advisory fee (see Note B) | | | 2,238,826 | | | | | |
Distribution fee—Class A | | | 46,282 | | | | | |
Distribution fee—Class B | | | 1,197 | | | | | |
Distribution fee—Class C | | | 31,424 | | | | | |
Transfer agency—Class A | | | 3,969 | | | | | |
Transfer agency—Class B | | | 66 | | | | | |
Transfer agency—Class C | | | 776 | | | | | |
Transfer agency—Advisor Class | | | 69,228 | | | | | |
Custodian | | | 70,852 | | | | | |
Administrative | | | 35,571 | | | | | |
Audit and tax | | | 31,598 | | | | | |
Registration fees | | | 27,976 | | | | | |
Legal | | | 22,188 | | | | | |
Printing | | | 19,932 | | | | | |
Trustees’ fees | | | 12,443 | | | | | |
Miscellaneous | | | 20,113 | | | | | |
| | | | | | | | |
Total expenses | | | 2,632,441 | | | | | |
Less: expenses waived and reimbursed by the Adviser (see Note B) | | | (1,248,732 | ) | | | | |
| | | | | | | | |
Net expenses | | | | | | | 1,383,709 | |
| | | | | | | | |
Net investment income | | | | | | | 8,572,913 | |
| | | | | | | | |
| Realized and Unrealized Gain (Loss) on Investment and Foreign Currency Transactions | | | | | | | | |
Net realized gain (loss) on: | | | | | | | | |
Affiliated Underlying Portfolios | | | | | | | (928,197 | ) |
Investment transactions | | | | | | | 8,721,287 | |
Foreign currency transactions | | | | | | | (107 | ) |
Net realized gain distributions from Affiliated Underlying Portfolios | | | | | | | 9,693,095 | |
Net change in unrealized appreciation/depreciation of: | | | | | | | | |
Affiliated Underlying Portfolios | | | | | | | (36,873,287 | ) |
Investments | | | | | | | (17,190,076 | ) |
Foreign currency denominated assets and liabilities | | | | | | | (3,174 | ) |
| | | | | | | | |
Net loss on investment and foreign currency transactions | | | | | | | (36,580,459 | ) |
| | | | | | | | |
Net Decrease in Net Assets from Operations | | | | | | $ | (28,007,546 | ) |
| | | | | | | | |
See notes to financial statements.
| | |
| |
| 20 | AB TAX-MANAGED WEALTH APPRECIATION STRATEGY | | abfunds.com |
STATEMENT OF CHANGES IN NET ASSETS
| | | | | | | | |
| | | Six Months Ended
February 28, 2019
(unaudited) | | | Year Ended
August 31,
2018 | |
Increase (Decrease) in Net Assets
from Operations | |
Net investment income | | $ | 8,572,913 | | | $ | 9,139,298 | |
Net realized gain on investment and foreign currency transactions | | | 7,792,983 | | | | 24,783,211 | |
Net realized gain distributions from Affiliated Underlying Portfolios | | | 9,693,095 | | | | 5,052,121 | |
Net change in unrealized appreciation/depreciation of investments and foreign currency denominated assets and liabilities | | | (54,066,537 | ) | | | 45,373,685 | |
| | | | | | | | |
Net increase (decrease) in net assets from operations | | | (28,007,546 | ) | | | 84,348,315 | |
Distributions to Shareholders* | |
Class A | | | (1,777,744 | ) | | | (4,705,618 | ) |
Class B | | | (8,422 | ) | | | (42,407 | ) |
Class C | | | (213,875 | ) | | | (1,011,470 | ) |
Advisor Class | | | (31,485,458 | ) | | | (77,419,360 | ) |
| Transactions in Shares of Beneficial Interest | | | | | | | | |
Net increase | | | 19,278,498 | | | | 59,557,867 | |
| | | | | | | | |
Total increase (decrease) | | | (42,214,547 | ) | | | 60,727,327 | |
| Net Assets | |
Beginning of period | | | 748,641,068 | | | | 687,913,741 | |
| | | | | | | | |
End of period | | $ | 706,426,521 | | | $ | 748,641,068 | |
| | | | | | | | |
| * | The prior year’s amounts have been reclassified to conform with the current year’s presentation. See Note I, Recent Accounting Pronouncements, in the Notes to Financial Statements for more information. |
See notes to financial statements.
| | |
| |
| abfunds.com | | AB TAX-MANAGED WEALTH APPRECIATION STRATEGY | 21 |
NOTES TO FINANCIAL STATEMENTS
February 28, 2019(unaudited)
NOTE A
Significant Accounting Policies
The AB Portfolios (the “Company”) was organized as a Massachusetts Business Trust on March 26, 1987 and is registered under the Investment Company Act of 1940 as a diversified, open end management investment company. The Company operates as a series company currently comprised of six series. Each series is considered to be a separate entity for financial reporting and tax purposes. This report relates to the ABTax-Managed Wealth Appreciation Strategy (the “Fund”). The Fund offers Class A, Class B, Class C and Advisor Class shares. Class A shares are sold with afront-end sales charge of up to 4.25% for purchases not exceeding $1,000,000. With respect to purchases of $1,000,000 or more, Class A shares redeemed within one year of purchase may be subject to a contingent deferred sales charge of 1%. Class B shares are currently sold with a contingent deferred sales charge which declines from 4% to 0% depending on the period of time the shares are held. Effective January 31, 2009, sales of Class B shares of the Fund to new investors were suspended. Class B shares will only be issued (i) upon the exchange of Class B shares from another AB mutual fund, (ii) for purposes of dividend reinvestment, (iii) through the Fund’s Automatic Investment Program (the “Program”) for accounts that established the Program prior to January 31, 2009, and (iv) for purchases of additional shares by Class B shareholders as of January 31, 2009. The ability to establish a new Program for accounts containing Class B shares was suspended as of January 31, 2009. Class B shares will automatically convert to Class A shares eight years after the end of the calendar month of purchase. Class C shares are subject to a contingent deferred sales charge of 1% on redemptions made within the first year after purchase, and 0% after the first year of purchase. Class C shares will automatically convert to Class A shares ten years after the end of the calendar month of purchase. Advisor Class shares are sold without any initial or contingent deferred sales charge and are not subject to ongoing distribution expenses. All four classes of shares have identical voting, dividend, liquidation and other rights, except that the classes bear different distribution and transfer agency expenses. Each class has exclusive voting rights with respect to its distribution plan. The financial statements have been prepared in conformity with U.S. generally accepted accounting principles (“U.S. GAAP”) which require management to make certain estimates and assumptions that affect the reported amounts of assets and liabilities in the financial statements and amounts of income and expenses during the reporting period. Actual results could differ from those estimates. The Fund is an investment company under U.S. GAAP and follows the accounting and reporting guidance applicable to investment companies. The following is a summary of significant accounting policies followed by the Fund.
| | |
| |
| 22 | AB TAX-MANAGED WEALTH APPRECIATION STRATEGY | | abfunds.com |
NOTES TO FINANCIAL STATEMENTS(continued)
1. Security Valuation
Portfolio securities are valued at their current market value determined on the basis of market quotations or, if market quotations are not readily available or are deemed unreliable, at “fair value” as determined in accordance with procedures established by and under the general supervision of the Company’s Board of Trustees (the “Board”).
In general, the market values of securities which are readily available and deemed reliable are determined as follows: securities listed on a national securities exchange (other than securities listed on the NASDAQ Stock Market, Inc. (“NASDAQ”)) or on a foreign securities exchange are valued at the last sale price at the close of the exchange or foreign securities exchange. If there has been no sale on such day, the securities are valued at the last traded price from the previous day. Securities listed on more than one exchange are valued by reference to the principal exchange on which the securities are traded; securities listed only on NASDAQ are valued in accordance with the NASDAQ Official Closing Price; listed or over the counter (“OTC”) market put or call options are valued at the mid level between the current bid and ask prices. If either a current bid or current ask price is unavailable, AllianceBernstein L.P. (the “Adviser”) will have discretion to determine the best valuation (e.g., last trade price in the case of listed options); open futures are valued using the closing settlement price or, in the absence of such a price, the most recent quoted bid price. If there are no quotations available for the day of valuation, the last available closing settlement price is used; U.S. Government securities and any other debt instruments having 60 days or less remaining until maturity are generally valued at market by an independent pricing vendor, if a market price is available. If a market price is not available, the securities are valued at amortized cost. This methodology is commonly used for short term securities that have an original maturity of 60 days or less, as well as short term securities that had an original term to maturity that exceeded 60 days. In instances when amortized cost is utilized, the Valuation Committee (the “Committee”) must reasonably conclude that the utilization of amortized cost is approximately the same as the fair value of the security. Such factors the Committee will consider include, but are not limited to, an impairment of the creditworthiness of the issuer or material changes in interest rates. Fixed-income securities, including mortgage-backed and asset-backed securities, may be valued on the basis of prices provided by a pricing service or at a price obtained from one or more of the major broker-dealers. In cases where broker-dealer quotes are obtained, the Adviser may establish procedures whereby changes in market yields or spreads are used to adjust, on a daily basis, a recently obtained quoted price on a security. Swaps and other derivatives are valued daily, primarily using independent pricing services, independent pricing models using market inputs, as well as third party broker-dealers or counterparties. Open end mutual funds are valued at the closing net asset value per share, while exchange traded funds are valued at the closing market price per share.
| | |
| |
| abfunds.com | | AB TAX-MANAGED WEALTH APPRECIATION STRATEGY | 23 |
NOTES TO FINANCIAL STATEMENTS(continued)
Securities for which market quotations are not readily available (including restricted securities) or are deemed unreliable are valued at fair value as deemed appropriate by the Adviser. Factors considered in making this determination may include, but are not limited to, information obtained by contacting the issuer, analysts, analysis of the issuer’s financial statements or other available documents. In addition, the Fund may use fair value pricing for securities primarily traded innon-U.S. markets because most foreign markets close well before the Fund values its securities at 4:00 p.m., Eastern Time. The earlier close of these foreign markets gives rise to the possibility that significant events, including broad market moves, may have occurred in the interim and may materially affect the value of those securities. To account for this, the Fund generally values many of its foreign equity securities using fair value prices based on third party vendor modeling tools to the extent available.
2. Fair Value Measurements
In accordance with U.S. GAAP regarding fair value measurements, fair value is defined as the price that the Fund would receive to sell an asset or pay to transfer a liability in an orderly transaction between market participants at the measurement date. U.S. GAAP establishes a framework for measuring fair value, and a three-level hierarchy for fair value measurements based upon the transparency of inputs to the valuation of an asset or liability (including those valued based on their market values as described in Note A.1 above). Inputs may be observable or unobservable and refer broadly to the assumptions that market participants would use in pricing the asset or liability. Observable inputs reflect the assumptions market participants would use in pricing the asset or liability based on market data obtained from sources independent of the Fund. Unobservable inputs reflect the Fund’s own assumptions about the assumptions that market participants would use in pricing the asset or liability based on the best information available in the circumstances. Each investment is assigned a level based upon the observability of the inputs which are significant to the overall valuation. The three-tier hierarchy of inputs is summarized below.
| | • | | Level 1—quoted prices in active markets for identical investments |
| | • | | Level 2—other significant observable inputs (including quoted prices for similar investments, interest rates, prepayment speeds, credit risk, etc.) |
| | • | | Level 3—significant unobservable inputs (including the Fund’s own assumptions in determining the fair value of investments) |
The fair value of debt instruments, such as bonds, andover-the-counter derivatives is generally based on market price quotations, recently executed market transactions (where observable) or industry recognized modeling techniques and are generally classified as Level 2. Pricing vendor inputs to
| | |
| |
| 24 | AB TAX-MANAGED WEALTH APPRECIATION STRATEGY | | abfunds.com |
NOTES TO FINANCIAL STATEMENTS(continued)
Level 2 valuations may include quoted prices for similar investments in active markets, interest rate curves, coupon rates, currency rates, yield curves, option adjusted spreads, default rates, credit spreads and other unique security features in order to estimate the relevant cash flows which are then discounted to calculate fair values. If these inputs are unobservable and significant to the fair value, these investments will be classified as Level 3. In addition,non-agency rated investments are classified as Level 3.
Where readily available market prices or relevant bid prices are not available for certain equity investments, such investments may be valued based on similar publicly traded investments, movements in relevant indices since last available prices or based upon underlying company fundamentals and comparable company data (such as multiples to earnings or other multiples to equity). Where an investment is valued using an observable input, such as another publicly traded security, the investment will be classified as Level 2. If management determines that an adjustment is appropriate based on restrictions on resale, illiquidity or uncertainty, and such adjustment is a significant component of the valuation, the investment will be classified as Level 3. An investment will also be classified as Level 3 where management uses company fundamentals and other significant inputs to determine the valuation.
The following table summarizes the valuation of the Fund’s investments by the above fair value hierarchy levels as of February 28, 2019:
| | | | | | | | | | | | | | | | |
Investments in Securities: | | Level 1 | | | Level 2 | | | Level 3 | | | Total | |
Assets: | | | | | | | | | | | | | | | | |
Common Stocks(a) | | $ | 367,797,962 | | | $ | – 0 | – | | $ | – 0 | – | | $ | 367,797,962 | |
Investment Companies | | | 335,030,291 | | | | – 0 | – | | | – 0 | – | | | 335,030,291 | |
Short-Term Investments | | | 2,044,603 | | | | – 0 | – | | | – 0 | – | | | 2,044,603 | |
| | | | | | | | | | | | | | | | |
Total Investments in Securities | | | 704,872,856 | | | | – 0 | – | | | – 0 | – | | | 704,872,856 | |
Other Financial Instruments(b) | | | – 0 | – | | | – 0 | – | | | – 0 | – | | | – 0 | – |
| | | | | | | | | | | | | | | | |
Total(c) | | $ | 704,872,856 | | | $ | – 0 | – | | $ | – 0 | – | | $ | 704,872,856 | |
| | | | | | | | | | | | | | | | |
| (a) | See Portfolio of Investments for sector classifications. |
| (b) | Other financial instruments are derivative instruments, such as futures, forwards and swaps, which are valued at the unrealized appreciation/(depreciation) on the instrument. Other financial instruments may also include swaps with upfront premiums, options written and swaptions written which are valued at market value. |
| (c) | There were no transfers between any levels during the reporting period. |
The Fund recognizes all transfers between levels of the fair value hierarchy assuming the financial instruments were transferred at the beginning of the reporting period.
The Adviser established the Committee to oversee the pricing and valuation of all securities held in the Fund. The Committee operates under pricing and
| | |
| |
| abfunds.com | | AB TAX-MANAGED WEALTH APPRECIATION STRATEGY | 25 |
NOTES TO FINANCIAL STATEMENTS(continued)
valuation policies and procedures established by the Adviser and approved by the Board, including pricing policies which set forth the mechanisms and processes to be employed on a daily basis to implement these policies and procedures. In particular, the pricing policies describe how to determine market quotations for securities and other instruments. The Committee’s responsibilities include: 1) fair value and liquidity determinations (and oversight of any third parties to whom any responsibility for fair value and liquidity determinations is delegated), and 2) regular monitoring of the Adviser’s pricing and valuation policies and procedures and modification or enhancement of these policies and procedures (or recommendation of the modification of these policies and procedures) as the Committee believes appropriate.
The Committee is also responsible for monitoring the implementation of the pricing policies by the Adviser’s Pricing Group (the “Pricing Group”) and any third party which performs certain pricing functions in accordance with the pricing policies. The Pricing Group is responsible for the oversight of the third party on aday-to-day basis. The Committee and the Pricing Group perform a series of activities to provide reasonable assurance of the accuracy of prices including: 1) periodic vendor due diligence meetings, review of methodologies, new developments and processes at vendors, 2) daily comparison of security valuation versus prior day for all securities that exceeded established thresholds, and 3) daily review of unpriced, stale, and variance reports with exceptions reviewed by senior management and the Committee.
In addition, several processes outside of the pricing process are used to monitor valuation issues including: 1) performance and performance attribution reports are monitored for anomalous impacts based upon benchmark performance, and 2) portfolio managers review all portfolios for performance and analytics (which are generated using the Adviser’s prices).
3. Currency Translation
Assets and liabilities denominated in foreign currencies and commitments under forward currency exchange contracts are translated into U.S. dollars at the mean of the quoted bid and ask prices of such currencies against the U.S. dollar. Purchases and sales of portfolio securities are translated into U.S. dollars at the rates of exchange prevailing when such securities were acquired or sold. Income and expenses are translated into U.S. dollars at rates of exchange prevailing when accrued.
Net realized gain or loss on foreign currency transactions represents foreign exchange gains and losses from sales and maturities of foreign fixed income investments, holding of foreign currencies, currency gains or losses realized between the trade and settlement dates on foreign investment
| | |
| |
| 26 | AB TAX-MANAGED WEALTH APPRECIATION STRATEGY | | abfunds.com |
NOTES TO FINANCIAL STATEMENTS(continued)
transactions, and the difference between the amounts of dividends, interest and foreign withholding taxes recorded on the Fund’s books and the U.S. dollar equivalent amounts actually received or paid. Net unrealized currency gains and losses from valuing foreign currency denominated assets and liabilities at period end exchange rates are reflected as a component of net unrealized appreciation or depreciation of foreign currency denominated assets and liabilities.
4. Taxes
It is the Fund’s policy to meet the requirements of the Internal Revenue Code applicable to regulated investment companies and to distribute all of its investment company taxable income and net realized gains, if any, to shareholders. Therefore, no provisions for federal income or excise taxes are required. The Fund may be subject to taxes imposed by countries in which it invests. Such taxes are generally based on income and/or capital gains earned or repatriated. Taxes are accrued and applied to net investment income, net realized gains and net unrealized appreciation/depreciation as such income and/or gains are earned.
In accordance with U.S. GAAP requirements regarding accounting for uncertainties in income taxes, management has analyzed the Fund’s tax positions taken or expected to be taken on federal and state income tax returns for all open tax years (the current and the prior three tax years) and has concluded that no provision for income tax is required in the Fund’s financial statements.
5. Investment Income and Investment Transactions
Dividend income is recorded on theex-dividend date or as soon as the Fund is informed of the dividend. Investment gains or losses are determined on the identified cost basis. The Fund amortizes premiums and accretes discounts as adjustments to interest income. Interest income is accrued daily. Investment transactions are accounted for on the date the securities are purchased or sold.
6. Class Allocations
All income earned and expenses incurred by the Fund are borne on apro-rata basis by each outstanding class of shares, based on the proportionate interest in the Fund represented by the net assets of such class, except for class specific expenses which are allocated to the respective class. Expenses of the Company are charged proportionately to each series or based on other appropriate methods. Realized and unrealized gains and losses are allocated among the various share classes based on respective net assets.
| | |
| |
| abfunds.com | | AB TAX-MANAGED WEALTH APPRECIATION STRATEGY | 27 |
NOTES TO FINANCIAL STATEMENTS(continued)
7. Dividends and Distributions
Dividends and distributions to shareholders, if any, are recorded on theex-dividend date. Income dividends and capital gains distributions are determined in accordance with federal tax regulations and may differ from those determined in accordance with U.S. GAAP. To the extent these differences are permanent, such amounts are reclassified within the capital accounts based on their federal tax basis treatment; temporary differences do not require such reclassification.
NOTE B
Advisory Fee and Other Transactions with Affiliates
Under the terms of the investment advisory agreement (the “Advisory Agreement”), the Fund pays the Adviser an advisory fee at an annual rate of .65% of the first $2.5 billion, .55% of the next $2.5 billion and .50% in excess of $5 billion of the Fund’s average daily net assets. The fee is accrued daily and paid monthly.
During 2017, AXA S.A. (“AXA”), a French holding company for the AXA Group, a worldwide leader in life, property and casualty and health insurance and asset management, announced its intention to pursue the sale of a minority stake in its subsidiary, AXA Equitable Holdings, Inc. (“AXA Equitable”), the holding company for a diversified financial services organization, through an initial public offering (“IPO”). AXA Equitable is the holding company for a diverse group of financial services companies, including AllianceBernstein L.P., the investment adviser to the Funds (“the Adviser”). In March 2018, AXA announced its intention to sell its entire interest in AXA Equitable over time, subject to market conditions and other factors (the “Plan”). During the second quarter of 2018, AXA Equitable completed the IPO, in the fourth quarter of 2018 and in the first quarter of 2019, AXA completed public offerings of additional shares of AXA Equitable’s common stock and simultaneously sold shares to AXA Equitable pursuant to a separate agreement with it. AXA also granted the underwriters of the offering an option to purchase additional shares of AXA Equitable, which was exercised. As a result of the foregoing sales of AXA Equitable shares, as of March 25, 2019, AXA owns approximately 48.3% of the shares of common stock of AXA Equitable. Contemporaneously with the IPO, AXA sold $862.5 million aggregate principal amount of its 7.25% mandatorily exchangeable notes (the “MxB Notes”) due May 15, 2021, and exchangeable into up to 43,125,000 shares of common stock (or approximately 7% of the outstanding shares of common stock of AXA Equitable). AXA retains ownership (including voting rights) of such shares of common stock until the MxB Notes are exchanged, which may be on a date that is earlier than the maturity date at AXA’s option upon the occurrence of certain events.
| | |
| |
| 28 | AB TAX-MANAGED WEALTH APPRECIATION STRATEGY | | abfunds.com |
NOTES TO FINANCIAL STATEMENTS(continued)
It is anticipated that one or more of the transactions contemplated by the Plan may ultimately result in the indirect transfer of a “controlling block” of voting securities of the Adviser (a “Change of Control Event”) and therefore may be deemed an “assignment” causing a termination of each Fund’s current investment advisory agreement. In order to ensure that the existing investment advisory services could continue uninterrupted, at meetings held in late July through early August 2018, the Boards of Directors/Trustees (each a “Board” and collectively, the “Boards”) approved new investment advisory agreements with the Adviser, in connection with the Plan. The Boards also agreed to call and hold a joint meeting of shareholders on October 11, 2018, for shareholders of each Fund to (1) approve the new investment advisory agreement with the Adviser that would be effective after the first Change of Control Event and (2) approve any future advisory agreement approved by the Board and that has terms not materially different from the current agreement, in the event there are subsequent Change of Control Events arising from completion of the Plan that terminate the advisory agreement after the first Change of Control Event. Approval of a future advisory agreement means that shareholders may not have another opportunity to vote on a new agreement with the Adviser even upon a change of control, as long as no single person or group of persons acting together gains “control” (as defined in the 1940 Act) of AXA Equitable.
At the December 11, 2018 adjourned shareholder meeting, shareholders approved the new and future investment advisory agreements.
Pursuant to the Advisory Agreement, the Fund may reimburse the Adviser for certain legal and accounting services provided to the Fund by the Adviser. For the six months ended February 28, 2019, the reimbursement for such services amounted to $35,571.
The Fund may invest in AB Government Money Market Portfolio (the “Government Money Market Portfolio”) which has a contractual annual advisory fee rate of .20% of the portfolio’s average daily net assets and bears its own expenses. Effective August 1, 2018, the Adviser has contractually agreed to waive .10% of the advisory fee of Government Money Market Portfolio (resulting in a net advisory fee of .10%) until August 31, 2019. In connection with the investment by the Fund in Government Money Market Portfolio, the Adviser has contractually agreed to waive its advisory fee from the Fund in an amount equal to the Fund’s pro rata share of the effective advisory fee of Government Money Market Portfolio, as borne indirectly by the Fund as an acquired fund fee and expense. For the six months ended February 28, 2019, such waiver amounted to $1,126.
In connection with the Fund’s investments in other AB mutual funds, the Adviser has contractually agreed to waive fees and/or reimburse the expenses
| | |
| |
| abfunds.com | | AB TAX-MANAGED WEALTH APPRECIATION STRATEGY | 29 |
NOTES TO FINANCIAL STATEMENTS(continued)
payable to the Adviser by the Fund in an amount equal to the Fund’s pro rata share of the effective advisory fees of AB mutual funds, as paid by the Fund as an acquired fund fee and expense. These fee waivers and/or expense reimbursements will remain in effect until December 31, 2019. For the six months ended February 28, 2019, such waivers and/or reimbursements amounted to $1,247,606.
A summary of the Fund’s transactions in AB mutual funds for the six months ended February 28, 2019 is as follows:
| | | | | | | | | | | | | | | | | | | | | | | | | | | | | | | | |
| | | | Distributions | |
| Fund | | Market
Value
8/31/18
(000) | | | Purchases
at Cost
(000) | | | Sales
Proceeds
(000) | | | Realized
Gain
(Loss)
(000) | | | Change in
Unrealized
Appr./
(Depr.)
(000) | | | Market
Value
2/28/19
(000) | | | Dividend
Income
(000) | | | Realized
Gains
(000) | |
Government Money Market Portfolio | | $ | 80 | | | $ | 60,412 | | | $ | 58,447 | | | $ | – 0 | – | | $ | – 0 | – | | $ | 2,045 | | | $ | 26 | | | $ | – 0 | – |
AB Discovery Growth Fund, Inc. | | | 18,623 | | | | 2,327 | | | | 221 | | | | 4 | | | | (3,476 | ) | | | 17,257 | | | | 306 | | | | 2,021 | |
AB Discovery Value Fund, Inc. | | | 18,197 | | | | 1,679 | | | | – 0 | – | | | – 0 | – | | | (3,165 | ) | | | 16,711 | | | | 226 | | | | 1,453 | |
Bernstein Fund, Inc.: | | | | | | | | | | | | | | | | | | | | | | | | | | | | | | | | |
International Small Cap Portfolio | | | 44,190 | | | | 6,034 | | | | 625 | | | | (97 | ) | | | (7,263 | ) | | | 42,239 | | | | 1,174 | | | | 2,470 | |
International Strategic Equities Portfolio | | | 146,862 | | | | 8,740 | | | | 4,216 | | | | (511 | ) | | | (10,587 | ) | | | 140,288 | | | | 2,541 | | | | 1,571 | |
Small Cap Core Portfolio | | | 20,336 | | | | 2,409 | | | | – 0 | – | | | – 0 | – | | | (3,241 | ) | | | 19,504 | | | | 280 | | | | 974 | |
Sanford C. Bernstein Fund, Inc.: | | | | | | | | | | | | | | | | | | | | | | | | | | | | | | | | |
Emerging Markets Portfolio | | | 18,997 | | | | 4,285 | | | | 1,536 | | | | (324 | ) | | | (1,537 | ) | | | 19,885 | | | | 297 | | | | 1,204 | |
Tax-Managed International Portfolio | | | 82,253 | | | | 4,497 | | | | – 0 | – | | | – 0 | – | | | (7,604 | ) | | | 79,146 | | | | 1,427 | | | | – 0 | – |
| | | | | | | | | | | | | | | | | | | | | | | | | | | | | | | | |
Total | | | | | | | | | | | | | | $ | (928 | ) | | $ | (36,873 | ) | | $ | 337,075 | | | $ | 6,277 | | | $ | 9,693 | |
| | | | | | | | | | | | | | | | | | | | | | | | | | | | | | | | |
The Fund compensates AllianceBernstein Investor Services, Inc. (“ABIS”), a wholly-owned subsidiary of the Adviser, under a Transfer Agency Agreement for providing personnel and facilities to perform transfer agency
| | |
| |
| 30 | AB TAX-MANAGED WEALTH APPRECIATION STRATEGY | | abfunds.com |
NOTES TO FINANCIAL STATEMENTS(continued)
services for the Fund. ABIS may make payments to intermediaries that provide omnibus account services,sub-accounting services and/or networking services. Such compensation retained by ABIS amounted to $47,958 for the six months ended February 28, 2019.
AllianceBernstein Investments, Inc. (the “Distributor”), a wholly-owned subsidiary of the Adviser, serves as the distributor of the Fund’s shares. The Distributor has advised the Fund that it has retainedfront-end sales charges of $709 from the sale of Class A shares and received$-0-, $37 and $6 in contingent deferred sales charges imposed upon redemptions by shareholders of Class A, Class B and Class C shares, respectively, for the six months ended February 28, 2019.
Brokerage commissions paid on investment transactions for the six months ended February 28, 2019 amounted to $24,618, of which $392 and $0, respectively, was paid to Sanford C. Bernstein & Co. LLC and Sanford C. Bernstein Limited, affiliates of the Adviser.
NOTE C
Distribution Plans
The Fund has adopted a Plan for each class of shares of the Fund pursuant to Rule12b-1 under the Investment Company Act of 1940 (each a “Plan” and collectively the “Plans”). Under the Plans, the Fund pays distribution and servicing fees to the Distributor at an annual rate of up to up to .50% of the Fund’s average daily net assets attributable to Class A shares, 1% of the Fund’s average daily net assets attributable to both Class B and Class C shares. There are no distribution and servicing fees on the Advisor Class shares. The fees are accrued daily and paid monthly. Effective August 1, 2014, payments under the Class A shares are limited to an annual rate of .25% of Class A share’s average daily net assets. The Plans provide that the Distributor will use such payments in their entirety for distribution assistance and promotional activities. The Fund is not obligated under the Plans to pay any distribution services fee in excess of the amounts set forth above. The purpose of the payments to the Distributor under the Plans is to compensate the Distributor for its distribution services with respect to the sale of the Fund’s shares. Since the Distributor’s compensation is not directly tied to its expenses, the amount of compensation received by it under the Plan during any year may be more or less than its actual expenses. For this reason, the Plans are characterized by the staff of the Securities and Exchange Commission as being of the “compensation” plan.
In the event that a Plan is terminated or not continued, no distribution services fees (other than current amounts accrued but not yet paid) would be owed by the Fund to the Distributor with respect to the relevant class. The Plans also provide that the Adviser may use its own resources to finance the distribution of the Fund’s shares.
| | |
| |
| abfunds.com | | AB TAX-MANAGED WEALTH APPRECIATION STRATEGY | 31 |
NOTES TO FINANCIAL STATEMENTS(continued)
NOTE D
Investment Transactions
Purchases and sales of investment securities (excluding short-term investments) for the six months ended February 28, 2019 were as follows:
| | | | | | | | |
| | | Purchases | | | Sales | |
Investment securities (excluding U.S. government securities) | | $ | 87,850,192 | | | $ | 86,721,101 | |
U.S. government securities | | | – 0 | – | | | – 0 | – |
The cost of investments for federal income tax purposes was substantially the same as the cost for financial reporting purposes. Accordingly, gross unrealized appreciation and unrealized depreciation are as follows:
| | | | |
Gross unrealized appreciation | | $ | 97,322,757 | |
Gross unrealized depreciation | | | (29,449,872 | ) |
| | | | |
Net unrealized appreciation | | $ | 67,872,885 | |
| | | | |
1. Derivative Financial Instruments
The Fund may use derivatives in an effort to earn income and enhance returns, to replace more traditional direct investments, to obtain exposure to otherwise inaccessible markets (collectively, “investment purposes”), or to hedge or adjust the risk profile of its portfolio.
The Fund did not engage in derivatives transactions for the six months ended February 28, 2019.
2. Currency Transactions
The Fund may invest innon-U.S. Dollar-denominated securities on a currency hedged or unhedged basis. The Fund may seek investment opportunities by taking long or short positions in currencies through the use of currency-related derivatives, including forward currency exchange contracts, futures and options on futures, swaps, and other options. The Fund may enter into transactions for investment opportunities when it anticipates that a foreign currency will appreciate or depreciate in value but securities denominated in that currency are not held by the Fund and do not present attractive investment opportunities. Such transactions may also be used when the Adviser believes that it may be more efficient than a direct investment in a foreign currency-denominated security. The Fund may also conduct currency exchange contracts on a spot basis (i.e., for cash at the spot rate prevailing in the currency exchange market for buying or selling currencies).
| | |
| |
| 32 | AB TAX-MANAGED WEALTH APPRECIATION STRATEGY | | abfunds.com |
NOTES TO FINANCIAL STATEMENTS(continued)
NOTE E
Shares of Beneficial Interest
Transactions in shares of beneficial interest for each class were as follows:
| | | | | | | | | | | | | | | | | | | | | | | | |
| | | | | | | | | | | | | | | | | | | | | | | | |
| | | Shares | | | | | | Amount | | | | |
| | | Six Months Ended
February 28, 2019
(unaudited) | | | Year Ended
August 31, 2018 | | | | | | Six Months Ended
February 28, 2019
(unaudited) | | | Year Ended
August 31, 2018 | | | | |
| | | | | | | | |
| Class A | | | | | |
Shares sold | | | 63,635 | | | | 40,664 | | | | | | | $ | 915,120 | | | $ | 673,631 | | | | | |
| | | | | |
Shares issued in reinvestment of dividends and distributions | | | 110,466 | | | | 256,158 | | | | | | | | 1,538,797 | | | | 4,126,704 | | | | | |
| | | | | |
Shares converted from Class B | | | 1,378 | | | | 8,164 | | | | | | | | 21,454 | | | | 133,737 | | | | | |
| | | | | |
Shares converted from Class C | | | 219,037 | | | | 64,785 | | | | | | | | 3,522,781 | | | | 1,075,002 | | | | | |
| | | | | |
Shares redeemed | | | (314,247 | ) | | | (354,977 | ) | | | | | | | (4,696,012 | ) | | | (5,909,897 | ) | | | | |
| | | | | |
Net increase | | | 80,269 | | | | 14,794 | | | | | | | $ | 1,302,140 | | | $ | 99,177 | | | | | |
| | | | | |
| | | | | | | | | | | | | | | | | | | | | | | | |
| Class B | | | | | |
Shares sold | | | 610 | | | | 1,151 | | | | | | | $ | 9,200 | | | $ | 19,100 | | | | | |
| | | | | |
Shares issued in reinvestment of dividends and distributions | | | 604 | | | | 2,641 | | | | | | | | 8,407 | | | | 42,360 | | | | | |
| | | | | |
Shares converted to Class A | | | (1,388 | ) | | | (8,222 | ) | | | | | | | (21,454 | ) | | | (133,737 | ) | | | | |
| | | | | |
Shares redeemed | | | (3,263 | ) | | | (946 | ) | | | | | | | (52,508 | ) | | | (15,665 | ) | | | | |
| | | | | |
Net decrease | | | (3,437 | ) | | | (5,376 | ) | | | | | | $ | (56,355 | ) | | $ | (87,942 | ) | | | | |
| | | | | |
| | | | | | | | | | | | | | | | | | | | | | | | |
| Class C | | | | | |
Shares sold | | | 107,088 | | | | 14,860 | | | | | | | $ | 1,709,349 | | | $ | 247,292 | | | | | |
| | | | | |
Shares issued in reinvestment of dividends and distributions | | | 13,741 | | | | 48,088 | | | | | | | | 189,763 | | | | 765,090 | | | | | |
| | | | | |
Shares converted to Class A | | | (223,114 | ) | | | (65,830 | ) | | | | | | | (3,522,781 | ) | | | (1,075,002 | ) | | | | |
| | | | | |
Shares redeemed | | | (52,726 | ) | | | (42,671 | ) | | | | | | | (761,902 | ) | | | (707,998 | ) | | | | |
| | | | | |
Net decrease | | | (155,011 | ) | | | (45,553 | ) | | | | | | $ | (2,385,571 | ) | | $ | (770,618 | ) | | | | |
| | | | | |
| | | | | | | | | | | | | | | | | | | | | | | | |
| Advisor Class | | | | | |
Shares sold | | | 3,138,216 | | | | 5,292,801 | | | | | | | $ | 46,455,309 | | | $ | 87,529,177 | | | | | |
| | | | | |
Shares issued in reinvestment of dividends and distributions | | | 2,129,985 | | | | 4,285,617 | | | | | | | | 29,777,195 | | | | 69,255,567 | | | | | |
| | | | | |
Shares redeemed | | | (3,685,062 | ) | | | (5,748,122 | ) | | | | | | | (55,814,220 | ) | | | (96,467,494 | ) | | | | |
| | | | | |
Net increase | | | 1,583,139 | | | | 3,830,296 | | | | | | | $ | 20,418,284 | | | $ | 60,317,250 | | | | | |
| | | | | |
| | |
| |
| abfunds.com | | AB TAX-MANAGED WEALTH APPRECIATION STRATEGY | 33 |
NOTES TO FINANCIAL STATEMENTS(continued)
NOTE F
Risks Involved in Investing in the Fund
Foreign(Non-U.S.) Risk—Investments in securities ofnon-U.S. issuers may involve more risk than those of U.S. issuers. These securities may fluctuate more widely in price and may be less liquid due to adverse market, economic, political, regulatory or other factors.
Currency Risk—Fluctuations in currency exchange rates may negatively affect the value of the Fund’s investments or reduce its returns.
Emerging Market Risk—Investments in emerging market countries may have more risk because the markets are less developed and less liquid as well as being subject to increased economic, political, regulatory or other uncertainties.
Capitalization Risk—Investments in small- andmid-capitalization companies may be more volatile than investments in large-capitalization companies. Investments in small- andmid-capitalization companies may have additional risks because these companies have limited product lines, markets or financial resources.
Investment in Other Investment Companies Risk—As with other investments, investments in other investment companies are subject to market and selection risk. In addition, shareholders of the Fund bear both their proportionate share of expenses in the Fund (including management fees) and, indirectly, the expenses of the investment companies (to the extent these expenses are not waived or reimbursed by the Adviser).
Indemnification Risk—In the ordinary course of business, the Fund enters into contracts that contain a variety of indemnifications. The Fund’s maximum exposure under these arrangements is unknown. However, the Fund has not had prior claims or losses pursuant to these indemnification provisions and expects the risk of loss thereunder to be remote. Therefore, the Fund has not accrued any liability in connection with these indemnification provisions.
NOTE G
Joint Credit Facility
A number ofopen-end mutual funds managed by the Adviser, including the Fund, participate in a $325 million revolving credit facility (the “Facility”) intended to provide short-term financing, if necessary, subject to certain restrictions in connection with abnormal redemption activity. Commitment fees related to the Facility are paid by the participating funds and are included in miscellaneous expenses in the statement of operations. The Fund did not utilize the Facility during the six months ended February 28, 2019.
| | |
| |
| 34 | AB TAX-MANAGED WEALTH APPRECIATION STRATEGY | | abfunds.com |
NOTES TO FINANCIAL STATEMENTS(continued)
NOTE H
Distributions to Shareholders
The tax character of distributions to be paid for the year ending August 31, 2019 will be determined at the end of the current fiscal year. The tax character of distributions paid during the fiscal years ended August 31, 2018 and August 31, 2017 were as follows:
| | | | | | | | |
| | | 2018 | | | 2017 | |
Distributions paid from: | | | | | | | | |
Ordinary income | | $ | 22,669,862 | | | $ | 14,799,804 | |
Net long-term capital gains | | | 60,508,993 | | | | 5,707,077 | |
| | | | | | | | |
Total taxable distributions paid | | $ | 83,178,855 | | | $ | 20,506,881 | |
| | | | | | | | |
As of August 31, 2018, the components of accumulated earnings/(deficit) on a tax basis were as follows:
| | | | |
Undistributed ordinary income | | $ | 1,643,891 | |
Undistributed capital gains | | | 28,984,082 | |
Unrealized appreciation/(depreciation) | | | 121,613,404 | (a) |
| | | | |
Total accumulated earnings/(deficit) | | $ | 152,241,377 | |
| | | | |
| (a) | The difference between book-basis andtax-basis unrealized appreciation/(depreciation) is attributable primarily to the tax deferral of losses on wash sales. |
For tax purposes, net realized capital losses may be carried over to offset future capital gains, if any. Funds are permitted to carry forward capital losses for an indefinite period, and such losses will retain their character as either short-term or long-term capital losses. As of August 31, 2018, the Fund did not have any capital loss carryforwards.
NOTE I
Recent Accounting Pronouncements
In August 2018, the Financial Accounting Standards Board issued an Accounting Standards Update, ASU2018-13, Fair Value Measurement (Topic 820), Disclosure Framework—Changes to the Disclosure Requirements for Fair Value Measurement which removes, modifies and adds disclosures to Topic 820. The amendments in this ASU2018-13 apply to all entities that are required, under existing U.S. GAAP, to make disclosures about recurring or nonrecurring fair value measurements. The amendments in this ASU2018-13 are effective for all entities for fiscal years, and interim periods within those fiscal years, beginning after December 15, 2019. At this time, management is evaluating the implications of these changes on the financial statements.
In October 2018, the U.S. Securities and Exchange Commission adopted amendments to certain disclosure requirements included in RegulationS-X
| | |
| |
| abfunds.com | | AB TAX-MANAGED WEALTH APPRECIATION STRATEGY | 35 |
NOTES TO FINANCIAL STATEMENTS(continued)
that had become “redundant, duplicative, overlapping, outdated or superseded, in light of the other Commission disclosure requirements, GAAP or changes in the information environment.” The compliance date for the amendments to RegulationS-X was November 5, 2018 (for reporting period end dates of September 30, 2018 or after). Management has adopted the amendments which simplified certain disclosure requirements on the financial statements.
NOTE J
Subsequent Events
Management has evaluated subsequent events for possible recognition or disclosure in the financial statements through the date the financial statements are issued. Management has determined that there are no material events that would require disclosure in the Fund’s financial statements through this date.
| | |
| |
| 36 | AB TAX-MANAGED WEALTH APPRECIATION STRATEGY | | abfunds.com |
FINANCIAL HIGHLIGHTS
Selected Data For A Share Of Beneficial Interest Outstanding Throughout Each Period
| | | | | | | | | | | | | | | | | | | | | | | | |
| | | Class A | |
| | | Six Months
Ended
February 28,
2019 (unaudited) | | | Year Ended August 31, | |
| | | 2018 | | | 2017 | | | 2016 | | | 2015 | | | 2014 | |
| | | | |
| | | | | | | | | | | | | | | | | | | | | | | | |
Net asset value, beginning of period | | | $ 16.76 | | | | $ 16.85 | | | | $ 15.08 | | | | $ 15.41 | | | | $ 16.51 | | | | $ 13.86 | |
| | | | |
Income From Investment Operations | | | | | | | | | | | | | | | | | | | | | | | | |
| | | | | | |
Net investment income(a)(b) | | | .18 | | | | .18 | | | | .42 | | | | .17 | | | | .20 | | | | .32 | |
| | | | | | |
Net realized and unrealized gain (loss) on investment and foreign currency transactions | | | (.89 | ) | | | 1.78 | | | | 1.78 | | | | .60 | | | | (.91 | ) | | | 2.65 | |
| | | | | | |
Contributions from Affiliates | | | – 0 | – | | | – 0 | – | | | – 0 | – | | | .00 | (c) | | | – 0 | – | | | – 0 | – |
| | | | |
Net increase (decrease) in net asset value from operations | | | (.71 | ) | | | 1.96 | | | | 2.20 | | | | .77 | | | | (.71 | ) | | | 2.97 | |
| | | | |
Less: Dividends and Distributions | | | | | | | | | | | | | | | | | | | | | | | | |
| | | | | | |
Dividends from net investment income | | | (.16 | ) | | | (.39 | ) | | | (.29 | ) | | | (.16 | ) | | | (.25 | ) | | | (.32 | ) |
| | | | | | |
Distributions from net realized gain on investment transactions | | | (.57 | ) | | | (1.66 | ) | | | (.14 | ) | | | (.94 | ) | | | (.14 | ) | | | – 0 | – |
| | | | |
Total dividends and distributions | | | (.73 | ) | | | (2.05 | ) | | | (.43 | ) | | | (1.10 | ) | | | (.39 | ) | | | (.32 | ) |
| | | | |
Net asset value, end of period | | | $ 15.32 | | | | $ 16.76 | | | | $ 16.85 | | | | $ 15.08 | | | | $ 15.41 | | | | $ 16.51 | |
| | | | |
Total Return | |
| | | | | | |
Total investment return based on net asset value(d)* | | | (3.80 | )% | | | 12.13 | % | | | 14.98 | % | | | 5.23 | % | | | (4.34 | )% | | | 21.66 | % |
| | | | | | |
Ratios/Supplemental Data | | | | | | | | | | | | | | | | | | | | | | | | |
| | | | | | |
Net assets, end of period (000’s omitted) | | | $37,340 | | | | $39,519 | | | | $39,479 | | | | $32,398 | | | | $34,813 | | | | $39,534 | |
| | | | | | |
Ratio to average net assets of: | | | | | | | | | | | | | | | | | | | | | | | | |
| | | | | | |
Expenses, net of waivers/reimbursements(e)‡ | | | .63 | %^ | | | .62 | % | | | .88 | % | | | .93 | % | | | .93 | % | | | 1.04 | % |
| | | | | | |
Expenses, before waivers/reimbursements(e)‡ | | | .99 | %^ | | | 1.00 | % | | | 1.01 | % | | | 1.01 | % | | | 1.00 | % | | | 1.04 | % |
| | | | | | |
Net investment income(b) | | | 2.32 | %^ | | | 1.05 | % | | | 2.70 | % | | | 1.16 | % | | | 1.24 | % | | | 2.05 | % |
| | | | | | |
Portfolio turnover rate | | | 12 | % | | | 25 | % | | | 112 | % | | | 47 | % | | | 49 | % | | | 61 | % |
| | | | | | | | | | | | | | | | | | | | | | | | |
| |
‡ Expense ratios exclude the estimated acquired fund fees of the affiliated/unaffiliated underlying | |
portfolios | | | .39 | %^ | | | .40 | % | | | .23 | % | | | .23 | % | | | .23 | % | | | .01 | % |
See footnote summary on page 41.
| | |
| |
| abfunds.com | | AB TAX-MANAGED WEALTH APPRECIATION STRATEGY | 37 |
FINANCIAL HIGHLIGHTS(continued)
Selected Data For A Share Of Beneficial Interest Outstanding Throughout Each Period
| | | | | | | | | | | | | | | | | | | | | | | | |
| | | Class B | |
| | | Six Months
Ended
February 28,
2019 (unaudited) | | | Year Ended August 31, | |
| | | 2018 | | | 2017 | | | 2016 | | | 2015 | | | 2014 | |
| | | | |
| | | | | | | | | | | | | | | | | | | | | | | | |
| | | | | | | | | | | | | | | | | | | | | | | | |
Net asset value, beginning of period | | | $ 16.60 | | | | $ 16.69 | | | | $ 14.91 | | | | $ 15.19 | | | | $ 16.24 | | | | $ 13.61 | |
| | | | |
Income From Investment Operations | | | | | | | | | | | | | | | | | | | | | | | | |
| | | | | | |
Net investment income(a)(b) | | | .11 | | | | .06 | | | | .27 | | | | .06 | | | | .08 | | | | .22 | |
| | | | | | |
Net realized and unrealized gain (loss) on investment and foreign currency transactions | | | (.86 | ) | | | 1.75 | | | | 1.79 | | | | .60 | | | | (.90 | ) | | | 2.59 | |
| | | | | | |
Contributions from Affiliates | | | – 0 | – | | | – 0 | – | | | – 0 | – | | | .00 | (c) | | | – 0 | – | | | – 0 | – |
| | | | |
Net increase (decrease) in net asset value from operations | | | (.75 | ) | | | 1.81 | | | | 2.06 | | | | .66 | | | | (.82 | ) | | | 2.81 | |
| | | | |
Less: Dividends and Distributions | | | | | | | | | | | | | | | | | | | | | | | | |
| | | | | | |
Dividends from net investment income | | | – 0 | – | | | (.24 | ) | | | (.14 | ) | | | – 0 | – | | | (.09 | ) | | | (.18 | ) |
| | | | | | |
Distributions from net realized gain on investment transactions | | | (.57 | ) | | | (1.66 | ) | | | (.14 | ) | | | (.94 | ) | | | (.14 | ) | | | – 0 | – |
| | | | |
Total dividends and distributions | | | (.57 | ) | | | (1.90 | ) | | | (.28 | ) | | | (.94 | ) | | | (.23 | ) | | | (.18 | ) |
| | | | |
Net asset value, end of period | | | $ 15.28 | | | | $ 16.60 | | | | $ 16.69 | | | | $ 14.91 | | | | $ 15.19 | | | | $ 16.24 | |
| | | | |
Total Return | | | | | | | | | | | | | | | | | | | | | | | | |
| | | | | | |
Total investment return based on net asset value(d)* | | | (4.22 | )% | | | 11.22 | % | | | 14.08 | % | | | 4.50 | % | | | (5.09 | )% | | | 20.79 | % |
| | | | | | |
Ratios/Supplemental Data | | | | | | | | | | | | | | | | | | | | | | | | |
| | | | | | |
Net assets, end of period (000’s omitted) | | | $228 | | | | $305 | | | | $396 | | | | $580 | | | | $821 | | | | $1,837 | |
| | | | | | |
Ratio to average net assets of: | | | | | | | | | | | | | | | | | | | | | | | | |
| | | | | | |
Expenses, net of waivers/reimbursements(e)‡ | | | 1.41 | %^ | | | 1.40 | % | | | 1.68 | % | | | 1.69 | % | | | 1.69 | % | | | 1.76 | % |
| | | | | | |
Expenses, before waivers/reimbursements(e)‡ | | | 1.77 | %^ | | | 1.77 | % | | | 1.80 | % | | | 1.77 | % | | | 1.77 | % | | | 1.76 | % |
| | | | | | |
Net investment income(b) | | | 1.39 | %^ | | | .34 | % | | | 1.75 | % | | | .43 | % | | | .51 | % | | | 1.43 | % |
| | | | | | |
Portfolio turnover rate | | | 12 | % | | | 25 | % | | | 112 | % | | | 47 | % | | | 49 | % | | | 61 | % |
| | | | | | | | | | | | | | | | | | | | | | | | |
| |
‡ Expense ratios exclude the estimated acquired fund fees of the affiliated/unaffiliated underlying | |
portfolios | | | .39 | %^ | | | .40 | % | | | .23 | % | | | .23 | % | | | .23 | % | | | .01 | % |
See footnote summary on page 41.
| | |
| |
| 38 | AB TAX-MANAGED WEALTH APPRECIATION STRATEGY | | abfunds.com |
FINANCIAL HIGHLIGHTS(continued)
Selected Data For A Share Of Beneficial Interest Outstanding Throughout Each Period
| | | | | | | | | | | | | | | | | | | | | | | | |
| | | Class C | |
| | | Six Months
Ended
February 28,
2019 (unaudited) | | | Year Ended August 31, | |
| | | 2018 | | | 2017 | | | 2016 | | | 2015 | | | 2014 | |
| | | | |
| | | | | | | | | | | | | | | | | | | | | | | | |
Net asset value, beginning of period | | | $ 16.47 | | | | $ 16.55 | | | | $ 14.82 | | | | $ 15.15 | | | | $ 16.23 | | | | $ 13.62 | |
| | | | |
Income From Investment Operations | | | | | | | | | | | | | | | | | | | | | | | | |
| | | | | | |
Net investment income(a)(b) | | | .10 | | | | .05 | | | | .27 | | | | .06 | | | | .07 | | | | .21 | |
| | | | | | |
Net realized and unrealized gain (loss) on investment and foreign currency transactions | | | (.84 | ) | | | 1.75 | | | | 1.78 | | | | .59 | | | | (.87 | ) | | | 2.60 | |
| | | | | | |
Contributions from Affiliates | | | – 0 | – | | | – 0 | – | | | – 0 | – | | | .00 | (c) | | | – 0 | – | | | – 0 | – |
| | | | |
Net increase (decrease) in net asset value from operations | | | (.74 | ) | | | 1.80 | | | | 2.05 | | | | .65 | | | | (.80 | ) | | | 2.81 | |
| | | | |
Less: Dividends and Distributions | | | | | | | | | | | | | | | | | | | | | | | | |
| | | | | | |
Dividends from net investment income | | | – 0 | – | | | (.22 | ) | | | (.18 | ) | | | (.04 | ) | | | (.14 | ) | | | (.20 | ) |
| | | | | | |
Distributions from net realized gain on investment transactions | | | (.57 | ) | | | (1.66 | ) | | | (.14 | ) | | | (.94 | ) | | | (.14 | ) | | | – 0 | – |
| | | | |
Total dividends and distributions | | | (.57 | ) | | | (1.88 | ) | | | (.32 | ) | | | (.98 | ) | | | (.28 | ) | | | (.20 | ) |
| | | | |
Net asset value, end of period | | | $ 15.16 | | | | $ 16.47 | | | | $ 16.55 | | | | $ 14.82 | | | | $ 15.15 | | | | $ 16.23 | |
| | | | |
Total Return | | | | | | | | | | | | | | | | | | | | | | | | |
| | | | | | |
Total investment return based on net asset value(d)* | | | (4.19 | )% | | | 11.31 | % | | | 14.09 | % | | | 4.44 | % | | | (4.99 | )% | | | 20.83 | % |
| | | | | | |
Ratios/Supplemental Data | | | | | | | | | | | | | | | | | | | | | | | | |
| | | | | | |
Net assets, end of period (000’s omitted) | | | $5,546 | | | | $8,577 | | | | $9,373 | | | | $14,380 | | | | $16,102 | | | | $17,964 | |
| | | | | | |
Ratio to average net assets of: | | | | | | | | | | | | | | | | | | | | | | | | |
| | | | | | |
Expenses, net of waivers/reimbursements(e)‡ | | | 1.38 | %^ | | | 1.38 | % | | | 1.65 | % | | | 1.68 | % | | | 1.68 | % | | | 1.75 | % |
| | | | | | |
Expenses, before waivers/reimbursements(e)‡ | | | 1.74 | %^ | | | 1.75 | % | | | 1.76 | % | | | 1.76 | % | | | 1.76 | % | | | 1.75 | % |
| | | | | | |
Net investment income(b) | | | 1.33 | %^ | | | .32 | % | | | 1.78 | % | | | .42 | % | | | .47 | % | | | 1.35 | % |
| | | | | | |
Portfolio turnover rate | | | 12 | % | | | 25 | % | | | 112 | % | | | 47 | % | | | 49 | % | | | 61 | % |
| | | | | | | | | | | | | | | | | | | | | | | | |
| |
‡ Expense ratios exclude the estimated acquired fund fees of the affiliated/unaffiliated underlying | |
portfolios | | | .39 | %^ | | | .40 | % | | | .23 | % | | | .23 | % | | | .23 | % | | | .01 | % |
See footnote summary on page 41.
| | |
| |
| abfunds.com | | AB TAX-MANAGED WEALTH APPRECIATION STRATEGY | 39 |
FINANCIAL HIGHLIGHTS(continued)
Selected Data For A Share Of Beneficial Interest Outstanding Throughout Each Period
| | | | | | | | | | | | | | | | | | | | | | | | |
| | | Advisor Class | |
| | | Six Months
Ended
February 28,
2019 (unaudited) | | | Year Ended August 31, | |
| | | 2018 | | | 2017 | | | 2016 | | | 2015 | | | 2014 | |
| | | | |
| | | | | | | | | | | | | | | | | | | | | | | | |
Net asset value, beginning of period | | | $ 16.84 | | | | $ 16.92 | | | | $ 15.14 | | | | $ 15.47 | | | | $ 16.58 | | | | $ 13.91 | |
| | | | |
Income From Investment Operations | | | | | | | | | | | | | | | | | | | | | | | | |
| | | | | | |
Net investment income(a)(b) | | | .19 | | | | .21 | | | | .45 | | | | .21 | | | | .24 | | | | .37 | |
| | | | | | |
Net realized and unrealized gain (loss) on investment and foreign currency transactions | | | (.89 | ) | | | 1.80 | | | | 1.80 | | | | .61 | | | | (.91 | ) | | | 2.66 | |
| | | | | | |
Contributions from Affiliates | | | – 0 | – | | | – 0 | – | | | – 0 | – | | | .00 | (c) | | | – 0 | – | | | – 0 | – |
| | | | |
Net increase (decrease) in net asset value from operations | | | (.70 | ) | | | 2.01 | | | | 2.25 | | | | .82 | | | | (.67 | ) | | | 3.03 | |
| | | | |
Less: Dividends and Distributions | | | | | | | | | | | | | | | | | | | | | | | | |
| | | | | | |
Dividends from net investment income | | | (.20 | ) | | | (.43 | ) | | | (.33 | ) | | | (.21 | ) | | | (.30 | ) | | | (.36 | ) |
| | | | | | |
Distributions from net realized gain on investment transactions | | | (.57 | ) | | | (1.66 | ) | | | (.14 | ) | | | (.94 | ) | | | (.14 | ) | | | – 0 | – |
| | | | |
Total dividends and distributions | | | (.77 | ) | | | (2.09 | ) | | | (.47 | ) | | | (1.15 | ) | | | (.44 | ) | | | (.36 | ) |
| | | | |
Net asset value, end of period | | | $ 15.37 | | | | $ 16.84 | | | | $ 16.92 | | | | $ 15.14 | | | | $ 15.47 | | | | $ 16.58 | |
| | | | |
Total Return | | | | | | | | | | | | | | | | | | | | | | | | |
| | | | | | |
Total investment return based on net asset value(d)* | | | (3.69 | )% | | | 12.41 | % | | | 15.27 | % | | | 5.50 | % | | | (4.10 | )% | | | 22.08 | % |
| | | | | | |
Ratios/Supplemental Data | | | | | | | | | | | | | | | | | | | | | | | | |
| | | | | | |
Net assets, end of period (000’s omitted) | | | $663,313 | | | | $700,240 | | | | $638,666 | | | | $639,602 | | | | $648,133 | | | | $687,496 | |
| | | | | | |
Ratio to average net assets of: | | | | | | | | | | | | | | | | | | | | | | | | |
| | | | | | |
Expenses, net of waivers/reimbursements(e)‡ | | | .38 | %^ | | | .38 | % | | | .64 | % | | | .68 | % | | | .68 | % | | | .74 | % |
| | | | | | |
Expenses, before waivers/reimbursements(e)‡ | | | .74 | %^ | | | .75 | % | | | .76 | % | | | .76 | % | | | .76 | % | | | .74 | % |
| | | | | | |
Net investment income(b) | | | 2.51 | %^ | | | 1.28 | % | | | 2.89 | % | | | 1.41 | % | | | 1.46 | % | | | 2.36 | % |
| | | | | | |
Portfolio turnover rate | | | 12 | % | | | 25 | % | | | 112 | % | | | 47 | % | | | 49 | % | | | 61 | % |
| | | | | | | | | | | | | | | | | | | | | | | | |
| |
‡ Expense ratios exclude the estimated acquired fund fees of the affiliated/unaffiliated underlying | |
portfolios | | | .39 | %^ | | | .40 | % | | | .23 | % | | | .23 | % | | | .23 | % | | | .01 | % |
See footnote summary on page 41.
| | |
| |
| 40 | AB TAX-MANAGED WEALTH APPRECIATION STRATEGY | | abfunds.com |
FINANCIAL HIGHLIGHTS(continued)
Selected Data For A Share Of Beneficial Interest Outstanding Throughout Each Period
| (a) | Based on average shares outstanding. |
| (b) | Net of fees and expenses waived/reimbursed by the Adviser. |
| (c) | Amount is less than $.005. |
| (d) | Total investment return is calculated assuming an initial investment made at the net asset value at the beginning of the period, reinvestment of all dividends and distributions at net asset value during the period, and redemption on the last day of the period. Initial sales charges or contingent deferred sales charges are not reflected in the calculation of total investment return. Total return does not reflect the deduction of taxes that a shareholder would pay on fund distributions or the redemption of fund shares. Total investment return calculated for a period of less than one year is not annualized. |
| (e) | In connection with the Fund’s investments in affiliated underlying portfolios, the Fund incurs no direct expenses, but bears proportionate shares of the fees and expenses (i.e., operating, administrative and investment advisory fees) of the affiliated underlying portfolios. The Adviser has contractually agreed to waive its fees from the Fund in an amount equal to the Fund’s pro rata share of certain acquired fund fees and expenses, and for the six months ended February 28, 2019 and the years ended August 31, 2018 and August 31, 2017, such waiver amounted to .36% (annualized), .37% and .12%, respectively. |
| * | Includes the impact of proceeds received and credited to the Fund resulting from class action settlements, which enhanced the Fund’s performance for the years ended August 31, 2018, August 31, 2017, August 31, 2016 and August 31, 2015 by .02%, .02%, .01% and .04%, respectively. |
See notes to financial statements.
| | |
| |
| abfunds.com | | AB TAX-MANAGED WEALTH APPRECIATION STRATEGY | 41 |
RESULTS OF SHAREHOLDER MEETING
(unaudited)
A Special Meeting of Shareholders of The AB Portfolios (the “Company”)—ABTax-Managed Wealth Appreciation Strategy (the “Fund”) was held on October 11, 2018, and adjourned until December 11, 2018. A description of each proposal and the number of shares voted at the Meeting are as follows (the proposal numbers shown below correspond to the proposal number in the Fund’s proxy statement):
| 1. | To approve and vote upon the election of Trustees for the Company, each such Trustee to serve for a term of indefinite duration and until his or her successor is duly elected and qualifies. |
| | | | | | | | |
Trustee: | | Voted
For: | | | Authority
Withheld: | |
Michael J. Downey | | | 112,255,334 | | | | 2,874,198 | |
William H. Foulk, Jr.* | | | 112,062,437 | | | | 3,067,095 | |
Nancy P. Jacklin | | | 112,466,540 | | | | 2,662,992 | |
Robert M. Keith | | | 112,388,936 | | | | 2,740,596 | |
Carol C. McMullen | | | 112,486,090 | | | | 2,643,442 | |
Gary L. Moody | | | 112,308,212 | | | | 2,821,321 | |
Marshall C. Turner, Jr. | | | 112,101,288 | | | | 3,028,244 | |
Earl D. Weiner | | | 112,176,204 | | | | 2,953,328 | |
| 2. | To vote upon the approval of new advisory agreements for the Fund with AllianceBernstein L.P. |
| | | | | | | | | | | | | | |
Voted
For | | | Voted
Against | | | Abstained | | | Broker-Non
Votes | |
| | 19,741,154 | | | | 224,426 | | | | 625,028 | | | | 1,884,967 | |
| * | Mr. Foulk retired on December 31, 2018. |
| | |
| |
| 42 | AB TAX-MANAGED WEALTH APPRECIATION STRATEGY | | abfunds.com |
TRUSTEES
| | |
Marshall C. Turner, Jr.(1),Chairman Michael J. Downey(1) Nancy P. Jacklin(1) | | Robert M. Keith,President and
Chief Executive Officer Carol C. McMullen(1) Garry L. Moody(1) Earl D. Weiner(1) |
OFFICERS
| | |
Ding Liu(2),Vice President Nelson Yu(2),Vice President Emilie D. Wrapp,Clerk Michael B. Reyes,Senior Analyst | | Joseph J. Mantineo,Treasurer and Chief Financial Officer Phyllis J. Clarke,Controllerand Chief Accounting Officer Vincent S. Noto,Chief Compliance Officer |
| | |
Custodian and Accounting Agent State Street Bank and Trust Company State Street Corporation CCB/5 1 Iron Street Boston, MA 02210 Principal Underwriter AllianceBernstein Investments, Inc. 1345 Avenue of the Americas New York, NY 10105 Legal Counsel Seward & Kissel LLP One Battery Park Plaza New York, NY 10004 | | Transfer Agent AllianceBernstein Investor Services, Inc. P.O. Box 786003 San Antonio, TX 78278-6003 Toll-Free (800) 221-5672 Independent Registered Public Accounting Firm Ernst & Young LLP 5 Times Square New York, NY 10036 |
| 1 | Member of the Audit Committee, the Governance and Nominating Committee and the Independent Directors Committee. |
| 2 | Theday-to-day management of, and investment decisions for, the Strategy’s portfolio are made by the Adviser’s Multi-Asset Solutions Team. Messrs. Liu and Yu are the investment professionals primarily responsible for the day-to-day management of the Tax-Managed Wealth Appreciation Strategy’s portfolio. |
| | |
| |
| abfunds.com | | AB TAX-MANAGED WEALTH APPRECIATION STRATEGY | 43 |
Information Regarding the Review and Approval of the Fund’s Proposed New Advisory Agreement and Interim Advisory Agreement in the Context of Potential Assignments
As described in more detail in the Proxy Statement for the AB Funds dated August 20, 2018, the Boards of the AB Funds, at a meeting held onJuly 31-August 2, 2018, approved new advisory agreements with the Adviser (the “Proposed Agreements”) for the AB Funds, including The AB Portfolios in respect ofAB Tax-Managed Wealth Appreciation Strategy (the “Fund”), in connection with the planned disposition by AXA S.A. of its remaining shares of AXA Equitable Holdings, Inc. (the indirect holder of a majority of the partnership interests in the Adviser and the indirect parent of AllianceBernstein Corporation, the general partner of the Adviser) in one or more transactions and the related potential for one or more “assignments” (within the meaning of section 2(a)(4) of the Investment Company Act) of the advisory agreements for the AB Funds, including the Fund’s Advisory Agreement, resulting in the automatic termination of such advisory agreements.
At the same meeting, the AB Boards also considered and approved interim advisory agreements with the Adviser (the “Interim Advisory Agreements”) for the AB Funds, including the Fund, to be effective only in the event that stockholder approval of a Proposed Agreement had not been obtained as of the date of one or more transactions resulting in an “assignment” of the Adviser’s advisory agreements, resulting in the automatic termination of such advisory agreements.
The shareholders of the Fund subsequently approved the Proposed Agreements at an annual meeting of shareholders called for the purpose of electing Directors and voting on the Proposed Agreements.
A discussion regarding the basis for the Boards’ approvals at the meeting held onJuly 31-August 2, 2018 is set forth below.
At a meeting of the AB Boards held on July31-August 2, 2018, the Adviser presented its recommendation that the Boards consider and approve the Proposed Agreements. Section 15(c) of the 1940 Act provides that, after an initial period, a Fund’s Current Agreement and currentsub-advisory agreement, as applicable, will remain in effect only if the Board, including a majority of the Independent Directors, annually reviews and approves them. Each of the Current Agreements had been approved by a Board within theone-year period prior to approval of its related Proposed Agreement, except that the Current Agreements for certain FlexFee funds were approved in February 2017. In connection with their approval of the Proposed Agreements, the Boards considered their conclusions in connection with their most recent approvals of the Current Agreements, in particular in cases where the last approval of a Current Agreement was relatively recent, including the Boards’ general satisfaction with the nature
| | |
| |
| 44 | AB TAX-MANAGED WEALTH APPRECIATION STRATEGY | | abfunds.com |
and quality of services being provided and, as applicable, in the case of certain Funds, actions taken or to be taken in an effort to improve investment performance or reduce expense ratios. The Directors also reviewed updated information provided by the Adviser in respect of each Fund. Also in connection with their approval of the Proposed Agreements, the Boards considered a representation made to them at that time by the Adviser that there were no additional developments not already disclosed to the Boards since their most recent approvals of the Current Agreements that would be a material consideration to the Boards in connection with their consideration of the Proposed Agreements, except for matters disclosed to the Boards by the Adviser. The Directors considered the fact that each Proposed Agreement would have corresponding terms and conditions identical to those of the corresponding Current Agreement with the exception of the effective date and initial term under the Proposed Agreement.
The Directors considered their knowledge of the nature and quality of the services provided by the Adviser to each Fund gained from their experience as directors or trustees of registered investment companies advised by the Adviser, their overall confidence in the Adviser’s integrity and competence they have gained from that experience, the Adviser’s initiative in identifying and raising potential issues with the Directors and its responsiveness, frankness and attention to concerns raised by the Directors in the past, including the Adviser’s willingness to consider and implement organizational and operational changes designed to improve investment results and the services provided to the Funds. The Directors noted that they have four regular meetings each year, at each of which they review extensive materials and information from the Adviser, including information on the investment performance of each Fund.
The Directors also considered all factors they believed relevant, including the specific matters discussed below. During the course of their deliberations, the Directors evaluated, among other things, the reasonableness of the management fees of the Funds they oversee. The Directors did not identify any particular information that wasall-important or controlling, and different Directors may have attributed different weights to the various factors. The Directors determined that the selection of the Adviser to manage the Funds, and the overall arrangements between the Funds and the Adviser, as provided in the Proposed Agreements, including the management fees, were fair and reasonable in light of the services performed under the Current Agreements and to be performed under the Proposed Agreements, expenses incurred and to be incurred and such other matters as the Directors considered relevant in the exercise of their business judgment. The material factors and conclusions that formed the basis for the Directors’ determinations included the following:
Nature, Extent and Quality of Services Provided
The Directors considered the scope and quality of services to be provided by the Adviser under the Proposed Agreements, including the quality of
| | |
| |
| abfunds.com | | AB TAX-MANAGED WEALTH APPRECIATION STRATEGY | 45 |
the investment research capabilities of the Adviser and the other resources it has dedicated to performing services for the Funds. They also considered the information that had been provided to them by the Adviser concerning the anticipated implementation of the Plan and the Adviser’s representation that it did not anticipate that such implementation would affect the management or structure of the Adviser, have a material adverse effect on the Adviser, or adversely affect the quality of the services provided to the Funds by the Adviser and its affiliates. The Directors noted that the Adviser from time to time reviews each Fund’s investment strategies and from time to time proposes changes intended to improve the Fund’s relative or absolute performance for the Directors’ consideration. They also noted the professional experience and qualifications of each Fund’s portfolio management team and other senior personnel of the Adviser. The Directors also considered that certain Proposed Agreements, similar to the corresponding Current Agreements, provide that the Funds will reimburse the Adviser for the cost to it of providing certain clerical, accounting, administrative and other services to the Funds by employees of the Adviser or its affiliates. Requests for these reimbursements are made on a quarterly basis and subject to approval by the Directors. The Directors noted that the Adviser did not request any reimbursements from certain Funds in the Fund’s latest fiscal year reviewed. The Directors noted that the methodology to be used to determine the reimbursement amounts had been reviewed by an independent consultant retained by the Funds’ former Senior Officer/Independent Compliance Officer. The quality of administrative and other services, including the Adviser’s role in coordinating the activities of the Funds’ other service providers, also was considered. The Directors of each Fund concluded that, overall, they were satisfied with the nature, extent and quality of services to be provided to the Funds under the Proposed Agreement for the Fund.
Costs of Services to be Provided and Profitability
The Directors reviewed a schedule of the revenues and expenses and related notes indicating the profitability of each Fund to the Adviser for calendar years 2016 and 2017, as applicable, that had been prepared with an expense allocation methodology arrived at in consultation with an independent consultant retained by the Funds’ former Senior Officer/Independent Compliance Officer. The Directors noted the assumptions and methods of allocation used by the Adviser in preparing fund-specific profitability data and understood that there are a number of potentially acceptable allocation methodologies for information of this type. The Directors noted that the profitability information reflected all revenues and expenses of the Adviser’s relationship with a Fund, including those relating to its subsidiaries that provide transfer agency, distribution and brokerage services to the Fund, as applicable. The Directors recognized that it is difficult to make comparisons of the profitability of the Proposed Agreements with the profitability of fund advisory contracts for unaffiliated funds because comparative information is not generally publicly available and is
| | |
| |
| 46 | AB TAX-MANAGED WEALTH APPRECIATION STRATEGY | | abfunds.com |
affected by numerous factors. The Directors focused on the profitability of the Adviser’s relationship with each Fund before taxes and distribution expenses, as applicable. The Directors noted that certain Funds were not profitable to the Adviser in one or more periods reviewed. The Directors concluded that the Adviser’s level of profitability from its relationship with the other Funds was not unreasonable. The Directors were unable to consider historical information about the profitability of certain Funds that had recently commenced operations and for which historical profitability information was not available. The Adviser agreed to provide the Directors with profitability information in connection with future proposed continuances of the Proposed Agreements.
Fall-Out Benefits
The Directors considered the other benefits to the Adviser and its affiliates from their relationships with the Funds, including, but not limited to, as applicable, benefits relating to soft dollar arrangements (whereby investment advisers receive brokerage and research services from brokers that execute agency transactions for their clients) in the case of certain Funds;12b-1 fees and sales charges received by the principal underwriter (which is a wholly owned subsidiary of the Adviser) in respect of certain classes of the shares of most of the Funds; brokerage commissions paid by certain Funds to brokers affiliated with the Adviser; and transfer agency fees paid by most of the Funds to a wholly owned subsidiary of the Adviser. The Directors recognized that the Adviser’s profitability would be somewhat lower, and that a Fund’s unprofitability to the Adviser would be exacerbated, without these benefits. The Directors understood that the Adviser also might derive reputational and other benefits from its association with the Funds.
Investment Results
In addition to the information reviewed by the Directors in connection with the Board meeting at which the Proposed Agreements were approved, the Directors receive detailed performance information for the Funds at each regular Board meeting during the year.
The Boards’ consideration of each Proposed Agreement was informed by their most recent approval of the related Current Agreement, and, in the case of certain Funds, their discussion with the Adviser of the reasons for those Funds’ underperformance in certain periods. The Directors also reviewed updated performance information and, in some cases, discussed with the Adviser the reasons for changes in performance or continued underperformance. On the basis of this review, the Directors concluded that each Fund’s investment performance was acceptable.
Management Fees and Other Expenses
The Directors considered the management fee rate payable by each Fund to the Adviser and information prepared by an independent service provider
| | |
| |
| abfunds.com | | AB TAX-MANAGED WEALTH APPRECIATION STRATEGY | 47 |
(the ‘‘15(c) provider’’) concerning management fee rates payable by other funds in the same category as the Fund. The Directors recognized that it is difficult to make comparisons of management fees because there are variations in the services that are included in the fees paid by other funds. The Directors compared each Fund’s contractual management fee rate with a peer group median, and where applicable, took into account the impact on the management fee rate of the administrative expense reimbursement paid to the Adviser in the latest fiscal year. In the case of the ACS Funds, the Directors noted that the management fee rate is zero but also were cognizant that the Adviser is indirectly compensated by the wrap fee program sponsors that use the ACS Funds as an investment vehicle for their clients.
The Directors also considered the Adviser’s fee schedule for other clients pursuing a similar investment style to each Fund. For this purpose, they reviewed the relevant advisory fee information from the Adviser’s Form ADV and in a report from the Funds’ Senior Analyst and noted the differences between a Fund’s fee schedule, on the one hand, and the Adviser’s institutional fee schedule and the schedule of fees charged by the Adviser to any offshore funds and for services to anysub-advised funds pursuing a similar investment strategy as the Fund, on the other, as applicable. The Directors noted that the Adviser may, in some cases, agree to fee rates with large institutional clients that are lower than those reviewed by the Directors and that they had previously discussed with the Adviser its policies in respect of such arrangements. The Adviser also informed the Directors that, in the case of certain Funds, there were no institutional products managed by the Adviser that have a substantially similar investment style. The Directors also discussed these matters with their independent fee consultant.
The Adviser reviewed with the Directors the significantly greater scope of the services it provides to each Fund relative to institutional, offshore fund andsub-advised fund clients, as applicable. In this regard, the Adviser noted, among other things, that, compared to institutional and offshore orsub-advisory accounts, each Fund, as applicable, (i) demands considerably more portfolio management, research and trading resources due to significantly higher daily cash flows (in the case ofopen-end Funds); (ii) has more tax and regulatory restrictions and compliance obligations; (iii) must prepare and file or distribute regulatory and other communications about fund operations; and (iv) must provide shareholder servicing to retail investors. The Adviser also reviewed the greater legal risks presented by the large and changing population of Fund shareholders who may assert claims against the Adviser in individual or class actions, and the greater entrepreneurial risk in offering new fund products, which require substantial investment to launch, may not succeed, and generally must be priced to compete with larger, more established funds resulting in lack of profitability to the Adviser until a new fund achieves scale. In light of the substantial differences in services rendered by the Adviser to institutional,
| | |
| |
| 48 | AB TAX-MANAGED WEALTH APPRECIATION STRATEGY | | abfunds.com |
offshore fund andsub-advised fund clients as compared to the Funds, and the different risk profile, the Directors considered these fee comparisons inapt and did not place significant weight on them in their deliberations.
The Directors noted that many of the Funds may invest in shares of exchange-traded funds (“ETFs”), subject to the restrictions and limitations of the 1940 Act as these may be varied as a result of exemptive orders issued by the SEC. The Directors also noted that ETFs pay advisory fees pursuant to their advisory contracts. The Directors concluded, based on the Adviser’s explanation of how it uses ETFs when they are the most cost-effective way to obtain desired exposures, in some cases pending purchases of underlying securities, that each Fund’s management fee would be for services that would be in addition to, rather than duplicative of, the services provided under the advisory contracts of the ETFs.
With respect to each Fund’s management fee, the Directors considered the total expense ratio of the Fund in comparison to a peer group and peer universe selected by the 15(c) service provider. The Directors also considered the Adviser’s expense caps for certain Funds. The Directors view expense ratio information as relevant to their evaluation of the Adviser’s services because the Adviser is responsible for coordinating services provided to a Fund by others.
The Boards’ consideration of each Proposed Agreement was informed by their most recent approval of the related Current Agreement, and, in the case of certain Funds, their discussion with the Adviser of the reasons for those Funds’ expense ratios in certain periods. The Directors also reviewed updated expense ratio information and, in some cases, discussed with the Adviser the reasons for the expense ratios of certain Funds. On the basis of this review, the Directors concluded that each Fund’s expense ratio was acceptable.
The Directors did not consider comparative expense information for the ACS Funds because those Funds do not bear ordinary expenses.
Economies of Scale
The Directors noted that the management fee schedules for certain Funds do not contain breakpoints and that they had discussed their strong preference for breakpoints in advisory contracts with the Adviser. The Directors took into consideration prior presentations by an independent consultant on economies of scale in the mutual fund industry and for the Funds, and by the Adviser concerning certain of its views on economies of scale. The Directors also had requested and received from the Adviser certain updates on economies of scale in advance of the Board meeting. The Directors believe that economies of scale may be realized (if at all) by the Adviser across a variety of products and services, and not only in respect of a single fund. The Directors noted that there is no established
| | |
| |
| abfunds.com | | AB TAX-MANAGED WEALTH APPRECIATION STRATEGY | 49 |
methodology for setting breakpoints that give effect to the fund-specific services provided by a fund’s adviser and to the economies of scale that an adviser may realize in its overall mutual fund business or those components of it which directly or indirectly affect a fund’s operations. The Directors observed that in the mutual fund industry as a whole, as well as among funds similar to each Fund, there is no uniformity or pattern in the fees and asset levels at which breakpoints (if any) apply. The Directors also noted that the advisory agreements for many funds do not have breakpoints at all. The Directors informed the Adviser that they would monitor the asset levels of the Funds without breakpoints and their profitability to the Adviser and anticipated revisiting the question of breakpoints in the future if circumstances warrant doing so.
The Directors did not consider the extent to which fee levels in the Advisory Agreement for the ACS Funds reflect economies of scale because that Advisory Agreement does not provide for any compensation to be paid to the Adviser by the ACS Funds and the expense ratio of each of those Funds is zero.
Interim Advisory Agreements
In approving the Interim Advisory Agreements, the Boards, with the assistance of independent counsel, considered similar factors to those considered in approving the Proposed Agreements. The Interim Advisory Agreements approved by the Boards are identical to the Proposed Agreements, as well as the Current Agreements, in all material respects except for their proposed effective and termination dates and provisions intended to comply with the requirements of the relevant SEC rule, such as provisions requiring escrow of advisory fees. Under the Interim Advisory Agreements, the Adviser would continue to manage a Fund pursuant to an Interim Advisory Agreement until a new advisory agreement was approved by stockholders or until the end of the150-day period, whichever would occur earlier. All fees earned by the Adviser under an Interim Advisory Agreement would be held in escrow pending shareholder approval of the Proposed Agreement. Upon approval of a new advisory agreement by stockholders, the escrowed management fees would be paid to the Adviser, and the Interim Advisory Agreement would terminate.
Information Regarding the Review and Approval of the Fund’s Current Advisory Agreement
The disinterested trustees (the “directors”) of The AB Portfolios (the “Company”) unanimously approved the continuance of the Company’s Advisory Agreement with the Adviser in respect of ABTax-Managed Wealth Appreciation Strategy (the “Fund”) at a meeting held onJuly 31-August 2, 2018 (the “Meeting”).
Prior to approval of the continuance of the Advisory Agreement, the directors had requested from the Adviser, and received and evaluated,
| | |
| |
| 50 | AB TAX-MANAGED WEALTH APPRECIATION STRATEGY | | abfunds.com |
extensive materials. They reviewed the proposed continuance of the Advisory Agreement with the Adviser and with experienced counsel who are independent of the Adviser, who advised on the relevant legal standards. The directors also reviewed additional materials, including materials from an outside consultant, who acted as their independent fee consultant, and comparative analytical data prepared by the Senior Analyst for the Fund. The directors also discussed the proposed continuance in private sessions with counsel.
The directors considered their knowledge of the nature and quality of the services provided by the Adviser to the Fund gained from their experience as directors or trustees of most of the registered investment companies advised by the Adviser, their overall confidence in the Adviser’s integrity and competence they have gained from that experience, the Adviser’s initiative in identifying and raising potential issues with the directors and its responsiveness, frankness and attention to concerns raised by the directors in the past, including the Adviser’s willingness to consider and implement organizational and operational changes designed to improve investment results and the services provided to the AB Funds. The directors noted that they have four regular meetings each year, at each of which they review extensive materials and information from the Adviser, including information on the investment performance of the Fund.
The directors also considered all factors they believed relevant, including the specific matters discussed below. During the course of their deliberations, the directors evaluated, among other things, the reasonableness of the advisory fee. The directors did not identify any particular information that wasall-important or controlling, and different directors may have attributed different weights to the various factors. The directors determined that the selection of the Adviser to manage the Fund and the overall arrangements between the Fund and the Adviser, as provided in the Advisory Agreement, including the advisory fee, were fair and reasonable in light of the services performed, expenses incurred and such other matters as the directors considered relevant in the exercise of their business judgment. The material factors and conclusions that formed the basis for the directors’ determinations included the following:
Nature, Extent and Quality of Services Provided
The directors considered the scope and quality of services provided by the Adviser under the Advisory Agreement, including the quality of the investment research capabilities of the Adviser and the other resources it has dedicated to performing services for the Fund. The directors noted that the Adviser from time to time reviews the Fund’s investment strategies and from time to time proposes changes intended to improve the Fund’s relative or absolute performance for the directors’ consideration. They also noted the professional experience and qualifications of the Fund’s portfolio management team and other senior personnel of the Adviser. The directors
| | |
| |
| abfunds.com | | AB TAX-MANAGED WEALTH APPRECIATION STRATEGY | 51 |
also considered that the Advisory Agreement provides that the Fund will reimburse the Adviser for the cost to it of providing certain clerical, accounting, administrative and other services to the Fund by employees of the Adviser or its affiliates. Requests for these reimbursements are made on a quarterly basis and subject to approval by the directors. Reimbursements, to the extent requested and paid, result in a higher rate of total compensation from the Fund to the Adviser than the fee rate stated in the Advisory Agreement. The directors noted that the methodology used to determine the reimbursement amounts had been reviewed by an independent consultant retained by the Fund’s former Senior Officer/Independent Compliance Officer. The quality of administrative and other services, including the Adviser’s role in coordinating the activities of the Fund’s other service providers, also was considered. The directors concluded that, overall, they were satisfied with the nature, extent and quality of services provided to the Fund under the Advisory Agreement.
Costs of Services Provided and Profitability
The directors reviewed a schedule of the revenues and expenses and related notes indicating the profitability of the Fund to the Adviser for calendar years 2016 and 2017 that had been prepared with an expense allocation methodology arrived at in consultation with an independent consultant retained by the Fund’s former Senior Officer/Independent Compliance Officer. The directors noted the assumptions and methods of allocation used by the Adviser in preparing fund-specific profitability data and understood that there are a number of potentially acceptable allocation methodologies for information of this type. The directors noted that the profitability information reflected all revenues and expenses of the Adviser’s relationship with the Fund, including those relating to its subsidiaries that provide transfer agency, distribution and brokerage services to the Fund. The directors recognized that it is difficult to make comparisons of the profitability of the Advisory Agreement with the profitability of fund advisory contracts for unaffiliated funds because comparative information is not generally publicly available and is affected by numerous factors. The directors focused on the profitability of the Adviser’s relationship with the Fund before taxes and distribution expenses. The directors concluded that the Adviser’s level of profitability from its relationship with the Fund was not unreasonable.
Fall-Out Benefits
The directors considered the other benefits to the Adviser and its affiliates from their relationships with the Fund and the underlying funds advised by the Adviser in which the Fund invests, including, but not limited to, benefits relating to soft dollar arrangements (whereby investment advisers receive brokerage and research services from brokers that execute agency transactions for their clients);12b-1 fees and sales charges received by the Fund’s principal underwriter (which is a wholly owned subsidiary of the Adviser) in respect of certain classes of the Fund’s shares; brokerage
| | |
| |
| 52 | AB TAX-MANAGED WEALTH APPRECIATION STRATEGY | | abfunds.com |
commissions paid by the Fund to brokers affiliated with the Adviser; and transfer agency fees paid by the Fund to a wholly owned subsidiary of the Adviser. The directors recognized that the Adviser’s profitability would be somewhat lower without these benefits. The directors understood that the Adviser also might derive reputational and other benefits from its association with the Fund.
Investment Results
In addition to the information reviewed by the directors in connection with the Meeting at which continuance of the Advisory Agreement was approved, the directors receive detailed performance information for the Fund at each regular Board meeting during the year.
At the Meeting, the directors reviewed performance information prepared by an independent service provider (the “15(c) service provider”), showing the performance of the Class A Shares of the Fund against a group of similar funds (“peer group”) and a larger group of similar funds (“peer universe”), each selected by the 15(c) service provider, and information prepared by the Adviser showing performance of the Class A Shares against a broad-based securities market index, in each case for the1-,3-,5- and10-year periods ended May 31, 2018 and (in the case of comparisons with the broad-based securities market index) for the period from inception. Based on their review, the directors concluded that the Fund’s investment performance was acceptable.
Advisory Fees and Other Expenses
The directors considered the advisory fee rate payable by the Fund to the Adviser and information prepared by the 15(c) service provider concerning advisory fee rates payable by other funds in the same category as the Fund. The directors recognized that it is difficult to make comparisons of advisory fees because there are variations in the services that are included in the fees paid by other funds. The directors compared the Fund’s contractual effective advisory fee rate with a peer group median and took into account the impact on the advisory fee rate of the administrative expense reimbursement paid to the Adviser in the latest fiscal year.
The directors also considered the Adviser’s fee schedule for other clients pursuing a similar investment style. For this purpose, they reviewed the relevant advisory fee information from the Adviser’s Form ADV and in a report from the Fund’s Senior Analyst and noted the differences between the Fund’s fee schedule, on the one hand, and the Adviser’s institutional fee schedule, on the other. The directors noted that the Adviser may, in some cases, agree to fee rates with large institutional clients that are lower than those reviewed by the directors and that they had previously discussed with the Adviser its policies in respect of such arrangements. The directors also discussed these matters with their independent fee consultant.
| | |
| |
| abfunds.com | | AB TAX-MANAGED WEALTH APPRECIATION STRATEGY | 53 |
The Adviser reviewed with the directors the significantly greater scope of the services it provides to the Fund relative to institutional clients. In this regard, the Adviser noted, among other things, that, compared to institutional accounts, the Fund (i) demands considerably more portfolio management, research and trading resources due to significantly higher daily cash flows; (ii) has more tax and regulatory restrictions and compliance obligations; (iii) must prepare and file or distribute regulatory and other communications about fund operations; and (iv) must provide shareholder servicing to retail investors. The Adviser also reviewed the greater legal risks presented by the large and changing population of Fund shareholders who may assert claims against the Adviser in individual or class actions, and the greater entrepreneurial risk in offering new fund products, which require substantial investment to launch, may not succeed, and generally must be priced to compete with larger, more established funds resulting in lack of profitability to the Adviser until a new fund achieves scale. In light of the substantial differences in services rendered by the Adviser to institutional clients as compared to the Fund, the directors considered these fee comparisons inapt and did not place significant weight on them in their deliberations.
The directors noted that the Fund may invest in shares of exchange-traded funds (“ETFs”), subject to the restrictions and limitations of the Investment Company Act of 1940 as these may be varied as a result of exemptive orders issued by the SEC. The directors also noted that ETFs pay advisory fees pursuant to their advisory contracts. The directors concluded, based on the Adviser’s explanation of how it uses ETFs when they are the most cost-effective way to obtain desired exposures, in some cases pending purchases of underlying securities, that the advisory fee for the Fund is for services that are in addition to, rather than duplicative of, the services provided under the advisory contracts of the ETFs.
The directors also considered the total expense ratio of the Class A shares of the Fund in comparison to a peer group and a peer universe selected by the 15(c) service provider. The Class A expense ratio of the Fund was based on the Fund’s latest fiscal year. The directors noted that it was likely that the expense ratios of some of the other funds in the Fund’s category were lowered by waivers or reimbursements by those funds’ investment advisers, which in some cases might be voluntary or temporary. The directors view expense ratio information as relevant to their evaluation of the Adviser’s services because the Adviser is responsible for coordinating services provided to the Fund by others. Based on their review, the directors concluded that the Fund’s expense ratio was acceptable.
Economies of Scale
The directors noted that the advisory fee schedules for the Fund contains breakpoints that reduce the fee rates on assets above specified levels. The directors took into consideration prior presentations by an independent
| | |
| |
| 54 | AB TAX-MANAGED WEALTH APPRECIATION STRATEGY | | abfunds.com |
consultant on economies of scale in the mutual fund industry and for the AB Funds, and by the Adviser concerning certain of its views on economies of scale. The directors also had requested and received from the Adviser certain updates on economies of scale in advance of the Meeting. The directors believe that economies of scale may be realized (if at all) by the Adviser across a variety of products and services, and not only in respect of a single fund. The directors noted that there is no established methodology for setting breakpoints that give effect to the fund-specific services provided by a fund’s adviser and to the economies of scale that an adviser may realize in its overall mutual fund business or those components of it which directly or indirectly affect a fund’s operations. The directors observed that in the mutual fund industry as a whole, as well as among funds similar to the Fund, there is no uniformity or pattern in the fees and asset levels at which breakpoints (if any) apply. The directors also noted that the advisory agreements for many funds do not have breakpoints at all. Having taken these factors into account, the directors concluded that the Fund’s shareholders would benefit from a sharing of economies of scale in the event the Fund’s net assets exceed a breakpoint in the future.
| | |
| |
| abfunds.com | | AB TAX-MANAGED WEALTH APPRECIATION STRATEGY | 55 |
This page is not part of the Shareholder Report or the Financial Statements.
AB FAMILY OF FUNDS
US EQUITY
US CORE
Core Opportunities Fund
FlexFee™ US Thematic Portfolio
Select US Equity Portfolio
US GROWTH
Concentrated Growth Fund
Discovery Growth Fund
FlexFee™ Large Cap Growth Portfolio
Growth Fund
Large Cap Growth Fund
Small Cap Growth Portfolio
US VALUE
Discovery Value Fund
Equity Income Fund
Relative Value Fund
Small Cap Value Portfolio
Value Fund
INTERNATIONAL/ GLOBAL EQUITY
INTERNATIONAL/ GLOBAL CORE
FlexFee™ International Strategic Core Portfolio
Global Core Equity Portfolio
International Portfolio
International Strategic Core Portfolio
Sustainable Global Thematic Fund
Tax-Managed International Portfolio
Tax-Managed Wealth Appreciation Strategy
Wealth Appreciation Strategy
INTERNATIONAL/ GLOBAL GROWTH
Concentrated International Growth Portfolio
FlexFee™ Emerging Markets Growth Portfolio
INTERNATIONAL/ GLOBAL EQUITY(continued)
Sustainable International Thematic Fund
INTERNATIONAL/ GLOBAL VALUE
All China Equity Portfolio
International Value Fund
FIXED INCOME
MUNICIPAL
High Income Municipal Portfolio
Intermediate California Municipal Portfolio
Intermediate Diversified Municipal Portfolio
Intermediate New York Municipal Portfolio
Municipal Bond Inflation Strategy
Tax-Aware Fixed Income Portfolio
National Portfolio
Arizona Portfolio
California Portfolio
Massachusetts Portfolio
Minnesota Portfolio
New Jersey Portfolio
New York Portfolio
Ohio Portfolio
Pennsylvania Portfolio
Virginia Portfolio
TAXABLE
Bond Inflation Strategy
FlexFee™ High Yield Portfolio
FlexFee™ International Bond Portfolio
Global Bond Fund
High Income Fund
Income Fund
Intermediate Bond Portfolio
Limited Duration High Income Portfolio
Short Duration Portfolio
ALTERNATIVES
All Market Real Return Portfolio
Global Real Estate Investment Fund
Select US Long/Short Portfolio
Unconstrained Bond Fund
MULTI-ASSET
All Market Income Portfolio
All Market Total Return Portfolio
Conservative Wealth Strategy
Emerging Markets Multi-Asset Portfolio
Global Risk Allocation Fund
Tax-Managed All Market Income Portfolio
TARGET-DATE
Multi-Manager Select Retirement Allocation Fund
Multi-Manager Select 2010 Fund
Multi-Manager Select 2015 Fund
Multi-Manager Select 2020 Fund
Multi-Manager Select 2025 Fund
Multi-Manager Select 2030 Fund
Multi-Manager Select 2035 Fund
Multi-Manager Select 2040 Fund
Multi-Manager Select 2045 Fund
Multi-Manager Select 2050 Fund
Multi-Manager Select 2055 Fund
Multi-Manager Select 2060 Fund
CLOSED-END FUNDS
Alliance California Municipal Income Fund
AllianceBernstein Global High Income Fund
AllianceBernstein National Municipal Income Fund
We also offer Government Money Market Portfolio, which serves as the money market fund exchange vehicle for the AB mutual funds. You could lose money by investing in the Fund. Although the Fund seeks to preserve the value of your investment at $1.00 per share, it cannot guarantee it will do so. The Fund may impose a fee upon sale of your shares or may temporarily suspend your ability to sell shares if the Fund’s liquidity falls below required minimums because of market conditions or other factors. An investment in the Fund is not insured or guaranteed by the Federal Deposit Insurance Corporation or any other government agency. The Fund’s sponsor has no legal obligation to provide financial support to the Fund, and you should not expect that the sponsor will provide financial support to the Fund at any time.
Investors should consider the investment objectives, risks, charges and expenses of the Fund carefully before investing. For copies of our prospectus or summary prospectus, which contain this and other information, visit us online at www.abfunds.com or contact your AB representative. Please read the prospectus and/or summary prospectus carefully before investing.
| | |
| |
| 56 | AB TAX-MANAGED WEALTH APPRECIATION STRATEGY | | abfunds.com |
NOTES
| | |
| |
| abfunds.com | | AB TAX-MANAGED WEALTH APPRECIATION STRATEGY | 57 |
NOTES
| | |
| |
| 58 | AB TAX-MANAGED WEALTH APPRECIATION STRATEGY | | abfunds.com |
NOTES
| | |
| |
| abfunds.com | | AB TAX-MANAGED WEALTH APPRECIATION STRATEGY | 59 |
NOTES
| | |
| |
| 60 | AB TAX-MANAGED WEALTH APPRECIATION STRATEGY | | abfunds.com |
AB TAX-MANAGED WEALTH APPRECIATION STRATEGY
1345 Avenue of the Americas
New York, NY 10105
800 221 5672
TWA-0152-0219 
FEB 02.28.19

SEMI-ANNUAL REPORT
AB WEALTH APPRECIATION STRATEGY

Beginning January 1, 2021, as permitted by new regulations adopted by the Securities and Exchange Commission, the Fund’s annual and semi-annual shareholder reports will no longer be sent by mail, unless you specifically request paper copies of the reports. Instead, the reports will be made available on a website, and you will be notified by mail each time a report is posted and provided with a website address to access the report.
If you already elected to receive shareholder reports electronically, you will not be affected by this change and you need not take any action. You may elect to receive shareholder reports and other communications from the Fund electronically at any time by contacting your financial intermediary (such as a broker-dealer or bank) or, if you are a direct investor, by calling the Fund at (800) 221 5672.
You may elect to receive all future reports in paper form free of charge. If you invest through a financial intermediary, you can contact your financial intermediary to request that you continue to receive paper copies of your shareholder reports; if you invest directly with the Fund, you can call the Fund at (800) 221 5672. Your election to receive reports in paper form will apply to all funds held in your account with your financial intermediary or, if you invest directly, to all AB Mutual Funds you hold.
| | |
| |
| Investment Products Offered | | • Are Not FDIC Insured• May Lose Value• Are Not Bank Guaranteed |
Investors should consider the investment objectives, risks, charges and expenses of the Fund carefully before investing. For copies of our prospectus or summary prospectus, which contain this and other information, visit us online at www.abfunds.com or contact your AB representative. Please read the prospectus and/or summary prospectus carefully before investing.
This shareholder report must be preceded or accompanied by the Fund’s prospectus for individuals who are not current shareholders of the Fund.
You may obtain a description of the Fund’s proxy voting policies and procedures, and information regarding how the Fund voted proxies relating to portfolio securities during the most recent12-month period ended June 30, without charge. Simply visit AB’s website at www.abfunds.com, or go to the Securities and Exchange Commission’s (the “Commission”) website at www.sec.gov, or call AB at (800) 227 4618.
The Fund files its complete schedule of portfolio holdings with the Commission for the first and third quarters of each fiscal year as an exhibit to its reports on Form N-PORT. The Fund’s Form N-PORT reports are available on the Commission’s website at www.sec.gov. The Fund’s Forms N-PORT may also be reviewed and copied at the Commission’s Public Reference Room in Washington, DC; information on the operation of the Public Reference Room may be obtained by calling (800) SEC 0330. AB publishes full portfolio holdings for the Fund monthly at www.abfunds.com.
AllianceBernstein Investments, Inc. (ABI) is the distributor of the AB family of mutual funds. ABI is a member of FINRA and is an affiliate of AllianceBernstein L.P., the Adviser of the funds.
The [A/B] logo is a registered service mark of AllianceBernstein and AllianceBernstein® is a registered service mark used by permission of the owner, AllianceBernstein L.P.
| | |
| FROM THE PRESIDENT | |  |
Dear Shareholder,
We are pleased to provide this report for AB Wealth Appreciation Strategy (the “Fund”). Please review the discussion of Fund performance, the market conditions during the reporting period and the Fund’s investment strategy.
As always, AB strives to keep clients ahead of what’s next by:
| + | | Transforming uncommon insights into uncommon knowledge with a global research scope |
| + | | Navigating markets with seasoned investment experience and sophisticated solutions |
| + | | Providing thoughtful investment insights and actionable ideas |
Whether you’re an individual investor or a multi-billion-dollar institution, we put knowledge and experience to work for you.
AB’s global research organization connects and collaborates across platforms and teams to deliver impactful insights and innovative products. Better insights lead to better opportunities—anywhere in the world.
For additional information about AB’s range of products and shareholder resources, please log on to www.abfunds.com.
Thank you for your investment in the AB Mutual Funds.
Sincerely,

Robert M. Keith
President and Chief Executive Officer, AB Mutual Funds
| | |
| |
| abfunds.com | | AB WEALTH APPRECIATION STRATEGY | 1 |
SEMI-ANNUAL REPORT
April 10, 2019
This report provides management’s discussion of fund performance for AB Wealth Appreciation Strategy for the semi-annual reporting period ended February 28, 2019.
The Fund’s investment objective is long-term growth of capital.
NAV RETURNS AS OF FEBRUARY 28, 2019(unaudited)
| | | | | | | | |
| | |
| | | 6 Months | | | 12 Months | |
| | |
| AB WEALTH APPRECIATION STRATEGY | | | | | | | | |
| | |
| Class A Shares | | | -3.79% | | | | -1.29% | |
| | |
| Class B Shares1 | | | -4.17% | | | | -2.06% | |
| | |
| Class C Shares | | | -4.10% | | | | -2.01% | |
| | |
| Advisor Class Shares2 | | | -3.64% | | | | -1.01% | |
| | |
| Class R Shares2 | | | -3.95% | | | | -1.73% | |
| | |
| Class K Shares2 | | | -3.87% | | | | -1.47% | |
| | |
| Class I Shares2 | | | -3.68% | | | | -1.06% | |
| | |
| MSCI ACWI (net) | | | -2.92% | | | | -0.84% | |
| 1 | Effective January 31, 2009, Class B shares are no longer available for purchase to new investors. Please see Note A for additional information. |
| 2 | Please note that these share classes are for investors purchasing shares through accounts established under certainfee-based programs sponsored and maintained by certain broker-dealers and financial intermediaries, institutional pension plans and/or investment advisory clients of, and certain other persons associated with, the Adviser and its affiliates or the Fund. |
INVESTMENT RESULTS
The table above shows the Fund’s performance compared to its benchmark, the Morgan Stanley Capital International All Country World Index (“MSCI ACWI”) (net), for thesix- and12-month periods ended February 28, 2019.
For both periods, all share classes underperformed the benchmark, before sales charges. For thesix-month period, the Fund’s overall allocation of 60% US stocks and 40%non-US stocks detracted from performance, relative to the benchmark, as US equities modestly underperformed. Stock selection in emerging-market, international large-cap and USsmall/mid-cap value stocks detracted, while stock selection in US large caps contributed.
For the12-month period, the greater allocation to US stocks contributed asUS-based stocks meaningfully outperformed theirnon-US peers. Stock selection in emerging-market, international large-cap and USsmall/mid-cap value stocks detracted, while stock selection in USsmall/mid-cap growth and US large caps contributed.
| | |
| |
| 2 | AB WEALTH APPRECIATION STRATEGY | | abfunds.com |
During the12-month period, the Fund utilized derivatives for hedging and investment purposes in the form of futures, which added to absolute returns.
MARKET REVIEW AND INVESTMENT STRATEGY
During thesix-month period ended February 28, 2019, US andnon-US equities declined, although emerging-market equities posted modest gains. In the US, growth-style stocks outperformed value-style stocks, andsmall-cap stocks outperformed theirlarge-cap peers. Global trade tensions and rising interest rates weighed on stock market performance. In Europe, Brexit uncertainty, Italian budget issues and German economic woes persisted. Slowing global growth was an increasing concern more broadly. Global equities plummeted at the end of 2018 amid increased volatility, but recouped some losses in January and February, as corporate earnings were above analyst estimates and many central banks shared more dovish monetary policy outlooks.
The Fund’s Senior Investment Management Team (the “Team”) seeks improved equity risk control by utilizing the Adviser’s Strategic Equities services as the core equity allocation to US and international markets. This diversified exposure across equity markets and emphasis on a broad set of stocks, which includes companies with historical and projected stable earnings and higher profitability, eliminates the need for diversifiers to limit volatility.
The Team believes this allocation offers the potential to achieve higher returns, with similar levels of volatility, increasing risk-adjusted returns in anall-equity service to meet the long-term growth goal—growth of capital.
INVESTMENT POLICIES
The Fund invests primarily in equity securities, either directly or through underlying investment companies advised by the Adviser (“Underlying Portfolios”). A majority of the Fund’s assets are expected to be invested directly in USlarge-cap equity securities, primarily common stocks, in accordance with the Adviser’s US Strategic Equities investment strategy (“US Strategic Equities”), as described below. In addition, the Fund seeks to achieve exposure to internationallarge-cap equity securities through investments in the International Strategic Equities Portfolio of Bernstein Fund, Inc. (“Bernstein International Strategic Equities Portfolio”) and the International Portfolio of Sanford C. Bernstein Fund, Inc. (“SCB International Portfolio”), each a registered investment company of the Adviser. The Fund also invests in other Underlying Portfolios to efficiently gain exposure to certain other types of equity securities, including small- andmid-cap and emerging-market equity securities. An Underlying Portfolio is selected
(continued on next page)
| | |
| |
| abfunds.com | | AB WEALTH APPRECIATION STRATEGY | 3 |
based on the segment of the equity market to which the Underlying Portfolio provides exposure, its investment philosophy, and how it complements and diversifies the Fund’s overall portfolio.
Under US Strategic Equities, portfolio managers of the Adviser that specialize in various investment disciplines identify high-convictionlarge-cap equity securities based on their fundamental investment research for potential investment by the Fund. These securities are then assessed in terms of both this fundamental research and quantitative analysis in creating the Fund’s portfolio. In applying the quantitative analysis, the Adviser considers a number of metrics that historically have provided some indication of favorable future returns, including metrics related to valuation, quality, investor behavior and corporate behavior.
Bernstein International Strategic Equities Portfolio and SCB International Portfolio focus on investing innon-USlarge-cap andmid-cap equity securities. Bernstein International Strategic Equities Portfolio follows a strategy similar to US Strategic Equities, but in the international context. In managing SCB International Portfolio, the Adviser selects stocks by drawing on the capabilities of its separate investment teams specializing in different investment disciplines, including value, growth, stability and others.
Fluctuations in currency exchange rates can have a dramatic impact on the returns of foreign equity securities. The Adviser may employ currency hedging strategies in the Fund or the Underlying Portfolios, including the use of currency-related derivatives, to seek to reduce currency risk in the Fund or the Underlying Portfolios, but it is not required to do so. The Fund is managed without regard to tax considerations.
| | |
| |
| 4 | AB WEALTH APPRECIATION STRATEGY | | abfunds.com |
DISCLOSURES AND RISKS
Benchmark Disclosure
The MSCI ACWI is unmanaged and does not reflect fees and expenses associated with the active management of a mutual fund portfolio. The MSCI ACWI (net, free float-adjusted, market capitalization weighted) represents the equity market performance of developed and emerging markets. MSCI makes no express or implied warranties or representations, and shall have no liability whatsoever with respect to any MSCI data contained herein. The MSCI data may not be further redistributed or used as a basis for other indices, any securities or financial products. This report is not approved, reviewed or produced by MSCI. Net returns include the reinvestment of dividends after deduction ofnon-US withholding tax. An investor cannot invest directly in an index or average, and their results are not indicative of the performance for any specific investment, including the Fund.
A Word About Risk
Market Risk: The value of the Fund’s assets will fluctuate as the stock, bond or commodities markets fluctuate. The value of its investments may decline, sometimes rapidly and unpredictably, simply because of economic changes or other events that affect large portions of the market. It includes the risk that a particular style of investing, such as growth or value, may be underperforming the stock market generally.
Foreign(Non-US) Risk: Investments in securities ofnon-US issuers may involve more risk than those of US issuers. These securities may fluctuate more widely in price and may be less liquid due to adverse market, economic, political, regulatory or other factors.
Currency Risk: Fluctuations in currency exchange rates may negatively affect the value of the Fund’s investments or reduce its returns.
Emerging-Market Risk: Investments in emerging-market countries may have more risk because the markets are less developed and less liquid as well as being subject to increased economic, political, regulatory or other uncertainties.
Capitalization Risk: Investments in small- andmid-capitalization companies may be more volatile than investments in large-capitalization companies. Investments insmall-andmid-capitalization companies may have additional risks because these companies have limited product lines, markets or financial resources.
Investment in Other Investment Companies Risk: As with other investments, investments in other investment companies are subject to market and selection risk. In addition, shareholders of the Fund bear both their proportionate share of expenses in the Fund (including management
| | |
| |
| abfunds.com | | AB WEALTH APPRECIATION STRATEGY | 5 |
DISCLOSURES AND RISKS(continued)
fees) and, indirectly, the expenses of the investment companies (to the extent these expenses are not waived or reimbursed by the Adviser).
Management Risk: The Fund is subject to management risk because it is an actively managed investment fund. The Adviser will apply its investment techniques and risk analyses in making investment decisions for the Fund, but there is no guarantee that its techniques will produce the intended results.
These risks are fully discussed in the Fund’s prospectus. As with all investments, you may lose money by investing in the Fund.
An Important Note About Historical Performance
The investment return and principal value of an investment in the Fund will fluctuate as the prices of the individual securities in which it invests fluctuate, so that your shares, when redeemed, may be worth more or less than their original cost. Performance shown in this report represents past performance and does not guarantee future results. Current performance may be lower or higher than the performance information shown. You may obtain performance information current to the most recentmonth-end by visiting www.abfunds.com. The performance shown for periods prior to July 14, 2017 is based on the Fund’s prior principal strategies and may not be representative of the Fund’s performance under its current principal strategies.
All fees and expenses related to the operation of the Fund have been deducted. Net asset value (“NAV”) returns do not reflect sales charges; if sales charges were reflected, the Fund’s quoted performance would be lower. SEC returns reflect the applicable sales charges for each share class: a 4.25% maximumfront-end sales charge for Class A shares; the applicable contingent deferred sales charge for Class B shares (4% year 1, 3% year 2, 2% year 3, 1% year 4) and a 1%1-year contingent deferred sales charge for Class C shares. Returns for the different share classes will vary due to different expenses associated with each class. Performance assumes reinvestment of distributions and does not account for taxes.
| | |
| |
| 6 | AB WEALTH APPRECIATION STRATEGY | | abfunds.com |
HISTORICAL PERFORMANCE
AVERAGE ANNUAL RETURNS AS OF FEBRUARY 28, 2019(unaudited)
| | | | | | | | |
| | |
| | | NAV Returns | | | SEC Returns
(reflects applicable
sales charges) | |
| | |
| CLASS A SHARES | | | | | | | | |
| | |
| 1 Year | | | -1.29% | | | | -5.52% | |
| | |
| 5 Years | | | 5.28% | | | | 4.38% | |
| | |
| 10 Years | | | 11.89% | | | | 11.40% | |
| | |
| CLASS B SHARES | | | | | | | | |
| | |
| 1 Year | | | -2.06% | | | | -5.88% | |
| | |
| 5 Years | | | 4.49% | | | | 4.49% | |
| | |
| 10 Years1 | | | 11.23% | | | | 11.23% | |
| | |
| CLASS C SHARES | | | | | | | | |
| | |
| 1 Year | | | -2.01% | | | | -2.97% | |
| | |
| 5 Years | | | 4.50% | | | | 4.50% | |
| | |
| 10 Years | | | 11.08% | | | | 11.08% | |
| | |
| ADVISOR CLASS SHARES2 | | | | | | | | |
| | |
| 1 Year | | | -1.01% | | | | -1.01% | |
| | |
| 5 Years | | | 5.56% | | | | 5.56% | |
| | |
| 10 Years | | | 12.21% | | | | 12.21% | |
| | |
| CLASS R SHARES2 | | | | | | | | |
| | |
| 1 Year | | | -1.73% | | | | -1.73% | |
| | |
| 5 Years | | | 4.82% | | | | 4.82% | |
| | |
| 10 Years | | | 11.46% | | | | 11.46% | |
| | |
| CLASS K SHARES2 | | | | | | | | |
| | |
| 1 Year | | | -1.47% | | | | -1.47% | |
| | |
| 5 Years | | | 5.15% | | | | 5.15% | |
| | |
| 10 Years | | | 11.80% | | | | 11.80% | |
| | |
| CLASS I SHARES2 | | | | | | | | |
| | |
| 1 Year | | | -1.06% | | | | -1.06% | |
| | |
| 5 Years | | | 5.50% | | | | 5.50% | |
| | |
| 10 Years | | | 12.18% | | | | 12.18% | |
The Fund’s current prospectus fee table shows the Fund’s total annual operating expense ratios as 1.41%, 2.18%, 2.17%, 1.16%, 1.87%, 1.56% and 1.23% for Class A, Class B, Class C, Advisor Class, Class R, Class K and Class I shares, respectively, gross of any fee waivers or expense reimbursements. Contractual fee waivers and/or expense reimbursement agreements reduced the Fund’s annual operating expense ratios to 1.04%, 1.81%, 1.79%, 0.79%, 1.49%, 1.18% and 0.85% for Class A, Class B, Class C, Advisor Class, Class R, Class K and Class I shares, respectively. These waivers/reimbursement agreements may not be terminated before December 31, 2019. Absent reimbursements or waivers, performance would have been lower. The net and gross expenses shown include the total operating expenses of the Fund and the indirect expenses of the Fund’s Underlying Portfolios, as based upon the allocation of the Fund’s assets among the Underlying Portfolios. The Financial Highlights section of this report sets forth expense ratio data for the current reporting period; the expense ratios shown above may differ from the expense ratios in the Financial Highlights section since they are based on different time periods.
(footnotes continued on next page)
| | |
| |
| abfunds.com | | AB WEALTH APPRECIATION STRATEGY | 7 |
HISTORICAL PERFORMANCE(continued)
| 1 | Assumes conversion of Class B shares into Class A shares after eight years. |
| 2 | These share classes are offered at NAV to eligible investors and their SEC returns are the same as their NAV returns. Please note that these share classes are for investors purchasing shares through accounts established under certainfee-based programs sponsored and maintained by certain broker-dealers and financial intermediaries, institutional pension plans and/or investment advisory clients of, and certain other persons associated with, the Adviser and its affiliates or the Fund. |
| | |
| |
| 8 | AB WEALTH APPRECIATION STRATEGY | | abfunds.com |
HISTORICAL PERFORMANCE(continued)
SEC AVERAGE ANNUAL RETURNS
AS OF THE MOST RECENT CALENDARQUARTER-END
MARCH 31, 2019(unaudited)
| | | | |
| |
| | | SEC Returns
(reflects applicable
sales charges) | |
| |
| CLASS A SHARES | | | | |
| |
| 1 Year | | | -3.11% | |
| |
| 5 Years | | | 4.56% | |
| |
| 10 Years | | | 10.57% | |
| |
| CLASS B SHARES | | | | |
| |
| 1 Year | | | -3.50% | |
| |
| 5 Years | | | 4.67% | |
| |
| 10 Years1 | | | 10.39% | |
| |
| CLASS C SHARES | | | | |
| |
| 1 Year | | | -0.55% | |
| |
| 5 Years | | | 4.67% | |
| |
| 10 Years | | | 10.24% | |
| |
| ADVISOR CLASS SHARES2 | | | | |
| |
| 1 Year | | | 1.41% | |
| |
| 5 Years | | | 5.73% | |
| |
| 10 Years | | | 11.35% | |
| |
| CLASS R SHARES2 | | | | |
| |
| 1 Year | | | 0.67% | |
| |
| 5 Years | | | 4.99% | |
| |
| 10 Years | | | 10.60% | |
| |
| CLASS K SHARES2 | | | | |
| |
| 1 Year | | | 1.00% | |
| |
| 5 Years | | | 5.32% | |
| |
| 10 Years | | | 10.95% | |
| |
| CLASS I SHARES2 | | | | |
| |
| 1 Year | | | 1.36% | |
| |
| 5 Years | | | 5.69% | |
| |
| 10 Years | | | 11.32% | |
| 1 | Assumes conversion of Class B shares into Class A shares after eight years. |
| 2 | Please note that these share classes are for investors purchasing shares through accounts established under certainfee-based programs sponsored and maintained by certain broker-dealers and financial intermediaries, institutional pension plans and/or investment advisory clients of, and certain other persons associated with, the Adviser and its affiliates or the Fund. |
| | |
| |
| abfunds.com | | AB WEALTH APPRECIATION STRATEGY | 9 |
EXPENSE EXAMPLE
(unaudited)
As a shareholder of the Fund, you incur two types of costs: (1) transaction costs, including sales charges (loads) on purchase payments, contingent deferred sales charges on redemptions and (2) ongoing costs, including management fees; distribution(12b-1) fees; and other Fund expenses. This example is intended to help you understand your ongoing costs (in dollars) of investing in the Fund and to compare these costs with the ongoing costs of investing in other mutual funds.
The Example is based on an investment of $1,000 invested at the beginning of the period and held for the entire period as indicated below.
Actual Expenses
The table below provides information about actual account values and actual expenses. You may use the information, together with the amount you invested, to estimate the expenses that you paid over the period. Simply divide your account value by $1,000 (for example, an $8,600 account value divided by $1,000 = 8.6), then multiply the result by the number under the heading entitled “Expenses Paid During Period” to estimate the expenses you paid on your account during this period.
Hypothetical Example for Comparison Purposes
The table below also provides information about hypothetical account values and hypothetical expenses based on the Fund’s actual expense ratio and an assumed annual rate of return of 5% before expenses, which is not the Fund’s actual return. The hypothetical account values and expenses may not be used to estimate the actual ending account balance or expenses you paid for the period. You may use this information to compare the ongoing costs of investing in the Fund and other funds by comparing this 5% hypothetical example with the 5% hypothetical examples that appear in the shareholder reports of other funds.
Please note that the expenses shown in the table are meant to highlight your ongoing costs only and do not reflect any transactional costs, such as sales charges (loads), or contingent deferred sales charges on redemptions. Therefore, the hypothetical example is useful in comparing ongoing costs only, and will not help you determine the relative total costs of owning different funds. In addition, if these transactional costs were included, your costs would have been higher.
| | |
| |
| 10 | AB WEALTH APPRECIATION STRATEGY | | abfunds.com |
EXPENSE EXAMPLE(continued)
| | | | | | | | | | | | | | | | | | | | | | | | |
| | | Beginning
Account
Value
September 1,
2018 | | | Ending
Account
Value
February 28,
2019 | | | Expenses
Paid
During
Period* | | | Annualized
Expense
Ratio* | | | Total
Expenses
Paid
During
Period+ | | | Total
Annualized
Expense
Ratio+ | |
| Class A | | | | | | | | | | | | | | | | | | | | | | | | |
Actual | | $ | 1,000 | | | $ | 962.10 | | | $ | 3.11 | | | | 0.64 | % | | $ | 5.01 | | | | 1.03 | % |
Hypothetical** | | $ | 1,000 | | | $ | 1,021.62 | | | $ | 3.21 | | | | 0.64 | % | | $ | 5.16 | | | | 1.03 | % |
| Class B | | | | | | | | | | | | | | | | | | | | | | | | |
Actual | | $ | 1,000 | | | $ | 958.30 | | | $ | 6.89 | | | | 1.42 | % | | $ | 8.79 | | | | 1.81 | % |
Hypothetical** | | $ | 1,000 | | | $ | 1,017.75 | | | $ | 7.10 | | | | 1.42 | % | | $ | 9.05 | | | | 1.81 | % |
| Class C | | | | | | | | | | | | | | | | | | | | | | | | |
Actual | | $ | 1,000 | | | $ | 959.00 | | | $ | 6.80 | | | | 1.40 | % | | $ | 8.69 | | | | 1.79 | % |
Hypothetical** | | $ | 1,000 | | | $ | 1,017.85 | | | $ | 7.00 | | | | 1.40 | % | | $ | 8.95 | | | | 1.79 | % |
| Advisor Class | | | | | | | | | | | | | | | | | | | | | | | | |
Actual | | $ | 1,000 | | | $ | 963.60 | | | $ | 1.90 | | | | 0.39 | % | | $ | 3.80 | | | | 0.78 | % |
Hypothetical** | | $ | 1,000 | | | $ | 1,022.86 | | | $ | 1.96 | | | | 0.39 | % | | $ | 3.91 | | | | 0.78 | % |
| Class R | | | | | | | | | | | | | | | | | | | | | | | | |
Actual | | $ | 1,000 | | | $ | 960.50 | | | $ | 5.30 | | | | 1.09 | % | | $ | 7.19 | | | | 1.48 | % |
Hypothetical** | | $ | 1,000 | | | $ | 1,019.39 | | | $ | 5.46 | | | | 1.09 | % | | $ | 7.40 | | | | 1.48 | % |
| Class K | | | | | | | | | | | | | | | | | | | | | | | | |
Actual | | $ | 1,000 | | | $ | 961.30 | | | $ | 3.84 | | | | 0.79 | % | | $ | 5.74 | | | | 1.18 | % |
Hypothetical** | | $ | 1,000 | | | $ | 1,020.88 | | | $ | 3.96 | | | | 0.79 | % | | $ | 5.91 | | | | 1.18 | % |
| Class I | | | | | | | | | | | | | | | | | | | | | | | | |
Actual | | $ | 1,000 | | | $ | 963.20 | | | $ | 2.24 | | | | 0.46 | % | | $ | 4.14 | | | | 0.85 | % |
Hypothetical** | | $ | 1,000 | | | $ | 1,022.51 | | | $ | 2.31 | | | | 0.46 | % | | $ | 4.26 | | | | 0.85 | % |
| * | Expenses are equal to the classes’ annualized expense ratios, multiplied by the average account value over the period, multiplied by 181/365 (to reflect theone-half year period). |
| ** | Assumes 5% annual return before expenses. |
| + | In connection with the Fund’s investments in affiliated/unaffiliated underlying portfolios, the Fund incurs no direct expenses, but bears proportionate shares of the fees and expenses (i.e., operating, administrative and investment advisory fees) of the affiliated/unaffiliated underlying portfolios. The Adviser has contractually agreed to waive its fees from the Fund in an amount equal to the Fund’s pro rata share of certain acquired fund fees and expenses of the affiliated underlying portfolios. The Fund’s total expenses are equal to the classes’ annualized expense ratio plus the Fund’s pro rata share of the weighted average expense ratio of the affiliated/unaffiliated underlying portfolios in which it invests, multiplied by the average account value over the period, multiplied by 181/365 (to reflect theone-half year period). |
| | |
| |
| abfunds.com | | AB WEALTH APPRECIATION STRATEGY | 11 |
PORTFOLIO SUMMARY
February 28, 2019(unaudited)
PORTFOLIO STATISTICS
Net Assets ($mil): $1,283.4
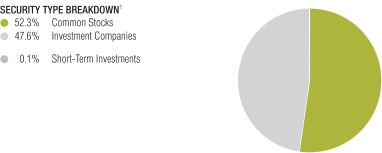
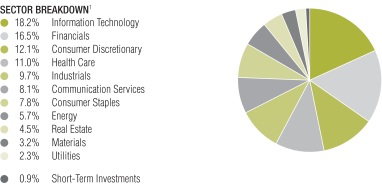
| 1 | All data are as of February 28, 2019. The Fund’s security type and sector breakdowns are expressed as a percentage of total investments and may vary over time. The Fund also enters into derivative transactions, which may be used for hedging or investment purposes (see “Portfolio of Investments” section of the report for additional details). Sectors shown include investments of Underlying Portfolios. |
Please note: The sector classifications presented herein are based on the Global Industry Classification Standard (GICS) which was developed by Morgan Stanley Capital International and Standard & Poor’s. The components are divided into sector, industry group, and industrysub-indices as classified by the GICS for each of the market capitalization indices in the broad market. These sector classifications are broadly defined. The “Portfolio of Investments” section of the report reflects more specific industry information and is consistent with the investment restrictions discussed in the Fund’s prospectus.
| | |
| |
| 12 | AB WEALTH APPRECIATION STRATEGY | | abfunds.com |
PORTFOLIO OF INVESTMENTS
February 28, 2019(unaudited)
| | | | | | | | |
| Company | | Shares | | | U.S. $ Value | |
| |
COMMON STOCKS – 52.2% | | | | | | | | |
Information Technology – 12.2% | | | | | | | | |
Communications Equipment – 1.0% | | | | | | | | |
Cisco Systems, Inc. | | | 159,042 | | | $ | 8,233,604 | |
Nokia Oyj (Sponsored ADR) – Class A | | | 833,649 | | | | 5,076,923 | |
| | | | | | | | |
| | | | | | | 13,310,527 | |
| | | | | | | | |
Electronic Equipment, Instruments & Components – 0.3% | | | | | | | | |
CDW Corp./DE | | | 43,091 | | | | 4,045,814 | |
| | | | | | | | |
| | |
IT Services – 3.2% | | | | | | | | |
Automatic Data Processing, Inc. | | | 36,575 | | | | 5,597,072 | |
Cognizant Technology Solutions Corp. – Class A | | | 66,505 | | | | 4,720,525 | |
Fidelity National Information Services, Inc. | | | 55,432 | | | | 5,994,971 | |
PayPal Holdings, Inc.(a) | | | 53,793 | | | | 5,275,479 | |
Total System Services, Inc. | | | 55,711 | | | | 5,259,118 | |
Visa, Inc. – Class A | | | 94,346 | | | | 13,974,530 | |
| | | | | | | | |
| | | | | | | 40,821,695 | |
| | | | | | | | |
Semiconductors & Semiconductor Equipment – 1.3% | | | | | | | | |
Texas Instruments, Inc. | | | 76,012 | | | | 8,040,549 | |
Xilinx, Inc. | | | 68,923 | | | | 8,636,052 | |
| | | | | | | | |
| | | | | | | 16,676,601 | |
| | | | | | | | |
Software – 4.0% | | | | | | | | |
Adobe, Inc.(a) | | | 25,408 | | | | 6,669,600 | |
Check Point Software Technologies Ltd.(a) | | | 27,544 | | | | 3,368,631 | |
Microsoft Corp. | | | 232,255 | | | | 26,019,528 | |
Oracle Corp. | | | 200,938 | | | | 10,474,898 | |
VMware, Inc. – Class A | | | 27,953 | | | | 4,802,605 | |
| | | | | | | | |
| | | | | | | 51,335,262 | |
| | | | | | | | |
Technology Hardware, Storage & Peripherals – 2.4% | | | | | | | | |
Apple, Inc. | | | 116,302 | | | | 20,137,691 | |
HP, Inc. | | | 186,255 | | | | 3,674,811 | |
Xerox Corp. | | | 204,756 | | | | 6,326,961 | |
| | | | | | | | |
| | | | | | | 30,139,463 | |
| | | | | | | | |
| | | | | | | 156,329,362 | |
| | | | | | | | |
Financials – 7.8% | | | | | | | | |
Banks – 3.6% | | | | | | | | |
Bank of America Corp. | | | 468,784 | | | | 13,632,239 | |
Citigroup, Inc. | | | 127,171 | | | | 8,136,400 | |
JPMorgan Chase & Co. | | | 130,400 | | | | 13,608,544 | |
Wells Fargo & Co. | | | 224,718 | | | | 11,211,181 | |
| | | | | | | | |
| | | | | | | 46,588,364 | |
| | | | | | | | |
| | |
| |
| abfunds.com | | AB WEALTH APPRECIATION STRATEGY | 13 |
PORTFOLIO OF INVESTMENTS(continued)
| | | | | | | | |
| Company | | Shares | | | U.S. $ Value | |
| |
Capital Markets – 0.9% | | | | | | | | |
Goldman Sachs Group, Inc. (The) | | | 33,593 | | | $ | 6,607,743 | |
S&P Global, Inc. | | | 21,403 | | | | 4,288,519 | |
| | | | | | | | |
| | | | | | | 10,896,262 | |
| | | | | | | | |
Consumer Finance – 0.4% | | | | | | | | |
Synchrony Financial | | | 161,887 | | | | 5,279,135 | |
| | | | | | | | |
| | |
Diversified Financial Services – 1.1% | | | | | | | | |
Berkshire Hathaway, Inc. – Class B(a) | | | 70,776 | | | | 14,247,209 | |
| | | | | | | | |
| | |
Insurance – 1.8% | | | | | | | | |
Everest Re Group Ltd. | | | 40,699 | | | | 9,202,451 | |
Fidelity National Financial, Inc. | | | 172,473 | | | | 6,052,077 | |
Progressive Corp. (The) | | | 102,964 | | | | 7,506,076 | |
| | | | | | | | |
| | | | | | | 22,760,604 | |
| | | | | | | | |
| | | | | | | 99,771,574 | |
| | | | | | | | |
Health Care – 6.3% | | | | | | | | |
Biotechnology – 1.4% | | | | | | | | |
Biogen, Inc.(a) | | | 21,638 | | | | 7,097,480 | |
Gilead Sciences, Inc. | | | 115,286 | | | | 7,495,896 | |
Vertex Pharmaceuticals, Inc.(a) | | | 18,484 | | | | 3,488,855 | |
| | | | | | | | |
| | | | | | | 18,082,231 | |
| | | | | | | | |
Health Care Equipment & Supplies – 0.8% | | | | | | | | |
Edwards Lifesciences Corp.(a) | | | 31,316 | | | | 5,301,486 | |
Medtronic PLC | | | 56,736 | | | | 5,134,608 | |
| | | | | | | | |
| | | | | | | 10,436,094 | |
| | | | | | | | |
Health Care Providers & Services – 1.6% | | | | | | | | |
Anthem, Inc. | | | 26,967 | | | | 8,109,786 | |
UnitedHealth Group, Inc. | | | 51,610 | | | | 12,500,974 | |
| | | | | | | | |
| | | | | | | 20,610,760 | |
| | | | | | | | |
Pharmaceuticals – 2.5% | | | | | | | | |
Merck & Co., Inc. | | | 111,219 | | | | 9,040,992 | |
Pfizer, Inc. | | | 314,914 | | | | 13,651,522 | |
Teva Pharmaceutical Industries Ltd. (Sponsored ADR)(a) | | | 169,634 | | | | 2,854,940 | |
Zoetis, Inc. | | | 72,721 | | | | 6,852,500 | |
| | | | | | | | |
| | | | | | | 32,399,954 | |
| | | | | | | | |
| | | | | | | 81,529,039 | |
| | | | | | | | |
Consumer Discretionary – 6.2% | | | | | | | | |
Auto Components – 0.6% | | | | | | | | |
Magna International, Inc. – Class A | | | 143,496 | | | | 7,566,544 | |
| | | | | | | | |
| | |
Hotels, Restaurants & Leisure – 0.4% | | | | | | | | |
McDonald’s Corp. | | | 29,366 | | | | 5,398,645 | |
| | | | | | | | |
| | |
| |
| 14 | AB WEALTH APPRECIATION STRATEGY | | abfunds.com |
PORTFOLIO OF INVESTMENTS(continued)
| | | | | | | | |
| Company | | Shares | | | U.S. $ Value | |
| |
Internet & Direct Marketing Retail – 0.4% | | | | | | | | |
Booking Holdings, Inc.(a) | | | 2,612 | | | $ | 4,432,669 | |
| | | | | | | | |
| | |
Multiline Retail – 0.6% | | | | | | | | |
Dollar General Corp. | | | 60,214 | | | | 7,132,951 | |
| | | | | | | | |
| | |
Specialty Retail – 3.4% | | | | | | | | |
AutoZone, Inc.(a) | | | 9,139 | | | | 8,581,247 | |
Home Depot, Inc. (The) | | | 70,232 | | | | 13,002,752 | |
Ross Stores, Inc. | | | 86,983 | | | | 8,248,598 | |
TJX Cos., Inc. (The) | | | 209,941 | | | | 10,767,874 | |
Ulta Salon Cosmetics & Fragrance, Inc.(a) | | | 11,233 | | | | 3,510,200 | |
| | | | | | | | |
| | | | | | | 44,110,671 | |
| | | | | | | | |
Textiles, Apparel & Luxury Goods – 0.8% | | | | | | | | |
NIKE, Inc. – Class B | | | 123,504 | | | | 10,587,998 | |
| | | | | | | | |
| | | | | | | 79,229,478 | |
| | | | | | | | |
Communication Services – 6.0% | | | | | | | | |
Diversified Telecommunication Services – 0.8% | | | | | | | | |
Verizon Communications, Inc. | | | 169,402 | | | | 9,642,362 | |
| | | | | | | | |
| | |
Entertainment – 0.6% | | | | | | | | |
Walt Disney Co. (The) | | | 73,535 | | | | 8,297,689 | |
| | | | | | | | |
| | |
Interactive Media & Services – 3.1% | | | | | | | | |
Alphabet, Inc. – Class C(a) | | | 23,513 | | | | 26,332,679 | |
Facebook, Inc. – Class A(a) | | | 82,367 | | | | 13,298,152 | |
| | | | | | | | |
| | | | | | | 39,630,831 | |
| | | | | | | | |
Media – 1.1% | | | | | | | | |
Comcast Corp. – Class A | | | 373,034 | | | | 14,425,225 | |
| | | | | | | | |
| | |
Wireless Telecommunication Services – 0.4% | | | | | | | | |
T-Mobile US, Inc.(a) | | | 65,305 | | | | 4,715,674 | |
| | | | | | | | |
| | | | | | | 76,711,781 | |
| | | | | | | | |
Consumer Staples – 3.8% | | | | | | | | |
Beverages – 0.7% | | | | | | | | |
PepsiCo, Inc. | | | 77,143 | | | | 8,920,816 | |
| | | | | | | | |
| | |
Food & Staples Retailing – 1.8% | | | | | | | | |
Costco Wholesale Corp. | | | 34,853 | | | | 7,623,745 | |
US Foods Holding Corp.(a) | | | 179,767 | | | | 6,334,989 | |
Walmart, Inc. | | | 98,673 | | | | 9,767,641 | |
| | | | | | | | |
| | | | | | | 23,726,375 | |
| | | | | | | | |
Household Products – 0.8% | | | | | | | | |
Procter & Gamble Co. (The) | | | 99,221 | | | | 9,778,229 | |
| | | | | | | | |
| | |
| |
| abfunds.com | | AB WEALTH APPRECIATION STRATEGY | 15 |
PORTFOLIO OF INVESTMENTS(continued)
| | | | | | | | |
| Company | | Shares | | | U.S. $ Value | |
| |
Tobacco – 0.5% | | | | | | | | |
Altria Group, Inc. | | | 131,048 | | | $ | 6,868,226 | |
| | | | | | | | |
| | | | | | | 49,293,646 | |
| | | | | | | | |
Industrials – 3.3% | | | | | | | | |
Aerospace & Defense – 1.7% | | | | | | | | |
Boeing Co. (The) | | | 22,748 | | | | 10,008,210 | |
Northrop Grumman Corp. | | | 12,020 | | | | 3,485,319 | |
Raytheon Co. | | | 44,779 | | | | 8,351,284 | |
| | | | | | | | |
| | | | | | | 21,844,813 | |
| | | | | | | | |
Airlines – 0.4% | | | | | | | | |
Delta Air Lines, Inc. | | | 103,073 | | | | 5,110,359 | |
| | | | | | | | |
| | |
Industrial Conglomerates – 0.7% | | | | | | | | |
Honeywell International, Inc. | | | 59,772 | | | | 9,209,072 | |
| | | | | | | | |
| | |
Road & Rail – 0.5% | | | | | | | | |
Norfolk Southern Corp. | | | 36,252 | | | | 6,499,984 | |
| | | | | | | | |
| | | | | | | 42,664,228 | |
| | | | | | | | |
Real Estate – 2.6% | | | | | | | | |
Equity Real Estate Investment Trusts (REITs) – 2.1% | | | | | | | | |
CubeSmart | | | 206,631 | | | | 6,331,174 | |
Mid-America Apartment Communities, Inc. | | | 110,107 | | | | 11,404,883 | |
Regency Centers Corp. | | | 136,764 | | | | 8,923,851 | |
| | | | | | | | |
| | | | | | | 26,659,908 | |
| | | | | | | | |
Real Estate Management & Development – 0.5% | | | | | | | | |
CBRE Group, Inc. – Class A(a) | | | 137,613 | | | | 6,847,623 | |
| | | | | | | | |
| | | | | | | 33,507,531 | |
| | | | | | | | |
Energy – 2.6% | | | | | | | | |
Energy Equipment & Services – 0.3% | | | | | | | | |
National Oilwell Varco, Inc. | | | 115,759 | | | | 3,257,458 | |
| | | | | | | | |
| | |
Oil, Gas & Consumable Fuels – 2.3% | | | | | | | | |
Chevron Corp. | | | 75,009 | | | | 8,969,576 | |
EOG Resources, Inc. | | | 58,608 | | | | 5,509,152 | |
Exxon Mobil Corp. | | | 62,276 | | | | 4,921,673 | |
Marathon Petroleum Corp. | | | 41,193 | | | | 2,554,378 | |
Royal Dutch Shell PLC (Sponsored ADR) | | | 125,787 | | | | 8,001,311 | |
| | | | | | | | |
| | | | | | | 29,956,090 | |
| | | | | | | | |
| | | | | | | 33,213,548 | |
| | | | | | | | |
Utilities – 1.2% | | | | | | | | |
Electric Utilities – 0.7% | | | | | | | | |
American Electric Power Co., Inc. | | | 108,228 | | | | 8,782,702 | |
| | | | | | | | |
| | |
Multi-Utilities – 0.5% | | | | | | | | |
NiSource, Inc. | | | 262,848 | | | | 7,091,639 | |
| | | | | | | | |
| | | | | | | 15,874,341 | |
| | | | | | | | |
| | |
| |
| 16 | AB WEALTH APPRECIATION STRATEGY | | abfunds.com |
PORTFOLIO OF INVESTMENTS(continued)
| | | | | | | | |
| Company | | Shares | | | U.S. $ Value | |
| |
Materials – 0.2% | | | | | | | | |
Chemicals – 0.2% | | | | | | | | |
Westlake Chemical Corp. | | | 28,124 | | | $ | 1,965,024 | |
| | | | | | | | |
| | |
Total Common Stocks
(cost $584,037,492) | | | | | | | 670,089,552 | |
| | | | | | | | |
| | | | | | | | |
INVESTMENT COMPANIES – 47.6% | | | | | | | | |
Funds and Investment Trusts – 47.6%(b)(c) | | | | | | | | |
AB Discovery Growth Fund, Inc. – Class Z | | | 2,705,846 | | | | 30,873,707 | |
AB Trust – AB Discovery Value Fund, Inc. – Class Z | | | 1,608,573 | | | | 31,463,690 | |
Bernstein Fund, Inc. – International Small Cap Portfolio – Class Z | | | 7,411,775 | | | | 77,749,517 | |
Bernstein Fund, Inc. – International Strategic Equities Portfolio – Class Z | | | 22,071,111 | | | | 255,362,759 | |
Bernstein Fund, Inc. – Small Cap Core Portfolio – Class Z | | | 3,211,336 | | | | 35,549,491 | |
Sanford C. Bernstein Fund, Inc. – Emerging Markets Portfolio – Class Z | | | 1,371,251 | | | | 35,940,486 | |
Sanford C. Bernstein Fund, Inc. – International Portfolio – Class Z | | | 9,351,197 | | | | 143,821,407 | |
| | | | | | | | |
| | |
Total Investment Companies
(cost $659,965,114) | | | | | | | 610,761,057 | |
| | | | | | | | |
| | | | | | | | |
SHORT-TERM INVESTMENTS – 0.1% | | | | | | | | |
Investment Companies – 0.1% | | | | | | | | |
AB Fixed Income Shares, Inc. – Government Money Market Portfolio – Class AB, 2.35%(b)(c)(d)
(cost $1,282,743) | | | 1,282,743 | | | | 1,282,743 | |
| | | | | | | | |
| | |
Total Investments – 99.9%
(cost $1,245,285,349) | | | | | | | 1,282,133,352 | |
Other assets less liabilities – 0.1% | | | | | | | 1,284,362 | |
| | | | | | | | |
| | |
Net Assets – 100.0% | | | | | | $ | 1,283,417,714 | |
| | | | | | | | |
| (a) | Non-income producing security. |
| (b) | To obtain a copy of the fund’s shareholder report, please go to the Securities and Exchange Commission’s website at www.sec.gov, or call AB at(800) 227-4618. |
| (c) | Affiliated investments. |
| (d) | The rate shown represents the7-day yield as of period end. |
Glossary:
ADR – American Depositary Receipt
See notes to financial statements.
| | |
| |
| abfunds.com | | AB WEALTH APPRECIATION STRATEGY | 17 |
STATEMENT OF ASSETS & LIABILITIES
February 28, 2019(unaudited)
| | | | |
| Assets | | | | |
Investments in securities, at value | | | | |
Unaffiliated issuers (cost $584,037,492) | | $ | 670,089,552 | |
Affiliated issuers (cost $661,247,857) | | | 612,043,800 | |
Receivable for shares of beneficial interest sold | | | 1,867,436 | |
Unaffiliated dividends receivable | | | 1,443,388 | |
Affiliated dividends receivable | | | 7,204 | |
Other assets | | | 254,287 | |
| | | | |
Total assets | | | 1,285,705,667 | |
| | | | |
| Liabilities | | | | |
Payable for shares of beneficial interest redeemed | | | 1,671,386 | |
Advisory fee payable | | | 274,596 | |
Distribution fee payable | | | 98,527 | |
Transfer Agent fee payable | | | 94,797 | |
Administrative fee payable | | | 29,864 | |
Trustees’ fees payable | | | 6,297 | |
Accrued expenses | | | 112,486 | |
| | | | |
Total liabilities | | | 2,287,953 | |
| | | | |
Net Assets | | $ | 1,283,417,714 | |
| | | | |
| Composition of Net Assets | | | | |
Shares of beneficial interest, at par | | $ | 815 | |
Additionalpaid-in capital | | | 1,221,248,618 | |
Distributable earnings | | | 62,168,281 | |
| | | | |
| | $ | 1,283,417,714 | |
| | | | |
| | | | | | | | | | | | |
Net Asset Value Per Share—unlimited shares authorized, $.00001 par value | |
| Class | | Net Assets | | | Shares
Outstanding | | | Net Asset
Value | |
| |
| A | | $ | 359,295,032 | | | | 22,766,733 | | | $ | 15.78 | * |
| |
| B | | $ | 4,444,677 | | | | 277,215 | | | $ | 16.03 | |
| |
| C | | $ | 30,183,896 | | | | 1,906,787 | | | $ | 15.83 | |
| |
| Advisor | | $ | 875,464,578 | | | | 55,658,741 | | | $ | 15.73 | |
| |
| R | | $ | 2,765,087 | | | | 176,154 | | | $ | 15.70 | |
| |
| K | | $ | 10,888,983 | | | | 694,301 | | | $ | 15.68 | |
| |
| I | | $ | 375,461 | | | | 23,843 | | | $ | 15.75 | |
| |
| * | The maximum offering price per share for Class A shares was $16.48 which reflects a sales charge of 4.25%. |
See notes to financial statements.
| | |
| |
| 18 | AB WEALTH APPRECIATION STRATEGY | | abfunds.com |
STATEMENT OF OPERATIONS
Six Months Ended February 28, 2019(unaudited)
| | | | | | | | |
| Investment Income | | | | | | | | |
Dividends | | | | | | | | |
Unaffiliated issuers (net of foreign taxes withheld of $8,543) | | $ | 6,753,478 | | | | | |
Affiliated issuers | | | 12,480,627 | | | $ | 19,234,105 | |
| | | | | | | | |
| Expenses | | | | | | | | |
Advisory fee (see Note B) | | | 4,110,849 | | | | | |
Distribution fee—Class A | | | 447,254 | | | | | |
Distribution fee—Class B | | | 23,002 | | | | | |
Distribution fee—Class C | | | 159,272 | | | | | |
Distribution fee—Class R | | | 6,753 | | | | | |
Distribution fee—Class K | | | 13,547 | | | | | |
Transfer agency—Class A | | | 103,738 | | | | | |
Transfer agency—Class B | | | 2,007 | | | | | |
Transfer agency—Class C | | | 10,218 | | | | | |
Transfer agency—Advisor Class | | | 248,494 | | | | | |
Transfer agency—Class R | | | 3,511 | | | | | |
Transfer agency—Class K | | | 10,837 | | | | | |
Transfer agency—Class I | | | 209 | | | | | |
Custodian | | | 87,917 | | | | | |
Registration fees | | | 49,041 | | | | | |
Printing | | | 44,198 | | | | | |
Administrative | | | 35,849 | | | | | |
Audit and tax | | | 31,062 | | | | | |
Legal | | | 22,226 | | | | | |
Trustees’ fees | | | 12,443 | | | | | |
Miscellaneous | | | 34,441 | | | | | |
| | | | | | | | |
Total expenses | | | 5,456,868 | | | | | |
Less: expenses waived and reimbursed by the Adviser (see Note B) | | | (2,308,786 | ) | | | | |
| | | | | | | | |
Net expenses | | | | | | | 3,148,082 | |
| | | | | | | | |
Net investment income | | | | | | | 16,086,023 | |
| | | | | | | | |
| Realized and Unrealized Gain (Loss) on Investment and Foreign Currency Transactions | | | | | | | | |
Net realized gain (loss) on: | | | | | | | | |
Affiliated Underlying Portfolios | | | | | | | (2,599,053 | ) |
Investment transactions | | | | | | | 13,304,370 | |
Foreign currency transactions | | | | | | | (1,678 | ) |
Net realized gain distributions from Affiliated Underlying Portfolios | | | | | | | 21,976,450 | |
Net change in unrealized appreciation/depreciation of: | | | | | | | | |
Affiliated Underlying Portfolios | | | | | | | (72,809,907 | ) |
Investments | | | | | | | (28,813,883 | ) |
Foreign currency denominated assets and liabilities | | | | | | | (6,937 | ) |
| | | | | | | | |
Net loss on investment and foreign currency transactions | | | | | | | (68,950,638 | ) |
| | | | | | | | |
Net Decrease in Net Assets from Operations | | | | | | $ | (52,864,615 | ) |
| | | | | | | | |
See notes to financial statements.
| | |
| |
| abfunds.com | | AB WEALTH APPRECIATION STRATEGY | 19 |
STATEMENT OF CHANGES IN NET ASSETS
| | | | | | | | |
| | | Six Months Ended
February 28, 2019
(unaudited) | | | Year Ended
August 31,
2018 | |
| Increase (Decrease) in Net Assets from Operations | | | | | | | | |
Net investment income | | $ | 16,086,023 | | | $ | 15,751,393 | |
Net realized gain on investment transactions | | | 10,703,639 | | | | 23,038,363 | |
Net realized gain distributions from Affiliated Underlying Portfolios | | | 21,976,450 | | | | 9,647,870 | |
Net change in unrealized appreciation/depreciation of investments and foreign currency denominated assets and liabilities | | | (101,630,727 | ) | | | 110,697,165 | |
| | | | | | | | |
Net increase (decrease) in net assets from operations | | | (52,864,615 | ) | | | 159,134,791 | |
Distributions to Shareholders* | | | | | | | | |
Class A | | | (11,667,972 | ) | | | (28,092,533 | ) |
Class B | | | (99,672 | ) | | | (421,748 | ) |
Class C | | | (702,562 | ) | | | (3,132,825 | ) |
Advisor Class | | | (30,308,404 | ) | | | (65,093,082 | ) |
Class R | | | (74,708 | ) | | | (225,749 | ) |
Class K | | | (339,831 | ) | | | (937,951 | ) |
Class I | | | (11,828 | ) | | | (54,682 | ) |
| Transactions in Shares of Beneficial Interest | | | | | | | | |
Net decrease | | | (3,969,874 | ) | | | (760,385 | ) |
| | | | | | | | |
Total increase (decrease) | | | (100,039,466 | ) | | | 60,415,836 | |
| Net Assets | | | | | | | | |
Beginning of period | | | 1,383,457,180 | | | | 1,323,041,344 | |
| | | | | | | | |
End of period | | $ | 1,283,417,714 | | | $ | 1,383,457,180 | |
| | | | | | | | |
| * | The prior year’s amounts have been reclassified to conform with the current year’s presentation. See Note I, Recent Accounting Pronouncements, in the Notes to Financial Statements for more information. |
See notes to financial statements.
| | |
| |
| 20 | AB WEALTH APPRECIATION STRATEGY | | abfunds.com |
NOTES TO FINANCIAL STATEMENTS
February 28, 2019(unaudited)
NOTE A
Significant Accounting Policies
The AB Portfolios (the “Company”) was organized as a Massachusetts Business Trust on March 26, 1987 and is registered under the Investment Company Act of 1940 as a diversified, open end management investment company. The Company operates as a series company currently comprised of six series. Each series is considered to be a separate entity for financial reporting and tax purposes. This report relates only to the AB Wealth Appreciation Strategy (the “Fund”). The Fund offers Class A, Class B, Class C, Advisor Class, Class R, Class K and Class I shares. Class T shares have been authorized but currently are not offered. Class A shares are sold with afront-end sales charge of up to 4.25% for purchases not exceeding $1,000,000. With respect to purchases of $1,000,000 or more, Class A shares redeemed within one year of purchase may be subject to a contingent deferred sales charge of 1%. Class B shares are currently sold with a contingent deferred sales charge which declines from 4% to 0% depending on the period of time the shares are held. Effective January 31, 2009, sales of Class B shares of the Fund to new investors were suspended. Class B shares will only be issued (i) upon the exchange of Class B shares from another AB mutual fund, (ii) for purposes of dividend reinvestment, (iii) through the Fund’s Automatic Investment Program (the “Program”) for accounts that established the Program prior to January 31, 2009, and (iv) for purchases of additional shares by Class B shareholders as of January 31, 2009. The ability to establish a new Program for accounts containing Class B shares was suspended as of January 31, 2009. Class B shares will automatically convert to Class A shares eight years after the end of the calendar month of purchase. Class C shares are subject to a contingent deferred sales charge of 1% on redemptions made within the first year after purchase, and 0% after the first year of purchase. Class C shares will automatically convert to Class A shares ten years after the end of the calendar month of purchase. Class R and Class K shares are sold without an initial or contingent deferred sales charge. Advisor Class and Class I shares are sold without an initial or contingent deferred sales charge and are not subject to ongoing distribution expenses. All eight classes of shares have identical voting, dividend, liquidation and other rights, except that the classes bear different distribution and transfer agency expenses. Each class has exclusive voting rights with respect to its distribution plan. The financial statements have been prepared in conformity with U.S. generally accepted accounting principles (“U.S. GAAP”) which require management to make certain estimates and assumptions that affect the reported amounts of assets and liabilities in the financial statements and amounts of income and expenses during the reporting period. Actual results could differ from those estimates. The Fund is an investment company under U.S. GAAP
| | |
| |
| abfunds.com | | AB WEALTH APPRECIATION STRATEGY | 21 |
NOTES TO FINANCIAL STATEMENTS(continued)
and follows the accounting and reporting guidance applicable to investment companies. The following is a summary of significant accounting policies followed by the Fund.
1. Security Valuation
Portfolio securities are valued at their current market value determined on the basis of market quotations or, if market quotations are not readily available or are deemed unreliable, at “fair value” as determined in accordance with procedures established by and under the general supervision of the Company’s Board of Trustees (the “Board”).
In general, the market values of securities which are readily available and deemed reliable are determined as follows: securities listed on a national securities exchange (other than securities listed on the NASDAQ Stock Market, Inc. (“NASDAQ”)) or on a foreign securities exchange are valued at the last sale price at the close of the exchange or foreign securities exchange. If there has been no sale on such day, the securities are valued at the last traded price from the previous day. Securities listed on more than one exchange are valued by reference to the principal exchange on which the securities are traded; securities listed only on NASDAQ are valued in accordance with the NASDAQ Official Closing Price; listed or over the counter (“OTC”) market put or call options are valued at the mid level between the current bid and ask prices. If either a current bid or current ask price is unavailable, AllianceBernstein L.P. (the “Adviser”) will have discretion to determine the best valuation (e.g., last trade price in the case of listed options); open futures are valued using the closing settlement price or, in the absence of such a price, the most recent quoted bid price. If there are no quotations available for the day of valuation, the last available closing settlement price is used; U.S. Government securities and any other debt instruments having 60 days or less remaining until maturity are generally valued at market by an independent pricing vendor, if a market price is available. If a market price is not available, the securities are valued at amortized cost. This methodology is commonly used for short term securities that have an original maturity of 60 days or less, as well as short term securities that had an original term to maturity that exceeded 60 days. In instances when amortized cost is utilized, the Valuation Committee (the “Committee”) must reasonably conclude that the utilization of amortized cost is approximately the same as the fair value of the security. Such factors the Committee will consider include, but are not limited to, an impairment of the creditworthiness of the issuer or material changes in interest rates. Fixed-income securities, including mortgage-backed and asset-backed securities, may be valued on the basis of prices provided by a pricing service or at a price obtained from one or more of the major broker-dealers. In cases where broker-dealer quotes are obtained, the Adviser may establish procedures whereby changes in market yields or spreads are used to adjust, on a daily basis, a recently obtained quoted
| | |
| |
| 22 | AB WEALTH APPRECIATION STRATEGY | | abfunds.com |
NOTES TO FINANCIAL STATEMENTS(continued)
price on a security. Swaps and other derivatives are valued daily, primarily using independent pricing services, independent pricing models using market inputs, as well as third party broker-dealers or counterparties. Open end mutual funds are valued at the closing net asset value per share, while exchange traded funds are valued at the closing market price per share.
Securities for which market quotations are not readily available (including restricted securities) or are deemed unreliable are valued at fair value as deemed appropriate by the Adviser. Factors considered in making this determination may include, but are not limited to, information obtained by contacting the issuer, analysts, analysis of the issuer’s financial statements or other available documents. In addition, the Fund may use fair value pricing for securities primarily traded innon-U.S. markets because most foreign markets close well before the Fund values its securities at 4:00 p.m., Eastern Time. The earlier close of these foreign markets gives rise to the possibility that significant events, including broad market moves, may have occurred in the interim and may materially affect the value of those securities. To account for this, the Fund generally values many of its foreign equity securities using fair value prices based on third party vendor modeling tools to the extent available.
2. Fair Value Measurements
In accordance with U.S. GAAP regarding fair value measurements, fair value is defined as the price that the Fund would receive to sell an asset or pay to transfer a liability in an orderly transaction between market participants at the measurement date. U.S. GAAP establishes a framework for measuring fair value, and a three-level hierarchy for fair value measurements based upon the transparency of inputs to the valuation of an asset or liability (including those valued based on their market values as described in Note A.1 above). Inputs may be observable or unobservable and refer broadly to the assumptions that market participants would use in pricing the asset or liability. Observable inputs reflect the assumptions market participants would use in pricing the asset or liability based on market data obtained from sources independent of the Fund. Unobservable inputs reflect the Fund’s own assumptions about the assumptions that market participants would use in pricing the asset or liability based on the best information available in the circumstances. Each investment is assigned a level based upon the observability of the inputs which are significant to the overall valuation. The three-tier hierarchy of inputs is summarized below.
| | • | | Level 1—quoted prices in active markets for identical investments |
| | • | | Level 2—other significant observable inputs (including quoted prices for similar investments, interest rates, prepayment speeds, credit risk, etc.) |
| | • | | Level 3—significant unobservable inputs (including the Fund’s own assumptions in determining the fair value of investments) |
| | |
| |
| abfunds.com | | AB WEALTH APPRECIATION STRATEGY | 23 |
NOTES TO FINANCIAL STATEMENTS(continued)
Where readily available market prices or relevant bid prices are not available for certain equity investments, such investments may be valued based on similar publicly traded investments, movements in relevant indices since last available prices or based upon underlying company fundamentals and comparable company data (such as multiples to earnings or other multiples to equity). Where an investment is valued using an observable input, such as another publicly traded security, the investment will be classified as Level 2. If management determines that an adjustment is appropriate based on restrictions on resale, illiquidity or uncertainty, and such adjustment is a significant component of the valuation, the investment will be classified as Level 3. An investment will also be classified as Level 3 where management uses company fundamentals and other significant inputs to determine the valuation.
The following table summarizes the valuation of the Fund’s investments by the above fair value hierarchy levels as of February 28, 2019:
| | | | | | | | | | | | | | | | |
Investments in
Securities: | | Level 1 | | | Level 2 | | | Level 3 | | | Total | |
Assets: | | | | | | | | | | | | | | | | |
Common Stocks(a) | | $ | 670,089,552 | | | $ | – 0 | – | | $ | – 0 | – | | $ | 670,089,552 | |
Investment Companies | | | 610,761,057 | | | | – 0 | – | | | – 0 | – | | | 610,761,057 | |
Short-Term Investments | | | 1,282,743 | | | | – 0 | – | | | – 0 | – | | | 1,282,743 | |
| | | | | | | | | | | | | | | | |
Total Investments in Securities | | | 1,282,133,352 | | | | – 0 | – | | | – 0 | – | | | 1,282,133,352 | |
Other Financial Instruments(b) | | | – 0 | – | | | – 0 | – | | | – 0 | – | | | – 0 | – |
| | | | | | | | | | | | | | | | |
Total(c) | | $ | 1,282,133,352 | | | $ | – 0 | – | | $ | – 0 | – | | $ | 1,282,133,352 | |
| | | | | | | | | | | | | | | | |
| (a) | See Portfolio of Investments for sector classifications. |
| (b) | Other financial instruments are derivative instruments, such as futures, forwards and swaps, which are valued at the unrealized appreciation/(depreciation) on the instrument. Other financial instruments may also include swaps with upfront premiums, options written and swaptions written which are valued at market value. |
| (c) | There were no transfers between any levels during the reporting period. |
The Fund recognizes all transfers between levels of the fair value hierarchy assuming the financial instruments were transferred at the beginning of the reporting period.
The Adviser established the Committee to oversee the pricing and valuation of all securities held in the Fund. The Committee operates under pricing and valuation policies and procedures established by the Adviser and approved by the Board, including pricing policies which set forth the mechanisms and processes to be employed on a daily basis to implement these policies and procedures. In particular, the pricing policies describe how to determine market quotations for securities and other instruments. The Committee’s responsibilities include: 1) fair value and liquidity determinations (and oversight of any third parties to whom any responsibility for
| | |
| |
| 24 | AB WEALTH APPRECIATION STRATEGY | | abfunds.com |
NOTES TO FINANCIAL STATEMENTS(continued)
fair value and liquidity determinations is delegated), and 2) regular monitoring of the Adviser’s pricing and valuation policies and procedures and modification or enhancement of these policies and procedures (or recommendation of the modification of these policies and procedures) as the Committee believes appropriate.
The Committee is also responsible for monitoring the implementation of the pricing policies by the Adviser’s Pricing Group (the “Pricing Group”) and any third party which performs certain pricing functions in accordance with the pricing policies. The Pricing Group is responsible for the oversight of the third party on aday-to-day basis. The Committee and the Pricing Group perform a series of activities to provide reasonable assurance of the accuracy of prices including: 1) periodic vendor due diligence meetings, review of methodologies, new developments and processes at vendors, 2) daily comparison of security valuation versus prior day for all securities that exceeded established thresholds, and 3) daily review of unpriced, stale, and variance reports with exceptions reviewed by senior management and the Committee.
In addition, several processes outside of the pricing process are used to monitor valuation issues including: 1) performance and performance attribution reports are monitored for anomalous impacts based upon benchmark performance, and 2) portfolio managers review all portfolios for performance and analytics (which are generated using the Adviser’s prices).
3. Currency Translation
Assets and liabilities denominated in foreign currencies and commitments under forward currency exchange contracts are translated into U.S. dollars at the mean of the quoted bid and ask prices of such currencies against the U.S. dollar. Purchases and sales of portfolio securities are translated into U.S. dollars at the rates of exchange prevailing when such securities were acquired or sold. Income and expenses are translated into U.S. dollars at rates of exchange prevailing when accrued.
Net realized gain or loss on foreign currency transactions represents foreign exchange gains and losses from sales and maturities of foreign fixed income investments, holding of foreign currencies, currency gains or losses realized between the trade and settlement dates on foreign investment transactions, and the difference between the amounts of dividends, interest and foreign withholding taxes recorded on the Fund’s books and the U.S. dollar equivalent amounts actually received or paid. Net unrealized currency gains and losses from valuing foreign currency denominated assets and liabilities at period end exchange rates are reflected as a component of net unrealized appreciation or depreciation of foreign currency denominated assets and liabilities.
| | |
| |
| abfunds.com | | AB WEALTH APPRECIATION STRATEGY | 25 |
NOTES TO FINANCIAL STATEMENTS(continued)
4. Taxes
It is the Fund’s policy to meet the requirements of the Internal Revenue Code applicable to regulated investment companies and to distribute all of its investment company taxable income and net realized gains, if any, to shareholders. Therefore, no provisions for federal income or excise taxes are required. Taxes are accrued and applied to net investment income, net realized gains and net unrealized appreciation/depreciation as such income and/or gains are earned.
In accordance with U.S. GAAP requirements regarding accounting for uncertainties in income taxes, management has analyzed the Fund’s tax positions taken or expected to be taken on federal and state income tax returns for all open tax years (the current and the prior three tax years) and has concluded that no provision for income tax is required in the Fund’s financial statements.
5. Investment Income and Investment Transactions
Dividend income is recorded on theex-dividend date or as soon as the Fund is informed of the dividend. Interest income is accrued daily. Investment transactions are accounted for on the date the securities are purchased or sold. Investment gains or losses are determined on the identified cost basis. The Fund amortizes premiums and accretes discounts as adjustments to interest income.
6. Class Allocations
All income earned and expenses incurred by the Fund are borne on apro-rata basis by each outstanding class of shares, based on the proportionate interest in the Fund represented by the net assets of such class, except for class specific expenses which are allocated to the respective class. Expenses of the Company are charged proportionately to each series or based on other appropriate methods. Realized and unrealized gains and losses are allocated among the various share classes based on respective net assets.
7. Dividends and Distributions
Dividends and distributions to shareholders, if any, are recorded on theex-dividend date. Income dividends and capital gains distributions are determined in accordance with federal tax regulations and may differ from those determined in accordance with U.S. GAAP. To the extent these differences are permanent, such amounts are reclassified within the capital accounts based on their federal tax basis treatment; temporary differences do not require such reclassification.
| | |
| |
| 26 | AB WEALTH APPRECIATION STRATEGY | | abfunds.com |
NOTES TO FINANCIAL STATEMENTS(continued)
NOTE B
Advisory Fee and Other Transactions with Affiliates
Under the terms of the investment advisory agreement (the “Advisory Agreement”), the Fund pays the Adviser an advisory fee at an annual rate of .65% of the first $2.5 billion, .55% of the next $2.5 billion and .50% in excess of $5 billion of the Fund’s average daily net assets. The fee is accrued daily and paid monthly.
During 2017, AXA S.A. (“AXA”), a French holding company for the AXA Group, a worldwide leader in life, property and casualty and health insurance and asset management, announced its intention to pursue the sale of a minority stake in its subsidiary, AXA Equitable Holdings, Inc. (“AXA Equitable”), the holding company for a diversified financial services organization, through an initial public offering (“IPO”). AXA Equitable is the holding company for a diverse group of financial services companies, including AllianceBernstein L.P., the investment adviser to the Funds (“the Adviser”). In March 2018, AXA announced its intention to sell its entire interest in AXA Equitable over time, subject to market conditions and other factors (the “Plan”). During the second quarter of 2018, AXA Equitable completed the IPO, and, in the fourth quarter of 2018, and in the first quarter of 2019, AXA completed public offerings of additional shares of AXA Equitable’s common stock and simultaneously sold shares to AXA Equitable pursuant to a separate agreement with it. AXA also granted the underwriters of the offering an option to purchase additional shares of AXA Equitable, which was exercised. As a result of the foregoing sales of AXA Equitable shares, as of March 25, 2019, AXA owns approximately 48.3% of the shares of common stock of AXA Equitable. Contemporaneously with the IPO, AXA sold $862.5 million aggregate principal amount of its 7.25% mandatorily exchangeable notes (the “MxB Notes”) due May 15, 2021, and exchangeable into up to 43,125,000 shares of common stock (or approximately 7% of the outstanding shares of common stock of AXA Equitable). AXA retains ownership (including voting rights) of such shares of common stock until the MxB Notes are exchanged, which may be on a date that is earlier than the maturity date at AXA’s option upon the occurrence of certain events.
It is anticipated that one or more of the transactions contemplated by the Plan may ultimately result in the indirect transfer of a “controlling block” of voting securities of the Adviser (a “Change of Control Event”) and therefore may be deemed an “assignment” causing a termination of each Fund’s current investment advisory agreement. In order to ensure that the existing investment advisory services could continue uninterrupted, at meetings held in late July through early August 2018, the Boards of Directors/Trustees (each a “Board” and collectively, the “Boards”) approved new investment advisory agreements with the Adviser, in connection with the
| | |
| |
| abfunds.com | | AB WEALTH APPRECIATION STRATEGY | 27 |
NOTES TO FINANCIAL STATEMENTS(continued)
Plan. The Boards also agreed to call and hold a joint meeting of shareholders on October 11, 2018, for shareholders of each Fund to (1) approve the new investment advisory agreement with the Adviser that would be effective after the first Change of Control Event and (2) approve any future advisory agreement approved by the Board and that has terms not materially different from the current agreement, in the event there are subsequent Change of Control Events arising from completion of the Plan that terminate the advisory agreement after the first Change of Control Event. Approval of a future advisory agreement means that shareholders may not have another opportunity to vote on a new agreement with the Adviser even upon a change of control, as long as no single person or group of persons acting together gains “control” (as defined in the 1940 Act) of AXA Equitable.
At the December 11, 2018 adjourned shareholder meeting, shareholders approved the new and future investment advisory agreements.
The Fund may invest in AB Government Money Market Portfolio (the “Government Money Market Portfolio”) which has a contractual annual advisory fee rate of ..20% of the portfolio’s average daily net assets and bears its own expenses. Effective August 1, 2018, the Adviser has contractually agreed to waive .10% of the advisory fee of Government Money Market Portfolio (resulting in a net advisory fee of .10%) until August 31, 2019. In connection with the investment by the Fund in Government Money Market Portfolio, the Adviser has contractually agreed to waive its advisory fee from the Fund in an amount equal to the Fund’s pro rata share of the effective advisory fee of Government Money Market Portfolio, as borne indirectly by the Fund as an acquired fund fee and expense. For the six months ended February 28, 2019, such waiver amounted to $1,483.
In connection with the Fund’s investments in other AB mutual funds, the Adviser has contractually agreed to waive fees and/or reimburse the expenses payable to the Adviser by the Fund in an amount equal to the Fund’s pro rata share of the effective advisory fees of AB mutual funds, as paid by the Fund as an acquired fund fee and expense. These fee waivers and/or expense reimbursements will remain in effect until December 31, 2019. For the six months ended February 28, 2019, such waivers and/or reimbursements amounted to $2,307,303.
| | |
| |
| 28 | AB WEALTH APPRECIATION STRATEGY | | abfunds.com |
NOTES TO FINANCIAL STATEMENTS(continued)
A summary of the Fund’s transactions in AB mutual funds for the six months ended February 28, 2019 is as follows:
| | | | | | | | | | | | | | | | | | | | | | | | | | | | | | | | |
| | | | Distributions | |
| Fund | | Market
Value
8/31/18
(000) | | | Purchases
at Cost
(000) | | | Sales
Proceeds
(000) | | | Realized
Gain
(Loss)
(000) | | | Change in
Unrealized
Appr./
(Depr.)
(000) | | | Market
Value
2/28/19
(000) | | | Dividend
Income
(000) | | | Realized
Gains
(000) | |
Government Money Market Portfolio | | $ | – 0 | – | | $ | 92,933 | | | $ | 91,650 | | | $ | – 0 | – | | $ | – 0 | – | | $ | 1,283 | | | $ | 36 | | | $ | – 0 | – |
AB Discovery Growth Fund, Inc. | | | 34,608 | | | | 4,324 | | | | 1,611 | | | | 101 | | | | (6,548 | ) | | | 30,874 | | | | 569 | | | | 3,755 | |
AB Trust: AB Discovery Value Fund, Inc. | | | 34,707 | | | | 3,161 | | | | 415 | | | | 8 | | | | (5,997 | ) | | | 31,464 | | | | 424 | | | | 2,736 | |
Bernstein Fund, Inc.: International Small Cap Portfolio | | | 80,519 | | | | 11,771 | | | | 1,023 | | | | (223 | ) | | | (13,294 | ) | | | 77,750 | | | | 2,159 | | | | 4,542 | |
International Strategic Equities Portfolio | | | 270,711 | | | | 15,553 | | | | 10,149 | | | | (1,496 | ) | | | (19,256 | ) | | | 255,363 | | | | 4,677 | | | | 2,892 | |
Small Cap Core Portfolio | | | 39,504 | | | | 2,436 | | | | – 0 | – | | | – 0 | – | | | (6,391 | ) | | | 35,549 | | | | 544 | | | | 1,892 | |
Sanford C. Bernstein Fund, Inc.: Emerging Markets Portfolio | | | 35,399 | | | | 6,835 | | | | 2,918 | | | | (644 | ) | | | (2,732 | ) | | | 35,940 | | | | 540 | | | | 2,186 | |
International Portfolio | | | 150,901 | | | | 13,454 | | | | 1,597 | | | | (345 | ) | | | (18,592 | ) | | | 143,821 | | | | 3,532 | | | | 3,973 | |
| | | | | | | | | | | | | | | | | | | | | | | | | | | | | | | | |
Total | | | | | | | | | | | | | | $ | (2,599 | ) | | $ | (72,810 | ) | | $ | 612,044 | | | $ | 12,481 | | | $ | 21,976 | |
| | | | | | | | | | | | | | | | | | | | | | | | | | | | | | | | |
Pursuant to the investment advisory agreement, the Fund may reimburse the Adviser for certain legal and accounting services provided to the Fund by the Adviser. For the six months ended February 28, 2019, the reimbursement for such services amounted to $35,849.
| | |
| |
| abfunds.com | | AB WEALTH APPRECIATION STRATEGY | 29 |
NOTES TO FINANCIAL STATEMENTS(continued)
The Fund compensates AllianceBernstein Investor Services, Inc. (“ABIS”), a wholly-owned subsidiary of the Adviser, under a Transfer Agency Agreement for providing personnel and facilities to perform transfer agency services for the Fund. ABIS may make payments to intermediaries that provide omnibus account services,sub-accounting services and/or networking services. Such compensation retained by ABIS amounted to $161,003 for the six months ended February 28, 2019.
AllianceBernstein Investments, Inc. (the “Distributor”), a wholly-owned subsidiary of the Adviser, serves as the distributor of the Fund’s shares. The Distributor has advised the Fund that it has retainedfront-end sales charges of $3,868 from the sale of Class A shares and received $1,297, $1,297 and $462 in contingent deferred sales charges imposed upon redemptions by shareholders of Class A, Class B and Class C shares, respectively, for the six months ended February 28, 2019.
Brokerage commissions paid on investment transactions for the six months ended February 28, 2019 amounted to $47,855, of which $1,823 and $0, respectively, was paid to Sanford C. Bernstein & Co. LLC and Sanford C. Bernstein Limited, affiliates of the Adviser.
NOTE C
Distribution Plans
The Fund has adopted a Plan for each class of shares of the Fund pursuant to Rule12b-1 under the Investment Company Act of 1940 (each a “Plan” and collectively the “Plans”). Under the Plans, the Fund pays distribution and servicing fees to the Distributor at an annual rate of up to .50% of the Fund’s average daily net assets attributable to Class A shares, 1% of the Fund’s average daily net assets attributable to both Class B and Class C shares, .50% of the Fund’s average daily net assets attributable to Class R shares and .25% of the Fund’s average daily net assets attributable to Class K shares. There are no distribution and servicing fees on the Advisor Class and Class I shares. The fees are accrued daily and paid monthly. Effective August 1, 2014, payments under the Plan in respect of Class A shares are limited to an annual rate of .25% of the Fund’s Class A share���s average daily net assets. The Plans provide that the Distributor will use such payments in their entirety for distribution assistance and promotional activities. The Fund is not obligated under the Plans to pay any distribution services fee in excess of the amounts set forth above. The purpose of the payments to the Distributor under the Plans is to compensate the Distributor for its distribution services with respect to the sale of the Fund’s shares. Since the Distributor’s compensation is not directly tied to its expenses, the amount of compensation received by it under the Plan during any year may be more or less than its actual expenses. For this reason, the Plans are characterized by the staff of the Securities and Exchange Commission as being of the “compensation” plan.
| | |
| |
| 30 | AB WEALTH APPRECIATION STRATEGY | | abfunds.com |
NOTES TO FINANCIAL STATEMENTS(continued)
In the event that a Plan is terminated or not continued, no distribution services fees (other than current amounts accrued but not yet paid) would be owed by the Fund to the Distributor with respect to the relevant class. The Plans also provide that the Adviser may use its own resources to finance the distribution of the Fund’s shares.
NOTE D
Investment Transactions
Purchases and sales of investment securities (excluding short-term investments) for the six months ended February 28, 2019 were as follows:
| | | | | | | | |
| | | Purchases | | | Sales | |
Investment securities (excluding U.S. government securities) | | $ | 173,016,725 | | | $ | 182,363,227 | |
U.S. government securities | | | – 0 | – | | | – 0 | – |
The cost of investments for federal income tax purposes was substantially the same as the cost for financial reporting purposes. Accordingly, gross unrealized appreciation and unrealized depreciation are as follows:
| | | | |
Gross unrealized appreciation | | $ | 99,960,385 | |
Gross unrealized depreciation | | | (63,112,382 | ) |
| | | | |
Net unrealized appreciation | | $ | 36,848,003 | |
| | | | |
1. Derivative Financial Instruments
The Fund may use derivatives in an effort to earn income and enhance returns, to replace more traditional direct investments, to obtain exposure to otherwise inaccessible markets (collectively, “investment purposes”), or to hedge or adjust the risk profile of its portfolio.
The Fund did not engage in derivatives transactions for the six months ended February 28, 2019.
2. Currency Transactions
The Fund may invest innon-U.S. Dollar-denominated securities on a currency hedged or unhedged basis. The Fund may seek investment opportunities by taking long or short positions in currencies through the use of currency-related derivatives, including forward currency exchange contracts, futures and options on futures, swaps, and other options. The Fund may enter into transactions for investment opportunities when it anticipates that a foreign currency will appreciate or depreciate in value but securities denominated in that currency are not held by the Fund and do not present attractive investment opportunities. Such transactions may also be used when the Adviser believes that it may be more efficient than a direct investment in a foreign currency-denominated security. The Fund may also conduct currency exchange contracts on a spot basis (i.e., for cash at the spot rate prevailing in the currency exchange market for buying or selling currencies).
| | |
| |
| abfunds.com | | AB WEALTH APPRECIATION STRATEGY | 31 |
NOTES TO FINANCIAL STATEMENTS(continued)
NOTE E
Shares of Beneficial Interest
Transactions in shares of beneficial interest for each class were as follows:
| | | | | | | | | | | | | | | | | | | | | | | | |
| | | | | | | | | | | | | | | | | | | | | | | | |
| | | Shares | | | | | | Amount | | | | |
| | | Six Months Ended
February 28, 2019
(unaudited) | | | Year Ended
August 31, 2018 | | | | | | Six Months Ended
February 28, 2019
(unaudited) | | | Year Ended
August 31, 2018 | | | | |
| | | | | | | | |
| Class A | | | | | | | | | | | | | | | | | | | | | | | | |
Shares sold | | | 307,094 | | | | 715,529 | | | | | | | $ | 4,832,810 | | | $ | 12,008,884 | | | | | |
| | | | | |
Shares issued in reinvestment of dividends and distributions | | | 767,105 | | | | 1,632,882 | | | | | | | | 11,007,955 | | | | 26,681,287 | | | | | |
| | | | | |
Shares converted from Class B | | | 32,725 | | | | 116,345 | | | | | | | | 520,283 | | | | 1,922,532 | | | | | |
| | | | | |
Shares converted from Class C | | | 255,370 | | | | 797,918 | | | | | | | | 4,130,751 | | | | 13,144,651 | | | | | |
| | | | | |
Shares redeemed | | | (1,737,122 | ) | | | (3,854,177 | ) | | | | | | | (27,189,506 | ) | | | (64,492,205 | ) | | | | |
| | | | | |
Net decrease | | | (374,828 | ) | | | (591,503 | ) | | | | | | $ | (6,697,707 | ) | | $ | (10,734,851 | ) | | | | |
| | | | | |
| | | | | | | | | | | | | | | | | | | | | | | | |
| Class B | | | | | | | | | | | | | | | | | | | | | | | | |
Shares sold | | | 6,308 | | | | 15,034 | | | | | | | $ | 99,650 | | | $ | 253,374 | | | | | |
| | | | | |
Shares issued in reinvestment of dividends and distributions | | | 6,133 | | | | 24,927 | | | | | | | | 88,170 | | | | 412,793 | | | | | |
| | | | | |
Shares converted to Class A | | | 32,388 | | | | (115,250 | ) | | | | | | | (520,283 | ) | | | (1,922,532 | ) | | | | |
| | | | | |
Shares redeemed | | | (82,652 | ) | | | (60,910 | ) | | | | | | | (281,379 | ) | | | (1,020,293 | ) | | | | |
| | | | | |
Net decrease | | | (37,823 | ) | | | (136,199 | ) | | | | | | $ | (613,842 | ) | | $ | (2,276,658 | ) | | | | |
| | | | | |
| | | | | | | | | | | | | | | | | | | | | | | | |
| Class C | | | | | | | | | | | | | | | | | | | | | | | | |
Shares sold | | | 31,525 | | | | 83,998 | | | | | | | $ | 480,053 | | | $ | 1,392,201 | | | | | |
| | | | | |
Shares issued in reinvestment of dividends and distributions | | | 44,969 | | | | 175,943 | | | | | | | | 648,458 | | | | 2,876,673 | | | | | |
| | | | | |
Shares converted to Class A | | | 256,095 | | | | (800,063 | ) | | | | | | | (4,130,751 | ) | | | (13,144,651 | ) | | | | |
| | | | | |
Shares redeemed | | | (680,289 | ) | | | (643,745 | ) | | | | | | | (2,618,514 | ) | | | (10,703,491 | ) | | | | |
| | | | | |
Net decrease | | | (347,700 | ) | | | (1,183,867 | ) | | | | | | $ | (5,620,754 | ) | | $ | (19,579,268 | ) | | | | |
| | | | | |
| | | | | | | | | | | | | | | | | | | | | | | | |
| Advisor Class | | | | | | | | | | | | | | | | | | | | | | | | |
Shares sold | | | 3,433,052 | | | | 6,914,794 | | | | | | | $ | 53,250,597 | | | $ | 115,025,615 | | | | | |
| | | | | |
Shares issued in reinvestment of dividends and distributions | | | 2,035,657 | | | | 3,723,512 | | | | | | | | 29,109,901 | | | | 60,618,771 | | | | | |
| | | | | |
Shares redeemed | | | (4,751,327 | ) | | | (8,467,394 | ) | | | | | | | (73,455,878 | ) | | | (141,553,778 | ) | | | | |
| | | | | |
Net increase | | | 717,382 | | | | 2,170,912 | | | | | | | $ | 8,904,620 | | | $ | 34,090,608 | | | | | |
| | | | | |
| | |
| |
| 32 | AB WEALTH APPRECIATION STRATEGY | | abfunds.com |
NOTES TO FINANCIAL STATEMENTS(continued)
| | | | | | | | | | | | | | | | | | | | | | | | |
| | | | | | | | | | | | | | | | | | | | | | | | |
| | | Shares | | | | | | Amount | | | | |
| | | Six Months Ended
February 28, 2019
(unaudited) | | | Year Ended
August 31, 2018 | | | | | | Six Months Ended
February 28, 2019
(unaudited) | | | Year Ended
August 31, 2018 | | | | |
| | | | | | | | |
| Class R | | | | | | | | | | | | | | | | | | | | | | | | |
Shares sold | | | 18,999 | | | | 15,844 | | | | | | | $ | 296,515 | | | $ | 262,876 | | | | | |
| | | | | |
Shares issued in reinvestment of dividends and distributions | | | 5,228 | | | | 13,892 | | | | | | | | 74,707 | | | | 225,748 | | | | | |
| | | | | |
Shares redeemed | | | (20,173 | ) | | | (62,671 | ) | | | | | | | (314,529 | ) | | | (1,038,146 | ) | | | | |
| | | | | |
Net increase (decrease) | | | 4,054 | | | | (32,935 | ) | | | | | | $ | 56,693 | | | $ | (549,522 | ) | | | | |
| | | | | |
| | | | | | | | | | | | | | | | | | | | | | | | |
| Class K | | | | | | | | | | | | | | | | | | | | | | | | |
Shares sold | | | 40,747 | | | | 77,425 | | | | | | | $ | 631,443 | | | $ | 1,279,644 | | | | | |
| | | | | |
Shares issued in reinvestment of dividends and distributions | | | 23,814 | | | | 57,755 | | | | | | | | 339,829 | | | | 937,946 | | | | | |
| | | | | |
Shares redeemed | | | (65,593 | ) | | | (214,732 | ) | | | | | | | (1,002,942 | ) | | | (3,541,703 | ) | | | | |
| | | | | |
Net decrease | | | (1,032 | ) | | | (79,552 | ) | | | | | | $ | (31,670 | ) | | $ | (1,324,113 | ) | | | | |
| | | | | |
| | | | | | | | | | | | | | | | | | | | | | | | |
| Class I | | | | | | | | | | | | | | | | | | | | | | | | |
Shares sold | | | 1,371 | | | | 2,683 | | | | | | | $ | 20,958 | | | $ | 44,131 | | | | | |
| | | | | |
Shares issued in reinvestment of dividends and distributions | | | 826 | | | | 3,359 | | | | | | | | 11,828 | | | | 54,682 | | | | | |
| | | | | |
Shares redeemed | | | – 0 | – | | | (29,151 | ) | | | | | | | – 0 | – | | | (485,394 | ) | | | | |
| | | | | |
Net increase (decrease) | | | 2,197 | | | | (23,109 | ) | | | | | | $ | 32,786 | | | $ | (386,581 | ) | | | | |
| | | | | |
| | |
| |
| abfunds.com | | AB WEALTH APPRECIATION STRATEGY | 33 |
NOTES TO FINANCIAL STATEMENTS(continued)
NOTE F
Risks Involved in Investing in the Fund
Foreign(Non-U.S.) Risk—Investments in securities ofnon-U.S. issuers may involve more risk than those of U.S. issuers. These securities may fluctuate more widely in price and may be less liquid due to adverse market, economic, political, regulatory or other factors.
Currency Risk—Fluctuations in currency exchange rates may negatively affect the value of the Fund’s investments or reduce its returns.
Emerging Market Risk—Investments in emerging market countries may have more risk because the markets are less developed and less liquid as well as being subject to increased economic, political, regulatory or other uncertainties.
Capitalization Risk—Investments in small- andmid-capitalization companies may be more volatile than investments in large-capitalization companies. Investments in small- andmid-capitalization companies may have additional risks because these companies have limited product lines, markets or financial resources.
Investment in Other Investment Companies Risk—As with other investments, investments in other investment companies are subject to market and selection risk. In addition, shareholders of the Fund bear both their proportionate share of expenses in the Fund (including management fees) and, indirectly, the expenses of the investment companies (to the extent these expenses are not waived or reimbursed by the Adviser).
Indemnification Risk—In the ordinary course of business, the Fund enters into contracts that contain a variety of indemnifications. The Fund’s maximum exposure under these arrangements is unknown. However, the Fund has not had prior claims or losses pursuant to these indemnification provisions and expects the risk of loss thereunder to be remote. Therefore, the Fund has not accrued any liability in connection with these indemnification provisions.
NOTE G
Joint Credit Facility
A number ofopen-end mutual funds managed by the Adviser, including the Fund, participate in a $325 million revolving credit facility (the “Facility”) intended to provide short-term financing, if necessary, subject to certain restrictions in connection with abnormal redemption activity. Commitment fees related to the Facility are paid by the participating funds and are included in miscellaneous expenses in the statement of operations. The Fund did not utilize the Facility during the six months ended February 28, 2019.
| | |
| |
| 34 | AB WEALTH APPRECIATION STRATEGY | | abfunds.com |
NOTES TO FINANCIAL STATEMENTS(continued)
NOTE H
Distributions to Shareholders
The tax character of distributions to be paid for the year ending August 31, 2019 will be determined at the end of the current fiscal year. The tax character of distributions paid during the fiscal years ended August 31, 2018 and August 31, 2017 were as follows:
| | | | | | | | |
| | | 2018 | | | 2017 | |
Distributions paid from: | | | | | | | | |
Ordinary income | | $ | 81,356,641 | | | $ | 42,440,731 | |
Net long-term capital gains | | | 16,601,929 | | | | 32,377,118 | |
| | | | | | | | |
Total taxable distributions | | $ | 97,958,570 | | | $ | 74,817,849 | |
| | | | | | | | |
As of August 31, 2018, the components of accumulated earnings/(deficit) on a tax basis were as follows:
| | | | |
Undistributed capital gains | | $ | 20,622,000 | |
Unrealized appreciation/(depreciation) | | | 137,615,873 | (a) |
| | | | |
Total accumulated earnings/(deficit) | | $ | 158,237,873 | |
| | | | |
| (a) | The difference between book-basis andtax-basis unrealized appreciation/(depreciation) is attributable primarily to the tax deferral of losses on wash sales. |
For tax purposes, net realized capital losses may be carried over to offset future capital gains, if any. Funds are permitted to carry forward capital losses for an indefinite period, and such losses will retain their character as either short-term or long-term capital losses. As of August 31, 2018, the Fund did not have any capital loss carryforwards.
NOTE I
Recent Accounting Pronouncements
In August 2018, the Financial Accounting Standards Board issued an Accounting Standards Update, ASU2018-13, Fair Value Measurement (Topic 820), Disclosure Framework—Changes to the Disclosure Requirements for Fair Value Measurement which removes, modifies and adds disclosures to Topic 820. The amendments in this ASU2018-13 apply to all entities that are required, under existing U.S. GAAP, to make disclosures about recurring or nonrecurring fair value measurements. The amendments in this ASU2018-13 are effective for all entities for fiscal years, and interim periods within those fiscal years, beginning after December 15, 2019. At this time, management is evaluating the implications of these changes on the financial statements.
In October 2018, the U.S. Securities and Exchange Commission adopted amendments to certain disclosure requirements included in RegulationS-X that had become “redundant, duplicative, overlapping, outdated or superseded, in light of the other Commission disclosure requirements, GAAP or
| | |
| |
| abfunds.com | | AB WEALTH APPRECIATION STRATEGY | 35 |
NOTES TO FINANCIAL STATEMENTS(continued)
changes in the information environment.” The compliance date for the amendments to RegulationS-X was November 5, 2018 (for reporting period end dates of September 30, 2018 or after). Management has adopted the amendments which simplified certain disclosure requirements on the financial statements.
NOTE J
Subsequent Events
Management has evaluated subsequent events for possible recognition or disclosure in the financial statements through the date the financial statements are issued. Management has determined that there are no material events that would require disclosure in the Fund’s financial statements through this date.
| | |
| |
| 36 | AB WEALTH APPRECIATION STRATEGY | | abfunds.com |
FINANCIAL HIGHLIGHTS
Selected Data For A Share Of Beneficial Interest Outstanding Throughout Each Period
| | | | | | | | | | | | | | | | | | | | | | | | |
| | | Class A | |
| | | Six Months
Ended
February 28,
2019 (unaudited) | | | Year Ended August 31, | |
| | | 2018 | | | 2017 | | | 2016 | | | 2015 | | | 2014 | |
| | | | |
| | | | | | | | | | | | | | | | | | | | | | | | |
Net asset value, beginning of period | | | $ 16.99 | | | | $ 16.27 | | | | $ 15.06 | | | | $ 14.64 | | | | $ 15.76 | | | | $ 13.36 | |
| | | | |
Income From Investment Operations | | | | | | | | | | | | | | | | | | | | | | | | |
| | | | | | |
Net investment income(a)(b) | | | .19 | | | | .17 | | | | .48 | | | | .26 | | | | .34 | | | | .37 | |
| | | | | | |
Net realized and unrealized gain (loss) on investment transactions | | | (.89 | ) | | | 1.77 | | | | 1.58 | | | | .39 | | | | (1.11 | ) | | | 2.30 | |
| | | | |
Net increase (decrease) in net asset value from operations | | | (.70 | ) | | | 1.94 | | | | 2.06 | | | | .65 | | | | (.77 | ) | | | 2.67 | |
| | | | |
Less: Dividends and Distributions | | | | | | | | | | | | | | | | | | | | | | | | |
| | | | | | |
Dividends from net investment income | | | (.16 | ) | | | (.43 | ) | | | (.48 | ) | | | (.23 | ) | | | (.35 | ) | | | (.27 | ) |
| | | | | | |
Distributions from net realized gain on investment transactions | | | (.35 | ) | | | (.79 | ) | | | (.37 | ) | | | – 0 | – | | | – 0 | – | | | – 0 | – |
| | | | |
Total dividends and distributions | | | (.51 | ) | | | (1.22 | ) | | | (.85 | ) | | | (.23 | ) | | | (.35 | ) | | | (.27 | ) |
| | | | |
Net asset value, end of period | | | $ 15.78 | | | | $ 16.99 | | | | $ 16.27 | | | | $ 15.06 | | | | $ 14.64 | | | | $ 15.76 | |
| | | | |
| | | | | | |
Total Return | | | | | | | | | | | | | | | | | | | | | | | | |
| | | | | | |
Total investment return based on net asset value(c)* | | | (3.79 | )% | | | 12.21 | % | | | 14.35 | % | | | 4.53 | % | | | (4.89 | )% | | | 20.21 | % |
| | | | | | |
Ratios/Supplemental Data | | | | | | | | | | | | | | | | | | | | | | | | |
| | | | | | |
Net assets, end of period (000’s omitted) | | | $359,295 | | | | $393,100 | | | | $386,168 | | | | $354,972 | | | | $367,939 | | | | $417,381 | |
| | | | | | |
Ratio to average net assets of: | | | | | | | | | | | | | | | | | | | | | | | | |
| | | | | | |
Expenses, net of waivers/reimbursements(d)‡ | | | .64 | %^ | | | .64 | % | | | .85 | % | | | .89 | % | | | .88 | % | | | 1.05 | % |
| | | | | | |
Expenses, before waivers/reimbursements(d)‡ | | | 1.01 | %^ | | | 1.01 | % | | | 1.01 | % | | | 1.01 | % | | | 1.00 | % | | | 1.06 | % |
| | | | | | |
Net investment income(b) | | | 2.40 | %^ | | | 1.02 | % | | | 3.14 | % | | | 1.78 | % | | | 2.18 | % | | | 2.52 | % |
| | | | | | |
Portfolio turnover rate | | | 13 | % | | | 22 | % | | | 111 | % | | | 9 | % | | | 9 | % | | | 20 | % |
| | | | | | | | | | | | | | | | | | | | | | | | |
| |
‡ Expense ratios exclude the estimated acquired fund fees of the affiliated/unaffiliated underlying | |
portfolios | | | .39 | %^ | | | .40 | % | | | .34 | % | | | .41 | % | | | .38 | % | | | .05 | % |
See footnote summary on page 44.
| | |
| |
| abfunds.com | | AB WEALTH APPRECIATION STRATEGY | 37 |
FINANCIAL HIGHLIGHTS(continued)
Selected Data For A Share Of Beneficial Interest Outstanding Throughout Each Period
| | | | | | | | | | | | | | | | | | | | | | | | |
| | | Class B | |
| | | Six Months
Ended
February 28,
2019 (unaudited) | | | Year Ended August 31, | |
| | | 2018 | | | 2017 | | | 2016 | | | 2015 | | | 2014 | |
| | | | |
| | | | | | | | | | | | | | | | | | | | | | | | |
Net asset value, beginning of period | | | $ 17.13 | | | | $ 16.36 | | | | $ 15.07 | | | | $ 14.57 | | | | $ 15.64 | | | | $ 13.20 | |
| | | | |
Income From Investment Operations | | | | | | | | | | | | | | | | | | | | | | | | |
| | | | | | |
Net investment income(a)(b) | | | .12 | | | | .05 | | | | .36 | | | | .20 | | | | .28 | | | | .31 | |
| | | | | | |
Net realized and unrealized gain (loss) on investment transactions | | | (.87 | ) | | | 1.77 | | | | 1.60 | | | | .34 | | | | (1.15 | ) | | | 2.23 | |
| | | | |
Net increase (decrease) in net asset value from operations | | | (.75 | ) | | | 1.82 | | | | 1.96 | | | | .54 | | | | (.87 | ) | | | 2.54 | |
| | | | |
Less: Dividends and Distributions | | | | | | | | | | | | | | | | | | | | | | | | |
| | | | | | |
Dividends from net investment income | | | – 0 | – | | | (.26 | ) | | | (.30 | ) | | | (.04 | ) | | | (.20 | ) | | | (.10 | ) |
| | | | | | |
Distributions from net realized gain on investment transactions | | | (.35 | ) | | | (.79 | ) | | | (.37 | ) | | | – 0 | – | | | – 0 | – | | | – 0 | – |
| | | | |
Total dividends and distributions | | | (.35 | ) | | | (1.05 | ) | | | (.67 | ) | | | (.04 | ) | | | (.20 | ) | | | (.10 | ) |
| | | | |
Net asset value, end of period | | | $ 16.03 | | | | $ 17.13 | | | | $ 16.36 | | | | $ 15.07 | | | | $ 14.57 | | | | $ 15.64 | |
| | | | |
| | | | | | |
Total Return | | | | | | | | | | | | | | | | | | | | | | | | |
| | | | | | |
Total investment return based on net asset value(c)* | | | (4.17 | )% | | | 11.36 | % | | | 13.48 | % | | | 3.72 | % | | | (5.59 | )% | | | 19.33 | % |
| | | | | | |
Ratios/Supplemental Data | | | | | | | | | | | | | | | | | | | | | | | | |
| | | | | | |
Net assets, end of period (000’s omitted) | | | $4,445 | | | | $5,396 | | | | $7,383 | | | | $12,268 | | | | $26,943 | | | | $57,541 | |
| | | | | | |
Ratio to average net assets of: | | | | | | | | | | | | | | | | | | | | | | | | |
| | | | | | |
Expenses, net of waivers/reimbursements(d)‡ | | | 1.42 | %^ | | | 1.41 | % | | | 1.64 | % | | | 1.65 | % | | | 1.64 | % | | | 1.76 | % |
| | | | | | |
Expenses, before waivers/reimbursements(d)‡ | | | 1.79 | %^ | | | 1.78 | % | | | 1.79 | % | | | 1.76 | % | | | 1.76 | % | | | 1.77 | % |
| | | | | | |
Net investment income(b) | | | 1.57 | %^ | | | .29 | % | | | 2.35 | % | | | 1.37 | % | | | 1.85 | % | | | 2.10 | % |
| | | | | | |
Portfolio turnover rate | | | 13 | % | | | 22 | % | | | 111 | % | | | 9 | % | | | 9 | % | | | 20 | % |
| | | | | | | | | | | | | | | | | | | | | | | | |
| |
‡ Expense ratios exclude the estimated acquired fund fees of the affiliated/unaffiliated underlying | |
portfolios | | | .39 | %^ | | | .40 | % | | | .34 | % | | | .41 | % | | | .38 | % | | | .05 | % |
See footnote summary on page 44.
| | |
| |
| 38 | AB WEALTH APPRECIATION STRATEGY | | abfunds.com |
FINANCIAL HIGHLIGHTS(continued)
Selected Data For A Share Of Beneficial Interest Outstanding Throughout Each Period
| | | | | | | | | | | | | | | | | | | | | | | | |
| | | Class C | |
| | | Six Months
Ended
February 28,
2019 (unaudited) | | | Year Ended August 31, | |
| | | 2018 | | | 2017 | | | 2016 | | | 2015 | | | 2014 | |
| | | | |
| | | | | | | | | | | | | | | | | | | | | | | | |
Net asset value, beginning of period | | | $ 16.91 | | | | $ 16.15 | | | | $ 14.95 | | | | $ 14.51 | | | | $ 15.62 | | | | $ 13.21 | |
| | | | | | | | |
Income From Investment Operations | | | | | | | | | | | | | | | | | | | | | | | | |
| | | | | | |
Net investment income(a)(b) | | | .12 | | | | .06 | | | | .36 | | | | .15 | | | | .23 | | | | .27 | |
| | | | | | |
Net realized and unrealized gain (loss) on investment transactions | | | (.85 | ) | | | 1.73 | | | | 1.57 | | | | .40 | | | | (1.11 | ) | | | 2.27 | |
| | | | |
Net increase (decrease) in net asset value from operations | | | (.73 | ) | | | 1.79 | | | | 1.93 | | | | .55 | | | | (.88 | ) | | | 2.54 | |
| | | | |
Less: Dividends and Distributions | | | | | | | | | | | | | | | | | | | | | | | | |
| | | | | | |
Dividends from net investment income | | | (.00 | )(e) | | | (.24 | ) | | | (.36 | ) | | | (.11 | ) | | | (.23 | ) | | | (.13 | ) |
| | | | | | |
Distributions from net realized gain on investment transactions | | | (.35 | ) | | | (.79 | ) | | | (.37 | ) | | | – 0 | – | | | – 0 | – | | | – 0 | – |
| | | | |
Total dividends and distributions | | | (.35 | ) | | | (1.03 | ) | | | (.73 | ) | | | (.11 | ) | | | (.23 | ) | | | (.13 | ) |
| | | | |
Net asset value, end of period | | | $ 15.83 | | | | $ 16.91 | | | | $ 16.15 | | | | $ 14.95 | | | | $ 14.51 | | | | $ 15.62 | |
| | | | |
| | | | | | |
Total Return | | | | | | | | | | | | | | | | | | | | | | | | |
| | | | | | |
Total investment return based on net asset value(c)* | | | (4.10 | )% | | | 11.31 | % | | | 13.45 | % | | | 3.81 | % | | | (5.62 | )% | | | 19.36 | % |
| | | | | | |
Ratios/Supplemental Data | | | | | | | | | | | | | | | | | | | | | | | | |
| | | | | | |
Net assets, end of period (000’s omitted) | | | $30,184 | | | | $38,133 | | | | $55,532 | | | | $97,091 | | | | $108,828 | | | | $134,675 | |
| | | | | | |
Ratio to average net assets of: | | | | | | | | | | | | | | | | | | | | | | | | |
| | | | | | |
Expenses, net of waivers/reimbursements(d)‡ | | | 1.40 | %^ | | | 1.39 | % | | | 1.62 | % | | | 1.64 | % | | | 1.63 | % | | | 1.75 | % |
| | | | | | |
Expenses, before waivers/reimbursements(d)‡ | | | 1.76 | %^ | | | 1.77 | % | | | 1.76 | % | | | 1.76 | % | | | 1.75 | % | | | 1.76 | % |
| | | | | | |
Net investment income(b) | | | 1.60 | %^ | | | .34 | % | | | 2.38 | % | | | 1.06 | % | | | 1.51 | % | | | 1.84 | % |
| | | | | | |
Portfolio turnover rate | | | 13 | % | | | 22 | % | | | 111 | % | | | 9 | % | | | 9 | % | | | 20 | % |
| | | | | | | | | | | | | | | | | | | | | | | | |
| |
‡ Expense ratios exclude the estimated acquired fund fees of the affiliated/unaffiliated underlying | |
portfolios | | | .39 | %^ | | | .40 | % | | | .34 | % | | | .41 | % | | | .38 | % | | | .05 | % |
See footnote summary on page 44.
| | |
| |
| abfunds.com | | AB WEALTH APPRECIATION STRATEGY | 39 |
FINANCIAL HIGHLIGHTS(continued)
Selected Data For A Share Of Beneficial Interest Outstanding Throughout Each Period
| | | | | | | | | | | | | | | | | | | | | | | | |
| | | Advisor Class | |
| | | Six Months
Ended
February 28,
2019 (unaudited) | | | Year Ended August 31, | |
| | | 2018 | | | 2017 | | | 2016 | | | 2015 | | | 2014 | |
| | | | |
| | | | | | | | | | | | | | | | | | | | | | | | |
Net asset value, beginning of period | | | $ 16.96 | | | | $ 16.25 | | | | $ 15.04 | | | | $ 14.62 | | | | $ 15.75 | | | | $ 13.37 | |
| | | | | | | | |
Income From Investment Operations | | | | | | | | | | | | | | | | | | | | | | | | |
| | | | | | |
Net investment income(a)(b) | | | .21 | | | | .21 | | | | .52 | | | | .29 | | | | .37 | | | | .41 | |
| | | | | | |
Net realized and unrealized gain (loss) on investment transactions | | | (.88 | ) | | | 1.76 | | | | 1.58 | | | | .40 | | | | (1.11 | ) | | | 2.30 | |
| | | | |
Net increase (decrease) in net asset value from operations | | | (.67 | ) | | | 1.97 | | | | 2.10 | | | | .69 | | | | (.74 | ) | | | 2.71 | |
| | | | |
Less: Dividends and Distributions | | | | | | | | | | | | | | | | | | | | | | | | |
| | | | | | |
Dividends from net investment income | | | (.21 | ) | | | (.47 | ) | | | (.52 | ) | | | (.27 | ) | | | (.39 | ) | | | (.33 | ) |
| | | | | | |
Distributions from net realized gain on investment transactions | | | (.35 | ) | | | (.79 | ) | | | (.37 | ) | | | – 0 | – | | | – 0 | – | | | – 0 | – |
| | | | |
Total dividends and distributions | | | (.56 | ) | | | (1.26 | ) | | | (.89 | ) | | | (.27 | ) | | | (.39 | ) | | | (.33 | ) |
| | | | |
Net asset value, end of period | | | $ 15.73 | | | | $ 16.96 | | | | $ 16.25 | | | | $ 15.04 | | | | $ 14.62 | | | | $ 15.75 | |
| | | | |
| | | | | | |
Total Return | | | | | | | | | | | | | | | | | | | | | | | | |
| | | | | | |
Total investment return based on net asset value(c)* | | | (3.64 | )% | | | 12.44 | % | | | 14.66 | % | | | 4.82 | % | | | (4.66 | )% | | | 20.53 | % |
| | | | | | |
Ratios/Supplemental Data | | | | | | | | | | | | | | | | | | | | | | | | |
| | | | | | |
Net assets, end of period (000’s omitted) | | | $875,465 | | | | $931,834 | | | | $857,397 | | | | $861,450 | | | | $858,681 | | | | $921,935 | |
| | | | | | |
Ratio to average net assets of: | | | | | | | | | | | | | | | | | | | | | | | | |
| | | | | | |
Expenses, net of waivers/reimbursements(d)‡ | | | .39 | %^ | | | .39 | % | | | .60 | % | | | .64 | % | | | .63 | % | | | .75 | % |
| | | | | | |
Expenses, before waivers/reimbursements(d)‡ | | | .76 | %^ | | | .76 | % | | | .76 | % | | | .76 | % | | | .75 | % | | | .76 | % |
| | | | | | |
Net investment income(b) | | | 2.65 | %^ | | | 1.26 | % | | | 3.39 | % | | | 2.00 | % | | | 2.42 | % | | | 2.77 | % |
| | | | | | |
Portfolio turnover rate | | | 13 | % | | | 22 | % | | | 111 | % | | | 9 | % | | | 9 | % | | | 20 | % |
| | | | | | | | | | | | | | | | | | | | | | | | |
| |
‡ Expense ratios exclude the estimated acquired fund fees of the affiliated/unaffiliated underlying | |
portfolios | | | .39 | %^ | | | .40 | % | | | .34 | % | | | .41 | % | | | .38 | % | | | .05 | % |
See footnote summary on page 44.
| | |
| |
| 40 | AB WEALTH APPRECIATION STRATEGY | | abfunds.com |
FINANCIAL HIGHLIGHTS(continued)
Selected Data For A Share Of Beneficial Interest Outstanding Throughout Each Period
| | | | | | | | | | | | | | | | | | | | | | | | |
| | | Class R | |
| | | Six Months
Ended
February 28,
2019 (unaudited) | | | Year Ended August 31, | |
| | | 2018 | | | 2017 | | | 2016 | | | 2015 | | | 2014 | |
| | | | |
| | | | | | | | | | | | | | | | | | | | | | | | |
Net asset value, beginning of period | | | $ 16.84 | | | | $ 16.14 | | | | $ 14.94 | | | | $ 14.51 | | | | $ 15.63 | | | | $ 13.22 | |
| | | | |
Income From Investment Operations | | | | | | | | | | | | | | | | | | | | | | | | |
| | | | | | |
Net investment income(a)(b) | | | .15 | | | | .10 | | | | .41 | | | | .21 | | | | .31 | | | | .33 | |
| | | | | | |
Net realized and unrealized gain (loss) on investment transactions | | | (.86 | ) | | | 1.73 | | | | 1.57 | | | | .37 | | | | (1.14 | ) | | | 2.26 | |
| | | | |
Net increase (decrease) in net asset value from operations | | | (.71 | ) | | | 1.83 | | | | 1.98 | | | | .58 | | | | (.83 | ) | | | 2.59 | |
| | | | |
Less: Dividends and Distributions | | | | | | | | | | | | | | | | | | | | | | | | |
| | | | | | |
Dividends from net investment income | | | (.08 | ) | | | (.34 | ) | | | (.41 | ) | | | (.15 | ) | | | (.29 | ) | | | (.18 | ) |
| | | | | | |
Distributions from net realized gain on investment transactions | | | (.35 | ) | | | (.79 | ) | | | (.37 | ) | | | – 0 | – | | | – 0 | – | | | – 0 | – |
| | | | |
Total dividends and distributions | | | (.43 | ) | | | (1.13 | ) | | | (.78 | ) | | | (.15 | ) | | | (.29 | ) | | | (.18 | ) |
| | | | |
Net asset value, end of period | | | $ 15.70 | | | | $ 16.84 | | | | $ 16.14 | | | | $ 14.94 | | | | $ 14.51 | | | | $ 15.63 | |
| | | | |
| | | | | | |
Total Return | | | | | | | | | | | | | | | | | | | | | | | | |
| | | | | | |
Total investment return based on net asset value(c)* | | | (3.95 | )% | | | 11.62 | % | | | 13.88 | % | | | 4.06 | % | | | (5.33 | )% | | | 19.75 | % |
| | | | | | |
Ratios/Supplemental Data | | | | | | | | | | | | | | | | | | | | | | | | |
| | | | | | |
Net assets, end of period (000’s omitted) | | | $2,765 | | | | $2,898 | | | | $3,308 | | | | $3,360 | | | | $4,212 | | | | $5,665 | |
| | | | | | |
Ratio to average net assets of: | | | | | | | | | | | | | | | | | | | | | | | | |
| | | | | | |
Expenses, net of waivers/reimbursements(d)‡ | | | 1.09 | %^ | | | 1.09 | % | | | 1.30 | % | | | 1.33 | % | | | 1.32 | % | | | 1.43 | % |
| | | | | | |
Expenses, before waivers/reimbursements(d)‡ | | | 1.46 | %^ | | | 1.47 | % | | | 1.46 | % | | | 1.45 | % | | | 1.44 | % | | | 1.44 | % |
| | | | | | |
Net investment income(b) | | | 1.94 | %^ | | | .59 | % | | | 2.67 | % | | | 1.46 | % | | | 2.02 | % | | | 2.27 | % |
| | | | | | |
Portfolio turnover rate | | | 13 | % | | | 22 | % | | | 111 | % | | | 9 | % | | | 9 | % | | | 20 | % |
| | | | | | | | | | | | | | | | | | | | | | | | |
| |
‡ Expense ratios exclude the estimated acquired fund fees of the affiliated/unaffiliated underlying | |
portfolios | | | .39 | %^ | | | .40 | % | | | .34 | % | | | .41 | % | | | .38 | % | | | .05 | % |
See footnote summary on page 44.
| | |
| |
| abfunds.com | | AB WEALTH APPRECIATION STRATEGY | 41 |
FINANCIAL HIGHLIGHTS(continued)
Selected Data For A Share Of Beneficial Interest Outstanding Throughout Each Period
| | | | | | | | | | | | | | | | | | | | | | | | |
| | | Class K | |
| | | Six Months
Ended
February 28,
2019 (unaudited) | | | Year Ended August 31, | |
| | | 2018 | | | 2017 | | | 2016 | | | 2015 | | | 2014 | |
| | | | |
| | | | | | | | | | | | | | | | | | | | | | | | |
Net asset value, beginning of period | | | $ 16.87 | | | | $ 16.17 | | | | $ 14.97 | | | | $ 14.54 | | | | $ 15.66 | | | | $ 13.28 | |
| | | | |
Income From Investment Operations | | | | | | | | | | | | | | | | | | | | | | | | |
| | | | | | |
Net investment income(a)(b) | | | .17 | | | | .15 | | | | .48 | | | | .22 | | | | .28 | | | | .37 | |
| | | | | | |
Net realized and unrealized gain (loss) on investment transactions | | | (.87 | ) | | | 1.75 | | | | 1.55 | | | | .42 | | | | (1.07 | ) | | | 2.27 | |
| | | | |
Net increase (decrease) in net asset value from operations | | | (.70 | ) | | | 1.90 | | | | 2.03 | | | | .64 | | | | (.79 | ) | | | 2.64 | |
| | | | |
Less: Dividends and Distributions | | | | | | | | | | | | | | | | | | | | | | | | |
| | | | | | |
Dividends from net investment income | | | (.14 | ) | | | (.41 | ) | | | (.46 | ) | | | (.21 | ) | | | (.33 | ) | | | (.26 | ) |
| | | | | | |
Distributions from net realized gain on investment transactions | | | (.35 | ) | | | (.79 | ) | | | (.37 | ) | | | – 0 | – | | | – 0 | – | | | – 0 | – |
| | | | |
Total dividends and distributions | | | (.49 | ) | | | (1.20 | ) | | | (.83 | ) | | | (.21 | ) | | | (.33 | ) | | | (.26 | ) |
| | | | |
Net asset value, end of period | | | $ 15.68 | | | | $ 16.87 | | | | $ 16.17 | | | | $ 14.97 | | | | $ 14.54 | | | | $ 15.66 | |
| | | | |
| | | | | | |
Total Return | | | | | | | | | | | | | | | | | | | | | | | | |
| | | | | | |
Total investment return based on net asset value(c)* | | | (3.87 | )% | | | 12.01 | % | | | 14.22 | % | | | 4.48 | % | | | (5.07 | )% | | | 20.12 | % |
| | | | | | |
Ratios/Supplemental Data | | | | | | | | | | | | | | | | | | | | | | | | |
| | | | | | |
Net assets, end of period (000’s omitted) | | | $10,889 | | | | $11,729 | | | | $12,527 | | | | $16,346 | | | | $15,751 | | | | $17,865 | |
| | | | | | |
Ratio to average net assets of: | | | | | | | | | | | | | | | | | | | | | | | | |
| | | | | | |
Expenses, net of waivers/reimbursements(d)‡ | | | .79 | %^ | | | .78 | % | | | .99 | % | | | 1.01 | % | | | 1.01 | % | | | 1.12 | % |
| | | | | | |
Expenses, before waivers/reimbursements(d)‡ | | | 1.15 | %^ | | | 1.16 | % | | | 1.14 | % | | | 1.12 | % | | | 1.13 | % | | | 1.13 | % |
| | | | | | |
Net investment income(b) | | | 2.26 | %^ | | | .92 | % | | | 3.18 | % | | | 1.57 | % | | | 1.85 | % | | | 2.48 | % |
| | | | | | |
Portfolio turnover rate | | | 13 | % | | | 22 | % | | | 111 | % | | | 9 | % | | | 9 | % | | | 20 | % |
| | | | | | | | | | | | | | | | | | | | | | | | |
| |
‡ Expense ratios exclude the estimated acquired fund fees of the affiliated/unaffiliated underlying | |
portfolios | | | .39 | %^ | | | .40 | % | | | .34 | % | | | .41 | % | | | .38 | % | | | .05 | % |
See footnote summary on page 44.
| | |
| |
| 42 | AB WEALTH APPRECIATION STRATEGY | | abfunds.com |
FINANCIAL HIGHLIGHTS(continued)
Selected Data For A Share Of Beneficial Interest Outstanding Throughout Each Period
| | | | | | | | | | | | | | | | | | | | | | | | |
| | | Class I | |
| | | Six Months
Ended
February 28,
2019 (unaudited) | | | Year Ended August 31, | |
| | | 2018 | | | 2017 | | | 2016 | | | 2015 | | | 2014 | |
| | | | |
| | | | | | | | | | | | | | | | | | | | | | | | |
Net asset value, beginning of period | | | $ 16.96 | | | | $ 16.22 | | | | $ 15.02 | | | | $ 14.59 | | | | $ 15.72 | | | | $ 13.34 | |
| | | | |
Income From Investment Operations | | | | | | | | | | | | | | | | | | | | | | | | |
| | | | | | |
Net investment income(a)(b) | | | .20 | | | | .20 | | | | .50 | | | | .28 | | | | .62 | | | | .41 | |
| | | | | | |
Net realized and unrealized gain (loss) on investment transactions | | | (.88 | ) | | | 1.76 | | | | 1.58 | | | | .41 | | | | (1.36 | ) | | | 2.29 | |
| | | | |
Net increase (decrease) in net asset value from operations | | | (.68 | ) | | | 1.96 | | | | 2.08 | | | | .69 | | | | (.74 | ) | | | 2.70 | |
| | | | |
Less: Dividends and Distributions | | | | | | | | | | | | | | | | | | | | | | | | |
| | | | | | |
Dividends from net investment income | | | (.18 | ) | | | (.43 | ) | | | (.51 | ) | | | (.26 | ) | | | (.39 | ) | | | (.32 | ) |
| | | | | | |
Distributions from net realized gain on investment transactions | | | (.35 | ) | | | (.79 | ) | | | (.37 | ) | | | – 0 | – | | | – 0 | – | | | – 0 | – |
| | | | |
Total dividends and distributions | | | (.53 | ) | | | (1.22 | ) | | | (.88 | ) | | | (.26 | ) | | | (.39 | ) | | | (.32 | ) |
| | | | |
Net asset value, end of period | | | $ 15.75 | | | | $ 16.96 | | | | $ 16.22 | | | | $ 15.02 | | | | $ 14.59 | | | | $ 15.72 | |
| | | | |
| | | | | | |
Total Return | | | | | | | | | | | | | | | | | | | | | | | | |
| | | | | | |
Total investment return based on net asset value(c)* | | | (3.68 | )% | | | 12.41 | % | | | 14.56 | % | | | 4.82 | % | | | (4.72 | )% | | | 20.53 | % |
| | | | | | |
Ratios/Supplemental Data | | | | | | | | | | | | | | | | | | | | | | | | |
| | | | | | |
Net assets, end of period (000’s omitted) | | | $375 | | | | $367 | | | | $726 | | | | $1,743 | | | | $1,781 | | | | $4,576 | |
| | | | | | |
Ratio to average net assets of: | | | | | | | | | | | | | | | | | | | | | | | | |
| | | | | | |
Expenses, net of waivers/reimbursements(d)‡ | | | .46 | %^ | | | .45 | % | | | .66 | % | | | .69 | % | | | .68 | % | | | .79 | % |
| | | | | | |
Expenses, before waivers/reimbursements(d)‡ | | | .82 | %^ | | | .83 | % | | | .82 | % | | | .81 | % | | | .80 | % | | | .81 | % |
| | | | | | |
Net investment income(b) | | | 2.60 | %^ | | | 1.19 | % | | | 3.24 | % | | | 1.93 | % | | | 3.99 | % | | | 2.78 | % |
| | | | | | |
Portfolio turnover rate | | | 13 | % | | | 22 | % | | | 111 | % | | | 9 | % | | | 9 | % | | | 20 | % |
| | | | | | | | | | | | | | | | | | | | | | | | |
| |
‡ Expense ratios exclude the estimated acquired fund fees of the affiliated/unaffiliated underlying | |
portfolios | | | .39 | %^ | | | .40 | % | | | .34 | % | | | .41 | % | | | .38 | % | | | .05 | % |
See footnote summary on page 44.
| | |
| |
| abfunds.com | | AB WEALTH APPRECIATION STRATEGY | 43 |
FINANCIAL HIGHLIGHTS(continued)
Selected Data For A Share Of Beneficial Interest Outstanding Throughout Each Period
| (a) | Based on average shares outstanding. |
| (b) | Net of fees and expenses waived/reimbursed by the Adviser. |
| (c) | Total investment return is calculated assuming an initial investment made at the net asset value at the beginning of the period, reinvestment of all dividends and distributions at net asset value during the period, and redemption on the last day of the period. Initial sales charges or contingent deferred sales charges are not reflected in the calculation of total investment return. Total return does not reflect the deduction of taxes that a shareholder would pay on fund distributions or the redemption of fund shares. Total investment return calculated for a period of less than one year is not annualized. |
| (d) | In connection with the Fund’s investments in affiliated underlying portfolios, the Fund incurs no direct expenses, but bears proportionate shares of the fees and expenses (i.e., operating, administrative and investment advisory fees) of the affiliated underlying portfolios. The Adviser has contractually agreed to waive its fees from the Fund in an amount equal to the Fund’s pro rata share of certain acquired fund fees and expenses, and for the six months ended February 28, 2019 and the years ended August 31, 2018 and August 31, 2017, such waiver amounted to .37% (annualized), .37% and .16%, respectively. |
| (e) | Amount is less than $.005. |
| * | Includes the impact of proceeds received and credited to the Fund resulting from class action settlements, which enhanced the Fund’s performance for the years ended August 31, 2018 and August 31, 2017 by .05% and .05%, respectively. |
See notes to financial statements.
| | |
| |
| 44 | AB WEALTH APPRECIATION STRATEGY | | abfunds.com |
RESULTS OF SHAREHOLDERS MEETING
(unaudited)
A Special Meeting of Shareholders of The AB Portfolios (the “Company”)—AB Wealth Appreciation Strategy (the “Fund”) was held on October 11, 2018, and adjourned until December 11, 2018. A description of each proposal and the number of shares voted at the Meeting are as follows (the proposal numbers shown below correspond to the proposal number in the Fund’s proxy statement):
| 1. | To approve and vote upon the election of Trustees for the Company, each such Trustee to serve for a term of indefinite duration and until his or her successor is duly elected and qualifies. |
| | | | | | | | |
Trustee: | | Voted
For: | | | Authority
Withheld: | |
Michael J. Downey | | | 112,255,334 | | | | 2,874,198 | |
William H. Foulk, Jr.* | | | 112.062,437 | | | | 3,067,095 | |
Nancy P. Jacklin | | | 112,466,540 | | | | 2,662,992 | |
Robert M. Keith | | | 112,388,936 | | | | 2,740,596 | |
Carol C. McMullen | | | 112,486,090 | | | | 2,643,442 | |
Gary L. Moody | | | 112,308,212 | | | | 2,821,321 | |
Marshall C. Turner, Jr. | | | 112,101,288 | | | | 3,028,244 | |
Earl D. Weiner | | | 112,176,204 | | | | 2,953,328 | |
| 2. | To vote upon the approval of new advisory agreements for the Fund with AllianceBernstein L.P. |
| | | | | | | | | | | | | | |
Voted
For | | | Voted
Against | | | Abstained | | | Broker-Non
Votes | |
| | 31,111,631 | | | | 409,460 | | | | 1,360,097 | | | | 11,374,922 | |
| * | Mr. Foulk retired on December 31, 2018. |
| | |
| |
| abfunds.com | | AB WEALTH APPRECIATION STRATEGY | 45 |
TRUSTEES
| | |
Marshall C. Turner, Jr.(1),Chairman Michael J. Downey(1) Nancy P. Jacklin(1) | | Robert M. Keith,President and Chief Executive Officer Carol C. McMullen(1) Garry L. Moody(1) Earl D. Weiner(1) |
| |
| OFFICERS | | |
Ding Liu(2),Vice President Nelson Yu(2),Vice President Emilie D. Wrapp,Clerk Michael B. Reyes,Senior Analyst Joseph J. Mantineo,Treasurer and Chief Financial Officer | | Phyllis J. Clarke,Controller and Chief Accounting Officer Vincent S. Noto,ChiefCompliance Officer |
| | |
Custodian and Accounting Agent State Street Bank and Trust Company
State Street Corporation CCB/5
1 Iron Street
Boston, MA 02210 Principal Underwriter AllianceBernstein Investments, Inc.
1345 Avenue of the Americas
New York, NY 10105 Legal Counsel Seward & Kissel LLP
One Battery Park Plaza
New York, NY 10004 | | Transfer Agent AllianceBernstein Investor
Services, Inc.
P.O. Box 786003
San Antonio, TX 78278-6003
Toll-Free (800) 221-5672 Independent Registered Public Accounting Firm Ernst & Young LLP
5 Times Square
New York, NY 10036 |
| 1 | Member of the Audit Committee, the Governance and Nominating Committee and the Independent Directors Committee. |
| 2 | The day-to-day management of, and investment decisions for, the Strategy’s portfolio are made by the Adviser’s Multi-Asset Solutions Team. Messrs. Liu and Yu are the investment professionals primarily responsible for the day-to-day management of the AB Wealth Appreciation Strategy’s portfolio. |
| | |
| |
| 46 | AB WEALTH APPRECIATION STRATEGY | | abfunds.com |
Information Regarding the Review and Approval of the Fund’s Proposed New Advisory Agreement and Interim Advisory Agreement in the Context of Potential Assignments
As described in more detail in the Proxy Statement for the AB Funds dated August 20, 2018, the Boards of the AB Funds, at a meeting held onJuly 31-August 2, 2018, approved new advisory agreements with the Adviser (the “Proposed Agreements”) for the AB Funds, including The AB Portfolios in respect of AB Wealth Appreciation Strategy (the “Fund”), in connection with the planned disposition by AXA S.A. of its remaining shares of AXA Equitable Holdings, Inc. (the indirect holder of a majority of the partnership interests in the Adviser and the indirect parent of AllianceBernstein Corporation, the general partner of the Adviser) in one or more transactions and the related potential for one or more “assignments” (within the meaning of section 2(a)(4) of the Investment Company Act) of the advisory agreements for the AB Funds, including the Fund’s Advisory Agreement, resulting in the automatic termination of such advisory agreements.
At the same meeting, the AB Boards also considered and approved interim advisory agreements with the Adviser (the “Interim Advisory Agreements”) for the AB Funds, including the Fund, to be effective only in the event that stockholder approval of a Proposed Agreement had not been obtained as of the date of one or more transactions resulting in an “assignment” of the Adviser’s advisory agreements, resulting in the automatic termination of such advisory agreements.
The shareholders of the Fund subsequently approved the Proposed Agreements at an annual meeting of shareholders called for the purpose of electing Directors and voting on the Proposed Agreements.
A discussion regarding the basis for the Boards’ approvals at the meeting held onJuly 31-August 2, 2018 is set forth below.
At a meeting of the AB Boards held on July31-August 2, 2018, the Adviser presented its recommendation that the Boards consider and approve the Proposed Agreements. Section 15(c) of the 1940 Act provides that, after an initial period, a Fund’s Current Agreement and currentsub-advisory agreement, as applicable, will remain in effect only if the Board, including a majority of the Independent Directors, annually reviews and approves them. Each of the Current Agreements had been approved by a Board within theone-year period prior to approval of its related Proposed Agreement, except that the Current Agreements for certain FlexFee funds were approved in February 2017. In connection with their approval of the Proposed Agreements, the Boards considered their conclusions in connection with their most recent approvals of the Current Agreements, in particular in cases where the last approval of a Current Agreement was relatively recent, including the Boards’ general satisfaction with the nature and quality of services being provided and, as applicable, in the case of
| | |
| |
| abfunds.com | | AB WEALTH APPRECIATION STRATEGY | 47 |
certain Funds, actions taken or to be taken in an effort to improve investment performance or reduce expense ratios. The Directors also reviewed updated information provided by the Adviser in respect of each Fund. Also in connection with their approval of the Proposed Agreements, the Boards considered a representation made to them at that time by the Adviser that there were no additional developments not already disclosed to the Boards since their most recent approvals of the Current Agreements that would be a material consideration to the Boards in connection with their consideration of the Proposed Agreements, except for matters disclosed to the Boards by the Adviser. The Directors considered the fact that each Proposed Agreement would have corresponding terms and conditions identical to those of the corresponding Current Agreement with the exception of the effective date and initial term under the Proposed Agreement.
The Directors considered their knowledge of the nature and quality of the services provided by the Adviser to each Fund gained from their experience as directors or trustees of registered investment companies advised by the Adviser, their overall confidence in the Adviser’s integrity and competence they have gained from that experience, the Adviser’s initiative in identifying and raising potential issues with the Directors and its responsiveness, frankness and attention to concerns raised by the Directors in the past, including the Adviser’s willingness to consider and implement organizational and operational changes designed to improve investment results and the services provided to the Funds. The Directors noted that they have four regular meetings each year, at each of which they review extensive materials and information from the Adviser, including information on the investment performance of each Fund.
The Directors also considered all factors they believed relevant, including the specific matters discussed below. During the course of their deliberations, the Directors evaluated, among other things, the reasonableness of the management fees of the Funds they oversee. The Directors did not identify any particular information that wasall-important or controlling, and different Directors may have attributed different weights to the various factors. The Directors determined that the selection of the Adviser to manage the Funds, and the overall arrangements between the Funds and the Adviser, as provided in the Proposed Agreements, including the management fees, were fair and reasonable in light of the services performed under the Current Agreements and to be performed under the Proposed Agreements, expenses incurred and to be incurred and such other matters as the Directors considered relevant in the exercise of their business judgment. The material factors and conclusions that formed the basis for the Directors’ determinations included the following:
Nature, Extent and Quality of Services Provided
The Directors considered the scope and quality of services to be provided by the Adviser under the Proposed Agreements, including the quality of
| | |
| |
| 48 | AB WEALTH APPRECIATION STRATEGY | | abfunds.com |
the investment research capabilities of the Adviser and the other resources it has dedicated to performing services for the Funds. They also considered the information that had been provided to them by the Adviser concerning the anticipated implementation of the Plan and the Adviser’s representation that it did not anticipate that such implementation would affect the management or structure of the Adviser, have a material adverse effect on the Adviser, or adversely affect the quality of the services provided to the Funds by the Adviser and its affiliates. The Directors noted that the Adviser from time to time reviews each Fund’s investment strategies and from time to time proposes changes intended to improve the Fund’s relative or absolute performance for the Directors’ consideration. They also noted the professional experience and qualifications of each Fund’s portfolio management team and other senior personnel of the Adviser. The Directors also considered that certain Proposed Agreements, similar to the corresponding Current Agreements, provide that the Funds will reimburse the Adviser for the cost to it of providing certain clerical, accounting, administrative and other services to the Funds by employees of the Adviser or its affiliates. Requests for these reimbursements are made on a quarterly basis and subject to approval by the Directors. The Directors noted that the Adviser did not request any reimbursements from certain Funds in the Fund’s latest fiscal year reviewed. The Directors noted that the methodology to be used to determine the reimbursement amounts had been reviewed by an independent consultant retained by the Funds’ former Senior Officer/Independent Compliance Officer. The quality of administrative and other services, including the Adviser’s role in coordinating the activities of the Funds’ other service providers, also was considered. The Directors of each Fund concluded that, overall, they were satisfied with the nature, extent and quality of services to be provided to the Funds under the Proposed Agreement for the Fund.
Costs of Services to be Provided and Profitability
The Directors reviewed a schedule of the revenues and expenses and related notes indicating the profitability of each Fund to the Adviser for calendar years 2016 and 2017, as applicable, that had been prepared with an expense allocation methodology arrived at in consultation with an independent consultant retained by the Funds’ former Senior Officer/Independent Compliance Officer. The Directors noted the assumptions and methods of allocation used by the Adviser in preparing fund-specific profitability data and understood that there are a number of potentially acceptable allocation methodologies for information of this type. The Directors noted that the profitability information reflected all revenues and expenses of the Adviser’s relationship with a Fund, including those relating to its subsidiaries that provide transfer agency, distribution and brokerage services to the Fund, as applicable. The Directors recognized that it is difficult to make comparisons of the profitability of the Proposed Agreements with the profitability of fund advisory contracts for unaffiliated funds because comparative information is not generally publicly available and is
| | |
| |
| abfunds.com | | AB WEALTH APPRECIATION STRATEGY | 49 |
affected by numerous factors. The Directors focused on the profitability of the Adviser’s relationship with each Fund before taxes and distribution expenses, as applicable. The Directors noted that certain Funds were not profitable to the Adviser in one or more periods reviewed. The Directors concluded that the Adviser’s level of profitability from its relationship with the other Funds was not unreasonable. The Directors were unable to consider historical information about the profitability of certain Funds that had recently commenced operations and for which historical profitability information was not available. The Adviser agreed to provide the Directors with profitability information in connection with future proposed continuances of the Proposed Agreements.
Fall-Out Benefits
The Directors considered the other benefits to the Adviser and its affiliates from their relationships with the Funds, including, but not limited to, as applicable, benefits relating to soft dollar arrangements (whereby investment advisers receive brokerage and research services from brokers that execute agency transactions for their clients) in the case of certain Funds;12b-1 fees and sales charges received by the principal underwriter (which is a wholly owned subsidiary of the Adviser) in respect of certain classes of the shares of most of the Funds; brokerage commissions paid by certain Funds to brokers affiliated with the Adviser; and transfer agency fees paid by most of the Funds to a wholly owned subsidiary of the Adviser. The Directors recognized that the Adviser’s profitability would be somewhat lower, and that a Fund’s unprofitability to the Adviser would be exacerbated, without these benefits. The Directors understood that the Adviser also might derive reputational and other benefits from its association with the Funds.
Investment Results
In addition to the information reviewed by the Directors in connection with the Board meeting at which the Proposed Agreements were approved, the Directors receive detailed performance information for the Funds at each regular Board meeting during the year.
The Boards’ consideration of each Proposed Agreement was informed by their most recent approval of the related Current Agreement, and, in the case of certain Funds, their discussion with the Adviser of the reasons for those Funds’ underperformance in certain periods. The Directors also reviewed updated performance information and, in some cases, discussed with the Adviser the reasons for changes in performance or continued underperformance. On the basis of this review, the Directors concluded that each Fund’s investment performance was acceptable.
Management Fees and Other Expenses
The Directors considered the management fee rate payable by each Fund to the Adviser and information prepared by an independent service provider
| | |
| |
| 50 | AB WEALTH APPRECIATION STRATEGY | | abfunds.com |
(the ‘‘15(c) provider’’) concerning management fee rates payable by other funds in the same category as the Fund. The Directors recognized that it is difficult to make comparisons of management fees because there are variations in the services that are included in the fees paid by other funds. The Directors compared each Fund’s contractual management fee rate with a peer group median, and where applicable, took into account the impact on the management fee rate of the administrative expense reimbursement paid to the Adviser in the latest fiscal year. In the case of the ACS Funds, the Directors noted that the management fee rate is zero but also were cognizant that the Adviser is indirectly compensated by the wrap fee program sponsors that use the ACS Funds as an investment vehicle for their clients.
The Directors also considered the Adviser’s fee schedule for other clients pursuing a similar investment style to each Fund. For this purpose, they reviewed the relevant advisory fee information from the Adviser’s Form ADV and in a report from the Funds’ Senior Analyst and noted the differences between a Fund’s fee schedule, on the one hand, and the Adviser’s institutional fee schedule and the schedule of fees charged by the Adviser to any offshore funds and for services to anysub-advised funds pursuing a similar investment strategy as the Fund, on the other, as applicable. The Directors noted that the Adviser may, in some cases, agree to fee rates with large institutional clients that are lower than those reviewed by the Directors and that they had previously discussed with the Adviser its policies in respect of such arrangements. The Adviser also informed the Directors that, in the case of certain Funds, there were no institutional products managed by the Adviser that have a substantially similar investment style. The Directors also discussed these matters with their independent fee consultant.
The Adviser reviewed with the Directors the significantly greater scope of the services it provides to each Fund relative to institutional, offshore fund andsub-advised fund clients, as applicable. In this regard, the Adviser noted, among other things, that, compared to institutional and offshore orsub-advisory accounts, each Fund, as applicable, (i) demands considerably more portfolio management, research and trading resources due to significantly higher daily cash flows (in the case ofopen-end Funds); (ii) has more tax and regulatory restrictions and compliance obligations; (iii) must prepare and file or distribute regulatory and other communications about fund operations; and (iv) must provide shareholder servicing to retail investors. The Adviser also reviewed the greater legal risks presented by the large and changing population of Fund shareholders who may assert claims against the Adviser in individual or class actions, and the greater entrepreneurial risk in offering new fund products, which require substantial investment to launch, may not succeed, and generally must be priced to compete with larger, more established funds resulting in lack of profitability to the Adviser until a new fund achieves scale. In light of the substantial differences in services rendered by the Adviser to institutional,
| | |
| |
| abfunds.com | | AB WEALTH APPRECIATION STRATEGY | 51 |
offshore fund andsub-advised fund clients as compared to the Funds, and the different risk profile, the Directors considered these fee comparisons inapt and did not place significant weight on them in their deliberations.
The Directors noted that many of the Funds may invest in shares of exchange-traded funds (‘‘ETFs’’), subject to the restrictions and limitations of the 1940 Act as these may be varied as a result of exemptive orders issued by the SEC. The Directors also noted that ETFs pay advisory fees pursuant to their advisory contracts. The Directors concluded, based on the Adviser’s explanation of how it uses ETFs when they are the most cost-effective way to obtain desired exposures, in some cases pending purchases of underlying securities, that each Fund’s management fee would be for services that would be in addition to, rather than duplicative of, the services provided under the advisory contracts of the ETFs.
With respect to each Fund’s management fee, the Directors considered the total expense ratio of the Fund in comparison to a peer group and peer universe selected by the 15(c) service provider. The Directors also considered the Adviser’s expense caps for certain Funds. The Directors view expense ratio information as relevant to their evaluation of the Adviser’s services because the Adviser is responsible for coordinating services provided to a Fund by others.
The Boards’ consideration of each Proposed Agreement was informed by their most recent approval of the related Current Agreement, and, in the case of certain Funds, their discussion with the Adviser of the reasons for those Funds’ expense ratios in certain periods. The Directors also reviewed updated expense ratio information and, in some cases, discussed with the Adviser the reasons for the expense ratios of certain Funds. On the basis of this review, the Directors concluded that each Fund’s expense ratio was acceptable.
The Directors did not consider comparative expense information for the ACS Funds because those Funds do not bear ordinary expenses.
Economies of Scale
The Directors noted that the management fee schedules for certain Funds do not contain breakpoints and that they had discussed their strong preference for breakpoints in advisory contracts with the Adviser. The Directors took into consideration prior presentations by an independent consultant on economies of scale in the mutual fund industry and for the Funds, and by the Adviser concerning certain of its views on economies of scale. The Directors also had requested and received from the Adviser certain updates on economies of scale in advance of the Board meeting. The Directors believe that economies of scale may be realized (if at all) by the Adviser across a variety of products and services, and not only in respect of a single fund. The Directors noted that there is no established
| | |
| |
| 52 | AB WEALTH APPRECIATION STRATEGY | | abfunds.com |
methodology for setting breakpoints that give effect to the fund-specific services provided by a fund’s adviser and to the economies of scale that an adviser may realize in its overall mutual fund business or those components of it which directly or indirectly affect a fund’s operations. The Directors observed that in the mutual fund industry as a whole, as well as among funds similar to each Fund, there is no uniformity or pattern in the fees and asset levels at which breakpoints (if any) apply. The Directors also noted that the advisory agreements for many funds do not have breakpoints at all. The Directors informed the Adviser that they would monitor the asset levels of the Funds without breakpoints and their profitability to the Adviser and anticipated revisiting the question of breakpoints in the future if circumstances warrant doing so.
The Directors did not consider the extent to which fee levels in the Advisory Agreement for the ACS Funds reflect economies of scale because that Advisory Agreement does not provide for any compensation to be paid to the Adviser by the ACS Funds and the expense ratio of each of those Funds is zero.
Interim Advisory Agreements
In approving the Interim Advisory Agreements, the Boards, with the assistance of independent counsel, considered similar factors to those considered in approving the Proposed Agreements. The Interim Advisory Agreements approved by the Boards are identical to the Proposed Agreements, as well as the Current Agreements, in all material respects except for their proposed effective and termination dates and provisions intended to comply with the requirements of the relevant SEC rule, such as provisions requiring escrow of advisory fees. Under the Interim Advisory Agreements, the Adviser would continue to manage a Fund pursuant to an Interim Advisory Agreement until a new advisory agreement was approved by stockholders or until the end of the150-day period, whichever would occur earlier. All fees earned by the Adviser under an Interim Advisory Agreement would be held in escrow pending shareholder approval of the Proposed Agreement. Upon approval of a new advisory agreement by stockholders, the escrowed management fees would be paid to the Adviser, and the Interim Advisory Agreement would terminate.
Information Regarding the Review and Approval of the Fund’s Current Advisory Agreement
The disinterested trustees (the “directors”) of The AB Portfolios (the “Company”) unanimously approved the continuance of the Company’s Advisory Agreement with the Adviser in respect of AB Wealth Appreciation Strategy (the “Fund”) at a meeting held onJuly 31-August 2, 2018 (the “Meeting”).
Prior to approval of the continuance of the Advisory Agreement, the directors had requested from the Adviser, and received and evaluated,
| | |
| |
| abfunds.com | | AB WEALTH APPRECIATION STRATEGY | 53 |
extensive materials. They reviewed the proposed continuance of the Advisory Agreement with the Adviser and with experienced counsel who are independent of the Adviser, who advised on the relevant legal standards. The directors also reviewed additional materials, including materials from an outside consultant, who acted as their independent fee consultant, and comparative analytical data prepared by the Senior Analyst for the Fund. The directors also discussed the proposed continuance in private sessions with counsel.
The directors considered their knowledge of the nature and quality of the services provided by the Adviser to the Fund gained from their experience as directors or trustees of most of the registered investment companies advised by the Adviser, their overall confidence in the Adviser’s integrity and competence they have gained from that experience, the Adviser’s initiative in identifying and raising potential issues with the directors and its responsiveness, frankness and attention to concerns raised by the directors in the past, including the Adviser’s willingness to consider and implement organizational and operational changes designed to improve investment results and the services provided to the AB Funds. The directors noted that they have four regular meetings each year, at each of which they review extensive materials and information from the Adviser, including information on the investment performance of the Fund.
The directors also considered all factors they believed relevant, including the specific matters discussed below. During the course of their deliberations, the directors evaluated, among other things, the reasonableness of the advisory fee. The directors did not identify any particular information that wasall-important or controlling, and different directors may have attributed different weights to the various factors. The directors determined that the selection of the Adviser to manage the Fund and the overall arrangements between the Fund and the Adviser, as provided in the Advisory Agreement, including the advisory fee, were fair and reasonable in light of the services performed, expenses incurred and such other matters as the directors considered relevant in the exercise of their business judgment. The material factors and conclusions that formed the basis for the directors’ determinations included the following:
Nature, Extent and Quality of Services Provided
The directors considered the scope and quality of services provided by the Adviser under the Advisory Agreement, including the quality of the investment research capabilities of the Adviser and the other resources it has dedicated to performing services for the Fund. The directors noted that the Adviser from time to time reviews the Fund’s investment strategies and from time to time proposes changes intended to improve the Fund’s relative or absolute performance for the directors’ consideration. They also noted the professional experience and qualifications of the Fund’s portfolio management team and other senior personnel of the Adviser. The directors also considered that the Advisory Agreement provides that the Fund
| | |
| |
| 54 | AB WEALTH APPRECIATION STRATEGY | | abfunds.com |
will reimburse the Adviser for the cost to it of providing certain clerical, accounting, administrative and other services to the Fund by employees of the Adviser or its affiliates. Requests for these reimbursements are made on a quarterly basis and subject to approval by the directors. Reimbursements, to the extent requested and paid, result in a higher rate of total compensation from the Fund to the Adviser than the fee rate stated in the Advisory Agreement. The directors noted that the methodology used to determine the reimbursement amounts had been reviewed by an independent consultant retained by the Fund’s former Senior Officer/Independent Compliance Officer. The quality of administrative and other services, including the Adviser’s role in coordinating the activities of the Fund’s other service providers, also was considered. The directors concluded that, overall, they were satisfied with the nature, extent and quality of services provided to the Fund under the Advisory Agreement.
Costs of Services Provided and Profitability
The directors reviewed a schedule of the revenues and expenses and related notes indicating the profitability of the Fund to the Adviser for calendar years 2016 and 2017 that had been prepared with an expense allocation methodology arrived at in consultation with an independent consultant retained by the Fund’s former Senior Officer/Independent Compliance Officer. The directors noted the assumptions and methods of allocation used by the Adviser in preparing fund-specific profitability data and understood that there are a number of potentially acceptable allocation methodologies for information of this type. The directors noted that the profitability information reflected all revenues and expenses of the Adviser’s relationship with the Fund, including those relating to its subsidiaries that provide transfer agency, distribution and brokerage services to the Fund. The directors recognized that it is difficult to make comparisons of the profitability of the Advisory Agreement with the profitability of fund advisory contracts for unaffiliated funds because comparative information is not generally publicly available and is affected by numerous factors. The directors focused on the profitability of the Adviser’s relationship with the Fund before taxes and distribution expenses. The directors concluded that the Adviser’s level of profitability from its relationship with the Fund was not unreasonable.
Fall-Out Benefits
The directors considered the other benefits to the Adviser and its affiliates from their relationships with the Fund and the underlying funds advised by the Adviser in which the Fund invests, including, but not limited to, benefits relating to soft dollar arrangements (whereby investment advisers receive brokerage and research services from brokers that execute agency transactions for their clients);12b-1 fees and sales charges received by the Fund’s principal underwriter (which is a wholly owned subsidiary of the Adviser) in respect of certain classes of the Fund’s shares; brokerage commissions paid by the Fund to brokers affiliated with the Adviser; and
| | |
| |
| abfunds.com | | AB WEALTH APPRECIATION STRATEGY | 55 |
transfer agency fees paid by the Fund to a wholly owned subsidiary of the Adviser. The directors recognized that the Adviser’s profitability would be somewhat lower without these benefits. The directors understood that the Adviser also might derive reputational and other benefits from its association with the Fund.
Investment Results
In addition to the information reviewed by the directors in connection with the Meeting at which continuance of the Advisory Agreement was approved, the directors receive detailed performance information for the Fund at each regular Board meeting during the year.
At the Meeting, the directors reviewed performance information prepared by an independent service provider (the “15(c) service provider”), showing the performance of the Class A Shares of the Fund against a group of similar funds (“peer group”) and a larger group of similar funds (“peer universe”), each selected by the 15(c) service provider, and information prepared by the Adviser showing performance of the Class A Shares against a broad-based securities market index, in each case for the1-,3-,5- and10-year periods ended May 31, 2018 and (in the case of comparisons with the broad-based securities market index) for the period from inception. Based on their review, the directors concluded that the Fund’s investment performance was acceptable.
Advisory Fees and Other Expenses
The directors considered the advisory fee rate payable by the Fund to the Adviser and information prepared by the 15(c) service provider concerning advisory fee rates payable by other funds in the same category as the Fund. The directors recognized that it is difficult to make comparisons of advisory fees because there are variations in the services that are included in the fees paid by other funds. The directors compared the Fund’s contractual effective advisory fee rate with a peer group median and took into account the impact on the advisory fee rate of the administrative expense reimbursement paid to the Adviser in the latest fiscal year.
The directors also considered the Adviser’s fee schedule for other clients pursuing a similar investment style. For this purpose, they reviewed the relevant advisory fee information from the Adviser’s Form ADV and in a report from the Fund’s Senior Analyst and noted the differences between the Fund’s fee schedule, on the one hand, and the Adviser’s institutional fee schedule, on the other. The directors noted that the Adviser may, in some cases, agree to fee rates with large institutional clients that are lower than those reviewed by the directors and that they had previously discussed with the Adviser its policies in respect of such arrangements. The directors also discussed these matters with their independent fee consultant.
The Adviser reviewed with the directors the significantly greater scope of the services it provides to the Fund relative to institutional clients. In this
| | |
| |
| 56 | AB WEALTH APPRECIATION STRATEGY | | abfunds.com |
regard, the Adviser noted, among other things, that, compared to institutional accounts, the Fund (i) demands considerably more portfolio management, research and trading resources due to significantly higher daily cash flows; (ii) has more tax and regulatory restrictions and compliance obligations; (iii) must prepare and file or distribute regulatory and other communications about fund operations; and (iv) must provide shareholder servicing to retail investors. The Adviser also reviewed the greater legal risks presented by the large and changing population of Fund shareholders who may assert claims against the Adviser in individual or class actions, and the greater entrepreneurial risk in offering new fund products, which require substantial investment to launch, may not succeed, and generally must be priced to compete with larger, more established funds resulting in lack of profitability to the Adviser until a new fund achieves scale. In light of the substantial differences in services rendered by the Adviser to institutional clients as compared to the Fund, the directors considered these fee comparisons inapt and did not place significant weight on them in their deliberations.
The directors noted that the Fund may invest in shares of exchange-traded funds (“ETFs”), subject to the restrictions and limitations of the Investment Company Act of 1940 as these may be varied as a result of exemptive orders issued by the SEC. The directors also noted that ETFs pay advisory fees pursuant to their advisory contracts, and that the Adviser had provided, and they had reviewed, information about the expense ratios of the relevant ETFs. The directors concluded, based on the Adviser’s explanation of how it uses ETFs when they are the most cost-effective way to obtain desired exposures, in some cases pending purchases of underlying securities, that the advisory fee for the Fund is for services that are in addition to, rather than duplicative of, the services provided under the advisory contracts of the ETFs.
The directors also considered the total expense ratio of the Class A shares of the Fund in comparison to a peer group and a peer universe selected by the 15(c) service provider. The Class A expense ratio of the Fund was based on the Fund’s latest fiscal year. The directors noted that it was likely that the expense ratios of some of the other funds in the Fund’s category were lowered by waivers or reimbursements by those funds’ investment advisers, which in some cases might be voluntary or temporary. The directors view expense ratio information as relevant to their evaluation of the Adviser’s services because the Adviser is responsible for coordinating services provided to the Fund by others. Based on their review, the directors concluded that the Fund’s expense ratio was acceptable.
Economies of Scale
The directors noted that the advisory fee schedules for the Fund contains breakpoints that reduce the fee rates on assets above specified levels. The directors took into consideration prior presentations by an independent
| | |
| |
| abfunds.com | | AB WEALTH APPRECIATION STRATEGY | 57 |
consultant on economies of scale in the mutual fund industry and for the AB Funds, and by the Adviser concerning certain of its views on economies of scale. The directors also had requested and received from the Adviser certain updates on economies of scale in advance of the Meeting. The directors believe that economies of scale may be realized (if at all) by the Adviser across a variety of products and services, and not only in respect of a single fund. The directors noted that there is no established methodology for setting breakpoints that give effect to the fund-specific services provided by a fund’s adviser and to the economies of scale that an adviser may realize in its overall mutual fund business or those components of it which directly or indirectly affect a fund’s operations. The directors observed that in the mutual fund industry as a whole, as well as among funds similar to the Fund, there is no uniformity or pattern in the fees and asset levels at which breakpoints (if any) apply. The directors also noted that the advisory agreements for many funds do not have breakpoints at all. Having taken these factors into account, the directors concluded that the Fund’s shareholders would benefit from a sharing of economies of scale in the event the Fund’s net assets exceed a breakpoint in the future.
| | |
| |
| 58 | AB WEALTH APPRECIATION STRATEGY | | abfunds.com |
This page is not part of the Shareholder Report or the Financial Statements.
AB FAMILY OF FUNDS
US EQUITY
US CORE
Core Opportunities Fund
FlexFee™ US Thematic Portfolio
Select US Equity Portfolio
US GROWTH
Concentrated Growth Fund
Discovery Growth Fund
FlexFee™ Large Cap Growth Portfolio
Growth Fund
Large Cap Growth Fund
Small Cap Growth Portfolio
US VALUE
Discovery Value Fund
Equity Income Fund
Relative Value Fund
Small Cap Value Portfolio
Value Fund
INTERNATIONAL/ GLOBAL EQUITY
INTERNATIONAL/ GLOBAL CORE
FlexFee™ International Strategic Core Portfolio
Global Core Equity Portfolio
International Portfolio
International Strategic Core Portfolio
Sustainable Global Thematic Fund
Tax-Managed International Portfolio
Tax-Managed Wealth Appreciation Strategy
Wealth Appreciation Strategy
INTERNATIONAL/ GLOBAL GROWTH
Concentrated International Growth Portfolio
FlexFee™ Emerging Markets Growth Portfolio
INTERNATIONAL/ GLOBAL EQUITY(continued)
Sustainable International Thematic Fund
INTERNATIONAL/ GLOBAL VALUE
All China Equity Portfolio
International Value Fund
FIXED INCOME
MUNICIPAL
High Income Municipal Portfolio
Intermediate California Municipal Portfolio
Intermediate Diversified Municipal Portfolio
Intermediate New York Municipal Portfolio
Municipal Bond Inflation Strategy
Tax-Aware Fixed Income Portfolio
National Portfolio
Arizona Portfolio
California Portfolio
Massachusetts Portfolio
Minnesota Portfolio
New Jersey Portfolio
New York Portfolio
Ohio Portfolio
Pennsylvania Portfolio
Virginia Portfolio
TAXABLE
Bond Inflation Strategy
FlexFee™ High Yield Portfolio
FlexFee™ International Bond Portfolio
Global Bond Fund
High Income Fund
Income Fund
Intermediate Bond Portfolio
Limited Duration High Income Portfolio
Short Duration Portfolio
ALTERNATIVES
All Market Real Return Portfolio
Global Real Estate Investment Fund
Select US Long/Short Portfolio
Unconstrained Bond Fund
MULTI-ASSET
All Market Income Portfolio
All Market Total Return Portfolio
Conservative Wealth Strategy
Emerging Markets Multi-Asset Portfolio
Global Risk Allocation Fund
Tax-Managed All Market Income Portfolio
TARGET-DATE
Multi-Manager Select Retirement Allocation Fund
Multi-Manager Select 2010 Fund
Multi-Manager Select 2015 Fund
Multi-Manager Select 2020 Fund
Multi-Manager Select 2025 Fund
Multi-Manager Select 2030 Fund
Multi-Manager Select 2035 Fund
Multi-Manager Select 2040 Fund
Multi-Manager Select 2045 Fund
Multi-Manager Select 2050 Fund
Multi-Manager Select 2055 Fund
Multi-Manager Select 2060 Fund
CLOSED-END FUNDS
Alliance California Municipal Income Fund
AllianceBernstein Global High Income Fund
AllianceBernstein National Municipal Income Fund
We also offer Government Money Market Portfolio, which serves as the money market fund exchange vehicle for the AB mutual funds. You could lose money by investing in the Fund. Although the Fund seeks to preserve the value of your investment at $1.00 per share, it cannot guarantee it will do so. The Fund may impose a fee upon sale of your shares or may temporarily suspend your ability to sell shares if the Fund’s liquidity falls below required minimums because of market conditions or other factors. An investment in the Fund is not insured or guaranteed by the Federal Deposit Insurance Corporation or any other government agency. The Fund’s sponsor has no legal obligation to provide financial support to the Fund, and you should not expect that the sponsor will provide financial support to the Fund at any time.
Investors should consider the investment objectives, risks, charges and expenses of the Fund carefully before investing. For copies of our prospectus or summary prospectus, which contain this and other information, visit us online at www.abfunds.com or contact your AB representative. Please read the prospectus and/or summary prospectus carefully before investing.
| | |
| |
| abfunds.com | | AB WEALTH APPRECIATION STRATEGY | 59 |
NOTES
| | |
| |
| 60 | AB WEALTH APPRECIATION STRATEGY | | abfunds.com |
AB WEALTH APPRECIATION STRATEGY
1345 Avenue of the Americas
New York, NY 10105
800 221 5672
WA-0152-0219 
ITEM 2. CODE OF ETHICS.
Not applicable when filing a semi-annual report to shareholders.
ITEM 3. AUDIT COMMITTEE FINANCIAL EXPERT.
Not applicable when filing a semi-annual report to shareholders.
ITEM 4. PRINCIPAL ACCOUNTANT FEES AND SERVICES.
Not applicable when filing a semi-annual report to shareholders.
ITEM 5. AUDIT COMMITTEE OF LISTED REGISTRANTS.
Not applicable to the registrant.
ITEM 6. SCHEDULE OF INVESTMENTS.
Please see Schedule of Investments contained in the Report to Shareholders included under Item 1 of this FormN-CSR.
ITEM 7. DISCLOSURE OF PROXY VOTING POLICIES AND PROCEDURES FORCLOSED-END MANAGEMENT INVESTMENT COMPANIES.
Not applicable to the registrant.
ITEM 8. PORTFOLIO MANAGERS OFCLOSED-END MANAGEMENT INVESTMENT COMPANIES.
Not applicable to the registrant.
ITEM 9. PURCHASES OF EQUITY SECURITIES BYCLOSED-END MANAGEMENT INVESTMENT COMPANY AND AFFILIATED PURCHASERS.
Not applicable to the registrant.
ITEM 10. SUBMISSION OF MATTERS TO A VOTE OF SECURITY HOLDERS.
There have been no material changes to the procedures by which shareholders may recommend nominees to the Fund’s Board of Directors since the Fund last provided disclosure in response to this item.
ITEM 11. CONTROLS AND PROCEDURES.
(a) The registrant’s principal executive officer and principal financial officer have concluded that the registrant’s disclosure controls and procedures (as defined in Rule30a-2(c) under the Investment Company Act of 1940, as amended) are effective at the reasonable assurance level based on their evaluation of these controls and procedures as of a date within 90 days of the filing date of this document.
(b) There were no changes in the registrant’s internal controls over financial reporting that occurred during the second fiscal quarter of the period that has materially affected, or is reasonably likely to materially affect, the registrant’s internal control over financial reporting.
ITEM 12. EXHIBITS.
The following exhibits are attached to this FormN-CSR:
| | |
EXHIBIT NO. | | DESCRIPTION OF EXHIBIT |
| |
| 12 (b) (1) | | Certification of Principal Executive Officer Pursuant to Section 302 of the Sarbanes-Oxley Act of 2002 |
| |
| 12 (b) (2) | | Certification of Principal Financial Officer Pursuant to Section 302 of the Sarbanes-Oxley Act of 2002 |
| |
| 12 (c) | | Certification of Principal Executive Officer and Principal Financial Officer Pursuant to Section 906 of theSarbanes-Oxley Act of 2002 |
SIGNATURES
Pursuant to the requirements of the Securities Exchange Act of 1934 and the Investment Company Act of 1940, the registrant has duly caused this report to be signed on its behalf by the undersigned, thereunto duly authorized.
(Registrant): The AB Portfolios
| | |
| By: | | /s/ Robert M. Keith |
| | Robert M. Keith |
| | President |
| |
| Date: | | April 26, 2019 |
Pursuant to the requirements of the Securities Exchange Act of 1934 and the Investment Company Act of 1940, this report has been signed below by the following persons on behalf of the registrant and in the capacities and on the dates indicated.
| | |
| By: | | /s/ Robert M. Keith |
| | Robert M. Keith |
| | President |
| |
| Date: | | April 26, 2019 |
| |
| By: | | /s/ Joseph J. Mantineo |
| | Joseph J. Mantineo |
| | Treasurer and Chief Financial Officer |
| |
| Date: | | April 26, 2019 |