UNITED STATES
SECURITIES AND EXCHANGE COMMISSION
WASHINGTON, D.C. 20549
FORM N-CSR
CERTIFIED SHAREHOLDER REPORT OF REGISTERED
MANAGEMENT INVESTMENT COMPANIES
Investment Company Act file number: 811-05088
THE AB PORTFOLIOS
(Exact name of registrant as specified in charter)
1345 Avenue of the Americas, New York, New York 10105
(Address of principal executive offices) (Zip code)
Joseph J. Mantineo
AllianceBernstein L.P.
1345 Avenue of the Americas
New York, New York 10105
(Name and address of agent for service)
Registrant’s telephone number, including area code: (800) 221-5672
Date of fiscal year end: August 31, 2021
Date of reporting period: February 28, 2021
| ITEM 1. | REPORTS TO STOCKHOLDERS. |
FEB 02.28.21

SEMI-ANNUAL REPORT
AB ALL MARKET TOTAL RETURN PORTFOLIO

As of January 1, 2021, as permitted by new regulations adopted by the Securities and Exchange Commission, the Fund’s annual and semi-annual shareholder reports are no longer sent by mail, unless you specifically requested paper copies of the reports. Instead, the reports are made available on a website, and you will be notified by mail each time a report is posted and provided with a website address to access the report.
You may elect to receive all future reports in paper form free of charge. If you invest through a financial intermediary, you can contact your financial intermediary to request that you continue to receive paper copies of your shareholder reports; if you invest directly with the Fund, you can call the Fund at (800) 221 5672. Your election to receive reports in paper form will apply to all funds held in your account with your financial intermediary or, if you invest directly, to all AB Mutual Funds you hold.
| | |
| |
| Investment Products Offered | | • Are Not FDIC Insured • May Lose Value • Are Not Bank Guaranteed |
Investors should consider the investment objectives, risks, charges and expenses of the Fund carefully before investing. For copies of our prospectus or summary prospectus, which contain this and other information, visit us online at www.abfunds.com or contact your AB representative. Please read the prospectus and/or summary prospectus carefully before investing.
This shareholder report must be preceded or accompanied by the Fund’s prospectus for individuals who are not current shareholders of the Fund.
You may obtain a description of the Fund’s proxy voting policies and procedures, and information regarding how the Fund voted proxies relating to portfolio securities during the most recent 12-month period ended June 30, without charge. Simply visit AB’s website at www.abfunds.com, or go to the Securities and Exchange Commission’s (the “Commission”) website at www.sec.gov, or call AB at (800) 227 4618.
The Fund files its complete schedule of portfolio holdings with the Commission for the first and third quarters of each fiscal year as an exhibit to its reports on Form N-PORT. The Fund’s Form N-PORT reports are available on the Commission’s website at www.sec.gov. The Fund’s Forms N-PORT may also be reviewed and copied at the Commission’s Public Reference Room in Washington, DC; information on the operation of the Public Reference Room may be obtained by calling (800) SEC 0330. AB publishes full portfolio holdings for the Fund monthly at www.abfunds.com.
AllianceBernstein Investments, Inc. (ABI) is the distributor of the AB family of mutual funds. ABI is a member of FINRA and is an affiliate of AllianceBernstein L.P., the Adviser of the funds.
The [A/B] logo is a registered service mark of AllianceBernstein and AllianceBernstein® is a registered service mark used by permission of the owner, AllianceBernstein L.P.
| | |
| FROM THE PRESIDENT | |  |
Dear Shareholder,
We’re pleased to provide this report for the AB All Market Total Return Portfolio (the “Fund”). Please review the discussion of Fund performance, the market conditions during the reporting period and the Fund’s investment strategy.
At AB, we’re striving to help our clients achieve better outcomes by:
| + | | Fostering diverse perspectives that give us a distinctive approach to navigating global capital markets |
| + | | Applying differentiated investment insights through a connected global research network |
| + | | Embracing innovation to design better ways to invest and leading-edge mutual-fund solutions |
Whether you’re an individual investor or a multibillion-dollar institution, we’re putting our knowledge and experience to work for you every day.
For more information about AB’s comprehensive range of products and shareholder resources, please log on to www.abfunds.com.
Thank you for your investment in AB mutual funds—and for placing your trust in our firm.
Sincerely,

Onur Erzan
President and Chief Executive Officer, AB Mutual Funds
| | |
| |
| abfunds.com | | AB ALL MARKET TOTAL RETURN PORTFOLIO | 1 |
SEMI-ANNUAL REPORT
April 8, 2021
This report provides management’s discussion of fund performance for the AB All Market Total Return Portfolio for the semi-annual reporting period ended February 28, 2021.
The Fund’s investment objective is to achieve the highest total return consistent with the Adviser’s determination of reasonable risk.
NAV RETURNS AS OF FEBRUARY 28, 2021 (unaudited)
| | | | | | | | |
| | |
| | | 6 Months | | | 12 Months | |
| | |
| AB ALL MARKET TOTAL RETURN PORTFOLIO | | | | | | | | |
| | |
| Class A Shares | | | 7.75% | | | | 9.96% | |
| | |
| Class C Shares | | | 7.44% | | | | 9.17% | |
| | |
| Advisor Class Shares1 | | | 7.93% | | | | 10.26% | |
| | |
| Class R Shares1 | | | 7.57% | | | | 9.57% | |
| | |
| Class K Shares1 | | | 7.69% | | | | 9.83% | |
| | |
| Class I Shares1 | | | 7.89% | | | | 10.20% | |
| | |
| Primary Benchmark: MSCI ACWI (net) | | | 13.04% | | | | 30.25% | |
| | |
Bloomberg Barclays Global Aggregate Bond Index
(USD hedged) | | | -0.85% | | | | 0.32% | |
| 1 | Please note that these share classes are for investors purchasing shares through accounts established under certain fee-based programs sponsored and maintained by certain broker-dealers and financial intermediaries, institutional pension plans and/or investment advisory clients of, and certain other persons associated with, the Adviser and its affiliates or the Fund. |
INVESTMENT RESULTS
The table above shows the Fund’s performance compared to its primary benchmark, the Morgan Stanley Capital International All Country World Index (“MSCI ACWI”) (net), and the Bloomberg Barclays Global Aggregate Bond Index (USD hedged) for the six- and 12-month periods ended February 28, 2021.
All share classes of the Fund underperformed the primary benchmark and outperformed the Bloomberg Barclays Global Aggregate Bond Index (USD hedged) for both periods, before sales charges.
During both periods, equity markets performed well, and therefore, the Fund’s more diversified approach, which balances exposures to equities, bonds, commodities and alternative strategies, underperformed the all-equity benchmark. Overall allocations within equities detracted from absolute performance, while allocations within fixed-income assets and
| | |
| |
2 | AB ALL MARKET TOTAL RETURN PORTFOLIO | | abfunds.com |
alternative strategies contributed to performance in both periods. During the six-month period, security selection within equities and alternative strategies contributed, while selection within fixed-income assets detracted. Security selection within all three asset classes detracted during the 12-month period.
The Fund utilized derivatives for hedging and investment purposes in the form of futures, currency forwards and inflation Consumer Price Index swaps, which contributed to absolute performance for both periods, while total return swaps detracted; credit default swaps and variance swaps contributed for the six-month period, but detracted for the 12-month period; interest rate swaps and purchased swaptions detracted for the six-month period, but contributed for the 12-month period; written options had no material impact on performance for the six-month period, but detracted for the 12-month period.
MARKET REVIEW AND INVESTMENT STRATEGY
Global equities, supported by extensive monetary and fiscal stimulus, continued to recover from lows triggered by the COVID-19 pandemic and recorded positive returns for the six-month period ended February 28, 2021. Equity markets suffered a setback at the beginning of the period as volatility and style rotation, including a broad sell-off of mega-cap technology stocks, prevailed. Favorable news about the efficacy of potential coronavirus vaccines helped offset market volatility that was prompted by the continued spread of the virus in many countries, a potentially contested US presidential election and lack of additional US fiscal stimulus. Later, despite the emergence of seemingly more transmissible strains of the virus—a significant decline in new cases, the acceleration of vaccine distribution, and positive signs that a $1.9 trillion relief package would be approved supported global equity markets. As the period drew to a close, the emergence of inflationary fears, especially in the US, precipitated a sharp rise in long-term government bond yields and an accompanying correction in equities. Rising longer-term interest rates pressured the valuations of many market-leading technology and growth stocks, especially in the US, boosting a rotation into more cyclical and value-oriented stocks. For the semi-annual period, small-cap stocks substantially outperformed large-cap stocks on a relative basis, and periods of market rotation led large and small value-style stocks to outperform their growth-style peers.
Global fixed-income market returns were mixed, with an elevated amount of volatility and dispersion between credit sectors over the six-month period. Developed-market government bonds were negative, and US Treasury bonds underperformed other major markets as longer-term US interest rates rose from a low in September 2020. Risk assets began to significantly rise, beginning in November, when positive vaccine news extended the credit rally. Emerging- and developed-market high-yield corporate bonds led gains with significant positive returns as investors searched for higher yields in a period of historically low interest rates.
| | |
| |
| abfunds.com | | AB ALL MARKET TOTAL RETURN PORTFOLIO | 3 |
Emerging-market local-currency bonds also had strong positive results. Globally, developed-market investment-grade corporate bonds had positive results and outperformed global treasuries, but returns were slightly negative in the US. Securitized assets also outperformed treasuries with slightly negative results. The US dollar fell against most developed-market currencies and was mixed relative to emerging-market currencies. Brent crude oil prices rebounded by 46% on the improved economic outlook and OPEC+ production cuts. Copper gained almost 35% from increased demand for infrastructure and green energy initiatives. Gold prices fell over 12% due to the improved economic landscape, following a large advance earlier in calendar year, and as a non-interest-bearing asset in a rising rate environment.
The Fund’s Senior Investment Management Team (the “Team”) strives to provide the highest total return consistent with reasonable risk. The Team’s global multi-asset strategy focuses on growth and defensively managing market volatility. The Team utilizes a rigorous quantitative research toolset with fundamental expertise across all regions and markets.
INVESTMENT POLICIES
The Adviser allocates the Fund’s investments primarily among a number of asset classes, including equity securities, fixed-income securities, and a number of alternative asset classes and alternative investment strategies. The Fund pursues a global strategy, typically investing in securities of issuers located in the United States and in other countries throughout the world, including emerging-market countries. Under normal circumstances, at least 40% of the Fund’s net assets will be invested in securities of non-US issuers.
The Fund’s investments in equity securities of issuers consist primarily of securities of large-capitalization companies, but include securities of small- and mid-capitalization companies to a lesser extent, and include derivatives related to equity securities. In selecting equity securities for the Fund, the Adviser uses fundamental and quantitative analysis with the goal of generating returns primarily from security selection rather than price movements in equity securities generally. Fixed-income securities include corporate and sovereign debt securities as well as interest rate derivatives and credit derivatives such as credit default swaps. Fixed-income securities also include debt securities with lower credit ratings (commonly known as “junk bonds”). In selecting fixed-income securities for the Fund, the Adviser attempts to take advantage of inefficiencies that it believes exist in the global fixed-income markets. These inefficiencies arise from investor behavior, market complexity and the investment limitations to which investors are subject.
(continued on next page)
| | |
| |
4 | AB ALL MARKET TOTAL RETURN PORTFOLIO | | abfunds.com |
Alternative investments include various instruments, the returns on which are expected to have low correlation with returns on equity and fixed-income securities, such as commodities and related derivatives, real estate-related securities and inflation-indexed securities. Alternative investment strategies that may be pursued by the Fund directly or indirectly through investment in other registered investment companies include (i) long/short equity strategies through which the Fund takes long positions in certain securities in the expectation that they will increase in value and takes short positions in other securities in the expectation that they will decrease in value; (ii) strategies that consider macroeconomic and technical factors to identify and exploit opportunities across global asset classes; and (iii) event-driven strategies that invest in the securities of companies that are expected to become the subject of major corporate events and companies in which an active role in company management has been taken or sought by a third-party investor.
The Adviser adjusts the Fund’s asset class exposure utilizing both fundamental analysis and the Adviser’s Dynamic Asset Allocation (“DAA”) approach. DAA comprises a series of analytical and forecasting tools employed by the Adviser to gauge fluctuations in the risk/return profile of various asset classes. DAA seeks to adjust the Fund’s investment exposure in changing market conditions and thereby reduce overall portfolio volatility by mitigating the effects of market fluctuations, while preserving consistent long-term return potential. For example, the Adviser may seek to reduce the Fund’s risk exposure to one or more asset classes when DAA suggests that market risks relevant to those asset classes are rising but return opportunities are declining. In addition to merely increasing or decreasing asset class exposure by buying or selling securities of that asset class, the Adviser may pursue DAA implementation for the Fund by utilizing derivatives.
The Adviser intends to utilize a variety of derivatives in its management of the Fund. As noted above, the Adviser may use derivatives to gain exposure to various asset classes, and may cause the Fund to enter into derivatives in making the adjustments called for by DAA. As a result of the use of derivatives, the Fund will frequently be leveraged, with net investment exposure substantially in excess of net assets.
While the Fund may seek to gain exposure to physical commodities traded in the commodities markets through investments in a variety of derivative instruments, the Adviser expects that the Fund seeks to gain such exposure to commodities and commodities-related instruments and derivatives primarily through investments in AB All Market Total Return Portfolio (Cayman), Ltd., a wholly owned subsidiary of the
(continued on next page)
| | |
| |
| abfunds.com | | AB ALL MARKET TOTAL RETURN PORTFOLIO | 5 |
Fund organized under the laws of the Cayman Islands (the “Subsidiary”). The Subsidiary is advised by the Adviser and has the same investment objective and substantially similar investment policies and restrictions as the Fund except that the Subsidiary, unlike the Fund, may invest, without limitation, in commodities and commodities-related instruments. The Fund is subject to the risks associated with the commodities, derivatives and other instruments in which the Subsidiary invests, to the extent of its investment in the Subsidiary. The Fund limits its investment in the Subsidiary to no more than 25% of its total assets. Investment in the Subsidiary is expected to provide the Fund with commodity exposure within the limitations of federal tax requirements that apply to the Fund.
Currency exchange rate fluctuations can have a dramatic impact on returns. The Fund’s foreign currency exposures will come from investment in securities priced or denominated in foreign currencies and from direct holdings in foreign currencies and currency-related derivatives. The Adviser may seek to hedge all or a portion of the currency exposure resulting from Fund investments or decide not to hedge this exposure. The Adviser may seek investment opportunities by taking long or short positions in currencies through the use of currency-related derivatives.
| | |
| |
6 | AB ALL MARKET TOTAL RETURN PORTFOLIO | | abfunds.com |
DISCLOSURES AND RISKS
Benchmark Disclosure
All indices are unmanaged and do not reflect fees and expenses associated with the active management of a mutual fund portfolio. The MSCI ACWI (net, free float-adjusted, market capitalization weighted) represents the equity market performance of developed and emerging markets. The Bloomberg Barclays Global Aggregate Bond Index (USD hedged) represents the performance of global investment-grade developed fixed-income markets, hedged to the US dollar. MSCI makes no express or implied warranties or representations, and shall have no liability whatsoever with respect to any MSCI data contained herein. The MSCI data may not be further redistributed or used as a basis for other indices, any securities or financial products. This report is not approved, reviewed or produced by MSCI. Net returns include the reinvestment of dividends after deduction of non-US withholding tax. An investor cannot invest directly in an index or average, and their results are not indicative of the performance for any specific investment, including the Fund.
A Word About Risk
Market Risk: The value of the Fund’s assets will fluctuate as the stock, bond or commodities markets fluctuate. The value of its investments may decline, sometimes rapidly and unpredictably, simply because of economic changes or other events, including public health crises (including the occurrence of a contagious disease or illness), that affect large portions of the market. It includes the risk that a particular style of investing, such as growth or value, may be underperforming the stock market generally.
Allocation Risk: The allocation of investments among different investment styles, such as equity or debt, growth or value, US or non-US securities, or diversification strategies, may have a more significant effect on the Fund’s net asset value (“NAV”) when one of these investments is performing more poorly than another.
Credit Risk: An issuer or guarantor of a fixed-income security, or the counterparty to a derivatives or other contract, may be unable or unwilling to make timely payments of interest or principal, or to otherwise honor its obligations. The issuer or guarantor may default, causing a loss of the full principal amount of a security and accrued interest. The degree of risk for a particular security may be reflected in its credit rating. There is the possibility that the credit rating of a fixed-income security may be downgraded after purchase, which may adversely affect the value of the security. Investments in fixed-income securities with lower ratings (commonly known as “junk bonds”) are subject to a higher probability that an issuer will default or fail to meet its payment obligations.
High-Yield Debt Securities Risk: Investments in fixed-income securities with lower ratings (commonly known as “junk bonds”) tend to have a
| | |
| |
| abfunds.com | | AB ALL MARKET TOTAL RETURN PORTFOLIO | 7 |
DISCLOSURES AND RISKS (continued)
higher probability that an issuer will default or fail to meet its payment obligations. These securities may be subject to greater price volatility due to such factors as specific corporate developments, interest-rate sensitivity, negative perceptions of the junk bond market generally and less secondary market liquidity.
Interest-Rate Risk: Changes in interest rates will affect the value of the Fund’s investments in fixed-income securities. When interest rates rise, the value of existing investments in fixed-income securities tends to fall and this decrease in value may not be offset by higher income from new investments. Interest-rate risk is generally greater for fixed-income securities with longer maturities or durations. Very low or negative interest rates would likely magnify the risks associated with changes in interest rates. During periods of very low or negative rates, the Fund’s returns would likely be adversely affected.
Inflation Risk: This is the risk that the value of assets or income from investments will be less in the future as inflation decreases the value of money. As inflation increases, the value of the Fund’s assets can decline as can the value of the Fund’s distributions. This risk is significantly greater for fixed-income securities with longer maturities.
Foreign (Non-US) Risk: Investments in securities of non-US issuers may involve more risk than those of US issuers. These securities may fluctuate more widely in price and may be more difficult to trade due to adverse market, economic, political, regulatory or other factors.
Currency Risk: Fluctuations in currency exchange rates may negatively affect the value of the Fund’s investments or reduce its returns.
Emerging-Market Risk: Investments in emerging-market countries may have more risk because the markets are less developed and less liquid as well as being subject to increased economic, political, regulatory or other uncertainties.
Alternative Investments Risk: Many alternative investments can be volatile and may be illiquid. Their performance may have little correlation with the performance of equity or fixed-income markets, and they may not perform in accordance with expectations.
Capitalization Risk: Investments in small- and mid-capitalization companies may be more volatile than investments in large-capitalization companies. Investments in small-capitalization companies may have additional risks because these companies have limited product lines, markets or financial resources.
| | |
| |
8 | AB ALL MARKET TOTAL RETURN PORTFOLIO | | abfunds.com |
DISCLOSURES AND RISKS (continued)
Derivatives Risk: Derivatives may be difficult to price or unwind and leveraged so that small changes may produce disproportionate losses for the Fund. Derivatives, especially over-the-counter derivatives, are also subject to counterparty risk.
Leverage Risk: To the extent the Fund uses leveraging techniques, its NAV may be more volatile because leverage tends to exaggerate the effect of changes in interest rates and any increase or decrease in the value of the Fund’s investments.
Commodity Risk: Investing in commodities and commodity-linked derivative instruments may subject the Fund to greater volatility than investments in traditional securities. The value of commodity-linked derivative instruments may be affected by overall market movements, commodity index volatility, changes in interest rates, or factors affecting a particular industry or commodity, such as drought, floods, weather, livestock disease, embargoes, tariffs and international economic, political and regulatory developments.
Subsidiary Risk: By investing in the Subsidiary, the Fund is indirectly exposed to the risks associated with the Subsidiary. The derivatives and other investments held by the Subsidiary are generally similar to those that are permitted to be held by the Fund and are subject to the same risks that apply to similar investments if held directly by the Fund. The Subsidiary is not registered under the Investment Company Act of 1940, as amended (the “1940 Act”), and, unless otherwise noted in the prospectus, is not subject to all of the investor protections of the 1940 Act. However, the Fund wholly owns and controls the Subsidiary, and the Fund and the Subsidiary are managed by the Adviser, making it unlikely the Subsidiary will take actions contrary to the interests of the Fund or its shareholders. In addition, changes in federal tax laws applicable to the Fund or interpretations thereof could limit the Fund’s ability to gain exposure to commodities investments through investments in the Subsidiary.
Short Sale Risk: The Fund is subject to short sale risk because it may engage in short sales either directly or indirectly through investment in the Underlying Portfolio. Short sales involve the risk that the Fund or Underlying Portfolio will incur a loss by subsequently buying a security at a higher price than the price at which it sold the security. The amount of such loss is theoretically unlimited, as it will be based on the increase in value of the security sold short. In contrast, the risk of loss from a long position is limited to the Fund’s or Underlying Portfolio’s investment in the security, because the price of the security cannot fall below zero. The Fund or Underlying Portfolio may not always be able to close out a short position on favorable terms.
| | |
| |
| abfunds.com | | AB ALL MARKET TOTAL RETURN PORTFOLIO | 9 |
DISCLOSURES AND RISKS (continued)
Management Risk: The Fund is subject to management risk because it is an actively managed investment fund. The Adviser will apply its investment techniques and risk analyses in making investment decisions for the Fund, but there is no guarantee that its techniques will produce the intended results. Some of these techniques may incorporate, or rely upon, quantitative models, but there is no guarantee that these models will generate accurate forecasts, reduce risk or otherwise perform as expected.
These risks are fully discussed in the Fund’s prospectus. As with all investments, you may lose money by investing in the Fund.
An Important Note About Historical Performance
The investment return and principal value of an investment in the Fund will fluctuate as the prices of the individual securities in which it invests fluctuate, so that your shares, when redeemed, may be worth more or less than their original cost. Performance shown in this report represents past performance and does not guarantee future results. Current performance may be lower or higher than the performance information shown. You may obtain performance information current to the most recent month-end by visiting www.abfunds.com. The performance shown for periods prior to April 24, 2017, is based on the Fund’s prior principal strategies and may not be representative of the Fund’s performance under its current principal strategies. Class B shares are no longer being offered. Effective November 7, 2019, all outstanding Class B shares were converted to Class A shares. Please see Note A for more information.
All fees and expenses related to the operation of the Fund have been deducted. NAV returns do not reflect sales charges; if sales charges were reflected, the Fund’s quoted performance would be lower. SEC returns reflect the applicable sales charges for each share class: a 4.25% maximum front-end sales charge for Class A shares and a 1% 1-year contingent deferred sales charge for Class C shares. Returns for the different share classes will vary due to different expenses associated with each class. Performance assumes reinvestment of distributions and does not account for taxes.
| | |
| |
10 | AB ALL MARKET TOTAL RETURN PORTFOLIO | | abfunds.com |
HISTORICAL PERFORMANCE
AVERAGE ANNUAL RETURNS AS OF FEBRUARY 28, 2021 (unaudited)
| | | | | | | | |
| | |
| | | NAV Returns | | | SEC Returns
(reflects applicable
sales charges) | |
| | |
| CLASS A SHARES | | | | | | | | |
| | |
| 1 Year | | | 9.96% | | | | 5.29% | |
| | |
| 5 Years | | | 7.19% | | | | 6.26% | |
| | |
| 10 Years | | | 5.10% | | | | 4.65% | |
| | |
| CLASS C SHARES | | | | | | | | |
| | |
| 1 Year | | | 9.17% | | | | 8.17% | |
| | |
| 5 Years | | | 6.39% | | | | 6.39% | |
| | |
| 10 Years | | | 4.34% | | | | 4.34% | |
| | |
| ADVISOR CLASS SHARES1 | | | | | | | | |
| | |
| 1 Year | | | 10.26% | | | | 10.26% | |
| | |
| 5 Years | | | 7.46% | | | | 7.46% | |
| | |
| 10 Years | | | 5.39% | | | | 5.39% | |
| | |
| CLASS R SHARES1 | | | | | | | | |
| | |
| 1 Year | | | 9.57% | | | | 9.57% | |
| | |
| 5 Years | | | 6.74% | | | | 6.74% | |
| | |
| 10 Years | | | 4.70% | | | | 4.70% | |
| | |
| CLASS K SHARES1 | | | | | | | | |
| | |
| 1 Year | | | 9.83% | | | | 9.83% | |
| | |
| 5 Years | | | 7.09% | | | | 7.09% | |
| | |
| 10 Years | | | 5.02% | | | | 5.02% | |
| | |
| CLASS I SHARES1 | | | | | | | | |
| | |
| 1 Year | | | 10.20% | | | | 10.20% | |
| | |
| 5 Years | | | 7.43% | | | | 7.43% | |
| | |
| 10 Years | | | 5.36% | | | | 5.36% | |
The Fund’s current prospectus fee table shows the Fund’s total annual operating expense ratios as 1.06%, 1.82%, 0.81%, 1.47%, 1.16% and 0.84% for Class A, Class C, Advisor Class, Class R, Class K and Class I shares, respectively. The Financial Highlights section of this report sets forth expense ratio data for the current reporting period; the expense ratios shown above may differ from the expense ratios in the Financial Highlights section since they are based on different time periods.
| 1 | These share classes are offered at NAV to eligible investors and their SEC returns are the same as their NAV returns. Please note that these share classes are for investors purchasing shares through accounts established under certain fee-based programs sponsored and maintained by certain broker-dealers and financial intermediaries, institutional pension plans and/or investment advisory clients of, and certain other persons associated with, the Adviser and its affiliates or the Fund. |
| | |
| |
| abfunds.com | | AB ALL MARKET TOTAL RETURN PORTFOLIO | 11 |
HISTORICAL PERFORMANCE (continued)
SEC AVERAGE ANNUAL RETURNS
AS OF THE MOST RECENT CALENDAR QUARTER-END
MARCH 31, 2021 (unaudited)
| | | | |
| |
| | | SEC Returns
(reflects applicable
sales charges) | |
| |
| CLASS A SHARES | | | | |
| |
| 1 Year | | | 24.40% | |
| |
| 5 Years | | | 5.58% | |
| |
| 10 Years | | | 4.83% | |
| |
| CLASS C SHARES | | | | |
| |
| 1 Year | | | 28.02% | |
| |
| 5 Years | | | 5.71% | |
| |
| 10 Years | | | 4.51% | |
| |
| ADVISOR CLASS SHARES1 | | | | |
| |
| 1 Year | | | 30.29% | |
| |
| 5 Years | | | 6.78% | |
| |
| 10 Years | | | 5.57% | |
| |
| CLASS R SHARES1 | | | | |
| |
| 1 Year | | | 29.50% | |
| |
| 5 Years | | | 6.07% | |
| |
| 10 Years | | | 4.87% | |
| |
| CLASS K SHARES1 | | | | |
| |
| 1 Year | | | 29.89% | |
| |
| 5 Years | | | 6.40% | |
| |
| 10 Years | | | 5.20% | |
| |
| CLASS I SHARES1 | | | | |
| |
| 1 Year | | | 30.25% | |
| |
| 5 Years | | | 6.75% | |
| |
| 10 Years | | | 5.55% | |
| 1 | Please note that these share classes are for investors purchasing shares through accounts established under certain fee-based programs sponsored and maintained by certain broker-dealers and financial intermediaries, institutional pension plans and/or investment advisory clients of, and certain other persons associated with, the Adviser and its affiliates or the Fund. |
| | |
| |
12 | AB ALL MARKET TOTAL RETURN PORTFOLIO | | abfunds.com |
EXPENSE EXAMPLE
(unaudited)
As a shareholder of the Fund, you incur two types of costs: (1) transaction costs, including sales charges (loads) on purchase payments, contingent deferred sales charges on redemptions and (2) ongoing costs, including management fees; distribution (12b-1) fees; and other Fund expenses. This example is intended to help you understand your ongoing costs (in dollars) of investing in the Fund and to compare these costs with the ongoing costs of investing in other mutual funds.
The Example is based on an investment of $1,000 invested at the beginning of the period and held for the entire period as indicated below.
Actual Expenses
The table below provides information about actual account values and actual expenses. You may use the information, together with the amount you invested, to estimate the expenses that you paid over the period. Simply divide your account value by $1,000 (for example, an $8,600 account value divided by $1,000 = 8.6), then multiply the result by the number under the heading entitled “Expenses Paid During Period” to estimate the expenses you paid on your account during this period.
Hypothetical Example for Comparison Purposes
The table below also provides information about hypothetical account values and hypothetical expenses based on the Fund’s actual expense ratio and an assumed annual rate of return of 5% before expenses, which is not the Fund’s actual return. The hypothetical account values and expenses may not be used to estimate the actual ending account balance or expenses you paid for the period. You may use this information to compare the ongoing costs of investing in the Fund and other funds by comparing this 5% hypothetical example with the 5% hypothetical examples that appear in the shareholder reports of other funds.
Please note that the expenses shown in the table are meant to highlight your ongoing costs only and do not reflect any transactional costs, such as sales charges (loads), or contingent deferred sales charges on redemptions. Therefore, the hypothetical example is useful in comparing ongoing costs only, and will not help you determine the relative total costs of owning different funds. In addition, if these transactional costs were included, your costs would have been higher.
| | |
| |
| abfunds.com | | AB ALL MARKET TOTAL RETURN PORTFOLIO | 13 |
EXPENSE EXAMPLE (continued)
| | | | | | | | | | | | | | | | | | | | | | | | |
| | | Beginning
Account
Value
September 1,
2020 | | | Ending
Account
Value
February 28,
2021 | | | Expenses
Paid
During
Period* | | | Annualized
Expense
Ratio* | | | Total
Expenses
Paid
During
Period+ | | | Total
Annualized
Expense
Ratio+ | |
| Class A | | | | | | | | | | | | |
Actual | | $ | 1,000 | | | $ | 1,077.50 | | | $ | 5.25 | | | | 1.02 | % | | $ | 5.41 | | | | 1.05 | % |
Hypothetical** | | $ | 1,000 | | | $ | 1,019.74 | | | $ | 5.11 | | | | 1.02 | % | | $ | 5.26 | | | | 1.05 | % |
| Class C | | | | | | | | | | | | |
Actual | | $ | 1,000 | | | $ | 1,074.40 | | | $ | 9.10 | | | | 1.77 | % | | $ | 9.26 | | | | 1.80 | % |
Hypothetical** | | $ | 1,000 | | | $ | 1,016.02 | | | $ | 8.85 | | | | 1.77 | % | | $ | 9.00 | | | | 1.80 | % |
| Advisor Class | | | | | | | | | | | | |
Actual | | $ | 1,000 | | | $ | 1,079.30 | | | $ | 3.97 | | | | 0.77 | % | | $ | 4.12 | | | | 0.80 | % |
Hypothetical** | | $ | 1,000 | | | $ | 1,020.98 | | | $ | 3.86 | | | | 0.77 | % | | $ | 4.01 | | | | 0.80 | % |
| Class R | | | | | | | | | | | | |
Actual | | $ | 1,000 | | | $ | 1,075.70 | | | $ | 7.36 | | | | 1.43 | % | | $ | 7.51 | | | | 1.46 | % |
Hypothetical** | | $ | 1,000 | | | $ | 1,017.70 | | | $ | 7.15 | | | | 1.43 | % | | $ | 7.30 | | | | 1.46 | % |
| Class K | | | | | | | | | | | | |
Actual | | $ | 1,000 | | | $ | 1,076.90 | | | $ | 5.77 | | | | 1.12 | % | | $ | 5.92 | | | | 1.15 | % |
Hypothetical** | | $ | 1,000 | | | $ | 1,019.24 | | | $ | 5.61 | | | | 1.12 | % | | $ | 5.76 | | | | 1.15 | % |
| Class I | | | | | | | | | | | | |
Actual | | $ | 1,000 | | | $ | 1,078.90 | | | $ | 4.07 | | | | 0.79 | % | | $ | 4.23 | | | | 0.82 | % |
Hypothetical** | | $ | 1,000 | | | $ | 1,020.88 | | | $ | 3.96 | | | | 0.79 | % | | $ | 4.11 | | | | 0.82 | % |
| * | Expenses are equal to the classes’ annualized expense ratios, multiplied by the average account value over the period, multiplied by 181/365 (to reflect the one-half year period). |
| ** | Assumes 5% annual return before expenses. |
| + | In connection with the Fund’s investments in affiliated/unaffiliated underlying portfolios, the Fund incurs no direct expenses, but bears proportionate shares of the fees and expenses (i.e., operating, administrative and investment advisory fees) of the affiliated/unaffiliated underlying portfolios. The Adviser has contractually agreed to waive its fees from the Fund in an amount equal to the Fund’s pro rata share of certain acquired fund fees and expenses of the affiliated underlying portfolios. The Fund’s total expenses are equal to the classes’ annualized expense ratio plus the Fund’s pro rata share of the weighted average expense ratio of the affiliated/unaffiliated underlying portfolios in which it invests, multiplied by the average account value over the period, multiplied by 181/365 (to reflect the one-half year period). |
| | |
| |
14 | AB ALL MARKET TOTAL RETURN PORTFOLIO | | abfunds.com |
PORTFOLIO SUMMARY
February 28, 2021 (unaudited)
PORTFOLIO STATISTICS
Net Assets ($mil): $646.1
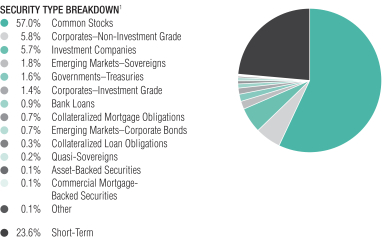
| 1 | All data are as of February 28, 2021. The Fund’s security type breakdown is expressed as a percentage of total investments (excluding security lending collateral) and may vary over time. The Fund also enters into derivative transactions, which may be used for hedging or investment purposes (see “Portfolio of Investments” section of the report for additional details). “Other” security type weightings represent 0.1% or less in the following types: Emerging Markets–Treasuries, Governments–Sovereign Bonds, Mortgage Pass-Throughs, Preferred Stocks and Warrants. |
| | |
| |
| abfunds.com | | AB ALL MARKET TOTAL RETURN PORTFOLIO | 15 |
PORTFOLIO SUMMARY (continued)
February 28, 2021 (unaudited)
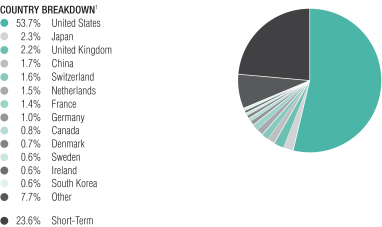
| 1 | All data are as of February 28, 2021. The Fund’s country breakdown is expressed as a percentage of total investments (excluding security lending collateral) and may vary over time. The Fund also enters into derivative transactions, which may be used for hedging or investment purposes (see “Portfolio of Investments” section of the report for additional details). “Other” country weightings represent 0.6% or less in the following: Angola, Argentina, Australia, Austria, Bahrain, Belgium, Bermuda, Brazil, Cayman Islands, Colombia, Costa Rica, Dominican Republic, Ecuador, Egypt, El Salvador, Finland, Ghana, Honduras, Hong Kong, India, Israel, Italy, Ivory Coast, Jamaica, Jersey (Channel Islands), Kenya, Kuwait, Lebanon, Luxembourg, Macau, Malaysia, Mexico, Mongolia, Nigeria, Norway, Oman, Peru, Portugal, Russia, Senegal, Singapore, South Africa, Spain, Taiwan, Turkey, Ukraine, United Arab Emirates, Venezuela and Zambia. |
| | |
| |
16 | AB ALL MARKET TOTAL RETURN PORTFOLIO | | abfunds.com |
CONSOLIDATED PORTFOLIO OF INVESTMENTS
February 28, 2021 (unaudited)
| | | | | | | | | | | | |
| Company | | | | |
Shares | | | U.S. $ Value | |
| |
COMMON STOCKS – 56.1% | | | | | | | | | | | | |
Information Technology – 15.6% | | | | | | | | | | | | |
Communications Equipment – 0.6% | | | | | | | | | | | | |
Acacia Communications, Inc.(a) | | | | | | | 16,430 | | | $ | 1,889,286 | |
Calix, Inc.(a) | | | | | | | 15,508 | | | | 612,721 | |
Lumentum Holdings, Inc.(a) | | | | | | | 6,050 | | | | 544,500 | |
Motorola Solutions, Inc. | | | | | | | 3,403 | | | | 597,158 | |
| | | | | | | | | | | | |
| | | | | | | | | | | 3,643,665 | |
| | | | | | | | | | | | |
Electronic Equipment, Instruments & Components – 2.4% | | | | | | | | | | | | |
Amphenol Corp. – Class A | | | | | | | 23,459 | | | | 2,948,327 | |
Arrow Electronics, Inc.(a) | | | | | | | 4,033 | | | | 404,349 | |
CDW Corp./DE | | | | | | | 20,748 | | | | 3,255,154 | |
Coherent, Inc.(a) | | | | | | | 12,897 | | | | 3,120,300 | |
Flex Ltd.(a) | | | | | | | 45,270 | | | | 823,461 | |
FLIR Systems, Inc. | | | | | | | 48,140 | | | | 2,570,676 | |
IPG Photonics Corp.(a) | | | | | | | 2,913 | | | | 662,271 | |
Keyence Corp. | | | | | | | 1,100 | | | | 524,547 | |
MTS Systems Corp. | | | | | | | 12,928 | | | | 754,478 | |
Zebra Technologies Corp. – Class A(a) | | | | | | | 857 | | | | 428,011 | |
| | | | | | | | | | | | |
| | | | | | | | | | | 15,491,574 | |
| | | | | | | | | | | | |
Internet Software & Services – 0.3% | | | | | | | | | | | | |
Grubhub, Inc.(a) | | | | | | | 36,202 | | | | 2,319,462 | |
| | | | | | | | | | | | |
| | | |
IT Services – 3.4% | | | | | | | | | | | | |
Adyen NV(a)(b)(c) | | | | | | | 240 | | | | 560,012 | |
Amadeus IT Group SA – Class A(a) | | | | | | | 7,430 | | | | 518,742 | |
Automatic Data Processing, Inc. | | | | | | | 24,688 | | | | 4,296,205 | |
Booz Allen Hamilton Holding Corp. | | | | | | | 6,846 | | | | 528,101 | |
Broadridge Financial Solutions, Inc. | | | | | | | 2,238 | | | | 318,893 | |
Capgemini SE | | | | | | | 4,150 | | | | 666,490 | |
Cardtronics PLC – Class A(a) | | | | | | | 20,481 | | | | 789,543 | |
Cognizant Technology Solutions Corp. – Class A | | | | | | | 33,407 | | | | 2,454,746 | |
EPAM Systems, Inc.(a) | | | | | | | 1,112 | | | | 415,454 | |
Fidelity National Information Services, Inc. | | | | | | | 5,820 | | | | 803,160 | |
Genpact Ltd. | | | | | | | 6,940 | | | | 280,654 | |
International Business Machines Corp. | | | | | | | 2,069 | | | | 246,066 | |
Mastercard, Inc. – Class A | | | | | | | 15,164 | | | | 5,365,782 | |
Nomura Research Institute Ltd. | | | | | | | 8,400 | | | | 260,618 | |
Paychex, Inc. | | | | | | | 10,220 | | | | 930,735 | |
Square, Inc. – Class A(a) | | | | | | | 2,030 | | | | 466,961 | |
Twilio, Inc. – Class A(a) | | | | | | | 970 | | | | 381,094 | |
Visa, Inc. – Class A | | | | | | | 12,216 | | | | 2,594,556 | |
Western Union Co. (The) – Class W | | | | | | | 17,492 | | | | 406,164 | |
| | | | | | | | | | | | |
| | | | | | | | | | | 22,283,976 | |
| | | | | | | | | | | | |
| | |
| |
| abfunds.com | | AB ALL MARKET TOTAL RETURN PORTFOLIO | 17 |
CONSOLIDATED PORTFOLIO OF INVESTMENTS (continued)
| | | | | | | | | | | | |
| Company | | | | |
Shares | | | U.S. $ Value | |
| |
Semiconductors & Semiconductor Equipment – 2.9% | | | | | | | | | | | | |
Applied Materials, Inc. | | | | | | | 13,519 | | | $ | 1,597,810 | |
Broadcom, Inc. | | | | | | | 247 | | | | 116,058 | |
Dialog Semiconductor PLC(a) | | | | | | | 25,388 | | | | 1,973,484 | |
Globalwafers Co., Ltd. | | | | | | | 14,000 | | | | 371,719 | |
Infineon Technologies AG | | | | | | | 15,880 | | | | 690,966 | |
Inphi Corp.(a) | | | | | | | 16,064 | | | | 2,643,974 | |
Intel Corp. | | | | | | | 1,581 | | | | 96,093 | |
JA Solar Technology Co., Ltd.(a) | | | | | | | 19,700 | | | | 101,231 | |
KLA Corp. | | | | | | | 2,461 | | | | 765,937 | |
Maxim Integrated Products, Inc. | | | | | | | 29,129 | | | | 2,713,949 | |
Novatek Microelectronics Corp. | | | | | | | 21,000 | | | | 357,572 | |
NVIDIA Corp. | | | | | | | 76 | | | | 41,692 | |
NXP Semiconductors NV | | | | | | | 3,180 | | | | 580,509 | |
Phison Electronics Corp. | | | | | | | 17,000 | | | | 279,984 | |
QUALCOMM, Inc. | | | | | | | 3,630 | | | | 494,370 | |
Realtek Semiconductor Corp. | | | | | | | 24,000 | | | | 395,971 | |
STMicroelectronics NV | | | | | | | 10,067 | | | | 390,975 | |
Taiwan Semiconductor Manufacturing Co., Ltd. | | | | | | | 44,000 | | | | 961,269 | |
Taiwan Semiconductor Manufacturing Co., Ltd. (Sponsored ADR) | | | | | | | 6,370 | | | | 802,238 | |
Texas Instruments, Inc. | | | | | | | 5,273 | | | | 908,380 | |
Xilinx, Inc. | | | | | | | 18,120 | | | | 2,361,036 | |
| | | | | | | | | | | | |
| | | | | | | | | | | 18,645,217 | |
| | | | | | | | | | | | |
Software – 4.7% | | | | | | | | | | | | |
Adobe, Inc.(a) | | | | | | | 1,045 | | | | 480,355 | |
Autodesk, Inc.(a) | | | | | | | 1,227 | | | | 338,652 | |
Avaya Holdings Corp.(a) | | | | | | | 2,216 | | | | 65,749 | |
Cadence Design Systems, Inc.(a) | | | | | | | 3,146 | | | | 443,869 | |
Citrix Systems, Inc. | | | | | | | 10,013 | | | | 1,337,537 | |
Constellation Software, Inc./Canada | | | | | | | 560 | | | | 725,069 | |
Dassault Systemes SE | | | | | | | 2,760 | | | | 573,246 | |
Dropbox, Inc. – Class A(a) | | | | | | | 7,777 | | | | 175,332 | |
Fair Isaac Corp.(a) | | | | | | | 700 | | | | 320,285 | |
Microsoft Corp. | | | | | | | 61,751 | | | | 14,349,697 | |
Monitronics International, Inc.(a) | | | | | | | 4,469 | | | | 37,986 | |
Nice Ltd.(a) | | | | | | | 640 | | | | 147,829 | |
NortonLifeLock, Inc. | | | | | | | 7,139 | | | | 139,282 | |
Oracle Corp. | | | | | | | 25,059 | | | | 1,616,556 | |
Oracle Corp./Japan | | | | | | | 3,600 | | | | 365,365 | |
Proofpoint, Inc.(a) | | | | | | | 3,820 | | | | 461,914 | |
SAP SE | | | | | | | 20,862 | | | | 2,580,352 | |
ServiceNow, Inc.(a) | | | | | | | 483 | | | | 257,661 | |
Slack Technologies, Inc. – Class A(a) | | | | | | | 60,446 | | | | 2,474,055 | |
| | |
| |
18 | AB ALL MARKET TOTAL RETURN PORTFOLIO | | abfunds.com |
CONSOLIDATED PORTFOLIO OF INVESTMENTS (continued)
| | | | | | | | | | | | |
| Company | | | | |
Shares | | | U.S. $ Value | |
| |
Synopsys, Inc.(a) | | | | | | | 797 | | | $ | 195,432 | |
Trade Desk, Inc. (The) – Class A(a) | | | | | | | 416 | | | | 335,042 | |
Trend Micro, Inc./Japan | | | | | | | 22,600 | | | | 1,092,550 | |
VMware, Inc. – Class A(a) | | | | | | | 8,903 | | | | 1,230,484 | |
Zendesk, Inc.(a) | | | | | | | 3,670 | | | | 536,334 | |
| | | | | | | | | | | | |
| | | | | | | | | | | 30,280,633 | |
| | | | | | | | | | | | |
Technology Hardware, Storage & Peripherals – 1.3% | | | | | | | | | | | | |
Apple, Inc. | | | | | | | 31,141 | | | | 3,776,158 | |
Lenovo Group Ltd. | | | | | | | 310,000 | | | | 391,852 | |
Logitech International SA | | | | | | | 2,980 | | | | 316,818 | |
NetApp, Inc. | | | | | | | 6,078 | | | | 380,483 | |
Pegatron Corp. | | | | | | | 65,000 | | | | 173,969 | |
Samsung Electronics Co., Ltd. | | | | | | | 44,128 | | | | 3,233,948 | |
| | | | | | | | | | | | |
| | | | | | | | | | | 8,273,228 | |
| | | | | | | | | | | | |
| | | | | | | | | | | 100,937,755 | |
| | | | | | | | | | | | |
Health Care – 10.0% | |
Biotechnology – 1.0% | |
AbbVie, Inc. | | | | | | | 5,640 | | | | 607,654 | |
Abcam PLC | | | | | | | 20,210 | | | | 477,535 | |
Alexion Pharmaceuticals, Inc.(a) | | | | | | | 18,187 | | | | 2,778,064 | |
Amgen, Inc. | | | | | | | 1,298 | | | | 291,946 | |
BGI Genomics Co., Ltd. | | | | | | | 1,100 | | | | 23,570 | |
Ionis Pharmaceuticals, Inc.(a) | | | | | | | 5,281 | | | | 276,724 | |
Seegene, Inc. | | | | | | | 1,879 | | | | 207,173 | |
Viela Bio, Inc.(a) | | | | | | | 41,614 | | | | 2,213,865 | |
| | | | | | | | | | | | |
| | | | | | | | | | | 6,876,531 | |
| | | | | | | | | | | | |
Health Care Equipment & Supplies – 3.0% | | | | | | | | | | | | |
Abbott Laboratories | | | | | | | 35,220 | | | | 4,218,652 | |
ABIOMED, Inc.(a) | | | | | | | 1,286 | | | | 417,371 | |
Alcon, Inc.(a) | | | | | | | 7,110 | | | | 489,680 | |
Avantor, Inc.(a) | | | | | | | 11,167 | | | | 311,224 | |
Cantel Medical Corp.(a) | | | | | | | 31,693 | | | | 2,354,156 | |
Danaher Corp. | | | | | | | 2,480 | | | | 544,782 | |
Demant A/S(a) | | | | | | | 6,189 | | | | 254,400 | |
Hologic, Inc.(a) | | | | | | | 5,548 | | | | 399,955 | |
IDEXX Laboratories, Inc.(a) | | | | | | | 849 | | | | 441,624 | |
Koninklijke Philips NV(a) | | | | | | | 60,140 | | | | 3,283,467 | |
Medtronic PLC | | | | | | | 25,113 | | | | 2,937,467 | |
STERIS PLC | | | | | | | 3,130 | | | | 547,124 | |
Supermax Corp. Bhd | | | | | | | 245,302 | | | | 292,350 | |
Top Glove Corp. Bhd | | | | | | | 249,100 | | | | 321,748 | |
Varian Medical Systems, Inc.(a) | | | | | | | 14,736 | | | | 2,582,779 | |
| | | | | | | | | | | | |
| | | | | | | | | | | 19,396,779 | |
| | | | | | | | | | | | |
| | |
| |
| abfunds.com | | AB ALL MARKET TOTAL RETURN PORTFOLIO | 19 |
CONSOLIDATED PORTFOLIO OF INVESTMENTS (continued)
| | | | | | | | | | | | |
| Company | | | | |
Shares | | | U.S. $ Value | |
| |
Health Care Providers & Services – 1.5% | |
Anthem, Inc. | | | | | | | 15,240 | | | $ | 4,620,615 | |
Galenica AG(c) | | | | | | | 2,990 | | | | 192,405 | |
Henry Schein, Inc.(a) | | | | | | | 14,667 | | | | 907,154 | |
Laboratory Corp. of America Holdings(a) | | | | | | | 2,990 | | | | 717,331 | |
Magellan Health, Inc.(a) | | | | | | | 18,533 | | | | 1,729,500 | |
Molina Healthcare, Inc.(a) | | | | | | | 1,662 | | | | 360,255 | |
UnitedHealth Group, Inc. | | | | | | | 3,200 | | | | 1,063,104 | |
| | | | | | | | | | | | |
| | | | | | | | | | | 9,590,364 | |
| | | | | | | | | | | | |
Health Care Technology – 0.5% | |
Cerner Corp. | | | | | | | 4,912 | | | | 339,616 | |
Change Healthcare, Inc.(a) | | | | | | | 110,311 | | | | 2,522,812 | |
Veeva Systems, Inc. – Class A(a) | | | | | | | 534 | | | | 149,579 | |
| | | | | | | | | | | | |
| | | | | | | | | | | 3,012,007 | |
| | | | | | | | | | | | |
Life Sciences Tools & Services – 1.6% | |
Agilent Technologies, Inc. | | | | | | | 231 | | | | 28,198 | |
Bio-Rad Laboratories, Inc. – Class A(a) | | | | | | | 1,863 | | | | 1,088,924 | |
Bruker Corp. | | | | | | | 11,130 | | | | 678,707 | |
Gerresheimer AG | | | | | | | 3,390 | | | | 350,122 | |
Hangzhou Tigermed Consulting Co., Ltd. –Class A | | | | | | | 15,484 | | | | 338,077 | |
ICON PLC(a) | | | | | | | 1,570 | | | | 283,668 | |
IQVIA Holdings, Inc.(a) | | | | | | | 26,217 | | | | 5,054,375 | |
Maccura Biotechnology Co., Ltd. | | | | | | | 62,200 | | | | 391,684 | |
PRA Health Sciences, Inc.(a) | | | | | | | 10,250 | | | | 1,510,953 | |
Thermo Fisher Scientific, Inc. | | | | | | | 1,676 | | | | 754,334 | |
| | | | | | | | | | | | |
| | | | | | | | | | | 10,479,042 | |
| | | | | | | | | | | | |
Pharmaceuticals – 2.4% | |
Bristol-Myers Squibb Co. | | | | | | | 7,600 | | | | 466,108 | |
Eli Lilly & Co. | | | | | | | 1,279 | | | | 262,054 | |
GlaxoSmithKline PLC | | | | | | | 30,290 | | | | 505,412 | |
GW Pharmaceuticals PLC (Sponsored ADR)(a) | | | | | | | 10,245 | | | | 2,194,991 | |
Johnson & Johnson | | | | | | | 3,136 | | | | 496,930 | |
Merck & Co., Inc. | | | | | | | 10,602 | | | | 769,917 | |
Novo Nordisk A/S – Class B | | | | | | | 8,820 | | | | 629,193 | |
Oxford Immunotec Global PLC(a) | | | | | | | 54,127 | | | | 1,188,088 | |
Perrigo Co. PLC | | | | | | | 7,357 | | | | 296,929 | |
Progenic Pharmaceuticals Cvr(d)(e) | | | | | | | 136,645 | | | | – 0 | – |
Roche Holding AG | | | | | | | 9,571 | | | | 3,139,851 | |
Sanofi | | | | | | | 17,281 | | | | 1,585,889 | |
Sumitomo Dainippon Pharma Co., Ltd. | | | | | | | 24,800 | | | | 394,200 | |
Takeda Pharmaceutical Co., Ltd. | | | | | | | 11,700 | | | | 394,276 | |
Zoetis, Inc. | | | | | | | 19,126 | | | | 2,969,120 | |
| | | | | | | | | | | | |
| | | | | | | | | | | 15,292,958 | |
| | | | | | | | | | | | |
| | | | | | | | | | | 64,647,681 | |
| | | | | | | | | | | | |
| | |
| |
20 | AB ALL MARKET TOTAL RETURN PORTFOLIO | | abfunds.com |
CONSOLIDATED PORTFOLIO OF INVESTMENTS (continued)
| | | | | | | | | | | | |
| Company | | | | |
Shares | | | U.S. $ Value | |
| |
Financials – 8.2% | | | | | |
Banks – 2.7% | |
ABN AMRO Bank NV (GDR)(a)(c) | | | | | | | 49,431 | | | $ | 568,383 | |
Absa Group Ltd. | | | | | | | 5,220 | | | | 41,774 | |
Banco do Brasil SA | | | | | | | 55,900 | | | | 279,789 | |
Bank Leumi Le-Israel BM | | | | | | | 74,860 | | | | 454,039 | |
Bank of America Corp. | | | | | | | 5,814 | | | | 201,804 | |
BNP Paribas SA(a) | | | | | | | 6,146 | | | | 365,364 | |
China Merchants Bank Co., Ltd. – Class H | | | | | | | 11,500 | | | | 88,191 | |
China Minsheng Banking Corp., Ltd. – Class H | | | | | | | 650,000 | | | | 387,893 | |
CIT Group, Inc. | | | | | | | 9,958 | | | | 451,595 | |
Credicorp Ltd. | | | | | | | 1,081 | | | | 172,971 | |
Danske Bank A/S(a) | | | | | | | 9,610 | | | | 176,660 | |
DBS Group Holdings Ltd. | | | | | | | 15,500 | | | | 307,126 | |
Erste Group Bank AG(a) | | | | | | | 20,350 | | | | 668,236 | |
Fifth Third Bancorp | | | | | | | 12,106 | | | | 419,957 | |
FinecoBank Banca Fineco SpA(a) | | | | | | | 23,084 | | | | 404,874 | |
HDFC Bank Ltd. (ADR)(a) | | | | | | | 8,540 | | | | 675,856 | |
Huaxia Bank Co., Ltd. | | | | | | | 356,900 | | | | 344,665 | |
JPMorgan Chase & Co. | | | | | | | 4,393 | | | | 646,517 | |
Jyske Bank A/S(a) | | | | | | | 30,971 | | | | 1,334,185 | |
KBC Group NV(a) | | | | | | | 4,080 | | | | 292,814 | |
Lloyds Banking Group PLC(a) | | | | | | | 258,758 | | | | 140,990 | |
Mebuki Financial Group, Inc. | | | | | | | 183,900 | | | | 392,826 | |
National Bank of Canada | | | | | | | 1,460 | | | | 91,964 | |
Natwest Group PLC(a) | | | | | | | 29,608 | | | | 76,480 | |
Royal Bank of Canada | | | | | | | 6,390 | | | | 544,099 | |
Societe Generale SA(a) | | | | | | | 17,131 | | | | 423,930 | |
Standard Chartered PLC(a) | | | | | | | 59,384 | | | | 384,312 | |
SVB Financial Group(a) | | | | | | | 2,557 | | | | 1,292,205 | |
TCF Financial Corp. | | | | | | | 62,862 | | | | 2,817,475 | |
Toronto-Dominion Bank (The) | | | | | | | 2,850 | | | | 172,756 | |
US Bancorp | | | | | | | 6,490 | | | | 324,500 | |
Wells Fargo & Co. | | | | | | | 74,731 | | | | 2,703,020 | |
| | | | | | | | | | | | |
| | | | | | | | | | | 17,647,250 | |
| | | | | | | | | | | | |
Capital Markets – 3.5% | |
Ameriprise Financial, Inc. | | | | | | | 1,886 | | | | 417,259 | |
BlackRock, Inc. – Class A | | | | | | | 1,564 | | | | 1,086,198 | |
Charles Schwab Corp. (The) | | | | | | | 62,747 | | | | 3,872,745 | |
CME Group, Inc. – Class A | | | | | | | 8,927 | | | | 1,782,722 | |
Eaton Vance Corp. | | | | | | | 38,660 | | | | 2,824,886 | |
EQT AB | | | | | | | 14,016 | | | | 388,534 | |
Goldman Sachs Group, Inc. (The) | | | | | | | 5,709 | | | | 1,823,911 | |
Julius Baer Group Ltd. | | | | | | | 44,666 | | | | 2,749,342 | |
| | |
| |
| abfunds.com | | AB ALL MARKET TOTAL RETURN PORTFOLIO | 21 |
CONSOLIDATED PORTFOLIO OF INVESTMENTS (continued)
| | | | | | | | | | | | |
| Company | | | | |
Shares | | | U.S. $ Value | |
| |
Moody’s Corp. | | | | | | | 7,069 | | | $ | 1,943,198 | |
Morgan Stanley | | | | | | | 22,550 | | | | 1,733,447 | |
MSCI, Inc. – Class A | | | | | | | 1,550 | | | | 642,506 | |
Partners Group Holding AG | | | | | | | 1,030 | | | | 1,233,187 | |
Raymond James Financial, Inc. | | | | | | | 3,478 | | | | 406,022 | |
S&P Global, Inc. | | | | | | | 1,350 | | | | 444,635 | |
Singapore Exchange Ltd. | | | | | | | 153,100 | | | | 1,139,865 | |
T. Rowe Price Group, Inc. | | | | | | | 1,079 | | | | 174,949 | |
| | | | | | | | | | | | |
| | | | | | | | | | | 22,663,406 | |
| | | | | | | | | | | | |
Consumer Finance – 0.2% | |
American Express Co. | | | | | | | 10,496 | | | | 1,419,689 | |
| | | | | | | | | | | | |
| | | |
Diversified Financial Services – 0.7% | | | | | | | | | | | | |
Berkshire Hathaway, Inc. – Class B(a) | | | | | | | 89 | | | | 21,405 | |
Far East Horizon Ltd.(b) | | | | | | | 371,000 | | | | 399,122 | |
Groupe Bruxelles Lambert SA | | | | | | | 7,096 | | | | 701,897 | |
IHS Markit Ltd. | | | | | | | 29,642 | | | | 2,672,523 | |
Kinnevik AB – Class B(b) | | | | | | | 8,691 | | | | 403,292 | |
| | | | | | | | | | | | |
| | | | | | | | | | | 4,198,239 | |
| | | | | | | | | | | | |
Insurance – 1.1% | |
AIA Group Ltd. | | | | | | | 38,400 | | | | 484,279 | |
Allianz SE | | | | | | | 1,190 | | | | 287,218 | |
CNP Assurances(a) | | | | | | | 23,529 | | | | 423,408 | |
iA Financial Corp., Inc.(b) | | | | | | | 7,753 | | | | 398,372 | |
Manulife Financial Corp.(b) | | | | | | | 22,594 | | | | 450,424 | |
MetLife, Inc. | | | | | | | 4,780 | | | | 275,328 | |
PICC Property & Casualty Co., Ltd. – Class H | | | | | | | 752,000 | | | | 568,936 | |
Progressive Corp. (The) | | | | | | | 2,380 | | | | 204,561 | |
Prudential Financial, Inc. | | | | | | | 380 | | | | 32,954 | |
RenaissanceRe Holdings Ltd. | | | | | | | 2,580 | | | | 430,808 | |
Sampo Oyj – Class A | | | | | | | 7,400 | | | | 329,387 | |
Willis Towers Watson PLC | | | | | | | 12,919 | | | | 2,850,448 | |
Zurich Insurance Group AG | | | | | | | 640 | | | | 261,255 | |
| | | | | | | | | | | | |
| | | | | | | | | | | 6,997,378 | |
| | | | | | | | | | | | |
| | | | | | | | | | | 52,925,962 | |
| | | | | | | | | | | | |
Consumer Discretionary – 7.1% | | | | | | | | | | | | |
Auto Components – 0.8% | |
Aisin Seiki Co., Ltd. | | | | | | | 11,700 | | | | 402,100 | |
Aptiv PLC(a) | | | | | | | 25,023 | | | | 3,749,446 | |
ATD New Holdings, Inc.(a)(e) | | | | | | | 2,609 | | | | 107,752 | |
BorgWarner, Inc. | | | | | | | 4,038 | | | | 181,710 | |
Exide Corp.(a)(d)(e) | | | | | | | 13 | | | | 24,375 | |
Exide Technologies(a)(d)(e) | | | | | | | 48,846 | | | | – 0 | – |
Exide Technologies/Old(a)(d)(e) | | | | | | | 1,244 | | | | – 0 | – |
JTEKT Corp. | | | | | | | 20,200 | | | | 214,544 | |
| | |
| |
22 | AB ALL MARKET TOTAL RETURN PORTFOLIO | | abfunds.com |
CONSOLIDATED PORTFOLIO OF INVESTMENTS (continued)
| | | | | | | | | | | | |
| Company | | | | |
Shares | | | U.S. $ Value | |
| |
Lear Corp. | | | | | | | 1,840 | | | $ | 305,606 | |
| | | | | | | | | | | | |
| | | | | | | | | | | 4,985,533 | |
| | | | | | | | | | | | |
Automobiles – 0.3% | |
BAIC Motor Corp., Ltd.(c) | | | | | | | 1,005,000 | | | | 359,503 | |
Ford Motor Co.(a) | | | | | | | 28,123 | | | | 329,039 | |
Geely Automobile Holdings Ltd. | | | | | | | 66,000 | | | | 213,491 | |
Great Wall Motor Co., Ltd. – Class H(b) | | | | | | | 40,500 | | | | 117,322 | |
Kia Motors Corp. | | | | | | | 1,500 | | | | 105,762 | |
Nissan Motor Co., Ltd.(a) | | | | | | | 46,600 | | | | 254,763 | |
Tesla, Inc.(a) | | | | | | | 306 | | | | 206,703 | |
Yadea Group Holdings Ltd.(c) | | | | | | | 117,241 | | | | 254,947 | |
| | | | | | | | | | | | |
| | | | | | | | | | | 1,841,530 | |
| | | | | | | | | | | | |
Diversified Consumer Services – 0.3% | |
Service Corp. International/US | | | | | | | 36,834 | | | | 1,759,192 | |
TAL Education Group (ADR)(a) | | | | | | | 1,723 | | | | 133,601 | |
| | | | | | | | | | | | |
| | | | | | | | | | | 1,892,793 | |
| | | | | | | | | | | | |
Hotels, Restaurants & Leisure – 0.8% | |
Aristocrat Leisure Ltd. | | | | | | | 25,900 | | | | 605,879 | |
Compass Group PLC(a) | | | | | | | 66,329 | | | | 1,346,941 | |
Domino’s Pizza, Inc. | | | | | | | 1,067 | | | | 369,726 | |
eDreams ODIGEO SA(a)(b) | | | | | | | 29,487 | | | | 176,828 | |
Galaxy Entertainment Group Ltd. | | | | | | | 77,000 | | | | 702,444 | |
La Francaise des Jeux SAEM(c) | | | | | | | 760 | | | | 34,306 | |
McDonald’s Corp. | | | | | | | 2,705 | | | | 557,609 | |
Starbucks Corp. | | | | | | | 10,617 | | | | 1,146,954 | |
| | | | | | | | | | | | |
| | | | | | | | | | | 4,940,687 | |
| | | | | | | | | | | | |
Household Durables – 0.4% | |
Electrolux AB – Class B | | | | | | | 16,417 | | | | 387,582 | |
Garmin Ltd. | | | | | | | 853 | | | | 105,789 | |
Haier Smart Home Co., Ltd.(a) | | | | | | | 95,600 | | | | 363,594 | |
LG Electronics, Inc. | | | | | | | 1,703 | | | | 221,551 | |
Sony Corp. | | | | | | | 6,700 | | | | 707,528 | |
TopBuild Corp.(a) | | | | | | | 3,150 | | | | 599,791 | |
Whirlpool Corp. | | | | | | | 714 | | | | 135,717 | |
| | | | | | | | | | | | |
| | | | | | | | | | | 2,521,552 | |
| | | | | | | | | | | | |
Internet & Direct Marketing Retail – 1.9% | | | | | | | | | | | | |
Alibaba Group Holding Ltd. (ADR)(a) | | | | | | | 7,145 | | | | 1,698,795 | |
Amazon.com, Inc.(a) | | | | | | | 1,493 | | | | 4,617,744 | |
eBay, Inc. | | | | | | | 7,235 | | | | 408,199 | |
HelloFresh SE(a) | | | | | | | 5,122 | | | | 397,954 | |
JD.com, Inc. (ADR)(a) | | | | | | | 1,369 | | | | 128,508 | |
Just Eat Takeaway.com NV(a)(b)(c) | | | | | | | 4,248 | | | | 408,771 | |
MercadoLibre, Inc.(a) | | | | | | | 180 | | | | 294,860 | |
Naspers Ltd. – Class N | | | | | | | 12,344 | | | | 2,912,905 | |
Pinduoduo, Inc. (ADR)(a) | | | | | | | 1,706 | | | | 291,999 | |
| | |
| |
| abfunds.com | | AB ALL MARKET TOTAL RETURN PORTFOLIO | 23 |
CONSOLIDATED PORTFOLIO OF INVESTMENTS (continued)
| | | | | | | | | | | | |
| Company | | | | |
Shares | | | U.S. $ Value | |
| |
Prosus NV(a) | | | | | | | 9,753 | | | $ | 1,162,719 | |
Zalando SE(a)(c) | | | | | | | 3,424 | | | | 352,012 | |
| | | | | | | | | | | | |
| | | | | | | | | | | 12,674,466 | |
| | | | | | | | | | | | |
Leisure Products – 0.1% | |
Polaris, Inc. | | | | | | | 3,272 | | | | 385,311 | |
| | | | | | | | | | | | |
|
Multiline Retail – 0.1% | |
Dollar General Corp. | | | | | | | 2,690 | | | | 508,383 | |
Next PLC(a) | | | | | | | 3,726 | | | | 394,676 | |
| | | | | | | | | | | | |
| | | | | | | | | | | 903,059 | |
| | | | | | | | | | | | |
Specialty Retail – 1.5% | |
AutoZone, Inc.(a) | | | | | | | 840 | | | | 974,333 | |
China Meidong Auto Holdings Ltd. | | | | | | | 29,200 | | | | 110,967 | |
GrandVision NV(a)(c) | | | | | | | 62,988 | | | | 1,915,155 | |
Home Depot, Inc. (The) | | | | | | | 3,681 | | | | 950,950 | |
Lowe’s Cos., Inc. | | | | | | | 975 | | | | 155,756 | |
O’Reilly Automotive, Inc.(a) | | | | | | | 1,458 | | | | 652,207 | |
Ross Stores, Inc. | | | | | | | 3,235 | | | | 377,330 | |
Sportsman’s Warehouse Holdings, Inc.(a) | | | | | | | 100,112 | | | | 1,695,897 | |
TJX Cos., Inc. (The) | | | | | | | 42,139 | | | | 2,780,753 | |
Topsports International Holdings Ltd.(c) | | | | | | | 59,000 | | | | 86,629 | |
| | | | | | | | | | | | |
| | | | | | | | | | | 9,699,977 | |
| | | | | | | | | | | | |
Textiles, Apparel & Luxury
Goods – 0.9% | | | | | | | | | | | | |
adidas AG(a) | | | | | | | 1,349 | | | | 470,241 | |
Bosideng International Holdings Ltd. | | | | | | | 184,000 | | | | 77,466 | |
Deckers Outdoor Corp.(a) | | | | | | | 2,610 | | | | 851,147 | |
EssilorLuxottica SA | | | | | | | 3,203 | | | | 522,516 | |
NIKE, Inc. – Class B | | | | | | | 26,827 | | | | 3,615,743 | |
Pandora A/S | | | | | | | 4,077 | | | | 395,817 | |
| | | | | | | | | | | | |
| | | | | | | | | | | 5,932,930 | |
| | | | | | | | | | | | |
| | | | | | | | | | | 45,777,838 | |
| | | | | | | | | | | | |
Industrials – 5.2% | |
Aerospace & Defense – 0.6% | |
Aerojet Rocketdyne Holdings, Inc.(a) | | | | | | | 50,609 | | | | 2,594,723 | |
Hexcel Corp.(a) | | | | | | | 11,280 | | | | 606,413 | |
L3Harris Technologies, Inc. | | | | | | | 2,580 | | | | 469,328 | |
| | | | | | | | | | | | |
| | | | | | | | | | | 3,670,464 | |
| | | | | | | | | | | | |
Air Freight & Logistics – 0.1% | |
Kuehne & Nagel International AG | | | | | | | 1,710 | | | | 405,767 | |
| | | | | | | | | | | | |
|
Building Products – 0.7% | |
Allegion PLC | | | | | | | 6,735 | | | | 732,634 | |
Cie de Saint-Gobain(a) | | | | | | | 5,785 | | | | 311,096 | |
Masco Corp. | | | | | | | 6,082 | | | | 323,684 | |
| | |
| |
24 | AB ALL MARKET TOTAL RETURN PORTFOLIO | | abfunds.com |
CONSOLIDATED PORTFOLIO OF INVESTMENTS (continued)
| | | | | | | | | | | | |
| Company | | | | |
Shares | | | U.S. $ Value | |
| |
Otis Worldwide Corp. | | | | | | | 37,244 | | | $ | 2,372,815 | |
Trex Co., Inc.(a) | | | | | | | 7,470 | | | | 684,551 | |
| | | | | | | | | | | | |
| | | | | | | | | | | 4,424,780 | |
| | | | | | | | | | | | |
Commercial Services &
Supplies – 0.9% | | | | | | | | | | | | |
Secom Co., Ltd. | | | | | | | 21,300 | | | | 1,854,698 | |
Stericycle, Inc.(a) | | | | | | | 38,341 | | | | 2,487,181 | |
Tetra Tech, Inc. | | | | | | | 3,250 | | | | 449,702 | |
TOMRA Systems ASA | | | | | | | 12,500 | | | | 533,424 | |
Waste Management, Inc. | | | | | | | 4,640 | | | | 514,529 | |
| | | | | | | | | | | | |
| | | | | | | | | | | 5,839,534 | |
| | | | | | | | | | | | |
Construction & Engineering – 0.0% | |
WillScot Mobile Mini Holdings Corp.(a) | | | | | | | 1,235 | | | | 34,247 | |
| | | | | | | | | | | | |
|
Electrical Equipment – 0.7% | |
Acuity Brands, Inc. | | | | | | | 3,078 | | | | 379,517 | |
Generac Holdings, Inc.(a) | | | | | | | 537 | | | | 176,974 | |
Prysmian SpA | | | | | | | 11,145 | | | | 357,990 | |
Regal Beloit Corp. | | | | | | | 2,360 | | | | 322,541 | |
Rockwell Automation, Inc. | | | | | | | 3,410 | | | | 829,585 | |
Schneider Electric SE | | | | | | | 7,030 | | | | 1,039,557 | |
Vertiv Holdings Co. | | | | | | | 20,261 | | | | 424,063 | |
Vestas Wind Systems A/S | | | | | | | 5,219 | | | | 978,692 | |
| | | | | | | | | | | | |
| | | | | | | | | | | 4,508,919 | |
| | | | | | | | | | | | |
Industrial Conglomerates – 0.2% | | | | | | | | | | | | |
3M Co. | | | | | | | 8,888 | | | | 1,555,933 | |
| | | | | | | | | | | | |
|
Machinery – 0.9% | |
CNH Industrial NV(a) | | | | | | | 19,450 | | | | 287,096 | |
Deere & Co. | | | | | | | 1,499 | | | | 523,331 | |
Dover Corp. | | | | | | | 7,913 | | | | 975,356 | |
Kawasaki Heavy Industries Ltd.(a) | | | | | | | 18,100 | | | | 410,185 | |
Mitsubishi Heavy Industries Ltd. | | | | | | | 14,000 | | | | 406,114 | |
Navistar International Corp.(a) | | | | | | | 8,420 | | | | 370,985 | |
SKF AB – Class B | | | | | | | 2,722 | | | | 74,165 | |
SMC Corp. | | | | | | | 500 | | | | 296,527 | |
Snap-on, Inc. | | | | | | | 2,071 | | | | 420,641 | |
Volvo AB(a) | | | | | | | 63,964 | | | | 1,637,504 | |
Xylem, Inc./NY | | | | | | | 6,860 | | | | 682,982 | |
| | | | | | | | | | | | |
| | | | | | | | | | | 6,084,886 | |
| | | | | | | | | | | | |
Marine – 0.1% | |
COSCO SHIPPING Holdings Co., Ltd.(a) | | | | | | | 98,800 | | | | 193,577 | |
Evergreen Marine Corp. Taiwan Ltd.(a) | | | | | | | 94,000 | | | | 128,021 | |
Nippon Yusen KK | | | | | | | 13,900 | | | | 402,053 | |
| | | | | | | | | | | | |
| | | | | | | | | | | 723,651 | |
| | | | | | | | | | | | |
| | |
| |
| abfunds.com | | AB ALL MARKET TOTAL RETURN PORTFOLIO | 25 |
CONSOLIDATED PORTFOLIO OF INVESTMENTS (continued)
| | | | | | | | | | | | |
| Company | | | | |
Shares | | | U.S. $ Value | |
| |
Professional Services – 0.8% | |
Intertrust NV(a)(c) | | | | | | | 14,350 | | | $ | 233,890 | |
Recruit Holdings Co., Ltd. | | | | | | | 10,500 | | | | 524,678 | |
RELX PLC | | | | | | | 58,080 | | | | 1,366,491 | |
Robert Half International, Inc. | | | | | | | 4,825 | | | | 375,337 | |
Verisk Analytics, Inc. – Class A | | | | | | | 13,115 | | | | 2,148,893 | |
Wolters Kluwer NV | | | | | | | 7,230 | | | | 573,117 | |
| | | | | | | | | | | | |
| | | | | | | | | | | 5,222,406 | |
| | | | | | | | | | | | |
Road & Rail – 0.1% | |
AMERCO | | | | | | | 728 | | | | 418,396 | |
Union Pacific Corp. | | | | | | | 475 | | | | 97,831 | |
| | | | | | | | | | | | |
| | | | | | | | | | | 516,227 | |
| | | | | | | | | | | | |
Trading Companies &
Distributors – 0.1% | | | | | | | | | | | | |
United Rentals, Inc.(a) | | | | | | | 188 | | | | 55,907 | |
WW Grainger, Inc. | | | | | | | 600 | | | | 223,626 | |
| | | | | | | | | | | | |
| | | | | | | | | | | 279,533 | |
| | | | | | | | | | | | |
| | | | | | | | | | | 33,266,347 | |
| | | | | | | | | | | | |
Communication Services – 4.0% | |
Diversified Telecommunication Services – 0.4% | | | | | | | | | | | | |
Comcast Corp. – Class A | | | | | | | 36,278 | | | | 1,912,576 | |
Nippon Telegraph & Telephone Corp. | | | | | | | 34,800 | | | | 901,495 | |
Telenor ASA | | | | | | | 4,089 | | | | 66,095 | |
| | | | | | | | | | | | |
| | | | | | | | | | | 2,880,166 | |
| | | | | | | | | | | | |
Entertainment – 0.6% | |
Activision Blizzard, Inc. | | | | | | | 6,940 | | | | 663,533 | |
Electronic Arts, Inc. | | | | | | | 10,670 | | | | 1,429,460 | |
Netflix, Inc.(a) | | | | | | | 742 | | | | 399,827 | |
Nintendo Co., Ltd. | | | | | | | 800 | | | | 489,258 | |
Take-Two Interactive Software, Inc.(a) | | | | | | | 2,262 | | | | 417,249 | |
Ubisoft Entertainment SA(a) | | | | | | | 3,020 | | | | 246,224 | |
Walt Disney Co. (The)(a) | | | | | | | 260 | | | | 49,150 | |
| | | | | | | | | | | | |
| | | | | | | | | | | 3,694,701 | |
| | | | | | | | | | | | |
Interactive Media & Services – 2.9% | |
Alphabet, Inc. – Class A(a) | | | | | | | 512 | | | | 1,035,218 | |
Alphabet, Inc. – Class C(a) | | | | | | | 4,193 | | | | 8,540,555 | |
Auto Trader Group PLC(a)(c) | | | | | | | 98,810 | | | | 759,707 | |
Facebook, Inc. – Class A(a) | | | | | | | 27,126 | | | | 6,988,200 | |
IAC/InterActiveCorp(a) | | | | | | | 1,715 | | | | 419,883 | |
Kakaku.com, Inc. | | | | | | | 13,500 | | | | 430,092 | |
Tencent Holdings Ltd. | | | | | | | 9,400 | | | | 817,771 | |
| | | | | | | | | | | | |
| | | | | | | | | | | 18,991,426 | |
| | | | | | | | | | | | |
| | |
| |
26 | AB ALL MARKET TOTAL RETURN PORTFOLIO | | abfunds.com |
CONSOLIDATED PORTFOLIO OF INVESTMENTS (continued)
| | | | | | | | | | | | |
| Company | | | | |
Shares | | | U.S. $ Value | |
| |
Media – 0.0% | |
Charter Communications, Inc. – Class A(a) | | | | | | | 193 | | | $ | 118,390 | |
DISH Network Corp. – Class A(a) | | | | | | | 609 | | | | 19,190 | |
iHeartMedia, Inc. – Class A(a) | | | | | | | 2,453 | | | | 34,514 | |
| | | | | | | | | | | | |
| | | | | | | | | | | 172,094 | |
| | | | | | | | | | | | |
Wireless Telecommunication
Services – 0.1% | | | | | | | | | | | | |
Softbank Corp. | | | | | | | 15,500 | | | | 209,596 | |
Vodafone Group PLC | | | | | | | 117,865 | | | | 201,766 | |
| | | | | | | | | | | | |
| | | | | | | | | | | 411,362 | |
| | | | | | | | | | | | |
| | | | | | | | | | | 26,149,749 | |
| | | | | | | | | | | | |
Consumer Staples – 2.0% | |
Beverages – 0.5% | |
Asahi Group Holdings Ltd. | | | | | | | 35,479 | | | | 1,548,910 | |
Chongqing Brewery Co., Ltd. | | | | | | | 17,344 | | | | 324,091 | |
Coca-Cola Co. (The) | | | | | | | 25,761 | | | | 1,262,032 | |
Kirin Holdings Co., Ltd. | | | | | | | 17,200 | | | | 338,854 | |
| | | | | | | | | | | | |
| | | | | | | | | | | 3,473,887 | |
| | | | | | | | | | | | |
Food & Staples Retailing – 0.3% | |
Koninklijke Ahold Delhaize NV | | | | | | | 28,010 | | | | 739,597 | |
Southeastern Grocers, Inc.(a)(d)(e) | | | | | | | 8,714 | | | | 113,286 | |
Walmart, Inc. | | | | | | | 6,450 | | | | 837,984 | |
| | | | | | | | | | | | |
| | | | | | | | | | | 1,690,867 | |
| | | | | | | | | | | | |
Food Products – 0.7% | |
Archer-Daniels-Midland Co. | | | | | | | 7,340 | | | | 415,297 | |
Bunge Ltd. | | | | | | | 5,289 | | | | 405,032 | |
Danone SA | | | | | | | 21,771 | | | | 1,480,448 | |
Ingredion, Inc. | | | | | | | 4,443 | | | | 400,759 | |
Kerry Group PLC – Class A | | | | | | | 3,600 | | | | 433,158 | |
Morinaga & Co., Ltd./Japan | | | | | | | 8,000 | | | | 288,938 | |
Nestle SA | | | | | | | 3,660 | | | | 381,989 | |
Salmar ASA | | | | | | | 13,770 | | | | 903,102 | |
| | | | | | | | | | | | |
| | | | | | | | | | | 4,708,723 | |
| | | | | | | | | | | | |
Household Products – 0.2% | | | | | | | | | | | | |
Procter & Gamble Co. (The) | | | | | | | 9,280 | | | | 1,146,358 | |
| | | | | | | | | | | | |
|
Tobacco – 0.3% | |
Imperial Brands PLC | | | | | | | 1,772 | | | | 33,017 | |
Philip Morris International, Inc. | | | | | | | 7,670 | | | | 644,433 | |
Smoore International Holdings Ltd.(a)(c) | | | | | | | 43,000 | | | | 348,599 | |
Swedish Match AB | | | | | | | 10,416 | | | | 747,595 | |
| | | | | | | | | | | | |
| | | | | | | | | | | 1,773,644 | |
| | | | | | | | | | | | |
| | | | | | | | | | | 12,793,479 | |
| | | | | | | | | | | | |
| | |
| |
| abfunds.com | | AB ALL MARKET TOTAL RETURN PORTFOLIO | 27 |
CONSOLIDATED PORTFOLIO OF INVESTMENTS (continued)
| | | | | | | | | | | | |
| Company | | | | |
Shares | | | U.S. $ Value | |
| |
Materials – 1.6% | |
Chemicals – 1.1% | |
Akzo Nobel NV | | | | | | | 3,890 | | | $ | 402,264 | |
Chr Hansen Holding A/S(a) | | | | | | | 6,550 | | | | 561,650 | |
Hengli Petrochemical Co., Ltd. | | | | | | | 18,100 | | | | 101,390 | |
Inner Mongolia Junzheng Energy & Chemical Industry Group Co., Ltd. – Class A | | | | | | | 97,400 | | | | 89,812 | |
International Flavors & Fragrances, Inc. | | | | | | | 23,942 | | | | 3,244,381 | |
Johnson Matthey PLC | | | | | | | 5,675 | | | | 242,496 | |
Koninklijke DSM NV | | | | | | | 3,390 | | | | 558,962 | |
Kumho Petrochemical Co., Ltd.(a) | | | | | | | 1,387 | | | | 259,873 | |
LANXESS AG | | | | | | | 5,479 | | | | 406,677 | |
Linde PLC | | | | | | | 2,787 | | | | 680,781 | |
Mitsui Chemicals, Inc. | | | | | | | 4,500 | | | | 139,400 | |
RPM International, Inc. | | | | | | | 3,740 | | | | 297,854 | |
Sumitomo Chemical Co., Ltd. | | | | | | | 40,300 | | | | 196,193 | |
| | | | | | | | | | | | |
| | | | | | | | | | | 7,181,733 | |
| | | | | | | | | | | | |
Construction Materials – 0.0% | |
Forterra, Inc.(a) | | | | | | | 9,160 | | | | 213,153 | |
| | | | | | | | | | | | |
|
Containers & Packaging – 0.1% | |
Smurfit Kappa Group PLC | | | | | | | 4,514 | | | | 213,280 | |
Westrock Co. | | | | | | | 16 | | | | 697 | |
| | | | | | | | | | | | |
| | | | | | | | | | | 213,977 | |
| | | | | | | | | | | | |
Metals & Mining – 0.4% | |
Artsonig Pty Ltd.(d)(e) | | | | | | | 51,133 | | | | – 0 | – |
Constellium SE(a) | | | | | | | 4,470 | | | | 59,183 | |
Evraz PLC | | | | | | | 51,294 | | | | 411,788 | |
First Quantum Minerals Ltd. | | | | | | | 6,264 | | | | 135,016 | |
Glencore PLC(a) | | | | | | | 59,684 | | | | 242,890 | |
Hunan Valin Steel Co., Ltd. – Class A | | | | | | | 221,700 | | | | 200,440 | |
Kumba Iron Ore Ltd. | | | | | | | 9,054 | | | | 388,339 | |
Neenah Enterprises, Inc.(a)(d)(e) | | | | | | | 10,896 | | | | – 0 | – |
Rio Tinto PLC | | | | | | | 678 | | | | 58,760 | |
Southern Copper Corp. | | | | | | | 5,110 | | | | 364,496 | |
Steel Dynamics, Inc. | | | | | | | 9,098 | | | | 378,295 | |
Teck Resources Ltd. – Class B | | | | | | | 14,854 | | | | 309,312 | |
| | | | | | | | | | | | |
| | | | | | | | | | | 2,548,519 | |
| | | | | | | | | | | | |
| | | | | | | | | | | 10,157,382 | |
| | | | | | | | | | | | |
Utilities – 1.1% | |
Electric Utilities – 0.8% | |
American Electric Power Co., Inc. | | | | | | | 1,800 | | | | 134,730 | |
EDP – Energias de Portugal SA | | | | | | | 83,390 | | | | 477,967 | |
Enel SpA | | | | | | | 94,250 | | | | 888,674 | |
Iberdrola SA | | | | | | | 34,390 | | | | 430,973 | |
| | |
| |
28 | AB ALL MARKET TOTAL RETURN PORTFOLIO | | abfunds.com |
CONSOLIDATED PORTFOLIO OF INVESTMENTS (continued)
| | | | | | | | | | | | |
| Company | | | | |
Shares | | | U.S. $ Value | |
| |
NextEra Energy, Inc. | | | | | | | 15,420 | | | $ | 1,133,061 | |
NRG Energy, Inc. | | | | | | | 2,821 | | | | 102,995 | |
PNM Resources, Inc. | | | | | | | 53,322 | | | | 2,559,989 | |
| | | | | | | | | | | | |
| | | | | | | | | | | 5,728,389 | |
| | | | | | | | | | | | |
Gas Utilities – 0.0% | |
UGI Corp. | | | | | | | 771 | | | | 29,537 | |
| | | | | | | | | | | | |
|
Multi-Utilities – 0.2% | |
Ameren Corp. | | | | | | | 8,880 | | | | 623,998 | |
Dominion Energy, Inc. | | | | | | | 4,100 | | | | 280,112 | |
Sempra Energy | | | | | | | 2,935 | | | | 340,401 | |
| | | | | | | | | | | | |
| | | | | | | | | | | 1,244,511 | |
| | | | | | | | | | | | |
Water Utilities – 0.1% | |
American Water Works Co., Inc. | | | | | | | 2,540 | | | | 360,375 | |
| | | | | | | | | | | | |
| | | | | | | | | | | 7,362,812 | |
| | | | | | | | | | | | |
|
Energy – 0.7% | |
Oil, Gas & Consumable Fuels – 0.7% | |
Battalion Oil Corp.(a) | | | | | | | 1 | | | | 12 | |
Berry Corp. | | | | | | | 9,850 | | | | 48,856 | |
CHC Group LLC(a)(f) | | | | | | | 22,775 | | | | 4,327 | |
Cheniere Energy, Inc.(a) | | | | | | | 6,075 | | | | 409,394 | |
Denbury, Inc.(a) | | | | | | | 4,255 | | | | 181,901 | |
ENEOS Holdings, Inc. | | | | | | | 68,600 | | | | 303,348 | |
Idemitsu Kosan Co., Ltd.(b) | | | | | | | 6,000 | | | | 157,819 | |
K2016470219 South Africa Ltd. – Series A(d)(e) | | | | | | | 465,862 | | | | 1 | |
K2016470219 South Africa Ltd. – Series B(d)(e) | | | | | | | 73,623 | | | | – 0 | – |
LUKOIL PJSC (Sponsored ADR) | | | | | | | 10,552 | | | | 786,124 | |
Neste Oyj | | | | | | | 2,435 | | | | 160,832 | |
OMV AG | | | | | | | 8,080 | | | | 389,288 | |
Paragon Litigation – Class A(e) | | | | | | | 649 | | | | 65 | |
Paragon Litigation – Class B(e) | | | | | | | 974 | | | | 6,088 | |
Parkland Corp./Canada(b) | | | | | | | 11,891 | | | | 377,866 | |
QEP Resources, Inc. | | | | | | | 4,236 | | | | 14,572 | |
Royal Dutch Shell PLC – Class B | | | | | | | 40,280 | | | | 789,622 | |
SandRidge Energy, Inc.(a) | | | | | | | 14 | | | | 70 | |
Valero Energy Corp. | | | | | | | 4,930 | | | | 379,511 | |
Vantage Drilling International(a) | | | | | | | 602 | | | | 2,408 | |
Whiting Petroleum Corp.(a) | | | | | | | 1,504 | | | | 51,587 | |
Yanzhou Coal Mining Co., Ltd. | | | | | | | 91,900 | | | | 137,191 | |
Yanzhou Coal Mining Co., Ltd. – Class H | | | | | | | 238,000 | | | | 220,643 | |
| | | | | | | | | | | | |
| | | | | | | | | | | 4,421,525 | |
| | | | | | | | | | | | |
| | |
| |
| abfunds.com | | AB ALL MARKET TOTAL RETURN PORTFOLIO | 29 |
CONSOLIDATED PORTFOLIO OF INVESTMENTS (continued)
| | | | | | | | | | | | |
| Company | | | | |
Shares | | | U.S. $ Value | |
| |
Real Estate – 0.6% | |
Equity Real Estate Investment Trusts (REITs) – 0.3% | | | | | | | | | | | | |
American Campus Communities, Inc. | | | | | | | 5,349 | | | $ | 219,095 | |
American Tower Corp. | | | | | | | 5,102 | | | | 1,102,695 | |
Nippon Building Fund, Inc. | | | | | | | 88 | | | | 539,121 | |
Orix JREIT, Inc.(b) | | | | | | | 106 | | | | 181,554 | |
Weyerhaeuser Co. | | | | | | | 10,022 | | | | 339,445 | |
| | | | | | | | | | | | |
| | | | | | | | | | | 2,381,910 | |
| | | | | | | | | | | | |
Real Estate Management & Development – 0.3% | | | | | | | | | | | | |
CBRE Group, Inc. – Class A(a) | | | | | | | 17,828 | | | | 1,350,827 | |
Tokyu Fudosan Holdings Corp. | | | | | | | 21,400 | | | | 135,161 | |
Vonovia SE | | | | | | | 4,370 | | | | 278,322 | |
| | | | | | | | | | | | |
| | | | | | | | | | | 1,764,310 | |
| | | | | | | | | | | | |
| | | | | | | | | | | 4,146,220 | |
| | | | | | | | | | | | |
| | | |
Total Common Stocks
(cost $302,096,017) | | | | | | | | | | | 362,586,750 | |
| | | | | | | | | | | | |
| | | |
| | | | | | Principal
Amount
(000) | | | | |
CORPORATES – NON-INVESTMENT
GRADE – 5.7% | | | | | | | | | |
Industrial – 4.8% | |
Basic – 0.3% | |
Advanced Drainage Systems, Inc.
5.00%, 09/30/2027(c) | | | U.S.$ | | | | 16 | | | | 16,800 | |
Arconic Corp.
6.125%, 02/15/2028(c) | | | | | | | 33 | | | | 34,837 | |
Big River Steel LLC/BRS Finance Corp.
6.625%, 01/31/2029(c) | | | | | | | 128 | | | | 138,163 | |
CF Industries, Inc.
3.45%, 06/01/2023 | | | | | | | 78 | | | | 81,290 | |
4.95%, 06/01/2043 | | | | | | | 3 | | | | 3,535 | |
5.375%, 03/15/2044 | | | | | | | 76 | | | | 95,149 | |
Cleveland-Cliffs, Inc.
4.625%, 03/01/2029(c) | | | | | | | 25 | | | | 24,472 | |
4.875%, 03/01/2031(c) | | | | | | | 27 | | | | 26,432 | |
6.75%, 03/15/2026(c) | | | | | | | 12 | | | | 12,910 | |
9.875%, 10/17/2025(c) | | | | | | | 75 | | | | 87,814 | |
Commercial Metals Co.
5.375%, 07/15/2027 | | | | | | | 140 | | | | 148,616 | |
Crown Americas LLC/Crown Americas Capital Corp. VI
4.75%, 02/01/2026 | | | | | | | 20 | | | | 20,755 | |
| | |
| |
30 | AB ALL MARKET TOTAL RETURN PORTFOLIO | | abfunds.com |
CONSOLIDATED PORTFOLIO OF INVESTMENTS (continued)
| | | | | | | | | | |
| | | | | Principal
Amount
(000) | | | U.S. $ Value | |
| |
Element Solutions, Inc.
3.875%, 09/01/2028(c) | | U.S.$ | | | 91 | | | $ | 90,866 | |
ERP Iron Ore, LLC
9.04%, 12/31/2019(a)(d)(e)(g)(h) | | | | | 12 | | | | 10,336 | |
FMG Resources (August 2006) Pty Ltd.
4.50%, 09/15/2027(c) | | | | | 36 | | | | 39,551 | |
Graham Packaging Co., Inc.
7.125%, 08/15/2028(c) | | | | | 28 | | | | 30,299 | |
Grinding Media, Inc./Moly-Cop AltaSteel Ltd.
7.375%, 12/15/2023(c) | | | | | 123 | | | | 124,907 | |
Hecla Mining Co.
7.25%, 02/15/2028 | | | | | 28 | | | | 30,360 | |
Illuminate Buyer LLC/Illuminate Holdings IV, Inc.
9.00%, 07/01/2028(c) | | | | | 77 | | | | 85,586 | |
INEOS Quattro Finance 1 PLC
3.75%, 07/15/2026(c) | | EUR | | | 149 | | | | 182,579 | |
Intelligent Packaging Holdco Issuer LP
9.00% (9.00% Cash or 9.75% PIK), 01/15/2026(c)(h) | | U.S.$ | | | 52 | | | | 52,694 | |
Intelligent Packaging Ltd. Finco, Inc./Intelligent Packaging Ltd. Co-Issuer LLC
6.00%, 09/15/2028(c) | | | | | 123 | | | | 128,513 | |
Joseph T Ryerson & Son, Inc.
8.50%, 08/01/2028(c) | | | | | 52 | | | | 57,258 | |
Kaiser Aluminum Corp.
6.50%, 05/01/2025(c) | | | | | 22 | | | | 23,535 | |
Kraton Polymers LLC/Kraton Polymers Capital Corp.
5.25%, 05/15/2026(c) | | EUR | | | 100 | | | | 124,074 | |
Magnetation LLC/Mag Finance Corp.
11.00%, 05/15/2018(a)(d)(e)(g)(i) | | U.S.$ | | | 146 | | | | – 0 | – |
Mercer International, Inc.
5.125%, 02/01/2029(c) | | | | | 93 | | | | 94,455 | |
Novelis Corp.
5.875%, 09/30/2026(c) | | | | | 40 | | | | 41,700 | |
Peabody Energy Corp.
6.00%, 03/31/2022(c) | | | | | 1 | | | | 656 | |
8.50% (6.00% Cash and 2.50% PIK), 12/31/2024(c)(h) | | | | | 7 | | | | 4,130 | |
PIC AU Holdings LLC/PIC AU Holdings Corp.
10.00%, 12/31/2024(c) | | | | | 7 | | | | 6,255 | |
SPCM SA
4.875%, 09/15/2025(c) | | | | | 142 | | | | 145,984 | |
| | |
| |
| abfunds.com | | AB ALL MARKET TOTAL RETURN PORTFOLIO | 31 |
CONSOLIDATED PORTFOLIO OF INVESTMENTS (continued)
| | | | | | | | | | | | |
| | | | | | Principal
Amount
(000) | | | U.S. $ Value | |
| |
United States Steel Corp.
12.00%, 06/01/2025(c) | | | U.S.$ | | | | 125 | | | $ | 149,765 | |
Valvoline, Inc.
4.25%, 02/15/2030(c) | | | | | | | 152 | | | | 157,125 | |
| | | | | | | | | | | | |
| | | | | | | | | | | 2,271,401 | |
| | | | | | | | | | | | |
Capital Goods – 0.4% | |
ARD Finance SA
5.00% (5.00% Cash or 5.75% PIK), 06/30/2027(c)(h) | | | EUR | | | | 202 | | | | 252,141 | |
Ball Corp.
5.00%, 03/15/2022 | | | U.S.$ | | | | 93 | | | | 96,973 | |
Bombardier, Inc. | | | | | | | | | | | | |
5.75%, 03/15/2022(c) | | | | | | | 364 | | | | 371,284 | |
8.75%, 12/01/2021(c) | | | | | | | 60 | | | | 62,291 | |
Clean Harbors, Inc.
4.875%, 07/15/2027(c) | | | | | | | 3 | | | | 3,149 | |
Cleaver-Brooks, Inc.
7.875%, 03/01/2023(b)(c) | | | | | | | 74 | | | | 72,710 | |
Colfax Corp.
6.00%, 02/15/2024(c) | | | | | | | 23 | | | | 23,752 | |
6.375%, 02/15/2026(c) | | | | | | | 24 | | | | 25,652 | |
Crown Americas LLC/Crown Americas Capital Corp. IV
4.50%, 01/15/2023 | | | | | | | 16 | | | | 16,810 | |
Energizer Holdings, Inc.
4.75%, 06/15/2028(c) | | | | | | | 33 | | | | 33,717 | |
EnerSys
4.375%, 12/15/2027(c) | | | | | | | 100 | | | | 105,634 | |
Gates Global LLC/Gates Corp.
6.25%, 01/15/2026(c) | | | | | | | 130 | | | | 136,430 | |
GFL Environmental, Inc. | | | | | | | | | | | | |
5.125%, 12/15/2026(c) | | | | | | | 15 | | | | 15,874 | |
8.50%, 05/01/2027(c) | | | | | | | 50 | | | | 55,277 | |
Granite US Holdings Corp.
11.00%, 10/01/2027(c) | | | | | | | 54 | | | | 60,546 | |
Griffon Corp.
5.75%, 03/01/2028 | | | | | | | 22 | | | | 23,101 | |
JELD-WEN, Inc.
4.625%, 12/15/2025(c) | | | | | | | 17 | | | | 17,319 | |
Mauser Packaging Solutions Holding Co.
5.50%, 04/15/2024(c) | | | | | | | 13 | | | | 13,049 | |
Moog, Inc.
4.25%, 12/15/2027(c) | | | | | | | 42 | | | | 43,154 | |
Odebrecht Holdco Finance Ltd.
Zero Coupon, 09/10/2058(c) | | | | | | | 127 | | | | 3,333 | |
RBS Global, Inc./Rexnord LLC
4.875%, 12/15/2025(c) | | | | | | | 60 | | | | 61,494 | |
| | |
| |
32 | AB ALL MARKET TOTAL RETURN PORTFOLIO | | abfunds.com |
CONSOLIDATED PORTFOLIO OF INVESTMENTS (continued)
| | | | | | | | | | | | |
| | | | | | Principal
Amount
(000) | | | U.S. $ Value | |
| |
Signature Aviation US Holdings, Inc.
4.00%, 03/01/2028(c) | | | U.S.$ | | | | 55 | | | $ | 55,669 | |
5.375%, 05/01/2026(c) | | | | | | | 60 | | | | 61,430 | |
Stevens Holding Co., Inc.
6.125%, 10/01/2026(c) | | | | | | | 18 | | | | 19,492 | |
Summit Materials LLC/Summit Materials Finance Corp.
5.25%, 01/15/2029(c) | | | | | | | 34 | | | | 36,078 | |
Terex Corp.
5.625%, 02/01/2025(c) | | | | | | | 81 | | | | 83,121 | |
Tervita Corp.
11.00%, 12/01/2025(b)(c) | | | | | | | 140 | | | | 152,716 | |
TransDigm UK Holdings PLC
6.875%, 05/15/2026 | | | | | | | 265 | | | | 278,833 | |
TransDigm, Inc.
6.25%, 03/15/2026(c) | | | | | | | 47 | | | | 49,514 | |
Triumph Group, Inc.
6.25%, 09/15/2024(c) | | | | | | | 37 | | | | 37,081 | |
7.75%, 08/15/2025 | | | | | | | 42 | | | | 41,112 | |
8.875%, 06/01/2024(c) | | | | | | | 66 | | | | 73,423 | |
| | | | | | | | | | | | |
| | | | | | | | | | | 2,382,159 | |
| | | | | | | | | | | | |
Communications - Media – 0.4% | |
Advantage Sales & Marketing, Inc.
Zero Coupon, 10/28/2027 | | | | | | | 150 | | | | 150,750 | |
6.50%, 11/15/2028(c) | | | | | | | 113 | | | | 115,801 | |
AMC Networks, Inc.
4.25%, 02/15/2029 | | | | | | | 181 | | | | 177,735 | |
Arches Buyer, Inc.
6.125%, 12/01/2028(b)(c) | | | | | | | 39 | | | | 40,343 | |
Banijay Entertainment SASU
3.50%, 03/01/2025(c) | | | EUR | | | | 150 | | | | 180,014 | |
CCO Holdings LLC/CCO Holdings Capital Corp.
5.75%, 02/15/2026(c) | | | U.S.$ | | | | 61 | | | | 63,039 | |
Clear Channel Worldwide Holdings, Inc.
5.125%, 08/15/2027(c) | | | | | | | 25 | | | | 25,422 | |
CSC Holdings LLC
3.375%, 02/15/2031(c) | | | | | | | 200 | | | | 191,958 | |
5.875%, 09/15/2022 | | | | | | | 15 | | | | 15,789 | |
6.75%, 11/15/2021 | | | | | | | 40 | | | | 41,351 | |
DISH DBS Corp.
7.375%, 07/01/2028 | | | | | | | 98 | | | | 102,720 | |
DISH Network Corp.
3.375%, 08/15/2026(j) | | | | | | | 56 | | | | 52,564 | |
iHeartCommunications, Inc.
4.75%, 01/15/2028(c) | | | | | | | 35 | | | | 35,739 | |
| | |
| |
| abfunds.com | | AB ALL MARKET TOTAL RETURN PORTFOLIO | 33 |
CONSOLIDATED PORTFOLIO OF INVESTMENTS (continued)
| | | | | | | | | | | | |
| | | | | | Principal
Amount
(000) | | | U.S. $ Value | |
| |
6.375%, 05/01/2026 | | | U.S.$ | | | | 22 | | | $ | 23,208 | |
8.375%, 05/01/2027 | | | | | | | 137 | | | | 144,814 | |
Lamar Media Corp.
4.875%, 01/15/2029 | | | | | | | 4 | | | | 4,213 | |
LCPR Senior Secured Financing DAC
6.75%, 10/15/2027(c) | | | | | | | 200 | | | | 214,646 | |
Meredith Corp.
6.875%, 02/01/2026 | | | | | | | 254 | | | | 259,138 | |
National CineMedia LLC
5.75%, 08/15/2026 | | | | | | | 33 | | | | 28,646 | |
5.875%, 04/15/2028(c) | | | | | | | 67 | | | | 61,712 | |
Outfront Media Capital LLC/Outfront Media Capital Corp.
4.625%, 03/15/2030(c) | | | | | | | 61 | | | | 60,513 | |
Scripps Escrow II, Inc.
5.375%, 01/15/2031(c) | | | | | | | 41 | | | | 41,650 | |
Scripps Escrow, Inc.
5.875%, 07/15/2027(c) | | | | | | | 76 | | | | 79,102 | |
Sinclair Television Group, Inc.
5.125%, 02/15/2027(c) | | | | | | | 150 | | | | 148,891 | |
Summer BC Holdco B SARL
5.75%, 10/31/2026(c) | | | EUR | | | | 150 | | | | 190,937 | |
TEGNA, Inc.
4.75%, 03/15/2026(c) | | | U.S.$ | | | | 35 | | | | 37,287 | |
5.00%, 09/15/2029 | | | | | | | 110 | | | | 114,685 | |
Univision Communications, Inc.
9.50%, 05/01/2025(c) | | | | | | | 43 | | | | 46,871 | |
Urban One, Inc.
7.375%, 02/01/2028(c) | | | | | | | 203 | | | | 204,721 | |
| | | | | | | | | | | | |
| | | | | | | | | | | 2,854,259 | |
| | | | | | | | | | | | |
Communications - Telecommunications – 0.2% | | | | | | | | | | | | |
C&W Senior Financing DAC
6.875%, 09/15/2027(c) | | | | | | | 200 | | | | 214,158 | |
Connect Finco SARL/Connect US Finco LLC
6.75%, 10/01/2026(c) | | | | | | | 200 | | | | 207,812 | |
Consolidated Communications, Inc.
6.50%, 10/01/2028(c) | | | | | | | 164 | | | | 175,810 | |
Embarq Corp.
7.995%, 06/01/2036 | | | | | | | 221 | | | | 263,454 | |
Frontier Communications Corp.
5.875%, 10/15/2027(c) | | | | | | | 65 | | | | 69,586 | |
6.75%, 05/01/2029(c) | | | | | | | 28 | | | | 29,071 | |
Hughes Satellite Systems Corp.
7.625%, 06/15/2021 | | | | | | | 47 | | | | 47,563 | |
| | |
| |
34 | AB ALL MARKET TOTAL RETURN PORTFOLIO | | abfunds.com |
CONSOLIDATED PORTFOLIO OF INVESTMENTS (continued)
| | | | | | | | | | | | |
| | | | | | Principal
Amount
(000) | | | U.S. $ Value | |
| |
Intelsat Jackson Holdings SA
5.50%, 08/01/2023(a)(k) | | | U.S.$ | | | | 177 | | | $ | 113,191 | |
Sprint Communications, Inc.
11.50%, 11/15/2021 | | | | | | | 60 | | | | 64,071 | |
Telecom Italia Capital SA
7.20%, 07/18/2036 | | | | | | | 105 | | | | 134,583 | |
Zayo Group Holdings, Inc.
6.125%, 03/01/2028(c) | | | | | | | 108 | | | | 111,488 | |
Zayo Group LLC/Zayo Capital, Inc.
5.75%, 01/15/2027(c) | | | | | | | 0 | ** | | | 117 | |
| | | | | | | | | | | | |
| | | | | | | | | | | 1,430,904 | |
| | | | | | | | | | | | |
Consumer Cyclical - Automotive – 0.3% | |
Allison Transmission, Inc.
5.875%, 06/01/2029(c) | | | | | | | 60 | | | | 65,402 | |
American Axle & Manufacturing, Inc.
6.25%, 04/01/2025(b) | | | | | | | 13 | | | | 13,392 | |
6.875%, 07/01/2028(b) | | | | | | | 213 | | | | 226,281 | |
Aston Martin Capital Holdings Ltd.
15.00% (8.89% Cash and 6.11% PIK), 11/30/2026(c)(h) | | | | | | | 248 | | | | 254,674 | |
Clarios Global LP/Clarios US Finance Co.
6.25%, 05/15/2026(c) | | | | | | | 77 | | | | 81,909 | |
Dana, Inc.
5.375%, 11/15/2027 | | | | | | | 11 | | | | 11,537 | |
5.625%, 06/15/2028 | | | | | | | 17 | | | | 18,092 | |
Dealer Tire LLC/DT Issuer LLC
8.00%, 02/01/2028(c) | | | | | | | 62 | | | | 66,005 | |
Exide Technologies
(Exchange Priority)
11.00%, 10/31/2024(a)(d)(e)(i) | | | | | | | 59 | | | | – 0 | – |
(First Lien)
11.00%, 10/31/2024(a)(d)(e)(i) | | | | | | | 24 | | | | – 0 | – |
Ford Motor Co.
8.50%, 04/21/2023 | | | | | | | 156 | | �� | | 174,506 | |
Garrett LX I SARL/Garrett Borrowing LLC
5.125%, 10/15/2026(a)(c)(k) | | | EUR | | | | 108 | | | | 139,465 | |
IHO Verwaltungs GmbH
3.625% (3.625% Cash or 4.375% PIK), 05/15/2025(c)(h) | | | | | | | 100 | | | | 122,767 | |
Jaguar Land Rover Automotive PLC
5.875%, 11/15/2024-01/15/2028(c) | | | U.S.$ | | | | 353 | | | | 402,647 | |
Meritor, Inc.
4.50%, 12/15/2028(c) | | | | | | | 104 | | | | 105,715 | |
6.25%, 02/15/2024-06/01/2025(c) | | | | | | | 65 | | | | 67,895 | |
PM General Purchaser LLC
9.50%, 10/01/2028(c) | | | | | | | 88 | | | | 96,468 | |
| | |
| |
| abfunds.com | | AB ALL MARKET TOTAL RETURN PORTFOLIO | 35 |
CONSOLIDATED PORTFOLIO OF INVESTMENTS (continued)
| | | | | | | | | | | | |
| | | | | | Principal
Amount
(000) | | | U.S. $ Value | |
| |
Real Hero Merger Sub 2, Inc.
6.25%, 02/01/2029(c) | | | U.S.$ | | | | 45 | | | $ | 46,350 | |
Tenneco, Inc. | | | | | | | | | | | | |
5.00%, 07/15/2026(b) | | | | | | | 121 | | | | 113,735 | |
7.875%, 01/15/2029(c) | | | | | | | 83 | | | | 93,020 | |
Titan International, Inc.
6.50%, 11/30/2023 | | | | | | | 102 | | | | 100,467 | |
| | | | | | | | | | | | |
| | | | | | | | | | | 2,200,327 | |
| | | | | | | | | | | | |
Consumer Cyclical - Entertainment – 0.3% | | | | | | | | | | | | |
Carnival Corp.
5.75%, 03/01/2027(c) | | | | | | | 81 | | | | 82,099 | |
7.625%, 03/01/2026(c) | | | | | | | 10 | | | | 10,513 | |
9.875%, 08/01/2027(c) | | | | | | | 60 | | | | 68,977 | |
11.50%, 04/01/2023(c) | | | | | | | 112 | | | | 127,642 | |
Cedar Fair LP/Canada’s Wonderland Co./Magnum Management Corp./Millennium Op
5.50%, 05/01/2025(c) | | | | | | | 179 | | | | 187,735 | |
Mattel, Inc.
5.875%, 12/15/2027(c) | | | | | | | 15 | | | | 16,330 | |
NCL Corp. Ltd.
5.875%, 03/15/2026(c) | | | | | | | 123 | | | | 123,791 | |
Royal Caribbean Cruises Ltd.
10.875%, 06/01/2023(c) | | | | | | | 127 | | | | 144,000 | |
11.50%, 06/01/2025(c) | | | | | | | 224 | | | | 262,244 | |
SeaWorld Parks & Entertainment, Inc.
8.75%, 05/01/2025(c) | | | | | | | 93 | | | | 100,905 | |
9.50%, 08/01/2025(c) | | | | | | | 135 | | | | 146,318 | |
Silversea Cruise Finance Ltd.
7.25%, 02/01/2025(c) | | | | | | | 213 | | | | 220,112 | |
Six Flags Entertainment Corp.
4.875%, 07/31/2024(c) | | | | | | | 30 | | | | 30,059 | |
Six Flags Theme Parks, Inc.
7.00%, 07/01/2025(c) | | | | | | | 38 | | | | 40,922 | |
Vail Resorts, Inc.
6.25%, 05/15/2025(c) | | | | | | | 25 | | | | 26,689 | |
Viking Cruises Ltd.
5.875%, 09/15/2027(c) | | | | | | | 129 | | | | 124,218 | |
7.00%, 02/15/2029(c) | | | | | | | 34 | | | | 34,373 | |
13.00%, 05/15/2025(c) | | | | | | | 35 | | | | 41,181 | |
VOC Escrow Ltd.
5.00%, 02/15/2028(c) | | | | | | | 3 | | | | 2,960 | |
| | | | | | | | | | | | |
| | | | | | | | | | | 1,791,068 | |
| | | | | | | | | | | | |
Consumer Cyclical - Other – 0.4% | | | | | | | | | | | | |
Adams Homes, Inc.
7.50%, 02/15/2025(c) | | | | | | | 79 | | | | 82,774 | |
| | |
| |
36 | AB ALL MARKET TOTAL RETURN PORTFOLIO | | abfunds.com |
CONSOLIDATED PORTFOLIO OF INVESTMENTS (continued)
| | | | | | | | | | |
| | | | | Principal
Amount
(000) | | | U.S. $ Value | |
| |
Bally’s Corp.
6.75%, 06/01/2027(c) | | U.S.$ | | | 97 | | | $ | 103,441 | |
Beazer Homes USA, Inc.
5.875%, 10/15/2027 | | | | | 7 | | | | 7,301 | |
6.75%, 03/15/2025 | | | | | 46 | | | | 47,193 | |
Brookfield Residential Properties, Inc./Brookfield Residential US Corp.
4.875%, 02/15/2030(c) | | | | | 113 | | | | 114,364 | |
6.25%, 09/15/2027(c) | | | | | 3 | | | | 3,167 | |
Caesars Entertainment, Inc.
6.25%, 07/01/2025(c) | | | | | 102 | | | | 108,019 | |
Caesars Holdings, Inc.
5.00%, 10/01/2024(j) | | | | | 26 | | | | 60,172 | |
CP Atlas Buyer, Inc.
7.00%, 12/01/2028(c) | | | | | 44 | | | | 45,762 | |
Empire Communities Corp.
7.00%, 12/15/2025(c) | | | | | 29 | | | | 30,495 | |
Five Point Operating Co. LP/Five Point Capital Corp.
7.875%, 11/15/2025(c) | | | | | 173 | | | | 182,510 | |
Forestar Group, Inc.
5.00%, 03/01/2028(c) | | | | | 40 | | | | 41,929 | |
8.00%, 04/15/2024(c) | | | | | 67 | | | | 70,075 | |
Forterra Finance LLC/FRTA Finance Corp.
6.50%, 07/15/2025(c) | | | | | 27 | | | | 29,125 | |
Hilton Domestic Operating Co., Inc.
3.625%, 02/15/2032(c) | | | | | 89 | | | | 87,798 | |
5.375%, 05/01/2025(c) | | | | | 21 | | | | 22,076 | |
5.75%, 05/01/2028(c) | | | | | 22 | | | | 23,832 | |
Installed Building Products, Inc.
5.75%, 02/01/2028(c) | | | | | 31 | | | | 33,056 | |
K. Hovnanian Enterprises, Inc.
10.00%, 07/15/2022(c) | | | | | 199 | | | | 201,026 | |
KB Home
7.00%, 12/15/2021 | | | | | 54 | | | | 55,481 | |
Marriott Ownership Resorts, Inc.
6.125%, 09/15/2025(c) | | | | | 39 | | | | 41,536 | |
Marriott Ownership Resorts, Inc./ILG LLC
6.50%, 09/15/2026 | | | | | 154 | | | | 159,843 | |
Mattamy Group Corp.
4.625%, 03/01/2030(c) | | | | | 88 | | | | 91,434 | |
5.25%, 12/15/2027(c) | | | | | 53 | | | | 55,761 | |
Meritage Homes Corp.
7.00%, 04/01/2022 | | | | | 11 | | | | 11,217 | |
Scientific Games International, Inc.
5.00%, 10/15/2025(c) | | | | | 27 | | | | 27,784 | |
7.00%, 05/15/2028(c) | | | | | 43 | | | | 45,557 | |
| | |
| |
| abfunds.com | | AB ALL MARKET TOTAL RETURN PORTFOLIO | 37 |
CONSOLIDATED PORTFOLIO OF INVESTMENTS (continued)
| | | | | | | | | | | | |
| | | | | | Principal
Amount
(000) | | | U.S. $ Value | |
| |
Shea Homes LP/Shea Homes Funding Corp.
4.75%, 02/15/2028-04/01/2029(c) | | | U.S.$ | | | | 142 | | | $ | 146,280 | |
Sugarhouse HSP Gaming Prop Mezz LP/Sugarhouse HSP Gaming Finance Corp.
5.875%, 05/15/2025(c) | | | | | | | 197 | | | | 191,112 | |
Taylor Morrison Communities, Inc.
5.75%, 01/15/2028(c) | | | | | | | 20 | | | | 22,304 | |
5.875%, 06/15/2027(c) | | | | | | | 3 | | | | 3,371 | |
Taylor Morrison Communities, Inc./Taylor Morrison Holdings II, Inc.
5.625%, 03/01/2024(c) | | | | | | | 183 | | | | 197,493 | |
Travel + Leisure Co.
4.625%, 03/01/2030(c) | | | | | | | 94 | | | | 97,540 | |
6.625%, 07/31/2026(c) | | | | | | | 48 | | | | 54,164 | |
Wyndham Hotels & Resorts, Inc.
5.375%, 04/15/2026(c) | | | | | | | 3 | | | | 3,078 | |
Wynn Las Vegas LLC/Wynn Las Vegas Capital Corp.
5.50%, 03/01/2025(c) | | | | | | | 93 | | | | 98,590 | |
| | | | | | | | | | | | |
| | | | | | | | | | | 2,596,660 | |
| | | | | | | | | | | | |
Consumer Cyclical -
Restaurants – 0.0% | | | | | | | | | | | | |
1011778 BC ULC/New Red Finance, Inc.
5.75%, 04/15/2025(c) | | | | | | | 53 | | | | 56,506 | |
IRB Holding Corp.
6.75%, 02/15/2026(c) | | | | | | | 122 | | | | 126,054 | |
| | | | | | | | | | | | |
| | | | | | | | | | | 182,560 | |
| | | | | | | | | | | | |
Consumer Cyclical - Retailers – 0.3% | | | | | | | | | | | | |
BCPE Ulysses Intermediate, Inc.
7.75% (7.75% Cash or 8.50% PIK), 04/01/2027(c)(h) | | | | | | | 48 | | | | 48,839 | |
Burlington Coat Factory Warehouse Corp.
6.25%, 04/15/2025(c) | | | | | | | 12 | | | | 12,756 | |
Dufry One BV
2.50%, 10/15/2024(c) | | | EUR | | | | 143 | | | | 166,120 | |
FirstCash, Inc.
4.625%, 09/01/2028(c) | | | U.S.$ | | | | 22 | | | | 22,850 | |
Foundation Building Materials, Inc.
6.00%, 03/01/2029(c) | | | | | | | 24 | | | | 23,927 | |
L Brands, Inc.
5.25%, 02/01/2028 | | | | | | | 13 | | | | 13,906 | |
6.625%, 10/01/2030(c) | | | | | | | 129 | | | | 145,271 | |
6.875%, 07/01/2025-11/01/2035(c) | | | | | | | 163 | | | | 193,216 | |
7.50%, 06/15/2029 | | | | | | | 13 | | | | 14,688 | |
9.375%, 07/01/2025(c) | | | | | | | 55 | | | | 68,165 | |
| | |
| |
38 | AB ALL MARKET TOTAL RETURN PORTFOLIO | | abfunds.com |
CONSOLIDATED PORTFOLIO OF INVESTMENTS (continued)
| | | | | | | | | | | | |
| | | | | | Principal
Amount
(000) | | | U.S. $ Value | |
| |
LBM Acquisition LLC
6.25%, 01/15/2029(c) | | | U.S.$ | | | | 20 | | | $ | 20,310 | |
Murphy Oil USA, Inc.
5.625%, 05/01/2027 | | | | | | | 6 | | | | 5,983 | |
Penske Automotive Group, Inc.
3.50%, 09/01/2025 | | | | | | | 65 | | | | 66,343 | |
5.50%, 05/15/2026 | | | | | | | 15 | | | | 15,479 | |
PetSmart, Inc.
7.125%, 03/15/2023(c) | | | | | | | 141 | | | | 141,411 | |
PetSmart, Inc./PetSmart Finance Corp.
7.75%, 02/15/2029(c) | | | | | | | 271 | | | | 290,672 | |
Rite Aid Corp.
7.50%, 07/01/2025(c) | | | | | | | 140 | | | | 146,726 | |
Sonic Automotive, Inc.
6.125%, 03/15/2027 | | | | | | | 47 | | | | 49,325 | |
Specialty Building Products Holdings LLC/SBP Finance Corp.
6.375%, 09/30/2026(c) | | | | | | | 176 | | | | 182,185 | |
Staples, Inc.
7.50%, 04/15/2026(c) | | | | | | | 215 | | | | 215,477 | |
TPro Acquisition Corp.
11.00%, 10/15/2024(c) | | | | | | | 36 | | | | 39,399 | |
White Cap Buyer LLC
6.875%, 10/15/2028(c) | | | | | | | 151 | | | | 160,881 | |
White Cap Parent LLC
8.25%, 03/15/2026(c)(h) | | | | | | | 29 | | | | 29,980 | |
William Carter Co. (The)
5.50%, 05/15/2025(c) | | | | | | | 47 | | | | 49,647 | |
| | | | | | | | | | | | |
| | | | | | | | | | | 2,123,556 | |
| | | | | | | | | | | | |
Consumer Non-Cyclical – 0.4% | |
Acadia Healthcare Co., Inc.
5.50%, 07/01/2028(c) | | | | | | | 88 | | | | 93,190 | |
AdaptHealth LLC
4.625%, 08/01/2029(c) | | | | | | | 118 | | | | 118,079 | |
6.125%, 08/01/2028(c) | | | | | | | 25 | | | | 26,541 | |
Albertsons Cos., Inc./Safeway, Inc./New Albertsons LP/Albertsons LLC
3.25%, 03/15/2026(c) | | | | | | | 184 | | | | 182,267 | |
Bausch Health Cos., Inc.
6.25%, 02/15/2029(c) | | | | | | | 7 | | | | 7,454 | |
CD&R Smokey Buyer, Inc.
6.75%, 07/15/2025(c) | | | | | | | 8 | | | | 8,574 | |
CHS/Community Health Systems, Inc. 4.75%, 02/15/2031(c) | | | | | | | 27 | | | | 26,582 | |
6.875%, 04/01/2028-04/15/2029(c) | | | | | | | 258 | | | | 258,119 | |
8.125%, 06/30/2024(c) | | | | | | | 97 | | | | 101,433 | |
| | |
| |
| abfunds.com | | AB ALL MARKET TOTAL RETURN PORTFOLIO | 39 |
CONSOLIDATED PORTFOLIO OF INVESTMENTS (continued)
| | | | | | | | | | | | |
| | | | | | Principal
Amount
(000) | | | U.S. $ Value | |
| |
DaVita, Inc.
3.75%, 02/15/2031(c) | | | U.S.$ | | | | 90 | | | $ | 85,972 | |
Emergent BioSolutions, Inc.
3.875%, 08/15/2028(c) | | | | | | | 13 | | | | 13,203 | |
Endo Dac/Endo Finance LLC/Endo Finco, Inc.
9.50%, 07/31/2027(c) | | | | | | | 36 | | | | 40,574 | |
Global Medical Response, Inc.
6.50%, 10/01/2025(c) | | | | | | | 140 | | | | 145,944 | |
HCA, Inc.
5.875%, 05/01/2023 | | | | | | | 23 | | | | 25,093 | |
Kronos Acquisition Holdings, Inc./KIK Custom Products, Inc.
7.00%, 12/31/2027(c) | | | | | | | 132 | | | | 130,636 | |
Lamb Weston Holdings, Inc.
4.625%, 11/01/2024(c) | | | | | | | 140 | | | | 145,314 | |
Mallinckrodt International Finance SA/Mallinckrodt CB LLC
5.50%, 04/15/2025(a)(c)(k) | | | | | | | 26 | | | | 13,812 | |
MEDNAX, Inc.
6.25%, 01/15/2027(c) | | | | | | | 17 | | | | 17,956 | |
ModivCare, Inc.
5.875%, 11/15/2025(c) | | | | | | | 17 | | | | 18,019 | |
Newell Brands, Inc.
4.35%, 04/01/2023 | | | | | | | 4 | | | | 4,205 | |
Par Pharmaceutical, Inc.
7.50%, 04/01/2027(c) | | | | | | | 164 | | | | 176,216 | |
RP Escrow Issuer LLC
5.25%, 12/15/2025(c) | | | | | | | 45 | | | | 46,561 | |
Spectrum Brands, Inc.
3.875%, 03/15/2031(c) | | | | | | | 175 | | | | 173,071 | |
5.75%, 07/15/2025 | | | | | | | 30 | | | | 30,900 | |
Sunshine Mid BV
6.50%, 05/15/2026(c) | | | EUR | | | | 103 | | | | 128,239 | |
Tenet Healthcare Corp.
5.125%, 05/01/2025 | | | U.S.$ | | | | 35 | | | | 35,368 | |
6.125%, 10/01/2028(c) | | | | | | | 65 | | | | 68,340 | |
7.50%, 04/01/2025(c) | | | | | | | 70 | | | | 76,088 | |
US Acute Care Solutions LLC
6.375%, 03/01/2026(c) | | | | | | | 18 | | | | 18,385 | |
US Foods, Inc.
4.75%, 02/15/2029(c) | | | | | | | 188 | | | | 191,296 | |
US Renal Care, Inc.
10.625%, 07/15/2027(c) | | | | | | | 85 | | | | 93,632 | |
| | | | | | | | | | | | |
| | | | | | | | | | | 2,501,063 | |
| | | | | | | | | | | | |
| | |
| |
40 | AB ALL MARKET TOTAL RETURN PORTFOLIO | | abfunds.com |
CONSOLIDATED PORTFOLIO OF INVESTMENTS (continued)
| | | | | | | | | | |
| | | | | Principal
Amount
(000) | | | U.S. $ Value | |
| |
Energy – 1.0% | |
Antero Resources Corp.
7.625%, 02/01/2029(c) | | U.S.$ | | | 29 | | | $ | 30,906 | |
8.375%, 07/15/2026(c) | | | | | 67 | | | | 73,242 | |
Apache Corp.
4.625%, 11/15/2025 | | | | | 8 | | | | 8,286 | |
4.875%, 11/15/2027 | | | | | 16 | | | | 16,803 | |
Berry Petroleum Co. LLC
7.00%, 02/15/2026(c) | | | | | 115 | | | | 110,625 | |
Blue Racer Midstream LLC/Blue Racer Finance Corp.
6.625%, 07/15/2026(c) | | | | | 29 | | | | 29,665 | |
7.625%, 12/15/2025(c) | | | | | 42 | | | | 45,173 | |
Callon Petroleum, Co.
6.25%, 04/15/2023 | | | | | 28 | | | | 26,034 | |
8.25%, 07/15/2025 | | | | | 169 | | | | 146,308 | |
9.00%, 04/01/2025(c) | | | | | 34 | | | | 33,694 | |
Citgo Holding, Inc.
9.25%, 08/01/2024(c) | | | | | 50 | | | | 49,212 | |
CITGO Petroleum Corp.
6.25%, 08/15/2022(c) | | | | | 34 | | | | 34,014 | |
6.375%, 06/15/2026(c) | | | | | 43 | | | | 43,648 | |
7.00%, 06/15/2025(c) | | | | | 152 | | | | 156,349 | |
CNX Resources Corp.
6.00%, 01/15/2029(c) | | | | | 64 | | | | 67,021 | |
7.25%, 03/14/2027(c) | | | | | 15 | | | | 16,064 | |
Comstock Resources, Inc.
6.75%, 03/01/2029(c) | | | | | 36 | | | | 37,234 | |
7.50%, 05/15/2025(c) | | | | | 41 | | | | 42,881 | |
9.75%, 08/15/2026 | | | | | 138 | | | | 150,722 | |
Diamond Offshore Drilling, Inc.
4.875%, 11/01/2043(a)(k) | | | | | 367 | | | | 80,089 | |
7.875%, 08/15/2025(a)(k) | | | | | 43 | | | | 9,582 | |
EnLink Midstream LLC
5.625%, 01/15/2028(c) | | | | | 120 | | | | 120,952 | |
EnLink Midstream Partners LP
4.15%, 06/01/2025 | | | | | 179 | | | | 177,777 | |
4.40%, 04/01/2024 | | | | | 7 | | | | 7,043 | |
5.05%, 04/01/2045 | | | | | 23 | | | | 18,374 | |
5.45%, 06/01/2047 | | | | | 17 | | | | 14,046 | |
5.60%, 04/01/2044 | | | | | 10 | | | | 8,316 | |
EQM Midstream Partners LP
4.50%, 01/15/2029(c) | | | | | 68 | | | | 65,976 | |
4.75%, 01/15/2031(c) | | | | | 63 | | | | 60,658 | |
Genesis Energy LP/Genesis Energy Finance Corp.
5.625%, 06/15/2024 | | | | | 51 | | | | 50,322 | |
| | |
| |
| abfunds.com | | AB ALL MARKET TOTAL RETURN PORTFOLIO | 41 |
CONSOLIDATED PORTFOLIO OF INVESTMENTS (continued)
| | | | | | | | | | |
| | | | | Principal
Amount
(000) | | | U.S. $ Value | |
| |
6.25%, 05/15/2026 | | U.S.$ | | | 47 | | | $ | 44,910 | |
6.50%, 10/01/2025 | | | | | 32 | | | | 31,019 | |
7.75%, 02/01/2028 | | | | | 84 | | | | 82,974 | |
8.00%, 01/15/2027 | | | | | 57 | | | | 57,608 | |
Global Partners LP/GLP Finance Corp.
6.875%, 01/15/2029 | | | | | 38 | | | | 41,107 | |
7.00%, 08/01/2027 | | | | | 51 | | | | 54,077 | |
Gulfport Energy Corp.
6.00%, 10/15/2024(a)(k) | | | | | 62 | | | | 56,873 | |
6.375%, 05/15/2025-01/15/2026(a)(k) | | | | | 279 | | | | 256,184 | |
6.625%, 05/01/2023(a)(k) | | | | | 12 | | | | 11,015 | |
Hess Midstream Operations LP
5.625%, 02/15/2026(c) | | | | | 197 | | | | 203,940 | |
HighPoint Operating Corp.
7.00%, 10/15/2022 | | | | | 33 | | | | 17,397 | |
Hilcorp Energy I LP/Hilcorp Finance Co.
5.75%, 10/01/2025-02/01/2029(c) | | | | | 40 | | | | 40,361 | |
6.00%, 02/01/2031(c) | | | | | 39 | | | | 39,648 | |
Indigo Natural Resources LLC
5.375%, 02/01/2029(c) | | | | | 78 | | | | 77,881 | |
Moss Creek Resources Holdings, Inc.
7.50%, 01/15/2026(c) | | | | | 116 | | | | 96,237 | |
Murphy Oil Corp.
6.375%, 12/01/2042 | | | | | 51 | | | | 47,047 | |
Nabors Industries Ltd.
7.25%, 01/15/2026(c) | | | | | 59 | | | | 52,403 | |
7.50%, 01/15/2028(c) | | | | | 117 | | | | 100,987 | |
New Fortress Energy, Inc.
6.75%, 09/15/2025(c) | | | | | 166 | | | | 172,157 | |
NGL Energy Operating LLC/NGL Energy Finance Corp.
7.50%, 02/01/2026(c) | | | | | 194 | | | | 200,049 | |
NGL Energy Partners LP/NGL Energy Finance Corp.
7.50%, 11/01/2023 | | | | | 86 | | | | 82,554 | |
Occidental Petroleum Corp.
2.70%, 02/15/2023 | | | | | 69 | | | | 67,442 | |
2.90%, 08/15/2024 | | | | | 42 | | | | 40,836 | |
3.40%, 04/15/2026 | | | | | 10 | | | | 9,699 | |
3.50%, 06/15/2025 | | | | | 35 | | | | 34,413 | |
5.50%, 12/01/2025 | | | | | 12 | | | | 12,740 | |
5.875%, 09/01/2025(b) | | | | | 22 | | | | 23,863 | |
6.125%, 01/01/2031(b) | | | | | 31 | | | | 34,362 | |
8.00%, 07/15/2025 | | | | | 37 | | | | 42,955 | |
8.50%, 07/15/2027 | | | | | 26 | | | | 31,129 | |
8.875%, 07/15/2030 | | | | | 26 | | | | 33,252 | |
| | |
| |
42 | AB ALL MARKET TOTAL RETURN PORTFOLIO | | abfunds.com |
CONSOLIDATED PORTFOLIO OF INVESTMENTS (continued)
| | | | | | | | | | | | |
| | | | | | Principal
Amount
(000) | | | U.S. $ Value | |
| |
Parkland Corp./Canada
6.00%, 04/01/2026(c) | | | U.S.$ | | | | 142 | | | $ | 148,505 | |
PBF Holding Co. LLC/PBF Finance Corp.
9.25%, 05/15/2025(c) | | | | | | | 153 | | | | 149,154 | |
PDC Energy, Inc.
5.75%, 05/15/2026(b) | | | | | | | 217 | | | | 222,418 | |
QEP Resources, Inc.
5.375%, 10/01/2022 | | | | | | | 81 | | | | 84,987 | |
Range Resources Corp.
8.25%, 01/15/2029(c) | | | | | | | 69 | | | | 74,159 | |
SM Energy Co.
5.00%, 01/15/2024(b) | | | | | | | 66 | | | | 63,444 | |
5.625%, 06/01/2025 | | | | | | | 133 | | | | 126,937 | |
Southwestern Energy Co.
8.375%, 09/15/2028 | | | | | | | 40 | | | | 44,216 | |
Sunoco LP/Sunoco Finance Corp.
5.50%, 02/15/2026 | | | | | | | 104 | | | | 106,993 | |
5.875%, 03/15/2028 | | | | | | | 129 | | | | 136,882 | |
6.00%, 04/15/2027 | | | | | | | 4 | | | | 4,166 | |
Talos Production, Inc.
12.00%, 01/15/2026(c) | | | | | | | 126 | | | | 118,582 | |
Targa Resources Partners LP/Targa Resources Partners Finance Corp.
4.00%, 01/15/2032(c) | | | | | | | 135 | | | | 132,407 | |
Transocean Phoenix 2 Ltd.
7.75%, 10/15/2024(c) | | | | | | | 91 | | | | 89,834 | |
Transocean Pontus Ltd.
6.125%, 08/01/2025(c) | | | | | | | 47 | | | | 45,156 | |
Transocean Sentry Ltd.
5.375%, 05/15/2023(c) | | | | | | | 144 | | | | 137,718 | |
Transocean, Inc.
6.80%, 03/15/2038 | | | | | | | 1 | | | | 382 | |
7.25%, 11/01/2025(c) | | | | | | | 39 | | | | 26,128 | |
7.50%, 01/15/2026(c) | | | | | | | 103 | | | | 67,666 | |
11.50%, 01/30/2027(c) | | | | | | | 35 | | | | 28,878 | |
Vantage Drilling International
7.50%, 11/01/2019(a)(d)(e)(g) | | | | | | | 111 | | | | – 0 | – |
Vine Oil & Gas LP/Vine Oil & Gas Finance Corp.
8.75%, 04/15/2023(c) | | | | | | | 286 | | | | 285,863 | |
Western Midstream Operating LP
3.95%, 06/01/2025 | | | | | | | 24 | | | | 24,349 | |
4.00%, 07/01/2022 | | | | | | | 14 | | | | 14,298 | |
4.35%, 02/01/2025 | | | | | | | 48 | | | | 49,241 | |
4.50%, 03/01/2028 | | | | | | | 56 | | | | 57,910 | |
4.75%, 08/15/2028 | | | | | | | 29 | | | | 30,433 | |
5.30%, 02/01/2030 | | | | | | | 48 | | | | 52,025 | |
5.45%, 04/01/2044 | | | | | | | 19 | | | | 20,279 | |
| | | | | | | | | | | | |
| | | | | | | | | | | 6,171,145 | |
| | | | | | | | | | | | |
| | |
| |
| abfunds.com | | AB ALL MARKET TOTAL RETURN PORTFOLIO | 43 |
CONSOLIDATED PORTFOLIO OF INVESTMENTS (continued)
| | | | | | | | | | | | |
| | | | | | Principal
Amount
(000) | | | U.S. $ Value | |
| |
Other Industrial – 0.1% | |
American Builders & Contractors Supply Co., Inc.
5.875%, 05/15/2026(c) | | | U.S.$ | | | | 55 | | | $ | 56,862 | |
Avient Corp.
5.75%, 05/15/2025(c) | | | | | | | 32 | | | | 33,890 | |
IAA, Inc.
5.50%, 06/15/2027(c) | | | | | | | 34 | | | | 35,534 | |
Interface, Inc.
5.50%, 12/01/2028(c) | | | | | | | 22 | | | | 23,083 | |
KAR Auction Services, Inc.
5.125%, 06/01/2025(c) | | | | | | | 130 | | | | 131,964 | |
Laureate Education, Inc.
8.25%, 05/01/2025(c) | | | | | | | 134 | | | | 140,452 | |
| | | | | | | | | | | | |
| | | | | | | | | | | 421,785 | |
| | | | | | | | | | | | |
Services – 0.4% | |
Allied Universal Holdco LLC/Allied Universal Finance Corp.
6.625%, 07/15/2026(c) | | | | | | | 31 | | | | 32,802 | |
9.75%, 07/15/2027(c) | | | | | | | 206 | | | | 227,282 | |
ANGI Group LLC
3.875%, 08/15/2028(c) | | | | | | | 209 | | | | 213,619 | |
Aptim Corp.
7.75%, 06/15/2025(c) | | | | | | | 168 | | | | 145,186 | |
APX Group, Inc.
6.75%, 02/15/2027(c) | | | | | | | 35 | | | | 37,081 | |
7.875%, 12/01/2022 | | | | | | | 185 | | | | 185,622 | |
Aramark Services, Inc.
6.375%, 05/01/2025(c) | | | | | | | 90 | | | | 94,922 | |
Carlson Travel, Inc.
11.50% (9.50% Cash and 2.00% PIK), 12/15/2026(c)(h) | | | | | | | 201 | | | | 141,367 | |
Carriage Services, Inc.
6.625%, 06/01/2026(c) | | | | | | | 87 | | | | 91,804 | |
Cars.com, Inc.
6.375%, 11/01/2028(c) | | | | | | | 70 | | | | 73,598 | |
Garda World Security Corp.
9.50%, 11/01/2027(c) | | | | | | | 37 | | | | 40,337 | |
Gartner, Inc.
4.50%, 07/01/2028(c) | | | | | | | 49 | | | | 51,479 | |
Korn Ferry
4.625%, 12/15/2027(c) | | | | | | | 63 | | | | 65,551 | |
Monitronics International, Inc.
Zero Coupon, 04/01/2020(a)(d)(e)(g) | | | | | | | 120 | | | | – 0 | – |
MPH Acquisition Holdings LLC
5.75%, 11/01/2028(b)(c) | | | | | | | 227 | | | | 225,338 | |
| | |
| |
44 | AB ALL MARKET TOTAL RETURN PORTFOLIO | | abfunds.com |
CONSOLIDATED PORTFOLIO OF INVESTMENTS (continued)
| | | | | | | | | | | | |
| | | | | | Principal
Amount
(000) | | | U.S. $ Value | |
| |
Prime Security Services Borrower LLC/Prime Finance, Inc.
6.25%, 01/15/2028(c) | | | U.S.$ | | | | 161 | | | $ | 167,068 | |
Sabre GLBL, Inc.
9.25%, 04/15/2025(c) | | | | | | | 41 | | | | 48,815 | |
Service Corp. International/US
3.375%, 08/15/2030 | | | | | | | 103 | | | | 101,123 | |
TripAdvisor, Inc.
7.00%, 07/15/2025(c) | | | | | | | 41 | | | | 44,219 | |
Verisure Midholding AB
5.25%, 02/15/2029(c) | | | EUR | | | | 185 | | | | 229,529 | |
Verscend Escrow Corp.
9.75%, 08/15/2026(c) | | | U.S.$ | | | | 115 | | | | 123,495 | |
| | | | | | | | | | | | |
| | | | | | | | | | | 2,340,237 | |
| | | | | | | | | | | | |
Technology – 0.2% | | | | | | | | | | | | |
Austin BidCo, Inc.
7.125%, 12/15/2028(c) | | | | | | | 19 | | | | 19,573 | |
Avaya, Inc.
6.125%, 09/15/2028(c) | | | | | | | 169 | | | | 181,868 | |
Banff Merger Sub, Inc.
9.75%, 09/01/2026(c) | | | | | | | 158 | | | | 168,066 | |
Boxer Parent Co., Inc.
7.125%, 10/02/2025(c) | | | | | | | 7 | | | | 7,567 | |
Cablevision Lightpath LLC
5.625%, 09/15/2028(c) | | | | | | | 200 | | | | 203,434 | |
CDW LLC/CDW Finance Corp.
4.125%, 05/01/2025 | | | | | | | 59 | | | | 60,925 | |
CommScope, Inc.
5.50%, 03/01/2024(c) | | | | | | | 75 | | | | 77,099 | |
Conduent Finance, Inc./Conduent Business Services LLC
10.50%, 12/15/2024(c) | | | | | | | 1 | | | | 895 | |
LogMeIn, Inc.
5.50%, 09/01/2027(c) | | | | | | | 51 | | | | 53,303 | |
Microchip Technology, Inc.
4.25%, 09/01/2025(c) | | | | | | | 58 | | | | 60,633 | |
NCR Corp.
5.75%, 09/01/2027(c) | | | | | | | 40 | | | | 41,822 | |
6.125%, 09/01/2029(c) | | | | | | | 28 | | | | 30,026 | |
8.125%, 04/15/2025(c) | | | | | | | 28 | | | | 30,592 | |
Presidio Holdings, Inc.
4.875%, 02/01/2027(c) | | | | | | | 12 | | | | 12,503 | |
8.25%, 02/01/2028(c) | | | | | | | 18 | | | | 19,934 | |
Science Applications International Corp.
4.875%, 04/01/2028(c) | | | | | | | 11 | | | | 11,508 | |
Solera LLC/Solera Finance, Inc.
10.50%, 03/01/2024(c) | | | | | | | 119 | | | | 123,555 | |
| | |
| |
| abfunds.com | | AB ALL MARKET TOTAL RETURN PORTFOLIO | 45 |
CONSOLIDATED PORTFOLIO OF INVESTMENTS (continued)
| | | | | | | | | | | | |
| | | | | | Principal
Amount
(000) | | | U.S. $ Value | |
| |
TTM Technologies, Inc.
4.00%, 03/01/2029(c) | | | U.S.$ | | | | 90 | | | $ | 91,048 | |
Veritas US, Inc./Veritas Bermuda Ltd.
7.50%, 09/01/2025(c) | | | | | | | 316 | | | | 327,088 | |
| | | | | | | | | | | | |
| | | | | | | | | | | 1,521,439 | |
| | | | | | | | | | | | |
Transportation - Airlines – 0.0% | | | | | | | | | | | | |
Hawaiian Brand Intellectual Property Ltd./HawaiianMiles Loyalty Ltd.
5.75%, 01/20/2026(c) | | | | | | | 47 | | | | 49,218 | |
Spirit Loyalty Cayman Ltd./Spirit IP Cayman Ltd.
8.00%, 09/20/2025(c) | | | | | | | 156 | | | | 175,845 | |
| | | | | | | | | | | | |
| | | | | | | | | | | 225,063 | |
| | | | | | | | | | | | |
Transportation - Services – 0.1% | | | | | | | | | | | | |
Algeco Global Finance PLC
8.00%, 02/15/2023(c) | | | | | | | 200 | | | | 204,006 | |
Avis Budget Car Rental LLC/Avis Budget Finance, Inc.
5.375%, 03/01/2029(c) | | | | | | | 45 | | | | 45,896 | |
5.75%, 07/15/2027(c) | | | | | | | 80 | | | | 82,531 | |
10.50%, 05/15/2025(c) | | | | | | | 64 | | | | 76,621 | |
| | | | | | | | | | | | |
| | | | | | | | | | | 409,054 | |
| | | | | | | | | | | | |
| | | | | | | | | | | 31,422,680 | |
| | | | | | | | | | | | |
Financial Institutions – 0.8% | | | | | | | | | | | | |
Banking – 0.3% | | | | | | | | | | | | |
Alliance Data Systems Corp.
4.75%, 12/15/2024(c) | | | | | | | 115 | | | | 117,830 | |
7.00%, 01/15/2026(c) | | | | | | | 53 | | | | 56,077 | |
Banco Santander SA
6.75%, 04/25/2022(c)(l) | | | EUR | | | | 300 | | | | 378,833 | |
CaixaBank SA
5.875%, 10/09/2027(c)(l) | | | | | | | 200 | | | | 265,441 | |
Credit Suisse Group AG
6.25%, 12/18/2024(c)(l) | | | U.S.$ | | | | 200 | | | | 219,878 | |
Credit Suisse Group AG
7.50%, 07/17/2023(c)(l) | | | | | | | 206 | | | | 224,379 | |
Discover Financial Services
Series D
6.125%, 06/23/2025(l) | | | | | | | 306 | | | | 339,908 | |
UniCredit SpA
9.25%, 06/03/2022(c)(l) | | | EUR | | | | 200 | | | | 259,529 | |
| | | | | | | | | | | | |
| | | | | | | | | | | 1,861,875 | |
| | | | | | | | | | | | |
Brokerage – 0.1% | | | | | | | | | | | | |
Lehman Brothers Holdings, Inc.
5.625%, 01/24/2013(a)(g) | | | U.S.$ | | | | 1,030 | | | | 10,502 | |
| | |
| |
46 | AB ALL MARKET TOTAL RETURN PORTFOLIO | | abfunds.com |
CONSOLIDATED PORTFOLIO OF INVESTMENTS (continued)
| | | | | | | | | | | | |
| | | | | | Principal
Amount
(000) | | | U.S. $ Value | |
| |
LPL Holdings, Inc.
5.75%, 09/15/2025(c) | | | U.S.$ | | | | 35 | | | $ | 36,034 | |
NFP Corp. | | | | | | | | | | | | |
6.875%, 08/15/2028(c) | | | | | | | 257 | | | | 265,253 | |
7.00%, 05/15/2025(c) | | | | | | | 43 | | | | 46,135 | |
| | | | | | | | | | | | |
| | | | | | | | | | | 357,924 | |
| | | | | | | | | | | | |
Finance – 0.1% | | | | | | | | | | | | |
Air Lease Corp.
Series B
4.65%, 06/15/2026(l) | | | | | | | 112 | | | | 109,200 | |
CNG Holdings, Inc.
12.50%, 06/15/2024(c) | | | | | | | 93 | | | | 87,327 | |
Curo Group Holdings Corp.
8.25%, 09/01/2025(c) | | | | | | | 207 | | | | 209,091 | |
Enova International, Inc.
8.50%, 09/01/2024-09/15/2025(c) | | | | | | | 206 | | | | 210,860 | |
goeasy Ltd.
5.375%, 12/01/2024(c) | | | | | | | 74 | | | | 76,676 | |
Lincoln Financing SARL
3.625%, 04/01/2024(c) | | | EUR | | | | 103 | | | | 125,406 | |
Navient Corp.
4.875%, 03/15/2028 | | | U.S.$ | | | | 45 | | | | 43,346 | |
5.50%, 01/25/2023 | | | | | | | 25 | | | | 25,823 | |
6.50%, 06/15/2022 | | | | | | | 31 | | | | 32,168 | |
7.25%, 01/25/2022 | | | | | | | 31 | | | | 32,390 | |
SLM Corp.
5.125%, 04/05/2022 | | | | | | | 30 | | | | 31,249 | |
TMX Finance LLC/TitleMax Finance Corp.
11.125%, 04/01/2023(c) | | | | | | | 112 | | | | 113,278 | |
| | | | | | | | | | | | |
| | | | | | | | | | | 1,096,814 | |
| | | | | | | | | | | | |
Insurance – 0.1% | | | | | | | | | | | | |
Acrisure LLC/Acrisure Finance, Inc.
7.00%, 11/15/2025(c) | | | | | | | 35 | | | | 36,074 | |
Alliant Holdings Intermediate LLC/Alliant Holdings Co-Issuer
6.75%, 10/15/2027(c) | | | | | | | 192 | | | | 198,595 | |
AssuredPartners, Inc.
5.625%, 01/15/2029(c) | | | | | | | 189 | | | | 190,486 | |
Genworth Holdings, Inc.
7.625%, 09/24/2021(b) | | | | | | | 19 | | | | 18,969 | |
| | | | | | | | | | | | |
| | | | | | | | | | | 444,124 | |
| | | | | | | | | | | | |
Other Finance – 0.1% | | | | | | | | | | | | |
Intrum AB
2.75%, 07/15/2022(c) | | | EUR | | | | 13 | | | | 15,664 | |
3.00%, 09/15/2027(c) | | | | | | | 100 | | | | 116,322 | |
4.875%, 08/15/2025(c) | | | | | | | 100 | | | | 125,413 | |
| | |
| |
| abfunds.com | | AB ALL MARKET TOTAL RETURN PORTFOLIO | 47 |
CONSOLIDATED PORTFOLIO OF INVESTMENTS (continued)
| | | | | | | | | | | | |
| | | | | | Principal
Amount
(000) | | | U.S. $ Value | |
| |
Tempo Acquisition LLC/Tempo Acquisition Finance Corp.
6.75%, 06/01/2025(c) | | | U.S.$ | | | | 184 | | | $ | 188,734 | |
| | | | | | | | | | | | |
| | | | | | | | | | | 446,133 | |
| | | | | | | | | | | | |
REITS – 0.1% | | | | | | | | | | | | |
Brookfield Property REIT, Inc./BPR Cumulus LLC/BPR Nimbus LLC/GGSI Sellco LL
5.75%, 05/15/2026(c) | | | | | | | 265 | | | | 272,730 | |
Diversified Healthcare Trust
6.75%, 12/15/2021 | | | | | | | 21 | | | | 21,557 | |
9.75%, 06/15/2025 | | | | | | | 90 | | | | 101,298 | |
GEO Group, Inc. (The)
6.00%, 04/15/2026(b) | | | | | | | 11 | | | | 8,060 | |
Iron Mountain, Inc.
4.875%, 09/15/2027(c) | | | | | | | 3 | | | | 3,125 | |
5.25%, 03/15/2028(c) | | | | | | | 124 | | | | 129,592 | |
MGM Growth Properties Operating Partnership LP/MGP Finance Co-Issuer, Inc.
5.625%, 05/01/2024 | | | | | | | 90 | | | | 97,191 | |
5.75%, 02/01/2027 | | | | | | | 108 | | | | 122,024 | |
Realogy Group LLC/Realogy Co-Issuer Corp.
5.75%, 01/15/2029(c) | | | | | | | 56 | | | | 56,271 | |
9.375%, 04/01/2027(c) | | | | | | | 204 | | | | 224,363 | |
| | | | | | | | | | | | |
| | | | | | | | | | | 1,036,211 | |
| | | | | | | | | | | | |
| | | | | | | | | | | 5,243,081 | |
| | | | | | | | | | | | |
Utility – 0.1% | | | | | | | | | | | | |
Electric – 0.1% | | | | | | | | | | | | |
Calpine Corp.
5.125%, 03/15/2028(c) | | | | | | | 28 | | | | 28,240 | |
NRG Energy, Inc.
6.625%, 01/15/2027 | | | | | | | 3 | | | | 3,120 | |
Talen Energy Supply LLC
4.60%, 12/15/2021 | | | | | | | 1 | | | | 768 | |
6.50%, 06/01/2025 | | | | | | | 144 | | | | 126,700 | |
7.25%, 05/15/2027(c) | | | | | | | 37 | | | | 39,085 | |
10.50%, 01/15/2026(c) | | | | | | | 152 | | | | 145,438 | |
Texas Competitive/TCEH
11.50%, 10/01/2020(a)(d)(e)(g) | | | | | | | 142 | | | | – 0 | – |
| | | | | | | | | | | | |
| | | | | | | | | | | 343,351 | |
| | | | | | | | | | | | |
| | | |
Total Corporates – Non-Investment Grade
(cost $35,917,487) | | | | | | | | | | | 37,009,112 | |
| | | | | | | | | | | | |
| | |
| |
48 | AB ALL MARKET TOTAL RETURN PORTFOLIO | | abfunds.com |
CONSOLIDATED PORTFOLIO OF INVESTMENTS (continued)
| | | | | | | | | | | | |
| Company | | | | |
Shares | | | U.S. $ Value | |
| |
INVESTMENT COMPANIES – 5.6% | | | | | | | | | | | | |
Funds and Investment Trusts – 5.6%(m) | | | | | | | | | | | | |
Consumer Staples Select Sector SPDR Fund | | | | | | | 10,249 | | | $ | 648,762 | |
Financial Select Sector SPDR Fund | | | | | | | 447,452 | | | | 14,457,174 | |
iShares JP Morgan USD Emerging Markets Bond ETF(b) | | | | | | | 11,937 | | | | 1,313,428 | |
iShares MSCI ACWI ETF(b) | | | | | | | 6,079 | | | | 562,368 | |
iShares MSCI Global Min Vol Factor ETF | | | | | | | 13,072 | | | | 1,230,337 | |
iShares MSCI USA Value Factor ETF(b) | | | | | | | 153,710 | | | | 14,753,086 | |
iShares Russell 2000 ETF(b) | | | | | | | 591 | | | | 129,021 | |
iShares US Technology ETF | | | | | | | 18,379 | | | | 1,597,503 | |
SPDR S&P Biotech ETF(b) | | | | | | | 2,865 | | | | 424,020 | |
Utilities Select Sector SPDR Fund(b) | | | | | | | 7,370 | | | | 430,113 | |
VanEck Vectors JP Morgan EM Local Currency Bond ETF – Class E | | | | | | | 18,392 | | | | 583,394 | |
| | | | | | | | | | | | |
| | | |
Total Investment Companies
(cost $33,774,074) | | | | | | | | | | | 36,129,206 | |
| | | | | | | | | | | | |
| | | |
| | | | | | Principal
Amount
(000) | | | | |
EMERGING MARKETS – SOVEREIGNS – 1.8% | | | | | | | | | | | | |
Angola – 0.1% | | | | | | | | | | | | |
Angolan Government International Bond
8.00%, 11/26/2029(c) | | | U.S.$ | | | | 226 | | | | 219,856 | |
9.50%, 11/12/2025(c) | | | | | | | 386 | | | | 409,280 | |
| | | | | | | | | | | | |
| | | | | | | | | | | 629,136 | |
| | | | | | | | | | | | |
Argentina – 0.1% | | | | | | | | | | | | |
Argentine Republic Government International Bond
0.125%, 07/09/2030-07/09/2041 | | | | | | | 1,964 | | | | 660,384 | |
1.00%, 07/09/2029 | | | | | | | 96 | | | | 37,837 | |
| | | | | | | | | | | | |
| | | | | | | | | | | 698,221 | |
| | | | | | | | | | | | |
Bahrain – 0.1% | | | | | | | | | | | | |
Bahrain Government International Bond
6.75%, 09/20/2029(c) | | | | | | | 200 | | | | 220,500 | |
7.00%, 10/12/2028(c) | | | | | | | 200 | | | | 226,751 | |
7.375%, 05/14/2030(c) | | | | | | | 200 | | | | 227,437 | |
CBB International Sukuk Programme Co. SPC
6.25%, 11/14/2024(c) | | | | | | | 218 | | | | 240,345 | |
| | | | | | | | | | | | |
| | | | | | | | | | | 915,033 | |
| | | | | | | | | | | | |
| | |
| |
| abfunds.com | | AB ALL MARKET TOTAL RETURN PORTFOLIO | 49 |
CONSOLIDATED PORTFOLIO OF INVESTMENTS (continued)
| | | | | | | | | | | | |
| | | | | | Principal
Amount
(000) | | | U.S. $ Value | |
| |
Brazil – 0.0% | | | | | | | | | | | | |
Brazilian Government International Bond
3.875%, 06/12/2030 | | | U.S.$ | | | | 260 | | | $ | 258,456 | |
| | | | | | | | | | | | |
| | | |
Costa Rica – 0.1% | | | | | | | | | | | | |
Costa Rica Government International Bond
6.125%, 02/19/2031(c) | | | | | | | 335 | | | | 337,303 | |
| | | | | | | | | | | | |
| | | |
Dominican Republic – 0.1% | | | | | | | | | | | | |
Dominican Republic International Bond
4.50%, 01/30/2030(c) | | | | | | | 300 | | | | 301,875 | |
4.875%, 09/23/2032(c) | | | | | | | 150 | | | | 152,062 | |
8.625%, 04/20/2027(c) | | | | | | | 425 | | | | 514,383 | |
| | | | | | | | | | | | |
| | | | | | | | | | | 968,320 | |
| | | | | | | | | | | | |
Ecuador – 0.1% | | | | | | | | | | | | |
Ecuador Government International Bond
Zero Coupon, 07/31/2030(c) | | | | | | | 48 | | | | 19,860 | |
0.50%, 07/31/2030-07/31/2040(c) | | | | | | | 802 | | | | 379,930 | |
| | | | | | | | | | | | |
| | | | | | | | | | | 399,790 | |
| | | | | | | | | | | | |
Egypt – 0.2% | | | | | | | | | | | | |
Egypt Government International Bond
6.125%, 01/31/2022(c) | | | | | | | 407 | | | | 417,557 | |
7.053%, 01/15/2032(c) | | | | | | | 200 | | | | 206,437 | |
7.625%, 05/29/2032(c) | | | | | | | 208 | | | | 221,520 | |
8.70%, 03/01/2049(c) | | | | | | | 239 | | | | 251,249 | |
8.875%, 05/29/2050(c) | | | | | | | 208 | | | | 221,130 | |
| | | | | | | | | | | | |
| | | | | | | | | | | 1,317,893 | |
| | | | | | | | | | | | |
El Salvador – 0.0% | | | | | | | | | | | | |
El Salvador Government International Bond
7.125%, 01/20/2050(c) | | | | | | | 334 | | | | 308,950 | |
7.65%, 06/15/2035(c) | | | | | | | 10 | | | | 9,850 | |
| | | | | | | | | | | | |
| | | | | | | | | | | 318,800 | |
| | | | | | | | | | | | |
Ghana – 0.1% | | | | | | | | | | | | |
Ghana Government International Bond
6.375%, 02/11/2027(c) | | | | | | | 200 | | | | 205,500 | |
10.75%, 10/14/2030(c) | | | | | | | 248 | | | | 323,718 | |
| | | | | | | | | | | | |
| | | | | | | | | | | 529,218 | |
| | | | | | | | | | | | |
Honduras – 0.1% | | | | | | | | | | | | |
Honduras Government International Bond
7.50%, 03/15/2024(c) | | | | | | | 400 | | | | 435,750 | |
| | | | | | | | | | | | |
| | | |
Ivory Coast – 0.1% | | | | | | | | | | | | |
Ivory Coast Government International Bond 4.875%, 01/30/2032(c) | | | EUR | | | | 170 | | | | 205,113 | |
5.875%, 10/17/2031(c) | | | | | | | 135 | | | | 175,101 | |
| | |
| |
50 | AB ALL MARKET TOTAL RETURN PORTFOLIO | | abfunds.com |
CONSOLIDATED PORTFOLIO OF INVESTMENTS (continued)
| | | | | | | | | | | | |
| | | | | | Principal
Amount
(000) | | | U.S. $ Value | |
| |
6.125%, 06/15/2033(c) | | | U.S.$ | | | | 258 | | | $ | 276,947 | |
| | | | | | | | | | | | |
| | | | | | | | | | | 657,161 | |
| | | | | | | | | | | | |
Kenya – 0.1% | | | | | | | | | | | | |
Kenya Government International Bond
6.875%, 06/24/2024(c) | | | | | | | 200 | | | | 221,563 | |
7.00%, 05/22/2027(c) | | | | | | | 275 | | | | 303,789 | |
| | | | | | | | | | | | |
| | | | | | | | | | | 525,352 | |
| | | | | | | | | | | | |
Lebanon – 0.0% | | | | | | | | | | | | |
Lebanon Government International Bond
6.65%, 04/22/2024(a)(c)(k) | | | | | | | 45 | | | | 5,794 | |
6.85%, 03/23/2027(a)(c)(k) | | | | | | | 46 | | | | 5,877 | |
Series G
6.60%, 11/27/2026(a)(c)(k) | | | | | | | 189 | | | | 24,334 | |
| | | | | | | | | | | | |
| | | | | | | | | | | 36,005 | |
| | | | | | | | | | | | |
Mongolia – 0.1% | | | | | | | | | | | | |
Mongolia Government International Bond | | | | | | | | | | | | |
5.125%, 12/05/2022(c) | | | | | | | 270 | | | | 280,294 | |
10.875%, 04/06/2021(c) | | | | | | | 200 | | | | 201,562 | |
| | | | | | | | | | | | |
| | | | | | | | | | | 481,856 | |
| | | | | | | | | | | | |
Nigeria – 0.1% | |
Nigeria Government International Bond
6.50%, 11/28/2027(c) | | | | | | | 200 | | | | 213,750 | |
7.625%, 11/21/2025-11/28/2047(c) | | | | | | | 467 | | | | 509,423 | |
| | | | | | | | | | | | |
| | | | | | | | | | | 723,173 | |
| | | | | | | | | | | | |
Oman – 0.1% | |
Oman Government International Bond
4.125%, 01/17/2023(c) | | | | | | | 400 | | | | 406,625 | |
6.25%, 01/25/2031(b)(c) | | | | | | | 213 | | | | 224,183 | |
| | | | | | | | | | | | |
| | | | | | | | | | | 630,808 | |
| | | | | | | | | | | | |
Senegal – 0.1% | |
Senegal Government International Bond
6.25%, 05/23/2033(c) | | | | | | | 365 | | | | 387,128 | |
| | | | | | | | | | | | |
|
South Africa – 0.1% | |
Republic of South Africa Government International Bond
5.75%, 09/30/2049 | | | | | | | 247 | | | | 226,623 | |
5.875%, 09/16/2025 | | | | | | | 300 | | | | 333,375 | |
| | | | | | | | | | | | |
| | | | | | | | | | | 559,998 | |
| | | | | | | | | | | | |
Ukraine – 0.1% | |
Ukraine Government International Bond
7.253%, 03/15/2033(c) | | | | | | | 200 | | | | 203,000 | |
7.75%, 09/01/2024(c) | | | | | | | 285 | | | | 307,711 | |
| | | | | | | | | | | | |
| | | | | | | | | | | 510,711 | |
| | | | | | | | | | | | |
| | |
| |
| abfunds.com | | AB ALL MARKET TOTAL RETURN PORTFOLIO | 51 |
CONSOLIDATED PORTFOLIO OF INVESTMENTS (continued)
| | | | | | | | | | | | |
| | | | | | Principal
Amount
(000) | | | U.S. $ Value | |
| |
Venezuela – 0.0% | |
Venezuela Government International Bond
9.25%, 09/15/2027(a)(k) | | | U.S.$ | | | | 815 | | | $ | 77,425 | |
| | | | | | | | | | | | |
| | | |
Total Emerging Markets – Sovereigns
(cost $11,849,088) | | | | | | | | | | | 11,397,537 | |
| | | | | | | | | | | | |
| | | | | | | | | | | | |
GOVERNMENTS – TREASURIES – 1.6% | | | | | | | | | | | | |
Colombia – 0.1% | |
Colombian TES
Series B
10.00%, 07/24/2024 | | | COP | | | | 1,391,900 | | | | 456,892 | |
| | | | | | | | | | | | |
|
Mexico – 0.1% | |
Mexican Bonos
Series M 20
7.50%, 06/03/2027 | | | MXN | | | | 9,211 | | | | 486,642 | |
| | | | | | | | | | | | |
|
Russia – 0.1% | |
Russian Federal Bond – OFZ
Series 6212 | | | | | | | | | | | | |
7.05%, 01/19/2028 | | | RUB | | | | 23,770 | | | | 329,048 | |
Series 6217
7.50%, 08/18/2021 | | | | | | | 40,638 | | | | 552,671 | |
| | | | | | | | | | | | |
| | | | | | | | | | | 881,719 | |
| | | | | | | | | | | | |
United States – 1.3% | | | | | | | | | | | | |
U.S. Treasury Bonds
1.25%, 05/15/2050 | | | U.S.$ | | | | 14 | | | | 11,128 | |
U.S. Treasury Notes
0.625%, 08/15/2030 | | | | | | | 2,130 | | | | 1,978,609 | |
1.625%, 08/15/2029 | | | | | | | 1,996 | | | | 2,044,341 | |
2.25%, 08/15/2027 | | | | | | | 2,360 | | | | 2,533,312 | |
2.375%, 05/15/2029 | | | | | | | 1,524 | | | | 1,650,942 | |
| | | | | | | | | | | | |
| | | | | | | | | | | 8,218,332 | |
| | | | | | | | | | | | |
Total Governments – Treasuries
(cost $10,055,129) | | | | | | | | | | | 10,043,585 | |
| | | | | | | | | | | | |
| | | | | | | | | | | | |
CORPORATES – INVESTMENT
GRADE – 1.4% | | | | | | | | | | | | |
Financial Institutions – 0.8% | | | | | | | | | | | | |
Banking – 0.5% | | | | | | | | | | | | |
Banco Santander Mexico SA Institucion de Banca Multiple Grupo Financiero Santand
5.375%, 04/17/2025(c) | | | | | | | 184 | | | | 208,481 | |
Bank of America Corp.
Series Z
6.50%, 10/23/2024(l) | | | | | | | 7 | | | | 7,783 | |
| | |
| |
52 | AB ALL MARKET TOTAL RETURN PORTFOLIO | | abfunds.com |
CONSOLIDATED PORTFOLIO OF INVESTMENTS (continued)
| | | | | | | | | | | | |
| | | | | | Principal
Amount
(000) | | | U.S. $ Value | |
| |
Barclays Bank PLC
6.86%, 06/15/2032(c)(l) | | | U.S.$ | | | | 35 | | | $ | 49,683 | |
CIT Group, Inc.
3.929%, 06/19/2024 | | | | | | | 31 | | | | 32,813 | |
Citigroup Capital XVIII
0.912% (Sterling LIBOR 3 Month + 0.89%), 06/28/2067(n) | | | GBP | | | | 185 | | | | 226,501 | |
Citigroup, Inc.
3.875%, 02/18/2026(l) | | | U.S.$ | | | | 50 | | | | 49,771 | |
5.95%, 01/30/2023(l) | | | | | | | 365 | | | | 378,647 | |
Series V
4.70%, 01/30/2025(l) | | | | | | | 47 | | | | 47,577 | |
Credit Agricole SA
8.125%, 12/23/2025(c)(l) | | | | | | | 400 | | | | 483,824 | |
DNB Bank ASA
6.50%, 03/26/2022(c)(l) | | | | | | | 201 | | | | 209,157 | |
Goldman Sachs Group, Inc. (The)
Series O
5.30%, 11/10/2026(l) | | | | | | | 23 | | | | 25,423 | |
Series P
5.00%, 11/10/2022(b)(l) | | | | | | | 185 | | | | 185,070 | |
HSBC Holdings PLC
6.00%, 09/29/2023(c)(l) | | | EUR | | | | 300 | | | | 392,732 | |
Natwest Group PLC
8.625%, 08/15/2021(l) | | | U.S.$ | | | | 320 | | | | 329,929 | |
Truist Financial Corp.
Series P
4.95%, 09/01/2025(l) | | | | | | | 211 | | | | 227,034 | |
Series Q
5.10%, 03/01/2030(l) | | | | | | | 56 | | | | 61,378 | |
UBS Group AG
7.00%, 02/19/2025(c)(l) | | | | | | | 400 | | | | 457,992 | |
| | | | | | | | | | | | |
| | | | | | | | | | | 3,373,795 | |
| | | | | | | | | | | | |
Brokerage – 0.0% | | | | | | | | | | | | |
Charles Schwab Corp. (The)
Series G
5.375%, 06/01/2025(l) | | | | | | | 119 | | | | 131,099 | |
| | | | | | | | | | | | |
| | | |
Finance – 0.1% | | | | | | | | | | | | |
Aircastle Ltd.
2.85%, 01/26/2028(c) | | | | | | | 15 | | | | 14,410 | |
4.125%, 05/01/2024 | | | | | | | 14 | | | | 14,744 | |
4.25%, 06/15/2026 | | | | | | | 2 | | | | 2,117 | |
5.00%, 04/01/2023 | | | | | | | 3 | | | | 3,208 | |
5.25%, 08/11/2025(c) | | | | | | | 200 | | | | 218,474 | |
Aviation Capital Group LLC
1.95%, 01/30/2026(c) | | | | | | | 4 | | | | 3,922 | |
| | |
| |
| abfunds.com | | AB ALL MARKET TOTAL RETURN PORTFOLIO | 53 |
CONSOLIDATED PORTFOLIO OF INVESTMENTS (continued)
| | | | | | | | | | | | |
| | | | | | Principal
Amount
(000) | | | U.S. $ Value | |
| |
3.50%, 11/01/2027(c) | | | U.S.$ | | | | 25 | | | $ | 25,936 | |
4.125%, 08/01/2025(c) | | | | | | | 39 | | | | 41,705 | |
4.875%, 10/01/2025(c) | | | | | | | 30 | | | | 32,998 | |
5.50%, 12/15/2024(c) | | | | | | | 67 | | | | 75,458 | |
| | | | | | | | | | | | |
| | | | | | | | | | | 432,972 | |
| | | | | | | | | | | | |
Insurance – 0.2% | | | | | | | | | | | | |
Centene Corp.
5.375%, 08/15/2026(c) | | | | | | | 81 | | | | 85,281 | |
Liberty Mutual Group, Inc.
7.80%, 03/15/2037(b)(c) | | | | | | | 298 | | | | 381,538 | |
MetLife Capital Trust IV
7.875%, 12/15/2037(c) | | | | | | | 254 | | | | 356,553 | |
MetLife, Inc.
6.40%, 12/15/2036 | | | | | | | 47 | | | | 59,787 | |
Prudential Financial, Inc.
5.20%, 03/15/2044 | | | | | | | 44 | | | | 46,825 | |
5.625%, 06/15/2043 | | | | | | | 126 | | | | 134,975 | |
| | | | | | | | | | | | |
| | | | | | | | | | | 1,064,959 | |
| | | | | | | | | | | | |
REITS – 0.0% | | | | | | | | | | | | |
GLP Capital LP/GLP Financing II, Inc.
5.375%, 04/15/2026 | | | | | | | 20 | | | | 22,907 | |
MPT Operating Partnership LP/MPT Finance Corp.
5.00%, 10/15/2027 | | | | | | | 33 | | | | 35,049 | |
5.25%, 08/01/2026 | | | | | | | 96 | | | | 100,121 | |
| | | | | | | | | | | | |
| | | | | | | | | | | 158,077 | |
| | | | | | | | | | | | |
| | | | | | | | | | | 5,160,902 | |
| | | | | | | | | | | | |
Industrial – 0.6% | | | | | | | | | | | | |
Basic – 0.2% | | | | | | | | | | | | |
ArcelorMittal SA
7.00%, 03/01/2041 | | | | | | | 54 | | | | 76,496 | |
7.25%, 10/15/2039 | | | | | | | 53 | | | | 75,991 | |
Arconic Corp.
6.00%, 05/15/2025(c) | | | | | | | 54 | | | | 57,695 | |
Equate Petrochemical BV
3.00%, 03/03/2022(c) | | | | | | | 255 | | | | 258,905 | |
Glencore Finance Canada Ltd.
6.00%, 11/15/2041(c) | | | | | | | 11 | | | | 14,304 | |
GUSAP III LP
4.25%, 01/21/2030(c) | | | | | | | 200 | | | | 215,840 | |
Industrias Penoles SAB de CV
5.65%, 09/12/2049(c) | | | | | | | 201 | | | | 235,070 | |
Vale Overseas Ltd.
3.75%, 07/08/2030 | | | | | | | 16 | | | | 16,945 | |
| | | | | | | | | | | | |
| | | | | | | | | | | 951,246 | |
| | | | | | | | | | | | |
| | |
| |
54 | AB ALL MARKET TOTAL RETURN PORTFOLIO | | abfunds.com |
CONSOLIDATED PORTFOLIO OF INVESTMENTS (continued)
| | | | | | | | | | | | |
| | | | | | Principal
Amount
(000) | | | U.S. $ Value | |
| |
Capital Goods – 0.0% | | | | | | | | | | | | |
General Electric Co.
Series D
3.521% (LIBOR 3 Month + 3.33%), 06/15/2021(l)(n) | | | U.S.$ | | | | 122 | | | $ | 115,567 | |
| | | | | | | | | | | | |
| | | |
Communications - Telecommunications – 0.0% | | | | | | | | | | | | |
Hughes Satellite Systems Corp.
5.25%, 08/01/2026 | | | | | | | 55 | | | | 61,048 | |
Qwest Corp.
6.75%, 12/01/2021 | | | | | | | 133 | | | | 137,576 | |
| | | | | | | | | | | | |
| | | | | | | | | | | 198,624 | |
| | | | | | | | | | | | |
Consumer Cyclical -
Automotive – 0.0% | | | | | | | | | | | | |
General Motors Co.
6.25%, 10/02/2043 | | | | | | | 185 | | | | 246,359 | |
Lear Corp.
4.25%, 05/15/2029 | | | | | | | 24 | | | | 26,762 | |
| | | | | | | | | | | | |
| | | | | | | | | | | 273,121 | |
| | | | | | | | | | | | |
Consumer Cyclical - Other – 0.1% | | | | | | | | | | | | |
Lennar Corp.
6.25%, 12/15/2021(c) | | | | | | | 0 | ** | | | 276 | |
MDC Holdings, Inc.
6.00%, 01/15/2043 | | | | | | | 195 | | | | 259,349 | |
PulteGroup, Inc.
6.00%, 02/15/2035 | | | | | | | 130 | | | | 169,402 | |
Toll Brothers Finance Corp.
4.875%, 03/15/2027 | | | | | | | 27 | | | | 30,846 | |
| | | | | | | | | | | | |
| | | | | | | | | | | 459,873 | |
| | | | | | | | | | | | |
Energy – 0.1% | | | | | | | | | | | | |
Cenovus Energy, Inc.
5.375%, 07/15/2025 | | | | | | | 63 | | | | 71,214 | |
6.75%, 11/15/2039 | | | | | | | 4 | | | | 4,568 | |
Continental Resources, Inc./OK
5.75%, 01/15/2031(c) | | | | | | | 82 | | | | 92,675 | |
Ecopetrol SA
5.875%, 05/28/2045 | | | | | | | 9 | | | | 9,671 | |
6.875%, 04/29/2030 | | | | | | | 93 | | | | 113,311 | |
Enable Midstream Partners LP
4.40%, 03/15/2027 | | | | | | | 136 | | | | 148,131 | |
4.95%, 05/15/2028 | | | | | | | 26 | | | | 29,041 | |
Energy Transfer Operating LP
6.125%, 12/15/2045 | | | | | | | 135 | | | | 155,392 | |
| | |
| |
| abfunds.com | | AB ALL MARKET TOTAL RETURN PORTFOLIO | 55 |
CONSOLIDATED PORTFOLIO OF INVESTMENTS (continued)
| | | | | | | | | | | | |
| | | | | | Principal
Amount
(000) | | | U.S. $ Value | |
| |
Plains All American Pipeline LP/PAA Finance Corp.
4.50%, 12/15/2026 | | | U.S.$ | | | | 37 | | | $ | 40,878 | |
| | | | | | | | | | | | |
| | | | | | | | | | | 664,881 | |
| | | | | | | | | | | | |
Services – 0.0% | | | | | | | | | | | | |
Expedia Group, Inc.
6.25%, 05/01/2025(c) | | | | | | | 25 | | | | 29,292 | |
| | | | | | | | | | | | |
| | | |
Technology – 0.1% | | | | | | | | | | | | |
Baidu, Inc.
3.075%, 04/07/2025 | | | | | | | 250 | | | | 264,328 | |
Nokia Oyj
3.375%, 06/12/2022 | | | | | | | 15 | | | | 15,433 | |
6.625%, 05/15/2039 | | | | | | | 34 | | | | 42,969 | |
Western Digital Corp.
4.75%, 02/15/2026 | | | | | | | 10 | | | | 11,063 | |
| | | | | | | | | | | | |
| | | | | | | | | | | 333,793 | |
| | | | | | | | | | | | |
Transportation - Airlines – 0.1% | | | | | | | | | | | | |
Delta Air Lines, Inc.
7.00%, 05/01/2025(c) | | | | | | | 97 | | | | 112,700 | |
Delta Air Lines, Inc./SkyMiles IP Ltd.
4.50%, 10/20/2025(c) | | | | | | | 58 | | | | 61,374 | |
4.75%, 10/20/2028(c) | | | | | | | 67 | | | | 74,136 | |
Mileage Plus Holdings LLC/Mileage Plus Intellectual Property Assets Ltd.
6.50%, 06/20/2027(c) | | | | | | | 354 | | | | 386,625 | |
| | | | | | | | | | | | |
| | | | | | | | | | | 634,835 | |
| | | | | | | | | | | | |
Transportation - Services – 0.0% | | | | | | | | | | | | |
United Rentals North America, Inc.
3.875%, 11/15/2027 | | | | | | | 60 | | | | 62,543 | |
| | | | | | | | | | | | |
| | | | | | | | | | | 3,723,775 | |
| | | | | | | | | | | | |
Utility – 0.0% | |
Electric – 0.0% | |
Israel Electric Corp., Ltd.
Series 6
5.00%, 11/12/2024(c) | | | | | | | 200 | | | | 226,339 | |
| | | | | | | | | | | | |
| | | |
Total Corporates – Investment Grade
(cost $8,332,511) | | | | | | | | | | | 9,111,016 | |
| | | | | | | | | | | | |
| | | | | | | | | | | | |
BANK LOANS – 0.8% | | | | | | | | | | | | |
Financial Institutions – 0.0% | | | | | | | | | | | | |
Insurance – 0.0% | | | | | | | | | | | | |
Hub International Limited
4.000% (LIBOR 3 Month + 3.25%), 04/25/2025(e)(o) | | | | | | | 123 | | | | 123,655 | |
| | |
| |
56 | AB ALL MARKET TOTAL RETURN PORTFOLIO | | abfunds.com |
CONSOLIDATED PORTFOLIO OF INVESTMENTS (continued)
| | | | | | | | | | | | |
| | | | | | Principal
Amount
(000) | | | U.S. $ Value | |
| |
Sedgwick Claims Management Services, Inc. (Lightning Cayman Merger Sub, Ltd.)
3.871% (LIBOR 1 Month + 3.75%), 09/03/2026(o) | | | U.S.$ | | | | 147 | | | $ | 147,319 | |
| | | | | | | | | | | | |
| | | | | | | | | | | 270,974 | |
| | | | | | | | | | | | |
Industrial – 0.8% | | | | | | | | | | | | |
Basic – 0.0% | | | | | | | | | | | | |
Illuminate Buyer, LLC
06/30/2027(p) | | | | | | | 60 | | | | 59,850 | |
| | | | | | | | | | | | |
| | | |
Capital Goods – 0.1% | | | | | | | | | | | | |
BWay Holding Company
3.407% (LIBOR 2 Month + 3.25%), 04/03/2024(o) | | | | | | | 0 | ** | | | 360 | |
3.443% (LIBOR 3 Month + 3.25%), 04/03/2024(o) | | | | | | | 141 | | | | 138,815 | |
Granite US Holdings Corporation
4.169% (LIBOR 2 Month + 4.00%), 09/30/2026(e)(o) | | | | | | | 164 | | | | 164,130 | |
| | | | | | | | | | | | |
| | | | | | | | | | | 303,305 | |
| | | | | | | | | | | | |
Communications - Media – 0.0% | | | | | | | | | | | | |
Clear Channel Outdoor Holdings, Inc.
3.659% (LIBOR 2 Month + 3.50%), 08/21/2026(o) | | | | | | | 0 | ** | | | 86 | |
3.712% (LIBOR 3 Month + 3.50%), 08/21/2026(o) | | | | | | | 35 | | | | 33,743 | |
iHeartCommunications, Inc. (fka Clear Channel Communications, Inc.)
3.115% (LIBOR 1 Month + 3.00%), 05/01/2026(o) | | | | | | | 40 | | | | 39,194 | |
LCPR Loan Financing LLC
5.112% (LIBOR 1 Month + 5.00%), 10/15/2026(o) | | | | | | | 62 | | | | 62,310 | |
Nielsen Finance LLC
4.750% (LIBOR 1 Month + 3.75%), 06/04/2025(o) | | | | | | | 50 | | | | 50,032 | |
Univision Communications Inc.
3.750% (LIBOR 1 Month + 2.75%), 03/15/2024(o) | | | | | | | 97 | | | | 96,562 | |
| | | | | | | | | | | | |
| | | | | | | | | | | 281,927 | |
| | | | | | | | | | | | |
Communications - Telecommunications – 0.1% | | | | | | | | | | | | |
Intrado Corporation
5.000% (LIBOR 1 Month + 4.00%), 10/10/2024(o) | | | | | | | 0 | ** | | | 369 | |
| | |
| |
| abfunds.com | | AB ALL MARKET TOTAL RETURN PORTFOLIO | 57 |
CONSOLIDATED PORTFOLIO OF INVESTMENTS (continued)
| | | | | | | | | | | | |
| | | | | | Principal
Amount
(000) | | | U.S. $ Value | |
| |
5.000% (LIBOR 3 Month + 4.00%), 10/10/2024(o) | | | U.S.$ | | | | 145 | | | $ | 142,869 | |
Zacapa S.A R.L.
4.769% (LIBOR 3 Month + 4.50%), 07/02/2025(o) | | | | | | | 199 | | | | 199,947 | |
| | | | | | | | | | | | |
| | | | | | | | | | | 343,185 | |
| | | | | | | | | | | | |
Consumer Cyclical - Automotive – 0.0% | | | | | | | | | | | | |
Clarios Global LP
3.615% (LIBOR 1 Month + 3.50%), 04/30/2026(o) | | | | | | | 58 | | | | 58,215 | |
Navistar, Inc.
3.620% (LIBOR 1 Month + 3.50%), 11/06/2024(o) | | | | | | | 45 | | | | 45,199 | |
| | | | | | | | | | | | |
| | | | | | | | | | | 103,414 | |
| | | | | | | | | | | | |
Consumer Cyclical - Entertainment – 0.0% | | | | | | | | | | | | |
Seaworld Parks & Entertainment, Inc. (fka SW Acquisitions Co., Inc.)
3.750% (LIBOR 1 Month + 3.00%), 04/01/2024(o) | | | | | | | 59 | | | | 57,979 | |
| | | | | | | | | | | | |
| | | |
Consumer Cyclical - Other – 0.1% | | | | | | | | | | | | |
Caesars Resort Collection, LLC
2.865% (LIBOR 1 Month + 2.75%), 12/23/2024(o) | | | | | | | 182 | | | | 180,323 | |
Flutter Entertainment PLC
3.754% (LIBOR 3 Month + 3.50%), 07/10/2025(o) | | | | | | | 15 | | | | 15,330 | |
Playtika Holding Corp.
7.000% (LIBOR 3 Month + 6.00%), 12/10/2024(o) | | | | | | | 317 | | | | 318,728 | |
| | | | | | | | | | | | |
| | | | | | | | | | | 514,381 | |
| | | | | | | | | | | | |
Consumer Cyclical - Restaurants – 0.0% | | | | | | | | | | | | |
Whatabrands LLC
2.862% (LIBOR 1 Month + 2.75%), 07/31/2026(o) | | | | | | | 40 | | | | 40,256 | |
| | | | | | | | | | | | |
| | | |
Consumer Cyclical - Retailers – 0.0% | | | | | | | | | | | | |
Bass Pro Group, LLC
5.750% (LIBOR 1 Month + 5.00%), 09/25/2024(o) | | | | | | | 52 | | | | 51,931 | |
PetSmart LLC
4.500% (LIBOR 3 Month + 3.75%), 02/11/2028(o) | | | | | | | 200 | | | | 201,312 | |
| | |
| |
58 | AB ALL MARKET TOTAL RETURN PORTFOLIO | | abfunds.com |
CONSOLIDATED PORTFOLIO OF INVESTMENTS (continued)
| | | | | | | | | | | | |
| | | | | | Principal
Amount
(000) | | | U.S. $ Value | |
| |
Serta Simmons Bedding, LLC
9.000% (LIBOR 3 Month + 8.00%), 11/08/2024(o) | | | U.S.$ | | | | 69 | | | $ | 29,361 | |
| | | | | | | | | | | | |
| | | | | | | | | | | 282,604 | |
| | | | | | | | | | | | |
Consumer Non-Cyclical – 0.1% | | | | | | | | | | | | |
Aldevron, LLC
4.250% (LIBOR 1 Month + 3.25%), 10/12/2026(e)(o) | | | | | | | 86 | | | | 86,669 | |
Alphabet Holding Company, Inc. (aka Nature’s Bounty)
7.865% (LIBOR 1 Month + 7.75%), 09/26/2025(o) | | | | | | | 183 | | | | 183,569 | |
Froneri International Limited
5.865% (LIBOR 1 Month + 5.75%), 01/31/2028(o) | | | | | | | 20 | | | | 20,212 | |
Kronos Acquisition Holdings, Inc.
12/22/2026(p) | | | | | | | 80 | | | | 79,883 | |
LifePoint Health, Inc. (fka Regionalcare Hospital Partners Holdings, Inc.)
3.865% (LIBOR 1 Month + 3.75%), 11/16/2025(o) | | | | | | | 96 | | | | 95,713 | |
U.S. Renal Care, Inc.
5.125% (LIBOR 1 Month + 5.00%), 06/26/2026(o) | | | | | | | 168 | | | | 167,130 | |
US Radiology Specialists, Inc. (US Outpatient Imaging Services, Inc.)
6.250% (LIBOR 3 Month + 5.50%), 12/15/2027(o) | | | | | | | 170 | | | | 171,134 | |
| | | | | | | | | | | | |
| | | | | | | | | | | 804,310 | |
| | | | | | | | | | | | |
Energy – 0.1% | | | | | | | | | | | | |
CITGO Petroleum Corporation
7.250% (LIBOR 3 Month + 6.25%), 03/28/2024(o) | | | | | | | 55 | | | | 55,063 | |
Enviva Holdings, LP
02/12/2026(e)(p) | | | | | | | 230 | | | | 228,850 | |
| | | | | | | | | | | | |
| | | | | | | | | | | 283,913 | |
| | | | | | | | | | | | |
Other Industrial – 0.0% | | | | | | | | | | | | |
American Tire Distributors, Inc.
8.500% (LIBOR 1 Month + 7.50%), 09/02/2024(o) | | | | | | | 64 | | | | 62,363 | |
8.500% (LIBOR 3 Month + 7.50%), 09/02/2024(o) | | | | | | | 8 | | | | 7,339 | |
Dealer Tire, LLC
4.365% (LIBOR 1 Month + 4.25%), 12/12/2025(o) | | | | | | | 40 | | | | 39,550 | |
| | |
| |
| abfunds.com | | AB ALL MARKET TOTAL RETURN PORTFOLIO | 59 |
CONSOLIDATED PORTFOLIO OF INVESTMENTS (continued)
| | | | | | | | | | | | |
| | | | | | Principal
Amount
(000) | | | U.S. $ Value | |
| |
Rockwood Service Corporation
4.365% (LIBOR 1 Month + 4.25%), 01/23/2027(o) | | | U.S.$ | | | | 10 | | | $ | 9,539 | |
RS IVY Holdco., Inc.
6.500% (LIBOR 3 Month + 5.50%), 12/23/2027(e)(o) | | | | | | | 130 | | | | 130,975 | |
| | | | | | | | | | | | |
| | | | | | | | | | | 249,766 | |
| | | | | | | | | | | | |
Services – 0.1% | | | | | | | | | | | | |
Allied Universal Holdco LLC (fka USAGM Holdco, LLC)
4.365% (LIBOR 1 Month + 4.25%), 07/10/2026(o) | | | | | | | 32 | | | | 32,441 | |
Amentum Government Services Holdings LLC
3.615% (LIBOR 1 Month + 3.50%), 01/29/2027(e)(o) | | | | | | | 40 | | | | 39,551 | |
Garda World Security Corporation
4.990% (LIBOR 3 Month + 4.75%), 10/30/2026(o) | | | | | | | 11 | | | | 11,033 | |
Parexel International Corporation
2.865% (LIBOR 1 Month + 2.75%), 09/27/2024(o) | | | | | | | 26 | | | | 26,295 | |
Sabre GLBL, Inc.
4.115% (LIBOR 1 Month + 4.00%), 12/17/2027(e)(o) | | | | | | | 60 | | | | 60,638 | |
Team Health Holdings, Inc.
3.750% (LIBOR 1 Month + 2.75%), 02/06/2024(o) | | | | | | | 196 | | | | 183,170 | |
Verscend Holding Corp.
4.615% (LIBOR 1 Month + 4.50%), 08/27/2025(o) | | | | | | | 89 | | | | 89,262 | |
| | | | | | | | | | | | |
| | | | 442,390 | |
| | | | | | | | | | | | |
Technology – 0.2% | | | | | | | | | | | | |
athenahealth, Inc.
4.453% (LIBOR 3 Month + 4.25%), 02/11/2026(e)(o) | | | | | | | 213 | | | | 214,508 | |
Banff Merger Sub, Inc.
10/02/2025(p) | | | | | | | 17 | | | | 16,807 | |
Boxer Parent Company Inc. (aka BMC Software, Inc.)
4.371% (LIBOR 1 Month + 4.25%), 10/02/2025(o) | | | | | | | 149 | | | | 148,704 | |
EIG Investors Corp.
02/10/2028(p) | | | | | | | 178 | | | | 176,404 | |
MTS Systems Corporation
4.000% (LIBOR 1 Month + 3.25%), 07/05/2023(e)(o) | | | | | | | 24 | | | | 23,978 | |
| | |
| |
60 | AB ALL MARKET TOTAL RETURN PORTFOLIO | | abfunds.com |
CONSOLIDATED PORTFOLIO OF INVESTMENTS (continued)
| | | | | | | | | | | | |
| | | | | | Principal
Amount
(000) | | | U.S. $ Value | |
| |
Peration Holding Corp.
02/01/2028-02/19/2028(e)(p) | | | U.S.$ | | | | 66 | | | $ | 66,566 | |
Pitney Bowes Inc.
5.620% (LIBOR 1 Month + 5.50%), 01/07/2025(o) | | | | | | | 117 | | | | 116,935 | |
Presidio Holdings Inc.
3.720% (LIBOR 3 Month + 3.50%), 01/22/2027(o) | | | | | | | 43 | | | | 43,088 | |
Solera, LLC (Solera Finance, Inc.)
2.865% (LIBOR 1 Month + 2.75%), 03/03/2023(o) | | | | | | | 141 | | | | 140,904 | |
Veritas US Inc.
6.500% (LIBOR 3 Month + 5.50%), 09/01/2025(o) | | | | | | | 224 | | | | 224,870 | |
| | | | | | | | | | | | |
| | | | | | | | | | | 1,172,764 | |
| | | | | | | | | | | | |
Transportation - Airlines – 0.0% | | | | | | | | | | | | |
Delta Air Lines, Inc.
5.750% (LIBOR 1 Month + 4.75%), 04/29/2023(o) | | | | | | | 20 | | | | 20,024 | |
| | | | | | | | | | | | |
| | | | | | | | | | | 4,960,068 | |
| | | | | | | | | | | | |
Utility – 0.0% | | | | | | | | | | | | |
Electric – 0.0% | | | | | | | | | | | | |
Granite Generation LLC
4.750% (LIBOR 1 Month + 3.75%), 11/09/2026(o) | | | | | | | 176 | | | | 176,680 | |
4.750% (LIBOR 3 Month + 3.75%), 11/09/2026(o) | | | | | | | 34 | | | | 33,785 | |
| | | | | | | | | | | | |
| | | | | | | | | | | 210,465 | |
| | | | | | | | | | | | |
Total Bank Loans
(cost $5,427,748) | | | | | | | | | | | 5,441,507 | |
| | | | | | | | | | | | |
| | | | | | | | | | | | |
COLLATERALIZED MORTGAGE OBLIGATIONS – 0.7% | | | | | | | | | | | | |
Risk Share Floating Rate – 0.7% | | | | | | | | | | | | |
Bellemeade Re Ltd.
Series 2018-3A, Class M2
2.868% (LIBOR 1 Month + 2.75%), 10/25/2028(c)(n) | | | | | | | 150 | | | | 150,696 | |
Series 2019-3A, Class M1C
2.068% (LIBOR 1 Month + 1.95%), 07/25/2029(c)(n) | | | | | | | 164 | | | | 165,758 | |
Connecticut Avenue Securities Trust
Series 2018-R07, Class 1B1
4.468% (LIBOR 1 Month + 4.35%), 04/25/2031(c)(n) | | | | | | | 51 | | | | 52,134 | |
| | |
| |
| abfunds.com | | AB ALL MARKET TOTAL RETURN PORTFOLIO | 61 |
CONSOLIDATED PORTFOLIO OF INVESTMENTS (continued)
| | | | | | | | | | |
| | | | | Principal
Amount
(000) | | | U.S. $ Value | |
| |
Eagle Re Ltd.
Series 2018-1, Class M2
3.13% (LIBOR 1 Month + 3.00%), 11/25/2028(c)(n) | | U.S.$ | | | 150 | | | $ | 151,314 | |
Federal Home Loan Mortgage Corp.
Series 2019-DNA3, Class M2
2.18% (LIBOR 1 Month + 2.05%), 07/25/2049(c)(n) | | | | | 16 | | | | 16,321 | |
Federal Home Loan Mortgage Corp. Structured Agency Credit Risk Debt Notes
Series 2016-HQA2, Class M3
5.28% (LIBOR 1 Month + 5.15%), 11/25/2028(n) | | | | | 342 | | | | 354,710 | |
Series 2016-HQA3, Class M3
3.98% (LIBOR 1 Month + 3.85%), 03/25/2029(n) | | | | | 374 | | | | 386,665 | |
Series 2016-HQA4, Class M3
4.03% (LIBOR 1 Month + 3.90%), 04/25/2029(n) | | | | | 403 | | | | 417,267 | |
Series 2020-DNA1, Class M2
1.83% (LIBOR 1 Month + 1.70%), 01/25/2050(c)(n) | | | | | 338 | | | | 336,622 | |
Federal National Mortgage Association Connecticut Avenue Securities
Series 2015-C02, Class 1M2
4.13% (LIBOR 1 Month + 4.00%), 05/25/2025(n) | | | | | 121 | | | | 123,722 | |
Series 2015-C02, Class 2M2
4.13% (LIBOR 1 Month + 4.00%), 05/25/2025(n) | | | | | 63 | | | | 63,807 | |
Series 2015-C03, Class 1M2
5.13% (LIBOR 1 Month + 5.00%), 07/25/2025(n) | | | | | 6 | | | | 6,413 | |
Series 2015-C03, Class 2M2
5.13% (LIBOR 1 Month + 5.00%), 07/25/2025(n) | | | | | 90 | | | | 91,394 | |
Series 2015-C04, Class 2M2
5.68% (LIBOR 1 Month + 5.55%), 04/25/2028(n) | | | | | 157 | | | | 164,817 | |
Series 2016-C01, Class 2M2
7.08% (LIBOR 1 Month + 6.95%), 08/25/2028(n) | | | | | 88 | | | | 93,404 | |
Series 2016-C03, Class 2M2
6.03% (LIBOR 1 Month + 5.90%), 10/25/2028(n) | | | | | 201 | | | | 210,708 | |
| | |
| |
62 | AB ALL MARKET TOTAL RETURN PORTFOLIO | | abfunds.com |
CONSOLIDATED PORTFOLIO OF INVESTMENTS (continued)
| | | | | | | | | | | | |
| | | | | | Principal
Amount
(000) | | | U.S. $ Value | |
| |
Series 2016-C05, Class 2M2
4.568% (LIBOR 1 Month + 4.45%), 01/25/2029(n) | | | U.S.$ | | | | 228 | | | $ | 237,511 | |
Series 2016-C07, Class 2M2
4.468% (LIBOR 1 Month + 4.35%), 05/25/2029(n) | | | | | | | 263 | | | | 273,774 | |
Series 2017-C01, Class 1B1
5.868% (LIBOR 1 Month + 5.75%), 07/25/2029(n) | | | | | | | 27 | | | | 29,315 | |
Series 2017-C02, Class 2M2
3.768% (LIBOR 1 Month + 3.65%), 09/25/2029(n) | | | | | | | 187 | | | | 191,846 | |
Series 2017-C03, Class 1B1
4.968% (LIBOR 1 Month + 4.85%), 10/25/2029(n) | | | | | | | 27 | | | | 29,065 | |
Series 2017-C05, Class 1B1
3.73% (LIBOR 1 Month + 3.60%), 01/25/2030(n) | | | | | | | 27 | | | | 28,305 | |
Series 2017-C06, Class 1B1
4.268% (LIBOR 1 Month + 4.15%), 02/25/2030(n) | | | | | | | 143 | | | | 147,900 | |
Series 2018-C01, Class 1B1
3.668% (LIBOR 1 Month + 3.55%), 07/25/2030(n) | | | | | | | 107 | | | | 107,888 | |
Home Re Ltd.
Series 2018-1, Class M2
3.13% (LIBOR 1 Month + 3.00%), 10/25/2028(c)(n) | | | | | | | 235 | | | | 237,182 | |
Mortgage Insurance-Linked Notes
Series 2019-1, Class M2
3.03% (LIBOR 1 Month + 2.90%), 11/26/2029(c)(n) | | | | | | | 365 | | | | 352,860 | |
Triangle Re Ltd.
Series 2020-1, Class M2
5.73% (LIBOR 1 Month + 5.60%), 10/25/2030(c)(n) | | | | | | | 150 | | | | 154,839 | |
| | | | | | | | | | | | |
| | | | | | | | | | | 4,576,237 | |
| | | | | | | | | | | | |
Agency Fixed Rate – 0.0% | | | | | | | | | | | | |
Federal National Mortgage Association Grantor Trust
Series 2004-T5, Class AB4
0.688%, 05/28/2035 | | | | | | | 96 | | | | 91,595 | |
| | | | | | | | | | | | |
| | | |
Non-Agency Fixed Rate – 0.0% | | | | | | | | | | | | |
Alternative Loan Trust
Series 2006-28CB, Class A14
6.25%, 10/25/2036 | | | | | | | 10 | | | | 7,663 | |
| | |
| |
| abfunds.com | | AB ALL MARKET TOTAL RETURN PORTFOLIO | 63 |
CONSOLIDATED PORTFOLIO OF INVESTMENTS (continued)
| | | | | | | | | | | | |
| | | | | | Principal
Amount
(000) | | | U.S. $ Value | |
| |
CSMC Mortgage-Backed Trust
Series 2006-7, Class 3A12
6.25%, 08/25/2036 | | | U.S.$ | | | | 12 | | | $ | 7,960 | |
| | | | | | | | | | | | |
| | | | | | | | | | | 15,623 | |
| | | | | | | | | | | | |
Total Collateralized Mortgage Obligations
(cost $4,613,053) | | | | | | | | | | | 4,683,455 | |
| | | | | | | | | | | | |
| | | | | | | | | | | | |
EMERGING MARKETS – CORPORATE BONDS – 0.7% | | | | | | | | | | | | |
Industrial – 0.6% | | | | | | | | | | | | |
Basic – 0.2% | | | | | | | | | | | | |
Braskem Netherlands Finance BV
4.50%, 01/31/2030(c) | | | | | | | 200 | | | | 203,040 | |
Consolidated Energy Finance SA
6.875%, 06/15/2025(c) | | | | | | | 200 | | | | 203,942 | |
CSN Resources SA
7.625%, 02/13/2023(c) | | | | | | | 200 | | | | 207,125 | |
Eldorado Gold Corp.
9.50%, 06/01/2024(c) | | | | | | | 162 | | | | 180,559 | |
First Quantum Minerals Ltd.
7.25%, 04/01/2023(c) | | | | | | | 342 | | | | 349,089 | |
Vedanta Resources Finance II PLC
13.875%, 01/21/2024(c) | | | | | | | 201 | | | | 222,231 | |
Volcan Cia Minera SAA
4.375%, 02/11/2026(c) | | | | | | | 21 | | | | 21,551 | |
| | | | | | | | | | | | |
| | | | 1,387,537 | |
| | | | | | | | | | | | |
Capital Goods – 0.1% | | | | | | | | | | | | |
Cemex SAB de CV
7.375%, 06/05/2027(b)(c) | | | | | | | 300 | | | | 336,645 | |
Embraer Netherlands Finance BV | | | | | | | | | | | | |
5.40%, 02/01/2027 | | | | | | | 90 | | | | 94,109 | |
6.95%, 01/17/2028(c) | | | | | | | 200 | | | | 223,900 | |
| | | | | | | | | | | | |
| | | | | | | | | | | 654,654 | |
| | | | | | | | | | | | |
Communications - Media – 0.1% | |
Globo Comunicacao e Participacoes SA
4.875%, 01/22/2030(c) | | | | | | | 231 | | | | 240,024 | |
| | | | | | | | | | | | |
| | | |
Communications - Telecommunications – 0.0% | | | | | | | | | | | | |
Digicel Group 0.5 Ltd.
7.00%, 03/15/2021(h)(i)(l) | | | | | | | 8 | | | | 5,433 | |
8.00% (5.00% Cash and 3.00% PIK), 04/01/2025(c)(h) | | | | | | | 50 | | | | 40,771 | |
10.00% (8.00% Cash and 2.00% PIK), 04/01/2024(h) | | | | | | | 155 | | | | 153,076 | |
| | | | | | | | | | | | |
| | | | | | | | | | | 199,280 | |
| | | | | | | | | | | | |
| | |
| |
64 | AB ALL MARKET TOTAL RETURN PORTFOLIO | | abfunds.com |
CONSOLIDATED PORTFOLIO OF INVESTMENTS (continued)
| | | | | | | | | | | | |
| | | | | | Principal
Amount
(000) | | | U.S. $ Value | |
| |
Consumer Cyclical - Other – 0.0% | |
Wynn Macau Ltd.
5.50%, 10/01/2027(c) | | | U.S.$ | | | | 214 | | | $ | 222,293 | |
| | | | | | | | | | | | |
|
Consumer Cyclical - Retailers – 0.0% | |
K2016470219 South Africa Ltd.
3.00%, 12/31/2022(d)(e)(h)(i) | | | | | | | 39 | | | | – 0 | – |
K2016470260 South Africa Ltd.
25.00%, 12/31/2022(d)(e)(h)(i) | | | | | | | 20 | | | | – 0 | – |
| | | | | | | | | | | | |
| | | | | | | | | | | – 0 | – |
| | | | | | | | | | | | |
Consumer Non-Cyclical – 0.1% | |
BRF GmbH
4.35%, 09/29/2026(c) | | | | | | | 210 | | | | 218,269 | |
Cosan Ltd.
5.50%, 09/20/2029(c) | | | | | | | 388 | | | | 415,281 | |
Tonon Luxembourg SA
6.50% (0.50% Cash and 6.00% PIK), 10/31/2024(a)(d)(e)(h)(i)(k) | | | | | | | 5 | | | | 155 | |
Virgolino de Oliveira Finance SA
10.50%, 01/28/2018(a)(g)(i) | | | | | | | 434 | | | | 4,737 | |
| | | | | | | | | | | | |
| | | | | | | | | | | 638,442 | |
| | | | | | | | | | | | |
Energy – 0.1% | |
Leviathan Bond Ltd.
6.50%, 06/30/2027(c) | | | | | | | 109 | | | | 119,604 | |
Petrobras Global Finance BV
5.093%, 01/15/2030 | | | | | | | 49 | | | | 51,775 | |
5.60%, 01/03/2031 | | | | | | | 59 | | | | 63,584 | |
| | | | | | | | | | | | |
| | | | | | | | | | | 234,963 | |
| | | | | | | | | | | | |
| | | | | | | | | | | 3,577,193 | |
| | | | | | | | | | | | |
Utility – 0.1% | |
Electric – 0.1% | |
Cemig Geracao e Transmissao SA
9.25%, 12/05/2024(c) | | | | | | | 200 | | | | 230,250 | |
Light Servicos de Eletricidade SA/Light Energia SA
7.25%, 05/03/2023(c) | | | | | | | 393 | | | | 407,639 | |
Terraform Global Operating LLC
6.125%, 03/01/2026(i) | | | | | | | 12 | | | | 12,367 | |
| | | | | | | | | | | | |
| | | | | | | | | | | 650,256 | |
| | | | | | | | | | | | |
Financial Institutions – 0.0% | | | | | | | | | | | | |
Insurance – 0.0% | | | | | | | | | | | | |
Ambac LSNI LLC
6.00% (LIBOR 3 Month + 5.00%), 02/12/2023(c)(n) | | | | | | | 18 | | | | 17,958 | |
| | | | | | | | | | | | |
| | |
| |
| abfunds.com | | AB ALL MARKET TOTAL RETURN PORTFOLIO | 65 |
CONSOLIDATED PORTFOLIO OF INVESTMENTS (continued)
| | | | | | | | | | | | |
| | | | | | Principal
Amount
(000) | | | U.S. $ Value | |
| |
Other Finance – 0.0% | | | | | | | | | | | | |
OEC Finance Ltd.
5.25%, 12/27/2033(c)(h) | | | U.S.$ | | | | 104 | | | $ | 20,728 | |
| | | | | | | | | | | | |
| | | | 38,686 | |
| | | | | | | | | | | | |
Total Emerging Markets – Corporate Bonds
(cost $4,065,965) | | | | | | | | | | | 4,266,135 | |
| | | | | | | | | | | | |
| | | | | | | | | | | | |
COLLATERALIZED LOAN OBLIGATIONS – 0.3% | | | | | | | | | | | | |
CLO - Floating Rate – 0.3% | | | | | | | | | | | | |
Ares XXXIV CLO Ltd.
Series 2015-2A, Class CR
2.223% (LIBOR 3 Month + 2.00%), 04/17/2033(c)(n) | | | | | | | 270 | | | | 270,565 | |
Dryden 49 Senior Loan Fund
Series 2017-49A, Class E
6.523% (LIBOR 3 Month + 6.30%), 07/18/2030(c)(n) | | | | | | | 250 | | | | 248,098 | |
Dryden CLO Ltd.
Series 2020-78A, Class C
2.173% (LIBOR 3 Month + 1.95%), 04/17/2033(c)(n) | | | | | | | 250 | | | | 251,197 | |
Elmwood CLO VIII Ltd.
Series 2021-1A, Class E1
Zero Coupon (LIBOR 3 Month + 6.00%), 01/20/2034(c)(n) | | | | | | | 150 | | | | 150,015 | |
Octagon Investment Partners 29 Ltd.
Series 2016-1A, Class DR
3.318% (LIBOR 3 Month + 3.10%), 01/24/2033(c)(n) | | | | | | | 263 | | | | 263,551 | |
Rockford Tower CLO Ltd.
Series 2017-2A, Class DR
3.091% (LIBOR 3 Month + 2.85%), 10/15/2029(c)(n) | | | | | | | 306 | | | | 305,762 | |
Trimaran Advisors CAVU 2019-1 Ltd.
Series 2019-1A, Class E
7.264% (LIBOR 3 Month + 7.04%), 07/20/2032(c)(n) | | | | | | | 250 | | | | 246,843 | |
Voya CLO Ltd.
Series 2019-1A, Class DR
3.091% (LIBOR 3 Month + 2.85%), 04/15/2031(c)(n) | | | | | | | 109 | | | | 108,378 | |
| | | | | | | | | | | | |
| | | |
Total Collateralized Loan Obligations
(cost $1,843,505) | | | | | | | | | | | 1,844,409 | |
| | | | | | | | | | | | |
| | | | | | | | | | | | |
| | |
| |
66 | AB ALL MARKET TOTAL RETURN PORTFOLIO | | abfunds.com |
CONSOLIDATED PORTFOLIO OF INVESTMENTS (continued)
| | | | | | | | | | | | |
| | | | | | Principal
Amount
(000) | | | U.S. $ Value | |
| |
QUASI-SOVEREIGNS – 0.2% | | | | | | | | | | | | |
Quasi-Sovereign Bonds – 0.2% | | | | | | | | | | | | |
Mexico – 0.2% | | | | | | | | | | | | |
Petroleos Mexicanos
5.95%, 01/28/2031 | | | U.S.$ | | | | 301 | | | $ | 290,013 | |
6.49%, 01/23/2027 | | | | | | | 51 | | | | 53,359 | |
6.50%, 01/23/2029 | | | | | | | 41 | | | | 41,231 | |
6.75%, 09/21/2047 | | | | | | | 229 | | | | 200,432 | |
6.84%, 01/23/2030 | | | | | | | 210 | | | | 211,050 | |
6.95%, 01/28/2060 | | | | | | | 67 | | | | 58,625 | |
7.69%, 01/23/2050 | | | | | | | 253 | | | | 240,325 | |
| | | | | | | | | | | | |
| | | | | | | | | | | 1,095,035 | |
| | | | | | | | | | | | |
United Arab Emirates – 0.0% | | | | | | | | | | | | |
DP World Crescent Ltd.
3.875%, 07/18/2029(c) | | | | | | | 220 | | | | 232,650 | |
| | | | | | | | | | | | |
| | | |
Total Quasi-Sovereigns
(cost $1,147,603) | | | | | | | | | | | 1,327,685 | |
| | | | | | | | | | | | |
| | | | | | | | | | | | |
ASSET-BACKED SECURITIES – 0.2% | | | | | | | | | | | | |
Other ABS - Fixed Rate – 0.1% | | | | | | | | | | | | |
Marlette Funding Trust
Series 2018-3A, Class C
4.63%, 09/15/2028(c) | | | | | | | 125 | | | | 126,805 | |
SoFi Consumer Loan Program LLC
Series 2017-6, Class C
4.02%, 11/25/2026(c) | | | | | | | 360 | | | | 370,717 | |
Taco Bell Funding LLC
Series 2016-1A, Class A23
4.97%, 05/25/2046(c) | | | | | | | 38 | | | | 41,008 | |
| | | | | | | | | | | | |
| | | | | | | | | | | 538,530 | |
| | | | | | | | | | | | |
Autos - Fixed Rate – 0.1% | | | | | | | | | | | | |
CPS Auto Trust
Series 2018-C, Class D
4.40%, 06/17/2024(c) | | | | | | | 120 | | | | 124,078 | |
Exeter Automobile Receivables Trust
Series 2019-2A, Class E
4.68%, 05/15/2026(c) | | | | | | | 115 | | | | 121,927 | |
| | | | | | | | | | | | |
| | | | | | | | | | | 246,005 | |
| | | | | | | | | | | | |
Home Equity Loans - Fixed Rate – 0.0% | | | | | | | | | | | | |
CWABS Asset-Backed Certificates Trust
Series 2005-7, Class AF5W
5.554%, 10/25/2035 | | | | | | | 88 | | | | 88,693 | |
GSAA Home Equity Trust
Series 2006-6, Class AF5
6.241%, 03/25/2036 | | | | | | | 158 | | | | 64,998 | |
| | | | | | | | | | | | |
| | | | | | | | | | | 153,691 | |
| | | | | | | | | | | | |
| | |
| |
| abfunds.com | | AB ALL MARKET TOTAL RETURN PORTFOLIO | 67 |
CONSOLIDATED PORTFOLIO OF INVESTMENTS (continued)
| | | | | | | | | | | | |
| | | | | | Principal
Amount
(000) | | | U.S. $ Value | |
| |
Home Equity Loans - Floating Rate – 0.0% | | | | | | | | | |
ABFC Trust
Series 2003-WF1, Class A2
1.255% (LIBOR 1 Month + 1.13%), 12/25/2032(n) | | | U.S.$ | | | | 21 | | | $ | 20,893 | |
Lehman XS Trust
Series 2007-6, Class 3A5
4.519%, 05/25/2037 | | | | | | | 25 | | | | 25,138 | |
| | | | | | | | | | | | |
| | | | 46,031 | |
| | | | | | | | | | | | |
Total Asset-Backed Securities
(cost $970,021) | | | | | | | | | | | 984,257 | |
| | | | | | | | | | | | |
| | | | | | | | | | | | |
COMMERCIAL MORTGAGE-BACKED SECURITIES – 0.1% | | | | | | | | | | | | |
Non-Agency Fixed Rate CMBS – 0.1% | | | | | | | | | | | | |
Citigroup Commercial Mortgage Trust Series 2014-GC23, Class D
4.485%, 07/10/2047(c) | | | | | | | 35 | | | | 32,696 | |
GS Mortgage Securities Trust
Series 2014-GC18, Class D
4.989%, 01/10/2047(c) | | | | | | | 71 | | | | 22,596 | |
JP Morgan Chase Commercial Mortgage Securities Trust
Series 2012-CBX, Class E
5.133%, 06/15/2045(c) | | | | | | | 298 | | | | 138,300 | |
JPMBB Commercial Mortgage Securities Trust
Series 2013-C17, Class D
4.889%, 01/15/2047(c) | | | | | | | 71 | | | | 70,754 | |
| | | | | | | | | | | | |
| | | | 264,346 | |
| | | | | | | | | | | | |
Non-Agency Floating Rate CMBS – 0.0% | | | | | | | | | | | | |
DBWF Mortgage Trust
Series 2018-GLKS, Class E
3.129% (LIBOR 1 Month + 3.02%), 12/19/2030(c)(n) | | | | | | | 100 | | | | 99,123 | |
Morgan Stanley Capital I Trust
Series 2019-BPR, Class E
4.862% (LIBOR 1 Month + 4.75%), 05/15/2036(c)(n) | | | | | | | 39 | | | | 24,187 | |
| | | | | | | | | | | | |
| | | | 123,310 | |
| | | | | | | | | | | | |
Total Commercial Mortgage-Backed Securities
(cost $591,451) | | | | | | | | | | | 387,656 | |
| | | | | | | | | | | | |
| | | | | | | | | | | | |
GOVERNMENTS – SOVEREIGN BONDS – 0.0% | | | | | | | | | | | | |
Mexico – 0.0% | | | | | | | | | | | | |
Mexico Government International Bond
4.75%, 04/27/2032
(cost $195,763) | | | | | | | 200 | | | | 224,250 | |
| | | | | | | | | | | | |
| | |
| |
68 | AB ALL MARKET TOTAL RETURN PORTFOLIO | | abfunds.com |
CONSOLIDATED PORTFOLIO OF INVESTMENTS (continued)
| | | | | | | | | | | | |
| | | | | | Principal
Amount
(000) | | | U.S. $ Value | |
| |
EMERGING MARKETS – TREASURIES – 0.0% | | | | | | | | | | | | |
Turkey – 0.0% | |
Turkey Government Bond
11.70%, 11/13/2030
(cost $236,877) | | | TRY | | | | 1,768 | | | $ | 221,275 | |
| | | | | | | | | | | | |
| | | |
| | | | | | Shares | | | | |
PREFERRED STOCKS – 0.0% | |
Industrials – 0.0% | |
Auto Components – 0.0% | |
Exide Corp.
8.00%(d)(e) | | | | | | | 117 | | | | 90,968 | |
| | | | | | | | | | | | |
|
Consumer Cyclical Services – 0.0% | |
Hovnanian Enterprises, Inc.
7.625% | | | | | | | 1,190 | | | | 16,898 | |
WESCO International, Inc.
Series A
10.625% | | | | | | | 3,350 | | | | 101,672 | |
| | | | | | | | | | | | |
| | | | | | | | | | | 118,570 | |
| | | | | | | | | | | | |
Total Preferred Stocks
(cost $186,763) | | | | | | | | | | | 209,538 | |
| | | | | | | | | | | | |
| | | | | | | | | | | | |
WARRANTS – 0.0% | |
Information Technology – 0.0% | |
Software – 0.0% | |
Avaya Holdings Corp.,
expiring 12/15/2022(a) | | | | | | | 4,686 | | | | 42,549 | |
| | | | | | | | | | | | |
| | | | | | | | | | | | |
Industrials – 0.0% | |
Construction & Engineering – 0.0% | |
Willscot Corp.,
expiring 11/29/2022(a)(d)(e) | | | | | | | 1,913 | | | | 24,902 | |
| | | | | | | | | | | | |
| | | | | | | | | | | | |
Energy – 0.0% | |
Oil, Gas & Consumable Fuels – 0.0% | |
Battalion Oil Corp.,
expiring 10/08/2022(a)(d)(e) | | | | | | | 14 | | | | – 0 | – |
Battalion Oil Corp.,
expiring 10/08/2022(a)(b)(d)(e) | | | | | | | 10 | | | | – 0 | – |
SandRidge Energy, Inc., A-CW22,
expiring 10/04/2022(a) | | | | | | | 4,816 | | | | 144 | |
SandRidge Energy, Inc., B-CW22,
expiring 10/04/2022(a) | | | | | | | 2,024 | | | | 45 | |
| | | | | | | | | | | | |
| | | | | | | | | | | 189 | |
| | | | | | | | | | | | |
Total Warrants
(cost $15,546) | | | | | | | | | | | 67,640 | |
| | | | | | | | | | | | |
| | |
| |
| abfunds.com | | AB ALL MARKET TOTAL RETURN PORTFOLIO | 69 |
CONSOLIDATED PORTFOLIO OF INVESTMENTS (continued)
| | | | | | | | | | | | |
| | | | | | Principal
Amount
(000) | | | U.S. $ Value | |
| |
MORTGAGE PASS-THROUGHS – 0.0% | | | | | | | | | | | | |
Agency Fixed Rate 30-Year – 0.0% | | | | | | | | | | | | |
Federal National Mortgage Association
Series 2006
5.00%, 01/01/2036
(cost $113) | | | U.S.$ | | | | 0 | ** | | $ | 119 | |
| | | | | | | | | | | | |
| | | |
| | | | | | Shares | | | | |
SHORT-TERM INVESTMENTS – 23.2% | | | | | | | | | | | | |
Investment Companies – 22.9% | | | | | | | | | | | | |
AB Fixed Income Shares, Inc. – Government Money Market Portfolio – Class AB, 0.01%(m)(q)(r)
(cost $147,893,610) | | | | | | | 147,893,610 | | | | 147,893,610 | |
| | | | | | | | | | | | |
| | | |
| | | | | | Principal
Amount
(000) | | | | |
U.S. Treasury Bills – 0.3% | | | | | | | | | | | | |
United States – 0.3% | | | | | | | | | | | | |
U.S. Treasury Bill
Zero Coupon, 04/22/2021
(cost $1,999,795) | | | U.S.$ | | | | 2,000 | | | | 1,999,899 | |
| | | | | | | | | | | | |
| | | |
Total Short-Term Investments
(cost $149,893,405) | | | | | | | | | | | 149,893,509 | |
| | | | | | | | | | | | |
| | | |
Total Investments Before Security Lending Collateral for Securities Loaned – 98.4%
(cost $571,212,119) | | | | | | | | | | | 635,828,641 | |
| | | | | | | | | | | | |
| | | |
| | | | | | Shares | | | | |
INVESTMENTS OF CASH COLLATERAL FOR SECURITIES LOANED – 0.6% | | | | | | | | | | | | |
Investment Companies – 0.6% | | | | | | | | | | | | |
AB Fixed Income Shares, Inc. – Government Money Market Portfolio – Class AB, 0.01%(m)(q)(r)
(cost $3,831,960) | | | | | | | 3,831,960 | | | | 3,831,960 | |
| | | | | | | | | | | | |
| | | |
Total Investments – 99.0%
(cost $575,044,079) | | | | | | | | | | | 639,660,601 | |
Other assets less liabilities – 1.0% | | | | | | | | | | | 6,397,254 | |
| | | | | | | | | | | | |
| | | |
Net Assets – 100.0% | | | | | | | | | | $ | 646,057,855 | |
| | | | | | | | | | | | |
| | |
| |
70 | AB ALL MARKET TOTAL RETURN PORTFOLIO | | abfunds.com |
CONSOLIDATED PORTFOLIO OF INVESTMENTS (continued)
FUTURES (see Note D)
| | | | | | | | | | | | | | | | |
| Description | | Number of
Contracts | | | Expiration
Month | | | Current
Notional | | | Value and
Unrealized
Appreciation/
(Depreciation) | |
Purchased Contracts | | | | | | | | | | | | | | | | |
10 Yr Australian Bond Futures | | | 183 | | | | March 2021 | | | $ | 19,300,858 | | | $ | (1,321,039 | ) |
10 Yr Canadian Bond Futures | | | 210 | | | | June 2021 | | | | 23,066,007 | | | | (394,656 | ) |
10 Yr Japan Bond (OSE) Futures | | | 27 | | | | March 2021 | | | | 38,151,320 | | | | (356,938 | ) |
E-Mini Russell 2000 Futures | | | 36 | | | | March 2021 | | | | 3,958,560 | | | | 525,067 | |
Euro Buxl 30 Yr Bond Futures | | | 51 | | | | March 2021 | | | | 12,911,081 | | | | (862,985 | ) |
Euro STOXX 50 Index Futures | | | 94 | | | | March 2021 | | | | 4,113,590 | | | | 46,541 | |
Euro-BOBL Futures | | | 45 | | | | March 2021 | | | | 7,286,902 | | | | (46,505 | ) |
Euro-BTP Futures | | | 118 | | | | March 2021 | | | | 21,327,471 | | | | (107,943 | ) |
Euro-Bund Futures | | | 86 | | | | March 2021 | | | | 17,992,565 | | | | (386,100 | ) |
Euro-Schatz Futures | | | 113 | | | | March 2021 | | | | 15,293,282 | | | | (21,265 | ) |
FTSE 100 Index Futures | | | 24 | | | | March 2021 | | | | 2,153,163 | | | | (128,579 | ) |
FTSE KLCI Futures | | | 158 | | | | March 2021 | | | | 3,056,553 | | | | (5,740 | ) |
FTSE Taiwan Index Futures | | | 58 | | | | March 2021 | | | | 3,214,360 | | | | (77,948 | ) |
Hang Seng Index Futures | | | 6 | | | | March 2021 | | | | 1,120,061 | | | | (61,008 | ) |
Long Gilt Futures | | | 363 | | | | June 2021 | | | | 64,617,330 | | | | (693,272 | ) |
MSCI EAFE Futures | | | 34 | | | | March 2021 | | | | 3,678,800 | | | | (125,014 | ) |
MSCI Emerging Markets Futures | | | 585 | | | | March 2021 | | | | 39,139,425 | | | | 2,599,640 | |
OMXS30 Index Futures | | | 47 | | | | March 2021 | | | | 1,116,013 | | | | (22,252 | ) |
S&P 500 E-Mini Futures | | | 503 | | | | March 2021 | | | | 95,801,380 | | | | 1,052,449 | |
S&P Mid 400 E-Mini Futures | | | 34 | | | | March 2021 | | | | 8,481,980 | | | | 881,345 | |
S&P/TSX 60 Index Futures | | | 11 | | | | March 2021 | | | | 1,852,868 | | | | (28,307 | ) |
SPI 200 Futures | | | 5 | | | | March 2021 | | | | 637,585 | | | | (16,471 | ) |
TOPIX Index Futures | | | 13 | | | | March 2021 | | | | 2,287,302 | | | | 15,504 | |
U.S. Long Bond (CBT) Futures | | | 2 | | | | June 2021 | | | | 318,438 | | | | (2,800 | ) |
U.S. T-Note 2 Yr (CBT) Futures | | | 145 | | | | June 2021 | | | | 32,011,016 | | | | (26,233 | ) |
U.S. T-Note 5 Yr (CBT) Futures | | | 316 | | | | June 2021 | | | | 39,174,125 | | | | (335,029 | ) |
U.S. T-Note 10 Yr (CBT) Futures | | | 424 | | | | June 2021 | | | | 56,272,750 | | | | (697,733 | ) |
U.S. Ultra Bond (CBT) Futures | | | 259 | | | | June 2021 | | | | 48,967,188 | | | | (187,844 | ) |
WIG 20 Index Futures | | | 65 | | | | March 2021 | | | | 666,044 | | | | (15,242 | ) |
|
Sold Contracts | |
10 Yr Australian Bond Futures | | | 32 | | | | March 2021 | | | | 3,375,013 | | | | 257,219 | |
10 Yr Canadian Bond Futures | | | 21 | | | | June 2021 | | | | 2,306,601 | | | | 45,014 | |
10 Yr Japan Bond (OSE) Futures | | | 8 | | | | March 2021 | | | | 11,304,095 | | | | 52,020 | |
10 Yr Mini Japan Government Bond Futures | | | 38 | | | | March 2021 | | | | 5,375,862 | | | | 41,644 | |
E-Mini Russell 1000 Futures | | | 52 | | | | March 2021 | | | | 5,612,880 | | | | (112,632 | ) |
Euro Buxl 30 Yr Bond Futures | | | 7 | | | | March 2021 | | | | 1,772,109 | | | | 144,705 | |
Euro STOXX 50 Index Futures | | | 40 | | | | March 2021 | | | | 1,750,464 | | | | (17,414 | ) |
Euro-BOBL Futures | | | 11 | | | | March 2021 | | | | 1,781,243 | | | | 15,238 | |
Euro-Bund Futures | | | 147 | | | | March 2021 | | | | 30,754,733 | | | | 648,530 | |
Euro-Schatz Futures | | | 8 | | | | March 2021 | | | | 1,082,710 | | | | 1,487 | |
FTSE 100 Index Futures | | | 36 | | | | March 2021 | | | | 3,229,744 | | | | 74,274 | |
Long Gilt Futures | | | 91 | | | | June 2021 | | | | 16,198,835 | | | | 184,976 | |
MEX BOLSA Index Futures | | | 56 | | | | March 2021 | | | | 1,195,484 | | | | 11,260 | |
MSCI EAFE Futures | | | 3 | | | | March 2021 | | | | 324,600 | | | | 5,390 | |
MSCI Emerging Markets Futures | | | 2 | | | | March 2021 | | | | 133,810 | | | | (8,524 | ) |
MSCI Singapore IX ETS Futures | | | 4 | | | | March 2021 | | | | 101,590 | | | | (1,115 | ) |
S&P 500 E-Mini Futures | | | 90 | | | | March 2021 | | | | 17,141,400 | | | | 308,754 | |
| | |
| |
| abfunds.com | | AB ALL MARKET TOTAL RETURN PORTFOLIO | 71 |
CONSOLIDATED PORTFOLIO OF INVESTMENTS (continued)
| | | | | | | | | | | | | | | | |
| Description | | Number of
Contracts | | | Expiration
Month | | | Current
Notional | | | Value and
Unrealized
Appreciation/
(Depreciation) | |
S&P Mid 400 E-Mini Futures | | | 44 | | | | March 2021 | | | $ | 10,976,680 | | | $ | (431,457 | ) |
SGX Nifty 50 Futures | | | 191 | | | | March 2021 | | | | 5,548,359 | | | | 201,306 | |
TOPIX Index Futures | | | 19 | | | | March 2021 | | | | 3,342,980 | | | | (14,435 | ) |
U.S. 10 Yr Ultra Futures | | | 5 | | | | June 2021 | | | | 736,719 | | | | 6,977 | |
U.S. T-Note 2 Yr (CBT) Futures | | | 129 | | | | June 2021 | | | | 28,478,766 | | | | 20,154 | |
U.S. T-Note 5 Yr (CBT) Futures | | | 37 | | | | June 2021 | | | | 4,586,844 | | | | 33,648 | |
U.S. T-Note 10 Yr (CBT) Futures | | | 239 | | | | June 2021 | | | | 31,719,781 | | | | 399,272 | |
U.S. Ultra Bond (CBT) Futures | | | 82 | | | | June 2021 | | | | 15,503,125 | | | | (61,215 | ) |
| | | | | | | | | | | | | | | | |
| | | | | | | | | | | | | | $ | 1,004,719 | |
| | | | | | | | | | | | | | | | |
FORWARD CURRENCY EXCHANGE CONTRACTS (see Note D)
| | | | | | | | | | | | | | | | | | | | |
| Counterparty | | Contracts to
Deliver
(000) | | | In Exchange
For
(000) | | | Settlement
Date | | | Unrealized
Appreciation/
(Depreciation) | |
Australia and New Zealand Banking Group Ltd. | | EUR | | | 816 | | | USD | | | 983 | | | | 03/17/2021 | | | $ | (2,678 | ) |
Australia and New Zealand Banking Group Ltd. | | CNY | | | 9,613 | | | USD | | | 1,477 | | | | 04/22/2021 | | | | 1,085 | |
Australia and New Zealand Banking Group Ltd. | | HKD | | | 139,445 | | | USD | | | 17,986 | | | | 08/13/2021 | | | | 4,956 | |
Bank of America, NA | | RUB | | | 49,600 | | | USD | | | 670 | | | | 03/24/2021 | | | | 6,899 | |
Bank of America, NA | | USD | | | 792 | | | RUB | | | 60,268 | | | | 03/24/2021 | | | | 13,125 | |
Bank of America, NA | | USD | | | 448 | | | RUB | | | 33,189 | | | | 03/24/2021 | | | | (4,250 | ) |
Bank of America, NA | | ILS | | | 6,558 | | | USD | | | 2,007 | | | | 03/25/2021 | | | | 25,277 | |
Bank of America, NA | | USD | | | 1,348 | | | NOK | | | 11,391 | | | | 04/15/2021 | | | | (34,310 | ) |
Bank of America, NA | | USD | | | 1,306 | | | SEK | | | 10,885 | | | | 04/15/2021 | | | | (16,609 | ) |
Barclays Bank PLC | | AUD | | | 2,422 | | | USD | | | 1,935 | | | | 03/17/2021 | | | | 71,702 | |
Barclays Bank PLC | | CHF | | | 1,495 | | | USD | | | 1,678 | | | | 03/17/2021 | | | | 34,206 | |
Barclays Bank PLC | | GBP | | | 1,489 | | | USD | | | 2,108 | | | | 03/17/2021 | | | | 32,923 | |
Barclays Bank PLC | | GBP | | | 3,456 | | | USD | | | 4,787 | | | | 03/17/2021 | | | | (27,908 | ) |
Barclays Bank PLC | | NZD | | | 6,128 | | | USD | | | 4,551 | | | | 03/17/2021 | | | | 123,534 | |
Barclays Bank PLC | | SEK | | | 36,173 | | | USD | | | 4,397 | | | | 03/17/2021 | | | | 112,660 | |
Barclays Bank PLC | | USD | | | 1,213 | | | CAD | | | 1,540 | | | | 03/17/2021 | | | | (2,931 | ) |
Barclays Bank PLC | | USD | | | 2,083 | | | CHF | | | 1,886 | | | | 03/17/2021 | | | | (8,996 | ) |
Barclays Bank PLC | | USD | | | 1,469 | | | EUR | | | 1,211 | | | | 03/17/2021 | | | | (7,418 | ) |
Barclays Bank PLC | | USD | | | 1,568 | | | JPY | | | 166,391 | | | | 03/17/2021 | | | | (6,806 | ) |
Barclays Bank PLC | | USD | | | 8,750 | | | NOK | | | 72,990 | | | | 03/17/2021 | | | | (331,782 | ) |
Barclays Bank PLC | | COP | | | 28,167,566 | | | USD | | | 8,094 | | | | 03/18/2021 | | | | 374,192 | |
Barclays Bank PLC | | CZK | | | 120,377 | | | USD | | | 5,617 | | | | 03/24/2021 | | | | 66,576 | |
Barclays Bank PLC | | HUF | | | 852,429 | | | USD | | | 2,890 | | | | 03/24/2021 | | | | 53,592 | |
Barclays Bank PLC | | RUB | | | 169,437 | | | USD | | | 2,288 | | | | 03/24/2021 | | | | 23,105 | |
Barclays Bank PLC | | MYR | | | 18,566 | | | USD | | | 4,565 | | | | 03/25/2021 | | | | 5,441 | |
Barclays Bank PLC | | MYR | | | 9,252 | | | USD | | | 2,223 | | | | 03/25/2021 | | | | (49,172 | ) |
Barclays Bank PLC | | USD | | | 7,457 | | | MYR | | | 30,780 | | | | 03/25/2021 | | | | 102,447 | |
Barclays Bank PLC | | USD | | | 4,392 | | | MYR | | | 17,738 | | | | 03/25/2021 | | | | (35,945 | ) |
Barclays Bank PLC | | KRW | | | 3,086,886 | | | USD | | | 2,766 | | | | 04/22/2021 | | | | 26,863 | |
Barclays Bank PLC | | USD | | | 2,421 | | | KRW | | | 2,645,248 | | | | 04/22/2021 | | | | (73,901 | ) |
Barclays Bank PLC | | TWD | | | 35,095 | | | USD | | | 1,264 | | | | 04/27/2021 | | | | (2,788 | ) |
BNP Paribas SA | | BRL | | | 15,251 | | | USD | | | 2,793 | | | | 03/02/2021 | | | | 71,714 | |
BNP Paribas SA | | USD | | | 2,794 | | | BRL | | | 15,251 | | | | 03/02/2021 | | | | (72,878 | ) |
| | |
| |
72 | AB ALL MARKET TOTAL RETURN PORTFOLIO | | abfunds.com |
CONSOLIDATED PORTFOLIO OF INVESTMENTS (continued)
| | | | | | | | | | | | | | | | | | | | |
| Counterparty | | Contracts to
Deliver
(000) | | | In Exchange
For
(000) | | | Settlement
Date | | | Unrealized
Appreciation/
(Depreciation) | |
BNP Paribas SA | | EUR | | | 5,751 | | | USD | | | 7,030 | | | | 03/17/2021 | | | $ | 88,941 | |
BNP Paribas SA | | USD | | | 5,562 | | | CAD | | | 7,052 | | | | 03/17/2021 | | | | (20,032 | ) |
BNP Paribas SA | | USD | | | 2,621 | | | EUR | | | 2,145 | | | | 03/17/2021 | | | | (31,992 | ) |
BNP Paribas SA | | COP | | | 1,719,240 | | | USD | | | 500 | | | | 03/18/2021 | | | | 28,983 | |
BNP Paribas SA | | USD | | | 1,023 | | | CNY | | | 6,626 | | | | 04/22/2021 | | | | (5,644 | ) |
Citibank, NA | | BRL | | | 10,886 | | | USD | | | 2,012 | | | | 03/02/2021 | | | | 69,726 | |
Citibank, NA | | USD | | | 1,968 | | | BRL | | | 10,886 | | | | 03/02/2021 | | | | (25,992 | ) |
Citibank, NA | | AUD | | | 3,929 | | | USD | | | 3,044 | | | | 03/17/2021 | | | | 20,573 | |
Citibank, NA | | EUR | | | 556 | | | USD | | | 674 | | | | 03/17/2021 | | | | 1,900 | |
Citibank, NA | | USD | | | 454 | | | EUR | | | 371 | | | | 03/17/2021 | | | | (6,407 | ) |
Citibank, NA | | USD | | | 3,595 | | | JPY | | | 380,173 | | | | 03/17/2021 | | | | (27,693 | ) |
Citibank, NA | | CLP | | | 975,169 | | | USD | | | 1,328 | | | | 03/18/2021 | | | | (19,233 | ) |
Citibank, NA | | PEN | | | 5,811 | | | USD | | | 1,597 | | | | 03/18/2021 | | | | 4,530 | |
Citibank, NA | | USD | | | 1,323 | | | CLP | | | 975,287 | | | | 03/18/2021 | | | | 24,911 | |
Citibank, NA | | USD | | | 469 | | | CLP | | | 332,212 | | | | 03/18/2021 | | | | (10,228 | ) |
Citibank, NA | | USD | | | 1,694 | | | COP | | | 5,983,140 | | | | 03/18/2021 | | | | (54,675 | ) |
Citibank, NA | | USD | | | 657 | | | CZK | | | 14,143 | | | | 03/24/2021 | | | | (4,440 | ) |
Citibank, NA | | USD | | | 660 | | | PLN | | | 2,456 | | | | 03/24/2021 | | | | (4,035 | ) |
Citibank, NA | | ILS | | | 8,885 | | | USD | | | 2,734 | | | | 03/25/2021 | | | | 48,891 | |
Citibank, NA | | USD | | | 1,494 | | | TRY | | | 10,803 | | | | 03/26/2021 | | | | (55,602 | ) |
Citibank, NA | | USD | | | 670 | | | ZAR | | | 10,056 | | | | 04/08/2021 | | | | (8,255 | ) |
Citibank, NA | | TWD | | | 75,350 | | | USD | | | 2,736 | | | | 04/27/2021 | | | | 15,745 | |
Credit Suisse International | | AUD | | | 2,789 | | | USD | | | 2,156 | | | | 03/17/2021 | | | | 10,365 | |
Credit Suisse International | | CAD | | | 902 | | | USD | | | 709 | | | | 03/17/2021 | | | | (316 | ) |
Credit Suisse International | | CHF | | | 2,778 | | | USD | | | 3,098 | | | | 03/17/2021 | | | | 42,757 | |
Credit Suisse International | | EUR | | | 1,211 | | | USD | | | 1,470 | | | | 03/17/2021 | | | | 8,428 | |
Credit Suisse International | | NZD | | | 1,405 | | | USD | | | 1,007 | | | | 03/17/2021 | | | | (8,469 | ) |
Credit Suisse International | | USD | | | 693 | | | CAD | | | 879 | | | | 03/17/2021 | | | | (2,252 | ) |
Credit Suisse International | | USD | | | 2,398 | | | GBP | | | 1,731 | | | | 03/17/2021 | | | | 14,219 | |
Credit Suisse International | | USD | | | 4,662 | | | SEK | | | 38,703 | | | | 03/17/2021 | | | | (77,871 | ) |
Credit Suisse International | | HUF | | | 183,979 | | | USD | | | 623 | | | | 03/24/2021 | | | | 11,067 | |
Credit Suisse International | | TRY | | | 11,070 | | | USD | | | 1,529 | | | | 03/26/2021 | | | | 54,609 | |
Credit Suisse International | | USD | | | 726 | | | TRY | | | 5,426 | | | | 03/26/2021 | | | | (3,651 | ) |
Credit Suisse International | | IDR | | | 146,346 | | | USD | | | 10 | | | | 04/15/2021 | | | | 359 | |
Credit Suisse International | | PHP | | | 31,279 | | | USD | | | 649 | | | | 04/22/2021 | | | | 12,796 | |
Credit Suisse International | | USD | | | 702 | | | PHP | | | 33,870 | | | | 04/22/2021 | | | | (13,856 | ) |
Deutsche Bank AG | | NZD | | | 1,850 | | | USD | | | 1,324 | | | | 03/05/2021 | | | | (12,418 | ) |
Deutsche Bank AG | | USD | | | 1,225 | | | CAD | | | 1,555 | | | | 03/17/2021 | | | | (3,340 | ) |
Deutsche Bank AG | | CLP | | | 4,563,081 | | | USD | | | 6,405 | | | | 03/18/2021 | | | | 99,046 | |
Deutsche Bank AG | | CLP | | | 2,021,132 | | | USD | | | 2,775 | | | | 03/18/2021 | | | | (17,435 | ) |
Deutsche Bank AG | | PEN | | | 6,094 | | | USD | | | 1,671 | | | | 03/18/2021 | | | | 939 | |
Deutsche Bank AG | | USD | | | 1,912 | | | CLP | | | 1,362,512 | | | | 03/18/2021 | | | | (29,575 | ) |
Deutsche Bank AG | | USD | | | 1,137 | | | COP | | | 4,054,101 | | | | 03/18/2021 | | | | (25,778 | ) |
Deutsche Bank AG | | USD | | | 1,767 | | | PEN | | | 6,390 | | | | 03/18/2021 | | | | (15,885 | ) |
Deutsche Bank AG | | USD | | | 1,785 | | | CZK | | | 38,026 | | | | 03/24/2021 | | | | (31,759 | ) |
Deutsche Bank AG | | ILS | | | 4,335 | | | USD | | | 1,313 | | | | 03/25/2021 | | | | 2,755 | |
Deutsche Bank AG | | USD | | | 548 | | | IDR | | | 7,762,190 | | | | 04/15/2021 | | | | (11,754 | ) |
Deutsche Bank AG | | USD | | | 5,966 | | | INR | | | 442,746 | | | | 04/15/2021 | | | | (16,076 | ) |
Deutsche Bank AG | | KRW | | | 517,753 | | | USD | | | 466 | | | | 04/22/2021 | | | | 6,713 | |
Deutsche Bank AG | | PHP | | | 68,261 | | | USD | | | 1,416 | | | | 04/22/2021 | | | | 28,219 | |
Goldman Sachs Bank USA | | BRL | | | 6,735 | | | USD | | | 1,235 | | | | 03/02/2021 | | | | 33,222 | |
Goldman Sachs Bank USA | | USD | | | 1,225 | | | BRL | | | 6,735 | | | | 03/02/2021 | | | | (22,803 | ) |
| | |
| |
| abfunds.com | | AB ALL MARKET TOTAL RETURN PORTFOLIO | 73 |
CONSOLIDATED PORTFOLIO OF INVESTMENTS (continued)
| | | | | | | | | | | | | | | | | | | | |
| Counterparty | | Contracts to
Deliver
(000) | | | In Exchange
For
(000) | | | Settlement
Date | | | Unrealized
Appreciation/
(Depreciation) | |
Goldman Sachs Bank USA | | EUR | | | 3,101 | | | USD | | | 3,749 | | | | 03/15/2021 | | | $ | 7,161 | |
Goldman Sachs Bank USA | | USD | | | 663 | | | EUR | | | 539 | | | | 03/17/2021 | | | | (13,263 | ) |
Goldman Sachs Bank USA | | USD | | | 1,705 | | | JPY | | | 180,801 | | | | 03/17/2021 | | | | (8,381 | ) |
Goldman Sachs Bank USA | | PEN | | | 26,413 | | | USD | | | 7,302 | | | | 03/18/2021 | | | | 63,135 | |
Goldman Sachs Bank USA | | USD | | | 1,954 | | | PEN | | | 7,070 | | | | 03/18/2021 | | | | (16,899 | ) |
Goldman Sachs Bank USA | | RUB | | | 183,508 | | | USD | | | 2,474 | | | | 03/24/2021 | | | | 21,120 | |
Goldman Sachs Bank USA | | USD | | | 988 | | | RUB | | | 75,114 | | | | 03/24/2021 | | | | 16,042 | |
Goldman Sachs Bank USA | | USD | | | 800 | | | RUB | | | 59,348 | | | | 03/24/2021 | | | | (6,798 | ) |
Goldman Sachs Bank USA | | MYR | | | 11,147 | | | USD | | | 2,756 | | | | 03/25/2021 | | | | 18,864 | |
Goldman Sachs Bank USA | | USD | | | 1,795 | | | MYR | | | 7,318 | | | | 03/25/2021 | | | | 2,483 | |
Goldman Sachs Bank USA | | AUD | | | 1,293 | | | USD | | | 986 | | | | 03/30/2021 | | | | (9,075 | ) |
Goldman Sachs Bank USA | | USD | | | 320 | | | BRL | | | 1,741 | | | | 04/05/2021 | | | | (9,546 | ) |
Goldman Sachs Bank USA | | ZAR | | | 22,427 | | | USD | | | 1,513 | | | | 04/08/2021 | | | | 38,112 | |
Goldman Sachs Bank USA | | NOK | | | 11,386 | | | USD | | | 1,337 | | | | 04/15/2021 | | | | 24,007 | |
Goldman Sachs Bank USA | | USD | | | 2,441 | | | IDR | | | 34,558,508 | | | | 04/15/2021 | | | | (55,424 | ) |
Goldman Sachs Bank USA | | USD | | | 665 | | | MXN | | | 13,646 | | | | 04/16/2021 | | | | (16,190 | ) |
Goldman Sachs Bank USA | | EUR | | | 797 | | | TRY | | | 7,421 | | | | 04/19/2021 | | | | 14,559 | |
Goldman Sachs Bank USA | | TRY | | | 7,421 | | | USD | | | 999 | | | | 04/19/2021 | | | | 21,522 | |
Goldman Sachs Bank USA | | CNY | | | 5,297 | | | USD | | | 817 | | | | 04/22/2021 | | | | 4,162 | |
Goldman Sachs Bank USA | | KRW | | | 799,970 | | | USD | | | 729 | | | | 04/22/2021 | | | | 19,049 | |
Goldman Sachs Bank USA | | PHP | | | 31,279 | | | USD | | | 648 | | | | 04/22/2021 | | | | 12,662 | |
Goldman Sachs Bank USA | | USD | | | 539 | | | CAD | | | 679 | | | | 04/22/2021 | | | | (5,276 | ) |
Goldman Sachs Bank USA | | USD | | | 1,271 | | | CNY | | | 8,255 | | | | 04/22/2021 | | | | (3,744 | ) |
Goldman Sachs Bank USA | | USD | | | 663 | | | KRW | | | 720,452 | | | | 04/22/2021 | | | | (23,748 | ) |
Goldman Sachs Bank USA | | USD | | | 702 | | | PHP | | | 33,870 | | | | 04/22/2021 | | | | (13,710 | ) |
Goldman Sachs Bank USA | | CHF | | | 2,626 | | | USD | | | 2,962 | | | | 05/06/2021 | | | | 70,189 | |
Goldman Sachs Bank USA | | TWD | | | 54,461 | | | USD | | | 1,989 | | | | 07/07/2021 | | | | 3,186 | |
HSBC Bank USA | | USD | | | 670 | | | SGD | | | 887 | | | | 03/11/2021 | | | | (4,952 | ) |
HSBC Bank USA | | TRY | | | 7,607 | | | USD | | | 1,061 | | | | 03/26/2021 | | | | 47,967 | |
HSBC Bank USA | | GBP | | | 481 | | | USD | | | 657 | | | | 04/09/2021 | | | | (13,898 | ) |
HSBC Bank USA | | USD | | | 226 | | | IDR | | | 3,166,940 | | | | 04/15/2021 | | | | (7,571 | ) |
HSBC Bank USA | | USD | | | 2,439 | | | CNY | | | 15,831 | | | | 04/22/2021 | | | | (8,604 | ) |
HSBC Bank USA | | CHF | | | 1,473 | | | USD | | | 1,643 | | | | 05/06/2021 | | | | 21,394 | |
JPMorgan Chase Bank, NA | | BRL | | | 6,110 | | | USD | | | 1,137 | | | | 03/02/2021 | | | | 46,340 | |
JPMorgan Chase Bank, NA | | USD | | | 1,105 | | | BRL | | | 6,110 | | | | 03/02/2021 | | | | (14,588 | ) |
JPMorgan Chase Bank, NA | | USD | | | 3,631 | | | EUR | | | 2,965 | | | | 03/17/2021 | | | | (53,730 | ) |
JPMorgan Chase Bank, NA | | PLN | | | 4,897 | | | EUR | | | 1,078 | | | | 03/24/2021 | | | | (5,654 | ) |
JPMorgan Chase Bank, NA | | PLN | | | 15,699 | | | USD | | | 4,219 | | | | 03/24/2021 | | | | 29,394 | |
JPMorgan Chase Bank, NA | | AUD | | | 1,406 | | | USD | | | 1,077 | | | | 03/30/2021 | | | | (5,128 | ) |
JPMorgan Chase Bank, NA | | USD | | | 2,497 | | | BRL | | | 13,567 | | | | 04/05/2021 | | | | (79,431 | ) |
JPMorgan Chase Bank, NA | | ZAR | | | 6,504 | | | USD | | | 427 | | | | 04/08/2021 | | | | (457 | ) |
JPMorgan Chase Bank, NA | | USD | | | 671 | | | EUR | | | 548 | | | | 04/09/2021 | | | | (8,547 | ) |
JPMorgan Chase Bank, NA | | USD | | | 1,995 | | | GBP | | | 1,411 | | | | 04/09/2021 | | | | (28,264 | ) |
JPMorgan Chase Bank, NA | | USD | | | 667 | | | NOK | | | 5,602 | | | | 04/15/2021 | | | | (20,999 | ) |
JPMorgan Chase Bank, NA | | CNY | | | 12,844 | | | USD | | | 1,980 | | | | 04/22/2021 | | | | 8,199 | |
Morgan Stanley Capital Services, Inc. | | BRL | | | 387 | | | USD | | | 73 | | | | 03/02/2021 | | | | 4,012 | |
Morgan Stanley Capital Services, Inc. | | USD | | | 70 | | | BRL | | | 387 | | | | 03/02/2021 | | | | (924 | ) |
Morgan Stanley Capital Services, Inc. | | USD | | | 673 | | | NZD | | | 930 | | | | 03/05/2021 | | | | (577 | ) |
| | |
| |
74 | AB ALL MARKET TOTAL RETURN PORTFOLIO | | abfunds.com |
CONSOLIDATED PORTFOLIO OF INVESTMENTS (continued)
| | | | | | | | | | | | | | | | | | | | |
| Counterparty | | Contracts to
Deliver
(000) | | | In Exchange
For
(000) | | | Settlement
Date | | | Unrealized
Appreciation/
(Depreciation) | |
Morgan Stanley Capital Services, Inc. | | EUR | | | 5,094 | | | USD | | | 6,219 | | | | 03/17/2021 | | | $ | 71,442 | |
Morgan Stanley Capital Services, Inc. | | EUR | | | 1,557 | | | USD | | | 1,873 | | | | 03/17/2021 | | | | (6,235 | ) |
Morgan Stanley Capital Services, Inc. | | USD | | | 3,914 | | | PLN | | | 14,415 | | | | 03/24/2021 | | | | (66,450 | ) |
Morgan Stanley Capital Services, Inc. | | USD | | | 805 | | | ILS | | | 2,622 | | | | 03/25/2021 | | | | (12,154 | ) |
Morgan Stanley Capital Services, Inc. | | USD | | | 2,413 | | | MYR | | | 9,775 | | | | 03/25/2021 | | | | (12,068 | ) |
Morgan Stanley Capital Services, Inc. | | AUD | | | 1,717 | | | USD | | | 1,326 | | | | 03/30/2021 | | | | 5,313 | |
Morgan Stanley Capital Services, Inc. | | GBP | | | 2,430 | | | USD | | | 3,310 | | | | 04/09/2021 | | | | (75,812 | ) |
Morgan Stanley Capital Services, Inc. | | USD | | | 978 | | | GBP | | | 717 | | | | 04/09/2021 | | | | 20,575 | |
Morgan Stanley Capital Services, Inc. | | SEK | | | 5,327 | | | USD | | | 638 | | | | 04/15/2021 | | | | 6,778 | |
Morgan Stanley Capital Services, Inc. | | SEK | | | 5,559 | | | USD | | | 657 | | | | 04/15/2021 | | | | (1,331 | ) |
Morgan Stanley Capital Services, Inc. | | MXN | | | 21,566 | | | USD | | | 1,049 | | | | 04/16/2021 | | | | 23,130 | |
Morgan Stanley Capital Services, Inc. | | USD | | | 669 | | | KRW | | | 737,582 | | | | 04/22/2021 | | | | (14,211 | ) |
Morgan Stanley Capital Services, Inc. | | CHF | | | 902 | | | USD | | | 1,004 | | | | 05/06/2021 | | | | 10,127 | |
Morgan Stanley Capital Services, Inc. | | USD | | | 1,167 | | | JPY | | | 123,482 | | | | 05/20/2021 | | | | (7,262 | ) |
Natwest Markets PLC | | BRL | | | 2,522 | | | USD | | | 456 | | | | 03/02/2021 | | | | 6,021 | |
Natwest Markets PLC | | USD | | | 470 | | | BRL | | | 2,522 | | | | 03/02/2021 | | | | (19,560 | ) |
Natwest Markets PLC | | USD | | | 997 | | | NZD | | | 1,386 | | | | 03/05/2021 | | | | 4,205 | |
Natwest Markets PLC | | USD | | | 2,676 | | | EUR | | | 2,225 | | | | 03/17/2021 | | | | 9,110 | |
Natwest Markets PLC | | CLP | | | 1,362,512 | | | USD | | | 1,841 | | | | 03/18/2021 | | | | (42,166 | ) |
Natwest Markets PLC | | COP | | | 5,983,139 | | | USD | | | 1,687 | | | | 03/18/2021 | | | | 47,507 | |
Natwest Markets PLC | | USD | | | 1,691 | | | CLP | | | 1,221,597 | | | | 03/18/2021 | | | | (2,738 | ) |
Natwest Markets PLC | | USD | | | 967 | | | COP | | | 3,361,868 | | | | 03/18/2021 | | | | (45,230 | ) |
Natwest Markets PLC | | USD | | | 2,037 | | | RUB | | | 150,621 | | | | 03/24/2021 | | | | (23,978 | ) |
Natwest Markets PLC | | MYR | | | 3,451 | | | USD | | | 848 | | | | 03/25/2021 | | | | 389 | |
Natwest Markets PLC | | USD | | | 1,335 | | | MYR | | | 5,396 | | | | 03/25/2021 | | | | (10,121 | ) |
Natwest Markets PLC | | USD | | | 673 | | | ZAR | | | 9,858 | | | | 04/08/2021 | | | | (24,676 | ) |
Natwest Markets PLC | | USD | | | 1,674 | | | GBP | | | 1,220 | | | | 04/09/2021 | | | | 25,222 | |
Natwest Markets PLC | | USD | | | 1,166 | | | TWD | | | 32,090 | | | | 04/27/2021 | | | | (7,557 | ) |
Standard Chartered Bank | | NZD | | | 1,403 | | | AUD | | | 1,300 | | | | 03/05/2021 | | | | (13,583 | ) |
Standard Chartered Bank | | USD | | | 1,998 | | | NZD | | | 2,781 | | | | 03/05/2021 | | | | 11,860 | |
Standard Chartered Bank | | COP | | | 4,076,487 | | | USD | | | 1,155 | | | | 03/18/2021 | | | | 38,233 | |
Standard Chartered Bank | | PEN | | | 8,868 | | | USD | | | 2,455 | | | | 03/18/2021 | | | | 24,455 | |
Standard Chartered Bank | | USD | | | 2,576 | | | CLP | | | 1,818,351 | | | | 03/18/2021 | | | | (62,894 | ) |
Standard Chartered Bank | | USD | | | 3,105 | | | COP | | | 10,830,467 | | | | 03/18/2021 | | | | (136,687 | ) |
Standard Chartered Bank | | USD | | | 1,403 | | | PEN | | | 5,118 | | | | 03/18/2021 | | | | (327 | ) |
Standard Chartered Bank | | EUR | | | 1,633 | | | USD | | | 2,002 | | | | 03/24/2021 | | | | 31,599 | |
Standard Chartered Bank | | USD | | | 705 | | | TRY | | | 5,396 | | | | 03/26/2021 | | | | 13,489 | |
Standard Chartered Bank | | CHF | | | 1,180 | | | GBP | | | 978 | | | | 04/09/2021 | | | | 63,809 | |
| | |
| |
| abfunds.com | | AB ALL MARKET TOTAL RETURN PORTFOLIO | 75 |
CONSOLIDATED PORTFOLIO OF INVESTMENTS (continued)
| | | | | | | | | | | | | | | | | | | | |
| Counterparty | | Contracts to
Deliver
(000) | | | In Exchange
For
(000) | | | Settlement
Date | | | Unrealized
Appreciation/
(Depreciation) | |
Standard Chartered Bank | | EUR | | | 548 | | | GBP | | | 489 | | | | 04/09/2021 | | | $ | 19,429 | |
Standard Chartered Bank | | USD | | | 676 | | | CHF | | | 601 | | | | 04/09/2021 | | | | (15,005 | ) |
Standard Chartered Bank | | IDR | | | 22,482,143 | | | USD | | | 1,596 | | | | 04/15/2021 | | | | 44,373 | |
Standard Chartered Bank | | CNY | | | 11,580 | | | USD | | | 1,793 | | | | 04/22/2021 | | | | 15,633 | |
Standard Chartered Bank | | KRW | | | 745,143 | | | USD | | | 665 | | | | 04/22/2021 | | | | 3,757 | |
Standard Chartered Bank | | PHP | | | 226,326 | | | USD | | | 4,656 | | | | 04/22/2021 | | | | 55,698 | |
Standard Chartered Bank | | USD | | | 6,914 | | | CNY | | | 44,923 | | | | 04/22/2021 | | | | (17,667 | ) |
Standard Chartered Bank | | USD | | | 668 | | | KRW | | | 735,101 | | | | 04/22/2021 | | | | (15,830 | ) |
Standard Chartered Bank | | TWD | | | 130,547 | | | USD | | | 4,718 | | | | 04/27/2021 | | | | 4,746 | |
Standard Chartered Bank | | CHF | | | 2,038 | | | USD | | | 2,277 | | | | 05/06/2021 | | | | 32,177 | |
Standard Chartered Bank | | USD | | | 1,967 | | | TWD | | | 54,461 | | | | 07/07/2021 | | | | 19,446 | |
State Street Bank & Trust Co. | | BRL | | | 427 | | | USD | | | 79 | | | | 03/02/2021 | | | | 3,041 | |
State Street Bank & Trust Co. | | USD | | | 474 | | | NZD | | | 649 | | | | 03/05/2021 | | | | (5,164 | ) |
State Street Bank & Trust Co. | | THB | | | 66,179 | | | USD | | | 2,205 | | | | 03/11/2021 | | | | 9,431 | |
State Street Bank & Trust Co. | | USD | | | 1,980 | | | SGD | | | 2,612 | | | | 03/11/2021 | | | | (21,892 | ) |
State Street Bank & Trust Co. | | USD | | | 5,325 | | | THB | | | 159,558 | | | | 03/11/2021 | | | | (30,536 | ) |
State Street Bank & Trust Co. | | CAD | | | 895 | | | USD | | | 706 | | | | 03/15/2021 | | | | 2,731 | |
State Street Bank & Trust Co. | | CAD | | | 3,222 | | | USD | | | 2,504 | | | | 03/15/2021 | | | | (27,434 | ) |
State Street Bank & Trust Co. | | EUR | | | 391 | | | USD | | | 478 | | | | 03/15/2021 | | | | 5,634 | |
State Street Bank & Trust Co. | | EUR | | | 442 | | | USD | | | 523 | | | | 03/15/2021 | | | | (10,120 | ) |
State Street Bank & Trust Co. | | USD | | | 3,242 | | | CAD | | | 4,116 | | | | 03/15/2021 | | | | (7,525 | ) |
State Street Bank & Trust Co. | | USD | | | 2,959 | | | EUR | | | 2,434 | | | | 03/15/2021 | | | | (24,013 | ) |
State Street Bank & Trust Co. | | EUR | | | 400 | | | USD | | | 486 | | | | 03/17/2021 | | | | 2,420 | |
State Street Bank & Trust Co. | | GBP | | | 346 | | | USD | | | 480 | | | | 03/17/2021 | | | | (1,472 | ) |
State Street Bank & Trust Co. | | NOK | | | 3,818 | | | USD | | | 452 | | | | 03/17/2021 | | | | 12,006 | |
State Street Bank & Trust Co. | | NZD | | | 675 | | | USD | | | 488 | | | | 03/17/2021 | | | | 18 | |
State Street Bank & Trust Co. | | USD | | | 724 | | | EUR | | | 601 | | | | 03/17/2021 | | | | 482 | |
State Street Bank & Trust Co. | | USD | | | 4,988 | | | EUR | | | 4,098 | | | | 03/17/2021 | | | | (41,748 | ) |
State Street Bank & Trust Co. | | USD | | | 408 | | | JPY | | | 43,217 | | | | 03/17/2021 | | | | (2,539 | ) |
State Street Bank & Trust Co. | | USD | | | 448 | | | NOK | | | 3,818 | | | | 03/17/2021 | | | | (7,894 | ) |
State Street Bank & Trust Co. | | PLN | | | 8,363 | | | USD | | | 2,265 | | | | 03/24/2021 | | | | 32,847 | |
State Street Bank & Trust Co. | | USD | | | 673 | | | EUR | | | 555 | | | | 03/24/2021 | | | | (3,637 | ) |
State Street Bank & Trust Co. | | USD | | | 329 | | | TRY | | | 2,478 | | | | 03/26/2021 | | | | 585 | |
State Street Bank & Trust Co. | | USD | | | 2,082 | | | AUD | | | 2,682 | | | | 03/30/2021 | | | | (18,081 | ) |
State Street Bank & Trust Co. | | USD | | | 1,162 | | | ZAR | | | 17,236 | | | | 04/08/2021 | | | | (27,913 | ) |
State Street Bank & Trust Co. | | GBP | | | 105 | | | USD | | | 143 | | | | 04/09/2021 | | | | (3,250 | ) |
State Street Bank & Trust Co. | | USD | | | 498 | | | GBP | | | 364 | | | | 04/09/2021 | | | | 8,903 | |
State Street Bank & Trust Co. | | USD | | | 402 | | | GBP | | | 287 | | | | 04/09/2021 | | | | (2,349 | ) |
State Street Bank & Trust Co. | | MXN | | | 6,139 | | | USD | | | 297 | | | | 04/16/2021 | | | | 4,755 | |
State Street Bank & Trust Co. | | MXN | | | 11,175 | | | USD | | | 531 | | | | 04/16/2021 | | | | (475 | ) |
State Street Bank & Trust Co. | | EUR | | | 416 | | | USD | | | 505 | | | | 04/19/2021 | | | | 3,079 | |
State Street Bank & Trust Co. | | CAD | | | 211 | | | USD | | | 166 | | | | 04/22/2021 | | | | 465 | |
State Street Bank & Trust Co. | | USD | | | 1,981 | | | CAD | | | 2,512 | | | | 04/22/2021 | | | | (6,817 | ) |
State Street Bank & Trust Co. | | USD | | | 282 | | | CHF | | | 250 | | | | 05/06/2021 | | | | (6,555 | ) |
State Street Bank & Trust Co. | | JPY | | | 661,966 | | | USD | | | 6,250 | | | | 05/20/2021 | | | | 34,025 | |
State Street Bank & Trust Co. | | USD | | | 1,730 | | | JPY | | | 183,222 | | | | 05/20/2021 | | | | (9,418 | ) |
State Street Bank & Trust Co. | | CAD | | | 618 | | | USD | | | 481 | | | | 06/16/2021 | | | | (4,769 | ) |
State Street Bank & Trust Co. | | EUR | | | 1,740 | | | USD | | | 2,114 | | | | 06/16/2021 | | | | 12,247 | |
State Street Bank & Trust Co. | | USD | | | 490 | | | CAD | | | 618 | | | | 06/16/2021 | | | | (4,199 | ) |
UBS AG | | BRL | | | 16,628 | | | USD | | | 3,007 | | | | 03/02/2021 | | | | 39,703 | |
UBS AG | | USD | | | 3,059 | | | BRL | | | 16,628 | | | | 03/02/2021 | | | | (92,370 | ) |
UBS AG | | USD | | | 656 | | | NZD | | | 920 | | | | 03/05/2021 | | | | 8,863 | |
| | |
| |
76 | AB ALL MARKET TOTAL RETURN PORTFOLIO | | abfunds.com |
CONSOLIDATED PORTFOLIO OF INVESTMENTS (continued)
| | | | | | | | | | | | | | | | | | | | | | | | |
| Counterparty | | Contracts to
Deliver
(000) | | | In Exchange
For
(000) | | | Settlement
Date | | | Unrealized
Appreciation/
(Depreciation) | |
UBS AG | | | CHF | | | | 7,250 | | | | USD | | | | 8,126 | | | | 03/17/2021 | | | $ | 152,472 | |
UBS AG | | | EUR | | | | 3,091 | | | | USD | | | | 3,776 | | | | 03/17/2021 | | | | 45,119 | |
UBS AG | | | USD | | | | 7,489 | | | | SEK | | | | 62,045 | | | | 03/17/2021 | | | | (139,391 | ) |
UBS AG | | | RUB | | | | 352,461 | | | | USD | | | | 4,751 | | | | 03/24/2021 | | | | 40,035 | |
UBS AG | | | USD | | | | 638 | | | | CZK | | | | 13,766 | | | | 03/24/2021 | | | | (3,419 | ) |
UBS AG | | | USD | | | | 3,641 | | | | RUB | | | | 276,593 | | | | 03/24/2021 | | | | 55,836 | |
UBS AG | | | USD | | | | 6,101 | | | | RUB | | | | 453,611 | | | | 03/24/2021 | | | | (38,824 | ) |
UBS AG | | | USD | | | | 3,990 | | | | TRY | | | | 30,622 | | | | 03/26/2021 | | | | 88,682 | |
UBS AG | | | USD | | | | 4,070 | | | | TRY | | | | 29,198 | | | | 03/26/2021 | | | | (181,686 | ) |
UBS AG | | | USD | | | | 1,348 | | | | AUD | | | | 1,733 | | | | 03/30/2021 | | | | (14,526 | ) |
UBS AG | | | BRL | | | | 16,628 | | | | USD | | | | 3,056 | | | | 04/05/2021 | | | | 92,489 | |
UBS AG | | | USD | | | | 3,978 | | | | MXN | | | | 82,183 | | | | 04/16/2021 | | | | (67,956 | ) |
UBS AG | | | KRW | | | | 1,464,641 | | | | USD | | | | 1,329 | | | | 04/22/2021 | | | | 29,506 | |
UBS AG | | | USD | | | | 2,122 | | | | KRW | | | | 2,357,153 | | | | 04/22/2021 | | | | (30,085 | ) |
| | | | | | | | | | | | | | | | | | | | | | | | |
| | | | | | | | | | | | | | | | | | | | | | $ | 416,632 | |
| | | | | | | | | | | | | | | | | | | | | | | | |
CENTRALLY CLEARED INTEREST RATE SWAPS (see Note D)
| | | | | | | | | | | | | | | | | | | | | | | | | | |
| | | | | | | | | Rate Type | | | | | | | | | | | |
Notional
Amount
(000) | | | Termination
Date | | | Payments
made
by the
Fund | | Payments
received
by the
Fund | | Payment
Frequency
Paid/
Received | | Market
Value | | | Upfront
Premiums
Paid
(Received) | | | Unrealized
Appreciation/
(Depreciation) | |
| BRL | | | 14,500 | | | | 01/02/2023 | | | 1 Day CDI | | 5.245% | | Maturity | | $ | (12,310 | ) | | $ | – 0 | – | | $ | (12,310 | ) |
| GBP | | | 6,100 | | | | 02/05/2023 | | | 6 Month LIBOR | | 0.177% | | Semi-Annual/ Semi-Annual | | | (12,197 | ) | | | (72 | ) | | | (12,125 | ) |
| USD | | | 13,320 | | | | 02/09/2023 | | | 3 Month LIBOR | | 0.200% | | Quarterly/
Semi-Annual | | | (9,699 | ) | | | – 0 | – | | | (9,699 | ) |
| CNY | | | 36,260 | | | | 02/17/2025 | | | China 7-Day Reverse Repo Rate | | 2.547% | | Quarterly/ Quarterly | | | (68,650 | ) | | | – 0 | – | | | (68,650 | ) |
| CNY | | | 107,914 | | | | 02/20/2025 | | | China 7-Day Reverse Repo Rate | | 2.598% | | Quarterly/ Quarterly | | | (163,280 | ) | | | – 0 | – | | | (163,280 | ) |
| CNY | | | 109,516 | | | | 02/21/2025 | | | China 7-Day Reverse Repo Rate | | 2.620% | | Quarterly/ Quarterly | | | (148,385 | ) | | | – 0 | – | | | (148,385 | ) |
| NOK | | | 10,490 | | | | 08/11/2030 | | | 0.825% | | 6 Month NIBOR | | Annual/ Semi-Annual | | | 95,288 | | | | 111,928 | | | | (16,640 | ) |
| NOK | | | 10,490 | | | | 08/11/2030 | | | 6 Month NIBOR | | 0.825% | | Semi-Annual/ Annual | | | (96,092 | ) | | | – 0 | – | | | (96,092 | ) |
| NOK | | | 10,160 | | | | 11/11/2030 | | | 1.031% | | 6 Month NIBOR | | Annual/ Semi-Annual | | | 77,654 | | | | 90,513 | | | | (12,859 | ) |
| NOK | | | 10,160 | | | | 11/11/2030 | | | 6 Month NIBOR | | 1.031% | | Semi-Annual/ Annual | | | (77,566 | ) | | | – 0 | – | | | (77,566 | ) |
| NOK | | | 5,070 | | | | 11/17/2030 | | | 1.053% | | 6 Month NIBOR | | Annual/ Semi-Annual | | | 37,588 | | | | 44,069 | | | | (6,481 | ) |
| | |
| |
| abfunds.com | | AB ALL MARKET TOTAL RETURN PORTFOLIO | 77 |
CONSOLIDATED PORTFOLIO OF INVESTMENTS (continued)
| | | | | | | | | | | | | | | | | | | | | | | | | | |
| | | | | | | | | Rate Type | | | | | | | | | | | |
Notional
Amount
(000) | | | Termination
Date | | | Payments
made
by the
Fund | | Payments
received
by the
Fund | | Payment
Frequency
Paid/
Received | | Market
Value | | | Upfront
Premiums
Paid
(Received) | | | Unrealized
Appreciation/
(Depreciation) | |
| NOK | | | 5,070 | | | | 11/17/2030 | | | 6 Month NIBOR | | 1.053% | | Semi-Annual/ Annual | | $ | (37,538 | ) | | $ | – 0 | – | | $ | (37,538 | ) |
| NOK | | | 6,610 | | | | 11/23/2030 | | | 1.079% | | 6 Month NIBOR | | Annual/ Semi-Annual | | | 47,360 | | | | 55,815 | | | | (8,455 | ) |
| NOK | | | 6,610 | | | | 11/23/2030 | | | 6 Month NIBOR | | 1.079% | | Semi-Annual/ Annual | | | (47,287 | ) | | | – 0 | – | | | (47,287 | ) |
| NZD | | | 6,460 | | | | 11/23/2030 | | | 0.841% | | 3 Month BKBM | | Semi-Annual/ Quarterly | | | 463,171 | | | | 495,243 | | | | (32,072 | ) |
| NZD | | | 6,460 | | | | 11/23/2030 | | | 3 Month BKBM | | 0.841% | | Quarterly/
Semi-Annual | | | (463,237 | ) | | | – 0 | – | | | (463,237 | ) |
| NOK | | | 35,860 | | | | 11/27/2030 | | | 6 Month NIBOR | | 1.111% | | Semi-Annual/ Annual | | | (244,552 | ) | | | – 0 | – | | | (244,552 | ) |
| NOK | | | 14,310 | | | | 11/27/2030 | | | 1.111% | | 6 Month NIBOR | | Annual/ Semi-Annual | | | 97,757 | | | | 111,602 | | | | (13,845 | ) |
| NZD | | | 2,030 | | | | 12/02/2030 | | | 0.876% | | 3 Month BKBM | | Semi-Annual/ Quarterly | | | 142,542 | | | | 151,848 | | | | (9,306 | ) |
| NZD | | | 2,030 | | | | 12/02/2030 | | | 3 Month BKBM | | 0.876% | | Quarterly/
Semi-Annual | | | (142,518 | ) | | | – 0 | – | | | (142,518 | ) |
| NOK | | | 9,310 | | | | 01/04/2031 | | | 6 Month NIBOR | | 1.280% | | Semi-Annual/ Annual | | | (49,223 | ) | | | – 0 | – | | | (49,223 | ) |
| NZD | | | 3,090 | | | | 01/05/2031 | | | 3 Month BKBM | | 0.978% | | Quarterly/
Semi-Annual | | | (201,252 | ) | | | – 0 | – | | | (201,252 | ) |
| NZD | | | 1,310 | | | | 01/05/2031 | | | 0.978% | | 3 Month BKBM | | Semi-Annual/ Quarterly | | | 85,367 | | | | 90,857 | | | | (5,490 | ) |
| NOK | | | 6,040 | | | | 01/11/2031 | | | 6 Month NIBOR | | 1.274% | | Semi-Annual/ Annual | | | (32,493 | ) | | | – 0 | – | | | (32,493 | ) |
| NZD | | | 1,470 | | | | 01/11/2031 | | | 3 Month BKBM | | 1.058% | | Quarterly/
Semi-Annual | | | (88,276 | ) | | | – 0 | – | | | (88,276 | ) |
| NOK | | | 11,330 | | | | 01/18/2031 | | | 6 Month NIBOR | | 1.331% | | Semi-Annual/ Annual | | | (54,825 | ) | | | – 0 | – | | | (54,825 | ) |
| NZD | | | 890 | | | | 01/18/2031 | | | 3 Month BKBM | | 1.080% | | Quarterly/
Semi-Annual | | | (52,470 | ) | | | – 0 | – | | | (52,470 | ) |
| NOK | | | 12,440 | | | | 01/21/2031 | | | 6 Month NIBOR | | 1.348% | | Semi-Annual/ Annual | | | (57,806 | ) | | | – 0 | – | | | (57,806 | ) |
| NZD | | | 2,130 | | | | 01/21/2031 | | | 3 Month BKBM | | 1.075% | | Quarterly/
Semi-Annual | | | (126,438 | ) | | | – 0 | – | | | (126,438 | ) |
| GBP | | | 1,220 | | | | 02/05/2031 | | | 0.701% | | 6 Month LIBOR | | Semi-Annual/ Semi-Annual | | | 47,556 | | | | 86 | | | | 47,470 | |
| USD | | | 2,660 | | | | 02/09/2031 | | | 1.226% | | 6 Month LIBOR | | Semi-Annual/ Quarterly | | | 70,238 | | | | – 0 | – | | | 70,238 | |
| NOK | | | 17,490 | | | | 02/19/2031 | | | 6 Month NIBOR | | 1.634% | | Semi-Annual/ Annual | | | (30,182 | ) | | | – 0 | – | | | (30,182 | ) |
| CHF | | | 5,190 | | | | 02/19/2031 | | | (0.054)% | | 6 Month LIBOR | | Annual/ Semi-Annual | | | 74,748 | | | | – 0 | – | | | 74,748 | |
| NZD | | | 3,150 | | | | 02/19/2031 | | | 3 Month BKBM | | 1.616% | | Quarterly/
Semi-Annual | | | (77,404 | ) | | | – 0 | – | | | (77,404 | ) |
| | | | | | | | | | | | | | | | | | | | | | | | | | |
| | | | | | | | | | | | | $ | (1,054,411 | ) | | $ | 1,151,889 | | | $ | (2,206,300 | ) |
| | | | | | | | | | | | | | | | | | | | | | | | | | |
| | |
| |
78 | AB ALL MARKET TOTAL RETURN PORTFOLIO | | abfunds.com |
CONSOLIDATED PORTFOLIO OF INVESTMENTS (continued)
CENTRALLY CLEARED CREDIT DEFAULT SWAPS (see Note D)
| | | | | | | | | | | | | | | | | | | | | | | | | | | | |
| Description | | Fixed
Rate
(Pay)
Receive | | | Payment
Frequency | | | Implied
Credit
Spread at
February 28,
2021 | | | Notional
Amount
(000) | | | Market
Value | | | Upfront
Premiums
Paid
(Received) | | | Unrealized
Appreciation/
(Depreciation) | |
Buy Contracts | | | | | | | | | | | | | | | | | | | | | | | | | |
CDX-NAHY
Series 29, 5 Year Index, 12/20/2022* | | | (5.00 | )% | | | Quarterly | | | | 1.69 | % | | USD | 4 | | | $ | (302 | ) | | $ | (138 | ) | | $ | (164 | ) |
CDX-NAHY
Series 31, 5 Year Index, 12/20/2023* | | | (5.00 | ) | | | Quarterly | | | | 2.14 | | | USD | 1,128 | | | | (98,779 | ) | | | (58,166 | ) | | | (40,613 | ) |
| | | | | | |
Sale Contracts | | | | | | | | | | | | | | | | | | | | | | | | | |
CDX-NAHY
Series 29, 5 Year Index, 12/20/2022* | | | 5.00 | | | | Quarterly | | | | 1.69 | | | USD | 4 | | | | 302 | | | | 148 | | | | 154 | |
CDX-NAHY
Series 31, 5 Year Index, 12/20/2023* | | | 5.00 | | | | Quarterly | | | | 2.14 | | | USD | 1,128 | | | | 98,779 | | | | 24,923 | | | | 73,856 | |
CDX-NAHY
Series 33, 5 Year Index, 12/20/2024* | | | 5.00 | | | | Quarterly | | | | 2.55 | | | USD | 632 | | | | 61,559 | | | | (50,241 | ) | | | 111,800 | |
CDX-NAHY
Series 34, 5 Year Index, 06/20/2025* | | | 5.00 | | | | Quarterly | | | | 2.89 | | | USD | 1,893 | | | | 176,337 | | | | 53,238 | | | | 123,099 | |
CDX-NAHY
Series 35, 5 Year Index, 12/20/2025* | | | 5.00 | | | | Quarterly | | | | 3.09 | | | USD | 8,500 | | | | 787,311 | | | | 491,221 | | | | 296,090 | |
CDX-NAIG
Series 28, 5 Year Index, 06/20/2022* | | | 1.00 | | | | Quarterly | | | | 0.34 | | | USD | 62,370 | | | | 667,119 | | | | 385,902 | | | | 281,217 | |
CDX-NAIG
Series 32, 5 Year Index, 06/20/2022* | | | 1.00 | | | | Quarterly | | | | 0.51 | | | USD | 1,090 | | | | 19,889 | | | | 16,018 | | | | 3,871 | |
CDX-NAIG
Series 34, 5 Year Index, 06/20/2025* | | | 1.00 | | | | Quarterly | | | | 0.63 | | | USD | 8,580 | | | | 150,560 | | | | 26,340 | | | | 124,220 | |
CDX-NAIG
Series 35, 5 Year Index, 12/20/2025* | | | 1.00 | | | | Quarterly | | | | 0.56 | | | USD | 8,450 | | | | 193,094 | | | | 186,332 | | | | 6,762 | |
Federative Republic of Brazil
4.250%, 01/07/2025, 06/20/2025* | | | 1.00 | | | | Quarterly | | | | 1.80 | | | USD | 346 | | | | (11,210 | ) | | | (23,116 | ) | | | 11,906 | |
| | |
| |
| abfunds.com | | AB ALL MARKET TOTAL RETURN PORTFOLIO | 79 |
CONSOLIDATED PORTFOLIO OF INVESTMENTS (continued)
| | | | | | | | | | | | | | | | | | | | | | | | | | | | |
| Description | | Fixed
Rate
(Pay)
Receive | | | Payment
Frequency | | | Implied
Credit
Spread at
February 28,
2021 | | | Notional
Amount
(000) | | | Market
Value | | | Upfront
Premiums
Paid
(Received) | | | Unrealized
Appreciation/
(Depreciation) | |
iTraxxx Europe
Series 27, 5 Year Index, 06/20/2022* | | | 1.00 | % | | | Quarterly | | | | 0.18 | % | | EUR | 30,780 | | | $ | 481,199 | | | $ | 299,779 | | | $ | 181,420 | |
iTraxxx Europe
Series 31, 5 Year Index, 06/20/2024* | | | 1.00 | | | | Quarterly | | | | 0.38 | | | EUR | 2,240 | | | | 61,038 | | | | 48,722 | | | | 12,316 | |
iTraxxx Xover
Series 34, 5 Year Index, 12/20/2025* | | | 5.00 | | | | Quarterly | | | | 2.65 | | | EUR | 4,736 | | | | 651,010 | | | | 400,992 | | | | 250,018 | |
Republic of South Africa, 5.875%, 09/16/2025, 06/20/2025* | | | 1.00 | | | | Quarterly | | | | 2.22 | | | USD | 297 | | | | (14,667 | ) | | | (34,002 | ) | | | 19,335 | |
| | | | | | | | | | | | | | | | | | | | | | | | | | | | |
| | | | | | | | | | | | | | | | | | $ | 3,223,239 | | | $ | 1,767,952 | | | $ | 1,455,287 | |
| | | | | | | | | | | | | | | | | | | | | | | | | | | | |
CREDIT DEFAULT SWAPS (see Note D)
| | | | | | | | | | | | | | | | | | | | | | | | | | | | |
Swap Counterparty &
Referenced Obligation | | Fixed
Rate
(Pay)
Receive | | | Payment
Frequency | | | Implied
Credit
Spread at
February 28,
2021 | | | Notional
Amount
(000) | | | Market
Value | | | Upfront
Premiums
Paid
(Received) | | | Unrealized
Appreciation/
(Depreciation) | |
Buy Contracts | | | | | | | | | | | | | | | | | | | | | | | | | | | | |
Goldman Sachs International | | | | | | | | | | | | | | | | | | | | | | | | | | | | |
CDX-CMBX.NA.BB Series 6,
05/11/2063* | | | (5.00 | )% | | | Monthly | | | | 12.50 | % | | USD | 865 | | | $ | 372,594 | | | $ | 279,144 | | | $ | 93,450 | |
JPMorgan Securities, LLC | | | | | | | | | | | | | | | | | | | | | | | | | | | | |
CDX-CMBX.NA.BBB- Series 6,
05/11/2063* | | | (3.00 | ) | | | Monthly | | | | 12.50 | | | USD | 950 | | | | 234,523 | | | | 158,490 | | | | 76,033 | |
| | | | | | | |
Sale Contracts | | | | | | | | | | | | | | | | | | | | | | | | | | | | |
Citigroup Global Markets, Inc | | | | | | | | | | | | | | | | | | | | | | | | | | | | |
CDX-CMBX.NA.BB Series 6,
05/11/2063* | | | 5.00 | | | | Monthly | | | | 12.50 | | | USD | 26 | | | | (11,206 | ) | | | (12,773 | ) | | | 1,567 | |
CDX-CMBX.NA.BB Series 6,
05/11/2063* | | | 5.00 | | | | Monthly | | | | 12.50 | | | USD | 1,645 | | | | (708,463 | ) | | | (280,743 | ) | | | (427,720 | ) |
Credit Suisse International CDX-CMBX.NA.BB Series 6,
05/11/2063* | | | 3.00 | | | | Monthly | | | | 12.50 | | | USD | 4,472 | | | | (1,104,163 | ) | | | (430,110 | ) | | | (674,053 | ) |
| | |
| |
80 | AB ALL MARKET TOTAL RETURN PORTFOLIO | | abfunds.com |
CONSOLIDATED PORTFOLIO OF INVESTMENTS (continued)
| | | | | | | | | | | | | | | | | | | | | | | | | | | | |
Swap Counterparty &
Referenced Obligation | | Fixed
Rate
(Pay)
Receive | | | Payment
Frequency | | | Implied
Credit
Spread at
February 28,
2021 | | | Notional
Amount
(000) | | | Market
Value | | | Upfront
Premiums
Paid
(Received) | | | Unrealized
Appreciation/
(Depreciation) | |
Deutsche Bank AG | | | | | | | | | | | | | | | | | | | | | | | | | | | | |
CDX-CMBX.NA.BB Series 6,
05/11/2063* | | | 5.00 | % | | | Monthly | | | | 12.50 | % | | USD | 2,500 | | | $ | (1,076,862 | ) | | $ | (435,826 | ) | | $ | (641,036 | ) |
Goldman Sachs International | | | | | | | | | | | | | | | | | | | | | | | | | | | | |
Avis Budget Car Rental LLC,
5.250%, 03/15/2025, 12/20/2023* | | | 5.00 | | | | Quarterly | | | | 1.92 | | | USD | 50 | | | | 4,704 | | | | 1,811 | | | | 2,893 | |
CDX-CMBX.NA.BB Series 6,
05/11/2063* | | | 5.00 | | | | Monthly | | | | 12.50 | | | USD | 5 | | | | (2,155 | ) | | | (2,453 | ) | | | 298 | |
CDX-CMBX.NA.BB Series 6,
05/11/2063* | | | 5.00 | | | | Monthly | | | | 12.50 | | | USD | 5 | | | | (2,155 | ) | | | (2,453 | ) | | | 298 | |
JPMorgan Chase Bank, NA | | | | | | | | | | | | | | | | | | | | | | | | | | | | |
Rolls-Royce PLC, 2.125%, 06/18/2021, 06/20/2025* | | | 1.00 | | | | Quarterly | | | | 2.72 | | | EUR | 72 | | | | (5,955 | ) | | | (12,313 | ) | | | 6,358 | |
Rolls-Royce PLC, 2.125%, 06/18/2021, 06/20/2025* | | | 1.00 | | | | Quarterly | | | | 2.72 | | | EUR | 68 | | | | (5,624 | ) | | | (11,563 | ) | | | 5,939 | |
Morgan Stanley & Co. International PLC | | | | | | | | | | | | | | | | | | | | | | | | | | | | |
CDX-CMBX.NA.BB Series 6, 05/11/2063* | | | 5.00 | | | | Monthly | | | | 12.50 | | | USD | 31 | | | | (13,362 | ) | | | (14,047 | ) | | | 685 | |
CDX-CMBX.NA.BB Series 6, 05/11/2063* | | | 5.00 | | | | Monthly | | | | 12.50 | | | USD | 10 | | | | (4,310 | ) | | | (4,802 | ) | | | 492 | |
CDX-CMBX.NA.BB Series 6, 05/11/2063* | | | 5.00 | | | | Monthly | | | | 12.50 | | | USD | 31 | | | | (13,362 | ) | | | (12,984 | ) | | | (378 | ) |
CDX-CMBX.NA.BB Series 6, 05/11/2063* | | | 5.00 | | | | Monthly | | | | 12.50 | | | USD | 30 | | | | (12,930 | ) | | | (12,491 | ) | | | (439 | ) |
CDX-CMBX.NA.BB Series 6, 05/11/2063* | | | 5.00 | | | | Monthly | | | | 12.50 | | | USD | 32 | | | | (13,793 | ) | | | (13,246 | ) | | | (547 | ) |
CDX-CMBX.NA.BB Series 6, 05/11/2063* | | | 5.00 | | | | Monthly | | | | 12.50 | | | USD | 33 | | | | (14,224 | ) | | | (13,579 | ) | | | (645 | ) |
| | | | | | | | | | | | | | | | | | | | | | | | | | | | |
| | | | | | | | | | | | | | | | | | $ | (2,376,743 | ) | | $ | (819,938 | ) | | $ | (1,556,805 | ) |
| | | | | | | | | | | | | | | | | | | | | | | | | | | | |
| | |
| |
| abfunds.com | | AB ALL MARKET TOTAL RETURN PORTFOLIO | 81 |
CONSOLIDATED PORTFOLIO OF INVESTMENTS (continued)
INFLATION (CPI) SWAPS (see Note D)
| | | | | | | | | | | | | | | | | | | | | | | | | | |
| | | | | | | | | Rate Type | | | | | | | | | | | |
Swap
Counterparty | | Notional
Amount
(000) | | | Termination
Date | | | Payments
made
by the
Fund | | Payments
received
by the
Fund | | Payment
Frequency
Paid
Received | | Market
Value | | | Upfront
Premiums
Paid
(Received) | | | Unrealized
Appreciation/
(Depreciation) | |
JPMorgan Chase Bank, NA | | | USD 10,100 | | | | 01/14/2026 | | | 2.236% | | CPI# | | Maturity | | $ | 63,794 | | | $ | – 0 | – | | $ | 63,794 | |
| # | Variable interest rate based on the rate of inflation as determined by the Consumer Price Index (CPI). |
TOTAL RETURN SWAPS (see Note D)
| | | | | | | | | | | | | | | | |
Counterparty &
Referenced Obligation | | Rate Paid/
Received | | Payment
Frequency | | Current
Notional
(000) | | | Maturity
Date | | | Unrealized
Appreciation/
(Depreciation) | |
Receive Total Return on Reference Obligation | |
Bank of America, NA | |
MLABCOVL | | LIBOR Plus 0.20% | | Quarterly | | USD | 1,116 | | | | 11/15/2021 | | | $ | 19,777 | |
MLABCOVL(1) | | LIBOR Plus 0.20% | | Quarterly | | USD | 14,049 | | | | 01/18/2022 | | | | 443,623 | |
Barclays Bank PLC | |
Barclays Capital US Inflation Linked Bonds 1 to 10 Year | | LIBOR Plus 0.001 | | Quarterly | | USD | 108,231 | | | | 05/01/2021 | | | | (1,677,378 | ) |
Citibank, NA | |
CGABROEC | | LIBOR Plus 0.20% | | Quarterly | | USD | 1,933 | | | | 10/15/2021 | | | | 9,969 | |
CGABROEC | | LIBOR Plus 0.20% | | Quarterly | | USD | 919 | | | | 10/15/2021 | | | | (12,081 | ) |
Goldman Sachs International | |
Codemasters Group Holdings PLC | | LIBOR Plus 0.35% | | Monthly | | GBP | 889 | | | | 01/05/2023 | | | | 5,392 | |
Codemasters Group Holdings PLC | | LIBOR Plus 0.35% | | Monthly | | GBP | 311 | | | | 01/05/2023 | | | | 1,886 | |
Codemasters Group Holdings PLC | | LIBOR Plus 0.35% | | Monthly | | GBP | 71 | | | | 01/05/2023 | | | | 431 | |
Codemasters Group Holdings PLC | | LIBOR Plus 0.35% | | Monthly | | GBP | 4 | | | | 01/05/2023 | | | | 38 | |
G4S PLC | | LIBOR Plus 0.35% | | Monthly | | GBP | 316 | | | | 01/05/2023 | | | | 279 | |
G4S PLC | | LIBOR Plus 0.35% | | Monthly | | GBP | 316 | | | | 01/05/2023 | | | | 279 | |
G4S PLC | | LIBOR Plus 0.35% | | Monthly | | GBP | 276 | | | | 01/05/2023 | | | | 86 | |
G4S PLC | | LIBOR Plus 0.35% | | Monthly | | GBP | 28 | | | | 01/05/2023 | | | | 9 | |
G4S PLC | | LIBOR Plus 0.35% | | Monthly | | GBP | 1 | | | | 01/05/2023 | | | | – 0 | – |
G4S PLC | | LIBOR Plus 0.35% | | Monthly | | GBP | 134 | | | | 01/05/2023 | | | | (36 | ) |
G4S PLC | | LIBOR Plus 0.35% | | Monthly | | GBP | 178 | | | | 01/05/2023 | | | | (47 | ) |
| | |
| |
82 | AB ALL MARKET TOTAL RETURN PORTFOLIO | | abfunds.com |
CONSOLIDATED PORTFOLIO OF INVESTMENTS (continued)
| | | | | | | | | | | | | | | | |
Counterparty &
Referenced Obligation | | Rate Paid/
Received | | Payment
Frequency | | Current
Notional
(000) | | | Maturity
Date | | | Unrealized
Appreciation/
(Depreciation) | |
Markit iBoxx EUR Contingent Convertible Liquid Developed Market AT1 TRI | | EURIBOR | | Quarterly/Maturity | | EUR | 521 | | | | 03/22/2021 | | | $ | 13,598 | |
RSA Insurance Group PLC | | LIBOR Plus 0.35% | | Monthly | | GBP | 137 | | | | 01/05/2023 | | | | 118 | |
RSA Insurance Group PLC | | LIBOR Plus 0.35% | | Monthly | | GBP | 202 | | | | 01/05/2023 | | | | 72 | |
RSA Insurance Group PLC | | LIBOR Plus 0.35% | | Monthly | | GBP | 92 | | | | 01/05/2023 | | | | 18 | |
RSA Insurance Group PLC | | LIBOR Plus 0.35% | | Monthly | | GBP | 2 | | | | 01/05/2023 | | | | (3 | ) |
RSA Insurance Group PLC | | LIBOR Plus 0.35% | | Monthly | | GBP | 213 | | | | 01/05/2023 | | | | (18 | ) |
RSA Insurance Group PLC | | LIBOR Plus 0.35% | | Monthly | | GBP | 19 | | | | 01/05/2023 | | | | (20 | ) |
RSA Insurance Group PLC | | LIBOR Plus 0.35% | | Monthly | | GBP | 428 | | | | 01/05/2023 | | | | (22 | ) |
RSA Insurance Group PLC | | LIBOR Plus 0.35% | | Monthly | | GBP | 17 | | | | 01/05/2023 | | | | (25 | ) |
RSA Insurance Group PLC | | LIBOR Plus 0.35% | | Monthly | | GBP | 131 | | | | 01/05/2023 | | | | (119 | ) |
RSA Insurance Group PLC | | LIBOR Plus 0.35% | | Monthly | | GBP | 273 | | | | 01/05/2023 | | | | (120 | ) |
RSA Insurance Group PLC | | LIBOR Plus 0.35% | | Monthly | | GBP | 439 | | | | 01/05/2023 | | | | (1,465 | ) |
Russell 2000 Total Return Index | | LIBOR Plus 0.05% | | Quarterly | | USD | 10,695 | | | | 05/17/2021 | | | | (347,261 | ) |
Signature Aviation PLC | | LIBOR Plus 0.35% | | Monthly | | USD | 340 | | | | 01/05/2023 | | | | 577 | |
Signature Aviation PLC | | LIBOR Plus 0.35% | | Monthly | | USD | 89 | | | | 01/05/2023 | | | | 71 | |
Signature Aviation PLC | | LIBOR Plus 0.35% | | Monthly | | USD | 34 | | | | 01/05/2023 | | | | 40 | |
Signature Aviation PLC | | LIBOR Plus 0.35% | | Monthly | | USD | 13 | | | | 01/05/2023 | | | | 4 | |
Signature Aviation PLC | | LIBOR Plus 0.35% | | Monthly | | USD | 0 | | | | 01/05/2023 | | | | – 0 | – |
Siltronic AG | | EURIBOR Plus 0.35% | | Monthly | | EUR | 20 | | | | 01/05/2023 | | | | (188 | ) |
Siltronic AG | | EURIBOR Plus 0.35% | | Monthly | | EUR | 25 | | | | 01/05/2023 | | | | (433 | ) |
Siltronic AG | | EURIBOR Plus 0.35% | | Monthly | | EUR | 177 | | | | 01/05/2023 | | | | (1,057 | ) |
Siltronic AG | | EURIBOR Plus 0.35% | | Monthly | | EUR | 342 | | | | 01/05/2023 | | | | (3,202 | ) |
Siltronic AG | | EURIBOR Plus 0.35% | | Monthly | | EUR | 336 | | | | 01/05/2023 | | | | (5,824 | ) |
Siltronic AG | | EURIBOR Plus 0.35% | | Monthly | | EUR | 362 | | | | 01/05/2023 | | | | (7,850 | ) |
| | |
| |
| abfunds.com | | AB ALL MARKET TOTAL RETURN PORTFOLIO | 83 |
CONSOLIDATED PORTFOLIO OF INVESTMENTS (continued)
| | | | | | | | | | | | | | | | |
Counterparty &
Referenced Obligation | | Rate Paid/
Received | | Payment
Frequency | | Current
Notional
(000) | | | Maturity
Date | | | Unrealized
Appreciation/
(Depreciation) | |
JPMorgan Chase Bank, NA | | | |
JPABJVAL(2) | | LIBOR Plus 0.10% | | Quarterly | | JPY | 280,943 | | | | 02/15/2022 | | | $ | (107,262 | ) |
JPQABEUV | | EURIBOR Plus 0.15% | | Quarterly | | EUR | 1,051 | | | | 06/15/2021 | | | | (13,430 | ) |
KAZ Minerals PLC | | LIBOR Plus 0.40% | | Monthly | | GBP | 373 | | | | 08/12/2022 | | | | 129,652 | |
KAZ Minerals PLC | | LIBOR Plus 0.40% | | Monthly | | GBP | 137 | | | | 08/12/2022 | | | | 47,297 | |
KAZ Minerals PLC | | LIBOR Plus 0.40% | | Monthly | | GBP | 119 | | | | 08/12/2022 | | | | 41,139 | |
KAZ Minerals PLC | | LIBOR Plus 0.40% | | Monthly | | GBP | 97 | | | | 08/12/2022 | | | | 33,682 | |
KAZ Minerals PLC | | LIBOR Plus 0.40% | | Monthly | | GBP | 62 | | | | 08/12/2022 | | | | 21,647 | |
William Hill PLC | | LIBOR Plus 0.40% | | Monthly | | GBP | 274 | | | | 08/12/2022 | | | | 7,185 | |
William Hill PLC | | LIBOR Plus 0.40% | | Monthly | | GBP | 278 | | | | 08/12/2022 | | | | 5,347 | |
William Hill PLC | | LIBOR Plus 0.40% | | Monthly | | GBP | 282 | | | | 08/12/2022 | | | | 3,124 | |
William Hill PLC | | LIBOR Plus 0.40% | | Monthly | | GBP | 275 | | | | 08/12/2022 | | | | 2,892 | |
William Hill PLC | | LIBOR Plus 0.40% | | Monthly | | GBP | 148 | | | | 08/12/2022 | | | | 1,534 | |
William Hill PLC | | LIBOR Plus 0.40% | | Monthly | | GBP | 139 | | | | 08/12/2022 | | | | 1,134 | |
William Hill PLC | | LIBOR Plus 0.40% | | Monthly | | GBP | 268 | | | | 08/12/2022 | | | | 1,009 | |
William Hill PLC | | LIBOR Plus 0.40% | | Monthly | | GBP | 105 | | | | 08/12/2022 | | | | 858 | |
William Hill PLC | | LIBOR Plus 0.40% | | Monthly | | GBP | 65 | | | | 08/12/2022 | | | | 705 | |
William Hill PLC | | LIBOR Plus 0.40% | | Monthly | | GBP | 62 | | | | 08/12/2022 | | | | 685 | |
William Hill PLC | | LIBOR Plus 0.40% | | Monthly | | GBP | 11 | | | | 08/12/2022 | | | | 201 | |
Morgan Stanley Capital Services LLC | | | |
Applegreen PLC | | EURIBOR Plus 0.50% | | Monthly | | EUR | 258 | | | | 01/27/2022 | | | | 2,526 | |
Applegreen PLC | | EURIBOR Plus 0.50% | | Monthly | | EUR | 258 | | | | 01/27/2022 | | | | 2,526 | |
Applegreen PLC | | EURIBOR Plus 0.50% | | Monthly | | EUR | 48 | | | | 01/27/2022 | | | | 474 | |
Applegreen PLC | | EURIBOR Plus 0.50% | | Monthly | | EUR | 32 | | | | 01/27/2022 | | | | 316 | |
Applegreen PLC | | EURIBOR Plus 0.50% | | Monthly | | EUR | 32 | | | | 01/27/2022 | | | | 316 | |
Applegreen PLC | | EURIBOR Plus 0.50% | | Monthly | | EUR | 8 | | | | 01/27/2022 | | | | 162 | |
Bloomberg Commodity Index | | 0.120% | | Annual | | USD | 48,189 | | | | 03/15/2021 | | | | 5,060,828 | |
| | |
| |
84 | AB ALL MARKET TOTAL RETURN PORTFOLIO | | abfunds.com |
CONSOLIDATED PORTFOLIO OF INVESTMENTS (continued)
| | | | | | | | | | | | | | | | |
Counterparty &
Referenced Obligation | | Rate Paid/
Received | | Payment
Frequency | | Current
Notional
(000) | | | Maturity
Date | | | Unrealized
Appreciation/
(Depreciation) | |
Calisen PLC | | LIBOR Plus 0.50% | | Annual | | GBP | 281 | | | | 01/27/2022 | | | $ | 4,252 | |
Calisen PLC | | LIBOR Plus 0.50% | | Monthly | | GBP | 282 | | | | 01/27/2022 | | | | 4,175 | |
Calisen PLC | | LIBOR Plus 0.50% | | Annual | | GBP | 140 | | | | 01/27/2022 | | | | 2,119 | |
Calisen PLC | | LIBOR Plus 0.50% | | Annual | | GBP | 135 | | | | 01/27/2022 | | | | 2,039 | |
Calisen PLC | | LIBOR Plus 0.50% | | Annual | | GBP | 65 | | | | 01/27/2022 | | | | 1,066 | |
Calisen PLC | | LIBOR Plus 0.50% | | Annual | | GBP | 28 | | | | 01/27/2022 | | | | 483 | |
Calisen PLC | | LIBOR Plus 0.50% | | Annual | | GBP | 9 | | | | 01/27/2022 | | | | 159 | |
IMImobile PLC | | LIBOR Plus 0.50% | | Monthly | | GBP | 727 | | | | 01/27/2022 | | | | 6,177 | |
IMImobile PLC | | LIBOR Plus 0.50% | | Monthly | | GBP | 297 | | | | 01/27/2022 | | | | 2,533 | |
IMImobile PLC | | LIBOR Plus 0.50% | | Monthly | | GBP | 220 | | | | 01/27/2022 | | | | 1,866 | |
IMImobile PLC | | LIBOR Plus 0.50% | | Monthly | | GBP | 31 | | | | 01/27/2022 | | | | 268 | |
IMImobile PLC | | LIBOR Plus 0.50% | | Monthly | | GBP | 16 | | | | 01/27/2022 | | | | 134 | |
IMImobile PLC | | LIBOR Plus 0.50% | | Monthly | | GBP | 16 | | | | 01/27/2022 | | | | 134 | |
KOSPI 200 Futures | | 0.00% | | Monthly | | KRW | 102,488 | | | | 03/11/2021 | | | | (43 | ) |
RTS Futures | | 0.00% | | Monthly | | USD | 361 | | | | 03/18/2021 | | | | 5,633 | |
RTS Futures | | 0.00% | | Monthly | | USD | 809 | | | | 03/18/2021 | | | | (29,591 | ) |
RTS Futures | | 0.00% | | Monthly | | USD | 2,742 | | | | 03/18/2021 | | | | (94,927 | ) |
Tikkurila Oyj | | EURIBOR Plus 0.50% | | Annual | | EUR | 622 | | | | 01/27/2022 | | | | 202,840 | |
Tikkurila Oyj | | EURIBOR Plus 0.50% | | Monthly | | EUR | 294 | | | | 01/27/2022 | | | | 312 | |
|
Pay Total Return on Reference Obligation | |
Goldman Sachs International | | | |
Analog Devices, Inc. | | LIBOR Minus 0.29% | | Monthly | | USD | 336 | | | | 01/05/2023 | | | | 3,678 | |
Analog Devices, Inc. | | LIBOR Plus 0.35% | | Monthly | | USD | 2,523 | | | | 01/05/2023 | | | | (628,497 | ) |
GSABHVIP | | LIBOR | | Quarterly | | USD | 836 | | | | 12/15/2021 | | | | (5,072 | ) |
ICON PLC | | LIBOR Minus 0.23% | | Monthly | | USD | 395 | | | | 01/05/2023 | | | | 25,898 | |
ICON PLC | | LIBOR Minus 0.23% | | Monthly | | USD | 328 | | | | 01/05/2023 | | | | 20,794 | |
ICON PLC | | LIBOR Minus 0.23% | | Monthly | | USD | 41 | | | | 01/05/2023 | | | | 3,702 | |
Lumentum Holdings Inc. | | LIBOR Minus 0.29% | | Monthly | | USD | 662 | | | | 01/05/2023 | | | | 35,441 | |
Lumentum Holdings Inc. | | LIBOR Minus 0.29% | | Monthly | | USD | 233 | | | | 01/05/2023 | | | | 12,085 | |
| | |
| |
| abfunds.com | | AB ALL MARKET TOTAL RETURN PORTFOLIO | 85 |
CONSOLIDATED PORTFOLIO OF INVESTMENTS (continued)
| | | | | | | | | | | | | | | | |
Counterparty &
Referenced Obligation | | Rate Paid/
Received | | Payment
Frequency | | Current
Notional
(000) | | | Maturity
Date | | | Unrealized
Appreciation/
(Depreciation) | |
Lumentum Holdings Inc. | | LIBOR Minus 0.29% | | Monthly | | USD | 132 | | | | 01/05/2023 | | | $ | 8,964 | |
Lumentum Holdings Inc. | | LIBOR Minus 0.29% | | Monthly | | USD | 130 | | | | 01/05/2023 | | | | 6,800 | |
Lumentum Holdings Inc. | | LIBOR Minus 0.29% | | Monthly | | USD | 117 | | | | 01/05/2023 | | | | 6,339 | |
Lumentum Holdings Inc. | | LIBOR Minus 0.30% | | Monthly | | USD | 59 | | | | 01/05/2023 | | | | 4,120 | |
Lumentum Holdings Inc. | | LIBOR Minus 0.29% | | Monthly | | USD | 43 | | | | 01/05/2023 | | | | 2,232 | |
Morgan Stanley Capital Services LLC | | LIBOR Minus 0.31% | | Monthly | | USD | 12 | | | | 01/05/2023 | | | | (1,432 | ) |
Morgan Stanley Capital Services LLC | | LIBOR Minus 0.31% | | Monthly | | USD | 163 | | | | 01/05/2023 | | | | (13,235 | ) |
Morgan Stanley Capital Services LLC | | LIBOR Minus 0.29% | | Monthly | | USD | 143 | | | | 01/05/2023 | | | | (51,734 | ) |
Morgan Stanley Capital Services LLC | | LIBOR Minus 0.29% | | Monthly | | USD | 257 | | | | 01/05/2023 | | | | (87,660 | ) |
Morgan Stanley Capital Services LLC | | LIBOR Minus 0.29% | | Monthly | | USD | 265 | | | | 01/05/2023 | | | | (90,853 | ) |
Morgan Stanley Capital Services LLC | | LIBOR Minus 0.29% | | Monthly | | USD | 358 | | | | 01/05/2023 | | | | (115,878 | ) |
Morgan Stanley Capital Services LLC | | LIBOR Minus 0.29% | | Monthly | | USD | 535 | | | | 01/05/2023 | | | | (194,257 | ) |
S&P 500 Total Return Index | | LIBOR Plus 0.08% | | Quarterly | | USD | 124,084 | | | | 05/17/2021 | | | | 3,899,131 | |
Salesforce.com Inc. | | LIBOR Minus 0.29% | | Monthly | | USD | 40 | | | | 01/27/2022 | | | | 1,631 | |
Salesforce.com Inc. | | LIBOR Minus 0.29% | | Monthly | | USD | 2 | | | | 01/27/2022 | | | | 48 | |
Salesforce.com Inc. | | LIBOR Minus 0.30% | | Monthly | | USD | 57 | | | | 01/05/2023 | | | | 8,286 | |
Salesforce.com Inc. | | LIBOR Minus 0.29% | | Monthly | | USD | 142 | | | | 01/05/2023 | | | | 7,000 | |
Salesforce.com Inc. | | LIBOR Minus 0.29% | | Monthly | | USD | 153 | | | | 01/05/2023 | | | | 5,303 | |
Salesforce.com Inc. | | LIBOR Minus 0.29% | | Monthly | | USD | 139 | | | | 01/05/2023 | | | | 4,154 | |
Salesforce.com Inc. | | LIBOR Minus 0.08% | | Monthly | | USD | 42 | | | | 01/05/2023 | | | | 3,969 | |
Salesforce.com Inc. | | LIBOR Minus 0.29% | | Monthly | | USD | 73 | | | | 01/05/2023 | | | | 3,961 | |
Salesforce.com Inc. | | LIBOR Minus 0.29% | | Monthly | | USD | 142 | | | | 01/05/2023 | | | | 3,709 | |
Salesforce.com Inc. | | LIBOR Minus 0.29% | | Monthly | | USD | 39 | | | | 01/05/2023 | | | | 1,991 | |
Salesforce.com Inc. | | LIBOR Minus 0.29% | | Monthly | | USD | 67 | | | | 01/05/2023 | | | | 1,491 | |
Salesforce.com Inc. | | LIBOR Minus 0.29% | | Monthly | | USD | 120 | | | | 01/05/2023 | | | | (114 | ) |
JPMorgan Chase Bank, NA | | | |
First Citizens Bancshares Inc. | | LIBOR Minus 0.31% | | Monthly | | USD | 189 | | | | 08/12/2022 | | | | 13,121 | |
| | |
| |
86 | AB ALL MARKET TOTAL RETURN PORTFOLIO | | abfunds.com |
CONSOLIDATED PORTFOLIO OF INVESTMENTS (continued)
| | | | | | | | | | | | | | | | |
Counterparty &
Referenced Obligation | | Rate Paid/
Received | | Payment
Frequency | | Current
Notional
(000) | | | Maturity
Date | | | Unrealized
Appreciation/
(Depreciation) | |
First Citizens Bancshares Inc. | | LIBOR Minus 0.31% | | Monthly | | USD | 62 | | | | 08/12/2022 | | | $ | 3,768 | |
First Citizens Bancshares Inc. | | LIBOR Minus 0.31% | | Monthly | | USD | 59 | | | | 08/12/2022 | | | | 3,487 | |
First Citizens Bancshares Inc. | | LIBOR Minus 0.31% | | Monthly | | USD | 60 | | | | 08/12/2022 | | | | 1,754 | |
First Citizens Bancshares Inc. | | LIBOR Minus 0.31% | | Monthly | | USD | 85 | | | | 08/12/2022 | | | | 37 | |
Huntington Bancshares Inc. | | LIBOR Minus 0.30% | | Monthly | | USD | 3 | | | | 08/12/2022 | | | | (605 | ) |
Huntington Bancshares Inc. | | LIBOR Minus 0.31% | | Monthly | | USD | 15 | | | | 08/12/2022 | | | | (2,035 | ) |
Huntington Bancshares Inc. | | LIBOR Minus 0.30% | | Monthly | | USD | 11 | | | | 08/12/2022 | | | | (2,062 | ) |
Huntington Bancshares Inc. | | LIBOR Minus 0.30% | | Monthly | | USD | 91 | | | | 08/12/2022 | | | | (7,269 | ) |
Huntington Bancshares Inc. | | LIBOR Minus 0.30% | | Monthly | | USD | 119 | | | | 08/12/2022 | | | | (9,050 | ) |
Huntington Bancshares Inc. | | LIBOR Minus 0.31% | | Monthly | | USD | 93 | | | | 08/12/2022 | | | | (10,177 | ) |
Huntington Bancshares Inc. | | LIBOR Minus 0.30% | | Monthly | | USD | 58 | | | | 08/12/2022 | | | | (11,358 | ) |
Huntington Bancshares Inc. | | LIBOR Minus 0.30% | | Monthly | | USD | 248 | | | | 08/12/2022 | | | | (18,344 | ) |
Huntington Bancshares Inc. | | LIBOR Minus 0.31% | | Monthly | | USD | 136 | | | | 08/12/2022 | | | | (18,475 | ) |
Huntington Bancshares Inc. | | LIBOR Minus 0.30% | | Monthly | | USD | 243 | | | | 08/12/2022 | | | | (47,019 | ) |
Huntington Bancshares Inc. | | LIBOR Minus 0.30% | | Monthly | | USD | 385 | | | | 08/12/2022 | | | | (74,638 | ) |
Huntington Bancshares Inc. | | LIBOR Minus 0.30% | | Monthly | | USD | 470 | | | | 08/12/2022 | | | | (90,210 | ) |
Huntington Bancshares Inc. | | LIBOR Minus 0.30% | | Monthly | | USD | 974 | | | | 08/12/2022 | | | | (188,445 | ) |
Jazz Pharmaceuticals PLC | | LIBOR Minus 0.31% | | Monthly | | USD | 131 | | | | 08/12/2022 | | | | (11,581 | ) |
Marvell Technology Group Ltd. | | LIBOR Minus 0.31% | | Monthly | | USD | 143 | | | | 08/12/2022 | | | | 8,603 | |
Marvell Technology Group Ltd. | | LIBOR Minus 0.30% | | Monthly | | USD | 6 | | | | 08/12/2022 | | | | (1,387 | ) |
Marvell Technology Group Ltd. | | LIBOR Minus 0.30% | | Monthly | | USD | 40 | | | | 08/12/2022 | | | | (9,225 | ) |
Marvell Technology Group Ltd. | | LIBOR Minus 0.30% | | Monthly | | USD | 98 | | | | 08/12/2022 | | | | (21,883 | ) |
Marvell Technology Group Ltd. | | LIBOR Minus 0.30% | | Monthly | | USD | 211 | | | | 08/12/2022 | | | | (22,076 | ) |
Marvell Technology Group Ltd. | | LIBOR Minus 0.30% | | Monthly | | USD | 273 | | | | 08/12/2022 | | | | (26,420 | ) |
Marvell Technology Group Ltd. | | LIBOR Minus 0.30% | | Monthly | | USD | 194 | | | | 08/12/2022 | | | | (43,719 | ) |
Marvell Technology Group Ltd. | | LIBOR Minus 0.30% | | Monthly | | USD | 253 | | | | 08/12/2022 | | | | (52,577 | ) |
| | |
| |
| abfunds.com | | AB ALL MARKET TOTAL RETURN PORTFOLIO �� | 87 |
CONSOLIDATED PORTFOLIO OF INVESTMENTS (continued)
| | | | | | | | | | | | | | | | |
Counterparty &
Referenced Obligation | | Rate Paid/
Received | | Payment
Frequency | | Current
Notional
(000) | | | Maturity
Date | | | Unrealized
Appreciation/
(Depreciation) | |
Marvell Technology Group Ltd. | | LIBOR Minus 0.30% | | Monthly | | USD | 287 | | | | 08/12/2022 | | | $ | (55,608 | ) |
Marvell Technology Group Ltd. | | LIBOR Minus 0.30% | | Monthly | | USD | 297 | | | | 08/12/2022 | | | | (67,694 | ) |
S&P Global Inc. | | LIBOR Minus 0.30% | | Monthly | | USD | 198 | | | | 08/12/2022 | | | | 3,488 | |
S&P Global Inc. | | LIBOR Minus 0.30% | | Monthly | | USD | 144 | | | | 08/12/2022 | | | | 3,302 | |
S&P Global Inc. | | LIBOR Minus 0.30% | | Monthly | | USD | 187 | | | | 08/12/2022 | | | | 2,728 | |
S&P Global Inc. | | LIBOR Minus 0.31% | | Monthly | | USD | 367 | | | | 08/12/2022 | | | | 1,925 | |
S&P Global Inc. | | LIBOR Minus 0.30% | | Monthly | | USD | 187 | | | | 08/12/2022 | | | | 1,799 | |
S&P Global Inc. | | LIBOR Minus 0.30% | | Monthly | | USD | 30 | | | | 08/12/2022 | | | | 885 | |
S&P Global Inc. | | LIBOR Minus 0.30% | | Monthly | | USD | 16 | | | | 08/12/2022 | | | | 221 | |
S&P Global Inc. | | LIBOR Minus 0.31% | | Monthly | | USD | 89 | | | | 08/12/2022 | | | | 972 | |
S&P Global Inc. | | LIBOR Minus 0.30% | | Monthly | | USD | 38 | | | | 08/12/2022 | | | | (603 | ) |
S&P Global Inc. | | LIBOR Minus 0.30% | | Monthly | | USD | 176 | | | | 08/12/2022 | | | | (843 | ) |
S&P Global Inc. | | LIBOR Minus 0.30% | | Monthly | | USD | 183 | | | | 08/12/2022 | | | | (1,082 | ) |
S&P Global Inc. | | LIBOR Minus 0.30% | | Monthly | | USD | 152 | | | | 08/12/2022 | | | | (1,651 | ) |
S&P Global Inc. | | LIBOR Minus 0.30% | | Monthly | | USD | 415 | | | | 08/12/2022 | | | | (5,508 | ) |
S&P Global Inc. | | LIBOR Minus 0.30% | | Monthly | | USD | 204 | | | | 08/12/2022 | | | | (5,483 | ) |
S&P Global Inc. | | LIBOR Minus 0.30% | | Monthly | | USD | 387 | | | | 08/12/2022 | | | | (6,029 | ) |
STERIS PLC | | LIBOR Minus 0.30% | | Monthly | | USD | 313 | | | | 08/12/2022 | | | | 30,782 | |
STERIS PLC | | LIBOR Minus 0.30% | | Monthly | | USD | 290 | | | | 08/12/2022 | | | | 28,382 | |
STERIS PLC | | LIBOR Minus 0.31% | | Monthly | | USD | 347 | | | | 08/12/2022 | | | | 15,368 | |
STERIS PLC | | LIBOR Minus 0.31% | | Monthly | | USD | 202 | | | | 08/12/2022 | | | | 10,099 | |
STERIS PLC | | LIBOR Minus 0.31% | | Monthly | | USD | 196 | | | | 08/12/2022 | | | | 9,047 | |
STERIS PLC | | LIBOR Minus 0.31% | | Monthly | | USD | 181 | | | | 08/12/2022 | | | | 8,976 | |
STERIS PLC | | LIBOR Minus 0.31% | | Monthly | | USD | 153 | | | | 08/12/2022 | | | | 8,209 | |
STERIS PLC | | LIBOR Minus 0.31% | | Monthly | | USD | 112 | | | | 08/12/2022 | | | | 5,236 | |
STERIS PLC | | LIBOR Minus 0.30% | | Monthly | | USD | 30 | | | | 08/12/2022 | | | | 3,259 | |
| | |
| |
88 | AB ALL MARKET TOTAL RETURN PORTFOLIO | | abfunds.com |
CONSOLIDATED PORTFOLIO OF INVESTMENTS (continued)
| | | | | | | | | | | | | | | | |
Counterparty &
Referenced Obligation | | Rate Paid/
Received | | Payment
Frequency | | Current
Notional
(000) | | | Maturity
Date | | | Unrealized
Appreciation/
(Depreciation) | |
STERIS PLC | | LIBOR Minus 0.31% | | Monthly | | USD | 36 | | | | 08/12/2022 | | | $ | 1,677 | |
STERIS PLC | | LIBOR Minus 0.31% | | Monthly | | USD | 10 | | | | 08/12/2022 | | | | 1,048 | |
Morgan Stanley Capital Services LLC | | | |
Advanced Micro Devices, Inc. | | LIBOR Minus 0.29% | | Annual | | USD | 369 | | | | 01/27/2022 | | | | 31,630 | |
Advanced Micro Devices, Inc. | | LIBOR Minus 0.29% | | Annual | | USD | 13 | | | | 01/27/2022 | | | | (936 | ) |
Advanced Micro Devices, Inc. | | LIBOR Minus 0.08% | | Monthly | | USD | 735 | | | | 01/27/2022 | | | | (16,299 | ) |
Advanced Micro Devices, Inc. | | LIBOR Minus 0.29% | | Annual | | USD | 362 | | | | 01/27/2022 | | | | (32,676 | ) |
Advanced Micro Devices, Inc. | | LIBOR Minus 0.29% | | Annual | | USD | 318 | | | | 01/27/2022 | | | | (36,653 | ) |
Advanced Micro Devices, Inc. | | LIBOR Minus 0.08% | | Monthly | | USD | 842 | | | | 01/27/2022 | | | | (50,884 | ) |
AON PLC | | LIBOR Minus 0.25% | | Monthly | | USD | 70 | | | | 01/27/2022 | | | | (18,091 | ) |
AON PLC | | LIBOR Minus 0.40% | | Monthly | | USD | 91 | | | | 01/27/2022 | | | | (26,242 | ) |
AON PLC | | LIBOR Minus 0.30% | | Monthly | | USD | 87 | | | | 01/27/2022 | | | | (27,378 | ) |
AON PLC | | LIBOR Minus 0.28% | | Monthly | | USD | 115 | | | | 01/27/2022 | | | | (31,803 | ) |
AON PLC | | LIBOR Minus 0.25% | | Monthly | | USD | 196 | | | | 01/27/2022 | | | | (38,573 | ) |
AON PLC | | LIBOR Minus 0.29% | | Annual | | USD | 483 | | | | 01/27/2022 | | | | (45,002 | ) |
AON PLC | | LIBOR Minus 0.25% | | Monthly | | USD | 294 | | | | 01/27/2022 | | | | (65,674 | ) |
AON PLC | | LIBOR Minus 0.28% | | Monthly | | USD | 305 | | | | 01/27/2022 | | | | (83,961 | ) |
AON PLC | | LIBOR Minus 1.10% | | Monthly | | USD | 565 | | | | 01/27/2022 | | | | (177,203 | ) |
AON PLC | | LIBOR Minus 0.40% | | Monthly | | USD | 971 | | | | 01/27/2022 | | | | (273,215 | ) |
AstraZeneca PLC | | LIBOR Minus 0.21% | | Annual | | USD | 266 | | | | 01/27/2022 | | | | 16,610 | |
AstraZeneca PLC | | LIBOR Minus 0.21% | | Annual | | USD | 167 | | | | 01/27/2022 | | | | 14,101 | |
AstraZeneca PLC | | LIBOR Minus 0.21% | | Annual | | USD | 308 | | | | 01/27/2022 | | | | 11,192 | |
AstraZeneca PLC | | LIBOR Minus 0.21% | | Annual | | USD | 160 | | | | 01/27/2022 | | | | 9,788 | |
AstraZeneca PLC | | LIBOR Minus 0.21% | | Annual | | USD | 119 | | | | 01/27/2022 | | | | 5,808 | |
AstraZeneca PLC | | LIBOR Minus 0.21% | | Annual | | USD | 121 | | | | 01/27/2022 | | | | 5,788 | |
AstraZeneca PLC | | LIBOR Minus 0.21% | | Annual | | USD | 129 | | | | 01/27/2022 | | | | 5,067 | |
| | |
| |
| abfunds.com | | AB ALL MARKET TOTAL RETURN PORTFOLIO | 89 |
CONSOLIDATED PORTFOLIO OF INVESTMENTS (continued)
| | | | | | | | | | | | | | | | |
Counterparty &
Referenced Obligation | | Rate Paid/
Received | | Payment
Frequency | | Current
Notional
(000) | | | Maturity
Date | | | Unrealized
Appreciation/
(Depreciation) | |
AstraZeneca PLC | | LIBOR Minus 0.21% | | Annual | | USD | 85 | | | | 01/27/2022 | | | $ | 3,623 | |
AstraZeneca PLC | | LIBOR Minus 0.21% | | Annual | | USD | 103 | | | | 01/27/2022 | | | | 2,717 | |
AstraZeneca PLC | | LIBOR Minus 0.21% | | Annual | | USD | 31 | | | | 01/27/2022 | | | | 1,774 | |
AstraZeneca PLC | | LIBOR Minus 0.21% | | Annual | | USD | 33 | | | | 01/27/2022 | | | | 1,469 | |
AstraZeneca PLC | | LIBOR Minus 0.21% | | Annual | | USD | 42 | | | | 01/27/2022 | | | | 1,120 | |
AstraZeneca PLC | | LIBOR Minus 0.21% | | Annual | | USD | 6 | | | | 01/27/2022 | | | | 172 | |
AstraZeneca PLC | | LIBOR Minus 0.21% | | Annual | | USD | 7 | | | | 01/27/2022 | | | | 104 | |
Diamondback Energy, Inc. | | LIBOR Minus 0.29% | | Annual | | USD | 7 | | | | 01/27/2022 | | | | (1,341 | ) |
Diamondback Energy, Inc. | | LIBOR Minus 0.29% | | Annual | | USD | 7 | | | | 01/27/2022 | | | | (1,409 | ) |
Huntington Bancshares Inc. | | LIBOR Minus 0.29% | | Annual | | USD | 49 | | | | 01/27/2022 | | | | (9,286 | ) |
iBovespa Futures | | 0.00% | | Monthly | | BRL | 8,898 | | | | 04/14/2021 | | | | 87,992 | |
iBovespa Futures | | 0.00% | | Monthly | | BRL | 3,625 | | | | 04/14/2021 | | | | 55,718 | |
Just Eat Takeaway N.V. | | EURIBOR Minus 0.35% | | Annual | | EUR | 244 | | | | 01/27/2022 | | | | 45,421 | |
Just Eat Takeaway N.V. | | EURIBOR Minus 0.35% | | Annual | | EUR | 145 | | | | 01/27/2022 | | | | 41,172 | |
Just Eat Takeaway N.V. | | EURIBOR Minus 0.35% | | Monthly | | EUR | 137 | | | | 01/27/2022 | | | | 39,989 | |
Just Eat Takeaway N.V. | | EURIBOR Minus 0.35% | | Annual | | EUR | 133 | | | | 01/27/2022 | | | | 36,668 | |
Just Eat Takeaway N.V. | | EURIBOR Minus 0.35% | | Monthly | | EUR | 219 | | | | 01/27/2022 | | | | 33,248 | |
Just Eat Takeaway N.V. | | EURIBOR Minus 0.35% | | Annual | | EUR | 132 | | | | 01/27/2022 | | | | 32,644 | |
Just Eat Takeaway N.V. | | EURIBOR Minus 0.35% | | Annual | | EUR | 123 | | | | 01/27/2022 | | | | 28,675 | |
Just Eat Takeaway N.V. | | EURIBOR Minus 0.35% | | Annual | | EUR | 100 | | | | 01/27/2022 | | | | 24,983 | |
Just Eat Takeaway N.V. | | EURIBOR Minus 0.35% | | Annual | | EUR | 74 | | | | 01/27/2022 | | | | 22,342 | |
Just Eat Takeaway N.V. | | EURIBOR Minus 0.35% | | Annual | | EUR | 105 | | | | 01/27/2022 | | | | 21,454 | |
Just Eat Takeaway N.V. | | EURIBOR Minus 0.35% | | Annual | | EUR | 61 | | | | 01/27/2022 | | | | 18,625 | |
Just Eat Takeaway N.V. | | EURIBOR Minus 0.35% | | Annual | | EUR | 86 | | | | 01/27/2022 | | | | 15,862 | |
Just Eat Takeaway N.V. | | EURIBOR Minus 0.35% | | Annual | | EUR | 48 | | | | 01/27/2022 | | | | 14,522 | |
Just Eat Takeaway N.V. | | EURIBOR Minus 0.35% | | Annual | | EUR | 44 | | | | 01/27/2022 | | | | 13,249 | |
Just Eat Takeaway N.V. | | EURIBOR Minus 0.35% | | Monthly | | EUR | 77 | | | | 01/27/2022 | | | | 11,983 | |
| | |
| |
90 | AB ALL MARKET TOTAL RETURN PORTFOLIO | | abfunds.com |
CONSOLIDATED PORTFOLIO OF INVESTMENTS (continued)
| | | | | | | | | | | | | | | | |
Counterparty &
Referenced Obligation | | Rate Paid/
Received | | Payment
Frequency | | Current
Notional
(000) | | | Maturity
Date | | | Unrealized
Appreciation/
(Depreciation) | |
Just Eat Takeaway N.V. | | EURIBOR Minus 0.35% | | Annual | | EUR | 35 | | | | 01/27/2022 | | | $ | 10,195 | |
Just Eat Takeaway N.V. | | EURIBOR Minus 0.35% | | Monthly | | EUR | 70 | | | | 01/27/2022 | | | | 10,042 | |
Just Eat Takeaway N.V. | | EURIBOR Minus 0.35% | | Annual | | EUR | 38 | | | | 01/27/2022 | | | | 9,891 | |
Just Eat Takeaway N.V. | | EURIBOR Minus 0.35% | | Annual | | EUR | 16 | | | | 01/27/2022 | | | | 3,424 | |
Just Eat Takeaway N.V. | | EURIBOR Minus 0.35% | | Annual | | EUR | 11 | | | | 01/27/2022 | | | | 3,255 | |
Just Eat Takeaway N.V. | | EURIBOR Minus 0.35% | | Annual | | EUR | 12 | | | | 01/27/2022 | | | | 2,911 | |
Just Eat Takeaway N.V. | | EURIBOR Minus 0.35% | | Monthly | | EUR | 12 | | | | 01/27/2022 | | | | 2,680 | |
Just Eat Takeaway N.V. | | EURIBOR Minus 0.35% | | Annual | | EUR | 7 | | | | 01/27/2022 | | | | 1,485 | |
Just Eat Takeaway N.V. | | EURIBOR Minus 0.35% | | Annual | | EUR | 7 | | | | 01/27/2022 | | | | 1,476 | |
Just Eat Takeaway N.V. | | EURIBOR Minus 0.35% | | Annual | | EUR | 3 | | | | 01/27/2022 | | | | 722 | |
Just Eat Takeaway N.V. | | EURIBOR Minus 0.35% | | Monthly | | EUR | 2 | | | | 01/27/2022 | | | | (15 | ) |
MSABHOWN | | LIBOR Minus 0.30% | | Maturity | | USD | 734 | | | | 05/17/2021 | | | | 25,422 | |
Swiss Market Index Futures | | 0.00% | | Monthly | | CHF | 105 | | | | 03/19/2021 | | | | 2,633 | |
Teledyne Technologies Inc. | | LIBOR Minus 0.29% | | Annual | | USD | 239 | | | | 01/27/2022 | | | | 8,004 | |
Teledyne Technologies Inc. | | LIBOR Minus 0.29% | | Annual | | USD | 190 | | | | 01/27/2022 | | | | (926 | ) |
Teledyne Technologies Inc. | | LIBOR Minus 0.29% | | Annual | | USD | 555 | | | | 01/27/2022 | | | | (6,514 | ) |
Teledyne Technologies Inc. | | LIBOR Minus 0.29% | | Annual | | USD | 299 | | | | 01/27/2022 | | | | (7,433 | ) |
| | | | | | | | | | | | | | | | |
| | | | | $ | 5,816,542 | |
| | | | | | | | | | | | | | | | |
VARIANCE SWAPS (see Note D)
| | | | | | | | | | | | | | | | | | | | | | | | |
Swap Counterparty &
Referenced Obligation | | Volatility
Strike
Rate | | | Payment
Frequency | | | Notional
Amount
(000) | | | Market
Value | | | Upfront
Premiums
(Paid)
Received | | | Unrealized
Appreciation/
(Depreciation) | |
Buy Contracts | | | | | | | | | | | | | | | | | | | | | | | | |
Bank of America, NA | |
FTSE 100 Index 05/21/2021* | | | 25.10 | % | | | Maturity | | | GBP | 1 | | | $ | 5,361 | | | $ | – | 0 – | | $ | 5,361 | |
JPMorgan Chase Bank, NA | |
Nikkei 225 Index 05/21/2021* | | | 26.90 | | | | Maturity | | | JPY | 83 | | | | 113,960 | | | | – | 0 – | | | 113,960 | |
UBS AG | |
S&P/ASX 200 Index 05/20/2021* | | | 22.72 | | | | Maturity | | | AUD | 3 | | | | 178,125 | | | | – | 0 – | | | 178,125 | |
USD/JPY 09/30/2021* | | | 7.85 | | | | Maturity | | | USD | 94 | | | | (99,655 | ) | | | – | 0 – | | | (99,655 | ) |
| | |
| |
| abfunds.com | | AB ALL MARKET TOTAL RETURN PORTFOLIO | 91 |
CONSOLIDATED PORTFOLIO OF INVESTMENTS (continued)
| | | | | | | | | | | | | | | | | | | | | | | | |
Swap Counterparty &
Referenced Obligation | | Volatility
Strike
Rate | | | Payment
Frequency | | | Notional
Amount
(000) | | | Market
Value | | | Upfront
Premiums
(Paid)
Received | | | Unrealized
Appreciation/
(Depreciation) | |
Sale Contracts | |
Credit Suisse International | |
Nasdaq 100 Stock Index 03/19/2021* | | | 28.00 | % | | | Maturity | | | USD | 1 | | | $ | (286,327 | ) | | $ | – 0 | – | | $ | (286,327 | ) |
Goldman Sachs Bank USA | |
USD/JPY 09/30/2021* | | | 7.20 | | | | Maturity | | | USD | 82 | | | | 23,704 | | | | – 0 | – | | | 23,704 | |
Goldman Sachs International | |
Nikkei 225 Index 03/12/2021* | | | 22.31 | | | | Maturity | | | JPY | 86 | | | | (309,548 | ) | | | – 0 | – | | | (309,548 | ) |
JPMorgan Chase Bank, NA | |
Russell 2000 Index 03/19/2021* | | | 32.45 | | | | Maturity | | | USD | 1 | | | | (195,720 | ) | | | – 0 | – | | | (195,720 | ) |
UBS AG | |
S&P/ASX 200 Index 03/18/2021* | | | 19.66 | | | | Maturity | | | AUD | 1 | | | | (78,079 | ) | | | – 0 | – | | | (78,079 | ) |
| | | | | | | | | | | | | | | | | | | | | | | | |
| | | | | | | | | | | | | | $ | (648,179 | ) | | $ | – 0 | – | | $ | (648,179 | ) |
| | | | | | | | | | | | | | | | | | | | | | | | |
| ** | Principal amount less than 500. |
| (a) | Non-income producing security. |
| (b) | Represents entire or partial securities out on loan. See Note E for securities lending information. |
| (c) | Security is exempt from registration under Rule 144A of the Securities Act of 1933. These securities are considered restricted, but liquid and may be resold in transactions exempt from registration, normally to qualified institutional buyers. At February 28, 2021, the aggregate market value of these securities amounted to $58,068,594 or 9.0% of net assets. |
| (d) | Fair valued by the Adviser. |
| (e) | Security in which significant unobservable inputs (Level 3) were used in determining fair value. |
| (f) | Restricted and illiquid security. |
| | | | | | | | | | | | | | | | |
Restricted & Illiquid
Securities | | Acquisition
Date | | | Cost | | | Market
Value | | | Percentage of
Net Assets | |
CHC Group LLC | | | 04/26/2017 | | | $ | 192,579 | | | $ | 4,327 | | | | 0.00 | % |
| (g) | Defaulted matured security. |
| (h) | Pay-In-Kind Payments (PIK). The issuer may pay cash interest and/or interest in additional debt securities. Rates shown are the rates in effect at February 28, 2021. |
| (i) | Security is exempt from registration under Rule 144A of the Securities Act of 1933. These securities, which represent 0.00% of net assets as of February 28, 2021, are considered illiquid and restricted. Additional information regarding such securities follows: |
| | | | | | | | | | | | | | | | |
144A/Restricted & Illiquid
Securities | | Acquisition
Date | | | Cost | | | Market
Value | | | Percentage of
Net Assets | |
Digicel Group 0.5 Ltd.
7.00%, 03/15/2021 | | | 10/01/2020 | | | $ | 803 | | | $ | 5,433 | | | | 0.00 | % |
Exide Technologies (Exchange Priority)
11.00%, 10/31/2024 | | | 06/21/2019 | | | | – 0 | – | | | – 0 | – | | | 0.00 | % |
Exide Technologies (First Lien)
11.00%, 10/31/2024 | | | 06/21/2019 | | | | 17,967 | | | | – 0 | – | | | 0.00 | % |
| | |
| |
92 | AB ALL MARKET TOTAL RETURN PORTFOLIO | | abfunds.com |
CONSOLIDATED PORTFOLIO OF INVESTMENTS (continued)
| | | | | | | | | | | | | | | | |
144A/Restricted & Illiquid
Securities | | Acquisition
Date | | | Cost | | | Market
Value | | | Percentage of
Net Assets | |
K2016470219 South Africa Ltd.
3.00%, 12/31/2022 | | | 04/26/2017 | | | $ | 21,734 | | | $ | – 0 | – | | | 0.00 | % |
K2016470260 South Africa Ltd.
25.00%, 12/31/2022 | | | 04/26/2017 | | | | 21,076 | | | | – 0 | – | | | 0.00 | % |
Magnetation LLC/Mag Finance Corp.
11.00%, 05/15/2018 | | | 04/26/2017 | | | | 15 | | | | – 0 | – | | | 0.00 | % |
Terraform Global Operating LLC
6.125%, 03/01/2026 | | | 02/08/2018 | | | | 12,000 | | | | 12,367 | | | | 0.00 | % |
Tonon Luxembourg SA
6.50%, 10/31/2024 | | | 04/26/2017 | | | | 2,770 | | | | 155 | | | | 0.00 | % |
Virgolino de Oliveira Finance SA
10.50%, 01/28/2018 | | | 04/26/2017 | | | | 33,435 | | | | 4,737 | | | | 0.00 | % |
| (l) | Securities are perpetual and, thus, do not have a predetermined maturity date. The date shown, if applicable, reflects the next call date. |
| (m) | To obtain a copy of the fund’s shareholder report, please go to the Securities and Exchange Commission’s website at www.sec.gov. Additionally, shareholder reports for AB funds can be obtained by calling AB at (800) 227-4618. |
| (n) | Floating Rate Security. Stated interest/floor/ceiling rate was in effect at February 28, 2021. |
| (o) | The stated coupon rate represents the greater of the LIBOR or the LIBOR floor rate plus a spread at February 28, 2021. |
| (p) | This position or a portion of this position represents an unsettled loan purchase. The coupon rate will be determined at the time of settlement and will be based upon the London-Interbank Offered Rate (“LIBOR”) plus a premium which was determined at the time of purchase. |
| (q) | Affiliated investments. |
| (r) | The rate shown represents the 7-day yield as of period end. |
| | |
Currency Abbreviations: AUD – Australian Dollar BRL – Brazilian Real CAD – Canadian Dollar CHF – Swiss Franc CLP – Chilean Peso CNY – Chinese Yuan Renminbi COP – Colombian Peso CZK – Czech Koruna EUR – Euro GBP – Great British Pound HKD – Hong Kong Dollar HUF – Hungarian Forint IDR – Indonesian Rupiah ILS – Israeli Shekel INR – Indian Rupee | | JPY – Japanese Yen KRW – South Korean Won MXN – Mexican Peso MYR – Malaysian Ringgit NOK – Norwegian Krone NZD – New Zealand Dollar PEN – Peruvian Sol PHP – Philippine Peso PLN – Polish Zloty RUB – Russian Ruble SEK – Swedish Krona SGD – Singapore Dollar THB – Thailand Baht TRY – Turkish Lira TWD – New Taiwan Dollar USD – United States Dollar ZAR – South African Rand |
| | |
| |
| abfunds.com | | AB ALL MARKET TOTAL RETURN PORTFOLIO | 93 |
CONSOLIDATED PORTFOLIO OF INVESTMENTS (continued)
Glossary:
ABS – Asset-Backed Securities
ADR – American Depositary Receipt
ASX – Australian Stock Exchange
BKBM – Bank Bill Benchmark (New Zealand)
BOBL – Bundesobligationen
BTP – Buoni del Tesoro Poliennali
CBT – Chicago Board of Trade
CDI – Brazil CETIP Interbank Deposit Rate
CDX-CMBX.NA – North American Commercial Mortgage-Backed Index
CDX-NAHY – North American High Yield Credit Default Swap Index
CDX-NAIG – North American Investment Grade Credit Default Swap Index
CLO – Collateralized Loan Obligations
CMBS – Commercial Mortgage-Backed Securities
CPI – Consumer Price Index
EAFE – Europe, Australia, and Far East
ETF – Exchange Traded Fund
ETS – Emission Trading Scheme
EURIBOR – Euro Interbank Offered Rate
FTSE – Financial Times Stock Exchange
GDR – Global Depositary Receipt
KOSPI – Korea Composite Stock Price Index
LIBOR – London Interbank Offered Rate
MSCI – Morgan Stanley Capital International
NIBOR – Norwegian Interbank Offered Rate
OMXS – Stockholm Stock Exchange
OSE – Osaka Securities Exchange
PJSC – Public Joint Stock Company
REIT – Real Estate Investment Trust
SGX – Singapore Exchange
SPDR – Standard & Poor’s Depository Receipt
SPI – Share Price Index
TOPIX – Tokyo Price Index
TSX – Toronto Stock Exchange
| (1) | The following table represents the 50 largest equity basket holdings underlying the total return swap with MLABCOVL as of February 28, 2021. |
| | | | | | | | | | | | |
| Security Description | | Shares | | | Current
Notional | | | Percent of
Basket’s Value | |
Kohl’s Corp. | | | 10,221 | | | $ | 564,690 | | | | 4.0 | % |
Forward Air Corp. | | | 6,489 | | | | 556,588 | | | | 4.0 | % |
Knight-Swift Transportation Holdings, Inc. | | | 12,833 | | | | 554,389 | | | | 3.9 | % |
ManpowerGroup, Inc. | | | 5,755 | | | | 543,543 | | | | 3.9 | % |
UniFirst Corp. | | | 2,207 | | | | 534,685 | | | | 3.8 | % |
Vail Resorts, Inc. | | | 1,700 | | | | 525,606 | | | | 3.7 | % |
Insperity, Inc. | | | 5,899 | | | | 523,233 | | | | 3.7 | % |
Sonoco Products Co. | | | 8,729 | | | | 519,995 | | | | 3.7 | % |
Union Pacific Corp. | | | 2,498 | | | | 514,462 | | | | 3.7 | % |
Graham Holdings Co. | | | 800 | | | | 480,627 | | | | 3.4 | % |
Choice Hotels International, Inc. | | | 4,504 | | | | 472,380 | | | | 3.4 | % |
TEGNA, Inc. | | | 20,926 | | | | 381,488 | | | | 2.7 | % |
John Wiley & Sons, Inc. | | | 7,139 | | | | 376,059 | | | | 2.7 | % |
CVS Health Corp. | | | 4,837 | | | | 329,531 | | | | 2.3 | % |
Sirius XM Holdings, Inc. | | | 51,117 | | | | 299,032 | | | | 2.1 | % |
Valero Energy Corp. | | | 3,860 | | | | 297,170 | | | | 2.1 | % |
HollyFrontier Corp. | | | 7,462 | | | | 282,646 | | | | 2.0 | % |
Phillips 66 | | | 3,280 | | | | 272,426 | | | | 1.9 | % |
| | |
| |
94 | AB ALL MARKET TOTAL RETURN PORTFOLIO | | abfunds.com |
CONSOLIDATED PORTFOLIO OF INVESTMENTS (continued)
| | | | | | | | | | | | |
| Security Description | | Shares | | | Current
Notional | | | Percent of
Basket’s Value | |
Pioneer Natural Resources Co. | | | 1,729 | | | $ | 256,863 | | | | 1.8 | % |
Unum Group | | | 6,532 | | | | 172,958 | | | | 1.2 | % |
Lincoln National Corp. | | | 2,817 | | | | 160,192 | | | | 1.1 | % |
Kimco Realty Corp. | | | 8,721 | | | | 159,854 | | | | 1.1 | % |
Regency Centers Corp. | | | 2,890 | | | | 158,320 | | | | 1.1 | % |
Constellation Brands, Inc. | | | 732 | | | | 156,711 | | | | 1.1 | % |
Ventas, Inc. | | | 2,824 | | | | 149,392 | | | | 1.1 | % |
Simon Property Group, Inc. | | | 1,306 | | | | 147,440 | | | | 1.0 | % |
PepsiCo., Inc. | | | 1,130 | | | | 146,015 | | | | 1.0 | % |
Brown-Forman Corp. | | | 2,013 | | | | 144,073 | | | | 1.0 | % |
Vornado Realty Trust | | | 3,335 | | | | 143,204 | | | | 1.0 | % |
Welltower, Inc. | | | 2,105 | | | | 142,903 | | | | 1.0 | % |
Prudential Financial, Inc. | | | 1,604 | | | | 139,099 | | | | 1.0 | % |
Manulife Financial Corp. | | | 6,645 | | | | 132,372 | | | | 0.9 | % |
Walgreens Boots Alliance, Inc. | | | 2,719 | | | | 130,310 | | | | 0.9 | % |
Realty Income Corp. | | | 2,138 | | | | 128,814 | | | | 0.9 | % |
Citigroup, Inc. | | | 1,953 | | | | 128,656 | | | | 0.9 | % |
Boston Properties, Inc. | | | 1,294 | | | | 128,309 | | | | 0.9 | % |
Weyerhaeuser Co. | | | 3,649 | | | | 123,583 | | | | 0.9 | % |
Anheuser-Busch InBev SA | | | 2,126 | | | | 122,751 | | | | 0.9 | % |
AvalonBay Communities, Inc. | | | 687 | | | | 120,816 | | | | 0.9 | % |
First Horizon Corp. | | | 7,313 | | | | 118,470 | | | | 0.8 | % |
Equity Residential | | | 1,777 | | | | 116,261 | | | | 0.8 | % |
Fifth Third Bancorp | | | 3,296 | | | | 114,330 | | | | 0.8 | % |
Mid-America Apartment Communities, Inc. | | | 848 | | | | 114,312 | | | | 0.8 | % |
Principal Financial Group, Inc. | | | 2,018 | | | | 114,173 | | | | 0.8 | % |
Essex Property Trust, Inc. | | | 431 | | | | 109,929 | | | | 0.8 | % |
United Bankshares, Inc. | | | 2,932 | | | | 108,353 | | | | 0.8 | % |
Extra Space Storage, Inc. | | | 825 | | | | 103,666 | | | | 0.7 | % |
Bank of New York Mellon Corp. | | | 2,408 | | | | 101,524 | | | | 0.7 | % |
Reinsurance Group of America, Inc. | | | 820 | | | | 100,174 | | | | 0.7 | % |
Franklin Resources, Inc. | | | 3,640 | | | | 95,272 | | | | 0.7 | % |
Other Long | | | 37,280 | | | | 1,731,666 | | | | 12.3 | % |
| (2) | The following table represents the 50 largest equity basket holdings underlying the total return swap with JPABJVAL as of February 28, 2021. |
| | | | | | | | | | | | |
| Security Description | | Shares | | | Current
Notional | | | Percent of
Basket’s Value | |
Hitachi, Ltd. | | | 1,905 | | | JPY | 9,286,673 | | | | 3.3 | % |
KDDI Corp. | | | 2,817 | | | | 9,267,580 | | | | 3.3 | % |
SoftBank Corp. | | | 5,024 | | | | 7,239,721 | | | | 2.6 | % |
Nippon Yusen KK | | | 2,297 | | | | 7,017,481 | | | | 2.5 | % |
Sony Corp. | | | 614 | | | | 6,828,726 | | | | 2.4 | % |
Japan Tobacco, Inc. | | | 3,543 | | | | 6,820,205 | | | | 2.4 | % |
Daito Trust Construction Co., Ltd. | | | 575 | | | | 6,785,722 | | | | 2.4 | % |
NEC Corp. | | | 1,147 | | | | 6,650,330 | | | | 2.4 | % |
T&D Holdings, Inc. | | | 4,612 | | | | 6,623,174 | | | | 2.4 | % |
Asahi Kasei Corp. | | | 5,722 | | | | 6,557,615 | | | | 2.3 | % |
SCSK Corp. | | | 1,045 | | | | 6,550,001 | | | | 2.3 | % |
Sumitomo Dainippon Pharma Co., Ltd. | | | 3,822 | | | | 6,432,571 | | | | 2.3 | % |
| | |
| |
| abfunds.com | | AB ALL MARKET TOTAL RETURN PORTFOLIO | 95 |
CONSOLIDATED PORTFOLIO OF INVESTMENTS (continued)
| | | | | | | | | | | | |
| Security Description | | Shares | | | Current
Notional | | | Percent of
Basket’s Value | |
United Urban Investment Corp. | | | 44 | | | | 6,417,127 | | | | 2.3 | % |
Lida Group Holdings Co., Ltd. | | | 2,656 | | | | 6,405,142 | | | | 2.3 | % |
Yamaha Motor Co., Ltd. | | | 2,748 | | | JPY | 6,373,007 | | | | 2.3 | % |
Hoya Corp. | | | 525 | | | | 6,355,690 | | | | 2.3 | % |
Taisei Corp. | | | 1,692 | | | | 6,351,911 | | | | 2.3 | % |
Nitto Denko Corp. | | | 696 | | | | 6,328,842 | | | | 2.3 | % |
Kao Corp. | | | 877 | | | | 6,266,281 | | | | 2.2 | % |
Resona Holdings, Inc. | | | 14,600 | | | | 6,244,210 | | | | 2.2 | % |
Amada Co., Ltd. | | | 4,819 | | | | 6,221,001 | | | | 2.2 | % |
Shionogi & Co., Ltd. | | | 1,149 | | | | 6,219,719 | | | | 2.2 | % |
Japan Post Insurance Co., Ltd. | | | 2,636 | | | | 5,744,180 | | | | 2.0 | % |
NGK Spark Plug Co., Ltd. | | | 3,182 | | | | 5,733,787 | | | | 2.0 | % |
Kurita Water Industries, Ltd. | | | 1,317 | | | | 5,675,805 | | | | 2.0 | % |
Capcom Co., Ltd. | | | 863 | | | | 5,589,302 | | | | 2.0 | % |
Chubu Electric Power Co., Inc. | | | 4,185 | | | | 5,471,444 | | | | 1.9 | % |
Toyota Motor Corp. | | | 680 | | | | 5,357,534 | | | | 1.9 | % |
SG Holdings Co., Ltd. | | | 2,186 | | | | 5,350,145 | | | | 1.9 | % |
Brother Industries, Ltd. | | | 2,505 | | | | 5,243,214 | | | | 1.9 | % |
Shimamura Co., Ltd. | | | 489 | | | | 5,184,364 | | | | 1.8 | % |
Advantest Corp. | | | 585 | | | | 5,121,238 | | | | 1.8 | % |
Lion Corp. | | | 2,434 | | | | 4,980,115 | | | | 1.8 | % |
Azbil Corp. | | | 1,034 | | | | 4,676,703 | | | | 1.7 | % |
Fuji Electric Co., Ltd. | | | 1,016 | | | | 4,488,963 | | | | 1.6 | % |
Otsuka Holdings Co., Ltd. | | | 1,016 | | | | 4,290,586 | | | | 1.5 | % |
McDonald’s Holdings Co./(Japan) | | | 737 | | | | 3,888,786 | | | | 1.4 | % |
Orix JREIT, Inc. | | | 20 | | | | 3,577,275 | | | | 1.3 | % |
SoftBank Group Corp. | | | 360 | | | | 3,559,086 | | | | 1.3 | % |
Toho Gas Co., Ltd. | | | 558 | | | | 3,491,987 | | | | 1.2 | % |
AGC, Inc. | | | 882 | | | | 3,441,535 | | | | 1.2 | % |
Toyota Tsusho Corp. | | | 770 | | | | 3,433,896 | | | | 1.2 | % |
Calbee, Inc. | | | 1,153 | | | | 3,227,546 | | | | 1.1 | % |
Nippon Express Co., Ltd. | | | 404 | | | | 3,197,583 | | | | 1.1 | % |
Persol Holdings Co., Ltd. | | | 1,427 | | | | 3,007,454 | | | | 1.1 | % |
Ajinomoto Co., Inc. | | | 1,399 | | | | 2,964,616 | | | | 1.1 | % |
Teijin, Ltd. | | | 1,499 | | | | 2,743,788 | | | | 1.0 | % |
ZOZO, Inc. | | | 717 | | | | 2,388,777 | | | | 0.9 | % |
Suzuken Co., Ltd./Aichi Japan | | | 575 | | | | 2,336,072 | | | | 0.8 | % |
Lixil Corp. | | | 771 | | | | 2,301,864 | | | | 0.8 | % |
Other Long | | | 8,215 | | | | 15,237,000 | | | | 5.4 | % |
See notes to consolidated financial statements.
| | |
| |
96 | AB ALL MARKET TOTAL RETURN PORTFOLIO | | abfunds.com |
CONSOLIDATED STATEMENT OF ASSETS & LIABILITIES
February 28, 2021 (unaudited)
| | | | |
| Assets | |
Investments in securities, at value | | | | |
Unaffiliated issuers (cost $423,318,509) | | $ | 487,935,031 | (a) |
Affiliated issuers (cost $151,725,570—including investment of cash collateral for securities loaned of $3,831,960) | | | 151,725,570 | |
Cash | | | 43,978 | |
Cash collateral due from broker | | | 18,901,761 | |
Foreign currencies, at value (cost $2,909,374) | | | 2,893,253 | |
Unrealized appreciation on total return swaps | | | 11,072,246 | |
Receivable for investment securities sold and foreign currency transactions | | | 4,500,222 | |
Unrealized appreciation on forward currency exchange contracts | | | 3,567,447 | |
Unaffiliated interest and dividends receivable | | | 1,767,207 | |
Receivable for variation margin on centrally cleared swaps | | | 854,094 | |
Market value on credit default swaps (net premiums paid $439,445) | | | 611,821 | |
Unrealized appreciation on variance swaps | | | 321,150 | |
Receivable for shares of beneficial interest sold | | | 69,251 | |
Unrealized appreciation on inflation swaps | | | 63,794 | |
Affiliated dividends receivable | | | 1,337 | |
| | | | |
Total assets | | | 684,328,162 | |
| | | | |
| Liabilities | |
Payable for investment securities purchased and foreign currency transactions | | | 11,047,819 | |
Cash collateral due to broker | | | 7,772,202 | |
Unrealized depreciation on total return swaps | | | 5,255,704 | |
Payable for collateral received on securities loaned | | | 3,831,960 | |
Unrealized depreciation on forward currency exchange contracts | | | 3,150,815 | |
Market value on credit default swaps (net premiums received $1,259,383) | | | 2,988,564 | |
Unrealized depreciation on variance swaps | | | 969,329 | |
Payable for variation margin on futures | | | 685,461 | |
Payable for shares of beneficial interest redeemed | | | 549,430 | |
Advisory fee payable | | | 272,298 | |
Distribution fee payable | | | 124,108 | |
Transfer Agent fee payable | | | 61,176 | |
Payable for terminated total return swaps | | | 57,378 | |
Payable for terminated credit default swaps | | | 19,643 | |
Payable for terminated centrally cleared credit default swaps | | | 19,079 | |
Trustees’ fees payable | | | 6,084 | |
Payable for newly entered centrally cleared interest rate swaps | | | 1,126,359 | |
Accrued expenses and other liabilities | | | 332,898 | |
| | | | |
Total liabilities | | | 38,270,307 | |
| | | | |
Net Assets | | $ | 646,057,855 | |
| | | | |
| Composition of Net Assets | |
Shares of beneficial interest, at par | | $ | 400 | |
Additional paid-in capital | | | 575,366,611 | |
Distributable earnings | | | 70,690,844 | |
| | | | |
| | $ | 646,057,855 | |
| | | | |
| (a) | Includes securities on loan with a value of $6,853,010 (see Note E). |
See notes to consolidated financial statements.
| | |
| |
| abfunds.com | | AB ALL MARKET TOTAL RETURN PORTFOLIO | 97 |
CONSOLIDATED STATEMENT OF ASSETS & LIABILITIES (continued)
Net Asset Value Per Share—unlimited shares authorized, $.00001 par value
| | | | | | | | | | | | |
| Class | | Net Assets | | | Shares
Outstanding | | | Net Asset
Value | |
| |
| A | | $ | 538,048,265 | | | | 33,298,408 | | | $ | 16.16 | * |
| |
| C | | $ | 18,976,721 | | | | 1,185,321 | | | $ | 16.01 | |
| |
| Advisor | | $ | 77,863,795 | | | | 4,773,434 | | | $ | 16.31 | |
| |
| R | | $ | 3,358,359 | | | | 209,584 | | | $ | 16.02 | |
| |
| K | | $ | 7,516,377 | | | | 466,950 | | | $ | 16.10 | |
| |
| I | | $ | 294,338 | | | | 17,851 | | | $ | 16.49 | |
| |
| * | The maximum offering price per share for Class A shares was $16.88 which reflects a sales charge of 4.25%. |
See notes to consolidated financial statements.
| | |
| |
98 | AB ALL MARKET TOTAL RETURN PORTFOLIO | | abfunds.com |
CONSOLIDATED STATEMENT OF OPERATIONS
Six Months Ended February 28, 2021 (unaudited)
| | | | | | | | |
| Investment Income | | | | | | | | |
Dividends | | | | | | | | |
Unaffiliated issuers (net of foreign taxes withheld of $78,415) | | $ | 2,751,097 | | | | | |
Affiliated issuers | | | 20,361 | | | | | |
Interest (net of foreign taxes withheld of $5,520) | | | 2,409,902 | | | | | |
Securities lending income | | | 92,041 | | | | | |
Other income | | | 2,399 | | | $ | 5,275,800 | |
| | | | | | | | |
| Expenses | | | | | | | | |
Advisory fee (see Note B) | | | 1,764,603 | | | | | |
Distribution fee—Class A | | | 666,327 | | | | | |
Distribution fee—Class C | | | 102,465 | | | | | |
Distribution fee—Class R | | | 8,043 | | | | | |
Distribution fee—Class K | | | 9,301 | | | | | |
Transfer agency—Class A | | | 260,232 | | | | | |
Transfer agency—Class C | | | 10,580 | | | | | |
Transfer agency—Advisor Class | | | 37,656 | | | | | |
Transfer agency—Class R | | | 4,212 | | | | | |
Transfer agency—Class K | | | 7,509 | | | | | |
Transfer agency—Class I | | | 171 | | | | | |
Custody and accounting | | | 218,721 | | | | | |
Audit and tax | | | 59,458 | | | | | |
Printing | | | 55,958 | | | | | |
Registration fees | | | 46,449 | | | | | |
Legal | | | 19,503 | | | | | |
Trustees’ fees | | | 13,328 | | | | | |
Miscellaneous | | | 38,512 | | | | | |
| | | | | | | | |
Total expenses | | | 3,323,028 | | | | | |
Less: expenses waived and reimbursed by the Adviser (see Notes B & E) | | | (59,420 | ) | | | | |
| | | | | | | | |
Net expenses | | | | | | | 3,263,608 | |
| | | | | | | | |
Net investment income | | | | | | | 2,012,192 | |
| | | | | | | | |
| Realized and Unrealized Gain (Loss) on Investment and Foreign Currency Transactions | | | | | | | | |
Net realized gain (loss) on: | | | | | | | | |
Investment transactions(a) | | | | | | | 51,908,671 | |
Forward currency exchange contracts | | | | | | | (251,878 | ) |
Futures | | | | | | | 10,224,528 | |
Swaps | | | | | | | 136,071 | |
Foreign currency transactions | | | | | | | (329,493 | ) |
Net change in unrealized appreciation/depreciation of: | | | | | |
Investments(b) | | | | | | | (8,658,041 | ) |
Forward currency exchange contracts | | | | | | | 840,519 | |
Futures | | | | | | | (6,164,128 | ) |
Swaps | | | | | | | (1,346,357 | ) |
Foreign currency denominated assets and liabilities | | | | | | | (3,151 | ) |
| | | | | | | | |
Net gain on investment and foreign currency transactions | | | | | | | 46,356,741 | |
| | | | | | | | |
Net Increase in Net Assets from Operations | | | | | | $ | 48,368,933 | |
| | | | | | | | |
| (a) | Net of foreign capital gains taxes of $43,313. |
| (b) | Net of decrease in accrued foreign capital gains taxes of $15,856. |
See notes to consolidated financial statements.
| | |
| |
| abfunds.com | | AB ALL MARKET TOTAL RETURN PORTFOLIO | 99 |
CONSOLIDATED STATEMENT OF CHANGES IN NET ASSETS
| | | | | | | | |
| | | Six Months Ended
February 28, 2021
(unaudited) | | | Year Ended
August 31,
2020 | |
Increase (Decrease) in Net Assets
from Operations | | | | | | | | |
Net investment income | | $ | 2,012,192 | | | $ | 8,118,187 | |
Net realized gain (loss) on investment and foreign currency transactions | | | 61,687,899 | | | | (39,734,102 | ) |
Net change in unrealized appreciation/depreciation of investments and foreign currency denominated assets and liabilities | | | (15,331,158 | ) | | | 38,551,348 | |
Contributions from Affiliates (see Note B) | | | – 0 | – | | | 13,090 | |
| | | | | | | | |
Net increase in net assets from operations | | | 48,368,933 | | | | 6,948,523 | |
| Distributions to Shareholders | |
Class A | | | (15,587,969 | ) | | | (16,836,692 | ) |
Class C | | | (391,667 | ) | | | (679,299 | ) |
Advisor Class | | | (2,421,226 | ) | | | (2,608,100 | ) |
Class R | | | (83,732 | ) | | | (83,171 | ) |
Class K | | | (206,196 | ) | | | (296,351 | ) |
Class I | | | (8,700 | ) | | | (8,115 | ) |
| Transactions in Shares of Beneficial Interest | | | | | | | | |
Net decrease | | | (23,181,363 | ) | | | (65,423,089 | ) |
Proceeds from third party vendor (see Note F) | | | – 0 | – | | | 13,089 | |
| | | | | | | | |
Total increase (decrease) | | | 6,488,080 | | | | (78,973,205 | ) |
| Net Assets | | | | | | | | |
Beginning of period | | | 639,569,775 | | | | 718,542,980 | |
| | | | | | | | |
End of period | | $ | 646,057,855 | | | $ | 639,569,775 | |
| | | | | | | | |
See notes to consolidated financial statements.
| | |
| |
100 | AB ALL MARKET TOTAL RETURN PORTFOLIO | | abfunds.com |
NOTES TO CONSOLIDATED FINANCIAL STATEMENTS
February 28, 2021 (unaudited)
NOTE A
Significant Accounting Policies
The AB Portfolios (the “Company”) is registered under the Investment Company Act of 1940 as a diversified, open end management investment company. The Company, which is a Massachusetts Business Trust, operates as a series company currently comprised of six series. Each series is considered to be a separate entity for financial reporting and tax purposes. This report relates only to the AB All Market Total Return Portfolio (the “Fund”). As part of the Fund’s investment strategy, the Fund seeks to gain exposure to commodities and commodities-related instruments and derivatives primarily through investments in AB All Market Total Return Portfolio (Cayman), Ltd., a wholly-owned subsidiary of the Fund organized under the laws of the Cayman Islands (the “Subsidiary”). The Fund is the sole shareholder of the Subsidiary and it is intended that the Fund will remain the sole shareholder and will continue to control the Subsidiary. Under the Articles of Association of the Subsidiary, shares issued by the Subsidiary confer upon a shareholder the right to receive notice of, to attend and to vote at general meetings of the Subsidiary and shall confer upon the shareholder rights in a winding-up or repayment of capital and the right to participate in the profits or assets of the Subsidiary. As of February 28, 2021, net assets of the Fund were $646,057,855, of which $19,419,656, or approximately 3%, represented the Fund’s ownership of all issued shares and voting rights of the Subsidiary. This report presents the consolidated financial statements of the Fund and the Subsidiary. All intercompany transactions and balances have been eliminated in consolidation. The Fund offers Class A, Class C, Advisor Class, Class R, Class K and Class I shares. Class B and Class T shares have been authorized but currently are not offered. Effective August 2, 2019, sales of Class B shares were suspended. On November 7, 2019, all remaining outstanding Class B shares of the Fund were converted to Class A shares. Class A shares are sold with a front-end sales charge of up to 4.25% for purchases not exceeding $1,000,000. With respect to purchases of $1,000,000 or more, Class A shares redeemed within one year of purchase may be subject to a contingent deferred sales charge of 1%. Class C shares are subject to a contingent deferred sales charge of 1% on redemptions made within the first year after purchase, and 0% after the first year of purchase. Class C shares will automatically convert to Class A shares ten years after the end of the calendar month of purchase. Class R and Class K shares are sold without an initial or contingent deferred sales charge. Advisor Class and Class I shares are sold without an initial or contingent deferred sales charge and are not subject to ongoing distribution expenses. All eight classes of shares have identical voting, dividend, liquidation and other rights, except that the classes bear different distribution and transfer agency expenses. Each class has exclusive voting rights with
| | |
| |
| abfunds.com | | AB ALL MARKET TOTAL RETURN PORTFOLIO | 101 |
NOTES TO CONSOLIDATED FINANCIAL STATEMENTS (continued)
respect to its distribution plan. The consolidated financial statements have been prepared in conformity with U.S. generally accepted accounting principles (“U.S. GAAP”), which require management to make certain estimates and assumptions that affect the reported amounts of assets and liabilities in the consolidated financial statements and amounts of income and expenses during the reporting period. Actual results could differ from those estimates. The Fund is an investment company under U.S. GAAP and follows the accounting and reporting guidance applicable to investment companies. The following is a summary of significant accounting policies followed by the Fund.
1. Security Valuation
Portfolio securities are valued at their current market value determined on the basis of market quotations or, if market quotations are not readily available or are deemed unreliable, at “fair value” as determined in accordance with procedures established by and under the general supervision of the Company’s Board of Trustees (the “Board”).
In general, the market values of securities which are readily available and deemed reliable are determined as follows: securities listed on a national securities exchange (other than securities listed on the NASDAQ Stock Market, Inc. (“NASDAQ”)) or on a foreign securities exchange are valued at the last sale price at the close of the exchange or foreign securities exchange. If there has been no sale on such day, the securities are valued at the last traded price from the previous day. Securities listed on more than one exchange are valued by reference to the principal exchange on which the securities are traded; securities listed only on NASDAQ are valued in accordance with the NASDAQ Official Closing Price; listed or over the counter (“OTC”) market put or call options are valued at the mid level between the current bid and ask prices. If either a current bid or current ask price is unavailable, AllianceBernstein L.P. (the “Adviser”) will have discretion to determine the best valuation (e.g., last trade price in the case of listed options); open futures are valued using the closing settlement price or, in the absence of such a price, the most recent quoted bid price. If there are no quotations available for the day of valuation, the last available closing settlement price is used; U.S. Government securities and any other debt instruments having 60 days or less remaining until maturity are generally valued at market by an independent pricing vendor, if a market price is available. If a market price is not available, the securities are valued at amortized cost. This methodology is commonly used for short term securities that have an original maturity of 60 days or less, as well as short term securities that had an original term to maturity that exceeded 60 days. In instances when amortized cost is utilized, the Valuation Committee (the “Committee”) must reasonably conclude that the utilization of amortized cost is approximately the same as the fair value of the security.
| | |
| |
102 | AB ALL MARKET TOTAL RETURN PORTFOLIO | | abfunds.com |
NOTES TO CONSOLIDATED FINANCIAL STATEMENTS (continued)
Such factors the Committee will consider include, but are not limited to, an impairment of the creditworthiness of the issuer or material changes in interest rates. Fixed-income securities, including mortgage-backed and asset-backed securities, may be valued on the basis of prices provided by a pricing service or at a price obtained from one or more of the major broker-dealers. In cases where broker-dealer quotes are obtained, the Adviser may establish procedures whereby changes in market yields or spreads are used to adjust, on a daily basis, a recently obtained quoted price on a security. Swaps and other derivatives are valued daily, primarily using independent pricing services, independent pricing models using market inputs, as well as third party broker-dealers or counterparties. Open-end mutual funds are valued at the closing net asset value per share, while exchange traded funds are valued at the closing market price per share.
Securities for which market quotations are not readily available (including restricted securities) or are deemed unreliable are valued at fair value as deemed appropriate by the Adviser. Factors considered in making this determination may include, but are not limited to, information obtained by contacting the issuer, analysts, analysis of the issuer’s financial statements or other available documents. In addition, the Fund may use fair value pricing for securities primarily traded in non-U.S. markets because most foreign markets close well before the Fund values its securities at 4:00 p.m., Eastern Time. The earlier close of these foreign markets gives rise to the possibility that significant events, including broad market moves, may have occurred in the interim and may materially affect the value of those securities. To account for this, the Fund generally values many of its foreign equity securities using fair value prices based on third party vendor modeling tools to the extent available.
2. Fair Value Measurements
In accordance with U.S. GAAP regarding fair value measurements, fair value is defined as the price that the Fund would receive to sell an asset or pay to transfer a liability in an orderly transaction between market participants at the measurement date. U.S. GAAP establishes a framework for measuring fair value, and a three-level hierarchy for fair value measurements based upon the transparency of inputs to the valuation of an asset or liability (including those valued based on their market values as described in Note A.1 above). Inputs may be observable or unobservable and refer broadly to the assumptions that market participants would use in pricing the asset or liability. Observable inputs reflect the assumptions market participants would use in pricing the asset or liability based on market data obtained from sources independent of the Fund. Unobservable inputs reflect the Fund’s own assumptions about the assumptions that market participants would use in pricing the asset or
| | |
| |
| abfunds.com | | AB ALL MARKET TOTAL RETURN PORTFOLIO | 103 |
NOTES TO CONSOLIDATED FINANCIAL STATEMENTS (continued)
liability based on the best information available in the circumstances. Each investment is assigned a level based upon the observability of the inputs which are significant to the overall valuation. The three-tier hierarchy of inputs is summarized below.
| | • | | Level 1—quoted prices in active markets for identical investments |
| | • | | Level 2—other significant observable inputs (including quoted prices for similar investments, interest rates, prepayment speeds, credit risk, etc.) |
| | • | | Level 3—significant unobservable inputs (including the Fund’s own assumptions in determining the fair value of investments) |
The fair value of debt instruments, such as bonds, and over-the-counter derivatives is generally based on market price quotations, recently executed market transactions (where observable) or industry recognized modeling techniques and are generally classified as Level 2. Pricing vendor inputs to Level 2 valuations may include quoted prices for similar investments in active markets, interest rate curves, coupon rates, currency rates, yield curves, option adjusted spreads, default rates, credit spreads and other unique security features in order to estimate the relevant cash flows which are then discounted to calculate fair values. If these inputs are unobservable and significant to the fair value, these investments will be classified as Level 3.
Where readily available market prices or relevant bid prices are not available for certain equity investments, such investments may be valued based on similar publicly traded investments, movements in relevant indices since last available prices or based upon underlying company fundamentals and comparable company data (such as multiples to earnings or other multiples to equity). Where an investment is valued using an observable input, such as another publicly traded security, the investment will be classified as Level 2. If management determines that an adjustment is appropriate based on restrictions on resale, illiquidity or uncertainty, and such adjustment is a significant component of the valuation, the investment will be classified as Level 3. An investment will also be classified as Level 3 where management uses company fundamentals and other significant inputs to determine the valuation.
Options are valued using market-based inputs to models, broker or dealer quotations, or alternative pricing sources with reasonable levels of price transparency, where such inputs and models are available. Alternatively, the values may be obtained through unobservable management determined inputs and/or management’s proprietary models. Where models are used, the selection of a particular model to value an option depends upon the contractual terms of, and specific risks inherent in, the
| | |
| |
104 | AB ALL MARKET TOTAL RETURN PORTFOLIO | | abfunds.com |
NOTES TO CONSOLIDATED FINANCIAL STATEMENTS (continued)
option as well as the availability of pricing information in the market. Valuation models require a variety of inputs, including contractual terms, market prices, measures of volatility and correlations of such inputs. Exchange traded options generally will be classified as Level 2. For options that do not trade on exchange but trade in liquid markets, inputs can generally be verified and model selection does not involve significant management judgment. Options are classified within Level 2 on the fair value hierarchy when all of the significant inputs can be corroborated to market evidence. Otherwise such instruments are classified as Level 3.
Valuations of mortgage-backed or other asset-backed securities, by pricing vendors, are based on both proprietary and industry recognized models and discounted cash flow techniques. Significant inputs to the valuation of these instruments are value of the collateral, the rates and timing of delinquencies, the rates and timing of prepayments, and default and loss expectations, which are driven in part by housing prices for residential mortgages. Significant inputs are determined based on relative value analyses, which incorporate comparisons to instruments with similar collateral and risk profiles, including relevant indices. Mortgage and asset-backed securities for which management has collected current observable data through pricing services are generally categorized within Level 2. Those investments for which current observable data has not been provided are classified as Level 3.
Bank loan prices are provided by third party pricing services and consist of a composite of the quotes received by the vendor into a consensus price. Certain bank loans are classified as Level 3, as a significant input used in the fair value measurement of these instruments is the market quotes that are received by the vendor and these inputs are not observable.
Other fixed income investments, including non-U.S. government and corporate debt, are generally valued using quoted market prices, if available, which are typically impacted by current interest rates, maturity dates and any perceived credit risk of the issuer. Additionally, in the absence of quoted market prices, these inputs are used by pricing vendors to derive a valuation based upon industry or proprietary models which incorporate issuer specific data with relevant yield/spread comparisons with more widely quoted bonds with similar key characteristics. Those investments for which there are observable inputs are classified as Level 2. Where the inputs are not observable, the investments are classified as Level 3.
| | |
| |
| abfunds.com | | AB ALL MARKET TOTAL RETURN PORTFOLIO | 105 |
NOTES TO CONSOLIDATED FINANCIAL STATEMENTS (continued)
The following table summarizes the valuation of the Fund’s investments by the above fair value hierarchy levels as of February 28, 2021:
| | | | | | | | | | | | | | | | |
Investments in
Securities: | | Level 1 | | | Level 2 | | | Level 3 | | | Total | |
Assets: | | | | | | | | | | | | | | | | |
Common Stocks: | | | | | | | | | | | | | | | | |
Information Technology | | $ | 84,008,246 | | | $ | 16,929,509 | | | $ | – 0 | – | | $ | 100,937,755 | |
Health Care | | | 52,204,306 | | | | 12,443,375 | | | | 0 | (a) | | | 64,647,681 | |
Financials | | | 36,703,498 | | | | 16,222,464 | | | | – 0 | – | | | 52,925,962 | |
Consumer Discretionary | | | 32,247,547 | | | | 13,398,164 | | | | 132,127 | (a) | | | 45,777,838 | |
Industrials | | | 22,618,196 | | | | 10,648,151 | | | | – 0 | – | | | 33,266,347 | |
Communication Services | | | 22,027,745 | | | | 4,122,004 | | | | – 0 | – | | | 26,149,749 | |
Consumer Staples | | | 5,111,895 | | | | 7,568,298 | | | | 113,286 | | | | 12,793,479 | |
Materials | | | 6,284,787 | | | | 3,872,595 | | | | 0 | (a) | | | 10,157,382 | |
Utilities | | | 5,565,198 | | | | 1,797,614 | | | | – 0 | – | | | 7,362,812 | |
Energy | | | 2,252,301 | | | | 2,163,070 | | | | 6,154 | (a) | | | 4,421,525 | |
Real Estate | | | 3,012,062 | | | | 1,134,158 | | | | – 0 | – | | | 4,146,220 | |
Corporates – Non-Investment Grade | | | – 0 | – | | | 36,998,776 | | | | 10,336 | (a) | | | 37,009,112 | |
Investment Companies | | | 36,129,206 | | | | – 0 | – | | | – 0 | – | | | 36,129,206 | |
Emerging Markets – Sovereigns | | | – 0 | – | | | 11,397,537 | | | | – 0 | – | | | 11,397,537 | |
Governments – Treasuries | | | – 0 | – | | | 10,043,585 | | | | – 0 | – | | | 10,043,585 | |
Corporates – Investment Grade | | | – 0 | – | | | 9,111,016 | | | | – 0 | – | | | 9,111,016 | |
Bank Loans | | | – 0 | – | | | 4,301,987 | | | | 1,139,520 | | | | 5,441,507 | |
Collateralized Mortgage Obligations | | | – 0 | – | | | 4,683,455 | | | | – 0 | – | | | 4,683,455 | |
Emerging Markets – Corporate Bonds | | | – 0 | – | | | 4,265,980 | | | | 155 | (a) | | | 4,266,135 | |
Collateralized Loan Obligations | | | – 0 | – | | | 1,844,409 | | | | – 0 | – | | | 1,844,409 | |
Quasi-Sovereigns | | | – 0 | – | | | 1,327,685 | | | | – 0 | – | | | 1,327,685 | |
Asset-Backed Securities | | | – 0 | – | | | 984,257 | | | | – 0 | – | | | 984,257 | |
Commercial Mortgage-Backed Securities | | | – 0 | – | | | 387,656 | | | | – 0 | – | | | 387,656 | |
Governments – Sovereign Bonds | | | – 0 | – | | | 224,250 | | | | – 0 | – | | | 224,250 | |
Emerging Markets – Treasuries | | | – 0 | – | | | 221,275 | | | | – 0 | – | | | 221,275 | |
Preferred Stocks | | | 118,570 | | | | – 0 | – | | | 90,968 | | | | 209,538 | |
Warrants | | | 42,738 | | | | – 0 | – | | | 24,902 | (a) | | | 67,640 | |
Mortgage Pass-Throughs | | | – 0 | – | | | 119 | | | | – 0 | – | | | 119 | |
Short-Term Investments: | | | | | | | | | | | | | | | | |
Investment Companies | | | 147,893,610 | | | | – 0 | – | | | – 0 | – | | | 147,893,610 | |
U.S. Treasury Bills | | | – 0 | – | | | 1,999,899 | | | | – 0 | – | | | 1,999,899 | |
Investments of Cash Collateral for Securities Loaned in Affiliated Money Market Fund | | | 3,831,960 | | | | – 0 | – | | | – 0 | – | | | 3,831,960 | |
| | | | | | | | | | | | | | | | |
Total Investments in Securities | | | 460,051,865 | | | | 178,091,288 | | | | 1,517,448 | | | | 639,660,601 | |
| | |
| |
106 | AB ALL MARKET TOTAL RETURN PORTFOLIO | | abfunds.com |
NOTES TO CONSOLIDATED FINANCIAL STATEMENTS (continued)
| | | | | | | | | | | | | | | | |
Investments in
Securities: | | Level 1 | | | Level 2 | | | Level 3 | | | Total | |
Other Financial Instruments(b): | | | | | | | | | | | | | | | | |
Assets: | |
Futures | | $ | 7,234,789 | | | $ | 337,625 | | | $ | – 0 | – | | $ | 7,572,414 | (c) |
Forward Currency Exchange Contracts | | | – 0 | – | | | 3,567,447 | | | | – 0 | – | | | 3,567,447 | |
Centrally Cleared Interest Rate Swaps | | | – 0 | – | | | 1,239,269 | | | | – 0 | – | | | 1,239,269 | (c) |
Centrally Cleared Credit Default Swaps | | | – 0 | – | | | 3,348,197 | | | | – 0 | – | | | 3,348,197 | (c) |
Credit Default Swaps | | | – 0 | – | | | 611,821 | | | | – 0 | – | | | 611,821 | |
Inflation (CPI) Swaps | | | – 0 | – | | | 63,794 | | | | – 0 | – | | | 63,794 | |
Total Return Swaps | | | – 0 | – | | | 11,072,246 | | | | – 0 | – | | | 11,072,246 | |
Variance Swaps | | | – 0 | – | | | 321,150 | | | | – 0 | – | | | 321,150 | |
Liabilities: | |
Futures | | | (6,306,421 | ) | | | (261,274 | ) | | | – 0 | – | | | (6,567,695 | )(c) |
Forward Currency Exchange Contracts | | | – 0 | – | | | (3,150,815 | ) | | | – 0 | – | | | (3,150,815 | ) |
Centrally Cleared Interest Rate Swaps | | | – 0 | – | | | (2,293,680 | ) | | | – 0 | – | | | (2,293,680 | )(c) |
Centrally Cleared Credit Default Swaps | | | – 0 | – | | | (124,958 | ) | | | – 0 | – | | | (124,958 | )(c) |
Credit Default Swaps | | | – 0 | – | | | (2,988,564 | ) | | | – 0 | – | | | (2,988,564 | ) |
Total Return Swaps | | | – 0 | – | | | (5,255,704 | ) | | | – 0 | – | | | (5,255,704 | ) |
Variance Swaps | | | – 0 | – | | | (969,329 | ) | | | – 0 | – | | | (969,329 | ) |
| | | | | | | | | | | | | | | | |
Total | | $ | 460,980,233 | | | $ | 183,608,513 | | | $ | 1,517,448 | | | $ | 646,106,194 | |
| | | | | | | | | | | | | | | | |
| (a) | The Fund held securities with zero market value at period end. |
| (b) | Other financial instruments are derivative instruments, such as futures, forwards and swaps, which are valued at the unrealized appreciation/(depreciation) on the instrument. Other financial instruments may also include swaps with upfront premiums, options written and swaptions written which are valued at market value. |
| (c) | Only variation margin receivable/(payable) at period end is reported within the consolidated statement of assets and liabilities. This amount reflects cumulative unrealized appreciation/(depreciation) on futures and centrally cleared swaps as reported in the consolidated portfolio of investments. Where applicable, centrally cleared swaps with upfront premiums are presented here at market value. |
3. Currency Translation
Assets and liabilities denominated in foreign currencies and commitments under forward currency exchange contracts are translated into U.S. dollars at the mean of the quoted bid and ask prices of such currencies against the U.S. dollar. Purchases and sales of portfolio securities are translated into U.S. dollars at the rates of exchange prevailing when such securities were acquired or sold. Income and expenses are translated into U.S. dollars at rates of exchange prevailing when accrued.
Net realized gain or loss on foreign currency transactions represents foreign exchange gains and losses from sales and maturities of foreign fixed income investments, holding of foreign currencies, currency gains or losses realized between the trade and settlement dates on foreign investment
| | |
| |
| abfunds.com | | AB ALL MARKET TOTAL RETURN PORTFOLIO | 107 |
NOTES TO CONSOLIDATED FINANCIAL STATEMENTS (continued)
transactions, and the difference between the amounts of dividends, interest and foreign withholding taxes recorded on the Fund’s books and the U.S. dollar equivalent amounts actually received or paid. Net unrealized currency gains and losses from valuing foreign currency denominated assets and liabilities at period end exchange rates are reflected as a component of net unrealized appreciation or depreciation of foreign currency denominated assets and liabilities.
4. Taxes
It is the Fund’s policy to meet the requirements of the Internal Revenue Code applicable to regulated investment companies and to distribute all of its investment company taxable income and net realized gains, if any, to shareholders. Therefore, no provisions for federal income or excise taxes are required. The Fund may be subject to taxes imposed by countries in which it invests. Such taxes are generally based on income and/or capital gains earned or repatriated. Taxes are accrued and applied to net investment income, net realized gains and net unrealized appreciation/depreciation as such income and/or gains are earned.
If, during a taxable year, the Subsidiary’s taxable losses (and other deductible items) exceed its income and gains, the net loss will not pass through to the Fund as a deductible amount for federal income tax purposes. Note that the loss from the Subsidiary’s contemplated activities also cannot be carried forward to reduce future Subsidiary’s income in subsequent years. However, if the Subsidiary’s taxable gains exceed its losses and other deductible items during a taxable year, the net gain will pass through to the Fund as income for federal income tax purposes.
In accordance with U.S. GAAP requirements regarding accounting for uncertainties in income taxes, management has analyzed the Fund’s tax positions taken or expected to be taken on federal and state income tax returns for all open tax years (the current and the prior three tax years) and has concluded that no provision for income tax is required in the Fund’s consolidated financial statements.
5. Investment Income and Investment Transactions
Dividend income is recorded on the ex-dividend date or as soon as the Fund is informed of the dividend. Interest income is accrued daily. Investment gains or losses are determined on the identified cost basis. The Fund amortizes premiums and accretes discounts as adjustments to interest income. Investment transactions are accounted for on the date the securities are purchased or sold. The Fund accounts for distributions received from REIT investments or from regulated investment companies as dividend income, realized gain, or return of capital based on information provided by the REIT or the investment company.
| | |
| |
108 | AB ALL MARKET TOTAL RETURN PORTFOLIO | | abfunds.com |
NOTES TO CONSOLIDATED FINANCIAL STATEMENTS (continued)
6. Class Allocations
All income earned and expenses incurred by the Fund are borne on a pro-rata basis by each outstanding class of shares, based on the proportionate interest in the Fund represented by the net assets of such class, except for class specific expenses which are allocated to the respective class. Expenses of the Company are charged proportionately to each series or based on other appropriate methods. Realized and unrealized gains and losses are allocated among the various share classes based on respective net assets.
7. Dividends and Distributions
Dividends and distributions to shareholders, if any, are recorded on the ex-dividend date. Income dividends and capital gains distributions are determined in accordance with federal tax regulations and may differ from those determined in accordance with U.S. GAAP. To the extent these differences are permanent, such amounts are reclassified within the capital accounts based on their federal tax basis treatment; temporary differences do not require such reclassification.
NOTE B
Advisory Fee and Other Transactions with Affiliates
Under the terms of the investment advisory agreement (the “Advisory Agreement”), the Fund pays the Adviser an advisory fee at an annual rate of .55% of the first $2.5 billion, .45% of the next $2.5 billion and .40% in excess of $5 billion of the Fund’s average daily net assets. The fee is accrued daily and paid monthly.
The Subsidiary has entered into a separate agreement with the Adviser for the management of the Subsidiary’s portfolio. The Adviser receives no compensation from the Subsidiary for its services under the agreement.
The Fund compensates AllianceBernstein Investor Services, Inc. (“ABIS”), a wholly-owned subsidiary of the Adviser, under a Transfer Agency Agreement for providing personnel and facilities to perform transfer agency services for the Fund. ABIS may make payments to intermediaries that provide omnibus account services, sub-accounting services and/or networking services. Such compensation retained by ABIS amounted to $92,827 for the six months ended February 28, 2021.
AllianceBernstein Investments, Inc. (the “Distributor”), a wholly-owned subsidiary of the Adviser, serves as the distributor of the Fund’s shares. The Distributor has advised the Fund that it has retained front-end sales charges of $2,613 from the sale of Class A shares and received $376 and $781 in contingent deferred sales charges imposed upon redemptions by shareholders of Class A and Class C shares, respectively, for the six months ended February 28, 2021.
| | |
| |
| abfunds.com | | AB ALL MARKET TOTAL RETURN PORTFOLIO | 109 |
NOTES TO CONSOLIDATED FINANCIAL STATEMENTS (continued)
The Fund may invest in AB Government Money Market Portfolio (the “Government Money Market Portfolio”) which has a contractual annual advisory fee rate of .20% of the portfolio’s average daily net assets and bears its own expenses. The Adviser has contractually agreed to waive .10% of the advisory fee of Government Money Market Portfolio (resulting in a net advisory fee of .10%) until August 31, 2021. In connection with the investment by the Fund in Government Money Market Portfolio, the Adviser has contractually agreed to waive its advisory fee from the Fund in an amount equal to the Fund’s pro rata share of the effective advisory fee of Government Money Market Portfolio, as borne indirectly by the Fund as an acquired fund fee and expense. For the six months ended February 28, 2021, such waiver amounted to $58,470.
A summary of the Fund’s transactions in AB mutual funds for the six months ended February 28, 2021 is as follows:
| | | | | | | | | | | | | | | | | | | | |
Fund | | Market Value
8/31/20
(000) | | | Purchases
at Cost
(000) | | | Sales
Proceeds
(000) | | | Market Value
2/28/21
(000) | | | Dividend
Income
(000) | |
Government Money Market Portfolio | | $ | 110,385 | | | $ | 239,324 | | | $ | 201,815 | | | $ | 147,894 | | | $ | 20 | |
Government Money Market Portfolio* | | | 7,426 | | | | 83,613 | | | | 87,207 | | | | 3,832 | | | | 1 | |
| | | | | | | | | | | | | | | | | | | | |
Total | | | | | | | | | | | | | | $ | 151,726 | | | $ | 21 | |
| | | | | | | | | | | | | | | | | | | | |
| * | Investments of cash collateral for securities lending transactions (see Note E). |
During the year ended August 31, 2020, the Adviser reimbursed the Fund $13,090 for trading losses incurred due to a trade entry error.
During the second quarter of 2018, AXA S.A. (“AXA”), a French holding company for the AXA Group, completed the sale of a minority stake in its subsidiary, AXA Equitable Holdings, Inc. (now named Equitable Holdings, Inc.)(“Equitable”), through an initial public offering. Equitable is the holding company for a diverse group of financial services companies, including an approximate 65% economic interest in the Adviser and a 100% interest in AllianceBernstein Corporation, the general partner of the Adviser. Since the initial sale, AXA has completed additional offerings, most recently during the fourth quarter of 2019. As a result, AXA currently owns less than 10% of the outstanding shares of common stock of Equitable, and no longer owns a controlling interest in Equitable. AXA previously announced its intention to sell its entire interest in Equitable over time, subject to market conditions and other factors (the “Plan”). Most of AXA’s remaining
| | |
| |
110 | AB ALL MARKET TOTAL RETURN PORTFOLIO | | abfunds.com |
NOTES TO CONSOLIDATED FINANCIAL STATEMENTS (continued)
Equitable shares are to be delivered on redemption of AXA bonds mandatorily exchangeable into Equitable shares and maturing in May 2021. AXA retains sole discretion to determine the timing of any future sales of its remaining shares of Equitable common stock.
Sales under the Plan that were completed on November 13, 2019 resulted in the indirect transfer of a “controlling block” of voting securities of the Adviser (a “Change of Control Event”) and may have been deemed to have been an “assignment” causing a termination of the Fund’s investment advisory and administration agreements. In order to ensure that investment advisory and administration services could continue uninterrupted in the event of a Change of Control Event, the Board previously approved new investment advisory and administration agreements with the Adviser, and shareholders of the Fund subsequently approved the new investment advisory agreement. These agreements became effective on November 13, 2019.
NOTE C
Distribution Plan
The Fund has adopted a Plan for each class of shares of the Fund pursuant to Rule 12b-1 under the Investment Company Act of 1940 (the “Plan”). Under the Plan, the Fund pays distribution and servicing fees to the Distributor at an annual rate of up to .50% of the Fund’s average daily net assets attributable to Class A shares, 1% of the Fund’s average daily net assets attributable to Class C shares, .50% of the Fund’s average daily net assets attributable to Class R shares and .25% of the Fund’s average daily net assets attributable to Class K shares. There are no distribution and servicing fees on the Advisor Class and Class I shares. The fees are accrued daily and paid monthly. Payments under the Plan in respect of Class A shares are currently limited to an annual rate of .25% of Class A shares’ average daily net assets. The Plan provides that the Distributor will use such payments in their entirety for distribution assistance and promotional activities. The Fund is not obligated under the Plan to pay any distribution services fee in excess of the amounts set forth above. The purpose of the payments to the Distributor under the Plan is to compensate the Distributor for its distribution services with respect to the sale of the Fund’s shares. Since the Distributor’s compensation is not directly tied to its expenses, the amount of compensation received by it under the Plan during any year may be more or less than its actual expenses. For this reason, the Plan is characterized by the staff of the Securities Exchange Commission as being a “compensation” plan.
In the event that the Plan is terminated or not continued, no distribution services fees (other than current amounts accrued but not yet paid) would be owed by the Fund to the Distributor with respect to the relevant class.
| | |
| |
| abfunds.com | | AB ALL MARKET TOTAL RETURN PORTFOLIO | 111 |
NOTES TO CONSOLIDATED FINANCIAL STATEMENTS (continued)
The Plan also provides that the Adviser may use its own resources to finance the distribution of the Fund’s shares.
NOTE D
Investment Transactions
Purchases and sales of investment securities (excluding short-term investments) for the six months ended February 28, 2021 were as follows:
| | | | | | | | |
| | | Purchases | | | Sales | |
Investment securities (excluding U.S. government securities) | | $ | 297,895,540 | | | $ | 357,312,919 | |
U.S. government securities | | | 3,740,137 | | | | 5,934,177 | |
The cost of investments for federal income tax purposes was substantially the same as the cost for financial reporting purposes. Accordingly, gross unrealized appreciation and unrealized depreciation are as follows:
| | | | |
Gross unrealized appreciation | | $ | 96,818,951 | |
Gross unrealized depreciation | | | (27,856,739 | ) |
| | | | |
Net unrealized appreciation | | $ | 68,962,212 | |
| | | | |
1. Derivative Financial Instruments
The Fund may use derivatives in an effort to earn income and enhance returns, to replace more traditional direct investments, to obtain exposure to otherwise inaccessible markets (collectively, “investment purposes”), or to hedge or adjust the risk profile of its portfolio.
The principal types of derivatives utilized by the Fund, as well as the methods in which they may be used are:
The Fund may buy or sell futures for investment purposes or for the purpose of hedging its portfolio against adverse effects of potential movements in the market. The Fund bears the market risk that arises from changes in the value of these instruments and the imperfect correlation between movements in the price of the futures and movements in the price of the assets, reference rates or indices which they are designed to track. Among other things, the Fund may purchase or sell futures for foreign currencies or options thereon for non-hedging purposes as a means of making direct investment in foreign currencies, as described below under “Currency Transactions”.
At the time the Fund enters into futures, the Fund deposits and maintains as collateral an initial margin with the broker, as required by the exchange on which the transaction is effected. Such amount is shown as cash collateral due from broker on the consolidated
| | |
| |
112 | AB ALL MARKET TOTAL RETURN PORTFOLIO | | abfunds.com |
NOTES TO CONSOLIDATED FINANCIAL STATEMENTS (continued)
statement of assets and liabilities. Pursuant to the contract, the Fund agrees to receive from or pay to the broker an amount of cash equal to the daily fluctuation in the value of the contract. Such receipts or payments are known as variation margin and are recorded by the Fund as unrealized gains or losses. Risks may arise from the potential inability of a counterparty to meet the terms of the contract. The credit/counterparty risk for exchange-traded futures is generally less than privately negotiated futures, since the clearinghouse, which is the issuer or counterparty to each exchange-traded future, has robust risk mitigation standards, including the requirement to provide initial and variation margin. When the contract is closed, the Fund records a realized gain or loss equal to the difference between the value of the contract at the time it was opened and the time it was closed.
Use of long futures subjects the Fund to risk of loss in excess of the amounts shown on the consolidated statement of assets and liabilities, up to the notional value of the futures. Use of short futures subjects the Fund to unlimited risk of loss. Under some circumstances, futures exchanges may establish daily limits on the amount that the price of futures can vary from the previous day’s settlement price, which could effectively prevent liquidation of unfavorable positions.
During the six months ended February 28, 2021, the Fund held futures for hedging and non-hedging purposes.
| | • | | Forward Currency Exchange Contracts |
The Fund may enter into forward currency exchange contracts in order to hedge its exposure to changes in foreign currency exchange rates on its foreign portfolio holdings, to hedge certain firm purchase and sale commitments denominated in foreign currencies and for non-hedging purposes as a means of making direct investments in foreign currencies, as described below under “Currency Transactions”.
A forward currency exchange contract is a commitment to purchase or sell a foreign currency at a future date at a negotiated forward rate. The gain or loss arising from the difference between the original contract and the closing of such contract would be included in net realized gain or loss on forward currency exchange contracts. Fluctuations in the value of open forward currency exchange contracts are recorded for financial reporting purposes as unrealized appreciation and/or depreciation by the Fund. Risks may arise from the potential inability of a counterparty to meet the terms of a contract and from unanticipated movements in the value of a foreign currency relative to the U.S. dollar.
| | |
| |
| abfunds.com | | AB ALL MARKET TOTAL RETURN PORTFOLIO | 113 |
NOTES TO CONSOLIDATED FINANCIAL STATEMENTS (continued)
During the six months ended February 28, 2021, the Fund held forward currency exchange contracts for hedging and non-hedging purposes.
For hedging and investment purposes, the Fund may purchase and write (sell) put and call options on U.S. and foreign securities, including government securities, and foreign currencies that are traded on U.S. and foreign securities exchanges and over-the-counter markets. Among other things, the Fund may use options transactions for non-hedging purposes as a means of making direct investments in foreign currencies, as described below under “Currency Transactions” and may use options strategies involving the purchase and/or writing of various combinations of call and/or put options, for hedging and investment purposes.
The risk associated with purchasing an option is that the Fund pays a premium whether or not the option is exercised. Additionally, the Fund bears the risk of loss of the premium and change in market value should the counterparty not perform under the contract. If a put or call option purchased by the Fund were permitted to expire without being sold or exercised, its premium would represent a loss to the Fund. Put and call options purchased are accounted for in the same manner as portfolio securities. The cost of securities acquired through the exercise of call options is increased by premiums paid. The proceeds from securities sold through the exercise of put options are decreased by the premiums paid.
When the Fund writes an option, the premium received by the Fund is recorded as a liability and is subsequently adjusted to the current market value of the option written. The Fund’s maximum payment for written put options equates to the number of shares multiplied by the strike price. In certain circumstances maximum payout amounts may be partially offset by recovery values of the respective referenced assets and upfront premium received upon entering into the contract. Premiums received from written options which expire unexercised are recorded by the Fund on the expiration date as realized gains from options written. The difference between the premium received and the amount paid on effecting a closing purchase transaction, including brokerage commissions, is also treated as a realized gain, or if the premium received is less than the amount paid for the closing purchase transaction, as a realized loss. If a call option is exercised, the premium received is added to the proceeds from the sale of the underlying security or currency in determining whether the Fund has realized a gain or loss. If a put option is exercised, the premium received reduces the cost basis of the security or currency purchased
| | |
| |
114 | AB ALL MARKET TOTAL RETURN PORTFOLIO | | abfunds.com |
NOTES TO CONSOLIDATED FINANCIAL STATEMENTS (continued)
by the Fund. In writing an option, the Fund bears the market risk of an unfavorable change in the price of the security or currency underlying the written option. Exercise of an option written by the Fund could result in the Fund selling or buying a security or currency at a price different from the current market value.
The Fund may also invest in options on swap agreements, also called “swaptions”. A swaption is an option that gives the buyer the right, but not the obligation, to enter into a swap on a future date in exchange for paying a market-based “premium”. A receiver swaption gives the owner the right to receive the total return of a specified asset, reference rate, or index. A payer swaption gives the owner the right to pay the total return on a specified asset, reference rate, or index. Swaptions also include options that allow an existing swap to be terminated or extended by one of the counterparties. The Fund’s maximum payment for written put swaptions equates to the notional amount of the underlying swap. In certain circumstances maximum payout amounts may be partially offset by recovery values of the respective referenced assets and upfront premium received upon entering into the contract.
During the six months ended February 28, 2021, the Fund held written options for hedging and non-hedging purposes.
During the six months ended February 28, 2021, the Fund held purchased swaptions for hedging and non-hedging purposes.
The Fund may enter into swaps to hedge its exposure to interest rates, credit risk, equity markets or currencies. The Fund may also enter into swaps for non-hedging purposes as a means of gaining market exposures, making direct investments in foreign currencies, as described below under “Currency Transactions” or in order to take a “long” or “short” position with respect to an underlying referenced asset described below under “Total Return Swaps”. A swap is an agreement that obligates two parties to exchange a series of cash flows at specified intervals based upon or calculated by reference to changes in specified prices or rates for a specified amount of an underlying asset. The payment flows are usually netted against each other, with the difference being paid by one party to the other. In addition, collateral may be pledged or received by the Fund in accordance with the terms of the respective swaps to provide value and recourse to the Fund or its counterparties in the event of default, bankruptcy or insolvency by one of the parties to the swap.
Risks may arise as a result of the failure of the counterparty to the swap to comply with the terms of the swap. The loss incurred by the
| | |
| |
| abfunds.com | | AB ALL MARKET TOTAL RETURN PORTFOLIO | 115 |
NOTES TO CONSOLIDATED FINANCIAL STATEMENTS (continued)
failure of a counterparty is generally limited to the net interim payment to be received by the Fund, and/or the termination value at the end of the contract. Therefore, the Fund considers the creditworthiness of each counterparty to a swap in evaluating potential counterparty risk. This risk is mitigated by having a netting arrangement between the Fund and the counterparty and by the posting of collateral by the counterparty to the Fund to cover the Fund’s exposure to the counterparty. Additionally, risks may arise from unanticipated movements in interest rates or in the value of the underlying securities. The Fund accrues for the interim payments on swaps on a daily basis, with the net amount recorded within unrealized appreciation/depreciation of swaps on the consolidated statement of assets and liabilities, where applicable. Once the interim payments are settled in cash, the net amount is recorded as realized gain/(loss) on swaps on the consolidated statement of operations, in addition to any realized gain/(loss) recorded upon the termination of swaps. Upfront premiums paid or received for over the counter (“OTC”) swaps are recognized as cost or proceeds on the consolidated statement of assets and liabilities and are amortized on a straight line basis over the life of the contract. Amortized upfront premiums are included in net realized gain/(loss) from swaps on the consolidated statement of operations. Fluctuations in the value of swaps are recorded as a component of net change in unrealized appreciation/depreciation of swaps on the consolidated statement of operations.
Certain standardized swaps, including certain interest rate swaps and credit default swaps, are (or soon will be) subject to mandatory central clearing. Cleared swaps are transacted through futures commission merchants (“FCMs”) that are members of central clearinghouses, with the clearinghouse serving as central counterparty, similar to transactions in futures contracts. Centralized clearing will be required for additional categories of swaps on a phased-in basis based on requirements published by the Securities and Exchange Commission and Commodity Futures Trading Commission.
At the time the Fund enters into a centrally cleared swap, the Fund deposits and maintains as collateral an initial margin with the broker, as required by the clearinghouse on which the transaction is effected. Such amount is shown as cash collateral due from broker on the consolidated statement of assets and liabilities. Pursuant to the contract, the Fund agrees to receive from or pay to the broker an amount of cash equal to the daily fluctuation in the value of the contract. Such receipts or payments are known as variation margin and are recorded by the Fund as unrealized gains or losses. Risks may arise from the potential inability of a counterparty to meet the terms of the contract. The credit/counterparty risk for centrally cleared
| | |
| |
116 | AB ALL MARKET TOTAL RETURN PORTFOLIO | | abfunds.com |
NOTES TO CONSOLIDATED FINANCIAL STATEMENTS (continued)
swaps is generally less than non-centrally cleared swaps, since the clearinghouse, which is the issuer or counterparty to each centrally cleared swap, has robust risk mitigation standards, including the requirement to provide initial and variation margin. When the contract is closed, the Fund records a realized gain or loss equal to the difference between the value of the contract at the time it was opened and the time it was closed.
Interest Rate Swaps:
The Fund is subject to interest rate risk exposure in the normal course of pursuing its investment objectives. Because the Fund holds fixed rate bonds, the value of these bonds may decrease if interest rates rise. To help hedge against this risk and to maintain its ability to generate income at prevailing market rates, the Fund may enter into interest rate swaps. Interest rate swaps are agreements between two parties to exchange cash flows based on a notional amount. The Fund may elect to pay a fixed rate and receive a floating rate, or, receive a fixed rate and pay a floating rate on a notional amount.
In addition, the Fund may also enter into interest rate swap transactions to preserve a return or spread on a particular investment or portion of its portfolio, or protecting against an increase in the price of securities the Fund anticipates purchasing at a later date. Interest rate swaps involve the exchange by a Fund with another party of their respective commitments to pay or receive interest (e.g., an exchange of floating rate payments for fixed rate payments) computed based on a contractually-based principal (or “notional”) amount. Interest rate swaps are entered into on a net basis (i.e., the two payment streams are netted out, with the Fund receiving or paying, as the case may be, only the net amount of the two payments).
During the six months ended February 28, 2021, the Fund held interest rate swaps for hedging and non-hedging purposes.
Inflation (CPI) Swaps:
Inflation swap agreements are contracts in which one party agrees to pay the cumulative percentage increase in a price index (the Consumer Price Index with respect to CPI swaps) over the term of the swap (with some lag on the inflation index), and the other pays a compounded fixed rate. Inflation swaps may be used to protect the net asset value, or NAV, of a Fund against an unexpected change in the rate of inflation measured by an inflation index since the value of these agreements is expected to increase if there are unexpected inflation increases.
During the six months ended February 28, 2021, the Fund held inflation (CPI) swaps for hedging and non-hedging purposes.
| | |
| |
| abfunds.com | | AB ALL MARKET TOTAL RETURN PORTFOLIO | 117 |
NOTES TO CONSOLIDATED FINANCIAL STATEMENTS (continued)
Credit Default Swaps:
The Fund may enter into credit default swaps, including to manage its exposure to the market or certain sectors of the market, to reduce its risk exposure to defaults by corporate and sovereign issuers held by the Fund, or to create exposure to corporate or sovereign issuers to which it is not otherwise exposed. The Fund may purchase credit protection (“Buy Contract”) or provide credit protection (“Sale Contract”) on the referenced obligation of the credit default swap. During the term of the swap, the Fund receives/(pays) fixed payments from/(to) the respective counterparty, calculated at the agreed upon rate applied to the notional amount. If the Fund is a buyer/(seller) of protection and a credit event occurs, as defined under the terms of the swap, the Fund will either (i) receive from the seller/(pay to the buyer) of protection an amount equal to the notional amount of the swap (the “Maximum Payout Amount”) and deliver/(take delivery of) the referenced obligation or (ii) receive/(pay) a net settlement amount in the form of cash or securities equal to the notional amount of the swap less the recovery value of the referenced obligation. In certain circumstances Maximum Payout Amounts may be partially offset by recovery values of the respective referenced obligations, upfront premium received upon entering into the agreement, or net amounts received from settlement of buy protection credit default swaps entered into by the Fund for the same referenced obligations with the same counterparty.
Credit default swaps may involve greater risks than if a Fund had invested in the referenced obligation directly. Credit default swaps are subject to general market risk, liquidity risk, counterparty risk and credit risk. If the Fund is a buyer of protection and no credit event occurs, it will lose the payments it made to its counterparty. If the Fund is a seller of protection and a credit event occurs, the value of the referenced obligation received by the Fund coupled with the periodic payments previously received, may be less than the Maximum Payout Amount it pays to the buyer, resulting in a net loss to the Fund.
Implied credit spreads over U.S. Treasuries of comparable maturity utilized in determining the market value of credit default swaps on issuers as of period end are disclosed in the portfolio of investments. The implied spreads serve as an indicator of the current status of the payment/performance risk and typically reflect the likelihood of default by the issuer of the referenced obligation. The implied credit spread of a particular reference obligation also reflects the cost of buying/selling protection and may reflect upfront payments required to be made to enter into the agreement. Widening credit spreads typically represent a deterioration of the referenced obligation’s credit soundness and
| | |
| |
118 | AB ALL MARKET TOTAL RETURN PORTFOLIO | | abfunds.com |
NOTES TO CONSOLIDATED FINANCIAL STATEMENTS (continued)
greater likelihood of default or other credit event occurring as defined under the terms of the agreement. A credit spread identified as “Defaulted” indicates a credit event has occurred for the referenced obligation.
During the six months ended February 28, 2021, the Fund held credit default swaps for hedging and non-hedging purposes.
Total Return Swaps:
The Fund may enter into total return swaps in order to take a “long” or “short” position with respect to an underlying referenced asset. The Fund is subject to market price volatility of the underlying referenced asset. A total return swap involves commitments to pay interest in exchange for a market linked return based on a notional amount. To the extent that the total return of the security, group of securities or index underlying the transaction exceeds or falls short of the offsetting interest obligation, the Fund will receive a payment from or make a payment to the counterparty.
During the six months ended February 28, 2021, the Fund held total return swaps for hedging and non-hedging purposes.
Variance Swaps:
The Fund may enter into variance swaps to hedge equity market risk or adjust exposure to the equity markets. Variance swaps are contracts in which two parties agree to exchange cash payments based on the difference between the stated level of variance and the actual variance realized on underlying asset(s) or index(es). Actual “variance” as used here is defined as the sum of the square of the returns on the reference asset(s) or index(es) (which in effect is a measure of its “volatility”) over the length of the contract term. So the parties to a variance swap can be said to exchange actual volatility for a contractually stated rate of volatility.
During the six months ended February 28, 2021, the Fund held variance swaps for hedging and non-hedging purposes.
The Fund typically enters into International Swaps and Derivatives Association, Inc. Master Agreements (“ISDA Master Agreement”) with its OTC derivative contract counterparties in order to, among other things, reduce its credit risk to OTC counterparties. ISDA Master Agreements include provisions for general obligations, representations, collateral and events of default or termination. Under an ISDA Master Agreement, the Fund typically may offset with the OTC counterparty certain derivative financial instruments’ payables and/or receivables with collateral held and/or posted and create one single net payment (close-out netting) in the event of default or termination. In the event of a default by an OTC counterparty,
| | |
| |
| abfunds.com | | AB ALL MARKET TOTAL RETURN PORTFOLIO | 119 |
NOTES TO CONSOLIDATED FINANCIAL STATEMENTS (continued)
the return of collateral with market value in excess of the Fund’s net liability, held by the defaulting party, may be delayed or denied.
The Fund’s ISDA Master Agreements may contain provisions for early termination of OTC derivative transactions in the event the net assets of the Fund decline below specific levels (“net asset contingent features”). If these levels are triggered, the Fund’s OTC counterparty has the right to terminate such transaction and require the Fund to pay or receive a settlement amount in connection with the terminated transaction. If OTC derivatives were held at period end, please refer to netting arrangements by the OTC counterparty table below for additional details.
During the six months ended February 28, 2021, the Fund had entered into the following derivatives:
| | | | | | | | | | | | |
| | | Asset Derivatives | | | Liability Derivatives | |
Derivative Type | | Consolidated
Statement of
Assets and
Liabilities
Location | | Fair Value | | | Consolidated
Statement of
Assets and
Liabilities
Location | | Fair Value | |
Interest rate contracts | | Receivable/Payable for variation margin on futures | | $ | 1,850,884 | * | | Receivable/Payable for variation margin on futures | | $ | 5,501,558 | * |
| | | | |
Equity contracts | | Receivable/Payable for variation margin on futures | | | 5,721,530 | * | | Receivable/Payable for variation margin on futures | | | 1,066,137 | * |
| | | | |
Credit contracts | | Receivable/Payable for variation margin on centrally cleared swaps | | | 1,496,064 | * | | Receivable/Payable for variation margin on centrally cleared swaps | | | 40,777 | * |
| | | | |
Interest rate contracts | | Receivable/Payable for variation margin on centrally cleared swaps | | | 192,456 | * | | Receivable/Payable for variation margin on centrally cleared swaps | | | 2,398,756 | * |
| | | | |
Foreign currency contracts | | Unrealized appreciation on forward currency exchange contracts | | | 3,567,447 | | | Unrealized depreciation on forward currency exchange contracts | | | 3,150,815 | |
| | | | |
Interest rate contracts | | Unrealized appreciation on inflation swaps | | | 63,794 | | | | | | | |
| | |
| |
120 | AB ALL MARKET TOTAL RETURN PORTFOLIO | | abfunds.com |
NOTES TO CONSOLIDATED FINANCIAL STATEMENTS (continued)
| | | | | | | | | | | | |
| | | Asset Derivatives | | | Liability Derivatives | |
Derivative Type | | Consolidated
Statement of
Assets and
Liabilities
Location | | Fair Value | | | Consolidated
Statement of
Assets and
Liabilities
Location | | Fair Value | |
| | | | |
Credit contracts | | Market value on credit default swaps | | $ | 611,821 | | | Market value on credit default swaps | | $ | 2,988,564 | |
| | | | |
Interest contracts | | | | | | | | Unrealized depreciation on total return swaps | | | 1,677,378 | |
| | | | |
Credit contracts | | Unrealized appreciation on total return swaps | | | 13,598 | | | | | | | |
| | | | |
Commodity contracts | | Unrealized appreciation on total return swaps | | | 5,060,828 | | | | | | | |
| | | | |
Equity contracts | | Unrealized appreciation on total return swaps | | | 5,997,820 | | | Unrealized depreciation on total return swaps | | | 3,578,326 | |
| | | | |
Foreign currency contracts | | Unrealized appreciation on variance swaps | | | 23,704 | | | Unrealized depreciation on variance swaps | | | 99,655 | |
| | | | |
Equity contracts | | Unrealized appreciation on variance swaps | | | 297,446 | | | Unrealized depreciation on variance swaps | | | 869,674 | |
| | | | | | | | | | | | |
Total | | | | $ | 24,897,392 | | | | | $ | 21,371,640 | |
| | | | | | | | | | | | |
| * | Only variation margin receivable/payable at period end is reported within the consolidated statement of assets and liabilities. This amount reflects cumulative unrealized appreciation/(depreciation) on futures and centrally cleared swaps as reported in the consolidated portfolio of investments. |
| | | | | | | | | | |
Derivative Type | | Location of
Gain or (Loss)
on Derivatives
Within Consolidated
Statement of
Operations | | Realized Gain
or (Loss) on
Derivatives | | | Change in
Unrealized
Appreciation or
(Depreciation) | |
Interest rate contracts | | Net realized gain (loss) on futures; Net change in unrealized appreciation/depreciation of futures | | $ | (6,452,368 | ) | | $ | (4,199,498 | ) |
| | | |
Equity contracts | | Net realized gain (loss) on futures; Net change in unrealized appreciation/depreciation of futures | | | 19,300,442 | | | | (1,964,630 | ) |
| | |
| |
| abfunds.com | | AB ALL MARKET TOTAL RETURN PORTFOLIO | 121 |
NOTES TO CONSOLIDATED FINANCIAL STATEMENTS (continued)
| | | | | | | | | | |
Derivative Type | | Location of
Gain or (Loss)
on Derivatives
Within Consolidated
Statement of
Operations | | Realized Gain
or (Loss) on
Derivatives | | | Change in
Unrealized
Appreciation or
(Depreciation) | |
| | | |
Commodity contracts | | Net realized gain (loss) on futures; Net change in unrealized appreciation/depreciation of futures | | $ | (2,623,546 | ) | | $ | – 0 | – |
| | | |
Foreign currency contracts | | Net realized gain (loss) on forward currency exchange contracts; Net change in unrealized appreciation/depreciation of forward currency exchange contracts | | | (251,878 | ) | | | 840,519 | |
| | | |
Interest rate contracts | | Net realized gain (loss) on investment transactions; Net change in unrealized appreciation/depreciation of investments | | | 1,722 | | | | (2,467 | ) |
| | | |
Interest rate contracts | | Net realized gain (loss) on swaps; Net change in unrealized appreciation/depreciation of swaps | | | 1,854,464 | | | | (3,585,510 | ) |
| | | |
Commodity contracts | | Net realized gain (loss) on swaps; Net change in unrealized appreciation/depreciation of swaps | | | 9,507,580 | | | | (1,340,602 | ) |
| | | |
Foreign exchange contracts | | Net realized gain (loss) on swaps; Net change in unrealized appreciation/depreciation of swaps | | | (47,348 | ) | | | (66,178 | ) |
| | | |
Credit contracts | | Net realized gain (loss) on swaps; Net change in unrealized appreciation/depreciation of swaps | | | 2,668,417 | | | | (906,553 | ) |
| | | |
Equity contracts | | Net realized gain (loss) on swaps; Net change in unrealized appreciation/depreciation of swaps | | | (13,847,042 | ) | | | 4,552,486 | |
| | | | | | | | | | |
Total | | | | $ | 10,110,443 | | | $ | (6,672,433 | ) |
| | | | | | | | | | |
| | |
| |
122 | AB ALL MARKET TOTAL RETURN PORTFOLIO | | abfunds.com |
NOTES TO CONSOLIDATED FINANCIAL STATEMENTS (continued)
The following table represents the average monthly volume of the Fund’s derivative transactions during the six months ended February 28, 2021:
| | | | |
Futures: | | | | |
Average notional amount of buy contracts | | $ | 515,785,524 | |
Average notional amount of sale contracts | | $ | 151,593,915 | |
Forward Currency Exchange Contracts: | | | | |
Average principal amount of buy contracts | | $ | 178,940,472 | |
Average principal amount of sale contracts | | $ | 230,759,877 | |
Purchased Swaptions: | | | | |
Average notional amount | | $ | 584,400 | (a) |
Options Written: | | | | |
Average notional amount | | $ | 1,722,000 | (b) |
Inflation Swaps: | | | | |
Average notional amount | | $ | 16,620,000 | (c) |
Centrally Cleared Interest Rate Swaps: | | | | |
Average notional amount | | $ | 79,428,274 | |
Credit Default Swaps: | | | | |
Average notional amount of buy contracts | | $ | 1,815,000 | |
Average notional amount of sale contracts | | $ | 9,372,407 | |
Centrally Cleared Credit Default Swaps: | | | | |
Average notional amount of buy contracts | | $ | 2,214,329 | |
Average notional amount of sale contracts | | $ | 136,999,852 | |
Total Return Swaps: | | | | |
Average notional amount | | $ | 369,343,827 | |
Variance Swaps: | | | | |
Average notional amount | | $ | 9,316,304 | |
| (a) | Positions were open for four months during the period. |
| (b) | Positions were open for one month during the period. |
| (c) | Positions were open for three months during the period. |
For financial reporting purposes, the Fund does not offset derivative assets and derivative liabilities that are subject to netting arrangements in the consolidated statement of assets and liabilities.
All OTC derivatives held at period end were subject to netting arrangements. The following table presents the Fund’s derivative assets and liabilities by OTC counterparty net of amounts available for offset under ISDA Master Agreements (“MA”) and net of the related collateral received/pledged by the Fund as of February 28, 2021. Exchange-traded derivatives and centrally cleared swaps are not subject to netting arrangements and as such are excluded from the table.
| | |
| |
| abfunds.com | | AB ALL MARKET TOTAL RETURN PORTFOLIO | 123 |
NOTES TO CONSOLIDATED FINANCIAL STATEMENTS (continued)
AB All Market Total Return Portfolio
| | | | | | | | | | | | | | | | | | | | |
Counterparty | | Derivative
Assets
Subject
to a MA | | | Derivatives
Available
for Offset | | | Cash
Collateral
Received* | | | Security
Collateral
Received* | | | Net
Amount of
Derivative
Assets | |
Australia and New Zealand Banking Group Ltd. | | $ | 6,041 | | | $ | (2,678 | ) | | $ | – 0 | – | | $ | – 0 | – | | $ | 3,363 | |
Bank of America, NA | | | 514,062 | | | | (55,169 | ) | | | (458,893 | ) | | | – 0 | – | | | – 0 | – |
Barclays Bank PLC | | | 1,027,241 | | | | (1,027,241 | ) | | | – 0 | – | | | – 0 | – | | | – 0 | – |
BNP Paribas SA | | | 189,638 | | | | (130,546 | ) | | | – 0 | – | | | – 0 | – | | | 59,092 | |
Citibank, NA/ Citigroup Global Markets, Inc | | | 196,245 | | | | (196,245 | ) | | | – 0 | – | | | – 0 | – | | | – 0 | – |
Credit Suisse International | | | 154,600 | | | | (154,600 | ) | | | – 0 | – | | | – 0 | – | | | – 0 | – |
Deutsche Bank AG | | | 137,672 | | | | (137,672 | ) | | | – 0 | – | | | – 0 | – | | | – 0 | – |
Goldman Sachs Bank USA/Goldman Sachs International | | | 4,864,102 | | | | (2,075,137 | ) | | | (474,202 | ) | | | – 0 | – | | | 2,314,763 | |
HSBC Bank USA | | | 69,361 | | | | (35,025 | ) | | | – 0 | – | | | – 0 | – | | | 34,336 | |
JPMorgan Chase Bank, NA/JPMorgan Securities, LLC | | | 962,474 | | | | (962,474 | ) | | | – 0 | – | | | – 0 | – | | | – 0 | – |
Morgan Stanley & Co. International PLC/Morgan Stanley Capital Services LLC/Morgan Stanley Capital Services, Inc. | | | 1,119,537 | | | | (1,119,537 | ) | | | – 0 | – | | | – 0 | – | | | – 0 | – |
Natwest Markets PLC | | | 92,454 | | | | (92,454 | ) | | | – 0 | – | | | – 0 | – | | | – 0 | – |
Standard Chartered Bank | | | 378,704 | | | | (261,993 | ) | | | – 0 | – | | | – 0 | – | | | 116,711 | |
State Street Bank & Trust Co. | | | 132,669 | | | | (132,669 | ) | | | – 0 | – | | | – 0 | – | | | – 0 | – |
UBS AG | | | 730,830 | | | | (730,830 | ) | | | – 0 | – | | | – 0 | – | | | – 0 | – |
| | | | | | | | | | | | | | | | | | | | |
Total | | $ | 10,575,630 | | | $ | (7,114,270 | ) | | $ | (933,095 | ) | | $ | – 0 | – | | $ | 2,528,265 | ^ |
| | | | | | | | | | | | | | | | | | | | |
| | | | | |
Counterparty | | Derivative
Liabilities
Subject
to a MA | | | Derivatives
Available
for Offset | | | Cash
Collateral
Pledged* | | | Security
Collateral
Pledged* | | | Net
Amount of
Derivative
Liabilities | |
Australia and New Zealand Banking Group Ltd. | | $ | 2,678 | | | $ | (2,678 | ) | | $ | – 0 | – | | $ | – 0 | – | | $ | – 0 | – |
Bank of America, NA | | | 55,169 | | | | (55,169 | ) | | | – 0 | – | | | – 0 | – | | | – 0 | – |
Barclays Bank PLC | | | 2,225,025 | | | | (1,027,241 | ) | | | (1,197,784 | ) | | | – 0 | – | | | – 0 | – |
BNP Paribas SA | | | 130,546 | | | | (130,546 | ) | | | – 0 | – | | | – 0 | – | | | – 0 | – |
Citibank, NA/Citigroup Global Markets, Inc | | | 948,310 | | | | (196,245 | ) | | | – 0 | – | | | (752,065 | ) | | | – 0 | – |
| | |
| |
124 | AB ALL MARKET TOTAL RETURN PORTFOLIO | | abfunds.com |
NOTES TO CONSOLIDATED FINANCIAL STATEMENTS (continued)
| | | | | | | | | | | | | | | | | | | | |
Counterparty | | Derivative
Liabilities
Subject
to a MA | | | Derivatives
Available
for Offset | | | Cash
Collateral
Pledged* | | | Security
Collateral
Pledged* | | | Net
Amount of
Derivative
Liabilities | |
Credit Suisse International | | $ | 1,496,905 | | | $ | (154,600 | ) | | $ | (330,000 | ) | | $ | (1,012,305 | ) | | $ | – 0 | – |
Deutsche Bank AG | | | 1,240,882 | | | | (137,672 | ) | | | – 0 | – | | | (912,632 | ) | | | 190,578 | |
Goldman Sachs Bank USA/Goldman Sachs International | | | 2,075,137 | | | | (2,075,137 | ) | | | – 0 | – | | | – 0 | – | | | – 0 | – |
HSBC Bank USA | | | 35,025 | | | | (35,025 | ) | | | – 0 | – | | | – 0 | – | | | – 0 | – |
JPMorgan Chase Bank, NA/JPMorgan Securities, LLC | | | 1,357,845 | | | | (962,474 | ) | | | – 0 | – | | | (395,371 | ) | | | – 0 | – |
Morgan Stanley & Co. International PLC/Morgan Stanley Capital Services LLC/Morgan Stanley Capital Services, Inc. | | | 1,345,080 | | | | (1,119,537 | ) | | | (225,543 | ) | | | – 0 | – | | | – 0 | – |
Natwest Markets PLC | | | 176,026 | | | | (92,454 | ) | | | – 0 | – | | | – 0 | – | | | 83,572 | |
Standard Chartered Bank | | | 261,993 | | | | (261,993 | ) | | | – 0 | – | | | – 0 | – | | | – 0 | – |
State Street Bank & Trust Co. | | | 267,800 | | | | (132,669 | ) | | | – 0 | – | | | – 0 | – | | | 135,131 | |
UBS AG | | | 745,991 | | | | (730,830 | ) | | | – 0 | – | | | – 0 | – | | | 15,161 | |
| | | | | | | | | | | | | | | | | | | | |
Total | | $ | 12,364,412 | | | $ | (7,114,270 | ) | | $ | (1,753,327 | ) | | $ | (3,072,373 | ) | | $ | 424,442 | ^ |
| | | | | | | | | | | | | | | | | | | | |
| * | The actual collateral received/pledged may be more than the amount reported due to over-collateralization. |
| ^ | Net amount represents the net receivable/payable that would be due from/to the counterparty in the event of default or termination. The net amount from OTC financial derivative instruments can only be netted across transactions governed under the same master agreement with the same counterparty. |
AB All Market Total Return Portfolio (Cayman), Ltd.
| | | | | | | | | | | | | | | | | | | | |
Counterparty | | Derivative
Assets
Subject
to a MA | | | Derivative
Available
for Offset | | | Cash
Collateral
Received* | | | Security
Collateral
Received* | | | Net
Amount of
Derivative
Assets | |
Morgan Stanley Capital Services LLC | | $ | 5,060,828 | | | $ | – 0 | – | | $ | (5,060,828 | ) | | $ | – 0 | – | | $ | – 0 | – |
| | | | | | | | | | | | | | | | | | | | |
Total | | $ | 5,060,828 | | | $ | – 0 | – | | $ | (5,060,828 | ) | | $ | – 0 | – | | $ | 0 | ^ |
| | | | | | | | | | | | | | | | | | | | |
| * | The actual collateral received/pledged may be more than the amount reported due to over-collateralization. |
| ^ | Net amount represents the net receivable/payable that would be due from/to the counterparty in the event of default or termination. The net amount from OTC financial derivative instruments can only be netted across transactions governed under the same master agreement with the same counterparty. |
| | |
| |
| abfunds.com | | AB ALL MARKET TOTAL RETURN PORTFOLIO | 125 |
NOTES TO CONSOLIDATED FINANCIAL STATEMENTS (continued)
2. Currency Transactions
The Fund may invest in non-U.S. Dollar-denominated securities on a currency hedged or unhedged basis. The Fund may seek investment opportunities by taking long or short positions in currencies through the use of currency-related derivatives, including forward currency exchange contracts, futures and options on futures, swaps, and other options. The Fund may enter into transactions for investment opportunities when it anticipates that a foreign currency will appreciate or depreciate in value but securities denominated in that currency are not held by the Fund and do not present attractive investment opportunities. Such transactions may also be used when the Adviser believes that it may be more efficient than a direct investment in a foreign currency-denominated security. The Fund may also conduct currency exchange contracts on a spot basis (i.e., for cash at the spot rate prevailing in the currency exchange market for buying or selling currencies).
NOTE E
Securities Lending
The Fund may enter into securities lending transactions. Under the Fund’s securities lending program, all loans of securities will be collateralized continually by cash collateral and/or non-cash collateral. Non-cash collateral will include only securities issued or guaranteed by the U.S. government or its agencies or instrumentalities. The Fund cannot sell or repledge any non-cash collateral, such collateral will not be reflected in the portfolio of investments. If a loan is collateralized by cash, the Fund will be compensated for the loan from a portion of the net return from the income earned on cash collateral after a rebate is paid to the borrower (in some cases, this rebate may be a “negative rebate” or fee paid by the borrower to the Fund in connection with the loan), and payments are made for fees of the securities lending agent and for certain other administrative expenses. If the Fund receives non-cash collateral, the Fund will receive a fee from the borrower generally equal to a negotiated percentage of the market value of the loaned securities. The Fund will have the right to call a loan and obtain the securities loaned at any time on notice to the borrower within the normal and customary settlement time for the securities. While the securities are on loan, the borrower is obligated to pay the Fund amounts equal to any income or other distributions from the securities; however, these distributions will not be afforded the same preferential tax treatment as qualified dividends. The Fund will not be able to exercise voting rights with respect to any securities during the existence of a loan, but will have the right to regain ownership of loaned securities in order to exercise voting or other ownership rights. Collateral received and securities loaned are marked to market daily to ensure that the securities loaned are secured by collateral. The lending agent currently invests the cash collateral received in Government Money Market Portfolio, an eligible money market vehicle,
| | |
| |
126 | AB ALL MARKET TOTAL RETURN PORTFOLIO | | abfunds.com |
NOTES TO CONSOLIDATED FINANCIAL STATEMENTS (continued)
in accordance with the investment restrictions of the Fund, and as approved by the Board. The collateral received on securities loaned is recorded as an asset as well as a corresponding liability in the consolidated statement of assets and liabilities. The collateral will be adjusted the next business day to maintain the required collateral amount. The amounts of securities lending income from the borrowers and Government Money Market Portfolio are reflected in the consolidated statement of operations. When the Fund earns net securities lending income from Government Money Market Portfolio, the income is inclusive of a rebate expense paid to the borrower. In connection with the cash collateral investment by the Fund in Government Money Market Portfolio, the Adviser has agreed to waive a portion of the Fund’s share of the advisory fees of Government Money Market Portfolio, as borne indirectly by the Fund as an acquired fund fee and expense. When the Fund lends securities, its investment performance will continue to reflect changes in the value of the securities loaned. A principal risk of lending portfolio securities is that the borrower may fail to return the loaned securities upon termination of the loan and that the collateral will not be sufficient to replace the loaned securities. The lending agent has agreed to indemnify the Fund in the case of default of any securities borrower.
A summary of the Fund’s transactions surrounding securities lending for the six months ended February 28, 2021 is as follows:
| | | | | | | | | | | | | | | | | | | | | | |
Market Value
of Securities
on Loan* | | | Cash
Collateral* | | | Market Value
of Non-Cash
Collateral* | | | Income from
Borrowers | | | Government Money
Market Portfolio | |
| | Income
Earned | | | Advisory
Fee
Waived | |
| $ | 6,853,010 | | | $ | 3,831,960 | | | $ | 3,316,922 | | | $ | 90,547 | | | $ | 1,494 | | | $ | 950 | |
| * | As of February 28, 2021. |
| | |
| |
| abfunds.com | | AB ALL MARKET TOTAL RETURN PORTFOLIO | 127 |
NOTES TO CONSOLIDATED FINANCIAL STATEMENTS (continued)
NOTE F
Shares of Beneficial Interest
Transactions in shares of beneficial interest for each class were as follows:
| | | | | | | | | | | | | | | | | | | | | | | | |
| | | | | | | | | | | | | | | | | | | | | | | | |
| | | Shares | | | | | | Amount | | | | |
| | | Six Months Ended
February 28, 2021
(unaudited) | | | Year Ended
August 31,
2020 | | | | | | Six Months Ended
February 28, 2021
(unaudited) | | | Year Ended
August 31,
2020 | | | | |
| | | | | | | | |
| Class A | | | | | | | | | | | | | | | | | | | | | |
Shares sold | | | 213,371 | | | | 622,360 | | | | | | | $ | 3,400,915 | | | $ | 9,358,148 | | | | | |
| | | | | |
Shares issued in reinvestment of dividends | | | 877,313 | | | | 967,561 | | | | | | | | 13,940,496 | | | | 15,229,411 | | | | | |
| | | | | |
Shares converted from Class B | | | – 0 | – | | | 283,623 | | | | | | | | – 0 | – | | | 4,520,626 | | | | | |
| | | | | |
Shares converted from Class C | | | 259,969 | | | | 630,784 | | | | | | | | 4,067,773 | | | | 9,440,569 | | | | | |
| | | | | |
Shares redeemed | | | (2,395,005 | ) | | | (5,154,462 | ) | | | | | | | (38,125,941 | ) | | | (76,766,552 | ) | | | | |
| | | | | |
Net decrease | | | (1,044,352 | ) | | | (2,650,134 | ) | | | | | | $ | (16,716,757 | ) | | $ | (38,217,798 | ) | | | | |
| | | | | |
| | | | | | | | | | | | | | | | | | | | | | | | |
| Class B | | | | | |
Shares sold | | | – 0 | – | | | 4,704 | | | | | | | $ | – 0 | – | | $ | 73,542 | | | | | |
| | | | | |
Shares converted to Class A | | | – 0 | – | | | (285,587 | ) | | | | | | | – 0 | – | | | (4,520,626 | ) | | | | |
| | | | | |
Shares redeemed | | | – 0 | – | | | (5,416 | ) | | | | | | | – 0 | – | | | (85,024 | ) | | | | |
| | | | | |
Net decrease | | | – 0 | – | | | (286,299 | ) | | | | | | $ | – 0 | – | | $ | (4,532,108 | ) | | | | |
| | | | | |
| | | | | | | | | | | | | | | | | | | | | | | | |
| Class C | | | | | |
Shares sold | | | 24,052 | | | | 90,051 | | | | | | | $ | 374,803 | | | $ | 1,347,759 | | | | | |
| | | | | |
Shares issued in reinvestment of dividends | | | 22,012 | | | | 38,020 | | | | | | | | 347,117 | | | | 592,745 | | | | | |
| | | | | |
Shares converted to Class A | | | (263,662 | ) | | | (639,837 | ) | | | | | | | (4,067,773 | ) | | | (9,440,569 | ) | | | | |
| | | | | |
Shares redeemed | | | (120,166 | ) | | | (410,112 | ) | | | | | | | (1,884,051 | ) | | | (5,953,201 | ) | | | | |
| | | | | |
Net decrease | | | (337,764 | ) | | | (921,878 | ) | | | | | | $ | (5,229,904 | ) | | $ | (13,453,266 | ) | | | | |
| | | | | |
| | | | | | | | | | | | | | | | | | | | | | | | |
| Advisor Class | | | | | |
Shares sold | | | 364,609 | | | | 716,344 | | | | | | | $ | 5,889,333 | | | $ | 10,900,093 | | | | | |
| | | | | |
Shares issued in reinvestment of dividends | | | 124,470 | | | | 136,144 | | | | | | | | 1,996,503 | | | | 2,161,969 | | | | | |
| | | | | |
Shares redeemed | | | (555,643 | ) | | | (1,256,049 | ) | | | | | | | (9,024,646 | ) | | | (18,567,221 | ) | | | | |
| | | | | |
Net decrease | | | (66,564 | ) | | | (403,561 | ) | | | | | | $ | (1,138,810 | ) | | $ | (5,505,159 | ) | | | | |
| | | | | |
| | |
| |
128 | AB ALL MARKET TOTAL RETURN PORTFOLIO | | abfunds.com |
NOTES TO CONSOLIDATED FINANCIAL STATEMENTS (continued)
| | | | | | | | | | | | | | | | | | | | | | | | |
| | | | | | | | | | | | | | | | | | | | | | | | |
| | | Shares | | | | | | Amount | | | | |
| | | Six Months Ended
February 28, 2021
(unaudited) | | | Year Ended
August 31,
2020 | | | | | | Six Months Ended
February 28, 2021
(unaudited) | | | Year Ended
August 31,
2020 | | | | |
| | | | | | | | |
| Class R | | | | | |
Shares sold | | | 18,579 | | | | 21,684 | | | | | | | $ | 292,590 | | | $ | 323,497 | | | | | |
| | | | | |
Shares issued in reinvestment of dividends | | | 5,306 | | | | 5,318 | | | | | | | | 83,732 | | | | 83,171 | | | | | |
| | | | | |
Shares redeemed | | | (16,208 | ) | | | (91,412 | ) | | | | | | | (253,648 | ) | | | (1,393,994 | ) | | | | |
| | | | | |
Net increase (decrease) | | | 7,677 | | | | (64,410 | ) | | | | | | $ | 122,674 | | | $ | (987,326 | ) | | | | |
| | | | | |
| | | | | | | | | | | | | | | | | | | | | | | | |
| Class K | | | | | |
Shares sold | | | 14,508 | | | | 67,213 | | | | | | | $ | 228,864 | | | $ | 1,005,825 | | | | | |
| | | | | |
Shares issued in reinvestment of dividends | | | 13,017 | | | | 18,900 | | | | | | | | 206,194 | | | | 296,349 | | | | | |
| | | | | |
Shares redeemed | | | (41,877 | ) | | | (265,800 | ) | | | | | | | (664,258 | ) | | | (4,049,331 | ) | | | | |
| | | | | |
Net decrease | | | (14,352 | ) | | | (179,687 | ) | | | | | | $ | (229,200 | ) | | $ | (2,747,157 | ) | | | | |
| | | | | |
| | | | | | | | | | | | | | | | | | | | | | | | |
| Class I | | | | | |
Shares sold | | | 250 | | | | 918 | | | | | | | $ | 4,073 | | | $ | 14,197 | | | | | |
| | | | | |
Shares issued in reinvestment of dividends | | | 440 | | | | 409 | | | | | | | | 7,135 | | | | 6,558 | | | | | |
| | | | | |
Shares redeemed | | | (35 | ) | | | (66 | ) | | | | | | | (574 | ) | | | (1,030 | ) | | | | |
| | | | | |
Net increase | | | 655 | | | | 1,261 | | | | | | | $ | 10,634 | | | $ | 19,725 | | | | | |
| | | | | |
During the year ended August 31, 2020, a third party vendor reimbursed the Fund $13,089 for losses incurred due to a trade entry error. This amount is presented in the Fund’s consolidated statement of changes in net assets.
NOTE G
Risks Involved in Investing in the Fund
Market Risk—The value of the Fund’s assets will fluctuate as the stock, bond or commodities markets fluctuate. The value of its investments may decline, sometimes rapidly and unpredictably, simply because of economic changes or other events, including public health crises (including the occurrence of a contagious disease or illness), that affect large portions of the market. It includes the risk that a particular style of investing, such as growth or value, may be underperforming the stock market generally.
Allocation Risk—The allocation of investments among different investment styles, such as equity or debt, growth or value, U.S. or non-U.S. securities, or diversification strategies, may have a more significant effect on the Fund’s net asset value, or NAV, when one of these investments is performing more poorly than another.
| | |
| |
| abfunds.com | | AB ALL MARKET TOTAL RETURN PORTFOLIO | 129 |
NOTES TO CONSOLIDATED FINANCIAL STATEMENTS (continued)
Credit Risk—An issuer or guarantor of a fixed-income security, or the counterparty to a derivatives or other contract, may be unable or unwilling to make timely payments of interest or principal, or to otherwise honor its obligations. The issuer or guarantor may default, causing a loss of the full principal amount of a security and accrued interest. The degree of risk for a particular security may be reflected in its credit rating. There is the possibility that the credit rating of a fixed-income security may be downgraded after purchase, which may adversely affect the value of the security. Investments in fixed-income securities with lower ratings (commonly known as “junk bonds”) are subject to have a higher probability that an issuer will default or fail to meet its payment obligations.
High Yield Debt Securities Risk—Investments in fixed-income securities with lower ratings (commonly known as “junk bonds”) tend to have a higher probability that an issuer will default or fail to meet its payment obligations. These securities may be subject to greater price volatility due to such factors as specific corporate developments, interest rate sensitivity, negative perceptions of the junk bond market generally and less secondary market liquidity.
Interest Rate Risk—Changes in interest rates will affect the value of investments in fixed-income securities. When interest rates rise, the value of existing investments in fixed-income securities tends to fall and this decrease in value may not be offset by higher income from new investments. Interest rate risk is generally greater for fixed-income securities with longer maturities or durations. Very low or negative interest rates would likely magnify the risks associated with changes in interest rates. During periods of very low or negative rates, the Fund’s returns would likely be adversely affected.
Inflation Risk—This is the risk that the value of assets or income from investments will be less in the future as inflation decreases the value of money. As inflation increases, the value of the Fund’s assets can decline as can the value of the Fund’s distributions. This risk is significantly greater for fixed-income securities with longer maturities.
Foreign (Non-U.S.) Risk—Investments in securities of non-U.S. issuers may involve more risk than those of U.S. issuers. These securities may fluctuate more widely in price and may be more difficult to trade due to adverse market, economic, political, regulatory or other factors.
Currency Risk—Fluctuations in currency exchange rates may negatively affect the value of the Fund’s investments or reduce its returns.
| | |
| |
130 | AB ALL MARKET TOTAL RETURN PORTFOLIO | | abfunds.com |
NOTES TO CONSOLIDATED FINANCIAL STATEMENTS (continued)
Emerging Market Risk—Investments in emerging market countries may have more risk because the markets are less developed and less liquid as well as being subject to increased economic, political, regulatory or other uncertainties.
Alternative Investments Risk—Many alternative investments can be volatile and may be illiquid. Their performance may have little correlation with the performance of equity or fixed-income markets, and they may not perform in accordance with expectations.
Capitalization Risk—Investments in small- and mid-capitalization companies may be more volatile than investments in large-capitalization companies. Investments in small-capitalization companies may have additional risks because these companies have limited product lines, markets or financial resources.
Derivatives Risk—The Fund may enter into derivative transactions such as forwards, options, futures and swaps. Derivatives may be illiquid, difficult to price, and leveraged so that small changes may produce disproportionate losses for the Fund, and subject to counterparty risk to a greater degree than more traditional investments. Derivatives may result in significant losses, including losses that are far greater than the value of the derivatives reflected on the consolidated statement of assets and liabilities.
Leverage Risk—When the Fund borrows money or otherwise leverages its investments, its performance may be volatile because leverage tends to exaggerate the effect of any increase or decrease in the value of the Fund’s investments. The Fund may create leverage through the use of reverse repurchase arrangements, forward currency exchange contracts, forward commitments, dollar rolls or futures or by borrowing money. The use of other types of derivative instruments by the Fund, such as options and swaps, may also result in a form of leverage. Leverage may result in higher returns to the Fund than if the Fund were not leveraged, but may also adversely affect returns, particularly if the market is declining.
Commodity Risk—Investing in commodities and commodity-linked derivative instruments may subject the Fund to greater volatility than investments in traditional securities. The value of commodity-linked derivative instruments may be affected by overall market movements, commodity index volatility, changes in interest rates, or factors affecting a particular industry or commodity, such as drought, floods, weather, livestock disease, embargoes, tariffs and international economic, political and regulatory developments.
Subsidiary Risk—By investing in the Subsidiary, the Fund is indirectly exposed to the risks associated with the Subsidiary. The derivatives and
| | |
| |
| abfunds.com | | AB ALL MARKET TOTAL RETURN PORTFOLIO | 131 |
NOTES TO CONSOLIDATED FINANCIAL STATEMENTS (continued)
other investments held by the Subsidiary are generally similar to those that are permitted to be held by the Fund and are subject to the same risks that apply to similar investments if held directly by the Fund. The Subsidiary is not registered under the Investment Company Act of 1940, as amended (the “1940 Act”), and, unless otherwise noted in the Fund’s prospectus, is not subject to all of the investor protections of the 1940 Act. However, the Fund wholly owns and controls the Subsidiary, and the Fund and the Subsidiary are managed by the Adviser, making it unlikely the Subsidiary will take actions contrary to the interests of the Fund or its shareholders. In addition, changes in federal tax laws applicable to the Fund or interpretations thereof could limit the Fund’s ability to gain exposure to commodities investments through investments in the Subsidiary.
Short Sale Risk—The Fund is subject to short sale risk because it may engage in short sales either directly or indirectly through investment in the Underlying Portfolio. Short sales involve the risk that the Fund or Underlying Portfolio will incur a loss by subsequently buying a security at a higher price than the price at which it sold the security. The amount of such loss is theoretically unlimited, as it will be based on the increase in value of the security sold short. In contrast, the risk of loss from a long position is limited to the Fund’s or Underlying Portfolio’s investment in the security, because the price of the security cannot fall below zero. The Fund or Underlying Portfolio may not always be able to close out a short position on favorable terms.
LIBOR Transition and Associated Risk—A Fund may invest in debt securities, derivatives or other financial instruments that utilize the London Interbank Offered Rate, or “LIBOR,” as a “benchmark” or “reference rate” for various interest rate calculations. The United Kingdom Financial Conduct Authority, which regulates LIBOR, will cease publishing certain LIBOR benchmarks at the end of 2021. Although certain LIBOR rates are intended to be published until June 2023, banks are strongly encouraged to cease entering into agreements with counterparties referencing LIBOR by the end of 2021. Although financial regulators and industry working groups have suggested alternative reference rates, such as the European Interbank Offer Rate, the Sterling Overnight Interbank Average Rate and the Secured Overnight Financing Rate, global consensus on alternative rates is lacking and the process for amending existing contracts or instruments to transition away from LIBOR is underway but remains incomplete. The elimination of LIBOR or changes to other reference rates or any other changes or reforms to the determination or supervision of reference rates could have an adverse impact on the market for, or value of, any securities or payments linked to those reference rates, which may adversely affect a Fund’s performance and/or net asset value. Uncertainty and risk also
| | |
| |
132 | AB ALL MARKET TOTAL RETURN PORTFOLIO | | abfunds.com |
NOTES TO CONSOLIDATED FINANCIAL STATEMENTS (continued)
remain regarding the willingness and ability of issuers and lenders to include revised provisions in new and existing contracts or instruments. Consequently, the transition away from LIBOR to other reference rates may lead to increased volatility and illiquidity in markets that are tied to LIBOR, fluctuations in values of LIBOR-related investments or investments in issuers that utilize LIBOR, increased difficulty in borrowing or refinancing and diminished effectiveness of hedging strategies, potentially adversely affecting a Fund’s performance. Furthermore, the risks associated with the expected discontinuation of LIBOR and transition may be exacerbated if the work necessary to effect an orderly transition to an alternative reference rate is not completed in a timely manner. Because the usefulness of LIBOR as a benchmark could deteriorate during the transition period, these effects could occur prior to the end of 2021.
Indemnification Risk—In the ordinary course of business, the Fund enters into contracts that contain a variety of indemnifications. The Fund’s maximum exposure under these arrangements is unknown. However, the Fund has not had prior claims or losses pursuant to these indemnification provisions and expects the risk of loss thereunder to be remote. Therefore, the Fund has not accrued any liability in connection with these indemnification provisions.
Management Risk—The Fund is subject to management risk because it is an actively-managed investment fund. The Adviser will apply its investment techniques and risk analyses in making investment decisions for the Fund, but there is no guarantee that its techniques will produce the intended results. Some of these techniques may incorporate, or rely upon, quantitative models, but there is no guarantee that these models will generate accurate forecasts, reduce risk or otherwise perform as expected.
NOTE H
Joint Credit Facility
A number of open-end mutual funds managed by the Adviser, including the Fund, participate in a $325 million revolving credit facility (the “Facility”) intended to provide short-term financing, if necessary, subject to certain restrictions in connection with abnormal redemption activity. Commitment fees related to the Facility are paid by the participating funds and are included in miscellaneous expenses in the consolidated statement of operations. The Fund did not utilize the Facility during the six months ended February 28, 2021.
NOTE I
Distributions to Shareholders
The tax character of distributions to be paid for the year ending August 31, 2021 will be determined at the end of the current fiscal year. The tax
| | |
| |
| abfunds.com | | AB ALL MARKET TOTAL RETURN PORTFOLIO | 133 |
NOTES TO CONSOLIDATED FINANCIAL STATEMENTS (continued)
character of distributions paid during the fiscal years ended August 31, 2020 and August 31, 2019 were as follows:
| | | | | | | | |
| | | 2020 | | | 2019 | |
Distributions paid from: | | | | | | | | |
Ordinary income | | $ | 16,217,686 | | | $ | – 0 | – |
Net long-term capital gains | | | 4,294,042 | | | | – 0 | – |
| | | | | | | | |
Total taxable distributions paid | | $ | 20,511,728 | | | $ | – 0 | – |
| | | | | | | | |
As of August 31, 2020, the components of accumulated earnings/(deficit) on a tax basis were as follows:
| | | | |
Undistributed ordinary income | | $ | 337,946 | |
Accumulated capital and other losses | | | (29,123,439 | )(a) |
Unrealized appreciation/(depreciation) | | | 61,540,309 | (b) |
| | | | |
Total accumulated earnings/(deficit) | | $ | 32,754,816 | (c) |
| | | | |
| (a) | As of August 31, 2020, the Fund had a net capital loss carryforward of $28,482,558. As of August 31, 2020, the cumulative deferred loss on straddles was $640,881. |
| (b) | The differences between book-basis and tax-basis unrealized appreciation/(depreciation) are attributable primarily to the recognition for tax purposes of unrealized gains/losses on certain derivative instruments, the tax treatment of passive foreign investment companies (PFICs), the tax treatment of Treasury inflation-protected securities, the tax treatment of earnings from the Subsidiary, the tax treatment of swaps, and the tax deferral of losses on wash sales. |
| (c) | The differences between book-basis and tax-basis components of accumulated earnings/(deficit) are attributable primarily to the accrual of foreign capital gains tax and the tax treatment of defaulted securities. |
For tax purposes, net realized capital losses may be carried over to offset future capital gains, if any. Funds are permitted to carry forward capital losses for an indefinite period, and such losses will retain their character as either short-term or long-term capital losses.
As of August 31, 2020, the Fund had a net short-term capital loss carryforward of $28,482,558, which may be carried forward for an indefinite period.
NOTE J
Subsequent Events
As of February 28, 2021, Class C shares will automatically convert to Class A shares ten years after the end of the calendar month of their original purchase. Effective May 31, 2021, Class C shares will automatically convert to Class A shares after eight years instead of ten years.
Management has evaluated subsequent events for possible recognition or disclosure in the consolidated financial statements through the date the consolidated financial statements are issued. Management has determined that there are no other material events that would require disclosure in the Fund’s consolidated financial statements through this date.
| | |
| |
134 | AB ALL MARKET TOTAL RETURN PORTFOLIO | | abfunds.com |
CONSOLIDATED FINANCIAL HIGHLIGHTS
Selected Data For A Share Of Beneficial Interest Outstanding Throughout Each Period
| | | | | | | | | | | | | | | | | | | | | | | | |
| | | Class A | |
| | | Six Months
Ended
February 28,
2021
(unaudited)† | | | Year Ended August 31, | |
| | | 2020† | | | 2019† | | | 2018† | | | 2017† | | | 2016 | |
| | | | |
Net asset value, beginning of period | | | $ 15.44 | | | | $ 15.65 | | | | $ 14.78 | | | | $ 14.71 | | | | $ 13.85 | | | | $ 13.49 | |
| | | | |
Income From Investment Operations | | | | | | | | | | | | | | | | | | | | | | | | |
| | | | | | |
Net investment income(a)(b) | | | .05 | | | | .19 | | | | .21 | | | | .20 | | | | .44 | | | | .38 | |
| | | | | | |
Net realized and unrealized gain on investment transactions | | | 1.14 | | | | .07 | (c) | | | .66 | | | | .05 | | | | .85 | | | | .29 | |
| | | | | | |
Contributions from Affiliates | | | – 0 | – | | | .00 | (d) | | | .00 | (d) | | | .00 | (d) | | | – 0 | – | | | – 0 | – |
| | | | | | |
Capital contributions | | | – 0 | – | | | .00 | (d) | | | – 0 | – | | | – 0 | – | | | – 0 | – | | | – 0 | – |
| | | | |
Net increase in net asset value from operations | | | 1.19 | | | | .26 | | | | .87 | | | | .25 | | | | 1.29 | | | | .67 | |
| | | | |
Less: Dividends and Distributions | | | | | | | | | | | | | | | | | | | | | | | | |
| | | | | | |
Dividends from net investment income | | | (.47 | ) | | | (.34 | ) | | | – 0 | – | | | (.18 | ) | | | (.43 | ) | | | (.31 | ) |
| | | | | | |
Distributions from net realized gain on investment transactions | | | – 0 | – | | | (.13 | ) | | | – 0 | – | | | – 0 | – | | | – 0 | – | | | – 0 | – |
| | | | |
Total dividends and distributions | | | (.47 | ) | | | (.47 | ) | | | – 0 | – | | | (.18 | ) | | | (.43 | ) | | | (.31 | ) |
| | | | |
Net asset value, end of period | | | $ 16.16 | | | | $ 15.44 | | | | $ 15.65 | | | | $ 14.78 | | | | $ 14.71 | | | | $ 13.85 | |
| | | | |
| | | | | | |
Total Return | | | | | | | | | | | | | | | | | | | | | | | | |
| | | | | | |
Total investment return based on net asset value(e)* | | | 7.75 | % | | | 1.44 | % | | | 5.88 | % | | | 1.79 | % | | | 9.61 | % | | | 5.13 | % |
| | | | | | |
Ratios/Supplemental Data | | | | | | | | | | | | | | | | | | | | | | | | |
| | | | | | |
Net assets, end of period (000’s omitted) | | | $538,049 | | | | $530,168 | | | | $578,919 | | | | $620,635 | | | | $688,485 | | | | $684,917 | |
| | | | | | |
Ratio to average net assets of: | | | | | | | | | | | | | | | | | | | | | | | | |
| | | | | | |
Expenses, net of waivers/reimbursements(f)‡ | | | 1.02 | %^ | | | 1.03 | % | | | .96 | % | | | .84 | % | | | .83 | % | | | .86 | % |
| | | | | | |
Expenses, before waivers/reimbursements(f)‡ | | | 1.04 | %^ | | | 1.04 | % | | | 1.03 | % | | | 1.03 | % | | | .97 | % | | | .94 | % |
| | | | | | |
Net investment income(b) | | | .62 | %^ | | | 1.23 | % | | | 1.45 | % | | | 1.38 | % | | | 3.14 | % | | | 2.89 | % |
| | | | | | |
Portfolio turnover rate | | | 62 | % | | | 76 | % | | | 81 | % | | | 38 | % | | | 108 | % | | | 14 | % |
| | | | | | | | | | | | | | | | | | | | | | | | |
| |
‡ Expense ratios exclude the estimated acquired fund fees of the affiliated/unaffiliated underlying | |
portfolios | | | .03 | %^ | | | .02 | % | | | .07 | % | | | .20 | % | | | .31 | % | | | .31 | % |
See footnote summary on page 141.
| | |
| |
| abfunds.com | | AB ALL MARKET TOTAL RETURN PORTFOLIO | 135 |
CONSOLIDATED FINANCIAL HIGHLIGHTS (continued)
Selected Data For A Share Of Beneficial Interest Outstanding Throughout Each Period
| | | | | | | | | | | | | | | | | | | | | | | | |
| | | Class C | |
| | | Six Months
Ended
February 28,
2021 (unaudited)† | | | Year Ended August 31, | |
| | | 2020† | | | 2019† | | | 2018† | | | 2017† | | | 2016 | |
| | | | |
Net asset value, beginning of period | | | $ 15.20 | | | | $ 15.38 | | | | $ 14.64 | | | | $ 14.53 | | | | $ 13.68 | | | | $ 13.32 | |
| | | | |
Income From Investment Operations | | | | | | | | | | | | | | | | | | | | | | | | |
| | | | | | |
Net investment income (loss)(a)(b) | | | (.01 | ) | | | .08 | | | | .10 | | | | .09 | | | | .38 | | | | .29 | |
| | | | | | |
Net realized and unrealized
gain on investment transactions | | | 1.13 | | | | .05 | (c) | | | .64 | | | | .06 | | | | .79 | | | | .27 | |
| | | | | | |
Contributions from Affiliates | | | – 0 | – | | | .00 | (d) | | | .00 | (d) | | | .00 | (d) | | | – 0 | – | | | – 0 | – |
| | | | | | |
Capital contributions | | | – 0 | – | | | .00 | (d) | | | – 0 | – | | | – 0 | – | | | – 0 | – | | | – 0 | – |
| | | | |
Net increase in net asset
value from operations | | | 1.12 | | | | .13 | | | | .74 | | | | .15 | | | | 1.17 | | | | .56 | |
| | | | |
Less: Dividends and
Distributions | | | | | | | | | | | | | | | | | | | | | | | | |
| | | | | | |
Dividends from net
investment income | | | (.31 | ) | | | (.18 | ) | | | – 0 | – | | | (.04 | ) | | | (.32 | ) | | | (.20 | ) |
| | | | | | |
Distributions from net
realized gain on
investment transactions | | | – 0 | – | | | (.13 | ) | | | – 0 | – | | | – 0 | – | | | – 0 | – | | | – 0 | – |
| | | | |
Total dividends and distributions | | | (.31 | ) | | | (.31 | ) | | | – 0 | – | | | (.04 | ) | | | (.32 | ) | | | (.20 | ) |
| | | | |
Net asset value, end of
period | | | $ 16.01 | | | | $ 15.20 | | | | $ 15.38 | | | | $ 14.64 | | | | $ 14.53 | | | | $ 13.68 | |
| | | | |
| | | | | | |
Total Return | | | | | | | | | | | | | | | | | | | | | | | | |
| | | | | | |
Total investment return
based on net asset
value(e)* | | | 7.44 | % | | | .67 | % | | | 5.05 | % | | | 1.01 | % | | | 8.84 | % | | | 4.31 | % |
| | | | | | |
Ratios/Supplemental Data | | | | | | | | | | | | | | | | | | | | | | | | |
| | | | | | |
Net assets, end of period
(000’s omitted) | | | $18,977 | | | | $23,156 | | | | $37,609 | | | | $61,466 | | | | $102,696 | | | | $198,792 | |
| | | | | | |
Ratio to average net assets
of: | | | | | | | | | | | | | | | | | | | | | | | | |
| | | | | | |
Expenses, net of waivers/reimbursements(f)‡ | | | 1.77 | %^ | | | 1.79 | % | | | 1.71 | % | | | 1.58 | % | | | 1.59 | % | | | 1.61 | % |
| | | | | | |
Expenses, before waivers/reimbursements(f)‡ | | | 1.79 | %^ | | | 1.80 | % | | | 1.78 | % | | | 1.78 | % | | | 1.71 | % | | | 1.69 | % |
| | | | | | |
Net investment income (loss)(b) | | | (.13 | )%^ | | | .52 | % | | | .71 | % | | | .63 | % | | | 2.73 | % | | | 2.17 | % |
| | | | | | |
Portfolio turnover rate | | | 62 | % | | | 76 | % | | | 81 | % | | | 38 | % | | | 108 | % | | | 14 | % |
| | | | | | | | | | | | | | | | | | | | | | | | |
| |
‡ Expense ratios exclude the estimated acquired fund fees of the affiliated/unaffiliated underlying | |
portfolios | | | .03 | %^ | | | .02 | % | | | .07 | % | | | .20 | % | | | .31 | % | | | .31 | % |
See footnote summary on page 141.
| | |
| |
136 | AB ALL MARKET TOTAL RETURN PORTFOLIO | | abfunds.com |
CONSOLIDATED FINANCIAL HIGHLIGHTS (continued)
Selected Data For A Share Of Beneficial Interest Outstanding Throughout Each Period
| | | | | | | | | | | | | | | | | | | | | | | | |
| | | Advisor Class | |
| | | Six Months
Ended
February 28,
2021 (unaudited)† | | | Year Ended August 31, | |
| | | 2020† | | | 2019† | | | 2018† | | | 2017† | | | 2016 | |
| | | | |
Net asset value, beginning of period | | | $ 15.60 | | | | $ 15.81 | | | | $ 14.90 | | | | $ 14.80 | | | | $ 13.93 | | | | $ 13.58 | |
| | | | |
Income From Investment Operations | | | | | | | | | | | | | | | | | | | | | | | | |
| | | | | | |
Net investment income(a)(b) | | | .07 | | | | .23 | | | | .25 | | | | .24 | | | | .48 | | | | .42 | |
| | | | | | |
Net realized and unrealized
gain on investment transactions | | | 1.15 | | | | .07 | (c) | | | .66 | | | | .07 | | | | .86 | | | | .28 | |
| | | | | | |
Contributions from Affiliates | | | – 0 | – | | | .00 | (d) | | | .00 | (d) | | | .00 | (d) | | | – 0 | – | | | – 0 | – |
| | | | | | |
Capital contributions | | | – 0 | – | | | .00 | (d) | | | – 0 | – | | | – 0 | – | | | – 0 | – | | | – 0 | – |
| | | | |
Net increase in net asset
value from operations | | | 1.22 | | | | .30 | | | | .91 | | | | .31 | | | | 1.34 | | | | .70 | |
| | | | |
Less: Dividends and
Distributions | | | | | | | | | | | | | | | | | | | | | | | | |
| | | | | | |
Dividends from net
investment income | | | (.51 | ) | | | (.38 | ) | | | – 0 | – | | | (.21 | ) | | | (.47 | ) | | | (.35 | ) |
| | | | | | |
Distributions from net
realized gain on
investment transactions | | | – 0 | – | | | (.13 | ) | | | – 0 | – | | | – 0 | – | | | – 0 | – | | | – 0 | – |
| | | | |
Total dividends and
distributions | | | (.51 | ) | | | (.51 | ) | | | – 0 | – | | | (.21 | ) | | | (.47 | ) | | | (.35 | ) |
| | | | |
Net asset value, end of
period | | | $ 16.31 | | | | $ 15.60 | | | | $ 15.81 | | | | $ 14.90 | | | | $ 14.80 | | | | $ 13.93 | |
| | | | |
| | | | | | |
Total Return | | | | | | | | | | | | | | | | | | | | | | | | |
| | | | | | |
Total investment return
based on net asset
value(e)* | | | 7.93 | % | | | 1.68 | % | | | 6.17 | % | | | 2.02 | % | | | 9.99 | % | | | 5.30 | % |
| | | | | | |
Ratios/Supplemental Data | | | | | | | | | | | | | | | | | | | | | | | | |
| | | | | | |
Net assets, end of period
(000’s omitted) | | | $77,864 | | | | $75,493 | | | | $82,885 | | | | $82,258 | | | | $90,911 | | | | $88,863 | |
| | | | | | |
Ratio to average net assets
of: | | | | | | | | | | | | | | | | | | | | | | | | |
| | | | | | |
Expenses, net of waivers/reimbursements(f)‡ | | | .77 | %^ | | | .78 | % | | | .71 | % | | | .59 | % | | | .59 | % | | | .61 | % |
| | | | | | |
Expenses, before waivers/reimbursements(f)‡ | | | .79 | %^ | | | .79 | % | | | .78 | % | | | .78 | % | | | .72 | % | | | .69 | % |
| | | | | | |
Net investment
income(b) | | | .88 | %^ | | | 1.48 | % | | | 1.70 | % | | | 1.63 | % | | | 3.40 | % | | | 3.16 | % |
| | | | | | |
Portfolio turnover rate | | | 62 | % | | | 76 | % | | | 81 | % | | | 38 | % | | | 108 | % | | | 14 | % |
| | | | | | | | | | | | | | | | | | | | | | | | |
| |
‡ Expense ratios exclude the estimated acquired fund fees of the affiliated/unaffiliated underlying | |
portfolios | | | .03 | %^ | | | .02 | % | | | .07 | % | | | .20 | % | | | .31 | % | | | .31 | % |
See footnote summary on page 141.
| | |
| |
| abfunds.com | | AB ALL MARKET TOTAL RETURN PORTFOLIO | 137 |
CONSOLIDATED FINANCIAL HIGHLIGHTS (continued)
Selected Data For A Share Of Beneficial Interest Outstanding Throughout Each Period
| | | | | | | | | | | | | | | | | | | | | | | | |
| | | Class R | |
| | | Six Months
Ended
February 28,
2021 (unaudited)† | | | Year Ended August 31, | |
| | | 2020† | | | 2019† | | | 2018† | | | 2017† | | | 2016 | |
| | | | |
Net asset value, beginning of period | | | $ 15.29 | | | | $ 15.48 | | | | $ 14.69 | | | | $ 14.63 | | | | $ 13.77 | | | | $ 13.39 | |
| | | | |
Income From Investment
Operations | | | | | | | | | | | | | | | | | | | | | | | | |
| | | | | | |
Net investment income(a)(b) | | | .02 | | | | .13 | | | | .15 | | | | .14 | | | | .38 | | | | .36 | |
| | | | | | |
Net realized and unrealized
gain on investment
transactions | | | 1.12 | | | | .06 | (c) | | | .64 | | | | .06 | | | | .85 | | | | .25 | |
| | | | | | |
Contributions from Affiliates | | | – 0 | – | | | .00 | (d) | | | .00 | (d) | | | .00 | (d) | | | – 0 | – | | | – 0 | – |
| | | | | | |
Capital contributions | | | – 0 | – | | | .00 | (d) | | | – 0 | – | | | – 0 | – | | | – 0 | – | | | – 0 | – |
| | | | |
Net increase in net asset
value from operations | | | 1.14 | | | | .19 | | | | .79 | | | | .20 | | | | 1.23 | | | | .61 | |
| | | | |
Less: Dividends and Distributions | | | | | | | | | | | | | | | | | | | | | | | | |
| | | | | | |
Dividends from net
investment income | | | (.41 | ) | | | (.25 | ) | | | – 0 | – | | | (.14 | ) | | | (.37 | ) | | | (.23 | ) |
| | | | | | |
Distributions from net
realized gain on
investment transactions | | | – 0 | – | | | (.13 | ) | | | – 0 | – | | | – 0 | – | | | – 0 | – | | | – 0 | – |
| | | | |
Total dividends and
distributions | | | (.41 | ) | | | (.38 | ) | | | – 0 | – | | | (.14 | ) | | | (.37 | ) | | | (.23 | ) |
| | | | |
Net asset value, end of
period | | | $ 16.02 | | | | $ 15.29 | | | | $ 15.48 | | | | $ 14.69 | | | | $ 14.63 | | | | $ 13.77 | |
| | | | |
| | | | | | |
Total Return | | | | | | | | | | | | | | | | | | | | | | | | |
| | | | | | |
Total investment return
based on net asset
value(e)* | | | 7.57 | % | | | 1.05 | % | | | 5.45 | % | | | 1.34 | % | | | 9.17 | % | | | 4.69 | % |
| | | | | | |
Ratios/Supplemental Data | | | | | | | | | | | | | | | | | | | | | | | | |
| | | | | | |
Net assets, end of period
(000’s omitted) | | | $3,358 | | | | $3,087 | | | | $4,124 | | | | $4,414 | | | | $6,196 | | | | $6,381 | |
| | | | | | |
Ratio to average net assets
of: | | | | | | | | | | | | | | | | | | | | | | | | |
| | | | | | |
Expenses, net of waivers/reimbursements(f)‡ | | | 1.43 | %^ | | | 1.44 | % | | | 1.38 | % | | | 1.25 | % | | | 1.25 | % | | | 1.27 | % |
| | | | | | |
Expenses, before waivers/reimbursements(f)‡ | | | 1.45 | %^ | | | 1.45 | % | | | 1.44 | % | | | 1.44 | % | | | 1.38 | % | | | 1.35 | % |
| | | | | | |
Net investment
income(b) | | | .21 | %^ | | | .86 | % | | | 1.04 | % | | | .97 | % | | | 2.69 | % | | | 2.70 | % |
| | | | | | |
Portfolio turnover rate | | | 62 | % | | | 76 | % | | | 81 | % | | | 38 | % | | | 108 | % | | | 14 | % |
| | | | | | | | | | | | | | | | | | | | | | | | |
| |
‡ Expense ratios exclude the estimated acquired fund fees of the affiliated/unaffiliated underlying | |
portfolios | | | .03 | %^ | | | .02 | % | | | .07 | % | | | .20 | % | | | .31 | % | | | .31 | % |
See footnote summary on page 141.
| | |
| |
138 | AB ALL MARKET TOTAL RETURN PORTFOLIO | | abfunds.com |
CONSOLIDATED FINANCIAL HIGHLIGHTS (continued)
Selected Data For A Share Of Beneficial Interest Outstanding Throughout Each Period
| | | | | | | | | | | | | | | | | | | | | | | | |
| | | Class K | |
| | | Six Months
Ended
February 28,
2021 (unaudited)† | | | Year Ended August 31, | |
| | | 2020† | | | 2019† | | | 2018† | | | 2017† | | | 2016 | |
| | | | |
Net asset value, beginning of period | | | $ 15.37 | | | | $ 15.58 | | | | $ 14.73 | | | | $ 14.66 | | | | $ 13.80 | | | | $ 13.44 | |
| | | | |
Income From Investment
Operations | | | | | | | | | | | | | | | | | | | | | | | | |
| | | | | | |
Net investment income(a)(b) | | | .04 | | | | .17 | | | | .20 | | | | .19 | | | | .41 | | | | .38 | |
| | | | | | |
Net realized and unrealized
gain on investment
transactions | | | 1.13 | | | | .07 | (c) | | | .65 | | | | .06 | | | | .86 | | | | .28 | |
| | | | | | |
Contributions from Affiliates | | | – 0 | – | | | .00 | (d) | | | .00 | (d) | | | .00 | (d) | | | – 0 | – | | | – 0 | – |
| | | | | | |
Capital contributions | | | – 0 | – | | | .00 | (d) | | | – 0 | – | | | – 0 | – | | | – 0 | – | | | – 0 | – |
| | | | |
Net increase in net asset
value from operations | | | 1.17 | | | | .24 | | | | .85 | | | | .25 | | | | 1.27 | | | | .66 | |
| | | | |
Less: Dividends and Distributions | | | | | | | | | | | | | | | | | | | | | | | | |
| | | | | | |
Dividends from net
investment income | | | (.44 | ) | | | (.32 | ) | | | – 0 | – | | | (.18 | ) | | | (.41 | ) | | | (.30 | ) |
| | | | | | |
Distributions from net
realized gain on
investment transactions | | | – 0 | – | | | (.13 | ) | | | – 0 | – | | | – 0 | – | | | – 0 | – | | | – 0 | – |
| | | | |
Total dividends and
distributions | | | (.44 | ) | | | (.45 | ) | | | – 0 | – | | | (.18 | ) | | | (.41 | ) | | | (.30 | ) |
| | | | |
Net asset value, end of
period | | | $ 16.10 | | | | $ 15.37 | | | | $ 15.58 | | | | $ 14.73 | | | | $ 14.66 | | | | $ 13.80 | |
| | | | |
| | | | | | |
Total Return | | | | | | | | | | | | | | | | | | | | | | | | |
| | | | | | |
Total investment return
based on net asset
value(e)* | | | 7.69 | % | | | 1.35 | % | | | 5.84 | % | | | 1.60 | % | | | 9.56 | % | | | 5.04 | % |
| | | | | | |
Ratios/Supplemental Data | | | | | | | | | | | | | | | | | | | | | | | | |
| | | | | | |
Net assets, end of period
(000’s omitted) | | | $7,516 | | | | $7,395 | | | | $10,298 | | | | $15,032 | | | | $23,344 | | | | $27,129 | |
| | | | | | |
Ratio to average net assets
of: | | | | | | | | | | | | | | | | | | | | | | | | |
| | | | | | |
Expenses, net of waivers/reimbursements(f)‡ | | | 1.12 | %^ | | | 1.13 | % | | | 1.06 | % | | | .94 | % | | | .94 | % | | | .95 | % |
| | | | | | |
Expenses, before waivers/reimbursements(f)‡ | | | 1.14 | %^ | | | 1.14 | % | | | 1.13 | % | | | 1.13 | % | | | 1.07 | % | | | 1.03 | % |
| | | | | | |
Net investment
income(b) | | | .52 | %^ | | | 1.15 | % | | | 1.36 | % | | | 1.28 | % | | | 2.95 | % | | | 2.85 | % |
| | | | | | |
Portfolio turnover rate | | | 62 | % | | | 76 | % | | | 81 | % | | | 38 | % | | | 108 | % | | | 14 | % |
| | | | | | | | | | | | | | | | | | | | | | | | |
| |
‡ Expense ratios exclude the estimated acquired fund fees of the affiliated/unaffiliated underlying | |
portfolios | | | .03 | %^ | | | .02 | % | | | .07 | % | | | .20 | % | | | .31 | % | | | .31 | % |
See footnote summary on page 141.
| | |
| |
| abfunds.com | | AB ALL MARKET TOTAL RETURN PORTFOLIO | 139 |
CONSOLIDATED FINANCIAL HIGHLIGHTS (continued)
Selected Data For A Share Of Beneficial Interest Outstanding Throughout Each Period
| | | | | | | | | | | | | | | | | | | | | | | | |
| | | Class I | |
| | | Six Months
Ended
February 28,
2021 (unaudited)† | | | Year Ended August 31, | |
| | | 2020† | | | 2019† | | | 2018† | | | 2017† | | | 2016 | |
| | | | |
Net asset value, beginning of period | | | $ 15.76 | | | | $ 15.97 | | | | $ 15.05 | | | | $ 14.76 | | | | $ 13.89 | | | | $ 13.54 | |
| | | | |
Income From Investment
Operations | | | | | | | | | | | | | | | | | | | | | | | | |
| | | | | | |
Net investment income(a)(b) | | | .07 | | | | .22 | | | | .25 | | | | .24 | | | | .47 | | | | .42 | |
| | | | | | |
Net realized and unrealized
gain on investment
transactions | | | 1.16 | | | | .07 | (c) | | | .67 | | | | .05 | | | | .87 | | | | .27 | |
| | | | | | |
Contributions from Affiliates | | | – 0 | – | | | .00 | (d) | | | .00 | (d) | | | .00 | (d) | | | – 0 | – | | | – 0 | – |
| | | | | | |
Capital contributions | | | – 0 | – | | | .00 | (d) | | | – 0 | – | | | – 0 | – | | | – 0 | – | | | – 0 | – |
| | | | |
Net increase in net asset
value from operations | | | 1.23 | | | | .29 | | | | .92 | | | | .29 | | | | 1.34 | | | | .69 | |
| | | | |
Less: Dividends and Distributions | | | | | | | | | | | | | | | | | | | | | | | | |
| | | | | | |
Dividends from net
investment income | | | (.50 | ) | | | (.37 | ) | | | – 0 | – | | | – 0 | – | | | (.47 | ) | | | (.34 | ) |
| | | | | | |
Distributions from net
realized gain on
investment transactions | | | – 0 | – | | | (.13 | ) | | | – 0 | – | | | – 0 | – | | | – 0 | – | | | – 0 | – |
| | | | |
Total dividends and
distributions | | | (.50 | ) | | | (.50 | ) | | | – 0 | – | | | – 0 | – | | | (.47 | ) | | | (.34 | ) |
| | | | |
Net asset value, end of
period | | | $ 16.49 | | | | $ 15.76 | | | | $ 15.97 | | | | $ 15.05 | | | | $ 14.76 | | | | $ 13.89 | |
| | | | |
| | | | | | |
Total Return | | | | | | | | | | | | | | | | | | | | | | | | |
| | | | | | |
Total investment return
based on net asset
value(e)* | | | 7.89 | % | | | 1.64 | % | | | 6.18 | % | | | 1.97 | % | | | 9.92 | % | | | 5.28 | % |
| | | | | | |
Ratios/Supplemental Data | | | | | | | | | | | | | | | | | | | | | | | | |
| | | | | | |
Net assets, end of period
(000’s omitted) | | | $294 | | | | $271 | | | | $254 | | | | $230 | | | | $214 | | | | $11,299 | |
| | | | | | |
Ratio to average net assets
of: | | | | | | | | | | | | | | | | | | | | | | | | |
| | | | | | |
Expenses, net of waivers/reimbursements(f)‡ | | | .79 | %^ | | | .80 | % | | | .74 | % | | | .62 | % | | | .61 | % | | | .63 | % |
| | | | | | |
Expenses, before waivers/reimbursements(f)‡ | | | .81 | %^ | | | .82 | % | | | .80 | % | | | .81 | % | | | .74 | % | | | .71 | % |
| | | | | | |
Net investment
income(b) | | | .85 | %^ | | | 1.44 | % | | | 1.68 | % | | | 1.60 | % | | | 3.33 | % | | | 3.14 | % |
| | | | | | |
Portfolio turnover rate | | | 62 | % | | | 76 | % | | | 81 | % | | | 38 | % | | | 108 | % | | | 14 | % |
| | | | | | | | | | | | | | | | | | | | | | | | |
| |
‡ Expense ratios exclude the estimated acquired fund fees of the affiliated/unaffiliated underlying | |
portfolios | | | .03 | %^ | | | .02 | % | | | .07 | % | | | .20 | % | | | .31 | % | | | .31 | % |
See footnote summary on page 141.
| | |
| |
140 | AB ALL MARKET TOTAL RETURN PORTFOLIO | | abfunds.com |
CONSOLIDATED FINANCIAL HIGHLIGHTS (continued)
Selected Data For A Share Of Beneficial Interest Outstanding Throughout Each Period
| (a) | Based on average shares outstanding. |
| (b) | Net of expenses waived/reimbursed by the Adviser. |
| (c) | Due to timing of sales and repurchase of capital shares, the net realized and unrealized gain (loss) per share is not in accordance with the Fund’s change in net realized and unrealized gain (loss) on investment transactions for the period. |
| (d) | Amount is less than $.005. |
| (e) | Total investment return is calculated assuming an initial investment made at the net asset value at the beginning of the period, reinvestment of all dividends and distributions at net asset value during the period, and redemption on the last day of the period. Initial sales charges or contingent deferred sales charges are not reflected in the calculation of total investment return. Total return does not reflect the deduction of taxes that a shareholder would pay on fund distributions or the redemption of fund shares. Total investment return calculated for a period of less than one year is not annualized. |
| (f) | In connection with the Fund’s investments in affiliated underlying portfolios, the Fund incurs no direct expenses, but bears proportionate shares of the fees and expenses (i.e., operating, administrative and investment advisory fees) of the affiliated underlying portfolios. The Adviser has contractually agreed to waive its fees from the Fund in an amount equal to the Fund’s pro rata share of certain acquired fund fees and expenses, and for the six months ended February 28, 2021 and the years ended August 31, 2020, August 31, 2019, August 31, 2018 and August 31, 2017, such waiver amounted to .02% (annualized), .01%, .07%, .19% and .13%, respectively. |
| * | Includes the impact of proceeds received and credited to the Fund resulting from class action settlements, which enhanced the Fund’s performance for the years ended August 31, 2018 and August 31, 2017 by .03% and .03%, respectively. |
| † | Consolidated (see Note A). |
See notes to consolidated financial statements.
| | |
| |
| abfunds.com | | AB ALL MARKET TOTAL RETURN PORTFOLIO | 141 |
BOARD OF TRUSTEES
TRUSTEES
| | |
Marshall C. Turner, Jr.(1), Chairman Jorge A. Bermudez(1) Michael J. Downey(1) Onur Erzan*, President and Chief Executive Officer | | Nancy P. Jacklin(1) Jeanette W. Loeb(1) Carol C. McMullen(1) Garry L. Moody(1) Earl D. Weiner(1) |
| |
| OFFICERS | | |
Alexander Barenboym(2), Vice President Daniel J. Loewy(2), Vice President Defne Ozaltun(2), Vice President Emilie D. Wrapp, Clerk Michael B. Reyes, Senior Analyst | | Joseph J. Mantineo, Treasurer and Chief Financial Officer Phyllis J. Clarke, Controller and Chief Accounting Officer Vincent S. Noto, Chief Compliance Officer |
| | |
Custodian and Accounting Agent State Street Bank and Trust Company
State Street Corporation CCB/5
1 Iron Street
Boston, MA 02210 Principal Underwriter AllianceBernstein Investments, Inc.
1345 Avenue of the Americas
New York, NY 10105 Legal Counsel Seward & Kissel LLP
One Battery Park Plaza
New York, NY 10004 | | Transfer Agent AllianceBernstein Investor
Services, Inc.
P.O. Box 786003
San Antonio, TX 78278-6003
Toll-Free (800) 221-5672 Independent Registered Public Accounting Firm Ernst & Young LLP
5 Times Square
New York, NY 10036 |
| 1 | Member of the Audit Committee, the Governance and Nominating Committee and the Independent Directors Committee. |
| 2 | The day-to-day management of, and investment decisions for, the Fund’s portfolio are made by the Adviser’s Multi-Asset Solutions Team. Messrs. Barenboym and Loewy and Ms. Ozaltun are the investment professionals primarily responsible for the day-to-day management of the Fund’s portfolio. |
| * | Mr. Robert M. Keith retired as President, Chief Executive Officer and a Director of the Fund as of March 31, 2021. Mr. Onur Erzan, Senior Vice President and Head of the Global Client Group of the Adviser, has been elected President, Chief Executive Officer and a Director of the Fund, effective April 1, 2021. |
| | |
| |
142 | AB ALL MARKET TOTAL RETURN PORTFOLIO | | abfunds.com |
Operation and Effectiveness of the Fund’s Liquidity Risk Management Program:
In October 2016, the Securities and Exchange Commission (“SEC”) adopted the open-end fund liquidity rule (the “Liquidity Rule”). In June 2018 the SEC adopted a requirement that funds disclose information about the operation and effectiveness of their Liquidity Risk Management Program (“LRMP”) in their reports to shareholders.
One of the requirements of the Liquidity Rule is for the Fund to designate an Administrator of the Fund’s Liquidity Risk Management Program. The Administrator of the Fund’s LRMP is AllianceBernstein L.P., the Fund’s investment adviser (the “Adviser”). The Adviser has delegated the responsibility to its Liquidity Risk Management Committee (the “Committee”).
Another requirement of the Liquidity Rule is for the Fund’s Board of Trustees (the “Fund Board”) to receive an annual written report from the Administrator of the LRMP, which addresses the operation of the Fund’s LRMP and assesses its adequacy and effectiveness. The Adviser provided the Fund Board with such annual report during the first quarter of 2021, which covered the period January 1, 2020 through December 31, 2020 (the “Program Reporting Period”).
The LRMP’s principal objectives include supporting the Fund’s compliance with limits on investments in illiquid assets and mitigating the risk that the Fund will be unable to meet its redemption obligations in a timely manner.
Pursuant to the LRMP, the Fund classifies the liquidity of its portfolio investments into one of the four categories defined by the SEC: Highly Liquid, Moderately Liquid, Less Liquid, and Illiquid. These classifications are reported to the SEC on Form N-PORT.
During the Program Reporting Period, the Committee reviewed whether the Fund’s strategy is appropriate for an open-end structure, incorporating any holdings of less liquid and illiquid assets. If the Fund participated in derivative transactions, the exposure from such transactions were considered in the LRMP.
The Committee also performed an analysis to determine whether the Fund is required to maintain a Highly Liquid Investment Minimum (“HLIM”). The Committee also incorporated the following information when determining the Fund’s reasonably anticipated trading size for purposes of liquidity monitoring: historical net redemption activity, a Fund’s concentration in an issuer, shareholder concentration, investment performance, total net assets, and distribution channels.
The Adviser informed the Fund Board that the Committee believes the Fund’s LRMP is adequately designed, has been implemented as intended,
| | |
| |
| abfunds.com | | AB ALL MARKET TOTAL RETURN PORTFOLIO | 143 |
and has operated effectively since its inception. No material exceptions have been noted since the implementation of the LRMP. During the Program Reporting Period, beginning in March 2020, all financial markets experienced extreme levels of price volatility and relative illiquidity resulting from the COVID-19 impacts on the global economy. This extreme relative illiquidity resulted in significantly wider bid-ask spreads to transact in securities, including many of those securities held by the Fund, and in a diminished depth of liquidity in most markets, to varying degrees. Nonetheless, there were no liquidity events that impacted the Fund or its ability to timely meet redemptions during the Program Reporting Period.
| | |
| |
144 | AB ALL MARKET TOTAL RETURN PORTFOLIO | | abfunds.com |
Information Regarding the Review and Approval of the Fund’s Advisory Agreement
The disinterested trustees (the “directors”) of The AB Portfolios (the “Company”) unanimously approved the continuance of the Company’s Advisory Agreement with the Adviser in respect of AB All Market Total Return Portfolio (the “Fund”) at a meeting held by video conference on August 4-5, 2020 (the “Meeting”).
Prior to approval of the continuance of the Advisory Agreement, the directors had requested from the Adviser, and received and evaluated, extensive materials. They reviewed the proposed continuance of the Advisory Agreement with the Adviser and with experienced counsel who are independent of the Adviser, who advised on the relevant legal standards. The directors also reviewed additional materials, including comparative analytical data prepared by the Senior Analyst for the Fund. The directors also discussed the proposed continuance in private sessions with counsel.
The directors considered their knowledge of the nature and quality of the services provided by the Adviser to the Fund gained from their experience as directors or trustees of most of the registered investment companies advised by the Adviser, their overall confidence in the Adviser’s integrity and competence they have gained from that experience, the Adviser’s initiative in identifying and raising potential issues with the directors and its responsiveness, frankness and attention to concerns raised by the directors in the past, including the Adviser’s willingness to consider and implement organizational and operational changes designed to improve investment results and the services provided to the AB Funds. The directors noted that they have four regular meetings each year, at each of which they review extensive materials and information from the Adviser, including information on the investment performance of the Fund and the money market fund advised by the Adviser in which the Fund invests.
The directors also considered all factors they believed relevant, including the specific matters discussed below. During the course of their deliberations, the directors evaluated, among other things, the reasonableness of the advisory fee. The directors did not identify any particular information that was all-important or controlling, and different directors may have attributed different weights to the various factors. The directors determined that the selection of the Adviser to manage the Fund and the overall arrangements between the Fund and the Adviser, as provided in the Advisory Agreement, including the advisory fee, were fair and reasonable in light of the services performed, expenses incurred and such other matters as the directors considered relevant in the exercise of their business
| | |
| |
| abfunds.com | | AB ALL MARKET TOTAL RETURN PORTFOLIO | 145 |
judgment. The material factors and conclusions that formed the basis for the directors’ determinations included the following:
Nature, Extent and Quality of Services Provided
The directors considered the scope and quality of services provided by the Adviser under the Advisory Agreement, including the quality of the investment research capabilities of the Adviser and the other resources it has dedicated to performing services for the Fund. The directors noted that the Adviser from time to time reviews the Fund’s investment strategies and from time to time proposes changes intended to improve the Fund’s relative or absolute performance for the directors’ consideration. They also noted the professional experience and qualifications of the Fund’s portfolio management team and other senior personnel of the Adviser. The quality of administrative and other services, including the Adviser’s role in coordinating the activities of the Fund’s other service providers, also was considered. The directors concluded that, overall, they were satisfied with the nature, extent and quality of services provided to the Fund under the Advisory Agreement.
Costs of Services Provided and Profitability
The directors reviewed a schedule of the revenues and expenses and related notes indicating the profitability of the Fund to the Adviser for calendar years 2018 and 2019 that had been prepared with an expense allocation methodology arrived at in consultation with an independent consultant retained by the Fund’s former Senior Officer/Independent Compliance Officer. The directors noted the assumptions and methods of allocation used by the Adviser in preparing fund-specific profitability data and understood that there are a number of potentially acceptable allocation methodologies for information of this type. The directors noted that the profitability information reflected all revenues and expenses of the Adviser’s relationship with the Fund, including those relating to its subsidiaries that provide transfer agency, distribution and brokerage services to the Fund. The directors recognized that it is difficult to make comparisons of the profitability of the Advisory Agreement with the profitability of fund advisory contracts for unaffiliated funds because comparative information is not generally publicly available and is affected by numerous factors. The directors focused on the profitability of the Adviser’s relationship with the Fund before taxes and distribution expenses. The directors concluded that the Adviser’s level of profitability from its relationship with the Fund was not unreasonable.
Fall-Out Benefits
The directors considered the other benefits to the Adviser and its affiliates from their relationships with the Fund and the money market fund advised by the Adviser in which the Fund invests, including, but not limited to, benefits relating to soft dollar arrangements (whereby investment advisers receive brokerage and research services from brokers that execute agency
| | |
| |
146 | AB ALL MARKET TOTAL RETURN PORTFOLIO | | abfunds.com |
transactions for their clients); 12b-1 fees and sales charges received by the Fund’s principal underwriter (which is a wholly owned subsidiary of the Adviser) in respect of certain classes of the Fund’s shares; brokerage commissions paid by the Fund to brokers affiliated with the Adviser; and transfer agency fees paid by the Fund to a wholly owned subsidiary of the Adviser. The directors recognized that the Fund’s profitability to the Adviser would be somewhat lower without these benefits. The directors understood that the Adviser also might derive reputational and other benefits from its association with the Fund.
Investment Results
In addition to the information reviewed by the directors in connection with the Meeting, the directors receive detailed performance information for the Fund at each regular Board meeting during the year.
At the Meeting, the directors reviewed performance information prepared by an independent service provider (the “15(c) service provider”), showing the performance of the Class A Shares of the Fund against a group of similar funds (“peer group”) and a larger group of similar funds (“peer universe”), each selected by the 15(c) service provider, and information prepared by the Adviser showing performance of the Class A Shares against a broad-based securities market index, in each case for the 1-, 3-, 5- and 10-year periods ended May 31, 2020 and (in the case of comparisons with the broad-based securities market index) for the period from inception. Based on their review, the directors concluded that the Fund’s investment performance was acceptable.
Advisory Fees and Other Expenses
The directors considered the advisory fee rate payable by the Fund to the Adviser and information prepared by the 15(c) service provider concerning advisory fee rates payable by other funds in the same category as the Fund. The directors recognized that it is difficult to make comparisons of advisory fees because there are variations in the services that are included in the fees paid by other funds. The directors compared the Fund’s contractual effective advisory fee rate with a peer group median.
The directors also considered the Adviser’s fee schedule for other clients utilizing investment strategies similar to those of the Fund. For this purpose, they reviewed the relevant advisory fee information from the Adviser’s Form ADV and in a report from the Fund’s Senior Analyst and noted the differences between the Fund’s fee schedule, on the one hand, and the Adviser’s institutional fee schedule and the schedule of fees charged by the Adviser to any offshore funds and for services to any sub-advised funds utilizing investment strategies similar to those of the Fund, on the other. The directors noted that the Adviser may, in some cases, agree to fee rates with large institutional clients that are lower than those reviewed by the directors and that they had previously discussed
| | |
| |
| abfunds.com | | AB ALL MARKET TOTAL RETURN PORTFOLIO | 147 |
with the Adviser its policies in respect of such arrangements. The directors previously discussed these matters with an independent fee consultant.
The Adviser reviewed with the directors the significantly greater scope of the services it provides to the Fund relative to institutional, offshore fund and sub-advised fund clients. In this regard, the Adviser noted, among other things, that, compared to institutional and offshore or sub-advised accounts, the Fund (i) demands considerably more portfolio management, research and trading resources due to significantly higher daily cash flows; (ii) has more tax and regulatory restrictions and compliance obligations; (iii) must prepare and file or distribute regulatory and other communications about fund operations; and (iv) must provide shareholder servicing to retail investors. The Adviser also reviewed the greater legal risks presented by the large and changing population of Fund shareholders who may assert claims against the Adviser in individual or class actions, and the greater entrepreneurial risk in offering new fund products, which require substantial investment to launch, may not succeed, and generally must be priced to compete with larger, more established funds resulting in lack of profitability to the Adviser until a new fund achieves scale. In light of the substantial differences in services rendered by the Adviser to institutional, offshore fund and sub-advised fund clients as compared to the Fund, and the different risk profile, the directors considered these fee comparisons inapt and did not place significant weight on them in their deliberations.
In connection with their review of the Fund’s advisory fee, the directors also considered the total expense ratio of the Class A shares of the Fund in comparison to a peer group and a peer universe selected by the 15(c) service provider. The Class A expense ratio of the Fund was based on the Fund’s latest fiscal year. The directors noted that it was likely that the expense ratios of some of the other funds in the Fund’s category were lowered by waivers or reimbursements by those funds’ investment advisers, which in some cases might be voluntary or temporary. The directors view expense ratio information as relevant to their evaluation of the Adviser’s services because the Adviser is responsible for coordinating services provided to the Fund by others. Based on their review, the directors concluded that the Fund’s expense ratio was acceptable.
Economies of Scale
The directors noted that the advisory fee schedules for the Fund contains breakpoints that reduce the fee rates on assets above specified levels. The directors took into consideration prior presentations by an independent consultant on economies of scale in the mutual fund industry and for the AB Funds, and presentations from time to time by the Adviser concerning certain of its views on economies of scale. The directors also previously discussed economies of scale with an independent fee consultant. The directors also had requested and received from the Adviser certain updates on economies of scale in advance of the Meeting. The directors
| | |
| |
148 | AB ALL MARKET TOTAL RETURN PORTFOLIO | | abfunds.com |
believe that economies of scale may be realized (if at all) by the Adviser across a variety of products and services, and not only in respect of a single fund. The directors noted that there is no established methodology for setting breakpoints that give effect to the fund-specific services provided by a fund’s adviser and to the economies of scale that an adviser may realize in its overall mutual fund business or those components of it which directly or indirectly affect a fund’s operations. The directors observed that in the mutual fund industry as a whole, as well as among funds similar to the Fund, there is no uniformity or pattern in the fees and asset levels at which breakpoints (if any) apply. The directors also noted that the advisory agreements for many funds do not have breakpoints at all. Having taken these factors into account, the directors concluded that the Fund’s shareholders would benefit from a sharing of economies of scale in the event the Fund’s net assets exceed a breakpoint in the future.
| | |
| |
| abfunds.com | | AB ALL MARKET TOTAL RETURN PORTFOLIO | 149 |
This page is not part of the Shareholder Report or the Financial Statements.
AB FAMILY OF FUNDS
US EQUITY
CORE
Core Opportunities Fund
FlexFee™ US Thematic Portfolio
Select US Equity Portfolio
GROWTH
Concentrated Growth Fund
Discovery Growth Fund
FlexFee™ Large Cap Growth Portfolio
Growth Fund
Large Cap Growth Fund
Small Cap Growth Portfolio
VALUE
Discovery Value Fund
Equity Income Fund
Relative Value Fund
Small Cap Value Portfolio
Value Fund
INTERNATIONAL/ GLOBAL EQUITY
CORE
Global Core Equity Portfolio
International Strategic Core Portfolio
Sustainable Global Thematic Fund
Tax-Managed Wealth Appreciation Strategy
Wealth Appreciation Strategy
GROWTH
Concentrated International Growth Portfolio
Sustainable International Thematic Fund
VALUE
All China Equity Portfolio
International Value Fund
FIXED INCOME
MUNICIPAL
High Income Municipal Portfolio
Intermediate California Municipal Portfolio
Intermediate Diversified Municipal Portfolio
Intermediate New York Municipal Portfolio
Municipal Bond Inflation Strategy
Tax-Aware Fixed Income Opportunities Portfolio
National Portfolio
Arizona Portfolio
California Portfolio
Massachusetts Portfolio
Minnesota Portfolio
New Jersey Portfolio
New York Portfolio
Ohio Portfolio
Pennsylvania Portfolio
Virginia Portfolio
TAXABLE
Bond Inflation Strategy
FlexFee™ High Yield Portfolio
Global Bond Fund
High Income Fund
Income Fund
Intermediate Duration Portfolio
Limited Duration High Income Portfolio
Short Duration Income Portfolio
Short Duration Portfolio
Total Return Bond Portfolio
ALTERNATIVES
All Market Real Return Portfolio
Global Real Estate Investment Fund
Select US Long/Short Portfolio
MULTI-ASSET
All Market Income Portfolio
All Market Total Return Portfolio
Conservative Wealth Strategy
Emerging Markets Multi-Asset Portfolio
Global Risk Allocation Fund
Tax-Managed All Market Income Portfolio
CLOSED-END FUNDS
AllianceBernstein Global High Income Fund
AllianceBernstein National Municipal Income Fund
We also offer Government Money Market Portfolio, which serves as the money market fund exchange vehicle for the AB mutual funds. You could lose money by investing in the Fund. Although the Fund seeks to preserve the value of your investment at $1.00 per share, it cannot guarantee it will do so. The Fund may impose a fee upon sale of your shares or may temporarily suspend your ability to sell shares if the Fund’s liquidity falls below required minimums because of market conditions or other factors. An investment in the Fund is not insured or guaranteed by the Federal Deposit Insurance Corporation or any other government agency. The Fund’s sponsor has no legal obligation to provide financial support to the Fund, and you should not expect that the sponsor will provide financial support to the Fund at any time.
Investors should consider the investment objectives, risks, charges and expenses of the Fund carefully before investing. For copies of our prospectus or summary prospectus, which contain this and other information, visit us online at www.abfunds.com or contact your AB representative. Please read the prospectus and/or summary prospectus carefully before investing.
| | |
| |
150 | AB ALL MARKET TOTAL RETURN PORTFOLIO | | abfunds.com |
NOTES
| | |
| |
| abfunds.com | | AB ALL MARKET TOTAL RETURN PORTFOLIO | 151 |
NOTES
| | |
| |
152 | AB ALL MARKET TOTAL RETURN PORTFOLIO | | abfunds.com |
AB ALL MARKET TOTAL RETURN PORTFOLIO
1345 Avenue of the Americas
New York, NY 10105
800 221 5672
AMTR-0152-0221 
FEB 02.28.21

SEMI-ANNUAL REPORT
AB CONSERVATIVE WEALTH STRATEGY

As of January 1, 2021, as permitted by new regulations adopted by the Securities and Exchange Commission, the Fund’s annual and semi-annual shareholder reports are no longer sent by mail, unless you specifically requested paper copies of the reports. Instead, the reports are made available on a website, and you will be notified by mail each time a report is posted and provided with a website address to access the report.
You may elect to receive all future reports in paper form free of charge. If you invest through a financial intermediary, you can contact your financial intermediary to request that you continue to receive paper copies of your shareholder reports; if you invest directly with the Fund, you can call the Fund at (800) 221 5672. Your election to receive reports in paper form will apply to all funds held in your account with your financial intermediary or, if you invest directly, to all AB Mutual Funds you hold.
| | |
| |
| Investment Products Offered | | • Are Not FDIC Insured • May Lose Value • Are Not Bank Guaranteed |
Investors should consider the investment objectives, risks, charges and expenses of the Fund carefully before investing. For copies of our prospectus or summary prospectus, which contain this and other information, visit us online at www.abfunds.com or contact your AB representative. Please read the prospectus and/or summary prospectus carefully before investing.
This shareholder report must be preceded or accompanied by the Fund’s prospectus for individuals who are not current shareholders of the Fund.
You may obtain a description of the Fund’s proxy voting policies and procedures, and information regarding how the Fund voted proxies relating to portfolio securities during the most recent 12-month period ended June 30, without charge. Simply visit AB’s website at www.abfunds.com, or go to the Securities and Exchange Commission’s (the “Commission”) website at www.sec.gov, or call AB at (800) 227 4618.
The Fund files its complete schedule of portfolio holdings with the Commission for the first and third quarters of each fiscal year as an exhibit to its reports on Form N-PORT. The Fund’s Form N-PORT reports are available on the Commission’s website at www.sec.gov. The Fund’s Forms N-PORT may also be reviewed and copied at the Commission’s Public Reference Room in Washington, DC; information on the operation of the Public Reference Room may be obtained by calling (800) SEC 0330. AB publishes full portfolio holdings for the Fund monthly at www.abfunds.com.
AllianceBernstein Investments, Inc. (ABI) is the distributor of the AB family of mutual funds. ABI is a member of FINRA and is an affiliate of AllianceBernstein L.P., the Adviser of the funds.
The [A/B] logo is a registered service mark of AllianceBernstein and AllianceBernstein® is a registered service mark used by permission of the owner, AllianceBernstein L.P.
| | |
| FROM THE PRESIDENT | |  |
Dear Shareholder,
We’re pleased to provide this report for the AB Conservative Wealth Strategy (the “Fund”). Please review the discussion of Fund performance, the market conditions during the reporting period and the Fund’s investment strategy.
At AB, we’re striving to help our clients achieve better outcomes by:
| + | | Fostering diverse perspectives that give us a distinctive approach to navigating global capital markets |
| + | | Applying differentiated investment insights through a connected global research network |
| + | | Embracing innovation to design better ways to invest and leading-edge mutual-fund solutions |
Whether you’re an individual investor or a multibillion-dollar institution, we’re putting our knowledge and experience to work for you every day.
For more information about AB’s comprehensive range of products and shareholder resources, please log on to www.abfunds.com.
Thank you for your investment in AB mutual funds—and for placing your trust in our firm.
Sincerely,

Onur Erzan
President and Chief Executive Officer, AB Mutual Funds
| | |
| |
| abfunds.com | | AB CONSERVATIVE WEALTH STRATEGY | 1 |
SEMI-ANNUAL REPORT
April 8, 2021
This report provides management’s discussion of fund performance for the AB Conservative Wealth Strategy for the semi-annual reporting period ended February 28, 2021.
The Fund’s investment objective is to achieve a high total return without, in the opinion of the Adviser, undue risk to principal.
NAV RETURNS AS OF FEBRUARY 28, 2021 (unaudited)
| | | | | | | | |
| | |
| | | 6 Months | | | 12 Months | |
| | |
| AB CONSERVATIVE WEALTH STRATEGY | | | | | | | | |
| | |
| Class A Shares | | | 6.41% | | | | 8.16% | |
| | |
| Class C Shares | | | 5.98% | | | | 7.37% | |
| | |
| Advisor Class Shares1 | | | 6.56% | | | | 8.47% | |
| | |
| Class R Shares1 | | | 6.21% | | | | 7.78% | |
| | |
| Class K Shares1 | | | 6.42% | | | | 8.09% | |
| | |
| Class I Shares1 | | | 6.57% | | | | 8.47% | |
| | |
Primary Benchmark:
Bloomberg Barclays Global Aggregate Bond Index (USD hedged) | | | -0.85% | | | | 0.32% | |
| | |
| MSCI ACWI (net) | | | 13.04% | | | | 30.25% | |
| 1 | Please note that these share classes are for investors purchasing shares through accounts established under certain fee-based programs sponsored and maintained by certain broker-dealers and financial intermediaries, institutional pension plans and/or investment advisory clients of, and certain other persons associated with, the Adviser and its affiliates or the Fund. |
INVESTMENT RESULTS
The table above shows the Fund’s performance compared to its primary benchmark, the Bloomberg Barclays Global Aggregate Bond Index (USD hedged), and the Morgan Stanley Capital International All Country World Index (“MSCI ACWI”) (net) for the six- and 12-month periods ended February 28, 2021.
All share classes of the Fund outperformed the primary benchmark and underperformed the MSCI ACWI (net) for both periods, before sales charges. During the six-month period, overall allocation to equities, fixed-income assets and diversifiers contributed to absolute performance. Diversifiers include alternative asset classes and alternative investment strategies that are expected to have low correlation with returns on equities and fixed-income securities. These investments can include commodities and related derivatives, real estate-related securities and inflation-linked securities. Security selection within equities and diversifiers contributed, while selection within fixed-income assets detracted.
| | |
| |
2 | AB CONSERVATIVE WEALTH STRATEGY | | abfunds.com |
During the 12-month period, overall asset class allocation was positive, led by allocation to fixed-income securities. Security selection within diversifiers contributed to performance, while selection within equities and fixed-income assets detracted.
The Fund utilized derivatives for hedging and investment purposes in the form of futures, interest rate swaps and total return swaps, which detracted from absolute performance for both periods, while written swaptions and inflation Consumer Price Index swaps contributed; currency forwards, variance swaps and credit default swaps contributed for the six-month period, but detracted for the 12-month period; purchased options had no material impact on performance for the six-month period, but contributed for the 12-month period; written options had no material impact on performance for the six-month period, but detracted for the 12-month period.
MARKET REVIEW AND INVESTMENT STRATEGY
Global equities, supported by extensive monetary and fiscal stimulus, continued to recover from lows triggered by the COVID-19 pandemic and recorded positive returns for the six-month period ended February 28, 2021. Equity markets suffered a setback at the beginning of the period as volatility and style rotation, including a broad sell-off of mega-cap technology stocks, prevailed. Favorable news about the efficacy of potential coronavirus vaccines helped offset market volatility that was prompted by the continued spread of the virus in many countries, a potentially contested US presidential election and lack of additional US fiscal stimulus. Later, despite the emergence of seemingly more transmissible strains of the virus—a significant decline in new cases, the acceleration of vaccine distribution, and positive signs that a $1.9 trillion relief package would be approved supported global equity markets. As the period drew to a close, the emergence of inflationary fears, especially in the US, precipitated a sharp rise in long-term government bond yields and an accompanying correction in equities. Rising longer-term interest rates pressured the valuations of many market-leading technology and growth stocks, especially in the US, boosting a rotation into more cyclical and value-oriented stocks. For the semi-annual period, small-cap stocks substantially outperformed large-cap stocks on a relative basis, and periods of market rotation led large and small value-style stocks to outperform their growth-style peers.
Global fixed-income market returns were mixed, with an elevated amount of volatility and dispersion between credit sectors over the six-month period. Developed-market government bonds were negative, and US Treasury bonds underperformed other major markets as longer-term US interest rates rose from a low in September 2020. Risk assets began to significantly rise, beginning in November, when positive vaccine news extended the credit rally. Emerging- and developed-market high-yield corporate bonds led gains with significant positive returns as investors searched for higher
| | |
| |
| abfunds.com | | AB CONSERVATIVE WEALTH STRATEGY | 3 |
yields in a period of historically low interest rates. Emerging-market local-currency bonds also had strong positive results. Globally, developed-market investment-grade corporate bonds had positive results and outperformed global treasuries, but returns were slightly negative in the US. Securitized assets also outperformed treasuries with slightly negative results. The US dollar fell against most developed-market currencies and was mixed relative to emerging-market currencies. Brent crude oil prices rebounded by 46% on the improved economic outlook and OPEC+ production cuts. Copper gained almost 35% from increased demand for infrastructure and green energy initiatives. Gold prices fell over 12% due to the improved economic landscape, following a large advance earlier in calendar year, and as a non-interest-bearing asset in a rising rate environment.
The Fund’s Senior Investment Management Team (the “Team”) uses a global, multi-asset strategy focusing on moderate growth and defensively managing market volatility. The Team’s dedicated multi-asset investment professionals utilize a rigorous quantitative research toolset in collaboration with fundamental expertise across all regions and markets.
INVESTMENT POLICIES
The Adviser allocates the Fund’s investments among a number of asset classes, including fixed-income securities, equity securities, and alternative asset classes and alternative investment strategies. The Fund seeks to have generally greater exposure to fixed-income securities than equity securities or alternative asset classes and alternative investment strategies. The Fund pursues a global strategy, typically investing in securities of issuers located in the United States and in other countries throughout the world, including emerging-market countries. Investments will be made either directly or indirectly through underlying registered investment companies advised by the Adviser (each an “Underlying Portfolio”), although a majority of the Fund’s assets are expected to be invested directly.
The Fund’s investments in fixed-income securities may include corporate and sovereign debt securities as well as interest rate derivatives and credit derivatives such as credit default swaps. In selecting fixed-income securities for the Fund, the Adviser attempts to take advantage of inefficiencies that it believes exist in the global fixed-income markets. These inefficiencies arise from investor behavior, market complexity and the investment limitations to which investors are subject. The Adviser intends to gain exposure to high-yield debt securities (commonly known as “junk bonds”) through investment in the AB High Income Fund, an Underlying Portfolio, and may, in the future, gain such exposure through direct investments in high-yield debt securities.
Fixed-income securities in which the Fund or AB High Income Fund may invest may be of any credit quality or maturity.
(continued on next page)
| | |
| |
4 | AB CONSERVATIVE WEALTH STRATEGY | | abfunds.com |
The Fund’s investments in equity securities of issuers consist primarily of securities of large-capitalization companies and derivatives related to such securities. In selecting equity securities for the Fund, the Adviser intends to use fundamental and quantitative analysis with the goal of generating returns primarily from security selection rather than price movements in equity securities generally.
The Fund may invest in alternative investments, the returns on which are expected to have low correlation with returns on equity and fixed-income securities, such as real estate-related securities and inflation-indexed securities. Alternative investment strategies that may be pursued by the Fund directly or indirectly through investment in other registered investment companies include (i) long/short equity strategies through which the Fund takes long positions in certain securities in the expectation that they will increase in value and takes short positions in other securities in the expectation that they will decrease in value; (ii) strategies that consider macroeconomic and technical factors to identify and exploit opportunities across global asset classes; and (iii) event-driven strategies that invest in the securities of companies that are expected to become the subject of major corporate events and companies in which an active role in company management has been taken or sought by a third-party investor. In order to gain exposure to real estate-related securities, the Adviser intends to invest a portion of the Fund’s assets in the AB All Market Real Return Portfolio, an Underlying Portfolio.
The Adviser seeks to adjust the Fund’s asset class exposure utilizing both fundamental analysis and the Adviser’s Dynamic Asset Allocation (“DAA”) approach. DAA comprises a series of analytical and forecasting tools employed by the Adviser to gauge fluctuations in the risk/return profile of various asset classes. DAA seeks to adjust the Fund’s investment exposure in changing market conditions and thereby reduce overall portfolio volatility by mitigating the effects of market fluctuations, while preserving consistent long-term return potential. For example, the Adviser may seek to reduce the Fund’s risk exposure to
one or more assets classes when DAA suggests that market risks relevant to those asset classes are rising but return opportunities are declining. In addition to merely increasing or decreasing asset class exposure by buying or selling securities of that asset class, the Adviser may pursue DAA implementation for the Fund by utilizing derivatives.
The Adviser intends to utilize a variety of derivatives in its management of the Fund. As noted above, the Adviser may use derivatives to gain exposure to various asset classes, and may cause the Fund to enter into derivatives in making the adjustments called for by DAA. As a
(continued on next page)
| | |
| |
| abfunds.com | | AB CONSERVATIVE WEALTH STRATEGY | 5 |
result of the use of derivatives, the Fund will frequently be leveraged, with net investment exposure in excess of net assets.
Currency exchange rate fluctuations can have a dramatic impact on returns. The Fund’s foreign currency exposures will come from investment in securities priced or denominated in foreign currencies and from direct holdings in foreign currencies and currency-related derivatives. The Adviser may seek to hedge all or a portion of the currency exposure resulting from Fund investments or decide not to hedge this exposure. The Adviser may seek investment opportunities by taking long or short positions in currencies through the use of currency-related derivatives.
| | |
| |
6 | AB CONSERVATIVE WEALTH STRATEGY | | abfunds.com |
DISCLOSURES AND RISKS
Benchmark Disclosure
All indices are unmanaged and do not reflect fees and expenses associated with the active management of a mutual fund portfolio. The Bloomberg Barclays Global Aggregate Bond Index (USD hedged) represents the performance of global investment-grade developed fixed-income markets, hedged to the US dollar. The MSCI ACWI (net, free float-adjusted, market capitalization weighted) represents the equity market performance of developed and emerging markets. MSCI makes no express or implied warranties or representations, and shall have no liability whatsoever with respect to any MSCI data contained herein. The MSCI data may not be further redistributed or used as a basis for other indices, any securities or financial products. This report is not approved, reviewed or produced by MSCI. Net returns include the reinvestment of dividends after deduction of non-US withholding tax. An investor cannot invest directly in an index or average, and their results are not indicative of the performance for any specific investment, including the Fund.
A Word About Risk
Market Risk: The value of the Fund’s assets will fluctuate as the stock, bond or commodities markets fluctuate. The value of its investments may decline, sometimes rapidly and unpredictably, simply because of economic changes or other events, including public health crises (including the occurrence of a contagious disease or illness), that affect large portions of the market. It includes the risk that a particular style of investing, such as growth or value, may be underperforming the stock market generally.
Allocation Risk: The allocation of investments among different investment styles, such as equity or debt, growth or value, US or non-US securities, or diversification strategies, may have a more significant effect on the Fund’s net asset value (“NAV”) when one of these investments is performing more poorly than another.
Credit Risk: An issuer or guarantor of a fixed-income security, or the counterparty to a derivatives or other contract, may be unable or unwilling to make timely payments of interest or principal, or to otherwise honor its obligations. The issuer or guarantor may default, causing a loss of the full principal amount of a security and accrued interest. The degree of risk for a particular security may be reflected in its credit rating. There is the possibility that the credit rating of a fixed-income security may be downgraded after purchase, which may adversely affect the value of the security. Investments in fixed-income securities with lower ratings (commonly known as “junk bonds”) are subject to a higher probability that an issuer will default or fail to meet its payment obligations.
High-Yield Debt Securities Risk: Investments in fixed-income securities with lower ratings (commonly known as “junk bonds”) tend to have a
| | |
| |
| abfunds.com | | AB CONSERVATIVE WEALTH STRATEGY | 7 |
DISCLOSURES AND RISKS (continued)
higher probability that an issuer will default or fail to meet its payment obligations. These securities may be subject to greater price volatility due to such factors as specific corporate developments, interest-rate sensitivity, negative perceptions of the junk bond market generally and less secondary market liquidity.
Interest-Rate Risk: Changes in interest rates will affect the value of the Fund’s investments in fixed-income securities and in Underlying Portfolios that invest in fixed-income securities. When interest rates rise, the value of existing investments in fixed-income securities tends to fall and this decrease in value may not be offset by higher income from new investments. Interest-rate risk is generally greater for fixed-income securities with longer maturities or durations. Very low or negative interest rates would likely magnify the risks associated with changes in interest rates. During periods of very low or negative rates, the Fund’s returns would likely be adversely affected.
Foreign (Non-US) Risk: Investments in securities of non-US issuers may involve more risk than those of US issuers. These securities may fluctuate more widely in price and may be more difficult to trade due to adverse market, economic, political, regulatory or other factors.
Currency Risk: Fluctuations in currency exchange rates may negatively affect the value of the Fund’s investments or reduce its returns.
Emerging-Market Risk: Investments in emerging-market countries may have more risk because the markets are less developed and less liquid as well as being subject to increased economic, political, regulatory or other uncertainties.
Alternative Investments Risk: Many alternative investments can be volatile and may be illiquid. Their performance may have little correlation with the performance of equity or fixed-income markets, and they may not perform in accordance with expectations.
Derivatives Risk: Derivatives may be difficult to price or unwind and leveraged so that small changes may produce disproportionate losses for the Fund. Derivatives, especially over-the-counter derivatives, are also subject to counterparty risk.
Leverage Risk: To the extent the Fund uses leveraging techniques, its NAV may be more volatile because leverage tends to exaggerate the effect of changes in interest rates and any increase or decrease in the value of the Fund’s investments.
Investment in Other Investment Companies Risk: As with other investments, investments in other investment companies are subject to
| | |
| |
8 | AB CONSERVATIVE WEALTH STRATEGY | | abfunds.com |
DISCLOSURES AND RISKS (continued)
market and selection risk. In addition, shareholders of the Fund bear both their proportionate share of expenses in the Fund (including management fees) and, indirectly, the expenses of the investment companies in which the Fund invests (to the extent these expenses are not waived or reimbursed by the Adviser).
Management Risk: The Fund is subject to management risk because it is an actively managed investment fund. The Adviser will apply its investment techniques and risk analyses in making investment decisions for the Fund, but there is no guarantee that its techniques will produce the intended results. Some of these techniques may incorporate, or rely upon, quantitative models, but there is no guarantee that these models will generate accurate forecasts, reduce risk or otherwise perform as expected.
These risks are fully discussed in the Fund’s prospectus. As with all investments, you may lose money by investing in the Fund.
An Important Note About Historical Performance
The investment return and principal value of an investment in the Fund will fluctuate as the prices of the individual securities in which it invests fluctuate, so that your shares, when redeemed, may be worth more or less than their original cost. Performance shown in this report represents past performance and does not guarantee future results. Current performance may be lower or higher than the performance information shown. You may obtain performance information current to the most recent month-end by visiting www.abfunds.com. The performance shown for periods prior to July 14, 2017, is based on the Fund’s prior principal strategies and may not be representative of the Fund’s performance under its current principal strategies. Class B shares are no longer being offered. Effective November 7, 2019, all outstanding Class B shares were converted to Class A shares. Please see Note A for more information.
All fees and expenses related to the operation of the Fund have been deducted. NAV returns do not reflect sales charges; if sales charges were reflected, the Fund’s quoted performance would be lower. SEC returns reflect the applicable sales charges for each share class: a 4.25% maximum front-end sales charge for Class A shares and a 1% 1-year contingent deferred sales charge for Class C shares. Returns for the different share classes will vary due to different expenses associated with each class. Performance assumes reinvestment of distributions and does not account for taxes.
| | |
| |
| abfunds.com | | AB CONSERVATIVE WEALTH STRATEGY | 9 |
HISTORICAL PERFORMANCE
AVERAGE ANNUAL RETURNS AS OF FEBRUARY 28, 2021 (unaudited)
| | | | | | | | |
| | |
| | | NAV Returns | | | SEC Returns
(reflects applicable
sales charges) | |
| | |
| CLASS A SHARES | | | | | | | | |
| | |
| 1 Year | | | 8.16% | | | | 3.56% | |
| | |
| 5 Years | | | 5.25% | | | | 4.35% | |
| | |
| 10 Years | | | 3.79% | | | | 3.34% | |
| | |
| CLASS C SHARES | | | | | | | | |
| | |
| 1 Year | | | 7.37% | | | | 6.37% | |
| | |
| 5 Years | | | 4.46% | | | | 4.46% | |
| | |
| 10 Years | | | 3.02% | | | | 3.02% | |
| | |
| ADVISOR CLASS SHARES1 | | | | | | | | |
| | |
| 1 Year | | | 8.47% | | | | 8.47% | |
| | |
| 5 Years | | | 5.53% | | | | 5.53% | |
| | |
| 10 Years | | | 4.07% | | | | 4.07% | |
| | |
| CLASS R SHARES1 | | | | | | | | |
| | |
| 1 Year | | | 7.78% | | | | 7.78% | |
| | |
| 5 Years | | | 4.83% | | | | 4.83% | |
| | |
| 10 Years | | | 3.38% | | | | 3.38% | |
| | |
| CLASS K SHARES1 | | | | | | | | |
| | |
| 1 Year | | | 8.09% | | | | 8.09% | |
| | |
| 5 Years | | | 5.16% | | | | 5.16% | |
| | |
| 10 Years | | | 3.71% | | | | 3.71% | |
| | |
| CLASS I SHARES1 | | | | | | | | |
| | |
| 1 Year | | | 8.47% | | | | 8.47% | |
| | |
| 5 Years | | | 5.49% | | | | 5.49% | |
| | |
| 10 Years | | | 4.04% | | | | 4.04% | |
The Fund’s current prospectus fee table shows the Fund’s total annual operating expense ratios as 1.46%, 2.21%, 1.21%, 1.85%, 1.55% and 1.23% for Class A, Class C, Advisor Class, Class R, Class K and Class I shares, respectively, gross of any fee waivers or expense reimbursements. Contractual fee waivers and/or expense reimbursement agreements reduced the Fund’s annual operating expense ratios to 1.31%, 2.06%, 1.06%, 1.70%, 1.40% and 1.08% for Class A, Class C, Advisor Class, Class R, Class K and Class I shares, respectively. These waivers/reimbursement agreements may not be terminated before December 31, 2021. Absent reimbursements or waivers, performance would have been lower. The net and gross expenses shown include the total operating expenses of the Fund and the indirect expenses of the Fund’s Underlying Portfolios, as based upon the allocation of the Fund’s assets among the Underlying Portfolios. The Financial Highlights section of this report sets forth expense ratio data for the current reporting period; the expense ratios shown above may differ from the expense ratios in the Financial Highlights section since they are based on different time periods.
| 1 | These share classes are offered at NAV to eligible investors and their SEC returns are the same as their NAV returns. Please note that these share classes are for investors purchasing shares through accounts established under certain fee-based programs sponsored and maintained by certain broker-dealers and financial intermediaries, institutional pension plans and/or investment advisory clients of, and certain other persons associated with, the Adviser and its affiliates or the Fund. |
| | |
| |
10 | AB CONSERVATIVE WEALTH STRATEGY | | abfunds.com |
HISTORICAL PERFORMANCE (continued)
SEC AVERAGE ANNUAL RETURNS
AS OF THE MOST RECENT CALENDAR QUARTER-END
MARCH 31, 2021 (unaudited)
| | | | |
| |
| | | SEC Returns
(reflects applicable
sales charges) | |
| |
| CLASS A SHARES | | | | |
| |
| 1 Year | | | 18.78% | |
| |
| 5 Years | | | 4.04% | |
| |
| 10 Years | | | 3.47% | |
| |
| CLASS C SHARES | | | | |
| |
| 1 Year | | | 22.10% | |
| |
| 5 Years | | | 4.16% | |
| |
| 10 Years | | | 3.16% | |
| |
| ADVISOR CLASS SHARES1 | | | | |
| |
| 1 Year | | | 24.28% | |
| |
| 5 Years | | | 5.21% | |
| |
| 10 Years | | | 4.20% | |
| |
| CLASS R SHARES1 | | | | |
| |
| 1 Year | | | 23.52% | |
| |
| 5 Years | | | 4.53% | |
| |
| 10 Years | | | 3.51% | |
| |
| CLASS K SHARES1 | | | | |
| |
| 1 Year | | | 23.93% | |
| |
| 5 Years | | | 4.84% | |
| |
| 10 Years | | | 3.84% | |
| |
| CLASS I SHARES1 | | | | |
| |
| 1 Year | | | 24.40% | |
| |
| 5 Years | | | 5.19% | |
| |
| 10 Years | | | 4.17% | |
| 1 | Please note that these share classes are for investors purchasing shares through accounts established under certain fee-based programs sponsored and maintained by certain broker-dealers and financial intermediaries, institutional pension plans and/or investment advisory clients of, and certain other persons associated with, the Adviser and its affiliates or the Fund. |
| | |
| |
| abfunds.com | | AB CONSERVATIVE WEALTH STRATEGY | 11 |
EXPENSE EXAMPLE
(unaudited)
As a shareholder of the Fund, you incur two types of costs: (1) transaction costs, including sales charges (loads) on purchase payments, contingent deferred sales charges on redemptions and (2) ongoing costs, including management fees; distribution (12b-1) fees; and other Fund expenses. This example is intended to help you understand your ongoing costs (in dollars) of investing in the Fund and to compare these costs with the ongoing costs of investing in other mutual funds.
The Example is based on an investment of $1,000 invested at the beginning of the period and held for the entire period as indicated below.
Actual Expenses
The table below provides information about actual account values and actual expenses. You may use the information, together with the amount you invested, to estimate the expenses that you paid over the period. Simply divide your account value by $1,000 (for example, an $8,600 account value divided by $1,000 = 8.6), then multiply the result by the number under the heading entitled “Expenses Paid During Period” to estimate the expenses you paid on your account during this period.
Hypothetical Example for Comparison Purposes
The table below also provides information about hypothetical account values and hypothetical expenses based on the Fund’s actual expense ratio and an assumed annual rate of return of 5% before expenses, which is not the Fund’s actual return. The hypothetical account values and expenses may not be used to estimate the actual ending account balance or expenses you paid for the period. You may use this information to compare the ongoing costs of investing in the Fund and other funds by comparing this 5% hypothetical example with the 5% hypothetical examples that appear in the shareholder reports of other funds.
Please note that the expenses shown in the table are meant to highlight your ongoing costs only and do not reflect any transactional costs, such as sales charges (loads), or contingent deferred sales charges on redemptions. Therefore, the hypothetical example is useful in comparing ongoing costs only, and will not help you determine the relative total costs of owning different funds. In addition, if these transactional costs were included, your costs would have been higher.
| | |
| |
12 | AB CONSERVATIVE WEALTH STRATEGY | | abfunds.com |
EXPENSE EXAMPLE (continued)
| | | | | | | | | | | | | | | | | | | | | | | | |
| | | Beginning
Account
Value
September 1,
2020 | | | Ending
Account
Value
February 28,
2021 | | | Expenses
Paid
During
Period* | | | Annualized
Expense
Ratio* | | | Total
Expenses
Paid
During
Period+ | | | Total
Annualized
Expense
Ratio+ | |
| Class A | | | | | | | | | | | | | | | | | | | | | | | | |
Actual | | $ | 1,000 | | | $ | 1,064.10 | | | $ | 5.99 | | | | 1.17 | % | | $ | 6.70 | | | | 1.31 | % |
Hypothetical** | | $ | 1,000 | | | $ | 1,018.99 | | | $ | 5.86 | | | | 1.17 | % | | $ | 6.56 | | | | 1.31 | % |
| Class C | | | | | | | | | | | | | | | | | | | | | | | | |
Actual | | $ | 1,000 | | | $ | 1,059.80 | | | $ | 9.86 | | | | 1.93 | % | | $ | 10.57 | | | | 2.07 | % |
Hypothetical** | | $ | 1,000 | | | $ | 1,015.22 | | | $ | 9.64 | | | | 1.93 | % | | $ | 10.34 | | | | 2.07 | % |
| Advisor Class | | | | | | | | | | | | | | | | | | | | | | | | |
Actual | | $ | 1,000 | | | $ | 1,065.60 | | | $ | 4.71 | | | | 0.92 | % | | $ | 5.43 | | | | 1.06 | % |
Hypothetical** | | $ | 1,000 | | | $ | 1,020.23 | | | $ | 4.61 | | | | 0.92 | % | | $ | 5.31 | | | | 1.06 | % |
| Class R | | | | | | | | | | | | | | | | | | | | | | | | |
Actual | | $ | 1,000 | | | $ | 1,062.10 | | | $ | 8.08 | | | | 1.58 | % | | $ | 8.79 | | | | 1.72 | % |
Hypothetical** | | $ | 1,000 | | | $ | 1,016.96 | | | $ | 7.90 | | | | 1.58 | % | | $ | 8.60 | | | | 1.72 | % |
| Class K | | | | | | | | | | | | | | | | | | | | | | | | |
Actual | | $ | 1,000 | | | $ | 1,064.20 | | | $ | 6.50 | | | | 1.27 | % | | $ | 7.22 | | | | 1.41 | % |
Hypothetical** | | $ | 1,000 | | | $ | 1,018.50 | | | $ | 6.36 | | | | 1.27 | % | | $ | 7.05 | | | | 1.41 | % |
| Class I | | | | | | | | | | | | | | | | | | | | | | | | |
Actual | | $ | 1,000 | | | $ | 1,065.70 | | | $ | 4.81 | | | | 0.94 | % | | $ | 5.53 | | | | 1.08 | % |
Hypothetical** | | $ | 1,000 | | | $ | 1,020.13 | | | $ | 4.71 | | | | 0.94 | % | | $ | 5.41 | | | | 1.08 | % |
| * | Expenses are equal to the classes’ annualized expense ratios, multiplied by the average account value over the period, multiplied by 181/365 (to reflect the one-half year period). |
| ** | Assumes 5% annual return before expenses. |
| + | In connection with the Fund’s investments in affiliated/unaffiliated underlying portfolios, the Fund incurs no direct expenses, but bears proportionate shares of the fees and expenses (i.e., operating, administrative and investment advisory fees) of the affiliated/unaffiliated underlying portfolios. The Adviser has contractually agreed to waive its fees from the Fund in an amount equal to the Fund’s pro rata share of certain acquired fund fees and expenses of the affiliated underlying portfolios. The Fund’s total expenses are equal to the classes’ annualized expense ratio plus the Fund’s pro rata share of the weighted average expense ratio of the affiliated/unaffiliated underlying portfolios in which it invests, multiplied by the average account value over the period, multiplied by 181/365 (to reflect the one-half year period). |
| | |
| |
| abfunds.com | | AB CONSERVATIVE WEALTH STRATEGY | 13 |
PORTFOLIO SUMMARY
February 28, 2021 (unaudited)
PORTFOLIO STATISTICS
Net Assets ($mil): $153.3
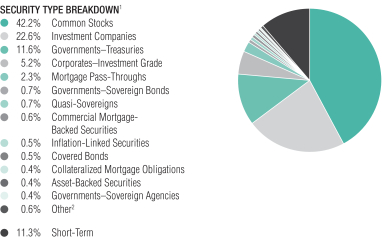
| 1 | All data are as of February 28, 2021. The Fund’s security type breakdown is expressed as a percentage of total investments (excluding security lending collateral) and may vary over time. The Fund also enters into derivative transactions, which may be used for hedging or investment purposes (see “Portfolio of Investments” section of the report for additional details). |
| 2 | “Other” represents 0.3% weightings in the following security types: Local Governments – Provisional Bonds and Collateralized Loan Obligations. |
| | |
| |
14 | AB CONSERVATIVE WEALTH STRATEGY | | abfunds.com |
PORTFOLIO OF INVESTMENTS
February 28, 2021 (unaudited)
| | | | | | | | | | | | |
| Company | | | | | Shares | | | U.S. $ Value | |
| |
COMMON STOCKS – 41.7% | | | | | | | | | | | | |
Information Technology – 11.4% | | | | | | | | | | | | |
Communications Equipment – 0.2% | | | | | | | | | | | | |
Acacia Communications, Inc.(a) | | | | | | | 2,827 | | | $ | 325,077 | |
Motorola Solutions, Inc. | | | | | | | 94 | | | | 16,495 | |
| | | | | | | | | | | | |
| | | | | | | | | | | 341,572 | |
| | | | | | | | | | | | |
Electronic Equipment, Instruments & Components – 2.1% | | | | | | | | | | | | |
Amphenol Corp. – Class A | | | | | | | 7,300 | | | | 917,464 | |
Arrow Electronics, Inc.(a) | | | | | | | 696 | | | | 69,781 | |
CDW Corp./DE | | | | | | | 5,379 | | | | 843,911 | |
Coherent, Inc.(a) | | | | | | | 2,219 | | | | 536,865 | |
FLIR Systems, Inc. | | | | | | | 8,283 | | | | 442,312 | |
IPG Photonics Corp.(a) | | | | | | | 539 | | | | 122,542 | |
MTS Systems Corp. | | | | | | | 2,357 | | | | 137,554 | |
Zebra Technologies Corp. – Class A(a) | | | | | | | 148 | | | | 73,916 | |
| | | | | | | | | | | | |
| | | | | | | | | | | 3,144,345 | |
| | | | | | | | | | | | |
IT Services – 2.7% | | | | | | | | | | | | |
Adyen NV(a)(b) | | | | | | | 2 | | | | 4,667 | |
Amadeus IT Group SA – Class A(a) | | | | | | | 1,298 | | | | 90,623 | |
Automatic Data Processing, Inc. | | | | | | | 5,508 | | | | 958,502 | |
Booz Allen Hamilton Holding Corp. | | | | | | | 1,195 | | | | 92,182 | |
Broadridge Financial Solutions, Inc. | | | | | | | 386 | | | | 55,001 | |
Capgemini SE | | | | | | | 725 | | | | 116,435 | |
Cardtronics PLC – Class A(a) | | | | | | | 3,525 | | | | 135,889 | |
Cognizant Technology Solutions Corp. – Class A | | | | | | | 6,118 | | | | 449,551 | |
EPAM Systems, Inc.(a) | | | | | | | 192 | | | | 71,733 | |
Fidelity National Information Services, Inc. | | | | | | | 1,017 | | | | 140,346 | |
Genpact Ltd. | | | | | | | 1,211 | | | | 48,973 | |
International Business Machines Corp. | | | | | | | 357 | | | | 42,458 | |
Mastercard, Inc. – Class A | | | | | | | 3,797 | | | | 1,343,568 | |
Nomura Research Institute Ltd. | | | | | | | 1,500 | | | | 46,539 | |
Paychex, Inc. | | | | | | | 1,786 | | | | 162,651 | |
Visa, Inc. – Class A | | | | | | | 1,801 | | | | 382,514 | |
Western Union Co. (The) – Class W | | | | | | | 3,017 | | | | 70,055 | |
| | | | | | | | | | | | |
| | | | | | | | | | | 4,211,687 | |
| | | | | | | | | | | | |
Semiconductors & Semiconductor Equipment – 2.0% | | | | | | | | | | | | |
Applied Materials, Inc. | | | | | | | 2,426 | | | | 286,729 | |
Broadcom, Inc. | | | | | | | 44 | | | | 20,674 | |
Dialog Semiconductor PLC(a) | | | | | | | 4,371 | | | | 339,771 | |
Globalwafers Co., Ltd. | | | | | | | 2,000 | | | | 53,103 | |
Inphi Corp.(a) | | | | | | | 2,696 | | | | 443,735 | |
Intel Corp. | | | | | | | 180 | | | | 10,940 | |
JA Solar Technology Co., Ltd.(a) | | | | | | | 3,400 | | | | 17,471 | |
KLA Corp. | | | | | | | 426 | | | | 132,584 | |
| | |
| |
| abfunds.com | | AB CONSERVATIVE WEALTH STRATEGY | 15 |
PORTFOLIO OF INVESTMENTS (continued)
| | | | | | | | | | | | |
| Company | | | | | Shares | | | U.S. $ Value | |
| |
Maxim Integrated Products, Inc. | | | | | | | 5,011 | | | $ | 466,875 | |
Novatek Microelectronics Corp. | | | | | | | 4,000 | | | | 68,109 | |
NVIDIA Corp. | | | | | | | 13 | | | | 7,132 | |
Phison Electronics Corp. | | | | | | | 3,000 | | | | 49,409 | |
QUALCOMM, Inc. | | | | | | | 626 | | | | 85,255 | |
Realtek Semiconductor Corp. | | | | | | | 4,000 | | | | 65,995 | |
STMicroelectronics NV | | | | | | | 1,736 | | | | 67,421 | |
Taiwan Semiconductor Manufacturing Co., Ltd. | | | | | | | 8,000 | | | | 174,776 | |
Taiwan Semiconductor Manufacturing Co., Ltd. (Sponsored ADR) | | | | | | | 1,113 | | | | 140,171 | |
Texas Instruments, Inc. | | | | | | | 918 | | | | 158,144 | |
Xilinx, Inc. | | | | | | | 3,117 | | | | 406,145 | |
| | | | | | | | | | | | |
| | | | | | | | | | | 2,994,439 | |
| | | | | | | | | | | | |
Software – 3.5% | | | | | | | | | | | | |
Autodesk, Inc.(a) | | | | | | | 212 | | | | 58,512 | |
Cadence Design Systems, Inc.(a) | | | | | | | 543 | | | | 76,612 | |
Citrix Systems, Inc. | | | | | | | 1,742 | | | | 232,696 | |
Constellation Software, Inc./Canada | | | | | | | 98 | | | | 126,887 | |
Dropbox, Inc. – Class A(a) | | | | | | | 1,342 | | | | 30,255 | |
Fair Isaac Corp.(a) | | | | | | | 121 | | | | 55,364 | |
Microsoft Corp. | | | | | | | 12,842 | | | | 2,984,224 | |
Nice Ltd.(a) | | | | | | | 115 | | | | 26,563 | |
NortonLifeLock, Inc. | | | | | | | 1,232 | | | | 24,036 | |
Oracle Corp. | | | | | | | 4,369 | | | | 281,844 | |
Oracle Corp./Japan | | | | | | | 700 | | | | 71,043 | |
SAP SE | | | | | | | 3,783 | | | | 467,907 | |
ServiceNow, Inc.(a) | | | | | | | 84 | | | | 44,811 | |
Slack Technologies, Inc. – Class A(a) | | | | | | | 10,406 | | | | 425,918 | |
Synopsys, Inc.(a) | | | | | | | 138 | | | | 33,839 | |
Trade Desk, Inc. (The) – Class A(a) | | | | | | | 72 | | | | 57,988 | |
Trend Micro, Inc./Japan | | | | | | | 4,120 | | | | 199,173 | |
VMware, Inc. – Class A(a) | | | | | | | 1,635 | | | | 225,973 | |
| | | | | | | | | | | | |
| | | | | | | | | | | 5,423,645 | |
| | | | | | | | | | | | |
Technology Hardware, Storage & Peripherals – 0.9% | | | | | | | | | | | | |
Apple, Inc. | | | | | | | 4,611 | | | | 559,130 | |
Lenovo Group Ltd. | | | | | | | 54,000 | | | | 68,258 | |
Logitech International SA | | | | | | | 521 | | | | 55,390 | |
NetApp, Inc. | | | | | | | 1,049 | | | | 65,667 | |
Pegatron Corp. | | | | | | | 11,000 | | | | 29,441 | |
Samsung Electronics Co., Ltd. | | | | | | | 8,051 | | | | 590,023 | |
| | | | | | | | | | | | |
| | | | | | | | | | | 1,367,909 | |
| | | | | | | | | | | | |
| | | | | | | | | | | 17,483,597 | |
| | | | | | | | | | | | |
Health Care – 7.5% | | | | | | | | | | | | |
Biotechnology – 0.7% | | | | | | | | | | | | |
AbbVie, Inc. | | | | | | | 973 | | | | 104,831 | |
| | |
| |
16 | AB CONSERVATIVE WEALTH STRATEGY | | abfunds.com |
PORTFOLIO OF INVESTMENTS (continued)
| | | | | | | | | | | | |
| Company | | | | | Shares | | | U.S. $ Value | |
| |
Alexion Pharmaceuticals, Inc.(a) | | | | | | | 3,134 | | | $ | 478,719 | |
Amgen, Inc. | | | | | | | 221 | | | | 49,707 | |
BGI Genomics Co., Ltd. | | | | | | | 200 | | | | 4,286 | |
Ionis Pharmaceuticals, Inc.(a) | | | | | | | 911 | | | | 47,736 | |
Seegene, Inc. | | | | | | | 324 | | | | 35,723 | |
Viela Bio, Inc.(a)(c) | | | | | | | 7,164 | | | | 381,125 | |
| | | | | | | | | | | | |
| | | | | | | | | | | 1,102,127 | |
| | | | | | | | | | | | |
Health Care Equipment & Supplies – 2.3% | | | | | | | | | | | | |
Abbott Laboratories | | | | | | | 9,133 | | | | 1,093,951 | |
ABIOMED, Inc.(a) | | | | | | | 222 | | | | 72,050 | |
Avantor, Inc.(a) | | | | | | | 1,926 | | | | 53,678 | |
Cantel Medical Corp.(a) | | | | | | | 5,457 | | | | 405,346 | |
Demant A/S(a) | | | | | | | 1,068 | | | | 43,900 | |
Hologic, Inc.(a) | | | | | | | 957 | | | | 68,990 | |
IDEXX Laboratories, Inc.(a) | | | | | | | 147 | | | | 76,465 | |
Koninklijke Philips NV(a) | | | | | | | 8,168 | | | | 445,949 | |
Medtronic PLC | | | | | | | 4,536 | | | | 530,576 | |
Oxford Immunotec Global PLC(a) | | | | | | | 9,317 | | | | 204,508 | |
Supermax Corp. Bhd | | | | | | | 42,337 | | | | 50,457 | |
Top Glove Corp. Bhd | | | | | | | 43,000 | | | | 55,541 | |
Varian Medical Systems, Inc.(a) | | | | | | | 2,535 | | | | 444,309 | |
| | | | | | | | | | | | |
| | | | | | | | | | | 3,545,720 | |
| | | | | | | | | | | | |
Health Care Providers & Services – 1.0% | | | | | | | | | | | | |
Anthem, Inc. | | | | | | | 2,777 | | | | 841,959 | |
Galenica AG(b) | | | | | | | 379 | | | | 24,388 | |
Henry Schein, Inc.(a) | | | | | | | 2,693 | | | | 166,562 | |
Magellan Health, Inc.(a) | | | | | | | 3,189 | | | | 297,598 | |
Molina Healthcare, Inc.(a) | | | | | | | 287 | | | | 62,210 | |
UnitedHealth Group, Inc. | | | | | | | 558 | | | | 185,379 | |
| | | | | | | | | | | | |
| | | | | | | | | | | 1,578,096 | |
| | | | | | | | | | | | |
Health Care Technology – 0.4% | | | | | | | | | | | | |
Cerner Corp. | | | | | | | 847 | | | | 58,562 | |
Change Healthcare, Inc.(a) | | | | | | | 18,988 | | | | 434,255 | |
Veeva Systems, Inc. – Class A(a) | | | | | | | 92 | | | | 25,770 | |
| | | | | | | | | | | | |
| | | | | | | | | | | 518,587 | |
| | | | | | | | | | | | |
Life Sciences Tools & Services – 1.3% | | | | | | | | | | | | |
Agilent Technologies, Inc. | | | | | | | 42 | | | | 5,127 | |
Bio-Rad Laboratories, Inc. – Class A(a) | | | | | | | 120 | | | | 70,140 | |
Hangzhou Tigermed Consulting Co., Ltd. – Class A | | | | | | | 2,697 | | | | 58,886 | |
IQVIA Holdings, Inc.(a) | | | | | | | 7,050 | | | | 1,359,169 | |
Maccura Biotechnology Co., Ltd. | | | | | | | 10,700 | | | | 67,380 | |
PRA Health Sciences, Inc.(a) | | | | | | | 1,765 | | | | 260,179 | |
Thermo Fisher Scientific, Inc. | | | | | | | 302 | | | | 135,924 | |
| | | | | | | | | | | | |
| | | | | | | | | | | 1,956,805 | |
| | | | | | | | | | | | |
| | |
| |
| abfunds.com | | AB CONSERVATIVE WEALTH STRATEGY | 17 |
PORTFOLIO OF INVESTMENTS (continued)
| | | | | | | | | | | | |
| Company | | | | | Shares | | | U.S. $ Value | |
| |
Pharmaceuticals – 1.8% | | | | | | | | | | | | |
Bristol-Myers Squibb Co. | | | | | | | 1,328 | | | $ | 81,446 | |
Eli Lilly & Co. | | | | | | | 220 | | | | 45,076 | |
GlaxoSmithKline PLC | | | | | | | 5,293 | | | | 88,318 | |
GW Pharmaceuticals PLC (Sponsored ADR)(a) | | | | | | | 1,764 | | | | 377,937 | |
Johnson & Johnson | | | | | | | 546 | | | | 86,519 | |
Merck & Co., Inc. | | | | | | | 1,852 | | | | 134,492 | |
Novo Nordisk A/S – Class B | | | | | | | 1,540 | | | | 109,859 | |
Perrigo Co. PLC | | | | | | | 1,269 | | | | 51,217 | |
Roche Holding AG | | | | | | | 1,709 | | | | 560,652 | |
Sanofi | | | | | | | 3,158 | | | | 289,812 | |
Sumitomo Dainippon Pharma Co., Ltd. | | | | | | | 4,300 | | | | 68,349 | |
Takeda Pharmaceutical Co., Ltd. | | | | | | | 2,000 | | | | 67,398 | |
Zoetis, Inc. | | | | | | | 4,971 | | | | 771,698 | |
| | | | | | | | | | | | |
| | | | | | | | | | | 2,732,773 | |
| | | | | | | | | | | | |
| | | | | | | | | | | 11,434,108 | |
| | | | | | | | | | | | |
Financials – 5.9% | | | | | | | | | | | | |
Banks – 1.7% | | | | | | | | | | | | |
ABN AMRO Bank NV (GDR)(a)(b) | | | | | | | 9,296 | | | | 106,890 | |
Absa Group Ltd. | | | | | | | 910 | | | | 7,283 | |
Banco do Brasil SA | | | | | | | 9,600 | | | | 48,050 | |
Bank Leumi Le-Israel BM | | | | | | | 13,080 | | | | 79,332 | |
Bank of America Corp. | | | | | | | 1,016 | | | | 35,265 | |
BNP Paribas SA(a) | | | | | | | 1,060 | | | | 63,014 | |
China Merchants Bank Co., Ltd. – Class H | | | | | | | 2,000 | | | | 15,338 | |
China Minsheng Banking Corp., Ltd. – Class H | | | | | | | 112,000 | | | | 66,837 | |
CIT Group, Inc. | | | | | | | 1,714 | | | | 77,730 | |
Credicorp Ltd. | | | | | | | 187 | | | | 29,922 | |
Danske Bank A/S(a) | | | | | | | 1,658 | | | | 30,479 | |
DBS Group Holdings Ltd. | | | | | | | 2,700 | | | | 53,499 | |
Fifth Third Bancorp | | | | | | | 2,088 | | | | 72,433 | |
FinecoBank Banca Fineco SpA(a) | | | | | | | 3,981 | | | | 69,823 | |
Huaxia Bank Co., Ltd. | | | | | | | 61,600 | | | | 59,488 | |
JPMorgan Chase & Co. | | | | | | | 765 | | | | 112,585 | |
Jyske Bank A/S(a) | | | | | | | 5,763 | | | | 248,262 | |
KBC Group NV(a) | | | | | | | 712 | | | | 51,099 | |
Lloyds Banking Group PLC(a) | | | | | | | 44,624 | | | | 24,314 | |
Mebuki Financial Group, Inc. | | | | | | | 31,700 | | | | 67,714 | |
National Bank of Canada | | | | | | | 260 | | | | 16,377 | |
Natwest Group PLC(a) | | | | | | | 5,106 | | | | 13,189 | |
Royal Bank of Canada | | | | | | | 1,120 | | | | 95,366 | |
Societe Generale SA(a) | | | | | | | 2,955 | | | | 73,126 | |
Standard Chartered PLC(a) | | | | | | | 10,241 | | | | 66,276 | |
SVB Financial Group(a) | | | | | | | 141 | | | | 71,256 | |
TCF Financial Corp. | | | | | | | 10,821 | | | | 484,997 | |
Toronto-Dominion Bank (The) | | | | | | | 498 | | | | 30,187 | |
| | |
| |
18 | AB CONSERVATIVE WEALTH STRATEGY | | abfunds.com |
PORTFOLIO OF INVESTMENTS (continued)
| | | | | | | | | | | | |
| Company | | | | | Shares | | | U.S. $ Value | |
| |
US Bancorp | | | | | | | 1,134 | | | $ | 56,700 | |
Wells Fargo & Co. | | | | | | | 13,490 | | | | 487,933 | |
| | | | | | | | | | | | |
| | | | | | | | | | | 2,714,764 | |
| | | | | | | | | | | | |
Capital Markets – 2.8% | | | | | | | | | | | | |
Ameriprise Financial, Inc. | | | | | | | 326 | | | | 72,124 | |
BlackRock, Inc. – Class A | | | | | | | 289 | | | | 200,711 | |
Charles Schwab Corp. (The) | | | | | | | 18,494 | | | | 1,141,450 | |
CME Group, Inc. – Class A | | | | | | | 1,595 | | | | 318,521 | |
Eaton Vance Corp. | | | | | | | 6,654 | | | | 486,208 | |
EQT AB | | | | | | | 2,417 | | | | 67,001 | |
Goldman Sachs Group, Inc. (The) | | | | | | | 1,031 | | | | 329,384 | |
Julius Baer Group Ltd. | | | | | | | 8,198 | | | | 504,614 | |
Moody’s Corp. | | | | | | | 1,283 | | | | 352,684 | |
Morgan Stanley | | | | | | | 3,881 | | | | 298,354 | |
Partners Group Holding AG | | | | | | | 94 | | | | 112,543 | |
Raymond James Financial, Inc. | | | | | | | 600 | | | | 70,044 | |
S&P Global, Inc. | | | | | | | 236 | | | | 77,729 | |
Singapore Exchange Ltd. | | | | | | | 27,800 | | | | 206,978 | |
T Rowe Price Group, Inc. | | | | | | | 189 | | | | 30,644 | |
| | | | | | | | | | | | |
| | | | | | | | | | | 4,268,989 | |
| | | | | | | | | | | | |
Consumer Finance – 0.2% | | | | | | | | | | | | |
American Express Co. | | | | | | | 1,936 | | | | 261,863 | |
| | | | | | | | | | | | |
| | | |
Diversified Financial Services – 0.5% | | | | | | | | | | | | |
Berkshire Hathaway, Inc. – Class B(a) | | | | | | | 16 | | | | 3,848 | |
Far East Horizon Ltd.(c) | | | | | | | 64,000 | | | | 68,851 | |
Groupe Bruxelles Lambert SA | | | | | | | 1,305 | | | | 129,083 | |
IHS Markit Ltd. | | | | | | | 5,103 | | | | 460,087 | |
Kinnevik AB – Class B(a) | | | | | | | 1,499 | | | | 69,559 | |
| | | | | | | | | | | | |
| | | | | | | | | | | 731,428 | |
| | | | | | | | | | | | |
Insurance – 0.7% | | | | | | | | | | | | |
Allianz SE | | | | | | | 208 | | | | 50,203 | |
CNP Assurances(a) | | | | | | | 4,058 | | | | 73,025 | |
iA Financial Corp., Inc.(c) | | | | | | | 1,337 | | | | 68,699 | |
Manulife Financial Corp.(c) | | | | | | | 3,897 | | | | 77,689 | |
MetLife, Inc. | | | | | | | 825 | | | | 47,520 | |
PICC Property & Casualty Co., Ltd. – Class H | | | | | | | 140,000 | | | | 105,919 | |
Progressive Corp. (The) | | | | | | | 415 | | | | 35,669 | |
Prudential Financial, Inc. | | | | | | | 70 | | | | 6,070 | |
RenaissanceRe Holdings Ltd. | | | | | | | 449 | | | | 74,974 | |
Sampo Oyj – Class A | | | | | | | 1,292 | | | | 57,509 | |
Willis Towers Watson PLC | | | | | | | 2,224 | | | | 490,703 | |
Zurich Insurance Group AG | | | | | | | 112 | | | | 45,720 | |
| | | | | | | | | | | | |
| | | | | | | | | | | 1,133,700 | |
| | | | | | | | | | | | |
| | | | | | | | | | | 9,110,744 | |
| | | | | | | | | | | | |
| | |
| |
| abfunds.com | | AB CONSERVATIVE WEALTH STRATEGY | 19 |
PORTFOLIO OF INVESTMENTS (continued)
| | | | | | | | | | | | |
| Company | | | | | Shares | | | U.S. $ Value | |
| |
Consumer Discretionary – 5.7% | | | | | | | | | | | | |
Auto Components – 0.6% | | | | | | | | | | | | |
Aisin Seiki Co., Ltd. | | | | | | | 2,000 | | | $ | 68,735 | |
Aptiv PLC(a) | | | | | | | 5,411 | | | | 810,784 | |
BorgWarner, Inc. | | | | | | | 697 | | | | 31,365 | |
JTEKT Corp. | | | | | | | 3,500 | | | | 37,174 | |
Lear Corp. | | | | | | | 318 | | | | 52,817 | |
| | | | | | | | | | | | |
| | | | | | | | | | | 1,000,875 | |
| | | | | | | | | | | | |
Automobiles – 0.2% | | | | | | | | | | | | |
BAIC Motor Corp., Ltd.(b) | | | | | | | 173,500 | | | | 62,064 | |
Ford Motor Co.(a) | | | | | | | 4,849 | | | | 56,733 | |
Geely Automobile Holdings Ltd. | | | | | | | 11,000 | | | | 35,582 | |
Great Wall Motor Co., Ltd. – Class H | | | | | | | 7,500 | | | | 21,726 | |
Kia Motors Corp. | | | | | | | 227 | | | | 16,005 | |
Nissan Motor Co., Ltd.(a) | | | | | | | 8,000 | | | | 43,736 | |
Tesla, Inc.(a) | | | | | | | 53 | | | | 35,802 | |
Yadea Group Holdings Ltd.(b) | | | | | | | 20,219 | | | | 43,967 | |
| | | | | | | | | | | | |
| | | | | | | | | | | 315,615 | |
| | | | | | | | | | | | |
Diversified Consumer Services – 0.2% | | | | | | | | | | | | |
Service Corp. International/US | | | | | | | 6,752 | | | | 322,475 | |
TAL Education Group (ADR)(a) | | | | | | | 298 | | | | 23,107 | |
| | | | | | | | | | | | |
| | | | | | | | | | | 345,582 | |
| | | | | | | | | | | | |
Hotels, Restaurants & Leisure – 0.6% | | | | | | | | | | | | |
Aristocrat Leisure Ltd. | | | | | | | 4,525 | | | | 105,853 | |
Compass Group PLC(a) | | | | | | | 11,947 | | | | 242,607 | |
Domino’s Pizza, Inc. | | | | | | | 184 | | | | 63,758 | |
Galaxy Entertainment Group Ltd. | | | | | | | 14,000 | | | | 127,717 | |
La Francaise des Jeux SAEM(b) | | | | | | | 130 | | | | 5,868 | |
McDonald’s Corp. | | | | | | | 475 | | | | 97,917 | |
Starbucks Corp. | | | | | | | 1,913 | | | | 206,662 | |
| | | | | | | | | | | | |
| | | | | | | | | | | 850,382 | |
| | | | | | | | | | | | |
Household Durables – 0.2% | | | | | | | | | | | | |
Electrolux AB – Class B | | | | | | | 2,832 | | | | 66,860 | |
Garmin Ltd. | | | | | | | 157 | | | | 19,471 | |
Haier Smart Home Co., Ltd.(a) | | | | | | | 16,400 | | | | 62,374 | |
LG Electronics, Inc. | | | | | | | 294 | | | | 38,248 | |
Sony Corp. | | | | | | | 1,200 | | | | 126,721 | |
Whirlpool Corp. | | | | | | | 123 | | | | 23,380 | |
| | | | | | | | | | | | |
| | | | | | | | | | | 337,054 | |
| | | | | | | | | | | | |
Internet & Direct Marketing Retail – 1.7% | | | | | | | | | | | | |
Alibaba Group Holding Ltd. (ADR)(a) | | | | | | | 1,306 | | | | 310,514 | |
Amazon.com, Inc.(a) | | | | | | | 266 | | | | 822,720 | |
eBay, Inc. | | | | | | | 1,248 | | | | 70,412 | |
Grubhub, Inc.(a) | | | | | | | 6,232 | | | | 399,284 | |
HelloFresh SE(a) | | | | | | | 884 | | | | 68,682 | |
| | |
| |
20 | AB CONSERVATIVE WEALTH STRATEGY | | abfunds.com |
PORTFOLIO OF INVESTMENTS (continued)
| | | | | | | | | | | | |
| Company | | | | | Shares | | | U.S. $ Value | |
| |
JD.com, Inc. (ADR)(a) | | | | | | | 237 | | | $ | 22,247 | |
Just Eat Takeaway.com NV(a) (b) | | | | | | | 739 | | | | 71,112 | |
Naspers Ltd. – Class N | | | | | | | 2,271 | | | | 535,905 | |
Pinduoduo, Inc. (ADR)(a) | | | | | | | 295 | | | | 50,492 | |
Prosus NV(a) | | | | | | | 1,778 | | | | 211,967 | |
Zalando SE(a)(b) | | | | | | | 591 | | | | 60,759 | |
| | | | | | | | | | | | |
| | | | | | | | | | | 2,624,094 | |
| | | | | | | | | | | | |
Leisure Products – 0.0% | | | | | | | | | | | | |
Polaris, Inc. | | | | | | | 565 | | | | 66,534 | |
| | | | | | | | | | | | |
| | | |
Multiline Retail – 0.1% | | | | | | | | | | | | |
Dollar General Corp. | | | | | | | 470 | | | | 88,825 | |
Next PLC(a) | | | | | | | 643 | | | | 68,110 | |
| | | | | | | | | | | | |
| | | | | | | | | | | 156,935 | |
| | | | | | | | | | | | |
Specialty Retail – 1.3% | | | | | | | | | | | | |
AutoZone, Inc.(a) | | | | | | | 147 | | | | 170,508 | |
China Meidong Auto Holdings Ltd. | | | | | | | 5,060 | | | | 19,229 | |
GrandVision NV(a)(b) | | | | | | | 10,979 | | | | 333,817 | |
Home Depot, Inc. (The) | | | | | | | 643 | | | | 166,113 | |
Lowe’s Cos., Inc. | | | | | | | 169 | | | | 26,998 | |
O’Reilly Automotive, Inc.(a) | | | | | | | 253 | | | | 113,174 | |
Ross Stores, Inc. | | | | | | | 566 | | | | 66,018 | |
Sportsman’s Warehouse Holdings, Inc.(a) | | | | | | | 17,235 | | | | 291,961 | |
TJX Cos., Inc. (The) | | | | | | | 10,929 | | | | 721,205 | |
Topsports International Holdings Ltd.(b) | | | | | | | 10,000 | | | | 14,683 | |
| | | | | | | | | | | | |
| | | | | | | | | | | 1,923,706 | |
| | | | | | | | | | | | |
Textiles, Apparel & Luxury Goods – 0.8% | | | | | | | | | | | | |
adidas AG(a) | | | | | | | 256 | | | | 89,238 | |
Bosideng International Holdings Ltd. | | | | | | | 32,000 | | | | 13,472 | |
Deckers Outdoor Corp.(a) | | | | | | | 456 | | | | 148,706 | |
EssilorLuxottica SA | | | | | | | 600 | | | | 97,880 | |
NIKE, Inc. – Class B | | | | | | | 5,700 | | | | 768,246 | |
Pandora A/S | | | | | | | 703 | | | | 68,251 | |
| | | | | | | | | | | | |
| | | | | | | | | | | 1,185,793 | |
| | | | | | | | | | | | |
| | | | | | | | | | | 8,806,570 | |
| | | | | | | | | | | | |
Industrials – 3.6% | | | | | | | | | | | | |
Aerospace & Defense – 0.3% | | | | | | | | | | | | |
Aerojet Rocketdyne Holdings, Inc.(a) | | | | | | | 8,712 | | | | 446,664 | |
L3Harris Technologies, Inc. | | | | | | | 450 | | | | 81,860 | |
| | | | | | | | | | | | |
| | | | | | | | | | | 528,524 | |
| | | | | | | | | | | | |
Air Freight & Logistics – 0.0% | | | | | | | | | | | | |
Kuehne & Nagel International AG | | | | | | | 295 | | | | 70,001 | |
| | | | | | | | | | | | |
| | | |
Building Products – 0.5% | | | | | | | | | | | | |
Allegion PLC | | | | | | | 2,193 | | | | 238,555 | |
| | |
| |
| abfunds.com | | AB CONSERVATIVE WEALTH STRATEGY | 21 |
PORTFOLIO OF INVESTMENTS (continued)
| | | | | | | | | | | | |
| Company | | | | | Shares | | | U.S. $ Value | |
| |
Cie de Saint-Gobain(a) | | | | | | | 1,005 | | | $ | 54,045 | |
Masco Corp. | | | | | | | 1,049 | | | | 55,828 | |
Otis Worldwide Corp. | | | | | | | 6,843 | | | | 435,967 | |
| | | | | | | | | | | | |
| | | | | | | | | | | 784,395 | |
| | | | | | | | | | | | |
Commercial Services & Supplies – 0.8% | | | | | | | | | | | | |
Secom Co., Ltd. | | | | | | | 3,900 | | | | 339,592 | |
Stericycle, Inc.(a) | | | | | | | 12,816 | | | | 831,374 | |
| | | | | | | | | | | | |
| | | | | | | | | | | 1,170,966 | |
| | | | | | | | | | | | |
Electrical Equipment – 0.3% | | | | | | | | | | | | |
Acuity Brands, Inc. | | | | | | | 531 | | | | 65,472 | |
Generac Holdings, Inc.(a) | | | | | | | 94 | | | | 30,979 | |
Prysmian SpA | | | | | | | 1,922 | | | | 61,737 | |
Regal Beloit Corp. | | | | | | | 412 | | | | 56,308 | |
Rockwell Automation, Inc. | | | | | | | 145 | | | | 35,275 | |
Schneider Electric SE | | | | | | | 544 | | | | 80,444 | |
Vertiv Holdings Co. | | | | | | | 3,715 | | | | 77,755 | |
Vestas Wind Systems A/S | | | | | | | 318 | | | | 59,633 | |
| | | | | | | | | | | | |
| | | | | | | | | | | 467,603 | |
| | | | | | | | | | | | |
Industrial Conglomerates – 0.2% | | | | | | | | | | | | |
3M Co. | | | | | | | 1,631 | | | | 285,523 | |
| | | | | | | | | | | | |
| | | |
Machinery – 0.6% | | | | | | | | | | | | |
CNH Industrial NV(a) | | | | | | | 3,355 | | | | 49,522 | |
Deere & Co. | | | | | | | 259 | | | | 90,422 | |
Dover Corp. | | | | | | | 1,453 | | | | 179,097 | |
Kawasaki Heavy Industries Ltd.(a) | | | | | | | 3,100 | | | | 70,253 | |
Mitsubishi Heavy Industries Ltd. | | | | | | | 2,400 | | | | 69,620 | |
Navistar International Corp.(a) | | | | | | | 1,535 | | | | 67,632 | |
SKF AB – Class B | | | | | | | 470 | | | | 12,806 | |
Snap-on, Inc. | | | | | | | 358 | | | | 72,713 | |
Volvo AB(a) | | | | | | | 11,629 | | | | 297,707 | |
| | | | | | | | | | | | |
| | | | | | | | | | | 909,772 | |
| | | | | | | | | | | | |
Marine – 0.1% | | | | | | | | | | | | |
COSCO SHIPPING Holdings Co., Ltd.(a) | | | | | | | 17,000 | | | | 33,308 | |
Evergreen Marine Corp. Taiwan Ltd.(a) | | | | | | | 16,000 | | | | 21,791 | |
Nippon Yusen KK | | | | | | | 2,400 | | | | 69,419 | |
| | | | | | | | | | | | |
| | | | | | | | | | | 124,518 | |
| | | | | | | | | | | | |
Professional Services – 0.7% | | | | | | | | | | | | |
Intertrust NV(a) | | | | | | | 2,508 | | | | 40,878 | |
RELX PLC | | | | | | | 10,377 | | | | 244,147 | |
Robert Half International, Inc. | | | | | | | 833 | | | | 64,799 | |
Verisk Analytics, Inc. – Class A | | | | | | | 3,399 | | | | 556,926 | |
Wolters Kluwer NV | | | | | | | 1,262 | | | | 100,038 | |
| | | | | | | | | | | | |
| | | | | | | | | | | 1,006,788 | |
| | | | | | | | | | | | |
| | |
| |
22 | AB CONSERVATIVE WEALTH STRATEGY | | abfunds.com |
PORTFOLIO OF INVESTMENTS (continued)
| | | | | | | | | | | | |
| Company | | | | | Shares | | | U.S. $ Value | |
| |
Road & Rail – 0.1% | | | | | | | | | | | | |
AMERCO | | | | | | | 126 | | | $ | 72,414 | |
Union Pacific Corp. | | | | | | | 54 | | | | 11,122 | |
| | | | | | | | | | | | |
| | | | | | | | | | | 83,536 | |
| | | | | | | | | | | | |
Trading Companies & Distributors – 0.0% | | | | | | | | | | | | |
United Rentals, Inc.(a) | | | | | | | 32 | | | | 9,516 | |
WW Grainger, Inc. | | | | | | | 104 | | | | 38,762 | |
| | | | | | | | | | | | |
| | | | | | | | | | | 48,278 | |
| | | | | | | | | | | | |
| | | | | | | | | | | 5,479,904 | |
| | | | | | | | | | | | |
Communication Services – 3.3% | | | | | | | | | | | | |
Diversified Telecommunication Services – 0.3% | | | | | | | | | | | | |
Comcast Corp. – Class A | | | | | | | 6,556 | | | | 345,632 | |
Nippon Telegraph & Telephone Corp. | | | | | | | 6,100 | | | | 158,021 | |
Telenor ASA | | | | | | | 710 | | | | 11,477 | |
| | | | | | | | | | | | |
| | | | | | | | | | | 515,130 | |
| | | | | | | | | | | | |
Entertainment – 0.4% | | | | | | | | | | | | |
Activision Blizzard, Inc. | | | | | | | 1,213 | | | | 115,975 | |
Electronic Arts, Inc. | | | | | | | 1,906 | | | | 255,346 | |
Netflix, Inc.(a) | | | | | | | 128 | | | | 68,973 | |
Nintendo Co., Ltd. | | | | | | | 145 | | | | 88,678 | |
Take-Two Interactive Software, Inc.(a) | | | | | | | 391 | | | | 72,124 | |
Ubisoft Entertainment SA(a) | | | | | | | 527 | | | | 42,967 | |
Walt Disney Co. (The)(a) | | | | | | | 45 | | | | 8,507 | |
| | | | | | | | | | | | |
| | | | | | | | | | | 652,570 | |
| | | | | | | | | | | | |
Interactive Media & Services – 2.5% | | | | | | | | | | | | |
Alphabet, Inc. – Class A(a) | | | | | | | 89 | | | | 179,950 | |
Alphabet, Inc. – Class C(a) | | | | | | | 871 | | | | 1,774,105 | |
Auto Trader Group PLC(a) | | | | | | | 17,265 | | | | 132,743 | |
Facebook, Inc. – Class A(a) | | | | | | | 5,842 | | | | 1,505,015 | |
IAC/InterActiveCorp(a) | | | | | | | 296 | | | | 72,470 | |
Kakaku.com, Inc. | | | | | | | 2,400 | | | | 76,461 | |
Tencent Holdings Ltd. | | | | | | | 400 | | | | 34,799 | |
| | | | | | | | | | | | |
| | | | | | | | | | | 3,775,543 | |
| | | | | | | | | | | | |
Wireless Telecommunication Services – 0.1% | | | | | | | | | | | | |
Softbank Corp. | | | | | | | 2,700 | | | | 36,510 | |
Vodafone Group PLC | | | | | | | 20,327 | | | | 34,797 | |
| | | | | | | | | | | | |
| | | | | | | | | | | 71,307 | |
| | | | | | | | | | | | |
| | | | | | | | | | | 5,014,550 | |
| | | | | | | | | | | | |
Consumer Staples – 1.4% | | | | | | | | | | | | |
Beverages – 0.4% | | | | | | | | | | | | |
Asahi Group Holdings Ltd. | | | | | | | 6,521 | | | | 284,688 | |
Chongqing Brewery Co., Ltd. | | | | | | | 2,990 | | | | 55,871 | |
Coca-Cola Co. (The) | | | | | | | 4,717 | | | | 231,086 | |
| | |
| |
| abfunds.com | | AB CONSERVATIVE WEALTH STRATEGY | 23 |
PORTFOLIO OF INVESTMENTS (continued)
| | | | | | | | | | | | |
| Company | | | | | Shares | | | U.S. $ Value | |
| |
Kirin Holdings Co., Ltd. | | | | | | | 3,000 | | | $ | 59,102 | |
| | | | | | | | | | | | |
| | | | | | | | | | | 630,747 | |
| | | | | | | | | | | | |
Food & Staples Retailing – 0.2% | | | | | | | | | | | | |
Koninklijke Ahold Delhaize NV | | | | | | | 4,896 | | | | 129,278 | |
Progenic Pharmaceuticals Cvr(d)(e) | | | | | | | 24,977 | | | | – 0 | – |
Walmart, Inc. | | | | | | | 1,122 | | | | 145,770 | |
| | | | | | | | | | | | |
| | | | | | | | | | | 275,048 | |
| | | | | | | | | | | | |
Food Products – 0.5% | | | | | | | | | | | | |
Archer-Daniels-Midland Co. | | | | | | | 1,266 | | | | 71,630 | |
Bunge Ltd. | | | | | | | 913 | | | | 69,918 | |
Danone SA | | | | | | | 4,022 | | | | 273,500 | |
Ingredion, Inc. | | | | | | | 767 | | | | 69,183 | |
Morinaga & Co., Ltd./Japan | | | | | | | 1,400 | | | | 50,564 | |
Nestle SA | | | | | | | 639 | | | | 66,692 | |
Salmar ASA | | | | | | | 2,405 | | | | 157,731 | |
| | | | | | | | | | | | |
| | | | | | | | | | | 759,218 | |
| | | | | | | | | | | | |
Household Products – 0.1% | | | | | | | | | | | | |
Procter & Gamble Co. (The) | | | | | | | 1,137 | | | | 140,454 | |
| | | | | | | | | | | | |
| | | |
Tobacco – 0.2% | | | | | | | | | | | | |
Imperial Brands PLC | | | | | | | 310 | | | | 5,776 | |
Philip Morris International, Inc. | | | | | | | 1,341 | | | | 112,671 | |
Smoore International Holdings Ltd.(a)(b) | | | | | | | 7,000 | | | | 56,749 | |
Swedish Match AB | | | | | | | 1,820 | | | | 130,628 | |
| | | | | | | | | | | | |
| | | | | | | | | | | 305,824 | |
| | | | | | | | | | | | |
| | | | | | | | | | | 2,111,291 | |
| | | | | | | | | | | | |
Materials – 1.2% | | | | | | | | | | | | |
Chemicals – 0.9% | | | | | | | | | | | | |
Akzo Nobel NV | | | | | | | 676 | | | | 69,905 | |
Hengli Petrochemical Co., Ltd. | | | | | | | 3,200 | | | | 17,925 | |
Inner Mongolia Junzheng Energy & Chemical Industry Group Co., Ltd. – Class A | | | | | | | 16,800 | | | | 15,491 | |
International Flavors & Fragrances, Inc. | | | | | | | 6,184 | | | | 837,995 | |
Johnson Matthey PLC | | | | | | | 979 | | | | 41,833 | |
Kumho Petrochemical Co., Ltd.(a) | | | | | | | 240 | | | | 44,967 | |
LANXESS AG | | | | | | | 945 | | | | 70,143 | |
Linde PLC | | | | | | | 511 | | | | 124,822 | |
Mitsui Chemicals, Inc. | | | | | | | 800 | | | | 24,782 | |
RPM International, Inc. | | | | | | | 645 | | | | 51,368 | |
Sumitomo Chemical Co., Ltd. | | | | | | | 7,000 | | | | 34,078 | |
| | | | | | | | | | | | |
| | | | | | | | | | | 1,333,309 | |
| | | | | | | | | | | | |
Construction Materials – 0.0% | |
Forterra, Inc.(a) | | | | | | | 1,576 | | | | 36,673 | |
| | | | | | | | | | | | |
| | |
| |
24 | AB CONSERVATIVE WEALTH STRATEGY | | abfunds.com |
PORTFOLIO OF INVESTMENTS (continued)
| | | | | | | | | | | | |
| Company | | | | | Shares | | | U.S. $ Value | |
| |
Containers & Packaging – 0.0% | | | | | |
Smurfit Kappa Group PLC | | | | | | | 779 | | | $ | 36,807 | |
| | | | | | | | | | | | |
| |
Metals & Mining – 0.3% | | | | | |
Evraz PLC | | | | | | | 8,846 | | | | 71,016 | |
First Quantum Minerals Ltd. | | | | | | | 1,081 | | | | 23,300 | |
Glencore PLC(a) | | | | | | | 10,293 | | | | 41,888 | |
Hunan Valin Steel Co., Ltd. – Class A | | | | | | | 38,200 | | | | 34,537 | |
Kumba Iron Ore Ltd. | | | | | | | 1,562 | | | | 66,996 | |
Rio Tinto PLC | | | | | | | 117 | | | | 10,140 | |
Southern Copper Corp. | | | | | | | 882 | | | | 62,913 | |
Steel Dynamics, Inc. | | | | | | | 1,569 | | | | 65,239 | |
Teck Resources Ltd. – Class B | | | | | | | 2,562 | | | | 53,350 | |
| | | | | | | | | | | | |
| | | | | | | | | | | 429,379 | |
| | | | | | | | | | | | |
| | | | | | | | | | | 1,836,168 | |
| | | | | | | | | | | | |
Utilities – 0.7% | |
Electric Utilities – 0.6% | |
American Electric Power Co., Inc. | | | | | | | 315 | | | | 23,578 | |
EDP – Energias de Portugal SA | | | | | | | 14,571 | | | | 83,517 | |
Enel SpA | | | | | | | 16,468 | | | | 155,275 | |
Iberdrola SA | | | | | | | 6,408 | | | | 80,304 | |
NextEra Energy, Inc. | | | | | | | 1,412 | | | | 103,754 | |
NRG Energy, Inc. | | | | | | | 489 | | | | 17,853 | |
PNM Resources, Inc. | | | | | | | 9,173 | | | | 440,396 | |
| | | | | | | | | | | | |
| | | | | | | | | | | 904,677 | |
| | | | | | | | | | | | |
Gas Utilities – 0.0% | |
UGI Corp. | | | | | | | 133 | | | | 5,095 | |
| | | | | | | | | | | | |
|
Multi-Utilities – 0.1% | |
Ameren Corp. | | | | | | | 1,551 | | | | 108,989 | |
Dominion Energy, Inc. | | | | | | | 715 | | | | 48,849 | |
Sempra Energy | | | | | | | 507 | | | | 58,802 | |
| | | | | | | | | | | | |
| | | | | | | | | | | 216,640 | |
| | | | | | | | | | | | |
| | | | | | | | | | | 1,126,412 | |
| | | | | | | | | | | | |
Real Estate – 0.5% | |
Equity Real Estate Investment Trusts (REITs) – 0.3% | |
American Campus Communities, Inc. | | | | | | | 937 | | | | 38,379 | |
American Tower Corp. | | | | | | | 1,408 | | | | 304,311 | |
Nippon Building Fund, Inc. | | | | | | | 15 | | | | 91,896 | |
Orix JREIT, Inc.(c) | | | | | | | 19 | | | | 32,543 | |
Weyerhaeuser Co. | | | | | | | 1,729 | | | | 58,561 | |
| | | | | | | | | | | | |
| | | | | | | | | | | 525,690 | |
| | | | | | | | | | | | |
Real Estate Management & Development – 0.2% | |
CBRE Group, Inc. – Class A(a) | | | | | | | 3,277 | | | | 248,298 | |
Tokyu Fudosan Holdings Corp. | | | | | | | 3,700 | | | | 23,369 | |
| | |
| |
| abfunds.com | | AB CONSERVATIVE WEALTH STRATEGY | 25 |
PORTFOLIO OF INVESTMENTS (continued)
| | | | | | | | | | | | |
| Company | | | | | Shares | | | U.S. $ Value | |
| |
Vonovia SE | | | | | | | 764 | | | $ | 48,659 | |
| | | | | | | | | | | | |
| | | | | | | | | | | 320,326 | |
| | | | | | | | | | | | |
| | | | | | | | | | | 846,016 | |
| | | | | | | | | | | | |
Energy – 0.5% | | | | | | | | | | | | |
Oil, Gas & Consumable Fuels – 0.5% | | | | | | | | | | | | |
Cheniere Energy, Inc.(a) | | | | | | | 1,048 | | | | 70,625 | |
ENEOS Holdings, Inc. | | | | | | | 11,800 | | | | 52,179 | |
Idemitsu Kosan Co., Ltd.(c) | | | | | | | 1,000 | | | | 26,303 | |
LUKOIL PJSC (Sponsored ADR) | | | | | | | 1,935 | | | | 144,157 | |
Neste Oyj | | | | | | | 420 | | | | 27,741 | |
OMV AG | | | | | | | 1,394 | | | | 67,162 | |
Parkland Corp./Canada(c) | | | | | | | 2,051 | | | | 65,175 | |
QEP Resources, Inc. | | | | | | | 772 | | | | 2,656 | |
Royal Dutch Shell PLC – Class B | | | | | | | 7,037 | | | | 137,949 | |
Valero Energy Corp. | | | | | | | 851 | | | | 65,510 | |
Yanzhou Coal Mining Co., Ltd. | | | | | | | 15,800 | | | | 23,587 | |
Yanzhou Coal Mining Co., Ltd. – Class H | | | | | | | 40,000 | | | | 37,083 | |
| | | | | | | | | | | | |
| | | | | | | | | | | 720,127 | |
| | | | | | | | | | | | |
Total Common Stocks
(cost $51,036,425) | | | | | | | | | | | 63,969,487 | |
| | | | | | | | | | | | |
| | | | | | | | | | | | |
INVESTMENT COMPANIES – 22.3% | | | | | | | | | | | | |
Funds and Investment Trusts – 22.3%(f) | | | | | | | | | | | | |
AB All Market Real Return Portfolio – Class Z(g) | | | | | | | 1,307,166 | | | | 11,803,705 | |
AB High Income Fund, Inc. – Class Z(g) | | | | | | | 1,974,992 | | | | 15,799,940 | |
Consumer Staples Select Sector SPDR Fund(c) | | | | | | | 2,401 | | | | 151,983 | |
Financial Select Sector SPDR Fund | | | | | | | 82,037 | | | | 2,650,616 | |
iShares JP Morgan USD Emerging Markets Bond ETF | | | | | | | 1,368 | | | | 150,521 | |
iShares MSCI ACWI ETF(c) | | | | | | | 1,467 | | | | 135,712 | |
iShares MSCI Global Min Vol Factor ETF(c) | | | | | | | 3,065 | | | | 288,478 | |
iShares MSCI USA Value Factor ETF(c) | | | | | | | 26,440 | | | | 2,537,711 | |
iShares US Technology ETF | | | | | | | 4,310 | | | | 374,625 | |
SPDR S&P Biotech ETF | | | | | | | 672 | | | | 99,456 | |
Utilities Select Sector SPDR Fund(c) | | | | | | | 1,728 | | | | 100,846 | |
VanEck Vectors JP Morgan EM Local Currency Bond ETF – Class E | | | | | | | 4,312 | | | | 136,777 | |
| | | | | | | | | | | | |
| | | |
Total Investment Companies
(cost $33,473,878) | | | | | | | | | | | 34,230,370 | |
| | | | | | | | | | | | |
| | |
| |
26 | AB CONSERVATIVE WEALTH STRATEGY | | abfunds.com |
PORTFOLIO OF INVESTMENTS (continued)
| | | | | | | | | | | | |
| | | | | | Principal
Amount
(000) | | | U.S. $ Value | |
| |
GOVERNMENTS - TREASURIES – 11.4% | | | | | | | | | | | | |
Australia – 1.1% | | | | | | | | | | | | |
Australia Government Bond
Series 142
4.25%, 04/21/2026(b) | | | AUD | | | | 605 | | | $ | 545,679 | |
Series 144
3.75%, 04/21/2037(b) | | | | | | | 275 | | | | 254,333 | |
Series 145
2.75%, 06/21/2035(b) | | | | | | | 351 | | | | 291,156 | |
Series 150
3.00%, 03/21/2047(b) | | | | | | | 625 | | | | 510,040 | |
Series 161
0.25%, 11/21/2025(b) | | | | | | | 135 | | | | 101,517 | |
| | | | | | | | | | | | |
| | | | | | | | | | | 1,702,725 | |
| | | | | | | | | | | | |
Austria – 0.2% | | | | | | | | | | | | |
Republic of Austria Government Bond
0.50%, 02/20/2029(b) | | | EUR | | | | 189 | | | | 241,054 | |
| | | | | | | | | | | | |
| | | |
Belgium – 0.1% | | | | | | | | | | | | |
Kingdom of Belgium Government Bond
Series 76
1.90%, 06/22/2038(b) | | | | | | | 95 | | | | 143,891 | |
| | | | | | | | | | | | |
| | | |
Canada – 0.1% | | | | | | | | | | | | |
Canadian Government Bond
0.25%, 03/01/2026 | | | CAD | | | | 185 | | | | 140,018 | |
| | | | | | | | | | | | |
| | | |
China – 1.1% | | | | | | | | | | | | |
China Government Bond
Series 1916
3.12%, 12/05/2026 | | | CNY | | | | 7,590 | | | | 1,178,366 | |
Series INBK
3.39%, 03/16/2050 | | | | | | | 3,560 | | | | 504,369 | |
| | | | | | | | | | | | |
| | | | | | | | | | | 1,682,735 | |
| | | | | | | | | | | | |
Colombia – 0.4% | | | | | | | | | | | | |
Colombian TES
Series B
5.75%, 11/03/2027 | | | COP | | | | 2,181,000 | | | | 613,365 | |
| | | | | | | | | | | | |
| | | |
Finland – 0.1% | | | | | | | | | | | | |
Finland Government Bond
0.50%, 09/15/2027-09/15/2028(b) | | | EUR | | | | 92 | | | | 117,484 | |
| | | | | | | | | | | | |
| | | |
France – 0.1% | | | | | | | | | | | | |
French Republic Government Bond OAT
1.50%, 05/25/2050(b) | | | | | | | 95 | | | | 139,314 | |
| | | | | | | | | | | | |
| | |
| |
| abfunds.com | | AB CONSERVATIVE WEALTH STRATEGY | 27 |
PORTFOLIO OF INVESTMENTS (continued)
| | | | | | | | | | | | |
| | | | | | Principal
Amount
(000) | | | U.S. $ Value | |
| |
Germany – 0.4% | | | | | | | | | | | | |
Bundesrepublik Deutschland Bundesanleihe
0.00%, 08/15/2050(b) | | | EUR | | | | 60 | | | $ | 68,418 | |
Series 2007
4.25%, 07/04/2039(b) | | | | | | | 153 | | | | 330,176 | |
Series 3
4.75%, 07/04/2034(b) | | | | | | | 110 | | | | 221,138 | |
| | | | | | | | | | | | |
| | | | | | | | | | | 619,732 | |
| | | | | | | | | | | | |
Italy – 1.1% | | | | | | | | | | | | |
Italy Buoni Poliennali Del Tesoro
0.95%, 09/15/2027(b) | | | | | | | 920 | | | | 1,150,787 | |
1.80%, 03/01/2041(b) | | | | | | | 444 | | | | 571,445 | |
| | | | | | | | | | | | |
| | | | | | | | | | | 1,722,232 | |
| | | | | | | | | | | | |
Japan – 3.1% | | | | | | | | | | | | |
Japan Government Ten Year Bond
Series 358
0.10%, 03/20/2030 | | | JPY | | | | 101,550 | | | | 950,833 | |
Series 359
0.10%, 06/20/2030 | | | | | | | 75,050 | | | | 702,018 | |
Japan Government Thirty Year Bond
Series 62
0.50%, 03/20/2049 | | | | | | | 13,700 | | | | 121,220 | |
Series 65
0.40%, 12/20/2049 | | | | | | | 39,650 | | | | 339,570 | |
Series 68
0.60%, 09/20/2050 | | | | | | | 33,250 | | | | 299,975 | |
Japan Government Twenty Year Bond
Series 143
1.60%, 03/20/2033 | | | | | | | 27,400 | | | | 298,067 | |
Series 171
0.30%, 12/20/2039 | | | | | | | 26,000 | | | | 233,796 | |
Japan Government Two Year Bond
Series 416
0.10%, 09/01/2022 | | | | | | | 74,100 | | | | 697,525 | |
Series 419
0.10%, 12/01/2022 | | | | | | | 110,800 | | | | 1,043,492 | |
| | | | | | | | | | | | |
| | | | | | | | | | | 4,686,496 | |
| | | | | | | | | | | | |
Malaysia – 0.1% | | | | | | | | | | | | |
Malaysia Government Bond
Series 0310
4.498%, 04/15/2030 | | | MYR | | | | 670 | | | | 182,665 | |
| | | | | | | | | | | | |
| | | |
Mexico – 0.0% | | | | | | | | | | | | |
Mexican Bonos
Series M
8.00%, 11/07/2047 | | | MXN | | | | 1,065 | | | | 55,758 | |
| | | | | | | | | | | | |
| | |
| |
28 | AB CONSERVATIVE WEALTH STRATEGY | | abfunds.com |
PORTFOLIO OF INVESTMENTS (continued)
| | | | | | | | | | | | |
| | | | | | Principal
Amount
(000) | | | U.S. $ Value | |
| |
South Korea – 0.5% | | | | | | | | | | | | |
Korea Treasury Bond
Series 2503
1.50%, 03/10/2025 | | | KRW | | | | 820,400 | | | $ | 734,040 | |
| | | | | | | | | | | | |
| | | |
Spain – 0.2% | | | | | | | | | | | | |
Spain Government Bond
1.20%, 10/31/2040(b) | | | EUR | | | | 165 | | | | 206,721 | |
2.35%, 07/30/2033(b) | | | | | | | 62 | | | | 90,648 | |
4.20%, 01/31/2037(b) | | | | | | | 40 | | | | 73,129 | |
| | | | | | | | | | | | |
| | | | | | | | | | | 370,498 | |
| | | | | | | | | | | | |
United Kingdom – 0.5% | | | | | | | | | | | | |
United Kingdom Gilt
1.25%, 10/22/2041(b) | | | GBP | | | | 105 | | | | 143,832 | |
1.75%, 09/07/2037(b) | | | | | | | 447 | | | | 670,719 | |
| | | | | | | | | | | | |
| | | | | | | | | | | 814,551 | |
| | | | | | | | | | | | |
United States – 2.3% | | | | | | | | | | | | |
U.S. Treasury Bonds
1.125%, 08/15/2040(h)(i) | | | U.S.$ | | | | 905 | | | | 763,876 | |
4.625%, 02/15/2040 | | | | | | | 85 | | | | 120,873 | |
U.S. Treasury Notes
0.25%, 05/31/2025 | | | | | | | 538 | | | | 529,426 | |
1.625%, 10/31/2026 | | | | | | | 335 | | | | 347,876 | |
2.125%, 05/31/2026(i) | | | | | | | 1,420 | | | | 1,514,297 | |
2.875%, 11/30/2025 | | | | | | | 275 | | | | 302,629 | |
| | | | | | | | | | | | |
| | | | | | | | | | | 3,578,977 | |
| | | | | | | | | | | | |
Total Governments - Treasuries
(cost $17,543,334) | | | | | | | | | | | 17,545,535 | |
| | | | | | | | | | | | |
| | | | | | | | | | | | |
CORPORATES - INVESTMENT GRADE – 5.2% | | | | | | | | | | | | |
Industrial – 2.6% | | | | | | | | | | | | |
Basic – 0.1% | | | | | | | | | | | | |
SABIC Capital II BV
4.00%, 10/10/2023(b) | | | | | | | 200 | | | | 216,000 | |
| | | | | | | | | | | | |
| | | |
Capital Goods – 0.0% | | | | | | | | | | | | |
Westinghouse Air Brake Technologies Corp.
4.40%, 03/15/2024 | | | | | | | 16 | | | | 17,456 | |
| | | | | | | | | | | | |
| | | |
Communications - Media – 0.2% | | | | | | | | | | | | |
Charter Communications Operating LLC/Charter Communications Operating Capital
5.375%, 05/01/2047 | | | | | | | 65 | | | | 75,288 | |
Fox Corp.
4.709%, 01/25/2029 | | | | | | | 90 | | | | 105,157 | |
| | |
| |
| abfunds.com | | AB CONSERVATIVE WEALTH STRATEGY | 29 |
PORTFOLIO OF INVESTMENTS (continued)
| | | | | | | | | | | | |
| | | | | | Principal
Amount
(000) | | | U.S. $ Value | |
| |
ViacomCBS, Inc.
3.70%, 06/01/2028 | | | U.S.$ | | | | 12 | | | $ | 13,244 | |
4.20%, 05/19/2032 | | | | | | | 21 | | | | 24,049 | |
4.95%, 01/15/2031 | | | | | | | 5 | | | | 5,990 | |
5.50%, 05/15/2033 | | | | | | | 40 | | | | 49,370 | |
| | | | | | | | | | | | |
| | | | | | | | | | | 273,098 | |
| | | | | | | | | | | | |
Communications - Telecommunications – 0.2% | | | | | | | | | | | | |
AT&T, Inc.
1.60%, 05/19/2028 | | | EUR | | | | 105 | | | | 134,990 | |
3.50%, 09/15/2053(b) | | | U.S.$ | | | | 20 | | | | 18,127 | |
3.65%, 09/15/2059(b) | | | | | | | 69 | | | | 62,843 | |
British Telecommunications PLC
9.625%, 12/15/2030 | | | | | | | 75 | | | | 118,290 | |
| | | | | | | | | | | | |
| | | | | | | | | | | 334,250 | |
| | | | | | | | | | | | |
Consumer Cyclical - Automotive – 0.2% | | | | | | | | | | | | |
American Honda Finance Corp.
1.95%, 10/18/2024 | | | EUR | | | | 100 | | | | 129,077 | |
Daimler International Finance BV
0.25%, 11/06/2023(b) | | | | | | | 80 | | | | 97,047 | |
0.85%, 02/28/2025(b) | | | | | | | 35 | | | | 43,421 | |
Lear Corp.
3.50%, 05/30/2030 | | | U.S.$ | | | | 6 | | | | 6,369 | |
4.25%, 05/15/2029 | | | | | | | 5 | | | | 5,575 | |
Volkswagen Leasing GmbH
2.625%, 01/15/2024(b) | | | EUR | | | | 60 | | | | 77,469 | |
| | | | | | | | | | | | |
| | | | | | | | | | | 358,958 | |
| | | | | | | | | | | | |
Consumer Cyclical - Retailers – 0.1% | | | | | | | | | | | | |
Ralph Lauren Corp.
2.95%, 06/15/2030 | | | U.S.$ | | | | 71 | | | | 74,883 | |
Ross Stores, Inc.
4.70%, 04/15/2027 | | | | | | | 15 | | | | 17,261 | |
| | | | | | | | | | | | |
| | | | | | | | | | | 92,144 | |
| | | | | | | | | | | | |
Consumer Non-Cyclical – 0.7% | | | | | | | | | | | | |
AbbVie, Inc.
0.75%, 11/18/2027 | | | EUR | | | | 100 | | | | 123,541 | |
Altria Group, Inc.
3.125%, 06/15/2031 | | | | | | | 140 | | | | 196,505 | |
Anheuser-Busch InBev Worldwide, Inc.
5.55%, 01/23/2049 | | | U.S.$ | | | | 65 | | | | 83,820 | |
Banner Health
2.338%, 01/01/2030 | | | | | | | 70 | | | | 71,679 | |
BAT Capital Corp.
4.906%, 04/02/2030 | | | | | | | 25 | | | | 28,877 | |
| | |
| |
30 | AB CONSERVATIVE WEALTH STRATEGY | | abfunds.com |
PORTFOLIO OF INVESTMENTS (continued)
| | | | | | | | | | | | |
| | | | | | Principal
Amount
(000) | | | U.S. $ Value | |
| |
Biogen, Inc.
3.15%, 05/01/2050 | | | U.S.$ | | | | 74 | | | $ | 69,849 | |
Bon Secours Mercy Health, Inc.
Series 20-2
2.095%, 06/01/2031 | | | | | | | 54 | | | | 53,798 | |
CVS Health Corp.
5.05%, 03/25/2048 | | | | | | | 55 | | | | 68,705 | |
Gilead Sciences, Inc.
4.80%, 04/01/2044 | | | | | | | 45 | | | | 55,261 | |
Medtronic Global Holdings SCA
1.125%, 03/07/2027 | | | EUR | | | | 120 | | | | 152,736 | |
Takeda Pharmaceutical Co., Ltd.
0.75%, 07/09/2027 | | | | | | | 110 | | | | 136,090 | |
| | | | | | | | | | | | |
| | | | | | | | | | | 1,040,861 | |
| | | | | | | | | | | | |
Energy – 0.6% | | | | | | | | | | | | |
BP Capital Markets PLC
1.573%, 02/16/2027(b) | | | | | | | 100 | | | | 129,872 | |
Cenovus Energy, Inc.
5.375%, 07/15/2025 | | | U.S.$ | | | | 18 | | | | 20,347 | |
Chevron USA, Inc.
5.25%, 11/15/2043 | | | | | | | 105 | | | | 140,368 | |
Energy Transfer Operating LP
5.50%, 06/01/2027 | | | | | | | 90 | | | | 104,940 | |
Eni SpA
Series NC5.
2.625%, 10/13/2025(b)(j) | | | EUR | | | | 100 | | | | 124,878 | |
Husky Energy, Inc.
4.40%, 04/15/2029 | | | U.S.$ | | | | 94 | | | | 103,280 | |
Marathon Petroleum Corp.
6.50%, 03/01/2041 | | | | | | | 15 | | | | 20,064 | |
Plains All American Pipeline LP/PAA Finance Corp.
3.55%, 12/15/2029 | | | | | | | 9 | | | | 9,192 | |
3.80%, 09/15/2030(c) | | | | | | | 18 | | | | 18,579 | |
4.50%, 12/15/2026 | | | | | | | 6 | | | | 6,629 | |
Saudi Arabian Oil Co.
1.625%, 11/24/2025(b)(c) | | | | | | | 200 | | | | 201,950 | |
Valero Energy Corp.
6.625%, 06/15/2037 | | | | | | | 20 | | | | 26,265 | |
| | | | | | | | | | | | |
| | | | | | | | | | | 906,364 | |
| | | | | | | | | | | | |
Technology – 0.4% | | | | | | | | | | | | |
Broadcom Corp./Broadcom Cayman Finance Ltd.
3.50%, 01/15/2028 | | | | | | | 9 | | | | 9,651 | |
3.875%, 01/15/2027 | | | | | | | 31 | | | | 33,876 | |
| | |
| |
| abfunds.com | | AB CONSERVATIVE WEALTH STRATEGY | 31 |
PORTFOLIO OF INVESTMENTS (continued)
| | | | | | | | | | | | |
| | | | | | Principal
Amount
(000) | | | U.S. $ Value | |
| |
Broadcom, Inc.
3.50%, 02/15/2041(b) | | | U.S.$ | | | | 50 | | | $ | 49,342 | |
3.75%, 02/15/2051(b) | | | | | | | 17 | | | | 16,599 | |
4.11%, 09/15/2028 | | | | | | | 27 | | | | 29,854 | |
Fidelity National Information Services, Inc.
0.625%, 12/03/2025 | | | EUR | | | | 100 | | | | 122,948 | |
1.00%, 12/03/2028 | | | | | | | 100 | | | | 123,418 | |
Fiserv, Inc.
1.125%, 07/01/2027 | | | | | | | 105 | | | | 132,247 | |
Oracle Corp.
3.60%, 04/01/2050 | | | U.S.$ | | | | 35 | | | | 36,106 | |
3.85%, 04/01/2060 | | | | | | | 44 | | | | 47,023 | |
| | | | | | | | | | | | |
| | | | | | | | | | | 601,064 | |
| | | | | | | | | | | | |
Transportation - Services – 0.1% | | | | | | | | | | | | |
Heathrow Funding Ltd.
6.75%, 12/03/2026(b) | | | GBP | | | | 60 | | | | 104,975 | |
| | | | | | | | | | | | |
| | | | | | | | | | | 3,945,170 | |
| | | | | | | | | | | | |
Financial Institutions – 2.5% | | | | | | | | | | | | |
Banking – 1.5% | | | | | | | | | | | | |
Banco Bilbao Vizcaya Argentaria SA
Series G
0.50%, 01/14/2027(b) | | | EUR | | | | 100 | | | | 120,674 | |
Bank of America Corp.
1.379%, 02/07/2025(b) | | | | | | | 105 | | | | 131,578 | |
4.271%, 07/23/2029 | | | U.S.$ | | | | 56 | | | | 64,696 | |
BNP Paribas SA
0.50%, 09/01/2028(b) | | | EUR | | | | 100 | | | | 120,170 | |
Citigroup, Inc.
1.50%, 07/24/2026(b) | | | | | | | 110 | | | | 140,076 | |
4.45%, 09/29/2027 | | | U.S.$ | | | | 60 | | | | 68,815 | |
Credit Suisse Group AG
4.194%, 04/01/2031(b) | | | | | | | 250 | | | | 283,155 | |
Deutsche Bank AG/New York NY
3.961%, 11/26/2025 | | | | | | | 150 | | | | 163,569 | |
Goldman Sachs Group, Inc. (The)
1.25%, 05/01/2025(b) | | | EUR | | | | 125 | | | | 156,098 | |
2.60%, 02/07/2030 | | | U.S.$ | | | | 69 | | | | 71,595 | |
ING Groep NV
3.00%, 02/18/2026(b) | | | GBP | | | | 100 | | | | 151,323 | |
JPMorgan Chase & Co.
1.09%, 03/11/2027(b) | | | EUR | | | | 100 | | | | 125,775 | |
Series I
3.682% (LIBOR 3 Month + 3.47%), 04/30/2021(j)(k) | | | U.S.$ | | | | 6 | | | | 5,977 | |
Series V
3.558% (LIBOR 3 Month + 3.32%), 04/01/2021(j)(k) | | | | | | | 7 | | | | 6,957 | |
| | |
| |
32 | AB CONSERVATIVE WEALTH STRATEGY | | abfunds.com |
PORTFOLIO OF INVESTMENTS (continued)
| | | | | | | | | | | | |
| | | | | | Principal
Amount
(000) | | | U.S. $ Value | |
| |
Series Z
4.005% (LIBOR 3 Month + 3.80%), 05/01/2021(j)(k) | | | U.S.$ | | | | 14 | | | $ | 13,977 | |
Mitsubishi UFJ Financial Group, Inc.
0.872%, 09/07/2024(b) | | | EUR | | | | 100 | | | | 124,048 | |
Morgan Stanley
Series G
1.375%, 10/27/2026 | | | | | | | 100 | | | | 127,980 | |
NatWest Markets PLC
2.75%, 04/02/2025(b) | | | | | | | 100 | | | | 133,233 | |
PNC Financial Services Group, Inc. (The)
Series O
6.75%, 08/01/2021(j) | | | U.S.$ | | | | 9 | | | | 9,171 | |
US Bancorp
Series I
3.727% (LIBOR 3 Month + 3.49%), 03/29/2021(j)(k) | | | | | | | 24 | | | | 23,873 | |
Series J
5.30%, 04/15/2027(j) | | | | | | | 46 | | | | 50,994 | |
Wells Fargo & Co.
0.625%, 08/14/2030(b) | | | EUR | | | | 125 | | | | 149,419 | |
| | | | | | | | | | | | |
| | | | | | | | | | | 2,243,153 | |
| | | | | | | | | | | | |
Brokerage – 0.1% | | | | | | | | | | | | |
SURA Asset Management SA
4.875%, 04/17/2024(b) | | | U.S.$ | | | | 107 | | | | 117,299 | |
| | | | | | | | | | | | |
| | | |
Finance – 0.1% | | | | | | | | | | | | |
Air Lease Corp.
3.625%, 04/01/2027 | | | | | | | 14 | | | | 15,032 | |
Aviation Capital Group LLC
1.95%, 01/30/2026(b) | | | | | | | 12 | | | | 11,767 | |
4.125%, 08/01/2025(b) | | | | | | | 27 | | | | 28,873 | |
GE Capital European Funding Unlimited Co.
4.625%, 02/22/2027 | | | EUR | | | | 50 | | | | 74,806 | |
Synchrony Financial
3.95%, 12/01/2027 | | | U.S.$ | | | | 15 | | | | 16,449 | |
4.50%, 07/23/2025 | | | | | | | 62 | | | | 69,154 | |
| | | | | | | | | | | | |
| | | | | | | | | | | 216,081 | |
| | | | | | | | | | | | |
Insurance – 0.7% | | | | | | | | | | | | |
Alleghany Corp.
3.625%, 05/15/2030 | | | | | | | 79 | | | | 87,753 | |
Berkshire Hathaway, Inc.
1.125%, 03/16/2027 | | | EUR | | | | 100 | | | | 127,543 | |
Chubb INA Holdings, Inc.
0.875%, 06/15/2027 | | | | | | | 125 | | | | 156,361 | |
1.55%, 03/15/2028 | | | | | | | 100 | | | | 129,860 | |
| | |
| |
| abfunds.com | | AB CONSERVATIVE WEALTH STRATEGY | 33 |
PORTFOLIO OF INVESTMENTS (continued)
| | | | | | | | | | | | |
| | | | | | Principal
Amount
(000) | | | U.S. $ Value | |
| |
CNP Assurances
4.50%, 06/10/2047(b) | | | EUR | | | | 100 | | | $ | 144,043 | |
Credit Agricole Assurances SA
4.25%, 01/13/2025(b)(j) | | | | | | | 100 | | | | 132,677 | |
Nationwide Mutual Insurance Co.
9.375%, 08/15/2039(b) | | | U.S.$ | | | | 21 | | | | 35,430 | |
Prudential Financial, Inc.
5.625%, 06/15/2043 | | | | | | | 98 | | | | 104,927 | |
Swiss Re America Holding Corp.
7.00%, 02/15/2026 | | | | | | | 77 | | | | 97,443 | |
Voya Financial, Inc.
5.65%, 05/15/2053 | | | | | | | 48 | | | | 51,218 | |
| | | | | | | | | | | | |
| | | | | | | | | | | 1,067,255 | |
| | | | | | | | | | | | |
REITS – 0.1% | | | | | | | | | | | | |
WPC Eurobond BV
0.95%, 06/01/2030 | | | EUR | | | | 100 | | | | 119,423 | |
| | | | | | | | | | | | |
| | | | | | | | | | | 3,763,211 | |
| | | | | | | | | | | | |
Utility – 0.1% | | | | | | | | | | | | |
Electric – 0.1% | | | | | | | | | | | | |
Enel Finance International NV
2.65%, 09/10/2024(b) | | | U.S.$ | | | | 200 | | | | 211,300 | |
| | | | | | | | | | | | |
| | | |
Total Corporates - Investment Grade
(cost $7,502,554) | | | | | | | | | | | 7,919,681 | |
| | | | | | | | | | | | |
| | | | | | | | | | | | |
MORTGAGE PASS-THROUGHS – 2.3% | | | | | | | | | | | | |
Agency Fixed Rate 30-Year – 2.3% | | | | | | | | | | | | |
Federal Home Loan Mortgage Corp.
Series 2019
3.50%, 09/01/2049 | | | | | | | 162 | | | | 175,539 | |
Federal Home Loan Mortgage Corp. Gold
Series 2007
5.50%, 07/01/2035 | | | | | | | 22 | | | | 25,720 | |
Series 2018
4.00%, 12/01/2048 | | | | | | | 101 | | | | 110,184 | |
Federal National Mortgage Association
Series 2004
5.50%, 04/01/2034 | | | | | | | 2 | | | | 2,684 | |
Series 2018
3.50%, 03/01/2048 | | | | | | | 343 | | | | 372,825 | |
4.00%, 09/01/2048 | | | | | | | 241 | | | | 262,495 | |
4.50%, 09/01/2048 | | | | | | | 159 | | | | 174,229 | |
Series 2020
2.50%, 07/01/2050-10/01/2050 | | | | | | | 328 | | | | 344,205 | |
Government National Mortgage Association
Series 2021
3.00%, 03/01/2051, TBA | | | | | | | 224 | | | | 233,030 | |
| | |
| |
34 | AB CONSERVATIVE WEALTH STRATEGY | | abfunds.com |
PORTFOLIO OF INVESTMENTS (continued)
| | | | | | | | | | | | |
| | | | | | Principal
Amount
(000) | | | U.S. $ Value | |
| |
Uniform Mortgage-Backed Security
Series 2021
1.50%, 03/01/2051, TBA | | | U.S.$ | | | | 175 | | | $ | 171,213 | |
2.00%, 03/01/2051, TBA | | | | | | | 721 | | | | 724,522 | |
2.50%, 03/01/2051, TBA | | | | | | | 818 | | | | 844,841 | |
| | | | | | | | | | | | |
| | | | | | | | | | | 3,441,487 | |
| | | | | | | | | | | | |
Agency ARMs – 0.0% | | | | | | | | | | | | |
Federal Home Loan Mortgage Corp.
Series 2011
2.983% (LIBOR 12 Month + 1.76%), 05/01/2038(k) | | | | | | | 23 | | | | 24,338 | |
Federal National Mortgage Association
Series 2003
2.221% (LIBOR 12 Month + 1.81%), 12/01/2033(k) | | | | | | | 17 | | | | 18,056 | |
| | | | | | | | | | | | |
| | | | | | | | | | | 42,394 | |
| | | | | | | | | | | | |
Total Mortgage Pass-Throughs
(cost $3,455,768) | | | | | | | | | | | 3,483,881 | |
| | | | | | | | | | | | |
| | | | | | | | | | | | |
GOVERNMENTS - SOVEREIGN BONDS – 0.7% | | | | | | | | | | | | |
Chile – 0.1% | | | | | | | | | | | | |
Chile Government International Bond
1.625%, 01/30/2025 | | | EUR | | | | 120 | | | | 153,564 | |
| | | | | | | | | | | | |
| | | |
France – 0.2% | | | | | | | | | | | | |
Dexia Credit Local SA
0.25%, 06/01/2023(b) | | | | | | | 100 | | | | 122,564 | |
0.50%, 01/17/2025(b) | | | | | | | 200 | | | | 248,576 | |
| | | | | | | | | | | | |
| | | | | | | | | | | 371,140 | |
| | | | | | | | | | | | |
Indonesia – 0.1% | | | | | | | | | | | | |
Indonesia Government International Bond
1.10%, 03/12/2033 | | | | | | | 115 | | | | 135,631 | |
| | | | | | | | | | | | |
| | | |
Mexico – 0.1% | | | | | | | | | | | | |
Mexico Government International Bond
4.75%, 04/27/2032 | | | U.S.$ | | | | 200 | | | | 224,250 | |
| | | | | | | | | | | | |
| | | |
Panama – 0.1% | | | | | | | | | | | | |
Panama Government International Bond
8.875%, 09/30/2027 | | | | | | | 60 | | | | 83,006 | |
| | | | | | | | | | | | |
| | | |
Peru – 0.1% | | | | | | | | | | | | |
Peruvian Government International Bond
2.392%, 01/23/2026 | | | | | | | 86 | | | | 89,252 | |
| | | | | | | | | | | | |
| | | |
Total Governments - Sovereign Bonds
(cost $1,045,554) | | | | | | | | | | | 1,056,843 | |
| | | | | | | | | | | | |
| | | | | | | | | | | | |
| | |
| |
| abfunds.com | | AB CONSERVATIVE WEALTH STRATEGY | 35 |
PORTFOLIO OF INVESTMENTS (continued)
| | | | | | | | | | | | |
| | | | | | Principal
Amount
(000) | | | U.S. $ Value | |
| |
QUASI-SOVEREIGNS – 0.6% | | | | | | | | | | | | |
Quasi-Sovereign Bonds – 0.6% | | | | | | | | | | | | |
China – 0.5% | | | | | | | | | | | | |
China Development Bank
Series 1805
4.88%, 02/09/2028 | | | CNY | | | | 2,100 | | | $ | 350,303 | |
Series 2015
3.70%, 10/20/2030 | | | | | | | 2,250 | | | | 346,116 | |
| | | | | | | | | | | | |
| | | | | | | | | | | 696,419 | |
| | | | | | | | | | | | |
Indonesia – 0.1% | | | | | | | | | | | | |
Perusahaan Perseroan Persero PT Perusahaan Listrik Negara
4.125%, 05/15/2027(b) | | | U.S.$ | | | | 200 | | | | 216,313 | |
| | | | | | | | | | | | |
| | | |
Mexico – 0.0% | | | | | | | | | | | | |
Petroleos Mexicanos
5.95%, 01/28/2031 | | | | | | | 10 | | | | 9,635 | |
6.75%, 09/21/2047 | | | | | | | 75 | | | | 65,644 | |
| | | | | | | | | | | | |
| | | | | | | | | | | 75,279 | |
| | | | | | | | | | | | |
Total Quasi-Sovereigns
(cost $962,980) | | | | | | | | | | | 988,011 | |
| | | | | | | | | | | | |
| | | | | | | | | | | | |
COMMERCIAL MORTGAGE-BACKED SECURITIES – 0.6% | | | | | | | | | | | | |
Non-Agency Floating Rate CMBS – 0.5% | | | | | | | | | | | | |
Ashford Hospitality Trust
Series 2018-KEYS, Class A
1.112% (LIBOR 1 Month + 1.00%), 06/15/2035(b)(k) | | | | | | | 100 | | | | 99,632 | |
BX Commercial Mortgage Trust
Series 2019-IMC, Class A
1.112% (LIBOR 1 Month + 1.00%), 04/15/2034(b)(k) | | | | | | | 105 | | | | 104,462 | |
Great Wolf Trust
Series 2019-WOLF, Class C
1.745% (LIBOR 1 Month + 1.63%), 12/15/2036(b)(k) | | | | | | | 210 | | | | 207,922 | |
GS Mortgage Securities Corp. Trust
Series 2019-SMP, Class C
1.812% (LIBOR 1 Month + 1.70%), 08/15/2032(b)(k) | | | | | | | 160 | | | | 159,146 | |
Natixis Commercial Mortgage Securities Trust
Series 2019-MILE, Class A
1.612% (LIBOR 1 Month + 1.50%), 07/15/2036(b)(k) | | | | | | | 105 | | | | 105,314 | |
| | | | | | | | | | | | |
| | | | | | | | | | | 676,476 | |
| | | | | | | | | �� | | | |
| | |
| |
36 | AB CONSERVATIVE WEALTH STRATEGY | | abfunds.com |
PORTFOLIO OF INVESTMENTS (continued)
| | | | | | | | | | | | |
| | | | | | Principal
Amount
(000) | | | U.S. $ Value | |
| |
Non-Agency Fixed Rate CMBS – 0.1% | | | | | | | | | | | | |
GS Mortgage Securities Trust
Series 2013-G1, Class A1
2.059%, 04/10/2031(b) | | | U.S.$ | | | | 32 | | | $ | 31,849 | |
Series 2013-G1, Class A2
3.557%, 04/10/2031(b) | | | | | | | 134 | | | | 133,616 | |
| | | | | | | | | | | | |
| | | | | | | | | | | 165,465 | |
| | | | | | | | | | | | |
| | | |
Total Commercial Mortgage-Backed Securities (cost $842,919) | | | | | | | | | | | 841,941 | |
| | | | | | | | | | | | |
| | | | | | | | | | | | |
INFLATION-LINKED SECURITIES – 0.5% | | | | | | | | | | | | |
Germany – 0.5% | | | | | | | | | | | | |
Deutsche Bundesrepublik Inflation Linked Bond
0.10%, 04/15/2026(b)
(cost $709,384) | | | EUR | | | | 537 | | | | 704,027 | |
| | | | | | | | | | | | |
| | | | | | | | | | | | |
| COVERED BONDS – 0.4% | | | | | | | | | | | | |
BPCE SFH SA
0.375%, 02/21/2024(b) | | | | | | | 100 | | | | 123,558 | |
Caisse Francaise de Financement Local
Series 06
0.20%, 04/27/2023(b) | | | | | | | 100 | | | | 122,393 | |
Danske Bank A/S
0.125%, 02/14/2022(b) | | | | | | | 120 | | | | 145,655 | |
Nationwide Building Society
4.375%, 02/28/2022(b) | | | | | | | 150 | | | | 189,762 | |
UBS AG/London
4.00%, 04/08/2022(b) | | | | | | | 84 | | | | 106,356 | |
| | | | | | | | | | | | |
| | | |
Total Covered Bonds
(cost $630,219) | | | | | | | | | | | 687,724 | |
| | | | | | | | | | | | |
| | | | | | | | | | | | |
COLLATERALIZED MORTGAGE OBLIGATIONS – 0.4% | | | | | | | | | | | | |
Risk Share Floating Rate – 0.4% | | | | | | | | | | | | |
Connecticut Avenue Securities Trust
Series 2020-R02, Class 2M1
0.88% (LIBOR 1 Month + 0.75%), 01/25/2040(b)(k) | | | U.S.$ | | | | 19 | | | | 19,347 | |
Eagle RE Ltd.
Series 2018-1, Class M1
1.83% (LIBOR 1 Month + 1.70%), 11/25/2028(b)(k) | | | | | | | 60 | | | | 60,508 | |
Federal Home Loan Mortgage Corp. Structured Agency Credit Risk Debt Notes
Series 2017-DNA2, Class M1
1.33% (LIBOR 1 Month + 1.20%), 10/25/2029(k) | | | | | | | 37 | | | | 37,374 | |
| | |
| |
| abfunds.com | | AB CONSERVATIVE WEALTH STRATEGY | 37 |
PORTFOLIO OF INVESTMENTS (continued)
| | | | | | | | | | | | |
| | | | | | Principal
Amount
(000) | | | U.S. $ Value | |
| |
Federal National Mortgage Association Connecticut Avenue Securities
Series 2014-C04, Class 1M2
5.03% (LIBOR 1 Month + 4.90%), 11/25/2024(k) | | | U.S.$ | | | | 71 | | | $ | 73,254 | |
Series 2014-C04, Class 2M2
5.13% (LIBOR 1 Month + 5.00%),
11/25/2024(k) | | | | | | | 48 | | | | 48,392 | |
Series 2015-C01, Class 2M2
4.68% (LIBOR 1 Month + 4.55%),
02/25/2025(k) | | | | | | | 7 | | | | 7,260 | |
Series 2016-C01, Class 2M2
7.08% (LIBOR 1 Month + 6.95%),
08/25/2028(k) | | | | | | | 23 | | | | 23,994 | |
Series 2016-C02, Class 1M2
6.13% (LIBOR 1 Month + 6.00%), 09/25/2028(k) | | | | | | | 26 | | | | 27,194 | |
Series 2016-C06, Class 1M2
4.38% (LIBOR 1 Month + 4.25%), 04/25/2029(k) | | | | | | | 168 | | | | 175,314 | |
Series 2017-C01, Class 1M2
3.68% (LIBOR 1 Month + 3.55%), 07/25/2029(k) | | | | | | | 62 | | | | 63,628 | |
PMT Credit Risk Transfer Trust
Series 2019-1R, Class A
2.128% (LIBOR 1 Month + 2.00%), 03/27/2024(b)(k) | | | | | | | 88 | | | | 83,763 | |
| | | | | | | | | | | | |
| | | | | | | | | | | 620,028 | |
| | | | | | | | | | | | |
Agency Fixed Rate – 0.0% | | | | | | | | | | | | |
Federal National Mortgage Association Grantor Trust
Series 2004-T5, Class AB4
0.688%, 05/28/2035 | | | | | | | 33 | | | | 31,136 | |
| | | | | | | | | | | | |
| | | |
Total Collateralized Mortgage Obligations
(cost $657,255) | | | | | | | | | | | 651,164 | |
| | | | | | | | | | | | |
| | | | | | | | | | | | |
ASSET-BACKED SECURITIES – 0.4% | | | | | | | | | | | | |
Autos - Fixed Rate – 0.3% | | | | | | | | | | | | |
Avis Budget Rental Car Funding AESOP LLC
Series 2018-2A, Class C
4.95%, 03/20/2025(b) | | | | | | | 120 | | | | 129,690 | |
Flagship Credit Auto Trust
Series 2018-3, Class D
4.15%, 12/16/2024(b) | | | | | | | 78 | | | | 82,259 | |
Hertz Vehicle Financing II LP
Series 2017-1A, Class A
2.96%, 10/25/2021(b) | | | | | | | 26 | | | | 25,653 | |
Series 2019-1A, Class B
4.10%, 03/25/2023(b) | | | | | | | 165 | | | | 165,111 | |
| | | | | | | | | | | | |
| | | | | | | | | | | 402,713 | |
| | | | | | | | | | | | |
| | |
| |
38 | AB CONSERVATIVE WEALTH STRATEGY | | abfunds.com |
PORTFOLIO OF INVESTMENTS (continued)
| | | | | | | | | | | | |
| | | | | | Principal
Amount
(000) | | | U.S. $ Value | |
| |
Other ABS - Fixed Rate – 0.1% | | | | | | | | | | | | |
SBA Tower Trust
Series 2014-2A, Class C
3.869%, 10/15/2049(b) | | | U.S.$ | | | | 85 | | | $ | 90,554 | |
SoFi Consumer Loan Program Trust
Series 2018-1, Class B
3.65%, 02/25/2027(b) | | | | | | | 115 | | | | 117,370 | |
| | | | | | | | | | | | |
| | | | | | | | | | | 207,924 | |
| | | | | | | | | | | | |
Home Equity Loans - Floating Rate – 0.0% | | | | | | | | | | | | |
ABFC Trust
Series 2003-WF1, Class A2
1.255% (LIBOR 1 Month + 1.13%), 12/25/2032(k) | | | | | | | 7 | | | | 7,102 | |
| | | | | | | | | | | | |
| | | |
Total Asset-Backed Securities
(cost $594,567) | | | | | | | | | | | 617,739 | |
| | | | | | | | | | | | |
| | | | | | | | | | | | |
GOVERNMENTS - SOVEREIGN AGENCIES – 0.4% | | | | | | | | | | | | |
Canada – 0.2% | | | | | | | | | | | | |
Canada Housing Trust No. 1
1.80%, 12/15/2024(b) | | | CAD | | | | 85 | | | | 69,057 | |
1.95%, 12/15/2025(b) | | | | | | | 275 | | | | 223,995 | |
| | | | | | | | | | | | |
| | | | | | | | | | | 293,052 | |
| | | | | | | | | | | | |
France – 0.2% | | | | | | | | | | | | |
SNCF Reseau
3.125%, 10/25/2028 | | | EUR | | | | 153 | | | | 148,922 | |
Societe Nationale SNCF SA
0.625%, 04/17/2030(b) | | | | | | | 129 | | | | 124,719 | |
| | | | | | | | | | | | |
| | | | | | | | | | | 273,641 | |
| | | | | | | | | | | | |
| | | |
Total Governments - Sovereign Agencies
(cost $579,447) | | | | | | | | | | | 566,693 | |
| | | | | | | | | | | | |
| | | | | | | | | | | | |
LOCAL GOVERNMENTS - PROVINCIAL BONDS – 0.3% | | | | | | | | | | | | |
Canada – 0.3% | | | | | | | | | | | | |
Province of Ontario Canada
6.50%, 03/08/2029 | | | CAD | | | | 240 | | | | 253,771 | |
Province of Quebec Canada
2.75%, 09/01/2027 | | | | | | | 305 | | | | 257,728 | |
| | | | | | | | | | | | |
| | | |
Total Local Governments - Provincial Bonds
(cost $508,668) | | | | | | | | | | | 511,499 | |
| | | | | | | | | | | | |
| | | | | | | | | | | | |
| | |
| |
| abfunds.com | | AB CONSERVATIVE WEALTH STRATEGY | 39 |
PORTFOLIO OF INVESTMENTS (continued)
| | | | | | | | | | | | |
| | | | | | Principal
Amount
(000) | | | U.S. $ Value | |
| |
COLLATERALIZED LOAN OBLIGATIONS – 0.3% | | | | | | | | | | | | |
CLO - Floating Rate – 0.3% | | | | | | | | | | | | |
Halcyon Loan Advisors Funding Ltd.
Series 2018-1A, Class A2
2.024% (LIBOR 3 Month + 1.80%), 07/21/2031(b)(k) | | | U.S.$ | | | | 250 | | | $ | 250,028 | |
Neuberger Berman Loan Advisers CLO Ltd.
Series 2018-29A, Class B1
1.923% (LIBOR 3 Month + 1.70%), 10/19/2031(b)(k) | | | | | | | 250 | | | | 250,124 | |
| | | | | | | | | | | | |
| | | |
Total Collateralized Loan Obligations
(cost $500,000) | | | | | | | | | | | 500,152 | |
| | | | | | | | | | | | |
| | | |
| | | | | | Shares | | | | |
SHORT-TERM INVESTMENTS – 11.2% | | | | | | | | | | | | |
Investment Companies – 11.2% | | | | | | | | | | | | |
AB Fixed Income Shares, Inc. – Government Money Market Portfolio – Class AB, 0.01%(f)(g)(l)
(cost $17,134,141) | | | | | | | 17,134,141 | | | | 17,134,141 | |
| | | | | | | | | | | | |
Total Investments Before Security Lending Collateral for Securities Loaned – 98.7%
(cost $137,177,093) | | | | | | | | | | | 151,408,888 | |
| | | | | | | | | | | | |
| | | | | | | | | | | | |
INVESTMENTS OF CASH COLLATERAL FOR SECURITIES LOANED – 1.3% | | | | | | | | | | | | |
Investment Companies – 1.3% | | | | | | | | | | | | |
AB Fixed Income Shares, Inc. – Government Money Market Portfolio – Class AB,
0.01%(f)(g)(l)
(cost $1,913,241) | | | | | | | 1,913,241 | | | | 1,913,241 | |
| | | | | | | | | | | | |
| | | |
Total Investments – 100.0%
(cost $139,090,334) | | | | | | | | | | | 153,322,129 | |
Other assets less liabilities – 0.0% | | | | | | | | | | | 20,321 | |
| | | | | | | | | | | | |
| | | |
Net Assets – 100.0% | | | | | | | | | | $ | 153,342,450 | |
| | | | | | | | | | | | |
| | |
| |
40 | AB CONSERVATIVE WEALTH STRATEGY | | abfunds.com |
PORTFOLIO OF INVESTMENTS (continued)
FUTURES (see Note D)
| | | | | | | | | | | | | | | | |
| Description | | Number of
Contracts | | | Expiration
Month | | | Current
Notional | | | Value and
Unrealized
Appreciation/
(Depreciation) | |
Purchased Contracts | | | | | | | | | | | | | | | | |
10 Yr Australian Bond Futures | | | 17 | | | | March 2021 | | | $ | 1,792,976 | | | $ | (116,175 | ) |
10 Yr Canadian Bond Futures | | | 12 | | | | June 2021 | | | | 1,318,058 | | | | (23,311 | ) |
BIST 30 Futures | | | 1 | | | | April 2021 | | | | 2,079 | | | | (46 | ) |
E-Mini Russell 2000 Futures | | | 24 | | | | March 2021 | | | | 2,639,040 | | | | 348,622 | |
Euro STOXX 50 Index Futures | | | 16 | | | | March 2021 | | | | 700,185 | | | | 5,741 | |
Euro-BTP Futures | | | 20 | | | | March 2021 | | | | 3,614,826 | | | | (18,291 | ) |
Euro-Schatz Futures | | | 3 | | | | March 2021 | | | | 406,016 | | | | (565 | ) |
FTSE KLCI Futures | | | 26 | | | | March 2021 | | | | 502,977 | | | | (832 | ) |
FTSE Taiwan Index Futures | | | 10 | | | | March 2021 | | | | 554,200 | | | | (13,777 | ) |
Long Gilt Futures | | | 28 | | | | June 2021 | | | | 4,984,257 | | | | (39,669 | ) |
MSCI Emerging Markets Futures | | | 106 | | | | March 2021 | | | | 7,091,930 | | | | 473,181 | |
OMXS30 Index Futures | | | 8 | | | | March 2021 | | | | 189,960 | | | | (3,787 | ) |
S&P Mid 400 E-Mini Futures | | | 1 | | | | March 2021 | | | | 249,470 | | | | 25,922 | |
S&P/TSX 60 Index Futures | | | 1 | | | | March 2021 | | | | 168,443 | | | | (2,568 | ) |
SET 50 Futures | | | 1 | | | | March 2021 | | | | 6,157 | | | | 36 | |
SPI 200 Futures | | | 1 | | | | March 2021 | | | | 127,517 | | | | (2,648 | ) |
TOPIX Index Futures | | | 1 | | | | March 2021 | | | | 175,946 | | | | 5,341 | |
U.S. T-Note 5 Yr (CBT) Futures | | | 60 | | | | June 2021 | | | | 7,438,125 | | | | (58,920 | ) |
U.S. Ultra Bond (CBT) Futures | | | 47 | | | | June 2021 | | | | 8,885,938 | | | | (34,155 | ) |
WIG 20 Index Futures | | | 14 | | | | March 2021 | | | | 143,456 | | | | (1,562 | ) |
| | | | |
Sold Contracts | | | | | | | | | | | | | | | | |
10 Yr Mini Japan Government Bond Futures | | | 20 | | | | March 2021 | | | | 2,829,401 | | | | 13,283 | |
E-Mini Russell 1000 Futures | | | 12 | | | | March 2021 | | | | 1,295,280 | | | | (26,974 | ) |
Euro Buxl 30 Yr Bond Futures | | | 4 | | | | March 2021 | | | | 1,012,634 | | | | 67,490 | |
Euro-BOBL Futures | | | 6 | | | | March 2021 | | | | 971,587 | | | | 2,684 | |
Euro-Bund Futures | | | 14 | | | | March 2021 | | | | 2,929,022 | | | | 58,320 | |
Japan 10 Yr Bond (OSE) Futures | | | 1 | | | | March 2021 | | | | 1,413,012 | | | | 13,268 | |
MEX BOLSA Index Futures | | | 7 | | | | March 2021 | | | | 149,436 | | | | 2,925 | |
MSCI EAFE Futures | | | 1 | | | | March 2021 | | | | 108,200 | | | | (3,352 | ) |
S&P 500 E-Mini Futures | | | 74 | | | | March 2021 | | | | 14,094,040 | | | | (164,895 | ) |
SGX Nifty 50 Futures | | | 32 | | | | March 2021 | | | | 929,568 | | | | 34,218 | |
U.S. 10 Yr Ultra Futures | | | 2 | | | | June 2021 | | | | 294,688 | | | | 2,786 | |
U.S. T-Note 10 Yr (CBT) Futures | | | 26 | | | | June 2021 | | | | 3,450,688 | | | | 44,003 | |
U.S. T-Note 2 Yr (CBT) Futures | | | 21 | | | | June 2021 | | | | 4,636,078 | | | | 3,583 | |
| | | | | | | | | | | | | | | | |
| | | | | | | | | | | | | | $ | 589,876 | |
| | | | | | | | | | | | | | | | |
FORWARD CURRENCY EXCHANGE CONTRACTS (see Note D)
| | | | | | | | | | | | | | | | | | | | |
| Counterparty | | Contracts to
Deliver
(000) | | | In Exchange
For
(000) | | | Settlement
Date | | | Unrealized
Appreciation/
(Depreciation) | |
Australia and New Zealand Banking Group Ltd. | | CNY | | | 1,348 | | | USD | | | 207 | | | | 04/22/2021 | | | $ | 152 | |
Australia and New Zealand Banking Group Ltd. | | HKD | | | 20,963 | | | USD | | | 2,704 | | | | 08/13/2021 | | | | 745 | |
Bank of America, NA | | USD | | | 390 | | | CLP | | | 275,311 | | | | 03/18/2021 | | | | (10,020 | ) |
| | |
| |
| abfunds.com | | AB CONSERVATIVE WEALTH STRATEGY | 41 |
PORTFOLIO OF INVESTMENTS (continued)
| | | | | | | | | | | | | | | | | | | | |
| Counterparty | | Contracts to
Deliver
(000) | | | In Exchange
For
(000) | | | Settlement
Date | | | Unrealized
Appreciation/
(Depreciation) | |
Bank of America, NA | | RUB | | | 6,974 | | | USD | | | 94 | | | | 03/24/2021 | | | $ | 970 | |
Bank of America, NA | | USD | | | 111 | | | RUB | | | 8,463 | | | | 03/24/2021 | | | | 1,843 | |
Barclays Bank PLC | | NZD | | | 1,021 | | | USD | | | 761 | | | | 03/17/2021 | | | | 22,948 | |
Barclays Bank PLC | | GBP | | | 575 | | | USD | | | 797 | | | | 03/17/2021 | | | | (4,643 | ) |
Barclays Bank PLC | | USD | | | 1,418 | | | NOK | | | 11,830 | | | | 03/17/2021 | | | | (53,774 | ) |
Barclays Bank PLC | | COP | | | 4,612,135 | | | USD | | | 1,325 | | | | 03/18/2021 | | | | 61,270 | |
Barclays Bank PLC | | RUB | | | 26,543 | | | USD | | | 358 | | | | 03/24/2021 | | | | 3,620 | |
Barclays Bank PLC | | CZK | | | 20,758 | | | USD | | | 969 | | | | 03/24/2021 | | | | 11,480 | |
Barclays Bank PLC | | USD | | | 354 | | | RUB | | | 26,842 | | | | 03/24/2021 | | | | 4,308 | |
Barclays Bank PLC | | MYR | | | 4,054 | | | USD | | | 999 | | | | 03/25/2021 | | | | 3,111 | |
Barclays Bank PLC | | MYR | | | 1,337 | | | USD | | | 321 | | | | 03/25/2021 | | | | (7,111 | ) |
Barclays Bank PLC | | USD | | | 643 | | | MYR | | | 2,598 | | | | 03/25/2021 | | | | (5,306 | ) |
Barclays Bank PLC | | USD | | | 1,097 | | | MYR | | | 4,527 | | | | 03/25/2021 | | | | 14,886 | |
Barclays Bank PLC | | KRW | | | 449,950 | | | USD | | | 403 | | | | 04/22/2021 | | | | 3,847 | |
Barclays Bank PLC | | USD | | | 353 | | | KRW | | | 385,707 | | | | 04/22/2021 | | | | (10,761 | ) |
Barclays Bank PLC | | TWD | | | 3,663 | | | USD | | | 132 | | | | 04/27/2021 | | | | (291 | ) |
Barclays Bank PLC | | USD | | | 640 | | | TWD | | | 17,689 | | | | 04/27/2021 | | | | (1,488 | ) |
BNP Paribas SA | | BRL | | | 2,389 | | | USD | | | 438 | | | | 03/02/2021 | | | | 11,803 | |
BNP Paribas SA | | USD | | | 437 | | | BRL | | | 2,389 | | | | 03/02/2021 | | | | (10,849 | ) |
BNP Paribas SA | | USD | | | 848 | | | CAD | | | 1,075 | | | | 03/17/2021 | | | | (3,054 | ) |
BNP Paribas SA | | COP | | | 2,541,669 | | | USD | | | 739 | | | | 03/18/2021 | | | | 42,848 | |
BNP Paribas SA | | USD | | | 94 | | | CLP | | | 66,948 | | | | 03/18/2021 | | | | (1,600 | ) |
BNP Paribas SA | | PLN | | | 659 | | | USD | | | 176 | | | | 03/24/2021 | | | | 313 | |
BNP Paribas SA | | USD | | | 231 | | | AUD | | | 290 | | | | 03/30/2021 | | | | (7,797 | ) |
BNP Paribas SA | | GBP | | | 1,244 | | | USD | | | 1,696 | | | | 04/09/2021 | | | | (38,555 | ) |
BNP Paribas SA | | USD | | | 583 | | | GBP | | | 412 | | | | 04/09/2021 | | | | (8,163 | ) |
BNP Paribas SA | | SEK | | | 2,647 | | | USD | | | 321 | | | | 04/15/2021 | | | | 7,386 | |
BNP Paribas SA | | CAD | | | 1,027 | | | USD | | | 809 | | | | 04/22/2021 | | | | 2,089 | |
BNP Paribas SA | | USD | | | 143 | | | CNY | | | 925 | | | | 04/22/2021 | | | | (788 | ) |
BNP Paribas SA | | USD | | | 192 | | | JPY | | | 20,371 | | | | 05/20/2021 | | | | (932 | ) |
Citibank, NA | | CLP | | | 137,595 | | | USD | | | 187 | | | | 03/18/2021 | | | | (2,714 | ) |
Citibank, NA | | PEN | | | 841 | | | USD | | | 231 | | | | 03/18/2021 | | | | 656 | |
Citibank, NA | | USD | | | 66 | | | CLP | | | 46,921 | | | | 03/18/2021 | | | | (1,445 | ) |
Citibank, NA | | USD | | | 187 | | | CLP | | | 137,822 | | | | 03/18/2021 | | | | 3,520 | |
Citibank, NA | | USD | | | 284 | | | COP | | | 1,008,165 | | | | 03/18/2021 | | | | (8,108 | ) |
Citibank, NA | | INR | | | 19,645 | | | USD | | | 269 | | | | 04/15/2021 | | | | 5,064 | |
Citibank, NA | | KRW | | | 640,929 | | | USD | | | 588 | | | | 04/22/2021 | | | | 19,216 | |
Citibank, NA | | TWD | | | 15,149 | | | USD | | | 550 | | | | 04/27/2021 | | | | 3,166 | |
Citibank, NA | | CHF | | | 478 | | | USD | | | 538 | | | | 05/06/2021 | | | | 11,763 | |
Citibank, NA | | USD | | | 352 | | | CHF | | | 318 | | | | 05/06/2021 | | | | (1,771 | ) |
Credit Suisse International | | USD | | | 256 | | | NZD | | | 344 | | | | 03/05/2021 | | | | (6,845 | ) |
Credit Suisse International | | USD | | | 179 | | | NOK | | | 1,498 | | | | 04/15/2021 | | | | (6,587 | ) |
Credit Suisse International | | PHP | | | 4,487 | | | USD | | | 93 | | | | 04/22/2021 | | | | 1,836 | |
Deutsche Bank AG | | CLP | | | 773,691 | | | USD | | | 1,086 | | | | 03/18/2021 | | | | 16,794 | |
Deutsche Bank AG | | CLP | | | 297,837 | | | USD | | | 409 | | | | 03/18/2021 | | | | (2,556 | ) |
Deutsche Bank AG | | PEN | | | 855 | | | USD | | | 235 | | | | 03/18/2021 | | | | 132 | |
Deutsche Bank AG | | USD | | | 189 | | | PEN | | | 683 | | | | 03/18/2021 | | | | (2,015 | ) |
Deutsche Bank AG | | USD | | | 275 | | | CLP | | | 195,734 | | | | 03/18/2021 | | | | (4,249 | ) |
Deutsche Bank AG | | USD | | | 205 | | | COP | | | 731,243 | | | | 03/18/2021 | | | | (4,650 | ) |
Deutsche Bank AG | | RUB | | | 43,699 | | | USD | | | 588 | | | | 03/24/2021 | | | | 3,777 | |
Deutsche Bank AG | | USD | | | 1,464 | | | INR | | | 108,688 | | | | 04/15/2021 | | | | (3,391 | ) |
| | |
| |
42 | AB CONSERVATIVE WEALTH STRATEGY | | abfunds.com |
PORTFOLIO OF INVESTMENTS (continued)
| | | | | | | | | | | | | | | | | | | | |
| Counterparty | | Contracts to
Deliver
(000) | | | In Exchange
For
(000) | | | Settlement
Date | | | Unrealized
Appreciation/
(Depreciation) | |
Deutsche Bank AG | | USD | | | 32 | | | IDR | | | 450,412 | | | | 04/15/2021 | | | $ | (682 | ) |
Deutsche Bank AG | | KRW | | | 118,526 | | | USD | | | 107 | | | | 04/22/2021 | | | | 1,537 | |
Goldman Sachs Bank USA | | BRL | | | 1,020 | | | USD | | | 187 | | | | 03/02/2021 | | | | 4,840 | |
Goldman Sachs Bank USA | | USD | | | 186 | | | BRL | | | 1,020 | | | | 03/02/2021 | | | | (3,523 | ) |
Goldman Sachs Bank USA | | PEN | | | 4,227 | | | USD | | | 1,168 | | | | 03/18/2021 | | | | 10,103 | |
Goldman Sachs Bank USA | | USD | | | 280 | | | PEN | | | 1,013 | | | | 03/18/2021 | | | | (2,421 | ) |
Goldman Sachs Bank USA | | RUB | | | 27,103 | | | USD | | | 366 | | | | 03/24/2021 | | | | 4,044 | |
Goldman Sachs Bank USA | | USD | | | 113 | | | RUB | | | 8,382 | | | | 03/24/2021 | | | | (960 | ) |
Goldman Sachs Bank USA | | USD | | | 140 | | | RUB | | | 10,625 | | | | 03/24/2021 | | | | 2,269 | |
Goldman Sachs Bank USA | | USD | | | 257 | | | MYR | | | 1,048 | | | | 03/25/2021 | | | | 356 | |
Goldman Sachs Bank USA | | USD | | | 48 | | | BRL | | | 262 | | | | 04/05/2021 | | | | (1,437 | ) |
Goldman Sachs Bank USA | | USD | | | 275 | | | IDR | | | 3,892,142 | | | | 04/15/2021 | | | | (6,280 | ) |
Goldman Sachs Bank USA | | KRW | | | 123,773 | | | USD | | | 113 | | | | 04/22/2021 | | | | 2,947 | |
Goldman Sachs Bank USA | | PHP | | | 4,487 | | | USD | | | 93 | | | | 04/22/2021 | | | | 1,816 | |
Goldman Sachs Bank USA | | CNY | | | 1,827 | | | USD | | | 282 | | | | 04/22/2021 | | | | 1,436 | |
Goldman Sachs Bank USA | | USD | | | 94 | | | KRW | | | 101,792 | | | | 04/22/2021 | | | | (3,355 | ) |
Goldman Sachs Bank USA | | TWD | | | 7,927 | | | USD | | | 290 | | | | 07/07/2021 | | | | 464 | |
HSBC Bank USA | | USD | | | 89 | | | IDR | | | 1,253,221 | | | | 04/15/2021 | | | | (2,996 | ) |
HSBC Bank USA | | USD | | | 345 | | | CNY | | | 2,238 | | | | 04/22/2021 | | | | (1,216 | ) |
JPMorgan Chase Bank, NA | | BRL | | | 866 | | | USD | | | 161 | | | | 03/02/2021 | | | | 6,571 | |
JPMorgan Chase Bank, NA | | USD | | | 157 | | | BRL | | | 866 | | | | 03/02/2021 | | | | (2,069 | ) |
JPMorgan Chase Bank, NA | | IDR | | | 1,241,217 | | | USD | | | 88 | | | | 04/15/2021 | | | | 2,314 | |
JPMorgan Chase Bank, NA | | KRW | | | 192,132 | | | USD | | | 173 | | | | 04/22/2021 | | | | 2,631 | |
JPMorgan Chase Bank, NA | | CNY | | | 1,816 | | | USD | | | 280 | | | | 04/22/2021 | | | | 1,159 | |
JPMorgan Chase Bank, NA | | CAD | | | 651 | | | USD | | | 521 | | | | 04/22/2021 | | | | 9,289 | |
Morgan Stanley Capital Services, Inc. | | EUR | | | 1,063 | | | USD | | | 1,289 | | | | 03/17/2021 | | | | 6,264 | |
Morgan Stanley Capital Services, Inc. | | MYR | | | 781 | | | USD | | | 187 | | | | 03/25/2021 | | | | (4,401 | ) |
Morgan Stanley Capital Services, Inc. | | USD | | | 238 | | | MYR | | | 965 | | | | 03/25/2021 | | | | (1,221 | ) |
Morgan Stanley Capital Services, Inc. | | AUD | | | 2,508 | | | USD | | | 1,946 | | | | 03/30/2021 | | | | 16,279 | |
Morgan Stanley Capital Services, Inc. | | CNY | | | 14,416 | | | USD | | | 2,219 | | | | 04/22/2021 | | | | 5,703 | |
Morgan Stanley Capital Services, Inc. | | USD | | | 94 | | | KRW | | | 103,725 | | | | 04/22/2021 | | | | (1,998 | ) |
Morgan Stanley Capital Services, Inc. | | TWD | | | 17,668 | | | USD | | | 641 | | | | 04/27/2021 | | | | 3,389 | |
Morgan Stanley Capital Services, Inc. | | JPY | | | 615,181 | | | USD | | | 5,807 | | | | 05/20/2021 | | | | 30,161 | |
Natwest Markets PLC | | BRL | | | 357 | | | USD | | | 65 | | | | 03/02/2021 | | | | 852 | |
Natwest Markets PLC | | USD | | | 66 | | | BRL | | | 357 | | | | 03/02/2021 | | | | (2,767 | ) |
Natwest Markets PLC | | COP | | | 842,054 | | | USD | | | 237 | | | | 03/18/2021 | | | | 6,686 | |
Natwest Markets PLC | | CLP | | | 195,867 | | | USD | | | 265 | | | | 03/18/2021 | | | | (6,062 | ) |
Natwest Markets PLC | | USD | | | 238 | | | CLP | | | 171,742 | | | | 03/18/2021 | | | | (385 | ) |
Natwest Markets PLC | | USD | | | 139 | | | COP | | | 481,904 | | | | 03/18/2021 | | | | (6,483 | ) |
Natwest Markets PLC | | USD | | | 327 | | | RUB | | | 24,197 | | | | 03/24/2021 | | | | (3,852 | ) |
Natwest Markets PLC | | MYR | | | 466 | | | USD | | | 114 | | | | 03/25/2021 | | | | 53 | |
Natwest Markets PLC | | USD | | | 189 | | | MYR | | | 762 | | | | 03/25/2021 | | | | (1,429 | ) |
Natwest Markets PLC | | MXN | | | 6,936 | | | USD | | | 330 | | | | 04/16/2021 | | | | (219 | ) |
| | |
| |
| abfunds.com | | AB CONSERVATIVE WEALTH STRATEGY | 43 |
PORTFOLIO OF INVESTMENTS (continued)
| | | | | | | | | | | | | | | | | | | | |
| Counterparty | | Contracts to
Deliver
(000) | | | In Exchange
For
(000) | | | Settlement
Date | | | Unrealized
Appreciation/
(Depreciation) | |
Natwest Markets PLC | | USD | | | 161 | | | TWD | | | 4,438 | | | | 04/27/2021 | | | $ | (1,045 | ) |
Standard Chartered Bank | | EUR | | | 565 | | | USD | | | 685 | | | | 03/15/2021 | | | | 3,430 | |
Standard Chartered Bank | | COP | | | 517,976 | | | USD | | | 147 | | | | 03/18/2021 | | | | 4,858 | |
Standard Chartered Bank | | PEN | | | 1,595 | | | USD | | | 442 | | | | 03/18/2021 | | | | 4,398 | |
Standard Chartered Bank | | USD | | | 299 | | | PEN | | | 1,092 | | | | 03/18/2021 | | | | (70 | ) |
Standard Chartered Bank | | USD | | | 414 | | | COP | | | 1,440,135 | | | | 03/18/2021 | | | | (19,614 | ) |
Standard Chartered Bank | | USD | | | 659 | | | TRY | | | 4,728 | | | | 03/26/2021 | | | | (29,742 | ) |
Standard Chartered Bank | | IDR | | | 2,050,207 | | | USD | | | 146 | | | | 04/15/2021 | | | | 4,101 | |
Standard Chartered Bank | | KRW | | | 104,787 | | | USD | | | 94 | | | | 04/22/2021 | | | | 528 | |
Standard Chartered Bank | | PHP | | | 31,867 | | | USD | | | 656 | | | | 04/22/2021 | | | | 7,842 | |
Standard Chartered Bank | | USD | | | 1,136 | | | CNY | | | 7,381 | | | | 04/22/2021 | | | | (2,903 | ) |
Standard Chartered Bank | | USD | | | 94 | | | KRW | | | 103,821 | | | | 04/22/2021 | | | | (2,236 | ) |
Standard Chartered Bank | | TWD | | | 18,364 | | | USD | | | 664 | | | | 04/27/2021 | | | | 669 | |
Standard Chartered Bank | | USD | | | 286 | | | TWD | | | 7,927 | | | | 07/07/2021 | | | | 2,830 | |
State Street Bank & Trust Co. | | NZD | | | 1,709 | | | USD | | | 1,226 | | | | 03/05/2021 | | | | (8,926 | ) |
State Street Bank & Trust Co. | | USD | | | 269 | | | NZD | | | 369 | | | | 03/05/2021 | | | | (1,737 | ) |
State Street Bank & Trust Co. | | USD | | | 1,184 | | | NZD | | | 1,650 | | | | 03/05/2021 | | | | 8,043 | |
State Street Bank & Trust Co. | | NZD | | | 197 | | | AUD | | | 183 | | | | 03/05/2021 | | | | (1,906 | ) |
State Street Bank & Trust Co. | | THB | | | 10,716 | | | USD | | | 357 | | | | 03/11/2021 | | | | 1,529 | |
State Street Bank & Trust Co. | | SGD | | | 238 | | | USD | | | 179 | | | | 03/11/2021 | | | | 545 | |
State Street Bank & Trust Co. | | USD | | | 559 | | | SGD | | | 737 | | | | 03/11/2021 | | | | (5,830 | ) |
State Street Bank & Trust Co. | | USD | | | 873 | | | THB | | | 26,159 | | | | 03/11/2021 | | | | (5,006 | ) |
State Street Bank & Trust Co. | | CAD | | | 521 | | | USD | | | 405 | | | | 03/15/2021 | | | | (4,647 | ) |
State Street Bank & Trust Co. | | CAD | | | 187 | | | USD | | | 148 | | | | 03/15/2021 | | | | 765 | |
State Street Bank & Trust Co. | | EUR | | | 71 | | | USD | | | 87 | | | | 03/15/2021 | | | | 1,018 | |
State Street Bank & Trust Co. | | EUR | | | 81 | | | USD | | | 96 | | | | 03/15/2021 | | | | (2,063 | ) |
State Street Bank & Trust Co. | | USD | | | 539 | | | EUR | | | 443 | | | | 03/15/2021 | | | | (4,674 | ) |
State Street Bank & Trust Co. | | USD | | | 408 | | | CAD | | | 520 | | | | 03/15/2021 | | | | 726 | |
State Street Bank & Trust Co. | | USD | | | 149 | | | CAD | | | 188 | | | | 03/15/2021 | | | | (1,525 | ) |
State Street Bank & Trust Co. | | SEK | | | 2,819 | | | USD | | | 343 | | | | 03/17/2021 | | | | 8,834 | |
State Street Bank & Trust Co. | | EUR | | | 3,934 | | | USD | | | 4,791 | | | | 03/17/2021 | | | | 42,898 | |
State Street Bank & Trust Co. | | NOK | | | 671 | | | USD | | | 79 | | | | 03/17/2021 | | | | 2,110 | |
State Street Bank & Trust Co. | | AUD | | | 1,504 | | | USD | | | 1,174 | | | | 03/17/2021 | | | | 17,100 | |
State Street Bank & Trust Co. | | EUR | | | 1,046 | | | USD | | | 1,258 | | | | 03/17/2021 | | | | (4,849 | ) |
State Street Bank & Trust Co. | | NZD | | | 325 | | | USD | | | 233 | | | | 03/17/2021 | | | | (1,851 | ) |
State Street Bank & Trust Co. | | CHF | | | 446 | | | USD | | | 499 | | | | 03/17/2021 | | | | 8,820 | |
State Street Bank & Trust Co. | | GBP | | | 208 | | | USD | | | 294 | | | | 03/17/2021 | | | | 4,352 | |
State Street Bank & Trust Co. | | GBP | | | 42 | | | USD | | | 59 | | | | 03/17/2021 | | | | (181 | ) |
State Street Bank & Trust Co. | | USD | | | 3,457 | | | EUR | | | 2,833 | | | | 03/17/2021 | | | | (37,723 | ) |
State Street Bank & Trust Co. | | USD | | | 355 | | | GBP | | | 256 | | | | 03/17/2021 | | | | 2,157 | |
State Street Bank & Trust Co. | | USD | | | 474 | | | CAD | | | 602 | | | | 03/17/2021 | | | | (1,303 | ) |
State Street Bank & Trust Co. | | USD | | | 736 | | | EUR | | | 612 | | | | 03/17/2021 | | | | 2,351 | |
State Street Bank & Trust Co. | | USD | | | 80 | | | NOK | | | 671 | | | | 03/17/2021 | | | | (3,020 | ) |
State Street Bank & Trust Co. | | USD | | | 410 | | | SEK | | | 3,412 | | | | 03/17/2021 | | | | (5,764 | ) |
State Street Bank & Trust Co. | | USD | | | 1,203 | | | JPY | | | 127,463 | | | | 03/17/2021 | | | | (7,373 | ) |
State Street Bank & Trust Co. | | HUF | | | 162,069 | | | USD | | | 549 | | | | 03/24/2021 | | | | 9,633 | |
State Street Bank & Trust Co. | | PLN | | | 3,515 | | | USD | | | 946 | | | | 03/24/2021 | | | | 8,405 | |
State Street Bank & Trust Co. | | EUR | | | 231 | | | USD | | | 283 | | | | 03/24/2021 | | | | 4,479 | |
State Street Bank & Trust Co. | | USD | | | 94 | | | EUR | | | 78 | | | | 03/24/2021 | | | | (515 | ) |
State Street Bank & Trust Co. | | USD | | | 833 | | | PLN | | | 3,074 | | | | 03/24/2021 | | | | (12,954 | ) |
State Street Bank & Trust Co. | | PLN | | | 695 | | | EUR | | | 153 | | | | 03/24/2021 | | | | (785 | ) |
State Street Bank & Trust Co. | | USD | | | 484 | | | CZK | | | 10,373 | | | | 03/24/2021 | | | | (5,318 | ) |
| | |
| |
44 | AB CONSERVATIVE WEALTH STRATEGY | | abfunds.com |
PORTFOLIO OF INVESTMENTS (continued)
| | | | | | | | | | | | | | | | | | | | |
| Counterparty | | Contracts to
Deliver
(000) | | | In Exchange
For
(000) | | | Settlement
Date | | | Unrealized
Appreciation/
(Depreciation) | |
State Street Bank & Trust Co. | | ILS | | | 2,791 | | | USD | | | 854 | | | | 03/25/2021 | | | $ | 10,875 | |
State Street Bank & Trust Co. | | USD | | | 113 | | | ILS | | | 369 | | | | 03/25/2021 | | | | (1,719 | ) |
State Street Bank & Trust Co. | | TRY | | | 2,649 | | | USD | | | 367 | | | | 03/26/2021 | | | | 14,285 | |
State Street Bank & Trust Co. | | USD | | | 147 | | | TRY | | | 1,121 | | | | 03/26/2021 | | | | 2,049 | |
State Street Bank & Trust Co. | | USD | | | 315 | | | TRY | | | 2,299 | | | | 03/26/2021 | | | | (8,329 | ) |
State Street Bank & Trust Co. | | AUD | | | 987 | | | USD | | | 766 | | | | 03/30/2021 | | | | 6,748 | |
State Street Bank & Trust Co. | | AUD | | | 386 | | | USD | | | 295 | | | | 03/30/2021 | | | | (2,004 | ) |
State Street Bank & Trust Co. | | USD | | | 902 | | | AUD | | | 1,164 | | | | 03/30/2021 | | | | (6,205 | ) |
State Street Bank & Trust Co. | | USD | | | 446 | | | AUD | | | 585 | | | | 03/30/2021 | | | | 3,994 | |
State Street Bank & Trust Co. | | ZAR | | | 3,462 | | | USD | | | 233 | | | | 04/08/2021 | | | | 5,439 | |
State Street Bank & Trust Co. | | USD | | | 292 | | | ZAR | | | 4,312 | | | | 04/08/2021 | | | | (8,276 | ) |
State Street Bank & Trust Co. | | GBP | | | 996 | | | USD | | | 1,361 | | | | 04/09/2021 | | | | (26,940 | ) |
State Street Bank & Trust Co. | | USD | | | 339 | | | GBP | | | 240 | | | | 04/09/2021 | | | | (4,304 | ) |
State Street Bank & Trust Co. | | USD | | | 1,497 | | | GBP | | | 1,090 | | | | 04/09/2021 | | | | 22,087 | |
State Street Bank & Trust Co. | | EUR | | | 78 | | | GBP | | | 69 | | | | 04/09/2021 | | | | 2,745 | |
State Street Bank & Trust Co. | | USD | | | 95 | | | EUR | | | 78 | | | | 04/09/2021 | | | | (1,255 | ) |
State Street Bank & Trust Co. | | USD | | | 95 | | | CHF | | | 84 | | | | 04/09/2021 | | | | (2,109 | ) |
State Street Bank & Trust Co. | | CHF | | | 167 | | | GBP | | | 138 | | | | 04/09/2021 | | | | 9,041 | |
State Street Bank & Trust Co. | | NOK | | | 5,906 | | | USD | | | 690 | | | | 04/15/2021 | | | | 8,353 | |
State Street Bank & Trust Co. | | SEK | | | 3,801 | | | USD | | | 456 | | | | 04/15/2021 | | | | 5,376 | |
State Street Bank & Trust Co. | | SEK | | | 785 | | | USD | | | 93 | | | | 04/15/2021 | | | | (184 | ) |
State Street Bank & Trust Co. | | USD | | | 869 | | | SEK | | | 7,231 | | | | 04/15/2021 | | | | (11,758 | ) |
State Street Bank & Trust Co. | | USD | | | 792 | | | NOK | | | 6,698 | | | | 04/15/2021 | | | | (19,998 | ) |
State Street Bank & Trust Co. | | MXN | | | 3,014 | | | USD | | | 147 | | | | 04/16/2021 | | | | 3,373 | |
State Street Bank & Trust Co. | | MXN | | | 966 | | | USD | | | 46 | | | | 04/16/2021 | | | | (59 | ) |
State Street Bank & Trust Co. | | USD | | | 1,063 | | | MXN | | | 21,963 | | | | 04/16/2021 | | | | (18,197 | ) |
State Street Bank & Trust Co. | | TRY | | | 1,048 | | | USD | | | 141 | | | | 04/19/2021 | | | | 3,033 | |
State Street Bank & Trust Co. | | EUR | | | 59 | | | USD | | | 71 | | | | 04/19/2021 | | | | 427 | |
State Street Bank & Trust Co. | | EUR | | | 113 | | | TRY | | | 1,047 | | | | 04/19/2021 | | | | 2,031 | |
State Street Bank & Trust Co. | | USD | | | 686 | | | CAD | | | 865 | | | | 04/22/2021 | | | | (6,179 | ) |
State Street Bank & Trust Co. | | USD | | | 525 | | | CNY | | | 3,399 | | | | 04/22/2021 | | | | (3,053 | ) |
State Street Bank & Trust Co. | | CHF | | | 1,282 | | | USD | | | 1,435 | | | | 05/06/2021 | | | | 23,270 | |
State Street Bank & Trust Co. | | USD | | | 191 | | | CHF | | | 170 | | | | 05/06/2021 | | | | (4,174 | ) |
State Street Bank & Trust Co. | | JPY | | | 76,655 | | | USD | | | 724 | | | | 05/20/2021 | | | | 3,940 | |
State Street Bank & Trust Co. | | USD | | | 477 | | | JPY | | | 50,468 | | | | 05/20/2021 | | | | (2,774 | ) |
State Street Bank & Trust Co. | | EUR | | | 287 | | | USD | | | 349 | | | | 06/16/2021 | | | | 1,972 | |
State Street Bank & Trust Co. | | CAD | | | 107 | | | USD | | | 83 | | | | 06/16/2021 | | | | (819 | ) |
State Street Bank & Trust Co. | | USD | | | 85 | | | CAD | | | 107 | | | | 06/16/2021 | | | | (865 | ) |
UBS AG | | BRL | | | 860 | | | USD | | | 156 | | | | 03/02/2021 | | | | 2,053 | |
UBS AG | | USD | | | 158 | | | BRL | | | 860 | | | | 03/02/2021 | | | | (4,777 | ) |
UBS AG | | EUR | | | 4,612 | | | USD | | | 5,634 | | | | 03/17/2021 | | | | 67,324 | |
UBS AG | | CHF | | | 1,163 | | | USD | | | 1,303 | | | | 03/17/2021 | | | | 24,458 | |
UBS AG | | USD | | | 1,241 | | | SEK | | | 10,284 | | | | 03/17/2021 | | | | (23,103 | ) |
UBS AG | | RUB | | | 4,476 | | | USD | | | 60 | | | | 03/24/2021 | | | | 383 | |
UBS AG | | USD | | | 553 | | | RUB | | | 42,058 | | | | 03/24/2021 | | | | 8,637 | |
UBS AG | | USD | | | 1,000 | | | RUB | | | 74,372 | | | | 03/24/2021 | | | | (6,365 | ) |
UBS AG | | USD | | | 662 | | | TRY | | | 5,085 | | | | 03/26/2021 | | | | 14,726 | |
UBS AG | | BRL | | | 860 | | | USD | | | 158 | | | | 04/05/2021 | | | | 4,783 | |
UBS AG | | KRW | | | 206,658 | | | USD | | | 188 | | | | 04/22/2021 | | | | 4,163 | |
UBS AG | | USD | | | 300 | | | KRW | | | 333,192 | | | | 04/22/2021 | | | | (4,252 | ) |
UBS AG | | USD | | | 702 | | | JPY | | | 74,267 | | | | 05/20/2021 | | | | (4,496 | ) |
| | | | | | | | | | | | | | | | | | | | |
| | | $ | 179,719 | |
| | | | | | | | | | | | | | | | | | | | |
| | |
| |
| abfunds.com | | AB CONSERVATIVE WEALTH STRATEGY | 45 |
PORTFOLIO OF INVESTMENTS (continued)
CENTRALLY CLEARED CREDIT DEFAULT SWAPS (see Note D)
| | | | | | | | | | | | | | | | | | | | | | | | | | | | |
Description | | Fixed
Rate
(Pay)
Receive | | | Payment
Frequency | | | Implied
Credit
Spread at
February 28,
2021 | | | Notional
Amount
(000) | | | Market
Value | | | Upfront
Premiums
Paid/
(Received) | | | Unrealized
Appreciation/
(Depreciation) | |
Sale Contracts | |
CDX-NAIG Series 28, 5 Year Index, 06/20/2022* | | | 1.00 | % | | | Quarterly | | | | 0.34 | % | | USD | 11,880 | | | $ | 127,070 | | | $ | 62,701 | | | $ | 64,369 | |
CDX-NAIG Series 34, 5 Year Index, 06/20/2025* | | | 1.00 | | | | Quarterly | | | | 0.63 | | | USD | 940 | | | | 16,495 | | | | 2,886 | | | | 13,609 | |
CDX-NAIG Series 35, 5 Year Index, 12/20/2025* | | | 1.00 | | | | Quarterly | | | | 0.56 | | | USD | 760 | | | | 17,367 | | | | 17,974 | | | | (607 | ) |
iTraxxx Europe Series 27, 5 Year Index, 06/20/2022* | | | 1.00 | | | | Quarterly | | | | 0.18 | | | EUR | 5,280 | | | | 82,545 | | | | 36,587 | | | | 45,958 | |
iTraxxx Europe Series 29, 5 Year Index, 06/20/2023* | | | 1.00 | | | | Quarterly | | | | 0.31 | | | EUR | 240 | | | | 5,283 | | | | 3,023 | | | | 2,260 | |
| | | | | | | | | | | | | | | | | | | | | | | | | | | | |
| | | $ | 248,760 | | | $ | 123,171 | | | $ | 125,589 | |
| | | | | | | | | | | | | | | | | | | | | | | | | | | | |
CENTRALLY CLEARED INTEREST RATE SWAPS (see Note D)
| | | | | | | | | | | | | | | | | | | | | | | | | | |
| | | | | | | | | Rate Type | | | | | | | | | | | |
Notional
Amount
(000) | | | Termination
Date | | | Payments
made
by the
Fund | | Payments
received
by the
Fund | | Payment
Frequency
Paid/
Received | | Market
Value | | | Upfront
Premiums
Paid/
(Received) | | | Unrealized
Appreciation/
(Depreciation) | |
| GBP | | | 1,430 | | | | 02/05/2023 | | | 6 Month LIBOR | | 0.177% | | Semi-Annual/ Semi-Annual | | $ | (2,859 | ) | | $ | (17 | ) | | $ | (2,842 | ) |
| USD | | | 3,120 | | | | 02/09/2023 | | | 3 Month LIBOR | | 0.200% | | Quarterly/ Semi-Annual | | | (2,272 | ) | | | – 0 | – | | | (2,272 | ) |
| CAD | | | 1,960 | | | | 05/22/2024 | | | 3 Month CDOR | | 1.980% | | Semi-Annual/ Semi-Annual | | | 55,853 | | | | 1 | | | | 55,852 | |
| CNY | | | 6,550 | | | | 02/17/2025 | | | China 7-Day Reverse Repo Rate | | 2.547% | | Quarterly/ Quarterly | | | (12,401 | ) | | | – 0 | – | | | (12,401 | ) |
| | |
| |
46 | AB CONSERVATIVE WEALTH STRATEGY | | abfunds.com |
PORTFOLIO OF INVESTMENTS (continued)
| | | | | | | | | | | | | | | | | | | | | | | | | | |
| | | | | | | | | Rate Type | | | | | | | | | | | |
Notional
Amount
(000) | | | Termination
Date | | | Payments
made
by the
Fund | | Payments
received
by the
Fund | | Payment
Frequency
Paid/
Received | | Market
Value | | | Upfront
Premiums
Paid/
(Received) | | | Unrealized
Appreciation/
(Depreciation) | |
| CNY | | | 19,495 | | | | 02/20/2025 | | | China 7-Day
Reverse
Repo Rate | | 2.598% | | Quarterly/Quarterly | | $ | (29,497 | ) | | $ | – 0 | – | | $ | (29,497 | ) |
| CNY | | | 19,785 | | | | 02/21/2025 | | | China 7-Day
Reverse
Repo Rate | | 2.620% | | Quarterly/Quarterly | | | (26,807 | ) | | | – 0 | – | | | (26,807 | ) |
| NOK | | | 2,010 | | | | 08/11/2030 | | | 0.825% | | 6 Month
NIBOR | | Annual/Semi-Annual | | | 18,259 | | | | 21,447 | | | | (3,188 | ) |
| NOK | | | 2,010 | | | | 08/11/2030 | | | 6 Month
NIBOR | | 0.825% | | Semi-Annual/ Annual | | | (18,383 | ) | | | – 0 | – | | | (18,383 | ) |
| NOK | | | 2,430 | | | | 11/17/2030 | | | 1.053% | | 6 Month
NIBOR | | Annual/Semi-Annual | | | 18,016 | | | | 21,122 | | | | (3,106 | ) |
| NOK | | | 2,430 | | | | 11/17/2030 | | | 6 Month
NIBOR | | 1.053% | | Semi-Annual/ Annual | | | (17,991 | ) | | | – 0 | – | | | (17,991 | ) |
| NZD | | | 60 | | | | 11/17/2030 | | | 0.785% | | 3 Month
BKBM | | Semi-Annual/ Quarterly | | | 4,509 | | | | 4,811 | | | | (302 | ) |
| NZD | | | 60 | | | | 11/17/2030 | | | 3 Month
BKBM | | 0.785% | | Quarterly/Semi-Annual | | | (4,520 | ) | | | – 0 | – | | | (4,520 | ) |
| NZD | | | 1,110 | | | | 11/23/2030 | | | 0.841% | | 3 Month
BKBM | | Semi-Annual/ Quarterly | | | 79,585 | | | | 85,096 | | | | (5,511 | ) |
| NZD | | | 1,110 | | | | 11/23/2030 | | | 3 Month
BKBM | | 0.841% | | Quarterly/Semi-Annual | | | (79,596 | ) | | | – 0 | – | | | (79,596 | ) |
| NOK | | | 7,110 | | | | 11/27/2030 | | | 6 Month
NIBOR | | 1.111% | | Semi-Annual/ Annual | | | (48,487 | ) | | | – 0 | – | | | (48,487 | ) |
| NOK | | | 2,760 | | | | 11/27/2030 | | | 1.111% | | 6 Month
NIBOR | | Annual/Semi-Annual | | | 18,855 | | | | 21,525 | | | | (2,670 | ) |
| NZD | | | 310 | | | | 12/02/2030 | | | 0.876% | | 3 Month
BKBM | | Semi-Annual/ Quarterly | | | 21,768 | | | | 23,189 | | | | (1,421 | ) |
| NZD | | | 310 | | | | 12/02/2030 | | | 3 Month
BKBM | | 0.876% | | Quarterly/Semi-Annual | | | (21,764 | ) | | | – 0 | – | | | (21,764 | ) |
| NOK | | | 1,040 | | | | 01/04/2031 | | | 6 Month
NIBOR | | 1.280% | | Semi-Annual/ Annual | | | (5,499 | ) | | | – 0 | – | | | (5,499 | ) |
| NZD | | | 450 | | | | 01/05/2031 | | | 3 Month
BKBM | | 0.978% | | Quarterly/Semi-Annual | | | (29,310 | ) | | | – 0 | – | | | (29,310 | ) |
| NZD | | | 100 | | | | 01/05/2031 | | | 0.978% | | 3 Month
BKBM | | Semi-Annual/ Quarterly | | | 6,517 | | | | 6,936 | | | | (419 | ) |
| NZD | | | 250 | | | | 01/11/2031 | | | 3 Month
BKBM | | 1.058% | | Quarterly/Semi-Annual | | | (15,013 | ) | | | – 0 | – | | | (15,013 | ) |
| SEK | | | 100 | | | | 01/11/2031 | | | 3 Month
STIBOR | | 0.383% | | Quarterly/Annual | | | (475 | ) | | | (4 | ) | | | (471 | ) |
| NOK | | | 2,840 | | | | 01/18/2031 | | | 6 Month
NIBOR | | 1.331% | | Semi-Annual/ Annual | | | (13,744 | ) | | | – 0 | – | | | (13,744 | ) |
| NOK | | | 2,030 | | | | 01/21/2031 | | | 6 Month
NIBOR | | 1.348% | | Semi-Annual/ Annual | | | (9,433 | ) | | | – 0 | – | | | (9,433 | ) |
| NZD | | | 450 | | | | 01/21/2031 | | | 3 Month
BKBM | | 1.075% | | Quarterly/ Semi-Annual | | | (26,712 | ) | | | – 0 | – | | | (26,712 | ) |
| GBP | | | 290 | | | | 02/05/2031 | | | 0.701% | | 6 Month
LIBOR | | Semi-Annual/ Semi-Annual | | | 11,305 | | | | 21 | | | | 11,284 | |
| | |
| |
| abfunds.com | | AB CONSERVATIVE WEALTH STRATEGY | 47 |
PORTFOLIO OF INVESTMENTS (continued)
| | | | | | | | | | | | | | | | | | | | | | | | | | |
| | | | | | | | | Rate Type | | | | | | | | | | | |
Notional
Amount
(000) | | | Termination
Date | | | Payments
made
by the
Fund | | Payments
received
by the
Fund | | Payment
Frequency
Paid/
Received | | Market
Value | | | Upfront
Premiums
Paid/
(Received) | | | Unrealized
Appreciation/
(Depreciation) | |
| USD | | | 620 | | | | 02/09/2031 | | | 1.226% | | 3 Month
LIBOR | | Semi-Annual/ Quarterly | | $ | 16,371 | | | $ | – 0 | – | | $ | 16,371 | |
| NOK | | | 2,770 | | | | 02/19/2031 | | | 6 Month
NIBOR | | 1.634% | | Semi-Annual/ Annual | | | (4,780 | ) | | | – 0 | – | | | (4,780 | ) |
| CHF | | | 820 | | | | 02/19/2031 | | | (0.054)% | | 6 Month
LIBOR | | Annual/ Semi-Annual | | | 11,810 | | | | – 0 | – | | | 11,810 | |
| NZD | | | 510 | | | | 02/19/2031 | | | 3 Month
BKBM | | 1.616% | | Quarterly/ Semi-Annual | | | (12,532 | ) | | | – 0 | – | | | (12,532 | ) |
| EUR | | | 240 | | | | 09/30/2050 | | | 0.122% | | 6 Month
EURIBOR | | Annual/ Semi-Annual | | | 19,397 | | | | – 0 | – | | | 19,397 | |
| EUR | | | 240 | | | | 09/30/2050 | | | 6 Month
EURIBOR | | (0.017)% | | Semi-Annual /Annual | | | (31,132 | ) | | | – 0 | – | | | (31,132 | ) |
| EUR | | | 240 | | | | 11/10/2050 | | | 0.022% | | 6 Month
EURIBOR | | Annual/ Semi-Annual | | | 28,073 | | | | 1,846 | | | | 26,227 | |
| EUR | | | 240 | | | | 11/10/2050 | | | 6 Month
EURIBOR | | (0.043)% | | Semi-Annual/ Annual | | | (33,597 | ) | | | – 0 | – | | | (33,597 | ) |
| | | | | | | | | | | | | | | | | | | | | | | | | | |
| | | | | | | | | | | | | | | | $ | (136,486 | ) | | $ | 185,973 | | | $ | (322,459 | ) |
| | | | | | | | | | | | | | | | | | | | | | | | | | |
INFLATION (CPI) SWAPS (see Note D)
| | | | | | | | | | | | | | | | | | | | | | | | | | | | |
| | | | | | | | | Rate Type | | | | | | | | | | | | |
Swap
Counterparty | | Notional
Amount
(000) | | | Termination
Date | | | Payments
made
by the
Fund | | Payments
received
by the
Fund | | Payment
Frequency
Paid/
Received | | | Market
Value | | | Upfront
Premiums
Paid/
(Received) | | | Unrealized
Appreciation/
(Depreciation) | |
| Barclays Bank PLC | | USD | 15,560 | | | | 07/18/2022 | | | 1.937% | | CPI# | | | Maturity | | | $ | 122,890 | | | $ | – 0 | – | | $ | 122,890 | |
| Citibank, NA | | USD | 2,880 | | | | 06/08/2025 | | | 1.242% | | CPI# | | | Maturity | | | | 161,067 | | | | – 0 | – | | | 161,067 | |
| Goldman Sachs International | | USD | 1,230 | | | | 01/18/2023 | | | 2.206% | | CPI# | | | Maturity | | | | (9,208 | ) | | | – 0 | – | | | (9,208 | ) |
| JPMorgan Chase Bank, NA | | USD | 980 | | | | 01/14/2026 | | | 2.236% | | CPI# | | | Maturity | | | | 6,190 | | | | – 0 | – | | | 6,190 | |
| | | | | | | | | | | | | | | | | | | | | | | | | | | | |
| | | | | | | | | | | | | | | | | | $ | 280,939 | | | $ | – 0 | – | | $ | 280,939 | |
| | | | | | | | | | | | | | | | | | | | | | | | | | | | |
| # | Variable interest rate based on the rate of inflation as determined by the Consumer Price Index (CPI). |
| | |
| |
48 | AB CONSERVATIVE WEALTH STRATEGY | | abfunds.com |
PORTFOLIO OF INVESTMENTS (continued)
TOTAL RETURN SWAPS (see Note D)
| | | | | | | | | | | | | | | | | | | | |
Counterparty &
Referenced Obligation | | Rate Paid/
Received | | Payment
Frequency | | Current
Notional
(000) | | | Maturity
Date | | | Unrealized
Appreciation/
(Depreciation) | |
Receive Total Return on Reference Obligation | |
Bank of America, NA | | | | | | | | | | | | | | | | | | | | |
MLABCOVL | | LIBOR Plus 0.20% | | Quarterly | | | USD | | | | 262 | | | | 11/15/2021 | | | $ | 4,648 | |
MLABCOVL(1) | | LIBOR Plus 0.20% | | Quarterly | | | USD | | | | 2,402 | | | | 01/18/2022 | | | | 75,835 | |
Citibank, NA | | | | | | | | | | | | | | | | | | | | |
CGABROEC | | LIBOR Plus 0.20% | | Quarterly | | | USD | | | | 462 | | | | 10/15/2021 | | | | 2,380 | |
CGABROEC | | LIBOR Plus 0.20% | | Quarterly | | | USD | | | | 206 | | | | 10/15/2021 | | | | (2,713 | ) |
Goldman Sachs International | | | | | | | | | | | | | | | | | | | | |
Codemasters Group Holdings Plc | | LIBOR Plus 0.35% | | Monthly | | | GBP | | | | 152 | | | | 01/05/2023 | | | | 924 | |
Codemasters Group Holdings Plc | | LIBOR Plus 0.35% | | Monthly | | | GBP | | | | 53 | | | | 01/05/2023 | | | | 325 | |
Codemasters Group Holdings Plc | | LIBOR Plus 0.35% | | Monthly | | | GBP | | | | 13 | | | | 01/05/2023 | | | | 79 | |
Codemasters Group Holdings Plc | | LIBOR Plus 0.35% | | Monthly | | | GBP | | | | 1 | | | | 01/05/2023 | | | | 6 | |
G4S PLC | | LIBOR Plus 0.35% | | Monthly | | | GBP | | | | 54 | | | | 01/05/2023 | | | | 48 | |
G4S PLC | | LIBOR Plus 0.35% | | Monthly | | | GBP | | | | 54 | | | | 01/05/2023 | | | | 48 | |
G4S PLC | | LIBOR Plus 0.35% | | Monthly | | | GBP | | | | 48 | | | | 01/05/2023 | | | | 15 | |
G4S PLC | | LIBOR Plus 0.35% | | Monthly | | | GBP | | | | 5 | | | | 01/05/2023 | | | | 2 | |
G4S PLC | | LIBOR Plus 0.35% | | Monthly | | | GBP | | | | 0 | ** | | | 01/05/2023 | | | | – 0 | – |
G4S PLC | | LIBOR Plus 0.35% | | Monthly | | | GBP | | | | 23 | | | | 01/05/2023 | | | | (6 | ) |
G4S PLC | | LIBOR Plus 0.35% | | Monthly | | | GBP | | | | 31 | | | | 01/05/2023 | | | | (8 | ) |
RSA Insurance Group PLC | | LIBOR Plus 0.35% | | Monthly | | | GBP | | | | 25 | | | | 01/05/2023 | | | | 22 | |
RSA Insurance Group PLC | | LIBOR Plus 0.35% | | Monthly | | | GBP | | | | 37 | | | | 01/05/2023 | | | | 14 | |
RSA Insurance Group PLC | | LIBOR Plus 0.35% | | Monthly | | | GBP | | | | 17 | | | | 01/05/2023 | | | | 3 | |
RSA Insurance Group PLC | | LIBOR Plus 0.35% | | Monthly | | | GBP | | | | 0 | ** | | | 01/05/2023 | | | | – 0 | – |
RSA Insurance Group PLC | | LIBOR Plus 0.35% | | Monthly | | | GBP | | | | 39 | | | | 01/05/2023 | | | | (3 | ) |
RSA Insurance Group PLC | | LIBOR Plus 0.35% | | Monthly | | | GBP | | | | 78 | | | | 01/05/2023 | | | | (3 | ) |
RSA Insurance Group PLC | | LIBOR Plus 0.35% | | Monthly | | | GBP | | | | 3 | | | | 01/05/2023 | | | | (4 | ) |
RSA Insurance Group PLC | | LIBOR Plus 0.35% | | Monthly | | | GBP | | | | 3 | | | | 01/05/2023 | | | | (4 | ) |
| | |
| |
| abfunds.com | | AB CONSERVATIVE WEALTH STRATEGY | 49 |
PORTFOLIO OF INVESTMENTS (continued)
| | | | | | | | | | | | | | | | | | | | |
Counterparty &
Referenced
Obligation | | Rate Paid/
Received | | Payment
Frequency | | Current
Notional
(000) | | | Maturity
Date | | | Unrealized
Appreciation/
(Depreciation) | |
RSA Insurance Group PLC | | LIBOR Plus 0.35% | | Monthly | | | GBP | | | | 24 | | | | 01/05/2023 | | | $ | (22 | ) |
RSA Insurance Group PLC | | LIBOR Plus 0.35% | | Monthly | | | GBP | | | | 50 | | | | 01/05/2023 | | | | (22 | ) |
RSA Insurance Group PLC | | LIBOR Plus 0.35% | | Monthly | | | GBP | | | | 60 | | | | 01/05/2023 | | | | (202 | ) |
Signature Aviation PLC | | LIBOR Plus 0.35% | | Monthly | | | USD | | | | 59 | | | | 01/05/2023 | | | | 99 | |
Signature Aviation PLC | | LIBOR Plus 0.35% | | Monthly | | | USD | | | | 15 | | | | 01/05/2023 | | | | 12 | |
Signature Aviation PLC | | LIBOR Plus 0.35% | | Monthly | | | USD | | | | 6 | | | | 01/05/2023 | | | | 7 | |
Signature Aviation PLC | | LIBOR Plus 0.35% | | Monthly | | | USD | | | | 2 | | | | 01/05/2023 | | | | 1 | |
Signature Aviation PLC | | LIBOR Plus 0.35% | | Monthly | | | USD | | | | 0 | ** | | | 01/05/2023 | | | | – 0 | – |
Siltronic AG | | EURIBOR Plus 0.35% | | Monthly | | | EUR | | | | 3 | | | | 01/05/2023 | | | | (33 | ) |
Siltronic AG | | EURIBOR Plus 0.35% | | Monthly | | | EUR | | | | 4 | | | | 01/05/2023 | | | | (74 | ) |
Siltronic AG | | EURIBOR Plus 0.35% | | Monthly | | | EUR | | | | 30 | | | | 01/05/2023 | | | | (181 | ) |
Siltronic AG | | EURIBOR Plus 0.35% | | Monthly | | | EUR | | | | 59 | | | | 01/05/2023 | | | | (551 | ) |
Siltronic AG | | EURIBOR Plus 0.35% | | Monthly | | | EUR | | | | 58 | | | | 01/05/2023 | | | | (1,003 | ) |
Siltronic AG | | EURIBOR Plus 0.35% | | Monthly | | | EUR | | | | 62 | | | | 01/05/2023 | | | | (1,352 | ) |
JPMorgan Chase Bank, NA | |
JPABJVAL(2) | | LIBOR Plus 0.10% | | Quarterly | | | JPY | | | | 65,735 | | | | 02/15/2022 | | | | (25,097 | ) |
JPQABEUV | | EURIBOR Plus 0.15% | | Quarterly | | | EUR | | | | 246 | | | | 06/15/2021 | | | | (3,143 | ) |
KAZ Minerals PLC | | LIBOR Plus 0.40% | | Monthly | | | GBP | | | | 68 | | | | 08/12/2022 | | | | 23,639 | |
KAZ Minerals PLC | | LIBOR Plus 0.40% | | Monthly | | | GBP | | | | 22 | | | | 08/12/2022 | | | | 7,499 | |
KAZ Minerals PLC | | LIBOR Plus 0.40% | | Monthly | | | GBP | | | | 18 | | | | 08/12/2022 | | | | 6,141 | |
KAZ Minerals PLC | | LIBOR Plus 0.40% | | Monthly | | | GBP | | | | 17 | | | | 08/12/2022 | | | | 5,866 | |
KAZ Minerals PLC | | LIBOR Plus 0.40% | | Monthly | | | GBP | | | | 11 | | | | 08/12/2022 | | | | 3,946 | |
William Hill PLC | | LIBOR Plus 0.40% | | Monthly | | | GBP | | | | 50 | | | | 08/12/2022 | | | | 1,310 | |
William Hill PLC | | LIBOR Plus 0.40% | | Monthly | | | GBP | | | | 51 | | | | 08/12/2022 | | | | 975 | |
William Hill PLC | | LIBOR Plus 0.40% | | Monthly | | | GBP | | | | 52 | | | | 08/12/2022 | | | | 571 | |
William Hill PLC | | LIBOR Plus 0.40% | | Monthly | | | GBP | | | | 50 | | | | 08/12/2022 | | | | 527 | |
| | |
| |
50 | AB CONSERVATIVE WEALTH STRATEGY | | abfunds.com |
PORTFOLIO OF INVESTMENTS (continued)
| | | | | | | | | | | | | | | | | | | | |
Counterparty &
Referenced Obligation | | Rate Paid/
Received | | Payment
Frequency | | Current
Notional
(000) | | | Maturity
Date | | | Unrealized
Appreciation/
(Depreciation) | |
William Hill PLC | | LIBOR Plus 0.40% | | Monthly | | | GBP | | | | 27 | | | | 08/12/2022 | | | $ | 280 | |
William Hill PLC | | LIBOR Plus 0.40% | | Monthly | | | GBP | | | | 25 | | | | 08/12/2022 | | | | 207 | |
William Hill PLC | | LIBOR Plus 0.40% | | Monthly | | | GBP | | | | 19 | | | | 08/12/2022 | | | | 156 | |
William Hill PLC | | LIBOR Plus 0.40% | | Monthly | | | GBP | | | | 12 | | | | 08/12/2022 | | | | 128 | |
William Hill PLC | | LIBOR Plus 0.40% | | Monthly | | | GBP | | | | 11 | | | | 08/12/2022 | | | | 124 | |
William Hill PLC | | LIBOR Plus 0.40% | | Monthly | | | GBP | | | | 29 | | | | 08/12/2022 | | | | 110 | |
William Hill PLC | | LIBOR Plus 0.40% | | Monthly | | | GBP | | | | 2 | | | | 08/12/2022 | | | | 37 | |
Morgan Stanley Capital Services LLC | |
Applegreen PLC | | EURIBOR Plus 0.50% | | Monthly | | | EUR | | | | 44 | | | | 01/27/2022 | | | | 435 | |
Applegreen PLC | | EURIBOR Plus 0.50% | | Monthly | | | EUR | | | | 44 | | | | 01/27/2022 | | | | 435 | |
Applegreen PLC | | EURIBOR Plus 0.50% | | Monthly | | | EUR | | | | 8 | | | | 01/27/2022 | | | | 81 | |
Applegreen PLC | | EURIBOR Plus 0.50% | | Monthly | | | EUR | | | | 6 | | | | 01/27/2022 | | | | 54 | |
Applegreen PLC | | EURIBOR Plus 0.50% | | Monthly | | | EUR | | | | 6 | | | | 01/27/2022 | | | | 54 | |
Applegreen PLC | | EURIBOR Plus 0.50% | | Monthly | | | EUR | | | | 1 | | | | 01/27/2022 | | | | 30 | |
Calisen PLC | | LIBOR Plus 0.50% | | Annual | | | GBP | | | | 51 | | | | 01/27/2022 | | | | 775 | |
Calisen PLC | | LIBOR Plus 0.50% | | Annual | | | GBP | | | | 51 | | | | 01/27/2022 | | | | 762 | |
Calisen PLC | | LIBOR Plus 0.50% | | Annual | | | GBP | | | | 26 | | | | 01/27/2022 | | | | 386 | |
Calisen PLC | | LIBOR Plus 0.50% | | Annual | | | GBP | | | | 25 | | | | 01/27/2022 | | | | 372 | |
Calisen PLC | | LIBOR Plus 0.50% | | Annual | | | GBP | | | | 12 | | | | 01/27/2022 | | | | 194 | |
Calisen PLC | | LIBOR Plus 0.50% | | Annual | | | GBP | | | | 5 | | | | 01/27/2022 | | | | 88 | |
Calisen PLC | | LIBOR Plus 0.50% | | Annual | | | GBP | | | | 2 | | | | 01/27/2022 | | | | 29 | |
IMImobile PLC | | LIBOR Plus 0.50% | | Annual | | | GBP | | | | 133 | | | | 01/27/2022 | | | | 1,047 | |
IMImobile PLC | | LIBOR Plus 0.50% | | Monthly | | | GBP | | | | 54 | | | | 01/27/2022 | | | | 462 | |
IMImobile PLC | | LIBOR Plus 0.50% | | Monthly | | | GBP | | | | 27 | | | | 01/27/2022 | | | | 229 | |
IMImobile PLC | | LIBOR Plus 0.50% | | Monthly | | | GBP | | | | 6 | | | | 01/27/2022 | | | | 49 | |
IMImobile PLC | | LIBOR Plus 0.50% | | Annual | | | GBP | | | | 3 | | | | 01/27/2022 | | | | 24 | |
| | |
| |
| abfunds.com | | AB CONSERVATIVE WEALTH STRATEGY | 51 |
PORTFOLIO OF INVESTMENTS (continued)
| | | | | | | | | | | | | | | | | | | | |
Counterparty &
Referenced Obligation | | Rate Paid/
Received | | Payment
Frequency | | Current
Notional
(000) | | | Maturity
Date | | | Unrealized
Appreciation/
(Depreciation) | |
IMImobile PLC | | LIBOR Plus 0.50% | | Monthly | | | GBP | | | | 3 | | | | 01/27/2022 | | | $ | 24 | |
RTS Futures Contract | | 0.00% | | Monthly | | | USD | | | | 59 | | | | 03/18/2021 | | | | 924 | |
RTS Futures Contract | | 0.00% | | Monthly | | | USD | | | | 572 | | | | 03/18/2021 | | | | (19,805 | ) |
Tikkurila Oyj | | EURIBOR Plus 0.50% | | Annual | | | EUR | | | | 113 | | | | 01/27/2022 | | | | 37,030 | |
Tikkurila Oyj | | EURIBOR Plus 0.50% | | Monthly | | | EUR | | | | 48 | | | | 01/27/2022 | | | | 51 | |
|
Pay Total Return on Reference Obligation | |
Goldman Sachs International | |
Analog Devices, Inc. | | LIBOR Minus 0.29% | | Monthly | | | USD | | | | 32 | | | | 01/05/2023 | | | | 353 | |
Analog Devices, Inc. | | LIBOR Minus 0.29% | | Monthly | | | USD | | | | 460 | | | | 01/05/2023 | | | | (115,364 | ) |
GSABHVIP | | LIBOR | | Quarterly | | | USD | | | | 200 | | | | 12/15/2021 | | | | (1,211 | ) |
ICON PLC | | LIBOR Minus 0.23% | | Monthly | | | USD | | | | 68 | | | | 01/05/2023 | | | | 4,459 | |
ICON PLC | | LIBOR Minus 0.23% | | Monthly | | | USD | | | | 57 | | | | 01/05/2023 | | | | 3,584 | |
ICON PLC | | LIBOR Minus 0.23% | | Monthly | | | USD | | | | 7 | | | | 01/05/2023 | | | | 633 | |
Lumentum Holdings Inc. | | LIBOR Minus 0.29% | | Monthly | | | USD | | | | 114 | | | | 01/05/2023 | | | | 6,116 | |
Lumentum Holdings Inc. | | LIBOR Minus 0.29% | | Monthly | | | USD | | | | 40 | | | | 01/05/2023 | | | | 2,082 | |
Lumentum Holdings Inc. | | LIBOR Minus 0.29% | | Monthly | | | USD | | | | 23 | | | | 01/05/2023 | | | | 1,557 | |
Lumentum Holdings Inc. | | LIBOR Minus 0.29% | | Monthly | | | USD | | | | 22 | | | | 01/05/2023 | | | | 1,178 | |
Lumentum Holdings Inc. | | LIBOR Minus 0.29% | | Monthly | | | USD | | | | 20 | | | | 01/05/2023 | | | | 1,093 | |
Lumentum Holdings Inc. | | LIBOR Minus 0.30% | | Monthly | | | USD | | | | 10 | | | | 01/05/2023 | | | | 687 | |
Lumentum Holdings Inc. | | LIBOR Minus 0.29% | | Monthly | | | USD | | | | 7 | | | | 01/05/2023 | | | | 386 | |
Morgan Stanley | | LIBOR Minus 0.31% | | Monthly | | | USD | | | | 1 | | | | 01/05/2023 | | | | (111 | ) |
Morgan Stanley | | LIBOR Minus 0.31% | | Monthly | | | USD | | | | 13 | | | | 01/05/2023 | | | | (1,085 | ) |
Morgan Stanley | | LIBOR Minus 0.29% | | Monthly | | | USD | | | | 26 | | | | 01/05/2023 | | | | (9,431 | ) |
Morgan Stanley | | LIBOR Minus 0.29% | | Monthly | | | USD | | | | 47 | | | | 01/05/2023 | | | | (15,977 | ) |
Morgan Stanley | | LIBOR Minus 0.29% | | Monthly | | | USD | | | | 48 | | | | 01/05/2023 | | | | (16,576 | ) |
Morgan Stanley | | LIBOR Minus 0.29% | | Monthly | | | USD | | | | 65 | | | | 01/05/2023 | | | | (21,116 | ) |
Morgan Stanley | | LIBOR Minus 0.29% | | Monthly | | | USD | | | | 98 | | | | 01/05/2023 | | | | (35,354 | ) |
Salesforce.com Inc. | | LIBOR Minus 0.29% | | Monthly | | | USD | | | | 7 | | | | 01/27/2022 | | | | 293 | |
| | |
| |
52 | AB CONSERVATIVE WEALTH STRATEGY | | abfunds.com |
PORTFOLIO OF INVESTMENTS (continued)
| | | | | | | | | | | | | | | | | | | | |
Counterparty &
Referenced Obligation | | Rate Paid/
Received | | Payment
Frequency | | Current
Notional
(000) | | | Maturity
Date | | | Unrealized
Appreciation/
(Depreciation) | |
Salesforce.com Inc. | | LIBOR Minus 0.29% | | Monthly | | | USD | | | | 0 | ** | | | 01/27/2022 | | | $ | 10 | |
Salesforce.com Inc. | | LIBOR Minus 0.30% | | Monthly | | | USD | | | | 10 | | | | 01/05/2023 | | | | 1,418 | |
Salesforce.com Inc. | | LIBOR Minus 0.29% | | Monthly | | | USD | | | | 26 | | | | 01/05/2023 | | | | 1,270 | |
Salesforce.com Inc. | | LIBOR Minus 0.29% | | Monthly | | | USD | | | | 28 | | | | 01/05/2023 | | | | 967 | |
Salesforce.com Inc. | | LIBOR Minus 0.29% | | Monthly | | | USD | | | | 26 | | | | 01/05/2023 | | | | 765 | |
Salesforce.com Inc. | | LIBOR Minus 0.29% | | Monthly | | | USD | | | | 13 | | | | 01/05/2023 | | | | 721 | |
Salesforce.com Inc. | | LIBOR Minus 0.08% | | Monthly | | | USD | | | | 7 | | | | 01/05/2023 | | | | 688 | |
Salesforce.com Inc. | | LIBOR Minus 0.29% | | Monthly | | | USD | | | | 26 | | | | 01/05/2023 | | | | 673 | |
Salesforce.com Inc. | | LIBOR Minus 0.29% | | Monthly | | | USD | | | | 7 | | | | 01/05/2023 | | | | 369 | |
Salesforce.com Inc. | | LIBOR Minus 0.29% | | Monthly | | | USD | | | | 12 | | | | 01/05/2023 | | | | 274 | |
Salesforce.com Inc. | | LIBOR Minus 0.29% | | Monthly | | | USD | | | | 13 | | | | 01/05/2023 | | | | (12 | ) |
JPMorgan Chase Bank, NA | |
First Citizens Bancshares Inc. | | LIBOR Minus 0.31% | | Monthly | | | USD | | | | 32 | | | | 08/12/2022 | | | | 2,255 | |
First Citizens Bancshares Inc. | | LIBOR Minus 0.31% | | Monthly | | | USD | | | | 10 | | | | 08/12/2022 | | | | 628 | |
First Citizens Bancshares Inc. | | LIBOR Minus 0.31% | | Monthly | | | USD | | | | 10 | | | | 08/12/2022 | | | | 610 | |
First Citizens Bancshares Inc. | | LIBOR Minus 0.31% | | Monthly | | | USD | | | | 10 | | | | 08/12/2022 | | | | 299 | |
First Citizens Bancshares Inc. | | LIBOR Minus 0.31% | | Monthly | | | USD | | | | 15 | | | | 08/12/2022 | | | | 6 | |
Huntington Bancshares Inc. | | LIBOR Minus 0.31% | | Monthly | | | USD | | | | 2 | | | | 08/12/2022 | | | | (274 | ) |
Huntington Bancshares Inc. | | LIBOR Minus 0.30% | | Monthly | | | USD | | | | 2 | | | | 08/12/2022 | | | | (375 | ) |
Huntington Bancshares Inc. | | LIBOR Minus 0.30% | | Monthly | | | USD | | | | 11 | | | | 08/12/2022 | | | | (870 | ) |
Huntington Bancshares Inc. | | LIBOR Minus 0.31% | | Monthly | | | USD | | | | 9 | | | | 08/12/2022 | | | | (979 | ) |
Huntington Bancshares Inc. | | LIBOR Minus 0.30% | | Monthly | | | USD | | | | 16 | | | | 08/12/2022 | | | | (1,255 | ) |
Huntington Bancshares Inc. | | LIBOR Minus 0.30% | | Monthly | | | USD | | | | 11 | | | | 08/12/2022 | | | | (2,071 | ) |
Huntington Bancshares Inc. | | LIBOR Minus 0.31% | | Monthly | | | USD | | | | 18 | | | | 08/12/2022 | | | | (2,493 | ) |
Huntington Bancshares Inc. | | LIBOR Minus 0.30% | | Monthly | | | USD | | | | 43 | | | | 08/12/2022 | | | | (3,156 | ) |
Huntington Bancshares Inc. | | LIBOR Minus 0.30% | | Monthly | | | USD | | | | 44 | | | | 08/12/2022 | | | | (8,573 | ) |
| | |
| |
| abfunds.com | | AB CONSERVATIVE WEALTH STRATEGY | 53 |
PORTFOLIO OF INVESTMENTS (continued)
| | | | | | | | | | | | | | | | | | | | |
Counterparty &
Referenced Obligation | | Rate Paid/
Received | | Payment
Frequency | | Current
Notional
(000) | | | Maturity
Date | | | Unrealized
Appreciation/
(Depreciation) | |
Huntington Bancshares Inc. | | LIBOR Minus 0.30% | | Monthly | | | USD | | | | 70 | | | | 08/12/2022 | | | $ | (13,612 | ) |
Huntington Bancshares Inc. | | LIBOR Minus 0.30% | | Monthly | | | USD | | | | 86 | | | | 08/12/2022 | | | | (16,443 | ) |
Huntington Bancshares Inc. | | LIBOR Minus 0.30% | | Monthly | | | USD | | | | 178 | | | | 08/12/2022 | | | | (34,386 | ) |
Jazz Pharmaceuticals PLC | | LIBOR Minus 0.31% | | Monthly | | | USD | | | | 23 | | | | 08/12/2022 | | | | (1,992 | ) |
Marvell Technology Group Ltd. | | LIBOR Minus 0.30% | | Monthly | | | USD | | | | 1 | | | | 08/12/2022 | | | | (257 | ) |
Marvell Technology Group Ltd. | | LIBOR Minus 0.30% | | Monthly | | | USD | | | | 7 | | | | 08/12/2022 | | | | (1,673 | ) |
Marvell Technology Group Ltd. | | LIBOR Minus 0.30% | | Monthly | | | USD | | | | 18 | | | | 08/12/2022 | | | | (4,001 | ) |
Marvell Technology Group Ltd. | | LIBOR Minus 0.30% | | Monthly | | | USD | | | | 38 | | | | 08/12/2022 | | | | (4,034 | ) |
Marvell Technology Group Ltd. | | LIBOR Minus 0.30% | | Monthly | | | USD | | | | 50 | | | | 08/12/2022 | | | | (4,808 | ) |
Marvell Technology Group Ltd. | | LIBOR Minus 0.30% | | Monthly | | | USD | | | | 35 | | | | 08/12/2022 | | | | (7,955 | ) |
Marvell Technology Group Ltd. | | LIBOR Minus 0.30% | | Monthly | | | USD | | | | 46 | | | | 08/12/2022 | | | | (9,558 | ) |
Marvell Technology Group Ltd. | | LIBOR Minus 0.30% | | Monthly | | | USD | | | | 52 | | | | 08/12/2022 | | | | (10,116 | ) |
Marvell Technology Group Ltd. | | LIBOR Minus 0.30% | | Monthly | | | USD | | | | 54 | | | | 08/12/2022 | | | | (12,354 | ) |
S&P Global Inc. | | LIBOR Minus 0.30% | | Monthly | | | USD | | | | 36 | | | | 08/12/2022 | | | | 592 | |
S&P Global Inc. | | LIBOR Minus 0.30% | | Monthly | | | USD | | | | 26 | | | | 08/12/2022 | | | | 605 | |
S&P Global Inc. | | LIBOR Minus 0.30% | | Monthly | | | USD | | | | 34 | | | | 08/12/2022 | | | | 510 | |
S&P Global Inc. | | LIBOR Minus 0.30% | | Monthly | | | USD | | | | 34 | | | | 08/12/2022 | | | | 337 | |
S&P Global Inc. | | LIBOR Minus 0.31% | | Monthly | | | USD | | | | 40 | | | | 08/12/2022 | | | | 211 | |
S&P Global Inc. | | LIBOR Minus 0.30% | | Monthly | | | USD | | | | 5 | | | | 08/12/2022 | | | | 157 | |
S&P Global Inc. | | LIBOR Minus 0.30% | | Monthly | | | USD | | | | 3 | | | | 08/12/2022 | | | | 41 | |
S&P Global Inc. | | LIBOR Minus 0.31% | | Monthly | | | USD | | | | 15 | | | | 08/12/2022 | | | | 169 | |
S&P Global Inc. | | LIBOR Minus 0.30% | | Monthly | | | USD | | | | 7 | | | | 08/12/2022 | | | | (110 | ) |
S&P Global Inc. | | LIBOR Minus 0.30% | | Monthly | | | USD | | | | 32 | | | | 08/12/2022 | | | | (153 | ) |
S&P Global Inc. | | LIBOR Minus 0.30% | | Monthly | | | USD | | | | 33 | | | | 08/12/2022 | | | | (186 | ) |
S&P Global Inc. | | LIBOR Minus 0.30% | | Monthly | | | USD | | | | 28 | | | | 08/12/2022 | | | | (300 | ) |
| | |
| |
54 | AB CONSERVATIVE WEALTH STRATEGY | | abfunds.com |
PORTFOLIO OF INVESTMENTS (continued)
| | | | | | | | | | | | | | | | | | | | |
Counterparty &
Referenced Obligation | | Rate Paid/
Received | | Payment
Frequency | | Current
Notional
(000) | | | Maturity
Date | | | Unrealized
Appreciation/
(Depreciation) | |
S&P Global Inc. | | LIBOR Minus 0.30% | | Monthly | | | USD | | | | 76 | | | | 08/12/2022 | | | $ | (1,039 | ) |
S&P Global Inc. | | LIBOR Minus 0.30% | | Monthly | | | USD | | | | 37 | | | | 08/12/2022 | | | | (991 | ) |
S&P Global Inc. | | LIBOR Minus 0.30% | | Monthly | | | USD | | | | 70 | | | | 08/12/2022 | | | | (1,098 | ) |
STERIS PLC | | LIBOR Minus 0.30% | | Monthly | | | USD | | | | 54 | | | | 08/12/2022 | | | | 5,294 | |
STERIS PLC | | LIBOR Minus 0.30% | | Monthly | | | USD | | | | 50 | | | | 08/12/2022 | | | | 4,873 | |
STERIS PLC | | LIBOR Minus 0.31% | | Monthly | | | USD | | | | 60 | | | | 08/12/2022 | | | | 2,651 | |
STERIS PLC | | LIBOR Minus 0.31% | | Monthly | | | USD | | | | 35 | | | | 08/12/2022 | | | | 1,753 | |
STERIS PLC | | LIBOR Minus 0.31% | | Monthly | | | USD | | | | 34 | | | | 08/12/2022 | | | | 1,552 | |
STERIS PLC | | LIBOR Minus 0.31% | | Monthly | | | USD | | | | 31 | | | | 08/12/2022 | | | | 1,545 | |
STERIS PLC | | LIBOR Minus 0.31% | | Monthly | | | USD | | | | 26 | | | | 08/12/2022 | | | | 1,415 | |
STERIS PLC | | LIBOR Minus 0.31% | | Monthly | | | USD | | | | 19 | | | | 08/12/2022 | | | | 904 | |
STERIS PLC | | LIBOR Minus 0.30% | | Monthly | | | USD | | | | 5 | | | | 08/12/2022 | | | | 568 | |
STERIS PLC | | LIBOR Minus 0.31% | | Monthly | | | USD | | | | 6 | | | | 08/12/2022 | | | | 292 | |
STERIS PLC | | LIBOR Minus 0.31% | | Monthly | | | USD | | | | 2 | | | | 08/12/2022 | | | | 157 | |
Morgan Stanley Capital Services LLC | |
Advanced Micro Devices, Inc. | | LIBOR Minus 0.29% | | Annual | | | USD | | | | 40 | | | | 01/27/2022 | | | | 3,439 | |
Advanced Micro Devices, Inc. | | LIBOR Minus 0.29% | | Monthly | | | USD | | | | 2 | | | | 01/27/2022 | | | | (170 | ) |
Advanced Micro Devices, Inc. | | LIBOR Minus 0.08% | | Monthly | | | USD | | | | 134 | | | | 01/27/2022 | | | | (2,971 | ) |
Advanced Micro Devices, Inc. | | LIBOR Minus 0.29% | | Monthly | | | USD | | | | 66 | | | | 01/27/2022 | | | | (5,962 | ) |
Advanced Micro Devices, Inc. | | LIBOR Minus 0.29% | | Monthly | | | USD | | | | 58 | | | | 01/27/2022 | | | | (6,689 | ) |
Advanced Micro Devices, Inc. | | LIBOR Minus 0.08% | | Monthly | | | USD | | | | 153 | | | | 01/27/2022 | | | | (9,272 | ) |
AON PLC | | LIBOR Minus 0.25% | | Monthly | | | USD | | | | 13 | | | | 01/27/2022 | | | | (3,281 | ) |
AON PLC | | LIBOR Minus 0.40% | | Monthly | | | USD | | | | 17 | | | | 01/27/2022 | | | | (4,807 | ) |
AON PLC | | LIBOR Minus 0.30% | | Annual | | | USD | | | | 16 | | | | 01/27/2022 | | | | (4,943 | ) |
AON PLC | | LIBOR Minus 0.29% | | Annual | | | USD | | | | 56 | | | | 01/27/2022 | | | | (5,192 | ) |
AON PLC | | LIBOR Minus 0.28% | | Monthly | | | USD | | | | 21 | | | | 01/27/2022 | | | | (5,787 | ) |
| | |
| |
| abfunds.com | | AB CONSERVATIVE WEALTH STRATEGY | 55 |
PORTFOLIO OF INVESTMENTS (continued)
| | | | | | | | | | | | | | | | | | | | |
Counterparty &
Referenced Obligation | | Rate Paid/
Received | | Payment
Frequency | | Current
Notional
(000) | | | Maturity
Date | | | Unrealized
Appreciation/
(Depreciation) | |
AON PLC | | LIBOR Minus 0.25% | | Annual | | | USD | | | | 36 | | | | 01/27/2022 | | | $ | (6,993 | ) |
AON PLC | | LIBOR Minus 0.25% | | Monthly | | | USD | | | | 54 | | | | 01/27/2022 | | | | (11,860 | ) |
AON PLC | | LIBOR Minus 0.28% | | Monthly | | | USD | | | | 56 | | | | 01/27/2022 | | | | (15,300 | ) |
AON PLC | | LIBOR Minus 1.10% | | Monthly | | | USD | | | | 103 | | | | 01/27/2022 | | | | (32,225 | ) |
AON PLC | | LIBOR Minus 0.40% | | Annual | | | USD | | | | 177 | | | | 01/27/2022 | | | | (49,388 | ) |
AstraZeneca PLC | | LIBOR Minus 0.21% | | Annual | | | USD | | | | 46 | | | | 01/27/2022 | | | | 2,839 | |
AstraZeneca PLC | | LIBOR Minus 0.21% | | Annual | | | USD | | | | 29 | | | | 01/27/2022 | | | | 2,455 | |
AstraZeneca PLC | | LIBOR Minus 0.21% | | Annual | | | USD | | | | 56 | | | | 01/27/2022 | | | | 2,040 | |
AstraZeneca PLC | | LIBOR Minus 0.21% | | Annual | | | USD | | | | 18 | | | | 01/27/2022 | | | | 1,082 | |
AstraZeneca PLC | | LIBOR Minus 0.21% | | Annual | | | USD | | | | 22 | | | | 01/27/2022 | | | | 1,059 | |
AstraZeneca PLC | | LIBOR Minus 0.21% | | Annual | | | USD | | | | 22 | | | | 01/27/2022 | | | | 1,053 | |
AstraZeneca PLC | | LIBOR Minus 0.21% | | Annual | | | USD | | | | 23 | | | | 01/27/2022 | | | | 922 | |
AstraZeneca PLC | | LIBOR Minus 0.21% | | Annual | | | USD | | | | 15 | | | | 01/27/2022 | | | | 660 | |
AstraZeneca PLC | | LIBOR Minus 0.21% | | Annual | | | USD | | | | 19 | | | | 01/27/2022 | | | | 497 | |
AstraZeneca PLC | | LIBOR Minus 0.21% | | Annual | | | USD | | | | 6 | | | | 01/27/2022 | | | | 325 | |
AstraZeneca PLC | | LIBOR Minus 0.21% | | Annual | | | USD | | | | 6 | | | | 01/27/2022 | | | | 271 | |
AstraZeneca PLC | | LIBOR Minus 0.21% | | Annual | | | USD | | | | 8 | | | | 01/27/2022 | | | | 204 | |
AstraZeneca PLC | | LIBOR Minus 0.21% | | Annual | | | USD | | | | 1 | | | | 01/27/2022 | | | | 31 | |
AstraZeneca PLC | | LIBOR Minus 0.21% | | Annual | | | USD | | | | 1 | | | | 01/27/2022 | | | | 19 | |
Diamondback Energy, Inc. | | LIBOR Minus 0.29% | | Annual | | | USD | | | | 1 | | | | 01/27/2022 | | | | (240 | ) |
Diamondback Energy, Inc. | | LIBOR Minus 0.29% | | Annual | | | USD | | | | 1 | | | | 01/27/2022 | | | | (253 | ) |
Huntington Bancshares Inc. | | LIBOR Minus 0.29% | | Annual | | | USD | | | | 9 | | | | 01/27/2022 | | | | (1,693 | ) |
iBovespa Futures | | 0.00% | | Monthly | | | BRL | | | | 1,538 | | | | 04/14/2021 | | | | 15,208 | |
iBovespa Futures | | 0.00% | | Monthly | | | BRL | | | | 659 | | | | 04/14/2021 | | | | 10,131 | |
Just Eat Takeaway N.V. | | EURIBOR Minus 0.35% | | Monthly | | | EUR | | | | 44 | | | | 01/27/2022 | | | | 8,465 | |
Just Eat Takeaway N.V. | | EURIBOR Minus 0.35% | | Monthly | | | EUR | | | | 26 | | | | 01/27/2022 | | | | 7,496 | |
| | |
| |
56 | AB CONSERVATIVE WEALTH STRATEGY | | abfunds.com |
PORTFOLIO OF INVESTMENTS (continued)
| | | | | | | | | | | | | | | | | | | | |
Counterparty &
Referenced Obligation | | Rate Paid/
Received | | Payment
Frequency | | Current
Notional
(000) | | | Maturity
Date | | | Unrealized
Appreciation/
(Depreciation) | |
Just Eat Takeaway N.V. | | EURIBOR Minus 0.35% | | Monthly | | | EUR | | | | 25 | | | | 01/27/2022 | | | $ | 7,301 | |
Just Eat Takeaway N.V. | | EURIBOR Minus 0.35% | | Monthly | | | EUR | | | | 24 | | | | 01/27/2022 | | | | 6,669 | |
Just Eat Takeaway N.V. | | EURIBOR Minus 0.35% | | Monthly | | | EUR | | | | 24 | | | | 01/27/2022 | | | | 6,052 | |
Just Eat Takeaway N.V. | | EURIBOR Minus 0.35% | | Monthly | | | EUR | | | | 22 | | | | 01/27/2022 | | | | 5,347 | |
Just Eat Takeaway N.V. | | EURIBOR Minus 0.35% | | Monthly | | | EUR | | | | 18 | | | | 01/27/2022 | | | | 4,571 | |
Just Eat Takeaway N.V. | | EURIBOR Minus 0.35% | | Monthly | | | EUR | | | | 14 | | | | 01/27/2022 | | | | 4,082 | |
Just Eat Takeaway N.V. | | EURIBOR Minus 0.35% | | Monthly | | | EUR | | | | 19 | | | | 01/27/2022 | | | | 3,918 | |
Just Eat Takeaway N.V. | | EURIBOR Minus 0.35% | | Monthly | | | EUR | | | | 11 | | | | 01/27/2022 | | | | 3,393 | |
Just Eat Takeaway N.V. | | EURIBOR Minus 0.35% | | Monthly | | | EUR | | | | 21 | | | | 01/27/2022 | | | | 3,193 | |
Just Eat Takeaway N.V. | | EURIBOR Minus 0.35% | | Annual | | | EUR | | | | 16 | | | | 01/27/2022 | | | | 2,823 | |
Just Eat Takeaway N.V. | | EURIBOR Minus 0.35% | | Monthly | | | EUR | | | | 9 | | | | 01/27/2022 | | | | 2,660 | |
Just Eat Takeaway N.V. | | EURIBOR Minus 0.35% | | Monthly | | | EUR | | | | 8 | | | | 01/27/2022 | | | | 2,422 | |
Just Eat Takeaway N.V. | | EURIBOR Minus 0.35% | | Monthly | | | EUR | | | | 13 | | | | 01/27/2022 | | | | 2,065 | |
Just Eat Takeaway N.V. | | EURIBOR Minus 0.35% | | Monthly | | | EUR | | | | 6 | | | | 01/27/2022 | | | | 1,854 | |
Just Eat Takeaway N.V. | | EURIBOR Minus 0.35% | | Monthly | | | EUR | | | | 13 | | | | 01/27/2022 | | | | 1,822 | |
Just Eat Takeaway N.V. | | EURIBOR Minus 0.35% | | Monthly | | | EUR | | | | 7 | | | | 01/27/2022 | | | | 1,753 | |
Just Eat Takeaway N.V. | | EURIBOR Minus 0.35% | | Monthly | | | EUR | | | | 3 | | | | 01/27/2022 | | | | 645 | |
Just Eat Takeaway N.V. | | EURIBOR Minus 0.35% | | Monthly | | | EUR | | | | 2 | | | | 01/27/2022 | | | | 604 | |
Just Eat Takeaway N.V. | | EURIBOR Minus 0.35% | | Monthly | | | EUR | | | | 2 | | | | 01/27/2022 | | | | 536 | |
Just Eat Takeaway N.V. | | EURIBOR Minus 0.35% | | Monthly | | | EUR | | | | 2 | | | | 01/27/2022 | | | | 489 | |
Just Eat Takeaway N.V. | | EURIBOR Minus 0.35% | | Monthly | | | EUR | | | | 1 | | | | 01/27/2022 | | | | 389 | |
Just Eat Takeaway N.V. | | EURIBOR Minus 0.35% | | Monthly | | | EUR | | | | 1 | | | | 01/27/2022 | | | | 280 | |
Just Eat Takeaway N.V. | | EURIBOR Minus 0.35% | | Monthly | | | EUR | | | | 1 | | | | 01/27/2022 | | | | 137 | |
Just Eat Takeaway N.V. | | EURIBOR Minus 0.35% | | Monthly | | | EUR | | | | 0 | ** | | | 01/27/2022 | | | | (3 | ) |
MSABHOWN | | LIBOR Minus 0.30% | | Maturity | | | USD | | | | 175 | | | | 05/17/2021 | | | | 6,065 | |
| | |
| |
| abfunds.com | | AB CONSERVATIVE WEALTH STRATEGY | 57 |
PORTFOLIO OF INVESTMENTS (continued)
| | | | | | | | | | | | | | | | | | | | | | |
Counterparty &
Referenced Obligation | | Rate Paid/
Received | | Payment
Frequency | | | Current
Notional
(000) | | | Maturity
Date | | | Unrealized
Appreciation/
(Depreciation) | |
Swiss Market Index Futures | | 0.00% | | | Monthly | | | | CHF | | | | 105 | | | | 03/19/2021 | | | $ | 1,492 | |
Teledyne Technologies Inc. | | LIBOR Minus 0.29% | | | Annual | | | | USD | | | | 30 | | | | 01/27/2022 | | | | 1,023 | |
Teledyne Technologies Inc. | | LIBOR Minus 0.29% | | | Annual | | | | USD | | | | 35 | | | | 01/27/2022 | | | | (165 | ) |
Teledyne Technologies Inc. | | LIBOR Minus 0.29% | | | Annual | | | | USD | | | | 101 | | | | 01/27/2022 | | | | (1,173 | ) |
Teledyne Technologies Inc. | | LIBOR Minus 0.29% | | | Annual | | | | USD | | | | 55 | | | | 01/27/2022 | | | | (1,351 | ) |
| | | | | | | | | | | | | | | | | | | | | | |
| | | | | | | | | | | | | | | | | | | | $ | (218,993 | ) |
| | | | | | | | | | | | | | | | | | | | | | |
VARIANCE SWAPS (see Note D)
| | | | | | | | | | | | | | | | | | | | | | | | | | | | |
Swap Counterparty &
Referenced Obligation | | Volatility
Strike
Rate | | | Payment
Frequency | | | Notional
Amount
(000) | | | Market
Value | | | Upfront
Premiums
Paid/
(Received) | | | Unrealized
Appreciation/
(Depreciation) | |
Buy Contracts | | | | | | | | | | | | | | | | | | | | | | | | | | | | |
Bank of America, NA | | | | | | | | | | | | | | | | | | | | | | | | | | | | |
FTSE 100 Index 05/21/2021* | | | 25.10 | % | | | Maturity | | | | GBP | | | | 0 | ** | | $ | 912 | | | $ | – 0 | – | | $ | 912 | |
JPMorgan Chase Bank, NA | | | | | | | | | | | | | | | | | | | | | | | | | | | | |
Nikkei 225 Index 05/14/2021* | | | 26.90 | | | | Maturity | | | | JPY | | | | 14 | | | | 19,098 | | | | – 0 | – | | | 19,098 | |
UBS AG | | | | | | | | | | | | | | | | | | | | | | | | | | | | |
S&P/ASX 200 Index 05/20/2021* | | | 22.72 | | | | Maturity | | | | AUD | | | | 1 | | | | 29,902 | | | | – 0 | – | | | 29,902 | |
USD/JPY 09/30/2021* | | | 7.85 | | | | Maturity | | | | USD | | | | 14 | | | | (14,842 | ) | | | – 0 | – | | | (14,842 | ) |
| | | | | | | |
Sale Contracts | | | | | | | | | | | | | | | | | | | | | | | | | | | | |
Credit Suisse International | | | | | | | | | | | | | | | | | | | | | | | | | | | | |
Nasdaq 100 Stock Index 03/19/2021* | | | 28.00 | | | | Maturity | | | | USD | | | | 0 | ** | | | (48,731 | ) | | | – 0 | – | | | (48,731 | ) |
Goldman Sachs Bank USA | | | | | | | | | | | | | | | | | | | | | | | | | | | | |
USD/JPY 09/30/2021* | | | 7.20 | | | | Maturity | | | | USD | | | | 12 | | | | 3,530 | | | | – 0 | – | | | 3,530 | |
Goldman Sachs International | | | | | | | | | | | | | | | | | | | | | | | | | | | | |
Nikkei 225 Index 03/12/2021* | | | 22.31 | | | | Maturity | | | | JPY | | | | 14 | | | | (51,964 | ) | | | – 0 | – | | | (51,964 | ) |
JPMorgan Chase Bank, NA | | | | | | | | | | | | | | | | | | | | | | | | | | | | |
Russell 2000 Index 03/19/2021* | | | 32.45 | | | | Maturity | | | | USD | | | | 0 | ** | | | (33,311 | ) | | | – 0 | – | | | (33,311 | ) |
UBS AG | | | | | | | | | | | | | | | | | | | | | | | | | | | | |
S&P/ASX 200 Index 03/18/2021* | | | 19.66 | | | | Maturity | | | | AUD | | | | 0 | ** | | | (13,085 | ) | | | – 0 | – | | | (13,085 | ) |
| | | | | | | | | | | | | | | | | | | | | | | | | | | | |
| | | | | | | | | | | | | | | | | | $ | (108,491 | ) | | $ | – 0 | – | | $ | (108,491 | ) |
| | | | | | | | | | | | | | | | | | | | | | | | | | | | |
| ** | Notional amount less than 500. |
| | |
| |
58 | AB CONSERVATIVE WEALTH STRATEGY | | abfunds.com |
PORTFOLIO OF INVESTMENTS (continued)
| (a) | Non-income producing security. |
| (b) | Security is exempt from registration under Rule 144A of the Securities Act of 1933. These securities are considered restricted, but liquid and may be resold in transactions exempt from registration, normally to qualified institutional buyers. At February 28, 2021, the aggregate market value of these securities amounted to $14,629,229 or 9.5% of net assets. |
| (c) | Represents entire or partial securities out on loan. |
| (d) | Security in which significant unobservable inputs (Level 3) were used in determining fair value. |
| (e) | Fair valued by the Adviser. |
| (f) | To obtain a copy of the fund’s shareholder report, please go to the Securities and Exchange Commission’s website at www.sec.gov. Additionally, shareholder reports for AB funds can be obtained by calling AB at (800) 227-4618. |
| (g) | Affiliated investments. |
| (h) | Position, or a portion thereof, has been segregated to collateralize OTC derivatives outstanding. |
| (i) | Position, or a portion thereof, has been segregated to collateralize margin requirements for open exchange-traded derivatives. |
| (j) | Securities are perpetual and, thus, do not have a predetermined maturity date. The date shown, if applicable, reflects the next call date. |
| (k) | Floating Rate Security. Stated interest/floor/ceiling rate was in effect at February 28, 2021. |
| (l) | The rate shown represents the 7-day yield as of period end. |
|
Currency Abbreviation: |
| AUD – Australian Dollar |
| BRL – Brazilian Real |
| CAD – Canadian Dollar |
| CHF – Swiss Franc |
| CLP – Chilean Peso |
| CNY – Chinese Yuan Renminbi |
| COP – Colombian Peso |
| CZK – Czech Koruna |
| EUR – Euro |
| GBP – Great British Pound |
| HKD – Hong Kong Dollar |
| HUF – Hungarian Forint |
| IDR – Indonesian Rupiah |
| ILS – Israeli Shekel |
| INR – Indian Rupee |
| JPY – Japanese Yen |
| KRW – South Korean Won |
| MXN – Mexican Peso |
| MYR – Malaysian Ringgit |
| NOK – Norwegian Krone |
| NZD – New Zealand Dollar |
| PEN – Peruvian Sol |
| PHP – Philippine Peso |
| PLN – Polish Zloty |
| RUB – Russian Ruble |
| SEK – Swedish Krona |
| SGD – Singapore Dollar |
| THB – Thailand Baht |
| TRY – Turkish Lira |
| TWD – New Taiwan Dollar |
| USD – United States Dollar |
| ZAR – South African Rand |
| | |
| |
| abfunds.com | | AB CONSERVATIVE WEALTH STRATEGY | 59 |
PORTFOLIO OF INVESTMENTS (continued)
Glossary:
ABS – Asset-Backed Securities
ADR – American Depositary Receipt
ARMs – Adjustable Rate Mortgages
ASX – Australian Stock Exchange
BKBM – Bank Bill Benchmark (New Zealand)
BOBL – Bundesobligationen
BTP – Buoni del Tesoro Poliennali
CBT – Chicago Board of Trade
CDOR – Canadian Dealer Offered Rate
CDX-NAIG – North American Investment Grade Credit Default Swap Index
CLO – Collateralized Loan Obligations
CMBS – Commercial Mortgage-Backed Securities
CPI – Consumer Price Index
EAFE – Europe, Australia, and Far East
ETF – Exchange Traded Fund
EURIBOR – Euro Interbank Offered Rate
FTSE – Financial Times Stock Exchange
GDR – Global Depositary Receipt
LIBOR – London Interbank Offered Rate
MSCI – Morgan Stanley Capital International
NIBOR – Norwegian Interbank Offered Rate
OAT – Obligations Assimilables du Trésor
OMSX – Stockholm Stock Exchange
OSE – Osaka Securities Exchange
PJSC – Public Joint Stock Company
REIT – Real Estate Investment Trust
SGX – Singapore Exchange
SPDR – Standard & Poor’s Depository Receipt
SPI – Share Price Index
STIBOR – Stockholm Interbank Offered Rate
TBA – To Be Announced
TOPIX – Tokyo Price Index
TSX – Toronto Stock Exchange
| (1) | The following table represents the 50 largest long equity basket holdings underlying the total return swap with MLABCOVL as of February 28, 2021. |
| | | | | | | | | | | | |
| Security Description | | Shares | | | Current Notional | | | Percent of
Basket’s Value | |
Kohl’s Corp. | | | 1,747 | | | $ | 96,531 | | | | 4.0 | % |
Forward Air Corp. | | | 1,109 | | | | 95,146 | | | | 4.0 | % |
Knight-Swift Transportation Holdings, Inc. | | | 2,194 | | | | 94,770 | | | | 3.9 | % |
ManpowerGroup, Inc. | | | 984 | | | | 92,916 | | | | 3.9 | % |
UniFirst Corp. | | | 377 | | | | 91,402 | | | | 3.8 | % |
Vail Resorts, Inc. | | | 291 | | | | 89,850 | | | | 3.7 | % |
Insperity, Inc. | | | 1,008 | | | | 89,444 | | | | 3.7 | % |
Sonoco Products Co. | | | 1,492 | | | | 88,891 | | | | 3.7 | % |
Union Pacific Corp. | | | 427 | | | | 87,945 | | | | 3.7 | % |
Graham Holdings Co. | | | 137 | | | | 82,161 | | | | 3.4 | % |
Choice Hotels International, Inc. | | | 770 | | | | 80,751 | | | | 3.4 | % |
TEGNA, Inc. | | | 3,577 | | | | 65,214 | | | | 2.7 | % |
John Wiley & Sons, Inc. | | | 1,220 | | | | 64,285 | | | | 2.7 | % |
CVS Health Corp. | | | 827 | | | | 56,332 | | | | 2.3 | % |
Sirius XM Holdings, Inc. | | | 8,738 | | | | 51,118 | | | | 2.1 | % |
Valero Energy Corp. | | | 660 | | | | 50,800 | | | | 2.1 | % |
| | |
| |
60 | AB CONSERVATIVE WEALTH STRATEGY | | abfunds.com |
PORTFOLIO OF INVESTMENTS (continued)
| | | | | | | | | | | | |
| Security Description | | Shares | | | Current Notional | | | Percent of
Basket’s Value | |
HollyFrontier Corp. | | | 1,276 | | | $ | 48,317 | | | | 2.0 | % |
Phillips 66 | | | 561 | | | | 46,570 | | | | 1.9 | % |
Pioneer Natural Resources Co. | | | 296 | | | | 43,909 | | | | 1.8 | % |
Unum Group | | | 1,117 | | | | 29,566 | | | | 1.2 | % |
Lincoln National Corp. | | | 482 | | | | 27,384 | | | | 1.1 | % |
Kimco Realty Corp. | | | 1,491 | | | | 27,326 | | | | 1.1 | % |
Regency Centers Corp. | | | 494 | | | | 27,064 | | | | 1.1 | % |
Constellation Brands, Inc. | | | 125 | | | | 26,789 | | | | 1.1 | % |
Ventas, Inc. | | | 483 | | | | 25,538 | | | | 1.1 | % |
Simon Property Group, Inc. | | | 223 | | | | 25,204 | | | | 1.0 | % |
PepsiCo, Inc. | | | 193 | | | | 24,961 | | | | 1.0 | % |
Brown-Forman Corp. | | | 344 | | | | 24,629 | | | | 1.0 | % |
Vornado Realty Trust | | | 570 | | | | 24,480 | | | | 1.0 | % |
Welltower, Inc. | | | 360 | | | | 24,429 | | | | 1.0 | % |
Prudential Financial, Inc. | | | 274 | | | | 23,778 | | | | 1.0 | % |
Manulife Financial Corp. | | | 1,136 | | | | 22,628 | | | | 0.9 | % |
Walgreens Boots Alliance, Inc. | | | 465 | | | | 22,276 | | | | 0.9 | % |
Realty Income Corp. | | | 365 | | | | 22,020 | | | | 0.9 | % |
Citigroup, Inc. | | | 334 | | | | 21,993 | | | | 0.9 | % |
Boston Properties, Inc. | | | 221 | | | | 21,934 | | | | 0.9 | % |
Weyerhaeuser Co | | | 624 | | | | 21,126 | | | | 0.9 | % |
Anheuser-Busch InBev SA | | | 363 | | | | 20,984 | | | | 0.9 | % |
AvalonBay Communities, Inc. | | | 118 | | | | 20,653 | | | | 0.9 | % |
First Horizon Corp. | | | 1,250 | | | | 20,252 | | | | 0.8 | % |
Equity Residential | | | 304 | | | | 19,874 | | | | 0.8 | % |
Fifth Third Bancorp | | | 563 | | | | 19,544 | | | | 0.8 | % |
Mid-America Apartment Communities, Inc. | | | 145 | | | | 19,541 | | | | 0.8 | % |
Principal Financial Group, Inc. | | | 345 | | | | 19,517 | | | | 0.8 | % |
Essex Property Trust, Inc. | | | 74 | | | | 18,792 | | | | 0.8 | % |
United Bankshares, Inc. | | | 501 | | | | 18,522 | | | | 0.8 | % |
Extra Space Storage, Inc. | | | 141 | | | | 17,721 | | | | 0.7 | % |
Bank of New York Mellon Corp. | | | 412 | | | | 17,355 | | | | 0.7 | % |
Reinsurance Group of America | | | 140 | | | | 17,124 | | | | 0.7 | % |
Franklin Resources, Inc. | | | 622 | | | | 16,286 | | | | 0.7 | % |
Other Long | | | 6,373 | | | | 296,020 | | | | 12.3 | % |
| (2) | The following table represents the 50 largest long equity basket holdings underlying the total return swap with JPABJVAL as of February 28, 2021. |
| | | | | | | | | | | | |
| Security Description | | Shares | | | Current Notional | | | Percent of
Basket’s Value | |
Hitachi, Ltd. | | | 446 | | | | JPY 2,172,886 | | | | 3.3 | % |
KDDI Corp. | | | 659 | | | | 2,168,418 | | | | 3.3 | % |
SoftBank Corp. | | | 1,176 | | | | 1,693,942 | | | | 2.6 | % |
Nippon Yusen KK | | | 537 | | | | 1,641,943 | | | | 2.5 | % |
Sony Corp. | | | 144 | | | | 1,597,778 | | | | 2.4 | % |
Japan Tobacco, Inc. | | | 829 | | | | 1,595,784 | | | | 2.4 | % |
Daito Trust Construction Co., Ltd. | | | 134 | | | | 1,587,716 | | | | 2.4 | % |
NEC Corp. | | | 268 | | | | 1,556,037 | | | | 2.4 | % |
T&D Holdings, Inc. | | | 1,079 | | | | 1,549,683 | | | | 2.4 | % |
| | |
| |
| abfunds.com | | AB CONSERVATIVE WEALTH STRATEGY | 61 |
PORTFOLIO OF INVESTMENTS (continued)
| | | | | | | | | | | | |
| Security Description | | Shares | | | Current Notional | | | Percent of
Basket’s Value | |
Asahi Kasei Corp. | | | 1,339 | | | | JPY 1,534,344 | | | | 2.3 | % |
SCSK Corp. | | | 244 | | | | 1,532,562 | | | | 2.3 | % |
Sumitomo Dainippon Pharma Co., Ltd. | | | 894 | | | | 1,505,086 | | | | 2.3 | % |
United Urban Investment Corp. | | | 10 | | | | 1,501,473 | | | | 2.3 | % |
Lida Group Holdings Co., Ltd. | | | 621 | | | | 1,498,668 | | | | 2.3 | % |
Yamaha Motor Co., Ltd. | | | 643 | | | | 1,491,149 | | | | 2.3 | % |
Hoya Corp. | | | 123 | | | | 1,487,097 | | | | 2.3 | % |
Taisei Corp. | | | 396 | | | | 1,486,213 | | | | 2.3 | % |
Nitto Denko Corp. | | | 163 | | | | 1,480,816 | | | | 2.3 | % |
Kao Corp. | | | 205 | | | | 1,466,178 | | | | 2.2 | % |
Resona Holdings, Inc. | | | 3,416 | | | | 1,461,014 | | | | 2.2 | % |
Amada Co., Ltd. | | | 1,127 | | | | 1,455,583 | | | | 2.2 | % |
Shionogi & Co., Ltd. | | | 269 | | | | 1,455,283 | | | | 2.2 | % |
Japan Post Insurance Co., Ltd. | | | 617 | | | | 1,344,017 | | | | 2.0 | % |
NGK Spark Plug Co., Ltd. | | | 744 | | | | 1,341,585 | | | | 2.0 | % |
Kurita Water Industries Ltd. | | | 308 | | | | 1,328,019 | | | | 2.0 | % |
Capcom Co., Ltd. | | | 202 | | | | 1,307,779 | | | | 2.0 | % |
Chubu Electric Power Co., Inc. | | | 979 | | | | 1,280,203 | | | | 1.9 | % |
Toyota Motor Corp. | | | 159 | | | | 1,253,550 | | | | 1.9 | % |
SG Holdings Co., Ltd. | | | 511 | | | | 1,251,821 | | | | 1.9 | % |
Brother Industries Ltd. | | | 586 | | | | 1,226,802 | | | | 1.9 | % |
Shimamura Co., Ltd. | | | 114 | | | | 1,213,032 | | | | 1.8 | % |
Advantest Corp. | | | 137 | | | | 1,198,262 | | | | 1.8 | % |
Lion Corp. | | | 570 | | | | 1,165,242 | | | | 1.8 | % |
Azbil Corp. | | | 242 | | | | 1,094,250 | | | | 1.7 | % |
Fuji Electric Co., Ltd. | | | 238 | | | | 1,050,323 | | | | 1.6 | % |
Otsuka Holdings Co., Ltd. | | | 238 | | | | 1,003,907 | | | | 1.5 | % |
McDonald’s Holdings Co./(Japan) | | | 172 | | | | 909,894 | | | | 1.4 | % |
Orix JREIT, Inc. | | | 5 | | | | 837,007 | | | | 1.3 | % |
SoftBank Group Corp. | | | 84 | | | | 832,751 | | | | 1.3 | % |
Toho Gas Co., Ltd. | | | 131 | | | | 817,052 | | | | 1.2 | % |
AGC, Inc. | | | 206 | | | | 805,247 | | | | 1.2 | % |
Toyota Tsusho Corp. | | | 180 | | | | 803,459 | | | | 1.2 | % |
Calbee, Inc. | | | 270 | | | | 755,178 | | | | 1.1 | % |
Nippon Express Co., Ltd. | | | 94 | | | | 748,167 | | | | 1.1 | % |
Persol Holdings Co., Ltd. | | | 334 | | | | 703,681 | | | | 1.1 | % |
Ajinomoto Co., Inc. | | | 327 | | | | 693,658 | | | | 1.1 | % |
Teijin Ltd. | | | 351 | | | | 641,989 | | | | 1.0 | % |
ZOZO, Inc. | | | 168 | | | | 558,924 | | | | 0.9 | % |
Suzuken Co., Ltd./Aichi Japan | | | 135 | | | | 546,592 | | | | 0.8 | % |
Lixil Corp. | | | 180 | | | | 538,588 | | | | 0.8 | % |
Other Long | | | 1,922 | | | | 3,565,137 | | | | 5.4 | % |
See notes to financial statements.
| | |
| |
62 | AB CONSERVATIVE WEALTH STRATEGY | | abfunds.com |
STATEMENT OF ASSETS & LIABILITIES
February 28, 2021 (unaudited)
| | | | |
| Assets | | | | |
Investments in securities, at value | | | | |
Unaffiliated issuers (cost $92,749,918) | | $ | 106,671,102 | (a) |
Affiliated issuers (cost $46,340,416—including investment of cash collateral for securities loaned of $1,913,241) | | | 46,651,027 | |
Cash | | | 53,870 | |
Cash collateral due from broker | | | 3,757,103 | |
Foreign currencies, at value (cost $1,371,352) | | | 1,368,660 | |
Receivable for investment securities sold and foreign currency transactions | | | 1,118,344 | |
Unrealized appreciation on forward currency exchange contracts | | | 788,692 | |
Unrealized appreciation on total return swaps | | | 366,300 | |
Unaffiliated interest and dividends receivable | | | 332,500 | |
Unrealized appreciation on inflation swaps | | | 290,147 | |
Receivable for variation margin on centrally cleared swaps | | | 130,041 | |
Affiliated dividends receivable | | | 86,378 | |
Unrealized appreciation on variance swaps | | | 53,442 | |
Receivable for variation margin on futures | | | 53,097 | |
Receivable for shares of beneficial interest sold | | | 3,292 | |
Other assets | | | 2,740 | |
| | | | |
Total assets | | | 161,726,735 | |
| | | | |
| Liabilities | | | | |
Payable for investment securities purchased and foreign currency transactions | | | 4,279,182 | |
Payable for collateral received on securities loaned | | | 1,913,241 | |
Unrealized depreciation on forward currency exchange contracts | | | 608,973 | |
Unrealized depreciation on total return swaps | | | 585,293 | |
Payable for shares of beneficial interest redeemed | | | 374,383 | |
Unrealized depreciation on variance swaps | | | 161,933 | |
Advisory fee payable | | | 52,499 | |
Distribution fee payable | | | 35,593 | |
Payable for terminated total return swaps | | | 15,328 | |
Transfer Agent fee payable | | | 13,001 | |
Unrealized depreciation on inflation swaps | | | 9,208 | |
Trustees’ fees payable | | | 4,226 | |
Payable for newly entered centrally cleared interest rate swaps | | | 179,849 | |
Accrued expenses and other liabilities | | | 151,576 | |
| | | | |
Total liabilities | | | 8,384,285 | |
| | | | |
Net Assets | | $ | 153,342,450 | |
| | | | |
| Composition of Net Assets | | | | |
Shares of beneficial interest, at par | | $ | 121 | |
Additional paid-in capital | | | 141,660,721 | |
Distributable earnings | | | 11,681,608 | |
| | | | |
| | $ | 153,342,450 | |
| | | | |
| (a) | Includes securities on loan with a value of $2,155,899 (see Note E). |
See notes to financial statements.
| | |
| |
| abfunds.com | | AB CONSERVATIVE WEALTH STRATEGY | 63 |
STATEMENT OF ASSETS & LIABILITIES (continued)
Net Asset Value Per Share—unlimited shares authorized, $.00001 par value
| | | | | | | | | | | | |
| Class | | Net Assets | | | Shares
Outstanding | | | Net Asset
Value | |
| |
| A | | $ | 131,406,185 | | | | 10,335,467 | | | $ | 12.71 | * |
| |
| C | | $ | 9,858,505 | | | | 774,684 | | | $ | 12.73 | |
| |
| Advisor | | $ | 5,487,756 | | | | 429,840 | | | $ | 12.77 | |
| |
| R | | $ | 4,449,661 | | | | 349,507 | | | $ | 12.73 | |
| |
| K | | $ | 2,103,385 | | | | 165,104 | | | $ | 12.74 | |
| |
| I | | $ | 36,958 | | | | 2,862 | | | $ | 12.91 | |
| |
| * | The maximum offering price per share for Class A shares was $13.27 which reflects a sales charge of 4.25%. |
See notes to financial statements.
| | |
| |
64 | AB CONSERVATIVE WEALTH STRATEGY | | abfunds.com |
STATEMENT OF OPERATIONS
Six Months Ended February 28, 2021 (unaudited)
| | | | | | | | |
| Investment Income | | | | | | | | |
Dividends | | | | | | | | |
Affiliated issuers | | $ | 881,330 | | | | | |
Unaffiliated issuers (net of foreign taxes withheld of $15,209) | | | 488,025 | | | | | |
Interest (net of foreign taxes withheld of $600) | | | 272,112 | | | | | |
Securities lending income | | | 17,345 | | | $ | 1,658,812 | |
| | | | | | | | |
| Expenses | | | | | | | | |
Advisory fee (see Note B) | | | 421,445 | | | | | |
Distribution fee—Class A | | | 164,088 | | | | | |
Distribution fee—Class C | | | 50,366 | | | | | |
Distribution fee—Class R | | | 10,916 | | | | | |
Distribution fee—Class K | | | 2,774 | | | | | |
Transfer agency—Class A | | | 68,274 | | | | | |
Transfer agency—Class C | | | 5,416 | | | | | |
Transfer agency—Advisor Class | | | 2,745 | | | | | |
Transfer agency—Class R | | | 5,677 | | | | | |
Transfer agency—Class K | | | 2,219 | | | | | |
Transfer agency—Class I | | | 24 | | | | | |
Custody and accounting | | | 142,473 | | | | | |
Registration fees | | | 47,291 | | | | | |
Audit and tax | | | 39,603 | | | | | |
Printing | | | 22,656 | | | | | |
Legal | | | 16,316 | | | | | |
Trustees’ fees | | | 9,761 | | | | | |
Miscellaneous | | | 21,017 | | | | | |
| | | | | | | | |
Total expenses | | | 1,033,061 | | | | | |
Less: expenses waived and reimbursed by the Adviser (see Notes B & E) | | | (92,790 | ) | | | | |
| | | | | | | | |
Net expenses | | | | | | | 940,271 | |
| | | | | | | | |
Net investment income | | | | | | | 718,541 | |
| | | | | | | | |
See notes to financial statements.
| | |
| |
| abfunds.com | | AB CONSERVATIVE WEALTH STRATEGY | 65 |
STATEMENT OF OPERATIONS (continued)
| | | | | | | | |
| Realized and Unrealized Gain (Loss) on Investment and Foreign Currency Transactions | | | | | | | | |
Net realized gain (loss) on: | | | | | | | | |
Affiliated Underlying Portfolios | | | | | | $ | (1,004,064 | ) |
Investment transactions(a) | | | | | | | 8,748,572 | |
Forward currency exchange contracts | | | | | | | (564,542 | ) |
Futures | | | | | | | (3,318,056 | ) |
Swaps | | | | | | | 1,017,427 | |
Swaptions written | | | | | | | 16,830 | |
Foreign currency transactions | | | | | | | 460,674 | |
Net change in unrealized appreciation/depreciation of: | | | | | | | | |
Affiliated Underlying Portfolios | | | | | | | 2,517,479 | |
Investments(b) | | | | | | | (1,646,141 | ) |
Forward currency exchange contracts | | | | | | | 582,612 | |
Futures | | | | | | | 2,934,457 | |
Swaps | | | | | | | (893,349 | ) |
Swaptions written | | | | | | | (2,830 | ) |
Foreign currency denominated assets and liabilities | | | | | | | (14,224 | ) |
| | | | | | | | |
Net gain on investment and foreign currency transactions | | | | | | | 8,834,845 | |
| | | | | | | | |
Net Increase in Net Assets from Operations | | | | | | $ | 9,553,386 | |
| | | | | | | | |
| (a) | Net of foreign capital gains taxes of $727. |
| (b) | Net of decrease in accrued foreign capital gains taxes of $3,246. |
See notes to financial statements.
| | |
| |
66 | AB CONSERVATIVE WEALTH STRATEGY | | abfunds.com |
STATEMENT OF CHANGES IN NET ASSETS
| | | | | | | | |
| | | Six Months Ended
February 28, 2021
(unaudited) | | | Year Ended
August 31,
2020 | |
| Increase (Decrease) in Net Assets from Operations | | | | | | | | |
Net investment income | | $ | 718,541 | | | $ | 1,754,980 | |
Net realized gain (loss) on investment and foreign currency transactions | | | 5,356,841 | | | | (3,635,193 | ) |
Net realized gain distributions from Affiliated Underlying Portfolios | | | – 0 | – | | | 46,863 | |
Net change in unrealized appreciation/depreciation of investments and foreign currency denominated assets and liabilities | | | 3,478,004 | | | | 3,952,736 | |
Contributions from Affiliates (see Note B) | | | – 0 | – | | | 2,404 | |
| | | | | | | | |
Net increase in net assets from operations | | | 9,553,386 | | | | 2,121,790 | |
Distributions to Shareholders | | | | | | | | |
Class A | | | (4,585,056 | ) | | | (4,906,979 | ) |
Class C | | | (264,659 | ) | | | (380,447 | ) |
Advisor Class | | | (198,708 | ) | | | (234,606 | ) |
Class R | | | (137,730 | ) | | | (135,975 | ) |
Class K | | | (61,098 | ) | | | (192,175 | ) |
Class I | | | (1,500 | ) | | | (1,234 | ) |
| Transactions in Shares of Beneficial Interest | | | | | | | | |
Net decrease | | | (6,478,124 | ) | | | (18,377,337 | ) |
Proceeds from third party vendor (see Note F) | | | – 0 | – | | | 2,403 | |
| | | | | | | | |
Total decrease | | | (2,173,489 | ) | | | (22,104,560 | ) |
| Net Assets | | | | | | | | |
Beginning of period | | | 155,515,939 | | | | 177,620,499 | |
| | | | | | | | |
End of period | | $ | 153,342,450 | | | $ | 155,515,939 | |
| | | | | | | | |
See notes to financial statements.
| | |
| |
| abfunds.com | | AB CONSERVATIVE WEALTH STRATEGY | 67 |
NOTES TO FINANCIAL STATEMENTS
February 28, 2021 (unaudited)
NOTE A
Significant Accounting Policies
The AB Portfolios (the “Company”) is registered under the Investment Company Act of 1940 as a diversified, open end management investment company. The Company, which is a Massachusetts Business Trust, operates as a series company currently comprised of six series. Each series is considered to be a separate entity for financial reporting and tax purposes. This report relates only to the AB Conservative Wealth Strategy (the “Fund”). The Fund offers Class A, Class C, Advisor Class, Class R, Class K and Class I shares. Class B and Class T shares have been authorized but currently are not offered. Effective August 2, 2019, sales of Class B shares were suspended. On November 7, 2019, all remaining outstanding Class B shares of the Fund were converted to Class A shares. Class A shares are sold with a front-end sales charge of up to 4.25% for purchases not exceeding $1,000,000. With respect to purchases of $1,000,000 or more, Class A shares redeemed within one year of purchase may be subject to a contingent deferred sales charge of 1%. Class C shares are subject to a contingent deferred sales charge of 1% on redemptions made within the first year after purchase, and 0% after the first year of purchase. Class C shares will automatically convert to Class A shares ten years after the end of the calendar month of purchase. Class R and Class K shares are sold without an initial or contingent deferred sales charge. Advisor Class and Class I shares are sold without an initial or contingent deferred sales charge and are not subject to ongoing distribution expenses. All eight classes of shares have identical voting, dividend, liquidation and other rights, except that the classes bear different distribution and transfer agency expenses. Each class has exclusive voting rights with respect to its distribution plan. The financial statements have been prepared in conformity with U.S. generally accepted accounting principles (“U.S. GAAP”), which require management to make certain estimates and assumptions that affect the reported amounts of assets and liabilities in the financial statements and amounts of income and expenses during the reporting period. Actual results could differ from those estimates. The Fund is an investment company under U.S. GAAP and follows the accounting and reporting guidance applicable to investment companies. The following is a summary of significant accounting policies followed by the Fund.
1. Security Valuation
Portfolio securities are valued at their current market value determined on the basis of market quotations or, if market quotations are not readily available or are deemed unreliable, at “fair value” as determined in accordance with procedures established by and under the general supervision of the Company’s Board of Trustees (the “Board”).
| | |
| |
68 | AB CONSERVATIVE WEALTH STRATEGY | | abfunds.com |
NOTES TO FINANCIAL STATEMENTS (continued)
In general, the market values of securities which are readily available and deemed reliable are determined as follows: securities listed on a national securities exchange (other than securities listed on the NASDAQ Stock Market, Inc. (“NASDAQ”)) or on a foreign securities exchange are valued at the last sale price at the close of the exchange or foreign securities exchange. If there has been no sale on such day, the securities are valued at the last traded price from the previous day. Securities listed on more than one exchange are valued by reference to the principal exchange on which the securities are traded; securities listed only on NASDAQ are valued in accordance with the NASDAQ Official Closing Price; listed or over the counter (“OTC”) market put or call options are valued at the mid level between the current bid and ask prices. If either a current bid or current ask price is unavailable, AllianceBernstein L.P. (the “Adviser”) will have discretion to determine the best valuation (e.g., last trade price in the case of listed options); open futures are valued using the closing settlement price or, in the absence of such a price, the most recent quoted bid price. If there are no quotations available for the day of valuation, the last available closing settlement price is used; U.S. Government securities and any other debt instruments having 60 days or less remaining until maturity are generally valued at market by an independent pricing vendor, if a market price is available. If a market price is not available, the securities are valued at amortized cost. This methodology is commonly used for short term securities that have an original maturity of 60 days or less, as well as short term securities that had an original term to maturity that exceeded 60 days. In instances when amortized cost is utilized, the Valuation Committee (the “Committee”) must reasonably conclude that the utilization of amortized cost is approximately the same as the fair value of the security. Such factors the Committee will consider include, but are not limited to, an impairment of the creditworthiness of the issuer or material changes in interest rates. Fixed-income securities, including mortgage-backed and asset-backed securities, may be valued on the basis of prices provided by a pricing service or at a price obtained from one or more of the major broker-dealers. In cases where broker-dealer quotes are obtained, the Adviser may establish procedures whereby changes in market yields or spreads are used to adjust, on a daily basis, a recently obtained quoted price on a security. Swaps and other derivatives are valued daily, primarily using independent pricing services, independent pricing models using market inputs, as well as third party broker-dealers or counterparties. Open-end mutual funds are valued at the closing net asset value per share, while exchange traded funds are valued at the closing market price per share.
Securities for which market quotations are not readily available (including restricted securities) or are deemed unreliable are valued at fair value as deemed appropriate by the Adviser. Factors considered in making this determination may include, but are not limited to, information obtained by
| | |
| |
| abfunds.com | | AB CONSERVATIVE WEALTH STRATEGY | 69 |
NOTES TO FINANCIAL STATEMENTS (continued)
contacting the issuer, analysts, analysis of the issuer’s financial statements or other available documents. In addition, the Fund may use fair value pricing for securities primarily traded in non-U.S. markets because most foreign markets close well before the Fund values its securities at 4:00 p.m., Eastern Time. The earlier close of these foreign markets gives rise to the possibility that significant events, including broad market moves, may have occurred in the interim and may materially affect the value of those securities. To account for this, the Fund generally values many of its foreign equity securities using fair value prices based on third party vendor modeling tools to the extent available.
2. Fair Value Measurements
In accordance with U.S. GAAP regarding fair value measurements, fair value is defined as the price that the Fund would receive to sell an asset or pay to transfer a liability in an orderly transaction between market participants at the measurement date. U.S. GAAP establishes a framework for measuring fair value, and a three-level hierarchy for fair value measurements based upon the transparency of inputs to the valuation of an asset or liability (including those valued based on their market values as described in Note A.1 above). Inputs may be observable or unobservable and refer broadly to the assumptions that market participants would use in pricing the asset or liability. Observable inputs reflect the assumptions market participants would use in pricing the asset or liability based on market data obtained from sources independent of the Fund. Unobservable inputs reflect the Fund’s own assumptions about the assumptions that market participants would use in pricing the asset or liability based on the best information available in the circumstances. Each investment is assigned a level based upon the observability of the inputs which are significant to the overall valuation. The three-tier hierarchy of inputs is summarized below.
| | • | | Level 1—quoted prices in active markets for identical investments |
| | • | | Level 2—other significant observable inputs (including quoted prices for similar investments, interest rates, prepayment speeds, credit risk, etc.) |
| | • | | Level 3—significant unobservable inputs (including the Fund’s own assumptions in determining the fair value of investments) |
The fair value of debt instruments, such as bonds, and over-the-counter derivatives is generally based on market price quotations, recently executed market transactions (where observable) or industry recognized modeling techniques and are generally classified as Level 2. Pricing vendor inputs to Level 2 valuations may include quoted prices for similar investments in active markets, interest rate curves, coupon rates, currency rates, yield curves, option adjusted spreads, default rates, credit spreads and other unique security features in order to estimate the relevant cash flows which are then discounted to calculate fair values. If these inputs are unobservable and significant to the fair value, these investments will be classified as Level 3.
| | |
| |
70 | AB CONSERVATIVE WEALTH STRATEGY | | abfunds.com |
NOTES TO FINANCIAL STATEMENTS (continued)
Where readily available market prices or relevant bid prices are not available for certain equity investments, such investments may be valued based on similar publicly traded investments, movements in relevant indices since last available prices or based upon underlying company fundamentals and comparable company data (such as multiples to earnings or other multiples to equity). Where an investment is valued using an observable input, such as another publicly traded security, the investment will be classified as Level 2. If management determines that an adjustment is appropriate based on restrictions on resale, illiquidity or uncertainty, and such adjustment is a significant component of the valuation, the investment will be classified as Level 3. An investment will also be classified as Level 3 where management uses company fundamentals and other significant inputs to determine the valuation.
Options are valued using market-based inputs to models, broker or dealer quotations, or alternative pricing sources with reasonable levels of price transparency, where such inputs and models are available. Alternatively, the values may be obtained through unobservable management determined inputs and/or management’s proprietary models. Where models are used, the selection of a particular model to value an option depends upon the contractual terms of, and specific risks inherent in, the option as well as the availability of pricing information in the market. Valuation models require a variety of inputs, including contractual terms, market prices, measures of volatility and correlations of such inputs. Exchange traded options generally will be classified as Level 2. For options that do not trade on exchange but trade in liquid markets, inputs can generally be verified and model selection does not involve significant management judgment. Options are classified within Level 2 on the fair value hierarchy when all of the significant inputs can be corroborated to market evidence. Otherwise such instruments are classified as Level 3.
Valuations of mortgage-backed or other asset-backed securities, by pricing vendors, are based on both proprietary and industry recognized models and discounted cash flow techniques. Significant inputs to the valuation of these instruments are value of the collateral, the rates and timing of delinquencies, the rates and timing of prepayments, and default and loss expectations, which are driven in part by housing prices for residential mortgages. Significant inputs are determined based on relative value analyses, which incorporate comparisons to instruments with similar collateral and risk profiles, including relevant indices. Mortgage and asset-backed securities for which management has collected current observable data through pricing services are generally categorized within Level 2. Those investments for which current observable data has not been provided are classified as Level 3.
| | |
| |
| abfunds.com | | AB CONSERVATIVE WEALTH STRATEGY | 71 |
NOTES TO FINANCIAL STATEMENTS (continued)
Other fixed income investments, including non-U.S. government and corporate debt, are generally valued using quoted market prices, if available, which are typically impacted by current interest rates, maturity dates and any perceived credit risk of the issuer. Additionally, in the absence of quoted market prices, these inputs are used by pricing vendors to derive a valuation based upon industry or proprietary models which incorporate issuer specific data with relevant yield/spread comparisons with more widely quoted bonds with similar key characteristics. Those investments for which there are observable inputs are classified as Level 2. Where the inputs are not observable, the investments are classified as Level 3.
The following table summarizes the valuation of the Fund’s investments by the above fair value hierarchy levels as of February 28, 2021:
| | | | | | | | | | | | | | | | |
Investments in
Securities: | | Level 1 | | | Level 2 | | | Level 3 | | | Total | |
Assets: | |
Common Stocks: | | | | | | | | | | | | | | | | |
Information Technology | | $ | 14,881,480 | | | $ | 2,602,117 | | | $ | – 0 | – | | $ | 17,483,597 | |
Health Care | | | 9,463,210 | | | | 1,970,898 | | | | – 0 | – | | | 11,434,108 | |
Financials | | | 6,523,776 | | | | 2,586,968 | | | | – 0 | – | | | 9,110,744 | |
Consumer Discretionary | | | 6,444,419 | | | | 2,362,151 | | | | – 0 | – | | | 8,806,570 | |
Industrials | | | 4,049,110 | | | | 1,430,794 | | | | – 0 | – | | | 5,479,904 | |
Communication Services | | | 4,398 ,097 | | | | 616,453 | | | | – 0 | – | | | 5,014,550 | |
Consumer Staples | | | 840,712 | | | | 1,270,579 | | | | 0 | (a) | | | 2,111,291 | |
Materials | | | 1,359,463 | | | | 476,705 | | | | – 0 | – | | | 1,836,168 | |
Utilities | | | 807,316 | | | | 319,096 | | | | – 0 | – | | | 1,126,412 | |
Real Estate | | | 649,549 | | | | 196,467 | | | | – 0 | – | | | 846,016 | |
Energy | | | 348,123 | | | | 372,004 | | | | – 0 | – | | | 720,127 | |
Investment Companies | | | 34,230,370 | | | | – 0 | – | | | – 0 | – | | | 34,230,370 | |
Governments – Treasuries | | | – 0 | – | | | 17,545,535 | | | | – 0 | – | | | 17,545,535 | |
Corporates – Investment Grade | | | – 0 | – | | | 7,919,681 | | | | – 0 | – | | | 7,919,681 | |
Mortgage Pass-Throughs | | | – 0 | – | | | 3,483,881 | | | | – 0 | – | | | 3,483,881 | |
Governments – Sovereign Bonds | | | – 0 | – | | | 1,056,843 | | | | – 0 | – | | | 1,056,843 | |
Quasi-Sovereigns | | | – 0 | – | | | 988,011 | | | | – 0 | – | | | 988,011 | |
Commercial Mortgage-Backed Securities | | | – 0 | – | | | 841,941 | | | | – 0 | – | | | 841,941 | |
Inflation-Linked Securities | | | – 0 | – | | | 704,027 | | | | – 0 | – | | | 704,027 | |
Covered Bonds | | | – 0 | – | | | 687,724 | | | | – 0 | – | | | 687,724 | |
Collateralized Mortgage Obligations | | | – 0 | – | | | 651,164 | | | | – 0 | – | | | 651,164 | |
Asset-Backed Securities | | | – 0 | – | | | 617,739 | | | | – 0 | – | | | 617,739 | |
Governments – Sovereign Agencies | | | – 0 | – | | | 566,693 | | | | – 0 | – | | | 566,693 | |
Local Governments – Provincial Bonds | | | – 0 | – | | | 511,499 | | | | – 0 | – | | | 511,499 | |
Collateralized Loan Obligations | | | – 0 | – | | | 500,152 | | | | – 0 | – | | | 500,152 | |
Short-Term Investments | | | 17,134,141 | | | | – 0 | – | | | – 0 | – | | | 17,134,141 | |
Investments of Cash Collateral for Securities Loaned in Affiliated Money Market Fund | | | 1,913,241 | | | | – 0 | – | | | – 0 | – | | | 1,913,241 | |
| | | | | | | | | | | | | | | | |
Total Investments in Securities | | | 103,043,007 | | | | 50,279,122 | | | | – 0 | – | | | 153,322,129 | |
| | |
| |
72 | AB CONSERVATIVE WEALTH STRATEGY | | abfunds.com |
NOTES TO FINANCIAL STATEMENTS (continued)
| | | | | | | | | | | | | | | | |
Investments in
Securities: | | Level 1 | | | Level 2 | | | Level 3 | | | Total | |
Other Financial Instruments(b): | | | | | | | | | | | | | | | | |
Assets: | |
Futures | | $ | 1,056,103 | | | $ | 45,300 | | | $ | – 0 | – | | $ | 1,101,403 | (c) |
Forward Currency Exchange Contracts | | | – 0 | – | | | 788,692 | | | | – 0 | – | | | 788,692 | |
Centrally Cleared Credit Default Swaps | | | – 0 | – | | | 248,760 | | | | – 0 | – | | | 248,760 | (c) |
Centrally Cleared Interest Rate Swaps | | | – 0 | – | | | 310,318 | | | | – 0 | – | | | 310,318 | (c) |
Inflation (CPI) Swaps | | | – 0 | – | | | 290,147 | | | | – 0 | – | | | 290,147 | |
Total Return Swaps | | | – 0 | – | | | 366,300 | | | | – 0 | – | | | 366,300 | |
Variance Swaps | | | – 0 | – | | | 53,442 | | | | – 0 | – | | | 53,442 | |
Liabilities: | |
Futures | | | (505,092 | ) | | | (6,435 | ) | | | – 0 | – | | | (511,527 | )(c) |
Forward Currency Exchange Contracts | | | – 0 | – | | | (608,973 | ) | | | – 0 | – | | | (608,973 | ) |
Centrally Cleared Interest Rate Swaps | | | – 0 | – | | | (446,804 | ) | | | – 0 | – | | | (446,804 | )(c) |
Inflation (CPI) Swaps | | | – 0 | – | | | (9,208 | ) | | | – 0 | – | | | (9,208 | ) |
Total Return Swaps | | | – 0 | – | | | (585,293 | ) | | | – 0 | – | | | (585,293 | ) |
Variance Swaps | | | – 0 | – | | | (161,933 | ) | | | – 0 | – | | | (161,933 | ) |
| | | | | | | | | | | | | | | | |
Total | | $ | 103,594,018 | | | $ | 50,563,435 | | | $ | – 0 | – | | $ | 154,157,453 | |
| | | | | | | | | | | | | | | | |
| (a) | The Fund held securities with zero market value at period end. |
| (b) | Other financial instruments are derivative instruments, such as futures, forwards and swaps, which are valued at the unrealized appreciation/(depreciation) on the instrument. Other financial instruments may also include swaps with upfront premiums, options written and swaptions written which are valued at market value. |
| (c) | Only variation margin receivable/(payable) at period end is reported within the statement of assets and liabilities. This amount reflects cumulative unrealized appreciation/(depreciation) on futures and centrally cleared swaps as reported in the portfolio of investments. Where applicable, centrally cleared swaps with upfront premiums are presented here at market value. |
3. Currency Translation
Assets and liabilities denominated in foreign currencies and commitments under forward currency exchange contracts are translated into U.S. dollars at the mean of the quoted bid and ask prices of such currencies against the U.S. dollar. Purchases and sales of portfolio securities are translated into U.S. dollars at the rates of exchange prevailing when such securities were acquired or sold. Income and expenses are translated into U.S. dollars at rates of exchange prevailing when accrued.
Net realized gain or loss on foreign currency transactions represents foreign exchange gains and losses from sales and maturities of foreign fixed income investments, holding of foreign currencies, currency gains or losses realized between the trade and settlement dates on foreign investment transactions, and the difference between the amounts of dividends, interest and foreign withholding taxes recorded on the Fund’s books and the U.S. dollar equivalent amounts actually received or paid. Net unrealized
| | |
| |
| abfunds.com | | AB CONSERVATIVE WEALTH STRATEGY | 73 |
NOTES TO FINANCIAL STATEMENTS (continued)
currency gains and losses from valuing foreign currency denominated assets and liabilities at period end exchange rates are reflected as a component of net unrealized appreciation or depreciation of foreign currency denominated assets and liabilities.
4. Taxes
It is the Fund’s policy to meet the requirements of the Internal Revenue Code applicable to regulated investment companies and to distribute all of its investment company taxable income and net realized gains, if any, to shareholders. Therefore, no provisions for federal income or excise taxes are required. The Fund may be subject to taxes imposed by countries in which it invests. Such taxes are generally based on income and/or capital gains earned or repatriated. Taxes are accrued and applied to net investment income, net realized gains and net unrealized appreciation/depreciation as such income and/or gains are earned.
In accordance with U.S. GAAP requirements regarding accounting for uncertainties in income taxes, management has analyzed the Fund’s tax positions taken or expected to be taken on federal and state income tax returns for all open tax years (the current and the prior three tax years) and has concluded that no provision for income tax is required in the Fund’s financial statements.
5. Investment Income and Investment Transactions
Dividend income is recorded on the ex-dividend date or as soon as the Fund is informed of the dividend. Interest income is accrued daily. Investment transactions are accounted for on the date the securities are purchased or sold. Investment gains or losses are determined on the identified cost basis. The Fund amortizes premiums and accretes discounts as adjustments to interest income. The Fund accounts for distributions received from REIT investments or from regulated investment companies as dividend income, realized gain, or return of capital based on information provided by the REIT or the investment company.
6. Class Allocations
All income earned and expenses incurred by the Fund are borne on a pro-rata basis by each outstanding class of shares, based on the proportionate interest in the Fund represented by the net assets of such class, except for class specific expenses which are allocated to the respective class. Expenses of the Company are charged proportionately to each series or based on other appropriate methods. Realized and unrealized gains and losses are allocated among the various share classes based on respective net assets.
| | |
| |
74 | AB CONSERVATIVE WEALTH STRATEGY | | abfunds.com |
NOTES TO FINANCIAL STATEMENTS (continued)
7. Dividends and Distributions
Dividends and distributions to shareholders, if any, are recorded on the ex-dividend date. Income dividends and capital gains distributions are determined in accordance with federal tax regulations and may differ from those determined in accordance with U.S. GAAP. To the extent these differences are permanent, such amounts are reclassified within the capital accounts based on their federal tax basis treatment; temporary differences do not require such reclassification.
NOTE B
Advisory Fee and Other Transactions with Affiliates
Under the terms of the investment advisory agreement (the “Advisory Agreement”), the Fund pays the Adviser an advisory fee at an annual rate of .55% of the first $2.5 billion, .45% of the next $2.5 billion and .40% in excess of $5 billion of the Fund’s average daily net assets. The fee is accrued daily and paid monthly.
The Fund compensates AllianceBernstein Investor Services, Inc. (“ABIS”), a wholly-owned subsidiary of the Adviser, under a Transfer Agency Agreement for providing personnel and facilities to perform transfer agency services for the Fund. ABIS may make payments to intermediaries that provide omnibus account services, sub-accounting services and/or networking services. Such compensation retained by ABIS amounted to $24,850 for the six months ended February 28, 2021.
AllianceBernstein Investments, Inc. (the “Distributor”), a wholly-owned subsidiary of the Adviser, serves as the distributor of the Fund’s shares. The Distributor has advised the Fund that it has retained front-end sales charges of $429 from the sale of Class A shares and received $499 and $306 in contingent deferred sales charges imposed upon redemptions by shareholders of Class A and Class C shares, respectively, for the six months ended February 28, 2021.
The Fund may invest in AB Government Money Market Portfolio (the “Government Money Market Portfolio”) which has a contractual annual advisory fee rate of .20% of the portfolio’s average daily net assets and bears its own expenses. The Adviser has contractually agreed to waive .10% of the advisory fee of Government Money Market Portfolio (resulting in a net advisory fee of .10%) until August 31, 2021. In connection with the investment by the Fund in Government Money Market Portfolio, the Adviser has contractually agreed to waive its advisory fee from the Fund in an amount equal to the Fund’s pro rata share of the effective advisory fee of Government Money Market Portfolio, as borne indirectly by the Fund as an acquired fund fee and expense. For the six months ended February 28, 2021, such waiver amounted to $5,597.
| | |
| |
| abfunds.com | | AB CONSERVATIVE WEALTH STRATEGY | 75 |
NOTES TO FINANCIAL STATEMENTS (continued)
In connection with the Fund’s investments in other AB mutual funds, the Adviser has contractually agreed to waive fees and/or reimburse the expenses payable to the Adviser by the Fund in an amount equal to the Fund’s pro rata share of the effective advisory fees of AB mutual funds, as paid by the Fund as an acquired fund fee and expense. These fee waivers and/or expense reimbursements will remain in effect until December 31, 2021. For the six months ended February 28, 2021, such waivers and/or reimbursements amounted to $86,997.
A summary of the Fund’s transactions in AB mutual funds for the six months ended February 28, 2021 is as follows:
| | | | | | | | | | | | | | | | | | | | | | | | | | | | | | | | |
| | | | | | | | | | | | | | | | | | | | | Distributions | |
| Fund | | Market
Value
8/31/20
(000) | | | Purchases
at Cost
(000) | | | Sales
Proceeds
(000) | | | Realized
Gain
(Loss)
(000) | | | Change in
Unrealized
Appr./
(Depr.)
(000) | | | Market
Value
2/28/21
(000) | | | Dividend
Income
(000) | | | Realized
Gains
(000) | |
Government Money Market Portfolio | | $ | 6,038 | | | $ | 45,409 | | | $ | 34,313 | | | $ | – 0 | – | | $ | – 0 | – | | $ | 17,134 | | | $ | 2 | | | $ | – 0 | – |
AB Bond Fund, Inc. – AB All Market Real Return Portfolio | | | 19,081 | | | | 370 | | | | 8,480 | | | | (631 | ) | | | 1,464 | | | | 11,804 | | | | 370 | | | | – 0 | – |
AB High Income Fund, Inc. | | | 17,239 | | | | 521 | | | | 2,640 | | | | (373 | ) | | | 1,053 | | | | 15,800 | | | | 509 | | | | – 0 | – |
Government Money Market Portfolio* | | | 1,821 | | | | 21,242 | | | | 21,150 | | | | – 0 | – | | | – 0 | – | | | 1,913 | | | | 0 | ** | | | – 0 | – |
| | | | | | | | | | | | | | | | | | | | | | | | | | | | | | | | |
Total | | | | | | | | | | | | | | $ | (1,004 | ) | | $ | 2,517 | | | $ | 46,651 | | | $ | 881 | | | $ | – 0 | – |
| | | | | | | | | | | | | | | | | | | | | | | | | | | | | | | | |
| * | Investments of cash collateral for securities lending transactions (see Note E). |
| ** | Amount is less than $500. |
During the year ended August 31, 2020, the Adviser reimbursed the Fund $2,404 for trading losses incurred due to a trade entry error.
During the second quarter of 2018, AXA S.A. (“AXA”), a French holding company for the AXA Group, completed the sale of a minority stake in its subsidiary, AXA Equitable Holdings, Inc. (now named Equitable Holdings, Inc.)(“Equitable”), through an initial public offering. Equitable is the holding company for a diverse group of financial services companies, including an approximate 65% economic interest in the Adviser and a 100% interest in AllianceBernstein Corporation, the general partner of the Adviser. Since the
| | |
| |
76 | AB CONSERVATIVE WEALTH STRATEGY | | abfunds.com |
NOTES TO FINANCIAL STATEMENTS (continued)
initial sale, AXA has completed additional offerings, most recently during the fourth quarter of 2019. As a result, AXA currently owns less than 10% of the outstanding shares of common stock of Equitable, and no longer owns a controlling interest in Equitable. AXA previously announced its intention to sell its entire interest in Equitable over time, subject to market conditions and other factors (the “Plan”). Most of AXA’s remaining Equitable shares are to be delivered on redemption of AXA bonds mandatorily exchangeable into Equitable shares and maturing in May 2021. AXA retains sole discretion to determine the timing of any future sales of its remaining shares of Equitable common stock.
Sales under the Plan that were completed on November 13, 2019 resulted in the indirect transfer of a “controlling block” of voting securities of the Adviser (a “Change of Control Event”) and may have been deemed to have been an “assignment” causing a termination of the Fund’s investment advisory and administration agreements. In order to ensure that investment advisory and administration services could continue uninterrupted in the event of a Change of Control Event, the Board previously approved new investment advisory and administration agreements with the Adviser, and shareholders of the Fund subsequently approved the new investment advisory agreement. These agreements became effective on November 13, 2019.
NOTE C
Distribution Plan
The Fund has adopted a Plan for each class of shares of the Fund pursuant to Rule 12b-1 under the Investment Company Act of 1940 (the “Plan”). Under the Plan, the Fund pays distribution and servicing fees to the Distributor at an annual rate of up to .50% of the Fund’s average daily net assets attributable to Class A shares, 1% of the Fund’s average daily net assets attributable to Class C shares, .50% of the Fund’s average daily net assets attributable to Class R shares and .25% of the Fund’s average daily net assets attributable to Class K shares. There are no distribution and servicing fees on the Advisor Class and Class I shares. The fees are accrued daily and paid monthly. Payments under the Plan in respect of Class A shares are currently limited to an annual rate of .25% of Class A shares’ average daily net assets. The Plan provides that the Distributor will use such payments in their entirety for distribution assistance and promotional activities. The Fund is not obligated under the Plan to pay any distribution services fee in excess of the amounts set forth above. The purpose of the payments to the Distributor under the Plan is to compensate the Distributor for its distribution services with respect to the sale of the Fund’s shares. Since the Distributor’s compensation is not directly tied to its expenses, the amount of compensation received by it under the Plan during any year may be more or less than its actual expenses. For this reason, the Plan is characterized by the staff of the Securities and Exchange Commission as being of the “compensation” plan.
| | |
| |
| abfunds.com | | AB CONSERVATIVE WEALTH STRATEGY | 77 |
NOTES TO FINANCIAL STATEMENTS (continued)
In the event that the Plan is terminated or not continued, no distribution services fees (other than current amounts accrued but not yet paid) would be owed by the Fund to the Distributor with respect to the relevant class. The Plan also provides that the Adviser may use its own resources to finance the distribution of the Fund’s shares.
NOTE D
Investment Transactions
Purchases and sales of investment securities (excluding short-term investments) for the six months ended February 28, 2021 were as follows:
| | | | | | | | |
| | | Purchases | | | Sales | |
Investment securities (excluding
U.S. government securities) | | $ | 60,767,401 | | | $ | 81,084,173 | |
U.S. government securities | | | 22,268,428 | | | | 20,806,981 | |
The cost of investments for federal income tax purposes was substantially the same as the cost for financial reporting purposes. Accordingly, gross unrealized appreciation and unrealized depreciation are as follows:
| | | | |
Gross unrealized appreciation | | $ | 19,185,439 | |
Gross unrealized depreciation | | | (4,427,464 | ) |
| | | | |
Net unrealized appreciation | | $ | 14,757,975 | |
| | | | |
1. Derivative Financial Instruments
The Fund may use derivatives in an effort to earn income and enhance returns, to replace more traditional direct investments, to obtain exposure to otherwise inaccessible markets (collectively, “investment purposes”), or to hedge or adjust the risk profile of its portfolio.
The principal types of derivatives utilized by the Fund, as well as the methods in which they may be used are:
The Fund may buy or sell futures for investment purposes or for the purpose of hedging its portfolio against adverse effects of potential movements in the market. The Fund bears the market risk that arises from changes in the value of these instruments and the imperfect correlation between movements in the price of the futures and movements in the price of the assets, reference rates or indices which they are designed to track. Among other things, the Fund may purchase or sell futures for foreign currencies or options thereon for non-hedging purposes as a means of making direct investment in foreign currencies, as described below under “Currency Transactions”.
| | |
| |
78 | AB CONSERVATIVE WEALTH STRATEGY | | abfunds.com |
NOTES TO FINANCIAL STATEMENTS (continued)
At the time the Fund enters into futures, the Fund deposits and maintains as collateral an initial margin with the broker, as required by the exchange on which the transaction is effected. Such amount is shown as cash collateral due from broker on the statement of assets and liabilities. Pursuant to the contract, the Fund agrees to receive from or pay to the broker an amount of cash equal to the daily fluctuation in the value of the contract. Such receipts or payments are known as variation margin and are recorded by the Fund as unrealized gains or losses. Risks may arise from the potential inability of a counterparty to meet the terms of the contract. The credit/counterparty risk for exchange-traded futures is generally less than privately negotiated futures, since the clearinghouse, which is the issuer or counterparty to each exchange-traded future, has robust risk mitigation standards, including the requirement to provide initial and variation margin. When the contract is closed, the Fund records a realized gain or loss equal to the difference between the value of the contract at the time it was opened and the time it was closed.
Use of long futures subjects the Fund to risk of loss in excess of the amounts shown on the statement of assets and liabilities, up to the notional value of the futures. Use of short futures subjects the Fund to unlimited risk of loss. Under some circumstances, futures exchanges may establish daily limits on the amount that the price of futures can vary from the previous day’s settlement price, which could effectively prevent liquidation of unfavorable positions.
During the six months ended February 28, 2021, the Fund held futures for hedging and non-hedging purposes.
| | • | | Forward Currency Exchange Contracts |
The Fund may enter into forward currency exchange contracts in order to hedge its exposure to changes in foreign currency exchange rates on its foreign portfolio holdings, to hedge certain firm purchase and sale commitments denominated in foreign currencies and for non-hedging purposes as a means of making direct investments in foreign currencies, as described below under “Currency Transactions”.
A forward currency exchange contract is a commitment to purchase or sell a foreign currency at a future date at a negotiated forward rate. The gain or loss arising from the difference between the original contract and the closing of such contract would be included in net realized gain or loss on forward currency exchange contracts. Fluctuations in the value of open forward currency exchange contracts are recorded for financial reporting purposes as unrealized appreciation and/or depreciation by the Fund. Risks may arise from the potential inability of a counterparty to meet the terms of a contract and from unanticipated movements in the value of a foreign currency relative to the U.S. dollar.
| | |
| |
| abfunds.com | | AB CONSERVATIVE WEALTH STRATEGY | 79 |
NOTES TO FINANCIAL STATEMENTS (continued)
During the six months ended February 28, 2021, the Fund held forward currency exchange contracts for hedging and non-hedging purposes.
For hedging and investment purposes, the Fund may purchase and write (sell) put and call options on U.S. and foreign securities, including government securities, and foreign currencies that are traded on U.S. and foreign securities exchanges and over-the-counter markets. Among other things, the Fund may use options transactions for non-hedging purposes as a means of making direct investments in foreign currencies, as described below under “Currency Transactions” and may use options strategies involving the purchase and/or writing of various combinations of call and/or put options, for hedging and investment purposes.
The risk associated with purchasing an option is that the Fund pays a premium whether or not the option is exercised. Additionally, the Fund bears the risk of loss of the premium and change in market value should the counterparty not perform under the contract. If a put or call option purchased by the Fund were permitted to expire without being sold or exercised, its premium would represent a loss to the Fund. Put and call options purchased are accounted for in the same manner as portfolio securities. The cost of securities acquired through the exercise of call options is increased by premiums paid. The proceeds from securities sold through the exercise of put options are decreased by the premiums paid.
When the Fund writes an option, the premium received by the Fund is recorded as a liability and is subsequently adjusted to the current market value of the option written. The Fund’s maximum payment for written put options equates to the number of shares multiplied by the strike price. In certain circumstances maximum payout amounts may be partially offset by recovery values of the respective referenced assets and upfront premium received upon entering into the contract. Premiums received from written options which expire unexercised are recorded by the Fund on the expiration date as realized gains from options written. The difference between the premium received and the amount paid on effecting a closing purchase transaction, including brokerage commissions, is also treated as a realized gain, or if the premium received is less than the amount paid for the closing purchase transaction, as a realized loss. If a call option is exercised, the premium received is added to the proceeds from the sale of the underlying security or currency in determining whether the Fund has realized a gain or loss. If a put option is exercised, the premium received reduces the cost basis of the security or currency purchased
| | |
| |
80 | AB CONSERVATIVE WEALTH STRATEGY | | abfunds.com |
NOTES TO FINANCIAL STATEMENTS (continued)
by the Fund. In writing an option, the Fund bears the market risk of an unfavorable change in the price of the security or currency underlying the written option. Exercise of an option written by the Fund could result in the Fund selling or buying a security or currency at a price different from the current market value.
The Fund may also invest in options on swap agreements, also called “swaptions”. A swaption is an option that gives the buyer the right, but not the obligation, to enter into a swap on a future date in exchange for paying a market-based “premium”. A receiver swaption gives the owner the right to receive the total return of a specified asset, reference rate, or index. A payer swaption gives the owner the right to pay the total return on a specified asset, reference rate, or index. Swaptions also include options that allow an existing swap to be terminated or extended by one of the counterparties. The Fund’s maximum payment for written put swaptions equates to the notional amount of the underlying swap. In certain circumstances maximum payout amounts may be partially offset by recovery values of the respective referenced assets and upfront premium received upon entering into the contract.
During the six months ended February 28, 2021, the Fund held written options for hedging and non-hedging purposes. During the six months ended February 28, 2021, the Fund held written swaptions for hedging and non-hedging purposes.
The Fund may enter into swaps to hedge its exposure to interest rates, credit risk, equity markets or currencies. The Fund may also enter into swaps for non-hedging purposes as a means of gaining market exposures, making direct investments in foreign currencies, as described below under “Currency Transactions” or in order to take a “long” or “short” position with respect to an underlying referenced asset described below under “Total Return Swaps”.
A swap is an agreement that obligates two parties to exchange a series of cash flows at specified intervals based upon or calculated by reference to changes in specified prices or rates for a specified amount of an underlying asset. The payment flows are usually netted against each other, with the difference being paid by one party to the other. In addition, collateral may be pledged or received by the Fund in accordance with the terms of the respective swaps to provide value and recourse to the Fund or its counterparties in the event of default, bankruptcy or insolvency by one of the parties to the swap.
Risks may arise as a result of the failure of the counterparty to the swap to comply with the terms of the swap. The loss incurred by the
| | |
| |
| abfunds.com | | AB CONSERVATIVE WEALTH STRATEGY | 81 |
NOTES TO FINANCIAL STATEMENTS (continued)
failure of a counterparty is generally limited to the net interim payment to be received by the Fund, and/or the termination value at the end of the contract. Therefore, the Fund considers the creditworthiness of each counterparty to a swap in evaluating potential counterparty risk. This risk is mitigated by having a netting arrangement between the Fund and the counterparty and by the posting of collateral by the counterparty to the Fund to cover the Fund’s exposure to the counterparty. Additionally, risks may arise from unanticipated movements in interest rates or in the value of the underlying securities. The Fund accrues for the interim payments on swaps on a daily basis, with the net amount recorded within unrealized appreciation/depreciation of swaps on the statement of assets and liabilities, where applicable. Once the interim payments are settled in cash, the net amount is recorded as realized gain/(loss) on swaps on the statement of operations, in addition to any realized gain/(loss) recorded upon the termination of swaps. Upfront premiums paid or received for over the counter (“OTC”) swaps are recognized as cost or proceeds on the statement of assets and liabilities and are amortized on a straight line basis over the life of the contract. Amortized upfront premiums are included in net realized gain/(loss) from swaps on the statement of operations. Fluctuations in the value of swaps are recorded as a component of net change in unrealized appreciation/depreciation of swaps on the statement of operations.
Certain standardized swaps, including certain interest rate swaps and credit default swaps, are (or soon will be) subject to mandatory central clearing. Cleared swaps are transacted through futures commission merchants (“FCMs”) that are members of central clearinghouses, with the clearinghouse serving as central counterparty, similar to transactions in futures contracts. Centralized clearing will be required for additional categories of swaps on a phased-in basis based on requirements published by the Securities and Exchange Commission and Commodity Futures Trading Commission.
At the time the Fund enters into a centrally cleared swap, the Fund deposits and maintains as collateral an initial margin with the broker, as required by the clearinghouse on which the transaction is effected. Such amount is shown as cash collateral due from broker on the statement of assets and liabilities. Pursuant to the contract, the Fund agrees to receive from or pay to the broker an amount of cash equal to the daily fluctuation in the value of the contract. Such receipts or payments are known as variation margin and are recorded by the Fund as unrealized gains or losses. Risks may arise from the potential inability of a counterparty to meet the terms of the contract. The credit/counterparty risk for centrally cleared swaps is generally less than non-centrally cleared swaps, since the clearinghouse, which is
| | |
| |
82 | AB CONSERVATIVE WEALTH STRATEGY | | abfunds.com |
NOTES TO FINANCIAL STATEMENTS (continued)
the issuer or counterparty to each centrally cleared swap, has robust risk mitigation standards, including the requirement to provide initial and variation margin. When the contract is closed, the Fund records a realized gain or loss equal to the difference between the value of the contract at the time it was opened and the time it was closed.
Interest Rate Swaps:
The Fund is subject to interest rate risk exposure in the normal course of pursuing its investment objectives. Because the Fund holds fixed rate bonds, the value of these bonds may decrease if interest rates rise. To help hedge against this risk and to maintain its ability to generate income at prevailing market rates, the Fund may enter into interest rate swaps. Interest rate swaps are agreements between two parties to exchange cash flows based on a notional amount. The Fund may elect to pay a fixed rate and receive a floating rate, or, receive a fixed rate and pay a floating rate on a notional amount.
In addition, the Fund may also enter into interest rate swap transactions to preserve a return or spread on a particular investment or portion of its portfolio, or protecting against an increase in the price of securities the Fund anticipates purchasing at a later date. Interest rate swaps involve the exchange by a Fund with another party of their respective commitments to pay or receive interest (e.g., an exchange of floating rate payments for fixed rate payments) computed based on a contractually-based principal (or “notional”) amount. Interest rate swaps are entered into on a net basis (i.e., the two payment streams are netted out, with the Fund receiving or paying, as the case may be, only the net amount of the two payments).
During the six months ended February 28, 2021, the Fund held interest rate swaps for hedging and non-hedging purposes.
Inflation (CPI) Swaps:
Inflation swap agreements are contracts in which one party agrees to pay the cumulative percentage increase in a price index (the Consumer Price Index with respect to CPI swaps) over the term of the swap (with some lag on the inflation index), and the other pays a compounded fixed rate. Inflation swaps may be used to protect the net asset value, or NAV, of a Fund against an unexpected change in the rate of inflation measured by an inflation index since the value of these agreements is expected to increase if there are unexpected inflation increases.
During the six months ended February 28, 2021, the Fund held inflation (CPI) swaps for hedging and non-hedging purposes.
| | |
| |
| abfunds.com | | AB CONSERVATIVE WEALTH STRATEGY | 83 |
NOTES TO FINANCIAL STATEMENTS (continued)
Credit Default Swaps:
The Fund may enter into credit default swaps, including to manage its exposure to the market or certain sectors of the market, to reduce its risk exposure to defaults by corporate and sovereign issuers held by the Fund, or to create exposure to corporate or sovereign issuers to which it is not otherwise exposed. The Fund may purchase credit protection (“Buy Contract”) or provide credit protection (“Sale Contract”) on the referenced obligation of the credit default swap. During the term of the swap, the Fund receives/(pays) fixed payments from/(to) the respective counterparty, calculated at the agreed upon rate applied to the notional amount. If the Fund is a buyer/(seller) of protection and a credit event occurs, as defined under the terms of the swap, the Fund will either (i) receive from the seller/(pay to the buyer) of protection an amount equal to the notional amount of the swap (the “Maximum Payout Amount”) and deliver/(take delivery of) the referenced obligation or (ii) receive/(pay) a net settlement amount in the form of cash or securities equal to the notional amount of the swap less the recovery value of the referenced obligation. In certain circumstances Maximum Payout Amounts may be partially offset by recovery values of the respective referenced obligations, upfront premium received upon entering into the agreement, or net amounts received from settlement of buy protection credit default swaps entered into by the Fund for the same referenced obligations with the same counterparty.
Credit default swaps may involve greater risks than if a Fund had invested in the referenced obligation directly. Credit default swaps are subject to general market risk, liquidity risk, counterparty risk and credit risk. If the Fund is a buyer of protection and no credit event occurs, it will lose the payments it made to its counterparty. If the Fund is a seller of protection and a credit event occurs, the value of the referenced obligation received by the Fund coupled with the periodic payments previously received, may be less than the Maximum Payout Amount it pays to the buyer, resulting in a net loss to the Fund.
Implied credit spreads over U.S. Treasuries of comparable maturity utilized in determining the market value of credit default swaps on issuers as of period end are disclosed in the portfolio of investments. The implied spreads serve as an indicator of the current status of the payment/performance risk and typically reflect the likelihood of default by the issuer of the referenced obligation. The implied credit spread of a particular reference obligation also reflects the cost of buying/selling protection and may reflect upfront payments required to be made to enter into the agreement. Widening credit spreads typically represent a deterioration of the referenced obligation’s credit soundness and greater likelihood of default or other credit event occurring as defined under the terms of the agreement. A credit spread identified as “Defaulted” indicates a credit event has occurred for the referenced obligation.
| | |
| |
84 | AB CONSERVATIVE WEALTH STRATEGY | | abfunds.com |
NOTES TO FINANCIAL STATEMENTS (continued)
During the six months ended February 28, 2021, the Fund held credit default swaps for hedging and non-hedging purposes.
Total Return Swaps:
The Fund may enter into total return swaps in order to take a “long” or “short” position with respect to an underlying referenced asset. The Fund is subject to market price volatility of the underlying referenced asset. A total return swap involves commitments to pay interest in exchange for a market linked return based on a notional amount. To the extent that the total return of the security, group of securities or index underlying the transaction exceeds or falls short of the offsetting interest obligation, the Fund will receive a payment from or make a payment to the counterparty.
During the six months ended February 28, 2021, the Fund held total return swaps for hedging and non-hedging purposes.
Variance Swaps:
The Fund may enter into variance swaps to hedge equity market risk or adjust exposure to the equity markets. Variance swaps are contracts in which two parties agree to exchange cash payments based on the difference between the stated level of variance and the actual variance realized on underlying asset(s) or index(es). Actual “variance” as used here is defined as the sum of the square of the returns on the reference asset(s) or index(es) (which in effect is a measure of its “volatility”) over the length of the contract term. So the parties to a variance swap can be said to exchange actual volatility for a contractually stated rate of volatility.
During the six months ended February 28, 2021, the Fund held variance swaps for hedging and non-hedging purposes.
The Fund typically enters into International Swaps and Derivatives Association, Inc. Master Agreements (“ISDA Master Agreement”) with its OTC derivative contract counterparties in order to, among other things, reduce its credit risk to OTC counterparties. ISDA Master Agreements include provisions for general obligations, representations, collateral and events of default or termination. Under an ISDA Master Agreement, the Fund typically may offset with the OTC counterparty certain derivative financial instruments’ payables and/or receivables with collateral held and/or posted and create one single net payment (close-out netting) in the event of default or termination. In the event of a default by an OTC counterparty, the return of collateral with market value in excess of the Fund’s net liability, held by the defaulting party, may be delayed or denied.
The Fund’s ISDA Master Agreements may contain provisions for early termination of OTC derivative transactions in the event the net assets of the Fund decline below specific levels (“net asset contingent features”). If these levels are triggered, the Fund’s OTC counterparty has the right to
| | |
| |
| abfunds.com | | AB CONSERVATIVE WEALTH STRATEGY | 85 |
NOTES TO FINANCIAL STATEMENTS (continued)
terminate such transaction and require the Fund to pay or receive a settlement amount in connection with the terminated transaction. If OTC derivatives were held at period end, please refer to netting arrangements by the OTC counterparty table below for additional details.
During the six months ended February 28, 2021, the Fund had entered into the following derivatives:
| | | | | | | | | | | | |
| | | Asset Derivatives | | | Liability Derivatives | |
Derivative Type | | Statement of
Assets and
Liabilities
Location | | Fair Value | | | Statement of
Assets and
Liabilities
Location | | Fair Value | |
Interest rate contracts | | Receivable/Payable for variation margin on futures | | $ | 205,417 | * | | Receivable/Payable for variation margin on futures | | $ | 291,086 | * |
| | | | |
Equity contracts | | Receivable/Payable for variation margin on futures | | | 895,986 | * | | Receivable/Payable for variation margin on futures | | | 220,441 | * |
| | | | |
Credit contracts | | Receivable/Payable for variation margin on centrally cleared swaps | | | 126,196 | * | | Receivable/Payable for variation margin on centrally cleared swaps | | | 607 | * |
| | | | |
Interest rate contracts | | Receivable/Payable for variation margin on centrally cleared swaps | | | 140,941 | * | | Receivable/Payable for variation margin on centrally cleared swaps | | | 463,400 | * |
| | | | |
Foreign currency contracts | | Unrealized appreciation on forward currency exchange contracts | | | 788,692 | | | Unrealized depreciation on forward currency exchange contracts | | | 608,973 | |
| | | | |
Interest rate contracts | | Unrealized appreciation on inflation swaps | | | 290,147 | | | Unrealized depreciation on inflation swaps | | | 9,208 | |
| | | | |
Equity contracts | | Unrealized appreciation on total return swaps | | | 366,300 | | | Unrealized depreciation on total return swaps | | | 585,293 | |
| | | | |
Foreign currency contracts | | Unrealized appreciation on variance swaps | | | 3,530 | | | Unrealized depreciation on variance swaps | | | 14,842 | |
| | | | |
Equity contracts | | Unrealized appreciation on variance swaps | | | 49,912 | | | Unrealized depreciation on variance swaps | | | 147,091 | |
| | | | | | | | | | | | |
Total | | | | $ | 2,867,121 | | | | | $ | 2,340,941 | |
| | | | | | | | | | | | |
| * | Only variation margin receivable/payable at period end is reported within the statement of assets and liabilities. This amount reflects cumulative unrealized appreciation/(depreciation) on futures and centrally cleared swaps as reported in the portfolio of investments. |
| | |
| |
86 | AB CONSERVATIVE WEALTH STRATEGY | | abfunds.com |
NOTES TO FINANCIAL STATEMENTS (continued)
| | | | | | | | | | |
Derivative Type | | Location of Gain or
(Loss) on Derivatives
Within Statement of
Operations | | Realized Gain
or (Loss) on
Derivatives | | | Change in
Unrealized
Appreciation or
(Depreciation) | |
Interest rate contracts | | Net realized gain (loss) on futures; Net change in unrealized appreciation/depreciation of futures | | $ | (1,414,597 | ) | | $ | (172,528 | ) |
| | | |
Equity contracts | | Net realized gain (loss) on futures; Net change in unrealized appreciation/depreciation of futures | | | (1,903,459 | ) | | | 3,106,985 | |
| | | |
Foreign currency contracts | | Net realized gain (loss) on forward currency exchange contracts; Net change in unrealized appreciation/depreciation of forward currency exchange contracts | | | (564,542 | ) | | | 582,612 | |
| | | |
Interest rate contracts | | Net realized gain (loss) on swaptions written; Net change in unrealized appreciation/depreciation of swaptions written | | | 16,830 | | | | (2,830 | ) |
| | | |
Interest rate contracts | | Net realized gain (loss) on swaps; Net change in unrealized appreciation/depreciation of swaps | | | (57,426 | ) | | | 93,873 | |
| | | |
Foreign exchange contracts | | Net realized gain (loss) on swaps; Net change in unrealized appreciation/depreciation of swaps | | | (7,072 | ) | | | (9,856 | ) |
| | | |
Credit contracts | | Net realized gain (loss) on swaps; Net change in unrealized appreciation/depreciation of swaps | | | 128,151 | | | | (22,630 | ) |
| | | |
Equity contracts | | Net realized gain (loss) on swaps; Net change in unrealized appreciation/depreciation of swaps | | | 953,774 | | | | (954,736 | ) |
| | | | | | | | | | |
Total | | | | $ | (2,848,341 | ) | | $ | 2,620,890 | |
| | | | | | | | | | |
| | |
| |
| abfunds.com | | AB CONSERVATIVE WEALTH STRATEGY | 87 |
NOTES TO FINANCIAL STATEMENTS (continued)
The following table represents the average monthly volume of the Fund’s derivative transactions during the six months ended February 28, 2021:
| | | | |
Futures: | | | | |
Average notional amount of buy contracts | | $ | 47,582,788 | |
Average notional amount of sale contracts | | $ | 34,822,249 | |
Forward Currency Exchange Contracts: | | | | |
Average principal amount of buy contracts | | $ | 36,080,631 | |
Average principal amount of sale contracts | | $ | 61,777,205 | |
Options Written: | | | | |
Average notional amount | | $ | 308,000 | (a) |
Swaptions Written: | | | | |
Average notional amount | | $ | 443,370 | (a) |
Interest Rate Swaps: | | | | |
Average notional amount | | $ | 480,252 | |
Inflation Swaps: | | | | |
Average notional amount | | $ | 17,727,143 | |
Centrally Cleared Interest Rate Swaps: | | | | |
Average notional amount | | $ | 16,887,248 | |
Centrally Cleared Inflation Swaps: | | | | |
Average notional amount | | $ | 15,560,000 | (a) |
Credit Default Swaps: | | | | |
Average notional amount of sale contracts | | $ | 227,200 | (b) |
Centrally Cleared Credit Default Swaps: | | | | |
Average notional amount of buy contracts | | $ | 352,167 | (c) |
Average notional amount of sale contracts | | $ | 21,049,081 | |
Total Return Swaps: | | | | |
Average notional amount | | $ | 10,671,092 | |
Variance Swaps: | | | | |
Average notional amount | | $ | 1,577,145 | |
| (a) | Positions were open for one month during the period. |
| (b) | Positions were open for four month during the period. |
| (c) | Positions were open for five months during the period. |
For financial reporting purposes, the Fund does not offset derivative assets and derivative liabilities that are subject to netting arrangements in the statement of assets and liabilities.
All OTC derivatives held at period end were subject to netting arrangements. The following table presents the Fund’s derivative assets and liabilities by OTC counterparty net of amounts available for offset under ISDA Master Agreements (“MA”) and net of the related collateral received/pledged by the Fund as of February 28, 2021. Exchange-traded derivatives and centrally cleared swaps are not subject to netting arrangements and as such are excluded from the table.
| | |
| |
88 | AB CONSERVATIVE WEALTH STRATEGY | | abfunds.com |
NOTES TO FINANCIAL STATEMENTS (continued)
| | | | | | | | | | | | | | | | | | | | |
Counterparty | | Derivative
Assets
Subject
to a MA | | | Derivatives
Available
for Offset | | | Cash
Collateral
Received* | | | Security
Collateral
Received* | | | Net Amount of
Derivative
Assets | |
Australia and New Zealand Banking Group Ltd. | | $ | 897 | | | $ | – 0 | – | | $ | – 0 | – | | $ | – 0 | – | | $ | 897 | |
Bank of America, NA | | | 84,208 | | | | (10,020 | ) | | | – 0 | – | | | – 0 | – | | | 74,188 | |
Barclays Bank PLC | | | 248,360 | | | | (83,374 | ) | | | – 0 | – | | | – 0 | – | | | 164,986 | |
BNP Paribas SA | | | 64,439 | | | | (64,439 | ) | | | – 0 | – | | | – 0 | – | | | – 0 | – |
Citibank, NA | | | 206,832 | | | | (16,751 | ) | | | – 0 | – | | | – 0 | – | | | 190,081 | |
Credit Suisse International | | | 1,836 | | | | (1,836 | ) | | | – 0 | – | | | – 0 | – | | | – 0 | – |
Deutsche Bank AG | | | 22,240 | | | | (17,543 | ) | | | – 0 | – | | | – 0 | – | | | 4,697 | |
Goldman Sachs Bank USA/Goldman Sachs International | | | 62,986 | | | | (62,986 | ) | | | – 0 | – | | | – 0 | – | | | – 0 | – |
JPMorgan Chase Bank, NA | | | 126,192 | | | | (126,192 | ) | | | – 0 | – | | | – 0 | – | | | – 0 | – |
Morgan Stanley Capital Services LLC/Morgan Stanley Capital Services, Inc. | | | 235,112 | | | | (197,143 | ) | | | – 0 | – | | | – 0 | – | | | 37,969 | |
Natwest Markets PLC | | | 7,591 | | | | (7,591 | ) | | | – 0 | – | | | – 0 | – | | | – 0 | – |
Standard Chartered Bank | | | 28,656 | | | | (28,656 | ) | | | – 0 | – | | | – 0 | – | | | – 0 | – |
State Street Bank & Trust Co. | | | 252,803 | | | | (247,151 | ) | | | – 0 | – | | | – 0 | – | | | 5,652 | |
UBS AG | | | 156,429 | | | | (70,920 | ) | | | – 0 | – | | | – 0 | – | | | 85,509 | |
| | | | | | | | | | | | | | | | | | | | |
Total | | $ | 1,498,581 | | | $ | (934,602 | ) | | $ | – 0 | – | | $ | – 0 | – | | $ | 563,979 | ^ |
| | | | | | | | | | | | | | | | | | | | |
| | | | | |
Counterparty | | Derivative
Liabilities
Subject
to a MA | | | Derivatives
Available
for Offset | | | Cash
Collateral
Pledged* | | | Security
Collateral
Pledged* | | | Net Amount of
Derivative
Liabilities | |
Bank of America, NA | | $ | 10,020 | | | $ | (10,020 | ) | | $ | – 0 | – | | $ | – 0 | – | | $ | – 0 | – |
Barclays Bank PLC | | | 83,374 | | | | (83,374 | ) | | | – 0 | – | | | – 0 | – | | | – 0 | – |
BNP Paribas SA | | | 71,738 | | | | (64,439 | ) | | | – 0 | – | | | – 0 | – | | | 7,299 | |
Citibank, NA | | | 16,751 | | | | (16,751 | ) | | | – 0 | – | | | – 0 | – | | | – 0 | – |
Credit Suisse International | | | 62,163 | | | | (1,836 | ) | | | – 0 | – | | | – 0 | – | | | 60,327 | |
Deutsche Bank AG | | | 17,543 | | | | (17,543 | ) | | | – 0 | – | | | – 0 | – | | | – 0 | – |
Goldman Sachs Bank USA/Goldman Sachs International | | | 298,853 | | | | (62,986 | ) | | | (235,867 | ) | | | – 0 | – | | | – 0 | – |
HSBC Bank USA | | | 4,212 | | | | – 0 | – | | | – 0 | – | | | – 0 | – | | | 4,212 | |
JPMorgan Chase Bank, NA | | | 208,732 | | | | (126,192 | ) | | | (82,540 | ) | | | – 0 | – | | | – 0 | – |
Morgan Stanley Capital Services LLC/Morgan Stanley Capital Services, Inc. | | | 197,143 | | | | (197,143 | ) | | | – 0 | – | | | – 0 | – | | | – 0 | – |
Natwest Markets PLC | | | 22,242 | | | | (7,591 | ) | | | – 0 | – | | | – 0 | – | | | 14,651 | |
Standard Chartered Bank | | | 54,565 | | | | (28,656 | ) | | | – 0 | – | | | – 0 | – | | | 25,909 | |
State Street Bank & Trust Co. | | | 247,151 | | | | (247,151 | ) | | | – 0 | – | | | – 0 | – | | | – 0 | – |
UBS AG | | | 70,920 | | | | (70,920 | ) | | | – 0 | – | | | – 0 | – | | | – 0 | – |
| | | | | | | | | | | | | | | | | | | | |
Total | | $ | 1,365,407 | | | $ | (934,602 | ) | | $ | (318,407 | ) | | $ | – 0 | – | | $ | 112,398 | ^ |
| | | | | | | | | | | | | | | | | | | | |
| * | The actual collateral received/pledged may be more than the amount reported due to over-collateralization. |
| | |
| |
| abfunds.com | | AB CONSERVATIVE WEALTH STRATEGY | 89 |
NOTES TO FINANCIAL STATEMENTS (continued)
| ^ | Net amount represents the net receivable/payable that would be due from/to the counterparty in the event of default or termination. The net amount from OTC financial derivative instruments can only be netted across transactions governed under the same master agreement with the same counterparty. |
2. Currency Transactions
The Fund may invest in non-U.S. Dollar-denominated securities on a currency hedged or unhedged basis. The Fund may seek investment opportunities by taking long or short positions in currencies through the use of currency-related derivatives, including forward currency exchange contracts, futures and options on futures, swaps, and other options. The Fund may enter into transactions for investment opportunities when it anticipates that a foreign currency will appreciate or depreciate in value but securities denominated in that currency are not held by the Fund and do not present attractive investment opportunities. Such transactions may also be used when the Adviser believes that it may be more efficient than a direct investment in a foreign currency-denominated security. The Fund may also conduct currency exchange contracts on a spot basis (i.e., for cash at the spot rate prevailing in the currency exchange market for buying or selling currencies).
NOTE E
Securities Lending
The Fund may enter into securities lending transactions. Under the Fund’s securities lending program, all loans of securities will be collateralized continually by cash collateral and/or non-cash collateral. Non-cash collateral will include only securities issued or guaranteed by the U.S. government or its agencies or instrumentalities. The Fund cannot sell or repledge any non-cash collateral, such collateral will not be reflected in the portfolio of investments. If a loan is collateralized by cash, the Fund will be compensated for the loan from a portion of the net return from the income earned on cash collateral after a rebate is paid to the borrower (in some cases, this rebate may be a “negative rebate” or fee paid by the borrower to the Fund in connection with the loan), and payments are made for fees of the securities lending agent and for certain other administrative expenses. If the Fund receives non-cash collateral, the Fund will receive a fee from the borrower generally equal to a negotiated percentage of the market value of the loaned securities. The Fund will have the right to call a loan and obtain the securities loaned at any time on notice to the borrower within the normal and customary settlement time for the securities. While the securities are on loan, the borrower is obligated to pay the Fund amounts equal to any income or other distributions from the securities; however, these distributions will not be afforded the same preferential tax treatment as qualified dividends. The Fund will not be able to exercise voting rights with respect to any securities during the existence of a loan, but will have the right to regain ownership of loaned securities in order to exercise voting or other ownership rights. Collateral received and securities loaned are
| | |
| |
90 | AB CONSERVATIVE WEALTH STRATEGY | | abfunds.com |
NOTES TO FINANCIAL STATEMENTS (continued)
marked to market daily to ensure that the securities loaned are secured by collateral. The lending agent currently invests the cash collateral received in Government Money Market Portfolio, an eligible money market vehicle, in accordance with the investment restrictions of the Fund, and as approved by the Board. The collateral received on securities loaned is recorded as an asset as well as a corresponding liability in the statement of assets and liabilities. The collateral will be adjusted the next business day to maintain the required collateral amount. The amounts of securities lending income from the borrowers and Government Money Market Portfolio are reflected in the statement of operations. When the Fund earns net securities lending income from Government Money Market Portfolio, the income is inclusive of a rebate expense paid to the borrower. In connection with the cash collateral investment by the Fund in Government Money Market Portfolio, the Adviser has agreed to waive a portion of the Fund’s share of the advisory fees of Government Money Market Portfolio, as borne indirectly by the Fund as an acquired fund fee and expense. When the Fund lends securities, its investment performance will continue to reflect changes in the value of the securities loaned. A principal risk of lending portfolio securities is that the borrower may fail to return the loaned securities upon termination of the loan and that the collateral will not be sufficient to replace the loaned securities. The lending agent has agreed to indemnify the Fund in the case of default of any securities borrower.
A summary of the Fund’s transactions surrounding securities lending for the six months ended February 28, 2021 is as follows:
| | | | | | | | | | | | | | | | | | | | |
Market Value of Securities on Loan* | | Cash
Collateral* | | | Market
Value of
Non-Cash
Collateral* | | | Income
from
Borrowers | | | Government
Money Market
Portfolio | |
| | Income
Earned | | | Advisory
Fee
Waived | |
$ 2,155,899 | | $ | 1,913,241 | | | $ | 302,592 | | | $ | 17,030 | | | $ | 315 | | | $ | 196 | |
| * | As of February 28, 2021. |
| | |
| |
| abfunds.com | | AB CONSERVATIVE WEALTH STRATEGY | 91 |
NOTES TO FINANCIAL STATEMENTS (continued)
NOTE F
Shares of Beneficial Interest
Transactions in shares of beneficial interest for each class were as follows:
| | | | | | | | | | | | | | | | | | | | | | | | |
| | | | | | | | | | | | | | | | | | | | | | | | |
| | | Shares | | | | | | Amount | | | | |
| | | Six Months Ended
February 28, 2021
(unaudited) | | | Year Ended
August 31, 2020 | | | | | | Six Months Ended
February 28, 2021
(unaudited) | | | Year Ended
August 31, 2020 | | | | |
| | | | | | | | |
| Class A | | | | | | | | | | | | | | | | | | | | | |
Shares sold | | | 102,330 | | | | 437,312 | | | | | | | $ | 1,268,127 | | | $ | 5,211,647 | | | | | |
| | | | | |
Shares issued in reinvestment of dividends | | | 326,790 | | | | 350,398 | | | | | | | | 4,071,800 | | | | 4,383,473 | | | | | |
| | | | | |
Shares converted from Class B | | | – 0 | – | | | 54,858 | | | | | | | | – 0 | – | | | 701,161 | | | | | |
| | | | | |
Shares converted from Class C | | | 60,855 | | | | 241,350 | | | | | | | | 755,734 | | | | 2,875,529 | | | | | |
| | | | | |
Shares redeemed | | | (874,194 | ) | | | (1,893,262 | ) | | | | | | | (11,001,522 | ) | | | (22,730,864 | ) | | | | |
| | | | | |
Net decrease | | | (384,219 | ) | | | (809,344 | ) | | | | | | $ | (4,905,861 | ) | | $ | (9,559,054 | ) | | | | |
| | | | | |
| | | | | | | | | | | | | | | | | | | | | | | | |
| Class B | | | | | | | | | | | | | | | | | | | | | |
Shares sold | | | – 0 | – | | | 8 | | | | | | | $ | – 0 | – | | $ | 100 | | | | | |
| | | | | |
Shares converted to Class A | | | – 0 | – | | | (53,971 | ) | | | | | | | – 0 | – | | | (701,161 | ) | | | | |
| | | | | |
Shares redeemed | | | – 0 | – | | | (403 | ) | | | | | | | – 0 | – | | | (5,454 | ) | | | | |
| | | | | |
Net decrease | | | – 0 | – | | | (54,366 | ) | | | | | | $ | – 0 | – | | $ | (706,515 | ) | | | | |
| | | | | |
| | | | | | | | | | | | | | | | | | | | | | | | |
| Class C | | | | | | | | | | | | | | | | | | | | | |
Shares sold | | | 6,212 | | | | 75,557 | | | | | | | $ | 77,065 | | | $ | 910,240 | | | | | |
| | | | | |
Shares issued in reinvestment of dividends | | | 19,127 | | | | 27,578 | | | | | | | | 238,896 | | | | 345,273 | | | | | |
| | | | | |
Shares converted to Class A | | | (61,053 | ) | | | (241,958 | ) | | | | | | | (755,734 | ) | | | (2,875,529 | ) | | | | |
| | | | | |
Shares redeemed | | | (55,241 | ) | | | (193,709 | ) | | | | | | | (693,042 | ) | | | (2,293,928 | ) | | | | |
| | | | | |
Net decrease | | | (90,955 | ) | | | (332,532 | ) | | | | | | $ | (1,132,815 | ) | | $ | (3,913,944 | ) | | | | |
| | | | | |
| | | | | | | | | | | | | | | | | | | | | | | | |
| Advisor Class | | | | | | | | | | | | | | | | | | | | | |
Shares sold | | | 56,870 | | | | 93,625 | | | | | | | $ | 725,156 | | | $ | 1,136,658 | | | | | |
| | | | | |
Shares issued in reinvestment of dividends | | | 12,869 | | | | 15,478 | | | | | | | | 160,868 | | | | 194,255 | | | | | |
| | | | | |
Shares redeemed | | | (75,467 | ) | | | (184,853 | ) | | | | | | | (945,333 | ) | | | (2,174,359 | ) | | | | |
| | | | | |
Net decrease | | | (5,728 | ) | | | (75,750 | ) | | | | | | $ | (59,309 | ) | | $ | (843,446 | ) | | | | |
| | | | | |
| | |
| |
92 | AB CONSERVATIVE WEALTH STRATEGY | | abfunds.com |
NOTES TO FINANCIAL STATEMENTS (continued)
| | | | | | | | | | | | | | | | | | | | | | | | |
| | | | | | | | | | | | | | | | | | | | | | | | |
| | | Shares | | | | | | Amount | | | | |
| | | Six Months Ended
February 28, 2021
(unaudited) | | | Year Ended
August 31, 2020 | | | | | | Six Months Ended
February 28, 2021
(unaudited) | | | Year Ended
August 31, 2020 | | | | |
| | | | | | | | |
| Class R | | | | | | | | | | | | | | | | | | | | | |
Shares sold | | | 55,464 | | | | 83,991 | | | | | | | $ | 699,721 | | | $ | 1,004,375 | | | | | |
| | | | | |
Shares issued in reinvestment of dividends | | | 11,036 | | | | 10,843 | | | | | | | | 137,730 | | | | 135,975 | | | | | |
| | | | | |
Shares redeemed | | | (62,732 | ) | | | (115,240 | ) | | | | | | | (787,171 | ) | | | (1,428,808 | ) | | | | |
| | | | | |
Net increase (decrease) | | | 3,768 | | | | (20,406 | ) | | | | | | $ | 50,280 | | | $ | (288,458 | ) | | | | |
| | | | | |
| | | | | | | | | | | | | | | | | | | | | | | | |
| Class K | | | | | | | | | | | | | | | | | | | | | |
Shares sold | | | 4,296 | | | | 18,598 | | | | | | | $ | 54,077 | | | $ | 223,140 | | | | | |
| | | | | |
Shares issued in reinvestment of dividends | | | 4,896 | | | | 15,386 | | | | | | | | 61,096 | | | | 192,175 | | | | | |
| | | | | |
Shares redeemed | | | (42,986 | ) | | | (299,774 | ) | | | | | | | (542,588 | ) | | | (3,487,386 | ) | | | | |
| | | | | |
Net decrease | | | (33,794 | ) | | | (265,790 | ) | | | | | | $ | (427,415 | ) | | $ | (3,072,071 | ) | | | | |
| | | | | |
| | | | | | | | | | | | | | | | | | | | | | | | |
| Class I | | | | | | | | | | | | | | | | | | | | | |
Shares sold | | | 113 | | | | 443 | | | | | | | $ | 1,445 | | | $ | 5,393 | | | | | |
| | | | | |
Shares issued in reinvestment of dividends | | | 88 | | | | 67 | | | | | | | | 1,115 | | | | 850 | | | | | |
| | | | | |
Shares redeemed | | | (421 | ) | | | (7 | ) | | | | | | | (5,564 | ) | | | (92 | ) | | | | |
| | | | | |
Net increase (decrease) | | | (220 | ) | | | 503 | | | | | | | $ | (3,004 | ) | | $ | 6,151 | | | | | |
| | | | | |
During the year ended August 31, 2020, a third party vendor reimbursed the Fund $2,403 for losses incurred due to a trade entry error. This amount is presented in the Fund’s consolidated statement of changes in net assets.
NOTE G
Risks Involved in Investing in the Fund
Market Risk—The value of the Fund’s assets will fluctuate as the stock, bond or commodities markets fluctuate. The value of its investments may decline, sometimes rapidly and unpredictably, simply because of economic changes or other events, including public health crises (including the occurrence of a contagious disease or illness), that affect large portions of the market. It includes the risk that a particular style of investing, such as growth or value, may be underperforming the stock market generally.
Allocation Risk—The allocation of investments among different investment styles, such as equity or debt, growth or value, U.S. or non-U.S. securities, or diversification strategies, may have a more significant effect on the Fund’s net asset value, or NAV, when one of these investments is performing more poorly than another.
| | |
| |
| abfunds.com | | AB CONSERVATIVE WEALTH STRATEGY | 93 |
NOTES TO FINANCIAL STATEMENTS (continued)
Credit Risk—An issuer or guarantor of a fixed-income security, or the counterparty to a derivatives or other contract, may be unable or unwilling to make timely payments of interest or principal, or to otherwise honor its obligations. The issuer or guarantor may default, causing a loss of the full principal amount of a security and accrued interest. The degree of risk for a particular security may be reflected in its credit rating. There is the possibility that the credit rating of a fixed-income security may be downgraded after purchase, which may adversely affect the value of the security. Investments in fixed-income securities with lower ratings (commonly known as “junk bonds”) are subject to have a higher probability that an issuer will default or fail to meet its payment obligations.
High Yield Debt Securities Risk—Investments in fixed-income securities with lower ratings (commonly known as “junk bonds”) tend to have a higher probability that an issuer will default or fail to meet its payment obligations. These securities may be subject to greater price volatility due to such factors as specific corporate developments, interest rate sensitivity, negative perceptions of the junk bond market generally and less secondary market liquidity.
Interest Rate Risk—Changes in interest rates will affect the value of the Fund’s investments in Underlying Portfolios that invest in fixed-income securities. When interest rates rise, the value of existing investments in fixed-income securities tends to fall and this decrease in value may not be offset by higher income from new investments. Interest rate risk is generally greater for fixed-income securities with longer maturities or durations. Very low or negative interest rates would likely magnify the risks associated with changes in interest rates. During periods of very low or negative rates, the Fund’s returns would likely be adversely affected.
Foreign (Non-U.S.) Risk—Investments in securities of non-U.S. issuers may involve more risk than those of U.S. issuers. These securities may fluctuate more widely in price and may be more difficult to trade due to adverse market, economic, political, regulatory or other factors.
Currency Risk—Fluctuations in currency exchange rates may negatively affect the value of the Fund’s investments or reduce its returns.
Emerging Market Risk—Investments in emerging market countries may have more risk because the markets are less developed and less liquid as well as being subject to increased economic, political, regulatory or other uncertainties.
Alternative Investments Risk—Many alternative investments can be volatile and may be illiquid. Their performance may have little correlation with the performance of equity or fixed-income markets, and they may not perform in accordance with expectations.
| | |
| |
94 | AB CONSERVATIVE WEALTH STRATEGY | | abfunds.com |
NOTES TO FINANCIAL STATEMENTS (continued)
Derivatives Risk—The Fund may enter into derivative transactions such as forwards, options, futures and swaps. Derivatives may be illiquid, difficult to price, and leveraged so that small changes may produce disproportionate losses for the Fund, and subject to counterparty risk to a greater degree than more traditional investments. Derivatives may result in significant losses, including losses that are far greater than the value of the derivatives reflected on the statement of assets and liabilities.
Leverage Risk—When the Fund borrows money or otherwise leverages its investments, its performance may be volatile because leverage tends to exaggerate the effect of any increase or decrease in the value of the Fund’s investments. The Fund may create leverage through the use of reverse repurchase arrangements, forward currency exchange contracts, forward commitments, dollar rolls or futures or by borrowing money. The use of other types of derivative instruments by the Fund, such as options and swaps, may also result in a form of leverage. Leverage may result in higher returns to the Fund than if the Fund were not leveraged, but may also adversely affect returns, particularly if the market is declining.
Investment in Other Investment Companies Risk—As with other investments, investments in other investment companies are subject to market and selection risk. In addition, shareholders of the Fund bear both their proportionate share of expenses in the Fund (including management fees) and, indirectly, the expenses of the investment companies in which the Fund invests (to the extent these expenses are not waived or reimbursed by the Adviser).
LIBOR Transition and Associated Risk—A Fund may invest in debt securities, derivatives or other financial instruments that utilize the London Interbank Offered Rate, or “LIBOR,” as a “benchmark” or “reference rate” for various interest rate calculations. The United Kingdom Financial Conduct Authority, which regulates LIBOR, will cease publishing certain LIBOR benchmarks at the end of 2021. Although certain LIBOR rates are intended to be published until June 2023, banks are strongly encouraged to cease entering into agreements with counterparties referencing LIBOR by the end of 2021. Although financial regulators and industry working groups have suggested alternative reference rates, such as the European Interbank Offer Rate, the Sterling Overnight Interbank Average Rate and the Secured Overnight Financing Rate, global consensus on alternative rates is lacking and the process for amending existing contracts or instruments to transition away from LIBOR is underway but remains incomplete. The elimination of LIBOR or changes to other reference rates or any other changes or reforms to the determination or supervision of reference rates could have an adverse impact on the market for, or value of, any securities or payments linked to those reference rates, which may adversely affect a
| | |
| |
| abfunds.com | | AB CONSERVATIVE WEALTH STRATEGY | 95 |
NOTES TO FINANCIAL STATEMENTS (continued)
Fund’s performance and/or net asset value. Uncertainty and risk also remain regarding the willingness and ability of issuers and lenders to include revised provisions in new and existing contracts or instruments. Consequently, the transition away from LIBOR to other reference rates may lead to increased volatility and illiquidity in markets that are tied to LIBOR, fluctuations in values of LIBOR-related investments or investments in issuers that utilize LIBOR, increased difficulty in borrowing or refinancing and diminished effectiveness of hedging strategies, potentially adversely affecting a Fund’s performance. Furthermore, the risks associated with the expected discontinuation of LIBOR and transition may be exacerbated if the work necessary to effect an orderly transition to an alternative reference rate is not completed in a timely manner. Because the usefulness of LIBOR as a benchmark could deteriorate during the transition period, these effects could occur prior to the end of 2021.
Indemnification Risk—In the ordinary course of business, the Fund enters into contracts that contain a variety of indemnifications. The Fund’s maximum exposure under these arrangements is unknown. However, the Fund has not had prior claims or losses pursuant to these indemnification provisions and expects the risk of loss thereunder to be remote. Therefore, the Fund has not accrued any liability in connection with these indemnification provisions.
Management Risk—The Fund is subject to management risk because it is an actively-managed investment fund. The Adviser will apply its investment techniques and risk analyses in making investment decisions for the Fund, but there is no guarantee that its techniques will produce the intended results. Some of these techniques may incorporate, or rely upon, quantitative models, but there is no guarantee that these models will generate accurate forecasts, reduce risk or otherwise perform as expected.
NOTE H
Joint Credit Facility
A number of open-end mutual funds managed by the Adviser, including the Fund, participate in a $325 million revolving credit facility (the “Facility”) intended to provide short-term financing, if necessary, subject to certain restrictions in connection with abnormal redemption activity. Commitment fees related to the Facility are paid by the participating funds and are included in miscellaneous expenses in the statement of operations. The Fund did not utilize the Facility during the six months ended February 28, 2021.
| | |
| |
96 | AB CONSERVATIVE WEALTH STRATEGY | | abfunds.com |
NOTES TO FINANCIAL STATEMENTS (continued)
NOTE I
Distributions to Shareholders
The tax character of distributions to be paid for the year ending August 31, 2021 will be determined at the end of the current fiscal year. The tax character of distributions paid during the fiscal years ended August 31, 2020 and August 31, 2019 were as follows:
| | | | | | | | |
| | | 2020 | | | 2019 | |
Distributions paid from: | | | | | | | | |
Ordinary income | | $ | 5,317,969 | | | $ | 1,300,747 | |
Net long-term capital gains | | | 533,447 | | | | – 0 | – |
| | | | | | | | |
Total taxable distributions paid | | $ | 5,851,416 | | | $ | 1,300,747 | |
| | | | | | | | |
As of August 31, 2020, the components of accumulated earnings/(deficit) on a tax basis were as follows:
| | | | |
Undistributed ordinary income | | $ | 4,929,970 | |
Accumulated capital and other losses | | | (9,731,742 | )(a) |
Unrealized appreciation/(depreciation) | | | 12,182,147 | (b) |
| | | | |
Total accumulated earnings/(deficit) | | $ | 7,380,375 | (c) |
| | | | |
| (a) | As of August 31, 2020, the cumulative deferred loss on straddles was $55,036. As of August 31, 2020, the Fund had a net post-October capital loss deferral of $9,676,706. |
| (b) | The differences between book-basis and tax-basis unrealized appreciation/(depreciation) are attributable primarily to the recognition for tax purposes of unrealized gains/losses on certain derivative instruments, the tax treatment of passive foreign investment companies (PFICs), the tax treatment of Treasury inflation-protected securities, the tax treatment of swaps, and the tax deferral of losses on wash sales. |
| (c) | The difference between book-basis and tax-basis components of accumulated earnings/(deficit) is attributable primarily to the accrual of foreign capital gains tax. |
For tax purposes, net realized capital losses may be carried over to offset future capital gains, if any. Funds are permitted to carry forward capital losses for an indefinite period, and such losses will retain their character as either short-term or long-term capital losses. As of August 31, 2020, the Fund did not have any capital loss carryforwards.
NOTE J
Subsequent Events
As of February 28, 2021, Class C shares will automatically convert to Class A shares ten years after the end of the calendar month of their original purchase. Effective May 31, 2021, Class C shares will automatically convert to Class A shares after eight years instead of ten years.
Management has evaluated subsequent events for possible recognition or disclosure in the financial statements through the date the financial statements are issued. Management has determined that there are no other material events that would require disclosure in the Fund’s financial statements through this date.
| | |
| |
| abfunds.com | | AB CONSERVATIVE WEALTH STRATEGY | 97 |
FINANCIAL HIGHLIGHTS
Selected Data For A Share Of Beneficial Interest Outstanding Throughout Each Period
| | | | | | | | | | | | | | | | | | | | | | | | |
| | | Class A | |
| | | Six Months
Ended
February 28,
2021 (unaudited) | | | Year Ended August 31, | |
| | | 2020 | | | 2019 | | | 2018 | | | 2017 | | | 2016 | |
| | | | |
| | | | | | | | | | | | | | | | | | | | | | | | |
Net asset value, beginning of period | | | $ 12.38 | | | | $ 12.58 | | | | $ 12.14 | | | | $ 12.79 | | | | $ 12.38 | | | | $ 12.18 | |
| | | | |
Income From Investment Operations | | | | | | | | | | | | | | | | | | | | | | | | |
| | | | | | |
Net investment income(a)(b) | | | .06 | | | | .14 | | | | .16 | | | | .17 | | | | .38 | | | | .27 | |
| | | | | | |
Net realized and unrealized gain on investment transactions | | | .71 | | | | .10 | | | | .37 | | | | .10 | | | | .34 | | | | .19 | |
| | | | | | |
Contributions from Affiliates | | | – 0 | – | | | .00 | (c) | | | .00 | (c) | | | – 0 | – | | | – 0 | – | | | – 0 | – |
| | | | | | |
Capital contributions | | | – 0 | – | | | .00 | (c) | | | – 0 | – | | | – 0 | – | | | – 0 | – | | | – 0 | – |
| | | | |
Net increase in net asset value from operations | | | .77 | | | | .24 | | | | .53 | | | | .27 | | | | .72 | | | | .46 | |
| | | | |
Less: Dividends and Distributions | | | | | | | | | | | | | | | | | | | | | | | | |
| | | | | | |
Dividends from net investment income | | | (.44 | ) | | | (.40 | ) | | | (.09 | ) | | | (.56 | ) | | | (.31 | ) | | | (.26 | ) |
| | | | | | |
Distributions from net realized gain on investment transactions | | | – 0 | – | | | (.04 | ) | | | – 0 | – | | | (.17 | ) | | | – 0 | – | | | – 0 | – |
| | | | | | |
Return of capital | | | – 0 | – | | | – 0 | – | | | – 0 | – | | | (.19 | ) | | | – 0 | – | | | – 0 | – |
| | | | |
Total dividends and distributions | | | (.44 | ) | | | (.44 | ) | | | (.09 | ) | | | (.92 | ) | | | (.31 | ) | | | (.26 | ) |
| | | | |
Net asset value, end of period | | | $ 12.71 | | | | $ 12.38 | | | | $ 12.58 | | | | $ 12.14 | | | | $ 12.79 | | | | $ 12.38 | |
| | | | |
| | | | | | |
Total Return | | | | | | | | | | | | | | | | | | | | | | | | |
| | | | | | |
Total investment return based on net asset value(d)* | | | 6.41 | % | | | 1.77 | % | | | 4.47 | % | | | 2.14 | % | | | 5.93 | % | | | 3.86 | % |
| | | | | | |
Ratios/Supplemental Data | | | | | | | | | | | | | | | | | | | | | | | | |
| | | | | | |
Net assets, end of period
(000’s omitted) | | | $131,406 | | | | $132,657 | | | | $145,002 | | | | $160,517 | | | | $174,667 | | | | $180,380 | |
| | | | | | |
Ratio to average net assets of: | | | | | | | | | | | | | | | | | | | | | | | | |
| | | | | | |
Expenses, net of waivers/reimbursements(e)‡ | | | 1.17 | %^ | | | 1.14 | % | | | 1.05 | % | | | 1.04 | % | | | 1.01 | % | | | .94 | % |
| | | | | | |
Expenses, before waivers/reimbursements(e)‡ | | | 1.29 | %^ | | | 1.29 | % | | | 1.23 | % | | | 1.25 | % | | | 1.09 | % | | | 1.00 | % |
| | | | | | |
Net investment income(b) | | | .99 | %^ | | | 1.13 | % | | | 1.32 | % | | | 1.36 | % | | | 3.08 | % | | | 2.20 | % |
| | | | | | |
Portfolio turnover rate | | | 61 | % | | | 96 | % | | | 100 | % | | | 90 | % | | | 86 | % | | | 5 | % |
| | | | | | | | | | | | | | | | | | | | | | | | |
| |
‡ Expense ratios exclude the estimated acquired fund fees of the affiliated/unaffiliated underlying | |
portfolios | | | .14 | %^ | | | .17 | % | | | .20 | % | | | .25 | % | | | .22 | % | | | .24 | % |
See footnote summary on page 104.
| | |
| |
98 | AB CONSERVATIVE WEALTH STRATEGY | | abfunds.com |
FINANCIAL HIGHLIGHTS (continued)
Selected Data For A Share Of Beneficial Interest Outstanding Throughout Each Period
| | | | | | | | | | | | | | | | | | | | | | | | |
| | | Class C | |
| | | Six Months
Ended
February 28,
2021 (unaudited) | | | Year Ended August 31, | |
| | | 2020 | | | 2019 | | | 2018 | | | 2017 | | | 2016 | |
| | | | |
| | | | | | | | | | | | | | | | | | | | | | | | |
Net asset value, beginning of period | | | $ 12.32 | | | | $ 12.51 | | | | $ 12.07 | | | | $ 12.58 | | | | $ 12.17 | | | | $ 12.00 | |
| | | | |
Income From Investment Operations | | | | | | | | | | | | | | | | | | | | | | | | |
| | | | | | |
Net investment income(a)(b) | | | .01 | | | | .05 | | | | .07 | | | | .08 | | | | .29 | | | | .17 | |
| | | | | | |
Net realized and unrealized gain on investment transactions | | | .73 | | | | .09 | | | | .37 | | | | .09 | | | | .32 | | | | .19 | |
| | | | | | |
Contributions from Affiliates | | | – 0 | – | | | .00 | (c) | | | .00 | (c) | | | – 0 | – | | | – 0 | – | | | – 0 | – |
| | | | | | |
Capital contributions | | | – 0 | – | | | .00 | (c) | | | – 0 | – | | | – 0 | – | | | – 0 | – | | | – 0 | – |
| | | | |
Net increase in net asset value from operations | | | .74 | | | | .14 | | | | .44 | | | | .17 | | | | .61 | | | | .36 | |
| | | | |
Less: Dividends and Distributions | | | | | | | | | | | | | | | | | | | | | | | | |
| | | | | | |
Dividends from net investment income | | | (.33 | ) | | | (.29 | ) | | | – 0 | – | | | (.38 | ) | | | (.20 | ) | | | (.19 | ) |
| | | | | | |
Distributions from net realized gain on investment transactions | | | – 0 | – | | | (.04 | ) | | | – 0 | – | | | (.17 | ) | | | – 0 | – | | | – 0 | – |
| | | | | | |
Return of capital | | | – 0 | – | | | – 0 | – | | | – 0 | – | | | (.13 | ) | | | – 0 | – | | | – 0 | – |
| | | | |
Total dividends and distributions | | | (.33 | ) | | | (.33 | ) | | | – 0 | – | | | (.68 | ) | | | (.20 | ) | | | (.19 | ) |
| | | | |
Net asset value, end of period | | | $ 12.73 | | | | $ 12.32 | | | | $ 12.51 | | | | $ 12.07 | | | | $ 12.58 | | | | $ 12.17 | |
| | | | |
| | | | | | |
Total Return | | | | | | | | | | | | | | | | | | | | | | | | |
| | | | | | |
Total investment return based on net asset value(d)* | | | 5.98 | % | | | .97 | % | | | 3.73 | % | | | 1.37 | % | | | 5.12 | % | | | 3.09 | % |
| | | | | | |
Ratios/Supplemental Data | | | | | | | | | | | | | | | | | | | | | | | | |
| | | | | | |
Net assets, end of period
(000’s omitted) | | | $9,858 | | | | $10,667 | | | | $14,989 | | | | $22,039 | | | | $41,637 | | | | $73,686 | |
| | | | | | |
Ratio to average net assets of: | | | | | | | | | | | | | | | | | | | | | | | | |
| | | | | | |
Expenses, net of waivers/reimbursements(e)‡ | | | 1.93 | %^ | | | 1.89 | % | | | 1.80 | % | | | 1.77 | % | | | 1.75 | % | | | 1.69 | % |
| | | | | | |
Expenses, before waivers/reimbursements(e)‡ | | | 2.05 | %^ | | | 2.04 | % | | | 1.98 | % | | | 1.98 | % | | | 1.82 | % | | | 1.75 | % |
| | | | | | |
Net investment income(b) | | | .24 | %^ | | | .44 | % | | | .59 | % | | | .64 | % | | | 2.41 | % | | | 1.45 | % |
| | | | | | |
Portfolio turnover rate | | | 61 | % | | | 96 | % | | | 100 | % | | | 90 | % | | | 86 | % | | | 5 | % |
| | | | | | | | | | | | | | | | | | | | | | | | |
| |
‡ Expense ratios exclude the estimated acquired fund fees of the affiliated/unaffiliated underlying | |
portfolios | | | .14 | %^ | | | .17 | % | | | .20 | % | | | .25 | % | | | .22 | % | | | .24 | % |
See footnote summary on page 104.
| | |
| |
| abfunds.com | | AB CONSERVATIVE WEALTH STRATEGY | 99 |
FINANCIAL HIGHLIGHTS (continued)
Selected Data For A Share Of Beneficial Interest Outstanding Throughout Each Period
| | | | | | | | | | | | | | | | | | | | | | | | |
| | | Advisor Class | |
| | | Six Months
Ended
February 28,
2021 (unaudited) | | | Year Ended August 31, | |
| | | 2020 | | | 2019 | | | 2018 | | | 2017 | | | 2016 | |
| | | | |
| | | | | | | | | | | | | | | | | | | | | | | | |
Net asset value, beginning of period | | | $ 12.44 | | | | $ 12.64 | | | | $ 12.20 | | | | $ 12.86 | | | | $ 12.45 | | | | $ 12.24 | |
| | | | |
Income From Investment Operations | | | | | | | | | | | | | | | | | | | | | | | | |
| | | | | | |
Net investment income(a)(b) | | | .08 | | | | .17 | | | | .19 | | | | .20 | | | | .41 | | | | .32 | |
| | | | | | |
Net realized and unrealized gain on investment transactions | | | .73 | | | | .10 | | | | .37 | | | | .10 | | | | .33 | | | | .17 | |
| | | | | | |
Contributions from Affiliates | | | – 0 | – | | | .00 | (c) | | | .00 | (c) | | | – 0 | – | | | – 0 | – | | | – 0 | – |
| | | | | | |
Capital contributions | | | – 0 | – | | | .00 | (c) | | | – 0 | – | | | – 0 | – | | | – 0 | – | | | – 0 | – |
| | | | |
Net increase in net asset value from operations | | | .81 | | | | .27 | | | | .56 | | | | .30 | | | | .74 | | | | .49 | |
| | | | |
Less: Dividends and Distributions | | | | | | | | | | | | | | | | | | | | | | | | |
| | | | | | |
Dividends from net investment income | | | (.48 | ) | | | (.43 | ) | | | (.12 | ) | | | (.59 | ) | | | (.33 | ) | | | (.28 | ) |
| | | | | | |
Distributions from net realized gain on investment transactions | | | – 0 | – | | | (.04 | ) | | | – 0 | – | | | (.17 | ) | | | – 0 | – | | | – 0 | – |
| | | | | | |
Return of capital | | | – 0 | – | | | – 0 | – | | | – 0 | – | | | (.20 | ) | | | – 0 | – | | | – 0 | – |
| | | | |
Total dividends and distributions | | | (.48 | ) | | | (.47 | ) | | | (.12 | ) | | | (.96 | ) | | | (.33 | ) | | | (.28 | ) |
| | | | |
Net asset value, end of period | | | $ 12.77 | | | | $ 12.44 | | | | $ 12.64 | | | | $ 12.20 | | | | $ 12.86 | | | | $ 12.45 | |
| | | | |
| | | | | | |
Total Return | | | | | | | | | | | | | | | | | | | | | | | | |
| | | | | | |
Total investment return based on net asset value(d)* | | | 6.56 | % | | | 2.02 | % | | | 4.81 | % | | | 2.39 | % | | | 6.15 | % | | | 4.12 | % |
| | | | | | |
Ratios/Supplemental Data | | | | | | | | | | | | | | | | | | | | | | | | |
| | | | | | |
Net assets, end of period
(000’s omitted) | | | $5,488 | | | | $5,419 | | | | $6,464 | | | | $8,772 | | | | $9,274 | | | | $12,277 | |
| | | | | | |
Ratio to average net assets of: | | | | | | | | | | | | | | | | | | | | | | | | |
| | | | | | |
Expenses, net of waivers/reimbursements(e)‡ | | | .92 | %^ | | | .89 | % | | | .80 | % | | | .79 | % | | | .75 | % | | | .69 | % |
| | | | | | |
Expenses, before waivers/reimbursements(e)‡ | | | 1.04 | %^ | | | 1.04 | % | | | .97 | % | | | 1.00 | % | | | .83 | % | | | .75 | % |
| | | | | | |
Net investment income(b) | | | 1.25 | %^ | | | 1.41 | % | | | 1.58 | % | | | 1.60 | % | | | 3.26 | % | | | 2.60 | % |
| | | | | | |
Portfolio turnover rate | | | 61 | % | | | 96 | % | | | 100 | % | | | 90 | % | | | 86 | % | | | 5 | % |
| | | | | | | | | | | | | | | | | | | | | | | | |
| |
‡ Expense ratios exclude the estimated acquired fund fees of the affiliated/unaffiliated underlying | |
portfolios | | | .14 | %^ | | | .17 | % | | | .20 | % | | | .25 | % | | | .22 | % | | | .24 | % |
See footnote summary on page 104.
| | |
| |
100 | AB CONSERVATIVE WEALTH STRATEGY | | abfunds.com |
FINANCIAL HIGHLIGHTS (continued)
Selected Data For A Share Of Beneficial Interest Outstanding Throughout Each Period
| | | | | | | | | | | | | | | | | | | | | | | | |
| | | Class R | |
| | | Six Months
Ended
February 28,
2021 (unaudited) | | | Year Ended August 31, | |
| | | 2020 | | | 2019 | | | 2018 | | | 2017 | | | 2016 | |
| | | | |
| | | | | | | | | | | | | | | | | | | | | | | | |
Net asset value, beginning of period | | | $ 12.37 | | | | $ 12.57 | | | | $ 12.13 | | | | $ 12.76 | | | | $ 12.36 | | | | $ 12.15 | |
| | | | |
Income From Investment Operations | | | | | | | | | | | | | | | | | | | | | | | | |
| | | | | | |
Net investment income(a)(b) | | | .04 | | | | .09 | | | | .11 | | | | .12 | | | | .33 | | | | .25 | |
| | | | | | |
Net realized and unrealized gain on investment transactions | | | .72 | | | | .10 | | | | .38 | | | | .09 | | | | .32 | | | | .17 | |
| | | | | | |
Contributions from Affiliates | | | – 0 | – | | | .00 | (c) | | | .00 | (c) | | | – 0 | – | | | – 0 | – | | | – 0 | – |
| | | | | | |
Capital contributions | | | – 0 | – | | | .00 | (c) | | | – 0 | – | | | – 0 | – | | | – 0 | – | | | – 0 | – |
| | | | |
Net increase in net asset value from operations | | | .76 | | | | .19 | | | | .49 | | | | .21 | | | | .65 | | | | .42 | |
| | | | |
Less: Dividends and Distributions | | | | | | | | | | | | | | | | | | | | | | | | |
| | | | | | |
Dividends from net investment income | | | (.40 | ) | | | (.35 | ) | | | (.05 | ) | | | (.50 | ) | | | (.25 | ) | | | (.21 | ) |
| | | | | | |
Distributions from net realized gain on investment transactions | | | – 0 | – | | | (.04 | ) | | | – 0 | – | | | (.17 | ) | | | – 0 | – | | | – 0 | – |
| | | | | | |
Return of capital | | | – 0 | – | | | – 0 | – | | | – 0 | – | | | (.17 | ) | | | – 0 | – | | | – 0 | – |
| | | | |
Total dividends and distributions | | | (.40 | ) | | | (.39 | ) | | | (.05 | ) | | | (.84 | ) | | | (.25 | ) | | | (.21 | ) |
| | | | |
Net asset value, end of period | | | $ 12.73 | | | | $ 12.37 | | | | $ 12.57 | | | | $ 12.13 | | | | $ 12.76 | | | | $ 12.36 | |
| | | | |
| | | | | | |
Total Return | | | | | | | | | | | | | | | | | | | | | | | | |
| | | | | | |
Total investment return based on net asset value(d)* | | | 6.21 | % | | | 1.36 | % | | | 4.06 | % | | | 1.73 | % | | | 5.42 | % | | | 3.56 | % |
| | | | | | |
Ratios/Supplemental Data | | | | | | | | | | | | | | | | | | | | | | | | |
| | | | | | |
Net assets, end of period
(000’s omitted) | | | $4,450 | | | | $4,278 | | | | $4,604 | | | | $3,896 | | | | $4,078 | | | | $4,532 | |
| | | | | | |
Ratio to average net assets of: | | | | | | | | | | | | | | | | | | | | | | | | |
| | | | | | |
Expenses, net of waivers/reimbursements(e)‡ | | | 1.58 | %^ | | | 1.53 | % | | | 1.46 | % | | | 1.45 | % | | | 1.42 | % | | | 1.34 | % |
| | | | | | |
Expenses, before waivers/reimbursements(e)‡ | | | 1.70 | %^ | | | 1.68 | % | | | 1.63 | % | | | 1.66 | % | | | 1.50 | % | | | 1.40 | % |
| | | | | | |
Net investment income(b) | | | .59 | %^ | | | .74 | % | | | .89 | % | | | .94 | % | | | 2.63 | % | | | 2.03 | % |
| | | | | | |
Portfolio turnover rate | | | 61 | % | | | 96 | % | | | 100 | % | | | 90 | % | | | 86 | % | | | 5 | % |
| | | | | | | | | | | | | | | | | | | | | | | | |
| |
‡ Expense ratios exclude the estimated acquired fund fees of the affiliated/unaffiliated underlying | |
portfolios | | | .14 | %^ | | | .17 | % | | | .20 | % | | | .25 | % | | | .22 | % | | | .24 | % |
See footnote summary on page 104.
| | |
| |
| abfunds.com | | AB CONSERVATIVE WEALTH STRATEGY | 101 |
FINANCIAL HIGHLIGHTS (continued)
Selected Data For A Share Of Beneficial Interest Outstanding Throughout Each Period
| | | | | | | | | | | | | | | | | | | | | | | | |
| | | Class K | |
| | | Six Months
Ended
February 28,
2021 (unaudited) | | | Year Ended August 31, | |
| | | 2020 | | | 2019 | | | 2018 | | | 2017 | | | 2016 | |
| | | | |
| | | | | | | | | | | | | | | | | | | | | | | | |
Net asset value, beginning of period | | | $ 12.35 | | | | $ 12.55 | | | | $ 12.11 | | | | $ 12.75 | | | | $ 12.35 | | | | $ 12.15 | |
| | | | |
Income From Investment Operations | | | | | | | | | | | | | | | | | | | | | | | | |
| | | | | | |
Net investment income(a)(b) | | | .05 | | | | .14 | | | | .15 | | | | .15 | | | | .37 | | | | .25 | |
| | | | | | |
Net realized and unrealized gain on investment transactions | | | .72 | | | | .08 | | | | .37 | | | | .11 | | | | .32 | | | | .20 | |
| | | | | | |
Contributions from Affiliates | | | – 0 | – | | | .00 | (c) | | | .00 | (c) | | | – 0 | – | | | – 0 | – | | | – 0 | – |
| | | | | | |
Capital contributions | | | – 0 | – | | | .00 | (c) | | | – 0 | – | | | – 0 | – | | | – 0 | – | | | – 0 | – |
| | | | |
Net increase in net asset value from operations | | | .77 | | | | .22 | | | | .52 | | | | .26 | | | | .69 | | | | .45 | |
| | | | |
Less: Dividends and Distributions | | | | | | | | | | | | | | | | | | | | | | | | |
| | | | | | |
Dividends from net investment income | | | (.38 | ) | | | (.38 | ) | | | (.08 | ) | | | (.55 | ) | | | (.29 | ) | | | (.25 | ) |
| | | | | | |
Distributions from net realized gain on investment transactions | | | – 0 | – | | | (.04 | ) | | | – 0 | – | | | (.17 | ) | | | – 0 | – | | | – 0 | – |
| | | | | | |
Return of capital | | | – 0 | – | | | – 0 | – | | | – 0 | – | | | (.18 | ) | | | – 0 | – | | | – 0 | – |
| | | | |
Total dividends and distributions | | | (.38 | ) | | | (.42 | ) | | | (.08 | ) | | | (.90 | ) | | | (.29 | ) | | | (.25 | ) |
| | | | |
Net asset value, end of period | | | $ 12.74 | | | | $ 12.35 | | | | $ 12.55 | | | | $ 12.11 | | | | $ 12.75 | | | | $ 12.35 | |
| | | | |
| | | | | | |
Total Return | | | | | | | | | | | | | | | | | | | | | | | | |
| | | | | | |
Total investment return based on net asset value(d)* | | | 6.42 | % | | | 1.58 | % | | | 4.45 | % | | | 2.07 | % | | | 5.72 | % | | | 3.82 | % |
| | | | | | |
Ratios/Supplemental Data | | | | | | | | | | | | | | | | | | | | | | | | |
| | | | | | |
Net assets, end of period
(000’s omitted) | | | $2,103 | | | | $2,456 | | | | $5,832 | | | | $6,734 | | | | $7,096 | | | | $7,277 | |
| | | | | | |
Ratio to average net assets of: | | | | | | | | | | | | | | | | | | | | | | | | |
| | | | | | |
Expenses, net of waivers/reimbursements(e)‡ | | | 1.27 | %^ | | | 1.23 | % | | | 1.15 | % | | | 1.15 | % | | | 1.11 | % | | | 1.03 | % |
| | | | | | |
Expenses, before waivers/reimbursements(e)‡ | | | 1.39 | %^ | | | 1.38 | % | | | 1.32 | % | | | 1.36 | % | | | 1.19 | % | | | 1.09 | % |
| | | | | | |
Net investment income(b) | | | .85 | %^ | | | 1.12 | % | | | 1.24 | % | | | 1.23 | % | | | 2.96 | % | | | 2.08 | % |
| | | | | | |
Portfolio turnover rate | | | 61 | % | | | 96 | % | | | 100 | % | | | 90 | % | | | 86 | % | | | 5 | % |
| | | | | | | | | | | | | | | | | | | | | | | | |
| |
‡ Expense ratios exclude the estimated acquired fund fees of the affiliated/unaffiliated underlying | |
portfolios | | | .14 | %^ | | | .17 | % | | | .20 | % | | | .25 | % | | | .22 | % | | | .24 | % |
See footnote summary on page 104.
| | |
| |
102 | AB CONSERVATIVE WEALTH STRATEGY | | abfunds.com |
FINANCIAL HIGHLIGHTS (continued)
Selected Data For A Share Of Beneficial Interest Outstanding Throughout Each Period
| | | | | | | | | | | | | | | | | | | | | | | | |
| | | Class I | |
| | | Six Months
Ended
February 28,
2021 (unaudited) | | | Year Ended August 31, | |
| | | 2020 | | | 2019 | | | 2018 | | | 2017 | | | 2016 | |
| | | | |
| | | | | | | | | | | | | | | | | | | | | | | | |
Net asset value, beginning of period | | | $ 12.58 | | | | $ 12.78 | | | | $ 12.34 | | | | $ 12.82 | | | | $ 12.42 | | | | $ 12.21 | |
| | | | |
Income From Investment Operations | | | | | | | | | | | | | | | | | | | | | | | | |
| | | | | | |
Net investment income(a)(b) | | | .08 | | | | .16 | | | | .18 | | | | .25 | | | | .40 | | | | .29 | |
| | | | | | |
Net realized and unrealized gain on investment transactions | | | .73 | | | | .11 | | | | .39 | | | | .05 | | | | .34 | | | | .20 | |
| | | | | | |
Contributions from Affiliates | | | – 0 | – | | | .00 | (c) | | | .00 | (c) | | | – 0 | – | | | – 0 | – | | | – 0 | – |
| | | | | | |
Capital contributions | | | – 0 | – | | | .00 | (c) | | | – 0 | – | | | – 0 | – | | | – 0 | – | | | – 0 | – |
| | | | |
Net increase in net asset value from operations | | | .81 | | | | .27 | | | | .57 | | | | .30 | | | | .74 | | | | .49 | |
| | | | |
Less: Dividends and Distributions | | | | | | | | | | | | | | | | | | | | | | | | |
| | | | | | |
Dividends from net investment income | | | (.48 | ) | | | (.43 | ) | | | (.13 | ) | | | (.46 | ) | | | (.34 | ) | | | (.28 | ) |
| | | | | | |
Distributions from net realized gain on investment transactions | | | – 0 | – | | | (.04 | ) | | | – 0 | – | | | (.17 | ) | | | – 0 | – | | | – 0 | – |
| | | | | | |
Return of capital | | | – 0 | – | | | – 0 | – | | | – 0 | – | | | (.15 | ) | | | – 0 | – | | | – 0 | – |
| | | | |
Total dividends and distributions | | | (.48 | ) | | | (.47 | ) | | | (.13 | ) | | | (.78 | ) | | | (.34 | ) | | | (.28 | ) |
| | | | |
Net asset value, end of period | | | $ 12.91 | | | | $ 12.58 | | | | $ 12.78 | | | | $ 12.34 | | | | $ 12.82 | | | | $ 12.42 | |
| | | | |
| | | | | | |
Total Return | | | | | | | | | | | | | | | | | | | | | | | | |
| | | | | | |
Total investment return based on net asset value(d)* | | | 6.57 | % | | | 2.02 | % | | | 4.72 | % | | | 2.34 | % | | | 6.09 | % | | | 4.11 | % |
| | | | | | |
Ratios/Supplemental Data | | | | | | | | | | | | | | | | | | | | | | | | |
| | | | | | |
Net assets, end of period
(000’s omitted) | | | $37 | | | | $39 | | | | $33 | | | | $10 | | | | $36 | | | | $453 | |
| | | | | | |
Ratio to average net assets of: | | | | | | | | | | | | | | | | | | | | | | | | |
| | | | | | |
Expenses, net of waivers/reimbursements(e)‡ | | | .94 | %^ | | | .91 | % | | | .86 | % | | | .73 | % | | | .78 | % | | | .72 | % |
| | | | | | |
Expenses, before waivers/reimbursements(e)‡ | | | 1.06 | %^ | | | 1.06 | % | | | 1.02 | % | | | .94 | % | | | .86 | % | | | .77 | % |
| | | | | | |
Net investment income(b) | | | 1.23 | %^ | | | 1.33 | % | | | 1.46 | % | | | 1.99 | % | | | 3.25 | % | | | 2.41 | % |
| | | | | | |
Portfolio turnover rate | | | 61 | % | | | 96 | % | | | 100 | % | | | 90 | % | | | 86 | % | | | 5 | % |
| | | | | | | | | | | | | | | | | | | | | | | | |
| |
‡ Expense ratios exclude the estimated acquired fund fees of the affiliated/unaffiliated underlying | |
portfolios | | | .14 | %^ | | | .17 | % | | | .20 | % | | | .25 | % | | | .22 | % | | | .24 | % |
See footnote summary on page 104.
| | |
| |
| abfunds.com | | AB CONSERVATIVE WEALTH STRATEGY | 103 |
FINANCIAL HIGHLIGHTS (continued)
Selected Data For A Share Of Beneficial Interest Outstanding Throughout Each Period
| (a) | Based on average shares outstanding. |
| (b) | Net of expenses waived/reimbursed by the Adviser. |
| (c) | Amount is less than $.005. |
| (d) | Total investment return is calculated assuming an initial investment made at the net asset value at the beginning of the period, reinvestment of all dividends and distributions at net asset value during the period, and redemption on the last day of the period. Initial sales charges or contingent deferred sales charges are not reflected in the calculation of total investment return. Total return does not reflect the deduction of taxes that a shareholder would pay on fund distributions or the redemption of fund shares. Total investment return calculated for a period of less than one year is not annualized. |
| (e) | In connection with the Fund’s investments in affiliated underlying portfolios, the Fund incurs no direct expenses, but bears proportionate shares of the fees and expenses (i.e., operating, administrative and investment advisory fees) of the affiliated underlying portfolios. The Adviser has contractually agreed to waive its fees from the Fund in an amount equal to the Fund’s pro rata share of certain acquired fund fees and expenses, and for the six months ended February 28, 2021 and the years ended August 31, 2020, August 31, 2019, August 31, 2018 and August 31, 2017, such waiver amounted to .12% (annualized), .15%, .17%, .21% and .08%, respectively. |
| * | Includes the impact of proceeds received and credited to the Fund resulting from class action settlements, which enhanced the Fund’s performance for the years ended August 31, 2018 and August 31, 2017 by .03% and .28%, respectively. |
See notes to financial statements.
| | |
| |
104 | AB CONSERVATIVE WEALTH STRATEGY | | abfunds.com |
TRUSTEES
| | |
Marshall C. Turner, Jr.(1),
Chairman Jorge A. Bermudez(1) Michael J. Downey(1) Onur Erzan*, President
and Chief Executive Officer | | Nancy P. Jacklin(1) Jeanette W. Loeb(1) Carol C. McMullen(1) Garry L. Moody(1) Earl D. Weiner(1) |
| |
| OFFICERS | | |
Alexander Barenboym(2),
Vice President Daniel J. Loewy(2), Vice President Defne Ozaltun(2), Vice President Emilie D. Wrapp, Clerk Michael B. Reyes, Senior Analyst | | Joseph J. Mantineo, Treasurer and Chief Financial Officer Phyllis J. Clarke, Controller and Chief Accounting Officer Vincent S. Noto, Chief Compliance Officer |
| | |
Custodian and Accounting Agent State Street Bank and Trust Company
State Street Corporation CCB/5
1 Iron Street
Boston, MA 02210 Principal Underwriter AllianceBernstein Investments, Inc.
1345 Avenue of the Americas
New York, NY 10105 Legal Counsel Seward & Kissel LLP
One Battery Park Plaza
New York, NY 10004 | | Transfer Agent AllianceBernstein Investor Services, Inc.
P.O. Box 786003
San Antonio, TX 78278-6003
Toll-Free (800) 221-5672 Independent Registered Public Accounting Firm Ernst & Young LLP
5 Times Square
New York, NY 10036 |
| 1 | Member of the Audit Committee, the Governance and Nominating Committee and the Independent Directors Committee. |
| 2 | The day-to-day management of, and investment decisions for, the Fund’s portfolio are made by the Adviser’s Multi-Asset Solutions Team. Messrs. Barenboym and Loewy and Ms. Ozaltun are the investment professionals primarily responsible for the day-to-day management of the Fund’s portfolio. |
| * | Mr. Robert M. Keith retired as President, Chief Executive Officer and a Director of the Fund as of March 31, 2021. Mr. Onur Erzan, Senior Vice President and Head of the Global Client Group of the Adviser, has been elected President, Chief Executive Officer and a Director of the Fund, effective April 1, 2021. |
| | |
| |
| abfunds.com | | AB CONSERVATIVE WEALTH STRATEGY | 105 |
Operation and Effectiveness of the Fund’s Liquidity Risk Management Program:
In October 2016, the Securities and Exchange Commission (“SEC”) adopted the open-end fund liquidity rule (the “Liquidity Rule”). In June 2018 the SEC adopted a requirement that funds disclose information about the operation and effectiveness of their Liquidity Risk Management Program (“LRMP”) in their reports to shareholders.
One of the requirements of the Liquidity Rule is for the Fund to designate an Administrator of the Fund’s Liquidity Risk Management Program. The Administrator of the Fund’s LRMP is AllianceBernstein L.P., the Fund’s investment adviser (the “Adviser”). The Adviser has delegated the responsibility to its Liquidity Risk Management Committee (the “Committee”).
Another requirement of the Liquidity Rule is for the Fund’s Board of Trustees (the “Fund Board”) to receive an annual written report from the Administrator of the LRMP, which addresses the operation of the Fund’s LRMP and assesses its adequacy and effectiveness. The Adviser provided the Fund Board with such annual report during the first quarter of 2021, which covered the period January 1, 2020 through December 31, 2020 (the “Program Reporting Period”).
The LRMP’s principal objectives include supporting the Fund’s compliance with limits on investments in illiquid assets and mitigating the risk that the Fund will be unable to meet its redemption obligations in a timely manner.
Pursuant to the LRMP, the Fund classifies the liquidity of its portfolio investments into one of the four categories defined by the SEC: Highly Liquid, Moderately Liquid, Less Liquid, and Illiquid. These classifications are reported to the SEC on Form N-PORT.
During the Program Reporting Period, the Committee reviewed whether the Fund’s strategy is appropriate for an open-end structure, incorporating any holdings of less liquid and illiquid assets. If the Fund participated in derivative transactions, the exposure from such transactions were considered in the LRMP.
The Committee also performed an analysis to determine whether the Fund is required to maintain a Highly Liquid Investment Minimum (“HLIM”). The Committee also incorporated the following information when determining the Fund’s reasonably anticipated trading size for purposes of liquidity monitoring: historical net redemption activity, a Fund’s concentration in an issuer, shareholder concentration, investment performance, total net assets, and distribution channels.
| | |
| |
106 | AB CONSERVATIVE WEALTH STRATEGY | | abfunds.com |
The Adviser informed the Fund Board that the Committee believes the Fund’s LRMP is adequately designed, has been implemented as intended, and has operated effectively since its inception. No material exceptions have been noted since the implementation of the LRMP. During the Program Reporting Period, beginning in March 2020, all financial markets experienced extreme levels of price volatility and relative illiquidity resulting from the COVID-19 impacts on the global economy. This extreme relative illiquidity resulted in significantly wider bid-ask spreads to transact in securities, including many of those securities held by the Fund, and in a diminished depth of liquidity in most markets, to varying degrees. Nonetheless, there were no liquidity events that impacted the Fund or its ability to timely meet redemptions during the Program Reporting Period.
| | |
| |
| abfunds.com | | AB CONSERVATIVE WEALTH STRATEGY | 107 |
Information Regarding the Review and Approval of the Fund’s Advisory Agreement
The disinterested trustees (the “directors”) of The AB Portfolios (the “Company”) unanimously approved the continuance of the Company’s Advisory Agreement with the Adviser in respect of AB Conservative Wealth Strategy (the “Fund”) at a meeting held by video conference on August 4-5, 2020 (the “Meeting”).
Prior to approval of the continuance of the Advisory Agreement, the directors had requested from the Adviser, and received and evaluated, extensive materials. They reviewed the proposed continuance of the Advisory Agreement with the Adviser and with experienced counsel who are independent of the Adviser, who advised on the relevant legal standards. The directors also reviewed additional materials, including comparative analytical data prepared by the Senior Analyst for the Fund. The directors also discussed the proposed continuance in private sessions with counsel.
The directors considered their knowledge of the nature and quality of the services provided by the Adviser to the Fund gained from their experience as directors or trustees of most of the registered investment companies advised by the Adviser, their overall confidence in the Adviser’s integrity and competence they have gained from that experience, the Adviser’s initiative in identifying and raising potential issues with the directors and its responsiveness, frankness and attention to concerns raised by the directors in the past, including the Adviser’s willingness to consider and implement organizational and operational changes designed to improve investment results and the services provided to the AB Funds. The directors noted that they have four regular meetings each year, at each of which they review extensive materials and information from the Adviser, including information on the investment performance of the Fund and the underlying funds advised by the Adviser in which the Fund invests.
The directors also considered all factors they believed relevant, including the specific matters discussed below. During the course of their deliberations, the directors evaluated, among other things, the reasonableness of the advisory fee. The directors did not identify any particular information that was all-important or controlling, and different directors may have attributed different weights to the various factors. The directors determined that the selection of the Adviser to manage the Fund and the overall arrangements between the Fund and the Adviser, as provided in the Advisory Agreement, including the advisory fee, were fair and reasonable in light of the services performed, expenses incurred and such other matters as the directors considered relevant in the exercise of their business judgment. The material factors and conclusions that formed the basis for the directors’ determinations included the following:
Nature, Extent and Quality of Services Provided
The directors considered the scope and quality of services provided by the Adviser under the Advisory Agreement, including the quality of the investment
| | |
| |
108 | AB CONSERVATIVE WEALTH STRATEGY | | abfunds.com |
research capabilities of the Adviser and the other resources it has dedicated to performing services for the Fund. The directors noted that the Adviser from time to time reviews the Fund’s investment strategies and from time to time proposes changes intended to improve the Fund’s relative or absolute performance for the directors’ consideration. They also noted the professional experience and qualifications of the Fund’s portfolio management team and other senior personnel of the Adviser. The quality of administrative and other services, including the Adviser’s role in coordinating the activities of the Fund’s other service providers, also was considered. The directors concluded that, overall, they were satisfied with the nature, extent and quality of services provided to the Fund under the Advisory Agreement.
Costs of Services Provided and Profitability
The directors reviewed a schedule of the revenues and expenses and related notes indicating the profitability of the Fund to the Adviser for calendar years 2018 and 2019 that had been prepared with an expense allocation methodology arrived at in consultation with an independent consultant retained by the Fund’s former Senior Officer/Independent Compliance Officer. The directors noted the assumptions and methods of allocation used by the Adviser in preparing fund-specific profitability data and understood that there are a number of potentially acceptable allocation methodologies for information of this type. The directors noted that the profitability information reflected all revenues and expenses of the Adviser’s relationship with the Fund, including those relating to its subsidiaries that provide transfer agency, distribution and brokerage services to the Fund. The directors recognized that it is difficult to make comparisons of the profitability of the Advisory Agreement with the profitability of fund advisory contracts for unaffiliated funds because comparative information is not generally publicly available and is affected by numerous factors. The directors focused on the profitability of the Adviser’s relationship with the Fund before taxes and distribution expenses. The directors concluded that the Adviser’s level of profitability from its relationship with the Fund was not unreasonable.
Fall-Out Benefits
The directors considered the other benefits to the Adviser and its affiliates from their relationships with the Fund and the underlying funds advised by the Adviser in which the Fund invests, including, but not limited to, benefits relating to soft dollar arrangements (whereby investment advisers receive brokerage and research services from brokers that execute agency transactions for their clients); 12b-1 fees and sales charges received by the Fund’s principal underwriter (which is a wholly owned subsidiary of the Adviser) in respect of certain classes of the Fund’s shares; brokerage commissions paid by the Fund to brokers affiliated with the Adviser; and transfer agency fees paid by the Fund to a wholly owned subsidiary of the Adviser. The directors recognized that the Adviser’s profitability would be somewhat lower without these benefits. The directors understood that the Adviser also might derive reputational and other benefits from its association with the Fund.
| | |
| |
| abfunds.com | | AB CONSERVATIVE WEALTH STRATEGY | 109 |
Investment Results
In addition to the information reviewed by the directors in connection with the Meeting, the directors receive detailed performance information for the Fund at each regular Board meeting during the year.
At the Meeting, the directors reviewed performance information prepared by an independent service provider (the “15(c) service provider”), showing the performance of the Class A Shares of the Fund against a group of similar funds (“peer group”) and a larger group of similar funds (“peer universe”), each selected by the 15(c) service provider, and information prepared by the Adviser showing performance of the Class A Shares against a broad-based securities market index, in each case for the 1-, 3-, 5- and 10-year periods ended May 31, 2020 and (in the case of comparisons with the broad-based securities market index) for the period from inception. Based on their review and their discussion with the Adviser of the reasons for the Fund’s underperformance in the periods reviewed, the directors concluded that the Fund’s investment performance was acceptable.
Advisory Fees and Other Expenses
The directors considered the advisory fee rate payable by the Fund to the Adviser and information prepared by the 15(c) service provider concerning advisory fee rates payable by other funds in the same category as the Fund. The directors recognized that it is difficult to make comparisons of advisory fees because there are variations in the services that are included in the fees paid by other funds. The directors compared the Fund’s contractual effective advisory fee rate with a peer group median.
The Adviser informed the directors that there were no institutional products managed by it that utilize investment strategies similar to those of the Fund.
The directors noted that the Fund invests in shares of exchange-traded funds (“ETFs”), subject to the restrictions and limitations of the Investment Company Act of 1940 as these may be varied as a result of exemptive orders issued by the SEC. The directors also noted that ETFs pay advisory fees pursuant to their advisory contracts, and that the Adviser had provided, and they had reviewed, information about the expense ratios of the relevant ETFs. The directors concluded, based on the Adviser’s explanation of how it uses ETFs when they are the most cost-effective way to obtain desired exposures, in some cases pending purchases of underlying securities, that the advisory fee for the Fund is for services that are in addition to, rather than duplicative of, the services provided under the advisory contracts of the ETFs.
In connection with their review of the Fund’s advisory fee, the directors also considered the total expense ratio of the Class A shares of the Fund
| | |
| |
110 | AB CONSERVATIVE WEALTH STRATEGY | | abfunds.com |
in comparison to a peer group and a peer universe selected by the 15(c) service provider. The Class A expense ratio of the Fund was based on the Fund’s latest fiscal year. The directors noted that it was likely that the expense ratios of some of the other funds in the Fund’s category were lowered by waivers or reimbursements by those funds’ investment advisers, which in some cases might be voluntary or temporary. The directors view expense ratio information as relevant to their evaluation of the Adviser’s services because the Adviser is responsible for coordinating services provided to the Fund by others. The directors noted that the Fund’s expense ratio was above the medians. After reviewing and discussing the Adviser’s explanations of the reasons for this, the directors concluded that the Fund’s expense ratio was acceptable.
Economies of Scale
The directors noted that the advisory fee schedules for the Fund contains breakpoints that reduce the fee rates on assets above specified levels. The directors took into consideration prior presentations by an independent consultant on economies of scale in the mutual fund industry and for the AB Funds, and presentations from time to time by the Adviser concerning certain of its views on economies of scale. The directors previously discussed economies of scale with an independent fee consultant. The directors also had requested and received from the Adviser certain updates on economies of scale in advance of the Meeting. The directors believe that economies of scale may be realized (if at all) by the Adviser across a variety of products and services, and not only in respect of a single fund. The directors noted that there is no established methodology for setting breakpoints that give effect to the fund-specific services provided by a fund’s adviser and to the economies of scale that an adviser may realize in its overall mutual fund business or those components of it which directly or indirectly affect a fund’s operations. The directors observed that in the mutual fund industry as a whole, as well as among funds similar to the Fund, there is no uniformity or pattern in the fees and asset levels at which breakpoints (if any) apply. The directors also noted that the advisory agreements for many funds do not have breakpoints at all. Having taken these factors into account, the directors concluded that the Fund’s shareholders would benefit from a sharing of economies of scale in the event the Fund’s net assets exceed a breakpoint in the future.
| | |
| |
| abfunds.com | | AB CONSERVATIVE WEALTH STRATEGY | 111 |
This page is not part of the Shareholder Report or the Financial Statements.
AB FAMILY OF FUNDS
US EQUITY
CORE
Core Opportunities Fund
FlexFee™ US Thematic Portfolio
Select US Equity Portfolio
GROWTH
Concentrated Growth Fund
Discovery Growth Fund
FlexFee™ Large Cap Growth Portfolio
Growth Fund
Large Cap Growth Fund
Small Cap Growth Portfolio
VALUE
Discovery Value Fund
Equity Income Fund
Relative Value Fund
Small Cap Value Portfolio
Value Fund
INTERNATIONAL/ GLOBAL EQUITY
CORE
Global Core Equity Portfolio
International Strategic Core Portfolio
Sustainable Global Thematic Fund
Tax-Managed Wealth Appreciation Strategy
Wealth Appreciation Strategy
GROWTH
Concentrated International Growth Portfolio
Sustainable International Thematic Fund
VALUE
All China Equity Portfolio
International Value Fund
FIXED INCOME
MUNICIPAL
High Income Municipal Portfolio
Intermediate California Municipal Portfolio
Intermediate Diversified Municipal Portfolio
Intermediate New York Municipal Portfolio
Municipal Bond Inflation Strategy
Tax-Aware Fixed Income Opportunities Portfolio
National Portfolio
Arizona Portfolio
California Portfolio
Massachusetts Portfolio
Minnesota Portfolio
New Jersey Portfolio
New York Portfolio
Ohio Portfolio
Pennsylvania Portfolio
Virginia Portfolio
TAXABLE
Bond Inflation Strategy
FlexFee™ High Yield Portfolio
Global Bond Fund
High Income Fund
Income Fund
Intermediate Duration Portfolio
Limited Duration High Income Portfolio
Short Duration Income Portfolio
Short Duration Portfolio
Total Return Bond Portfolio
ALTERNATIVES
All Market Real Return Portfolio
Global Real Estate Investment Fund
Select US Long/Short Portfolio
MULTI-ASSET
All Market Income Portfolio
All Market Total Return Portfolio
Conservative Wealth Strategy
Emerging Markets Multi-Asset Portfolio
Global Risk Allocation Fund
Tax-Managed All Market Income Portfolio
CLOSED-END FUNDS
AllianceBernstein Global High Income Fund
AllianceBernstein National Municipal Income Fund
We also offer Government Money Market Portfolio, which serves as the money market fund exchange vehicle for the AB mutual funds. You could lose money by investing in the Fund. Although the Fund seeks to preserve the value of your investment at $1.00 per share, it cannot guarantee it will do so. The Fund may impose a fee upon sale of your shares or may temporarily suspend your ability to sell shares if the Fund’s liquidity falls below required minimums because of market conditions or other factors. An investment in the Fund is not insured or guaranteed by the Federal Deposit Insurance Corporation or any other government agency. The Fund’s sponsor has no legal obligation to provide financial support to the Fund, and you should not expect that the sponsor will provide financial support to the Fund at any time.
Investors should consider the investment objectives, risks, charges and expenses of the Fund carefully before investing. For copies of our prospectus or summary prospectus, which contain this and other information, visit us online at www.abfunds.com or contact your AB representative. Please read the prospectus and/or summary prospectus carefully before investing.
| | |
| |
112 | AB CONSERVATIVE WEALTH STRATEGY | | abfunds.com |
AB CONSERVATIVE WEALTH STRATEGY
1345 Avenue of the Americas
New York, NY 10105
800 221 5672
CW-0152-0221 
FEB 02.28.21

SEMI-ANNUAL REPORT
AB TAX-MANAGED ALL MARKET INCOME PORTFOLIO

As of January 1, 2021, as permitted by new regulations adopted by the Securities and Exchange Commission, the Fund’s annual and semi-annual shareholder reports are no longer sent by mail, unless you specifically requested paper copies of the reports. Instead, the reports are made available on a website, and you will be notified by mail each time a report is posted and provided with a website address to access the report.
You may elect to receive all future reports in paper form free of charge. If you invest through a financial intermediary, you can contact your financial intermediary to request that you continue to receive paper copies of your shareholder reports; if you invest directly with the Fund, you can call the Fund at (800) 221 5672. Your election to receive reports in paper form will apply to all funds held in your account with your financial intermediary or, if you invest directly, to all AB Mutual Funds you hold.
| | |
| |
| Investment Products Offered | | • Are Not FDIC Insured • May Lose Value • Are Not Bank Guaranteed |
Investors should consider the investment objectives, risks, charges and expenses of the Fund carefully before investing. For copies of our prospectus or summary prospectus, which contain this and other information, visit us online at www.abfunds.com or contact your AB representative. Please read the prospectus and/or summary prospectus carefully before investing.
This shareholder report must be preceded or accompanied by the Fund’s prospectus for individuals who are not current shareholders of the Fund.
You may obtain a description of the Fund’s proxy voting policies and procedures, and information regarding how the Fund voted proxies relating to portfolio securities during the most recent 12-month period ended June 30, without charge. Simply visit AB’s website at www.abfunds.com, or go to the Securities and Exchange Commission’s (the “Commission”) website at www.sec.gov, or call AB at (800) 227 4618.
The Fund files its complete schedule of portfolio holdings with the Commission for the first and third quarters of each fiscal year as an exhibit to its reports on Form N-PORT. The Fund’s Form N-PORT reports are available on the Commission’s website at www.sec.gov. The Fund’s Forms N-PORT may also be reviewed and copied at the Commission’s Public Reference Room in Washington, DC; information on the operation of the Public Reference Room may be obtained by calling (800) SEC 0330. AB publishes full portfolio holdings for the Fund monthly at www.abfunds.com.
AllianceBernstein Investments, Inc. (ABI) is the distributor of the AB family of mutual funds. ABI is a member of FINRA and is an affiliate of AllianceBernstein L.P., the Adviser of the funds.
The [A/B] logo is a registered service mark of AllianceBernstein and AllianceBernstein® is a registered service mark used by permission of the owner, AllianceBernstein L.P.
| | |
| FROM THE PRESIDENT | |  |
Dear Shareholder,
We’re pleased to provide this report for the AB Tax-Managed All Market Income Portfolio (the “Fund”). Please review the discussion of Fund performance, the market conditions during the reporting period and the Fund’s investment strategy.
At AB, we’re striving to help our clients achieve better outcomes by:
| + | | Fostering diverse perspectives that give us a distinctive approach to navigating global capital markets |
| + | | Applying differentiated investment insights through a connected global research network |
| + | | Embracing innovation to design better ways to invest and leading-edge mutual-fund solutions |
Whether you’re an individual investor or a multibillion-dollar institution, we’re putting our knowledge and experience to work for you every day.
For more information about AB’s comprehensive range of products and shareholder resources, please log on to www.abfunds.com.
Thank you for your investment in AB mutual funds—and for placing your trust in our firm.
Sincerely,

Onur Erzan
President and Chief Executive Officer, AB Mutual Funds
| | |
| |
| abfunds.com | | AB TAX-MANAGED ALL MARKET INCOME PORTFOLIO | 1 |
SEMI-ANNUAL REPORT
April 5, 2021
This report provides management’s discussion of fund performance for the AB Tax-Managed All Market Income Portfolio for the semi-annual reporting period ended February 28, 2021.
The Fund’s investment objective is to seek current income with consideration of capital appreciation.
NAV RETURNS AS OF FEBRUARY 28, 2021 (unaudited)
| | | | | | | | |
| | |
| | | 6 Months | | | 12 Months | |
| | |
| AB TAX-MANAGED ALL MARKET INCOME PORTFOLIO | | | | | | | | |
| | |
| Class A Shares | | | 5.43% | | | | 2.48% | |
| | |
| Class C Shares | | | 5.07% | | | | 1.77% | |
| | |
| Advisor Class Shares1 | | | 5.55% | | | | 2.74% | |
| | |
Primary Benchmark:
Bloomberg Barclays 5-Year GO Municipal Bond Index | | | -0.09% | | | | 1.57% | |
| | |
| MSCI ACWI (net) | | | 13.04% | | | | 30.25% | |
| 1 | Please note that this share class is for investors purchasing shares through accounts established under certain fee-based programs sponsored and maintained by certain broker-dealers and financial intermediaries, institutional pension plans and/or investment advisory clients of, and certain other persons associated with, the Adviser and its affiliates or the Fund. |
INVESTMENT RESULTS
The table above shows the Fund’s performance compared to its primary benchmark, the Bloomberg Barclays 5-Year General Obligation (“GO”) Municipal Bond Index, and the Morgan Stanley Capital International All Country World Index (“MSCI ACWI”) (net) for the six- and 12-month periods ended February 28, 2021.
All share classes of the Fund outperformed the primary benchmark and underperformed the MSCI ACWI (net) for both periods, before sales charges. During the six-month period, overall allocation to equities, fixed-income assets and non-traditional income assets contributed to absolute performance. Security selection within fixed-income assets also contributed, while selection within equities and non-traditional income assets detracted. During the 12-month period, overall allocation to equities and non-traditional income assets were positive, while allocations to fixed-income assets detracted. Security selection within fixed-income assets contributed; selection within equities and non-traditional income assets detracted. Active currency management was neutral over both periods.
The Fund utilized derivatives for hedging and investment purposes in the form of futures and credit default swaps, which contributed to absolute
| | |
| |
2 | AB TAX-MANAGED ALL MARKET INCOME PORTFOLIO | | abfunds.com |
returns for both periods, while total return swaps and written options detracted; currency forwards and inflation Consumer Price Index swaps had no material impact on returns for either period; interest rate swaps detracted for the six-month period, but contributed for the 12-month period.
MARKET REVIEW AND INVESTMENT STRATEGY
Global equities, supported by extensive monetary and fiscal stimulus, continued to recover from lows triggered by the COVID-19 pandemic and recorded positive returns for the six-month period ended February 28, 2021. Equity markets suffered a setback at the beginning of the period as volatility and style rotation, including a broad sell-off of mega-cap technology stocks, prevailed. Favorable news about the efficacy of potential coronavirus vaccines helped offset market volatility that was prompted by the continued spread of the virus in many countries, a potentially contested US presidential election and lack of additional US fiscal stimulus. Later, despite the emergence of seemingly more transmissible strains of the virus—a significant decline in new cases, the acceleration of vaccine distribution, and positive signs that a $1.9 trillion relief package would be approved supported global equity markets. As the period drew to a close, the emergence of inflationary fears, especially in the US, precipitated a sharp rise in long-term government bond yields and an accompanying correction in equities. Rising longer-term interest rates pressured the valuations of many market-leading technology and growth stocks, especially in the US, boosting a rotation into more cyclical and value-oriented stocks. For the semi-annual period, small-cap stocks substantially outperformed large-cap stocks on a relative basis, and periods of market rotation led large and small value-style stocks to outperform their growth-style peers.
Global fixed-income market returns were mixed, with an elevated amount of volatility and dispersion between credit sectors over the six-month period. Developed-market government bonds were negative, and US Treasury bonds underperformed other major markets as longer-term US interest rates rose from a low in September 2020. Municipal bonds fared better than US Treasuries, perhaps owing to the increased value investors assigned to their tax advantages amid expectations that future personal income tax rates could rise under a new US administration. Risk assets began to significantly rise, beginning in November, when positive vaccine news extended the credit rally. Emerging- and developed-market high-yield corporate bonds led gains with significant positive returns as investors searched for higher yields in a period of historically low interest rates. Emerging-market local-currency bonds also had strong positive results. Globally, developed-market investment-grade corporate bonds had positive results and outperformed global treasuries, but returns were slightly negative in the US. Securitized assets also outperformed treasuries with slightly negative results. The US dollar fell against most developed-market currencies and was mixed relative to emerging-market currencies. Brent crude oil prices rebounded by 46% on
| | |
| |
| abfunds.com | | AB TAX-MANAGED ALL MARKET INCOME PORTFOLIO | 3 |
the improved economic outlook and OPEC+ production cuts. Copper gained almost 35% from increased demand for infrastructure and green energy initiatives. Gold prices fell over 12% due to the improved economic landscape, following a large advance earlier in calendar year, and as a non-interest-bearing asset in a rising rate environment.
The Fund’s Senior Investment Management Team (the “Team”) seeks current income with consideration of capital appreciation. The Team’s global multi-asset strategy focuses on generating high, stable income for taxable investors. The Team utilizes a rigorous quantitative research toolset with fundamental expertise across all regions and markets.
The municipal components may purchase municipal securities that are insured under policies issued by certain insurance companies. Historically, insured municipal securities typically received a higher credit rating, which meant that the issuer of the securities paid a lower interest rate. As a result of declines in the credit quality and associated downgrades of most bond insurers, insurance has less value than it did in the past. The market now values insured municipal securities primarily based on the credit quality of the issuer of the security with little value given to the insurance feature. In purchasing such insured securities, the Adviser evaluates the risk and return of municipal securities through its own research. If an insurance company’s rating is downgraded or the company becomes insolvent, the prices of municipal securities insured by the insurance company may decline. As of February 28, 2021, the Fund’s percentages of total investments in insured bonds and in insured bonds that have been pre-refunded or escrowed to maturity were 4.30% and 0.00%, respectively.
INVESTMENT POLICIES
The Adviser allocates the Fund’s investments primarily among a broad range of income-producing securities, including common stock of companies that regularly pay dividends (including real estate investment trusts or “REITs”), preferred stocks, fixed-income securities (including those with lower credit ratings) and derivatives related to these types of securities. The Fund pursues a global strategy, typically investing in securities of issuers located in the United States and in other countries throughout the world, including emerging-market countries.
In selecting equity securities for the Fund, the Adviser focuses on securities that have high dividend yields and that it believes are undervalued by the market relative to their long-term earnings potential. In order to provide diversification and the opportunity for increased return, the Adviser also acquires equity securities for the Fund that are expected to exhibit relatively little correlation with the returns of the Fund’s holdings in high dividend yield equity securities.
(continued on next page)
| | |
| |
4 | AB TAX-MANAGED ALL MARKET INCOME PORTFOLIO | | abfunds.com |
The Fund intends to meet the tax requirement for passing municipal bond interest through to Fund shareholders as tax-exempt interest dividends, which currently requires that at least 50% of the Fund’s assets be invested in tax-exempt debt securities. In the event that the Internal Revenue Code or the related rules, regulations and interpretations of the Internal Revenue Service should in the future change so as to permit the Fund to pass through tax-exempt dividends when the Fund invests a lesser amount of its assets in tax-exempt debt securities, the Fund’s allocations to equity securities may increase. In selecting tax-exempt securities for the Fund’s debt investments, the Adviser may draw on the capabilities of separate investment teams that specialize in different areas that are generally defined by the maturity of the debt securities and/or their ratings. These fixed-income teams draw on the resources and expertise of the Adviser’s fixed-income research staff, which includes fixed-income research analysts and economists.
In addition, the Fund may engage in certain alternative income strategies that generally utilize derivatives to diversify sources of income and manage risk. For example, the Fund may take long positions in currency derivatives on higher yielding currencies and/or short positions in currency derivatives on lower yielding currencies.
The Adviser adjusts the Fund’s investment exposure utilizing the Adviser’s Dynamic Asset Allocation (“DAA”) approach. DAA comprises a series of analytical and forecasting tools employed by the Adviser to gauge fluctuations in the risk/return profile of various asset classes. DAA seeks to adjust the Fund’s investment exposure in changing market conditions and thereby reduce overall portfolio volatility by mitigating the effects of market fluctuations, while preserving consistent long-term return potential. For example, the Adviser may seek to reduce the Fund’s risk exposure to one or more assets classes when DAA suggests that market risks relevant to those asset classes are rising but return opportunities are declining. In addition to merely increasing or decreasing asset class exposure by buying or selling securities of that asset class, the Adviser may pursue DAA implementation for the Fund by investing in derivatives or exchange-traded funds.
The Adviser intends to utilize a variety of derivatives in its management of the Fund. The Adviser may use derivatives to gain exposure to an asset class, such as using interest rate derivatives to gain exposure to certain bonds. As noted above, the Adviser may separately pursue certain alternative investment strategies that utilize derivatives, and may enter into derivatives in making the adjustments called for by DAA. As a result of the use of derivatives, the Fund may be leveraged, with net investment exposure in excess of net assets.
(continued on next page)
| | |
| |
| abfunds.com | | AB TAX-MANAGED ALL MARKET INCOME PORTFOLIO | 5 |
Currency exchange rate fluctuation can have a dramatic impact on returns. The Fund’s foreign currency exposures will come from investment in securities priced or denominated in foreign currencies and from direct holdings in foreign currencies and currency-related derivatives. The Adviser may seek to hedge all or a portion of the currency exposure resulting from Fund investments or decide not to hedge this exposure.
| | |
| |
6 | AB TAX-MANAGED ALL MARKET INCOME PORTFOLIO | | abfunds.com |
DISCLOSURES AND RISKS
Benchmark Disclosure
All indices are unmanaged and do not reflect fees and expenses associated with the active management of a mutual fund portfolio. The Bloomberg Barclays 5-Year GO Municipal Bond Index represents the performance of long-term, investment-grade tax-exempt bonds with maturities ranging from four to six years. The MSCI ACWI (net, free float-adjusted, market capitalization weighted) represents the equity market performance of developed and emerging markets. MSCI makes no express or implied warranties or representations, and shall have no liability whatsoever with respect to any MSCI data contained herein. The MSCI data may not be further redistributed or used as a basis for other indices, any securities or financial products. This report is not approved, reviewed or produced by MSCI. Net returns include the reinvestment of dividends after deduction of non-US withholding tax. An investor cannot invest directly in an index or average, and their results are not indicative of the performance for any specific investment, including the Fund.
A Word About Risk
Market Risk: The value of the Fund’s assets will fluctuate as the stock or bond market fluctuate. The value of its investments may decline, sometimes rapidly and unpredictably, simply because of economic changes or other events, including public health crises (including the occurrence of a contagious disease or illness), that affect large portions of the market. It includes the risk that a particular style of investing, such as growth or value, may be underperforming the stock market generally.
Allocation Risk: The allocation of investments among different investment styles, such as equity or debt, growth or value, US or non-US securities, or diversification strategies, may have a more significant effect on the Fund’s net asset value (“NAV”) when one of these investments is performing more poorly than another.
Credit Risk: An issuer or guarantor of a fixed-income security, or the counterparty to a derivatives or other contract, may be unable or unwilling to make timely payments of interest or principal, or to otherwise honor its obligations. The issuer or guarantor may default, causing a loss of the full principal amount of a security and accrued interest. The degree of risk for a particular security may be reflected in its credit rating. There is the possibility that the credit rating of a fixed-income security may be downgraded after purchase, which may adversely affect the value of the security. Investments in fixed-income securities with lower ratings (commonly known as “junk bonds”) are subject to a higher probability that an issuer will default or fail to meet its payment obligations.
High-Yield Debt Securities Risk: Investments in fixed-income securities with lower ratings (commonly known as “junk bonds”) tend to have a
| | |
| |
| abfunds.com | | AB TAX-MANAGED ALL MARKET INCOME PORTFOLIO | 7 |
DISCLOSURES AND RISKS (continued)
higher probability that an issuer will default or fail to meet its payment obligations. These securities may be subject to greater price volatility due to such factors as specific corporate developments, interest-rate sensitivity, negative perceptions of the junk bond market generally and less secondary market liquidity.
Interest-Rate Risk: Changes in interest rates will affect the value of the Fund’s investments in fixed-income securities. When interest rates rise, the value of existing investments in fixed-income securities tends to fall and this decrease in value may not be offset by higher income from new investments. Interest-rate risk is generally greater for fixed-income securities with longer maturities or durations. Very low or negative interest rates would likely magnify the risks associated with changes in interest rates. During periods of very low or negative rates, the Fund’s returns would likely be adversely affected.
Inflation Risk: This is the risk that the value of assets or income from investments will be less in the future as inflation decreases the value of money. As inflation increases, the value of the Fund’s assets can decline as can the value of the Fund’s distributions. This risk is significantly greater for fixed-income securities with longer maturities.
Municipal Market Risk: This is the risk that special factors may adversely affect the value of municipal securities and have a significant effect on the yield or value of the Fund’s investments in municipal securities. These factors include economic conditions, political or legislative changes, public health crises, uncertainties related to the tax status of municipal securities, or the rights of investors in these securities. To the extent that the Fund invests more of its assets in a particular state’s municipal securities, the Fund may be vulnerable to events adversely affecting that state, including economic, political and regulatory occurrences, court decisions, terrorism, public health crises (including the occurrence of a contagious disease or illness) and catastrophic natural disasters, such as hurricanes, fires or earthquakes. For example, the novel coronavirus (COVID-19) pandemic has significantly stressed the financial resources of many issuers of municipal securities, which could impair any such issuer’s ability to meet its financial obligations when due and adversely impact the value of its securities held by the Fund. As the full effects of the COVID-19 pandemic on state and local economies and on issuers of municipal securities are still uncertain, the financial difficulties of issuers of municipal securities may continue or worsen, adversely affecting the performance of the Fund. The Fund’s investments in certain municipal securities with principal and interest payments that are made from the revenues of a specific project or facility, and not general tax revenues, may have increased risks. Factors affecting the project or facility, such as local business or economic
| | |
| |
8 | AB TAX-MANAGED ALL MARKET INCOME PORTFOLIO | | abfunds.com |
DISCLOSURES AND RISKS (continued)
conditions, could have a significant effect on the project’s ability to make payments of principal and interest on these securities.
Real Estate Risk: The Fund’s investments in the real estate market have many of the same risks as direct ownership of real estate, including the risk that the value of real estate could decline due to a variety of factors that affect the real estate market generally. Investments in REITs may have additional risks. REITs are dependent on the capability of their managers, may have limited diversification and could be significantly affected by changes in tax laws.
Foreign (Non-US) Risk: Investments in securities of non-US issuers may involve more risk than those of US issuers. These securities may fluctuate more widely in price and may be more difficult to trade due to adverse market, economic, political, regulatory or other factors.
Currency Risk: Fluctuations in currency exchange rates may negatively affect the value of the Fund’s investments or reduce its returns.
Emerging-Market Risk: Investments in emerging-market countries may have more risk because the markets are less developed and less liquid as well as being subject to increased economic, political, regulatory or other uncertainties.
Derivatives Risk: Derivatives may be difficult to price or unwind and leveraged so that small changes may produce disproportionate losses for the Fund. Derivatives, especially over-the-counter derivatives, are also subject to counterparty risk.
Leverage Risk: To the extent the Fund uses leveraging techniques, its NAV may be more volatile because leverage tends to exaggerate the effect of changes in interest rates and any increase or decrease in the value of the Fund’s investments.
Illiquid Investments Risk: Illiquid investments risk exists when certain investments become difficult to purchase or sell. Difficulty in selling such investments may result in sales at disadvantageous prices affecting the value of your investment in the Fund. Causes of illiquid investments risk may include low trading volumes and large positions. Foreign fixed-income securities may have more illiquid investments risk because secondary trading markets for these securities may be smaller and less well-developed and the securities may trade less frequently. Illiquid investments risk may be higher in a rising interest-rate environment, when the value and liquidity of fixed-income securities generally go down.
| | |
| |
| abfunds.com | | AB TAX-MANAGED ALL MARKET INCOME PORTFOLIO | 9 |
DISCLOSURES AND RISKS (continued)
Management Risk: The Fund is subject to management risk because it is an actively managed investment fund. The Adviser will apply its investment techniques and risk analyses in making investment decisions for the Fund, but there is no guarantee that its techniques will produce the intended results. Some of these techniques may incorporate, or rely upon, quantitative models, but there is no guarantee that these models will generate accurate forecasts, reduce risk or otherwise perform as expected. The Fund’s tax-management strategies may result in it forgoing performance in favor of tax benefits that may not materialize, or may result in pre-tax performance that is lower than that of funds that do not use tax-management strategies.
These risks are fully discussed in the Fund’s prospectus. As with all investments, you may lose money by investing in the Fund.
An Important Note About Historical Performance
The investment return and principal value of an investment in the Fund will fluctuate as the prices of the individual securities in which it invests fluctuate, so that your shares, when redeemed, may be worth more or less than their original cost. Performance shown in this report represents past performance and does not guarantee future results. Current performance may be lower or higher than the performance information shown. You may obtain performance information current to the most recent month-end by visiting www.abfunds.com. The performance shown for periods prior to April 17, 2017, is based on the Fund’s prior principal strategies and may not be representative of the Fund’s performance under its current principal strategies. Class B shares are no longer being offered. Effective November 7, 2019, all outstanding Class B shares were converted to Class A shares. Please see Note A for more information.
All fees and expenses related to the operation of the Fund have been deducted. NAV returns do not reflect sales charges; if sales charges were reflected, the Fund’s quoted performance would be lower. SEC returns reflect the applicable sales charges for each share class: a 4.25% maximum front-end sales charge for Class A shares and a 1% 1-year contingent deferred sales charge for Class C shares. Returns for the different share classes will vary due to different expenses associated with each class. Performance assumes reinvestment of distributions and does not account for taxes.
| | |
| |
10 | AB TAX-MANAGED ALL MARKET INCOME PORTFOLIO | | abfunds.com |
HISTORICAL PERFORMANCE
AVERAGE ANNUAL RETURNS AS OF FEBRUARY 28, 2021 (unaudited)
| | | | | | | | |
| | |
| | | NAV Returns | | | SEC Returns
(reflects applicable
sales charges) | |
| | |
| CLASS A SHARES | | | | | | | | |
| | |
| 1 Year | | | 2.48% | | | | -1.90% | |
| | |
| 5 Years | | | 5.11% | | | | 4.20% | |
| | |
| 10 Years | | | 4.08% | | | | 3.63% | |
| | |
| CLASS C SHARES | | | | | | | | |
| | |
| 1 Year | | | 1.77% | | | | 0.77% | |
| | |
| 5 Years | | | 4.32% | | | | 4.32% | |
| | |
| 10 Years | | | 3.33% | | | | 3.33% | |
| | |
| ADVISOR CLASS SHARES1 | | | | | | | | |
| | |
| 1 Year | | | 2.74% | | | | 2.74% | |
| | |
| 5 Years | | | 5.36% | | | | 5.36% | |
| | |
| 10 Years | | | 4.36% | | | | 4.36% | |
The Fund’s current prospectus fee table shows the Fund’s total annual operating expense ratios as 1.35%, 2.11% and 1.10% for Class A, Class C and Advisor Class shares, respectively, gross of any fee waivers or expense reimbursements. Contractual fee waivers and/or expense reimbursement agreements reduced the Fund’s annual operating expense ratios exclusive of acquired fund fees and expenses, interest expense, taxes, extraordinary expenses, and brokerage commissions and other transaction costs to 0.99%, 1.74% and 0.74% for Class A, Class C and Advisor Class shares, respectively. These waivers/reimbursement agreements may not be terminated before December 31, 2021. Absent reimbursements or waivers, performance would have been lower. The Financial Highlights section of this report sets forth expense ratio data for the current reporting period; the expense ratios shown above may differ from the expense ratios in the Financial Highlights section since they are based on different time periods.
| 1 | This share class is offered at NAV to eligible investors and the SEC returns are the same as the NAV returns. Please note that this share class is for investors purchasing shares through accounts established under certain fee-based programs sponsored and maintained by certain broker-dealers and financial intermediaries, institutional pension plans and/or investment advisory clients of, and certain other persons associated with, the Adviser and its affiliates or the Fund. |
| | |
| |
| abfunds.com | | AB TAX-MANAGED ALL MARKET INCOME PORTFOLIO | 11 |
HISTORICAL PERFORMANCE (continued)
SEC AVERAGE ANNUAL RETURNS
AS OF THE MOST RECENT CALENDAR QUARTER-END
MARCH 31, 2021 (unaudited)
| | | | |
| |
| | | SEC Returns
(reflects applicable
sales charges) | |
| |
| CLASS A SHARES | | | | |
| |
| 1 Year | | | 19.60% | |
| |
| 5 Years | | | 4.24% | |
| |
| 10 Years | | | 3.99% | |
| |
| CLASS C SHARES | | | | |
| |
| 1 Year | | | 23.00% | |
| |
| 5 Years | | | 4.37% | |
| |
| 10 Years | | | 3.69% | |
| |
| ADVISOR CLASS SHARES1 | | | | |
| |
| 1 Year | | | 25.16% | |
| |
| 5 Years | | | 5.40% | |
| |
| 10 Years | | | 4.72% | |
| 1 | Please note that this share class is for investors purchasing shares through accounts established under certain fee-based programs sponsored and maintained by certain broker-dealers and financial intermediaries, institutional pension plans and/or investment advisory clients of, and certain other persons associated with, the Adviser and its affiliates or the Fund. |
| | |
| |
12 | AB TAX-MANAGED ALL MARKET INCOME PORTFOLIO | | abfunds.com |
HISTORICAL PERFORMANCE (continued)
RETURNS AFTER TAXES ON DISTRIBUTIONS
AS OF THE MOST RECENT CALENDAR QUARTER-END
MARCH 31, 2021 (unaudited)
| | | | |
| |
| | | Returns | |
| |
| CLASS A SHARES | | | | |
| |
| 1 Year | | | 18.78% | |
| |
| 5 Years | | | 3.01% | |
| |
| 10 Years | | | 3.13% | |
| |
| CLASS C SHARES | | | | |
| |
| 1 Year | | | 22.38% | |
| |
| 5 Years | | | 3.35% | |
| |
| 10 Years | | | 2.97% | |
| |
| ADVISOR CLASS SHARES1 | | | | |
| |
| 1 Year | | | 24.24% | |
| |
| 5 Years | | | 4.11% | |
| |
| 10 Years | | | 3.81% | |
RETURNS AFTER TAXES ON DISTRIBUTIONS AND SALE OF FUND SHARES
AS OF THE MOST RECENT CALENDAR QUARTER-END
MARCH 31, 2021 (unaudited)
| | | | |
| |
| | | Returns | |
| |
| CLASS A SHARES | | | | |
| |
| 1 Year | | | 12.22% | |
| |
| 5 Years | | | 3.26% | |
| |
| 10 Years | | | 3.16% | |
| |
| CLASS C SHARES | | | | |
| |
| 1 Year | | | 14.09% | |
| |
| 5 Years | | | 3.34% | |
| |
| 10 Years | | | 2.89% | |
| |
| ADVISOR CLASS SHARES1 | | | | |
| |
| 1 Year | | | 15.59% | |
| |
| 5 Years | | | 4.18% | |
| |
| 10 Years | | | 3.76% | |
| 1 | Please note that this share class is for investors purchasing shares through accounts established under certain fee-based programs sponsored and maintained by certain broker-dealers and financial intermediaries, institutional pension plans and/or investment advisory clients of, and certain other persons associated with, the Adviser and its affiliates or the Fund. |
| | |
| |
| abfunds.com | | AB TAX-MANAGED ALL MARKET INCOME PORTFOLIO | 13 |
EXPENSE EXAMPLE
(unaudited)
As a shareholder of the Fund, you incur two types of costs: (1) transaction costs, including sales charges (loads) on purchase payments, contingent deferred sales charges on redemptions and (2) ongoing costs, including management fees; distribution (12b-1) fees; and other Fund expenses. This example is intended to help you understand your ongoing costs (in dollars) of investing in the Fund and to compare these costs with the ongoing costs of investing in other mutual funds.
The Example is based on an investment of $1,000 invested at the beginning of the period and held for the entire period as indicated below.
Actual Expenses
The table below provides information about actual account values and actual expenses. You may use the information, together with the amount you invested, to estimate the expenses that you paid over the period. Simply divide your account value by $1,000 (for example, an $8,600 account value divided by $1,000 = 8.6), then multiply the result by the number under the heading entitled “Expenses Paid During Period” to estimate the expenses you paid on your account during this period.
Hypothetical Example for Comparison Purposes
The table below also provides information about hypothetical account values and hypothetical expenses based on the Fund’s actual expense ratio and an assumed annual rate of return of 5% before expenses, which is not the Fund’s actual return. The hypothetical account values and expenses may not be used to estimate the actual ending account balance or expenses you paid for the period. You may use this information to compare the ongoing costs of investing in the Fund and other funds by comparing this 5% hypothetical example with the 5% hypothetical examples that appear in the shareholder reports of other funds.
Please note that the expenses shown in the table are meant to highlight your ongoing costs only and do not reflect any transactional costs, such as sales charges (loads), or contingent deferred sales charges on redemptions. Therefore, the hypothetical example is useful in comparing ongoing costs only, and will not help you determine the relative total costs of owning different funds. In addition, if these transactional costs were included, your costs would have been higher.
| | |
| |
14 | AB TAX-MANAGED ALL MARKET INCOME PORTFOLIO | | abfunds.com |
EXPENSE EXAMPLE (continued)
| | | | | | | | | | | | | | | | | | | | | | | | |
| | | Beginning
Account
Value
September 1,
2020 | | | Ending
Account
Value
February 28,
2021 | | | Expenses
Paid
During
Period* | | | Annualized
Expense
Ratio* | | | Total
Expenses
Paid
During
Period+ | | | Total
Annualized
Expense
Ratio+ | |
| Class A | | | | | | | | | | | | | | | | | | | | | | | | |
Actual | | $ | 1,000 | | | $ | 1,054.30 | | | $ | 4.99 | | | | 0.98 | % | | $ | 5.04 | | | | 0.99 | % |
Hypothetical** | | $ | 1,000 | | | $ | 1,019.93 | | | $ | 4.91 | | | | 0.98 | % | | $ | 4.96 | | | | 0.99 | % |
| Class C | | | | | | | | | | | | | | | | | | | | | | | | |
Actual | | $ | 1,000 | | | $ | 1,050.70 | | | $ | 8.80 | | | | 1.73 | % | | $ | 8.85 | | | | 1.74 | % |
Hypothetical** | | $ | 1,000 | | | $ | 1,016.22 | | | $ | 8.65 | | | | 1.73 | % | | $ | 8.70 | | | | 1.74 | % |
| Advisor Class | | | | | | | | | | | | | | | | | | | | | | | | |
Actual | | $ | 1,000 | | | $ | 1,055.50 | | | $ | 3.72 | | | | 0.73 | % | | $ | 3.77 | | | | 0.74 | % |
Hypothetical** | | $ | 1,000 | | | $ | 1,021.17 | | | $ | 3.66 | | | | 0.73 | % | | $ | 3.71 | | | | 0.74 | % |
| * | Expenses are equal to the classes’ annualized expense ratios, multiplied by the average account value over the period, multiplied by 181/365 (to reflect the one-half year period). |
| ** | Assumes 5% annual return before expenses. |
| + | In connection with the Fund’s investments in affiliated/unaffiliated underlying portfolios, the Fund incurs no direct expenses, but bears proportionate shares of the fees and expenses (i.e., operating, administrative and investment advisory fees) of the affiliated/unaffiliated underlying portfolios. The Adviser has contractually agreed to waive its fees from the Fund in an amount equal to the Fund’s pro rata share of certain acquired fund fees and expenses of the affiliated underlying portfolios. The Fund’s total expenses are equal to the classes’ annualized expense ratio plus the Fund’s pro rata share of the weighted average expense ratio of the affiliated/unaffiliated underlying portfolios in which it invests, multiplied by the average account value over the period, multiplied by 181/365 (to reflect the one-half year period). |
| | |
| |
| abfunds.com | | AB TAX-MANAGED ALL MARKET INCOME PORTFOLIO | 15 |
PORTFOLIO SUMMARY
February 28, 2021 (unaudited)
PORTFOLIO STATISTICS
Net Assets ($mil): $88.4
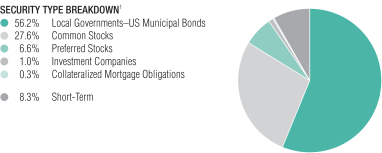
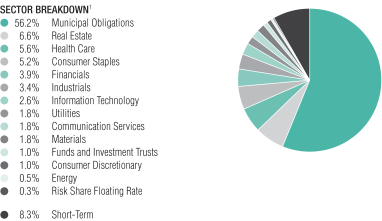
| 1 | All data are as of February 28, 2021. The Fund’s security type and sector breakdowns are expressed as a percentage of total investments and may vary over time. The Fund also enters into derivative transactions, which may be used for hedging or investment purposes (see “Portfolio of Investments” section of the report for additional details). |
Please note: The sector classifications presented herein are based on the Global Industry Classification Standard (GICS) which was developed by Morgan Stanley Capital International and Standard & Poor’s. The components are divided into sector, industry group, and industry sub-indices as classified by the GICS for each of the market capitalization indices in the broad market. These sector classifications are broadly defined. The “Portfolio of Investments” section of the report reflects more specific industry information and is consistent with the investment restrictions discussed in the Fund’s prospectus.
| | |
| |
16 | AB TAX-MANAGED ALL MARKET INCOME PORTFOLIO | | abfunds.com |
PORTFOLIO SUMMARY (continued)
February 28, 2021 (unaudited)
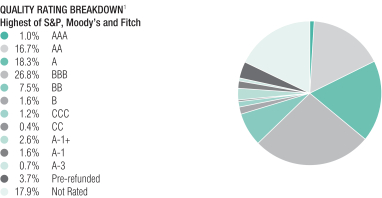
| 1 | All data are as of February 28, 2021. The Fund’s quality rating breakdown is expressed as a percentage of the Fund’s total investments in municipal securities and may vary over time. The Fund also enters into derivative transactions, which may be used for hedging or investment purposes (see “Portfolio of Investments” section of the report for additional details). The quality ratings are determined by using the S&P Global Ratings (“S&P”), Moody’s Investors Services, Inc. (“Moody’s”) and Fitch Ratings, Ltd. (“Fitch”). The Fund considers the credit ratings issued by S&P, Moody’s and Fitch and uses the highest rating issued by the agencies. These ratings are a measure of the quality and safety of a bond or portfolio, based on the issuer’s financial condition. AAA is the highest (best) and D is the lowest (worst). If applicable, the pre-refunded category includes bonds which are secured by U.S. Government securities and therefore are deemed high-quality investment grade by the Adviser. If applicable, Not Applicable (N/A) includes non-credit worthy investments such as, equities, currency contracts, futures and options. If applicable, the Not Rated category includes bonds that are not rated by a nationally recognized statistical rating organization. The Adviser evaluates the creditworthiness of non-rated securities based on a number of factors including, but not limited to, cash flows, enterprise value and economic environment. |
| | |
| |
| abfunds.com | | AB TAX-MANAGED ALL MARKET INCOME PORTFOLIO | 17 |
PORTFOLIO OF INVESTMENTS
February 28, 2021 (unaudited)
| | | | | | | | |
| | | Principal
Amount
(000) | | | U.S. $ Value | |
| |
MUNICIPAL OBLIGATIONS – 55.5% | | | | | | | | |
Long-Term Municipal Bonds – 53.9% | | | | | | | | |
Alabama – 0.8% | | | | | | | | |
Black Belt Energy Gas District
(Morgan Stanley)
Series 2019A
4.00%, 12/01/2049 | | $ | 265 | | | $ | 301,101 | |
Lower Alabama Gas District (The)
(Goldman Sachs Group, Inc. (The))
Series 2016A
5.00%, 09/01/2046 | | | 100 | | | | 140,552 | |
Tuscaloosa County Industrial Development Authority
(Hunt Refining Co.)
Series 2019A
5.25%, 05/01/2044(a) | | | 250 | | | | 284,052 | |
| | | | | | | | |
| | | | | | | 725,705 | |
| | | | | | | | |
Arizona – 2.1% | | | | | | | | |
Arizona Department of Transportation State Highway Fund Revenue
Series 2011A
5.00%, 07/01/2025 (Pre-refunded/ETM) | | | 1,185 | | | | 1,204,067 | |
Arizona Industrial Development Authority
(Arizona Industrial Development Authority)
Series 20192 – Class A
3.625%, 05/20/2033 | | | 142 | | | | 153,533 | |
Arizona Industrial Development Authority
(Legacy Cares, Inc.)
Series 2020
7.75%, 07/01/2050(a) | | | 100 | | | | 107,740 | |
Glendale Industrial Development Authority
(Beatitudes Campus Obligated Group (The))
Series 2017
5.00%, 11/15/2040 | | | 235 | | | | 252,218 | |
Tempe Industrial Development Authority
(Mirabella at ASU, Inc.)
Series 2017A
6.125%, 10/01/2047(a) | | | 110 | | | | 116,988 | |
| | | | | | | | |
| | | | | | | 1,834,546 | |
| | | | | | | | |
California – 0.8% | | | | | | | | |
California School Finance Authority
(Bright Star Schools Obligated Group)
Series 2017
5.00%, 06/01/2054(a) | | | 250 | | | | 272,770 | |
Golden State Tobacco Securitization Corp.
Series 2018A
5.00%, 06/01/2047 | | | 200 | | | | 206,870 | |
| | |
| |
18 | AB TAX-MANAGED ALL MARKET INCOME PORTFOLIO | | abfunds.com |
PORTFOLIO OF INVESTMENTS (continued)
| | | | | | | | |
| | | Principal
Amount
(000) | | | U.S. $ Value | |
| |
Los Angeles Department of Water & Power
(Los Angeles Department of Water & Power Power System Revenue)
Series 2020A
5.00%, 07/01/2029 | | $ | 180 | | | $ | 237,305 | |
| | | | | | | | |
| | | | | | | 716,945 | |
| | | | | | | | |
Colorado – 0.9% | | | | | | | | |
City & County of Denver Co. Airport System Revenue
(Denver Intl Airport)
Series 2018A
5.00%, 12/01/2028 | | | 545 | | | | 689,768 | |
Douglas County Housing Partnership
(Bridgewater Castle Rock ALF LLC)
5.375%, 01/01/2041(a) | | | 100 | | | | 97,201 | |
| | | | | | | | |
| | | | | | | 786,969 | |
| | | | | | | | |
Connecticut – 1.4% | | | | | | | | |
State of Connecticut Special Tax Revenue
Series 2012
5.00%, 01/01/2027 | | | 1,135 | | | | 1,230,102 | |
| | | | | | | | |
| | |
District of Columbia – 0.1% | | | | | | | | |
District of Columbia Tobacco Settlement Financing Corp.
Zero Coupon, 06/15/2055 | | | 625 | | | | 50,463 | |
| | | | | | | | |
| | |
Florida – 5.2% | | | | | | | | |
Cape Coral Health Facilities Authority
(Gulf Care, Inc. Obligated Group)
Series 2015
6.00%, 07/01/2050(a) | | | 270 | | | | 284,777 | |
Capital Projects Finance Authority/FL
(CAPFA Capital Corp. 2000F)
Series 2020A
5.00%, 10/01/2034 | | | 500 | | | | 590,940 | |
Capital Trust Agency, Inc.
(Aviva Senior Life)
Series 2017
5.00%, 07/01/2046(a) | | | 240 | | | | 243,624 | |
County of Broward FL Airport System Revenue
Series 2019A
5.00%, 10/01/2036 | | | 500 | | | | 612,785 | |
County of Miami-Dade FL
(County of Miami-Dade FL Spl Tax)
Series 2012A
5.00%, 10/01/2025 (Pre-refunded/ETM) | | | 560 | | | | 602,862 | |
| | |
| |
| abfunds.com | | AB TAX-MANAGED ALL MARKET INCOME PORTFOLIO | 19 |
PORTFOLIO OF INVESTMENTS (continued)
| | | | | | | | |
| | | Principal
Amount
(000) | | | U.S. $ Value | |
| |
County of Miami-Dade FL Aviation Revenue
Series 2014B
5.00%, 10/01/2025 | | $ | 665 | | | $ | 768,467 | |
Florida Higher Educational Facilities Financial Authority
(Ringling College of Art and Design, Inc.)
5.00%, 03/01/2049 | | | 315 | | | | 357,868 | |
North Broward Hospital District
Series 2017B
5.00%, 01/01/2037-01/01/2048 | | | 425 | | | | 492,639 | |
Tampa Bay Water
Series 2011A
5.00%, 10/01/2023 | | | 650 | | | | 668,285 | |
| | | | | | | | |
| | | | | | | 4,622,247 | |
| | | | | | | | |
Georgia – 1.9% | | | | | | | | |
Augusta Development Authority
(AU Health System Obligated Group)
Series 2018
5.00%, 07/01/2030 | | | 200 | | | | 232,820 | |
City of Atlanta GA Department of Aviation
Series 2014A
5.00%, 01/01/2028 | | | 625 | | | | 702,319 | |
Main Street Natural Gas, Inc.
(Royal Bank of Canada)
Series 2018C
4.00%, 08/01/2048 | | | 450 | | | | 489,483 | |
Private Colleges & Universities Authority
(Savannah College of Art & Design, Inc.)
Series 2014
5.00%, 04/01/2044 | | | 210 | | | | 228,215 | |
| | | | | | | | |
| | | | | | | 1,652,837 | |
| | | | | | | | |
Guam – 0.4% | | | | | | | | |
Territory of Guam
(Territory of Guam Business Privilege Tax)
Series 2011A
5.125%, 01/01/2042 | | | 300 | | | | 306,765 | |
| | | | | | | | |
| | |
Illinois – 6.7% | | | | | | | | |
Chicago Board of Education
Series 2012A
5.00%, 12/01/2042 | | | 950 | | | | 992,683 | |
Series 2016A
7.00%, 12/01/2044 | | | 100 | | | | 120,094 | |
Series 2017B
6.75%, 12/01/2030(a) | | | 135 | | | | 176,317 | |
7.00%, 12/01/2042(a) | | | 100 | | | | 127,704 | |
| | |
| |
20 | AB TAX-MANAGED ALL MARKET INCOME PORTFOLIO | | abfunds.com |
PORTFOLIO OF INVESTMENTS (continued)
| | | | | | | | |
| | | Principal
Amount
(000) | | | U.S. $ Value | |
| |
Chicago O’Hare International Airport
(TrIPs Obligated Group)
Series 2018
5.00%, 07/01/2033 | | $ | 105 | | | $ | 126,065 | |
City of Chicago IL
Series 2014A
5.00%, 01/01/2035 | | | 100 | | | | 106,953 | |
Illinois Finance Authority
(Park Place of Elmhurst Obligated Group)
Series 2016A
6.44%, 05/15/2055 | | | 498 | | | | 448,200 | |
Illinois Finance Authority
(Ascension Health Credit Group)
Series 2016C
5.00%, 02/15/2041 | | | 415 | | | | 489,642 | |
Illinois Finance Authority
(CHF-Chicago LLC)
Series 2017A
5.00%, 02/15/2047 | | | 210 | | | | 229,318 | |
Illinois Finance Authority
(Rosalind Franklin University of Medicine & Science)
Series 2017C
5.00%, 08/01/2049 | | | 425 | | | | 479,158 | |
Metropolitan Pier & Exposition Authority
Series 2012
Zero Coupon, 12/15/2041-12/15/2050 | | | 675 | | | | 290,553 | |
Series 2017A
5.00%, 06/15/2057 | | | 115 | | | | 134,088 | |
Series 2017B
Zero Coupon, 12/15/2054 | | | 150 | | | | 45,150 | |
Railsplitter Tobacco Settlement Authority
Series 2017
5.00%, 06/01/2023 | | | 365 | | | | 400,690 | |
State of Illinois
Series 2013
5.00%, 07/01/2022 | | | 315 | | | | 331,408 | |
Series 2016
5.00%, 02/01/2027-02/01/2028 | | | 650 | | | | 755,701 | |
Series 2017A
5.00%, 12/01/2025 | | | 135 | | | | 154,303 | |
Series 2017D
5.00%, 11/01/2024-11/01/2028 | | | 480 | | | | 545,358 | |
| | | | | | | | |
| | | | | | | 5,953,385 | |
| | | | | | | | |
Indiana – 0.2% | |
Indiana Finance Authority
(RES Polyflow Indiana LLC)
7.00%, 03/01/2039(a) | | | 185 | | | | 169,812 | |
| | | | | | | | |
| | |
| |
| abfunds.com | | AB TAX-MANAGED ALL MARKET INCOME PORTFOLIO | 21 |
PORTFOLIO OF INVESTMENTS (continued)
| | | | | | | | |
| | | Principal
Amount
(000) | | | U.S. $ Value | |
| |
Iowa – 1.1% | |
Iowa Finance Authority
(Iowa Fertilizer Co. LLC)
Series 2013B
5.25%, 12/01/2050 | | $ | 110 | | | $ | 121,928 | |
Iowa Finance Authority
(Iowa Finance Authority State Revolving Fund)
Series 2020A
5.00%, 08/01/2026 | | | 385 | | | | 474,736 | |
Xenia Rural Water District
Series 2016
5.00%, 12/01/2031 | | | 340 | | | | 396,474 | |
| | | | | | | | |
| | | | | | | 993,138 | |
| | | | | | | | |
Kansas – 0.3% | |
Wyandotte County-Kansas City Unified Government
(Wyandotte County-Kansas City Unified Government Sales Tax)
Series 2018
4.50%, 06/01/2040 | | | 280 | | | | 287,398 | |
| | | | | | | | |
|
Kentucky – 1.2% | |
Kentucky Economic Development Finance Authority
(Owensboro Health, Inc. Obligated Group)
Series 2017A
5.00%, 06/01/2037 | | | 315 | | | | 344,569 | |
Kentucky Economic Development Finance Authority
(Baptist Healthcare System Obligated Group)
Series 2017B
5.00%, 08/15/2037 | | | 410 | | | | 487,904 | |
Kentucky Public Energy Authority
(Morgan Stanley)
Series 2019C
4.00%, 02/01/2050 | | | 220 | | | | 257,189 | |
| | | | | | | | |
| | | | | | | 1,089,662 | |
| | | | | | | | |
Louisiana – 0.5% | |
New Orleans Aviation Board
Series 2017B
5.00%, 01/01/2048 | | | 400 | | | | 456,652 | |
| | | | | | | | |
|
Maryland – 0.4% | |
City of Baltimore MD
(East Baltimore Research Park Project)
Series 2017A
5.00%, 09/01/2038 | | | 100 | | | | 107,926 | |
| | |
| |
22 | AB TAX-MANAGED ALL MARKET INCOME PORTFOLIO | | abfunds.com |
PORTFOLIO OF INVESTMENTS (continued)
| | | | | | | | |
| | | Principal
Amount
(000) | | | U.S. $ Value | |
| |
County of Frederick MD
(Mount St. Mary’s University, Inc.)
Series 2017A
5.00%, 09/01/2045(a) | | $ | 215 | | | $ | 232,559 | |
| | | | | | | | |
| | | | | | | 340,485 | |
| | | | | | | | |
Massachusetts – 1.9% | |
Commonwealth of Massachusetts
Series 2019C
5.00%, 05/01/2022 | | | 355 | | | | 375,057 | |
Massachusetts Development Finance Agency
(Merrimack College)
Series 2012A
5.25%, 07/01/2042 | | | 635 | | | | 669,703 | |
Massachusetts Development Finance Agency
(Lawrence General Hospital Obligated Group)
Series 2017
5.00%, 07/01/2047 | | | 320 | | | | 291,309 | |
Massachusetts Development Finance Agency
(Zero Waste Solutions LLC)
Series 2017
8.00%, 12/01/2022(b) | | | 235 | | | | 224,538 | |
Series 2017A
7.75%, 12/01/2044(b) | | | 100 | | | | 95,300 | |
| | | | | | | | |
| | | | | | | 1,655,907 | |
| | | | | | | | |
Michigan – 1.8% | |
City of Detroit MI
5.00%, 04/01/2036-04/01/2037 | | | 65 | | | | 75,234 | |
Grand Rapids Economic Development Corp.
(Beacon Hill at Eastgate)
Series 2017A
5.00%, 11/01/2047 | | | 325 | | | | 328,650 | |
Michigan Finance Authority
(Great Lakes Water Authority Water Supply System)
AGM Series 2014D2
5.00%, 07/01/2028 | | | 500 | | | | 571,035 | |
Michigan Finance Authority
(Michigan Finance Authority Tobacco Settlement Revenue)
Series 2020B
Zero Coupon, 06/01/2065 | | | 235 | | | | 29,004 | |
Michigan State Hospital Finance Authority
(Trinity Health Corp.)
Series 2017C
5.00%, 12/01/2023 | | | 445 | | | | 500,647 | |
| | |
| |
| abfunds.com | | AB TAX-MANAGED ALL MARKET INCOME PORTFOLIO | 23 |
PORTFOLIO OF INVESTMENTS (continued)
| | | | | | | | |
| | | Principal
Amount
(000) | | | U.S. $ Value | |
| |
Michigan Tobacco Settlement Finance Authority
(Tobacco Settlement Financing Corp./MI)
Series 2008C
Zero Coupon, 06/01/2058 | | $ | 1,000 | | | $ | 48,480 | |
| | | | | | | | |
| | | | | | | 1,553,050 | |
| | | | | | | | |
Minnesota – 0.2% | |
City of Minneapolis MN/St. Paul Housing & Redevelopment Authority
(Allina Health Obligated Group)
NATL 0.105%, 08/01/2028(c) | | | 175 | | | | 169,969 | |
| | | | | | | | |
|
Missouri – 0.9% | |
Cape Girardeau County Industrial Development Authority
(SoutheastHEALTH Obligated Group)
Series 2017A
5.00%, 03/01/2036 | | | 470 | | | | 504,103 | |
Lee’s Summit Industrial Development Authority
(John Knox Village Obligated Group)
Series 2016A
5.00%, 08/15/2046 | | | 245 | | | | 259,301 | |
| | | | | | | | |
| | | | | | | 763,404 | |
| | | | | | | | |
Nevada – 0.1% | |
State of Nevada Department of Business & Industry
(Fulcrum Sierra Biofuels LLC)
Series 2018
6.95%, 02/15/2038(a) | | | 100 | | | | 101,971 | |
| | | | | | | | |
|
New Jersey – 5.0% | |
New Jersey Economic Development Authority
(New Jersey Economic Development Authority State Lease)
Series 2013
5.00%, 03/01/2030 | | | 685 | | | | 733,498 | |
Series 2014P
5.00%, 06/15/2029 | | | 500 | | | | 557,200 | |
New Jersey Economic Development Authority
(North Star Academy Charter School of Newark, Inc.)
Series 2017
5.00%, 07/15/2047 | | | 415 | | | | 462,750 | |
New Jersey Economic Development Authority
(Port Newark Container Terminal LLC)
Series 2017
5.00%, 10/01/2047 | | | 415 | | | | 461,082 | |
| | |
| |
24 | AB TAX-MANAGED ALL MARKET INCOME PORTFOLIO | | abfunds.com |
PORTFOLIO OF INVESTMENTS (continued)
| | | | | | | | |
| | | Principal
Amount
(000) | | | U.S. $ Value | |
| |
New Jersey Transportation Trust Fund Authority
(New Jersey Transportation Trust Fund Authority State Lease)
5.00%, 06/15/2038 | | $ | 250 | | | $ | 295,878 | |
New Jersey Turnpike Authority
Series 2014A
5.00%, 01/01/2029 | | | 675 | | | | 768,973 | |
Series 2021A
4.00%, 01/01/2042 | | | 500 | | | | 579,965 | |
Tobacco Settlement Financing Corp./NJ
Series 2018B
5.00%, 06/01/2046 | | | 515 | | | | 594,670 | |
| | | | | | | | |
| | | | | | | 4,454,016 | |
| | | | | | | | |
New York – 1.8% | |
County of Nassau NY
Series 2017C
5.00%, 10/01/2026 | | | 225 | | | | 273,373 | |
Metropolitan Transportation Authority
Series 2019D
5.00%, 09/01/2022 | | | 310 | | | | 329,149 | |
New York City Transitional Finance Authority Building Aid Revenue
(New York City Transitional Finance Authority Building Aid Revenue State Lease)
Series 2018S
5.00%, 07/15/2032 | | | 195 | | | | 242,718 | |
New York Counties Tobacco Trust V
Zero Coupon, 06/01/2050 | | | 550 | | | | 80,526 | |
New York Transportation Development Corp.
(Delta Air Lines, Inc.)
4.375%, 10/01/2045 | | | 100 | | | | 114,327 | |
New York Transportation Development Corp.
(Laguardia Gateway Partners LLC)
Series 2016A
5.00%, 07/01/2041 | | | 460 | | | | 514,680 | |
| | | | | | | | |
| | | | | | | 1,554,773 | |
| | | | | | | | |
North Carolina – 0.3% | |
North Carolina Medical Care Commission
(United Church Homes & Services Obligated Group)
Series 2017
5.00%, 09/01/2041 | | | 250 | | | | 259,105 | |
| | | | | | | | |
|
Ohio – 3.1% | |
Buckeye Tobacco Settlement Financing Authority Series 2020B
Zero Coupon, 06/01/2057 | | | 395 | | | | 59,171 | |
5.00%, 06/01/2055 | | | 1,000 | | | | 1,125,150 | |
| | |
| |
| abfunds.com | | AB TAX-MANAGED ALL MARKET INCOME PORTFOLIO | 25 |
PORTFOLIO OF INVESTMENTS (continued)
| | | | | | | | |
| | | Principal
Amount
(000) | | | U.S. $ Value | |
| |
County of Allen OH Hospital Facilities Revenue
(Bon Secours Mercy Health, Inc.)
Series 2017A
5.00%, 08/01/2028 | | $ | 315 | | | $ | 397,905 | |
County of Cuyahoga/OH
(MetroHealth System (The))
Series 2017
5.00%, 02/15/2042 | | | 560 | | | | 631,383 | |
County of Miami OH
(Kettering Health Network Obligated Group)
5.00%, 08/01/2033 | | | 195 | | | | 241,728 | |
Ohio Air Quality Development Authority
(Energy Harbor Generation LLC)
Series 2009D
4.25%, 08/01/2029 | | | 250 | | | | 254,467 | |
Ohio Water Development Authority Water Pollution Control Loan Fund
(Energy Harbor Nuclear Generation LLC)
Series 2016A
4.375%, 06/01/2033 | | | 45 | | | | 46,350 | |
| | | | | | | | |
| | | | | | | 2,756,154 | |
| | | | | | | | |
Pennsylvania – 2.0% | |
Allegheny County Hospital Development Authority
(UPMC Obligated Group)
5.00%, 07/15/2030 | | | 305 | | | | 394,310 | |
Allentown Neighborhood Improvement Zone Development Authority
Series 2017
5.00%, 05/01/2042(a) | | | 220 | | | | 249,216 | |
Commonwealth of Pennsylvania
Series 2016
5.00%, 09/15/2023 | | | 600 | | | | 670,968 | |
Crawford County Hospital Authority
(Meadville Medical Center Obligated Group)
Series 2016A
6.00%, 06/01/2051 | | | 215 | | | | 230,944 | |
Pennsylvania Economic Development Financing Authority
(PA Bridges Finco LP)
Series 2015
5.00%, 12/31/2034 | | | 220 | | | | 256,870 | |
| | | | | | | | |
| | | | | | | 1,802,308 | |
| | | | | | | | |
| | |
| |
26 | AB TAX-MANAGED ALL MARKET INCOME PORTFOLIO | | abfunds.com |
PORTFOLIO OF INVESTMENTS (continued)
| | | | | | | | |
| | | Principal
Amount
(000) | | | U.S. $ Value | |
| |
Puerto Rico – 3.7% | |
Commonwealth of Puerto Rico
Series 2006A
5.25%, 07/01/2023 | | $ | 20 | | | $ | 17,275 | |
Series 2011A
5.75%, 07/01/2024(d)(e) | | | 40 | | | | 33,650 | |
Series 2012A
5.50%, 07/01/2039(d)(e) | | | 65 | | | | 53,137 | |
Series 2014A
8.00%, 07/01/2035(d)(e) | | | 100 | | | | 77,625 | |
GDB Debt Recovery Authority of Puerto Rico
Series 2018
7.50%, 08/20/2040 | | | 90 | | | | 76,424 | |
Puerto Rico Commonwealth Aqueduct & Sewer Authority
Series 2008A
6.125%, 07/01/2024 | | | 20 | | | | 21,783 | |
Series 2012A
5.00%, 07/01/2022-07/01/2033 | | | 90 | | | | 94,223 | |
5.125%, 07/01/2037 | | | 25 | | | | 26,214 | |
5.25%, 07/01/2029-07/01/2042 | | | 120 | | | | 126,026 | |
5.50%, 07/01/2028 | | | 30 | | | | 31,605 | |
5.75%, 07/01/2037 | | | 30 | | | | 31,704 | |
6.00%, 07/01/2047 | | | 30 | | | | 31,803 | |
Puerto Rico Electric Power Authority
Series 2007T
5.00%, 07/01/2032 | | | 65 | | | | 58,500 | |
5.00%, 07/01/2037(d)(e) | | | 110 | | | | 99,000 | |
AGM Series 2007V
5.25%, 07/01/2031 | | | 245 | | | | 298,518 | |
Series 2008W
5.00%, 07/01/2028 | | | 90 | | | | 81,000 | |
5.375%, 07/01/2024 | | | 45 | | | | 40,669 | |
5.50%, 07/01/2036(d)(e) | | | 100 | | | | 90,500 | |
Series 2010A
5.25%, 07/01/2030 | | | 55 | | | | 49,637 | |
Series 2010C
5.00%, 07/01/2021(d)(e) | | | 25 | | | | 22,500 | |
5.25%, 07/01/2028 | | | 65 | | | | 58,662 | |
Series 2010D
5.00%, 07/01/2021(d)(e) | | | 15 | | | | 13,500 | |
Series 2010X
5.25%, 07/01/2040(d)(e) | | | 70 | | | | 63,175 | |
Series 2010Z
5.25%, 07/01/2024 | | | 25 | | | | 22,562 | |
Series 2012A
5.00%, 07/01/2029 | | | 40 | | | | 36,000 | |
| | |
| |
| abfunds.com | | AB TAX-MANAGED ALL MARKET INCOME PORTFOLIO | 27 |
PORTFOLIO OF INVESTMENTS (continued)
| | | | | | | | |
| | | Principal
Amount
(000) | | | U.S. $ Value | |
| |
Puerto Rico Highway & Transportation Authority
NATL Series 2007N
5.25%, 07/01/2032 | | $ | 330 | | | $ | 369,864 | |
Puerto Rico Industrial Tourist Educational Medical & Environmental Control Facilities Financing Auth
(AES Puerto Rico LP)
Series 2000
6.625%, 06/01/2026 | | | 225 | | | | 232,312 | |
Puerto Rico Sales Tax Financing Corp. Sales Tax Revenue
Series 2018A
Zero Coupon, 07/01/2024-07/01/2046 | | | 434 | | | | 141,344 | |
Series 2019A
4.329%, 07/01/2040 | | | 100 | | | | 107,315 | |
5.00%, 07/01/2058 | | | 772 | | | | 853,091 | |
| | | | | | | | |
| | | | | | | 3,259,618 | |
| | | | | | | | |
Tennessee – 0.6% | |
Bristol Industrial Development Board
(Bristol Industrial Development Board Sales Tax)
Series 2016A
5.125%, 12/01/2042(a) | | | 280 | | | | 281,963 | |
Metropolitan Government Nashville & Davidson County Health & Educational Facilities Board
(Trousdale Foundation Obligated Group)
Series 2018A
6.25%, 04/01/2049(a) | | | 100 | | | | 46,951 | |
Tennessee Housing Development Agency
Series 2017
4.00%, 07/01/2048 | | | 215 | | | | 233,316 | |
| | | | | | | | |
| | | | | | | 562,230 | |
| | | | | |
Texas – 4.4% | |
City of Houston TX
Series 2017A
5.00%, 03/01/2026 | | | 405 | | | | 490,921 | |
Harris County-Houston Sports Authority
AGM Series 2014A
5.00%, 11/15/2025 | | | 615 | | | | 701,641 | |
Irving Hospital Authority
(Baylor Medical Center at Irving)
Series 2017A
5.00%, 10/15/2044 | | | 500 | | | | 567,275 | |
New Hope Cultural Education Facilities Finance Corp.
(BSPV – Plano LLC)
7.25%, 12/01/2053 | | | 35 | | | | 30,787 | |
| | |
| |
28 | AB TAX-MANAGED ALL MARKET INCOME PORTFOLIO | | abfunds.com |
PORTFOLIO OF INVESTMENTS (continued)
| | | | | | | | |
| | | Principal
Amount
(000) | | | U.S. $ Value | |
| |
New Hope Cultural Education Facilities Finance Corp.
(Longhorn Village)
Series 2017
5.00%, 01/01/2037 | | $ | 325 | | | $ | 351,835 | |
Red River Education Finance Corp.
(St. Edward’s University, Inc.)
Series 2016
5.00%, 06/01/2046 | | | 90 | | | | 99,656 | |
Tarrant County Cultural Education Facilities Finance Corp.
(Trinity Terrace Project)
Series 2014A-1
5.00%, 10/01/2044 | | | 300 | | | | 325,530 | |
Tarrant County Cultural Education Facilities Finance Corp.
(Stayton at Museum Way)
Series 2020A
5.75%, 12/01/2054 | | | 180 | | | | 191,776 | |
Texas Private Activity Bond Surface Transportation Corp.
(NTE Mobility Partners Segments 3 LLC)
5.00%, 06/30/2058 | | | 230 | | | | 272,782 | |
University of North Texas System
Series 2020A
5.00%, 04/15/2025 | | | 400 | | | | 471,376 | |
Uptown Development Authority
Series 2017A
5.00%, 09/01/2040 | | | 325 | | | | 365,037 | |
| | | | | | | | |
| | | | 3,868,616 | |
| | | | | |
Utah – 0.3% | |
Salt Lake City Corp. Airport Revenue
Series 2018A
5.00%, 07/01/2048 | | | 255 | | | | 298,967 | |
| | | | | | | | |
|
Vermont – 0.4% | |
Vermont Economic Development Authority
(Casella Waste Systems, Inc.)
Series 2013
4.625%, 04/01/2036(a) | | | 100 | | | | 113,511 | |
Vermont Economic Development Authority
(Wake Robin Corp.)
Series 2017A
5.00%, 05/01/2047 | | | 235 | | | | 241,249 | |
| | | | | | | | |
| | | | 354,760 | |
| | | | | |
| | |
| |
| abfunds.com | | AB TAX-MANAGED ALL MARKET INCOME PORTFOLIO | 29 |
PORTFOLIO OF INVESTMENTS (continued)
| | | | | | | | |
| | | Principal
Amount
(000) | | | U.S. $ Value | |
| |
Virginia – 0.9% | |
Richmond Redevelopment & Housing Authority
(American Tobacco Holdings LLC)
Series 2017
5.55%, 01/01/2037(a) | | $ | 220 | | | $ | 228,290 | |
Tobacco Settlement Financing Corp./VA
Series 2007B1
5.00%, 06/01/2047 | | | 410 | | | | 412,251 | |
Virginia College Building Authority
(Virginia College Building Authority State Lease)
5.00%, 02/01/2027 | | | 155 | | | | 193,173 | |
| | | | | | | | |
| | | | 833,714 | |
| | | | | |
Washington – 1.3% | |
Kalispel Tribe of Indians
Series 2018B
5.25%, 01/01/2038(a)(f) | | | 155 | | | | 175,468 | |
King County Public Hospital District No. 1
Series 2018
5.00%, 12/01/2031 | | | 265 | | | | 322,168 | |
Washington State Housing Finance Commission
(Mirabella)
Series 2012A
6.75%, 10/01/2047(a) | | | 340 | | | | 352,529 | |
Washington State Housing Finance Commission
(Presbyterian Retirement Communities Northwest Obligated Group)
Series 2016A
5.00%, 01/01/2046(a) | | | 315 | | | | 336,480 | |
| | | | | | | | |
| | | | 1,186,645 | |
| | | | | |
Wisconsin – 1.2% | |
Wisconsin Public Finance Authority
(Roseman University of Health Sciences)
5.00%, 04/01/2030(a) | | | 100 | | | | 119,212 | |
Wisconsin Public Finance Authority
(Bancroft Neurohealth Obligated Group)
Series 2016
5.125%, 06/01/2048(a) | | | 160 | | | | 172,833 | |
Wisconsin Public Finance Authority
(Celanese US Holdings LLC)
Series 2016A
5.00%, 01/01/2024 | | | 265 | | | | 291,768 | |
Wisconsin Public Finance Authority
(Gannon University)
Series 2017
5.00%, 05/01/2042-05/01/2047 | | | 410 | | | | 455,254 | |
| | | | | | | | |
| | | | | | | 1,039,067 | |
| | | | | |
| | | | 47,691,385 | |
| | | | | | | | |
| | |
| |
30 | AB TAX-MANAGED ALL MARKET INCOME PORTFOLIO | | abfunds.com |
PORTFOLIO OF INVESTMENTS (continued)
| | | | | | | | |
| | | Principal
Amount
(000) | | | U.S. $ Value | |
| |
Short-Term Municipal Notes – 1.6% | |
California – 0.6% | |
State of California
0.01%, 05/01/2034(g) | | $ | 500 | | | $ | 500,000 | |
| | | | | | | | |
|
Colorado – 0.1% | |
Colorado Educational & Cultural Facilities Authority
(Michael Ann Russell Jewish Community Center, Inc.)
0.01%, 01/01/2039(g) | | | 145 | | | | 145,000 | |
| | | | | | | | |
|
New Jersey – 0.6% | |
New Jersey Health Care Facilities Financing Authority
(Virtua Health Obligated Group)
Series 2009C
0.11%, 07/01/2043(g) | | | 500 | | | | 500,000 | |
| | | | | | | | |
|
Texas – 0.3% | |
State of Texas
4.00%, 08/26/2021 | | | 280 | | | | 285,278 | |
| | | | | | | | |
| | | | 1,430,278 | |
| | | | | | | | |
Total Municipal Obligations
(cost $46,498,970) | | | | | | | 49,121,663 | |
| | | | | |
| | |
| | | Shares | | | | |
COMMON STOCKS – 27.3% | |
Health Care – 5.6% | |
Biotechnology – 1.1% | |
AbbVie, Inc. | | | 4,033 | | | | 434,515 | |
Amgen, Inc. | | | 1,339 | | | | 301,168 | |
Gilead Sciences, Inc. | | | 2,864 | | | | 175,850 | |
| | | | | | | | |
| | | | 911,533 | |
| | | | | |
Health Care Providers & Services – 0.3% | |
Alfresa Holdings Corp. | | | 429 | | | | 8,295 | |
Cardinal Health, Inc. | | | 668 | | | | 34,415 | |
CVS Health Corp. | | | 2,990 | | | | 203,709 | |
Sonic Healthcare Ltd. | | | 1,034 | | | | 25,351 | |
| | | | | | | | |
| | | | 271,770 | |
| | | | | |
Pharmaceuticals – 4.2% | |
Astellas Pharma, Inc. | | | 4,254 | | | | 67,261 | |
Bayer AG | | | 2,244 | | | | 136,303 | |
Bristol-Myers Squibb Co. | | | 5,150 | | | | 315,849 | |
GlaxoSmithKline PLC | | | 11,464 | | | | 191,286 | |
Johnson & Johnson | | | 6,016 | | | | 953,295 | |
| | |
| |
| abfunds.com | | AB TAX-MANAGED ALL MARKET INCOME PORTFOLIO | 31 |
PORTFOLIO OF INVESTMENTS (continued)
| | | | | | | | |
Company | |
Shares | | | U.S. $ Value | |
| |
Merck & Co., Inc. | | | 5,779 | | | $ | 419,671 | |
Novartis AG | | | 5,073 | | | | 436,919 | |
Orion Oyj – Class B | | | 241 | | | | 9,887 | |
Pfizer, Inc. | | | 12,697 | | | | 425,223 | |
Roche Holding AG | | | 1,606 | | | | 526,862 | |
Sanofi | | | 2,589 | | | | 237,594 | |
| | | | | | | | |
| | | | 3,720,150 | |
| | | | | |
| | | | 4,903,453 | |
| | | | | | | | |
Consumer Staples – 5.1% | |
Beverages – 1.1% | |
Asahi Group Holdings Ltd. | | | 1,037 | | | | 45,272 | |
Coca-Cola Amatil Ltd. | | | 1,158 | | | | 11,956 | |
Coca-Cola Co. (The) | | | 9,324 | | | | 456,783 | |
Coca-Cola HBC AG(e) | | | 457 | | | | 14,331 | |
PepsiCo, Inc. | | | 3,164 | | | | 408,757 | |
Treasury Wine Estates Ltd. | | | 1,647 | | | | 13,830 | |
| | | | | | | | |
| | | | 950,929 | |
| | | | | |
Food & Staples Retailing – 0.4% | |
Etablissements Franz Colruyt NV | | | 126 | | | | 7,548 | |
ICA Gruppen AB | | | 229 | | | | 10,867 | |
Kesko Oyj – Class B | | | 624 | | | | 15,877 | |
Koninklijke Ahold Delhaize NV | | | 2,515 | | | | 66,408 | |
Seven & i Holdings Co., Ltd. | | | 1,721 | | | | 65,595 | |
Sysco Corp. | | | 1,104 | | | | 87,912 | |
Tesco PLC | | | 17,666 | | | | 55,526 | |
Walgreens Boots Alliance, Inc. | | | 1,682 | | | | 80,618 | |
Wm Morrison Supermarkets PLC | | | 5,502 | | | | 13,139 | |
| | | | | | | | |
| | | | 403,490 | |
| | | | | |
Food Products – 1.3% | |
Archer-Daniels-Midland Co. | | | 1,269 | | | | 71,800 | |
Campbell Soup Co. | | | 414 | | | | 18,829 | |
Conagra Brands, Inc. | | | 1,116 | | | | 37,866 | |
Danone SA | | | 1,412 | | | | 96,017 | |
General Mills, Inc. | | | 1,395 | | | | 76,739 | |
JM Smucker Co. (The) | | | 261 | | | | 29,232 | |
Kellogg Co. | | | 587 | | | | 33,876 | |
Mowi ASA | | | 1,004 | | | | 24,247 | |
Nestle SA | | | 6,583 | | | | 687,059 | |
Orkla ASA | | | 1,716 | | | | 15,805 | |
Tyson Foods, Inc. – Class A | | | 672 | | | | 45,474 | |
WH Group Ltd.(a) | | | 21,881 | | | | 19,625 | |
| | | | | | | | |
| | | | 1,156,569 | |
| | | | | |
Household Products – 1.1% | |
Kimberly-Clark Corp. | | | 779 | | | | 99,969 | |
Procter & Gamble Co. (The) | | | 5,689 | | | | 702,762 | |
| | |
| |
32 | AB TAX-MANAGED ALL MARKET INCOME PORTFOLIO | | abfunds.com |
PORTFOLIO OF INVESTMENTS (continued)
| | | | | | | | |
Company | |
Shares | | | U.S. $ Value | |
| |
Reckitt Benckiser Group PLC | | | 1,625 | | | $ | 136,307 | |
| | | | | | | | |
| | | | 939,038 | |
| | | | | |
Personal Products – 0.4% | |
Pola Orbis Holdings, Inc. | | | 209 | | | | 4,789 | |
Unilever PLC | | | 6,007 | | | | 312,486 | |
| | | | | | | | |
| | | | 317,275 | |
| | | | | |
Tobacco – 0.8% | |
Altria Group, Inc. | | | 4,246 | | | | 185,126 | |
British American Tobacco PLC | | | 5,242 | | | | 182,029 | |
Imperial Brands PLC | | | 2,162 | | | | 40,284 | |
Japan Tobacco, Inc. | | | 2,741 | | | | 49,630 | |
Philip Morris International, Inc. | | | 3,558 | | | | 298,943 | |
| | | | | | | | |
| | | | 756,012 | |
| | | | | |
| | | | 4,523,313 | |
| | | | | | | | |
Financials – 3.6% | |
Banks – 1.0% | |
Bank Leumi Le-Israel BM | | | 3,319 | | | | 20,130 | |
BOC Hong Kong Holdings Ltd. | | | 8,455 | | | | 28,092 | |
Citizens Financial Group, Inc. | | | 975 | | | | 42,354 | |
Concordia Financial Group Ltd. | | | 2,349 | | | | 9,098 | |
DBS Group Holdings Ltd. | | | 4,100 | | | | 81,240 | |
Fifth Third Bancorp | | | 1,627 | | | | 56,441 | |
Hang Seng Bank Ltd. | | | 1,747 | | | | 33,740 | |
Huntington Bancshares, Inc./OH | | | 2,324 | | | | 35,650 | |
KeyCorp | | | 2,230 | | | | 44,912 | |
M&T Bank Corp. | | | 293 | | | | 44,225 | |
Oversea-Chinese Banking Corp., Ltd. | | | 7,555 | | | | 61,807 | |
PNC Financial Services Group, Inc. (The) | | | 970 | | | | 163,309 | |
Regions Financial Corp. | | | 2,193 | | | | 45,242 | |
Truist Financial Corp. | | | 3,079 | | | | 175,380 | |
United Overseas Bank Ltd. | | | 2,687 | | | | 49,344 | |
| | | | | | | | |
| | | | 890,964 | |
| | | | | |
Capital Markets – 0.8% | |
3i Group PLC | | | 2,223 | | | | 34,510 | |
Ameriprise Financial, Inc. | | | 275 | | | | 60,841 | |
ASX Ltd. | | | 442 | | | | 23,017 | |
Bank of New York Mellon Corp. (The) | | | 1,821 | | | | 76,773 | |
CME Group, Inc. – Class A | | | 820 | | | | 163,754 | |
Franklin Resources, Inc. | | | 679 | | | | 17,769 | |
Hargreaves Lansdown PLC | | | 758 | | | | 16,025 | |
IGM Financial, Inc. | | | 190 | | | | 5,184 | |
Magellan Financial Group Ltd. | | | 293 | | | | 9,790 | |
Northern Trust Corp. | | | 452 | | | | 42,999 | |
Partners Group Holding AG | | | 43 | | | | 51,483 | |
Schroders PLC | | | 284 | | | | 13,899 | |
| | |
| |
| abfunds.com | | AB TAX-MANAGED ALL MARKET INCOME PORTFOLIO | 33 |
PORTFOLIO OF INVESTMENTS (continued)
| | | | | | | | |
Company | |
Shares | | | U.S. $ Value | |
| |
Singapore Exchange Ltd. | | | 1,836 | | | $ | 13,669 | |
Standard Life Aberdeen PLC | | | 5,123 | | | | 22,375 | |
State Street Corp. | | | 805 | | | | 58,580 | |
T. Rowe Price Group, Inc. | | | 519 | | | | 84,151 | |
| | | | | | | | |
| | | | 694,819 | |
| | | | | |
Consumer Finance – 0.1% | |
Discover Financial Services | | | 700 | | | | 65,849 | |
Synchrony Financial | | | 1,200 | | | | 46,416 | |
| | | | | | | | |
| | | | 112,265 | |
| | | | | |
Diversified Financial Services – 0.0% | |
M&G PLC | | | 5,940 | | | | 15,300 | |
| | | | | | | | |
|
Insurance – 1.7% | |
Admiral Group PLC | | | 436 | | | | 18,868 | |
Aflac, Inc. | | | 1,547 | | | | 74,086 | |
Allianz SE | | | 953 | | | | 230,015 | |
Assicurazioni Generali SpA | | | 2,520 | | | | 47,257 | |
Baloise Holding AG | | | 106 | | | | 18,540 | |
Direct Line Insurance Group PLC | | | 3,117 | | | | 13,935 | |
Fidelity National Financial, Inc. | | | 633 | | | | 24,231 | |
Gjensidige Forsikring ASA | | | 456 | | | | 10,459 | |
Great-West Lifeco, Inc. | | | 634 | | | | 16,226 | |
Hannover Rueck SE | | | 138 | | | | 23,366 | |
Hartford Financial Services Group, Inc. (The) | | | 818 | | | | 41,464 | |
iA Financial Corp., Inc. | | | 244 | | | | 12,537 | |
Lincoln National Corp. | | | 441 | | | | 25,080 | |
Manulife Financial Corp. | | | 4,431 | | | | 88,334 | |
Medibank Pvt Ltd. | | | 6,292 | | | | 13,429 | |
MS&AD Insurance Group Holdings, Inc. | | | 1,017 | | | | 28,867 | |
NN Group NV | | | 658 | | | | 30,382 | |
Power Corp. of Canada | | | 1,277 | | | | 30,786 | |
Principal Financial Group, Inc. | | | 627 | | | | 35,476 | |
Progressive Corp. (The) | | | 1,337 | | | | 114,915 | |
Prudential Financial, Inc. | | | 902 | | | | 78,221 | |
Reinsurance Group of America, Inc. – Class A | | | 155 | | | | 18,946 | |
Sompo Holdings, Inc. | | | 767 | | | | 29,519 | |
Sun Life Financial, Inc. | | | 1,336 | | | | 64,291 | |
Swiss Life Holding AG | | | 70 | | | | 34,793 | |
T&D Holdings, Inc. | | | 1,229 | | | | 16,740 | |
Tokio Marine Holdings, Inc. | | | 1,443 | | | | 71,686 | |
Travelers Cos., Inc. (The) | | | 579 | | | | 84,245 | |
Tryg A/S | | | 345 | | | | 10,834 | |
Zurich Insurance Group AG | | | 344 | | | | 140,424 | |
| | | | | | | | |
| | | | 1,447,952 | |
| | | | | |
| | | | 3,161,300 | |
| | | | | | | | |
| | |
| |
34 | AB TAX-MANAGED ALL MARKET INCOME PORTFOLIO | | abfunds.com |
PORTFOLIO OF INVESTMENTS (continued)
| | | | | | | | |
Company | |
Shares | | | U.S. $ Value | |
| |
Industrials – 3.4% | |
Aerospace & Defense – 0.7% | |
BAE Systems PLC | | | 7,349 | | | $ | 49,746 | |
General Dynamics Corp. | | | 557 | | | | 91,053 | |
Huntington Ingalls Industries, Inc. | | | 93 | | | | 16,359 | |
Lockheed Martin Corp. | | | 575 | | | | 189,894 | |
Raytheon Technologies Corp. | | | 3,490 | | | | 251,245 | |
Singapore Technologies Engineering Ltd. | | | 3,567 | | | | 9,990 | |
| | | | | | | | |
| | | | 608,287 | |
| | | | | |
Air Freight & Logistics – 0.4% | |
Deutsche Post AG | | | 2,260 | | | | 112,249 | |
United Parcel Service, Inc. – Class B | | | 1,616 | | | | 255,053 | |
| | | | | | | | |
| | | | 367,302 | |
| | | | | |
Building Products – 0.1% | |
AGC, Inc. | | | 441 | | | | 16,251 | |
Johnson Controls International PLC | | | 1,700 | | | | 94,843 | |
Xinyi Glass Holdings Ltd. | | | 4,150 | | | | 11,612 | |
| | | | | | | | |
| | | | 122,706 | |
| | | | | |
Commercial Services & Supplies – 0.0% | |
Toppan Printing Co., Ltd. | | | 599 | | | | 9,464 | |
| | | | | | | | |
|
Construction & Engineering – 0.1% | |
ACS Actividades de Construccion y Servicios SA | | | 581 | | | | 17,752 | |
Bouygues SA | | | 521 | | | | 21,092 | |
HOCHTIEF AG | | | 56 | | | | 5,005 | |
Kajima Corp. | | | 1,026 | | | | 13,167 | |
Obayashi Corp. | | | 1,483 | | | | 12,803 | |
Shimizu Corp. | | | 1,261 | | | | 9,579 | |
Taisei Corp. | | | 436 | | | | 15,461 | |
| | | | | | | | |
| | | | 94,859 | |
| | | | | |
Electrical Equipment – 0.7% | |
ABB Ltd.(e) | | | 4,210 | | | | 121,204 | |
Eaton Corp. PLC | | | 914 | | | | 118,994 | |
Emerson Electric Co. | | | 1,365 | | | | 117,253 | |
Mitsubishi Electric Corp. | | | 4,170 | | | | 61,753 | |
Schneider Electric SE | | | 1,231 | | | | 182,033 | |
| | | | | | | | |
| | | | 601,237 | |
| | | | | |
Industrial Conglomerates – 0.7% | |
3M Co. | | | 1,316 | | | | 230,379 | |
CK Hutchison Holdings Ltd. | | | 6,167 | | | | 46,538 | |
DCC PLC | | | 225 | | | | 18,175 | |
Jardine Matheson Holdings Ltd. | | | 499 | | | | 26,013 | |
Siemens AG | | | 1,748 | | | | 270,523 | |
| | | | | | | | |
| | | | 591,628 | |
| | | | | |
| | |
| |
| abfunds.com | | AB TAX-MANAGED ALL MARKET INCOME PORTFOLIO | 35 |
PORTFOLIO OF INVESTMENTS (continued)
| | | | | | | | |
Company | |
Shares | | | U.S. $ Value | |
| |
Machinery – 0.3% | |
Amada Co. Ltd. | | | 738 | | | $ | 9,017 | |
Cummins, Inc. | | | 338 | | | | 85,582 | |
Kone Oyj – Class B | | | 776 | | | | 61,935 | |
PACCAR, Inc. | | | 791 | | | | 71,973 | |
Snap-on, Inc. | | | 118 | | | | 23,967 | |
Wartsila Oyj Abp | | | 1,014 | | | | 11,643 | |
| | | | | | | | |
| | | | 264,117 | |
| | | | | |
Professional Services – 0.2% | |
Adecco Group AG | | | 354 | | | | 22,280 | |
RELX PLC (London) | | | 4,413 | | | | 104,420 | |
SGS SA | | | 14 | | | | 40,009 | |
| | | | | | | | |
| | | | 166,709 | |
| | | | | |
Road & Rail – 0.1% | |
Aurizon Holdings Ltd. | | | 4,374 | | | | 12,880 | |
Kyushu Railway Co. | | | 341 | | | | 8,915 | |
MTR Corp., Ltd. | | | 3,529 | | | | 21,162 | |
Nippon Express Co., Ltd. | | | 164 | | | | 12,265 | |
| | | | | | | | |
| | | | 55,222 | |
| | | | | |
Trading Companies & Distributors – 0.1% | |
ITOCHU Corp. | | | 3,078 | | | | 91,934 | |
| | | | | | | | |
|
Transportation Infrastructure – 0.0% | |
Sydney Airport(e) | | | 3,021 | | | | 13,695 | |
| | | | | | | | |
| | | | 2,987,160 | |
| | | | | | | | |
Information Technology – 2.5% | |
Communications Equipment – 0.5% | |
Cisco Systems, Inc./Delaware | | | 9,647 | | | | 432,861 | |
Juniper Networks, Inc. | | | 758 | | | | 17,646 | |
| | | | | | | | |
| | | | 450,507 | |
| | | | | |
Electronic Equipment, Instruments & Components – 0.1% | | | | | | | | |
Hitachi Ltd. | | | 2,211 | | | | 101,978 | |
Venture Corp., Ltd. | | | 631 | | | | 9,004 | |
| | | | | | | | |
| | | | 110,982 | |
| | | | | |
IT Services – 0.4% | |
Computershare Ltd. | | | 1,112 | | | | 11,377 | |
International Business Machines Corp. | | | 2,035 | | | | 242,022 | |
Paychex, Inc. | | | 738 | | | | 67,210 | |
Western Union Co. (The) – Class W | | | 939 | | | | 21,804 | |
| | | | | | | | |
| | | | 342,413 | |
| | | | | |
Semiconductors & Semiconductor Equipment – 1.3% | | | | | | | | |
Intel Corp. | | | 9,436 | | | | 573,520 | |
| | |
| |
36 | AB TAX-MANAGED ALL MARKET INCOME PORTFOLIO | | abfunds.com |
PORTFOLIO OF INVESTMENTS (continued)
| | | | | | | | |
Company | |
Shares | | | U.S. $ Value | |
| |
Maxim Integrated Products, Inc. | | | 609 | | | $ | 56,740 | |
Texas Instruments, Inc. | | | 2,093 | | | | 360,561 | |
Tokyo Electron Ltd. | | | 342 | | | | 142,620 | |
| | | | | | | | |
| | | | 1,133,441 | |
| | | | | |
Software – 0.0% | |
Sage Group PLC (The) | | | 2,492 | | | | 19,472 | |
Trend Micro, Inc./Japan | | | 305 | | | | 14,745 | |
| | | | | | | | |
| | | | 34,217 | |
| | | | | |
Technology Hardware, Storage & Peripherals – 0.2% | | | | | | | | |
Brother Industries Ltd. | | | 509 | | | | 10,086 | |
HP, Inc. | | | 3,267 | | | | 94,645 | |
NetApp, Inc. | | | 507 | | | | 31,738 | |
Seagate Technology PLC | | | 529 | | | | 38,739 | |
| | | | | | | | |
| | | | 175,208 | |
| | | | | |
| | | | 2,246,768 | |
| | | | | | | | |
Utilities – 1.8% | |
Electric Utilities – 1.0% | |
Alliant Energy Corp. | | | 570 | | | | 26,311 | |
American Electric Power Co., Inc. | | | 1,134 | | | | 84,880 | |
CK Infrastructure Holdings Ltd. | | | 1,514 | | | | 8,770 | |
CLP Holdings Ltd. | | | 3,752 | | | | 36,630 | |
Duke Energy Corp. | | | 1,680 | | | | 143,791 | |
Edison International | | | 864 | | | | 46,647 | |
EDP – Energias de Portugal SA | | | 6,345 | | | | 36,368 | |
Endesa SA | | | 725 | | | | 17,915 | |
Eversource Energy | | | 783 | | | | 62,233 | |
Fortis, Inc./Canada | | | 1,061 | | | | 40,853 | |
Fortum Oyj | | | 1,014 | | | | 25,264 | |
Hydro One Ltd.(a) | | | 750 | | | | 15,924 | |
Iberdrola SA | | | 14,164 | | | | 177,502 | |
Mercury NZ Ltd. | | | 1,556 | | | | 6,793 | |
OGE Energy Corp. | | | 457 | | | | 13,376 | |
Pinnacle West Capital Corp. | | | 257 | | | | 17,972 | |
Power Assets Holdings Ltd. | | | 3,169 | | | | 17,585 | |
PPL Corp. | | | 1,756 | | | | 45,990 | |
Red Electrica Corp. SA | | | 989 | | | | 16,522 | |
Terna Rete Elettrica Nazionale SpA | | | 3,214 | | | | 22,296 | |
Xcel Energy, Inc. | | | 1,200 | | | | 70,308 | |
| | | | | | | | |
| | | | | | | 933,930 | |
| | | | | | | | |
Gas Utilities – 0.1% | | | | | | | | |
Enagas SA | | | 568 | | | | 11,897 | |
Hong Kong & China Gas Co., Ltd. | | | 24,363 | | | | 36,768 | |
Snam SpA | | | 4,607 | | | | 23,849 | |
| | | | | | | | |
| | | | | | | 72,514 | |
| | | | | | | | |
| | |
| |
| abfunds.com | | AB TAX-MANAGED ALL MARKET INCOME PORTFOLIO | 37 |
PORTFOLIO OF INVESTMENTS (continued)
| | | | | | | | |
Company | |
Shares | | | U.S. $ Value | |
| |
Multi-Utilities – 0.7% | | | | | | | | |
Ameren Corp. | | | 564 | | | $ | 39,632 | |
CMS Energy Corp. | | | 654 | | | | 35,388 | |
Consolidated Edison, Inc. | | | 764 | | | | 50,157 | |
Dominion Energy, Inc. | | | 1,919 | | | | 131,106 | |
DTE Energy Co. | | | 440 | | | | 51,797 | |
National Grid PLC | | | 8,043 | | | | 90,439 | |
Public Service Enterprise Group, Inc. | | | 1,155 | | | | 62,174 | |
Sempra Energy | | | 661 | | | | 76,663 | |
WEC Energy Group, Inc. | | | 721 | | | | 58,141 | |
| | | | | | | | |
| | | | | | | 595,497 | |
| | | | | | | | |
| | | | | | | 1,601,941 | |
| | | | | | | | |
Communication Services – 1.8% | |
Diversified Telecommunication Services – 1.3% | | | | | | | | |
AT&T, Inc. | | | 16,280 | | | | 454,049 | |
BCE, Inc. | | | 351 | | | | 15,013 | |
Elisa Oyj | | | 325 | | | | 19,433 | |
HKT Trust & HKT Ltd. – Class SS | | | 8,655 | | | | 11,764 | |
Nippon Telegraph & Telephone Corp. | | | 2,941 | | | | 76,187 | |
Proximus SADP | | | 347 | | | | 6,777 | |
Shaw Communications, Inc. – Class B | | | 1,064 | | | | 18,519 | |
Spark New Zealand Ltd. | | | 4,197 | | | | 13,919 | |
Swisscom AG | | | 60 | | | | 30,140 | |
TELUS Corp. | | | 968 | | | | 19,396 | |
Verizon Communications, Inc. | | | 9,455 | | | | 522,861 | |
Washington H Soul Pattinson & Co., Ltd. | | | 246 | | | | 5,661 | |
| | | | | | | | |
| | | | | | | 1,193,719 | |
| | | | | | | | |
Media – 0.2% | | | | | | | | |
Interpublic Group of Cos., Inc. (The) | | | 890 | | | | 23,247 | |
Omnicom Group, Inc. | | | 491 | | | | 33,746 | |
ViacomCBS, Inc. – Class B | | | 1,288 | | | | 83,063 | |
| | | | | | | | |
| | | | | | | 140,056 | |
| | | | | | | | |
Wireless Telecommunication Services – 0.3% | | | | | | | | |
KDDI Corp. | | | 3,685 | | | | 114,874 | |
Rogers Communications, Inc. – Class B | | | 809 | | | | 35,047 | |
Softbank Corp. | | | 6,562 | | | | 88,733 | |
| | | | | | | | |
| | | | | | | 238,654 | |
| | | | | | | | |
| | | | | | | 1,572,429 | |
| | | | | | | | |
Materials – 1.7% | | | | | | | | |
Chemicals – 0.8% | | | | | | | | |
Air Water, Inc. | | | 419 | | | | 6,915 | |
Asahi Kasei Corp. | | | 2,866 | | | | 31,092 | |
BASF SE | | | 2,099 | | | | 171,721 | |
| | |
| |
38 | AB TAX-MANAGED ALL MARKET INCOME PORTFOLIO | | abfunds.com |
PORTFOLIO OF INVESTMENTS (continued)
| | | | | | | | |
Company | |
Shares | | | U.S. $ Value | |
| |
Dow, Inc. | | | 1,693 | | | $ | 100,412 | |
Eastman Chemical Co. | | | 309 | | | | 33,761 | |
EMS-Chemie Holding AG | | | 19 | | | | 16,836 | |
Evonik Industries AG | | | 479 | | | | 16,131 | |
International Flavors & Fragrances, Inc. | | | 511 | | | | 69,246 | |
JSR Corp. | | | 465 | | | | 13,938 | |
LyondellBasell Industries NV – Class A | | | 610 | | | | 62,885 | |
Mitsubishi Chemical Holdings Corp. | | | 2,925 | | | | 20,454 | |
Mitsubishi Gas Chemical Co., Inc. | | | 361 | | | | 8,456 | |
Mitsui Chemicals, Inc. | | | 420 | | | | 13,011 | |
Nitto Denko Corp. | | | 363 | | | | 31,159 | |
Nutrien Ltd. | | | 1,300 | | | | 70,169 | |
Sumitomo Chemical Co., Ltd. | | | 3,404 | | | | 16,572 | |
Tosoh Corp. | | | 594 | | | | 10,919 | |
| | | | | | | | |
| | | | | | | 693,677 | |
| | | | | | | | |
Construction Materials – 0.1% | | | | | | | | |
CRH PLC(e) | | | 1,793 | | | | 77,836 | |
| | | | | | | | |
| | |
Containers & Packaging – 0.1% | | | | | | | | |
AMCOR PLC | | | 3,583 | | | | 39,198 | |
International Paper Co. | | | 853 | | | | 42,352 | |
Packaging Corp. of America | | | 217 | | | | 28,648 | |
| | | | | | | | |
| | | | | | | 110,198 | |
| | | | | | | | |
Metals & Mining – 0.6% | | | | | | | | |
Anglo American PLC | | | 2,803 | | | | 108,759 | |
B2Gold Corp. | | | 2,388 | | | | 10,396 | |
Boliden AB | | | 624 | | | | 24,713 | |
Evolution Mining Ltd. | | | 3,708 | | | | 11,864 | |
Fortescue Metals Group Ltd. | | | 3,869 | | | | 71,453 | |
Nucor Corp. | | | 689 | | | | 41,216 | |
Rio Tinto Ltd. | | | 848 | | �� | | 83,206 | |
Rio Tinto PLC | | | 2,564 | | | | 222,214 | |
| | | | | | | | |
| | | | | | | 573,821 | |
| | | | | | | | |
Paper & Forest Products – 0.1% | | | | | | | | |
Mondi PLC | | | 1,109 | | | | 26,762 | |
Oji Holdings Corp. | | | 1,970 | | | | 12,467 | |
UPM-Kymmene Oyj | | | 1,219 | | | | 46,571 | |
| | | | | | | | |
| | | | | | | 85,800 | |
| | | | | | | | |
| | | | | | | 1,541,332 | |
| | | | | | | | |
Consumer Discretionary – 1.0% | | | | | | | | |
Auto Components – 0.2% | | | | | | | | |
Bridgestone Corp. | | | 1,223 | | | | 48,314 | |
Magna International, Inc. – Class A (Canada) | | | 648 | | | | 54,581 | |
NGK Spark Plug Co., Ltd. | | | 349 | | | | 5,968 | |
Sumitomo Electric Industries Ltd. | | | 1,723 | | | | 25,245 | |
| | | | | | | | |
| | | | | | | 134,108 | |
| | | | | | | | |
| | |
| |
| abfunds.com | | AB TAX-MANAGED ALL MARKET INCOME PORTFOLIO | 39 |
PORTFOLIO OF INVESTMENTS (continued)
| | | | | | | | |
| Company | |
Shares | | | U.S. $ Value | |
| |
Automobiles – 0.4% | | | | | | | | |
Isuzu Motors Ltd. | | | 1,260 | | | $ | 13,261 | |
Toyota Motor Corp. | | | 4,846 | | | | 358,089 | |
| | | | | | | | |
| | | | | | | 371,350 | |
| | | | | | | | |
Distributors – 0.1% | | | | | | | | |
Genuine Parts Co. | | | 330 | | | | 34,766 | |
| | | | | | | | |
| | |
Hotels, Restaurants & Leisure – 0.0% | | | | | | | | |
Sodexo SA(e) | | | 202 | | | | 19,350 | |
| | | | | | | | |
| | |
Household Durables – 0.2% | | | | | | | | |
Husqvarna AB – Class B | | | 955 | | | | 11,680 | |
Panasonic Corp. | | | 5,045 | | | | 65,222 | |
Sekisui Chemical Co., Ltd. | | | 816 | | | | 14,624 | |
Sekisui House Ltd. | | | 1,408 | | | | 26,567 | |
Whirlpool Corp. | | | 143 | | | | 27,181 | |
| | | | | | | | |
| | | | | | | 145,274 | |
| | | | | | | | |
Leisure Products – 0.0% | | | | | | | | |
Hasbro, Inc. | | | 297 | | | | 27,832 | |
| | | | | | | | |
| | |
Multiline Retail – 0.1% | | | | | | | | |
Canadian Tire Corp., Ltd. – Class A | | | 131 | | | | 16,927 | |
Wesfarmers Ltd. | | | 2,590 | | | | 98,511 | |
| | | | | | | | |
| | | | | | | 115,438 | |
| | | | | | | | |
Specialty Retail – 0.0% | | | | | | | | |
ABC-Mart, Inc. | | | 75 | | | | 4,285 | |
USS Co., Ltd. | | | 501 | | | | 9,558 | |
| | | | | | | | |
| | | | | | | 13,843 | |
| | | | | | | | |
Textiles, Apparel & Luxury Goods – 0.0% | | | | | | | | |
Pandora A/S | | | 228 | | | | 22,135 | |
| | | | | | | | |
| | | | | | | 884,096 | |
| | | | | | | | |
Energy – 0.5% | | | | | | | | |
Energy Equipment & Services – 0.0% | | | | | | | | |
Baker Hughes Co. – Class A | | | 1,499 | | | | 36,695 | |
| | | | | | | | |
| | |
Oil, Gas & Consumable Fuels – 0.5% | | | | | | | | |
Inter Pipeline Ltd. | | | 980 | | | | 13,792 | |
Keyera Corp. | | | 505 | | | | 9,790 | |
Koninklijke Vopak NV | | | 160 | | | | 7,634 | |
Lundin Energy AB | | | 424 | | | | 13,760 | |
Pembina Pipeline Corp. | | | 1,256 | | | | 31,938 | |
TC Energy Corp. | | | 2,147 | | | | 89,922 | |
TOTAL SE | | | 5,759 | | | | 268,543 | |
| | | | | | | | |
| | | | | | | 435,379 | |
| | | | | | | | |
| | | | | | | 472,074 | |
| | | | | | | | |
| | |
| |
40 | AB TAX-MANAGED ALL MARKET INCOME PORTFOLIO | | abfunds.com |
PORTFOLIO OF INVESTMENTS (continued)
| | | | | | | | |
| Company | |
Shares | | | U.S. $ Value | |
| |
Real Estate – 0.3% | | | | | | | | |
Real Estate Management & Development – 0.3% | | | | | | | | |
CK Asset Holdings Ltd. | | | 5,907 | | | $ | 34,719 | |
Daiwa House Industry Co., Ltd. | | | 1,293 | | | | 36,677 | |
Hang Lung Properties Ltd. | | | 4,624 | | | | 11,979 | |
Henderson Land Development Co., Ltd. | | | 3,318 | | | | 14,453 | |
Hongkong Land Holdings Ltd. | | | 2,666 | | | | 12,808 | |
Sino Land Co., Ltd. | | | 7,243 | | | | 10,955 | |
Sun Hung Kai Properties Ltd. | | | 2,979 | | | | 48,354 | |
Swire Properties Ltd. | | | 2,673 | | | | 8,598 | |
Swiss Prime Site AG | | | 174 | | | | 16,286 | |
Wharf Real Estate Investment Co., Ltd. | | | 3,815 | | | | 22,812 | |
| | | | | | | | |
| | | | | | | 217,641 | |
| | | | | | | | |
| | | | | | | 217,641 | |
| | | | | | | | |
Total Common Stocks
(cost $20,832,907) | | | | | | | 24,111,507 | |
| | | | | | | | |
| | | | | | | | |
PREFERRED STOCKS – 6.6% | | | | | | | | |
Real Estate – 6.6% | | | | | | | | |
Diversified REITs – 1.5% | | | | | | | | |
Armada Hoffler Properties, Inc.
Series A
6.75%, | | | 8,150 | | | | 205,787 | |
Colony Capital, Inc.
Series H
7.125%, | | | 10,210 | | | | 248,001 | |
Colony Capital, Inc.
Series I
7.15%, | | | 4,450 | | | | 107,868 | |
Colony Capital, Inc.
Series J
7.125%, | | | 4,575 | | | | 111,493 | |
Gladstone Commercial Corp.
Series E
6.625%, | | | 5,775 | | | | 148,129 | |
Global Net Lease, Inc.
Series A
7.25%, | | | 3,378 | | | | 87,389 | |
Global Net Lease, Inc.
Series B
6.875%, | | | 3,550 | | | | 90,632 | |
PS Business Parks, Inc.
Series Y
5.20%, | | | 513 | | | | 13,179 | |
PS Business Parks, Inc.
Series Z
4.875%, | | | 7,550 | | | | 191,543 | |
| | |
| |
| abfunds.com | | AB TAX-MANAGED ALL MARKET INCOME PORTFOLIO | 41 |
PORTFOLIO OF INVESTMENTS (continued)
| | | | | | | | |
| Company | |
Shares | | | U.S. $ Value | |
| |
Vornado Realty Trust
Series K
5.70%, | | | 3,081 | | | $ | 77,333 | |
Vornado Realty Trust
Series L
5.40%, | | | 2,623 | | | | 65,313 | |
| | | | | | | | |
| | | | | | | 1,346,667 | |
| | | | | | | | |
Health Care REITs – 0.0% | | | | | | | | |
Global Medical REIT, Inc.
Series A
7.50%, | | | 1,050 | | | | 27,615 | |
| | | | | | | | |
| | |
Hotel & Resort REITs – 0.9% | | | | | | | | |
DiamondRock Hospitality Co.
8.25%, | | | 6,975 | | | | 186,093 | |
Hersha Hospitality Trust
Series C
6.875%, | | | 50 | | | | 1,184 | |
Hersha Hospitality Trust
Series D
6.50%, | | | 194 | | | | 4,507 | |
Hersha Hospitality Trust
Series E
6.50%, | | | 50 | | | | 1,158 | |
Pebblebrook Hotel Trust
Series C
6.50%, | | | 2,600 | | | | 60,502 | |
Pebblebrook Hotel Trust
Series D
6.375%, | | | 965 | | | | 22,398 | |
Pebblebrook Hotel Trust
Series E
6.375%, | | | 753 | | | | 17,439 | |
Pebblebrook Hotel Trust
Series F
6.30%, | | | 5,600 | | | | 126,672 | |
Summit Hotel Properties, Inc.
Series E
6.25%, | | | 8,896 | | | | 202,829 | |
Sunstone Hotel Investors, Inc.
Series E
6.95%, | | | 1,044 | | | | 25,933 | |
Sunstone Hotel Investors, Inc.
Series F
6.45%, | | | 4,875 | | | | 121,022 | |
| | | | | | | | |
| | | | | | | 769,737 | |
| | | | | | | | |
| | |
| |
42 | AB TAX-MANAGED ALL MARKET INCOME PORTFOLIO | | abfunds.com |
PORTFOLIO OF INVESTMENTS (continued)
| | | | | | | | |
| Company | |
Shares | | | U.S. $ Value | |
| |
Industrial REITs – 0.5% | | | | | | | | |
Monmouth Real Estate Investment Corp.
Series C
6.125%, | | | 6,951 | | | $ | 174,957 | |
Plymouth Industrial REIT, Inc.
Series A
7.50%, | | | 751 | | | | 19,766 | |
Rexford Industrial Realty, Inc.
Series A
5.875%, | | | 875 | | | | 22,094 | |
Rexford Industrial Realty, Inc.
Series B
5.875%, | | | 5,800 | | | | 147,900 | |
Rexford Industrial Realty, Inc.
Series C
5.625%, | | | 3,224 | | | | 82,341 | |
| | | | | | | | |
| | | | | | | 447,058 | |
| | | | | | | | |
Office REITs – 0.2% | | | | | | | | |
City Office REIT, Inc.
Series A
6.625%, | | | 2,628 | | | | 66,120 | |
SL Green Realty Corp.
Series I
6.50%, | | | 2,025 | | | | 51,395 | |
Vornado Realty Trust
Series M
5.25%, | | | 2,811 | | | | 70,275 | |
| | | | | | | | |
| | | | | | | 187,790 | |
| | | | | | | | |
Real Estate Development – 0.2% | | | | | | | | |
American Finance Trust, Inc.
Series C
7.375%, | | | 8,000 | | | | 200,080 | |
| | | | | | | | |
| | |
Real Estate Operating Companies – 0.1% | | | | | | | | |
Brookfield Property Partners LP
Series A2
6.375%, | | | 4,109 | | | | 97,301 | |
| | | | | | | | |
| | |
Residential REITs – 0.9% | | | | | | | | |
American Homes 4 Rent
Series D
6.50%, | | | 7,368 | | | | 188,400 | |
American Homes 4 Rent
Series F
5.875%, | | | 5,850 | | | | 150,228 | |
American Homes 4 Rent
Series G
5.875%, | | | 125 | | | | 3,215 | |
| | |
| |
| abfunds.com | | AB TAX-MANAGED ALL MARKET INCOME PORTFOLIO | 43 |
PORTFOLIO OF INVESTMENTS (continued)
| | | | | | | | |
| Company | |
Shares | | | U.S. $ Value | |
| |
American Homes 4 Rent
Series H
6.25%, | | | 2,225 | | | $ | 59,007 | |
Bluerock Residential Growth REIT, Inc.
Series D
7.125%, | | | 850 | | | | 21,675 | |
Centerspace
Series C
6.625%, | | | 2,359 | | | | 61,452 | |
UMH Properties, Inc.
Series C
6.75%, | | | 7,842 | | | | 196,363 | |
UMH Properties, Inc.
Series D
6.375%, | | | 2,825 | | | | 69,495 | |
| | | | | | | | |
| | | | | | | 749,835 | |
| | | | | | | | |
Retail REITs – 1.3% | | | | | | | | |
American Finance Trust, Inc.
Series A
7.50%, | | | 100 | | | | 2,537 | |
Brookfield Property REIT, Inc.
Series A
6.375%, | | | 7,215 | | | | 179,509 | |
Cedar Realty Trust, Inc.
Series C
6.50%, | | | 5,761 | | | | 128,240 | |
National Retail Properties, Inc.
Series F
5.20%, | | | 1,150 | | | | 29,187 | |
Saul Centers, Inc.
Series D
6.125%, | | | 7,025 | | | | 170,327 | |
SITE Centers Corp.
Series A
6.375%, | | | 10,850 | | | | 277,326 | |
Spirit Realty Capital, Inc.
Series A
6.00%, | | | 5,525 | | | | 143,098 | |
Urstadt Biddle Properties, Inc.
Series H
6.25%, | | | 5,765 | | | | 141,588 | |
Urstadt Biddle Properties, Inc.
Series K
5.875%, | | | 1,523 | | | | 36,780 | |
| | | | | | | | |
| | | | | | | 1,108,592 | |
| | | | | | | | |
| | |
| |
44 | AB TAX-MANAGED ALL MARKET INCOME PORTFOLIO | | abfunds.com |
PORTFOLIO OF INVESTMENTS (continued)
| | | | | | | | |
| Company | |
Shares | | | U.S. $ Value | |
| |
Specialized REITs – 1.0% | | | | | | | | |
Digital Realty Trust, Inc.
Series C
6.625%, | | | 1,961 | | | $ | 50,084 | |
Digital Realty Trust, Inc.
Series L
5.20%, | | | 10,725 | | | | 278,957 | |
National Storage Affiliates Trust
Series A
6.00%, | | | 7,180 | | | | 190,270 | |
Public Storage
Series L
4.625%, | | | 5,384 | | | | 136,754 | |
Public Storage
Series M
4.125%, | | | 2,650 | | | | 66,594 | |
QTS Realty Trust, Inc.
Series A
7.125%, | | | 5,121 | | | | 136,936 | |
| | | | | | | | |
| | | | | | | 859,595 | |
| | | | | | | | |
Total Preferred Stocks
(cost $5,773,435) | | | | | | | 5,794,270 | |
| | | | | | | | |
| | | | | | | | |
INVESTMENT COMPANIES – 1.0% | | | | | | | | |
Funds and Investment Trusts – 1.0%(h) | | | | | | | | |
Vanguard Global ex-U.S. Real Estate ETF | | | 8,412 | | | | 459,716 | |
Vanguard Real Estate ETF | | | 5,165 | | | | 453,848 | |
| | | | | | | | |
| | |
Total Investment Companies
(cost $917,171) | | | | | | | 913,564 | |
| | | | | | | | |
| | |
| | | Principal
Amount
(000) | | | | |
COLLATERALIZED MORTGAGE OBLIGATIONS – 0.3% | | | | | | | | |
Risk Share Floating Rate – 0.3% | | | | | | | | |
Federal Home Loan Mortgage Corp. Structured Agency Credit Risk Debt Notes
Series 2014-HQ2, Class M3
3.88% (LIBOR 1 Month + 3.75%), 09/25/2024(i)
(cost $226,623) | | $ | 222 | | | | 229,330 | |
| | | | | | | | |
| | |
| |
| abfunds.com | | AB TAX-MANAGED ALL MARKET INCOME PORTFOLIO | 45 |
PORTFOLIO OF INVESTMENTS (continued)
| | | | | | | | |
| | |
Shares | | | U.S. $ Value | |
| |
SHORT-TERM INVESTMENTS – 8.2% | | | | | | | | |
Investment Companies – 8.2% | |
AB Fixed Income Shares, Inc. – Government Money Market Portfolio – Class AB,
0.01%(h)(j)(k)
(cost $7,275,716) | | | 7,275,716 | | | $ | 7,275,716 | |
| | | | | | | | |
| | |
Total Investments – 98.9%
(cost $81,524,822) | | | | | | | 87,446,050 | |
Other assets less liabilities – 1.1% | | | | | | | 977,686 | |
| | | | | | | | |
| | |
Net Assets – 100.0% | | | | | | $ | 88,423,736 | |
| | | | | | | | |
FUTURES (see Note D)
| | | | | | | | | | | | | | | | |
| Description | | Number of
Contracts | | | Expiration
Month | | | Current
Notional | | | Value and
Unrealized
Appreciation/
(Depreciation) | |
Purchased Contracts | |
10 Yr Australian Bond Futures | | | 14 | | | | March 2021 | | | $ | 1,476,568 | | | $ | (85,220 | ) |
10 Yr Canadian Bond Futures | | | 2 | | | | June 2021 | | | | 219,676 | | | | (553 | ) |
Euro STOXX 50 Index Futures | | | 34 | | | | March 2021 | | | | 1,487,894 | | | | 28,054 | |
FTSE 100 Index Futures | | | 4 | | | | March 2021 | | | | 358,861 | | | | (12,006 | ) |
Hang Seng Index Futures | | | 1 | | | | March 2021 | | | | 186,677 | | | | (10,191 | ) |
MSCI Emerging Markets Futures | | | 20 | | | | March 2021 | | | | 1,338,100 | | | | 49,116 | |
OMXS30 Index Futures | | | 11 | | | | March 2021 | | | | 261,195 | | | | (5,206 | ) |
S&P 500 E-Mini Futures | | | 58 | | | | March 2021 | | | | 11,046,680 | | | | 299,369 | |
S&P/TSX 60 Index Futures | | | 2 | | | | March 2021 | | | | 336,885 | | | | 2,880 | |
SPI 200 Futures | | | 2 | | | | March 2021 | | | | 255,034 | | | | (3,625 | ) |
TOPIX Index Futures | | | 5 | | | | March 2021 | | | | 879,732 | | | | 14,704 | |
U.S. T-Note 10 Yr (CBT) Futures | | | 72 | | | | June 2021 | | | | 9,555,750 | | | | (109,784 | ) |
|
Sold Contracts | |
10 Yr Mini Japan Government Bond Futures | | | 14 | | | | March 2021 | | | | 1,980,581 | | | | 9,742 | |
Euro STOXX 50 Index Futures | | | 1 | | | | March 2021 | | | | 43,762 | | | | 919 | |
Euro-Bund Futures | | | 7 | | | | March 2021 | | | | 1,464,511 | | | | 24,979 | |
FTSE 100 Index Futures | | | 4 | | | | March 2021 | | | | 358,860 | | | | 5,902 | |
Long Gilt Futures | | | 11 | | | | June 2021 | | | | 1,958,101 | | | | 21,941 | |
S&P 500 E-Mini Futures | | | 1 | | | | March 2021 | | | | 190,460 | | | | 3,914 | |
U.S. T-Note 10 Yr (CBT) Futures | | | 6 | | | | June 2021 | | | | 796,313 | | | | 8,320 | |
| | | | | | | | | | | | | | | | |
| | | $ | 243,255 | |
| | | | | | | | | | | | | | | | |
| | |
| |
46 | AB TAX-MANAGED ALL MARKET INCOME PORTFOLIO | | abfunds.com |
PORTFOLIO OF INVESTMENTS (continued)
FORWARD CURRENCY EXCHANGE CONTRACTS (see Note D)
| | | | | | | | | | | | | | | | |
| Counterparty | | Contracts to
Deliver
(000) | | | In Exchange
For
(000) | | | Settlement
Date | | | Unrealized
Appreciation/
(Depreciation) | |
Barclays Bank PLC | | GBP | 483 | | | USD | 669 | | | | 03/17/2021 | | | $ | (3,900 | ) |
Barclays Bank PLC | | NZD | 746 | | | USD | 556 | | | | 03/17/2021 | | | | 16,767 | |
Barclays Bank PLC | | SEK | 4,589 | | | USD | 558 | | | | 03/17/2021 | | | | 14,292 | |
Barclays Bank PLC | | USD | 1,245 | | | NOK | 10,385 | | | | 03/17/2021 | | | | (47,206 | ) |
Barclays Bank PLC | | COP | 3,128,448 | | | USD | 899 | | | | 03/18/2021 | | | | 41,560 | |
Barclays Bank PLC | | RUB | 21,141 | | | USD | 285 | | | | 03/24/2021 | | | | 2,883 | |
Barclays Bank PLC | | USD | 142 | | | MYR | 580 | | | | 03/25/2021 | | | | 371 | |
Barclays Bank PLC | | USD | 140 | | | MYR | 566 | | | | 03/25/2021 | | | | (1,374 | ) |
Barclays Bank PLC | | KRW | 229,938 | | | USD | 206 | | | | 04/22/2021 | | | | 1,519 | |
Barclays Bank PLC | | USD | 1 | | | KRW | 1,548 | | | | 04/22/2021 | | | | (41 | ) |
Barclays Bank PLC | | TWD | 6,403 | | | USD | 231 | | | | 04/27/2021 | | | | (509 | ) |
BNP Paribas SA | | BRL | 984 | | | USD | 183 | | | | 03/02/2021 | | | | 6,979 | |
BNP Paribas SA | | USD | 178 | | | BRL | 984 | | | | 03/02/2021 | | | | (2,350 | ) |
BNP Paribas SA | | USD | 745 | | | CAD | 945 | | | | 03/17/2021 | | | | (2,684 | ) |
Citibank, NA | | TWD | 9,418 | | | USD | 342 | | | | 04/27/2021 | | | | 1,968 | |
Credit Suisse International | | IDR | 19,759 | | | USD | 1 | | | | 04/15/2021 | | | | 48 | |
Credit Suisse International | | USD | 121 | | | PHP | 5,816 | | | | 04/22/2021 | | | | (2,379 | ) |
Deutsche Bank AG | | CLP | 624,243 | | | USD | 876 | | | | 03/18/2021 | | | | 13,550 | |
Deutsche Bank AG | | CLP | 316,633 | | | USD | 435 | | | | 03/18/2021 | | | | (2,721 | ) |
Deutsche Bank AG | | USD | 125 | | | COP | 447,040 | | | | 03/18/2021 | | | | (2,843 | ) |
Deutsche Bank AG | | USD | 108 | | | IDR | 1,530,528 | | | | 04/15/2021 | | | | (2,318 | ) |
Deutsche Bank AG | | USD | 910 | | | INR | 67,480 | | | | 04/15/2021 | | | | (2,977 | ) |
Deutsche Bank AG | | KRW | 131,672 | | | USD | 119 | | | | 04/22/2021 | | | | 1,707 | |
Deutsche Bank AG | | PHP | 11,700 | | | USD | 243 | | | | 04/22/2021 | | | | 4,837 | |
Goldman Sachs Bank USA | | BRL | 259 | | | USD | 47 | | | | 03/02/2021 | | | | 618 | |
Goldman Sachs Bank USA | | USD | 47 | | | BRL | 259 | | | | 03/02/2021 | | | | (1,264 | ) |
Goldman Sachs Bank USA | | PEN | 3,609 | | | USD | 998 | | | | 03/18/2021 | | | | 8,627 | |
Goldman Sachs Bank USA | | USD | 302 | | | COP | 1,049,403 | | | | 03/18/2021 | | | | (14,466 | ) |
Goldman Sachs Bank USA | | RUB | 2,761 | | | USD | 37 | | | | 03/24/2021 | | | | 399 | |
Goldman Sachs Bank USA | | MYR | 1,527 | | | USD | 378 | | | | 03/25/2021 | | | | 2,584 | |
Goldman Sachs Bank USA | | USD | 28 | | | BRL | 153 | | | | 04/05/2021 | | | | (839 | ) |
Goldman Sachs Bank USA | | USD | 348 | | | IDR | 4,926,203 | | | | 04/15/2021 | | | | (7,862 | ) |
Goldman Sachs Bank USA | | USD | 249 | | | CNY | 1,617 | | | | 04/22/2021 | | | | (733 | ) |
Goldman Sachs Bank USA | | USD | 121 | | | PHP | 5,816 | | | | 04/22/2021 | | | | (2,354 | ) |
Morgan Stanley Capital Services, Inc. | | USD | 362 | | | MYR | 1,467 | | | | 03/25/2021 | | | | (1,856 | ) |
Natwest Markets PLC | | USD | 237 | | | RUB | 17,521 | | | | 03/24/2021 | | | | (2,789 | ) |
Standard Chartered Bank | | COP | 550,864 | | | USD | 156 | | | | 03/18/2021 | | | | 5,167 | |
Standard Chartered Bank | | PEN | 1,043 | | | USD | 289 | | | | 03/18/2021 | | | | 2,876 | |
Standard Chartered Bank | | USD | 244 | | | CLP | 171,949 | | | | 03/18/2021 | | | | (5,948 | ) |
Standard Chartered Bank | | USD | 51 | | | PEN | 186 | | | | 03/18/2021 | | | | (12 | ) |
Standard Chartered Bank | | IDR | 2,385,473 | | | USD | 169 | | | | 04/15/2021 | | | | 4,772 | |
Standard Chartered Bank | | USD | 49 | | | INR | 3,561 | | | | 04/15/2021 | | | | (818 | ) |
Standard Chartered Bank | | CNY | 1,535 | | | USD | 238 | | | | 04/22/2021 | | | | 2,072 | |
Standard Chartered Bank | | USD | 893 | | | CNY | 5,801 | | | | 04/22/2021 | | | | (2,281 | ) |
State Street Bank & Trust Co. | | NZD | 210 | | | USD | 150 | | | | 03/05/2021 | | | | (2,098 | ) |
State Street Bank & Trust Co. | | THB | 9,775 | | | USD | 326 | | | | 03/11/2021 | | | | 1,481 | |
State Street Bank & Trust Co. | | USD | 691 | | | THB | 20,708 | | | | 03/11/2021 | | | | (3,963 | ) |
State Street Bank & Trust Co. | | AUD | 1,299 | | | USD | 1,015 | | | | 03/17/2021 | | | | 15,379 | |
State Street Bank & Trust Co. | | CAD | 85 | | | USD | 67 | | | | 03/17/2021 | | | | 5 | |
State Street Bank & Trust Co. | | CHF | 628 | | | USD | 703 | | | | 03/17/2021 | | | | 11,612 | |
| | |
| |
| abfunds.com | | AB TAX-MANAGED ALL MARKET INCOME PORTFOLIO | 47 |
PORTFOLIO OF INVESTMENTS (continued)
| | | | | | | | | | | | | | | | |
| Counterparty | | Contracts to
Deliver
(000) | | | In Exchange
For
(000) | | | Settlement
Date | | | Unrealized
Appreciation/
(Depreciation) | |
State Street Bank & Trust Co. | | EUR | 145 | | | USD | 176 | | | | 03/17/2021 | | | $ | 1,032 | |
State Street Bank & Trust Co. | | GBP | 223 | | | USD | 315 | | | | 03/17/2021 | | | | 4,665 | |
State Street Bank & Trust Co. | | GBP | 41 | | | USD | 57 | | | | 03/17/2021 | | | | (176 | ) |
State Street Bank & Trust Co. | | NOK | 457 | | | USD | 54 | | | | 03/17/2021 | | | | 1,437 | |
State Street Bank & Trust Co. | | NZD | 136 | | | USD | 99 | | | | 03/17/2021 | | | | 1,274 | |
State Street Bank & Trust Co. | | NZD | 285 | | | USD | 204 | | | | 03/17/2021 | | | | (1,623 | ) |
State Street Bank & Trust Co. | | USD | 467 | | | CAD | 591 | | | | 03/17/2021 | | | | (2,052 | ) |
State Street Bank & Trust Co. | | USD | 214 | | | CHF | 194 | | | | 03/17/2021 | | | | (818 | ) |
State Street Bank & Trust Co. | | USD | 176 | | | EUR | 145 | | | | 03/17/2021 | | | | (932 | ) |
State Street Bank & Trust Co. | | USD | 332 | | | GBP | 240 | | | | 03/17/2021 | | | | 2,022 | |
State Street Bank & Trust Co. | | USD | 1,033 | | | JPY | 109,396 | | | | 03/17/2021 | | | | (6,421 | ) |
State Street Bank & Trust Co. | | USD | 55 | | | NOK | 457 | | | | 03/17/2021 | | | | (2,057 | ) |
State Street Bank & Trust Co. | | USD | 667 | | | SEK | 5,534 | | | | 03/17/2021 | | | | (11,234 | ) |
State Street Bank & Trust Co. | | HUF | 149,122 | | | USD | 505 | | | | 03/24/2021 | | | | 8,908 | |
State Street Bank & Trust Co. | | PLN | 1,247 | | | USD | 337 | | | | 03/24/2021 | | | | 4,618 | |
State Street Bank & Trust Co. | | USD | 246 | | | CZK | 5,273 | | | | 03/24/2021 | | | | (3,266 | ) |
State Street Bank & Trust Co. | | USD | 263 | | | TRY | 1,936 | | | | 03/26/2021 | | | | (4,830 | ) |
State Street Bank & Trust Co. | | ZAR | 3,815 | | | USD | 257 | | | | 04/08/2021 | | | | 5,919 | |
State Street Bank & Trust Co. | | USD | 162 | | | NOK | 1,379 | | | | 04/15/2021 | | | | (3,248 | ) |
State Street Bank & Trust Co. | | USD | 313 | | | MXN | 6,465 | | | | 04/16/2021 | | | | (5,095 | ) |
State Street Bank & Trust Co. | | CHF | 366 | | | USD | 412 | | | | 05/06/2021 | | | | 9,595 | |
UBS AG | | BRL | 725 | | | USD | 131 | | | | 03/02/2021 | | | | 1,731 | |
UBS AG | | USD | 133 | | | BRL | 725 | | | | 03/02/2021 | | | | (4,027 | ) |
UBS AG | | CHF | 940 | | | USD | 1,054 | | | | 03/17/2021 | | | | 19,779 | |
UBS AG | | USD | 991 | | | SEK | 8,209 | | | | 03/17/2021 | | | | (18,443 | ) |
UBS AG | | CZK | 16,644 | | | USD | 777 | | | | 03/24/2021 | | | | 9,111 | |
UBS AG | | RUB | 2,761 | | | USD | 37 | | | | 03/24/2021 | | | | 479 | |
UBS AG | | USD | 281 | | | RUB | 21,457 | | | | 03/24/2021 | | | | 5,302 | |
UBS AG | | USD | 834 | | | RUB | 62,011 | | | | 03/24/2021 | | | | (5,307 | ) |
UBS AG | | USD | 546 | | | TRY | 4,190 | | | | 03/26/2021 | | | | 12,134 | |
UBS AG | | USD | 604 | | | TRY | 4,334 | | | | 03/26/2021 | | | | (26,969 | ) |
UBS AG | | BRL | 725 | | | USD | 133 | | | | 04/05/2021 | | | | 4,033 | |
| | | | | | | | | | | | | | | | |
| | | $ | 39,029 | |
| | | | | | | | | | | | | | | | |
CALL OPTIONS WRITTEN (see Note D)
| | | | | | | | | | | | | | | | | | | | | | | | | | |
| Description | | Counterparty | | Contracts | | | Exercise
Price | | | Expiration
Month | | | Notional
(000) | | | Premiums
Received | | | U.S. $ Value | |
Euro STOXX 50 Index(l) | | Citibank, NA | | | 110 | | | EUR | 3,825.00 | | | | March 2021 | | | EUR | 421 | | | $ | 3,624 | | | $ | (604 | ) |
FTSE 100 Index(l) | | Citibank, NA | | | 20 | | | GBP | 6,825.00 | | | | March 2021 | | | GBP | 137 | | | | 364 | | | | (259 | ) |
Nikkei 225 Index(l) | | Goldman Sachs International | | | 1,000 | | | JPY | 31,125.00 | | | | March 2021 | | | JPY | 31,125 | | | | 375 | | | | (326 | ) |
S&P 500 Index(l) | | UBS AG | | | 900 | | | USD | 3,915.00 | | | | March 2021 | | | USD | 3,524 | | | | 24,300 | | | | (24,300 | ) |
| | | | | | | | | |
| | | $ | 28,663 | | | $ | (25,489 | ) |
| | | | | | | | | |
| | |
| |
48 | AB TAX-MANAGED ALL MARKET INCOME PORTFOLIO | | abfunds.com |
PORTFOLIO OF INVESTMENTS (continued)
PUT OPTIONS WRITTEN (see Note D)
| | | | | | | | | | | | | | | | | | | | | | | | | | |
| Description | | Counterparty | | Contracts | | | Exercise
Price | | | Expiration
Month | | | Notional
(000) | | | Premiums
Received | | | U.S. $ Value | |
Euro STOXX 50 Index(l) | | Citibank,
NA | | | 110 | | | EUR | 3,450.00 | | | | March 2021 | | | EUR | 380 | | | $ | 4,128 | | | $ | (3,866 | ) |
FTSE 100 Index(l) | | Citibank,
NA | | | 20 | | | GBP | 6,400.00 | | | | March 2021 | | | GBP | 128 | | | | 3,040 | | | | (3,067 | ) |
Nikkei 225 Index(l) | | Goldman
Sachs
International | | | 1,000 | | | JPY | 28,125.00 | | | | March 2021 | | | JPY | 28,125 | | | | 2,247 | | | | (2,439 | ) |
S&P 500 Index(l) | | UBS AG | | | 900 | | | USD | 3,730.00 | | | | March 2021 | | | USD | 3,357 | | | | 54,540 | | | | (54,540 | ) |
| | | | | | | | | |
| | | $ | 63,955 | | | $ | (63,912 | ) |
| | | | | | | | | |
CENTRALLY CLEARED CREDIT DEFAULT SWAPS (see Note D)
| | | | | | | | | | | | | | | | | | | | | | | | | | | | |
| Description | | Fixed
Rate
(Pay)
Receive | | | Payment
Frequency | | | Implied
Credit
Spread at
February 28,
2021 | | | Notional
Amount
(000) | | | Market
Value | | | Upfront
Premiums
Paid
(Received) | | | Unrealized
Appreciation/
(Depreciation) | |
Buy Contracts | | | | | | | | | | | | | | | | | | | | | | | | | |
CDX-NAHY Series 35, 5 Year Index, 12/20/2025* | | | (5.00 | )% | | | Quarterly | | | | 3.09 | % | | | USD 690 | | | $ | (63,911 | ) | | $ | (25,895 | ) | | $ | (38,016 | ) |
CENTRALLY CLEARED INFLATION (CPI) SWAPS (see Note D)
| | | | | | | | | | | | | | | | | | | | | | | | | | |
| | | | | | | | | Rate Type | | | | | | | | | | | |
Notional
Amount
(000) | | | Termination
Date | | | Payments
made
by the
Fund | | Payments
received
by the
Fund | | Payment
Frequency
Paid/
Received | | Market
Value | | | Upfront
Premiums
Paid
(Received) | | | Unrealized
Appreciation/
(Depreciation) | |
| USD | | | 1,170 | | | | 01/15/2028 | | | 0.735% | | CPI# | | Maturity | | $ | 137,394 | | | $ | – 0 | – | | $ | 137,394 | |
| USD | | | 1,080 | | | | 01/15/2028 | | | 1.230% | | CPI# | | Maturity | | | 84,076 | | | | – 0 | – | | | 84,076 | |
| USD | | | 310 | | | | 01/15/2028 | | | 1.230% | | CPI# | | Maturity | | | 24,133 | | | | – 0 | – | | | 24,133 | |
| USD | | | 630 | | | | 01/15/2030 | | | 1.585% | | CPI# | | Maturity | | | 38,433 | | | | – 0 | – | | | 38,433 | |
| USD | | | 75 | | | | 01/15/2030 | | | 1.572% | | CPI# | | Maturity | | | 4,676 | | | | – 0 | – | | | 4,676 | |
| USD | | | 75 | | | | 01/15/2030 | | | 1.587% | | CPI# | | Maturity | | | 4,560 | | | | – 0 | – | | | 4,560 | |
| USD | | | 150 | | | | 02/15/2051 | | | CPI# | | 2.290% | | Maturity | | | 3,885 | | | | – 0 | – | | | 3,885 | |
| | | | | | | | | | | | | | | | | | | | | | | | | | |
| | | | | | | | | | | | | | | | $ | 297,157 | | | $ | – 0 | – | | $ | 297,157 | |
| | | | | | | | | | | | | | | | | | | | | | | | | | |
| # | Variable interest rate based on the rate of inflation as determined by the Consumer Price Index (CPI). |
| | |
| |
| abfunds.com | | AB TAX-MANAGED ALL MARKET INCOME PORTFOLIO | 49 |
PORTFOLIO OF INVESTMENTS (continued)
CENTRALLY CLEARED INTEREST RATE SWAPS (see Note D)
| | | | | | | | | | | | | | | | | | | | | | | | | | | | | | |
| | | | | | | | | Rate Type | | | | | | | | | | | | |
Notional
Amount
(000) | | | Termination
Date | | | Payments
made
by the
Fund | | | Payments
received
by the
Fund | | | Payment
Frequency
Paid/
Received | | Market
Value | | | Upfront
Premiums
Paid
(Received) | | | Unrealized
Appreciation/
(Depreciation) | |
| USD | | | 1,640 | | | | 06/17/2021 | | |
| 3 Month
LIBOR |
| | | 1.907% | | | Quarterly/Semi-Annual | | $ | 14,341 | | | $ | – 0 | – | | $ | 14,341 | |
| USD | | | 820 | | | | 09/10/2024 | | |
| 3 Month
LIBOR |
| | | 1.341% | | | Quarterly/Semi-Annual | | | 27,752 | | | | – 0 | – | | | 27,752 | |
| USD | | | 2,420 | | | | 11/29/2024 | | |
| 3 Month
LIBOR |
| | | 1.535% | | | Quarterly/Semi-Annual | | | 92,461 | | | | – 0 | – | | | 92,461 | |
| USD | | | 145 | | | | 10/09/2029 | | |
| 3 Month
LIBOR |
| | | 1.476% | | | Quarterly/Semi-Annual | | | 1,527 | | | | – 0 | – | | | 1,527 | |
| USD | | | 145 | | | | 10/09/2029 | | |
| 3 Month
LIBOR |
| | | 1.479% | | | Quarterly/Semi-Annual | | | 1,565 | | | | – 0 | – | | | 1,565 | |
| NOK | | | 1,230 | | | | 05/05/2030 | | |
| 6 Month
NIBOR |
| | | 0.885% | | | Semi-Annual/ Annual | | | (9,810 | ) | | | – 0 | – | | | (9,810 | ) |
| NOK | | | 1,130 | | | | 06/23/2030 | | |
| 6 Month
NIBOR |
| | | 0.916% | | | Semi-Annual/ Annual | | | (8,940 | ) | | | – 0 | – | | | (8,940 | ) |
| NOK | | | 960 | | | | 07/02/2030 | | |
| 6 Month
NIBOR |
| | | 0.890% | | | Semi-Annual/ Annual | | | (7,901 | ) | | | – 0 | – | | | (7,901 | ) |
| NOK | | | 540 | | | | 07/10/2030 | | |
| 6 Month
NIBOR |
| | | 0.900% | | | Semi-Annual/ Annual | | | (4,410 | ) | | | – 0 | – | | | (4,410 | ) |
| NOK | | | 1,060 | | | | 08/11/2030 | | |
| 6 Month
NIBOR |
| | | 0.825% | | | Semi-Annual/ Annual | | | (9,666 | ) | | | – 0 | – | | | (9,666 | ) |
| NOK | | | 3,240 | | | | 11/11/2030 | | |
| 6 Month
NIBOR |
| | | 1.031% | | | Semi-Annual/ Annual | | | (24,736 | ) | | | – 0 | – | | | (24,736 | ) |
| NZD | | | 530 | | | | 11/17/2030 | | |
| 3 Month
BKBM |
| | | 0.785% | | | Quarterly/Semi-Annual | | | (39,831 | ) | | | – 0 | – | | | (39,831 | ) |
| NZD | | | 720 | | | | 11/23/2030 | | |
| 3 Month
BKBM |
| | | 0.841% | | | Quarterly/Semi-Annual | | | (51,630 | ) | | | – 0 | – | | | (51,630 | ) |
| NZD | | | 90 | | | | 12/02/2030 | | |
| 3 Month
BKBM |
| | | 0.876% | | | Quarterly/Semi-Annual | | | (6,319 | ) | | | – 0 | – | | | (6,319 | ) |
| NOK | | | 640 | | | | 01/04/2031 | | |
| 6 Month
NIBOR |
| | | 1.280% | | | Semi-Annual/ Annual | | | (3,384 | ) | | | – 0 | – | | | (3,384 | ) |
| NZD | | | 150 | | | | 01/05/2031 | | |
| 3 Month
BKBM |
| | | 0.978% | | | Quarterly/Semi-Annual | | | (9,770 | ) | | | – 0 | – | | | (9,770 | ) |
| NOK | | | 1,020 | | | | 01/11/2031 | | |
| 6 Month
NIBOR |
| | | 1.274% | | | Semi-Annual/ Annual | | | (5,487 | ) | | | – 0 | – | | | (5,487 | ) |
| NOK | | | 1,800 | | | | 01/21/2031 | | |
| 6 Month
NIBOR |
| | | 1.348% | | | Semi-Annual/ Annual | | | (8,364 | ) | | | – 0 | – | | | (8,364 | ) |
| NZD | | | 230 | | | | 01/21/2031 | | |
| 3 Month
BKBM |
| | | 1.075% | | | Quarterly/Semi-Annual | | | (13,653 | ) | | | – 0 | – | | | (13,653 | ) |
| NOK | | | 3,210 | | | | 02/19/2031 | | |
| 6 Month
NIBOR |
| | | 1.634% | | | Semi-Annual/ Annual | | | (5,540 | ) | | | – 0 | – | | | (5,540 | ) |
| CHF | | | 600 | | | | 02/19/2031 | | | | (0.054)% | | |
| 6 Month
LIBOR |
| | Annual/ Semi-Annual | | | 8,641 | | | | – 0 | – | | | 8,641 | |
| NZD | | | 560 | | | | 02/19/2031 | | |
| 3 Month
BKBM |
| | | 1.616% | | | Quarterly/Semi-Annual | | | (13,761 | ) | | | – 0 | – | | | (13,761 | ) |
| NZD | | | 260 | | | | 02/19/2031 | | | | 1.616% | | |
| 3 Month
BKBM |
| | Semi-Annual/Quarterly | | | 6,411 | | | | 7,108 | | | | (697 | ) |
| CHF | | | 370 | | | | 03/01/2031 | | | | 0.068% | | |
| 6 Month
LIBOR |
| | Annual/ Semi-Annual | | | 523 | | | | – 0 | – | | | 523 | |
| USD | | | 80 | | | | 02/15/2051 | | | | 1.942% | | |
| 3 Month
LIBOR |
| | Semi-Annual/Quarterly | | | (761 | ) | | | – 0 | – | | | (761 | ) |
| | | | | | | | | | | | | | | | | | | | | | | | | | | | | | |
| | | | | | | | | | | | | | | | | | | | $ | (70,742 | ) | | $ | 7,108 | | | $ | (77,850 | ) |
| | | | | | | | | | | | | | | | | | | | | | | | | | | | | | |
| | |
| |
50 | AB TAX-MANAGED ALL MARKET INCOME PORTFOLIO | | abfunds.com |
PORTFOLIO OF INVESTMENTS (continued)
CREDIT DEFAULT SWAPS (see Note D)
| | | | | | | | | | | | | | | | | | | | | | | | | | | | |
Swap
Counterparty &
Referenced
Obligation | | Fixed
Rate
(Pay)
Receive | | | Payment
Frequency | | | Implied
Credit
Spread at
February 28,
2021 | | | Notional
Amount
(000) | | | Market
Value | | | Upfront
Premiums
Paid
(Received) | | | Unrealized
Appreciation/
(Depreciation) | |
Sale Contracts | |
Citigroup Global Markets, Inc. | | | | | | | | | | | | | | | | | | | | | | | | | | | | |
CDX-CMBX.
NA.BBB- Series 6, 05/11/2063* | | | 3.00 | % | | | Monthly | | | | 12.50 | % | | USD | 8 | | | $ | (1,976 | ) | | $ | (777 | ) | | $ | (1,199 | ) |
CDX-CMBX.
NA.BBB- Series 6, 05/11/2063* | | | 3.00 | | | | Monthly | | | | 12.50 | | | USD | 70 | | | | (17,286 | ) | | | (8,768 | ) | | | (8,518 | ) |
Credit Suisse International | | | | | | | | | | | | | | | | | | | | | | | | | | | | |
CDX-CMBX.
NA.BBB- Series 6, 05/11/2063* | | | 3.00 | | | | Monthly | | | | 12.50 | | | USD | 3 | | | | (741 | ) | | | (294 | ) | | | (447 | ) |
CDX-CMBX.
NA.BBB- Series 6, 05/11/2063* | | | 3.00 | | | | Monthly | | | | 12.50 | | | USD | 4 | | | | (988 | ) | | | (486 | ) | | | (502 | ) |
CDX-CMBX.
NA.BBB- Series 6, 05/11/2063* | | | 3.00 | | | | Monthly | | | | 12.50 | | | USD | 54 | | | | (13,330 | ) | | | (5,298 | ) | | | (8,032 | ) |
CDX-CMBX.
NA.BBB- Series 6, 05/11/2063* | | | 3.00 | | | | Monthly | | | | 12.50 | | | USD | 81 | | | | (20,003 | ) | | | (7,743 | ) | | | (12,260 | ) |
CDX-CMBX.
NA.BBB- Series 6, 05/11/2063* | | | 3.00 | | | | Monthly | | | | 12.50 | | | USD | 138 | | | | (34,079 | ) | | | (16,653 | ) | | | (17,426 | ) |
Goldman Sachs International | | | | | | | | | | | | | | | | | | | | | | | | | | | | |
CDX-CMBX.
NA.BBB- Series 6, 05/11/2063* | | | 3.00 | | | | Monthly | | | | 12.50 | | | USD | 7 | | | | (1,728 | ) | | | (873 | ) | | | (855 | ) |
CDX-CMBX.
NA.BBB- Series 6, 05/11/2063* | | | 3.00 | | | | Monthly | | | | 12.50 | | | USD | 26 | | | | (6,421 | ) | | | (3,243 | ) | | | (3,178 | ) |
CDX-CMBX.
NA.BBB- Series 6, 05/11/2063* | | | 3.00 | | | | Monthly | | | | 12.50 | | | USD | 69 | | | | (17,039 | ) | | | (6,402 | ) | | | (10,637 | ) |
| | |
| |
| abfunds.com | | AB TAX-MANAGED ALL MARKET INCOME PORTFOLIO | 51 |
PORTFOLIO OF INVESTMENTS (continued)
| | | | | | | | | | | | | | | | | | | | | | | | | | | | |
Swap
Counterparty &
Referenced
Obligation | | Fixed
Rate
(Pay)
Receive | | | Payment
Frequency | | | Implied
Credit
Spread at
February 28,
2021 | | | Notional
Amount
(000) | | | Market
Value | | | Upfront
Premiums
Paid
(Received) | | | Unrealized
Appreciation/
(Depreciation) | |
CDX-CMBX.
NA.BBB- Series 6, 05/11/2063* | | | 3.00 | % | | | Monthly | | | | 12.50 | % | | USD | 149 | | | $ | (36,783 | ) | | $ | (20,998 | ) | | $ | (15,785 | ) |
| | | | | | | | | | | | | | | | | | | | | | | | | | | | |
| | | | | | | | | | | | | | | | | | $ | (150,374 | ) | | $ | (71,535 | ) | | $ | (78,839 | ) |
| | | | | | | | | | | | | | | | | | | | | | | | | | | | |
INTEREST RATE SWAPS (see Note D)
| | | | | | | | | | | | | | | | | | | | | | | | | | | | | | |
| | | | | | | | | Rate Type | | | | | | | | | | | | | |
Swap
Counterparty | | Notional
Amount
(000) | | | Termination
Date | | | Payments
made
by the
Fund | | Payments
received
by the
Fund | | | Payment
Frequency
Paid
Received | | | Market
Value | | | Upfront
Premiums
Paid
(Received) | | | Unrealized
Appreciation/
(Depreciation) | |
Citibank, NA | | USD | 195 | | | | 10/09/2029 | | | 1.120% | | | SIFMA* | | | | Quarterly | | | $ | (1,898 | ) | | $ | – 0 | – | | $ | (1,898 | ) |
Citibank, NA | | USD | 195 | | | | 10/09/2029 | | | 1.125% | | | SIFMA* | | | | Quarterly | | | | (1,989 | ) | | | – 0 | – | | | (1,989 | ) |
| | | | | | | | | | | | | | | | | | | | | | | | | | | | | | |
| | | | | | | | | | | | | | | | | | | | $ | (3,887 | ) | | $ | – 0 | – | | $ | (3,887 | ) |
| | | | | | | | | | | | | | | | | | | | | | | | | | | | | | |
| * | Variable interest rate based on the Securities Industry & Financial Markets Association (SIFMA) Municipal Swap Index. |
TOTAL RETURN SWAPS (see Note D)
| | | | | | | | | | | | | | | | | | | | |
Counterparty &
Referenced Obligation | | Rate
Paid/
Received | | | Payment
Frequency | | | Current
Notional
(000) | | | Maturity
Date | | | Unrealized
Appreciation/
(Depreciation) | |
Receive Total Return on Reference Obligation | |
JPMorgan Chase Bank, NA | | | | | | | | | | | | | | | | | | | | |
JPABSAA1(1) | | | 0.14 | % | | | Maturity | | | | USD 9,032 | | | | 03/31/2021 | | | $ | – 0 | – |
| (a) | Security is exempt from registration under Rule 144A of the Securities Act of 1933. These securities are considered restricted, but liquid and may be resold in transactions exempt from registration, normally to qualified institutional buyers. At February 28, 2021, the aggregate market value of these securities amounted to $4,327,517 or 4.9% of net assets. |
| (b) | Security is exempt from registration under Rule 144A of the Securities Act of 1933. These securities, which represent 0.36% of net assets as of February 28, 2021, are considered illiquid and restricted. Additional information regarding such securities follows: |
| | | | | | | | | | | | | | | | |
144A/Restricted & Illiquid
Securities | | Acquisition
Date | | | Cost | | | Market
Value | | | Percentage of
Net Assets | |
Massachusetts Development Finance Agency
(Zero Waste Solutions LLC) Series 2017
8.00%, 12/01/2022 | | | 12/07/2017 | | | $ | 217,972 | | | $ | 224,538 | | | | 0.25 | % |
Massachusetts Development Finance Agency
(Zero Waste Solutions LLC) Series 2017A
7.75%, 12/01/2044 | | | 12/07/2017 | | | | 100,000 | | | | 95,300 | | | | 0.11 | % |
| | |
| |
52 | AB TAX-MANAGED ALL MARKET INCOME PORTFOLIO | | abfunds.com |
PORTFOLIO OF INVESTMENTS (continued)
| (c) | An auction rate security whose interest rate resets at each auction date. Auctions are typically held every week or month. The rate shown is as of February 28, 2021 and the aggregate market value of this security amounted to $169,969 or 0.19% of net assets. |
| (e) | Non-income producing security. |
| (f) | When-Issued or delayed delivery security. |
| (g) | Variable Rate Demand Notes are instruments whose interest rates change on a specific date (such as coupon date or interest payment date) or whose interest rates vary with changes in a designated base rate (such as the prime interest rate). This instrument is payable on demand and is secured by letters of credit or other credit support agreements from major banks. |
| (h) | To obtain a copy of the fund’s shareholder report, please go to the Securities and Exchange Commission’s website at www.sec.gov. Additionally, shareholder reports for AB funds can be obtained by calling AB at (800) 227-4618. |
| (i) | Floating Rate Security. Stated interest/floor/ceiling rate was in effect at February 28, 2021. |
| (j) | The rate shown represents the 7-day yield as of period end. |
| (k) | Affiliated investments. |
| (l) | One contract relates to 1 share. |
As of February 28, 2021, the Fund’s percentages of investments in municipal bonds that are insured and in insured municipal bonds that have been pre-refunded or escrowed to maturity are 4.3% and 0.0%, respectively.
Currency Abbreviations:
AUD – Australian Dollar
BRL – Brazilian Real
CAD – Canadian Dollar
CHF – Swiss Franc
CLP – Chilean Peso
CNY – Chinese Yuan Renminbi
COP – Colombian Peso
CZK – Czech Koruna
EUR – Euro
GBP – Great British Pound
HUF – Hungarian Forint
IDR – Indonesian Rupiah
INR – Indian Rupee
JPY – Japanese Yen
KRW – South Korean Won
MXN – Mexican Peso
MYR – Malaysian Ringgit
NOK – Norwegian Krone
NZD – New Zealand Dollar
PEN – Peruvian Sol
PHP – Philippine Peso
PLN – Polish Zloty
RUB – Russian Ruble
SEK – Swedish Krona
THB – Thailand Baht
TRY – Turkish Lira
TWD – New Taiwan Dollar
USD – United States Dollar
ZAR – South African Rand
| | |
| |
| abfunds.com | | AB TAX-MANAGED ALL MARKET INCOME PORTFOLIO | 53 |
PORTFOLIO OF INVESTMENTS (continued)
Glossary:
AGM – Assured Guaranty Municipal
BKBM – Bank Bill Benchmark (New Zealand)
CBT – Chicago Board of Trade
CDX-CMBX.NA – North American Commercial Mortgage-Backed Index
CDX-NAHY – North American High Yield Credit Default Swap Index
CPI – Consumer Price Index
ETF – Exchange Traded Fund
ETM – Escrowed to Maturity
FTSE – Financial Times Stock Exchange
LIBOR – London Interbank Offered Rate
MSCI – Morgan Stanley Capital International
NATL – National Interstate Corporation
NIBOR – Norwegian Interbank Offered Rate
OMXS – Stockholm Stock Exchange
REIT – Real Estate Investment Trust
SPI – Share Price Index
TOPIX – Tokyo Price Index
TSX – Toronto Stock Exchange
UPMC – University of Pittsburgh Medical Center
| (1) | The following table represents the 50 largest (long/(short)) equity basket holdings underlying the total return swap with JPABSAA1 as of February 28, 2021. |
| | | | | | | | | | | | |
| Security Description | | Shares | | | Current Notional | | | Percent of
Basket’s Value | |
S&P 500 Total Return | | | (620 | ) | | $ | (4,893,662 | ) | | | (54.2 | )% |
MSCI Daily TR Gross EAFE USD | | | (280 | ) | | | (2,648,667 | ) | | | (29.3 | )% |
JPMorgan Cash USA | | | (5,615 | ) | | | (1,710,895 | ) | | | (18.9 | )% |
Microsoft Corp. | | | 1,831 | | | | 425,487 | | | | 4.7 | % |
MSCI Daily TR Gross Canada USD | | | (31 | ) | | | (279,252 | ) | | | (3.1 | )% |
Alphabet, Inc. | | | 117 | | | | 238,347 | | | | 2.6 | % |
Roche Holding AG | | | 702 | | | | 230,899 | | | | 2.6 | % |
Apple, Inc. | | | 1,797 | | | | 217,864 | | | | 2.4 | % |
Oracle Corp. | | | 3,276 | | | | 211,347 | | | | 2.3 | % |
Amazon.com, Inc. | | | 68 | | | | 209,485 | | | | 2.3 | % |
Citrix Systems, Inc. | | | 1,275 | | | | 170,381 | | | | 1.9 | % |
UnitedHealth Group, Inc. | | | 502 | | | | 166,657 | | | | 1.8 | % |
Walmart, Inc. | | | 1,276 | | | | 165,726 | | | | 1.8 | % |
Home Depot, Inc./(The) | | | 623 | | | | 161,070 | | | | 1.8 | % |
AutoZone, Inc. | | | 137 | | | | 159,208 | | | | 1.8 | % |
Facebook, Inc. | | | 607 | | | | 156,415 | | | | 1.7 | % |
Procter & Gamble Co./(The) | | | 1,266 | | | | 156,415 | | | | 1.7 | % |
Nippon Telegraph & Telephone Co. | | | 5,719 | | | | 148,036 | | | | 1.6 | % |
Enel SpA | | | 15,450 | | | | 147,105 | | | | 1.6 | % |
Paychex, Inc. | | | 1,615 | | | | 147,105 | | | | 1.6 | % |
Koninklijke Ahold Delhaize | | | 5,514 | | | | 146,174 | | | | 1.6 | % |
CME Group, Inc. | | | 704 | | | | 140,588 | | | | 1.6 | % |
Deckers Outdoor Corp. | | | 420 | | | | 136,863 | | | | 1.5 | % |
Taiwan Semiconductor Manufacturing Co., Ltd. | | | 1,079 | | | | 135,932 | | | | 1.5 | % |
Automatic Data Processing, Inc. | | | 765 | | | | 133,139 | | | | 1.5 | % |
Auto Trader Group PLC | | | 171 | | | | 131,277 | | | | 1.5 | % |
Merck & Co. Inc. | | | 1,744 | | | | 126,622 | | | | 1.4 | % |
Fidelity National Information Services | | | 911 | | | | 125,691 | | | | 1.4 | % |
RELX PLC | | | 5,310 | | | | 125,691 | | | | 1.4 | % |
Sony Corp. | | | 1,160 | | | | 121,036 | | | | 1.3 | % |
| | |
| |
54 | AB TAX-MANAGED ALL MARKET INCOME PORTFOLIO | | abfunds.com |
PORTFOLIO OF INVESTMENTS (continued)
| | | | | | | | | | | | |
| Security Description | | Shares | | | Current Notional | | | Percent of
Basket’s Value | |
Texas Instruments, Inc. | | | 703 | | | $ | 121,036 | | | | 1.3 | % |
Swedish Match AB | | | 1,662 | | | | 120,105 | | | | 1.3 | % |
Constellation Software, Inc./(Canada) | | | 88 | | | | 114,518 | | | | 1.3 | % |
Capgemini SE | | | 686 | | | | 110,794 | | | | 1.2 | % |
Royal Dutch Shell PLC | | | 57 | | | | 110,794 | | | | 1.2 | % |
Activision Blizzard, Inc. | | | 1,110 | | | | 106,139 | | | | 1.2 | % |
Aristocrat Leisure, Ltd. | | | 4,476 | | | | 105,208 | | | | 1.2 | % |
Partners Group Holding AG | | | 87 | | | | 105,208 | | | | 1.2 | % |
Novo Nordisk A/S | | | 1,433 | | | | 102,415 | | | | 1.1 | % |
Comcast Corp. | | | 1,907 | | | | 100,553 | | | | 1.1 | % |
Ameren Corp. | | | 1,418 | | | | 99,622 | | | | 1.1 | % |
Anthem, Inc. | | | 319 | | | | 96,828 | | | | 1.1 | % |
NextEra Energy, Inc. | | | 1,305 | | | | 95,897 | | | | 1.1 | % |
Wolters Kluwer NV | | | 1,191 | | | | 94,966 | | | | 1.1 | % |
Visa, Inc. | | | 434 | | | | 92,173 | | | | 1.0 | % |
Philip Morris International, Inc. | | | 1,042 | | | | 87,518 | | | | 1.0 | % |
Mastercard, Inc. | | | 247 | | | | 87,518 | | | | 1.0 | % |
Nippon Building Fund, Inc. | | | 14 | | | | 86,587 | | | | 1.0 | % |
Dollar General Corp. | | | 448 | | | | 84,725 | | | | 0.9 | % |
Booz Allen Hamilton Holding Co. | | | 1,086 | | | | 83,794 | | | | 0.9 | % |
Other Long | | | 384,325 | | | | 2,724,313 | | | | 30.2 | % |
See notes to financial statements.
| | |
| |
| abfunds.com | | AB TAX-MANAGED ALL MARKET INCOME PORTFOLIO | 55 |
STATEMENT OF ASSETS & LIABILITIES
February 28, 2021 (unaudited)
| | | | |
| Assets | | | | |
Investments in securities, at value | | | | |
Unaffiliated issuers (cost $74,249,106) | | $ | 80,170,334 | |
Affiliated issuers (cost $7,275,716) | | | 7,275,716 | |
Cash collateral due from broker | | | 1,660,688 | |
Foreign currencies, at value (cost $558,439) | | | 553,781 | |
Unaffiliated interest and dividends receivable | | | 676,869 | |
Unrealized appreciation on forward currency exchange contracts | | | 254,112 | |
Receivable for investment securities sold | | | 154,196 | |
Receivable for shares of beneficial interest sold | | | 35,119 | |
Affiliated dividends receivable | | | 76 | |
Other assets | | | 25 | |
| | | | |
Total assets | | | 90,780,916 | |
| | | | |
| Liabilities | | | | |
Due to custodian | | | 978,975 | |
Options written, at value (premiums received $92,618) | | | 89,401 | |
Payable for variation margin on futures | | | 280,987 | |
Payable for terminated total return swaps | | | 225,069 | |
Unrealized depreciation on forward currency exchange contracts | | | 215,083 | |
Market value on credit default swaps (net premiums received $71,535) | | | 150,374 | |
Payable for investment securities purchased and foreign currency transactions | | | 143,511 | |
Payable for shares of beneficial interest redeemed | | | 78,877 | |
Distribution fee payable | | | 13,314 | |
Advisory fee payable | | | 10,635 | |
Transfer Agent fee payable | | | 7,832 | |
Trustees’ fees payable | | | 3,936 | |
Payable for variation margin on centrally cleared swaps | | | 3,905 | |
Unrealized depreciation on interest rate swaps | | | 3,887 | |
Payable for newly entered centrally cleared interest rate swaps | | | 7,058 | |
Accrued expenses and other liabilities | | | 144,336 | |
| | | | |
Total liabilities | | | 2,357,180 | |
| | | | |
Net Assets | | $ | 88,423,736 | |
| | | | |
| Composition of Net Assets | | | | |
Shares of beneficial interest, at par | | $ | 72 | |
Additional paid-in capital | | | 87,434,401 | |
Distributable earnings | | | 989,263 | |
| | | | |
| | $ | 88,423,736 | |
| | | | |
Net Asset Value Per Share—unlimited shares authorized, $.00001 par value
| | | | | | | | | | | | |
| Class | | Net Assets | | | Shares
Outstanding | | | Net Asset
Value | |
| |
| A | | $ | 54,335,015 | | | | 4,434,310 | | | $ | 12.25 | * |
| |
| C | | $ | 3,392,980 | | | | 271,306 | | | $ | 12.51 | |
| |
| Advisor | | $ | 30,695,741 | | | | 2,501,298 | | | $ | 12.27 | |
| |
| * | The maximum offering price per share for Class A shares was $12.79 which reflects a sales charge of 4.25%. |
See notes to financial statements.
| | |
| |
56 | AB TAX-MANAGED ALL MARKET INCOME PORTFOLIO | | abfunds.com |
STATEMENT OF OPERATIONS
Six Months Ended February 28, 2021 (unaudited)
| | | | | | | | |
| Investment Income | | | | | | | | |
Interest | | $ | 857,391 | | | | | |
Dividends | | | | | | | | |
Unaffiliated issuers (net of foreign taxes withheld of $9,507) | | | 599,152 | | | | | |
Affiliated issuers | | | 1,133 | | | | | |
Other income | | | 250 | | | $ | 1,457,926 | |
| | | | | | | | |
| Expenses | | | | | | | | |
Advisory fee (see Note B) | | | 243,666 | | | | | |
Distribution fee—Class A | | | 67,697 | | | | | |
Distribution fee—Class C | | | 18,342 | | | | | |
Transfer agency—Class A | | | 21,966 | | | | | |
Transfer agency—Class C | | | 1,576 | | | | | |
Transfer agency—Advisor Class | | | 12,484 | | | | | |
Custody and accounting | | | 90,672 | | | | | |
Audit and tax | | | 37,886 | | | | | |
Registration fees | | | 26,633 | | | | | |
Printing | | | 17,346 | | | | | |
Legal | | | 16,101 | | | | | |
Trustees’ fees | | | 9,272 | | | | | |
Miscellaneous | | | 18,603 | | | | | |
| | | | | | | | |
Total expenses | | | 582,244 | | | | | |
Less: expenses waived and reimbursed by the Adviser (see Note B) | | | (171,616 | ) | | | | |
| | | | | | | | |
Net expenses | | | | | | | 410,628 | |
| | | | | | | | |
Net investment income | | | | | | | 1,047,298 | |
| | | | | | | | |
| Realized and Unrealized Gain (Loss) on Investment and Foreign Currency Transactions | | | | | | | | |
Net realized gain (loss) on: | | | | | | | | |
Investment transactions | | | | | | | (398,206 | ) |
Forward currency exchange contracts | | | | | | | 65,351 | |
Futures | | | | | | | 2,936,470 | |
Options written | | | | | | | (29,931 | ) |
Swaps | | | | | | | (424,512 | ) |
Foreign currency transactions | | | | | | | 114,016 | |
Net change in unrealized appreciation/depreciation of: | | | | | | | | |
Investments(a) | | | | | | | 3,351,876 | |
Forward currency exchange contracts | | | | | | | 8,485 | |
Futures | | | | | | | (1,531,386 | ) |
Options written | | | | | | | 536 | |
Swaps | | | | | | | (405,421 | ) |
Foreign currency denominated assets and liabilities | | | | | | | (25,769 | ) |
| | | | | | | | |
Net gain on investment and foreign currency transactions | | | | | | | 3,661,509 | |
| | | | | | | | |
Net Increase in Net Assets from Operations | | | | | | $ | 4,708,807 | |
| | | | | | | | |
| (a) | Net of increase in accrued foreign capital gains taxes of $129. |
See notes to financial statements.
| | |
| |
| abfunds.com | | AB TAX-MANAGED ALL MARKET INCOME PORTFOLIO | 57 |
STATEMENT OF CHANGES IN NET ASSETS
| | | | | | | | |
| | | Six Months Ended
February 28, 2021
(unaudited) | | | Year Ended
August 31,
2020 | |
| Increase (Decrease) in Net Assets from Operations | | | | | | | | |
Net investment income | | $ | 1,047,298 | | | $ | 2,595,448 | |
Net realized gain (loss) on investment and foreign currency transactions | | | 2,263,188 | | | | (5,784,162 | ) |
Net change in unrealized appreciation/depreciation of investments and foreign currency denominated assets and liabilities | | | 1,398,321 | | | | (227,651 | ) |
| | | | | | | | |
Net increase (decrease) in net assets from operations | | | 4,708,807 | | | | (3,416,365 | ) |
Distributions to Shareholders | |
Class A | | | (939,767 | ) | | | (2,986,845 | ) |
Class B | | | – 0 | – | | | (1,897 | ) |
Class C | | | (47,176 | ) | | | (201,470 | ) |
Advisor Class | | | (570,279 | ) | | | (1,617,428 | ) |
| Transactions in Shares of Beneficial Interest | | | | | | | | |
Net decrease | | | (4,799,459 | ) | | | (5,914,904 | ) |
| | | | | | | | |
Total decrease | | | (1,647,874 | ) | | | (14,138,909 | ) |
| Net Assets | |
Beginning of period | | | 90,071,610 | | | | 104,210,519 | |
| | | | | | | | |
End of period | | $ | 88,423,736 | | | $ | 90,071,610 | |
| | | | | | | | |
See notes to financial statements.
| | |
| |
58 | AB TAX-MANAGED ALL MARKET INCOME PORTFOLIO | | abfunds.com |
NOTES TO FINANCIAL STATEMENTS
February 28, 2021 (unaudited)
NOTE A
Significant Accounting Policies
The AB Portfolios (the “Company”) is registered under the Investment Company Act of 1940 as a diversified, open end management investment company. The Company, which is a Massachusetts Business Trust, operates as a series company currently comprised of six series. Each series is considered to be a separate entity for financial reporting and tax purposes. This report relates to the AB Tax-Managed All Market Income Portfolio (the “Fund”). The Fund offers Class A, Class C and Advisor Class shares. Class B shares have been authorized but currently are not offered. Effective August 2, 2019, sales of Class B shares were suspended. On November 7, 2019, all remaining outstanding Class B shares of the Fund were converted to Class A shares. Class A shares are sold with a front-end sales charge of up to 4.25% for purchases not exceeding $1,000,000. With respect to purchases of $1,000,000 or more, Class A shares redeemed within one year of purchase may be subject to a contingent deferred sales charge of 1%. Class C shares are subject to a contingent deferred sales charge of 1% on redemptions made within the first year after purchase, and 0% after the first year of purchase. Class C shares will automatically convert to Class A shares ten years after the end of the calendar month of purchase. Advisor Class shares are sold without any initial or contingent deferred sales charge and are not subject to ongoing distribution expenses. All four classes of shares have identical voting, dividend, liquidation and other rights, except that the classes bear different distribution and transfer agency expenses. Each class has exclusive voting rights with respect to its distribution plan. The financial statements have been prepared in conformity with U.S. generally accepted accounting principles (“U.S. GAAP”), which require management to make certain estimates and assumptions that affect the reported amounts of assets and liabilities in the financial statements and amounts of income and expenses during the reporting period. Actual results could differ from those estimates. The Fund is an investment company under U.S. GAAP and follows the accounting and reporting guidance applicable to investment companies. The following is a summary of significant accounting policies followed by the Fund.
1. Security Valuation
Portfolio securities are valued at their current market value determined on the basis of market quotations or, if market quotations are not readily available or are deemed unreliable, at “fair value” as determined in accordance with procedures established by and under the general supervision of the Company’s Board of Trustees (the “Board”).
In general, the market values of securities which are readily available and deemed reliable are determined as follows: securities listed on a national
| | |
| |
| abfunds.com | | AB TAX-MANAGED ALL MARKET INCOME PORTFOLIO | 59 |
NOTES TO FINANCIAL STATEMENTS (continued)
securities exchange (other than securities listed on the NASDAQ Stock Market, Inc. (“NASDAQ”)) or on a foreign securities exchange are valued at the last sale price at the close of the exchange or foreign securities exchange. If there has been no sale on such day, the securities are valued at the last traded price from the previous day. Securities listed on more than one exchange are valued by reference to the principal exchange on which the securities are traded; securities listed only on NASDAQ are valued in accordance with the NASDAQ Official Closing Price; listed or over the counter (“OTC”) market put or call options are valued at the mid level between the current bid and ask prices. If either a current bid or current ask price is unavailable, AllianceBernstein L.P. (the “Adviser”) will have discretion to determine the best valuation (e.g., last trade price in the case of listed options); open futures are valued using the closing settlement price or, in the absence of such a price, the most recent quoted bid price. If there are no quotations available for the day of valuation, the last available closing settlement price is used; U.S. Government securities and any other debt instruments having 60 days or less remaining until maturity are generally valued at market by an independent pricing vendor, if a market price is available. If a market price is not available, the securities are valued at amortized cost. This methodology is commonly used for short term securities that have an original maturity of 60 days or less, as well as short term securities that had an original term to maturity that exceeded 60 days. In instances when amortized cost is utilized, the Valuation Committee (the “Committee”) must reasonably conclude that the utilization of amortized cost is approximately the same as the fair value of the security. Such factors the Committee will consider include, but are not limited to, an impairment of the creditworthiness of the issuer or material changes in interest rates. Fixed-income securities, including mortgage-backed and asset-backed securities, may be valued on the basis of prices provided by a pricing service or at a price obtained from one or more of the major broker-dealers. In cases where broker-dealer quotes are obtained, the Adviser may establish procedures whereby changes in market yields or spreads are used to adjust, on a daily basis, a recently obtained quoted price on a security. Swaps and other derivatives are valued daily, primarily using independent pricing services, independent pricing models using market inputs, as well as third party broker-dealers or counterparties. Open-end mutual funds are valued at the closing net asset value per share, while exchange traded funds are valued at the closing market price per share.
Securities for which market quotations are not readily available (including restricted securities) or are deemed unreliable are valued at fair value as deemed appropriate by the Adviser. Factors considered in making this determination may include, but are not limited to, information obtained by
| | |
| |
60 | AB TAX-MANAGED ALL MARKET INCOME PORTFOLIO | | abfunds.com |
NOTES TO FINANCIAL STATEMENTS (continued)
contacting the issuer, analysts, analysis of the issuer’s financial statements or other available documents. In addition, the Fund may use fair value pricing for securities primarily traded in non-U.S. markets because most foreign markets close well before the Fund values its securities at 4:00 p.m., Eastern Time. The earlier close of these foreign markets gives rise to the possibility that significant events, including broad market moves, may have occurred in the interim and may materially affect the value of those securities. To account for this, the Fund generally values many of its foreign equity securities using fair value prices based on third party vendor modeling tools to the extent available.
2. Fair Value Measurements
In accordance with U.S. GAAP regarding fair value measurements, fair value is defined as the price that the Fund would receive to sell an asset or pay to transfer a liability in an orderly transaction between market participants at the measurement date. U.S. GAAP establishes a framework for measuring fair value, and a three-level hierarchy for fair value measurements based upon the transparency of inputs to the valuation of an asset or liability (including those valued based on their market values as described in Note A.1 above). Inputs may be observable or unobservable and refer broadly to the assumptions that market participants would use in pricing the asset or liability. Observable inputs reflect the assumptions market participants would use in pricing the asset or liability based on market data obtained from sources independent of the Fund. Unobservable inputs reflect the Fund’s own assumptions about the assumptions that market participants would use in pricing the asset or liability based on the best information available in the circumstances. Each investment is assigned a level based upon the observability of the inputs which are significant to the overall valuation. The three-tier hierarchy of inputs is summarized below.
| | • | | Level 1—quoted prices in active markets for identical investments |
| | • | | Level 2—other significant observable inputs (including quoted prices for similar investments, interest rates, prepayment speeds, credit risk, etc.) |
| | • | | Level 3—significant unobservable inputs (including the Fund’s own assumptions in determining the fair value of investments) |
The fair value of debt instruments, such as bonds, and over-the-counter derivatives is generally based on market price quotations, recently executed market transactions (where observable) or industry recognized modeling techniques and are generally classified as Level 2. Pricing vendor inputs to Level 2 valuations may include quoted prices for similar investments in active markets, interest rate curves, coupon rates, currency rates, yield curves, option adjusted spreads, default rates, credit spreads and
| | |
| |
| abfunds.com | | AB TAX-MANAGED ALL MARKET INCOME PORTFOLIO | 61 |
NOTES TO FINANCIAL STATEMENTS (continued)
other unique security features in order to estimate the relevant cash flows which are then discounted to calculate fair values. If these inputs are unobservable and significant to the fair value, these investments will be classified as Level 3.
Where readily available market prices or relevant bid prices are not available for certain equity investments, such investments may be valued based on similar publicly traded investments, movements in relevant indices since last available prices or based upon underlying company fundamentals and comparable company data (such as multiples to earnings or other multiples to equity). Where an investment is valued using an observable input, such as another publicly traded security, the investment will be classified as Level 2. If management determines that an adjustment is appropriate based on restrictions on resale, illiquidity or uncertainty, and such adjustment is a significant component of the valuation, the investment will be classified as Level 3. An investment will also be classified as Level 3 where management uses company fundamentals and other significant inputs to determine the valuation.
Options are valued using market-based inputs to models, broker or dealer quotations, or alternative pricing sources with reasonable levels of price transparency, where such inputs and models are available. Alternatively, the values may be obtained through unobservable management determined inputs and/or management’s proprietary models. Where models are used, the selection of a particular model to value an option depends upon the contractual terms of, and specific risks inherent in, the option as well as the availability of pricing information in the market. Valuation models require a variety of inputs, including contractual terms, market prices, measures of volatility and correlations of such inputs. Exchange traded options generally will be classified as Level 2. For options that do not trade on exchange but trade in liquid markets, inputs can generally be verified and model selection does not involve significant management judgment. Options are classified within Level 2 on the fair value hierarchy when all of the significant inputs can be corroborated to market evidence. Otherwise such instruments are classified as Level 3.
Other fixed income investments, including non-U.S. government and corporate debt, are generally valued using quoted market prices, if available, which are typically impacted by current interest rates, maturity dates and any perceived credit risk of the issuer. Additionally, in the absence of quoted market prices, these inputs are used by pricing vendors to derive a valuation based upon industry or proprietary models which incorporate issuer specific data with relevant yield/spread comparisons with more widely quoted bonds with similar key characteristics. Those investments
| | |
| |
62 | AB TAX-MANAGED ALL MARKET INCOME PORTFOLIO | | abfunds.com |
NOTES TO FINANCIAL STATEMENTS (continued)
for which there are observable inputs are classified as Level 2. Where the inputs are not observable, the investments are classified as Level 3.
The following table summarizes the valuation of the Fund’s investments by the above fair value hierarchy levels as of February 28, 2021:
| | | | | | | | | | | | | | | | |
Investments in
Securities: | | Level 1 | | | Level 2 | | | Level 3 | | | Total | |
Assets: | |
Long-Term Municipal Bonds | | $ | – 0 | – | | $ | 47,691,385 | | | $ | – 0 | – | | $ | 47,691,385 | |
Short-Term Municipal Notes | | | – 0 | – | | | 1,430,278 | | | | – 0 | – | | | 1,430,278 | |
Common Stocks: | | | | | | | | | | | | | | | | |
Health Care | | | 3,263,695 | | | | 1,639,758 | | | | – 0 | – | | | 4,903,453 | |
Consumer Staples | | | 2,861,076 | | | | 1,662,237 | | | | – 0 | – | | | 4,523,313 | |
Financials | | | 1,938,667 | | | | 1,222,633 | | | | – 0 | – | | | 3,161,300 | |
Industrials | | | 1,546,595 | | | | 1,440,565 | | | | – 0 | – | | | 2,987,160 | |
Information Technology | | | 1,937,486 | | | | 309,282 | | | | – 0 | – | | | 2,246,768 | |
Utilities | | | 1,073,343 | | | | 528,598 | | | | – 0 | – | | | 1,601,941 | |
Communication Services | | | 1,204,941 | | | | 367,488 | | | | – 0 | – | | | 1,572,429 | |
Materials | | | 498,283 | | | | 1,043,049 | | | | – 0 | – | | | 1,541,332 | |
Consumer Discretionary | | | 161,287 | | | | 722,809 | | | | – 0 | – | | | 884,096 | |
Energy | | | 182,137 | | | | 289,937 | | | | – 0 | – | | | 472,074 | |
Real Estate | | | – 0 | – | | | 217,641 | | | | – 0 | – | | | 217,641 | |
Preferred Stocks | | | 5,794,270 | | | | – 0 | – | | | – 0 | – | | | 5,794,270 | |
Investment Companies | | | 913,564 | | | | – 0 | – | | | – 0 | – | | | 913,564 | |
Collateralized Mortgage Obligations | | | – 0 | – | | | 229,330 | | | | – 0 | – | | | 229,330 | |
Short-Term Investments | | | 7,275,716 | | | | – 0 | – | | | – 0 | – | | | 7,275,716 | |
| | | | | | | | | | | | | | | | |
Total Investments in Securities | | | 28,651,060 | | | | 58,794,990 | | | | – 0 | – | | | 87,446,050 | |
Other Financial Instruments(a): | | | | | | | | | | | | | | | | |
Assets: | |
Futures | | | 420,261 | | | | 49,579 | | | | – 0 | – | | | 469,840 | (b) |
Forward Currency Exchange Contracts | | | – 0 | – | | | 254,112 | | | | – 0 | – | | | 254,112 | |
Centrally Cleared Inflation (CPI) Swaps | | | – 0 | – | | | 297,157 | | | | – 0 | – | | | 297,157 | (b) |
Centrally Cleared Interest Rate Swaps | | | – 0 | – | | | 153,221 | | | | – 0 | – | | | 153,221 | (b) |
Total Return Swaps | | | – 0 | – | | | – 0 | – | | | – 0 | – | | | – 0 | – |
Liabilities: | |
Futures | | | (195,557 | ) | | | (31,028 | ) | | | – 0 | – | | | (226,585 | )(b) |
Forward Currency Exchange Contracts | | | – 0 | – | | | (215,083 | ) | | | – 0 | – | | | (215,083 | ) |
Call Options Written | | | – 0 | – | | | (25,489 | ) | | | – 0 | – | | | (25,489 | ) |
Put Options Written | | | – 0 | – | | | (63,912 | ) | | | – 0 | – | | | (63,912 | ) |
Centrally Cleared Credit Default Swaps | | | – 0 | – | | | (63,911 | ) | | | – 0 | – | | | (63,911 | )(b) |
Centrally Cleared Interest Rate Swaps | | | – 0 | – | | | (223,963 | ) | | | – 0 | – | | | (223,963 | )(b) |
Credit Default Swaps | | | – 0 | – | | | (150,374 | ) | | | – 0 | – | | | (150,374 | ) |
Interest Rate Swaps | | | – 0 | – | | | (3,887 | ) | | | – 0 | – | | | (3,887 | ) |
| | | | | | | | | | | | | | | | |
Total | | $ | 28,875,764 | | | $ | 58,771,412 | | | $ | – 0 | – | | $ | 87,647,176 | |
| | | | | | | | | | | | | | | | |
| | |
| |
| abfunds.com | | AB TAX-MANAGED ALL MARKET INCOME PORTFOLIO | 63 |
NOTES TO FINANCIAL STATEMENTS (continued)
| (a) | Other financial instruments are derivative instruments, such as futures, forwards and swaps, which are valued at the unrealized appreciation/(depreciation) on the instrument. Other financial instruments may also include swaps with upfront premiums, options written and swaptions written which are valued at market value. |
| (b) | Only variation margin receivable/(payable) at period end is reported within the statement of assets and liabilities. This amount reflects cumulative unrealized appreciation/(depreciation) on futures and centrally cleared swaps as reported in the portfolio of investments. Where applicable, centrally cleared swaps with upfront premiums are presented here at market value. |
3. Currency Translation
Assets and liabilities denominated in foreign currencies and commitments under forward currency exchange contracts are translated into U.S. dollars at the mean of the quoted bid and ask prices of such currencies against the U.S. dollar. Purchases and sales of portfolio securities are translated into U.S. dollars at the rates of exchange prevailing when such securities were acquired or sold. Income and expenses are translated into U.S. dollars at rates of exchange prevailing when accrued.
Net realized gain or loss on foreign currency transactions represents foreign exchange gains and losses from sales and maturities of foreign fixed income investments, holding of foreign currencies, currency gains or losses realized between the trade and settlement dates on foreign investment transactions, and the difference between the amounts of dividends, interest and foreign withholding taxes recorded on the Fund’s books and the U.S. dollar equivalent amounts actually received or paid. Net unrealized currency gains and losses from valuing foreign currency denominated assets and liabilities at period end exchange rates are reflected as a component of net unrealized appreciation or depreciation of foreign currency denominated assets and liabilities.
4. Taxes
It is the Fund’s policy to meet the requirements of the Internal Revenue Code applicable to regulated investment companies and to distribute all of its investment company taxable income and net realized gains, if any, to shareholders. Therefore, no provisions for federal income or excise taxes are required. The Fund may be subject to taxes imposed by countries in which it invests. Such taxes are generally based on income and/or capital gains earned or repatriated. Taxes are accrued and applied to net investment income, net realized gains and net unrealized appreciation/depreciation as such income and/or gains are earned.
In accordance with U.S. GAAP requirements regarding accounting for uncertainties in income taxes, management has analyzed the Fund’s tax positions taken or expected to be taken on federal and state income tax returns for all open tax years (the current and the prior three tax years) and has concluded that no provision for income tax is required in the Fund’s financial statements.
| | |
| |
64 | AB TAX-MANAGED ALL MARKET INCOME PORTFOLIO | | abfunds.com |
NOTES TO FINANCIAL STATEMENTS (continued)
5. Investment Income and Investment Transactions
Dividend income is recorded on the ex-dividend date or as soon as the Fund is informed of the dividend. Interest income is accrued daily. Investment gains or losses are determined on the identified cost basis. The Fund amortizes premiums and accretes discounts as adjustments to interest income. Investment transactions are accounted for on the date the securities are purchased or sold. The Fund accounts for distributions received from REIT investments or from regulated investment companies as dividend income, realized gain, or return of capital based on information provided by the REIT or the investment company.
6. Class Allocations
All income earned and expenses incurred by the Fund are borne on a pro-rata basis by each outstanding class of shares, based on the proportionate interest in the Fund represented by the net assets of such class, except for class specific expenses which are allocated to the respective class. Expenses of the Company are charged proportionately to each series or based on other appropriate methods. Realized and unrealized gains and losses are allocated among the various share classes based on respective net assets.
7. Dividends and Distributions
Dividends and distributions to shareholders, if any, are recorded on the ex-dividend date. Income dividends and capital gains distributions are determined in accordance with federal tax regulations and may differ from those determined in accordance with U.S. GAAP. To the extent these differences are permanent, such amounts are reclassified within the capital accounts based on their federal tax basis treatment; temporary differences do not require such reclassification.
NOTE B
Advisory Fee and Other Transactions with Affiliates
Under the terms of the investment advisory agreement (the “Advisory Agreement”), the Fund pays the Adviser an advisory fee at an annual rate of .55% of the first $2.5 billion, .45% of the next $2.5 billion and .40% in excess of $5 billion of the Fund’s average daily net assets. The fee is accrued daily and paid monthly. The Adviser has contractually agreed to waive advisory fees and/or to bear certain expenses to the extent necessary to limit total operating expenses (excluding acquired fund fees and expenses, interest expense, taxes, extraordinary expenses, and brokerage commissions and other transactions costs), on an annual basis (the “Expense Caps”) to ..99%, 1.74% and .74% of the daily average net assets for the Class A, Class C and Advisor Class shares, respectively. For the six months ended February 28, 2021, such reimbursement amounted to $168,358. The Expense Caps will remain in effect through December 31, 2021.
| | |
| |
| abfunds.com | | AB TAX-MANAGED ALL MARKET INCOME PORTFOLIO | 65 |
NOTES TO FINANCIAL STATEMENTS (continued)
The Fund compensates AllianceBernstein Investor Services, Inc. (“ABIS”), a wholly-owned subsidiary of the Adviser, under a Transfer Agency Agreement for providing personnel and facilities to perform transfer agency services for the Fund. ABIS may make payments to intermediaries that provide omnibus account services, sub-accounting services and/or networking services. Such compensation retained by ABIS amounted to $17,224 for the six months ended February 28, 2021.
AllianceBernstein Investments, Inc. (the “Distributor”), a wholly-owned subsidiary of the Adviser, serves as the distributor of the Fund’s shares. The Distributor has advised the Fund that it has retained front-end sales charges of $169 from the sale of Class A shares and received $21 and $500 in contingent deferred sales charges imposed upon redemptions by shareholders of Class A and Class C shares, respectively, for the six months ended February 28, 2021.
The Fund may invest in AB Government Money Market Portfolio (the “Government Money Market Portfolio”) which has a contractual annual advisory fee rate of .20% of the portfolio’s average daily net assets and bears its own expenses. The Adviser has contractually agreed to waive .10% of the advisory fee of Government Money Market Portfolio (resulting in a net advisory fee of ..10%) until August 31, 2021. In connection with the investment by the Fund in Government Money Market Portfolio, the Adviser has contractually agreed to waive its advisory fee from the Fund in an amount equal to the Fund’s pro rata share of the effective advisory fee of Government Money Market Portfolio, as borne indirectly by the Fund as an acquired fund fee and expense. For the six months ended February 28, 2021, such waiver amounted to $3,258.
A summary of the Fund’s transactions in AB mutual funds for the six months ended February 28, 2021 is as follows:
| | | | | | | | | | | | | | | | | | | | |
Fund | | Market Value
8/31/20
(000) | | | Purchases
at Cost
(000) | | | Sales
Proceeds
(000) | | | Market Value
2/28/21
(000) | | | Dividend
Income
(000) | |
Government Money Market Portfolio | | $ | – 0 | – | | $ | 53,296 | | | $ | 46,020 | | | $ | 7,276 | | | $ | 1 | |
During the second quarter of 2018, AXA S.A. (“AXA”), a French holding company for the AXA Group, completed the sale of a minority stake in its subsidiary, AXA Equitable Holdings, Inc. (now named Equitable Holdings, Inc.)(“Equitable”), through an initial public offering. Equitable is the holding company for a diverse group of financial services companies, including an approximate 65% economic interest in the Adviser and a 100% interest in AllianceBernstein Corporation, the general partner of the Adviser. Since the
| | |
| |
66 | AB TAX-MANAGED ALL MARKET INCOME PORTFOLIO | | abfunds.com |
NOTES TO FINANCIAL STATEMENTS (continued)
initial sale, AXA has completed additional offerings, most recently during the fourth quarter of 2019. As a result, AXA currently owns less than 10% of the outstanding shares of common stock of Equitable, and no longer owns a controlling interest in Equitable. AXA previously announced its intention to sell its entire interest in Equitable over time, subject to market conditions and other factors (the “Plan”). Most of AXA’s remaining Equitable shares are to be delivered on redemption of AXA bonds mandatorily exchangeable into Equitable shares and maturing in May 2021. AXA retains sole discretion to determine the timing of any future sales of its remaining shares of Equitable common stock.
Sales under the Plan that were completed on November 13, 2019 resulted in the indirect transfer of a “controlling block” of voting securities of the Adviser (a “Change of Control Event”) and may have been deemed to have been an “assignment” causing a termination of the Fund’s investment advisory and administration agreements. In order to ensure that investment advisory and administration services could continue uninterrupted in the event of a Change of Control Event, the Board previously approved new investment advisory and administration agreements with the Adviser, and shareholders of the Fund subsequently approved the new investment advisory agreement. These agreements became effective on November 13, 2019.
NOTE C
Distribution Plan
The Fund has adopted a Plan for each class of shares of the Fund pursuant to Rule 12b-1 under the Investment Company Act of 1940 (the “Plan”). Under the Plan, the Fund pays distribution and servicing fees to the Distributor at an annual rate of up to .50% of the Fund’s average daily net assets attributable to Class A shares and 1% of the Fund’s average daily net assets attributable to Class C shares. There are no distribution and servicing fees on the Advisor Class shares. The fees are accrued daily and paid monthly. Payments under the Plan in respect of Class A shares are currently limited to an annual rate of .25% of Class A shares’ average daily net assets. The Plan provides that the Distributor will use such payments in their entirety for distribution assistance and promotional activities. The Fund is not obligated under the Plan to pay any distribution services fee in excess of the amounts set forth above. The purpose of the payments to the Distributor under the Plan is to compensate the Distributor for its distribution services with respect to the sale of the Fund’s shares. Since the Distributor’s compensation is not directly tied to its expenses, the amount of compensation received by it under the Plan during any year may be more or less than its actual expenses. For this reason, the Plan is characterized by the staff of the Securities Exchange Commission as being a “compensation” plan.
| | |
| |
| abfunds.com | | AB TAX-MANAGED ALL MARKET INCOME PORTFOLIO | 67 |
NOTES TO FINANCIAL STATEMENTS (continued)
In the event that the Plan is terminated or not continued, no distribution services fees (other than current amounts accrued but not yet paid) would be owed by the Fund to the Distributor with respect to the relevant class. The Plan also provides that the Adviser may use its own resources to finance the distribution of the Fund’s shares.
NOTE D
Investment Transactions
Purchases and sales of investment securities (excluding short-term investments) for the six months ended February 28, 2021 were as follows:
| | | | | | | | |
| | | Purchases | | | Sales | |
Investment securities (excluding U.S. government securities) | | $ | 9,768,142 | | | $ | 10,728,909 | |
U.S. government securities | | | 758,813 | | | | 749,719 | |
The cost of investments for federal income tax purposes was substantially the same as the cost for financial reporting purposes. Accordingly, gross unrealized appreciation and unrealized depreciation are as follows:
| | | | |
Gross unrealized appreciation | | $ | 8,170,879 | |
Gross unrealized depreciation | | | (1,865,585 | ) |
| | | | |
Net unrealized appreciation | | $ | 6,305,294 | |
| | | | |
1. Derivative Financial Instruments
The Fund may use derivatives in an effort to earn income and enhance returns, to replace more traditional direct investments, to obtain exposure to otherwise inaccessible markets (collectively, “investment purposes”), or to hedge or adjust the risk profile of its portfolio.
The principal types of derivatives utilized by the Fund, as well as the methods in which they may be used are:
The Fund may buy or sell futures for investment purposes or for the purpose of hedging its portfolio against adverse effects of potential movements in the market. The Fund bears the market risk that arises from changes in the value of these instruments and the imperfect correlation between movements in the price of the futures and movements in the price of the assets, reference rates or indices which they are designed to track. Among other things, the Fund may purchase or sell futures for foreign currencies or options thereon for non-hedging purposes as a means of making direct investment in foreign currencies, as described below under “Currency Transactions”.
At the time the Fund enters into futures, the Fund deposits and maintains as collateral an initial margin with the broker, as required by
| | |
| |
68 | AB TAX-MANAGED ALL MARKET INCOME PORTFOLIO | | abfunds.com |
NOTES TO FINANCIAL STATEMENTS (continued)
the exchange on which the transaction is effected. Such amount is shown as cash collateral due from broker on the statement of assets and liabilities. Pursuant to the contract, the Fund agrees to receive from or pay to the broker an amount of cash equal to the daily fluctuation in the value of the contract. Such receipts or payments are known as variation margin and are recorded by the Fund as unrealized gains or losses. Risks may arise from the potential inability of a counterparty to meet the terms of the contract. The credit/counterparty risk for exchange-traded futures is generally less than privately negotiated futures, since the clearinghouse, which is the issuer or counterparty to each exchange-traded future, has robust risk mitigation standards, including the requirement to provide initial and variation margin. When the contract is closed, the Fund records a realized gain or loss equal to the difference between the value of the contract at the time it was opened and the time it was closed.
Use of long futures subjects the Fund to risk of loss in excess of the amounts shown on the statement of assets and liabilities, up to the notional value of the futures. Use of short futures subjects the Fund to unlimited risk of loss. Under some circumstances, futures exchanges may establish daily limits on the amount that the price of futures can vary from the previous day’s settlement price, which could effectively prevent liquidation of unfavorable positions.
During the six months ended February 28, 2021, the Fund held futures for hedging and non-hedging purposes.
| | • | | Forward Currency Exchange Contracts |
The Fund may enter into forward currency exchange contracts in order to hedge its exposure to changes in foreign currency exchange rates on its foreign portfolio holdings, to hedge certain firm purchase and sale commitments denominated in foreign currencies and for non-hedging purposes as a means of making direct investments in foreign currencies, as described below under “Currency Transactions”.
A forward currency exchange contract is a commitment to purchase or sell a foreign currency at a future date at a negotiated forward rate. The gain or loss arising from the difference between the original contract and the closing of such contract would be included in net realized gain or loss on forward currency exchange contracts. Fluctuations in the value of open forward currency exchange contracts are recorded for financial reporting purposes as unrealized appreciation and/or depreciation by the Fund. Risks may arise from the potential inability of a counterparty to meet the terms of a contract and from unanticipated movements in the value of a foreign currency relative to the U.S. dollar.
| | |
| |
| abfunds.com | | AB TAX-MANAGED ALL MARKET INCOME PORTFOLIO | 69 |
NOTES TO FINANCIAL STATEMENTS (continued)
During the six months ended February 28, 2021, the Fund held forward currency exchange contracts for hedging and non-hedging purposes.
For hedging and investment purposes, the Fund may purchase and write (sell) put and call options on U.S. and foreign securities, including government securities, and foreign currencies that are traded on U.S. and foreign securities exchanges and over-the-counter markets. Among other things, the Fund may use options transactions for non-hedging purposes as a means of making direct investments in foreign currencies, as described below under “Currency Transactions” and may use options strategies involving the purchase and/or writing of various combinations of call and/or put options, for hedging and investment purposes.
The risk associated with purchasing an option is that the Fund pays a premium whether or not the option is exercised. Additionally, the Fund bears the risk of loss of the premium and change in market value should the counterparty not perform under the contract. If a put or call option purchased by the Fund were permitted to expire without being sold or exercised, its premium would represent a loss to the Fund. Put and call options purchased are accounted for in the same manner as portfolio securities. The cost of securities acquired through the exercise of call options is increased by premiums paid. The proceeds from securities sold through the exercise of put options are decreased by the premiums paid.
When the Fund writes an option, the premium received by the Fund is recorded as a liability and is subsequently adjusted to the current market value of the option written. The Fund’s maximum payment for written put options equates to the number of shares multiplied by the strike price. In certain circumstances maximum payout amounts may be partially offset by recovery values of the respective referenced assets and upfront premium received upon entering into the contract. Premiums received from written options which expire unexercised are recorded by the Fund on the expiration date as realized gains from options written. The difference between the premium received and the amount paid on effecting a closing purchase transaction, including brokerage commissions, is also treated as a realized gain, or if the premium received is less than the amount paid for the closing purchase transaction, as a realized loss. If a call option is exercised, the premium received is added to the proceeds from the sale of the underlying security or currency in determining whether the Fund has realized a gain or loss. If a put option is exercised, the premium received reduces the cost basis of the security or currency purchased
| | |
| |
70 | AB TAX-MANAGED ALL MARKET INCOME PORTFOLIO | | abfunds.com |
NOTES TO FINANCIAL STATEMENTS (continued)
by the Fund. In writing an option, the Fund bears the market risk of an unfavorable change in the price of the security or currency underlying the written option. Exercise of an option written by the Fund could result in the Fund selling or buying a security or currency at a price different from the current market value.
During the six months ended February 28, 2021, the Fund held written options for hedging and non-hedging purposes.
The Fund may enter into swaps to hedge its exposure to interest rates. The Fund may also enter into swaps for non-hedging purposes as a means of gaining market exposures, making direct investments in foreign currencies, as described below under “Currency Transactions” or in order to take a “long” or “short” position with respect to an underlying referenced asset described below under “Total Return Swaps”. A swap is an agreement that obligates two parties to exchange a series of cash flows at specified intervals based upon or calculated by reference to changes in specified prices or rates for a specified amount of an underlying asset. The payment flows are usually netted against each other, with the difference being paid by one party to the other. In addition, collateral may be pledged or received by the Fund in accordance with the terms of the respective swaps to provide value and recourse to the Fund or its counterparties in the event of default, bankruptcy or insolvency by one of the parties to the swap.
Risks may arise as a result of the failure of the counterparty to the swap to comply with the terms of the swap. The loss incurred by the failure of a counterparty is generally limited to the net interim payment to be received by the Fund, and/or the termination value at the end of the contract. Therefore, the Fund considers the creditworthiness of each counterparty to a swap in evaluating potential counterparty risk. This risk is mitigated by having a netting arrangement between the Fund and the counterparty and by the posting of collateral by the counterparty to the Fund to cover the Fund’s exposure to the counterparty. Additionally, risks may arise from unanticipated movements in interest rates or in the value of the underlying securities. The Fund accrues for the interim payments on swaps on a daily basis, with the net amount recorded within unrealized appreciation/depreciation of swaps on the statement of assets and liabilities, where applicable. Once the interim payments are settled in cash, the net amount is recorded as realized gain/(loss) on swaps on the statement of operations, in addition to any realized gain/(loss) recorded upon the termination of swaps. Upfront premiums paid or received for over the counter (“OTC”) swaps are recognized as cost or proceeds on the
| | |
| |
| abfunds.com | | AB TAX-MANAGED ALL MARKET INCOME PORTFOLIO | 71 |
NOTES TO FINANCIAL STATEMENTS (continued)
statement of assets and liabilities and are amortized on a straight line basis over the life of the contract. Amortized upfront premiums are included in net realized gain/(loss) from swaps on the statement of operations. Fluctuations in the value of swaps are recorded as a component of net change in unrealized appreciation/depreciation of swaps on the statement of operations.
Certain standardized swaps, including certain interest rate swaps and credit default swaps, are (or soon will be) subject to mandatory central clearing. Cleared swaps are transacted through futures commission merchants (“FCMs”) that are members of central clearinghouses, with the clearinghouse serving as central counterparty, similar to transactions in futures contracts. Centralized clearing will be required for additional categories of swaps on a phased-in basis based on requirements published by the Securities and Exchange Commission and Commodity Futures Trading Commission.
At the time the Fund enters into a centrally cleared swap, the Fund deposits and maintains as collateral an initial margin with the broker, as required by the clearinghouse on which the transaction is effected. Such amount is shown as cash collateral due from broker on the statement of assets and liabilities. Pursuant to the contract, the Fund agrees to receive from or pay to the broker an amount of cash equal to the daily fluctuation in the value of the contract. Such receipts or payments are known as variation margin and are recorded by the Fund as unrealized gains or losses. Risks may arise from the potential inability of a counterparty to meet the terms of the contract. The credit/counterparty risk for centrally cleared swaps is generally less than non-centrally cleared swaps, since the clearinghouse, which is the issuer or counterparty to each centrally cleared swap, has robust risk mitigation standards, including the requirement to provide initial and variation margin. When the contract is closed, the Fund records a realized gain or loss equal to the difference between the value of the contract at the time it was opened and the time it was closed.
Interest Rate Swaps:
The Fund is subject to interest rate risk exposure in the normal course of pursuing its investment objectives. Because the Fund holds fixed rate bonds, the value of these bonds may decrease if interest rates rise. To help hedge against this risk and to maintain its ability to generate income at prevailing market rates, the Fund may enter into interest rate swaps. Interest rate swaps are agreements between two parties to exchange cash flows based on a notional amount. The Fund may elect to pay a fixed rate and receive a floating rate, or, receive a fixed rate and pay a floating rate on a notional amount.
| | |
| |
72 | AB TAX-MANAGED ALL MARKET INCOME PORTFOLIO | | abfunds.com |
NOTES TO FINANCIAL STATEMENTS (continued)
In addition, the Fund may also enter into interest rate swap transactions to preserve a return or spread on a particular investment or portion of its portfolio, or protecting against an increase in the price of securities the Fund anticipates purchasing at a later date. Interest rate swaps involve the exchange by a Fund with another party of their respective commitments to pay or receive interest (e.g., an exchange of floating rate payments for fixed rate payments) computed based on a contractually-based principal (or “notional”) amount. Interest rate swaps are entered into on a net basis (i.e., the two payment streams are netted out, with the Fund receiving or paying, as the case may be, only the net amount of the two payments).
During the six months ended February 28, 2021, the Fund held interest rate swaps for hedging and non-hedging purposes.
Inflation (CPI) Swaps:
Inflation swap agreements are contracts in which one party agrees to pay the cumulative percentage increase in a price index (the Consumer Price Index with respect to CPI swaps) over the term of the swap (with some lag on the inflation index), and the other pays a compounded fixed rate. Inflation swaps may be used to protect the net asset value, or NAV, of a Fund against an unexpected change in the rate of inflation measured by an inflation index since the value of these agreements is expected to increase if there are unexpected inflation increases.
During the six months ended February 28, 2021, the Fund held inflation (CPI) swaps for hedging and non-hedging purposes.
Credit Default Swaps:
The Fund may enter into credit default swaps, including to manage its exposure to the market or certain sectors of the market, to reduce its risk exposure to defaults by corporate and sovereign issuers held by the Fund, or to create exposure to corporate or sovereign issuers to which it is not otherwise exposed. The Fund may purchase credit protection (“Buy Contract”) or provide credit protection (“Sale Contract”) on the referenced obligation of the credit default swap. During the term of the swap, the Fund receives/(pays) fixed payments from/(to) the respective counterparty, calculated at the agreed upon rate applied to the notional amount. If the Fund is a buyer/(seller) of protection and a credit event occurs, as defined under the terms of the swap, the Fund will either (i) receive from the seller/(pay to the buyer) of protection an amount equal to the notional amount of the swap (the “Maximum Payout Amount”) and deliver/(take delivery of) the referenced obligation or (ii) receive/(pay) a net settlement amount in the form of cash or securities equal to the notional amount of the swap less the recovery value of the referenced obligation. In certain
| | |
| |
| abfunds.com | | AB TAX-MANAGED ALL MARKET INCOME PORTFOLIO | 73 |
NOTES TO FINANCIAL STATEMENTS (continued)
circumstances Maximum Payout Amounts may be partially offset by recovery values of the respective referenced obligations, upfront premium received upon entering into the agreement, or net amounts received from settlement of buy protection credit default swaps entered into by the Fund for the same referenced obligations with the same counterparty.
Credit default swaps may involve greater risks than if a Fund had invested in the referenced obligation directly. Credit default swaps are subject to general market risk, liquidity risk, counterparty risk and credit risk. If the Fund is a buyer of protection and no credit event occurs, it will lose the payments it made to its counterparty. If the Fund is a seller of protection and a credit event occurs, the value of the referenced obligation received by the Fund coupled with the periodic payments previously received, may be less than the Maximum Payout Amount it pays to the buyer, resulting in a net loss to the Fund.
Implied credit spreads over U.S. Treasuries of comparable maturity utilized in determining the market value of credit default swaps on issuers as of period end are disclosed in the portfolio of investments. The implied spreads serve as an indicator of the current status of the payment/performance risk and typically reflect the likelihood of default by the issuer of the referenced obligation. The implied credit spread of a particular reference obligation also reflects the cost of buying/selling protection and may reflect upfront payments required to be made to enter into the agreement. Widening credit spreads typically represent a deterioration of the referenced obligation’s credit soundness and greater likelihood of default or other credit event occurring as defined under the terms of the agreement. A credit spread identified as “Defaulted” indicates a credit event has occurred for the referenced obligation.
During the six months ended February 28, 2021, the Fund held credit default swaps for hedging and non-hedging purposes.
Total Return Swaps:
The Fund may enter into total return swaps in order to take a “long” or “short” position with respect to an underlying referenced asset. The Fund is subject to market price volatility of the underlying referenced asset. A total return swap involves commitments to pay interest in exchange for a market linked return based on a notional amount. To the extent that the total return of the security, group of securities or index underlying the transaction exceeds or falls short of the offsetting interest obligation, the Fund will receive a payment from or make a payment to the counterparty.
| | |
| |
74 | AB TAX-MANAGED ALL MARKET INCOME PORTFOLIO | | abfunds.com |
NOTES TO FINANCIAL STATEMENTS (continued)
During the six months ended February 28, 2021, the Fund held total return swaps for hedging and non-hedging purposes.
The Fund typically enters into International Swaps and Derivatives Association, Inc. Master Agreements (“ISDA Master Agreement”) with its OTC derivative contract counterparties in order to, among other things, reduce its credit risk to OTC counterparties. ISDA Master Agreements include provisions for general obligations, representations, collateral and events of default or termination. Under an ISDA Master Agreement, the Fund typically may offset with the OTC counterparty certain derivative financial instruments’ payables and/or receivables with collateral held and/or posted and create one single net payment (close-out netting) in the event of default or termination. In the event of a default by an OTC counterparty, the return of collateral with market value in excess of the Fund’s net liability, held by the defaulting party, may be delayed or denied.
The Fund’s ISDA Master Agreements may contain provisions for early termination of OTC derivative transactions in the event the net assets of the Fund decline below specific levels (“net asset contingent features”). If these levels are triggered, the Fund’s OTC counterparty has the right to terminate such transaction and require the Fund to pay or receive a settlement amount in connection with the terminated transaction. If OTC derivatives were held at period end, please refer to netting arrangements by the OTC counterparty table below for additional details.
During the six months ended February 28, 2021, the Fund had entered into the following derivatives:
| | | | | | | | | | | | |
| | | Asset Derivatives | | | Liability Derivatives | |
Derivative Type | | Statement of
Assets and
Liabilities
Location | | Fair Value | | | Statement of
Assets and
Liabilities
Location | | Fair Value | |
Interest rate contracts | | Receivable/Payable for variation margin on futures | | $ | 64,982 | * | | Receivable/Payable for variation margin on futures | | $ | 195,557 | * |
| | | | |
Equity contracts | | Receivable/Payable for variation margin on futures | | | 404,858 | * | | Receivable/Payable for variation margin on futures | | | 31,028 | * |
| | | | |
Credit contracts | | | | | | | | Receivable/Payable for variation margin on centrally cleared swaps | | | 38,016 | * |
| | |
| |
| abfunds.com | | AB TAX-MANAGED ALL MARKET INCOME PORTFOLIO | 75 |
NOTES TO FINANCIAL STATEMENTS (continued)
| | | | | | | | | | | | |
| | | Asset Derivatives | | | Liability Derivatives | |
Derivative Type | | Statement of
Assets and
Liabilities
Location | | Fair Value | | | Statement of
Assets and
Liabilities
Location | | Fair Value | |
| | | | |
Interest rate contracts | | Receivable/Payable for variation margin on centrally cleared swaps | | $ | 443,967 | * | | Receivable/Payable for variation margin on centrally cleared swaps | | $ | 224,660 | * |
| | | | |
Foreign currency contracts | | Unrealized appreciation on forward currency exchange contracts | | | 254,112 | | | Unrealized depreciation on forward currency exchange contracts | | | 215,083 | |
| | | | |
Equity contracts | | | | | | | | Options written, at value | | | 89,401 | |
| | | | |
Interest rate contracts | | | | | | | | Unrealized depreciation on interest rate swaps | | | 3,887 | |
| | | | |
Credit contracts | | | | | | | | Market value on credit default swaps | | | 150,374 | |
| | | | | | | | | | | | |
Total | | | | $ | 1,167,919 | | | | | $ | 948,006 | |
| | | | | | | | | | | | |
| * | Only variation margin receivable/payable at period end is reported within the statement of assets and liabilities. This amount reflects cumulative unrealized appreciation/(depreciation) on futures and centrally cleared swaps as reported in the portfolio of investments. |
| | | | | | | | | | |
Derivative Type | | Location of Gain or
(Loss) on Derivatives
Within Statement of
Operations | | Realized Gain
or (Loss) on
Derivatives | | | Change in
Unrealized
Appreciation or
(Depreciation) | |
Interest rate contracts | | Net realized gain (loss) on futures; Net change in unrealized appreciation/depreciation of futures | | $ | (212,278 | ) | | $ | (125,102 | ) |
| | | |
Equity contracts | | Net realized gain (loss) on futures; Net change in unrealized appreciation/depreciation of futures | | | 3,148,748 | | | | (1,406,284 | ) |
| | | |
Foreign currency contracts | | Net realized gain (loss) on forward currency exchange contracts; Net change in unrealized appreciation/depreciation of forward currency exchange contracts | | | 65,351 | | | | 8,485 | |
| | |
| |
76 | AB TAX-MANAGED ALL MARKET INCOME PORTFOLIO | | abfunds.com |
NOTES TO FINANCIAL STATEMENTS (continued)
| | | | | | | | | | |
Derivative Type | | Location of Gain or
(Loss) on Derivatives
Within Statement of
Operations | | Realized Gain
or (Loss) on
Derivatives | | | Change in
Unrealized
Appreciation or
(Depreciation) | |
| | | |
Foreign exchange contracts | | Net realized gain (loss) on options written; Net change in unrealized appreciation/depreciation of options written | | $ | (35,415 | ) | | $ | – 0 | – |
| | | |
Equity contracts | | Net realized gain (loss) on options written; Net change in unrealized appreciation/depreciation of options written | | | 5,484 | | | | 536 | |
| | | |
Interest rate contracts | | Net realized gain (loss) on swaps; Net change in unrealized appreciation/depreciation of swaps | | | 18,288 | | | | (191,131 | ) |
| | | |
Credit contracts | | Net realized gain (loss) on swaps; Net change in unrealized appreciation/depreciation of swaps | | | 269,196 | | | | (211,151 | ) |
| | | |
Equity contracts | | Net realized gain (loss) on swaps; Net change in unrealized appreciation/depreciation of swaps | | | (711,996 | ) | | | (3,139 | ) |
| | | | | | | | | | |
Total | | | | $ | 2,547,378 | | | $ | (1,927,786 | ) |
| | | | | | | | | | |
The following table represents the average monthly volume of the Fund’s derivative transactions during the six months ended February 28, 2021:
| | | | |
Futures: | | | | |
Average notional amount of buy contracts | | $ | 29,704,636 | |
Average notional amount of sale contracts | | $ | 5,529,325 | |
Forward Currency Exchange Contracts: | | | | |
Average principal amount of buy contracts | | $ | 12,032,802 | |
Average principal amount of sale contracts | | $ | 12,564,374 | |
Options Written: | | | | |
Average notional amount | | $ | 9,785,947 | |
Interest Rate Swaps: | | | | |
Average notional amount | | $ | 390,000 | |
Inflation Swaps: | | | | |
Average notional amount | | $ | 5,707,500 | (a) |
Centrally Cleared Interest Rate Swaps: | | | | |
Average notional amount | | $ | 11,813,278 | |
| | |
| |
| abfunds.com | | AB TAX-MANAGED ALL MARKET INCOME PORTFOLIO | 77 |
NOTES TO FINANCIAL STATEMENTS (continued)
| | | | |
Centrally Cleared Inflation Swaps: | | | | |
Average notional amount | | $ | 4,297,429 | |
Credit Default Swaps: | | | | |
Average notional amount of sale contracts | | $ | 609,000 | |
Centrally Cleared Credit Default Swaps: | | | | |
Average notional amount of buy contracts | | $ | 720,000 | |
Average notional amount of sale contracts | | $ | 2,356,724 | (b) |
Total Return Swaps: | | | | |
Average notional amount | | $ | 16,418,394 | |
| (a) | Positions were open for one month during the period. |
| (b) | Positions were open for five months during the period. |
For financial reporting purposes, the Fund does not offset derivative assets and derivative liabilities that are subject to netting arrangements in the statement of assets and liabilities.
All OTC derivatives held at period end were subject to netting arrangements. The following table presents the Fund’s derivative assets and liabilities by OTC counterparty net of amounts available for offset under ISDA Master Agreements (“MA”) and net of the related collateral received/pledged by the Fund as of February 28, 2021. Exchange-traded derivatives and centrally cleared swaps are not subject to netting arrangements and as such are excluded from the table.
| | | | | | | | | | | | | | | | | | | | |
Counterparty | | Derivative
Assets
Subject
to a MA | | | Derivatives
Available
for Offset | | | Cash
Collateral
Received* | | | Security
Collateral
Received* | | | Net
Amount of
Derivative
Assets | |
Barclays Bank PLC | | $ | 77,392 | | | $ | (53,030 | ) | | $ | – 0 | – | | $ | – 0 | – | | $ | 24,362 | |
BNP Paribas SA | | | 6,979 | | | | (5,034 | ) | | | – 0 | – | | | – 0 | – | | | 1,945 | |
Citibank, NA/Citigroup Global Markets, Inc. | | | 1,968 | | | | (1,968 | ) | | | – 0 | – | | | – 0 | – | | | – 0 | – |
Credit Suisse International | | | 48 | | | | (48 | ) | | | – 0 | – | | | – 0 | – | | | – 0 | – |
Deutsche Bank AG | | | 20,094 | | | | (10,859 | ) | | | – 0 | – | | | – 0 | – | | | 9,235 | |
Goldman Sachs Bank USA/Goldman Sachs International | | | 12,228 | | | | (12,228 | ) | | | – 0 | – | | | – 0 | – | | | – 0 | – |
Standard Chartered Bank | | | 14,887 | | | | (9,059 | ) | | | – 0 | – | | | – 0 | – | | | 5,828 | |
State Street Bank & Trust Co. | | | 67,947 | | | | (47,813 | ) | | | – 0 | – | | | – 0 | – | | | 20,134 | |
UBS AG | | | 52,569 | | | | (52,569 | ) | | | – 0 | – | | | – 0 | – | | | – 0 | – |
| | | | | | | | | | | | | | | | | | | | |
Total | | $ | 254,112 | | | $ | (192,608 | ) | | $ | – 0 | – | | $ | – 0 | – | | $ | 61,504 | ^ |
| | | | | | | | | | | | | | | | | | | | |
| | |
| |
78 | AB TAX-MANAGED ALL MARKET INCOME PORTFOLIO | | abfunds.com |
NOTES TO FINANCIAL STATEMENTS (continued)
| | | | | | | | | | | | | | | | | | | | |
Counterparty | | Derivative
Liabilities
Subject
to a MA | | | Derivatives
Available
for Offset | | | Cash
Collateral
Pledged* | | | Security
Collateral
Pledged* | | | Net
Amount of
Derivative
Liabilities | |
Barclays Bank PLC | | $ | 53,030 | | | $ | (53,030 | ) | | $ | – 0 | – | | $ | – 0 | – | | $ | – 0 | – |
BNP Paribas SA | | | 5,034 | | | | (5,034 | ) | | | – 0 | – | | | – 0 | – | | | – 0 | – |
Citibank, NA/Citigroup Global Markets, Inc. | | | 30,945 | | | | (1,968 | ) | | | – 0 | – | | | – 0 | – | | | 28,977 | |
Credit Suisse International | | | 71,520 | | | | (48 | ) | | | – 0 | – | | | – 0 | – | | | 71,472 | |
Deutsche Bank AG | | | 10,859 | | | | (10,859 | ) | | | – 0 | – | | | – 0 | – | | | – 0 | – |
Goldman Sachs Bank USA/Goldman Sachs International | | | 92,254 | | | | (12,228 | ) | | | (80,026 | ) | | | – 0 | – | | | – 0 | – |
Morgan Stanley Capital Services, Inc. | | | 1,856 | | | | – 0 | – | | | – 0 | – | | | – 0 | – | | | 1,856 | |
Natwest Markets PLC | | | 2,789 | | | | – 0 | – | | | – 0 | – | | | – 0 | – | | | 2,789 | |
Standard Chartered Bank | | | 9,059 | | | | (9,059 | ) | | | – 0 | – | | | – 0 | – | | | – 0 | – |
State Street Bank & Trust Co. | | | 47,813 | | | | (47,813 | ) | | | – 0 | – | | | – 0 | – | | | – 0 | – |
UBS AG | | | 133,586 | | | | (52,569 | ) | | | – 0 | – | | | – 0 | – | | | 81,017 | |
| | | | | | | | | | | | | | | | | | | | |
Total | | $ | 458,745 | | | $ | (192,608 | ) | | $ | (80,026 | ) | | $ | – 0 | – | | $ | 186,111 | ^ |
| | | | | | | | | | | | | | | | | | | | |
| * | The actual collateral received/pledged may be more than the amount reported due to over-collateralization. |
| ^ | Net amount represents the net receivable/payable that would be due from/to the counterparty in the event of default or termination. The net amount from OTC financial derivative instruments can only be netted across transactions governed under the same master agreement with the same counterparty. |
2. Currency Transactions
The Fund may invest in non-U.S. Dollar-denominated securities on a currency hedged or unhedged basis. The Fund may seek investment opportunities by taking long or short positions in currencies through the use of currency-related derivatives, including forward currency exchange contracts, futures and options on futures, swaps, and other options. The Fund may enter into transactions for investment opportunities when it anticipates that a foreign currency will appreciate or depreciate in value but securities denominated in that currency are not held by the Fund and do not present attractive investment opportunities. Such transactions may also be used when the Adviser believes that it may be more efficient than a direct investment in a foreign currency-denominated security. The Fund may also conduct currency exchange contracts on a spot basis (i.e., for cash at the spot rate prevailing in the currency exchange market for buying or selling currencies).
| | |
| |
| abfunds.com | | AB TAX-MANAGED ALL MARKET INCOME PORTFOLIO | 79 |
NOTES TO FINANCIAL STATEMENTS (continued)
NOTE E
Shares of Beneficial Interest
Transactions in shares of beneficial interest for each class were as follows:
| | | | | | | | | | | | | | | | | | | | | | | | |
| | | | | | | | | | | | | | | | | | | | | | | | |
| | | Shares | | | | | | Amount | | | | |
| | | Six Months Ended
February 28, 2021
(unaudited) | | | Year Ended
August 31,
2020 | | | | | | Six Months Ended
February 28, 2021
(unaudited) | | | Year Ended
August 31,
2020 | | | | |
| | | | | | | | |
| Class A | | | | | |
Shares sold | | | 12,294 | | | | 215,245 | | | | | | | $ | 148,545 | | | $ | 2,743,264 | | | | | |
| | | | | |
Shares issued in reinvestment of dividends and distributions | | | 68,338 | | | | 212,644 | | | | | | | | 830,462 | | | | 2,623,471 | | | | | |
| | | | | |
Shares converted from Class B | | | – 0 | – | | | 42,297 | | | | | | | | – 0 | – | | | 546,700 | | | | | |
| | | | | |
Shares converted from Class C | | | 36,417 | | | | 78,955 | | | | | | | | 432,909 | | | | 946,823 | | | | | |
| | | | | |
Shares redeemed | | | (306,430 | ) | | | (1,024,381 | ) | | | | | | | (3,688,302 | ) | | | (11,875,720 | ) | | | | |
| | | | | |
Net decrease | | | (189,381 | ) | | | (475,240 | ) | | | | | | $ | (2,276,386 | ) | | $ | (5,015,462 | ) | | | | |
| | | | | |
| | | | | | | | | | | | | | | | | | | | | | | | |
Class B | | | | | |
Shares sold | | | – 0 | – | | | 225 | | | | | | | $ | – 0 | – | | $ | 2,968 | | | | | |
| | | | | |
Shares issued in reinvestment of dividends and distributions | | | – 0 | – | | | 133 | | | | | | | | – 0 | – | | | 1,757 | | | | | |
| | | | | |
Shares converted to Class A | | | – 0 | – | | | (41,244 | ) | | | | | | | – 0 | – | | | (546,700 | ) | | | | |
| | | | | |
Shares redeemed | | | – 0 | – | | | (314 | ) | | | | | | | – 0 | – | | | (4,141 | ) | | | | |
| | | | | |
Net decrease | | | – 0 | – | | | (41,200 | ) | | | | | | $ | – 0 | – | | $ | (546,116 | ) | | | | |
| | | | | |
| | | | | | | | | | | | | | | | | | | | | | | | |
Class C | | | | | |
Shares sold | | | 3,868 | | | | 55,349 | | | | | | | $ | 47,305 | | | $ | 617,544 | | | | | |
| | | | | |
Shares issued in reinvestment of dividends and distributions | | | 3,497 | | | | 14,105 | | | | | | | | 43,340 | | | | 178,494 | | | | | |
| | | | | |
Shares converted to Class A | | | (35,688 | ) | | | (77,461 | ) | | | | | | | (432,909 | ) | | | (946,823 | ) | | | | |
| | | | | |
Shares redeemed | | | (42,845 | ) | | | (75,986 | ) | | | | | | | (526,327 | ) | | | (879,064 | ) | | | | |
| | | | | |
Net decrease | | | (71,168 | ) | | | (83,993 | ) | | | | | | $ | (868,591 | ) | | $ | (1,029,849 | ) | | | | |
| | | | | |
| | | | | | | | | | | | | | | | | | | | | | | | |
Advisor Class | | | | | |
Shares sold | | | 220,222 | | | | 1,001,535 | | | | | | | $ | 2,656,573 | | | $ | 11,746,117 | | | | | |
| | | | | |
Shares issued in reinvestment of dividends and distributions | | | 36,071 | | | | 101,699 | | | | | | | | 438,704 | | | | 1,253,140 | | | | | |
| | | | | |
Shares redeemed | | | (394,801 | ) | | | (1,059,496 | ) | | | | | | | (4,749,759 | ) | | | (12,322,734 | ) | | | | |
| | | | | |
Net increase (decrease) | | | (138,508 | ) | | | 43,738 | | | | | | | $ | (1,654,482 | ) | | $ | 676,523 | | | | | |
| | | | | |
| | |
| |
80 | AB TAX-MANAGED ALL MARKET INCOME PORTFOLIO | | abfunds.com |
NOTES TO FINANCIAL STATEMENTS (continued)
NOTE F
Risks Involved in Investing in the Fund
Market Risk—The value of the Fund’s assets will fluctuate as the stock or bond market fluctuates. The value of its investments may decline, sometimes rapidly and unpredictably, simply because of economic changes or other events, including public health crises (including the occurrence of a contagious disease or illness), that affect large portions of the market. It includes the risk that a particular style of investing, such as growth or value, may be underperforming the stock market generally.
Allocation Risk—The allocation of investments among different investment styles, such as equity or debt, growth or value, U.S. or non-U.S. securities, or diversification strategies, may have a more significant effect on the Fund’s net asset value, or NAV, when one of these investments is performing more poorly than another.
Credit Risk—An issuer or guarantor of a fixed-income security, or the counterparty to a derivatives or other contract, may be unable or unwilling to make timely payments of interest or principal, or to otherwise honor its obligations. The issuer or guarantor may default, causing a loss of the full principal amount of a security and accrued interest. The degree of risk for a particular security may be reflected in its credit rating. There is the possibility that the credit rating of a fixed-income security may be downgraded after purchase, which may adversely affect the value of the security. Investments in fixed-income securities with lower ratings (commonly known as “junk bonds”) are subject to a higher probability that an issuer will default or fail to meet its payment obligations.
High Yield Debt Securities Risk—Investments in fixed-income securities with lower ratings (commonly known as “junk bonds”) tend to have a higher probability that an issuer will default or fail to meet its payment obligations. These securities may be subject to greater price volatility due to such factors as specific corporate developments, interest rate sensitivity, negative perceptions of the junk bond market generally and less secondary market liquidity.
Interest Rate Risk—Changes in interest rates will affect the value of the Fund’s investments in fixed-income securities. When interest rates rise, the value of existing investments in fixed-income securities tends to fall and this decrease in value may not be offset by higher income from new investments. Interest rate risk is generally greater for fixed-income securities with longer maturities or durations. Very low or negative interest rates would likely magnify the risks associated with changes in interest rates. During periods of very low or negative rates, the Fund’s returns would likely be adversely affected.
| | |
| |
| abfunds.com | | AB TAX-MANAGED ALL MARKET INCOME PORTFOLIO | 81 |
NOTES TO FINANCIAL STATEMENTS (continued)
Inflation Risk—This is the risk that the value of assets or income from investments will be less in the future as inflation decreases the value of money. As inflation increases, the value of the Fund’s assets can decline as can the value of the Fund’s distributions. This risk is significantly greater for fixed-income securities with longer maturities.
Municipal Market Risk—This is the risk that special factors may adversely affect the value of municipal securities and have a significant effect on the yield or value of the Fund’s investments in municipal securities. These factors include economic conditions, political or legislative changes, public health crises, uncertainties related to the tax status of municipal securities, or the rights of investors in these securities. To the extent that the Fund invests more of its assets in a particular state’s municipal securities, the Fund may be vulnerable to events adversely affecting that state, including economic, political and regulatory occurrences, court decisions, terrorism, public health crises (including the occurrence of a contagious disease or illness) and catastrophic natural disasters, such as hurricanes, fires or earthquakes. For example, the novel coronavirus (COVID-19) pandemic has significantly stressed the financial resources of many issuers of municipal securities, which could impair any such issuer’s ability to meet its financial obligations when due and adversely impact the value of its securities held by the Fund. As the full effects of the COVID-19 pandemic on state and local economies and on issuers of municipal securities are still uncertain, the financial difficulties of issuers of municipal securities may continue or worsen, adversely affecting the performance of the Fund. The Fund’s investments in certain municipal securities with principal and interest payments that are made from the revenues of a specific project or facility, and not general tax revenues, may have increased risks. Factors affecting the project or facility, such as local business or economic conditions, could have a significant effect on the project’s ability to make payments of principal and interest on these securities.
Real Estate Risk—The Fund’s investments in the real estate market have many of the same risks as direct ownership of real estate, including the risk that the value of real estate could decline due to a variety of factors that affect the real estate market generally. Investments in REITs may have additional risks. REITs are dependent on the capability of their managers, may have limited diversification, and could be significantly affected by changes in tax laws.
Foreign (Non-U.S.) Risk—The Fund’s investments in securities of non-U.S. issuers may involve more risk than those of U.S. issuers. These securities may fluctuate more widely in price and may be more difficult to trade due to adverse market, economic, political, regulatory or other factors.
| | |
| |
82 | AB TAX-MANAGED ALL MARKET INCOME PORTFOLIO | | abfunds.com |
NOTES TO FINANCIAL STATEMENTS (continued)
Currency Risk—Fluctuations in currency exchange rates may negatively affect the value of the Fund’s investments or reduce its returns.
Emerging Market Risk—Investments in emerging market countries may have more risk because the markets are less developed and less liquid as well as being subject to increased economic, political, regulatory or other uncertainties.
Derivatives Risk—The Fund may enter into derivative transactions such as forwards, options, futures and swaps. Derivatives may be illiquid, difficult to price, and leveraged so that small changes may produce disproportionate losses for the Fund, and subject to counterparty risk to a greater degree than more traditional investments. Derivatives may result in significant losses, including losses that are far greater than the value of the derivatives reflected on the statement of assets and liabilities.
Leverage Risk—When the Fund borrows money or otherwise leverages its investments, its performance may be volatile because leverage tends to exaggerate the effect of any increase or decrease in the value of the Fund’s investments. The Fund may create leverage through the use of reverse repurchase arrangements, forward currency exchange contracts, forward commitments, dollar rolls or futures or by borrowing money. The use of other types of derivative instruments by the Fund, such as options and swaps, may also result in a form of leverage. Leverage may result in higher returns to the Fund than if the Fund were not leveraged, but may also adversely affect returns, particularly if the market is declining.
Illiquid Investments Risk—Illiquid investments risk exists when certain investments are or become difficult to purchase or sell. Difficulty in selling such investments may result in sales at disadvantageous prices affecting the value of your investment in the Fund. Causes of illiquid investments risk may include low trading volumes and large positions. Foreign fixed-income securities may have more illiquid investments risk because secondary trading markets for these securities may be smaller and less well developed and the securities may trade less frequently. Illiquid investments risk may be higher in a rising interest rate environment, when the value and liquidity of fixed-income securities generally go down.
LIBOR Transition and Associated Risk—A Fund may invest in debt securities, derivatives or other financial instruments that utilize the London Interbank Offered Rate, or “LIBOR,” as a “benchmark” or “reference rate” for various interest rate calculations. The United Kingdom Financial Conduct Authority, which regulates LIBOR, will cease publishing certain LIBOR benchmarks at the end of 2021. Although certain LIBOR rates are intended to be published until June 2023, banks are strongly encouraged
| | |
| |
| abfunds.com | | AB TAX-MANAGED ALL MARKET INCOME PORTFOLIO | 83 |
NOTES TO FINANCIAL STATEMENTS (continued)
to cease entering into agreements with counterparties referencing LIBOR by the end of 2021. Although financial regulators and industry working groups have suggested alternative reference rates, such as the European Interbank Offer Rate, the Sterling Overnight Interbank Average Rate and the Secured Overnight Financing Rate, global consensus on alternative rates is lacking and the process for amending existing contracts or instruments to transition away from LIBOR is underway but remains incomplete. The elimination of LIBOR or changes to other reference rates or any other changes or reforms to the determination or supervision of reference rates could have an adverse impact on the market for, or value of, any securities or payments linked to those reference rates, which may adversely affect a Fund’s performance and/or net asset value. Uncertainty and risk also remain regarding the willingness and ability of issuers and lenders to include revised provisions in new and existing contracts or instruments. Consequently, the transition away from LIBOR to other reference rates may lead to increased volatility and illiquidity in markets that are tied to LIBOR, fluctuations in values of LIBOR-related investments or investments in issuers that utilize LIBOR, increased difficulty in borrowing or refinancing and diminished effectiveness of hedging strategies, potentially adversely affecting a Fund’s performance. Furthermore, the risks associated with the expected discontinuation of LIBOR and transition may be exacerbated if the work necessary to effect an orderly transition to an alternative reference rate is not completed in a timely manner. Because the usefulness of LIBOR as a benchmark could deteriorate during the transition period, these effects could occur prior to the end of 2021.
Indemnification Risk—In the ordinary course of business, the Fund enters into contracts that contain a variety of indemnifications. The Fund’s maximum exposure under these arrangements is unknown. However, the Fund has not had prior claims or losses pursuant to these indemnification provisions and expects the risk of loss thereunder to be remote. Therefore, the Fund has not accrued any liability in connection with these indemnification provisions.
Management Risk—The Fund is subject to management risk because it is an actively-managed investment fund. The Adviser will apply its investment techniques and risk analyses in making investment decisions for the Fund, but there is no guarantee that its techniques will produce the intended results. Some of these techniques may incorporate, or rely upon, quantitative models, but there is no guarantee that these models will generate accurate forecasts, reduce risk or otherwise perform as expected. The Fund’s tax-management strategies may result in it forgoing performance in favor of tax benefits that may not materialize, or may result in pre-tax performance that is lower than that of funds that do not use tax-management strategies.
| | |
| |
84 | AB TAX-MANAGED ALL MARKET INCOME PORTFOLIO | | abfunds.com |
NOTES TO FINANCIAL STATEMENTS (continued)
NOTE G
Joint Credit Facility
A number of open-end mutual funds managed by the Adviser, including the Fund, participate in a $325 million revolving credit facility (the “Facility”) intended to provide short-term financing, if necessary, subject to certain restrictions in connection with abnormal redemption activity. Commitment fees related to the Facility are paid by the participating funds and are included in miscellaneous expenses in the statement of operations. The Fund did not utilize the Facility during the six months ended February 28, 2021.
NOTE H
Distributions to Shareholders
The tax character of distributions to be paid for the year ending August 31, 2021 will be determined at the end of the current fiscal year. The tax character of distributions paid during the fiscal years ended August 31, 2020 and August 31, 2019 were as follows:
| | | | | | | | |
| | | 2020 | | | 2019 | |
Distributions paid from: | | | | | | | | |
Ordinary income | | $ | 1,888,525 | | | $ | 5,393,455 | |
Net long-term capital gains | | | – 0 | – | | | 829,397 | |
| | | | | | | | |
Total taxable distributions paid | | $ | 1,888,525 | | | $ | 6,222,852 | |
Tax-exempt income | | | 2,919,115 | | | | 338,369 | |
| | | | | | | | |
Total distributions paid | | $ | 4,807,640 | | | $ | 6,561,221 | |
| | | | | | | | |
As of August 31, 2020, the components of accumulated earnings/(deficit) on a tax basis were as follows:
| | | | |
Undistributed ordinary income | | $ | 109,105 | |
Undistributed tax-exempt income | | | 72,276 | |
Accumulated capital and other losses | | | (5,056,488 | )(a) |
Unrealized appreciation/(depreciation) | | | 2,712,786 | (b) |
| | | | |
Total accumulated earnings/(deficit) | | $ | (2,162,321 | ) |
| | | | |
| (a) | As of August 31, 2020, the Fund had a net capital loss carryforward of $4,968,348. As of August 31, 2020, the cumulative deferred loss on straddles was $88,140. |
| (b) | The differences between book-basis and tax-basis unrealized appreciation/(depreciation) are attributable primarily to the recognition for tax purposes of unrealized gains/losses on certain derivative instruments, the tax treatment of passive foreign investment companies (PFICs), the tax treatment of swaps, and the tax deferral of losses on wash sales. |
For tax purposes, net realized capital losses may be carried over to offset future capital gains, if any. Funds are permitted to carry forward capital losses for an indefinite period, and such losses will retain their character as either short-term or long-term capital losses. As of August 31, 2020, the Fund had a net short-term capital loss carryforward of $4,968,348, which may be carried forward for an indefinite period.
| | |
| |
| abfunds.com | | AB TAX-MANAGED ALL MARKET INCOME PORTFOLIO | 85 |
NOTES TO FINANCIAL STATEMENTS (continued)
NOTE I
Subsequent Events
As of February 28, 2021, Class C shares will automatically convert to Class A shares ten years after the end of the calendar month of their original purchase. Effective May 31, 2021, Class C shares will automatically convert to Class A shares after eight years instead of ten years.
Management has evaluated subsequent events for possible recognition or disclosure in the financial statements through the date the financial statements are issued. Management has determined that there are no other material events that would require disclosure in the Fund’s financial statements through this date.
| | |
| |
86 | AB TAX-MANAGED ALL MARKET INCOME PORTFOLIO | | abfunds.com |
FINANCIAL HIGHLIGHTS
Selected Data For A Share Of Beneficial Interest Outstanding Throughout Each Period
| | | | | | | | | | | | | | | | | | | | | | | | |
| | | Class A | |
| | | Six Months
Ended
February 28,
2021
(unaudited) | | | Year Ended August 31, | |
| | | 2020 | | | 2019 | | | 2018 | | | 2017 | | | 2016 | |
| | | | |
| | | | | | | | | | | | | | | | | | | | | | | | |
Net asset value, beginning of period | | | $ 11.83 | | | | $ 12.75 | | | | $ 12.68 | | | | $ 13.93 | | | | $ 13.20 | | | | $ 13.32 | |
| | | | |
Income From Investment Operations | | | | | | | | | | | | | | | | | | | | | | | | |
| | | | | | |
Net investment income(a)(b) | | | .14 | | | | .32 | | | | .35 | | | | .36 | | | | .34 | † | | | .17 | |
| | | | | | |
Net realized and unrealized gain (loss) on investment and foreign currency transactions | | | .49 | | | | (.64 | ) | | | .49 | | | | (.01 | ) | | | .65 | | | | .37 | |
| | | | | | |
Contributions from Affiliates | | | – 0 | – | | | – 0 | – | | | – 0 | – | | | – 0 | – | | | – 0 | – | | | .00 | (c) |
| | | | |
| | | | | | |
Net increase (decrease) in net asset value from operations | | | .63 | | | | (.32 | ) | | | .84 | | | | .35 | | | | .99 | | | | .54 | |
| | | | |
Less: Dividends and Distributions | | | | | | | | | | | | | | | | | | | | | | | | |
| | | | | | |
Dividends from net investment income | | | (.21 | ) | | | (.60 | ) | | | (.37 | ) | | | (.69 | ) | | | (.19 | ) | | | (.21 | ) |
| | | | | | |
Distributions from net realized gain on investment transactions | | | – 0 | – | | | – 0 | – | | | (.40 | ) | | | (.91 | ) | | | (.07 | ) | | | (.45 | ) |
| | | | |
Total dividends and distributions | | | (.21 | ) | | | (.60 | ) | | | (.77 | ) | | | (1.60 | ) | | | (.26 | ) | | | (.66 | ) |
| | | | |
Net asset value, end of period | | | $ 12.25 | | | | $ 11.83 | | | | $ 12.75 | | | | $ 12.68 | | | | $ 13.93 | | | | $ 13.20 | |
| | | | |
| | | | | | |
Total Return | | | | | | | | | | | | | | | | | | | | | | | | |
| | | | | | |
Total investment return based on net asset value(d)* | | | 5.43 | % | | | (2.72 | )% | | | 7.22 | % | | | 2.54 | %+ | | | 7.64 | %†+ | | | 4.19 | % |
| | | | | | |
Ratios/Supplemental Data | | | | | | | | | | | | | | | | | | | | | | | | |
| | | | | | |
Net assets, end of period
(000’s omitted) | | | $54,335 | | | | $54,677 | | | | $64,994 | | | | $68,946 | | | | $77,486 | | | | $73,526 | |
| | | | | | |
Ratio to average net assets of: | | | | | | | | | | | | | | | | | | | | | | | | |
| | | | | | |
Expenses, net of waivers/reimbursements(e)(f)‡ | | | .98 | %^ | | | .98 | % | | | .99 | % | | | .99 | % | | | 1.08 | % | | | 1.13 | % |
| | | | | | |
Expenses, before waivers/reimbursements(e)(f)‡ | | | 1.37 | %^ | | | 1.33 | % | | | 1.35 | % | | | 1.31 | % | | | 1.25 | % | | | 1.19 | % |
| | | | | | |
Net investment income(b) | | | 2.31 | %^ | | | 2.66 | % | | | 2.85 | % | | | 2.77 | % | | | 2.57 | %† | | | 1.31 | % |
| | | | | | |
Portfolio turnover rate | | | 14 | % | | | 35 | % | | | 22 | % | | | 50 | % | | | 85 | % | | | 25 | % |
| | | | | | | | | | | | | | | | | | | | | | | | |
| |
‡ Expense ratios exclude the estimated acquired fund fees of the affiliated/unaffiliated underlying | |
portfolios | | | .01 | %^ | | | .02 | % | | | .02 | % | | | .04 | % | | | .11 | % | | | .16 | % |
| See | footnote summary on page 90. |
| | |
| |
| abfunds.com | | AB TAX-MANAGED ALL MARKET INCOME PORTFOLIO | 87 |
FINANCIAL HIGHLIGHTS (continued)
Selected Data For A Share Of Beneficial Interest Outstanding Throughout Each Period
| | | | | | | | | | | | | | | | | | | | | | | | |
| | | Class C | |
| | | Six Months
Ended
February 28,
2021 (unaudited) | | | Year Ended August 31, | |
| | | 2020 | | | 2019 | | | 2018 | | | 2017 | | | 2016 | |
| | | | |
| | | | | | | | | | | | | | | | | | | | | | | | |
Net asset value, beginning of period | | | $ 12.06 | | | | $ 12.98 | | | | $ 12.90 | | | | $ 13.93 | | | | $ 13.19 | | | | $ 13.30 | |
| | | | |
Income From Investment Operations | | | | | | | | | | | | | | | | | | | | | | | | |
| | | | | | |
Net investment income(a)(b) | | | .10 | | | | .24 | | | | .26 | | | | .27 | | | | .23 | † | | | .07 | |
| | | | | | |
Net realized and unrealized gain (loss) on investment and foreign currency transactions | | | .51 | | | | (.66 | ) | | | .49 | | | | (.02 | ) | | | .66 | | | | .37 | |
| | | | | | |
Contributions from Affiliates | | | – 0 | – | | | – 0 | – | | | – 0 | – | | | – 0 | – | | | – 0 | – | | | .00 | (c) |
| | | | |
| | | | | | |
Net increase (decrease) in net asset value from operations | | | .61 | | | | (.42 | ) | | | .75 | | | | .25 | | | | .89 | | | | .44 | |
| | | | |
Less: Dividends and Distributions | | | | | | | | | | | | | | | | | | | | | | | | |
| | | | | | |
Dividends from net investment income | | | (.16 | ) | | | (.50 | ) | | | (.27 | ) | | | (.37 | ) | | | (.08 | ) | | | (.10 | ) |
| | | | | | |
Distributions from net realized gain on investment transactions | | | – 0 | – | | | – 0 | – | | | (.40 | ) | | | (.91 | ) | | | (.07 | ) | | | (.45 | ) |
| | | | |
Total dividends and distributions | | | (.16 | ) | | | (.50 | ) | | | (.67 | ) | | | (1.28 | ) | | | (.15 | ) | | | (.55 | ) |
| | | | |
Net asset value, end of period | | | $ 12.51 | | | | $ 12.06 | | | | $ 12.98 | | | | $ 12.90 | | | | $ 13.93 | | | | $ 13.19 | |
| | | | |
| | | | | | |
Total Return | | | | | | | | | | | | | | | | | | | | | | | | |
| | | | | | |
Total investment return based on net asset value(d)* | | | 5.07 | % | | | (3.37 | )% | | | 6.33 | % | | | 1.83 | %+ | | | 6.82 | %†+ | | | 3.40 | % |
| | | | | | |
Ratios/Supplemental Data | | | | | | | | | | | | | | | | | | | | | | | | |
| | | | | | |
Net assets, end of period (000’s omitted) | | | $3,393 | | | | $4,131 | | | | $5,537 | | | | $7,383 | | | | $11,986 | | | | $24,955 | |
| | | | | | |
Ratio to average net assets of: | | | | | | | | | | | | | | | | | | | | | | | | |
| | | | | | |
Expenses, net of waivers/reimbursements(e)(f)‡ | | | 1.73 | %^ | | | 1.73 | % | | | 1.74 | % | | | 1.74 | % | | | 1.86 | % | | | 1.89 | % |
| | | | | | |
Expenses, before waivers/reimbursements(e)(f)‡ | | | 2.12 | %^ | | | 2.09 | % | | | 2.10 | % | | | 2.05 | % | | | 1.99 | % | | | 1.94 | % |
| | | | | | |
Net investment income(b) | | | 1.56 | %^ | | | 1.92 | % | | | 2.11 | % | | | 2.02 | % | | | 1.72 | %† | | | .56 | % |
| | | | | | |
Portfolio turnover rate | | | 14 | % | | | 35 | % | | | 22 | % | | | 50 | % | | | 85 | % | | | 25 | % |
| | | | | | | | | | | | | | | | | | | | | | | | |
| |
‡ Expense ratios exclude the estimated acquired fund fees of the affiliated/unaffiliated underlying | |
portfolios | | | .01 | %^ | | | .02 | % | | | .02 | % | | | .04 | % | | | .11 | % | | | .16 | % |
| See | footnote summary on page 90. |
| | |
| |
88 | AB TAX-MANAGED ALL MARKET INCOME PORTFOLIO | | abfunds.com |
FINANCIAL HIGHLIGHTS (continued)
Selected Data For A Share Of Beneficial Interest Outstanding Throughout Each Period
| | | | | | | | | | | | | | | | | | | | | | | | |
| | | Advisor Class | |
| | | Six Months
Ended
February 28,
2021 (unaudited) | | | Year Ended August 31, | |
| | | 2020 | | | 2019 | | | 2018 | | | 2017 | | | 2016 | |
| | | | |
| | | | | | | | | | | | | | | | | | | | | | | | |
Net asset value, beginning of period | | | $ 11.84 | | | | $ 12.77 | | | | $ 12.70 | | | | $ 13.96 | | | | $ 13.24 | | | | $ 13.36 | |
| | | | |
Income From Investment Operations | | | | | | | | | | | | | | | | | | | | | | | | |
| | | | | | |
Net investment income(a)(b) | | | .15 | | | | .35 | | | | .38 | | | | .39 | | | | .37 | † | | | .20 | |
| | | | | | |
Net realized and unrealized gain (loss) on investment and foreign currency transactions | | | .50 | | | | (.65 | ) | | | .49 | | | | .00 | (c) | | | .64 | | | | .38 | |
| | | | | | |
Contributions from Affiliates | | | – 0 | – | | | – 0 | – | | | – 0 | – | | | – 0 | – | | | – 0 | – | | | .00 | (c) |
| | | | |
| | | | | | |
Net increase (decrease) in net asset value from operations | | | .65 | | | | (.30 | ) | | | .87 | | | | .39 | | | | 1.01 | | | | .58 | |
| | | | |
Less: Dividends and Distributions | | | | | | | | | | | | | | | | | | | | | | | | |
| | | | | | |
Dividends from net investment income | | | (.22 | ) | | | (.63 | ) | | | (.40 | ) | | | (.74 | ) | | | (.22 | ) | | | (.25 | ) |
| | | | | | |
Distributions from net realized gain on investment transactions | | | – 0 | – | | | – 0 | – | | | (.40 | ) | | | (.91 | ) | | | (.07 | ) | | | (.45 | ) |
| | | | |
Total dividends and distributions | | | (.22 | ) | | | (.63 | ) | | | (.80 | ) | | | (1.65 | ) | | | (.29 | ) | | | (.70 | ) |
| | | | |
Net asset value, end of period | | | $ 12.27 | | | | $ 11.84 | | | | $ 12.77 | | | | $ 12.70 | | | | $ 13.96 | | | | $ 13.24 | |
| | | | |
| | | | | | |
Total Return | | | | | | | | | | | | | | | | | | | | | | | | |
| | | | | | |
Total investment return based on net asset value(d)* | | | 5.55 | % | | | (2.47 | )% | | | 7.48 | % | | | 2.95 | % | | | 7.84 | %†+ | | | 4.48 | % |
| | | | | | |
Ratios/Supplemental Data | | | | | | | | | | | | | | | | | | | | | | | | |
| | | | | | |
Net assets, end of period (000’s omitted) | | | $30,696 | | | | $31,264 | | | | $33,141 | | | | $35,479 | | | | $39,646 | | | | $39,382 | |
| | | | | | |
Ratio to average net assets of: | | | | | | | | | | | | | | | | | | | | | | | | |
| | | | | | |
Expenses, net of waivers/reimbursements(e)(f)‡ | | | .73 | %^ | | | .73 | % | | | .74 | % | | | .74 | % | | | .84 | % | | | .89 | % |
| | | | | | |
Expenses, before waivers/reimbursements(e)(f)‡ | | | 1.12 | %^ | | | 1.08 | % | | | 1.10 | % | | | 1.06 | % | | | 1.00 | % | | | .94 | % |
| | | | | | |
Net investment income(b) | | | 2.55 | %^ | | | 2.91 | % | | | 3.10 | % | | | 3.02 | % | | | 2.81 | %† | | | 1.55 | % |
| | | | | | |
Portfolio turnover rate | | | 14 | % | | | 35 | % | | | 22 | % | | | 50 | % | | | 85 | % | | | 25 | % |
| | | | | | | | | | | | | | | | | | | | | | | | |
| |
‡ Expense ratios exclude the estimated acquired fund fees of the affiliated/unaffiliated underlying | |
portfolios | | | .01 | %^ | | | .02 | % | | | .02 | % | | | .04 | % | | | .11 | % | | | .16 | % |
| See | footnote summary on page 90. |
| | |
| |
| abfunds.com | | AB TAX-MANAGED ALL MARKET INCOME PORTFOLIO | 89 |
FINANCIAL HIGHLIGHTS (continued)
Selected Data For A Share Of Beneficial Interest Outstanding Throughout Each Period
| (a) | Based on average shares outstanding. |
| (b) | Net of expenses waived/reimbursed by the Adviser. |
| (c) | Amount is less than $.005. |
| (d) | Total investment return is calculated assuming an initial investment made at the net asset value at the beginning of the period, reinvestment of all dividends and distributions at net asset value during the period, and redemption on the last day of the period. Initial sales charges or contingent deferred sales charges are not reflected in the calculation of total investment return. Total return does not reflect the deduction of taxes that a shareholder would pay on fund distributions or the redemption of fund shares. Total investment return calculated for a period of less than one year is not annualized. |
| (e) | In connection with the Fund’s investments in affiliated underlying portfolios, the Fund incurs no direct expenses, but bears proportionate shares of the fees and expenses (i.e., operating, administrative and investment advisory fees) of the affiliated underlying portfolios. The Adviser has contractually agreed to waive its fees from the Fund in an amount equal to the Fund’s pro rata share of certain acquired fund fees and expenses, and for the six months ended February 28, 2021 and the years ended August 31, 2020 and August 31, 2017, such waiver amounted to .01% (annualized), .01% and .04%, respectively. |
| (f) | The expense ratios presented below exclude bank overdraft expense: |
| | | | | | | | | | | | | | |
| | | Six Months
Ended
February 28,
2021 (unaudited) | | Year Ended August 31, |
| | | 2020 | | 2019 | | 2018 | | | 2017 | | 2016 |
Class A |
Net of waivers/reimbursements | | N/A | | N/A | | N/A | | | .99 | % | | N/A | | N/A |
Before waivers/reimbursements | | N/A | | N/A | | N/A | | | 1.30 | % | | N/A | | N/A |
|
Class C |
Net of waivers/reimbursements | | N/A | | N/A | | N/A | | | 1.74 | % | | N/A | | N/A |
Before waivers/reimbursements | | N/A | | N/A | | N/A | | | 2.04 | % | | N/A | | N/A |
|
Advisor Class |
Net of waivers/reimbursements | | N/A | | N/A | | N/A | | | .74 | % | | N/A | | N/A |
Before waivers/reimbursements | | N/A | | N/A | | N/A | | | 1.05 | % | | N/A | | N/A |
| † | For the year ended August 31, 2017, the amount includes a refund for overbilling of prior years’ custody out of pocket fees as follows: |
| | | | |
Net Investment
Income Per Share | | Net Investment
Income Ratio | | Total
Return |
| $.012 | | .09% | | .09% |
| * | Includes the impact of proceeds received and credited to the Fund resulting from class action settlements, which enhanced the Fund’s performance for the years ended August 31, 2018, August 31, 2017 and August 31, 2016 by .01%, .01% and .02%, respectively. |
| + | The net asset value and total return include adjustments in accordance with accounting principles generally accepted in the United States of America for financial reporting purposes. As such, the net asset value and total return for shareholder transactions may differ from financial statements. |
See notes to financial statements.
| | |
| |
90 | AB TAX-MANAGED ALL MARKET INCOME PORTFOLIO | | abfunds.com |
BOARD OF TRUSTEES
TRUSTEES
| | |
Marshall C. Turner, Jr.(1), Chairman Jorge A. Bermudez(1) Michael J. Downey(1) Onur Erzan*, President and Chief Executive Officer | | Nancy P. Jacklin(1) Jeanette W. Loeb(1) Carol C. McMullen(1) Garry L. Moody(1) Earl D. Weiner(1) |
OFFICERS
| | |
Morgan C. Harting(2), Vice President Daniel J. Loewy(2), Vice President Karen Watkin(2), Vice President Emilie D. Wrapp, Clerk Michael B. Reyes, Senior Analyst | | Joseph J. Mantineo, Treasurer and Chief Financial Officer Phyllis J. Clarke, Controller and Chief Accounting Officer Vincent S. Noto, Chief Compliance Officer |
| | |
Custodian and Accounting Agent State Street Bank and Trust Company State Street Corporation CCB/5 1 Iron Street Boston, MA 02210 Principal Underwriter AllianceBernstein Investments, Inc. 1345 Avenue of the Americas New York, NY 10105 Legal Counsel Seward & Kissel LLP One Battery Park Plaza New York, NY 10004 | | Transfer Agent AllianceBernstein Investor Services, Inc. P.O. Box 786003 San Antonio, TX 78278-6003 Toll-Free (800) 221-5672 Independent Registered Public Accounting Firm Ernst & Young LLP 5 Times Square New York, NY 10036 |
| 1 | Member of the Audit Committee, the Governance and Nominating Committee and the Independent Directors Committee. |
| 2 | The day-to-day management of, and investment decisions for, the Fund’s portfolio are made by the Adviser’s Multi-Asset Solutions Team. Messrs. Harting and Loewy and Ms. Watkin are the investment professionals primarily responsible for the day-to-day management of the Fund’s portfolio. |
| * | Mr. Robert M. Keith retired as President, Chief Executive Officer and a Director of the Fund as of March 31, 2021. Mr. Onur Erzan, Senior Vice President and Head of the Global Client Group of the Adviser, has been elected President, Chief Executive Officer and a Director of the Fund, effective April 1, 2021. |
| | |
| |
| abfunds.com | | AB TAX-MANAGED ALL MARKET INCOME PORTFOLIO | 91 |
Operation and Effectiveness of the Fund’s Liquidity Risk Management Program:
In October 2016, the Securities and Exchange Commission (“SEC”) adopted the open-end fund liquidity rule (the “Liquidity Rule”). In June 2018 the SEC adopted a requirement that funds disclose information about the operation and effectiveness of their Liquidity Risk Management Program (“LRMP”) in their reports to shareholders.
One of the requirements of the Liquidity Rule is for the Fund to designate an Administrator of the Fund’s Liquidity Risk Management Program. The Administrator of the Fund’s LRMP is AllianceBernstein L.P., the Fund’s investment adviser (the “Adviser”). The Adviser has delegated the responsibility to its Liquidity Risk Management Committee (the “Committee”).
Another requirement of the Liquidity Rule is for the Fund’s Board of Trustees (the “Fund Board”) to receive an annual written report from the Administrator of the LRMP, which addresses the operation of the Fund’s LRMP and assesses its adequacy and effectiveness. The Adviser provided the Fund Board with such annual report during the first quarter of 2021, which covered the period January 1, 2020 through December 31, 2020 (the “Program Reporting Period”).
The LRMP’s principal objectives include supporting the Fund’s compliance with limits on investments in illiquid assets and mitigating the risk that the Fund will be unable to meet its redemption obligations in a timely manner.
Pursuant to the LRMP, the Fund classifies the liquidity of its portfolio investments into one of the four categories defined by the SEC: Highly Liquid, Moderately Liquid, Less Liquid, and Illiquid. These classifications are reported to the SEC on Form N-PORT.
During the Program Reporting Period, the Committee reviewed whether the Fund’s strategy is appropriate for an open-end structure, incorporating any holdings of less liquid and illiquid assets. If the Fund participated in derivative transactions, the exposure from such transactions were considered in the LRMP.
The Committee also performed an analysis to determine whether the Fund is required to maintain a Highly Liquid Investment Minimum (“HLIM”). The Committee also incorporated the following information when determining the Fund’s reasonably anticipated trading size for purposes of liquidity monitoring: historical net redemption activity, a Fund’s concentration in an issuer, shareholder concentration, investment performance, total net assets, and distribution channels.
The Adviser informed the Fund Board that the Committee believes the Fund’s LRMP is adequately designed, has been implemented as intended,
| | |
| |
92 | AB TAX-MANAGED ALL MARKET INCOME PORTFOLIO | | abfunds.com |
and has operated effectively since its inception. No material exceptions have been noted since the implementation of the LRMP. During the Program Reporting Period, beginning in March 2020, all financial markets experienced extreme levels of price volatility and relative illiquidity resulting from the COVID-19 impacts on the global economy. This extreme relative illiquidity resulted in significantly wider bid-ask spreads to transact in securities, including many of those securities held by the Fund, and in a diminished depth of liquidity in most markets, to varying degrees. Nonetheless, there were no liquidity events that impacted the Fund or its ability to timely meet redemptions during the Program Reporting Period.
| | |
| |
| abfunds.com | | AB TAX-MANAGED ALL MARKET INCOME PORTFOLIO | 93 |
Information Regarding the Review and Approval of the Fund’s Advisory Agreement
The disinterested trustees (the “directors”) of The AB Portfolios (the “Company”) unanimously approved the continuance of the Company’s Advisory Agreement with the Adviser in respect of AB Tax-Managed All Market Income Portfolio (the “Fund”) at a meeting held by video conference on August 4-5, 2020 (the “Meeting”).
Prior to approval of the continuance of the Advisory Agreement, the directors had requested from the Adviser, and received and evaluated, extensive materials. They reviewed the proposed continuance of the Advisory Agreement with the Adviser and with experienced counsel who are independent of the Adviser, who advised on the relevant legal standards. The directors also reviewed additional materials, including comparative analytical data prepared by the Senior Analyst for the Fund. The directors also discussed the proposed continuance in private sessions with counsel.
The directors considered their knowledge of the nature and quality of the services provided by the Adviser to the Fund gained from their experience as directors or trustees of most of the registered investment companies advised by the Adviser, their overall confidence in the Adviser’s integrity and competence they have gained from that experience, the Adviser’s initiative in identifying and raising potential issues with the directors and its responsiveness, frankness and attention to concerns raised by the directors in the past, including the Adviser’s willingness to consider and implement organizational and operational changes designed to improve investment results and the services provided to the AB Funds. The directors noted that they have four regular meetings each year, at each of which they review extensive materials and information from the Adviser, including information on the investment performance of the Fund and the money market fund advised by the Adviser in which the Fund invests.
The directors also considered all factors they believed relevant, including the specific matters discussed below. During the course of their deliberations, the directors evaluated, among other things, the reasonableness of the advisory fee. The directors did not identify any particular information that was all-important or controlling, and different directors may have attributed different weights to the various factors. The directors determined that the selection of the Adviser to manage the Fund and the overall arrangements between the Fund and the Adviser, as provided in the Advisory Agreement, including the advisory fee, were fair and reasonable in light of the services performed, expenses incurred and such other matters as the directors considered relevant in the exercise of their business
| | |
| |
94 | AB TAX-MANAGED ALL MARKET INCOME PORTFOLIO | | abfunds.com |
judgment. The material factors and conclusions that formed the basis for the directors’ determinations included the following:
Nature, Extent and Quality of Services Provided
The directors considered the scope and quality of services provided by the Adviser under the Advisory Agreement, including the quality of the investment research capabilities of the Adviser and the other resources it has dedicated to performing services for the Fund. The directors noted that the Adviser from time to time reviews the Fund’s investment strategies and from time to time proposes changes intended to improve the Fund’s relative or absolute performance for the directors’ consideration. They also noted the professional experience and qualifications of the Fund’s portfolio management team and other senior personnel of the Adviser. The quality of administrative and other services, including the Adviser’s role in coordinating the activities of the Fund’s other service providers, also was considered. The directors concluded that, overall, they were satisfied with the nature, extent and quality of services provided to the Fund under the Advisory Agreement.
Costs of Services Provided and Profitability
The directors reviewed a schedule of the revenues and expenses and related notes indicating the profitability of the Fund to the Adviser for calendar years 2018 and 2019 that had been prepared with an expense allocation methodology arrived at in consultation with an independent consultant retained by the Fund’s former Senior Officer/Independent Compliance Officer. The directors noted the assumptions and methods of allocation used by the Adviser in preparing fund-specific profitability data and understood that there are a number of potentially acceptable allocation methodologies for information of this type. The directors noted that the profitability information reflected all revenues and expenses of the Adviser’s relationship with the Fund, including those relating to its subsidiaries that provide transfer agency, distribution and brokerage services to the Fund. The directors recognized that it is difficult to make comparisons of the profitability of the Advisory Agreement with the profitability of fund advisory contracts for unaffiliated funds because comparative information is not generally publicly available and is affected by numerous factors. The directors focused on the profitability of the Adviser’s relationship with the Fund before taxes and distribution expenses. The directors noted that the Fund was not profitable to the Adviser in the periods reviewed.
Fall-Out Benefits
The directors considered the other benefits to the Adviser and its affiliates from their relationships with the Fund and the money market fund advised by the Adviser in which the Fund invests, including, but not limited to, benefits relating to soft dollar arrangements (whereby investment advisers receive brokerage and research services from brokers that execute agency transactions for their clients); 12b-1 fees and sales charges received by the
| | |
| |
| abfunds.com | | AB TAX-MANAGED ALL MARKET INCOME PORTFOLIO | 95 |
Fund’s principal underwriter (which is a wholly owned subsidiary of the Adviser) in respect of certain classes of the Fund’s shares; brokerage commissions paid by the Fund to brokers affiliated with the Adviser; and transfer agency fees paid by the Fund to a wholly owned subsidiary of the Adviser. The directors recognized that the Fund’s unprofitability to the Adviser would be exacerbated without these benefits. The directors understood that the Adviser also might derive reputational and other benefits from its association with the Fund.
Investment Results
In addition to the information reviewed by the directors in connection with the Meeting, the directors receive detailed performance information for the Fund at each regular Board meeting during the year.
At the Meeting, the directors reviewed performance information prepared by an independent service provider (the “15(c) service provider”), showing the performance of the Class A Shares of the Fund against a group of similar funds (“peer group”) and a larger group of similar funds (“peer universe”), each selected by the 15(c) service provider, and information prepared by the Adviser showing performance of the Class A Shares against a broad-based securities market index, in each case for the 1-, 3-, 5- and 10-year periods ended May 31, 2020 and (in the case of comparisons with the broad-based securities market index) for the period from inception. Based on their review, the directors concluded that the Fund’s investment performance was acceptable.
Advisory Fees and Other Expenses
The directors considered the advisory fee rate payable by the Fund to the Adviser and information prepared by the 15(c) service provider concerning advisory fee rates payable by other funds in the same category as the Fund. The directors recognized that it is difficult to make comparisons of advisory fees because there are variations in the services that are included in the fees paid by other funds. The directors compared the Fund’s contractual effective advisory fee rate with a peer group median.
The directors also considered the Adviser’s fee schedule for other clients utilizing investment strategies similar to those of the Fund. For this purpose, they reviewed the relevant advisory fee information from the Adviser’s Form ADV and in a report from the Fund’s Senior Analyst and noted the differences between the Fund’s fee schedule, on the one hand, and the Adviser’s institutional fee schedule, on the other. The directors noted that the Adviser may, in some cases, agree to fee rates with large institutional clients that are lower than those reviewed by the directors and that they had previously discussed with the Adviser its policies in respect of such arrangements. The directors previously discussed these matters with an independent fee consultant.
| | |
| |
96 | AB TAX-MANAGED ALL MARKET INCOME PORTFOLIO | | abfunds.com |
The Adviser reviewed with the directors the significantly greater scope of the services it provides to the Fund relative to institutional clients. In this regard, the Adviser noted, among other things, that, compared to institutional accounts, the Fund (i)��demands considerably more portfolio management, research and trading resources due to significantly higher daily cash flows; (ii) has more tax and regulatory restrictions and compliance obligations; (iii) must prepare and file or distribute regulatory and other communications about fund operations; and (iv) must provide shareholder servicing to retail investors. The Adviser also reviewed the greater legal risks presented by the large and changing population of Fund shareholders who may assert claims against the Adviser in individual or class actions, and the greater entrepreneurial risk in offering new fund products, which require substantial investment to launch, may not succeed, and generally must be priced to compete with larger, more established funds resulting in lack of profitability to the Adviser until a new fund achieves scale. In light of the substantial differences in services rendered by the Adviser to institutional clients as compared to the Fund, and the different risk profile, the directors considered these fee comparisons inapt and did not place significant weight on them in their deliberations.
In connection with their review of the Fund’s advisory fee, the directors also considered the total expense ratio of the Class A shares of the Fund in comparison to a peer group and a peer universe selected by the 15(c) service provider. The Class A expense ratio of the Fund was based on the Fund’s latest fiscal year and the directors considered the Adviser’s expense cap for the Fund. The directors noted that it was likely that the expense ratios of some of the other funds in the Fund’s category were lowered by waivers or reimbursements by those funds’ investment advisers, which in some cases might be voluntary or temporary. The directors view expense ratio information as relevant to their evaluation of the Adviser’s services because the Adviser is responsible for coordinating services provided to the Fund by others. Based on their review, the directors concluded that the Fund’s expense ratio was acceptable.
Economies of Scale
The directors noted that the advisory fee schedules for the Fund contains breakpoints that reduce the fee rates on assets above specified levels. The directors took into consideration prior presentations by an independent consultant on economies of scale in the mutual fund industry and for the AB Funds, and presentations from time to time by the Adviser concerning certain of its views on economies of scale. The directors also previously discussed economies of scale with an independent fee consultant. The directors also had requested and received from the Adviser certain updates on economies of scale in advance of the Meeting. The directors believe that economies of scale may be realized (if at all) by the Adviser across a variety of products and services, and not only in respect of a single fund. The directors noted that there is no established methodology for
| | |
| |
| abfunds.com | | AB TAX-MANAGED ALL MARKET INCOME PORTFOLIO | 97 |
setting breakpoints that give effect to the fund-specific services provided by a fund’s adviser and to the economies of scale that an adviser may realize in its overall mutual fund business or those components of it which directly or indirectly affect a fund’s operations. The directors observed that in the mutual fund industry as a whole, as well as among funds similar to the Fund, there is no uniformity or pattern in the fees and asset levels at which breakpoints (if any) apply. The directors also noted that the advisory agreements for many funds do not have breakpoints at all. Having taken these factors into account, the directors concluded that the Fund’s shareholders would benefit from a sharing of economies of scale in the event the Fund’s net assets exceed a breakpoint in the future.
| | |
| |
98 | AB TAX-MANAGED ALL MARKET INCOME PORTFOLIO | | abfunds.com |
This page is not part of the Shareholder Report or the Financial Statements.
AB FAMILY OF FUNDS
US EQUITY
CORE
Core Opportunities Fund
FlexFee™ US Thematic Portfolio
Select US Equity Portfolio
GROWTH
Concentrated Growth Fund
Discovery Growth Fund
FlexFee™ Large Cap Growth Portfolio
Growth Fund
Large Cap Growth Fund
Small Cap Growth Portfolio
VALUE
Discovery Value Fund
Equity Income Fund
Relative Value Fund
Small Cap Value Portfolio
Value Fund
INTERNATIONAL/ GLOBAL EQUITY
CORE
Global Core Equity Portfolio
International Strategic Core Portfolio
Sustainable Global Thematic Fund
Tax-Managed Wealth Appreciation Strategy
Wealth Appreciation Strategy
GROWTH
Concentrated International Growth Portfolio
Sustainable International Thematic Fund
VALUE
All China Equity Portfolio
International Value Fund
FIXED INCOME
MUNICIPAL
High Income Municipal Portfolio
Intermediate California Municipal Portfolio
Intermediate Diversified Municipal Portfolio
Intermediate New York Municipal Portfolio
Municipal Bond Inflation Strategy
Tax-Aware Fixed Income Opportunities Portfolio
National Portfolio
Arizona Portfolio
California Portfolio
Massachusetts Portfolio
Minnesota Portfolio
New Jersey Portfolio
New York Portfolio
Ohio Portfolio
Pennsylvania Portfolio
Virginia Portfolio
TAXABLE
Bond Inflation Strategy
FlexFee™ High Yield Portfolio
Global Bond Fund
High Income Fund
Income Fund
Intermediate Duration Portfolio
Limited Duration High Income Portfolio
Short Duration Income Portfolio
Short Duration Portfolio
Total Return Bond Portfolio
ALTERNATIVES
All Market Real Return Portfolio
Global Real Estate Investment Fund
Select US Long/Short Portfolio
MULTI-ASSET
All Market Income Portfolio
All Market Total Return Portfolio
Conservative Wealth Strategy
Emerging Markets Multi-Asset Portfolio
Global Risk Allocation Fund
Tax-Managed All Market Income Portfolio
CLOSED-END FUNDS
AllianceBernstein Global High Income Fund
AllianceBernstein National Municipal Income Fund
We also offer Government Money Market Portfolio, which serves as the money market fund exchange vehicle for the AB mutual funds. You could lose money by investing in the Fund. Although the Fund seeks to preserve the value of your investment at $1.00 per share, it cannot guarantee it will do so. The Fund may impose a fee upon sale of your shares or may temporarily suspend your ability to sell shares if the Fund’s liquidity falls below required minimums because of market conditions or other factors. An investment in the Fund is not insured or guaranteed by the Federal Deposit Insurance Corporation or any other government agency. The Fund’s sponsor has no legal obligation to provide financial support to the Fund, and you should not expect that the sponsor will provide financial support to the Fund at any time.
Investors should consider the investment objectives, risks, charges and expenses of the Fund carefully before investing. For copies of our prospectus or summary prospectus, which contain this and other information, visit us online at www.abfunds.com or contact your AB representative. Please read the prospectus and/or summary prospectus carefully before investing.
| | |
| |
| abfunds.com | | AB TAX-MANAGED ALL MARKET INCOME PORTFOLIO | 99 |
NOTES
| | |
| |
100 | AB TAX-MANAGED ALL MARKET INCOME PORTFOLIO | | abfunds.com |
AB TAX-MANAGED ALL MARKET INCOME PORTFOLIO
1345 Avenue of the Americas
New York, NY 10105
800 221 5672
TAMI-0152-0221 
FEB 02.28.21

SEMI-ANNUAL REPORT
AB TAX-MANAGED WEALTH APPRECIATION STRATEGY

As of January 1, 2021, as permitted by new regulations adopted by the Securities and Exchange Commission, the Fund’s annual and semi-annual shareholder reports are no longer sent by mail, unless you specifically requested paper copies of the reports. Instead, the reports are made available on a website, and you will be notified by mail each time a report is posted and provided with a website address to access the report.
You may elect to receive all future reports in paper form free of charge. If you invest through a financial intermediary, you can contact your financial intermediary to request that you continue to receive paper copies of your shareholder reports; if you invest directly with the Fund, you can call the Fund at (800) 221 5672. Your election to receive reports in paper form will apply to all funds held in your account with your financial intermediary or, if you invest directly, to all AB Mutual Funds you hold.
| | |
| |
| Investment Products Offered | | • Are Not FDIC Insured • May Lose Value • Are Not Bank Guaranteed |
Investors should consider the investment objectives, risks, charges and expenses of the Fund carefully before investing. For copies of our prospectus or summary prospectus, which contain this and other information, visit us online at www.abfunds.com or contact your AB representative. Please read the prospectus and/or summary prospectus carefully before investing.
This shareholder report must be preceded or accompanied by the Fund’s prospectus for individuals who are not current shareholders of the Fund.
You may obtain a description of the Fund’s proxy voting policies and procedures, and information regarding how the Fund voted proxies relating to portfolio securities during the most recent 12-month period ended June 30, without charge. Simply visit AB’s website at www.abfunds.com, or go to the Securities and Exchange Commission’s (the “Commission”) website at www.sec.gov, or call AB at (800) 227 4618.
The Fund files its complete schedule of portfolio holdings with the Commission for the first and third quarters of each fiscal year as an exhibit to its reports on Form N-PORT. The Fund’s Form N-PORT reports are available on the Commission’s website at www.sec.gov. The Fund’s Forms N-PORT may also be reviewed and copied at the Commission’s Public Reference Room in Washington, DC; information on the operation of the Public Reference Room may be obtained by calling (800) SEC 0330. AB publishes full portfolio holdings for the Fund monthly at www.abfunds.com.
AllianceBernstein Investments, Inc. (ABI) is the distributor of the AB family of mutual funds. ABI is a member of FINRA and is an affiliate of AllianceBernstein L.P., the Adviser of the funds.
The [A/B] logo is a registered service mark of AllianceBernstein and AllianceBernstein® is a registered service mark used by permission of the owner, AllianceBernstein L.P.
| | |
| FROM THE PRESIDENT | |  |
Dear Shareholder,
We’re pleased to provide this report for the AB Tax-Managed Wealth Appreciation Strategy (the “Fund”). Please review the discussion of Fund performance, the market conditions during the reporting period and the Fund’s investment strategy.
At AB, we’re striving to help our clients achieve better outcomes by:
| + | | Fostering diverse perspectives that give us a distinctive approach to navigating global capital markets |
| + | | Applying differentiated investment insights through a connected global research network |
| + | | Embracing innovation to design better ways to invest and leading-edge mutual-fund solutions |
Whether you’re an individual investor or a multibillion-dollar institution, we’re putting our knowledge and experience to work for you every day.
For more information about AB’s comprehensive range of products and shareholder resources, please log on to www.abfunds.com.
Thank you for your investment in AB mutual funds—and for placing your trust in our firm.
Sincerely,

Onur Erzan
President and Chief Executive Officer, AB Mutual Funds
| | |
| |
| abfunds.com | | AB TAX-MANAGED WEALTH APPRECIATION STRATEGY | 1 |
SEMI-ANNUAL REPORT
April 5, 2021
This report provides management’s discussion of fund performance for the AB Tax-Managed Wealth Appreciation Strategy for the semi-annual reporting period ended February 28, 2021.
The Fund’s investment objective is long-term growth of capital.
NAV RETURNS AS OF FEBRUARY 28, 2021 (unaudited)
| | | | | | | | |
| | |
| | | 6 Months | | | 12 Months | |
| | |
| AB TAX-MANAGED WEALTH APPRECIATION STRATEGY | | | | | | | | |
| | |
| Class A Shares | | | 13.36% | | | | 27.38% | |
| | |
| Class C Shares | | | 12.90% | | | | 26.38% | |
| | |
| Advisor Class Shares1 | | | 13.43% | | | | 27.62% | |
| | |
| MSCI ACWI (net) | | | 13.04% | | | | 30.25% | |
| 1 | Please note that this share class is for investors purchasing shares through accounts established under certain fee-based programs sponsored and maintained by certain broker-dealers and financial intermediaries, institutional pension plans and/or investment advisory clients of, and certain other persons associated with, the Adviser and its affiliates or the Fund. |
Please keep in mind that high, double-digit returns are highly unusual and cannot be sustained. Investors should also be aware that these returns were primarily achieved during favorable market conditions.
INVESTMENT RESULTS
The table above shows the Fund’s performance compared to its benchmark, the Morgan Stanley Capital International All Country World Index (“MSCI ACWI”) (net), for the six- and 12-month periods ended February 28, 2021.
During the six-month period, all share classes except Class C outperformed the benchmark, before sales charges. The Fund’s overweight allocations to US and international small-cap stocks were significant contributors, relative to the benchmark, and stock selection within industrials and financials contributed to performance, as market returns broadened to include companies that would benefit from economic reopening after the announcement of COVID-19 vaccines. Strong stock selection within emerging markets also contributed. Weaker sector selection from underweights to materials, energy and financials offset some of these gains.
All shares classes underperformed the benchmark during the 12-month period, before sales charges. Stock selection was the largest detractor, while sector and country selection had no material impact on returns, and currency selection was a small contributor. The Fund’s stock selection
| | |
| |
2 | AB TAX-MANAGED WEALTH APPRECIATION STRATEGY | | abfunds.com |
within the materials, information-technology and consumer-discretionary sectors detracted, as returns were very concentrated within stocks deemed as COVID-19 beneficiaries in this period, while stocks exposed to travel, such as energy producers and the aerospace complex, underperformed significantly.
The Fund did not use derivatives during either period.
MARKET REVIEW AND INVESTMENT STRATEGY
Following patterns seen in the prior six-month period, global equity markets continued to be driven by news surrounding the pandemic. US, international and emerging-market equities, supported by extensive monetary and fiscal stimulus, continued to recover from lows triggered by the COVID-19 pandemic and recorded positive returns for the six-month period ended February 28, 2021. Equity markets suffered a setback at the beginning of the period as volatility and style rotation, including a broad sell-off of mega-cap technology stocks, prevailed. Favorable news about the efficacy of potential coronavirus vaccines helped offset market volatility that was prompted by the continued spread of the virus in many countries, a potentially contested US presidential election and lack of additional US fiscal stimulus. Later in the period, global equity markets were supported by a significant decline in new cases, the acceleration of vaccine distribution and positive signs that a $1.9 trillion relief package would be approved—despite the emergence of seemingly more transmissible strains of the virus. As the period drew to a close, the emergence of inflationary fears, especially in the US, precipitated a sharp rise in long-term government bond yields and an accompanying correction in equities. Rising longer-term interest rates pressured the valuations of many market-leading technology and growth stocks, especially in the US, boosting a rotation into more cyclical and value-oriented stocks. For the semi-annual period, small-cap stocks substantially outperformed large-cap stocks on a relative basis, and periods of market rotation led large and small value-style stocks to outperform their growth-style peers.
The Fund’s Senior Investment Management Team (the “Team”) seeks improved equity risk control by utilizing the Adviser’s Strategic Equities services as the core equity allocation to US and international markets. This diversified exposure across equity markets and emphasis on a broad set of stocks, which includes companies with historical and projected stable earnings and higher profitability, eliminates the need for diversifiers to limit volatility. The Team believes this allocation offers the potential to achieve higher returns, with similar levels of volatility, increasing risk-adjusted returns in an all-equity service to meet the long-term growth goal—growth of capital.
| | |
| |
| abfunds.com | | AB TAX-MANAGED WEALTH APPRECIATION STRATEGY | 3 |
INVESTMENT POLICIES
The Fund invests primarily in equity securities, either directly or through underlying investment companies advised by the Adviser (“Underlying Portfolios”). A majority of the Fund’s assets are expected to be invested directly in US large-cap equity securities, primarily common stocks, in accordance with the Adviser’s US Strategic Equities investment strategy (“US Strategic Equities”), as described below. In addition, the Fund seeks to achieve exposure to international large-cap equity securities through investments in other registered investment companies advised by the Adviser, which may include International Strategic Equities Portfolio of Bernstein Fund, Inc. (“Bernstein International Strategic Equities Portfolio”). The Fund also invests in other Underlying Portfolios to efficiently gain exposure to certain other types of equity securities, including small- and mid-cap and emerging-market equity securities. An Underlying Portfolio is selected based on the segment of the equity market to which the Underlying Portfolio provides exposure, its investment philosophy, and how it complements and diversifies the Fund’s overall portfolio.
Under US Strategic Equities, portfolio managers of the Adviser that specialize in various investment disciplines identify high-conviction large-cap equity securities based on their fundamental investment research for potential investment by the Fund. These securities are then assessed in terms of both this fundamental research and quantitative analysis in creating the Fund’s portfolio. In applying the quantitative analysis, the Adviser considers a number of metrics that historically have provided some indication of favorable future returns, including metrics related to valuation, quality, investor behavior and corporate behavior.
Bernstein International Strategic Equities Portfolio focuses on investing in non-US large-cap and mid-cap equity securities. Bernstein International Strategic Equities Portfolio follows a strategy similar to US Strategic Equities, but in the international context.
Fluctuations in currency exchange rates can have a dramatic impact on the returns of foreign equity securities. The Adviser may employ currency hedging strategies in the Fund or the Underlying Portfolios, including the use of currency-related derivatives, to seek to reduce currency risk in the Fund or the Underlying Portfolios, but it is not required to do so.
The Fund seeks to maximize after-tax returns to shareholders by taking into account the tax impact of buy and sell investment decisions on its shareholders. For example, the Adviser may sell certain
(continued on next page)
| | |
| |
4 | AB TAX-MANAGED WEALTH APPRECIATION STRATEGY | | abfunds.com |
securities in order to realize capital losses. Capital losses may be used to offset realized capital gains. To minimize capital gains distributions, the Adviser may sell securities in the Fund with the highest cost basis. The Adviser may monitor the length of time the Fund has held an investment to evaluate whether the investment should be sold at a short-term gain or held for a longer period so that the gain on the investment will be taxed at the lower long-term rate. In making this decision, the Adviser considers whether, in its judgment, the risk of continued exposure to the investment is worth the tax savings of a lower capital gains rate. There can be no assurance that any of these strategies will be effective or that their use will not adversely affect the gross returns of the Fund.
| | |
| |
| abfunds.com | | AB TAX-MANAGED WEALTH APPRECIATION STRATEGY | 5 |
DISCLOSURES AND RISKS
Benchmark Disclosure
The MSCI ACWI is unmanaged and does not reflect fees and expenses associated with the active management of a mutual fund portfolio. The MSCI ACWI (net, free float-adjusted, market capitalization weighted) represents the equity market performance of developed and emerging markets. MSCI makes no express or implied warranties or representations, and shall have no liability whatsoever with respect to any MSCI data contained herein. The MSCI data may not be further redistributed or used as a basis for other indices, any securities or financial products. This report is not approved, reviewed or produced by MSCI. Net returns include the reinvestment of dividends after deduction of non-US withholding tax. An investor cannot invest directly in an index or average, and their results are not indicative of the performance for any specific investment, including the Fund.
A Word About Risk
Market Risk: The value of the Fund’s assets will fluctuate as the stock, bond or commodities markets fluctuate. The value of its investments may decline, sometimes rapidly and unpredictably, simply because of economic changes or other events, including public health crises (including the occurrence of a contagious disease or illness), that affect large portions of the market. It includes the risk that a particular style of investing, such as growth or value, may be underperforming the stock market generally.
Foreign (Non-US) Risk: The Fund’s investments in securities of non-US issuers may involve more risk than those of US issuers. These securities may fluctuate more widely in price and may be more difficult to trade due to adverse market, economic, political, regulatory or other factors.
Currency Risk: Fluctuations in currency exchange rates may negatively affect the value of the Fund’s investments or reduce its returns.
Emerging-Market Risk: Investments in emerging-market countries may have more risk because the markets are less developed and less liquid as well as being subject to increased economic, political, regulatory or other uncertainties.
Capitalization Risk: Investments in small- and mid-capitalization companies may be more volatile than investments in large-capitalization companies. Investments in small- and mid-capitalization companies may have additional risks because these companies have limited product lines, markets, or financial resources.
Investment in Other Investment Companies Risk: As with other investments, investments in other investment companies are subject to market and selection risk. In addition, shareholders of the Fund bear both
| | |
| |
6 | AB TAX-MANAGED WEALTH APPRECIATION STRATEGY | | abfunds.com |
DISCLOSURES AND RISKS (continued)
their proportionate share of expenses in the Fund (including management fees) and, indirectly, the expenses of the investment companies in which the Fund invests (to the extent these expenses are not waived or reimbursed by the Adviser).
Sector Risk: The Fund may have more risk because it may invest to a significant extent in one or more particular market sectors, such as the information-technology sector. To the extent it does so, market or economic factors affecting the relevant sector(s) could have a major effect on the value of the Fund’s investments.
Management Risk: The Fund is subject to management risk because it is an actively managed investment fund. The Adviser will apply its investment techniques and risk analyses in making investment decisions for the Fund, but there is no guarantee that its techniques will produce the intended results. Some of these techniques may incorporate, or rely upon, quantitative models, but there is no guarantee that these models will generate accurate forecasts, reduce risk or otherwise perform as expected. The Fund’s tax-management strategies may result in it forgoing performance in favor of tax benefits that may not materialize, or may result in pre-tax performance that is lower than that of funds that do not use tax-management strategies.
These risks are fully discussed in the Fund’s prospectus. As with all investments, you may lose money by investing in the Fund.
An Important Note About Historical Performance
The investment return and principal value of an investment in the Fund will fluctuate as the prices of the individual securities in which it invests fluctuate, so that your shares, when redeemed, may be worth more or less than their original cost. Performance shown in this report represents past performance and does not guarantee future results. Current performance may be lower or higher than the performance information shown. You may obtain performance information current to the most recent month-end by visiting www.abfunds.com. The performance shown for periods prior to July 14, 2017, is based on the Fund’s prior principal strategies and may not be representative of the Fund’s performance under its current principal strategies. Class B shares are no longer being offered. Effective November 7, 2019, all outstanding Class B shares were converted to Class A shares. Please see Note A for more information.
All fees and expenses related to the operation of the Fund have been deducted. Net asset value (“NAV”) returns do not reflect sales charges; if sales charges were reflected, the Fund’s quoted
| | |
| |
| abfunds.com | | AB TAX-MANAGED WEALTH APPRECIATION STRATEGY | 7 |
DISCLOSURES AND RISKS (continued)
performance would be lower. SEC returns reflect the applicable sales charges for each share class: a 4.25% maximum front-end sales charge for Class A shares and a 1% 1-year contingent deferred sales charge for Class C shares. Returns for the different share classes will vary due to different expenses associated with each class. Performance assumes reinvestment of distributions and does not account for taxes.
| | |
| |
8 | AB TAX-MANAGED WEALTH APPRECIATION STRATEGY | | abfunds.com |
HISTORICAL PERFORMANCE
AVERAGE ANNUAL RETURNS AS OF FEBRUARY 28, 2021 (unaudited)
| | | | | | | | |
| | |
| | | NAV Returns | | | SEC Returns
(reflects applicable
sales charges) | |
| | |
| CLASS A SHARES | | | | | | | | |
| | |
| 1 Year | | | 27.38% | | | | 22.00% | |
| | |
| 5 Years | | | 12.45% | | | | 11.48% | |
| | |
| 10 Years | | | 8.08% | | | | 7.61% | |
| | |
| CLASS C SHARES | | | | | | | | |
| | |
| 1 Year | | | 26.38% | | | | 25.38% | |
| | |
| 5 Years | | | 11.62% | | | | 11.62% | |
| | |
| 10 Years | | | 7.29% | | | | 7.29% | |
| | |
| ADVISOR CLASS SHARES1 | | | | | | | | |
| | |
| 1 Year | | | 27.62% | | | | 27.62% | |
| | |
| 5 Years | | | 12.73% | | | | 12.73% | |
| | |
| 10 Years | | | 8.36% | | | | 8.36% | |
The Fund’s current prospectus fee table shows the Fund’s total annual operating expense ratios as 1.38%, 2.13% and 1.13% for Class A, Class C and Advisor Class shares, respectively, gross of any fee waivers or expense reimbursements. Contractual fee waivers and/or expense reimbursement agreements reduced the Fund’s annual operating expense ratios to 1.02%, 1.77% and 0.77% for Class A, Class C and Advisor Class shares, respectively. These waivers/reimbursement agreements may not be terminated before December 31, 2021. Absent reimbursements or waivers, performance would have been lower. The net and gross expenses shown include the total operating expenses of the Fund and the indirect expenses of the Fund’s Underlying Portfolios, as based upon the allocation of the Fund’s assets among the Underlying Portfolios. The Financial Highlights section of this report sets forth expense ratio data for the current reporting period; the expense ratios shown above may differ from the expense ratios in the Financial Highlights section since they are based on different time periods.
| 1 | This share class is offered at NAV to eligible investors and the SEC returns are the same as the NAV returns. Please note that this share class is for investors purchasing shares through accounts established under certain fee-based programs sponsored and maintained by certain broker-dealers and financial intermediaries, institutional pension plans and/or investment advisory clients of, and certain other persons associated with, the Adviser and its affiliates or the Fund. |
| | |
| |
| abfunds.com | | AB TAX-MANAGED WEALTH APPRECIATION STRATEGY | 9 |
HISTORICAL PERFORMANCE (continued)
SEC AVERAGE ANNUAL RETURNS
AS OF THE MOST RECENT CALENDAR QUARTER-END
MARCH 31, 2021 (unaudited)
| | | | |
| |
| | | SEC Returns
(reflects applicable
sales charges) | |
| |
| CLASS A SHARES | | | | |
| |
| 1 Year | | | 46.99% | |
| |
| 5 Years | | | 10.80% | |
| |
| 10 Years | | | 8.02% | |
| |
| CLASS C SHARES | | | | |
| |
| 1 Year | | | 51.34% | |
| |
| 5 Years | | | 10.93% | |
| |
| 10 Years | | | 7.70% | |
| |
| ADVISOR CLASS SHARES1 | | | | |
| |
| 1 Year | | | 53.98% | |
| |
| 5 Years | | | 12.04% | |
| |
| 10 Years | | | 8.79% | |
| 1 | Please note that this share class is for investors purchasing shares through accounts established under certain fee-based programs sponsored and maintained by certain broker-dealers and financial intermediaries, institutional pension plans and/or investment advisory clients of, and certain other persons associated with, the Adviser and its affiliates or the Fund. |
| | |
| |
10 | AB TAX-MANAGED WEALTH APPRECIATION STRATEGY | | abfunds.com |
HISTORICAL PERFORMANCE (continued)
RETURNS AFTER TAXES ON DISTRIBUTIONS
AS OF THE MOST RECENT CALENDAR QUARTER-END
MARCH 31, 2021 (unaudited)
| | | | |
| |
| | | Returns | |
| |
| CLASS A SHARES | | | | |
| |
| 1 Year | | | 46.55 | % |
| |
| 5 Years | | | 9.35 | % |
| |
| 10 Years | | | 6.94 | % |
| |
| CLASS C SHARES | | | | |
| |
| 1 Year | | | 51.26 | % |
| |
| 5 Years | | | 9.75 | % |
| |
| 10 Years | | | 6.85 | % |
| |
| ADVISOR CLASS SHARES1 | | | | |
| |
| 1 Year | | | 53.43 | % |
| |
| 5 Years | | | 10.51 | % |
| |
| 10 Years | | | 7.64 | % |
RETURNS AFTER TAXES ON DISTRIBUTIONS AND SALE OF FUND SHARES
AS OF THE MOST RECENT CALENDAR QUARTER-END
MARCH 31, 2021 (unaudited)
| | | | |
| |
| | | Returns | |
| |
| CLASS A SHARES | | | | |
| |
| 1 Year | | | 27.96% | |
| |
| 5 Years | | | 8.17% | |
| |
| 10 Years | | | 6.18% | |
| |
| CLASS C SHARES | | | | |
| |
| 1 Year | | | 30.44% | |
| |
| 5 Years | | | 8.39% | |
| |
| 10 Years | | | 6.01% | |
| |
| ADVISOR CLASS SHARES1 | | | | |
| |
| 1 Year | | | 32.14% | |
| |
| 5 Years | | | 9.16% | |
| |
| 10 Years | | | 6.81% | |
| 1 | Please note that this share class is for investors purchasing shares through accounts established under certain fee-based programs sponsored and maintained by certain broker-dealers and financial intermediaries, institutional pension plans and/or investment advisory clients of, and certain other persons associated with, the Adviser and its affiliates or the Fund. |
| | |
| |
| abfunds.com | | AB TAX-MANAGED WEALTH APPRECIATION STRATEGY | 11 |
EXPENSE EXAMPLE
(unaudited)
As a shareholder of the Fund, you incur two types of costs: (1) transaction costs, including sales charges (loads) on purchase payments, contingent deferred sales charges on redemptions and (2) ongoing costs, including management fees; distribution (12b-1) fees; and other Fund expenses. This example is intended to help you understand your ongoing costs (in dollars) of investing in the Fund and to compare these costs with the ongoing costs of investing in other mutual funds.
The Example is based on an investment of $1,000 invested at the beginning of the period and held for the entire period as indicated below.
Actual Expenses
The table below provides information about actual account values and actual expenses. You may use the information, together with the amount you invested, to estimate the expenses that you paid over the period. Simply divide your account value by $1,000 (for example, an $8,600 account value divided by $1,000 = 8.6), then multiply the result by the number under the heading entitled “Expenses Paid During Period” to estimate the expenses you paid on your account during this period.
Hypothetical Example for Comparison Purposes
The table below also provides information about hypothetical account values and hypothetical expenses based on the Fund’s actual expense ratio and an assumed annual rate of return of 5% before expenses, which is not the Fund’s actual return. The hypothetical account values and expenses may not be used to estimate the actual ending account balance or expenses you paid for the period. You may use this information to compare the ongoing costs of investing in the Fund and other funds by comparing this 5% hypothetical example with the 5% hypothetical examples that appear in the shareholder reports of other funds.
Please note that the expenses shown in the table are meant to highlight your ongoing costs only and do not reflect any transactional costs, such as sales charges (loads), or contingent deferred sales charges on redemptions. Therefore, the hypothetical example is useful in comparing ongoing costs only, and will not help you determine the relative total costs of owning different funds. In addition, if these transactional costs were included, your costs would have been higher.
| | |
| |
12 | AB TAX-MANAGED WEALTH APPRECIATION STRATEGY | | abfunds.com |
EXPENSE EXAMPLE (continued)
| | | | | | | | | | | | | | | | | | | | | | | | |
| | | Beginning
Account
Value
September 1,
2020 | | | Ending
Account
Value
February 28,
2021 | | | Expenses
Paid
During
Period* | | | Annualized
Expense
Ratio* | | | Total
Expenses
Paid
During
Period+ | | | Total
Annualized
Expense
Ratio+ | |
| Class A | | | | | | | | | | | | | | | | | | | | | | | | |
Actual | | $ | 1,000 | | | $ | 1,133.60 | | | $ | 3.28 | | | | 0.62 | % | | $ | 5.34 | | | | 1.01 | % |
Hypothetical** | | $ | 1,000 | | | $ | 1,021.72 | | | $ | 3.11 | | | | 0.62 | % | | $ | 5.06 | | | | 1.01 | % |
| Class C | | | | | | | | | | | | | | | | | | | | | | | | |
Actual | | $ | 1,000 | | | $ | 1,129.00 | | | $ | 7.23 | | | | 1.37 | % | | $ | 9.29 | | | | 1.76 | % |
Hypothetical** | | $ | 1,000 | | | $ | 1,018.00 | | | $ | 6.85 | | | | 1.37 | % | | $ | 8.80 | | | | 1.76 | % |
| Advisor Class | | | | | | | | | | | | | | | | | | | | | | | | |
Actual | | $ | 1,000 | | | $ | 1,134.30 | | | $ | 1.96 | | | | 0.37 | % | | $ | 4.02 | | | | 0.76 | % |
Hypothetical** | | $ | 1,000 | | | $ | 1,022.96 | | | $ | 1.86 | | | | 0.37 | % | | $ | 3.81 | | | | 0.76 | % |
| * | Expenses are equal to the classes’ annualized expense ratios, multiplied by the average account value over the period, multiplied by 181/365 (to reflect the one-half year period). |
| ** | Assumes 5% annual return before expenses. |
| + | In connection with the Fund’s investments in affiliated/unaffiliated underlying portfolios, the Fund incurs no direct expenses, but bears proportionate shares of the fees and expenses (i.e., operating, administrative and investment advisory fees) of the affiliated/unaffiliated underlying portfolios. The Adviser has contractually agreed to waive its fees from the Fund in an amount equal to the Fund’s pro rata share of certain acquired fund fees and expenses of the affiliated underlying portfolios. The Fund’s total expenses are equal to the classes’ annualized expense ratio plus the Fund’s pro rata share of the weighted average expense ratio of the affiliated/unaffiliated underlying portfolios in which it invests, multiplied by the average account value over the period, multiplied by 181/365 (to reflect the one-half year period). |
| | |
| |
| abfunds.com | | AB TAX-MANAGED WEALTH APPRECIATION STRATEGY | 13 |
PORTFOLIO SUMMARY
February 28, 2021 (unaudited)
PORTFOLIO STATISTICS
Net Assets ($mil): $763.7
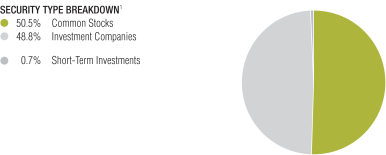
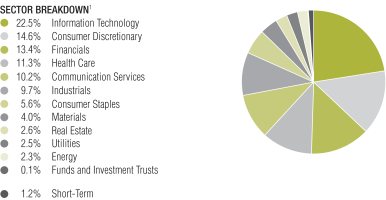
| 1 | All data are as of February 28, 2021. The Fund’s security type and sector breakdowns are expressed as a percentage of total investments and may vary over time. The Fund also enters into derivative transactions, which may be used for hedging or investment purposes (see “Portfolio of Investments” section of the report for additional details). Sectors shown include investments of Underlying Portfolios. |
Please note: The sector classifications presented herein are based on the Global Industry Classification Standard (GICS) which was developed by Morgan Stanley Capital International and Standard & Poor’s. The components are divided into sector, industry group, and industry sub-indices as classified by the GICS for each of the market capitalization indices in the broad market. These sector classifications are broadly defined. The “Portfolio of Investments” section of the report reflects more specific industry information and is consistent with the investment restrictions discussed in the Fund’s prospectus.
| | |
| |
14 | AB TAX-MANAGED WEALTH APPRECIATION STRATEGY | | abfunds.com |
PORTFOLIO OF INVESTMENTS
February 28, 2021 (unaudited)
| | | | | | | | |
| Company | | Shares | | | U.S. $ Value | |
| |
COMMON STOCKS – 50.5% | | | | | | | | |
Information Technology – 13.5% | | | | | | | | |
Communications Equipment – 0.2% | | | | | | | | |
Cisco Systems, Inc./Delaware | | | 18,435 | | | $ | 827,178 | |
F5 Networks, Inc.(a) | | | 2,205 | | | | 418,906 | |
| | | | | | | | |
| | | | | | | 1,246,084 | |
| | | | | | | | |
Electronic Equipment, Instruments & Components – 0.4% | | | | | | | | |
CDW Corp./DE | | | 20,234 | | | | 3,174,512 | |
| | | | | | | | |
|
IT Services – 3.0% | |
Automatic Data Processing, Inc. | | | 14,105 | | | | 2,454,552 | |
Booz Allen Hamilton Holding Corp. | | | 19,549 | | | | 1,508,010 | |
Genpact Ltd. | | | 90,917 | | | | 3,676,684 | |
PayPal Holdings, Inc.(a) | | | 17,527 | | | | 4,554,391 | |
Visa, Inc. – Class A | | | 50,990 | | | | 10,829,766 | |
| | | | | | | | |
| | | | | | | 23,023,403 | |
| | | | | | | | |
Semiconductors & Semiconductor Equipment – 3.0% | | | | | | | | |
KLA Corp. | | | 4,546 | | | | 1,414,851 | |
NVIDIA Corp. | | | 7,967 | | | | 4,370,537 | |
NXP Semiconductors NV | | | 26,674 | | | | 4,869,339 | |
QUALCOMM, Inc. | | | 43,920 | | | | 5,981,465 | |
Texas Instruments, Inc. | | | 22,265 | | | | 3,835,591 | |
Xilinx, Inc. | | | 18,516 | | | | 2,412,635 | |
| | | | | | | | |
| | | | | | | 22,884,418 | |
| | | | | | | | |
Software – 4.6% | |
Adobe, Inc.(a) | | | 6,667 | | | | 3,064,620 | |
Citrix Systems, Inc. | | | 16,833 | | | | 2,248,552 | |
Microsoft Corp. | | | 111,736 | | | | 25,965,212 | |
Oracle Corp. | | | 59,768 | | | | 3,855,634 | |
| | | | | | | | |
| | | | | | | 35,134,018 | |
| | | | | | | | |
Technology Hardware, Storage & Peripherals – 2.3% | | | | | | | | |
Apple, Inc. | | | 128,412 | | | | 15,571,239 | |
Western Digital Corp. | | | 29,034 | | | | 1,989,700 | |
| | | | | | | | |
| | | | | | | 17,560,939 | |
| | | | | | | | |
| | | | | | | 103,023,374 | |
| | | | | | | | |
Health Care – 6.9% | |
Biotechnology – 0.8% | |
Gilead Sciences, Inc. | | | 412 | | | | 25,297 | |
Regeneron Pharmaceuticals, Inc.(a) | | | 3,792 | | | | 1,708,561 | |
Vertex Pharmaceuticals, Inc.(a) | | | 18,898 | | | | 4,016,770 | |
| | | | | | | | |
| | | | | | | 5,750,628 | |
| | | | | | | | |
Health Care Equipment & Supplies – 2.2% | | | | | | | | |
Align Technology, Inc.(a) | | | 5,210 | | | | 2,954,643 | |
Edwards Lifesciences Corp.(a) | | | 46,200 | | | | 3,839,220 | �� |
Intuitive Surgical, Inc.(a) | | | 784 | | | | 577,652 | |
| | |
| |
| abfunds.com | | AB TAX-MANAGED WEALTH APPRECIATION STRATEGY | 15 |
PORTFOLIO OF INVESTMENTS (continued)
| | | | | | | | |
| Company | | Shares | | | U.S. $ Value | |
| |
Medtronic PLC | | | 58,894 | | | $ | 6,888,831 | |
Zimmer Biomet Holdings, Inc. | | | 15,967 | | | | 2,603,579 | |
| | | | | | | | |
| | | | | | | 16,863,925 | |
| | | | | | | | |
Health Care Providers & Services – 1.9% | | | | | | | | |
Anthem, Inc. | | | 15,523 | | | | 4,706,419 | |
UnitedHealth Group, Inc. | | | 30,656 | | | | 10,184,536 | |
| | | | | | | | |
| | | | | | | 14,890,955 | |
| | | | | | | | |
Pharmaceuticals – 2.0% | |
Johnson & Johnson | | | 18,582 | | | | 2,944,504 | |
Merck & Co., Inc. | | | 10,156 | | | | 737,529 | |
Pfizer, Inc. | | | 15,219 | | | | 509,684 | |
Roche Holding AG (Sponsored ADR) | | | 160,492 | | | | 6,596,221 | |
Viatris, Inc.(a) | | | 3,219 | | | | 47,802 | |
Zoetis, Inc. | | | 30,246 | | | | 4,695,389 | |
| | | | | | | | |
| | | | | | | 15,531,129 | |
| | | | | | | | |
| | | | | | | 53,036,637 | |
| | | | | | | | |
Consumer Discretionary – 6.8% | |
Auto Components – 0.6% | |
Magna International, Inc. – Class A (United States) | | | 50,674 | | | | 4,266,751 | |
| | | | | | | | |
|
Automobiles – 0.3% | |
Stellantis NV | | | 131,510 | | | | 2,154,134 | |
| | | | | | | | |
|
Distributors – 0.4% | |
LKQ Corp.(a) | | | 70,411 | | | | 2,773,489 | |
| | | | | | | | |
|
Diversified Consumer Services – 0.2% | |
Chegg, Inc.(a) | | | 18,228 | | | | 1,759,549 | |
| | | | | | | | |
|
Hotels, Restaurants & Leisure – 0.1% | |
Starbucks Corp. | | | 8,298 | | | | 896,433 | |
| | | | | | | | |
| | |
Internet & Direct Marketing Retail – 1.7% | | | | | | | | |
Amazon.com, Inc.(a) | | | 3,967 | | | | 12,269,653 | |
Booking Holdings, Inc.(a) | | | 442 | | | | 1,029,202 | |
| | | | | | | | |
| | | | | | | 13,298,855 | |
| | | | | | | | |
Specialty Retail – 2.3% | |
AutoZone, Inc.(a) | | | 4,111 | | | | 4,768,431 | |
Home Depot, Inc. (The) | | | 29,493 | | | | 7,619,221 | |
TJX Cos., Inc. (The) | | | 76,211 | | | | 5,029,164 | |
| | | | | | | | |
| | | | | | | 17,416,816 | |
| | | | | | | | |
Textiles, Apparel & Luxury Goods – 1.2% | | | | | | | | |
Deckers Outdoor Corp.(a) | | | 8,024 | | | | 2,616,707 | |
NIKE, Inc. – Class B | | | 50,290 | | | | 6,778,086 | |
| | | | | | | | |
| | | | | | | 9,394,793 | |
| | | | | | | | |
| | | | | | | 51,960,820 | |
| | | | | | | | |
| | |
| |
16 | AB TAX-MANAGED WEALTH APPRECIATION STRATEGY | | abfunds.com |
PORTFOLIO OF INVESTMENTS (continued)
| | | | | | | | |
| Company | | Shares | | | U.S. $ Value | |
| |
Communication Services – 6.4% | |
Diversified Telecommunication Services – 1.0% | | | | | | | | |
Comcast Corp. – Class A | | | 146,339 | | | $ | 7,714,992 | |
| | | | | | | | |
|
Entertainment – 1.0% | |
Electronic Arts, Inc. | | | 39,345 | | | | 5,271,049 | |
Take-Two Interactive Software, Inc.(a) | | | 11,195 | | | | 2,065,030 | |
Walt Disney Co. (The)(a) | | | 3,242 | | | | 612,868 | |
| | | | | | | | |
| | | | | | | 7,948,947 | |
| | | | | | | | |
Interactive Media & Services – 4.0% | |
Alphabet, Inc. – Class A(a) | | | 925 | | | | 1,870,267 | |
Alphabet, Inc. – Class C(a) | | | 8,729 | | | | 17,779,751 | |
Facebook, Inc. – Class A(a) | | | 40,962 | | | | 10,552,630 | |
| | | | | | | | |
| | | | | | | 30,202,648 | |
| | | | | | | | |
Wireless Telecommunication Services – 0.4% | | | | | | | | |
T-Mobile US, Inc.(a) | | | 24,726 | | | | 2,966,378 | |
| | | | | | | | |
| | | | | | | 48,832,965 | |
| | | | | | | | |
Financials – 5.9% | |
Banks – 3.0% | |
Bank of America Corp. | | | 264,259 | | | | 9,172,430 | |
Citigroup, Inc. | | | 63,421 | | | | 4,178,175 | |
JPMorgan Chase & Co. | | | 13,260 | | | | 1,951,474 | |
PNC Financial Services Group, Inc. (The) | | | 12,300 | | | | 2,070,828 | |
Wells Fargo & Co. | | | 158,310 | | | | 5,726,073 | |
| | | | | | | | |
| | | | | | | 23,098,980 | |
| | | | | | | | |
Capital Markets – 2.0% | |
CME Group, Inc. – Class A | | | 18,649 | | | | 3,724,205 | |
Goldman Sachs Group, Inc. (The) | | | 23,996 | | | | 7,666,242 | |
LPL Financial Holdings, Inc. | | | 27,099 | | | | 3,564,603 | |
S&P Global, Inc. | | | 957 | | | | 315,198 | |
| | | | | | | | |
| | | | | | | 15,270,248 | |
| | | | | | | | |
Insurance – 0.9% | |
Progressive Corp. (The) | | | 41,505 | | | | 3,567,355 | |
Reinsurance Group of America, Inc. – Class A | | | 23,072 | | | | 2,820,090 | |
| | | | | | | | |
| | | | | | | 6,387,445 | |
| | | | | | | | |
| | | | | | | 44,756,673 | |
| | | | | | | | |
Industrials – 4.8% | |
Aerospace & Defense – 0.5% | |
L3Harris Technologies, Inc. | | | 20,432 | | | | 3,716,785 | |
Raytheon Technologies Corp. | | | 2,765 | | | | 199,052 | |
| | | | | | | | |
| | | | | | | 3,915,837 | |
| | | | | | | | |
Airlines – 0.4% | |
Delta Air Lines, Inc.(a) | | | 5,165 | | | | 247,610 | |
Southwest Airlines Co. | | | 51,957 | | | | 3,020,261 | |
| | | | | | | | |
| | | | | | | 3,267,871 | |
| | | | | | | | |
| | |
| |
| abfunds.com | | AB TAX-MANAGED WEALTH APPRECIATION STRATEGY | 17 |
PORTFOLIO OF INVESTMENTS (continued)
| | | | | | | | |
| Company | | Shares | | | U.S. $ Value | |
| |
Building Products – 0.1% | |
Masco Corp. | | | 13,850 | | | $ | 737,097 | |
| | | | | | | | |
|
Construction & Engineering – 0.6% | |
AECOM(a) | | | 73,853 | | | | 4,275,350 | |
| | | | | | | | |
|
Electrical Equipment – 0.5% | |
Eaton Corp. PLC | | | 31,912 | | | | 4,154,623 | |
| | | | | | | | |
|
Industrial Conglomerates – 0.4% | |
Honeywell International, Inc. | | | 14,658 | | | | 2,966,046 | |
| | | | | | | | |
|
Machinery – 0.3% | |
Ingersoll Rand, Inc.(a) | | | 40,670 | | | | 1,884,648 | |
| | | | | | | | |
|
Professional Services – 0.3% | |
Robert Half International, Inc. | | | 32,091 | | | | 2,496,359 | |
| | | | | | | | |
|
Road & Rail – 1.2% | |
CSX Corp. | | | 49,635 | | | | 4,544,084 | |
Knight-Swift Transportation Holdings, Inc. | | | 78,845 | | | | 3,406,104 | |
Norfolk Southern Corp. | | | 5,172 | | | | 1,303,655 | |
| | | | | | | | |
| | | | | | | 9,253,843 | |
| | | | | | | | |
Trading Companies & Distributors – 0.5% | | | | | | | | |
United Rentals, Inc.(a) | | | 13,300 | | | | 3,955,154 | |
| | | | | | | | |
| | | | | | | 36,906,828 | |
| | | | | | | | |
Consumer Staples – 2.2% | |
Food & Staples Retailing – 1.1% | |
Costco Wholesale Corp. | | | 7,999 | | | | 2,647,669 | |
Walmart, Inc. | | | 46,273 | | | | 6,011,788 | |
| | | | | | | | |
| | | | | | | 8,659,457 | |
| | | | | | | | |
Household Products – 1.1% | |
Procter & Gamble Co. (The) | | | 65,148 | | | | 8,047,733 | |
| | | | | | | | |
| | | | | | | 16,707,190 | |
| | | | | | | | |
Real Estate – 1.4% | |
Equity Real Estate Investment Trusts (REITs) – 1.4% | | | | | | | | |
American Campus Communities, Inc. | | | 41,608 | | | | 1,704,264 | |
American Tower Corp. | | | 9,691 | | | | 2,094,516 | |
Americold Realty Trust | | | 31,154 | | | | 1,091,636 | |
CubeSmart | | | 17,687 | | | | 653,711 | |
Mid-America Apartment Communities, Inc. | | | 28,681 | | | | 3,864,191 | |
Prologis, Inc. | | | 15,294 | | | | 1,515,177 | |
| | | | | | | | |
| | | | | | | 10,923,495 | |
| | | | | | | | |
Real Estate Management & Development – 0.0% | | | | | | | | |
CBRE Group, Inc. – Class A(a) | | | 450 | | | | 34,096 | |
| | | | | | | | |
| | | | | | | 10,957,591 | |
| | | | | | | | |
| | |
| |
18 | AB TAX-MANAGED WEALTH APPRECIATION STRATEGY | | abfunds.com |
PORTFOLIO OF INVESTMENTS (continued)
| | | | | | | | |
| Company | | Shares | | | U.S. $ Value | |
| |
Utilities – 1.1% | |
Electric Utilities – 1.1% | |
American Electric Power Co., Inc. | | | 56,656 | | | $ | 4,240,702 | |
Edison International | | | 4,800 | | | | 259,152 | |
NextEra Energy, Inc. | | | 51,172 | | | | 3,760,118 | |
| | | | | | | | |
| | | | | | | 8,259,972 | |
| | | | | | | | |
Energy – 0.8% | |
Oil, Gas & Consumable Fuels – 0.8% | |
Chevron Corp. | | | 30,272 | | | | 3,027,200 | |
EOG Resources, Inc. | | | 48,109 | | | | 3,105,917 | |
| | | | | | | | |
| | | | | | | 6,133,117 | |
| | | | | | | | |
Materials – 0.7% | |
Chemicals – 0.7% | |
LyondellBasell Industries NV – Class A | | | 27,469 | | | | 2,831,779 | |
Westlake Chemical Corp. | | | 26,914 | | | | 2,303,570 | |
| | | | | | | | |
| | | | | | | 5,135,349 | |
| | | | | | | | |
Total Common Stocks
(cost $211,762,187) | | | | | | | 385,710,516 | |
| | | | | | | | |
| | | | | | | | |
INVESTMENT COMPANIES – 48.8% | |
Funds and Investment Trusts – 48.8%(b)(c) | | | | | | | | |
AB Discovery Growth Fund, Inc. – Class Z | | | 1,563,310 | | | | 25,200,552 | |
AB Trust – AB Discovery Value Fund – Class Z | | | 1,096,809 | | | | 25,292,421 | |
Bernstein Fund, Inc. – International Small Cap Portfolio – Class Z | | | 3,777,141 | | | | 46,383,293 | |
Bernstein Fund, Inc. – International Strategic Equities Portfolio – Class Z | | | 17,942,738 | | | | 235,229,291 | |
Bernstein Fund, Inc. – Small Cap Core Portfolio – Class Z | | | 1,286,134 | | | | 18,777,552 | |
Sanford C. Bernstein Fund, Inc. – Emerging Markets Portfolio – Class Z | | | 624,013 | | | | 21,422,366 | |
| | | | | | | | |
| | |
Total Investment Companies
(cost $335,319,515) | | | | | | | 372,305,475 | |
| | | | | | | | |
| | | | | | | | |
SHORT-TERM INVESTMENTS – 0.7% | |
Investment Companies – 0.7% | |
AB Fixed Income Shares, Inc. – Government Money Market Portfolio – Class AB, 0.01%(b)(c)(d)
(cost $5,661,916) | | | 5,661,916 | | | | 5,661,916 | |
| | | | | | | | |
| | |
Total Investments – 100.0%
(cost $552,743,618) | | | | | | | 763,677,907 | |
Other assets less liabilities – 0.0% | | | | | | | 18,683 | |
| | | | | | | | |
| | |
Net Assets – 100.0% | | | | | | $ | 763,696,590 | |
| | | | | | | | |
| | |
| |
| abfunds.com | | AB TAX-MANAGED WEALTH APPRECIATION STRATEGY | 19 |
PORTFOLIO OF INVESTMENTS (continued)
| (a) | Non-income producing security. |
| (b) | To obtain a copy of the fund’s shareholder report, please go to the Securities and Exchange Commission’s website at www.sec.gov, or call AB at (800) 227-4618. |
| (c) | Affiliated investments. |
| (d) | The rate shown represents the 7-day yield as of period end. |
Glossary:
ADR – American Depositary Receipt
REIT – Real Estate Investment Trust
See notes to financial statements.
| | |
| |
20 | AB TAX-MANAGED WEALTH APPRECIATION STRATEGY | | abfunds.com |
STATEMENT OF ASSETS & LIABILITIES
February 28, 2021 (unaudited)
| | | | |
| Assets | |
Investments in securities, at value | | | | |
Unaffiliated issuers (cost $211,762,187) | | $ | 385,710,516 | |
Affiliated issuers (cost $340,981,431) | | | 377,967,391 | |
Foreign currencies, at value (cost $99,632) | | | 103,252 | |
Receivable for shares of beneficial interest sold | | | 558,404 | |
Unaffiliated dividends receivable | | | 415,200 | |
Affiliated dividends receivable | | | 51 | |
Other assets | | | 10,586 | |
| | | | |
Total assets | | | 764,765,400 | |
| | | | |
| Liabilities | |
Payable for shares of beneficial interest redeemed | | | 380,074 | |
Payable for investment securities purchased | | | 325,917 | |
Advisory fee payable | | | 178,700 | |
Administrative fee payable | | | 28,230 | |
Transfer Agent fee payable | | | 13,835 | |
Distribution fee payable | | | 9,852 | |
Trustees’ fees payable | | | 6,141 | |
Dividends payable | | | 153 | |
Accrued expenses and other liabilities | | | 125,908 | |
| | | | |
Total liabilities | | | 1,068,810 | |
| | | | |
Net Assets | | $ | 763,696,590 | |
| | | | |
| Composition of Net Assets | |
Shares of beneficial interest, at par | | $ | 403 | |
Additional paid-in capital | | | 535,981,663 | |
Distributable earnings | | | 227,714,524 | |
| | | | |
| | $ | 763,696,590 | |
| | | | |
Net Asset Value Per Share—unlimited shares authorized, $.00001 par value
| | | | | | | | | | | | |
| Class | | Net Assets | | | Shares
Outstanding | | | Net Asset
Value | |
| |
| A | | $ | 42,500,476 | | | | 2,254,053 | | | $ | 18.86 | * |
| |
| C | | $ | 1,947,673 | | | | 104,232 | | | $ | 18.69 | |
| |
| Advisor | | $ | 719,248,441 | | | | 37,987,213 | | | $ | 18.93 | |
| |
| * | The maximum offering price per share for Class A shares was $19.70 which reflects a sales charge of 4.25%. |
See notes to financial statements.
| | |
| |
| abfunds.com | | AB TAX-MANAGED WEALTH APPRECIATION STRATEGY | 21 |
STATEMENT OF OPERATIONS
Six Months Ended February 28, 2021 (unaudited)
| | | | | | | | |
| Investment Income | | | | | | | | |
Dividends | | | | | | | | |
Affiliated issuers | | $ | 3,883,739 | | | | | |
Unaffiliated issuers (net of foreign taxes withheld of $6,703) | | | 2,609,629 | | | $ | 6,493,368 | |
| | | | | | | | |
| Expenses | | | | | | | | |
Advisory fee (see Note B) | | | 2,336,814 | | | | | |
Distribution fee—Class A | | | 50,263 | | | | | |
Distribution fee—Class C | | | 10,654 | | | | | |
Transfer agency—Class A | | | 3,724 | | | | | |
Transfer agency—Class C | | | 247 | | | | | |
Transfer agency—Advisor Class | | | 62,653 | | | | | |
Custody and accounting | | | 66,558 | | | | | |
Administrative | | | 36,219 | | | | | |
Registration fees | | | 29,948 | | | | | |
Audit and tax | | | 29,428 | | | | | |
Printing | | | 21,911 | | | | | |
Legal | | | 21,099 | | | | | |
Trustees’ fees | | | 13,667 | | | | | |
Miscellaneous | | | 15,255 | | | | | |
| | | | | | | | |
Total expenses | | | 2,698,440 | | | | | |
Less: expenses waived and reimbursed by the Adviser (see Note B) | | | (1,299,821 | ) | | | | |
| | | | | | | | |
Net expenses | | | | | | | 1,398,619 | |
| | | | | | | | |
Net investment income | | | | | | | 5,094,749 | |
| | | | | | | | |
| Realized and Unrealized Gain on Investment and Foreign Currency Transactions | | | | | | | | |
Net realized gain on: | | | | | | | | |
Affiliated Underlying Portfolios | | | | | | | 202,680 | |
Investment transactions | | | | | | | 16,405,236 | |
Foreign currency transactions | | | | | | | 58 | |
Net realized gain distributions from Affiliated Underlying Portfolios | | | | | | | 2,823,876 | |
Net change in unrealized appreciation/depreciation of: | | | | | | | | |
Affiliated Underlying Portfolios | | | | | | | 48,812,289 | |
Investments | | | | | | | 18,332,307 | |
| | | | | | | | |
Net gain on investment and foreign currency transactions | | | | | | | 86,576,446 | |
| | | | | | | | |
Net Increase in Net Assets from Operations | | | | | | $ | 91,671,195 | |
| | | | | | | | |
See notes to financial statements.
| | |
| |
22 | AB TAX-MANAGED WEALTH APPRECIATION STRATEGY | | abfunds.com |
STATEMENT OF CHANGES IN NET ASSETS
| | | | | | | | |
| | | Six Months Ended
February 28, 2021
(unaudited) | | | Year Ended
August 31,
2020 | |
| Increase in Net Assets from Operations | | | | | | | | |
Net investment income | | $ | 5,094,749 | | | $ | 9,483,742 | |
Net realized gain on investment and foreign currency transactions | | | 16,607,974 | | | | 4,772,783 | |
Net realized gain distributions from Affiliated Underlying Portfolios | | | 2,823,876 | | | | 1,582,338 | |
Net change in unrealized appreciation/depreciation of investments and foreign currency denominated assets and liabilities | | | 67,144,596 | | | | 61,897,482 | |
| | | | | | | | |
Net increase in net assets from operations | | | 91,671,195 | | | | 77,736,345 | |
Distributions to Shareholders | | | | | | | | |
Class A | | | (417,754 | ) | | | (1,818,152 | ) |
Class C | | | (4,650 | ) | | | (169,302 | ) |
Advisor Class | | | (8,582,765 | ) | | | (33,352,145 | ) |
| Transactions in Shares of Beneficial Interest | | | | | | | | |
Net decrease | | | (17,659,250 | ) | | | (41,164,215 | ) |
| | | | | | | | |
Total increase | | | 65,006,776 | | | | 1,232,531 | |
| Net Assets | | | | | | | | |
Beginning of period | | | 698,689,814 | | | | 697,457,283 | |
| | | | | | | | |
End of period | | $ | 763,696,590 | | | $ | 698,689,814 | |
| | | | | | | | |
See notes to financial statements.
| | |
| |
| abfunds.com | | AB TAX-MANAGED WEALTH APPRECIATION STRATEGY | 23 |
NOTES TO FINANCIAL STATEMENTS
February 28, 2021 (unaudited)
NOTE A
Significant Accounting Policies
The AB Portfolios (the “Company”) is registered under the Investment Company Act of 1940 as a diversified, open end management investment company. The Company, which is a Massachusetts Business Trust, operates as a series company currently comprised of six series. Each series is considered to be a separate entity for financial reporting and tax purposes. This report relates to the AB Tax-Managed Wealth Appreciation Strategy (the “Fund”). The Fund offers Class A, Class C and Advisor Class shares. Class B shares have been authorized but currently are not offered. Effective August 2, 2019, sales of Class B shares were suspended. On November 7, 2019, all remaining outstanding Class B shares of the Fund were converted to Class A shares. Class A shares are sold with a front-end sales charge of up to 4.25% for purchases not exceeding $1,000,000. With respect to purchases of $1,000,000 or more, Class A shares redeemed within one year of purchase may be subject to a contingent deferred sales charge of 1%. Class C shares are subject to a contingent deferred sales charge of 1% on redemptions made within the first year after purchase, and 0% after the first year of purchase. Class C shares will automatically convert to Class A shares ten years after the end of the calendar month of purchase. Advisor Class shares are sold without any initial or contingent deferred sales charge and are not subject to ongoing distribution expenses. All four classes of shares have identical voting, dividend, liquidation and other rights, except that the classes bear different distribution and transfer agency expenses. Each class has exclusive voting rights with respect to its distribution plan. The financial statements have been prepared in conformity with U.S. generally accepted accounting principles (“U.S. GAAP”), which require management to make certain estimates and assumptions that affect the reported amounts of assets and liabilities in the financial statements and amounts of income and expenses during the reporting period. Actual results could differ from those estimates. The Fund is an investment company under U.S. GAAP and follows the accounting and reporting guidance applicable to investment companies. The following is a summary of significant accounting policies followed by the Fund.
1. Security Valuation
Portfolio securities are valued at their current market value determined on the basis of market quotations or, if market quotations are not readily available or are deemed unreliable, at “fair value” as determined in accordance with procedures established by and under the general supervision of the Company’s Board of Trustees (the “Board”).
| | |
| |
24 | AB TAX-MANAGED WEALTH APPRECIATION STRATEGY | | abfunds.com |
NOTES TO FINANCIAL STATEMENTS (continued)
In general, the market values of securities which are readily available and deemed reliable are determined as follows: securities listed on a national securities exchange (other than securities listed on the NASDAQ Stock Market, Inc. (“NASDAQ”)) or on a foreign securities exchange are valued at the last sale price at the close of the exchange or foreign securities exchange. If there has been no sale on such day, the securities are valued at the last traded price from the previous day. Securities listed on more than one exchange are valued by reference to the principal exchange on which the securities are traded; securities listed only on NASDAQ are valued in accordance with the NASDAQ Official Closing Price; listed or over the counter (“OTC”) market put or call options are valued at the mid level between the current bid and ask prices. If either a current bid or current ask price is unavailable, AllianceBernstein L.P. (the “Adviser”) will have discretion to determine the best valuation (e.g., last trade price in the case of listed options); open futures are valued using the closing settlement price or, in the absence of such a price, the most recent quoted bid price. If there are no quotations available for the day of valuation, the last available closing settlement price is used; U.S. Government securities and any other debt instruments having 60 days or less remaining until maturity are generally valued at market by an independent pricing vendor, if a market price is available. If a market price is not available, the securities are valued at amortized cost. This methodology is commonly used for short term securities that have an original maturity of 60 days or less, as well as short term securities that had an original term to maturity that exceeded 60 days. In instances when amortized cost is utilized, the Valuation Committee (the “Committee”) must reasonably conclude that the utilization of amortized cost is approximately the same as the fair value of the security. Such factors the Committee will consider include, but are not limited to, an impairment of the creditworthiness of the issuer or material changes in interest rates. Fixed-income securities, including mortgage-backed and asset-backed securities, may be valued on the basis of prices provided by a pricing service or at a price obtained from one or more of the major broker-dealers. In cases where broker-dealer quotes are obtained, the Adviser may establish procedures whereby changes in market yields or spreads are used to adjust, on a daily basis, a recently obtained quoted price on a security. Swaps and other derivatives are valued daily, primarily using independent pricing services, independent pricing models using market inputs, as well as third party broker-dealers or counterparties. Open-end mutual funds are valued at the closing net asset value per share, while exchange traded funds are valued at the closing market price per share.
Securities for which market quotations are not readily available (including restricted securities) or are deemed unreliable are valued at fair value as deemed appropriate by the Adviser. Factors considered in making this
| | |
| |
| abfunds.com | | AB TAX-MANAGED WEALTH APPRECIATION STRATEGY | 25 |
NOTES TO FINANCIAL STATEMENTS (continued)
determination may include, but are not limited to, information obtained by contacting the issuer, analysts, analysis of the issuer’s financial statements or other available documents. In addition, the Fund may use fair value pricing for securities primarily traded in non-U.S. markets because most foreign markets close well before the Fund values its securities at 4:00 p.m., Eastern Time. The earlier close of these foreign markets gives rise to the possibility that significant events, including broad market moves, may have occurred in the interim and may materially affect the value of those securities. To account for this, the Fund generally values many of its foreign equity securities using fair value prices based on third party vendor modeling tools to the extent available.
2. Fair Value Measurements
In accordance with U.S. GAAP regarding fair value measurements, fair value is defined as the price that the Fund would receive to sell an asset or pay to transfer a liability in an orderly transaction between market participants at the measurement date. U.S. GAAP establishes a framework for measuring fair value, and a three-level hierarchy for fair value measurements based upon the transparency of inputs to the valuation of an asset or liability (including those valued based on their market values as described in Note A.1 above). Inputs may be observable or unobservable and refer broadly to the assumptions that market participants would use in pricing the asset or liability. Observable inputs reflect the assumptions market participants would use in pricing the asset or liability based on market data obtained from sources independent of the Fund. Unobservable inputs reflect the Fund’s own assumptions about the assumptions that market participants would use in pricing the asset or liability based on the best information available in the circumstances. Each investment is assigned a level based upon the observability of the inputs which are significant to the overall valuation. The three-tier hierarchy of inputs is summarized below.
| | • | | Level 1—quoted prices in active markets for identical investments |
| | • | | Level 2—other significant observable inputs (including quoted prices for similar investments, interest rates, prepayment speeds, credit risk, etc.) |
| | • | | Level 3—significant unobservable inputs (including the Fund’s own assumptions in determining the fair value of investments) |
The fair value of debt instruments, such as bonds, and over-the-counter derivatives is generally based on market price quotations, recently executed market transactions (where observable) or industry recognized modeling techniques and are generally classified as Level 2. Pricing vendor inputs to Level 2 valuations may include quoted prices for similar investments in active markets, interest rate curves, coupon rates, currency
| | |
| |
26 | AB TAX-MANAGED WEALTH APPRECIATION STRATEGY | | abfunds.com |
NOTES TO FINANCIAL STATEMENTS (continued)
rates, yield curves, option adjusted spreads, default rates, credit spreads and other unique security features in order to estimate the relevant cash flows which are then discounted to calculate fair values. If these inputs are unobservable and significant to the fair value, these investments will be classified as Level 3.
Where readily available market prices or relevant bid prices are not available for certain equity investments, such investments may be valued based on similar publicly traded investments, movements in relevant indices since last available prices or based upon underlying company fundamentals and comparable company data (such as multiples to earnings or other multiples to equity). Where an investment is valued using an observable input, such as another publicly traded security, the investment will be classified as Level 2. If management determines that an adjustment is appropriate based on restrictions on resale, illiquidity or uncertainty, and such adjustment is a significant component of the valuation, the investment will be classified as Level 3. An investment will also be classified as Level 3 where management uses company fundamentals and other significant inputs to determine the valuation.
The following table summarizes the valuation of the Fund’s investments by the above fair value hierarchy levels as of February 28, 2021:
| | | | | | | | | | | | | | | | |
Investments in
Securities: | | Level 1 | | | Level 2 | | | Level 3 | | | Total | |
Assets: | | | | | | | | | | | | | | | | |
Common Stocks(a) | | $ | 385,710,516 | | | $ | – 0 | – | | $ | – 0 | – | | $ | 385,710,516 | |
Investment Companies | | | 372,305,475 | | | | – 0 | – | | | – 0 | – | | | 372,305,475 | |
Short-Term Investments | | | 5,661,916 | | | | – 0 | – | | | – 0 | – | | | 5,661,916 | |
| | | | | | | | | | | | | | | | |
Total Investments in Securities | | | 763,677,907 | | | | – 0 | – | | | – 0 | – | | | 763,677,907 | |
Other Financial Instruments(b) | | | – 0 | – | | | – 0 | – | | | – 0 | – | | | – 0 | – |
| | | | | | | | | | | | | | | | |
Total | | $ | 763,677,907 | | | $ | – 0 | – | | $ | – 0 | – | | $ | 763,677,907 | |
| | | | | | | | | | | | | | | | |
| (a) | See Portfolio of Investments for sector classifications. |
| (b) | Other financial instruments are derivative instruments, such as futures, forwards and swaps, which are valued at the unrealized appreciation/(depreciation) on the instrument. Other financial instruments may also include swaps with upfront premiums, options written and swaptions written which are valued at market value. |
3. Currency Translation
Assets and liabilities denominated in foreign currencies and commitments under forward currency exchange contracts are translated into U.S. dollars at the mean of the quoted bid and ask prices of such currencies against the U.S. dollar. Purchases and sales of portfolio securities are translated into U.S. dollars at the rates of exchange prevailing when such securities
| | |
| |
| abfunds.com | | AB TAX-MANAGED WEALTH APPRECIATION STRATEGY | 27 |
NOTES TO FINANCIAL STATEMENTS (continued)
were acquired or sold. Income and expenses are translated into U.S. dollars at rates of exchange prevailing when accrued.
Net realized gain or loss on foreign currency transactions represents foreign exchange gains and losses from sales and maturities of foreign fixed income investments, holding of foreign currencies, currency gains or losses realized between the trade and settlement dates on foreign investment transactions, and the difference between the amounts of dividends, interest and foreign withholding taxes recorded on the Fund’s books and the U.S. dollar equivalent amounts actually received or paid. Net unrealized currency gains and losses from valuing foreign currency denominated assets and liabilities at period end exchange rates are reflected as a component of net unrealized appreciation or depreciation of foreign currency denominated assets and liabilities.
4. Taxes
It is the Fund’s policy to meet the requirements of the Internal Revenue Code applicable to regulated investment companies and to distribute all of its investment company taxable income and net realized gains, if any, to shareholders. Therefore, no provisions for federal income or excise taxes are required. The Fund may be subject to taxes imposed by countries in which it invests. Such taxes are generally based on income and/or capital gains earned or repatriated. Taxes are accrued and applied to net investment income, net realized gains and net unrealized appreciation/depreciation as such income and/or gains are earned.
In accordance with U.S. GAAP requirements regarding accounting for uncertainties in income taxes, management has analyzed the Fund’s tax positions taken or expected to be taken on federal and state income tax returns for all open tax years (the current and the prior three tax years) and has concluded that no provision for income tax is required in the Fund’s financial statements.
5. Investment Income and Investment Transactions
Dividend income is recorded on the ex-dividend date or as soon as the Fund is informed of the dividend. Investment gains or losses are determined on the identified cost basis. The Fund amortizes premiums and accretes discounts as adjustments to interest income. Interest income is accrued daily. Investment transactions are accounted for on the date the securities are purchased or sold. The Fund accounts for distributions received from REIT investments or from regulated investment companies as dividend income, realized gain, or return of capital based on information provided by the REIT or the investment company.
| | |
| |
28 | AB TAX-MANAGED WEALTH APPRECIATION STRATEGY | | abfunds.com |
NOTES TO FINANCIAL STATEMENTS (continued)
6. Class Allocations
All income earned and expenses incurred by the Fund are borne on a pro-rata basis by each outstanding class of shares, based on the proportionate interest in the Fund represented by the net assets of such class, except for class specific expenses which are allocated to the respective class. Expenses of the Company are charged proportionately to each series or based on other appropriate methods. Realized and unrealized gains and losses are allocated among the various share classes based on respective net assets.
7. Dividends and Distributions
Dividends and distributions to shareholders, if any, are recorded on the ex-dividend date. Income dividends and capital gains distributions are determined in accordance with federal tax regulations and may differ from those determined in accordance with U.S. GAAP. To the extent these differences are permanent, such amounts are reclassified within the capital accounts based on their federal tax basis treatment; temporary differences do not require such reclassification.
NOTE B
Advisory Fee and Other Transactions with Affiliates
Under the terms of the investment advisory agreement (the “Advisory Agreement”), the Fund pays the Adviser an advisory fee at an annual rate of .65% of the first $2.5 billion, .55% of the next $2.5 billion and .50% in excess of $5 billion of the Fund’s average daily net assets. The fee is accrued daily and paid monthly.
Pursuant to the investment advisory agreement, the Fund may reimburse the Adviser for certain legal and accounting services provided to the Fund by the Adviser. For the six months ended February 28, 2021, the reimbursement for such services amounted to $36,219.
The Fund compensates AllianceBernstein Investor Services, Inc. (“ABIS”), a wholly-owned subsidiary of the Adviser, under a Transfer Agency Agreement for providing personnel and facilities to perform transfer agency services for the Fund. ABIS may make payments to intermediaries that provide omnibus account services, sub-accounting services and/or networking services. Such compensation retained by ABIS amounted to $40,509 for the six months ended February 28, 2021.
AllianceBernstein Investments, Inc. (the “Distributor”), a wholly-owned subsidiary of the Adviser, serves as the distributor of the Fund’s shares. The Distributor has advised the Fund that it has retained front-end sales charges of $159 from the sale of Class A shares and received $0 and $12
| | |
| |
| abfunds.com | | AB TAX-MANAGED WEALTH APPRECIATION STRATEGY | 29 |
NOTES TO FINANCIAL STATEMENTS (continued)
in contingent deferred sales charges imposed upon redemptions by shareholders of Class A and Class C shares, respectively, for the six months ended February 28, 2021.
The Fund may invest in AB Government Money Market Portfolio (the “Government Money Market Portfolio”) which has a contractual annual advisory fee rate of .20% of the portfolio’s average daily net assets and bears its own expenses. The Adviser has contractually agreed to waive .10% of the advisory fee of Government Money Market Portfolio (resulting in a net advisory fee of .10%) until August 31, 2021. In connection with the investment by the Fund in Government Money Market Portfolio, the Adviser has contractually agreed to waive its advisory fee from the Fund in an amount equal to the Fund’s pro rata share of the effective advisory fee of Government Money Market Portfolio, as borne indirectly by the Fund as an acquired fund fee and expense. For the six months ended February 28, 2021, such waiver amounted to $1,260.
In connection with the Fund’s investments in other AB mutual funds, the Adviser has contractually agreed to waive fees and/or reimburse the expenses payable to the Adviser by the Fund in an amount equal to the Fund’s pro rata share of the effective advisory fees of AB mutual funds, as paid by the Fund as an acquired fund fee and expense. These fee waivers and/or expense reimbursements will remain in effect until December 31, 2021. For the six months ended February 28, 2021, such waivers and/or reimbursements amounted to $1,298,561.
A summary of the Fund’s transactions in AB mutual funds for the six months ended February 28, 2021 is as follows:
| | | | | | | | | | | | | | | | | | | | | | | | | | | | | | | | |
| | | | Distributions | |
| Fund | | Market
Value
8/31/20
(000) | | | Purchases
at Cost
(000) | | | Sales
Proceeds
(000) | | | Realized
Gain
(Loss)
(000) | | | Change in
Unrealized
Appr./
(Depr.)
(000) | | | Market
Value
2/28/21
(000) | | | Dividend
Income
(000) | | | Realized
Gains
(000) | |
Government Money Market Portfolio | | $ | 237 | | | $ | 52,138 | | | $ | 46,713 | | | $ | – 0 | – | | $ | – 0 | – | | $ | 5,662 | | | $ | 0 | * | | $ | – 0 | – |
AB Discovery Growth Fund, Inc. | | | 19,995 | | | | 4,300 | | | | 1,884 | | | | 542 | | | | 2,248 | | | | 25,201 | | | | 76 | | | | 2,824 | |
AB Trust – AB Discovery Value Fund | | | 16,342 | | | | 2,522 | | | | 1,121 | | | | (153 | ) | | | 7,702 | | | | 25,292 | | | | 196 | | | | – 0 | – |
Bernstein Fund, Inc.: | | | | | | | | | | | | | | | | | | | | | | | | | | | | | | | | |
International Small Cap Portfolio | | | 41,474 | | | | 529 | | | | 2,284 | | | | (58 | ) | | | 6,722 | | | | 46,383 | | | | 529 | | | | – 0 | – |
International Strategic Equities Portfolio | | | 136,733 | | | | 80,168 | † | | | 3,952 | | | | 171 | | | | 22,109 | | | | 235,229 | | | | 1,907 | | | | – 0 | – |
| | |
| |
30 | AB TAX-MANAGED WEALTH APPRECIATION STRATEGY | | abfunds.com |
NOTES TO FINANCIAL STATEMENTS (continued)
| | | | | | | | | | | | | | | | | | | | | | | | | | | | | | | | |
| | | | Distributions | |
| Fund | | Market
Value
8/31/20
(000) | | | Purchases
at Cost
(000) | | | Sales
Proceeds
(000) | | | Realized
Gain
(Loss)
(000) | | | Change in
Unrealized
Appr./
(Depr.)
(000) | | | Market
Value
2/28/21
(000) | | | Dividend
Income
(000) | | | Realized
Gains
(000) | |
Small Cap Core Portfolio | | $ | 19,085 | | | $ | 86 | | | $ | 5,312 | | | $ | (530 | ) | | $ | 5,449 | | | $ | 18,778 | | | $ | 86 | | | $ | – 0 | – |
Sanford C. Bernstein Fund, Inc.: | | | | | | | | | | | | | | | | | | | | | | | | | | | | | | | | |
Emerging Markets Portfolio | | | 18,561 | | | | 422 | | | | 2,134 | | | | 241 | | | | 4,332 | | | | 21,422 | | | | 422 | | | | – 0 | – |
Tax-Managed International Portfolio | | | 77,625 | | | | 668 | | | | 78,533 | † | | | (10 | ) | | | 250 | | | | – 0 | – | | | 668 | | | | – 0 | – |
| | | | | | | | | | | | | | | | | | | | | | | | | | | | | | | | |
Total | | | | | | | | | | | | | | $ | 203 | | | $ | 48,812 | | | $ | 377,967 | | | $ | 3,884 | | | $ | 2,824 | |
| | | | | | | | | | | | | | | | | | | | | | | | | | | | | | | | |
| † | Includes $77,442,511 of purchases / sales resulting from the merger of the Tax-Managed International Portfolio into the International Strategic Equities Portfolio, which took place on December 4, 2020. |
| * | Amount is less than $500. |
Brokerage commissions paid on investment transactions for the six months ended February 28, 2021 amounted to $24,945, of which $478 and $0, respectively, was paid to Sanford C. Bernstein & Co. LLC and Sanford C. Bernstein Limited, affiliates of the Adviser.
During the second quarter of 2018, AXA S.A. (“AXA”), a French holding company for the AXA Group, completed the sale of a minority stake in its subsidiary, AXA Equitable Holdings, Inc. (now named Equitable Holdings, Inc.)(“Equitable”), through an initial public offering. Equitable is the holding company for a diverse group of financial services companies, including an approximate 65% economic interest in the Adviser and a 100% interest in AllianceBernstein Corporation, the general partner of the Adviser. Since the initial sale, AXA has completed additional offerings, most recently during the fourth quarter of 2019. As a result, AXA currently owns less than 10% of the outstanding shares of common stock of Equitable, and no longer owns a controlling interest in Equitable. AXA previously announced its intention to sell its entire interest in Equitable over time, subject to market conditions and other factors (the “Plan”). Most of AXA’s remaining Equitable shares are to be delivered on redemption of AXA bonds mandatorily exchangeable into Equitable shares and maturing in May 2021. AXA retains sole discretion to determine the timing of any future sales of its remaining shares of Equitable common stock.
Sales under the Plan that were completed on November 13, 2019 resulted in the indirect transfer of a “controlling block” of voting securities of the Adviser (a “Change of Control Event”) and may have been deemed to have been an “assignment” causing a termination of the Fund’s investment advisory and administration agreements. In order to ensure that investment advisory and administration services could continue uninterrupted in the event of a Change
| | |
| |
| abfunds.com | | AB TAX-MANAGED WEALTH APPRECIATION STRATEGY | 31 |
NOTES TO FINANCIAL STATEMENTS (continued)
of Control Event, the Board previously approved new investment advisory and administration agreements with the Adviser, and shareholders of the Fund subsequently approved the new investment advisory agreement. These agreements became effective on November 13, 2019.
NOTE C
Distribution Plan
The Fund has adopted a Plan for each class of shares of the Fund pursuant to Rule 12b-1 under the Investment Company Act of 1940 (the “Plan”). Under the Plan, the Fund pays distribution and servicing fees to the Distributor at an annual rate of up to .50% of the Fund’s average daily net assets attributable to Class A shares and 1% of the Fund’s average daily net assets attributable to Class C shares. There are no distribution and servicing fees on the Advisor Class shares. The fees are accrued daily and paid monthly. Payments under the Plan in respect of Class A shares are currently limited to an annual rate of .25% of Class A shares’ average daily net assets. The Plan provides that the Distributor will use such payments in their entirety for distribution assistance and promotional activities. The Fund is not obligated under the Plan to pay any distribution services fee in excess of the amounts set forth above. The purpose of the payments to the Distributor under the Plan is to compensate the Distributor for its distribution services with respect to the sale of the Fund’s shares. Since the Distributor’s compensation is not directly tied to its expenses, the amount of compensation received by it under the Plan during any year may be more or less than its actual expenses. For this reason, the Plan is characterized by the staff of the Securities and Exchange Commission as being of the “compensation” plan.
In the event that the Plan is terminated or not continued, no distribution services fees (other than current amounts accrued but not yet paid) would be owed by the Fund to the Distributor with respect to the relevant class. The Plan also provides that the Adviser may use its own resources to finance the distribution of the Fund’s shares.
NOTE D
Investment Transactions
Purchases and sales of investment securities (excluding short-term investments) for the six months ended February 28, 2021 were as follows:
| | | | | | | | |
| | | Purchases | | | Sales | |
Investment securities (excluding U.S. government securities) | | $ | 80,766,346 | | | $ | 101,653,682 | |
U.S. government securities | | | – 0 | – | | | – 0 | – |
| | |
| |
32 | AB TAX-MANAGED WEALTH APPRECIATION STRATEGY | | abfunds.com |
NOTES TO FINANCIAL STATEMENTS (continued)
The cost of investments for federal income tax purposes was substantially the same as the cost for financial reporting purposes. Accordingly, gross unrealized appreciation and unrealized depreciation are as follows:
| | | | |
Gross unrealized appreciation | | $ | 211,477,237 | |
Gross unrealized depreciation | | | (542,948 | ) |
| | | | |
Net unrealized appreciation | | $ | 210,934,289 | |
| | | | |
1. Derivative Financial Instruments
The Fund may use derivatives in an effort to earn income and enhance returns, to replace more traditional direct investments, to obtain exposure to otherwise inaccessible markets (collectively, “investment purposes”), or to hedge or adjust the risk profile of its portfolio.
The Fund did not engage in derivatives transactions for the six months ended February 28, 2021.
2. Currency Transactions
The Fund may invest in non-U.S. Dollar-denominated securities on a currency hedged or unhedged basis. The Fund may seek investment opportunities by taking long or short positions in currencies through the use of currency-related derivatives, including forward currency exchange contracts, futures and options on futures, swaps, and other options. The Fund may enter into transactions for investment opportunities when it anticipates that a foreign currency will appreciate or depreciate in value but securities denominated in that currency are not held by the Fund and do not present attractive investment opportunities. Such transactions may also be used when the Adviser believes that it may be more efficient than a direct investment in a foreign currency-denominated security. The Fund may also conduct currency exchange contracts on a spot basis (i.e., for cash at the spot rate prevailing in the currency exchange market for buying or selling currencies).
| | |
| |
| abfunds.com | | AB TAX-MANAGED WEALTH APPRECIATION STRATEGY | 33 |
NOTES TO FINANCIAL STATEMENTS (continued)
NOTE E
Shares of Beneficial Interest
Transactions in shares of beneficial interest for each class were as follows:
| | | | | | | | | | | | | | | | | | | | | | | | |
| | | | | | | | | | | | | | | | | | | | | | | | |
| | | Shares | | | | | | Amount | | | | |
| | | Six Months Ended
February 28, 2021
(unaudited) | | | Year Ended
August 31,
2020 | | | | | | Six Months Ended
February 28, 2021
(unaudited) | | | Year Ended
August 31,
2020 | | | | |
| | | | | | | | |
| Class A | | | | | |
Shares sold | | | 26,164 | | | | 27,520 | | | | | | | $ | 454,155 | | | $ | 435,509 | | | | | |
| | | | | |
Shares issued in reinvestment of dividends and distributions | | | 20,852 | | | | 99,482 | | | | | | | | 371,580 | | | | 1,626,540 | | | | | |
| | | | | |
Shares converted from Class B | | | – 0 | – | | | 13,839 | | | | | | | | – 0 | – | | | 230,023 | | | | | |
| | | | | |
Shares converted from Class C | | | 23,930 | | | | 71,358 | | | | | | | | 407,440 | | | | 1,119,363 | | | | | |
| | | | | |
Shares redeemed | | | (135,727 | ) | | | (250,404 | ) | | | | | | | (2,385,567 | ) | | | (3,791,428 | ) | | | | |
| | | | | |
Net decrease | | | (64,781 | ) | | | (38,205 | ) | | | | | | $ | (1,152,392 | ) | | $ | (379,993 | ) | | | | |
| | | | | |
| | | | | | | | | | | | | | | | | | | | | | | | |
| Class B | | | | | |
Shares sold | | | – 0 | – | | | 6 | | | | | | | $ | – 0 | – | | $ | 143 | | | | | |
| | | | | |
Shares converted to Class A | | | – 0 | – | | | (13,939 | ) | | | | | | | – 0 | – | | | (230,023 | ) | | | | |
| | | | | |
Net decrease | | | – 0 | – | | | (13,933 | ) | | | | | | $ | – 0 | – | | $ | (229,880 | ) | | | | |
| | | | | |
| | | | | | | | | | | | | | | | | | | | | | | | |
| Class C | | | | | |
Shares sold | | | 1,118 | | | | 5,268 | | | | | | | $ | 19,620 | | | $ | 83,473 | | | | | |
| | | | | |
Shares issued in reinvestment of dividends and distributions | | | 251 | | | | 9,401 | | | | | | | | 4,436 | | | | 152,481 | | | | | |
| | | | | |
Shares converted to Class A | | | (24,255 | ) | | | (72,274 | ) | | | | | | | (407,440 | ) | | | (1,119,363 | ) | | | | |
| | | | | |
Shares redeemed | | | (18,350 | ) | | | (89,780 | ) | | | | | | | (338,576 | ) | | | (1,317,146 | ) | | | | |
| | | | | |
Net decrease | | | (41,236 | ) | | | (147,385 | ) | | | | | | $ | (721,960 | ) | | $ | (2,200,555 | ) | | | | |
| | | | | |
| | | | | | | | | | | | | | | | | | | | | | | | |
| Advisor Class | | | | | |
Shares sold | | | 1,405,471 | | | | 3,039,670 | | | | | | | $ | 25,329,361 | | | $ | 47,527,142 | | | | | |
| | | | | |
Shares issued in reinvestment of dividends and distributions | | | 429,733 | | | | 1,891,323 | | | | | | | | 7,687,922 | | | | 31,017,696 | | | | | |
| | | | | |
Shares redeemed | | | (2,744,909 | ) | | | (7,712,813 | ) | | | | | | | (48,802,181 | ) | | | (116,898,625 | ) | | | | |
| | | | | |
Net decrease | | | (909,705 | ) | | | (2,781,820 | ) | | | | | | $ | (15,784,898 | ) | | $ | (38,353,787 | ) | | | | |
| | | | | |
| | |
| |
34 | AB TAX-MANAGED WEALTH APPRECIATION STRATEGY | | abfunds.com |
NOTES TO FINANCIAL STATEMENTS (continued)
NOTE F
Risks Involved in Investing in the Fund
Market Risk—The value of the Fund’s assets will fluctuate as the stock, bond or commodities markets fluctuate. The value of its investments may decline, sometimes rapidly and unpredictably, simply because of economic changes or other events, including public health crises (including the occurrence of a contagious disease or illness), that affect large portions of the market. It includes the risk that a particular style of investing, such as growth or value, may be underperforming the stock market generally.
Foreign (Non-U.S.) Risk—The Fund’s investments in securities of non-U.S. issuers may involve more risk than those of U.S. issuers. These securities may fluctuate more widely in price and may be more difficult to trade due to adverse market, economic, political, regulatory or other factors.
Currency Risk—Fluctuations in currency exchange rates may negatively affect the value of the Fund’s investments or reduce its returns.
Emerging Market Risk—Investments in emerging market countries may have more risk because the markets are less developed and less liquid as well as being subject to increased economic, political, regulatory or other uncertainties.
Capitalization Risk—Investments in small- and mid-capitalization companies may be more volatile than investments in large-capitalization companies. Investments in small- and mid-capitalization companies may have additional risks because these companies have limited product lines, markets or financial resources.
Investment in Other Investment Companies Risk—As with other investments, investments in other investment companies are subject to market and selection risk. In addition, shareholders of the Fund bear both their proportionate share of expenses in the Fund (including management fees) and, indirectly, the expenses of the investment companies in which the Fund invests (to the extent these expenses are not waived or reimbursed by the Adviser).
Sector Risk—The Fund may have more risk because it may invest to a significant extent in one or more particular market sectors, such as the information technology sector. To the extent it does so, market or economic factors affecting the relevant sector(s) could have a major effect on the value of the Fund’s investments.
LIBOR Transition and Associated Risk—A Fund may invest in debt securities, derivatives or other financial instruments that utilize the London
| | |
| |
| abfunds.com | | AB TAX-MANAGED WEALTH APPRECIATION STRATEGY | 35 |
NOTES TO FINANCIAL STATEMENTS (continued)
Interbank Offered Rate, or “LIBOR,” as a “benchmark” or “reference rate” for various interest rate calculations. The United Kingdom Financial Conduct Authority, which regulates LIBOR, will cease publishing certain LIBOR benchmarks at the end of 2021. Although certain LIBOR rates are intended to be published until June 2023, banks are strongly encouraged to cease entering into agreements with counterparties referencing LIBOR by the end of 2021. Although financial regulators and industry working groups have suggested alternative reference rates, such as the European Interbank Offer Rate, the Sterling Overnight Interbank Average Rate and the Secured Overnight Financing Rate, global consensus on alternative rates is lacking and the process for amending existing contracts or instruments to transition away from LIBOR is underway but remains incomplete. The elimination of LIBOR or changes to other reference rates or any other changes or reforms to the determination or supervision of reference rates could have an adverse impact on the market for, or value of, any securities or payments linked to those reference rates, which may adversely affect a Fund’s performance and/or net asset value. Uncertainty and risk also remain regarding the willingness and ability of issuers and lenders to include revised provisions in new and existing contracts or instruments. Consequently, the transition away from LIBOR to other reference rates may lead to increased volatility and illiquidity in markets that are tied to LIBOR, fluctuations in values of LIBOR-related investments or investments in issuers that utilize LIBOR, increased difficulty in borrowing or refinancing and diminished effectiveness of hedging strategies, potentially adversely affecting a Fund’s performance. Furthermore, the risks associated with the expected discontinuation of LIBOR and transition may be exacerbated if the work necessary to effect an orderly transition to an alternative reference rate is not completed in a timely manner. Because the usefulness of LIBOR as a benchmark could deteriorate during the transition period, these effects could occur prior to the end of 2021.
Indemnification Risk—In the ordinary course of business, the Fund enters into contracts that contain a variety of indemnifications. The Fund’s maximum exposure under these arrangements is unknown. However, the Fund has not had prior claims or losses pursuant to these indemnification provisions and expects the risk of loss thereunder to be remote. Therefore, the Fund has not accrued any liability in connection with these indemnification provisions.
Management Risk—The Fund is subject to management risk because it is an actively-managed investment fund. The Adviser will apply its investment techniques and risk analyses in making investment decisions for the Fund, but there is no guarantee that its techniques will produce the intended results. Some of these techniques may incorporate, or rely upon, quantitative models, but there is no guarantee that these models will
| | |
| |
36 | AB TAX-MANAGED WEALTH APPRECIATION STRATEGY | | abfunds.com |
NOTES TO FINANCIAL STATEMENTS (continued)
generate accurate forecasts, reduce risk or otherwise perform as expected. The Fund’s tax-management strategies may result in it forgoing performance in favor of tax benefits that may not materialize, or may result in pre-tax performance that is lower than that of funds that do not use tax-management strategies.
NOTE G
Joint Credit Facility
A number of open-end mutual funds managed by the Adviser, including the Fund, participate in a $325 million revolving credit facility (the “Facility”) intended to provide short-term financing, if necessary, subject to certain restrictions in connection with abnormal redemption activity. Commitment fees related to the Facility are paid by the participating funds and are included in miscellaneous expenses in the statement of operations. The Fund did not utilize the Facility during the six months ended February 28, 2021.
NOTE H
Distributions to Shareholders
The tax character of distributions to be paid for the year ending August 31, 2021 will be determined at the end of the current fiscal year. The tax character of distributions paid during the fiscal years ended August 31, 2020 and August 31, 2019 were as follows:
| | | | | | | | |
| | | 2020 | | | 2019 | |
Distributions paid from: | | | | | | | | |
Ordinary income | | $ | 12,291,441 | | | $ | 8,819,847 | |
Net long-term capital gains | | | 23,048,158 | | | | 24,665,652 | |
| | | | | | | | |
Total taxable distributions paid | | $ | 35,339,599 | | | $ | 33,485,499 | |
| | | | | | | | |
As of August 31, 2020, the components of accumulated earnings/(deficit) on a tax basis were as follows:
| | | | |
Undistributed capital gains | | $ | 1,526,204 | |
Unrealized appreciation/(depreciation) | | | 143,522,294 | (a) |
| | | | |
Total accumulated earnings/(deficit) | | $ | 145,048,498 | |
| | | | |
| (a) | The difference between book-basis and tax-basis unrealized appreciation/(depreciation) is attributable primarily to the tax deferral of losses on wash sales. |
For tax purposes, net realized capital losses may be carried over to offset future capital gains, if any. Funds are permitted to carry forward capital losses for an indefinite period, and such losses will retain their character as either short-term or long-term capital losses. As of August 31, 2020, the Fund did not have any capital loss carryforwards.
| | |
| |
| abfunds.com | | AB TAX-MANAGED WEALTH APPRECIATION STRATEGY | 37 |
NOTES TO FINANCIAL STATEMENTS (continued)
NOTE I
Subsequent Events
As of February 28, 2021, Class C shares will automatically convert to Class A shares ten years after the end of the calendar month of their original purchase. Effective May 31, 2021, Class C shares will automatically convert to Class A shares after eight years instead of ten years.
Management has evaluated subsequent events for possible recognition or disclosure in the financial statements through the date the financial statements are issued. Management has determined that there are no other material events that would require disclosure in the Fund’s financial statements through this date.
| | |
| |
38 | AB TAX-MANAGED WEALTH APPRECIATION STRATEGY | | abfunds.com |
FINANCIAL HIGHLIGHTS
Selected Data For A Share Of Beneficial Interest Outstanding Throughout Each Period
| | | | | | | | | | | | | | | | | | | | | | | | |
| | | Class A | |
| | | Six Months
Ended
February 28,
2021 (unaudited) | | | Year Ended August 31, | |
| | | 2020 | | | 2019 | | | 2018 | | | 2017 | | | 2016 | |
| | | | |
Net asset value, beginning of period | | | $ 16.81 | | | | $ 15.66 | | | | $ 16.76 | | | | $ 16.85 | | | | $ 15.08 | | | | $ 15.41 | |
| | | | |
Income From Investment Operations | | | | | | | | | | | | | | | | | | | | | | | | |
| | | | | | |
Net investment income(a)(b) | | | .10 | | | | .18 | | | | .20 | | | | .18 | | | | .42 | | | | .17 | |
| | | | | | |
Net realized and unrealized gain (loss) on investment and foreign currency transactions | | | 2.14 | | | | 1.75 | | | | (.57 | ) | | | 1.78 | | | | 1.78 | | | | .60 | |
| | | | | | |
Contributions from Affiliates | | | – 0 | – | | | – 0 | – | | | – 0 | – | | | – 0 | – | | | – 0 | – | | | .00 | (c) |
| | | | |
Net increase (decrease) in net asset value from
operations | | | 2.24 | | | | 1.93 | | | | (.37 | ) | | | 1.96 | | | | 2.20 | | | | .77 | |
| | | | |
Less: Dividends and Distributions | | | | | | | | | | | | | | | | | | | | | | | | |
| | | | | | |
Dividends from net investment income | | | (.15 | ) | | | (.33 | ) | | | (.16 | ) | | | (.39 | ) | | | (.29 | ) | | | (.16 | ) |
| | | | | | |
Distributions from net realized gain on investment transactions | | | (.04 | ) | | | (.45 | ) | | | (.57 | ) | | | (1.66 | ) | | | (.14 | ) | | | (.94 | ) |
| | | | |
Total dividends and
distributions | | | (.19 | ) | | | (.78 | ) | | | (.73 | ) | | | (2.05 | ) | | | (.43 | ) | | | (1.10 | ) |
| | | | |
Net asset value, end of
period | | | $ 18.86 | | | | $ 16.81 | | | | $ 15.66 | | | | $ 16.76 | | | | $ 16.85 | | | | $ 15.08 | |
| | | | |
| | | | | | |
Total Return | | | | | | | | | | | | | | | | | | | | | | | | |
| | | | | | |
Total investment return
based on net asset
value(d)* | | | 13.36 | % | | | 12.44 | % | | | (1.66 | )% | | | 12.13 | % | | | 14.98 | % | | | 5.23 | % |
| | | | | | |
Ratios/Supplemental Data | | | | | | | | | | | | | | | | | | | | | | | | |
| | | | | | |
Net assets, end of period
(000’s omitted) | | | $42,500 | | | | $38,983 | | | | $36,908 | | | | $39,519 | | | | $39,479 | | | | $32,398 | |
| | | | | | |
Ratio to average net assets
of: | | | | | | | | | | | | | | | | | | | | | | | | |
| | | | | | |
Expenses, net of waivers/reimbursements(e)‡ | | | .62 | %^ | | | .63 | % | | | .63 | % | | | .62 | % | | | .88 | % | | | .93 | % |
| | | | | | |
Expenses, before waivers/reimbursements(e)‡ | | | .98 | %^ | | | .99 | % | | | .99 | % | | | 1.00 | % | | | 1.01 | % | | | 1.01 | % |
| | | | | | |
Net investment income(b) | | | 1.18 | %^ | | | 1.15 | % | | | 1.30 | % | | | 1.05 | % | | | 2.70 | % | | | 1.16 | % |
| | | | | | |
Portfolio turnover rate | | | 11 | % | | | 21 | % | | | 19 | % | | | 25 | % | | | 112 | % | | | 47 | % |
| | | | | | | | | | | | | | | | | | | | | | | | |
| |
‡ Expense ratios exclude the estimated acquired fund fees of the affiliated/unaffiliated underlying | |
portfolios | | | .39 | %^ | | | .39 | % | | | .39 | % | | | .40 | % | | | .23 | % | | | .23 | % |
See footnote summary on page 42.
| | |
| |
| abfunds.com | | AB TAX-MANAGED WEALTH APPRECIATION STRATEGY | 39 |
FINANCIAL HIGHLIGHTS (continued)
Selected Data For A Share Of Beneficial Interest Outstanding Throughout Each Period
| | | | | | | | | | | | | | | | | | | | | | | | |
| | | Class C | |
| | | Six Months
Ended
February 28,
2021 (unaudited) | | | Year Ended August 31, | |
| | | 2020 | | | 2019 | | | 2018 | | | 2017 | | | 2016 | |
| | | | |
Net asset value, beginning of period | | | $ 16.59 | | | | $ 15.44 | | | | $ 16.47 | | | | $ 16.55 | | | | $ 14.82 | | | | $ 15.15 | |
| | | | |
Income From Investment Operations | | | | | | | | | | | | | | | | | | | | | | | | |
| | | | | | |
Net investment income(a)(b) | | | .04 | | | | .09 | | | | .08 | | | | .05 | | | | .27 | | | | .06 | |
| | | | | | |
Net realized and unrealized gain (loss) on investment and foreign currency transactions | | | 2.10 | | | | 1.69 | | | | (.54 | ) | | | 1.75 | | | | 1.78 | | | | .59 | |
| | | | | | |
Contributions from Affiliates | | | – 0 | – | | | – 0 | – | | | – 0 | – | | | – 0 | – | | | – 0 | – | | | .00 | (c) |
| | | | |
Net increase (decrease) in net asset value from
operations | | | 2.14 | | | | 1.78 | | | | (.46 | ) | | | 1.80 | | | | 2.05 | | | | .65 | |
| | | | |
Less: Dividends and Distributions | | | | | | | | | | | | | | | | | | | | | | | | |
| | | | | | |
Dividends from net investment income | | | – 0 | – | | | (.18 | ) | | | – 0 | – | | | (.22 | ) | | | (.18 | ) | | | (.04 | ) |
| | | | | | |
Distributions from net realized gain on investment transactions | | | (.04 | ) | | | (.45 | ) | | | (.57 | ) | | | (1.66 | ) | | | (.14 | ) | | | (.94 | ) |
| | | | |
Total dividends and
distributions | | | (.04 | ) | | | (.63 | ) | | | (.57 | ) | | | (1.88 | ) | | | (.32 | ) | | | (.98 | ) |
| | | | |
Net asset value, end of
period | | | $ 18.69 | | | | $ 16.59 | | | | $ 15.44 | | | | $ 16.47 | | | | $ 16.55 | | | | $ 14.82 | |
| | | | |
| | | | | | |
Total Return | | | | | | | | | | | | | | | | | | | | | | | | |
| | | | | | |
Total investment return
based on net asset
value(d)* | | | 12.90 | % | | | 11.63 | % | | | (2.42 | )% | | | 11.31 | % | | | 14.09 | % | | | 4.44 | % |
| | | | | | |
Ratios/Supplemental Data | | | | | | | | | | | | | | | | | | | | | | | | |
| | | | | | |
Net assets, end of period (000’s omitted) | | | $1,948 | | | | $2,413 | | | | $4,522 | | | | $8,577 | | | | $9,373 | | | | $14,380 | |
| | | | | | |
Ratio to average net assets
of: | | | | | | | | | | | | | | | | | | | | | | | | |
| | | | | | |
Expenses, net of waivers/reimbursements(e)‡ | | | 1.37 | %^ | | | 1.38 | % | | | 1.38 | % | | | 1.38 | % | | | 1.65 | % | | | 1.68 | % |
| | | | | | |
Expenses, before waivers/reimbursements(e)‡ | | | 1.74 | %^ | | | 1.74 | % | | | 1.74 | % | | | 1.75 | % | | | 1.76 | % | | | 1.76 | % |
| | | | | | |
Net investment income(b) | | | .45 | %^ | | | .58 | % | | | .53 | % | | | .32 | % | | | 1.78 | % | | | .42 | % |
| | | | | | |
Portfolio turnover rate | | | 11 | % | | | 21 | % | | | 19 | % | | | 25 | % | | | 112 | % | | | 47 | % |
| | | | | | | | | | | | | | | | | | | | | | | | |
| |
‡ Expense ratios exclude the estimated acquired fund fees of the affiliated/unaffiliated underlying | |
portfolios | | | .39 | %^ | | | .39 | % | | | .39 | % | | | .40 | % | | | .23 | % | | | .23 | % |
See footnote summary on page 42.
| | |
| |
40 | AB TAX-MANAGED WEALTH APPRECIATION STRATEGY | | abfunds.com |
FINANCIAL HIGHLIGHTS (continued)
Selected Data For A Share Of Beneficial Interest Outstanding Throughout Each Period
| | | | | | | | | | | | | | | | | | | | | | | | |
| | | Advisor Class | |
| | | Six Months
Ended
February 28,
2021 (unaudited) | | | Year Ended August 31, | |
| | | 2020 | | | 2019 | | | 2018 | | | 2017 | | | 2016 | |
| | | | |
Net asset value, beginning of period | | | $ 16.90 | | | | $ 15.73 | | | | $ 16.84 | | | | $ 16.92 | | | | $ 15.14 | | | | $ 15.47 | |
| | | | |
Income From Investment Operations | | | | | | | | | | | | | | | | | | | | | | | | |
| | | | | | |
Net investment income(a)(b) | | | .13 | | | | .22 | | | | .24 | | | | .21 | | | | .45 | | | | .21 | |
| | | | | | |
Net realized and unrealized gain (loss) on investment and foreign currency transactions | | | 2.13 | | | | 1.77 | | | | (.58 | ) | | | 1.80 | | | | 1.80 | | | | .61 | |
| | | | | | |
Contributions from Affiliates | | | – 0 | – | | | – 0 | – | | | – 0 | – | | | – 0 | – | | | – 0 | – | | | .00 | (c) |
| | | | |
Net increase (decrease) in net asset value from operations | | | 2.26 | | | | 1.99 | | | | (.34 | ) | | | 2.01 | | | | 2.25 | | | | .82 | |
| | | | |
Less: Dividends and Distributions | | | | | | | | | | | | | | | | | | | | | | | | |
| | | | | | |
Dividends from net investment income | | | (.19 | ) | | | (.37 | ) | | | (.20 | ) | | | (.43 | ) | | | (.33 | ) | | | (.21 | ) |
| | | | | | |
Distributions from net realized gain on investment transactions | | | (.04 | ) | | | (.45 | ) | | | (.57 | ) | | | (1.66 | ) | | | (.14 | ) | | | (.94 | ) |
| | | | |
Total dividends and distributions | | | (.23 | ) | | | (.82 | ) | | | (.77 | ) | | | (2.09 | ) | | | (.47 | ) | | | (1.15 | ) |
| | | | |
Net asset value, end of period | | | $ 18.93 | | | | $ 16.90 | | | | $ 15.73 | | | | $ 16.84 | | | | $ 16.92 | | | | $ 15.14 | |
| | | | |
| | | | | | |
Total Return | | | | | | | | | | | | | | | | | | | | | | | | |
| | | | | | |
Total investment return based on net asset value(d)* | | | 13.43 | % | | | 12.78 | % | | | (1.44 | )% | | | 12.41 | % | | | 15.27 | % | | | 5.50 | % |
| | | | | | |
Ratios/Supplemental Data | | | | | | | | | | | | | | | | | | | | | | | | |
| | | | | | |
Net assets, end of period (000’s omitted) | | | $719,249 | | | | $657,294 | | | | $655,810 | | | | $700,240 | | | | $638,666 | | | | $639,602 | |
| | | | | | |
Ratio to average net assets of: | | | | | | | | | | | | | | | | | | | | | | | | |
| | | | | | |
Expenses, net of waivers/reimbursements(e)‡ | | | .37 | %^ | | | .38 | % | | | .38 | % | | | .38 | % | | | .64 | % | | | .68 | % |
| | | | | | |
Expenses, before waivers/reimbursements(e)‡ | | | .73 | %^ | | | .74 | % | | | .74 | % | | | .75 | % | | | .76 | % | | | .76 | % |
| | | | | | |
Net investment income(b) | | | 1.43 | %^ | | | 1.41 | % | | | 1.51 | % | | | 1.28 | % | | | 2.89 | % | | | 1.41 | % |
| | | | | | |
Portfolio turnover rate | | | 11 | % | | | 21 | % | | | 19 | % | | | 25 | % | | | 112 | % | | | 47 | % |
| | | | | | | | | | | | | | | | | | | | | | | | |
| |
‡ Expense ratios exclude the estimated acquired fund fees of the affiliated/unaffiliated underlying | |
portfolios | | | .39 | %^ | | | .39 | % | | | .39 | % | | | .40 | % | | | .23 | % | | | .23 | % |
See footnote summary on page 42.
| | |
| |
| abfunds.com | | AB TAX-MANAGED WEALTH APPRECIATION STRATEGY | 41 |
FINANCIAL HIGHLIGHTS (continued)
Selected Data For A Share Of Beneficial Interest Outstanding Throughout Each Period
| (a) | Based on average shares outstanding. |
| (b) | Net of expenses waived/reimbursed by the Adviser. |
| (c) | Amount is less than $.005. |
| (d) | Total investment return is calculated assuming an initial investment made at the net asset value at the beginning of the period, reinvestment of all dividends and distributions at net asset value during the period, and redemption on the last day of the period. Initial sales charges or contingent deferred sales charges are not reflected in the calculation of total investment return. Total return does not reflect the deduction of taxes that a shareholder would pay on fund distributions or the redemption of fund shares. Total investment return calculated for a period of less than one year is not annualized. |
| (e) | In connection with the Fund’s investments in affiliated underlying portfolios, the Fund incurs no direct expenses, but bears proportionate shares of the fees and expenses (i.e., operating, administrative and investment advisory fees) of the affiliated underlying portfolios. The Adviser has contractually agreed to waive its fees from the Fund in an amount equal to the Fund’s pro rata share of certain acquired fund fees and expenses, and for the six months ended February 28, 2021 and the years ended August 31, 2020, August 31, 2019, August 31, 2018 and August 31, 2017, such waiver amounted to .36% (annualized), .36%, .36%, .37% and .12%, respectively. |
| * | Includes the impact of proceeds received and credited to the Fund resulting from class action settlements, which enhanced the Fund’s performance for the years ended August 31, 2018, August 31, 2017 and August 31, 2016 by .02%, .02% and .01%, respectively. |
See notes to financial statements.
| | |
| |
42 | AB TAX-MANAGED WEALTH APPRECIATION STRATEGY | | abfunds.com |
TRUSTEES
| | |
Marshall C. Turner, Jr.(1),
Chairman Jorge A. Bermudez(1) Michael J. Downey(1) Onur Erzan*, President and Chief Executive Officer | | Nancy P. Jacklin(1) Jeanette W. Loeb(1) Carol C. McMullen(1) Garry L. Moody(1) Earl D. Weiner(1) |
OFFICERS
| | |
Ding Liu(2), Vice President Nelson Yu(2), Vice President Emilie D. Wrapp, Clerk Michael B. Reyes, Senior Analyst Joseph J. Mantineo, Treasurer and Chief Financial Officer | | Phyllis J. Clarke, Controller and Chief Accounting Officer Vincent S. Noto, Chief Compliance Officer |
| | |
Custodian and Accounting Agent State Street Bank and Trust Company State Street Corporation CCB/5 1 Iron Street Boston, MA 02210 Principal Underwriter AllianceBernstein Investments, Inc. 1345 Avenue of the Americas New York, NY 10105 Legal Counsel Seward & Kissel LLP One Battery Park Plaza New York, NY 10004 | | Transfer Agent AllianceBernstein Investor Services, Inc. P.O. Box 786003 San Antonio, TX 78278-6003 Toll-Free (800) 221-5672 Independent Registered Public Accounting Firm Ernst & Young LLP 5 Times Square New York, NY 10036 |
| 1 | Member of the Audit Committee, the Governance and Nominating Committee and the Independent Directors Committee. |
| 2 | The day-to-day management of, and investment decisions for, the Fund’s portfolio are made by the Adviser’s Multi-Asset Solutions Team. Messrs. Liu and Yu are the investment professionals primarily responsible for the day-to-day management of the Fund’s portfolio. |
| * | Mr. Robert M. Keith retired as President, Chief Executive Officer and a Director of the Fund as of March 31, 2021. Mr. Onur Erzan, Senior Vice President and Head of the Global Client Group of the Adviser, has been elected President, Chief Executive Officer and a Director of the Fund, effective April 1, 2021. |
| | |
| |
| abfunds.com | | AB TAX-MANAGED WEALTH APPRECIATION STRATEGY | 43 |
Operation and Effectiveness of the Fund’s Liquidity Risk Management Program:
In October 2016, the Securities and Exchange Commission (“SEC”) adopted the open-end fund liquidity rule (the “Liquidity Rule”). In June 2018 the SEC adopted a requirement that funds disclose information about the operation and effectiveness of their Liquidity Risk Management Program (“LRMP”) in their reports to shareholders.
One of the requirements of the Liquidity Rule is for the Fund to designate an Administrator of the Fund’s Liquidity Risk Management Program. The Administrator of the Fund’s LRMP is AllianceBernstein L.P., the Fund’s investment adviser (the “Adviser”). The Adviser has delegated the responsibility to its Liquidity Risk Management Committee (the “Committee”).
Another requirement of the Liquidity Rule is for the Fund’s Board of Trustees (the “Fund Board”) to receive an annual written report from the Administrator of the LRMP, which addresses the operation of the Fund’s LRMP and assesses its adequacy and effectiveness. The Adviser provided the Fund Board with such annual report during the first quarter of 2021, which covered the period January 1, 2020 through December 31, 2020 (the “Program Reporting Period”).
The LRMP’s principal objectives include supporting the Fund’s compliance with limits on investments in illiquid assets and mitigating the risk that the Fund will be unable to meet its redemption obligations in a timely manner.
Pursuant to the LRMP, the Fund classifies the liquidity of its portfolio investments into one of the four categories defined by the SEC: Highly Liquid, Moderately Liquid, Less Liquid, and Illiquid. These classifications are reported to the SEC on Form N-PORT.
During the Program Reporting Period, the Committee reviewed whether the Fund’s strategy is appropriate for an open-end structure, incorporating any holdings of less liquid and illiquid assets. If the Fund participated in derivative transactions, the exposure from such transactions were considered in the LRMP.
The Committee also performed an analysis to determine whether the Fund is required to maintain a Highly Liquid Investment Minimum (“HLIM”). The Committee also incorporated the following information when determining the Fund’s reasonably anticipated trading size for purposes of liquidity monitoring: historical net redemption activity, a Fund’s concentration in an issuer, shareholder concentration, investment performance, total net assets, and distribution channels.
The Adviser informed the Fund Board that the Committee believes the Fund’s LRMP is adequately designed, has been implemented as intended,
| | |
| |
44 | AB TAX-MANAGED WEALTH APPRECIATION STRATEGY | | abfunds.com |
and has operated effectively since its inception. No material exceptions have been noted since the implementation of the LRMP. During the Program Reporting Period, beginning in March 2020, all financial markets experienced extreme levels of price volatility and relative illiquidity resulting from the COVID-19 impacts on the global economy. This extreme relative illiquidity resulted in significantly wider bid-ask spreads to transact in securities, including many of those securities held by the Fund, and in a diminished depth of liquidity in most markets, to varying degrees. Nonetheless, there were no liquidity events that impacted the Fund or its ability to timely meet redemptions during the Program Reporting Period.
| | |
| |
| abfunds.com | | AB TAX-MANAGED WEALTH APPRECIATION STRATEGY | 45 |
Information Regarding the Review and Approval of the Fund’s Advisory Agreement
The disinterested trustees (the “directors”) of The AB Portfolios (the “Company”) unanimously approved the continuance of the Company’s Advisory Agreement with the Adviser in respect of AB Tax-Managed Wealth Appreciation Strategy (the “Fund”) at a meeting held by video conference on May 5-7, 2020 (the “Meeting”).
Prior to approval of the continuance of the Advisory Agreement, the directors had requested from the Adviser, and received and evaluated, extensive materials. They reviewed the proposed continuance of the Advisory Agreement with the Adviser and with experienced counsel who are independent of the Adviser, who advised on the relevant legal standards. The directors also reviewed additional materials, including comparative analytical data prepared by the Senior Analyst for the Fund. The directors also discussed the proposed continuance in private sessions with counsel.
The directors considered their knowledge of the nature and quality of the services provided by the Adviser to the Fund gained from their experience as directors or trustees of most of the registered investment companies advised by the Adviser, their overall confidence in the Adviser’s integrity and competence they have gained from that experience, the Adviser’s initiative in identifying and raising potential issues with the directors and its responsiveness, frankness and attention to concerns raised by the directors in the past, including the Adviser’s willingness to consider and implement organizational and operational changes designed to improve investment results and the services provided to the AB Funds. The directors noted that they have four regular meetings each year, at each of which they review extensive materials and information from the Adviser, including information on the investment performance of the Fund, and the underlying funds advised by the Adviser in which the Fund invests.
The directors also considered all factors they believed relevant, including the specific matters discussed below. During the course of their deliberations, the directors evaluated, among other things, the reasonableness of the advisory fee. The directors did not identify any particular information that was all-important or controlling, and different directors may have attributed different weights to the various factors. The directors determined that the selection of the Adviser to manage the Fund and the overall arrangements between the Fund and the Adviser, as provided in the Advisory Agreement, including the advisory fee, were fair and reasonable in light of the services performed, expenses incurred and such other matters as the directors considered relevant in the exercise of their business judgment. The material factors and conclusions that formed the basis for the directors’ determinations included the following:
Nature, Extent and Quality of Services Provided
The directors considered the scope and quality of services provided by the Adviser under the Advisory Agreement, including the quality of the investment
| | |
| |
46 | AB TAX-MANAGED WEALTH APPRECIATION STRATEGY | | abfunds.com |
research capabilities of the Adviser and the other resources it has dedicated to performing services for the Fund. The directors noted that the Adviser from time to time reviews the Fund’s investment strategies and from time to time proposes changes intended to improve the Fund’s relative or absolute performance for the directors’ consideration. They also noted the professional experience and qualifications of the Fund’s portfolio management team and other senior personnel of the Adviser. The directors also considered that the Advisory Agreement provides that the Fund will reimburse the Adviser for the cost to it of providing certain clerical, accounting, administrative and other services to the Fund by employees of the Adviser or its affiliates. Requests for these reimbursements are made on a quarterly basis and subject to approval by the directors. Reimbursements, to the extent requested and paid, result in a higher rate of total compensation from the Fund to the Adviser than the fee rate stated in the Advisory Agreement. The directors noted that the methodology used to determine the reimbursement amounts had been reviewed by an independent consultant retained by the Fund’s former Senior Officer/Independent Compliance Officer. The quality of administrative and other services, including the Adviser’s role in coordinating the activities of the Fund’s other service providers, also was considered. The directors concluded that, overall, they were satisfied with the nature, extent and quality of services provided to the Fund under the Advisory Agreement.
Costs of Services Provided and Profitability
The directors reviewed a schedule of the revenues and expenses and related notes indicating the profitability of the Fund to the Adviser for calendar years 2018 and 2019 that had been prepared with an expense allocation methodology arrived at in consultation with an independent consultant retained by the Fund’s former Senior Officer/Independent Compliance Officer. The directors noted the assumptions and methods of allocation used by the Adviser in preparing fund-specific profitability data and understood that there are a number of potentially acceptable allocation methodologies for information of this type. The directors noted that the profitability information reflected all revenues and expenses of the Adviser’s relationship with the Fund, including those relating to its subsidiaries that provide transfer agency, distribution and brokerage services to the Fund. The directors recognized that it is difficult to make comparisons of the profitability of the Advisory Agreement with the profitability of fund advisory contracts for unaffiliated funds because comparative information is not generally publicly available and is affected by numerous factors. The directors focused on the profitability of the Adviser’s relationship with the Fund before taxes and distribution expenses. The directors concluded that the Adviser’s level of profitability from its relationship with the Fund was not unreasonable.
Fall-Out Benefits
The directors considered the other benefits to the Adviser and its affiliates from their relationships with the Fund and the underlying funds advised by
| | |
| |
| abfunds.com | | AB TAX-MANAGED WEALTH APPRECIATION STRATEGY | 47 |
the Adviser in which the Fund invests, including, but not limited to, benefits relating to soft dollar arrangements (whereby investment advisers receive brokerage and research services from brokers that execute agency transactions for their clients); 12b-1 fees and sales charges received by the Fund’s principal underwriter (which is a wholly owned subsidiary of the Adviser) in respect of certain classes of the Fund’s shares; brokerage commissions paid by the Fund to brokers affiliated with the Adviser; and transfer agency fees paid by the Fund to a wholly owned subsidiary of the Adviser. The directors recognized that the Adviser’s profitability would be somewhat lower without these benefits. The directors understood that the Adviser also might derive reputational and other benefits from its association with the Fund.
Investment Results
In addition to the information reviewed by the directors in connection with the Meeting, the directors receive detailed performance information for the Fund at each regular Board meeting during the year.
At the Meeting, the directors reviewed performance information prepared by an independent service provider (the “15(c) service provider”), showing the performance of the Class A Shares of the Fund against a group of similar funds (“peer group”) and a larger group of similar funds (“peer universe”), each selected by the 15(c) service provider, and information prepared by the Adviser showing performance of the Class A Shares against a broad-based securities market index, in each case for the 1-, 3-, 5- and 10-year periods ended February 29, 2020 and (in the case of comparisons with the broad-based securities market index) for the period from inception. Based on their review, the directors concluded that the Fund’s investment performance was acceptable.
Advisory Fees and Other Expenses
The directors considered the advisory fee rate payable by the Fund to the Adviser and information prepared by the 15(c) service provider concerning advisory fee rates payable by other funds in the same category as the Fund. The directors recognized that it is difficult to make comparisons of advisory fees because there are variations in the services that are included in the fees paid by other funds. The directors compared the Fund’s contractual effective advisory fee rate with a peer group median and took into account the impact on the advisory fee rate of the administrative expense reimbursement paid to the Adviser in the latest fiscal year.
The directors also considered the Adviser’s fee schedule for other clients utilizing investment strategies similar to those of the Fund. For this purpose, they reviewed the relevant advisory fee information from the Adviser’s Form ADV and in a report from the Fund’s Senior Analyst and noted the differences between the Fund’s fee schedule, on the one hand, and the Adviser’s institutional fee schedule, on the other. The directors noted that
| | |
| |
48 | AB TAX-MANAGED WEALTH APPRECIATION STRATEGY | | abfunds.com |
the Adviser may, in some cases, agree to fee rates with large institutional clients that are lower than those reviewed by the directors and that they had previously discussed with the Adviser its policies in respect of such arrangements. The directors previously discussed these matters with an independent fee consultant.
The Adviser reviewed with the directors the significantly greater scope of the services it provides to the Fund relative to institutional clients. In this regard, the Adviser noted, among other things, that, compared to institutional accounts, the Fund (i) demands considerably more portfolio management, research and trading resources due to significantly higher daily cash flows; (ii) has more tax and regulatory restrictions and compliance obligations; (iii) must prepare and file or distribute regulatory and other communications about fund operations; and (iv) must provide shareholder servicing to retail investors. The Adviser also reviewed the greater legal risks presented by the large and changing population of Fund shareholders who may assert claims against the Adviser in individual or class actions, and the greater entrepreneurial risk in offering new fund products, which require substantial investment to launch, may not succeed, and generally must be priced to compete with larger, more established funds resulting in lack of profitability to the Adviser until a new fund achieves scale. In light of the substantial differences in services rendered by the Adviser to institutional clients as compared to the Fund, and the different risk profile, the directors considered these fee comparisons inapt and did not place significant weight on them in their deliberations.
The directors noted that the Fund may invest in shares of exchange-traded funds (“ETFs”), subject to the restrictions and limitations of the Investment Company Act of 1940 as these may be varied as a result of exemptive orders issued by the SEC. The directors also noted that ETFs pay advisory fees pursuant to their advisory contracts. The directors concluded, based on the Adviser’s explanation of how it uses ETFs when they are the most cost-effective way to obtain desired exposures, in some cases pending purchases of underlying securities, that the advisory fee for the Fund would be for services in addition to, rather than duplicative of, the services provided under the advisory contracts of the ETFs.
In connection with their review of the Fund’s advisory fee, the directors also considered the total expense ratio of the Class A shares of the Fund in comparison to a peer group and a peer universe selected by the 15(c) service provider. The Class A expense ratio of the Fund was based on the Fund’s latest fiscal year. The directors noted that it was likely that the expense ratios of some of the other funds in the Fund’s category were lowered by waivers or reimbursements by those funds’ investment advisers, which in some cases might be voluntary or temporary. The directors view expense ratio information as relevant to their evaluation of the Adviser’s services because the Adviser is responsible for coordinating
| | |
| |
| abfunds.com | | AB TAX-MANAGED WEALTH APPRECIATION STRATEGY | 49 |
services provided to the Fund by others. Based on their review, the directors concluded that the Fund’s expense ratio was acceptable.
Economies of Scale
The directors noted that the advisory fee schedules for the Fund contains breakpoints that reduce the fee rates on assets above specified levels. The directors took into consideration prior presentations by an independent consultant on economies of scale in the mutual fund industry and for the AB Funds, and presentations from time to time by the Adviser concerning certain of its views on economies of scale. The directors also previously discussed economies of scale with an independent fee consultant. The directors also had requested and received from the Adviser certain updates on economies of scale in advance of the Meeting. The directors believe that economies of scale may be realized (if at all) by the Adviser across a variety of products and services, and not only in respect of a single fund. The directors noted that there is no established methodology for setting breakpoints that give effect to the fund-specific services provided by a fund’s adviser and to the economies of scale that an adviser may realize in its overall mutual fund business or those components of it which directly or indirectly affect a fund’s operations. The directors observed that in the mutual fund industry as a whole, as well as among funds similar to the Fund, there is no uniformity or pattern in the fees and asset levels at which breakpoints (if any) apply. The directors also noted that the advisory agreements for many funds do not have breakpoints at all. Having taken these factors into account, the directors concluded that the Fund’s shareholders would benefit from a sharing of economies of scale in the event the Fund’s net assets exceed a breakpoint in the future.
| | |
| |
50 | AB TAX-MANAGED WEALTH APPRECIATION STRATEGY | | abfunds.com |
This page is not part of the Shareholder Report or the Financial Statements.
AB FAMILY OF FUNDS
US EQUITY
CORE
Core Opportunities Fund
FlexFee™ US Thematic Portfolio
Select US Equity Portfolio
GROWTH
Concentrated Growth Fund
Discovery Growth Fund
FlexFee™ Large Cap Growth Portfolio
Growth Fund
Large Cap Growth Fund
Small Cap Growth Portfolio
VALUE
Discovery Value Fund
Equity Income Fund
Relative Value Fund
Small Cap Value Portfolio
Value Fund
INTERNATIONAL/ GLOBAL EQUITY
CORE
Global Core Equity Portfolio
International Strategic Core Portfolio
Sustainable Global Thematic Fund
Tax-Managed Wealth Appreciation Strategy
Wealth Appreciation Strategy
GROWTH
Concentrated International Growth Portfolio
Sustainable International Thematic Fund
VALUE
All China Equity Portfolio
International Value Fund
FIXED INCOME
MUNICIPAL
High Income Municipal Portfolio
Intermediate California Municipal Portfolio
Intermediate Diversified Municipal Portfolio
Intermediate New York Municipal Portfolio
Municipal Bond Inflation Strategy
Tax-Aware Fixed Income Opportunities Portfolio
National Portfolio
Arizona Portfolio
California Portfolio
Massachusetts Portfolio
Minnesota Portfolio
New Jersey Portfolio
New York Portfolio
Ohio Portfolio
Pennsylvania Portfolio
Virginia Portfolio
TAXABLE
Bond Inflation Strategy
FlexFee™ High Yield Portfolio
Global Bond Fund
High Income Fund
Income Fund
Intermediate Duration Portfolio
Limited Duration High Income Portfolio
Short Duration Income Portfolio
Short Duration Portfolio
Total Return Bond Portfolio
ALTERNATIVES
All Market Real Return Portfolio
Global Real Estate Investment Fund
Select US Long/Short Portfolio
MULTI-ASSET
All Market Income Portfolio
All Market Total Return Portfolio
Conservative Wealth Strategy
Emerging Markets Multi-Asset Portfolio
Global Risk Allocation Fund
Tax-Managed All Market Income Portfolio
CLOSED-END FUNDS
AllianceBernstein Global High Income Fund
AllianceBernstein National Municipal Income Fund
We also offer Government Money Market Portfolio, which serves as the money market fund exchange vehicle for the AB mutual funds. You could lose money by investing in the Fund. Although the Fund seeks to preserve the value of your investment at $1.00 per share, it cannot guarantee it will do so. The Fund may impose a fee upon sale of your shares or may temporarily suspend your ability to sell shares if the Fund’s liquidity falls below required minimums because of market conditions or other factors. An investment in the Fund is not insured or guaranteed by the Federal Deposit Insurance Corporation or any other government agency. The Fund’s sponsor has no legal obligation to provide financial support to the Fund, and you should not expect that the sponsor will provide financial support to the Fund at any time.
Investors should consider the investment objectives, risks, charges and expenses of the Fund carefully before investing. For copies of our prospectus or summary prospectus, which contain this and other information, visit us online at www.abfunds.com or contact your AB representative. Please read the prospectus and/or summary prospectus carefully before investing.
| | |
| |
| abfunds.com | | AB TAX-MANAGED WEALTH APPRECIATION STRATEGY | 51 |
NOTES
| | |
| |
52 | AB TAX-MANAGED WEALTH APPRECIATION STRATEGY | | abfunds.com |
AB TAX-MANAGED WEALTH APPRECIATION STRATEGY
1345 Avenue of the Americas
New York, NY 10105
800 221 5672
TWA-0152-0221 
FEB 02.28.21

SEMI-ANNUAL REPORT
AB WEALTH APPRECIATION STRATEGY

As of January 1, 2021, as permitted by new regulations adopted by the Securities and Exchange Commission, the Fund’s annual and semi-annual shareholder reports are no longer sent by mail, unless you specifically requested paper copies of the reports. Instead, the reports are made available on a website, and you will be notified by mail each time a report is posted and provided with a website address to access the report.
You may elect to receive all future reports in paper form free of charge. If you invest through a financial intermediary, you can contact your financial intermediary to request that you continue to receive paper copies of your shareholder reports; if you invest directly with the Fund, you can call the Fund at (800) 221 5672. Your election to receive reports in paper form will apply to all funds held in your account with your financial intermediary or, if you invest directly, to all AB Mutual Funds you hold.
| | |
| |
| Investment Products Offered | | • Are Not FDIC Insured • May Lose Value • Are Not Bank Guaranteed |
Investors should consider the investment objectives, risks, charges and expenses of the Fund carefully before investing. For copies of our prospectus or summary prospectus, which contain this and other information, visit us online at www.abfunds.com or contact your AB representative. Please read the prospectus and/or summary prospectus carefully before investing.
This shareholder report must be preceded or accompanied by the Fund’s prospectus for individuals who are not current shareholders of the Fund.
You may obtain a description of the Fund’s proxy voting policies and procedures, and information regarding how the Fund voted proxies relating to portfolio securities during the most recent 12-month period ended June 30, without charge. Simply visit AB’s website at www.abfunds.com, or go to the Securities and Exchange Commission’s (the “Commission”) website at www.sec.gov, or call AB at (800) 227 4618.
The Fund files its complete schedule of portfolio holdings with the Commission for the first and third quarters of each fiscal year as an exhibit to its reports on Form N-PORT. The Fund’s Form N-PORT reports are available on the Commission’s website at www.sec.gov. The Fund’s Forms N-PORT may also be reviewed and copied at the Commission’s Public Reference Room in Washington, DC; information on the operation of the Public Reference Room may be obtained by calling (800) SEC 0330. AB publishes full portfolio holdings for the Fund monthly at www.abfunds.com.
AllianceBernstein Investments, Inc. (ABI) is the distributor of the AB family of mutual funds. ABI is a member of FINRA and is an affiliate of AllianceBernstein L.P., the Adviser of the funds.
The [A/B] logo is a registered service mark of AllianceBernstein and AllianceBernstein® is a registered service mark used by permission of the owner, AllianceBernstein L.P.
| | |
| FROM THE PRESIDENT | |  |
Dear Shareholder,
We’re pleased to provide this report for the AB Wealth Appreciation Strategy (the “Fund”). Please review the discussion of Fund performance, the market conditions during the reporting period and the Fund’s investment strategy.
At AB, we’re striving to help our clients achieve better outcomes by:
| + | | Fostering diverse perspectives that give us a distinctive approach to navigating global capital markets |
| + | | Applying differentiated investment insights through a connected global research network |
| + | | Embracing innovation to design better ways to invest and leading-edge mutual-fund solutions |
Whether you’re an individual investor or a multibillion-dollar institution, we’re putting our knowledge and experience to work for you every day.
For more information about AB’s comprehensive range of products and shareholder resources, please log on to www.abfunds.com.
Thank you for your investment in AB mutual funds—and for placing your trust in our firm.
Sincerely,

Onur Erzan
President and Chief Executive Officer, AB Mutual Funds
| | |
| |
| abfunds.com | | AB WEALTH APPRECIATION STRATEGY | 1 |
SEMI-ANNUAL REPORT
April 5, 2021
This report provides management’s discussion of fund performance for the AB Wealth Appreciation Strategy for the semi-annual reporting period ended February 28, 2021.
The Fund’s investment objective is long-term growth of capital.
NAV RETURNS AS OF FEBRUARY 28, 2021 (unaudited)
| | | | | | | | |
| | |
| | | 6 Months | | | 12 Months | |
| | |
| AB WEALTH APPRECIATION STRATEGY | | | | | | | | |
| | |
| Class A Shares | | | 13.53% | | | | 27.93% | |
| | |
| Class C Shares | | | 13.10% | | | | 26.94% | |
| | |
| Advisor Class Shares1 | | | 13.71% | | | | 28.26% | |
| | |
| Class R Shares1 | | | 13.28% | | | | 27.34% | |
| | |
| Class K Shares1 | | | 13.51% | | | | 27.78% | |
| | |
| MSCI ACWI (net) | | | 13.04% | | | | 30.25% | |
| 1 | Please note that these share classes are for investors purchasing shares through accounts established under certain fee-based programs sponsored and maintained by certain broker-dealers and financial intermediaries, institutional pension plans and/or investment advisory clients of, and certain other persons associated with, the Adviser and its affiliates or the Fund. |
Please keep in mind that high, double-digit returns are highly unusual and cannot be sustained. Investors should also be aware that these returns were primarily achieved during favorable market conditions.
INVESTMENT RESULTS
The table above shows the Fund’s performance compared to its benchmark, the Morgan Stanley Capital International All Country World Index (“MSCI ACWI”) (net), for the six- and 12-month periods ended February 28, 2021.
During the six-month period, all share classes outperformed the benchmark, before sales charges. The Fund’s overweight allocations to US and international small-cap stocks were significant contributors, relative to the benchmark, and stock selection within industrials and financials contributed to performance, as market returns broadened to include companies that would benefit from economic reopening after the announcement of COVID-19 vaccines. Strong stock selection within emerging markets also contributed. Weaker sector selection from underweights to materials, energy and financials offset some of these gains.
All shares classes underperformed the benchmark during the 12-month period, before sales charges. Stock selection was the largest detractor, while sector and country selection had no material impact on returns, and currency selection was a small contributor. The Fund’s stock selection
| | |
| |
2 | AB WEALTH APPRECIATION STRATEGY | | abfunds.com |
within the materials, information-technology and consumer-discretionary sectors detracted, as returns were very concentrated within stocks deemed as COVID-19 beneficiaries in this period, while stocks exposed to travel, such as energy producers and the aerospace complex, underperformed significantly.
The Fund did not use derivatives during either period.
MARKET REVIEW AND INVESTMENT STRATEGY
Following patterns seen in the prior six-month period, global equity markets continued to be driven by news surrounding the pandemic. US, international and emerging-market equities, supported by extensive monetary and fiscal stimulus, continued to recover from lows triggered by the COVID-19 pandemic and recorded positive returns for the six-month period ended February 28, 2021. Equity markets suffered a setback at the beginning of the period as volatility and style rotation, including a broad sell-off of mega-cap technology stocks, prevailed. Favorable news about the efficacy of potential coronavirus vaccines helped offset market volatility that was prompted by the continued spread of the virus in many countries, a potentially contested US presidential election and lack of additional US fiscal stimulus. Later in the period, global equity markets were supported by a significant decline in new cases, the acceleration of vaccine distribution and positive signs that a $1.9 trillion relief package would be approved—despite the emergence of seemingly more transmissible strains of the virus. As the period drew to a close, the emergence of inflationary fears, especially in the US, precipitated a sharp rise in long-term government bond yields and an accompanying correction in equities. Rising longer-term interest rates pressured the valuations of many market-leading technology and growth stocks, especially in the US, boosting a rotation into more cyclical and value-oriented stocks. For the semi-annual period, small-cap stocks substantially outperformed large-cap stocks on a relative basis, and periods of market rotation led large and small value-style stocks to outperform their growth-style peers.
The Fund’s Senior Investment Management Team (the “Team”) seeks improved equity risk control by utilizing the Adviser’s Strategic Equities services as the core equity allocation to US and international markets. This diversified exposure across equity markets and emphasis on a broad set of stocks, which includes companies with historical and projected stable earnings and higher profitability, eliminates the need for diversifiers to limit volatility. The Team believes this allocation offers the potential to achieve higher returns, with similar levels of volatility, increasing risk-adjusted returns in an all-equity service to meet the long-term growth goal—growth of capital.
| | |
| |
| abfunds.com | | AB WEALTH APPRECIATION STRATEGY | 3 |
INVESTMENT POLICIES
The Fund invests primarily in equity securities, either directly or through underlying investment companies advised by the Adviser (“Underlying Portfolios”). A majority of the Fund’s assets are expected to be invested directly in US large-cap equity securities, primarily common stocks, in accordance with the Adviser’s US Strategic Equities investment strategy (“US Strategic Equities”), as described below. In addition, the Fund seeks to achieve exposure to international large-cap equity securities through investments in other registered investment companies advised by the Adviser, which may include International Strategic Equities Portfolio of Bernstein Fund, Inc. (“Bernstein International Strategic Equities Portfolio”). The Fund also invests in other Underlying Portfolios to efficiently gain exposure to certain other types of equity securities, including small- and mid-cap and emerging-market equity securities. An Underlying Portfolio is selected based on the segment of the equity market to which the Underlying Portfolio provides exposure, its investment philosophy, and how it complements and diversifies the Fund’s overall portfolio.
Under US Strategic Equities, portfolio managers of the Adviser that specialize in various investment disciplines identify high-conviction large-cap equity securities based on their fundamental investment research for potential investment by the Fund. These securities are then assessed in terms of both this fundamental research and quantitative analysis in creating the Fund’s portfolio. In applying the quantitative analysis, the Adviser considers a number of metrics that historically have provided some indication of favorable future returns, including metrics related to valuation, quality, investor behavior and corporate behavior.
Bernstein International Strategic Equities Portfolio focuses on investing in non-US large-cap and mid-cap equity securities. Bernstein International Strategic Equities Portfolio follows a strategy similar to US Strategic Equities, but in the international context.
Fluctuations in currency exchange rates can have a dramatic impact on the returns of foreign equity securities. The Adviser may employ currency hedging strategies in the Fund or the Underlying Portfolios, including the use of currency-related derivatives, to seek to reduce currency risk in the Fund or the Underlying Portfolios, but it is not required to do so. The Fund is managed without regard to tax considerations.
| | |
| |
4 | AB WEALTH APPRECIATION STRATEGY | | abfunds.com |
DISCLOSURES AND RISKS
Benchmark Disclosure
The MSCI ACWI is unmanaged and does not reflect fees and expenses associated with the active management of a mutual fund portfolio. The MSCI ACWI (net, free float-adjusted, market capitalization weighted) represents the equity market performance of developed and emerging markets. MSCI makes no express or implied warranties or representations, and shall have no liability whatsoever with respect to any MSCI data contained herein. The MSCI data may not be further redistributed or used as a basis for other indices, any securities or financial products. This report is not approved, reviewed or produced by MSCI. Net returns include the reinvestment of dividends after deduction of non-US withholding tax. An investor cannot invest directly in an index or average, and their results are not indicative of the performance for any specific investment, including the Fund.
A Word About Risk
Market Risk: The value of the Fund’s assets will fluctuate as the stock, bond or commodities markets fluctuate. The value of its investments may decline, sometimes rapidly and unpredictably, simply because of economic changes or other events, including public health crises (including the occurrence of a contagious disease or illness), that affect large portions of the market. It includes the risk that a particular style of investing, such as growth or value, may be underperforming the stock market generally.
Foreign (Non-US) Risk: Investments in securities of non-US issuers may involve more risk than those of US issuers. These securities may fluctuate more widely in price and may be more difficult to trade due to adverse market, economic, political, regulatory or other factors.
Currency Risk: Fluctuations in currency exchange rates may negatively affect the value of the Fund’s investments or reduce its returns.
Emerging-Market Risk: Investments in emerging-market countries may have more risk because the markets are less developed and less liquid as well as being subject to increased economic, political, regulatory or other uncertainties.
Capitalization Risk: Investments in small- and mid-capitalization companies may be more volatile than investments in large-capitalization companies. Investments in small-and mid-capitalization companies may have additional risks because these companies have limited product lines, markets or financial resources.
Investment in Other Investment Companies Risk: As with other investments, investments in other investment companies are subject to market and selection risk. In addition, shareholders of the Fund bear both their proportionate share of expenses in the Fund (including management
| | |
| |
| abfunds.com | | AB WEALTH APPRECIATION STRATEGY | 5 |
DISCLOSURES AND RISKS (continued)
fees) and, indirectly, the expenses of the investment companies in which the Fund invests (to the extent these expenses are not waived or reimbursed by the Adviser).
Sector Risk: The Fund may have more risk because it may invest to a significant extent in one or more particular market sectors, such as the information-technology sector. To the extent it does so, market or economic factors affecting the relevant sector(s) could have a major effect on the value of the Fund’s investments.
Management Risk: The Fund is subject to management risk because it is an actively managed investment fund. The Adviser will apply its investment techniques and risk analyses in making investment decisions for the Fund, but there is no guarantee that its techniques will produce the intended results. Some of these techniques may incorporate, or rely upon, quantitative models, but there is no guarantee that these models will generate accurate forecasts, reduce risk or otherwise perform as expected.
These risks are fully discussed in the Fund’s prospectus. As with all investments, you may lose money by investing in the Fund.
An Important Note About Historical Performance
The investment return and principal value of an investment in the Fund will fluctuate as the prices of the individual securities in which it invests fluctuate, so that your shares, when redeemed, may be worth more or less than their original cost. Performance shown in this report represents past performance and does not guarantee future results. Current performance may be lower or higher than the performance information shown. You may obtain performance information current to the most recent month-end by visiting www.abfunds.com. The performance shown for periods prior to July 14, 2017, is based on the Fund’s prior principal strategies and may not be representative of the Fund’s performance under its current principal strategies. Class B shares are no longer being offered. Effective November 7, 2019, all outstanding Class B shares were converted to Class A shares. Please see Note A for more information.
All fees and expenses related to the operation of the Fund have been deducted. Net asset value (“NAV”) returns do not reflect sales charges; if sales charges were reflected, the Fund’s quoted performance would be lower. SEC returns reflect the applicable sales charges for each share class: a 4.25% maximum front-end sales charge for Class A shares and a 1% 1-year contingent deferred sales charge for Class C shares. Returns for the different share classes will vary due to different expenses associated with each class. Performance assumes reinvestment of distributions and does not account for taxes.
| | |
| |
6 | AB WEALTH APPRECIATION STRATEGY | | abfunds.com |
HISTORICAL PERFORMANCE
AVERAGE ANNUAL RETURNS AS OF FEBRUARY 28, 2021 (unaudited)
| | | | | | | | |
| | |
| | | NAV Returns | | | SEC Returns
(reflects applicable
sales charges) | |
| | |
| CLASS A SHARES | | | | | | | | |
| | |
| 1 Year | | | 27.93% | | | | 22.49% | |
| | |
| 5 Years | | | 12.47% | | | | 11.50% | |
| | |
| 10 Years | | | 7.60% | | | | 7.14% | |
| | |
| CLASS C SHARES | | | | | | | | |
| | |
| 1 Year | | | 26.94% | | | | 25.94% | |
| | |
| 5 Years | | | 11.64% | | | | 11.64% | |
| | |
| 10 Years | | | 6.80% | | | | 6.80% | |
| | |
| ADVISOR CLASS SHARES1 | | | | | | | | |
| | |
| 1 Year | | | 28.26% | | | | 28.26% | |
| | |
| 5 Years | | | 12.77% | | | | 12.77% | |
| | |
| 10 Years | | | 7.88% | | | | 7.88% | |
| | |
| CLASS R SHARES1 | | | | | | | | |
| | |
| 1 Year | | | 27.34% | | | | 27.34% | |
| | |
| 5 Years | | | 11.97% | | | | 11.97% | |
| | |
| 10 Years | | | 7.14% | | | | 7.14% | |
| | |
| CLASS K SHARES1 | | | | | | | | |
| | |
| 1 Year | | | 27.78% | | | | 27.78% | |
| | |
| 5 Years | | | 12.33% | | | | 12.33% | |
| | |
| 10 Years | | | 7.48% | | | | 7.48% | |
The Fund’s current prospectus fee table shows the Fund’s total annual operating expense ratios as 1.41%, 2.16%, 1.16%, 1.86% and 1.55% for Class A, Class C, Advisor Class, Class R and Class K shares, respectively, gross of any fee waivers or expense reimbursements. Contractual fee waivers and/or expense reimbursement agreements reduced the Fund’s annual operating expense ratios to 1.04%, 1.79%, 0.79%, 1.49% and 1.18% for Class A, Class C, Advisor Class, Class R and Class K shares, respectively. These waivers/reimbursement agreements may not be terminated before December 31, 2021. Absent reimbursements or waivers, performance would have been lower. The net and gross expenses shown include the total operating expenses of the Fund and the indirect expenses of the Fund’s Underlying Portfolios, as based upon the allocation of the Fund’s assets among the Underlying Portfolios. The Financial Highlights section of this report sets forth expense ratio data for the current reporting period; the expense ratios shown above may differ from the expense ratios in the Financial Highlights section since they are based on different time periods.
| 1 | These share classes are offered at NAV to eligible investors and their SEC returns are the same as their NAV returns. Please note that these share classes are for investors purchasing shares through accounts established under certain fee-based programs sponsored and maintained by certain broker-dealers and financial intermediaries, institutional pension plans and/or investment advisory clients of, and certain other persons associated with, the Adviser and its affiliates or the Fund. |
| | |
| |
| abfunds.com | | AB WEALTH APPRECIATION STRATEGY | 7 |
HISTORICAL PERFORMANCE (continued)
SEC AVERAGE ANNUAL RETURNS
AS OF THE MOST RECENT CALENDAR QUARTER-END
MARCH 31, 2021 (unaudited)
| | | | |
| |
| | | SEC Returns
(reflects applicable
sales charges) | |
| |
| CLASS A SHARES | | | | |
| |
| 1 Year | | | 47.60% | |
| |
| 5 Years | | | 10.84% | |
| |
| 10 Years | | | 7.50% | |
| |
| CLASS C SHARES | | | | |
| |
| 1 Year | | | 52.01% | |
| |
| 5 Years | | | 10.97% | |
| |
| 10 Years | | | 7.17% | |
| |
| ADVISOR CLASS SHARES1 | | | | |
| |
| 1 Year | | | 54.51% | |
| |
| 5 Years | | | 12.08% | |
| |
| 10 Years | | | 8.25% | |
| |
| CLASS R SHARES1 | | | | |
| |
| 1 Year | | | 53.45% | |
| |
| 5 Years | | | 11.29% | |
| |
| 10 Years | | | 7.51% | |
| |
| CLASS K SHARES1 | | | | |
| |
| 1 Year | | | 53.84% | |
| |
| 5 Years | | | 11.65% | |
| |
| 10 Years | | | 7.85% | |
| 1 | Please note that these share classes are for investors purchasing shares through accounts established under certain fee-based programs sponsored and maintained by certain broker-dealers and financial intermediaries, institutional pension plans and/or investment advisory clients of, and certain other persons associated with, the Adviser and its affiliates or the Fund. |
| | |
| |
8 | AB WEALTH APPRECIATION STRATEGY | | abfunds.com |
EXPENSE EXAMPLE
(unaudited)
As a shareholder of the Fund, you incur two types of costs: (1) transaction costs, including sales charges (loads) on purchase payments, contingent deferred sales charges on redemptions and (2) ongoing costs, including management fees; distribution (12b-1) fees; and other Fund expenses. This example is intended to help you understand your ongoing costs (in dollars) of investing in the Fund and to compare these costs with the ongoing costs of investing in other mutual funds.
The Example is based on an investment of $1,000 invested at the beginning of the period and held for the entire period as indicated below.
Actual Expenses
The table below provides information about actual account values and actual expenses. You may use the information, together with the amount you invested, to estimate the expenses that you paid over the period. Simply divide your account value by $1,000 (for example, an $8,600 account value divided by $1,000 = 8.6), then multiply the result by the number under the heading entitled “Expenses Paid During Period” to estimate the expenses you paid on your account during this period.
Hypothetical Example for Comparison Purposes
The table below also provides information about hypothetical account values and hypothetical expenses based on the Fund’s actual expense ratio and an assumed annual rate of return of 5% before expenses, which is not the Fund’s actual return. The hypothetical account values and expenses may not be used to estimate the actual ending account balance or expenses you paid for the period. You may use this information to compare the ongoing costs of investing in the Fund and other funds by comparing this 5% hypothetical example with the 5% hypothetical examples that appear in the shareholder reports of other funds.
Please note that the expenses shown in the table are meant to highlight your ongoing costs only and do not reflect any transactional costs, such as sales charges (loads), or contingent deferred sales charges on redemptions. Therefore, the hypothetical example is useful in comparing ongoing costs only, and will not help you determine the relative total costs of owning different funds. In addition, if these transactional costs were included, your costs would have been higher.
| | |
| |
| abfunds.com | | AB WEALTH APPRECIATION STRATEGY | 9 |
EXPENSE EXAMPLE (continued)
| | | | | | | | | | | | | | | | | | | | | | | | |
| | | Beginning
Account
Value
September 1,
2020 | | | Ending
Account
Value
February 28,
2021 | | | Expenses
Paid
During
Period* | | | Annualized
Expense
Ratio* | | | Total
Expenses
Paid
During
Period+ | | | Total
Annualized
Expense
Ratio+ | |
| Class A | | | | | | | | | | | | | | | | | | | | | | | | |
Actual | | $ | 1,000 | | | $ | 1,135.30 | | | $ | 3.39 | | | | 0.64 | % | | $ | 5.45 | | | | 1.03 | % |
Hypothetical** | | $ | 1,000 | | | $ | 1,021.62 | | | $ | 3.21 | | | | 0.64 | % | | $ | 5.16 | | | | 1.03 | % |
| Class C | | | | | | | | | | | | | | | | | | | | | | | | |
Actual | | $ | 1,000 | | | $ | 1,131.00 | | | $ | 7.34 | | | | 1.39 | % | | $ | 9.41 | | | | 1.78 | % |
Hypothetical** | | $ | 1,000 | | | $ | 1,017.90 | | | $ | 6.95 | | | | 1.39 | % | | $ | 8.90 | | | | 1.78 | % |
| Advisor Class | | | | | | | | | | | | | | | | | | | | | | | | |
Actual | | $ | 1,000 | | | $ | 1,137.10 | | | $ | 2.07 | | | | 0.39 | % | | $ | 4.13 | | | | 0.78 | % |
Hypothetical** | | $ | 1,000 | | | $ | 1,022.86 | | | $ | 1.96 | | | | 0.39 | % | | $ | 3.91 | | | | 0.78 | % |
| Class R | | | | | | | | | | | | | | | | | | | | | | | | |
Actual | | $ | 1,000 | | | $ | 1,132.80 | | | $ | 5.82 | | | | 1.10 | % | | $ | 7.88 | | | | 1.49 | % |
Hypothetical** | | $ | 1,000 | | | $ | 1,019.34 | | | $ | 5.51 | | | | 1.10 | % | | $ | 7.45 | | | | 1.49 | % |
| Class K | | | | | | | | | | | | | | | | | | | | | | | | |
Actual | | $ | 1,000 | | | $ | 1,135.10 | | | $ | 4.18 | | | | 0.79 | % | | $ | 6.25 | | | | 1.18 | % |
Hypothetical** | | $ | 1,000 | | | $ | 1,020.88 | | | $ | 3.96 | | | | 0.79 | % | | $ | 5.91 | | | | 1.18 | % |
| * | Expenses are equal to the classes’ annualized expense ratios, multiplied by the average account value over the period, multiplied by 181/365 (to reflect the one-half year period). |
| ** | Assumes 5% annual return before expenses. |
| + | In connection with the Fund’s investments in affiliated/unaffiliated underlying portfolios, the Fund incurs no direct expenses, but bears proportionate shares of the fees and expenses (i.e., operating, administrative and investment advisory fees) of the affiliated/unaffiliated underlying portfolios. The Adviser has contractually agreed to waive its fees from the Fund in an amount equal to the Fund’s pro rata share of certain acquired fund fees and expenses of the affiliated underlying portfolios. The Fund’s total expenses are equal to the classes’ annualized expense ratio plus the Fund’s pro rata share of the weighted average expense ratio of the affiliated/unaffiliated underlying portfolios in which it invests, multiplied by the average account value over the period, multiplied by 181/365 (to reflect the one-half year period). |
| | |
| |
10 | AB WEALTH APPRECIATION STRATEGY | | abfunds.com |
PORTFOLIO SUMMARY
February 28, 2021 (unaudited)
PORTFOLIO STATISTICS
Net Assets ($mil): $1,313.4

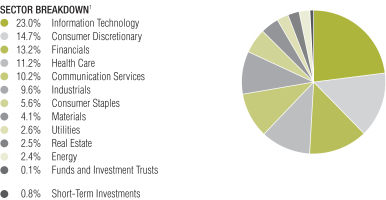
| 1 | All data are as of February 28, 2021. The Fund’s security type and sector breakdowns are expressed as a percentage of total investments (excluding security lending collateral) and may vary over time. The Fund also enters into derivative transactions, which may be used for hedging or investment purposes (see “Portfolio of Investments” section of the report for additional details). Sectors shown include investments of Underlying Portfolios. |
Please note: The sector classifications presented herein are based on the Global Industry Classification Standard (GICS) which was developed by Morgan Stanley Capital International and Standard & Poor’s. The components are divided into sector, industry group, and industry sub-indices as classified by the GICS for each of the market capitalization indices in the broad market. These sector classifications are broadly defined. The “Portfolio of Investments” section of the report reflects more specific industry information and is consistent with the investment restrictions discussed in the Fund’s prospectus.
| | |
| |
| abfunds.com | | AB WEALTH APPRECIATION STRATEGY | 11 |
PORTFOLIO OF INVESTMENTS
February 28, 2021 (unaudited)
| | | | | | | | |
| Company | | Shares | | | U.S. $ Value | |
| |
COMMON STOCKS – 51.1% | | | | | | | | |
Information Technology – 14.0% | | | | | | | | |
Electronic Equipment, Instruments & Components – 0.5% | | | | | | | | |
CDW Corp./DE | | | 42,448 | | | $ | 6,659,667 | |
| | | | | | | | |
| | |
IT Services – 3.2% | | | | | | | | |
Automatic Data Processing, Inc. | | | 35,072 | | | | 6,103,229 | |
Booz Allen Hamilton Holding Corp. | | | 39,768 | | | | 3,067,704 | |
Genpact Ltd. | | | 159,645 | | | | 6,456,044 | |
PayPal Holdings, Inc.(a) | | | 30,090 | | | | 7,818,887 | |
Visa, Inc. – Class A | | | 88,724 | | | | 18,844,090 | |
| | | | | | | | |
| | | | | | | 42,289,954 | |
| | | | | | | | |
Semiconductors & Semiconductor Equipment – 3.0% | | | | | | | | |
NVIDIA Corp. | | | 12,868 | | | | 7,059,128 | |
NXP Semiconductors NV | | | 48,293 | | | | 8,815,887 | |
QUALCOMM, Inc. | | | 74,673 | | | | 10,169,716 | |
Texas Instruments, Inc. | | | 51,986 | | | | 8,955,628 | |
Xilinx, Inc. | | | 37,617 | | | | 4,901,495 | |
| | | | | | | | |
| | | | | | | 39,901,854 | |
| | | | | | | | |
Software – 4.9% | | | | | | | | |
Adobe, Inc.(a) | | | 10,865 | | | | 4,994,314 | |
Citrix Systems, Inc. | | | 41,043 | | | | 5,482,524 | |
Microsoft Corp. | | | 201,488 | | | | 46,821,781 | |
Oracle Corp. | | | 105,913 | | | | 6,832,448 | |
| | | | | | | | |
| | | | | | | 64,131,067 | |
| | | | | | | | |
Technology Hardware, Storage & Peripherals – 2.4% | | | | | | | | |
Apple, Inc. | | | 225,726 | | | | 27,371,535 | |
Western Digital Corp. | | | 59,238 | | | | 4,059,580 | |
| | | | | | | | |
| | | | | | | 31,431,115 | |
| | | | | | | | |
| | | | | | | 184,413,657 | |
| | | | | | | | |
Consumer Discretionary – 6.9% | | | | | | | | |
Auto Components – 0.6% | | | | | | | | |
Magna International, Inc. – Class A (United States) | | | 91,666 | | | | 7,718,277 | |
| | | | | | | | |
| | |
Automobiles – 0.3% | | | | | | | | |
Stellantis NV(b) | | | 231,208 | | | | 3,787,187 | |
| | | | | | | | |
| | |
Distributors – 0.3% | | | | | | | | |
LKQ Corp.(a) | | | 115,109 | | | | 4,534,144 | |
| | | | | | | | |
| | |
Diversified Consumer Services – 0.2% | | | | | | | | |
Chegg, Inc.(a) | | | 31,480 | | | | 3,038,764 | |
| | | | | | | | |
| | |
Internet & Direct Marketing Retail – 1.8% | | | | | | | | |
Amazon.com, Inc.(a) | | | 7,416 | | | | 22,937,169 | |
| | | | | | | | |
| | |
| |
12 | AB WEALTH APPRECIATION STRATEGY | | abfunds.com |
PORTFOLIO OF INVESTMENTS (continued)
| | | | | | | | |
| Company | | Shares | | | U.S. $ Value | |
| |
Specialty Retail – 2.4% | | | | | | | | |
AutoZone, Inc.(a) | | | 7,056 | | | $ | 8,184,396 | |
Home Depot, Inc. (The) | | | 57,665 | | | | 14,897,176 | |
TJX Cos., Inc. (The) | | | 131,659 | | | | 8,688,177 | |
| | | | | | | | |
| | | | | | | 31,769,749 | |
| | | | | | | | |
Textiles, Apparel & Luxury Goods – 1.3% | | | | | | | | |
Deckers Outdoor Corp.(a) | | | 18,123 | | | | 5,910,091 | |
NIKE, Inc. – Class B | | | 80,888 | | | | 10,902,085 | |
| | | | | | | | |
| | | | | | | 16,812,176 | |
| | | | | | | | |
| | | | | | | 90,597,466 | |
| | | | | | | | |
Health Care – 6.8% | | | | | | | | |
Biotechnology – 0.8% | | | | | | | | |
Regeneron Pharmaceuticals, Inc.(a) | | | 7,169 | | | | 3,230,136 | |
Vertex Pharmaceuticals, Inc.(a) | | | 35,150 | | | | 7,471,133 | |
| | | | | | | | |
| | | | | | | 10,701,269 | |
| | | | | | | | |
Health Care Equipment & Supplies – 1.9% | | | | | | | | |
Edwards Lifesciences Corp.(a) | | | 79,957 | | | | 6,644,427 | |
Medtronic PLC | | | 118,256 | | | | 13,832,404 | |
Zimmer Biomet Holdings, Inc. | | | 32,772 | | | | 5,343,802 | |
| | | | | | | | |
| | | | | | | 25,820,633 | |
| | | | | | | | |
Health Care Providers & Services – 2.2% | | | | | | | | |
Anthem, Inc. | | | 29,139 | | | | 8,834,653 | |
UnitedHealth Group, Inc. | | | 59,689 | | | | 19,829,880 | |
| | | | | | | | |
| | | | | | | 28,664,533 | |
| | | | | | | | |
Pharmaceuticals – 1.9% | | | | | | | | |
Johnson & Johnson | | | 33,424 | | | | 5,296,367 | |
Roche Holding AG (Sponsored ADR) | | | 288,006 | | | | 11,837,047 | |
Zoetis, Inc. | | | 49,547 | | | �� | 7,691,676 | |
| | | | | | | | |
| | | | | | | 24,825,090 | |
| | | | | | | | |
| | | | | | | 90,011,525 | |
| | | | | | | | |
Communication Services – 6.4% | | | | | | | | |
Diversified Telecommunication Services – 1.1% | | | | | | | | |
Comcast Corp. – Class A | | | 264,768 | | | | 13,958,569 | |
| | | | | | | | |
| | |
Entertainment – 0.7% | | | | | | | | |
Electronic Arts, Inc. | | | 65,119 | | | | 8,723,993 | |
| | | | | | | | |
| | |
Interactive Media & Services – 4.2% | | | | | | | | |
Alphabet, Inc. – Class C(a) | | | 17,837 | | | | 36,331,472 | |
Facebook, Inc. – Class A(a) | | | 72,749 | | | | 18,741,597 | |
| | | | | | | | |
| | | | | | | 55,073,069 | |
| | | | | | | | |
Wireless Telecommunication Services – 0.4% | | | | | | | | |
T-Mobile US, Inc.(a) | | | 49,586 | | | | 5,948,832 | |
| | | | | | | | |
| | | | | | | 83,704,463 | |
| | | | | | | | |
| | |
| |
| abfunds.com | | AB WEALTH APPRECIATION STRATEGY | 13 |
PORTFOLIO OF INVESTMENTS (continued)
| | | | | | | | |
| Company | | Shares | | | U.S. $ Value | |
| |
Financials – 5.7% | | | | | | | | |
Banks – 2.9% | | | | | | | | |
Bank of America Corp. | | | 427,660 | | | $ | 14,844,079 | |
Citigroup, Inc. | | | 125,554 | | | | 8,271,497 | |
PNC Financial Services Group, Inc. (The) | | | 33,804 | | | | 5,691,241 | |
Wells Fargo & Co. | | | 267,610 | | | | 9,679,454 | |
| | | | | | | | |
| | | | | | | 38,486,271 | |
| | | | | | | | |
Capital Markets – 2.0% | | | | | | | | |
CME Group, Inc. – Class A | | | 34,322 | | | | 6,854,103 | |
Goldman Sachs Group, Inc. (The) | | | 41,689 | | | | 13,318,802 | |
LPL Financial Holdings, Inc. | | | 47,120 | | | | 6,198,165 | |
| | | | | | | | |
| | | | | | | 26,371,070 | |
| | | | | | | | |
Insurance – 0.8% | | | | | | | | |
Progressive Corp. (The) | | | 58,130 | | | | 4,996,274 | |
Reinsurance Group of America, Inc. – Class A | | | 41,315 | | | | 5,049,932 | |
| | | | | | | | |
| | | | | | | 10,046,206 | |
| | | | | | | | |
| | | | | | | 74,903,547 | |
| | | | | | | | |
Industrials – 4.7% | | | | | | | | |
Aerospace & Defense – 0.6% | | | | | | | | |
L3Harris Technologies, Inc. | | | 40,144 | | | | 7,302,595 | |
| | | | | | | | |
| | |
Airlines – 0.5% | | | | | | | | |
Southwest Airlines Co. | | | 105,400 | | | | 6,126,902 | |
| | | | | | | | |
| | |
Construction & Engineering – 0.6% | | | | | | | | |
AECOM(a) | | | 131,609 | | | | 7,618,845 | |
| | | | | | | | |
| | |
Electrical Equipment – 0.6% | | | | | | | | |
Eaton Corp. PLC | | | 65,570 | | | | 8,536,558 | |
| | | | | | | | |
| | |
Industrial Conglomerates – 0.3% | | | | | | | | |
Honeywell International, Inc. | | | 19,346 | | | | 3,914,663 | |
| | | | | | | | |
| | |
Professional Services – 0.4% | | | | | | | | |
Robert Half International, Inc. | | | 68,041 | | | | 5,292,910 | |
| | | | | | | | |
| | |
Road & Rail – 1.2% | | | | | | | | |
CSX Corp. | | | 105,140 | | | | 9,625,567 | |
Knight-Swift Transportation Holdings, Inc. | | | 136,158 | | | | 5,882,026 | |
Norfolk Southern Corp. | | | 1,393 | | | | 351,119 | |
| | | | | | | | |
| | | | | | | 15,858,712 | |
| | | | | | | | |
Trading Companies & Distributors – 0.5% | | | | | | | | |
United Rentals, Inc.(a) | | | 22,753 | | | | 6,766,287 | |
| | | | | | | | |
| | | | | | | 61,417,472 | |
| | | | | | | | |
Consumer Staples – 2.2% | | | | | | | | |
Food & Staples Retailing – 1.1% | | | | | | | | |
Costco Wholesale Corp. | | | 9,953 | | | | 3,294,443 | |
Walmart, Inc. | | | 82,344 | | | | 10,698,133 | |
| | | | | | | | |
| | | | | | | 13,992,576 | |
| | | | | | | | |
| | |
| |
14 | AB WEALTH APPRECIATION STRATEGY | | abfunds.com |
PORTFOLIO OF INVESTMENTS (continued)
| | | | | | | | |
| Company | | Shares | | | U.S. $ Value | |
| |
Household Products – 1.1% | | | | | | | | |
Procter & Gamble Co. (The) | | | 117,863 | | | $ | 14,559,616 | |
| | | | | | | | |
| | | | | | | 28,552,192 | |
| | | | | | | | |
Real Estate – 1.4% | | | | | | | | |
Equity Real Estate Investment Trusts (REITs) – 1.4% | | | | | | | | |
American Campus Communities, Inc. | | | 87,095 | | | | 3,567,411 | |
American Tower Corp. | | | 17,275 | | | | 3,733,646 | |
Mid-America Apartment Communities, Inc. | | | 53,567 | | | | 7,217,082 | |
Prologis, Inc. | | | 39,779 | | | | 3,940,905 | |
| | | | | | | | |
| | | | | | | 18,459,044 | |
| | | | | | | | |
Utilities – 1.3% | | | | | | | | |
Electric Utilities – 1.3% | | | | | | | | |
American Electric Power Co., Inc. | | | 100,484 | | | | 7,521,228 | |
NextEra Energy, Inc. | | | 121,911 | | | | 8,958,020 | |
| | | | | | | | |
| | | | | | | 16,479,248 | |
| | | | | | | | |
Energy – 0.9% | | | | | | | | |
Oil, Gas & Consumable Fuels – 0.9% | | | | | | | | |
Chevron Corp. | | | 59,208 | | | | 5,920,800 | |
EOG Resources, Inc. | | | 89,941 | | | | 5,806,591 | |
| | | | | | | | |
| | | | | | | 11,727,391 | |
| | | | | | | | |
Materials – 0.8% | | | | | | | | |
Chemicals – 0.8% | | | | | | | | |
LyondellBasell Industries NV – Class A | | | 53,201 | | | | 5,484,491 | |
Westlake Chemical Corp. | | | 56,496 | | | | 4,835,493 | |
| | | | | | | | |
| | | | | | | 10,319,984 | |
| | | | | | | | |
| | |
Total Common Stocks
(cost $455,414,184) | | | | | | | 670,585,989 | |
| | | | | | | | |
| | |
INVESTMENT COMPANIES – 48.6% | | | | | | | | |
Funds and Investment Trusts – 48.6%(c)(d) | | | | | | | | |
AB Discovery Growth Fund, Inc. – Class Z | | | 2,702,545 | | | | 43,565,026 | |
AB Trust – AB Discovery Value Fund – Class Z | | | 1,838,753 | | | | 42,401,649 | |
Bernstein Fund, Inc. – International Small Cap Portfolio – Class Z | | | 6,537,875 | | | | 80,285,108 | |
Bernstein Fund, Inc. – International Strategic Equities Portfolio – Class Z | | | 30,821,563 | | | | 404,070,686 | |
Bernstein Fund, Inc. – Small Cap Core Portfolio – Class Z | | | 2,126,837 | | | | 31,051,821 | |
Sanford C. Bernstein Fund, Inc. – Emerging Markets Portfolio – Class Z | | | 1,078,086 | | | | 37,010,682 | |
| | | | | | | | |
| | |
Total Investment Companies
(cost $576,585,650) | | | | | | | 638,384,972 | |
| | | | | | | | |
| | |
| |
| abfunds.com | | AB WEALTH APPRECIATION STRATEGY | 15 |
PORTFOLIO OF INVESTMENTS (continued)
| | | | | | | | |
| Company | | Shares | | | U.S. $ Value | |
| |
SHORT-TERM INVESTMENTS – 0.3% | | | | | | | | |
Investment Companies – 0.3% | | | | | | | | |
AB Fixed Income Shares, Inc. – Government Money Market Portfolio – Class AB,
0.01%(c)(d)(e)
(cost $4,628,708) | | | 4,628,708 | | | $ | 4,628,708 | |
| | | | | | | | |
Total Investments Before Security Lending Collateral for Securities Loaned – 100.0%
(cost $1,036,628,542) | | | | | | | 1,313,599,669 | |
| | | | | | | | |
| | |
INVESTMENTS OF CASH COLLATERAL FOR SECURITIES LOANED – 0.0% | | | | | | | | |
Investment Companies – 0.0% | | | | | | | | |
AB Fixed Income Shares, Inc. – Government Money Market Portfolio – Class AB,
0.01%(c)(d)(e)
(cost $76,665) | | | 76,665 | | | | 76,665 | |
| | | | | | | | |
| | |
Total Investments – 100.0%
(cost $1,036,705,207) | | | | | | | 1,313,676,334 | |
Other assets less liabilities – 0.0% | | | | | | | (321,485 | ) |
| | | | | | | | |
| | |
Net Assets – 100.0% | | | | | | $ | 1,313,354,849 | |
| | | | | | | | |
| (a) | Non-income producing security. |
| (b) | Represents entire or partial securities out on loan. See Note E for securities lending information. |
| (c) | To obtain a copy of the fund’s shareholder report, please go to the Securities and Exchange Commission’s website at www.sec.gov, or call AB at
(800) 227-4618. |
| (d) | Affiliated investments. |
| (e) | The rate shown represents the 7-day yield as of period end. |
Glossary:
ADR – American Depositary Receipt
REIT – Real Estate Investment Trust
See notes to financial statements.
| | |
| |
16 | AB WEALTH APPRECIATION STRATEGY | | abfunds.com |
STATEMENT OF ASSETS & LIABILITIES
February 28, 2021 (unaudited)
| | | | |
| Assets | | | | |
Investments in securities, at value | | | | |
Unaffiliated issuers (cost $455,414,184) | | $ | 670,585,989 | (a) |
Affiliated issuers (cost $581,291,023—including investment of cash collateral for securities loaned of $76,665) | | | 643,090,345 | |
Foreign currencies, at value (cost $234,802) | | | 252,558 | |
Receivable for investment securities sold | | | 2,285,832 | |
Unaffiliated dividends receivable | | | 741,598 | |
Receivable for shares of beneficial interest sold | | | 277,911 | |
Affiliated dividends receivable | | | 31 | |
Other assets | | | 18,691 | |
| | | | |
Total assets | | | 1,317,252,955 | |
| | | | |
| Liabilities | | | | |
Payable for shares of beneficial interest redeemed | | | 1,848,716 | |
Payable for investment securities purchased | | | 1,268,635 | |
Advisory fee payable | | | 309,851 | |
Distribution fee payable | | | 89,019 | |
Transfer Agent fee payable | | | 77,329 | |
Payable for collateral received on securities loaned | | | 76,665 | |
Administrative fee payable | | | 28,230 | |
Trustees’ fees payable | | | 8,143 | |
Accrued expenses | | | 191,518 | |
| | | | |
Total liabilities | | | 3,898,106 | |
| | | | |
Net Assets | | $ | 1,313,354,849 | |
| | | | |
| Composition of Net Assets | | | | |
Shares of beneficial interest, at par | | $ | 682 | |
Additional paid-in capital | | | 1,007,462,554 | |
Distributable earnings | | | 305,891,613 | |
| | | | |
| | $ | 1,313,354,849 | |
| | | | |
|
| Net Asset Value Per Share—unlimited shares authorized, $.00001 par value |
| | | | | | | | | | | | |
| Class | | Net Assets | | | Shares
Outstanding | | | Net Asset
Value | |
| |
| A | | $ | 380,448,698 | | | | 19,700,384 | | | $ | 19.31 | * |
| |
| C | | $ | 15,058,889 | | | | 774,520 | | | $ | 19.44 | |
| |
| Advisor | | $ | 906,336,761 | | | | 47,085,043 | | | $ | 19.25 | |
| |
| R | | $ | 2,034,793 | | | | 105,808 | | | $ | 19.23 | |
| |
| K | | $ | 9,475,708 | | | | 493,818 | | | $ | 19.19 | |
| |
| (a) | Includes securities on loan with a value of $74,971 (see Note E). |
| * | The maximum offering price per share for Class A shares was $20.17 which reflects a sales charge of 4.25%. |
See notes to financial statements.
| | |
| |
| abfunds.com | | AB WEALTH APPRECIATION STRATEGY | 17 |
STATEMENT OF OPERATIONS
Six Months Ended February 28, 2021 (unaudited)
| | | | | | | | |
| Investment Income | | | | | | | | |
Dividends | | | | | | | | |
Affiliated issuers | | $ | 6,547,759 | | | | | |
Unaffiliated issuers (net of foreign taxes withheld of $12,577) | | | 4,560,149 | | | | | |
Securities lending income | | | 5,279 | | | $ | 11,113,187 | |
| | | | | | | | |
| Expenses | | | | | | | | |
Advisory fee (see Note B) | | | 4,123,154 | | | | | |
Distribution fee—Class A | | | 454,814 | | | | | |
Distribution fee—Class C | | | 75,895 | | | | | |
Distribution fee—Class R | | | 4,881 | | | | | |
Distribution fee—Class K | | | 11,172 | | | | | |
Transfer agency—Class A | | | 90,771 | | | | | |
Transfer agency—Class C | | | 4,277 | | | | | |
Transfer agency—Advisor Class | | | 219,228 | | | | | |
Transfer agency—Class R | | | 2,538 | | | | | |
Transfer agency—Class K | | | 8,937 | | | | | |
Custody and accounting | | | 85,607 | | | | | |
Registration fees | | | 49,156 | | | | | |
Printing | | | 42,649 | | | | | |
Administrative | | | 36,219 | | | | | |
Audit and tax | | | 28,307 | | | | | |
Legal | | | 23,401 | | | | | |
Trustees’ fees | | | 17,627 | | | | | |
Miscellaneous | | | 23,540 | | | | | |
| | | | | | | | |
Total expenses | | | 5,302,173 | | | | | |
Less: expenses waived and reimbursed by the Adviser (see Note B) | | | (2,294,721 | ) | | | | |
| | | | | | | | |
Net expenses | | | | | | | 3,007,452 | |
| | | | | | | | |
Net investment income | | | | | | | 8,105,735 | |
| | | | | | | | |
| Realized and Unrealized Gain (Loss) on Investment and Foreign Currency Transactions | | | | | | | | |
Net realized gain on: | | | | | | | | |
Affiliated Underlying Portfolios | | | | | | | 1,770,512 | |
Investment transactions | | | | | | | 33,631,662 | |
Foreign currency transactions | | | | | | | 157 | |
Net realized gain distributions from Affiliated Underlying Portfolios | | | | | | | 5,021,276 | |
Net change in unrealized appreciation/depreciation of: | | | | | | | | |
Affiliated Underlying Portfolios | | | | | | | 85,425,042 | |
Investments | | | | | | | 30,726,085 | |
Foreign currency denominated assets and liabilities | | | | | | | (987 | ) |
| | | | | | | | |
Net gain on investment and foreign currency transactions | | | | | | | 156,573,747 | |
| | | | | | | | |
Net Increase in Net Assets from Operations | | | | | | $ | 164,679,482 | |
| | | | | | | | |
See notes to financial statements.
| | |
| |
18 | AB WEALTH APPRECIATION STRATEGY | | abfunds.com |
STATEMENT OF CHANGES IN NET ASSETS
| | | | | | | | |
| | | Six Months Ended
February 28, 2021
(unaudited) | | | Year Ended
August 31,
2020 | |
| Increase in Net Assets from Operations | | | | | | | | |
Net investment income | | $ | 8,105,735 | | | $ | 16,489,808 | |
Net realized gain on investment and foreign currency transactions | | | 35,402,331 | | | | 15,785,520 | |
Net realized gain distributions from Affiliated Underlying Portfolios | | | 5,021,276 | | | | 2,855,551 | |
Net change in unrealized appreciation/depreciation of investments and foreign currency denominated assets and liabilities | | | 116,150,140 | | | | 110,804,247 | |
| | | | | | | | |
Net increase in net assets from operations | | | 164,679,482 | | | | 145,935,126 | |
Distributions to Shareholders | |
Class A | | | (10,398,366 | ) | | | (14,132,922 | ) |
Class C | | | (287,019 | ) | | | (647,878 | ) |
Advisor Class | | | (27,251,883 | ) | | | (36,481,767 | ) |
Class R | | | (49,181 | ) | | | (59,482 | ) |
Class K | | | (244,459 | ) | | | (393,909 | ) |
Class I | | | – 0 | – | | | (17,215 | ) |
| Transactions in Shares of Beneficial Interest | | | | | | | | |
Net decrease | | | (60,279,407 | ) | | | (107,267,390 | ) |
| | | | | | | | |
Total increase (decrease) | | | 66,169,167 | | | | (13,065,437 | ) |
| Net Assets | | | | | | | | |
Beginning of period | | | 1,247,185,682 | | | | 1,260,251,119 | |
| | | | | | | | |
End of period | | $ | 1,313,354,849 | | | $ | 1,247,185,682 | |
| | | | | | | | |
See notes to financial statements.
| | |
| |
| abfunds.com | | AB WEALTH APPRECIATION STRATEGY | 19 |
NOTES TO FINANCIAL STATEMENTS
February 28, 2021 (unaudited)
NOTE A
Significant Accounting Policies
The AB Portfolios (the “Company”) is registered under the Investment Company Act of 1940 as a diversified, open end management investment company. The Company, which is a Massachusetts Business Trust, operates as a series company currently comprised of six series. Each series is considered to be a separate entity for financial reporting and tax purposes. This report relates only to the AB Wealth Appreciation Strategy (the “Fund”). The Fund offers Class A, Class C, Advisor Class, Class R and Class K shares. Class B, Class I and Class T shares have been authorized but currently are not offered. Effective August 2, 2019, sales of Class B shares were suspended. On November 7, 2019, all remaining outstanding Class B shares of the Fund were converted to Class A shares. Class A shares are sold with a front-end sales charge of up to 4.25% for purchases not exceeding $1,000,000. With respect to purchases of $1,000,000 or more, Class A shares redeemed within one year of purchase may be subject to a contingent deferred sales charge of 1%. Class C shares are subject to a contingent deferred sales charge of 1% on redemptions made within the first year after purchase, and 0% after the first year of purchase. Class C shares will automatically convert to Class A shares ten years after the end of the calendar month of purchase. Class R and Class K shares are sold without an initial or contingent deferred sales charge. Advisor Class and Class I shares are sold without an initial or contingent deferred sales charge and are not subject to ongoing distribution expenses. All eight classes of shares have identical voting, dividend, liquidation and other rights, except that the classes bear different distribution and transfer agency expenses. Each class has exclusive voting rights with respect to its distribution plan. The financial statements have been prepared in conformity with U.S. generally accepted accounting principles (“U.S. GAAP”), which require management to make certain estimates and assumptions that affect the reported amounts of assets and liabilities in the financial statements and amounts of income and expenses during the reporting period. Actual results could differ from those estimates. The Fund is an investment company under U.S. GAAP and follows the accounting and reporting guidance applicable to investment companies. The following is a summary of significant accounting policies followed by the Fund.
1. Security Valuation
Portfolio securities are valued at their current market value determined on the basis of market quotations or, if market quotations are not readily available or are deemed unreliable, at “fair value” as determined in accordance with procedures established by and under the general supervision of the Company’s Board of Trustees (the “Board”).
| | |
| |
20 | AB WEALTH APPRECIATION STRATEGY | | abfunds.com |
NOTES TO FINANCIAL STATEMENTS (continued)
In general, the market values of securities which are readily available and deemed reliable are determined as follows: securities listed on a national securities exchange (other than securities listed on the NASDAQ Stock Market, Inc. (“NASDAQ”)) or on a foreign securities exchange are valued at the last sale price at the close of the exchange or foreign securities exchange. If there has been no sale on such day, the securities are valued at the last traded price from the previous day. Securities listed on more than one exchange are valued by reference to the principal exchange on which the securities are traded; securities listed only on NASDAQ are valued in accordance with the NASDAQ Official Closing Price; listed or over the counter (“OTC”) market put or call options are valued at the mid level between the current bid and ask prices. If either a current bid or current ask price is unavailable, AllianceBernstein L.P. (the “Adviser”) will have discretion to determine the best valuation (e.g., last trade price in the case of listed options); open futures are valued using the closing settlement price or, in the absence of such a price, the most recent quoted bid price. If there are no quotations available for the day of valuation, the last available closing settlement price is used; U.S. Government securities and any other debt instruments having 60 days or less remaining until maturity are generally valued at market by an independent pricing vendor, if a market price is available. If a market price is not available, the securities are valued at amortized cost. This methodology is commonly used for short term securities that have an original maturity of 60 days or less, as well as short term securities that had an original term to maturity that exceeded 60 days. In instances when amortized cost is utilized, the Valuation Committee (the “Committee”) must reasonably conclude that the utilization of amortized cost is approximately the same as the fair value of the security. Such factors the Committee will consider include, but are not limited to, an impairment of the creditworthiness of the issuer or material changes in interest rates. Fixed-income securities, including mortgage-backed and asset-backed securities, may be valued on the basis of prices provided by a pricing service or at a price obtained from one or more of the major broker-dealers. In cases where broker-dealer quotes are obtained, the Adviser may establish procedures whereby changes in market yields or spreads are used to adjust, on a daily basis, a recently obtained quoted price on a security. Swaps and other derivatives are valued daily, primarily using independent pricing services, independent pricing models using market inputs, as well as third party broker-dealers or counterparties. Open-end mutual funds are valued at the closing net asset value per share, while exchange traded funds are valued at the closing market price per share.
Securities for which market quotations are not readily available (including restricted securities) or are deemed unreliable are valued at fair value as deemed appropriate by the Adviser. Factors considered in making this
| | |
| |
| abfunds.com | | AB WEALTH APPRECIATION STRATEGY | 21 |
NOTES TO FINANCIAL STATEMENTS (continued)
determination may include, but are not limited to, information obtained by contacting the issuer, analysts, analysis of the issuer’s financial statements or other available documents. In addition, the Fund may use fair value pricing for securities primarily traded in non-U.S. markets because most foreign markets close well before the Fund values its securities at 4:00 p.m., Eastern Time. The earlier close of these foreign markets gives rise to the possibility that significant events, including broad market moves, may have occurred in the interim and may materially affect the value of those securities. To account for this, the Fund generally values many of its foreign equity securities using fair value prices based on third party vendor modeling tools to the extent available.
2. Fair Value Measurements
In accordance with U.S. GAAP regarding fair value measurements, fair value is defined as the price that the Fund would receive to sell an asset or pay to transfer a liability in an orderly transaction between market participants at the measurement date. U.S. GAAP establishes a framework for measuring fair value, and a three-level hierarchy for fair value measurements based upon the transparency of inputs to the valuation of an asset or liability (including those valued based on their market values as described in Note A.1 above). Inputs may be observable or unobservable and refer broadly to the assumptions that market participants would use in pricing the asset or liability. Observable inputs reflect the assumptions market participants would use in pricing the asset or liability based on market data obtained from sources independent of the Fund. Unobservable inputs reflect the Fund’s own assumptions about the assumptions that market participants would use in pricing the asset or liability based on the best information available in the circumstances. Each investment is assigned a level based upon the observability of the inputs which are significant to the overall valuation. The three-tier hierarchy of inputs is summarized below.
| | • | | Level 1—quoted prices in active markets for identical investments |
| | • | | Level 2—other significant observable inputs (including quoted prices for similar investments, interest rates, prepayment speeds, credit risk, etc.) |
| | • | | Level 3—significant unobservable inputs (including the Fund’s own assumptions in determining the fair value of investments) |
Where readily available market prices or relevant bid prices are not available for certain equity investments, such investments may be valued based on similar publicly traded investments, movements in relevant indices since last available prices or based upon underlying company fundamentals and comparable company data (such as multiples to earnings or other multiples to equity). Where an investment is valued using an observable input, such as another publicly traded security, the investment will be classified
| | |
| |
22 | AB WEALTH APPRECIATION STRATEGY | | abfunds.com |
NOTES TO FINANCIAL STATEMENTS (continued)
as Level 2. If management determines that an adjustment is appropriate based on restrictions on resale, illiquidity or uncertainty, and such adjustment is a significant component of the valuation, the investment will be classified as Level 3. An investment will also be classified as Level 3 where management uses company fundamentals and other significant inputs to determine the valuation.
The following table summarizes the valuation of the Fund’s investments by the above fair value hierarchy levels as of February 28, 2021:
| | | | | | | | | | | | | | | | |
Investments in
Securities: | | Level 1 | | | Level 2 | | | Level 3 | | | Total | |
Assets: | |
Common Stocks(a) | | $ | 670,585,989 | | | $ | – 0 | – | | $ | – 0 | – | | $ | 670,585,989 | |
Investment Companies | | | 638,384,972 | | | | – 0 | – | | | – 0 | – | | | 638,384,972 | |
Short-Term Investments | | | 4,628,708 | | | | – 0 | – | | | – 0 | – | | | 4,628,708 | |
Investments of Cash Collateral for Securities Loaned in Affiliated Money Market Fund | | | 76,665 | | | | – 0 | – | | | – 0 | – | | | 76,665 | |
| | | | | | | | | | | | | | | | |
Total Investments in Securities | | | 1,313,676,334 | | | | – 0 | – | | | – 0 | – | | | 1,313,676,334 | |
Other Financial Instruments(b) | | | – 0 | – | | | – 0 | – | | | – 0 | – | | | – 0 | – |
| | | | | | | | | | | | | | | | |
Total | | $ | 1,313,676,334 | | | $ | – 0 | – | | $ | – 0 | – | | $ | 1,313,676,334 | |
| | | | | | | | | | | | | | | | |
| (a) | See Portfolio of Investments for sector classifications. |
| (b) | Other financial instruments are derivative instruments, such as futures, forwards and swaps, which are valued at the unrealized appreciation/(depreciation) on the instrument. Other financial instruments may also include swaps with upfront premiums, options written and swaptions written which are valued at market value. |
3. Currency Translation
Assets and liabilities denominated in foreign currencies and commitments under forward currency exchange contracts are translated into U.S. dollars at the mean of the quoted bid and ask prices of such currencies against the U.S. dollar. Purchases and sales of portfolio securities are translated into U.S. dollars at the rates of exchange prevailing when such securities were acquired or sold. Income and expenses are translated into U.S. dollars at rates of exchange prevailing when accrued.
Net realized gain or loss on foreign currency transactions represents foreign exchange gains and losses from sales and maturities of foreign fixed income investments, holding of foreign currencies, currency gains or losses realized between the trade and settlement dates on foreign investment transactions, and the difference between the amounts of dividends, interest and foreign withholding taxes recorded on the Fund’s books and
| | |
| |
| abfunds.com | | AB WEALTH APPRECIATION STRATEGY | 23 |
NOTES TO FINANCIAL STATEMENTS (continued)
the U.S. dollar equivalent amounts actually received or paid. Net unrealized currency gains and losses from valuing foreign currency denominated assets and liabilities at period end exchange rates are reflected as a component of net unrealized appreciation or depreciation of foreign currency denominated assets and liabilities.
4. Taxes
It is the Fund’s policy to meet the requirements of the Internal Revenue Code applicable to regulated investment companies and to distribute all of its investment company taxable income and net realized gains, if any, to shareholders. Therefore, no provisions for federal income or excise taxes are required. Taxes are accrued and applied to net investment income, net realized gains and net unrealized appreciation/depreciation as such income and/or gains are earned.
In accordance with U.S. GAAP requirements regarding accounting for uncertainties in income taxes, management has analyzed the Fund’s tax positions taken or expected to be taken on federal and state income tax returns for all open tax years (the current and the prior three tax years) and has concluded that no provision for income tax is required in the Fund’s financial statements.
5. Investment Income and Investment Transactions
Dividend income is recorded on the ex-dividend date or as soon as the Fund is informed of the dividend. Interest income is accrued daily. Investment transactions are accounted for on the date the securities are purchased or sold. Investment gains or losses are determined on the identified cost basis. The Fund amortizes premiums and accretes discounts as adjustments to interest income. The Fund accounts for distributions received from REIT investments or from regulated investment companies as dividend income, realized gain, or return of capital based on information provided by the REIT or the investment company.
6. Class Allocations
All income earned and expenses incurred by the Fund are borne on a pro-rata basis by each outstanding class of shares, based on the proportionate interest in the Fund represented by the net assets of such class, except for class specific expenses which are allocated to the respective class. Expenses of the Company are charged proportionately to each series or based on other appropriate methods. Realized and unrealized gains and losses are allocated among the various share classes based on respective net assets.
7. Dividends and Distributions
Dividends and distributions to shareholders, if any, are recorded on the ex-dividend date. Income dividends and capital gains distributions are
| | |
| |
24 | AB WEALTH APPRECIATION STRATEGY | | abfunds.com |
NOTES TO FINANCIAL STATEMENTS (continued)
determined in accordance with federal tax regulations and may differ from those determined in accordance with U.S. GAAP. To the extent these differences are permanent, such amounts are reclassified within the capital accounts based on their federal tax basis treatment; temporary differences do not require such reclassification.
NOTE B
Advisory Fee and Other Transactions with Affiliates
Under the terms of the investment advisory agreement (the “Advisory Agreement”), the Fund pays the Adviser an advisory fee at an annual rate of .65% of the first $2.5 billion, .55% of the next $2.5 billion and .50% in excess of $5 billion of the Fund’s average daily net assets. The fee is accrued daily and paid monthly.
Pursuant to the investment advisory agreement, the Fund may reimburse the Adviser for certain legal and accounting services provided to the Fund by the Adviser. For the six months ended February 28, 2021, the reimbursement for such services amounted to $36,219.
The Fund compensates AllianceBernstein Investor Services, Inc. (“ABIS”), a wholly-owned subsidiary of the Adviser, under a Transfer Agency Agreement for providing personnel and facilities to perform transfer agency services for the Fund. ABIS may make payments to intermediaries that provide omnibus account services, sub-accounting services and/or networking services. Such compensation retained by ABIS amounted to $130,509 for the six months ended February 28, 2021.
AllianceBernstein Investments, Inc. (the “Distributor”), a wholly-owned subsidiary of the Adviser, serves as the distributor of the Fund’s shares. The Distributor has advised the Fund that it has retained front-end sales charges of $1,972 from the sale of Class A shares and received $265 and $306 in contingent deferred sales charges imposed upon redemptions by shareholders of Class A and Class C shares, respectively, for the six months ended February 28, 2021.
The Fund may invest in AB Government Money Market Portfolio (the “Government Money Market Portfolio”) which has a contractual annual advisory fee rate of .20% of the portfolio’s average daily net assets and bears its own expenses. The Adviser has contractually agreed to waive .10% of the advisory fee of Government Money Market Portfolio (resulting in a net advisory fee of .10%) until August 31, 2021. In connection with the investment by the Fund in Government Money Market Portfolio, the Adviser has contractually agreed to waive its advisory fee from the Fund in an amount equal to the Fund’s pro rata share of the effective advisory fee of Government Money Market Portfolio, as borne indirectly by the Fund as an acquired fund fee and expense. For the six months ended February 28, 2021, such waiver amounted to $1,493.
| | |
| |
| abfunds.com | | AB WEALTH APPRECIATION STRATEGY | 25 |
NOTES TO FINANCIAL STATEMENTS (continued)
In connection with the Fund’s investments in other AB mutual funds, the Adviser has contractually agreed to waive fees and/or reimburse the expenses payable to the Adviser by the Fund in an amount equal to the Fund’s pro rata share of the effective advisory fees of AB mutual funds, as paid by the Fund as an acquired fund fee and expense. These fee waivers and/or expense reimbursements will remain in effect until December 31, 2021. For the six months ended February 28, 2021, such waivers and/or reimbursements amounted to $2,293,228.
A summary of the Fund’s transactions in AB mutual funds for the six months ended February 28, 2021 is as follows:
| | | | | | | | | | | | | | | | | | | | | | | | | | | | | | | | |
| | | | Distributions | |
| Fund | | Market
Value
8/31/20
(000) | | | Purchases
at Cost
(000) | | | Sales
Proceeds
(000) | | | Realized
Gain
(Loss)
(000) | | | Change in
Unrealized
Appr./
(Depr.)
(000) | | | Market
Value
2/28/21
(000) | | | Dividend
Income
(000) | | | Realized
Gains
(000) | |
Government Money Market Portfolio | | $ | 2,995 | | | $ | 80,131 | | | $ | 78,497 | | | $ | – 0 | – | | $ | – 0 | – | | $ | 4,629 | | | $ | 1 | | | $ | – 0 | – |
AB Discovery Growth Fund, Inc. | | | 35,906 | | | | 7,422 | | | | 4,640 | | | | 1,301 | | | | 3,576 | | | | 43,565 | | | | 135 | | | | 5,021 | |
AB Trust—AB Discovery Value Fund | | | 28,050 | | | | 5,587 | | | | 4,442 | | | | (396 | ) | | | 13,602 | | | | 42,401 | | | | 332 | | | | – 0 | – |
Bernstein Fund, Inc.: | | | | | | | | | | | | | | | | | | | | | | | | | | | | | | | | |
International Small Cap Portfolio | | | 73,856 | | | | 938 | | | | 6,249 | | | | (206 | ) | | | 11,946 | | | | 80,285 | | | | 938 | | | | – 0 | – |
International Strategic Equities Portfolio | | | 243,778 | | | | 145,738 | † | | | 22,079 | | | | 1,319 | | | | 35,314 | | | | 404,070 | | | | 3,382 | | | | – 0 | – |
Small Cap Core Portfolio | | | 34,552 | | | | 153 | | | | 12,355 | | | | (602 | ) | | | 9,304 | | | | 31,052 | | | | 153 | | | | – 0 | – |
Sanford C. Bernstein Fund, Inc.: | | | | | | | | | | | | | | | | | | | | | | | | | | | | | | | | |
Emerging Markets Portfolio | | | 33,805 | | | | 765 | | | | 5,670 | | | | 432 | | | | 7,679 | | | | 37,011 | | | | 765 | | | | – 0 | – |
International Portfolio | | | 137,262 | | | | 842 | | | | 142,031 | † | | | (77 | ) | | | 4,004 | | | | – 0 | – | | | 842 | | | | – 0 | – |
Government Money Market Portfolio* | | | – 0 | – | | | 77 | | | | – 0 | – | | | – 0 | – | | | – 0 | – | | | 77 | | | | – 0 | – | | | – 0 | – |
| | | | | | | | | | | | | | | | | | | | | | | | | | | | | | | | |
Total | | | | | | | | | | | | | | $ | 1,771 | | | $ | 85,425 | | | $ | 643,090 | | | $ | 6,548 | | | $ | 5,021 | |
| | | | | | | | | | | | | | | | | | | | | | | | | | | | | | | | |
| † | Includes $140,239,507 of purchases / sales resulting from the merger of the International Portfolio into the International Strategic Equities Portfolio, which took place on December 4, 2020. |
| * | Investments of cash collateral for securities lending transactions (see Note E). |
| | |
| |
26 | AB WEALTH APPRECIATION STRATEGY | | abfunds.com |
NOTES TO FINANCIAL STATEMENTS (continued)
Brokerage commissions paid on investment transactions for the six months ended February 28, 2021 amounted to $41,439, of which $1,947 and $0, respectively, was paid to Sanford C. Bernstein & Co. LLC and Sanford C. Bernstein Limited, affiliates of the Adviser.
During the second quarter of 2018, AXA S.A. (“AXA”), a French holding company for the AXA Group, completed the sale of a minority stake in its subsidiary, AXA Equitable Holdings, Inc. (now named Equitable Holdings, Inc.)(“Equitable”), through an initial public offering. Equitable is the holding company for a diverse group of financial services companies, including an approximate 65% economic interest in the Adviser and a 100% interest in AllianceBernstein Corporation, the general partner of the Adviser. Since the initial sale, AXA has completed additional offerings, most recently during the fourth quarter of 2019. As a result, AXA currently owns less than 10% of the outstanding shares of common stock of Equitable, and no longer owns a controlling interest in Equitable. AXA previously announced its intention to sell its entire interest in Equitable over time, subject to market conditions and other factors (the “Plan”). Most of AXA’s remaining Equitable shares are to be delivered on redemption of AXA bonds mandatorily exchangeable into Equitable shares and maturing in May 2021. AXA retains sole discretion to determine the timing of any future sales of its remaining shares of Equitable common stock.
Sales under the Plan that were completed on November 13, 2019 resulted in the indirect transfer of a “controlling block” of voting securities of the Adviser (a “Change of Control Event”) and may have been deemed to have been an “assignment” causing a termination of the Fund’s investment advisory and administration agreements. In order to ensure that investment advisory and administration services could continue uninterrupted in the event of a Change of Control Event, the Board previously approved new investment advisory and administration agreements with the Adviser, and shareholders of the Fund subsequently approved the new investment advisory agreement. These agreements became effective on November 13, 2019.
NOTE C
Distribution Plan
The Fund has adopted a Plan for each class of shares of the Fund pursuant to Rule 12b-1 under the Investment Company Act of 1940 (the “Plan”). Under the Plan, the Fund pays distribution and servicing fees to the Distributor at an annual rate of up to .50% of the Fund’s average daily net assets attributable to Class A shares, 1% of the Fund’s average daily net assets attributable to Class C shares, .50% of the Fund’s average daily net assets attributable to Class R shares and .25% of the Fund’s average daily net assets attributable to Class K shares. There are no distribution
| | |
| |
| abfunds.com | | AB WEALTH APPRECIATION STRATEGY | 27 |
NOTES TO FINANCIAL STATEMENTS (continued)
and servicing fees on the Advisor Class and Class I shares. The fees are accrued daily and paid monthly. Payments under the Plan in respect of Class A shares are currently limited to an annual rate of .25% of Class A shares’ average daily net assets. The Plan provides that the Distributor will use such payments in their entirety for distribution assistance and promotional activities. The Fund is not obligated under the Plan to pay any distribution services fee in excess of the amounts set forth above. The purpose of the payments to the Distributor under the Plan is to compensate the Distributor for its distribution services with respect to the sale of the Fund’s shares. Since the Distributor’s compensation is not directly tied to its expenses, the amount of compensation received by it under the Plan during any year may be more or less than its actual expenses. For this reason, the Plan is characterized by the staff of the Securities and Exchange Commission as being of the “compensation” plan.
In the event that the Plan is terminated or not continued, no distribution services fees (other than current amounts accrued but not yet paid) would be owed by the Fund to the Distributor with respect to the relevant class. The Plan also provides that the Adviser may use its own resources to finance the distribution of the Fund’s shares.
NOTE D
Investment Transactions
Purchases and sales of investment securities (excluding short-term investments) for the six months ended February 28, 2021 were as follows:
| | | | | | | | |
| | | Purchases | | | Sales | |
Investment securities (excluding U.S. government securities) | | $ | 133,408,703 | | | $ | 216,498,845 | |
U.S. government securities | | | – 0 | – | | | – 0 | – |
The cost of investments for federal income tax purposes was substantially the same as the cost for financial reporting purposes. Accordingly, gross unrealized appreciation and unrealized depreciation are as follows:
| | | | |
Gross unrealized appreciation | | $ | 286,104,743 | |
Gross unrealized depreciation | | | (9,133,616 | ) |
| | | | |
Net unrealized appreciation | | $ | 276,971,127 | |
| | | | |
1. Derivative Financial Instruments
The Fund may use derivatives in an effort to earn income and enhance returns, to replace more traditional direct investments, to obtain exposure to otherwise inaccessible markets (collectively, “investment purposes”), or to hedge or adjust the risk profile of its portfolio.
| | |
| |
28 | AB WEALTH APPRECIATION STRATEGY | | abfunds.com |
NOTES TO FINANCIAL STATEMENTS (continued)
The Fund did not engage in derivatives transactions for the six months ended February 28, 2021.
2. Currency Transactions
The Fund may invest in non-U.S. Dollar-denominated securities on a currency hedged or unhedged basis. The Fund may seek investment opportunities by taking long or short positions in currencies through the use of currency-related derivatives, including forward currency exchange contracts, futures and options on futures, swaps, and other options. The Fund may enter into transactions for investment opportunities when it anticipates that a foreign currency will appreciate or depreciate in value but securities denominated in that currency are not held by the Fund and do not present attractive investment opportunities. Such transactions may also be used when the Adviser believes that it may be more efficient than a direct investment in a foreign currency-denominated security. The Fund may also conduct currency exchange contracts on a spot basis (i.e., for cash at the spot rate prevailing in the currency exchange market for buying or selling currencies).
NOTE E
Securities Lending
The Fund may enter into securities lending transactions. Under the Fund’s securities lending program, all loans of securities will be collateralized continually by cash collateral and/or non-cash collateral. Non-cash collateral will include only securities issued or guaranteed by the U.S. government or its agencies or instrumentalities. The Fund cannot sell or repledge any non-cash collateral, such collateral will not be reflected in the portfolio of investments. If a loan is collateralized by cash, the Fund will be compensated for the loan from a portion of the net return from the income earned on cash collateral after a rebate is paid to the borrower (in some cases, this rebate may be a “negative rebate” or fee paid by the borrower to the Fund in connection with the loan), and payments are made for fees of the securities lending agent and for certain other administrative expenses. If the Fund receives non-cash collateral, the Fund will receive a fee from the borrower generally equal to a negotiated percentage of the market value of the loaned securities. The Fund will have the right to call a loan and obtain the securities loaned at any time on notice to the borrower within the normal and customary settlement time for the securities. While the securities are on loan, the borrower is obligated to pay the Fund amounts equal to any income or other distributions from the securities; however, these distributions will not be afforded the same preferential tax treatment as qualified dividends. The Fund will not be able to exercise voting rights with respect to any securities during the existence of a loan, but will have the right to regain ownership of loaned securities in order to exercise voting or other ownership rights. Collateral received and securities loaned are
| | |
| |
| abfunds.com | | AB WEALTH APPRECIATION STRATEGY | 29 |
NOTES TO FINANCIAL STATEMENTS (continued)
marked to market daily to ensure that the securities loaned are secured by collateral. The lending agent currently invests the cash collateral received in Government Money Market Portfolio, an eligible money market vehicle, in accordance with the investment restrictions of the Fund, and as approved by the Board. The collateral received on securities loaned is recorded as an asset as well as a corresponding liability in the statement of assets and liabilities. The collateral will be adjusted the next business day to maintain the required collateral amount. The amounts of securities lending income from the borrowers and Government Money Market Portfolio are reflected in the statement of operations. When the Fund earns net securities lending income from Government Money Market Portfolio, the income is inclusive of a rebate expense paid to the borrower. In connection with the cash collateral investment by the Fund in Government Money Market Portfolio, the Adviser has agreed to waive a portion of the Fund’s share of the advisory fees of Government Money Market Portfolio, as borne indirectly by the Fund as an acquired fund fee and expense. When the Fund lends securities, its investment performance will continue to reflect changes in the value of the securities loaned. A principal risk of lending portfolio securities is that the borrower may fail to return the loaned securities upon termination of the loan and that the collateral will not be sufficient to replace the loaned securities. The lending agent has agreed to indemnify the Fund in the case of default of any securities borrower.
A summary of the Fund’s transactions surrounding securities lending for the six months ended February 28, 2021 is as follows:
| | | | | | | | | | | | | | | | | | | | | | |
Market
Value of
Securities on Loan* | | | Cash
Collateral* | | | Market Value
of Non-Cash
Collateral* | | | Income from
Borrowers | | | Government
Money Market
Portfolio | |
| | Income
Earned | | | Advisory Fee
Waived | |
| $ | 74,971 | | | $ | 76,665 | | | $ | – 0 – | | | $ | 5,279 | | | $ | – 0 – | | | $ | – 0 – | |
| * | As of February 28, 2021. |
| | |
| |
30 | AB WEALTH APPRECIATION STRATEGY | | abfunds.com |
NOTES TO FINANCIAL STATEMENTS (continued)
NOTE F
Shares of Beneficial Interest
Transactions in shares of beneficial interest for each class were as follows:
| | | | | | | | | | | | | | | | | | | | | | | | |
| | | | | | | | | | | | | | | | | | | | | | | | |
| | | Shares | | | | | | Amount | | | | |
| | | Six Months Ended
February 28, 2021
(unaudited) | | | Year Ended
August 31,
2020 | | | | | | Six Months Ended
February 28, 2021
(unaudited) | | | Year Ended
August 31, 2020 | | | | |
| | | | | | | | |
| Class A | | | | | | | | | | | | | | | | | | | | | | | | |
Shares sold | | | 145,520 | | | | 532,296 | | | | | | | $ | 2,668,045 | | | $ | 8,669,759 | | | | | |
| | | | | |
Shares issued in reinvestment of dividends and distributions | | | 534,095 | | | | 783,909 | | | | | | | | 9,747,243 | | | | 13,310,783 | | | | | |
| | | | | |
Shares converted from Class B | | | – 0 | – | | | 232,717 | | | | | | | | – 0 | – | | | 3,978,652 | | | | | |
| | | | | |
Shares converted from Class C | | | 140,742 | | | | 305,044 | | | | | | | | 2,486,575 | | | | 4,860,832 | | | | | |
| | | | | |
Shares redeemed | | | (1,439,683 | ) | | | (3,273,492 | ) | | | | | | | (26,346,156 | ) | | | (51,978,107 | ) | | | | |
| | | | | |
Net decrease | | | (619,326 | ) | | | (1,419,526 | ) | | | | | | $ | (11,444,293 | ) | | $ | (21,158,081 | ) | | | | |
| | | | | |
| | | | | | | | | | | | | | | | | | | | | | | | |
| Class B | | | | | | | | | | | | | | | | | | | | | | | | |
Shares sold | | | – 0 | – | | | 809 | | | | | | | | – 0 | – | | $ | 13,784 | | | | | |
| | | | | |
Shares converted to Class A | | | – 0 | – | | | (230,288 | ) | | | | | | | – 0 | – | | | (3,978,652 | ) | | | | |
| | | | | |
Shares redeemed | | | – 0 | – | | | (4,629 | ) | | | | | | | – 0 | – | | | (77,453 | ) | | | | |
| | | | | |
Net decrease | | | – 0 | – | | | (234,108 | ) | | | | | | $ | – 0 | – | | $ | (4,042,321 | ) | | | | |
| | | | | |
| | | | | | | | | | | | | | | | | | | | | | | | |
| Class C | | | | | | | | | | | | | | | | | | | | | | | | |
Shares sold | | | 11,738 | | | | 55,363 | | | | | | | $ | 215,094 | | | $ | 869,409 | | | | | |
| | | | | |
Shares issued in reinvestment of dividends and distributions | | | 14,813 | | | | 34,958 | | | | | | | | 272,558 | | | | 597,439 | | | | | |
| | | | | |
Shares converted to Class A | | | (140,538 | ) | | | (304,314 | ) | | | | | | | (2,486,575 | ) | | | (4,860,832 | ) | | | | |
| | | | | |
Shares redeemed | | | (60,424 | ) | | | (299,721 | ) | | | | | | | (1,111,086 | ) | | | (4,744,056 | ) | | | | |
| | | | | |
Net decrease | | | (174,411 | ) | | | (513,714 | ) | | | | | | $ | (3,110,009 | ) | | $ | (8,138,040 | ) | | | | |
| | | | | |
| | | | | | | | | | | | | | | | | | | | | | | | |
| Advisor Class | | | | | | | | | | | | | | | | | | | | | | | | |
Shares sold | | | 1,468,698 | | | | 4,522,411 | | | | | | | $ | 26,944,411 | | | $ | 71,519,773 | | | | | |
| | | | | |
Shares issued in reinvestment of dividends and distributions | | | 1,447,054 | | | | 2,062,329 | | | | | | | | 26,307,441 | | | | 34,873,984 | | | | | |
| | | | | |
Shares redeemed | | | (5,338,007 | ) | | | (11,150,478 | ) | | | | | | | (98,653,389 | ) | | | (177,034,483 | ) | | | | |
| | | | | |
Net decrease | | | (2,422,255 | ) | | | (4,565,738 | ) | | | | | | $ | (45,401,537 | ) | | $ | (70,640,726 | ) | | | | |
| | | | | |
| | |
| |
| abfunds.com | | AB WEALTH APPRECIATION STRATEGY | 31 |
NOTES TO FINANCIAL STATEMENTS (continued)
| | | | | | | | | | | | | | | | | | | | | | | | |
| | | | | | | | | | | | | | | | | | | | | | | | |
| | | Shares | | | | | | Amount | | | | |
| | | Six Months Ended
February 28, 2021
(unaudited) | | | Year Ended
August 31,
2020 | | | | | | Six Months Ended
February 28, 2021
(unaudited) | | | Year Ended
August 31, 2020 | | | | |
| | | | | | | | |
| Class R | | | | | | | | | | | | | | | | | | | | | | | | |
Shares sold | | | 3,902 | | | | 13,003 | | | | | | | $ | 70,897 | | | $ | 197,780 | | | | | |
| | | | | |
Shares issued in reinvestment of dividends and distributions | | | 2,704 | | | | 3,512 | | | | | | | | 49,180 | | | | 59,482 | | | | | |
Shares redeemed | | | (8,047 | ) | | | (49,896 | ) | | | | | | | (149,827 | ) | | | (836,228 | ) | | | | |
| | | | | |
Net decrease | | | (1,441 | ) | | | (33,381 | ) | | | | | | $ | (29,750 | ) | | $ | (578,966 | ) | | | | |
| | | | | |
| | | | | | | | | | | | | | | | | | | | | | | | |
| Class K | | | | | | | | | | | | | | | | | | | | | | | | |
Shares sold | | | 33,004 | | | | 59,458 | | | | | | | $ | 614,350 | | | $ | 957,846 | | | | | |
| | | | | |
Shares issued in reinvestment of dividends and distributions | | | 13,476 | | | | 23,350 | | | | | | | | 244,457 | | | | 393,907 | | | | | |
| | | | | |
Shares redeemed | | | (63,212 | ) | | | (239,301 | ) | | | | | | | (1,152,625 | ) | | | (3,728,898 | ) | | | | |
| | | | | |
Net decrease | | | (16,732 | ) | | | (156,493 | ) | | | | | | $ | (293,818 | ) | | $ | (2,377,145 | ) | | | | |
| | | | | |
| | | | | | | | | | | | | | | | | | | | | | | | |
| Class I | | | | | | | | | | | | | | | | | | | | | | | | |
Shares sold | | | – 0 | – | | | 1,463 | | | | | | | $ | – 0 | – | | $ | 23,635 | | | | | |
| | | | | |
Shares issued in reinvestment of dividends and distributions | | | – 0 | – | | | 1,017 | | | | | | | | – 0 | – | | | 17,215 | | | | | |
| | | | | |
Shares redeemed | | | – 0 | – | | | (26,306 | ) | | | | | | | – 0 | – | | | (372,961 | ) | | | | |
| | | | | |
Net decrease | | | – 0 | – | | | (23,826 | ) | | | | | | $ | – 0 | – | | $ | (332,111 | ) | | | | |
| | | | | |
NOTE G
Risks Involved in Investing in the Fund
Market Risk—The value of the Fund’s assets will fluctuate as the stock, bond or commodities markets fluctuate. The value of its investments may decline, sometimes rapidly and unpredictably, simply because of economic changes or other events, including public health crises (including the occurrence of a contagious disease or illness), that affect large portions of the market. It includes the risk that a particular style of investing, such as growth or value, may be underperforming the stock market generally.
Foreign (Non-U.S.) Risk—Investments in securities of non-U.S. issuers may involve more risk than those of U.S. issuers. These securities may fluctuate more widely in price and may be more difficult to trade due to adverse market, economic, political, regulatory or other factors.
Currency Risk—Fluctuations in currency exchange rates may negatively affect the value of the Fund’s investments or reduce its returns.
| | |
| |
32 | AB WEALTH APPRECIATION STRATEGY | | abfunds.com |
NOTES TO FINANCIAL STATEMENTS (continued)
Emerging Market Risk—Investments in emerging market countries may have more risk because the markets are less developed and less liquid as well as being subject to increased economic, political, regulatory or other uncertainties.
Capitalization Risk—Investments in small- and mid-capitalization companies may be more volatile than investments in large-capitalization companies. Investments in small- and mid-capitalization companies may have additional risks because these companies have limited product lines, markets or financial resources.
Investment in Other Investment Companies Risk—As with other investments, investments in other investment companies are subject to market and selection risk. In addition, shareholders of the Fund bear both their proportionate share of expenses in the Fund (including management fees) and, indirectly, the expenses of the investment companies in which the Fund invests (to the extent these expenses are not waived or reimbursed by the Adviser).
Sector Risk—The Fund may have more risk because it may invest to a significant extent in one or more particular market sectors, such as the information technology sector. To the extent it does so, market or economic factors affecting the relevant sector(s) could have a major effect on the value of the Fund’s investments.
LIBOR Transition and Associated Risk—A Fund may invest in debt securities, derivatives or other financial instruments that utilize the London Interbank Offered Rate, or “LIBOR,” as a “benchmark” or “reference rate” for various interest rate calculations. The United Kingdom Financial Conduct Authority, which regulates LIBOR, will cease publishing certain LIBOR benchmarks at the end of 2021. Although certain LIBOR rates are intended to be published until June 2023, banks are strongly encouraged to cease entering into agreements with counterparties referencing LIBOR by the end of 2021. Although financial regulators and industry working groups have suggested alternative reference rates, such as the European Interbank Offer Rate, the Sterling Overnight Interbank Average Rate and the Secured Overnight Financing Rate, global consensus on alternative rates is lacking and the process for amending existing contracts or instruments to transition away from LIBOR is underway but remains incomplete. The elimination of LIBOR or changes to other reference rates or any other changes or reforms to the determination or supervision of reference rates could have an adverse impact on the market for, or value of, any securities or payments linked to those reference rates, which may adversely affect a Fund’s performance and/or net asset value. Uncertainty and risk also remain regarding the willingness and ability of issuers and lenders to
| | |
| |
| abfunds.com | | AB WEALTH APPRECIATION STRATEGY | 33 |
NOTES TO FINANCIAL STATEMENTS (continued)
include revised provisions in new and existing contracts or instruments. Consequently, the transition away from LIBOR to other reference rates may lead to increased volatility and illiquidity in markets that are tied to LIBOR, fluctuations in values of LIBOR-related investments or investments in issuers that utilize LIBOR, increased difficulty in borrowing or refinancing and diminished effectiveness of hedging strategies, potentially adversely affecting a Fund’s performance. Furthermore, the risks associated with the expected discontinuation of LIBOR and transition may be exacerbated if the work necessary to effect an orderly transition to an alternative reference rate is not completed in a timely manner. Because the usefulness of LIBOR as a benchmark could deteriorate during the transition period, these effects could occur prior to the end of 2021.
Indemnification Risk—In the ordinary course of business, the Fund enters into contracts that contain a variety of indemnifications. The Fund’s maximum exposure under these arrangements is unknown. However, the Fund has not had prior claims or losses pursuant to these indemnification provisions and expects the risk of loss thereunder to be remote. Therefore, the Fund has not accrued any liability in connection with these indemnification provisions.
Management Risk—The Fund is subject to management risk because it is an actively-managed investment fund. The Adviser will apply its investment techniques and risk analyses in making investment decisions for the Fund, but there is no guarantee that its techniques will produce the intended results. Some of these techniques may incorporate, or rely upon, quantitative models, but there is no guarantee that these models will generate accurate forecasts, reduce risk or otherwise perform as expected.
NOTE H
Joint Credit Facility
A number of open-end mutual funds managed by the Adviser, including the Fund, participate in a $325 million revolving credit facility (the “Facility”) intended to provide short-term financing, if necessary, subject to certain restrictions in connection with abnormal redemption activity. Commitment fees related to the Facility are paid by the participating funds and are included in miscellaneous expenses in the statement of operations. The Fund did not utilize the Facility during the six months ended February 28, 2021.
| | |
| |
34 | AB WEALTH APPRECIATION STRATEGY | | abfunds.com |
NOTES TO FINANCIAL STATEMENTS (continued)
NOTE I
Distributions to Shareholders
The tax character of distributions to be paid for the year ending August 31, 2021 will be determined at the end of the current fiscal year. The tax character of distributions paid during the fiscal years ended August 31, 2020 and August 31, 2019 were as follows:
| | | | | | | | |
| | | 2020 | | | 2019 | |
Distributions paid from: | | | | | | | | |
Ordinary income | | $ | 16,856,078 | | | $ | 15,021,652 | |
Net long-term capital gains | | | 34,877,095 | | | | 28,183,325 | |
| | | | | | | | |
Total taxable distributions | | $ | 51,733,173 | | | $ | 43,204,977 | |
| | | | | | | | |
As of August 31, 2020, the components of accumulated earnings/(deficit) on a tax basis were as follows:
| | | | |
Undistributed ordinary income | | $ | 3,705,861 | |
Undistributed capital gains | | | 17,710,014 | |
Unrealized appreciation/(depreciation) | | | 158,027,164 | (a) |
| | | | |
Total accumulated earnings/(deficit) | | $ | 179,443,039 | |
| | | | |
| (a) | The difference between book-basis and tax-basis unrealized appreciation/(depreciation) is attributable primarily to the tax deferral of losses on wash sales. |
For tax purposes, net realized capital losses may be carried over to offset future capital gains, if any. Funds are permitted to carry forward capital losses for an indefinite period, and such losses will retain their character as either short-term or long-term capital losses. As of August 31, 2020, the Fund did not have any capital loss carryforwards.
NOTE J
Subsequent Events
As of February 28, 2021, Class C shares will automatically convert to Class A shares ten years after the end of the calendar month of their original purchase. Effective May 31, 2021, Class C shares will automatically convert to Class A shares after eight years instead of ten years.
Management has evaluated subsequent events for possible recognition or disclosure in the financial statements through the date the financial statements are issued. Management has determined that there are no other material events that would require disclosure in the Fund’s financial statements through this date.
| | |
| |
| abfunds.com | | AB WEALTH APPRECIATION STRATEGY | 35 |
FINANCIAL HIGHLIGHTS
Selected Data For A Share Of Beneficial Interest Outstanding Throughout Each Period
| | | | | | | | | | | | | | | | | | | | | | | | |
| | | Class A | |
| | | Six Months
Ended
February 28,
2021 (unaudited) | | | Year Ended August 31, | |
| | | 2020 | | | 2019 | | | 2018 | | | 2017 | | | 2016 | |
| | | | |
| | | | | | | | | | | | | | | | | | | | | | | | |
Net asset value, beginning of period | | | $ 17.50 | | | | $ 16.11 | | | | $ 16.99 | | | | $ 16.27 | | | | $ 15.06 | | | | $ 14.64 | |
| | | | |
Income From Investment Operations | | | | | | | | | | | | | | | | | | | | | | | | |
| | | | | | |
Net investment income(a)(b) | | | .10 | | | | .19 | | | | .21 | | | | .17 | | | | .48 | | | | .26 | |
| | | | | | |
Net realized and unrealized gain (loss) on investment transactions | | | 2.24 | | | | 1.86 | | | | (.58 | ) | | | 1.77 | | | | 1.58 | | | | .39 | |
| | | | |
Net increase (decrease) in net asset value from operations | | | 2.34 | | | | 2.05 | | | | (.37 | ) | | | 1.94 | | | | 2.06 | | | | .65 | |
| | | | |
Less: Dividends and Distributions | | | | | | | | | | | | | | | | | | | | | | | | |
| | | | | | |
Dividends from net investment income | | | (.22 | ) | | | (.20 | ) | | | (.16 | ) | | | (.43 | ) | | | (.48 | ) | | | (.23 | ) |
| | | | | | |
Distributions from net realized gain on investment transactions | | | (.31 | ) | | | (.46 | ) | | | (.35 | ) | | | (.79 | ) | | | (.37 | ) | | | – 0 | – |
| | | | |
Total dividends and distributions | | | (.53 | ) | | | (.66 | ) | | | (.51 | ) | | | (1.22 | ) | | | (.85 | ) | | | (.23 | ) |
| | | | |
Net asset value, end of period | | | $ 19.31 | | | | $ 17.50 | | | | $ 16.11 | | | | $ 16.99 | | | | $ 16.27 | | | | $ 15.06 | |
| | | | |
|
Total Return | |
| | | | | | |
Total investment return based on net asset value(c)* | | | 13.53 | % | | | 12.85 | % | | | (1.78 | )% | | | 12.21 | % | | | 14.35 | % | | | 4.53 | % |
| | | | | | |
Ratios/Supplemental Data | | | | | | | | | | | | | | | | | | | | | | | | |
| | | | | | |
Net assets, end of period (000’s omitted) | | | $380,449 | | | | $355,496 | | | | $350,232 | | | | $393,100 | | | | $386,168 | | | | $354,972 | |
| | | | | | |
Ratio to average net assets of: | | | | | | | | | | | | | | | | | | | | | | | | |
| | | | | | |
Expenses, net of waivers/reimbursements(d)‡ | | | .64 | %^ | | | .64 | % | | | .64 | % | | | .64 | % | | | .85 | % | | | .89 | % |
| | | | | | |
Expenses, before waivers/reimbursements(d)‡ | | | 1.00 | %^ | | | 1.01 | % | | | 1.01 | % | | | 1.01 | % | | | 1.01 | % | | | 1.01 | % |
| | | | | | |
Net investment income(b) | | | 1.11 | %^ | | | 1.20 | % | | | 1.34 | % | | | 1.02 | % | | | 3.14 | % | | | 1.78 | % |
| | | | | | |
Portfolio turnover rate | | | 11 | % | | | 18 | % | | | 20 | % | | | 22 | % | | | 111 | % | | | 9 | % |
| | | | | | | | | | | | | | | | | | | | | | | | |
| |
‡ Expense ratios exclude the estimated acquired fund fees of the affiliated/unaffiliated underlying | |
portfolios | | | .39 | %^ | | | .40 | % | | | .40 | % | | | .40 | % | | | .34 | % | | | .41 | % |
See footnote summary on page 41.
| | |
| |
36 | AB WEALTH APPRECIATION STRATEGY | | abfunds.com |
FINANCIAL HIGHLIGHTS (continued)
Selected Data For A Share Of Beneficial Interest Outstanding Throughout Each Period
| | | | | | | | | | | | | | | | | | | | | | | | |
| | | Class C | |
| | | Six Months
Ended
February 28,
2021 (unaudited) | | | Year Ended August 31, | |
| | | 2020 | | | 2019 | | | 2018 | | | 2017 | | | 2016 | |
| | | | |
| | | | | | | | | | | | | | | | | | | | | | | | |
Net asset value, beginning of period | | | $ 17.52 | | | | $ 16.10 | | | | $ 16.91 | | | | $ 16.15 | | | | $ 14.95 | | | | $ 14.51 | |
| | | | |
Income From Investment Operations | | | | | | | | | | | | | | | | | | | | | | | | |
| | | | | | |
Net investment income(a)(b) | | | .03 | | | | .08 | | | | .10 | | | | .06 | | | | .36 | | | | .15 | |
| | | | | | |
Net realized and unrealized gain (loss) on investment transactions | | | 2.25 | | | | 1.84 | | | | (.56 | ) | | | 1.73 | | | | 1.57 | | | | .40 | |
| | | | |
Net increase (decrease) in net asset value from operations | | | 2.28 | | | | 1.92 | | | | (.46 | ) | | | 1.79 | | | | 1.93 | | | | .55 | |
| | | | |
Less: Dividends and Distributions | | | | | | | | | | | | | | | | | | | | | | | | |
| | | | | | |
Dividends from net investment income | | | (.05 | ) | | | (.04 | ) | | | (.00 | )(e) | | | (.24 | ) | | | (.36 | ) | | | (.11 | ) |
| | | | | | |
Distributions from net realized gain on investment transactions | | | (.31 | ) | | | (.46 | ) | | | (.35 | ) | | | (.79 | ) | | | (.37 | ) | | | – 0 | – |
| | | | |
Total dividends and distributions | | | (.36 | ) | | | (.50 | ) | | | (.35 | ) | | | (1.03 | ) | | | (.73 | ) | | | (.11 | ) |
| | | | |
Net asset value, end of period | | | $ 19.44 | | | | $ 17.52 | | | | $ 16.10 | | | | $ 16.91 | | | | $ 16.15 | | | | $ 14.95 | |
| | | | |
|
Total Return | |
| | | | | | |
Total investment return based on net asset value(c)* | | | 13.10 | % | | | 11.98 | % | | | (2.46 | )% | | | 11.31 | % | | | 13.45 | % | | | 3.81 | % |
| | | | | | |
Ratios/Supplemental Data | | | | | | | | | | | | | | | | | | | | | | | | |
| | | | | | |
Net assets, end of period (000’s omitted) | | | $15,059 | | | | $16,621 | | | | $23,546 | | | | $38,133 | | | | $55,532 | | | | $97,091 | |
| | | | | | |
Ratio to average net assets of: | | | | | | | | | | | | | | | | | | | | | | | | |
| | | | | | |
Expenses, net of waivers/reimbursements(d)‡ | | | 1.39 | %^ | | | 1.39 | % | | | 1.40 | % | | | 1.39 | % | | | 1.62 | % | | | 1.64 | % |
| | | | | | |
Expenses, before waivers/reimbursements(d)‡ | | | 1.75 | %^ | | | 1.76 | % | | | 1.76 | % | | | 1.77 | % | | | 1.76 | % | | | 1.76 | % |
| | | | | | |
Net investment income(b) | | | .34 | %^ | | | .50 | % | | | .64 | % | | | .34 | % | | | 2.38 | % | | | 1.06 | % |
| | | | | | |
Portfolio turnover rate | | | 11 | % | | | 18 | % | | | 20 | % | | | 22 | % | | | 111 | % | | | 9 | % |
| | | | | | | | | | | | | | | | | | | | | | | | |
| |
‡ Expense ratios exclude the estimated acquired fund fees of the affiliated/unaffiliated underlying | |
portfolios | | | .39 | %^ | | | .40 | % | | | .40 | % | | | .40 | % | | | .34 | % | | | .41 | % |
See footnote summary on page 41.
| | |
| |
| abfunds.com | | AB WEALTH APPRECIATION STRATEGY | 37 |
FINANCIAL HIGHLIGHTS (continued)
Selected Data For A Share Of Beneficial Interest Outstanding Throughout Each Period
| | | | | | | | | | | | | | | | | | | | | | | | |
| | | Advisor Class | |
| | | Six Months
Ended
February 28,
2021 (unaudited) | | | Year Ended August 31, | |
| | | 2020 | | | 2019 | | | 2018 | | | 2017 | | | 2016 | |
| | | | |
| | | | | | | | | | | | | | | | | | | | | | | | |
| | | | | | | | | | | | | | | | | | | | | | | | |
Net asset value, beginning of period | | | $ 17.46 | | | | $ 16.08 | | | | $ 16.96 | | | | $ 16.25 | | | | $ 15.04 | | | | $ 14.62 | |
| | | | |
Income From Investment Operations | | | | | | | | | | | | | | | | | | | | | | | | |
| | | | | | |
Net investment income(a)(b) | | | .12 | | | | .23 | | | | .25 | | | | .21 | | | | .52 | | | | .29 | |
| | | | | | |
Net realized and unrealized gain (loss) on
investment transactions | | | 2.24 | | | | 1.85 | | | | (.57 | ) | | | 1.76 | | | | 1.58 | | | | .40 | |
| | | | |
Net increase (decrease) in net asset value from operations | | | 2.36 | | | | 2.08 | | | | (.32 | ) | | | 1.97 | | | | 2.10 | | | | .69 | |
| | | | |
Less: Dividends and Distributions | | | | | | | | | | | | | | | | | | | | | | | | |
| | | | | | |
Dividends from net investment income | | | (.26 | ) | | | (.24 | ) | | | (.21 | ) | | | (.47 | ) | | | (.52 | ) | | | (.27 | ) |
| | | | | | |
Distributions from net realized gain on investment transactions | | | (.31 | ) | | | (.46 | ) | | | (.35 | ) | | | (.79 | ) | | | (.37 | ) | | | – 0 | – |
| | | | |
Total dividends and distributions | | | (.57 | ) | | | (.70 | ) | | | (.56 | ) | | | (1.26 | ) | | | (.89 | ) | | | (.27 | ) |
| | | | |
Net asset value, end of period | | | $ 19.25 | | | | $ 17.46 | | | | $ 16.08 | | | | $ 16.96 | | | | $ 16.25 | | | | $ 15.04 | |
| | | | |
|
Total Return | |
| | | | | | |
Total investment return based on net asset value(c)* | | | 13.71 | % | | | 13.08 | % | | | (1.49 | )% | | | 12.44 | % | | | 14.66 | % | | | 4.82 | % |
| | | | | | |
Ratios/Supplemental Data | | | | | | | | | | | | | | | | | | | | | | | | |
| | | | | | |
Net assets, end of period (000’s omitted) | | | $906,336 | | | | $864,334 | | | | $869,353 | | | | $931,834 | | | | $857,397 | | | | $861,450 | |
| | | | | | |
Ratio to average net assets of: | | | | | | | | | | | | | | | | | | | | | | | | |
| | | | | | |
Expenses, net of waivers/reimbursements(d)‡ | | | .39 | %^ | | | .39 | % | | | .39 | % | | | .39 | % | | | .60 | % | | | .64 | % |
| | | | | | |
Expenses, before
waivers/reimbursements(d)‡ | | | .75 | %^ | | | .76 | % | | | .76 | % | | | .76 | % | | | .76 | % | | | .76 | % |
| | | | | | |
Net investment income(b) | | | 1.37 | %^ | | | 1.44 | % | | | 1.58 | % | | | 1.26 | % | | | 3.39 | % | | | 2.00 | % |
| | | | | | |
Portfolio turnover rate | | | 11 | % | | | 18 | % | | | 20 | % | | | 22 | % | | | 111 | % | | | 9 | % |
| | | | | | | | | | | | | | | | | | | | | | | | |
| |
‡ Expense ratios exclude the estimated acquired fund fees of the affiliated/unaffiliated underlying | |
portfolios | | | .39 | %^ | | | .40 | % | | | .40 | % | | | .40 | % | | | .34 | % | | | .41 | % |
See footnote summary on page 41.
| | |
| |
38 | AB WEALTH APPRECIATION STRATEGY | | abfunds.com |
FINANCIAL HIGHLIGHTS (continued)
Selected Data For A Share Of Beneficial Interest Outstanding Throughout Each Period
| | | | | | | | | | | | | | | | | | | | | | | | |
| | | Class R | |
| | | Six Months
Ended
February 28,
2021 (unaudited) | | | Year Ended August 31, | |
| | | 2020 | | | 2019 | | | 2018 | | | 2017 | | | 2016 | |
| | | | |
| | | | | | | | | | | | | | | | | | | | | | | | |
Net asset value, beginning of period | | | $ 17.40 | | | | $ 15.99 | | | | $ 16.84 | | | | $ 16.14 | | | | $ 14.94 | | | | $ 14.51 | |
| | | | |
Income From Investment Operations | | | | | | | | | | | | | | | | | | | | | | | | |
| | | | | | |
Net investment income(a)(b) | | | .06 | | | | .11 | | | | .15 | | | | .10 | | | | .41 | | | | .21 | |
| | | | | | |
Net realized and unrealized gain (loss) on
investment transactions | | | 2.23 | | | | 1.84 | | | | (.57 | ) | | | 1.73 | | | | 1.57 | | | | .37 | |
| | | | |
Net increase (decrease) in net asset value from operations | | | 2.29 | | | | 1.95 | | | | (.42 | ) | | | 1.83 | | | | 1.98 | | | | .58 | |
| | | | |
Less: Dividends and Distributions | | | | | | | | | | | | | | | | | | | | | | | | |
| | | | | | |
Dividends from net investment income | | | (.15 | ) | | | (.08 | ) | | | (.08 | ) | | | (.34 | ) | | | (.41 | ) | | | (.15 | ) |
| | | | | | |
Distributions from net realized gain on investment transactions | | | (.31 | ) | | | (.46 | ) | | | (.35 | ) | | | (.79 | ) | | | (.37 | ) | | | – 0 | – |
| | | | |
Total dividends and distributions | | | (.46 | ) | | | (.54 | ) | | | (.43 | ) | | | (1.13 | ) | | | (.78 | ) | | | (.15 | ) |
| | | | |
Net asset value, end of period | | | $ 19.23 | | | | $ 17.40 | | | | $ 15.99 | | | | $ 16.84 | | | | $ 16.14 | | | | $ 14.94 | |
| | | | |
|
Total Return | |
| | | | | | |
Total investment return based on net asset value(c)* | | | 13.28 | % | | | 12.31 | % | | | (2.17 | )% | | | 11.62 | % | | | 13.88 | % | | | 4.06 | % |
| | | | | | |
Ratios/Supplemental Data | | | | | | | | | | | | | | | | | | | | | | | | |
| | | | | | |
Net assets, end of period (000’s omitted) | | | $2,035 | | | | $1,866 | | | | $2,248 | | | | $2,898 | | | | $3,308 | | | | $3,360 | |
| | | | | | |
Ratio to average net assets of: | | | | | | | | | | | | | | | | | | | | | | | | |
| | | | | | |
Expenses, net of waivers/reimbursements(d)‡ | | | 1.10 | %^ | | | 1.09 | % | | | 1.10 | % | | | 1.09 | % | | | 1.30 | % | | | 1.33 | % |
| | | | | | |
Expenses, before
waivers/reimbursements(d)‡ | | | 1.46 | %^ | | | 1.46 | % | | | 1.46 | % | | | 1.47 | % | | | 1.46 | % | | | 1.45 | % |
| | | | | | |
Net investment income(b) | | | .66 | %^ | | | .69 | % | | | .93 | % | | | .59 | % | | | 2.67 | % | | | 1.46 | % |
| | | | | | |
Portfolio turnover rate | | | 11 | % | | | 18 | % | | | 20 | % | | | 22 | % | | | 111 | % | | | 9 | % |
| | | | | | | | | | | | | | | | | | | | | | | | |
| |
‡ Expense ratios exclude the estimated acquired fund fees of the affiliated/unaffiliated underlying | |
portfolios | | | .39 | %^ | | | .40 | % | | | .40 | % | | | .40 | % | | | .34 | % | | | .41 | % |
See footnote summary on page 41.
| | |
| |
| abfunds.com | | AB WEALTH APPRECIATION STRATEGY | 39 |
FINANCIAL HIGHLIGHTS (continued)
Selected Data For A Share Of Beneficial Interest Outstanding Throughout Each Period
| | | | | | | | | | | | | | | | | | | | | | | | |
| | | Class K | |
| | | Six Months
Ended
February 28,
2021 (unaudited) | | | Year Ended August 31, | |
| | | 2020 | | | 2019 | | | 2018 | | | 2017 | | | 2016 | |
| | | | |
| | | | | | | | | | | | | | | | | | | | | | | | |
| | | | | | | | | | | | | | | | | | | | | | | | |
Net asset value, beginning of period | | | $ 17.37 | | | | $ 16.00 | | | | $ 16.87 | | | | $ 16.17 | | | | $ 14.97 | | | | $ 14.54 | |
| | | | |
Income From Investment Operations | | | | | | | | | | | | | | | | | | | | | | | | |
| | | | | | |
Net investment income(a)(b) | | | .09 | | | | .17 | | | | .19 | | | | .15 | | | | .48 | | | | .22 | |
| | | | | | |
Net realized and unrealized gain (loss) on
investment transactions | | | 2.23 | | | | 1.83 | | | | (.57 | ) | | | 1.75 | | | | 1.55 | | | | .42 | |
| | | | |
Net increase (decrease) in net asset value from operations | | | 2.32 | | | | 2.00 | | | | (.38 | ) | | | 1.90 | | | | 2.03 | | | | .64 | |
| | | | |
Less: Dividends and Distributions | | | | | | | | | | | | | | | | | | | | | | | | |
| | | | | | |
Dividends from net investment income | | | (.19 | ) | | | (.17 | ) | | | (.14 | ) | | | (.41 | ) | | | (.46 | ) | | | (.21 | ) |
| | | | | | |
Distributions from net realized gain on investment transactions | | | (.31 | ) | | | (.46 | ) | | | (.35 | ) | | | (.79 | ) | | | (.37 | ) | | | – 0 | – |
| | | | |
Total dividends and distributions | | | (.50 | ) | | | (.63 | ) | | | (.49 | ) | | | (1.20 | ) | | | (.83 | ) | | | (.21 | ) |
| | | | |
Net asset value, end of period | | | $ 19.19 | | | | $ 17.37 | | | | $ 16.00 | | | | $ 16.87 | | | | $ 16.17 | | | | $ 14.97 | |
| | | | |
|
Total Return | |
| | | | | | |
Total investment return based on net asset value(c)* | | | 13.51 | % | | | 12.63 | % | | | (1.90 | )% | | | 12.01 | % | | | 14.22 | % | | | 4.48 | % |
| | | | | | |
Ratios/Supplemental Data | | | | | | | | | | | | | | | | | | | | | | | | |
| | | | | | |
Net assets, end of period (000’s omitted) | | | $9,476 | | | | $8,869 | | | | $10,672 | | | | $11,729 | | | | $12,527 | | | | $16,346 | |
| | | | | | |
Ratio to average net assets of: | | | | | | | | | | | | | | | | | | | | | | | | |
| | | | | | |
Expenses, net of waivers/reimbursements(d)‡ | | | .79 | %^ | | | .78 | % | | | .79 | % | | | .78 | % | | | .99 | % | | | 1.01 | % |
| | | | | | |
Expenses, before
waivers/reimbursements(d)‡ | | | 1.15 | %^ | | | 1.15 | % | | | 1.15 | % | | | 1.16 | % | | | 1.14 | % | | | 1.12 | % |
| | | | | | |
Net investment income(b) | | | .96 | %^ | | | 1.08 | % | | | 1.19 | % | | | .92 | % | | | 3.18 | % | | | 1.57 | % |
| | | | | | |
Portfolio turnover rate | | | 11 | % | | | 18 | % | | | 20 | % | | | 22 | % | | | 111 | % | | | 9 | % |
| | | | | | | | | | | | | | | | | | | | | | | | |
| |
‡ Expense ratios exclude the estimated acquired fund fees of the affiliated/unaffiliated underlying | |
portfolios | | | .39 | %^ | | | .40 | % | | | .40 | % | | | .40 | % | | | .34 | % | | | .41 | % |
See footnote summary on page 41.
| | |
| |
40 | AB WEALTH APPRECIATION STRATEGY | | abfunds.com |
FINANCIAL HIGHLIGHTS (continued)
Selected Data For A Share Of Beneficial Interest Outstanding Throughout Each Period
| (a) | Based on average shares outstanding. |
| (b) | Net of expenses waived/reimbursed by the Adviser. |
| (c) | Total investment return is calculated assuming an initial investment made at the net asset value at the beginning of the period, reinvestment of all dividends and distributions at net asset value during the period, and redemption on the last day of the period. Initial sales charges or contingent deferred sales charges are not reflected in the calculation of total investment return. Total return does not reflect the deduction of taxes that a shareholder would pay on fund distributions or the redemption of fund shares. Total investment return calculated for a period of less than one year is not annualized. |
| (d) | In connection with the Fund’s investments in affiliated underlying portfolios, the Fund incurs no direct expenses, but bears proportionate shares of the fees and expenses (i.e., operating, administrative and investment advisory fees) of the affiliated underlying portfolios. The Adviser has contractually agreed to waive its fees from the Fund in an amount equal to the Fund’s pro rata share of certain acquired fund fees and expenses, and for the six months ended February 28, 2021 and the years ended August 31, 2020, August 31, 2019, August 31, 2018 and August 31, 2017, such waiver amounted to .36% (annualized), .37%, .36%, .37% and .16%, respectively. |
| (e) | Amount is less than $.005. |
| * | Includes the impact of proceeds received and credited to the Fund resulting from class action settlements, which enhanced the Fund’s performance for the years ended August 31, 2018 and August 31, 2017 by .05% and .05%, respectively. |
See notes to financial statements.
| | |
| |
| abfunds.com | | AB WEALTH APPRECIATION STRATEGY | 41 |
TRUSTEES
| | |
Marshall C. Turner, Jr.(1), Chairman Jorge A. Bermudez(1) Michael J. Downey(1) Onur Erzan*, President and Chief Executive Officer | | Nancy P. Jacklin(1) Jeanette W. Loeb(1) Carol C. McMullen(1) Garry L. Moody(1) Earl D. Weiner(1) |
| |
| OFFICERS | | |
Ding Liu(2), Vice President Nelson Yu(2), Vice President Emilie D. Wrapp, Clerk Michael B. Reyes, Senior Analyst Joseph J. Mantineo, Treasurer and Chief Financial Officer | | Phyllis J. Clarke, Controller and Chief Accounting Officer Vincent S. Noto, Chief Compliance Officer |
| | |
Custodian and Accounting Agent State Street Bank and Trust Company
State Street Corporation CCB/5
1 Iron Street
Boston, MA 02210 Principal Underwriter AllianceBernstein Investments, Inc.
1345 Avenue of the Americas
New York, NY 10105 Legal Counsel Seward & Kissel LLP
One Battery Park Plaza
New York, NY 10004 | | Transfer Agent AllianceBernstein Investor
Services, Inc.
P.O. Box 786003
San Antonio, TX 78278-6003
Toll-Free (800) 221-5672 Independent Registered Public Accounting Firm Ernst & Young LLP
5 Times Square
New York, NY 10036 |
| 1 | Member of the Audit Committee, the Governance and Nominating Committee and the Independent Directors Committee. |
| 2 | The day-to-day management of, and investment decisions for, the Fund’s portfolio are made by the Adviser’s Multi-Asset Solutions Team. Messrs. Liu and Yu are the investment professionals primarily responsible for the day-to-day management of the Fund’s portfolio. |
| * | Mr. Robert M. Keith retired as President, Chief Executive Officer and a Director of the Fund as of March 31, 2021. Mr. Onur Erzan, Senior Vice President and Head of the Global Client Group of the Adviser, has been elected President, Chief Executive Officer and a Director of the Fund, effective April 1, 2021. |
| | |
| |
42 | AB WEALTH APPRECIATION STRATEGY | | abfunds.com |
Operation and Effectiveness of the Fund’s Liquidity Risk Management Program:
In October 2016, the Securities and Exchange Commission (“SEC”) adopted the open-end fund liquidity rule (the “Liquidity Rule”). In June 2018 the SEC adopted a requirement that funds disclose information about the operation and effectiveness of their Liquidity Risk Management Program (“LRMP”) in their reports to shareholders.
One of the requirements of the Liquidity Rule is for the Fund to designate an Administrator of the Fund’s Liquidity Risk Management Program. The Administrator of the Fund’s LRMP is AllianceBernstein L.P., the Fund’s investment adviser (the “Adviser”). The Adviser has delegated the responsibility to its Liquidity Risk Management Committee (the “Committee”).
Another requirement of the Liquidity Rule is for the Fund’s Board of Trustees (the “Fund Board”) to receive an annual written report from the Administrator of the LRMP, which addresses the operation of the Fund’s LRMP and assesses its adequacy and effectiveness. The Adviser provided the Fund Board with such annual report during the first quarter of 2021, which covered the period January 1, 2020 through December 31, 2020 (the “Program Reporting Period”).
The LRMP’s principal objectives include supporting the Fund’s compliance with limits on investments in illiquid assets and mitigating the risk that the Fund will be unable to meet its redemption obligations in a timely manner.
Pursuant to the LRMP, the Fund classifies the liquidity of its portfolio investments into one of the four categories defined by the SEC: Highly Liquid, Moderately Liquid, Less Liquid, and Illiquid. These classifications are reported to the SEC on Form N-PORT.
During the Program Reporting Period, the Committee reviewed whether the Fund’s strategy is appropriate for an open-end structure, incorporating any holdings of less liquid and illiquid assets. If the Fund participated in derivative transactions, the exposure from such transactions were considered in the LRMP.
The Committee also performed an analysis to determine whether the Fund is required to maintain a Highly Liquid Investment Minimum (“HLIM”). The Committee also incorporated the following information when determining the Fund’s reasonably anticipated trading size for purposes of liquidity monitoring: historical net redemption activity, a Fund’s concentration in an issuer, shareholder concentration, investment performance, total net assets, and distribution channels.
The Adviser informed the Fund Board that the Committee believes the Fund’s LRMP is adequately designed, has been implemented as intended,
| | |
| |
| abfunds.com | | AB WEALTH APPRECIATION STRATEGY | 43 |
and has operated effectively since its inception. No material exceptions have been noted since the implementation of the LRMP. During the Program Reporting Period, beginning in March 2020, all financial markets experienced extreme levels of price volatility and relative illiquidity resulting from the COVID-19 impacts on the global economy. This extreme relative illiquidity resulted in significantly wider bid-ask spreads to transact in securities, including many of those securities held by the Fund, and in a diminished depth of liquidity in most markets, to varying degrees. Nonetheless, there were no liquidity events that impacted the Fund or its ability to timely meet redemptions during the Program Reporting Period.
| | |
| |
44 | AB WEALTH APPRECIATION STRATEGY | | abfunds.com |
Information Regarding the Review and Approval of the Fund’s Advisory Agreement
The disinterested trustees (the “directors”) of The AB Portfolios (the “Company”) unanimously approved the continuance of the Company’s Advisory Agreement with the Adviser in respect of AB Wealth Appreciation Strategy (the “Fund”) at a meeting held by video conference on May 5-7, 2020 (the “Meeting”).
Prior to approval of the continuance of the Advisory Agreement, the directors had requested from the Adviser, and received and evaluated, extensive materials. They reviewed the proposed continuance of the Advisory Agreement with the Adviser and with experienced counsel who are independent of the Adviser, who advised on the relevant legal standards. The directors also reviewed additional materials, including comparative analytical data prepared by the Senior Analyst for the Fund. The directors also discussed the proposed continuance in private sessions with counsel.
The directors considered their knowledge of the nature and quality of the services provided by the Adviser to the Fund gained from their experience as directors or trustees of most of the registered investment companies advised by the Adviser, their overall confidence in the Adviser’s integrity and competence they have gained from that experience, the Adviser’s initiative in identifying and raising potential issues with the directors and its responsiveness, frankness and attention to concerns raised by the directors in the past, including the Adviser’s willingness to consider and implement organizational and operational changes designed to improve investment results and the services provided to the AB Funds. The directors noted that they have four regular meetings each year, at each of which they review extensive materials and information from the Adviser, including information on the investment performance of the Fund and the underlying funds advised by the Adviser in which the Fund invests.
The directors also considered all factors they believed relevant, including the specific matters discussed below. During the course of their deliberations, the directors evaluated, among other things, the reasonableness of the advisory fee. The directors did not identify any particular information that was all-important or controlling, and different directors may have attributed different weights to the various factors. The directors determined that the selection of the Adviser to manage the Fund and the overall arrangements between the Fund and the Adviser, as provided in the Advisory Agreement, including the advisory fee, were fair and reasonable in light of the services performed, expenses incurred and such other matters as the directors considered relevant in the exercise of their business judgment. The material factors and conclusions that formed the basis for the directors’ determinations included the following:
Nature, Extent and Quality of Services Provided
The directors considered the scope and quality of services provided by the Adviser under the Advisory Agreement, including the quality of the
| | |
| |
| abfunds.com | | AB WEALTH APPRECIATION STRATEGY | 45 |
investment research capabilities of the Adviser and the other resources it has dedicated to performing services for the Fund. The directors noted that the Adviser from time to time reviews the Fund’s investment strategies and from time to time proposes changes intended to improve the Fund’s relative or absolute performance for the directors’ consideration. They also noted the professional experience and qualifications of the Fund’s portfolio management team and other senior personnel of the Adviser. The directors also considered that the Advisory Agreement provides that the Fund will reimburse the Adviser for the cost to it of providing certain clerical, accounting, administrative and other services to the Fund by employees of the Adviser or its affiliates. Requests for these reimbursements are made on a quarterly basis and subject to approval by the directors. Reimbursements, to the extent requested and paid, result in a higher rate of total compensation from the Fund to the Adviser than the fee rate stated in the Advisory Agreement. The directors noted that the methodology used to determine the reimbursement amounts had been reviewed by an independent consultant retained by the Fund’s former Senior Officer/Independent Compliance Officer. The quality of administrative and other services, including the Adviser’s role in coordinating the activities of the Fund’s other service providers, also was considered. The directors concluded that, overall, they were satisfied with the nature, extent and quality of services provided to the Fund under the Advisory Agreement.
Costs of Services Provided and Profitability
The directors reviewed a schedule of the revenues and expenses and related notes indicating the profitability of the Fund to the Adviser for calendar years 2018 and 2019 that had been prepared with an expense allocation methodology arrived at in consultation with an independent consultant retained by the Fund’s former Senior Officer/Independent Compliance Officer. The directors noted the assumptions and methods of allocation used by the Adviser in preparing fund-specific profitability data and understood that there are a number of potentially acceptable allocation methodologies for information of this type. The directors noted that the profitability information reflected all revenues and expenses of the Adviser’s relationship with the Fund, including those relating to its subsidiaries that provide transfer agency, distribution and brokerage services to the Fund. The directors recognized that it is difficult to make comparisons of the profitability of the Advisory Agreement with the profitability of fund advisory contracts for unaffiliated funds because comparative information is not generally publicly available and is affected by numerous factors. The directors focused on the profitability of the Adviser’s relationship with the Fund before taxes and distribution expenses. The directors concluded that the Adviser’s level of profitability from its relationship with the Fund was not unreasonable.
| | |
| |
46 | AB WEALTH APPRECIATION STRATEGY | | abfunds.com |
Fall-Out Benefits
The directors considered the other benefits to the Adviser and its affiliates from their relationships with the Fund and the underlying funds advised by the Adviser in which the Fund invests, including, but not limited to, benefits relating to soft dollar arrangements (whereby investment advisers receive brokerage and research services from brokers that execute agency transactions for their clients); 12b-1 fees and sales charges received by the Fund’s principal underwriter (which is a wholly owned subsidiary of the Adviser) in respect of certain classes of the Fund’s shares; brokerage commissions paid by the Fund to brokers affiliated with the Adviser; and transfer agency fees paid by the Fund to a wholly owned subsidiary of the Adviser. The directors recognized that the Adviser’s profitability would be somewhat lower without these benefits. The directors understood that the Adviser also might derive reputational and other benefits from its association with the Fund.
Investment Results
In addition to the information reviewed by the directors in connection with the Meeting, the directors receive detailed performance information for the Fund at each regular Board meeting during the year.
At the Meeting, the directors reviewed performance information prepared by an independent service provider (the “15(c) service provider”), showing the performance of the Class A Shares of the Fund against a group of similar funds (“peer group”) and a larger group of similar funds (“peer universe”), each selected by the 15(c) service provider, and information prepared by the Adviser showing performance of the Class A Shares against a broad-based securities market index, in each case for the 1-, 3-, 5- and 10-year periods ended February 29, 2020 and (in the case of comparisons with the broad-based securities market index) for the period from inception. Based on their review, the directors concluded that the Fund’s investment performance was acceptable.
Advisory Fees and Other Expenses
The directors considered the advisory fee rate payable by the Fund to the Adviser and information prepared by the 15(c) service provider concerning advisory fee rates payable by other funds in the same category as the Fund. The directors recognized that it is difficult to make comparisons of advisory fees because there are variations in the services that are included in the fees paid by other funds. The directors compared the Fund’s contractual effective advisory fee rate with a peer group median and took into account the impact on the advisory fee rate of the administrative expense reimbursement paid to the Adviser in the latest fiscal year.
The directors also considered the Adviser’s fee schedule for other clients utilizing investment strategies similar to those of the Fund. For this purpose, they reviewed the relevant advisory fee information from the Adviser’s
| | |
| |
| abfunds.com | | AB WEALTH APPRECIATION STRATEGY | 47 |
Form ADV and in a report from the Fund’s Senior Analyst and noted the differences between the Fund’s fee schedule, on the one hand, and the Adviser’s institutional fee schedule, on the other. The directors noted that the Adviser may, in some cases, agree to fee rates with large institutional clients that are lower than those reviewed by the directors and that they had previously discussed with the Adviser its policies in respect of such arrangements. The directors previously discussed these matters with an independent fee consultant.
The Adviser reviewed with the directors the significantly greater scope of the services it provides to the Fund relative to institutional clients. In this regard, the Adviser noted, among other things, that, compared to institutional accounts, the Fund (i) demands considerably more portfolio management, research and trading resources due to significantly higher daily cash flows; (ii) has more tax and regulatory restrictions and compliance obligations; (iii) must prepare and file or distribute regulatory and other communications about fund operations; and (iv) must provide shareholder servicing to retail investors. The Adviser also reviewed the greater legal risks presented by the large and changing population of Fund shareholders who may assert claims against the Adviser in individual or class actions, and the greater entrepreneurial risk in offering new fund products, which require substantial investment to launch, may not succeed, and generally must be priced to compete with larger, more established funds resulting in lack of profitability to the Adviser until a new fund achieves scale. In light of the substantial differences in services rendered by the Adviser to institutional clients as compared to the Fund and the different risk profile, the directors considered these fee comparisons inapt and did not place significant weight on them in their deliberations.
The directors noted that the Fund may invest in shares of exchange-traded funds (“ETFs”), subject to the restrictions and limitations of the Investment Company Act of 1940 as these may be varied as a result of exemptive orders issued by the SEC. The directors also noted that ETFs pay advisory fees pursuant to their advisory contracts. The directors concluded, based on the Adviser’s explanation of how it uses ETFs when they are the most cost-effective way to obtain desired exposures, in some cases pending purchases of underlying securities, that the advisory fee for the Fund would be for services in addition to, rather than duplicative of, the services provided under the advisory contracts of the ETFs.
In connection with their review of the Fund’s advisory fee, the directors also considered the total expense ratio of the Class A shares of the Fund in comparison to a peer group and a peer universe selected by the 15(c) service provider. The Class A expense ratio of the Fund was based on the Fund’s latest fiscal year. The directors noted that it was likely that the expense ratios of some of the other funds in the Fund’s category were lowered by waivers or reimbursements by those funds’ investment
| | |
| |
48 | AB WEALTH APPRECIATION STRATEGY | | abfunds.com |
advisers, which in some cases might be voluntary or temporary. The directors view expense ratio information as relevant to their evaluation of the Adviser’s services because the Adviser is responsible for coordinating services provided to the Fund by others. Based on their review, the directors concluded that the Fund’s expense ratio was acceptable.
Economies of Scale
The directors noted that the advisory fee schedules for the Fund contains breakpoints that reduce the fee rates on assets above specified levels. The directors took into consideration prior presentations by an independent consultant on economies of scale in the mutual fund industry and for the AB Funds, and presentations from time to time by the Adviser concerning certain of its views on economies of scale. The directors also previously discussed economies of scale with an independent fee consultant. The directors also had requested and received from the Adviser certain updates on economies of scale in advance of the Meeting. The directors believe that economies of scale may be realized (if at all) by the Adviser across a variety of products and services, and not only in respect of a single fund. The directors noted that there is no established methodology for setting breakpoints that give effect to the fund-specific services provided by a fund’s adviser and to the economies of scale that an adviser may realize in its overall mutual fund business or those components of it which directly or indirectly affect a fund’s operations. The directors observed that in the mutual fund industry as a whole, as well as among funds similar to the Fund, there is no uniformity or pattern in the fees and asset levels at which breakpoints (if any) apply. The directors also noted that the advisory agreements for many funds do not have breakpoints at all. Having taken these factors into account, the directors concluded that the Fund’s shareholders would benefit from a sharing of economies of scale in the event the Fund’s net assets exceed a breakpoint in the future.
| | |
| |
| abfunds.com | | AB WEALTH APPRECIATION STRATEGY | 49 |
This page is not part of the Shareholder Report or the Financial Statements.
AB FAMILY OF FUNDS
US EQUITY
CORE
Core Opportunities Fund
FlexFee™ US Thematic Portfolio
Select US Equity Portfolio
GROWTH
Concentrated Growth Fund
Discovery Growth Fund
FlexFee™ Large Cap Growth Portfolio
Growth Fund
Large Cap Growth Fund
Small Cap Growth Portfolio
VALUE
Discovery Value Fund
Equity Income Fund
Relative Value Fund
Small Cap Value Portfolio
Value Fund
INTERNATIONAL/ GLOBAL EQUITY
CORE
Global Core Equity Portfolio
International Strategic Core Portfolio
Sustainable Global Thematic Fund
Tax-Managed Wealth Appreciation Strategy
Wealth Appreciation Strategy
GROWTH
Concentrated International Growth Portfolio
Sustainable International Thematic Fund
VALUE
All China Equity Portfolio
International Value Fund
FIXED INCOME
MUNICIPAL
High Income Municipal Portfolio
Intermediate California Municipal Portfolio
Intermediate Diversified Municipal Portfolio
Intermediate New York Municipal Portfolio
Municipal Bond Inflation Strategy
Tax-Aware Fixed Income Opportunities Portfolio
National Portfolio
Arizona Portfolio
California Portfolio
Massachusetts Portfolio
Minnesota Portfolio
New Jersey Portfolio
New York Portfolio
Ohio Portfolio
Pennsylvania Portfolio
Virginia Portfolio
TAXABLE
Bond Inflation Strategy
FlexFee™ High Yield Portfolio
Global Bond Fund
High Income Fund
Income Fund
Intermediate Duration Portfolio
Limited Duration High Income Portfolio
Short Duration Income Portfolio
Short Duration Portfolio
Total Return Bond Portfolio
ALTERNATIVES
All Market Real Return Portfolio
Global Real Estate Investment Fund
Select US Long/Short Portfolio
MULTI-ASSET
All Market Income Portfolio
All Market Total Return Portfolio
Conservative Wealth Strategy
Emerging Markets Multi-Asset Portfolio
Global Risk Allocation Fund
Tax-Managed All Market Income Portfolio
CLOSED-END FUNDS
AllianceBernstein Global High Income Fund
AllianceBernstein National Municipal Income Fund
We also offer Government Money Market Portfolio, which serves as the money market fund exchange vehicle for the AB mutual funds. You could lose money by investing in the Fund. Although the Fund seeks to preserve the value of your investment at $1.00 per share, it cannot guarantee it will do so. The Fund may impose a fee upon sale of your shares or may temporarily suspend your ability to sell shares if the Fund’s liquidity falls below required minimums because of market conditions or other factors. An investment in the Fund is not insured or guaranteed by the Federal Deposit Insurance Corporation or any other government agency. The Fund’s sponsor has no legal obligation to provide financial support to the Fund, and you should not expect that the sponsor will provide financial support to the Fund at any time.
Investors should consider the investment objectives, risks, charges and expenses of the Fund carefully before investing. For copies of our prospectus or summary prospectus, which contain this and other information, visit us online at www.abfunds.com or contact your AB representative. Please read the prospectus and/or summary prospectus carefully before investing.
| | |
| |
50 | AB WEALTH APPRECIATION STRATEGY | | abfunds.com |
NOTES
| | |
| |
| abfunds.com | | AB WEALTH APPRECIATION STRATEGY | 51 |
NOTES
| | |
| |
52 | AB WEALTH APPRECIATION STRATEGY | | abfunds.com |
AB WEALTH APPRECIATION STRATEGY
1345 Avenue of the Americas
New York, NY 10105
800 221 5672
WA-0152-0221 
Not applicable when filing a semi-annual report to shareholders.
| ITEM 3. | AUDIT COMMITTEE FINANCIAL EXPERT. |
Not applicable when filing a semi-annual report to shareholders.
| ITEM 4. | PRINCIPAL ACCOUNTANT FEES AND SERVICES. |
Not applicable when filing a semi-annual report to shareholders.
| ITEM 5. | AUDIT COMMITTEE OF LISTED REGISTRANTS. |
Not applicable to the registrant.
Please see Schedule of Investments contained in the Report to Shareholders included under Item 1 of this Form N-CSR.
| ITEM 7. | DISCLOSURE OF PROXY VOTING POLICIES AND PROCEDURES FOR CLOSED-END MANAGEMENT INVESTMENT COMPANIES. |
Not applicable to the registrant.
| ITEM 8. | PORTFOLIO MANAGERS OF CLOSED-END MANAGEMENT INVESTMENT COMPANIES. |
Not applicable to the registrant.
| ITEM 9. | PURCHASES OF EQUITY SECURITIES BY CLOSED-END MANAGEMENT INVESTMENT COMPANY AND AFFILIATED PURCHASERS. |
Not applicable to the registrant.
| ITEM 10. | SUBMISSION OF MATTERS TO A VOTE OF SECURITY HOLDERS. |
There have been no material changes to the procedures by which shareholders may recommend nominees to the Fund’s Board of Directors since the Fund last provided disclosure in response to this item.
| ITEM | 11. CONTROLS AND PROCEDURES. |
(a) The registrant’s principal executive officer and principal financial officer have concluded that the registrant’s disclosure controls and procedures (as defined in Rule 30a-2(c) under the Investment Company Act of 1940, as amended) are effective at the reasonable assurance level based on their evaluation of these controls and procedures as of a date within 90 days of the filing date of this document.
(b) There were no changes in the registrant’s internal controls over financial reporting that occurred during the second fiscal quarter of the period that has materially affected, or is reasonably likely to materially affect, the registrant’s internal control over financial reporting.
| ITEM 12. | DISCLOSURE OF SECURITIES LENDING ACTIVITIES FOR CLOSED-END MANAGEMENT INVESTMENT COMPANIES. |
Not applicable to the registrant.
The following exhibits are attached to this Form N-CSR:
SIGNATURES
Pursuant to the requirements of the Securities Exchange Act of 1934 and the Investment Company Act of 1940, the registrant has duly caused this report to be signed on its behalf by the undersigned, thereunto duly authorized.
(Registrant): The AB Portfolios
| | |
| By: | | /s/ Onur Erzan |
| | Onur Erzan |
| | President |
| |
| Date: | | April 26, 2021 |
Pursuant to the requirements of the Securities Exchange Act of 1934 and the Investment Company Act of 1940, this report has been signed below by the following persons on behalf of the registrant and in the capacities and on the dates indicated.
| | |
| By: | | /s/ Onur Erzan |
| | Onur Erzan |
| | President |
| |
| Date: | | April 26, 2021 |
| |
| By: | | /s/ Joseph J. Mantineo |
| | Joseph J. Mantineo |
| | Treasurer and Chief Financial Officer |
| |
| Date: | | April 26, 2021 |