UNITED STATES
SECURITIES AND EXCHANGE COMMISSION
Washington, D.C. 20549
FORM N-CSR
CERTIFIED SHAREHOLDER REPORT OF REGISTERED
MANAGEMENT INVESTMENT COMPANIES
Investment Company Act file number 811-649
Fidelity Puritan Trust
(Exact name of registrant as specified in charter)
82 Devonshire St., Boston, Massachusetts 02109
(Address of principal executive offices) (Zip code)
Scott C. Goebel, Secretary
82 Devonshire St.
Boston, Massachusetts 02109
(Name and address of agent for service)
Registrant's telephone number, including area code: 617-563-7000
Date of fiscal year end: | August 31 |
| |
Date of reporting period: | August 31, 2012 |
Item 1. Reports to Stockholders
Fidelity®
Balanced
Fund -
Class K
Annual Report
August 31, 2012
(Fidelity Cover Art)
Contents
Performance | (Click Here) | How the fund has done over time. |
Management's Discussion of Fund Performance | (Click Here) | The Portfolio Manager's review of fund performance and strategy. |
Shareholder Expense Example | (Click Here) | An example of shareholder expenses. |
Investment Changes | (Click Here) | A summary of major shifts in the fund's investments over the past six months. |
Investments | (Click Here) | A complete list of the fund's investments with their market values. |
Financial Statements | (Click Here) | Statements of assets and liabilities, operations, and changes in net assets, as well as financial highlights. |
Notes | (Click Here) | Notes to the financial statements. |
Report of Independent Registered Public Accounting Firm | (Click Here) | |
Trustees and Officers | (Click Here) | |
Distributions | (Click Here) | |
Board Approval of Investment Advisory Contracts and Management Fees | (Click Here) | |
To view a fund's proxy voting guidelines and proxy voting record for the 12-month period ended June 30, visit http://www.fidelity.com/proxyvotingresults or visit the Securities and Exchange Commission's (SEC) web site at http://www.sec.gov. You may also call 1-800-835-5092 to request a free copy of the proxy voting guidelines.
Standard & Poor's, S&P and S&P 500 are registered service marks of The McGraw-Hill Companies, Inc. and have been licensed for use by Fidelity Distributors Corporation.
Other third party marks appearing herein are the property of their respective owners.
All other marks appearing herein are registered or unregistered trademarks or service marks of FMR LLC or an affiliated company. © 2012 FMR LLC. All rights reserved.
Annual Report
This report and the financial statements contained herein are submitted for the general information of the shareholders of the fund. This report is not authorized for distribution to prospective investors in the fund unless preceded or accompanied by an effective prospectus.
A fund files its complete schedule of portfolio holdings with the SEC for the first and third quarters of each fiscal year on Form N-Q. Forms N-Q are available on the SEC's web site at http://www.sec.gov. A fund's Forms N-Q may be reviewed and copied at the SEC's Public Reference Room in Washington, DC. Information regarding the operation of the SEC's Public Reference Room may be obtained by calling 1-800-SEC-0330. For a complete list of a fund's portfolio holdings, view the most recent holdings listing, semiannual report, or annual report on Fidelity's web site at http://www.fidelity.com, http://www.advisor.fidelity.com, or http://www.401k.com, as applicable.
NOT FDIC INSURED • MAY LOSE VALUE • NO BANK GUARANTEE
Neither the fund nor Fidelity Distributors Corporation is a bank.
Annual Report
Average annual total return reflects the change in the value of an investment, assuming reinvestment of the class' distributions from dividend income and capital gains (the profits earned upon the sale of securities that have grown in value, if any) and assuming a constant rate of performance each year. The $10,000 table and the fund's returns do not reflect the deduction of taxes that a shareholder would pay on fund distributions or the redemption of fund shares. During periods of reimbursement by Fidelity, a fund's total return will be greater than it would be had the reimbursement not occurred. How a fund did yesterday is no guarantee of how it will do tomorrow.
Average Annual Total Returns
Periods ended August 31, 2012 | Past 1
year | Past 5
years | Past 10
years |
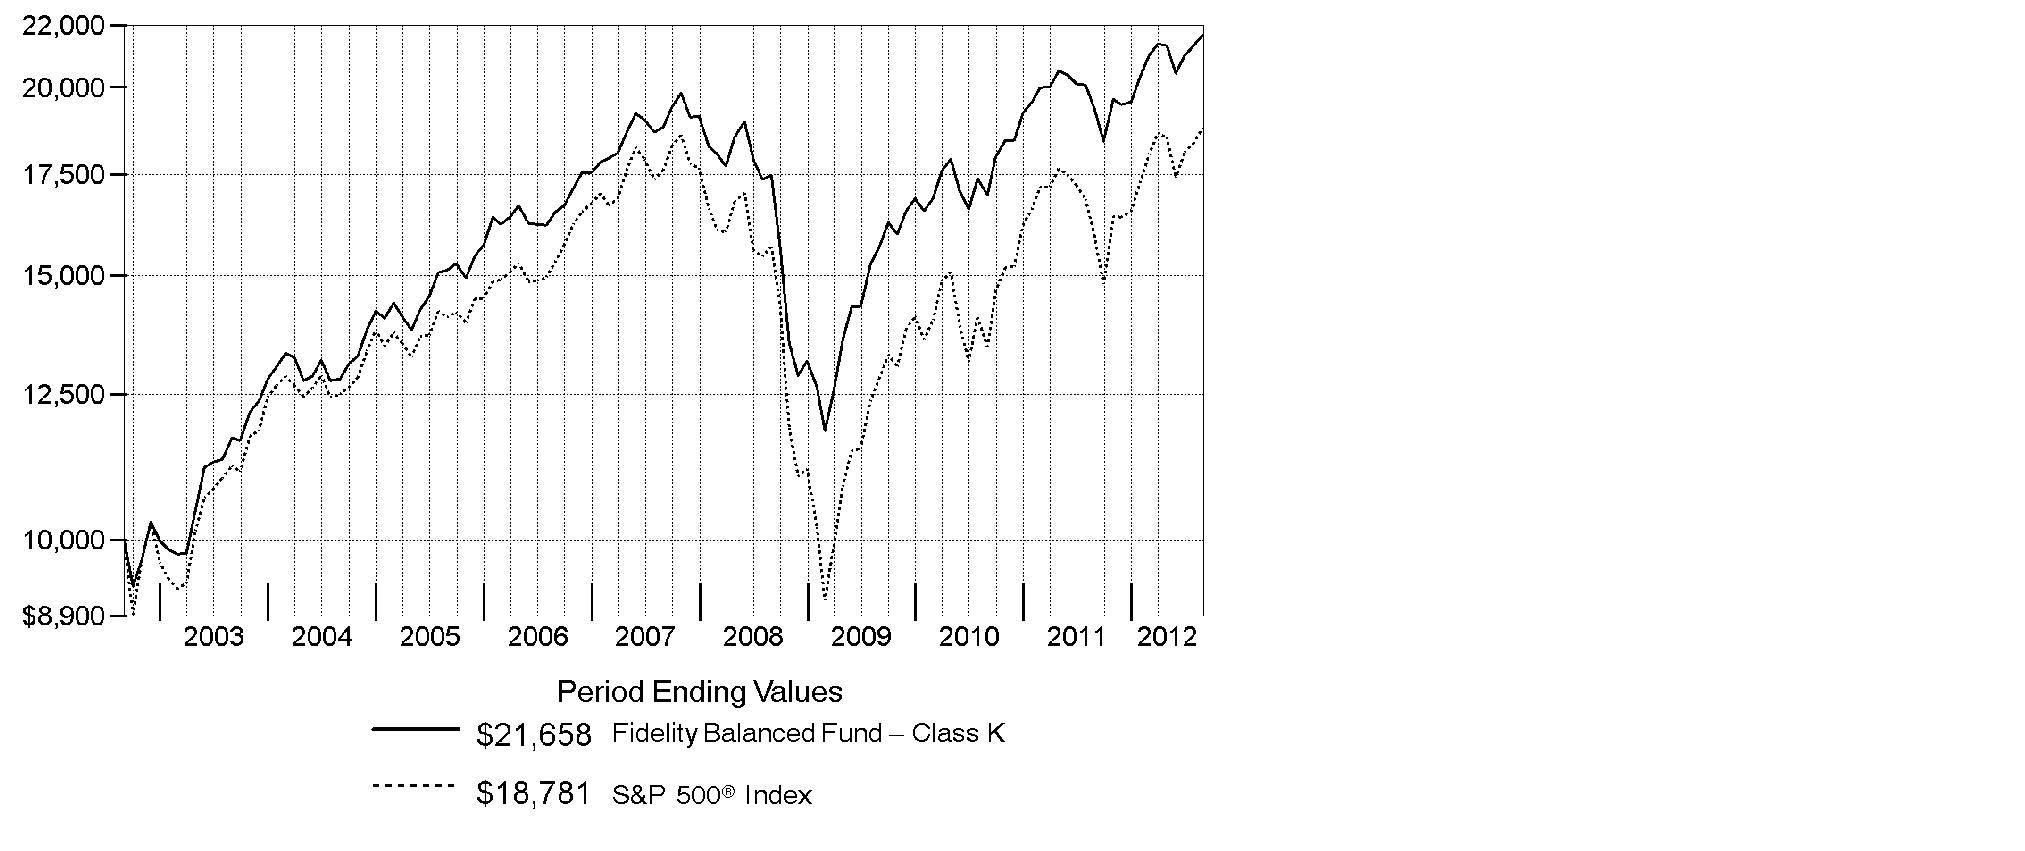
Class K A | 12.03% | 2.84% | 8.03% |
A The initial offering of Class K shares took place on May 9, 2008. Returns prior to May 9, 2008 are those of Fidelity® Balanced Fund, the original class of the fund.
$10,000 Over 10 Years
Let's say hypothetically that $10,000 was invested in Fidelity® Balanced Fund - Class K on August 31, 2002. The chart shows how the value of your investment would have changed, and also shows how the S&P 500® Index performed over the same period. The initial offering of Class K took place on May 9, 2008. See above for additional information regarding the performance of Class K.
Annual Report
Market Recap: U.S. stocks posted a strong gain for the 12 months ending August 31, 2012, overcoming losses sustained last summer and extending an uptrend that began in March 2009. The broad-based S&P 500® Index added 18.00% for the 12-month period, while the blue-chip-laden Dow Jones Industrial AverageSM and technology-heavy Nasdaq Composite® Index rose 15.86% and 20.26%, respectively. Uncertainty prevailed early on, as Greece neared insolvency and fear of debt contagion in Europe led the S&P 500® to its lowest point in more than a year, in early October. Markets reversed course that same month, and the S&P 500® rose to its largest monthly gain in two decades. Despite a rough patch in the spring, U.S. stocks pushed ahead for much of the remainder of the period, fueled by solid corporate earnings, a reviving housing market and hope for a solution in the eurozone. Elsewhere, foreign developed-markets stocks languished amid the European turmoil and as local currencies weakened versus the dollar, leaving the MSCI® EAFE® Index up just 0.10%. In the fixed-income arena, the search for yield benefited high-income securities, which returned 13.01%, according to The BofA Merrill LynchSM US High Yield Constrained Index. Higher-quality debt registered a more muted advance, with the Barclays® U.S. Aggregate Bond Index - a proxy for investment-grade debt - returning 5.78%.
Comments from Robert Stansky, Head of Fidelity's Stock Selector Large Cap Group, which manages Fidelity® Balanced Fund: For the year, the fund's Class K shares returned 12.03%, trailing the 13.34% gain of the Fidelity Balanced Hybrid Composite IndexSM, a hypothetical blend of the total returns of the S&P 500 and the Barclays® U.S. Aggregate Bond Index, using weightings of 60% and 40%, respectively. Disappointing stock selection hurt performance, although the negative impact was modestly offset by our overweighting in equities. The fund benefited the most from our fixed-income investments, including good picks and an underweighting in investment-grade bonds, and a small out-of-index allocation to high-yield bonds. Looking at individual holdings, the biggest detractor was enterprise software firm Oracle, primarily due to positioning during the first half of the period. The stock declined sharply in December, due to concern about future earnings, and we sold it by period end. Our decision to not own telecom giant and benchmark component AT&T for nearly the entire period also detracted. We were concerned about the stock's valuation. Conversely, a sizable position in Apple was the fund's top individual contributor, as the company's iPad® tablet computer and iPhone® smartphone continued to define their respective categories, helping the stock maintain its run of strong performance.
The views expressed above reflect those of the portfolio manager(s) only through the end of the period as stated on the cover of this report and do not necessarily represent the views of Fidelity or any other person in the Fidelity organization. Any such views are subject to change at any time based upon market or other conditions and Fidelity disclaims any responsibility to update such views. These views may not be relied on as investment advice and, because investment decisions for a Fidelity fund are based on numerous factors, may not be relied on as an indication of trading intent on behalf of any Fidelity fund.
Annual Report
Shareholder Expense Example
As a shareholder of the Fund, you incur two types of costs: (1) transaction costs, and (2) ongoing costs, including management fees and other Fund expenses. This Example is intended to help you understand your ongoing costs (in dollars) of investing in the Fund and to compare these costs with the ongoing costs of investing in other mutual funds.
The Example is based on an investment of $1,000 invested at the beginning of the period and held for the entire period (March 1, 2012 to August 31, 2012).
Actual Expenses
The first line of the accompanying table for each class of the Fund provides information about actual account values and actual expenses. You may use the information in this line, together with the amount you invested, to estimate the expenses that you paid over the period. Simply divide your account value by $1,000.00 (for example, an $8,600 account value divided by $1,000.00 = 8.6), then multiply the result by the number in the first line for a class of the Fund under the heading entitled "Expenses Paid During Period" to estimate the expenses you paid on your account during this period. A small balance maintenance fee of $12.00 that is charged once a year may apply for certain accounts with a value of less than $2,000. This fee is not included in the table below. If it was, the estimate of expenses you paid during the period would be higher, and your ending account value lower, by this amount. In addition, the Fund, as a shareholder in the underlying Fidelity Central Funds, will indirectly bear its pro-rata share of the fees and expenses incurred by the underlying Fidelity Central Funds. These fees and expenses are not included in the Fund's annualized expense ratio used to calculate the expense estimate in the table below.
Hypothetical Example for Comparison Purposes
The second line of the accompanying table for each class of the Fund provides information about hypothetical account values and hypothetical expenses based on a Class' actual expense ratio and an assumed rate of return of 5% per year before expenses, which is not the Class' actual return. The hypothetical account values and expenses may not be used to estimate the actual ending account balance or expenses you paid for the period. You may use this information to compare the ongoing costs of investing in the Fund and other funds. To do so, compare this 5% hypothetical example with the 5% hypothetical examples that appear in the shareholder reports of the other funds. A small balance maintenance fee of $12.00 that is charged once a year may apply for certain accounts with a value of less than $2,000. This fee is not included in the table below. If it was, the estimate of expenses you paid during the period would be higher, and your ending account value lower, by this amount. In addition, the Fund, as a shareholder in the underlying Fidelity Central Funds, will indirectly bear its pro-rata share of the fees and expenses incurred by the underlying Fidelity Central Funds. These fees and expenses are not included in the Fund's annualized expense ratio used to calculate the expense estimate in the table below.
Please note that the expenses shown in the table are meant to highlight your ongoing costs only and do not reflect any transaction costs. Therefore, the second line of the table is useful in comparing ongoing costs only, and will not help you determine the relative total costs of owning different funds.
Annual Report
| Annualized
Expense Ratio | Beginning
Account Value
March 1, 2012 | Ending
Account Value
August 31, 2012 | Expenses Paid
During Period*
March 1, 2012
to August 31, 2012 |
Balanced | .59% | | | |
Actual | | $ 1,000.00 | $ 1,031.80 | $ 3.01 |
HypotheticalA | | $ 1,000.00 | $ 1,022.17 | $ 3.00 |
Class K | .47% | | | |
Actual | | $ 1,000.00 | $ 1,032.30 | $ 2.40 |
HypotheticalA | | $ 1,000.00 | $ 1,022.77 | $ 2.39 |
A 5% return per year before expenses
* Expenses are equal to each Class' annualized expense ratio, multiplied by the average account value over the period, multiplied by 184/366 (to reflect the one-half year period). The fees and expenses of the underlying Fidelity Central Funds in which the Fund invests are not included in the Fund's annualized expense ratio.
Annual Report
Investment Changes (Unaudited)
The information in the following tables is based on the combined investments of the Fund and its pro-rata share of the investments of Fidelity's fixed-income central funds. |
Top Five Stocks as of August 31, 2012 |
| % of fund's
net assets | % of fund's net assets
6 months ago |
Apple, Inc. | 5.0 | 4.3 |
QUALCOMM, Inc. | 1.6 | 1.3 |
Microsoft Corp. | 1.6 | 1.3 |
Exxon Mobil Corp. | 1.5 | 0.9 |
Procter & Gamble Co. | 1.4 | 1.4 |
| 11.1 | |
Top Five Bond Issuers as of August 31, 2012 |
(with maturities greater than one year) | % of fund's
net assets | % of fund's net assets
6 months ago |
Fannie Mae | 9.2 | 5.4 |
U.S. Treasury Obligations | 5.1 | 10.0 |
Freddie Mac | 2.7 | 2.6 |
Ginnie Mae | 2.4 | 2.1 |
Wachovia Bank Commercial Mortgage Trust | 0.4 | 0.0 |
| 19.8 | |
Top Five Market Sectors as of August 31, 2012 |
| % of fund's
net assets | % of fund's net assets
6 months ago |
Information Technology | 14.1 | 13.6 |
Financials | 13.7 | 13.3 |
Energy | 8.9 | 9.6 |
Health Care | 8.1 | 7.4 |
Consumer Staples | 7.9 | 7.4 |
Asset Allocation (% of fund's net assets) |
As of August 31, 2012 * | As of February 29, 2012 ** |
 | Stocks and Equity
Futures 64.2% | | | Stocks and Equity
Futures 62.8% | |
 | Bonds 34.0% | | | Bonds 34.4% | |
 | Convertible
Securities 0.1% | | | Convertible
Securities 0.1% | |
 | Other Investments 0.3% | | | Other Investments 0.3% | |
 | Short-Term
Investments and
Net Other Assets
(Liabilities) 1.4% | |  | Short-Term
Investments and
Net Other Assets
(Liabilities) 2.4% | |
* Foreign investments | 8.9% | | ** Foreign investments | 13.1% | |

Percentages are adjusted for the effect of futures and swap contracts, if applicable. An unaudited holdings listing for the Fund, which presents direct holdings as well as the pro-rata share of any securities and other investments held indirectly through its investment in underlying non-money market Fidelity Central Funds, is available at fidelity.com. |
Percentages in the above tables are adjusted for the effect of TBA Sale Commitments. |
Annual Report
Investments August 31, 2012
Showing Percentage of Net Assets
Common Stocks - 63.7% |
| Shares | | Value (000s) |
CONSUMER DISCRETIONARY - 6.4% |
Diversified Consumer Services - 0.0% |
Weight Watchers International, Inc. (e) | 100,727 | | $ 4,812 |
Hotels, Restaurants & Leisure - 1.2% |
Arcos Dorados Holdings, Inc. | 713,097 | | 9,420 |
Domino's Pizza, Inc. | 819,931 | | 29,058 |
Dunkin' Brands Group, Inc. | 341,877 | | 9,959 |
Icahn Enterprises LP rights (a) | 290,524 | | 0 |
McDonald's Corp. | 757,421 | | 67,782 |
Starbucks Corp. | 1,086,917 | | 53,922 |
Yum! Brands, Inc. | 1,130,472 | | 72,034 |
| | 242,175 |
Internet & Catalog Retail - 0.4% |
Kayak Software Corp. (e)(f) | 203,012 | | 5,542 |
Priceline.com, Inc. (a) | 111,242 | | 67,254 |
| | 72,796 |
Media - 2.8% |
Comcast Corp. Class A | 6,618,603 | | 221,922 |
DIRECTV (a) | 1,641,196 | | 85,490 |
Legend Pictures LLC (a)(p)(q) | 8,571 | | 9,164 |
News Corp. Class A | 4,894,779 | | 114,489 |
Sirius XM Radio, Inc. (a) | 5,666,600 | | 14,336 |
The Walt Disney Co. | 2,541,497 | | 125,728 |
| | 571,129 |
Multiline Retail - 0.3% |
Dollar General Corp. (a) | 1,420,365 | | 72,538 |
Specialty Retail - 1.5% |
AutoZone, Inc. (a) | 148,441 | | 53,682 |
CarMax, Inc. (a) | 261,919 | | 8,012 |
Limited Brands, Inc. | 550,498 | | 26,754 |
Lowe's Companies, Inc. | 4,013,003 | | 114,290 |
TJX Companies, Inc. | 2,170,980 | | 99,409 |
| | 302,147 |
Textiles, Apparel & Luxury Goods - 0.2% |
Under Armour, Inc. Class A (sub. vtg.) (a)(e) | 754,878 | | 43,941 |
TOTAL CONSUMER DISCRETIONARY | | 1,309,538 |
CONSUMER STAPLES - 7.2% |
Beverages - 2.6% |
Anheuser-Busch InBev SA NV | 655,741 | | 55,169 |
Common Stocks - continued |
| Shares | | Value (000s) |
CONSUMER STAPLES - continued |
Beverages - continued |
Coca-Cola Bottling Co. CONSOLIDATED | 118,433 | | $ 8,129 |
Coca-Cola FEMSA SAB de CV sponsored ADR | 30,925 | | 3,774 |
Coca-Cola Icecek A/S | 394,435 | | 7,025 |
Companhia de Bebidas das Americas (AmBev) (PN) sponsored ADR | 164,725 | | 6,195 |
Constellation Brands, Inc. Class A (sub. vtg.) (a) | 1,476,841 | | 48,647 |
Diageo PLC sponsored ADR | 494,843 | | 54,047 |
Embotelladora Andina SA sponsored ADR | 218,222 | | 7,184 |
Molson Coors Brewing Co. Class B | 628,844 | | 28,009 |
Monster Beverage Corp. (a) | 97,800 | | 5,763 |
Pernod Ricard SA | 344,150 | | 37,084 |
Remy Cointreau SA | 176,092 | | 20,113 |
The Coca-Cola Co. | 6,784,472 | | 253,739 |
| | 534,878 |
Food & Staples Retailing - 1.0% |
CVS Caremark Corp. | 3,242,038 | | 147,675 |
Drogasil SA | 434,400 | | 4,595 |
Kroger Co. | 801,453 | | 17,856 |
Safeway, Inc. | 278,105 | | 4,352 |
Wal-Mart Stores, Inc. | 394,834 | | 28,665 |
Walgreen Co. | 386,702 | | 13,828 |
| | 216,971 |
Food Products - 0.5% |
Bunge Ltd. | 348,589 | | 22,188 |
Green Mountain Coffee Roasters, Inc. (a) | 168,876 | | 4,105 |
Mead Johnson Nutrition Co. Class A | 137,761 | | 10,102 |
Nestle SA | 338,708 | | 21,056 |
Orion Corp. | 5,168 | | 4,194 |
Pilgrims Pride Corp. | 748,200 | | 3,980 |
Unilever NV (NY Reg.) | 1,018,331 | | 35,418 |
| | 101,043 |
Household Products - 1.6% |
Colgate-Palmolive Co. | 327,533 | | 34,820 |
Procter & Gamble Co. | 4,164,463 | | 279,810 |
Spectrum Brands Holdings, Inc. | 202,786 | | 7,469 |
| | 322,099 |
Common Stocks - continued |
| Shares | | Value (000s) |
CONSUMER STAPLES - continued |
Personal Products - 0.2% |
L'Oreal SA | 256,900 | | $ 31,583 |
Nu Skin Enterprises, Inc. Class A | 281,363 | | 11,674 |
| | 43,257 |
Tobacco - 1.3% |
Altria Group, Inc. | 543,295 | | 18,450 |
British American Tobacco PLC sponsored ADR | 2,088,001 | | 218,697 |
Philip Morris International, Inc. | 200,183 | | 17,876 |
Souza Cruz SA | 477,700 | | 6,403 |
| | 261,426 |
TOTAL CONSUMER STAPLES | | 1,479,674 |
ENERGY - 7.2% |
Energy Equipment & Services - 1.6% |
Cameron International Corp. (a) | 743,991 | | 40,704 |
Ensco PLC Class A | 823,839 | | 47,264 |
Forum Energy Technologies, Inc. | 341,364 | | 8,080 |
Halliburton Co. | 746,958 | | 24,470 |
National Oilwell Varco, Inc. | 1,061,248 | | 83,626 |
Noble Corp. | 1,087,208 | | 41,466 |
Ocean Rig UDW, Inc. (United States) | 455,396 | | 7,619 |
Oceaneering International, Inc. | 220,987 | | 11,832 |
Oil States International, Inc. (a) | 101,400 | | 7,934 |
Schlumberger Ltd. | 631,524 | | 45,710 |
Vantage Drilling Co. (a) | 4,677,101 | | 7,109 |
| | 325,814 |
Oil, Gas & Consumable Fuels - 5.6% |
Anadarko Petroleum Corp. | 900,802 | | 62,399 |
Apache Corp. | 835,168 | | 71,616 |
Cheniere Energy, Inc. (a) | 193,100 | | 2,850 |
Chevron Corp. | 1,260,894 | | 141,422 |
Cobalt International Energy, Inc. (a) | 317,200 | | 7,204 |
EQT Corp. | 360,200 | | 19,436 |
Exxon Mobil Corp. | 3,618,457 | | 315,891 |
Halcon Resources Corp. (q) | 910,000 | | 6,989 |
Hess Corp. | 619,326 | | 31,295 |
HollyFrontier Corp. | 836,666 | | 33,709 |
InterOil Corp. (a)(e) | 310,031 | | 24,660 |
Marathon Oil Corp. | 2,036,593 | | 56,658 |
Marathon Petroleum Corp. | 1,189,088 | | 61,535 |
Common Stocks - continued |
| Shares | | Value (000s) |
ENERGY - continued |
Oil, Gas & Consumable Fuels - continued |
Noble Energy, Inc. | 325,965 | | $ 28,652 |
Northern Tier Energy LP Class A | 458,700 | | 8,394 |
Occidental Petroleum Corp. | 1,038,752 | | 88,304 |
Phillips 66 | 375,591 | | 15,775 |
Royal Dutch Shell PLC Class B sponsored ADR (e) | 1,233,621 | | 89,055 |
Suncor Energy, Inc. | 1,602,400 | | 50,084 |
Williams Companies, Inc. | 1,122,100 | | 36,210 |
| | 1,152,138 |
TOTAL ENERGY | | 1,477,952 |
FINANCIALS - 9.3% |
Capital Markets - 0.8% |
BlackRock, Inc. Class A | 275,742 | | 48,633 |
E*TRADE Financial Corp. (a) | 629,301 | | 5,393 |
Evercore Partners, Inc. Class A | 275,200 | | 6,797 |
ICAP PLC | 923,400 | | 4,658 |
Invesco Ltd. | 903,982 | | 21,406 |
Morgan Stanley | 1,163,200 | | 17,448 |
State Street Corp. | 563,918 | | 23,459 |
TD Ameritrade Holding Corp. | 904,736 | | 15,480 |
The Blackstone Group LP | 1,026,000 | | 13,841 |
UBS AG | 647,930 | | 7,229 |
| | 164,344 |
Commercial Banks - 2.2% |
CIT Group, Inc. (a) | 708,926 | | 26,769 |
Comerica, Inc. | 1,107,648 | | 34,016 |
Credit Agricole SA (a) | 924,624 | | 5,394 |
FirstMerit Corp. | 318,698 | | 5,000 |
Huntington Bancshares, Inc. | 4,733,054 | | 31,238 |
Lloyds Banking Group PLC (a) | 7,606,900 | | 4,014 |
M&T Bank Corp. | 314,819 | | 27,358 |
Synovus Financial Corp. (e) | 4,461,120 | | 9,279 |
U.S. Bancorp | 7,141,743 | | 238,606 |
Wells Fargo & Co. | 2,356,876 | | 80,204 |
| | 461,878 |
Consumer Finance - 1.5% |
Capital One Financial Corp. | 4,019,745 | | 227,236 |
Common Stocks - continued |
| Shares | | Value (000s) |
FINANCIALS - continued |
Consumer Finance - continued |
Discover Financial Services | 364,652 | | $ 14,123 |
SLM Corp. | 4,030,734 | | 63,484 |
| | 304,843 |
Diversified Financial Services - 1.7% |
African Bank Investments Ltd. | 692,111 | | 2,677 |
Bank of America Corp. | 3,429,996 | | 27,406 |
Citigroup, Inc. | 5,059,146 | | 150,307 |
JPMorgan Chase & Co. | 4,570,385 | | 169,744 |
NBH Holdings Corp. Class A (a)(g) | 576,500 | | 10,233 |
| | 360,367 |
Insurance - 1.9% |
ACE Ltd. | 494,636 | | 36,470 |
Amlin PLC | 1,942,409 | | 11,893 |
Berkshire Hathaway, Inc.: | | | |
Class A (a) | 234 | | 29,615 |
Class B (a) | 486,868 | | 41,062 |
Fairfax Financial Holdings Ltd. (sub. vtg.) | 71,900 | | 27,073 |
Hartford Financial Services Group, Inc. | 1,013,400 | | 18,170 |
MetLife, Inc. | 2,833,406 | | 96,704 |
Prudential Financial, Inc. | 178,800 | | 9,746 |
The Travelers Companies, Inc. | 1,037,039 | | 67,138 |
Torchmark Corp. | 494,632 | | 25,315 |
Validus Holdings Ltd. | 952,465 | | 31,917 |
| | 395,103 |
Real Estate Investment Trusts - 0.9% |
American Tower Corp. | 1,162,045 | | 81,808 |
Camden Property Trust (SBI) | 303,775 | | 21,091 |
Equity Lifestyle Properties, Inc. | 288,929 | | 19,867 |
Home Properties, Inc. | 29,800 | | 1,903 |
Japan Retail Fund Investment Corp. | 3,499 | | 5,991 |
Sun Communities, Inc. | 280,526 | | 12,851 |
The Macerich Co. | 685,541 | | 40,838 |
| | 184,349 |
Thrifts & Mortgage Finance - 0.3% |
Ocwen Financial Corp. (a) | 2,001,417 | | 51,496 |
TOTAL FINANCIALS | | 1,922,380 |
Common Stocks - continued |
| Shares | | Value (000s) |
HEALTH CARE - 7.5% |
Biotechnology - 2.3% |
Alexion Pharmaceuticals, Inc. (a) | 132,137 | | $ 14,166 |
Amgen, Inc. | 2,040,855 | | 171,269 |
Biogen Idec, Inc. (a) | 539,608 | | 79,101 |
BioMarin Pharmaceutical, Inc. (a) | 596,287 | | 22,265 |
CSL Ltd. | 293,502 | | 13,473 |
CSL Ltd. ADR | 379,200 | | 8,691 |
Gilead Sciences, Inc. (a) | 2,149,093 | | 123,981 |
Onyx Pharmaceuticals, Inc. (a) | 415,782 | | 29,903 |
Theravance, Inc. (a) | 198,850 | | 5,303 |
| | 468,152 |
Health Care Equipment & Supplies - 1.0% |
C.R. Bard, Inc. | 380,956 | | 37,376 |
Covidien PLC | 1,241,865 | | 69,607 |
Edwards Lifesciences Corp. (a) | 528,081 | | 53,922 |
Quidel Corp. (a)(e) | 1,317,147 | | 21,390 |
The Cooper Companies, Inc. | 406,065 | | 34,049 |
| | 216,344 |
Health Care Providers & Services - 1.3% |
Catamaran Corp. (a) | 165,961 | | 14,405 |
CIGNA Corp. | 816,351 | | 37,364 |
Express Scripts Holding Co. (a) | 402,065 | | 25,177 |
Henry Schein, Inc. (a) | 715,654 | | 54,969 |
McKesson Corp. | 373,348 | | 32,522 |
Omnicare, Inc. | 341,802 | | 11,068 |
UnitedHealth Group, Inc. | 1,782,107 | | 96,768 |
WellPoint, Inc. | 88,200 | | 5,281 |
| | 277,554 |
Pharmaceuticals - 2.9% |
Allergan, Inc. | 770,565 | | 66,369 |
Eli Lilly & Co. | 380,900 | | 17,106 |
GlaxoSmithKline PLC sponsored ADR | 553,190 | | 25,165 |
Merck & Co., Inc. | 2,594,840 | | 111,708 |
Optimer Pharmaceuticals, Inc. (a) | 568,104 | | 8,539 |
Pfizer, Inc. | 11,662,658 | | 278,271 |
Sanofi SA sponsored ADR | 590,703 | | 24,189 |
Valeant Pharmaceuticals International, Inc. (Canada) (a) | 1,099,375 | | 56,288 |
| | 587,635 |
TOTAL HEALTH CARE | | 1,549,685 |
Common Stocks - continued |
| Shares | | Value (000s) |
INDUSTRIALS - 6.6% |
Aerospace & Defense - 1.9% |
Honeywell International, Inc. | 1,388,553 | | $ 81,161 |
MTU Aero Engines Holdings AG | 218,364 | | 16,664 |
Precision Castparts Corp. | 334,903 | | 53,946 |
Raytheon Co. | 683,637 | | 38,639 |
Textron, Inc. | 2,095,158 | | 55,983 |
The Boeing Co. | 899,838 | | 64,248 |
United Technologies Corp. | 1,099,534 | | 87,798 |
| | 398,439 |
Air Freight & Logistics - 0.4% |
United Parcel Service, Inc. Class B | 1,230,637 | | 90,833 |
Building Products - 0.5% |
Armstrong World Industries, Inc. | 660,746 | | 29,053 |
Owens Corning (a) | 1,469,438 | | 49,020 |
Quanex Building Products Corp. | 947,855 | | 16,587 |
| | 94,660 |
Commercial Services & Supplies - 0.2% |
Stericycle, Inc. (a) | 347,149 | | 31,771 |
Electrical Equipment - 0.4% |
Regal-Beloit Corp. | 633,339 | | 43,105 |
Roper Industries, Inc. | 350,067 | | 35,983 |
| | 79,088 |
Industrial Conglomerates - 1.8% |
Danaher Corp. | 1,396,974 | | 74,836 |
General Electric Co. | 12,219,400 | | 253,064 |
Tyco International Ltd. | 804,119 | | 45,336 |
| | 373,236 |
Machinery - 0.6% |
Caterpillar, Inc. | 205,413 | | 17,528 |
Cummins, Inc. | 441,167 | | 42,842 |
Fiat Industrial SpA | 675,197 | | 6,798 |
Illinois Tool Works, Inc. | 763,773 | | 45,284 |
| | 112,452 |
Road & Rail - 0.7% |
CSX Corp. | 1,922,124 | | 43,171 |
J.B. Hunt Transport Services, Inc. | 191,549 | | 10,045 |
Union Pacific Corp. | 807,500 | | 98,063 |
| | 151,279 |
Common Stocks - continued |
| Shares | | Value (000s) |
INDUSTRIALS - continued |
Trading Companies & Distributors - 0.1% |
W.W. Grainger, Inc. | 95,800 | | $ 19,731 |
TOTAL INDUSTRIALS | | 1,351,489 |
INFORMATION TECHNOLOGY - 13.8% |
Communications Equipment - 2.2% |
Acme Packet, Inc. (a) | 677,252 | | 12,929 |
ADTRAN, Inc. | 1,098,668 | | 22,292 |
Finisar Corp. (a) | 983,487 | | 13,513 |
Juniper Networks, Inc. (a) | 2,780,146 | | 48,486 |
NETGEAR, Inc. (a) | 322,578 | | 11,797 |
QUALCOMM, Inc. | 5,382,555 | | 330,812 |
Riverbed Technology, Inc. (a) | 616,612 | | 12,326 |
| | 452,155 |
Computers & Peripherals - 5.4% |
Apple, Inc. | 1,541,738 | | 1,025,622 |
NetApp, Inc. (a) | 157,707 | | 5,444 |
SanDisk Corp. (a) | 1,988,456 | | 81,964 |
| | 1,113,030 |
Electronic Equipment & Components - 0.3% |
Hon Hai Precision Industry Co. Ltd. (Foxconn) | 10,180,000 | | 28,884 |
Jabil Circuit, Inc. | 1,846,550 | | 42,064 |
Uni-Pixel Inc. (a) | 90,300 | | 545 |
| | 71,493 |
Internet Software & Services - 1.0% |
Dice Holdings, Inc. (a) | 965,144 | | 7,702 |
eBay, Inc. (a) | 1,081,464 | | 51,337 |
Facebook, Inc. Class A | 856,127 | | 15,479 |
Google, Inc. Class A (a) | 135,830 | | 93,056 |
Mail.ru Group Ltd.: | | | |
GDR (g) | 391,234 | | 12,821 |
GDR (Reg. S) | 195,272 | | 6,399 |
VeriSign, Inc. (a) | 337,918 | | 16,112 |
| | 202,906 |
IT Services - 0.0% |
Accenture PLC Class A | 32,270 | | 1,988 |
Semiconductors & Semiconductor Equipment - 2.3% |
Analog Devices, Inc. | 3,381,391 | | 134,376 |
ARM Holdings PLC sponsored ADR | 641,300 | | 17,469 |
Common Stocks - continued |
| Shares | | Value (000s) |
INFORMATION TECHNOLOGY - continued |
Semiconductors & Semiconductor Equipment - continued |
ASAT Holdings Ltd. (a) | 88,719 | | $ 0 |
ASML Holding NV | 501,249 | | 28,456 |
Avago Technologies Ltd. | 1,928,985 | | 70,543 |
Dialog Semiconductor PLC (a) | 384,898 | | 8,286 |
Fairchild Semiconductor International, Inc. (a) | 841,711 | | 12,222 |
International Rectifier Corp. (a) | 676,289 | | 11,774 |
Maxim Integrated Products, Inc. | 1,194,297 | | 32,413 |
Micron Technology, Inc. (a) | 7,144,995 | | 44,370 |
NXP Semiconductors NV (a) | 1,327,116 | | 30,948 |
ON Semiconductor Corp. (a) | 2,754,511 | | 17,161 |
PMC-Sierra, Inc. (a) | 2,578,085 | | 15,082 |
RF Micro Devices, Inc. (a) | 4,914,586 | | 18,430 |
Rubicon Technology, Inc. (a)(e) | 123,185 | | 1,037 |
Skyworks Solutions, Inc. (a) | 1,141,255 | | 34,763 |
| | 477,330 |
Software - 2.6% |
Check Point Software Technologies Ltd. (a) | 1,096,779 | | 50,551 |
Citrix Systems, Inc. (a) | 1,544,850 | | 120,019 |
Microsoft Corp. | 10,609,586 | | 326,987 |
Sourcefire, Inc. (a) | 158,833 | | 8,242 |
VMware, Inc. Class A (a) | 226,267 | | 20,147 |
| | 525,946 |
TOTAL INFORMATION TECHNOLOGY | | 2,844,848 |
MATERIALS - 2.0% |
Chemicals - 1.4% |
Air Products & Chemicals, Inc. | 647,168 | | 53,443 |
E.I. du Pont de Nemours & Co. | 1,381,887 | | 68,749 |
Eastman Chemical Co. | 627,953 | | 34,701 |
Ecolab, Inc. | 494,778 | | 31,681 |
LyondellBasell Industries NV Class A | 491,016 | | 23,981 |
Sherwin-Williams Co. | 299,779 | | 42,892 |
Sigma Aldrich Corp. | 389,450 | | 27,663 |
| | 283,110 |
Containers & Packaging - 0.3% |
Ball Corp. | 669,211 | | 28,221 |
Rock-Tenn Co. Class A | 470,505 | | 31,416 |
| | 59,637 |
Common Stocks - continued |
| Shares | | Value (000s) |
MATERIALS - continued |
Metals & Mining - 0.3% |
First Quantum Minerals Ltd. (e) | 1,466,705 | | $ 28,255 |
Goldcorp, Inc. | 765,897 | | 31,444 |
Turquoise Hill Resources Ltd. (a) | 1,893,665 | | 15,215 |
| | 74,914 |
TOTAL MATERIALS | | 417,661 |
TELECOMMUNICATION SERVICES - 1.5% |
Diversified Telecommunication Services - 1.2% |
AT&T, Inc. | 1,892,026 | | 69,324 |
CenturyLink, Inc. | 1,777,204 | | 75,105 |
Verizon Communications, Inc. | 2,232,168 | | 95,849 |
| | 240,278 |
Wireless Telecommunication Services - 0.3% |
SBA Communications Corp. Class A (a) | 442,894 | | 26,476 |
Sprint Nextel Corp. (a) | 9,026,777 | | 43,780 |
| | 70,256 |
TOTAL TELECOMMUNICATION SERVICES | | 310,534 |
UTILITIES - 2.2% |
Electric Utilities - 1.4% |
American Electric Power Co., Inc. | 417,924 | | 17,967 |
Duke Energy Corp. | 1,406,380 | | 91,105 |
Edison International | 1,547,007 | | 67,743 |
FirstEnergy Corp. | 1,320,436 | | 57,703 |
NextEra Energy, Inc. | 926,475 | | 62,361 |
| | 296,879 |
Gas Utilities - 0.0% |
ONEOK, Inc. | 184,456 | | 8,214 |
Independent Power Producers & Energy Traders - 0.2% |
NRG Energy, Inc. | 243,000 | | 5,186 |
The AES Corp. | 2,731,715 | | 31,114 |
| | 36,300 |
Multi-Utilities - 0.6% |
CenterPoint Energy, Inc. | 1,386,952 | | 28,280 |
NiSource, Inc. | 698,474 | | 17,001 |
Common Stocks - continued |
| Shares | | Value (000s) |
UTILITIES - continued |
Multi-Utilities - continued |
PG&E Corp. | 592,029 | | $ 25,700 |
Sempra Energy | 750,345 | | 49,673 |
| | 120,654 |
TOTAL UTILITIES | | 462,047 |
TOTAL COMMON STOCKS (Cost $10,748,046) |
13,125,808
|
Convertible Preferred Stocks - 0.0% |
| | | |
CONSUMER DISCRETIONARY - 0.0% |
Media - 0.0% |
Jumptap, Inc. Series G (q) | 893,724 | | 6,429 |
INFORMATION TECHNOLOGY - 0.0% |
Semiconductors & Semiconductor Equipment - 0.0% |
ASAT Holdings Ltd. 13.00% (a) | 2,416 | | 0 |
TOTAL CONVERTIBLE PREFERRED STOCKS (Cost $6,519) |
6,429
|
Nonconvertible Bonds - 7.4% |
| Principal Amount (000s) | | |
CONSUMER DISCRETIONARY - 0.7% |
Automobiles - 0.2% |
Daimler Finance North America LLC 1.65% 4/10/15 (g) | | $ 20,636 | | 20,903 |
Volkswagen International Finance NV 2.375% 3/22/17 (g) | | 10,000 | | 10,328 |
| | 31,231 |
Media - 0.5% |
AOL Time Warner, Inc. 7.625% 4/15/31 | | 4,975 | | 6,762 |
Comcast Corp.: | | | | |
4.65% 7/15/42 | | 5,049 | | 5,392 |
5.15% 3/1/20 | | 644 | | 767 |
6.4% 3/1/40 | | 6,097 | | 8,023 |
COX Communications, Inc. 4.625% 6/1/13 | | 3,612 | | 3,720 |
Discovery Communications LLC 3.7% 6/1/15 | | 5,116 | | 5,485 |
Nonconvertible Bonds - continued |
| Principal Amount (000s) | | Value (000s) |
CONSUMER DISCRETIONARY - continued |
Media - continued |
NBCUniversal Media LLC: | | | | |
5.15% 4/30/20 | | $ 7,276 | | $ 8,592 |
6.4% 4/30/40 | | 6,271 | | 8,138 |
News America Holdings, Inc. 7.75% 12/1/45 | | 8,630 | | 11,735 |
News America, Inc. 6.15% 2/15/41 | | 9,222 | | 11,348 |
Time Warner Cable, Inc.: | | | | |
4.5% 9/15/42 | | 5,093 | | 5,071 |
5.5% 9/1/41 | | 13,538 | | 15,346 |
6.2% 7/1/13 | | 2,729 | | 2,854 |
6.75% 7/1/18 | | 1,378 | | 1,724 |
Time Warner, Inc.: | | | | |
5.875% 11/15/16 | | 4,125 | | 4,884 |
6.2% 3/15/40 | | 3,821 | | 4,697 |
6.5% 11/15/36 | | 2,758 | | 3,449 |
| | 107,987 |
Specialty Retail - 0.0% |
Staples, Inc. 7.375% 10/1/12 | | 820 | | 824 |
TOTAL CONSUMER DISCRETIONARY | | 140,042 |
CONSUMER STAPLES - 0.5% |
Beverages - 0.1% |
Beam, Inc.: | | | | |
1.875% 5/15/17 | | 1,331 | | 1,359 |
3.25% 5/15/22 | | 1,578 | | 1,636 |
Diageo Capital PLC 5.2% 1/30/13 | | 4,139 | | 4,219 |
FBG Finance Ltd. 5.125% 6/15/15 (g) | | 3,447 | | 3,811 |
Fortune Brands, Inc.: | | | | |
5.375% 1/15/16 | | 1,615 | | 1,840 |
5.875% 1/15/36 | | 6,416 | | 7,676 |
6.375% 6/15/14 | | 482 | | 527 |
SABMiller Holdings, Inc. 3.75% 1/15/22 (g) | | 5,490 | | 5,958 |
| | 27,026 |
Food Products - 0.0% |
Cargill, Inc. 6% 11/27/17 (g) | | 572 | | 695 |
Kraft Foods, Inc.: | | | | |
6.5% 2/9/40 | | 3,854 | | 5,316 |
6.75% 2/19/14 | | 436 | | 474 |
| | 6,485 |
Nonconvertible Bonds - continued |
| Principal Amount (000s) | | Value (000s) |
CONSUMER STAPLES - continued |
Tobacco - 0.4% |
Altria Group, Inc.: | | | | |
2.85% 8/9/22 | | $ 4,604 | | $ 4,591 |
4.25% 8/9/42 | | 4,604 | | 4,500 |
9.7% 11/10/18 | | 16,451 | | 23,620 |
Philip Morris International, Inc. 1.125% 8/21/17 | | 24,419 | | 24,374 |
Reynolds American, Inc.: | | | | |
6.75% 6/15/17 | | 3,486 | | 4,223 |
7.25% 6/15/37 | | 7,569 | | 9,708 |
| | 71,016 |
TOTAL CONSUMER STAPLES | | 104,527 |
ENERGY - 1.1% |
Energy Equipment & Services - 0.2% |
DCP Midstream LLC: | | | | |
4.75% 9/30/21 (g) | | 6,554 | | 6,949 |
5.35% 3/15/20 (g) | | 6,637 | | 7,281 |
El Paso Pipeline Partners Operating Co. LLC: | | | | |
4.1% 11/15/15 | | 7,675 | | 8,099 |
5% 10/1/21 | | 2,791 | | 3,050 |
6.5% 4/1/20 | | 1,091 | | 1,287 |
Transocean, Inc.: | | | | |
5.05% 12/15/16 | | 4,522 | | 5,009 |
6.375% 12/15/21 | | 5,971 | | 7,198 |
Weatherford International Ltd.: | | | | |
4.95% 10/15/13 | | 2,045 | | 2,130 |
5.15% 3/15/13 | | 2,673 | | 2,730 |
| | 43,733 |
Oil, Gas & Consumable Fuels - 0.9% |
Anadarko Petroleum Corp.: | | | | |
5.95% 9/15/16 | | 718 | | 830 |
6.375% 9/15/17 | | 13,514 | | 16,161 |
Canadian Natural Resources Ltd. 5.15% 2/1/13 | | 5,282 | | 5,380 |
Duke Capital LLC 6.25% 2/15/13 | | 809 | | 829 |
Duke Energy Field Services: | | | | |
5.375% 10/15/15 (g) | | 1,435 | | 1,545 |
6.45% 11/3/36 (g) | | 6,493 | | 7,497 |
El Paso Natural Gas Co. 5.95% 4/15/17 | | 1,098 | | 1,258 |
Enbridge Energy Partners LP 4.2% 9/15/21 | | 7,741 | | 8,264 |
Encana Holdings Finance Corp. 5.8% 5/1/14 | | 3,391 | | 3,644 |
Nonconvertible Bonds - continued |
| Principal Amount (000s) | | Value (000s) |
ENERGY - continued |
Oil, Gas & Consumable Fuels - continued |
Enterprise Products Operating LP: | | | | |
5.6% 10/15/14 | | $ 715 | | $ 783 |
5.65% 4/1/13 | | 563 | | 577 |
Gulfstream Natural Gas System LLC 6.95% 6/1/16 (g) | | 327 | | 382 |
Marathon Petroleum Corp. 5.125% 3/1/21 | | 4,207 | | 4,837 |
Midcontinent Express Pipeline LLC 5.45% 9/15/14 (g) | | 6,234 | | 6,430 |
Motiva Enterprises LLC 6.85% 1/15/40 (g) | | 4,294 | | 5,662 |
Nakilat, Inc. 6.067% 12/31/33 (g) | | 2,490 | | 2,944 |
Nexen, Inc. 5.2% 3/10/15 | | 1,067 | | 1,161 |
Petrobras International Finance Co. Ltd.: | | | | |
3.875% 1/27/16 | | 6,946 | | 7,293 |
7.875% 3/15/19 | | 7,382 | | 9,153 |
Petroleos Mexicanos: | | | | |
4.875% 1/24/22 (g) | | 1,430 | | 1,605 |
5.5% 1/21/21 | | 7,423 | | 8,666 |
5.5% 6/27/44 (g) | | 6,720 | | 7,308 |
6% 3/5/20 | | 952 | | 1,135 |
6.5% 6/2/41 (g) | | 8,760 | | 10,884 |
Phillips 66: | | | | |
4.3% 4/1/22 (g) | | 6,038 | | 6,580 |
5.875% 5/1/42 (g) | | 5,485 | | 6,484 |
Plains All American Pipeline LP/PAA Finance Corp.: | | | | |
3.65% 6/1/22 | | 3,381 | | 3,575 |
3.95% 9/15/15 | | 149 | | 161 |
4.25% 9/1/12 | | 718 | | 718 |
6.125% 1/15/17 | | 1,940 | | 2,301 |
Ras Laffan Liquefied Natural Gas Co. Ltd. III: | | | | |
4.5% 9/30/12 (g) | | 3,472 | | 3,472 |
5.5% 9/30/14 (g) | | 5,137 | | 5,535 |
5.832% 9/30/16 (g) | | 1,121 | | 1,222 |
6.332% 9/30/27 (g) | | 5,910 | | 6,988 |
6.75% 9/30/19 (g) | | 3,177 | | 3,939 |
Rockies Express Pipeline LLC 6.25% 7/15/13 (g) | | 3,193 | | 3,289 |
Southeast Supply Header LLC 4.85% 8/15/14 (g) | | 543 | | 571 |
Spectra Energy Capital, LLC 5.65% 3/1/20 | | 455 | | 525 |
Spectra Energy Partners, LP: | | | | |
2.95% 6/15/16 | | 1,325 | | 1,352 |
4.6% 6/15/21 | | 1,733 | | 1,882 |
Texas Eastern Transmission LP 6% 9/15/17 (g) | | 1,301 | | 1,513 |
Nonconvertible Bonds - continued |
| Principal Amount (000s) | | Value (000s) |
ENERGY - continued |
Oil, Gas & Consumable Fuels - continued |
TransCapitalInvest Ltd. 5.67% 3/5/14 (g) | | $ 4,215 | | $ 4,457 |
Western Gas Partners LP 5.375% 6/1/21 | | 7,979 | | 8,862 |
| | 177,654 |
TOTAL ENERGY | | 221,387 |
FINANCIALS - 3.2% |
Capital Markets - 0.2% |
BlackRock, Inc. 3.375% 6/1/22 | | 3,840 | | 4,063 |
Goldman Sachs Group, Inc.: | | | | |
5.95% 1/18/18 | | 4,684 | | 5,269 |
6.15% 4/1/18 | | 1,671 | | 1,900 |
Lazard Group LLC: | | | | |
6.85% 6/15/17 | | 4,528 | | 5,108 |
7.125% 5/15/15 | | 1,616 | | 1,773 |
Merrill Lynch & Co., Inc.: | | | | |
6.11% 1/29/37 | | 5,110 | | 5,138 |
6.4% 8/28/17 | | 4,179 | | 4,749 |
Morgan Stanley: | | | | |
5.5% 7/28/21 | | 7,030 | | 7,212 |
5.625% 9/23/19 | | 1,795 | | 1,858 |
5.75% 1/25/21 | | 2,403 | | 2,483 |
7.3% 5/13/19 | | 6,528 | | 7,367 |
| | 46,920 |
Commercial Banks - 0.6% |
Bank of America NA 5.3% 3/15/17 | | 8,427 | | 9,173 |
BB&T Corp. 3.95% 3/22/22 | | 6,787 | | 7,330 |
Credit Suisse New York Branch 6% 2/15/18 | | 15,195 | | 16,877 |
Discover Bank: | | | | |
7% 4/15/20 | | 3,831 | | 4,509 |
8.7% 11/18/19 | | 2,425 | | 3,070 |
Fifth Third Bancorp: | | | | |
4.5% 6/1/18 | | 584 | | 634 |
8.25% 3/1/38 | | 4,070 | | 5,690 |
Fifth Third Bank 4.75% 2/1/15 | | 951 | | 1,014 |
Fifth Third Capital Trust IV 6.5% 4/15/67 (m) | | 4,393 | | 4,393 |
HBOS PLC 6.75% 5/21/18 (g) | | 560 | | 553 |
HSBC Holdings PLC 4% 3/30/22 | | 5,850 | | 6,276 |
Huntington Bancshares, Inc. 7% 12/15/20 | | 1,908 | | 2,278 |
JPMorgan Chase Bank 6% 10/1/17 | | 2,460 | | 2,897 |
Nonconvertible Bonds - continued |
| Principal Amount (000s) | | Value (000s) |
FINANCIALS - continued |
Commercial Banks - continued |
KeyBank NA: | | | | |
5.45% 3/3/16 | | $ 2,765 | | $ 3,092 |
5.8% 7/1/14 | | 5,776 | | 6,190 |
Marshall & Ilsley Bank: | | | | |
4.85% 6/16/15 | | 3,561 | | 3,840 |
5% 1/17/17 | | 9,004 | | 10,094 |
5.25% 9/4/12 | | 2,221 | | 2,221 |
Regions Bank: | | | | |
6.45% 6/26/37 | | 9,201 | | 9,213 |
7.5% 5/15/18 | | 3,852 | | 4,488 |
Regions Financial Corp.: | | | | |
5.75% 6/15/15 | | 1,443 | | 1,533 |
7.75% 11/10/14 | | 6,740 | | 7,466 |
UnionBanCal Corp. 5.25% 12/16/13 | | 777 | | 813 |
Wachovia Corp.: | | | | |
5.625% 10/15/16 | | 3,991 | | 4,596 |
5.75% 6/15/17 | | 2,371 | | 2,830 |
Wells Fargo & Co. 3.676% 6/15/16 | | 3,236 | | 3,521 |
| | 124,591 |
Consumer Finance - 0.4% |
Capital One Financial Corp. 2.15% 3/23/15 | | 20,318 | | 20,810 |
Discover Financial Services: | | | | |
5.2% 4/27/22 | | 1,290 | | 1,372 |
6.45% 6/12/17 | | 12,103 | | 13,712 |
Ford Motor Credit Co. LLC 2.5% 1/15/16 | | 16,000 | | 16,005 |
General Electric Capital Corp. 5.625% 9/15/17 | | 15,752 | | 18,615 |
HSBC USA, Inc. 2.375% 2/13/15 | | 8,675 | | 8,889 |
| | 79,403 |
Diversified Financial Services - 0.5% |
Bank of America Corp.: | | | | |
3.875% 3/22/17 | | 7,618 | | 8,027 |
5.65% 5/1/18 | | 1,270 | | 1,419 |
5.7% 1/24/22 | | 12,760 | | 14,439 |
5.75% 12/1/17 | | 11,990 | | 13,408 |
5.875% 2/7/42 | | 5,117 | | 5,815 |
BP Capital Markets PLC: | | | | |
3.625% 5/8/14 | | 4,599 | | 4,828 |
4.5% 10/1/20 | | 961 | | 1,119 |
4.742% 3/11/21 | | 6,000 | | 7,044 |
Nonconvertible Bonds - continued |
| Principal Amount (000s) | | Value (000s) |
FINANCIALS - continued |
Diversified Financial Services - continued |
Capital One Capital V 10.25% 8/15/39 | | $ 4,813 | | $ 4,957 |
Citigroup, Inc.: | | | | |
2.25% 8/7/15 | | 5,000 | | 5,043 |
4.75% 5/19/15 | | 11,282 | | 12,112 |
6.125% 5/15/18 | | 1,701 | | 1,973 |
6.5% 8/19/13 | | 19,655 | | 20,671 |
JPMorgan Chase & Co. 3.15% 7/5/16 | | 10,650 | | 11,276 |
TECO Finance, Inc. 4% 3/15/16 | | 1,828 | | 1,982 |
| | 114,113 |
Insurance - 0.7% |
American International Group, Inc.: | | | | |
2.375% 8/24/15 | | 16,000 | | 16,028 |
4.875% 6/1/22 | | 3,000 | | 3,272 |
Aon Corp.: | | | | |
3.125% 5/27/16 | | 4,391 | | 4,638 |
3.5% 9/30/15 | | 3,180 | | 3,353 |
Axis Capital Holdings Ltd. 5.75% 12/1/14 | | 452 | | 486 |
Great-West Life & Annuity Insurance Co. 7.153% 5/16/46 (g)(m) | | 1,750 | | 1,785 |
Hartford Financial Services Group, Inc.: | | | | |
5.125% 4/15/22 | | 11,774 | | 12,663 |
5.375% 3/15/17 | | 287 | | 314 |
6.625% 4/15/42 | | 9,968 | | 11,222 |
Liberty Mutual Group, Inc.: | | | | |
5% 6/1/21 (g) | | 8,525 | | 8,953 |
6.5% 3/15/35 (g) | | 1,315 | | 1,412 |
Marsh & McLennan Companies, Inc. 4.8% 7/15/21 | | 4,458 | | 5,008 |
Massachusetts Mutual Life Insurance Co. 5.375% 12/1/41 (g) | | 3,576 | | 4,078 |
MetLife, Inc.: | | | | |
5% 6/15/15 | | 941 | | 1,045 |
6.75% 6/1/16 | | 5,158 | | 6,169 |
Metropolitan Life Global Funding I: | | | | |
5.125% 4/10/13 (g) | | 452 | | 464 |
5.125% 6/10/14 (g) | | 4,625 | | 4,972 |
Monumental Global Funding III 5.5% 4/22/13 (g) | | 2,585 | | 2,647 |
Northwestern Mutual Life Insurance Co. 6.063% 3/30/40 (g) | | 4,915 | | 6,329 |
Pacific Life Insurance Co. 9.25% 6/15/39 (g) | | 3,353 | | 4,566 |
Pacific LifeCorp 6% 2/10/20 (g) | | 5,390 | | 6,002 |
Nonconvertible Bonds - continued |
| Principal Amount (000s) | | Value (000s) |
FINANCIALS - continued |
Insurance - continued |
Prudential Financial, Inc.: | | | | |
3.875% 1/14/15 | | $ 5,340 | | $ 5,663 |
5.15% 1/15/13 | | 2,934 | | 2,982 |
6.2% 11/15/40 | | 2,535 | | 2,989 |
7.375% 6/15/19 | | 2,520 | | 3,173 |
Symetra Financial Corp. 6.125% 4/1/16 (g) | | 5,955 | | 6,479 |
Unum Group: | | | | |
5.625% 9/15/20 | | 3,667 | | 4,051 |
5.75% 8/15/42 | | 5,242 | | 5,405 |
7.125% 9/30/16 | | 869 | | 1,012 |
| | 137,160 |
Real Estate Investment Trusts - 0.3% |
Alexandria Real Estate Equities, Inc. 4.6% 4/1/22 | | 1,925 | | 2,029 |
AvalonBay Communities, Inc. 4.95% 3/15/13 | | 296 | | 302 |
Boston Properties, Inc. 3.85% 2/1/23 | | 4,358 | | 4,562 |
BRE Properties, Inc. 5.5% 3/15/17 | | 977 | | 1,109 |
Camden Property Trust: | | | | |
5.375% 12/15/13 | | 3,103 | | 3,257 |
5.875% 11/30/12 | | 542 | | 548 |
DDR Corp. 4.625% 7/15/22 | | 2,262 | | 2,346 |
Developers Diversified Realty Corp.: | | | | |
4.75% 4/15/18 | | 5,964 | | 6,393 |
7.5% 4/1/17 | | 4,622 | | 5,411 |
Duke Realty LP: | | | | |
4.375% 6/15/22 | | 3,546 | | 3,707 |
4.625% 5/15/13 | | 967 | | 987 |
5.4% 8/15/14 | | 771 | | 823 |
5.5% 3/1/16 | | 3,075 | | 3,372 |
6.75% 3/15/20 | | 560 | | 675 |
8.25% 8/15/19 | | 2,489 | | 3,148 |
Equity One, Inc.: | | | | |
5.375% 10/15/15 | | 948 | | 1,023 |
6% 9/15/17 | | 717 | | 798 |
6.25% 12/15/14 | | 1,000 | | 1,084 |
6.25% 1/15/17 | | 399 | | 445 |
Federal Realty Investment Trust: | | | | |
5.4% 12/1/13 | | 355 | | 373 |
5.9% 4/1/20 | | 1,860 | | 2,227 |
6.2% 1/15/17 | | 501 | | 583 |
HCP, Inc. 3.15% 8/1/22 | | 7,000 | | 6,835 |
Nonconvertible Bonds - continued |
| Principal Amount (000s) | | Value (000s) |
FINANCIALS - continued |
Real Estate Investment Trusts - continued |
Health Care REIT, Inc. 4.125% 4/1/19 | | $ 13,700 | | $ 14,415 |
HRPT Properties Trust: | | | | |
5.75% 11/1/15 | | 1,731 | | 1,818 |
6.25% 6/15/17 | | 996 | | 1,093 |
6.65% 1/15/18 | | 676 | | 750 |
Washington (REIT) 5.25% 1/15/14 | | 476 | | 497 |
| | 70,610 |
Real Estate Management & Development - 0.5% |
AMB Property LP 5.9% 8/15/13 | | 2,086 | | 2,160 |
BioMed Realty LP: | | | | |
3.85% 4/15/16 | | 7,000 | | 7,316 |
4.25% 7/15/22 | | 2,970 | | 3,100 |
6.125% 4/15/20 | | 2,467 | | 2,878 |
Brandywine Operating Partnership LP 5.7% 5/1/17 | | 129 | | 141 |
Digital Realty Trust LP: | | | | |
4.5% 7/15/15 | | 3,650 | | 3,866 |
5.25% 3/15/21 | | 4,138 | | 4,570 |
ERP Operating LP: | | | | |
4.625% 12/15/21 | | 12,970 | | 14,876 |
4.75% 7/15/20 | | 5,288 | | 5,990 |
5.5% 10/1/12 | | 382 | | 383 |
5.75% 6/15/17 | | 2,042 | | 2,406 |
Liberty Property LP: | | | | |
4.125% 6/15/22 | | 3,041 | | 3,156 |
4.75% 10/1/20 | | 7,482 | | 8,153 |
5.125% 3/2/15 | | 1,229 | | 1,320 |
5.5% 12/15/16 | | 1,772 | | 1,987 |
Mack-Cali Realty LP: | | | | |
4.5% 4/18/22 | | 1,907 | | 2,021 |
7.75% 8/15/19 | | 1,036 | | 1,273 |
Post Apartment Homes LP 6.3% 6/1/13 | | 3,079 | | 3,167 |
Prime Property Funding, Inc.: | | | | |
5.125% 6/1/15 (g) | | 2,258 | | 2,304 |
5.5% 1/15/14 (g) | | 816 | | 836 |
5.7% 4/15/17 (g) | | 1,991 | | 2,082 |
Regency Centers LP: | | | | |
4.95% 4/15/14 | | 494 | | 518 |
5.25% 8/1/15 | | 1,725 | | 1,878 |
5.875% 6/15/17 | | 877 | | 1,008 |
Nonconvertible Bonds - continued |
| Principal Amount (000s) | | Value (000s) |
FINANCIALS - continued |
Real Estate Management & Development - continued |
Simon Property Group LP: | | | | |
4.2% 2/1/15 | | $ 2,640 | | $ 2,816 |
6.75% 5/15/14 | | 5,698 | | 6,163 |
Tanger Properties LP: | | | | |
6.125% 6/1/20 | | 9,256 | | 10,984 |
6.15% 11/15/15 | | 1,254 | | 1,400 |
| | 98,752 |
TOTAL FINANCIALS | | 671,549 |
HEALTH CARE - 0.3% |
Biotechnology - 0.1% |
Amgen, Inc. 5.15% 11/15/41 | | 17,224 | | 18,836 |
Celgene Corp. 2.45% 10/15/15 | | 907 | | 939 |
| | 19,775 |
Health Care Providers & Services - 0.2% |
Aristotle Holding, Inc.: | | | | |
4.75% 11/15/21 (g) | | 10,952 | | 12,640 |
6.125% 11/15/41 (g) | | 5,466 | | 7,131 |
Coventry Health Care, Inc.: | | | | |
5.95% 3/15/17 | | 1,413 | | 1,652 |
6.3% 8/15/14 | | 2,925 | | 3,170 |
Express Scripts, Inc. 6.25% 6/15/14 | | 1,991 | | 2,175 |
Medco Health Solutions, Inc.: | | | | |
2.75% 9/15/15 | | 1,740 | | 1,820 |
4.125% 9/15/20 | | 5,031 | | 5,468 |
| | 34,056 |
Pharmaceuticals - 0.0% |
Watson Pharmaceuticals, Inc. 5% 8/15/14 | | 1,065 | | 1,133 |
TOTAL HEALTH CARE | | 54,964 |
INDUSTRIALS - 0.3% |
Aerospace & Defense - 0.1% |
BAE Systems Holdings, Inc.: | | | | |
4.95% 6/1/14 (g) | | 846 | | 892 |
6.375% 6/1/19 (g) | | 5,000 | | 5,971 |
| | 6,863 |
Nonconvertible Bonds - continued |
| Principal Amount (000s) | | Value (000s) |
INDUSTRIALS - continued |
Airlines - 0.0% |
Continental Airlines, Inc.: | | | | |
6.648% 3/15/19 | | $ 2,631 | | $ 2,775 |
6.9% 7/2/19 | | 798 | | 863 |
U.S. Airways pass-thru trust certificates: | | | | |
6.85% 1/30/18 | | 1,522 | | 1,591 |
8.36% 1/20/19 | | 1,259 | | 1,366 |
| | 6,595 |
Road & Rail - 0.2% |
Burlington Northern Santa Fe LLC: | | | | |
4.4% 3/15/42 | | 18,995 | | 20,003 |
5.05% 3/1/41 | | 8,624 | | 9,904 |
Norfolk Southern Corp. 3% 4/1/22 | | 13,653 | | 14,156 |
| | 44,063 |
TOTAL INDUSTRIALS | | 57,521 |
INFORMATION TECHNOLOGY - 0.1% |
Electronic Equipment & Components - 0.0% |
Tyco Electronics Group SA: | | | | |
5.95% 1/15/14 | | 3,694 | | 3,940 |
6% 10/1/12 | | 4,552 | | 4,570 |
6.55% 10/1/17 | | 1,119 | | 1,353 |
| | 9,863 |
Office Electronics - 0.1% |
Xerox Corp.: | | | | |
1.8679% 9/13/13 (m) | | 10,110 | | 10,180 |
4.25% 2/15/15 | | 545 | | 580 |
4.5% 5/15/21 | | 2,447 | | 2,572 |
| | 13,332 |
TOTAL INFORMATION TECHNOLOGY | | 23,195 |
MATERIALS - 0.2% |
Chemicals - 0.1% |
Dow Chemical Co. 7.6% 5/15/14 | | 10,939 | | 12,139 |
Construction Materials - 0.0% |
CRH America, Inc. 6% 9/30/16 | | 2,152 | | 2,388 |
Metals & Mining - 0.1% |
Anglo American Capital PLC 9.375% 4/8/14 (g) | | 1,278 | | 1,433 |
Nonconvertible Bonds - continued |
| Principal Amount (000s) | | Value (000s) |
MATERIALS - continued |
Metals & Mining - continued |
Corporacion Nacional del Cobre de Chile (Codelco): | | | | |
3.875% 11/3/21 (g) | | $ 6,889 | | $ 7,434 |
6.375% 11/30/12 (g) | | 1,618 | | 1,637 |
Vale Overseas Ltd.: | | | | |
4.375% 1/11/22 | | 6,000 | | 6,154 |
6.25% 1/23/17 | | 2,726 | | 3,125 |
| | 19,783 |
TOTAL MATERIALS | | 34,310 |
TELECOMMUNICATION SERVICES - 0.3% |
Diversified Telecommunication Services - 0.2% |
AT&T, Inc. 6.8% 5/15/36 | | 9,241 | | 12,642 |
BellSouth Capital Funding Corp. 7.875% 2/15/30 | | 1,158 | | 1,574 |
CenturyLink, Inc.: | | | | |
6.15% 9/15/19 | | 3,372 | | 3,671 |
6.45% 6/15/21 | | 3,263 | | 3,644 |
7.6% 9/15/39 | | 1,011 | | 1,046 |
Embarq Corp. 7.995% 6/1/36 | | 3,741 | | 4,142 |
Telefonica Emisiones SAU 5.462% 2/16/21 | | 4,994 | | 4,594 |
Verizon Communications, Inc.: | | | | |
6.1% 4/15/18 | | 2,674 | | 3,341 |
6.25% 4/1/37 | | 4,611 | | 6,123 |
| | 40,777 |
Wireless Telecommunication Services - 0.1% |
America Movil SAB de CV 3.625% 3/30/15 | | 1,082 | | 1,155 |
DIRECTV Holdings LLC/DIRECTV Financing, Inc.: | | | | |
5.15% 3/15/42 | | 3,616 | | 3,696 |
5.875% 10/1/19 | | 8,810 | | 10,362 |
6.35% 3/15/40 | | 2,500 | | 2,945 |
Vodafone Group PLC 5% 12/16/13 | | 2,696 | | 2,849 |
| | 21,007 |
TOTAL TELECOMMUNICATION SERVICES | | 61,784 |
UTILITIES - 0.7% |
Electric Utilities - 0.4% |
Ameren Illinois Co. 6.125% 11/15/17 | | 333 | | 393 |
AmerenUE 6.4% 6/15/17 | | 3,507 | | 4,209 |
Nonconvertible Bonds - continued |
| Principal Amount (000s) | | Value (000s) |
UTILITIES - continued |
Electric Utilities - continued |
Cleveland Electric Illuminating Co. 5.65% 12/15/13 | | $ 4,829 | | $ 5,092 |
Duke Capital LLC 5.668% 8/15/14 | | 2,413 | | 2,601 |
Duquesne Light Holdings, Inc.: | | | | |
5.9% 12/1/21 (g) | | 5,410 | | 6,106 |
6.4% 9/15/20 (g) | | 10,602 | | 12,253 |
Edison International 3.75% 9/15/17 | | 4,275 | | 4,571 |
Enel Finance International SA 5.7% 1/15/13 (g) | | 305 | | 308 |
FirstEnergy Corp. 7.375% 11/15/31 | | 9,223 | | 12,171 |
FirstEnergy Solutions Corp.: | | | | |
4.8% 2/15/15 | | 1,798 | | 1,920 |
6.05% 8/15/21 | | 6,625 | | 7,372 |
LG&E and KU Energy LLC: | | | | |
2.125% 11/15/15 | | 4,999 | | 5,050 |
3.75% 11/15/20 | | 984 | | 1,019 |
Nevada Power Co.: | | | | |
6.5% 5/15/18 | | 5,290 | | 6,602 |
6.5% 8/1/18 | | 1,844 | | 2,312 |
Pennsylvania Electric Co. 6.05% 9/1/17 | | 618 | | 710 |
Pepco Holdings, Inc. 2.7% 10/1/15 | | 4,728 | | 4,870 |
Sierra Pacific Power Co. 5.45% 9/1/13 | | 1,831 | | 1,909 |
| | 79,468 |
Gas Utilities - 0.0% |
Southern Natural Gas Co. 5.9% 4/1/17 (g) | | 357 | | 420 |
Southern Natural Gas Co. / Southern Natural Issuing Corp. 4.4% 6/15/21 | | 2,360 | | 2,533 |
| | 2,953 |
Independent Power Producers & Energy Traders - 0.0% |
PSEG Power LLC 2.75% 9/15/16 | | 1,703 | | 1,777 |
Multi-Utilities - 0.3% |
Dominion Resources, Inc.: | | | | |
2.7606% 9/30/66 (m) | | 13,426 | | 12,223 |
7.5% 6/30/66 (m) | | 3,828 | | 4,139 |
MidAmerican Energy Holdings, Co.: | | | | |
5.875% 10/1/12 | | 3,227 | | 3,239 |
6.5% 9/15/37 | | 3,287 | | 4,491 |
National Grid PLC 6.3% 8/1/16 | | 407 | | 470 |
NiSource Finance Corp.: | | | | |
4.45% 12/1/21 | | 2,779 | | 3,007 |
5.25% 9/15/17 | | 682 | | 786 |
Nonconvertible Bonds - continued |
| Principal Amount (000s) | | Value (000s) |
UTILITIES - continued |
Multi-Utilities - continued |
NiSource Finance Corp.: - continued | | | | |
5.25% 2/15/43 | | $ 4,557 | | $ 5,046 |
5.4% 7/15/14 | | 6,582 | | 7,075 |
5.45% 9/15/20 | | 980 | | 1,120 |
5.8% 2/1/42 | | 3,785 | | 4,503 |
6.4% 3/15/18 | | 1,557 | | 1,864 |
6.8% 1/15/19 | | 4,065 | | 4,874 |
Sempra Energy 2.3% 4/1/17 | | 7,119 | | 7,446 |
Wisconsin Energy Corp. 6.25% 5/15/67 (m) | | 3,554 | | 3,763 |
| | 64,046 |
TOTAL UTILITIES | | 148,244 |
TOTAL NONCONVERTIBLE BONDS (Cost $1,363,957) |
1,517,523
|
U.S. Government and Government Agency Obligations - 4.9% |
|
U.S. Treasury Inflation Protected Obligations - 1.0% |
U.S. Treasury Inflation-Indexed Bonds: | | | | |
0.75% 2/15/42 | | 129,548 | | 142,315 |
2.125% 2/15/41 | | 44,924 | | 66,568 |
TOTAL U.S. TREASURY INFLATION PROTECTED OBLIGATIONS | | 208,883 |
U.S. Treasury Obligations - 3.9% |
U.S. Treasury Bills, yield at date of purchase 0.1% 11/23/12 (i) | | 6,110 | | 6,109 |
U.S. Treasury Bonds 3% 5/15/42 | | 83,902 | | 89,801 |
U.S. Treasury Notes: | | | | |
0.5% 7/31/17 | | 151,500 | | 150,896 |
0.75% 6/30/17 (j) | | 40,000 | | 40,338 |
0.875% 7/31/19 | | 175,011 | | 173,712 |
U.S. Government and Government Agency Obligations - continued |
| Principal Amount (000s) | | Value (000s) |
U.S. Treasury Obligations - continued |
U.S. Treasury Notes: - continued | | | | |
1% 8/31/19 | | $ 195,000 | | $ 194,985 |
1.625% 8/15/22 | | 155,000 | | 156,017 |
TOTAL U.S. TREASURY OBLIGATIONS | | 811,858 |
TOTAL U.S. GOVERNMENT AND GOVERNMENT AGENCY OBLIGATIONS (Cost $990,501) |
1,020,741
|
U.S. Government Agency - Mortgage Securities - 8.8% |
|
Fannie Mae - 7.2% |
2.558% 6/1/36 (m) | | 181 | | 194 |
2.777% 7/1/37 (m) | | 544 | | 585 |
3% 4/1/27 to 8/1/42 | | 30,176 | | 31,504 |
3% 9/1/27 (h) | | 9,100 | | 9,603 |
3% 9/1/27 (h) | | 9,300 | | 9,814 |
3% 9/1/27 (h) | | 8,000 | | 8,442 |
3% 9/1/42 (h) | | 700 | | 726 |
3% 9/1/42 (h) | | 195,900 | | 203,280 |
3% 9/1/42 (h) | | 11,300 | | 11,726 |
3% 9/1/42 (h) | | 184,600 | | 191,554 |
3% 10/1/42 (h) | | 135,900 | | 140,487 |
3.5% 1/1/21 to 8/1/42 | | 25,483 | | 27,231 |
3.5% 9/1/27 (h) | | 4,000 | | 4,253 |
3.5% 7/1/42 | | 84 | | 90 |
3.5% 7/1/42 | | 122 | | 130 |
3.5% 8/1/42 | | 156 | | 167 |
3.5% 8/1/42 | | 144 | | 154 |
3.5% 9/1/42 (h) | | 268,800 | | 285,012 |
3.5% 9/1/42 (h) | | 3,700 | | 3,923 |
3.5% 9/1/42 (h) | | 7,300 | | 7,740 |
4% 9/1/26 to 4/1/42 | | 43,345 | | 46,757 |
4% 9/1/41 | | 132 | | 142 |
4% 9/1/42 (h) | | 77,000 | | 82,570 |
4.5% 6/1/18 to 7/1/41 | | 31,845 | | 34,882 |
4.5% 9/1/42 (h) | | 69,000 | | 74,682 |
4.5% 9/1/42 (h) | | 5,600 | | 6,061 |
5% 12/1/25 to 5/1/40 | | 35,141 | | 38,607 |
5% 9/1/42 (h) | | 1,300 | | 1,420 |
U.S. Government Agency - Mortgage Securities - continued |
| Principal Amount (000s) | | Value (000s) |
Fannie Mae - continued |
5% 9/1/42 (h) | | $ 500 | | $ 546 |
5% 9/1/42 (h) | | 52,000 | | 56,794 |
5.5% 9/1/24 to 3/1/40 | | 40,142 | | 44,126 |
5.5% 9/1/42 (h) | | 60,000 | | 65,845 |
6% 6/1/35 to 4/1/40 | | 52,455 | | 57,935 |
6% 9/1/42 (h) | | 40,000 | | 44,078 |
TOTAL FANNIE MAE | | 1,491,060 |
Freddie Mac - 0.8% |
3.454% 10/1/35 (m) | | 259 | | 278 |
3.5% 4/1/32 to 4/1/42 | | 9,965 | | 10,669 |
4% 6/1/24 to 11/1/41 | | 16,220 | | 17,650 |
4% 9/1/41 | | 870 | | 946 |
4% 9/1/42 (h) | | 23,000 | | 24,606 |
4.5% 7/1/25 to 10/1/41 | | 45,001 | | 48,942 |
5% 3/1/19 to 9/1/40 | | 29,059 | | 31,672 |
5.5% 1/1/28 to 3/1/40 | | 20,160 | | 21,973 |
6% 7/1/37 to 8/1/37 | | 1,077 | | 1,185 |
6.5% 3/1/36 | | 1,330 | | 1,504 |
TOTAL FREDDIE MAC | | 159,425 |
Ginnie Mae - 0.8% |
3% 10/1/42 (h) | | 11,300 | | 11,837 |
3.5% 11/15/41 to 3/15/42 | | 10,016 | | 10,859 |
3.5% 9/1/42 (h) | | 1,200 | | 1,299 |
4% 1/15/25 to 11/15/41 | | 28,145 | | 30,737 |
4.5% 5/15/39 to 4/15/41 | | 53,616 | | 59,455 |
5% 3/15/39 to 9/15/41 | | 24,680 | | 27,630 |
5.5% 12/15/31 to 1/15/39 | | 1,304 | | 1,460 |
6% 2/15/34 to 9/20/38 | | 13,321 | | 15,050 |
TOTAL GINNIE MAE | | 158,327 |
TOTAL U.S. GOVERNMENT AGENCY - MORTGAGE SECURITIES (Cost $1,790,231) |
1,808,812
|
Asset-Backed Securities - 0.3% |
| Principal Amount (000s) | | Value (000s) |
Accredited Mortgage Loan Trust Series 2005-1 Class M1, 0.7055% 4/25/35 (m) | | $ 1,086 | | $ 836 |
ACE Securities Corp. Home Equity Loan Trust: | | | | |
Series 2004-HE1 Class M2, 1.8855% 3/25/34 (m) | | 424 | | 346 |
Series 2005-HE2 Class M2, 0.6855% 4/25/35 (m) | | 89 | | 85 |
Advanta Business Card Master Trust Series 2006-C1 Class C1, 0.6758% 10/20/14 (m) | | 688 | | 7 |
Ally Master Owner Trust Series 2012-3 Class A2, 1.21% 6/15/17 | | 32,660 | | 32,719 |
Ameriquest Mortgage Securities, Inc. pass-thru certificates: | | | | |
Series 2003-10 Class M1, 0.9355% 12/25/33 (m) | | 85 | | 64 |
Series 2004-R2 Class M3, 0.7855% 4/25/34 (m) | | 120 | | 47 |
Series 2005-R2 Class M1, 0.6855% 4/25/35 (m) | | 2,266 | | 2,030 |
Argent Securities, Inc. pass-thru certificates: | | | | |
Series 2003-W7 Class A2, 1.0262% 3/25/34 (m) | | 53 | | 42 |
Series 2004-W11 Class M2, 0.9355% 11/25/34 (m) | | 616 | | 433 |
Series 2004-W7 Class M1, 0.7855% 5/25/34 (m) | | 1,600 | | 1,136 |
Series 2006-W4 Class A2C, 0.3955% 5/25/36 (m) | | 1,429 | | 432 |
Asset Backed Securities Corp. Home Equity Loan Trust: | | | | |
Series 2004-HE2 Class M1, 1.0605% 4/25/34 (m) | | 2,575 | | 2,120 |
Series 2006-HE2 Class M1, 0.6055% 3/25/36 (m) | | 64 | | 0* |
Axon Financial Funding Ltd. Series 2007-1 Class A1, 0.9743% 4/4/17 (d)(g)(m) | | 6,960 | | 0 |
Capital Trust Ltd. Series 2004-1: | | | | |
Class A2, 0.687% 7/20/39 (g)(m) | | 138 | | 125 |
Class B, 0.987% 7/20/39 (g)(m) | | 290 | | 130 |
Class C, 1.337% 7/20/39 (g)(m) | | 372 | | 6 |
Carrington Mortgage Loan Trust Series 2007-RFC1 Class A3, 0.3755% 12/25/36 (m) | | 1,978 | | 788 |
Citigroup Mortgage Loan Trust Series 2005-HE4 Class A2C, 0.5055% 10/25/35 (m) | | 447 | | 445 |
Countrywide Asset-Backed Certificates Trust Series 2007-4 Class A1A, 0.3662% 9/25/37 (m) | | 129 | | 128 |
Countrywide Home Loan Trust Series 2006-13 Class N, 7% 8/25/37 (g) | | 363 | | 0 |
Countrywide Home Loans, Inc.: | | | | |
Series 2004-3 Class M4, 1.2055% 4/25/34 (m) | | 175 | | 80 |
Series 2004-4 Class M2, 1.0305% 6/25/34 (m) | | 645 | | 371 |
Fannie Mae Series 2004-T5 Class AB3, 1.1466% 5/28/35 (m) | | 43 | | 27 |
Fieldstone Mortgage Investment Corp. Series 2004-3 Class M5, 2.4105% 8/25/34 (m) | | 319 | | 197 |
Asset-Backed Securities - continued |
| Principal Amount (000s) | | Value (000s) |
First Franklin Mortgage Loan Trust: | | | | |
Series 2004-FF2 Class M3, 1.0605% 3/25/34 (m) | | $ 25 | | $ 10 |
Series 2006-FF14 Class A2, 0.2955% 10/25/36 (m) | | 462 | | 457 |
Fremont Home Loan Trust Series 2005-A: | | | | |
Class M3, 0.9705% 1/25/35 (m) | | 1,041 | | 325 |
Class M4, 1.2555% 1/25/35 (m) | | 399 | | 53 |
GCO Education Loan Funding Master Trust II Series 2007-1A Class C1L, 0.8069% 2/25/47 (g)(m) | | 3,122 | | 1,284 |
GCO Slims Trust Series 2006-1A, 5.72% 3/1/22 (g) | | 624 | | 602 |
GE Business Loan Trust: | | | | |
Series 2003-1 Class A, 0.6695% 4/15/31 (g)(m) | | 216 | | 203 |
Series 2006-2A: | | | | |
Class A, 0.4195% 11/15/34 (g)(m) | | 1,457 | | 1,254 |
Class B, 0.5195% 11/15/34 (g)(m) | | 526 | | 364 |
Class C, 0.6195% 11/15/34 (g)(m) | | 874 | | 498 |
Class D, 0.9895% 11/15/34 (g)(m) | | 332 | | 103 |
Guggenheim Structured Real Estate Funding Ltd. Series 2006-3 Class C, 0.7855% 9/25/46 (g)(m) | | 1,540 | | 1,481 |
Home Equity Asset Trust: | | | | |
Series 2003-2 Class M1, 1.5555% 8/25/33 (m) | | 376 | | 293 |
Series 2003-3 Class M1, 1.5255% 8/25/33 (m) | | 745 | | 623 |
Series 2003-5 Class A2, 0.9355% 12/25/33 (m) | | 36 | | 30 |
HSI Asset Securitization Corp. Trust Series 2007-HE1 Class 2A3, 0.4255% 1/25/37 (m) | | 1,642 | | 549 |
JPMorgan Mortgage Acquisition Trust: | | | | |
Series 2006-NC2 Class M2, 0.5355% 7/25/36 (m) | | 3,185 | | 44 |
Series 2007-CH1 Class AV4, 0.3655% 11/25/36 (m) | | 1,641 | | 1,507 |
Keycorp Student Loan Trust: | | | | |
Series 1999-A Class A2, 0.7906% 12/27/29 (m) | | 570 | | 512 |
Series 2006-A Class 2C, 1.6106% 3/27/42 (m) | | 2,909 | | 138 |
Marriott Vacation Club Owner Trust Series 2006-2A: | | | | |
Class B, 5.442% 10/20/28 (g) | | 9 | | 9 |
Class C, 5.691% 10/20/28 (g) | | 4 | | 4 |
Class D, 6.01% 10/20/28 (g) | | 48 | | 49 |
MASTR Asset Backed Securities Trust Series 2007-HE1 Class M1, 0.5355% 5/25/37 (m) | | 861 | | 7 |
Meritage Mortgage Loan Trust Series 2004-1 Class M1, 0.9855% 7/25/34 (m) | | 163 | | 104 |
Merrill Lynch Mortgage Investors Trust: | | | | |
Series 2003-OPT1 Class M1, 1.2105% 7/25/34 (m) | | 506 | | 336 |
Series 2006-FM1 Class A2B, 0.3455% 4/25/37 (m) | | 1,582 | | 1,428 |
Series 2006-OPT1 Class A1A, 0.4955% 6/25/35 (m) | | 2,995 | | 2,411 |
Asset-Backed Securities - continued |
| Principal Amount (000s) | | Value (000s) |
Morgan Stanley ABS Capital I Trust: | | | | |
Series 2004-HE6 Class A2, 0.5755% 8/25/34 (m) | | $ 63 | | $ 50 |
Series 2005-NC1 Class M1, 0.6755% 1/25/35 (m) | | 439 | | 264 |
Series 2005-NC2 Class B1, 1.4055% 3/25/35 (m) | | 457 | | 54 |
National Collegiate Student Loan Trust: | | | | |
Series 2004-2 Class AIO, 9.75% 10/27/14 (o) | | 1,638 | | 21 |
Series 2006-4 Class D, 1.3355% 5/25/32 (m) | | 2,225 | | 0* |
New Century Home Equity Loan Trust Series 2005-4 Class M2, 0.7455% 9/25/35 (m) | | 1,566 | | 1,012 |
Ocala Funding LLC: | | | | |
Series 2005-1A Class A, 1.737% 3/20/10 (d)(g)(m) | | 621 | | 0 |
Series 2006-1A Class A, 1.637% 3/20/11 (d)(g)(m) | | 1,290 | | 0 |
Park Place Securities, Inc.: | | | | |
Series 2004-WCW1: | | | | |
Class M3, 1.4855% 9/25/34 (m) | | 585 | | 255 |
Class M4, 1.6855% 9/25/34 (m) | | 750 | | 170 |
Series 2005-WCH1 Class M4, 1.0655% 1/25/36 (m) | | 1,620 | | 926 |
Salomon Brothers Mortgage Securities VII, Inc. Series 2003-HE1 Class A, 1.0355% 4/25/33 (m) | | 6 | | 5 |
Saxon Asset Securities Trust Series 2004-1 Class M1, 1.0305% 3/25/35 (m) | | 1,392 | | 1,009 |
Sierra Receivables Funding Co. Series 2007-1A Class A2, 0.3968% 3/20/19 (FGIC Insured) (g)(m) | | 444 | | 434 |
SLM Private Credit Student Loan Trust Series 2004-A Class C, 1.4179% 6/15/33 (m) | | 1,396 | | 845 |
Specialty Underwriting & Residential Finance Trust Series 2006-AB2 Class N1, 5.75% 6/25/37 (g) | | 655 | | 0 |
Structured Asset Investment Loan Trust Series 2004-8 Class M5, 1.9605% 9/25/34 (m) | | 70 | | 24 |
SVO VOI Mortgage Corp. Series 2006-AA Class A, 5.28% 2/20/24 (g) | | 475 | | 487 |
Terwin Mortgage Trust Series 2003-4HE Class A1, 1.0955% 9/25/34 (m) | | 32 | | 29 |
Trapeza CDO XII Ltd./Trapeza CDO XII, Inc. Series 2007-12A Class B, 1.0196% 4/6/42 (g)(m) | | 2,177 | | 27 |
WaMu Asset Holdings Corp. Series 2006-8 Class N1, 6.048% 10/25/46 (g) | | 974 | | 0 |
Asset-Backed Securities - continued |
| Principal Amount (000s) | | Value (000s) |
Wells Fargo Home Equity Trust Series 2004-3 Class A, 4.5% 11/27/34 (g) | | $ 8 | | $ 0 |
Whinstone Capital Management Ltd. Series 1A Class B3, 2.2511% 10/25/44 (g)(m) | | 1,964 | | 1,296 |
TOTAL ASSET-BACKED SECURITIES (Cost $60,917) |
64,180
|
Collateralized Mortgage Obligations - 0.2% |
|
Private Sponsor - 0.2% |
Bayview Commercial Asset Trust Series 2006-3A, Class IO, 3.9199% 10/25/36 (g)(m)(o) | | 27,699 | | 979 |
Bear Stearns ALT-A Trust floater Series 2005-1 Class A1, 0.7955% 1/25/35 (m) | | 1,962 | | 1,689 |
Cobalt CMBS Commercial Mortgage Trust Series 2007-C2 Class B, 5.617% 4/15/47 (m) | | 1,468 | | 616 |
COMM pass-thru certificates floater Series 2001-J2A Class A2F, 0.7385% 7/16/34 (g)(m) | | 8 | | 8 |
First Horizon Mortgage pass-thru Trust Series 2004-AR5 Class 2A1, 2.623% 10/25/34 (m) | | 1,183 | | 1,139 |
Granite Master Issuer PLC: | | | | |
floater: | | | | |
Series 2006-1A Class A5, 0.377% 12/20/54 (g)(m) | | 6,713 | | 6,545 |
Series 2006-3 Class M2, 0.517% 12/20/54 (m) | | 5,460 | | 4,750 |
Series 2006-4: | | | | |
Class B1, 0.417% 12/20/54 (m) | | 4,556 | | 4,157 |
Class M1, 0.577% 12/20/54 (m) | | 1,198 | | 1,042 |
Series 2007-1: | | | | |
Class 1B1, 0.377% 12/20/54 (m) | | 4,650 | | 4,243 |
Class 1M1, 0.537% 12/20/54 (m) | | 1,611 | | 1,402 |
Class 2M1, 0.737% 12/20/54 (m) | | 2,067 | | 1,798 |
Series 2007-2 Class 2C1, 1.098% 12/17/54 (m) | | 2,864 | | 2,162 |
sequential payer Series 2006-3 Class B2, 0.407% 12/20/54 (m) | | 5,461 | | 4,983 |
Granite Mortgages PLC floater Series 2003-3 Class 1C, 2.9051% 1/20/44 (m) | | 472 | | 374 |
JPMorgan Chase Commercial Mortgage Securities Trust Series 2007-CB18 Class A3, 5.447% 6/12/47 (m) | | 1,532 | | 1,620 |
JPMorgan Mortgage Trust sequential payer Series 2006-A5 Class 3A5, 5.6881% 8/25/36 (m) | | 1,956 | | 1,506 |
LB-UBS Commercial Mortgage Trust sequential payer Series 2006-C6 Class A4, 5.372% 9/15/39 | | 591 | | 682 |
Collateralized Mortgage Obligations - continued |
| Principal Amount (000s) | | Value (000s) |
Private Sponsor - continued |
MASTR Adjustable Rate Mortgages Trust Series 2007-3 Class 22A2, 0.4455% 5/25/47 (m) | | $ 848 | | $ 543 |
Merrill Lynch Alternative Note Asset Trust floater Series 2007-OAR1 Class A1, 0.4055% 2/25/37 (m) | | 1,476 | | 1,158 |
Opteum Mortgage Acceptance Corp. floater Series 2005-3 Class APT, 0.5255% 7/25/35 (m) | | 2,048 | | 1,665 |
RESI Finance LP/RESI Finance DE Corp. floater Series 2003-B: | | | | |
Class B5, 2.5903% 7/10/35 (g)(m) | | 1,153 | | 919 |
Class B6, 3.0903% 7/10/35 (g)(m) | | 245 | | 194 |
Residential Funding Securities Corp. floater Series 2003-RP2 Class A1, 0.6855% 6/25/33 (g)(m) | | 221 | | 212 |
Salomon Brothers Mortgage Securities VII, Inc. Series 2006-C2 Class H, 6.308% 7/18/33 (g) | | 185 | | 62 |
Sequoia Mortgage Trust floater Series 2004-6 Class A3B, 1.6169% 7/20/34 (m) | | 38 | | 33 |
Structured Asset Securities Corp. Series 2003-15A Class 4A, 5.3743% 4/25/33 (m) | | 333 | | 311 |
TBW Mortgage-Backed pass-thru certificates floater Series 2006-4 Class A3, 0.4355% 9/25/36 (m) | | 3,513 | | 3,021 |
TOTAL COLLATERALIZED MORTGAGE OBLIGATIONS (Cost $35,173) |
47,813
|
Commercial Mortgage Securities - 1.9% |
|
Asset Securitization Corp. Series 1997-D5: | | | | |
Class A6, 7.1354% 2/14/43 (m) | | 153 | | 154 |
Class PS1, 1.2297% 2/14/43 (m)(o) | | 747 | | 22 |
Banc of America Commercial Mortgage Trust: | | | | |
sequential payer: | | | | |
Series 2006-2 Class AAB, 5.7087% 5/10/45 (m) | | 1,083 | | 1,146 |
Series 2006-5: | | | | |
Class A2, 5.317% 9/10/47 | | 3,817 | | 3,838 |
Class A3, 5.39% 9/10/47 | | 1,832 | | 1,944 |
Series 2006-6 Class A3, 5.369% 10/10/45 | | 2,628 | | 2,872 |
Series 2007-4 Class A3, 5.7921% 2/10/51 (m) | | 1,291 | | 1,342 |
Series 2006-6 Class E, 5.619% 10/10/45 (g) | | 759 | | 76 |
Series 2007-3: | | | | |
Class A3, 5.6612% 6/10/49 (m) | | 2,194 | | 2,237 |
Class A4, 5.6612% 6/10/49 (m) | | 2,739 | | 3,133 |
Commercial Mortgage Securities - continued |
| Principal Amount (000s) | | Value (000s) |
Banc of America Commercial Mortgage, Inc.: | | | | |
sequential payer: | | | | |
Series 2001-1 Class A4, 5.451% 1/15/49 | | $ 2,878 | | $ 3,297 |
Series 2004-2 Class A4, 4.153% 11/10/38 | | 1,406 | | 1,445 |
Series 2005-1 Class A3, 4.877% 11/10/42 | | 469 | | 469 |
Series 2001-3 Class H, 6.562% 4/11/37 (g) | | 735 | | 735 |
Series 2005-3 Class A3B, 5.09% 7/10/43 (m) | | 4,082 | | 4,299 |
Banc of America Large Loan, Inc. floater: | | | | |
Series 2005-MIB1: | | | | |
Class C, 0.5495% 3/15/22 (g)(m) | | 564 | | 558 |
Class D, 0.5995% 3/15/22 (g)(m) | | 572 | | 564 |
Class E, 0.6395% 3/15/22 (g)(m) | | 472 | | 463 |
Class F, 0.7095% 3/15/22 (g)(m) | | 676 | | 656 |
Class G, 0.7695% 3/15/22 (g)(m) | | 438 | | 416 |
Series 2006-BIX1: | | | | |
Class D, 0.4495% 10/15/19 (g)(m) | | 115 | | 111 |
Class E, 0.4795% 10/15/19 (g)(m) | | 956 | | 903 |
Class F, 0.5495% 10/15/19 (g)(m) | | 2,868 | | 2,696 |
Class G, 0.5695% 10/15/19 (g)(m) | | 1,350 | | 1,255 |
Bayview Commercial Asset Trust: | | | | |
floater: | | | | |
Series 2003-2 Class M1, 1.0855% 12/25/33 (g)(m) | | 65 | | 47 |
Series 2004-1: | | | | |
Class A, 0.5955% 4/25/34 (g)(m) | | 1,120 | | 988 |
Class B, 2.1355% 4/25/34 (g)(m) | | 125 | | 73 |
Class M1, 0.7955% 4/25/34 (g)(m) | | 101 | | 72 |
Class M2, 1.4355% 4/25/34 (g)(m) | | 93 | | 65 |
Series 2005-2A: | | | | |
Class A1, 0.5455% 8/25/35 (g)(m) | | 1,525 | | 1,100 |
Class M1, 0.6655% 8/25/35 (g)(m) | | 83 | | 49 |
Class M2, 0.7155% 8/25/35 (g)(m) | | 137 | | 74 |
Class M3, 0.7355% 8/25/35 (g)(m) | | 76 | | 37 |
Series 2005-3A: | | | | |
Class A2, 0.6355% 11/25/35 (g)(m) | | 536 | | 421 |
Class M1, 0.6755% 11/25/35 (g)(m) | | 70 | | 40 |
Class M2, 0.7255% 11/25/35 (g)(m) | | 89 | | 48 |
Class M3, 0.7455% 11/25/35 (g)(m) | | 80 | | 41 |
Class M4, 0.8355% 11/25/35 (g)(m) | | 100 | | 47 |
Series 2005-4A: | | | | |
Class A2, 0.6255% 1/25/36 (g)(m) | | 1,392 | | 986 |
Class B1, 1.6355% 1/25/36 (g)(m) | | 120 | | 18 |
Class M1, 0.6855% 1/25/36 (g)(m) | | 449 | | 277 |
Commercial Mortgage Securities - continued |
| Principal Amount (000s) | | Value (000s) |
Bayview Commercial Asset Trust: - continued | | | | |
floater: | | | | |
Series 2005-4A: | | | | |
Class M2, 0.7055% 1/25/36 (g)(m) | | $ 135 | | $ 78 |
Class M3, 0.7355% 1/25/36 (g)(m) | | 197 | | 105 |
Class M4, 0.8455% 1/25/36 (g)(m) | | 109 | | 53 |
Class M5, 0.8855% 1/25/36 (g)(m) | | 109 | | 36 |
Class M6, 0.9355% 1/25/36 (g)(m) | | 116 | | 31 |
Series 2006-1: | | | | |
Class A2, 0.5955% 4/25/36 (g)(m) | | 215 | | 159 |
Class M1, 0.6155% 4/25/36 (g)(m) | | 77 | | 46 |
Class M2, 0.6355% 4/25/36 (g)(m) | | 81 | | 45 |
Class M3, 0.6555% 4/25/36 (g)(m) | | 70 | | 36 |
Class M4, 0.7555% 4/25/36 (g)(m) | | 40 | | 18 |
Class M5, 0.7955% 4/25/36 (g)(m) | | 39 | | 14 |
Class M6, 0.8755% 4/25/36 (g)(m) | | 77 | | 26 |
Series 2006-2A: | | | | |
Class A1, 0.4655% 7/25/36 (g)(m) | | 3,201 | | 2,257 |
Class A2, 0.5155% 7/25/36 (g)(m) | | 190 | | 135 |
Class B1, 1.1055% 7/25/36 (g)(m) | | 71 | | 10 |
Class B3, 2.9355% 7/25/36 (g)(m) | | 67 | | 2 |
Class M1, 0.5455% 7/25/36 (g)(m) | | 200 | | 65 |
Class M2, 0.5655% 7/25/36 (g)(m) | | 141 | | 42 |
Class M3, 0.5855% 7/25/36 (g)(m) | | 117 | | 26 |
Class M4, 0.6555% 7/25/36 (g)(m) | | 79 | | 17 |
Class M5, 0.7055% 7/25/36 (g)(m) | | 97 | | 19 |
Class M6, 0.7755% 7/25/36 (g)(m) | | 145 | | 23 |
Series 2006-3A: | | | | |
Class B1, 1.0355% 10/25/36 (g)(m) | | 4 | | 0* |
Class M4, 0.6655% 10/25/36 (g)(m) | | 157 | | 24 |
Class M5, 0.7155% 10/25/36 (g)(m) | | 188 | | 12 |
Class M6, 0.7955% 10/25/36 (g)(m) | | 369 | | 9 |
Series 2006-4A: | | | | |
Class A1, 0.4655% 12/25/36 (g)(m) | | 809 | | 549 |
Class A2, 0.5055% 12/25/36 (g)(m) | | 3,952 | | 1,841 |
Class B1, 0.9355% 12/25/36 (g)(m) | | 78 | | 2 |
Class M1, 0.5255% 12/25/36 (g)(m) | | 263 | | 54 |
Class M2, 0.5455% 12/25/36 (g)(m) | | 175 | | 27 |
Class M3, 0.5755% 12/25/36 (g)(m) | | 176 | | 24 |
Class M4, 0.6355% 12/25/36 (g)(m) | | 213 | | 24 |
Class M5, 0.6755% 12/25/36 (g)(m) | | 195 | | 16 |
Class M6, 0.7555% 12/25/36 (g)(m) | | 175 | | 10 |
Series 2007-1 Class A2, 0.5055% 3/25/37 (g)(m) | | 810 | | 436 |
Commercial Mortgage Securities - continued |
| Principal Amount (000s) | | Value (000s) |
Bayview Commercial Asset Trust: - continued | | | | |
floater: | | | | |
Series 2007-2A: | | | | |
Class A1, 0.5055% 7/25/37 (g)(m) | | $ 771 | | $ 434 |
Class A2, 0.5555% 7/25/37 (g)(m) | | 723 | | 240 |
Class B1, 1.8355% 7/25/37 (g)(m) | | 105 | | 1 |
Class M1, 0.6055% 7/25/37 (g)(m) | | 253 | | 66 |
Class M2, 0.6455% 7/25/37 (g)(m) | | 139 | | 17 |
Class M3, 0.7255% 7/25/37 (g)(m) | | 140 | | 14 |
Class M4, 0.8855% 7/25/37 (g)(m) | | 278 | | 22 |
Class M5, 0.9855% 7/25/37 (g)(m) | | 245 | | 17 |
Class M6, 1.2355% 7/25/37 (g)(m) | | 311 | | 16 |
Series 2007-3: | | | | |
Class A2, 0.5255% 7/25/37 (g)(m) | | 827 | | 420 |
Class B1, 1.1855% 7/25/37 (g)(m) | | 184 | | 12 |
Class B2, 1.8355% 7/25/37 (g)(m) | | 433 | | 24 |
Class M1, 0.5455% 7/25/37 (g)(m) | | 165 | | 38 |
Class M2, 0.5755% 7/25/37 (g)(m) | | 176 | | 31 |
Class M3, 0.6055% 7/25/37 (g)(m) | | 276 | | 38 |
Class M4, 0.7355% 7/25/37 (g)(m) | | 434 | | 51 |
Class M5, 0.8355% 7/25/37 (g)(m) | | 227 | | 23 |
Class M6, 1.0355% 7/25/37 (g)(m) | | 173 | | 15 |
Series 2007-4A: | | | | |
Class M1, 1.1855% 9/25/37 (g)(m) | | 293 | | 18 |
Class M2, 1.2855% 9/25/37 (g)(m) | | 293 | | 15 |
Class M4, 1.8355% 9/25/37 (g)(m) | | 742 | | 30 |
Class M5, 1.9855% 9/25/37 (g)(m) | | 742 | | 23 |
Class M6, 2.1855% 9/25/37 (g)(m) | | 486 | | 12 |
Series 2004-1, Class IO, 1.25% 4/25/34 (g)(o) | | 2,255 | | 91 |
Series 2007-5A, Class IO, 4.1484% 10/25/37 (g)(m)(o) | | 5,767 | | 499 |
Bear Stearns Commercial Mortgage Securities Trust: | | | | |
floater: | | | | |
Series 2006-BBA7: | | | | |
Class H, 0.8895% 3/15/19 (g)(m) | | 439 | | 424 |
Class J, 1.0895% 3/15/19 (g)(m) | | 447 | | 409 |
Series 2007-BBA8: | | | | |
Class D, 0.4895% 3/15/22 (g)(m) | | 653 | | 590 |
Class E, 0.5395% 3/15/22 (g)(m) | | 3,391 | | 2,994 |
Class F, 0.5895% 3/15/22 (g)(m) | | 2,081 | | 1,795 |
Class G, 0.6395% 3/15/22 (g)(m) | | 534 | | 450 |
Class H, 0.7895% 3/15/22 (g)(m) | | 653 | | 537 |
Class J, 0.9395% 3/15/22 (g)(m) | | 653 | | 521 |
Commercial Mortgage Securities - continued |
| Principal Amount (000s) | | Value (000s) |
Bear Stearns Commercial Mortgage Securities Trust: - continued | | | | |
sequential payer: | | | | |
Series 2004-PWR3 Class A3, 4.487% 2/11/41 | | $ 301 | | $ 303 |
Series 2007-PW15 Class AAB, 5.315% 2/11/44 | | 3,274 | | 3,413 |
Series 2007-PW16: | | | | |
Class A4, 5.7154% 6/11/40 (m) | | 769 | | 901 |
Class AAB, 5.7154% 6/11/40 (m) | | 6,095 | | 6,557 |
Series 2007-PW18: | | | | |
Class A2, 5.613% 6/11/50 | | 280 | | 286 |
Class A4, 5.7% 6/11/50 | | 5,820 | | 6,827 |
Series 2006-PW13 Class A3, 5.518% 9/11/41 | | 4,638 | | 4,849 |
Series 2006-PW14 Class X2, 0.6677% 12/11/38 (g)(m)(o) | | 13,836 | | 113 |
Series 2006-T22 Class A4, 5.5391% 4/12/38 (m) | | 164 | | 188 |
Series 2006-T24 Class X2, 0.4455% 10/12/41 (g)(m)(o) | | 3,433 | | 16 |
Series 2007-PW18 Class X2, 0.3156% 6/11/50 (g)(m)(o) | | 92,485 | | 864 |
Series 2007-T28 Class X2, 0.1576% 9/11/42 (g)(m)(o) | | 49,759 | | 265 |
C-BASS Trust floater Series 2006-SC1 Class A, 0.5055% 5/25/36 (g)(m) | | 772 | | 668 |
CDC Commercial Mortgage Trust Series 2002-FX1: | | | | |
Class G, 6.625% 5/15/35 (g) | | 1,544 | | 1,592 |
Class XCL, 1.331% 5/15/35 (g)(m)(o) | | 5,266 | | 103 |
Citigroup Commercial Mortgage Trust: | | | | |
floater Series 2006-FL2: | | | | |
Class G, 0.5693% 8/15/21 (g)(m) | | 127 | | 126 |
Class H, 0.6093% 8/15/21 (g)(m) | | 468 | | 447 |
Series 2007-C6: | | | | |
Class A2, 5.7002% 12/10/49 (m) | | 1,062 | | 1,062 |
Class A4, 5.7002% 12/10/49 (m) | | 4,371 | | 5,103 |
Series 2008-C7 Class A2B, 6.0731% 12/10/49 (m) | | 839 | | 860 |
Citigroup/Deutsche Bank Commercial Mortgage Trust: | | | | |
sequential payer Series 2007-CD4 Class A4, 5.322% 12/11/49 | | 16,063 | | 18,109 |
Series 2007-CD4 Class A3, 5.293% 12/11/49 | | 1,279 | | 1,352 |
Cobalt CMBS Commercial Mortgage Trust: | | | | |
sequential payer Series 2007-C3 Class A3, 5.8108% 5/15/46 (m) | | 1,314 | | 1,412 |
Series 2006-C1 Class B, 5.359% 8/15/48 | | 3,942 | | 572 |
Commercial Mortgage Securities - continued |
| Principal Amount (000s) | | Value (000s) |
COMM pass-thru certificates: | | | | |
floater: | | | | |
Series 2005-F10A Class J, 1.0895% 4/15/17 (g)(m) | | $ 138 | | $ 126 |
Series 2005-FL11: | | | | |
Class C, 0.5395% 11/15/17 (g)(m) | | 807 | | 766 |
Class D, 0.5795% 11/15/17 (g)(m) | | 42 | | 39 |
Class E, 0.6295% 11/15/17 (g)(m) | | 149 | | 137 |
Class F, 0.6895% 11/15/17 (g)(m) | | 164 | | 149 |
Class G, 0.7395% 11/15/17 (g)(m) | | 114 | | 101 |
Series 2006-CN2A: | | | | |
Class A2FL, 0.4643% 2/5/19 (g)(m) | | 1,454 | | 1,422 |
Class AJFL, 0.5043% 2/5/19 (m) | | 890 | | 870 |
Series 2006-FL12 Class AJ, 0.3695% 12/15/20 (g)(m) | | 1,872 | | 1,709 |
sequential payer: | | | | |
Series 2006-C8 Class A3, 5.31% 12/10/46 | | 3,744 | | 3,821 |
Series 2006-CN2A: | | | | |
Class A2FX, 5.449% 2/5/19 (g) | | 1,717 | | 1,721 |
Class AJFX, 5.478% 2/5/19 (g) | | 4,140 | | 4,146 |
Series 2007-C9 Class A4, 5.8111% 12/10/49 (m) | | 2,907 | | 3,432 |
Series 2006-C8 Class XP, 0.4663% 12/10/46 (m)(o) | | 16,244 | | 101 |
Credit Suisse Commercial Mortgage Trust: | | | | |
sequential payer: | | | | |
Series 2006-C4 Class A3, 5.467% 9/15/39 | | 1,596 | | 1,803 |
Series 2007-C2: | | | | |
Class A2, 5.448% 1/15/49 (m) | | 3,324 | | 3,354 |
Class A3, 5.542% 1/15/49 (m) | | 2,628 | | 2,933 |
Series 2007-C3 Class A4, 5.6792% 6/15/39 (m) | | 790 | | 872 |
Series 2006-C4 Class AAB, 5.439% 9/15/39 | | 3,838 | | 3,887 |
Series 2006-C5 Class ASP, 0.6643% 12/15/39 (m)(o) | | 11,239 | | 92 |
Series 2007-C5 Class A4, 5.695% 9/15/40 (m) | | 1,189 | | 1,328 |
Credit Suisse First Boston Mortgage Capital Certificates floater Series 2007-TF2A Class B, 0.5895% 4/15/22 (g)(m) | | 4,688 | | 3,715 |
Credit Suisse First Boston Mortgage Securities Corp.: | | | | |
sequential payer Series 2004-C1 Class A4, 4.75% 1/15/37 | | 600 | | 626 |
Series 2001-CK6 Class AX, 0.9973% 8/15/36 (m)(o) | | 344 | | 0* |
Series 2001-CKN5 Class AX, 1.7514% 9/15/34 (g)(m)(o) | | 1,187 | | 1 |
Series 2006-C1 Class A3, 5.4157% 2/15/39 (m) | | 4,694 | | 4,805 |
Commercial Mortgage Securities - continued |
| Principal Amount (000s) | | Value (000s) |
Credit Suisse Mortgage Capital Certificates: | | | | |
floater Series 2007-TFL1: | | | | |
Class B, 0.3895% 2/15/22 (g)(m) | | $ 497 | | $ 465 |
Class C: | | | | |
0.4095% 2/15/22 (g)(m) | | 2,047 | | 1,896 |
0.5095% 2/15/22 (g)(m) | | 731 | | 662 |
Class F, 0.5595% 2/15/22 (g)(m) | | 1,462 | | 1,310 |
Series 2007-C1: | | | | |
Class ASP, 0.3813% 2/15/40 (m)(o) | | 19,061 | | 107 |
Class B, 5.487% 2/15/40 (g)(m) | | 2,009 | | 256 |
First Union National Bank-Bank of America Commercial Mortgage Trust Series 2001-C1 Class G, 6.936% 3/15/33 (g) | | 123 | | 123 |
GE Capital Commercial Mortgage Corp.: | | | | |
sequential payer Series 2007-C1 Class A4, 5.543% 12/10/49 | | 8,890 | | 9,960 |
Series 2001-1 Class X1, 1.4912% 5/15/33 (g)(m)(o) | | 863 | | 11 |
Series 2007-C1 Class XP, 0.1588% 12/10/49 (m)(o) | | 20,244 | | 66 |
Greenwich Capital Commercial Funding Corp.: | | | | |
floater Series 2006-FL4 Class B, 0.4343% 11/5/21 (g)(m) | | 494 | | 469 |
sequential payer: | | | | |
Series 2007-GG11 Class A2, 5.597% 12/10/49 | | 2,296 | | 2,365 |
Series 2007-GG9 Class A4, 5.444% 3/10/39 | | 17,490 | | 19,797 |
Series 2006-GG7 Class A3, 5.8738% 7/10/38 (m) | | 548 | | 548 |
Series 2007-GG11 Class A1, 0.2519% 12/10/49 (g)(m)(o) | | 25,003 | | 129 |
GS Mortgage Securities Corp. II: | | | | |
floater: | | | | |
Series 2006-FL8A: | | | | |
Class E, 0.6158% 6/6/20 (g)(m) | | 298 | | 296 |
Class F, 0.6858% 6/6/20 (g)(m) | | 916 | | 903 |
Series 2007-EOP: | | | | |
Class C, 2.0056% 3/6/20 (g)(m) | | 1,650 | | 1,634 |
Class D, 2.2018% 3/6/20 (g)(m) | | 3,090 | | 3,061 |
Class F, 2.6334% 3/6/20 (g)(m) | | 136 | | 135 |
Class G, 2.7903% 3/6/20 (g)(m) | | 67 | | 66 |
Class H, 3.3004% 3/6/20 (g)(m) | | 62 | | 62 |
Class J, 4.0852% 3/6/20 (g)(m) | | 85 | | 85 |
Series 2006-GG6 Class A2, 5.506% 4/10/38 | | 3,167 | | 3,170 |
GS Mortgage Securities Trust sequential payer: | | | | |
Series 2006-GG8 Class A2, 5.479% 11/10/39 | | 393 | | 399 |
Series 2007-GG10 Class A2, 5.778% 8/10/45 | | 294 | | 298 |
Commercial Mortgage Securities - continued |
| Principal Amount (000s) | | Value (000s) |
JPMorgan Chase Commercial Mortgage Securities Trust: | | | | |
floater Series 2006-FLA2: | | | | |
Class B, 0.4095% 11/15/18 (g)(m) | | $ 655 | | $ 638 |
Class C, 0.4495% 11/15/18 (g)(m) | | 465 | | 448 |
Class D, 0.4695% 11/15/18 (g)(m) | | 207 | | 195 |
Class E, 0.5195% 11/15/18 (g)(m) | | 297 | | 274 |
Class F, 0.5695% 11/15/18 (g)(m) | | 446 | | 394 |
Class G, 0.5995% 11/15/18 (g)(m) | | 386 | | 326 |
Class H, 0.7395% 11/15/18 (g)(m) | | 297 | | 239 |
sequential payer: | | | | |
Series 2006-CB14 Class A3B, 5.4914% 12/12/44 (m) | | 3,229 | | 3,301 |
Series 2006-LDP8 Class A4, 5.399% 5/15/45 | | 837 | | 962 |
Series 2006-LDP9: | | | | |
Class A2, 5.134% 5/15/47 (m) | | 419 | | 440 |
Class A3, 5.336% 5/15/47 | | 5,183 | | 5,861 |
Series 2007-CB19 Class A4, 5.7337% 2/12/49 (m) | | 4,608 | | 5,342 |
Series 2007-LD11 Class A2, 5.7998% 6/15/49 (m) | | 2,882 | | 2,968 |
Series 2007-LDPX: | | | | |
Class A2 S, 5.305% 1/15/49 | | 1,929 | | 1,944 |
Class A3, 5.42% 1/15/49 | | 18,477 | | 21,088 |
Series 2005-LDP3 Class A3, 4.959% 8/15/42 | | 1,723 | | 1,747 |
Series 2006-CB17 Class A3, 5.45% 12/12/43 | | 344 | | 345 |
Series 2007-CB19: | | | | |
Class B, 5.7337% 2/12/49 (m) | | 112 | | 37 |
Class C, 5.7337% 2/12/49 (m) | | 294 | | 62 |
Class D, 5.7337% 2/12/49 (m) | | 309 | | 63 |
Series 2007-LDP10: | | | | |
Class CS, 5.466% 1/15/49 (m) | | 108 | | 9 |
Class ES, 5.5652% 1/15/49 (g)(m) | | 679 | | 31 |
LB Commercial Conduit Mortgage Trust sequential payer Series 2007-C3 Class A4, 5.8846% 7/15/44 (m) | | 1,054 | | 1,239 |
LB-UBS Commercial Mortgage Trust: | | | | |
sequential payer: | | | | |
Series 2006-C1 Class A2, 5.084% 2/15/31 | | 178 | | 178 |
Series 2006-C6 Class A2, 5.262% 9/15/39 (m) | | 72 | | 72 |
Series 2006-C7: | | | | |
Class A2, 5.3% 11/15/38 | | 764 | | 777 |
Class A3, 5.347% 11/15/38 | | 979 | | 1,121 |
Series 2007-C1 Class A4, 5.424% 2/15/40 | | 4,069 | | 4,678 |
Series 2007-C2 Class A3, 5.43% 2/15/40 | | 2,923 | | 3,318 |
Commercial Mortgage Securities - continued |
| Principal Amount (000s) | | Value (000s) |
LB-UBS Commercial Mortgage Trust: - continued | | | | |
Series 2006-C6 Class XCP, 0.6747% 9/15/39 (m)(o) | | $ 5,603 | | $ 39 |
Series 2007-C1 Class XCP, 0.4243% 2/15/40 (m)(o) | | 2,095 | | 13 |
Series 2007-C6 Class A4, 5.858% 7/15/40 (m) | | 1,642 | | 1,919 |
Series 2007-C7 Class XCP, 0.2615% 9/15/45 (m)(o) | | 84,375 | | 552 |
Lehman Brothers Floating Rate Commercial Mortgage Trust floater Series 2006-LLFA: | | | | |
Class D, 0.4695% 9/15/21 (g)(m) | | 421 | | 400 |
Class E, 0.5295% 9/15/21 (g)(m) | | 1,518 | | 1,404 |
Class F, 0.5795% 9/15/21 (g)(m) | | 1,255 | | 1,129 |
Class G, 0.5995% 9/15/21 (g)(m) | | 2,478 | | 2,169 |
Class H, 0.6395% 9/15/21 (g)(m) | | 639 | | 537 |
Merrill Lynch Mortgage Trust: | | | | |
Series 2005-LC1 Class F, 5.3733% 1/12/44 (g)(m) | | 1,143 | | 751 |
Series 2006-C1 Class A2, 5.6141% 5/12/39 (m) | | 1,164 | | 1,190 |
Series 2007-C1 Class A4, 5.8461% 6/12/50 (m) | | 4,974 | | 5,613 |
Series 2008-C1 Class A4, 5.69% 2/12/51 | | 2,805 | | 3,289 |
Merrill Lynch-CFC Commercial Mortgage Trust: | | | | |
floater Series 2006-4 Class A2FL, 0.3688% 12/12/49 (m) | | 132 | | 132 |
sequential payer: | | | | |
Series 2006-1 Class A3, 5.4796% 2/12/39 (m) | | 1,394 | | 1,393 |
Series 2006-4 Class ASB, 5.133% 12/12/49 (m) | | 961 | | 1,011 |
Series 2007-5: | | | | |
Class A3, 5.364% 8/12/48 | | 512 | | 519 |
Class B, 5.479% 8/12/48 | | 3,942 | | 968 |
Series 2007-6 Class A4, 5.485% 3/12/51 (m) | | 10,897 | | 12,129 |
Series 2007-7 Class A4, 5.7386% 6/12/50 (m) | | 4,599 | | 5,029 |
Series 2006-3 Class ASB, 5.382% 7/12/46 (m) | | 4,518 | | 4,656 |
Series 2006-4 Class XP, 0.617% 12/12/49 (m)(o) | | 20,146 | | 278 |
Series 2007-6 Class B, 5.635% 3/12/51 (m) | | 1,314 | | 329 |
Series 2007-7 Class B, 5.7386% 6/12/50 (m) | | 114 | | 8 |
Series 2007-8 Class A3, 5.9634% 8/12/49 (m) | | 1,133 | | 1,293 |
Morgan Stanley Capital I Trust: | | | | |
floater: | | | | |
Series 2006-XLF Class C, 1.44% 7/15/19 (g)(m) | | 393 | | 247 |
Series 2007-XLFA: | | | | |
Class C, 0.4% 10/15/20 (g)(m) | | 754 | | 682 |
Class D, 0.43% 10/15/20 (g)(m) | | 732 | | 648 |
Class E, 0.49% 10/15/20 (g)(m) | | 916 | | 779 |
Class F, 0.54% 10/15/20 (g)(m) | | 550 | | 456 |
Class G, 0.58% 10/15/20 (g)(m) | | 680 | | 528 |
Class H, 0.67% 10/15/20 (g)(m) | | 428 | | 278 |
Commercial Mortgage Securities - continued |
| Principal Amount (000s) | | Value (000s) |
Morgan Stanley Capital I Trust: - continued | | | | |
floater: | | | | |
Series 2007-XLFA: | | | | |
Class J, 0.82% 10/15/20 (g)(m) | | $ 250 | | $ 100 |
sequential payer: | | | | |
Series 2005-IQ9 Class A3, 4.54% 7/15/56 | | 1,242 | | 1,258 |
Series 2007-HQ11 Class A31, 5.439% 2/12/44 (m) | | 666 | | 701 |
Series 2006-HQ10 Class X2, 0.4951% 11/12/41 (g)(m)(o) | | 8,835 | | 9 |
Series 2006-IQ11: | | | | |
Class A3, 5.6877% 10/15/42 (m) | | 404 | | 410 |
Class A4, 5.7237% 10/15/42 (m) | | 394 | | 447 |
Series 2006-T23 Class A3, 5.809% 8/12/41 (m) | | 671 | | 697 |
Series 2007-IQ14: | | | | |
Class A4, 5.692% 4/15/49 (m) | | 1,971 | | 2,224 |
Class AAB, 5.654% 4/15/49 | | 3,406 | | 3,675 |
Class B, 5.7187% 4/15/49 (m) | | 323 | | 96 |
Wachovia Bank Commercial Mortgage Trust: | | | | |
floater: | | | | |
Series 2006-WL7A: | | | | |
Class E, 0.518% 9/15/21 (g)(m) | | 1,791 | | 1,540 |
Class F, 0.578% 9/15/21 (g)(m) | | 2,061 | | 1,690 |
Class G, 0.598% 9/15/21 (g)(m) | | 1,953 | | 1,523 |
Class J, 0.838% 9/15/21 (g)(m) | | 434 | | 286 |
Series 2007-WHL8: | | | | |
Class F, 0.7195% 6/15/20 (g)(m) | | 4,581 | | 3,372 |
Class LXR1, 0.9395% 6/15/20 (g)(m) | | 162 | | 140 |
sequential payer: | | | | |
Series 2003-C7 Class A1, 4.241% 10/15/35 (g) | | 834 | | 840 |
Series 2003-C8 Class A3, 4.445% 11/15/35 | | 4,548 | | 4,610 |
Series 2006-C29 Class A3, 5.313% 11/15/48 | | 3,490 | | 3,655 |
Series 2007-C30: | | | | |
Class A3, 5.246% 12/15/43 | | 419 | | 423 |
Class A4, 5.305% 12/15/43 | | 386 | | 415 |
Class A5, 5.342% 12/15/43 | | 17,206 | | 19,046 |
Series 2007-C31 Class A4, 5.509% 4/15/47 | | 12,470 | | 14,134 |
Series 2003-C6 Class G, 5.125% 8/15/35 (g)(m) | | 624 | | 623 |
Series 2005-C19 Class B, 4.892% 5/15/44 | | 1,314 | | 1,214 |
Series 2005-C22: | | | | |
Class B, 5.3564% 12/15/44 (m) | | 2,914 | | 2,018 |
Class F, 5.3564% 12/15/44 (g)(m) | | 2,191 | | 429 |
Series 2006-C23 Class A5, 5.416% 1/15/45 (m) | | 7,210 | | 8,125 |
Commercial Mortgage Securities - continued |
| Principal Amount (000s) | | Value (000s) |
Wachovia Bank Commercial Mortgage Trust: - continued | | | | |
Series 2007-C30: | | | | |
Class C, 5.483% 12/15/43 (m) | | $ 3,942 | | $ 1,110 |
Class D, 5.513% 12/15/43 (m) | | 2,102 | | 426 |
Class XP, 0.4723% 12/15/43 (g)(m)(o) | | 11,372 | | 83 |
Series 2007-C31 Class C, 5.6821% 4/15/47 (m) | | 361 | | 81 |
Series 2007-C31A Class A2, 5.421% 4/15/47 | | 7,547 | | 7,829 |
Series 2007-C32: | | | | |
Class D, 5.7418% 6/15/49 (m) | | 987 | | 266 |
Class E, 5.7418% 6/15/49 (m) | | 1,556 | | 367 |
Wachovia Bank Commercial Mortgage Trust pass-thru certificates sequential payer Series 2007-C33 Class A5, 5.9003% 2/15/51 (m) | | 870 | | 1,010 |
TOTAL COMMERCIAL MORTGAGE SECURITIES (Cost $320,186) |
394,726
|
Municipal Securities - 0.4% |
|
Beaver County Indl. Dev. Auth. Poll. Cont. Rev. Bonds (FirstEnergy Nuclear Generation Corp. Proj.) Series 2005 A, 3.375%, tender 7/1/15 (m) | | 2,300 | | 2,388 |
California Gen. Oblig.: | | | | |
Series 2009, 7.35% 11/1/39 | | 985 | | 1,279 |
7.3% 10/1/39 | | 10,620 | | 13,706 |
7.5% 4/1/34 | | 8,780 | | 11,439 |
7.55% 4/1/39 | | 5,410 | | 7,243 |
7.6% 11/1/40 | | 6,110 | | 8,281 |
7.625% 3/1/40 | | 2,530 | | 3,403 |
Illinois Gen. Oblig.: | | | | |
Series 2010, 4.421% 1/1/15 | | 5,980 | | 6,358 |
Series 2010-1, 6.63% 2/1/35 | | 12,295 | | 13,671 |
Series 2010-3: | | | | |
6.725% 4/1/35 | | 2,025 | | 2,274 |
7.35% 7/1/35 | | 1,640 | | 1,948 |
Series 2011, 5.877% 3/1/19 | | 2,005 | | 2,242 |
5.1% 6/1/33 | | 5,220 | | 5,047 |
TOTAL MUNICIPAL SECURITIES (Cost $75,809) |
79,279
|
Bank Notes - 0.0% |
|
Wachovia Bank NA 6% 11/15/17
(Cost $3,586) | | 3,319 | |
3,975
|
Fixed-Income Funds - 14.5% |
| Shares | | Value (000s) |
Fidelity Corporate Bond 1-10 Year Central Fund (n) | 3,538,209 | | $ 401,162 |
Fidelity High Income Central Fund 2 (n) | 5,394,857 | | 614,582 |
Fidelity Mortgage Backed Securities Central Fund (n) | 17,940,819 | | 1,971,158 |
TOTAL FIXED-INCOME FUNDS (Cost $2,752,455) |
2,986,902
|
Money Market Funds - 2.3% |
| | | |
Fidelity Cash Central Fund, 0.17% (b) | 403,928,601 | | 403,929 |
Fidelity Securities Lending Cash Central Fund, 0.18% (b)(c) | 69,757,970 | | 69,758 |
TOTAL MONEY MARKET FUNDS (Cost $473,687) |
473,687
|
TOTAL INVESTMENT PORTFOLIO - 104.4% (Cost $18,621,067) | | 21,529,875 |
NET OTHER ASSETS (LIABILITIES) - (4.4)% | | (911,147) |
NET ASSETS - 100% | $ 20,618,728 |
TBA Sale Commitments |
| Principal Amount (000s) | | |
Fannie Mae |
3% 9/1/42 | $ (183,000) | | (189,894) |
3% 9/1/42 | (11,300) | | (11,726) |
3% 9/1/42 | (2,300) | | (2,387) |
3% 9/1/42 | (11,300) | | (11,726) |
3% 9/1/42 | (184,600) | | (191,554) |
3.5% 9/1/42 | (139,000) | | (147,383) |
4% 9/1/42 | (31,400) | | (33,672) |
4.5% 9/1/42 | (30,000) | | (32,470) |
TBA Sale Commitments - continued |
| Principal Amount (000s) | | Value (000s) |
Fannie Mae - continued |
5% 9/1/42 | $ (36,800) | | $ (40,192) |
5.5% 9/1/42 | (17,000) | | (18,656) |
6% 9/1/42 | (43,000) | | (47,384) |
TOTAL FANNIE MAE | | (727,044) |
Freddie Mac |
5% 9/1/42 | (7,000) | | (7,588) |
Ginnie Mae |
3.5% 9/1/42 | (7,300) | | (7,902) |
3.5% 9/1/42 | (3,700) | | (4,005) |
TOTAL GINNIE MAE | | (11,907) |
TOTAL TBA SALE COMMITMENTS (Proceeds $743,971) | $ (746,539) |
Futures Contracts |
| Expiration Date | | Underlying
Face Amount
at Value (000s) | | Unrealized Appreciation/
(Depreciation) (000s) |
Purchased |
Equity Index Contracts |
1,537 CME E-mini S&P 500 Index Contracts | Sept. 2012 | | $ 107,982 | | $ 7,700 |
|
The face value of futures purchased as a percentage of net assets is 0.5% |
Swap Agreements |
| Expiration Date | | Notional Amount
(000s) (l) | | Value
(000s) |
Credit Default Swaps |
Receive monthly a fixed rate of .15% multiplied by the notional amount and pay to Credit Suisse First Boston upon each credit event of one of the issues of ABX AA 07-01 Index, par value of the proportional notional amount (Rating-C) (Upfront Premium Received/(Paid) $3,215,000) (k) | Sept. 2037 | | $ 5,588 | | $ (5,303) |
Receive monthly a fixed rate of .15% multiplied by the notional amount and pay to JPMorgan Chase, Inc. upon each credit event of one of the issues of ABX AA 07-01 Index, par value of the proportional notional amount (Rating-C) (Upfront Premium Received/(Paid) $2,992,000) (k) | Sept. 2037 | | 4,551 | | (4,318) |
Receive monthly a fixed rate of .15% multiplied by the notional amount and pay to JPMorgan Chase, Inc. upon each credit event of one of the issues of ABX AA 07-01 Index, par value of the proportional notional amount (Rating-C) (Upfront Premium Received/(Paid) $407,000) (k) | Sept. 2037 | | 602 | | (572) |
Receive monthly a fixed rate of .15% multiplied by the notional amount and pay to Morgan Stanley, Inc. upon each credit event of one of the issues of ABX AA 07-01 Index, par value of the proportional notional amount (Rating-C) (Upfront Premium Received/(Paid) $2,992,000) (k) | Sept. 2037 | | 4,551 | | (4,318) |
Receive monthly a fixed rate of .15% multiplied by the notional amount and pay to UBS upon each credit event of one of the issues of ABX AA 07-1 Index, par value of the proportional notional amount (Rating-C) (Upfront Premium Received/(Paid) $2,882,000) (k) | Sept. 2037 | | 4,383 | | (4,160) |
Swap Agreements - continued |
| Expiration Date | | Notional Amount
(000s)(l) | | Value
(000s) |
Credit Default Swaps - continued |
Receive monthly a fixed rate of .15% multiplied by the notional amount and pay to UBS upon each credit event of one of the issues of ABX AA 07-1 Index, par value of the proportional notional amount (Rating-C) (Upfront Premium Received/(Paid) $2,559,000) (k) | Sept. 2037 | | $ 3,848 | | $ (3,651) |
Receive monthly notional amount multiplied by 2.5% and pay Bank of America upon credit event of Ameriquest Mortgage Securities, Inc., par value of the notional amount of Ameriquest Mortgage Securities, Inc. Series 2004-R11 Class M9, 6.102% 11/25/34 (Rating-C) (k) | Dec. 2034 | | 562 | | (542) |
| | $ 24,085 | | $ (22,864) |
Legend |
(a) Non-income producing |
(b) Affiliated fund that is available only to investment companies and other accounts managed by Fidelity Investments. The rate quoted is the annualized seven-day yield of the fund at period end. A complete unaudited listing of the fund's holdings as of its most recent quarter end is available upon request. In addition, each Fidelity Central Fund's financial statements, which are not covered by the Fund's Report of Independent Registered Public Accounting Firm, are available on the SEC's website or upon request. |
(c) Investment made with cash collateral received from securities on loan. |
(d) Non-income producing - Security is in default. |
(e) Security or a portion of the security is on loan at period end. |
(f) Affiliated company |
(g) Security exempt from registration under Rule 144A of the Securities Act of 1933. These securities may be resold in transactions exempt from registration, normally to qualified institutional buyers. At the end of the period, the value of these securities amounted to $376,199,000 or 1.8% of net assets. |
(h) Security or a portion of the security purchased on a delayed delivery or when-issued basis. |
(i) Security or a portion of the security was pledged to cover margin requirements for futures contracts. At the period end, the value of securities pledged amounted to $5,699,000. |
(j) Security or a portion of the security has been segregated as collateral for open swap agreements. At the period end, the value of securities pledged amounted to $27,704,000. |
(k) Represents a credit default swap contract in which the Fund has sold protection on the underlying reference. The underlying reference may be a single-name issuer or a traded credit index. The value of each credit default swap and the credit rating can be measures of the current payment/performance risk. For the underlying reference, ratings disclosed are from Moody's Investors Service, Inc. Where Moody's ratings are not available, S&P ratings are disclosed and are indicated as such. For swaps on a traded credit index, ratings represent a weighted average of the ratings of all securities included in the index. All ratings are as of the report date and do not reflect subsequent changes. Where a credit rating is not disclosed, the value is used as the measure of the payment/performance risk. |
(l) The notional amount of each credit default swap where the Fund has sold protection approximates the maximum potential amount of future payments that the Fund could be required to make if a credit event were to occur. |
(m) Coupon rates for floating and adjustable rate securities reflect the rates in effect at period end. |
(n) Affiliated fund that is available only to investment companies and other accounts managed by Fidelity Investments. A complete unaudited schedule of portfolio holdings for each Fidelity Central Fund is filed with the SEC for the first and third quarters of each fiscal year on Form N-Q and is available upon request or at the SEC's web site at www.sec.gov. An unaudited holdings listing for the Fund, which presents direct holdings as well as the pro rata share of securities and other investments held indirectly through its investment in underlying non-money market Fidelity Central Funds, is available at fidelity.com. In addition, each Fidelity Central Fund's financial statements, which are not covered by the Fund's Report of Independent Registered Public Accounting Firm, are available on the SEC's web site or upon request. |
(o) Security represents right to receive monthly interest payments on an underlying pool of mortgages or assets. Principal shown is the outstanding par amount of the pool as of the end of the period. |
(p) Investment is owned by an entity that is treated as a corporation for U.S. tax purposes which is owned by the Fund. |
(q) Restricted securities - Investment in securities not registered under the Securities Act of 1933 (excluding 144A issues). At the end of the period, the value of restricted securities (excluding 144A issues) amounted to $22,582,000 or 0.1% of net assets. |
Additional information on each restricted holding is as follows: |
Security | Acquisition Date | Acquisition Cost (000s) |
Halcon Resources Corp. | 3/1/12 | $ 8,190 |
Jumptap, Inc. Series G | 6/29/12 | $ 6,429 |
Legend Pictures LLC | 9/23/10 | $ 6,428 |
* Amount represents less than $1,000. |
Affiliated Central Funds |
Information regarding fiscal year to date income earned by the Fund from investments in Fidelity Central Funds is as follows: |
Fund | Income earned
(Amounts in thousands) |
Fidelity Cash Central Fund | $ 767 |
Fidelity Corporate Bond 1-10 Year Central Fund | 16,659 |
Fidelity High Income Central Fund 2 | 39,969 |
Fidelity Mortgage Backed Securities Central Fund | 44,833 |
Fidelity Securities Lending Cash Central Fund | 1,552 |
Total | $ 103,780 |
Additional information regarding the Fund's fiscal year to date purchases and sales, including the ownership percentage, of the non Money Market Central Funds is as follows: |
Fund
(Amounts in
thousands) | Value,
beginning of
period | Purchases | Sales
Proceeds | Value,
end of
period | % ownership,
end of
period |
Fidelity Corporate Bond 1-10 Year Central Fund | $ 388,778 | $ - | $ - | $ 401,162 | 58.3% |
Fidelity High Income Central Fund 2 | 533,410 | 39,969 | - | 614,582 | 83.0% |
Fidelity Mortgage Backed Securities Central Fund | 1,480,565 | 541,089 | 76,845 | 1,971,158 | 12.6% |
Total | $ 2,402,753 | $ 581,058 | $ 76,845 | $ 2,986,902 | |
Other Affiliated Issuers |
An affiliated company is a company in which the Fund has ownership of at least 5% of the voting securities. Fiscal year to date transactions with companies which are or were affiliates are as follows: |
Affiliate
(Amounts in thousands) | Value,
beginning of
period | Purchases | Sales Proceeds | Dividend Income | Value,
end of
period |
Kayak Software Corp. | $ - | $ 5,795 | $ - | $ - | $ 5,542 |
Other Information |
The following is a summary of the inputs used, as of August 31, 2012, involving the Fund's assets and liabilities carried at fair value. The inputs or methodology used for valuing securities may not be an indication of the risk associated with investing in those securities. For more information on valuation inputs, and their aggregation into the levels used in the table below, please refer to the Security Valuation section in the accompanying Notes to Financial Statements. |
Valuation Inputs at Reporting Date: |
Description
(Amounts in thousands) | Total | Level 1 | Level 2 | Level 3 |
Investments in Securities: | | | | |
Equities: | | | | |
Consumer Discretionary | $ 1,315,967 | $ 1,300,374 | $ - | $ 15,593 |
Consumer Staples | 1,479,674 | 1,424,505 | 55,169 | - |
Energy | 1,477,952 | 1,477,952 | - | - |
Financials | 1,922,380 | 1,894,913 | 17,234 | 10,233 |
Health Care | 1,549,685 | 1,549,685 | - | - |
Industrials | 1,351,489 | 1,351,489 | - | - |
Information Technology | 2,844,848 | 2,844,848 | - | - |
Materials | 417,661 | 417,661 | - | - |
Valuation Inputs at Reporting Date: |
Description
(Amounts in thousands) | Total | Level 1 | Level 2 | Level 3 |
Investments in Securities: | | | | |
Equities: | | | | |
Telecommunication Services | $ 310,534 | $ 310,534 | $ - | $ - |
Utilities | 462,047 | 462,047 | - | - |
Corporate Bonds | 1,517,523 | - | 1,517,523 | - |
U.S. Government and Government Agency Obligations | 1,020,741 | - | 1,020,741 | - |
U.S. Government Agency - Mortgage Securities | 1,808,812 | - | 1,808,812 | - |
Asset-Backed Securities | 64,180 | - | 56,298 | 7,882 |
Collateralized Mortgage Obligations | 47,813 | - | 46,022 | 1,791 |
Commercial Mortgage Securities | 394,726 | - | 365,749 | 28,977 |
Municipal Securities | 79,279 | - | 79,279 | - |
Bank Notes | 3,975 | - | 3,975 | - |
Fixed-Income Funds | 2,986,902 | 2,986,902 | - | - |
Money Market Funds | 473,687 | 473,687 | - | - |
Total Investments in Securities: | $ 21,529,875 | $ 16,494,597 | $ 4,970,802 | $ 64,476 |
Derivative Instruments: | | | | |
Assets | | | | |
Futures Contracts | $ 7,700 | $ 7,700 | $ - | $ - |
Liabilities | | | | |
Swap Agreements | $ (22,864) | $ - | $ (22,322) | $ (542) |
Total Derivative Instruments: | $ (15,164) | $ 7,700 | $ (22,322) | $ (542) |
Other Financial Instruments: | | | | |
TBA Sale Commitments | $ (746,539) | $ - | $ (746,539) | $ - |
Value of Derivative Instruments |
The following table is a summary of the Fund's value of derivative instruments by primary risk exposure as of August 31, 2012. For additional information on derivative instruments, please refer to the Derivative Instruments section in the accompanying Notes to Financial Statements. |
Primary Risk Exposure /
Derivative Type | Value |
(Amounts in thousands) | Asset | Liability |
Credit Risk | | |
Swap Agreements (b) | $ - | $ (22,864) |
Equity Risk | | |
Futures Contracts (a) | 7,700 | - |
Total Value of Derivatives | $ 7,700 | $ (22,864) |
(a) Reflects cumulative appreciation/(depreciation) on futures contracts as disclosed on the Schedule of Investments. Only the period end variation margin is separately disclosed on the Statement of Assets and Liabilities. |
(b) Value is disclosed on the Statement of Assets and Liabilities in the Swap agreements, at value line-items. |
Other Information |
The composition of credit quality ratings as a percentage of net assets is as follows (Unaudited): |
U.S. Government and U.S. Government Agency Obligations | 19.9% |
AAA,AA,A | 4.8% |
BBB | 6.7% |
BB | 0.8% |
B | 1.9% |
CCC,CC,C | 0.2% |
D | 0.0%* |
Not Rated | 0.0%* |
Equities | 63.8% |
Short-Term Investments and Net Other Assets | 1.9% |
| 100% |
* Amount represents less than 0.1% |
We have used ratings from Moody's Investors Service, Inc. Where Moody's® ratings are not available, we have used S&P® ratings. All ratings are as of the date indicated and do not reflect subsequent changes. |
The information in the above table is based on the combined investments of the Fund and its pro-rata share of the investments of Fidelity's fixed-income central funds. |
See accompanying notes which are an integral part of the financial statements.
Annual Report
Statement of Assets and Liabilities
Amounts in thousands (except per-share amounts) | August 31, 2012 |
| | |
Assets | | |
Investment in securities, at value (including securities loaned of $68,346) - See accompanying schedule: Unaffiliated issuers (cost $15,389,130) | $ 18,063,744 | |
Fidelity Central Funds (cost $3,226,142) | 3,460,589 | |
Other affiliated issuers (cost $5,795) | 5,542 | |
Total Investments (cost $18,621,067) | | $ 21,529,875 |
Foreign currency held at value (cost $2,756) | | 2,756 |
Receivable for investments sold, regular delivery | | 637,453 |
Receivable for TBA sale commitments | | 743,971 |
Receivable for swap agreements | | 5 |
Receivable for fund shares sold | | 15,555 |
Dividends receivable | | 29,414 |
Interest receivable | | 28,064 |
Distributions receivable from Fidelity Central Funds | | 1,750 |
Receivable for daily variation margin on futures contracts | | 615 |
Other receivables | | 998 |
Total assets | | 22,990,456 |
| | |
Liabilities | | |
Payable to custodian bank | $ 102 | |
Payable for investments purchased
Regular delivery | 263,000 | |
Delayed delivery | 1,245,389 | |
TBA sale commitments, at value | 746,539 | |
Payable for swap agreements | 2,633 | |
Payable for fund shares redeemed | 9,164 | |
Swap agreements, at value | 22,864 | |
Accrued management fee | 6,974 | |
Other affiliated payables | 2,484 | |
Other payables and accrued expenses | 2,821 | |
Collateral on securities loaned, at value | 69,758 | |
Total liabilities | | 2,371,728 |
| | |
Net Assets | | $ 20,618,728 |
Net Assets consist of: | | |
Paid in capital | | $ 18,565,807 |
Undistributed net investment income | | 84,489 |
Accumulated undistributed net realized gain (loss) on investments and foreign currency transactions | | (921,602) |
Net unrealized appreciation (depreciation) on investments and assets and liabilities in foreign currencies | | 2,890,034 |
Net Assets | | $ 20,618,728 |
See accompanying notes which are an integral part of the financial statements.
Annual Report
Financial Statements - continued
Statement of Assets and Liabilities - continued
Amounts in thousands (except per-share amounts) | August 31, 2012 |
| | |
Balanced:
Net Asset Value, offering price and redemption price per share ($15,016,156 ÷ 752,542 shares) | | $ 19.95 |
| | |
Class K:
Net Asset Value, offering price and redemption price per share ($5,602,572 ÷ 280,771 shares) | | $ 19.95 |
See accompanying notes which are an integral part of the financial statements.
Annual Report
Statement of Operations
Amounts in thousands | Year ended August 31, 2012 |
| | |
Investment Income | | |
Dividends | | $ 232,301 |
Interest | | 177,782 |
Income from Fidelity Central Funds | | 103,780 |
Total income | | 513,863 |
| | |
Expenses | | |
Management fee | $ 81,574 | |
Transfer agent fees | 28,381 | |
Accounting and security lending fees | 1,995 | |
Custodian fees and expenses | 342 | |
Independent trustees' compensation | 133 | |
Registration fees | 298 | |
Audit | 162 | |
Legal | 86 | |
Miscellaneous | 208 | |
Total expenses before reductions | 113,179 | |
Expense reductions | (845) | 112,334 |
Net investment income (loss) | | 401,529 |
Realized and Unrealized Gain (Loss) Net realized gain (loss) on: | | |
Investment securities: | | |
Unaffiliated issuers | 5,409 | |
Fidelity Central Funds | 1,625 | |
Foreign currency transactions | (129) | |
Futures contracts | 8,596 | |
Swap agreements | (16,533) | |
Total net realized gain (loss) | | (1,032) |
Change in net unrealized appreciation (depreciation) on: Investment securities | 1,823,727 | |
Assets and liabilities in foreign currencies | (260) | |
Futures contracts | 8,583 | |
Swap agreements | 15,494 | |
Delayed delivery commitments | (5,308) | |
Total change in net unrealized appreciation (depreciation) | | 1,842,236 |
Net gain (loss) | | 1,841,204 |
Net increase (decrease) in net assets resulting from operations | | $ 2,242,733 |
See accompanying notes which are an integral part of the financial statements.
Annual Report
Financial Statements - continued
Statement of Changes in Net Assets
Amounts in thousands | Year ended
August 31,
2012 | Year ended
August 31,
2011 |
Increase (Decrease) in Net Assets | | |
Operations | | |
Net investment income (loss) | $ 401,529 | $ 410,670 |
Net realized gain (loss) | (1,032) | 2,160,284 |
Change in net unrealized appreciation (depreciation) | 1,842,236 | 115,234 |
Net increase (decrease) in net assets resulting
from operations | 2,242,733 | 2,686,188 |
Distributions to shareholders from net investment income | (379,925) | (410,590) |
Distributions to shareholders from net realized gain | - | (9,407) |
Total distributions | (379,925) | (419,997) |
Share transactions - net increase (decrease) | (947,824) | (2,018,385) |
Total increase (decrease) in net assets | 914,984 | 247,806 |
| | |
Net Assets | | |
Beginning of period | 19,703,744 | 19,455,938 |
End of period (including undistributed net investment income of $84,489 and undistributed net investment income of $89,115, respectively) | $ 20,618,728 | $ 19,703,744 |
See accompanying notes which are an integral part of the financial statements.
Annual Report
Financial Highlights - Balanced
Years ended August 31, | 2012 | 2011 | 2010 | 2009 | 2008 |
Selected Per-Share Data | | | | | |
Net asset value, beginning of period | $ 18.17 | $ 16.27 | $ 15.40 | $ 17.71 | $ 20.66 |
Income from Investment Operations | | | | | |
Net investment income (loss) B | .37 | .35 | .36 | .38 | .42 |
Net realized and unrealized gain (loss) | 1.76 | 1.91 | .88 | (2.29) | (1.76) |
Total from investment operations | 2.13 | 2.26 | 1.24 | (1.91) | (1.34) |
Distributions from net investment income | (.35) | (.35) | (.36) | (.37) | (.43) |
Distributions from net realized gain | - | (.01) | (.01) | (.03) | (1.18) |
Total distributions | (.35) | (.36) | (.37) | (.40) | (1.61) |
Net asset value, end of period | $ 19.95 | $ 18.17 | $ 16.27 | $ 15.40 | $ 17.71 |
Total Return A | 11.89% | 13.88% | 8.06% | (10.48)% | (7.28)% |
Ratios to Average Net Assets C, E | | | | | |
Expenses before reductions | .60% | .61% | .62% | .68% | .61% |
Expenses net of fee waivers, if any | .60% | .61% | .62% | .68% | .61% |
Expenses net of all reductions | .59% | .60% | .61% | .68% | .61% |
Net investment income (loss) | 1.98% | 1.92% | 2.18% | 2.78% | 2.22% |
Supplemental Data | | | | | |
Net assets, end of period (in millions) | $ 15,016 | $ 15,602 | $ 16,764 | $ 17,225 | $ 25,363 |
Portfolio turnover rate D | 155% | 193% F | 122% | 198% F | 73% F |
A Total returns would have been lower if certain expenses had not been reduced during the applicable periods shown.
B Calculated based on average shares outstanding during the period.
C Fees and expenses of any underlying Fidelity Central Funds are not included in the Fund's expense ratio. The Fund indirectly bears its proportionate share of the expenses of any underlying Fidelity Central Funds.
D Amount does not include the portfolio activity of any underlying Fidelity Central Funds.
E Expense ratios reflect operating expenses of the class. Expenses before reductions do not reflect amounts reimbursed by the investment adviser or reductions from brokerage service arrangements or reductions from other expense offset arrangements and do not represent the amount paid by the class during periods when reimbursements or reductions occur. Expenses net of fee waivers reflect expenses after reimbursement by the investment adviser but prior to reductions from brokerage service arrangements or other expense offset arrangements. Expenses net of all reductions represent the net expenses paid by the class.
F The portfolio turnover rate excludes liquidations and/or redemptions executed in-kind from Affiliated Central Funds.
See accompanying notes which are an integral part of the financial statements.
Annual Report
Financial Highlights - Class K
Years ended August 31, | 2012 | 2011 | 2010 | 2009 | 2008 G |
Selected Per-Share Data | | | | | |
Net asset value, beginning of period | $ 18.17 | $ 16.27 | $ 15.40 | $ 17.72 | $ 19.12 |
Income from Investment Operations | | | | | |
Net investment income (loss) D | .40 | .38 | .38 | .40 | .12 |
Net realized and unrealized gain (loss) | 1.76 | 1.90 | .88 | (2.29) | (1.41) |
Total from investment operations | 2.16 | 2.28 | 1.26 | (1.89) | (1.29) |
Distributions from net investment income | (.38) | (.38) | (.38) | (.40) | (.11) |
Distributions from net realized gain | - | (.01) | (.01) | (.03) | - |
Total distributions | (.38) | (.38) I | (.39) | (.43) | (.11) |
Net asset value, end of period | $ 19.95 | $ 18.17 | $ 16.27 | $ 15.40 | $ 17.72 |
Total Return B, C | 12.03% | 14.04% | 8.23% | (10.33)% | (6.74)% |
Ratios to Average Net Assets E, H | | | | | |
Expenses before reductions | .48% | .48% | .48% | .50% | .48% A |
Expenses net of fee waivers, if any | .48% | .48% | .48% | .50% | .48% A |
Expenses net of all reductions | .47% | .47% | .47% | .50% | .48% A |
Net investment income (loss) | 2.10% | 2.05% | 2.32% | 2.96% | 2.45% A |
Supplemental Data | | | | | |
Net assets, end of period (in millions) | $ 5,603 | $ 4,102 | $ 2,692 | $ 2,014 | $ 17 |
Portfolio turnover rate F | 155% | 193% J | 122% | 198% J | 73% J |
A Annualized
B Total returns for periods of less than one year are not annualized.
C Total returns would have been lower if certain expenses had not been reduced during the applicable periods shown.
D Calculated based on average shares outstanding during the period.
E Fees and expenses of any underlying Fidelity Central Funds are not included in the Fund's expense ratio. The Fund indirectly bears its proportionate share of the expenses of any underlying Fidelity Central Funds.
F Amount does not include the portfolio activity of any underlying Fidelity Central Funds.
G For the period May 9, 2008 (commencement of sale of shares) to August 31, 2008.
H Expense ratios reflect operating expenses of the class. Expenses before reductions do not reflect amounts reimbursed by the investment adviser or reductions from brokerage service arrangements or reductions from other expense offset arrangements and do not represent the amount paid by the class during periods when reimbursements or reductions occur. Expense ratios before reductions for start-up periods may not be representative of longer-term operating periods. Expenses net of fee waivers reflect expenses after reimbursement by the investment adviser but prior to reductions from brokerage service arrangements or other expense offset arrangements. Expenses net of all reductions represent the net expenses paid by the class.
I Total distributions of $.38 per share is comprised of distributions from net investment income of $.376 and distributions from net realized gain of $.008 per share.
J The portfolio turnover rate excludes liquidations and/or redemptions executed in-kind from Affiliated Central Funds.
See accompanying notes which are an integral part of the financial statements.
Annual Report
Notes to Financial Statements
For the period ended August 31, 2012
(Amounts in thousands except percentages)
1. Organization.
Fidelity® Balanced Fund (the Fund) is a fund of Fidelity Puritan Trust (the Trust) and is authorized to issue an unlimited number of shares. The Trust is registered under the Investment Company Act of 1940, as amended (the 1940 Act), as an open-end management investment company organized as a Massachusetts business trust. The Fund offers Balanced and Class K, shares, each of which has equal rights as to assets and voting privileges. Each class has exclusive voting rights with respect to matters that affect that class. Investment income, realized and unrealized capital gains and losses, the common expenses of the Fund, and certain fund-level expense reductions, if any, are allocated on a pro-rata basis to each class based on the relative net assets of each class to the total net assets of the Fund. Each class differs with respect to transfer agent fees incurred. Certain expense reductions may also differ by class.
2. Investments in Fidelity Central Funds.
The Fund invests in Fidelity Central Funds, which are open-end investment companies available only to other investment companies and accounts managed by Fidelity Management & Research Company (FMR) and its affiliates. The Fund's Schedule of Investments lists each of the Fidelity Central Funds held as of period end, if any, as an investment of the Fund, but does not include the underlying holdings of each Fidelity Central Fund. As an Investing Fund, the Fund indirectly bears its proportionate share of the expenses of the underlying Fidelity Central Funds.
Based on its investment objective, each Fidelity Central Fund may invest or participate in various investment vehicles or strategies that are similar to those of the Fund. These strategies are consistent with the investment objectives of the Fund and may involve certain economic risks which may cause a decline in value of each of the Fidelity Central Funds and thus a decline in the value of the Fund. The Money Market Central Funds seek preservation of capital and current income and are managed by Fidelity Investments Money Management, Inc. (FIMM), an affiliate of FMR. The following summarizes the Fund's investment in each non-money market Fidelity Central Fund.
Fidelity Central Fund | | Investment
Manager | | Investment Objective | | Investment Practices |
Fidelity Corporate Bond 1-10 Year Central Fund | | FIMM | | Seeks a high level of income by normally investing in investment-grade corporate bonds and other corporate debt securities and repurchase agreements for those securities. | | Repurchase Agreements Restricted Securities |
Annual Report
Notes to Financial Statements - continued
(Amounts in thousands except percentages)
2. Investments in Fidelity Central Funds - continued
Fidelity Central Fund | | Investment
Manager | | Investment Objective | | Investment Practices |
Fidelity High Income Central Fund 2 | | FMR Co., Inc. (FMRC) | | Seeks a high level of income and may also seek capital appreciation by investing primarily in debt securities, preferred stocks, and convertible securities, with an emphasis on lower-quality debt securities. | | Loans & Direct Debt Instruments Repurchase Agreements Restricted Securities |
Fidelity Mortgage Backed Securities Central Fund | | FIMM | | Seeks a high level of income by normally investing in investment-grade mortgage-related securities and repurchase agreements for those securities. | | Delayed Delivery & When Issued Securities Futures Repurchase Agreements Swap Agreements |
An unaudited holdings listing for the Fund, which presents direct holdings as well as the pro-rata share of any securities and other investments held indirectly through its investment in underlying non-money market Fidelity Central Funds, is available at fidelity.com. A complete unaudited list of holdings for each Fidelity Central Fund is available upon request or at the Securities and Exchange Commission (the SEC) web site at www.sec.gov. In addition, the financial statements of the Fidelity Central Funds which contain the significant accounting policies (including security valuation policies) of those funds, which are not covered by the Fund's Report of Independent Registered Public Accounting Firm, are available on the SEC web site or upon request.
3. Significant Accounting Policies.
The financial statements have been prepared in conformity with accounting principles generally accepted in the United States of America (GAAP), which require management to make certain estimates and assumptions at the date of the financial statements. Actual results could differ from those estimates. Subsequent events, if any, through the date that the financial statements were issued have been evaluated in the preparation of the financial statements. The following summarizes the significant accounting policies of the Fund:
Security Valuation. Investments are valued as of 4:00 p.m. Eastern time on the last calendar day of the period. In accordance with valuation policies and procedures approved by the Board of Trustees (the Board), the Fund attempts to obtain prices from one or more third party pricing vendor or broker to value its investments. When current market prices, quotations or rates are not readily available or reliable, securities will be
Annual Report
3. Significant Accounting Policies - continued
Security Valuation - continued
fair valued in good faith by the FMR Fair Value Committee (the Committee), in accordance with procedures adopted by the Fund's Board. Factors used in determining fair value vary by security type and may include market or security specific events, changes in interest rates and credit quality. The frequency with which these procedures are used cannot be predicted and they may be utilized to a significant extent. The Committee oversees the Fund's valuation policies and procedures and is responsible for approving and reporting to the Board all fair value determinations.
The Fund categorizes the inputs to valuation techniques used to value its investments into a disclosure hierarchy consisting of three levels as shown below:
Level 1 - quoted prices in active markets for identical investments
Level 2 - other significant observable inputs (including quoted prices for similar investments, interest rates, prepayment speeds, etc.)
Level 3 - unobservable inputs (including the Fund's own assumptions based on the best information available)
Valuation techniques used to value the Fund's investments by major category are as follows:
Equity securities, including restricted securities, for which market quotations are readily available, are valued at the last reported sale price or official closing price as reported by a third party pricing vendor on the primary market or exchange on which they are traded and are categorized as Level 1 in the hierarchy. In the event there were no sales during the day or closing prices are not available, securities are valued at the last quoted bid price or may be valued using the last available price and are generally categorized as Level 2 in the hierarchy. For foreign equity securities, when significant market or security specific events arise, comparisons to the valuation of American Depositary Receipts (ADRs), futures contracts, Exchange-Traded Funds (ETFs) and certain indexes as well as quoted prices for similar securities are used and are categorized as Level 2 in the hierarchy. Utilizing these techniques may result in transfers between Level 1 and Level 2. For restricted equity securities and private placements where observable inputs are limited, assumptions about market activity and risk are used and these securities are categorized as Level 3 in the hierarchy.
Debt securities, including restricted securities, are valued based on evaluated prices received from third party pricing vendors or from brokers who make markets in such securities. For corporate bonds, bank notes, municipal securities and U.S. government and government agency obligations, pricing vendors utilize matrix pricing which considers yield or price of bonds of comparable quality, coupon, maturity and type as well as
Annual Report
Notes to Financial Statements - continued
(Amounts in thousands except percentages)
3. Significant Accounting Policies - continued
Security Valuation - continued
broker-supplied prices and are generally categorized as Level 2 in the hierarchy. For asset backed securities, collateralized mortgage obligations, commercial mortgage securities and U.S. government agency mortgage securities, pricing vendors utilize matrix pricing which considers prepayment speed assumptions, attributes of the collateral, yield or price of bonds of comparable quality, coupon, maturity and type as well as broker-supplied prices and, accordingly, such securities are generally categorized as Level 2 in the hierarchy. Swaps are marked-to-market daily based on valuations from third party pricing vendors or broker-supplied valuations and changes in value are recorded as unrealized appreciation (depreciation). Pricing vendors utilize matrix pricing which considers comparisons to interest rate curves, credit spread curves, default possibilities and recovery rates and, as a result, swaps are generally categorized as Level 2 in the hierarchy. When independent prices are unavailable or unreliable, debt securities and swaps may be valued utilizing pricing methodologies which consider similar factors that would be used by third party pricing vendors. These are generally categorized as Level 2 in the hierarchy but may be Level 3 depending on the circumstances.
Futures contracts are valued at the settlement price established each day by the board of trade or exchange on which they are traded and are categorized as Level 1 in the hierarchy. Investments in open-end mutual funds, including the Fidelity Central Funds, are valued at their closing net asset value each business day and are categorized as Level 1 in the hierarchy.
Changes in valuation techniques may result in transfers in or out of an assigned level within the disclosure hierarchy. The aggregate value of investments by input level, as of August 31, 2012, is included at the end of the Fund's Schedule of Investments.
Foreign Currency Translation. The Fund may use foreign currency contracts to facilitate transactions in foreign-denominated securities. Gains and losses from these transactions may arise from changes in the value of the foreign currency or if the counterparties do not perform under the contracts' terms.
Foreign-denominated assets, including investment securities, and liabilities are translated into U.S. dollars at the exchange rates at period end. Purchases and sales of investment securities, income and dividends received and expenses denominated in foreign currencies are translated into U.S. dollars at the exchange rate in effect on the transaction date.
Annual Report
3. Significant Accounting Policies - continued
Foreign Currency Translation - continued
The effects of exchange rate fluctuations on investments are included with the net realized and unrealized gain (loss) on investment securities. Other foreign currency transactions resulting in realized and unrealized gain (loss) are disclosed separately.
Investment Transactions and Income. For financial reporting purposes, the Fund's investment holdings and NAV include trades executed through the end of the last business day of the period. The NAV per share for processing shareholder transactions is calculated as of the close of business of the New York Stock Exchange (NYSE), normally 4:00 p.m. Eastern time and includes trades executed through the end of the prior business day. Gains and losses on securities sold are determined on the basis of identified cost and may include proceeds received from litigation. Dividend income is recorded on the ex-dividend date, except for certain dividends from foreign securities where the ex-dividend date may have passed, which are recorded as soon as the Fund is informed of the ex-dividend date. Non-cash dividends included in dividend income, if any, are recorded at the fair market value of the securities received. Distributions received on securities that represent a return of capital or capital gain are recorded as a reduction of cost of investments and/or as a realized gain. The Fund estimates the components of distributions received that may be considered return of capital distributions or capital gain distributions. Interest income and distributions from the Fidelity Central Funds are accrued as earned. Interest income includes coupon interest and amortization of premium and accretion of discount on debt securities. The principal amount on inflation-indexed securities is periodically adjusted to the rate of inflation and interest is accrued based on the principal amount. The adjustments to principal due to inflation are reflected as increases or decreases to interest income even though principal is not received until maturity. Investment income is recorded net of foreign taxes withheld where recovery of such taxes is uncertain. Debt obligations may be placed on non-accrual status and related interest income may be reduced by ceasing current accruals and writing off interest receivables when the collection of all or a portion of interest has become doubtful based on consistently applied procedures. A debt obligation is removed from non-accrual status when the issuer resumes interest payments or when collectability of interest is reasonably assured.
Expenses. Expenses directly attributable to a fund are charged to that fund. Expenses attributable to more than one fund are allocated among the respective funds on the basis of relative net assets or other appropriate methods. Expense estimates are accrued in the period to which they relate and adjustments are made when actual amounts are known.
Deferred Trustee Compensation. Under a Deferred Compensation Plan (the Plan), independent Trustees may elect to defer receipt of a portion of their annual compensation. Deferred amounts are invested in a cross-section of Fidelity funds, are
Annual Report
Notes to Financial Statements - continued
(Amounts in thousands except percentages)
3. Significant Accounting Policies - continued
Deferred Trustee Compensation - continued
marked-to-market and remain in the Fund until distributed in accordance with the Plan. The investment of deferred amounts and the offsetting payable to the Trustees are included in the accompanying Statement of Assets and Liabilities.
Income Tax Information and Distributions to Shareholders. Each year, the Fund intends to qualify as a regulated investment company under Subchapter M of the Internal Revenue Code, including distributing substantially all of its taxable income and realized gains. As a result, no provision for income taxes is required. As of August 31, 2012, the Fund did not have any unrecognized tax benefits in the financial statements; nor is the Fund aware of any tax positions for which it is reasonably possible that the total amounts of unrecognized tax benefits will significantly change in the next twelve months. The Fund files a U.S. federal tax return, in addition to state and local tax returns as required. A fund's federal income tax returns are subject to examination by the Internal Revenue Service (IRS) for a period of three fiscal years after they are filed. State and local tax returns may be subject to examination for an additional fiscal year depending on the jurisdiction. Foreign taxes are provided for based on the Fund's understanding of the tax rules and rates that exist in the foreign markets in which it invests.
Distributions are declared and recorded on the ex-dividend date. Income dividends and capital gain distributions are declared separately for each class. Income and capital gain distributions are determined in accordance with income tax regulations, which may differ from GAAP.
Capital accounts within the financial statements are adjusted for permanent book-tax differences. These adjustments have no impact on net assets or the results of operations. Temporary book-tax differences will reverse in a subsequent period.
Book-tax differences are primarily due to futures transactions, swap agreements, foreign currency transactions, passive foreign investment companies (PFIC), prior period premium and discount on debt securities, market discount, partnerships (including allocations from Fidelity Central Funds), deferred trustees compensation, capital loss carryforwards and losses deferred due to wash sales and excise tax regulations.
The federal tax cost of investment securities and unrealized appreciation (depreciation) as of period end were as follows:
Gross unrealized appreciation | $ 2,929,790 |
Gross unrealized depreciation | (276,783) |
Net unrealized appreciation (depreciation) on securities and other investments | $ 2,653,007 |
Tax Cost | $ 18,876,868 |
Annual Report
3. Significant Accounting Policies - continued
Income Tax Information and Distributions to Shareholders - continued
The tax-based components of distributable earnings as of period end were as follows:
Undistributed ordinary income | $ 64,654 |
Capital loss carryforward | $ (409,574) |
Net unrealized appreciation (depreciation) | $ 2,626,534 |
Capital loss carryforwards are only available to offset future capital gains of the Fund to the extent provided by regulations and may be limited. Under the Regulated Investment Company Modernization Act of 2010 (the Act), the Fund is permitted to carry forward capital losses incurred in taxable years beginning after December 22, 2010 for an unlimited period and such capital losses are required to be used prior to any losses that expire. Capital loss carryforwards were as follows:
Fiscal year of expiration | |
| |
2018 | $ (409,574) |
The Fund intends to elect to defer to its fiscal year ending August 31, 2013 approximately $228,149 of capital losses recognized during the period November 1, 2011 to August 31, 2012.
The tax character of distributions paid was as follows:
| August 31, 2012 | August 31, 2011 |
Ordinary Income | $ 379,925 | $ 419,997 |
New Accounting Pronouncement. In December 2011, the Financial Accounting Standards Board issued Accounting Standard Update No. 2011-11, Disclosures about Offsetting Assets and Liabilities. The update creates new disclosure requirements requiring entities to disclose both gross and net information for derivatives and other financial instruments that are either offset in the Statement of Assets and Liabilities or subject to an enforceable master netting arrangement or similar agreement. The disclosure requirements are effective for annual reporting periods beginning on or after January 1, 2013, and interim periods within those annual periods. Management is currently evaluating the impact of the update's adoption on the Fund's financial statement disclosures.
4. Operating Policies.
Delayed Delivery Transactions and When-Issued Securities. During the period, the Fund transacted in securities on a delayed delivery or when-issued basis. Payment
Annual Report
Notes to Financial Statements - continued
(Amounts in thousands except percentages)
4. Operating Policies - continued
Delayed Delivery Transactions and When-Issued Securities - continued
and delivery may take place after the customary settlement period for that security. The price of the underlying securities and the date when the securities will be delivered and paid for are fixed at the time the transaction is negotiated. The securities purchased on a delayed delivery or when-issued basis are identified as such in the Fund's Schedule of Investments. The Fund may receive compensation for interest forgone in the purchase of a delayed delivery or when-issued security. With respect to purchase commitments, the Fund identifies securities as segregated in its records with a value at least equal to the amount of the commitment. Losses may arise due to changes in the value of the underlying securities or if the counterparty does not perform under the contract's terms, or if the issuer does not issue the securities due to political, economic, or other factors.
To-Be-Announced (TBA) Securities and Mortgage Dollar Rolls. During the period, the Fund transacted in TBA securities that involved buying or selling mortgage-backed securities (MBS) on a forward commitment basis. A TBA transaction typically does not designate the actual security to be delivered and only includes an approximate principal amount however; delivered securities must meet specified terms defined by industry guidelines, including issuer, rate and current principal amount outstanding on underlying mortgage pools. The Fund may enter into a TBA transaction with the intent to take possession of or deliver the underlying MBS, or the Fund may elect to extend the settlement by entering into either a mortgage or reverse mortgage dollar roll. Mortgage dollar rolls are transactions where a fund sells TBA securities and simultaneously agrees to repurchase MBS on a later date at a lower price and with the same counterparty. Reverse mortgage dollar rolls involve the purchase and simultaneous agreement to sell TBA securities on a later date at a lower price. Transactions in mortgage dollar rolls and reverse mortgage dollar rolls are accounted for as purchases and sales and may result in an increase to the Fund's portfolio turnover rate.
Purchases and sales of TBA securities involve risks similar to those discussed above for delayed delivery and when-issued securities. Also, if the counterparty in a mortgage dollar roll or a reverse mortgage dollar roll transaction files for bankruptcy or becomes insolvent, the Fund's right to repurchase or sell securities may be limited. Additionally, when a fund sells TBA securities without already owning or having the right to obtain the deliverable securities (an uncovered forward commitment to sell), it incurs a risk of loss because it could have to purchase the securities at a price that is higher than the price at which it sold them. A fund may be unable to purchase the deliverable securities if the corresponding market is illiquid.
TBA securities subject to a forward commitment to sell at period end are included at the end of the Fund's Schedule of Investments under the caption "TBA Sale Commitments." The proceeds and value of these commitments are reflected in the Fund's Statement of Assets and Liabilities.
Annual Report
4. Operating Policies - continued
Restricted Securities. The Fund may invest in securities that are subject to legal or contractual restrictions on resale. These securities generally may be resold in transactions exempt from registration or to the public if the securities are registered. Disposal of these securities may involve time-consuming negotiations and expense, and prompt sale at an acceptable price may be difficult. Information regarding restricted securities is included at the end of the Fund's Schedule of Investments.
5. Derivative Instruments.
Risk Exposures and the Use of Derivative Instruments. The Fund's investment objective allows the Fund to enter into various types of derivative contracts, including futures contracts and swap agreements. Derivatives are investments whose value is primarily derived from underlying assets, indices or reference rates and may be transacted on an exchange or over-the-counter (OTC). Derivatives may involve a future commitment to buy or sell a specified instrument based on specified terms, to exchange future cash flows at periodic intervals based on a notional principal amount, or for one party to make one or more payments upon the occurrence of specified events in exchange for periodic payments from the other party.
The Fund used derivatives to increase returns, to gain exposure to certain types of assets and to manage exposure to certain risks as defined below. The success of any strategy involving derivatives depends on analysis of numerous economic factors, and if the strategies for investment do not work as intended, the Fund may not achieve its objectives.
The Fund's use of derivatives increased or decreased its exposure to the following risks:
Credit Risk | Credit risk relates to the ability of the issuer of a financial instrument to make further principal or interest payments on an obligation or commitment that it has to the Fund. |
Equity Risk | Equity risk relates to the fluctuations in the value of financial instruments as a result of changes in market prices (other than those arising from interest rate risk or foreign exchange risk), whether caused by factors specific to an individual investment, its issuer, or all factors affecting all instruments traded in a market or market segment. |
The Fund is also exposed to additional risks from investing in derivatives, such as liquidity risk and counterparty credit risk. Liquidity risk is the risk that the Fund will be unable to close out the derivative in the open market in a timely manner. Counterparty credit risk is the risk that the counterparty will not be able to fulfill its obligation to the Fund. Derivative counterparty credit risk is managed through formal evaluation of the creditworthiness of all potential counterparties. On certain OTC derivatives such as swap
Annual Report
Notes to Financial Statements - continued
(Amounts in thousands except percentages)
5. Derivative Instruments - continued
Risk Exposures and the Use of Derivative Instruments - continued
transactions, the Fund attempts to reduce its exposure to counterparty credit risk by entering into an International Swaps and Derivatives Association, Inc. (ISDA) Master Agreement on a bilateral basis with each of its counterparties. The ISDA Master Agreement gives the Fund the right to terminate all transactions traded under such agreement upon the deterioration in the credit quality of the counterparty beyond specified levels. The ISDA Master Agreement gives each party the right, upon an event of default by the other party or a termination of the agreement, to close out all transactions traded under such agreement and to net amounts owed under each transaction to one net payable by one party to the other. To mitigate counterparty credit risk on OTC derivatives, the Fund receives collateral in the form of cash or securities once the Fund's net unrealized appreciation on outstanding derivative contracts under an ISDA Master Agreement exceeds certain applicable thresholds, subject to certain minimum transfer provisions. The collateral received is held in segregated accounts with the Fund's custodian bank in accordance with the collateral agreements entered into between the Fund, the counterparty and the Fund's custodian bank. The Fund could experience delays and costs in gaining access to the collateral even though it is held by the Fund's custodian bank. The Fund's maximum risk of loss from counterparty credit risk related to OTC derivatives is generally the aggregate unrealized appreciation and unpaid counterparty payments in excess of any collateral pledged by the counterparty to the Fund. The Fund may be required to pledge collateral for the benefit of the counterparties on OTC derivatives in an amount not less than each counterparty's unrealized appreciation on outstanding derivative contracts, subject to certain minimum transfer provisions, and any such pledged collateral is identified in the Schedule of Investments. Exchange-traded futures contracts are not covered by the ISDA Master Agreement; however counterparty credit risk related to exchange-traded futures contracts is minimal because of the protection provided by the exchange on which they trade.
Investing in derivatives may involve greater risks than investing in the underlying assets directly and, to varying degrees, may involve risk of loss in excess of any initial investment and collateral received and amounts recognized in the Statement of Assets and Liabilities. In addition, there may be the risk that the change in value of the derivative contract does not correspond to the change in value of the underlying instrument.
Net Realized Gain (Loss) and Change in Net Unrealized Appreciation (Depreciation) on Derivatives. The table below, which reflects the impacts of derivatives on the financial performance of the Fund, summarizes the net realized gain (loss) and
Annual Report
5. Derivative Instruments - continued
Net Realized Gain (Loss) and Change in Net Unrealized Appreciation (Depreciation) on Derivatives - continued
change in net unrealized appreciation (depreciation) for derivatives during the period as shown in the Statement of Operations.
Primary Risk Exposure / Derivative Type | Net Realized
Gain (Loss) | Change in Net Unrealized Appreciation (Depreciation) |
Credit Risk | | |
Swap Agreements | $ (16,533) | $ 15,494 |
Equity Risk | | |
Futures Contracts | 8,596 | 8,583 |
Totals (a) | $ (7,937) | $ 24,077 |
(a) A summary of the value of derivatives by primary risk exposure as of period end is included at the end of the Schedule of Investments and is
representative of activity for the period
Futures Contracts. A futures contract is an agreement between two parties to buy or sell a specified underlying instrument for a fixed price at a specified future date. The Fund used futures contracts to manage its exposure to the stock market.
Upon entering into a futures contract, a fund is required to deposit either cash or securities (initial margin) with a clearing broker in an amount equal to a certain percentage of the face value of the contract. Futures contracts are marked-to-market daily and subsequent payments (variation margin) are made or received by a fund depending on the daily fluctuations in the value of the futures contracts and are recorded as unrealized appreciation or (depreciation). This receivable and/or payable is included in daily variation margin on futures contracts in the Statement of Assets and Liabilities. Realized gain or (loss) is recorded upon the expiration or closing of a futures contract. The net realized gain (loss) and change in net unrealized appreciation (depreciation) on futures contracts during the period is included in the Statement of Operations.
Any open futures contracts at period end are shown in the Schedule of Investments under the caption "Futures Contracts." The underlying face amount at value reflects each contract's exposure to the underlying instrument at period end and is representative of activity for the period. Securities deposited to meet initial margin requirements are identified in the Schedule of Investments.
Swap Agreements. A swap agreement (swap) is a contract between two parties to exchange future cash flows at periodic intervals based on a notional principal amount.
Swaps are marked-to-market daily and changes in value are reflected in the Statement of Assets and Liabilities in the swap agreements at value line items. Any upfront premiums paid or received upon entering a swap to compensate for differences between stated
Annual Report
Notes to Financial Statements - continued
(Amounts in thousands except percentages)
5. Derivative Instruments - continued
Swap Agreements - continued
terms of the agreement and prevailing market conditions (e.g. credit spreads, interest rates or other factors) are recorded as realized gain or (loss) ratably over the term of the swap. Any unamortized upfront premiums are included in net unrealized appreciation (depreciation) in the Statement of Assets and Liabilities. Payments are exchanged at specified intervals, accrued daily commencing with the effective date of the contract and recorded as realized gain or (loss). Realized gain or (loss) is also recorded in the event of an early termination of a swap. The net realized gain (loss) and change in net unrealized appreciation (depreciation) on swaps during the period is included in the Statement of Operations.
Any open swaps at period end are included in the Schedule of Investments under the caption "Swap Agreements."
Credit Default Swaps. Credit default swaps enable the Fund to buy or sell protection against specified credit events on a single-name issuer or a traded credit index. Under the terms of a credit default swap the buyer of protection (buyer) receives credit protection in exchange for making periodic payments to the seller of protection (seller) based on a fixed percentage applied to a notional principal amount. In return for these payments, the seller acts as a guarantor of the creditworthiness of a reference obligation and will be required to make a payment upon the occurrence of one or more specified credit events. The Fund enters into credit default swaps as a seller to gain credit exposure to an issuer and/or as a buyer to obtain a measure of protection against defaults of an issuer. Periodic payments are made over the life of the contract by the buyer provided that no credit event occurs.
For credit default swaps on most corporate and sovereign issuers, credit events include bankruptcy, failure to pay or repudiation/moratorium. For credit default swaps on corporate or sovereign issuers, the obligation that may be put to the seller is not limited to the specific reference obligation described in the Schedule of Investments. For credit default swaps on asset-backed securities, a credit event may be triggered by events such as failure to pay principal, maturity extension, rating downgrade or write-down. For credit default swaps on asset-backed securities, the reference obligation described represents the security that may be put to the seller. For credit default swaps on a traded credit index, a specified credit event may affect all or individual underlying securities included in the index.
As a seller, if an underlying credit event occurs, the Fund will pay a net settlement amount of cash equal to the notional amount of the swap less the recovery value of the reference obligation or underlying securities comprising an index. Only in the event of the industry's inability to value the underlying asset will the Fund be required to take
Annual Report
5. Derivative Instruments - continued
Credit Default Swaps - continued
delivery of the reference obligation or underlying securities comprising an index and pay an amount equal to the notional amount of the swap.
As a buyer, if an underlying credit event occurs, the Fund will receive a net settlement amount of cash equal to the notional amount of the swap less the recovery value of the reference obligation or underlying securities comprising an index. Only in the event of the industry's inability to value the underlying asset will the Fund be required to deliver the reference obligation or underlying securities comprising an index in exchange for payment of an amount equal to the notional amount of the swap.
Typically, the value of each credit default swap and credit rating disclosed for each reference obligation in the Schedule of Investments, where the Fund is the seller, can be used as measures of the current payment/performance risk of the swap. As the value of the swap changes as a positive or negative percentage of the total notional amount, the payment/performance risk may decrease or increase, respectively. In addition to these measures, FMR monitors a variety of factors including cash flow assumptions, market activity and market sentiment as part of its ongoing process of assessing payment/performance risk.
6. Purchases and Sales of Investments.
Purchases and sales of securities (including the Fixed-Income Central Funds), other than short-term securities and U.S. government securities, aggregated $14,332,476 and $13,867,469, respectively.
7. Fees and Other Transactions with Affiliates.
Management Fee. FMR and its affiliates provide the Fund with investment management related services for which the Fund pays a monthly management fee. The management fee is the sum of an individual fund fee rate that is based on an annual rate of .15% of the Fund's average net assets and an annualized group fee rate that averaged .26% during the period. The group fee rate is based upon the average net assets of all the mutual funds advised by FMR. The group fee rate decreases as assets under management increase and increases as assets under management decrease. For the period, the total annual management fee rate was .41% of the Fund's average net assets.
Annual Report
Notes to Financial Statements - continued
(Amounts in thousands except percentages)
7. Fees and Other Transactions with Affiliates - continued
Transfer Agent Fees. Fidelity Investments Institutional Operations Company, Inc. (FIIOC), an affiliate of FMR, is the transfer, dividend disbursing and shareholder servicing agent for each class of the Fund. FIIOC receives account fees and asset-based fees that vary according to the account size and type of account of the shareholders of Balanced. FIIOC receives an asset-based fee of Class K's average net assets. FIIOC pays for typesetting, printing and mailing of shareholder reports, except proxy statements. For the period, transfer agent fees for each class were as follows:
| Amount | % of
Average
Net Assets |
Balanced | $ 25,838 | .17 |
Class K | 2,543 | .05 |
| $ 28,381 | |
Accounting and Security Lending Fees. Fidelity Service Company, Inc. (FSC), an affiliate of FMR, maintains the Fund's accounting records. The accounting fee is based on the level of average net assets for each month. Under a separate contract, FSC administers the security lending program. The security lending fee is based on the number and duration of lending transactions.
Brokerage Commissions. The Fund placed a portion of its portfolio transactions with brokerage firms which are affiliates of the investment adviser. The commissions paid to these affiliated firms were $425 for the period.
8. Committed Line of Credit.
The Fund participates with other funds managed by FMR or an affiliate in a $4.25 billion credit facility (the "line of credit") to be utilized for temporary or emergency purposes to fund shareholder redemptions or for other short-term liquidity purposes. The Fund has agreed to pay commitment fees on its pro-rata portion of the line of credit, which amounted to $57 and is reflected in Miscellaneous expenses on the Statement of Operations. During the period, there were no borrowings on this line of credit.
9. Security Lending.
The Fund lends portfolio securities from time to time in order to earn additional income. For equity securities, a lending agent is used and may loan securities to certain qualified borrowers, including Fidelity Capital Markets (FCM), a broker-dealer affiliated with the Fund. On the settlement date of the loan, the Fund receives collateral (in the form of U.S. Treasury obligations, letters of credit and/or cash) against the loaned securities and maintains collateral in an amount not less than 100% of the market value of the loaned
Annual Report
9. Security Lending - continued
securities during the period of the loan. The market value of the loaned securities is determined at the close of business of the Fund and any additional required collateral is delivered to the Fund on the next business day. If the borrower defaults on its obligation to return the securities loaned because of insolvency or other reasons, a fund could experience delays and costs in recovering the securities loaned or in gaining access to the collateral. Any cash collateral received is maintained at the Fund's custodian and/or invested in cash equivalents and/or the Fidelity Securities Lending Cash Central Fund. The value of loaned securities at period end is disclosed on the Fund's Statement of Assets and Liabilities. The value of securities loaned to FCM at period ended was $370. Security lending income represents the income earned on investing cash collateral, less rebates paid to borrowers and any lending agent fees associated with the loan, plus any premium payments received for lending certain types of securities. Total security lending income during the period, presented in the Statement of Operations as a component of interest income, amounted to $91. Net income from the Fidelity Securities Lending Cash Central Fund during the period, presented in the Statement of Operations as a component of income from Fidelity Central Funds, amounted to $1,552 (including $38 from securities loaned to FCM).
10. Expense Reductions.
Many of the brokers with whom FMR places trades on behalf of the Fund provided services to the Fund in addition to trade execution. These services included payments of certain expenses on behalf of the Fund totaling $836 for the period. In addition, through arrangements with the Fund's custodian credits realized as a result of uninvested cash balances were used to reduce the Fund's expenses. During the period, these credits reduced the Fund's custody expenses by $9.
11. Distributions to Shareholders.
Distributions to shareholders of each class were as follows:
Years ended August 31, | 2012 | 2011 |
From net investment income | | |
Balanced | $ 281,775 | $ 328,396 |
Class K | 98,150 | 82,194 |
Total | $ 379,925 | $ 410,590 |
From net realized gain | | |
Balanced | $ - | $ 7,916 |
Class K | - | 1,491 |
Total | $ - | $ 9,407 |
Annual Report
Notes to Financial Statements - continued
(Amounts in thousands except percentages)
12. Share Transactions.
Transactions for each class of shares were as follows:
| Shares | Dollars |
Years ended August 31, | 2012 | 2011 | 2012 | 2011 |
Balanced | | | | |
Shares sold | 101,057 | 117,364 | $ 1,914,819 | $ 2,150,235 |
Reinvestment of distributions | 14,566 | 17,788 | 271,000 | 325,354 |
Shares redeemed | (221,553) | (307,092) | (4,157,808) | (5,576,894) |
Net increase (decrease) | (105,930) | (171,940) | $ (1,971,989) | $ (3,101,305) |
Class K | | | | |
Shares sold | 117,984 | 127,669 | $ 2,217,745 | $ 2,316,418 |
Reinvestment of distributions | 5,255 | 4,546 | 98,150 | 83,685 |
Shares redeemed | (68,166) | (71,990) | (1,291,730) | (1,317,183) |
Net increase (decrease) | 55,073 | 60,225 | $ 1,024,165 | $ 1,082,920 |
13. Other.
The Fund's organizational documents provide former and current trustees and officers with a limited indemnification against liabilities arising in connection with the performance of their duties to the Fund. In the normal course of business, the Fund may also enter into contracts that provide general indemnifications. The Fund's maximum exposure under these arrangements is unknown as this would be dependent on future claims that may be made against the Fund. The risk of material loss from such claims is considered remote.
Annual Report
To the Trustees of Fidelity Puritan Trust and the Shareholders of Fidelity Balanced Fund:
In our opinion, the accompanying statement of assets and liabilities, including the schedule of investments, and the related statements of operations and of changes in net assets and the financial highlights present fairly, in all material respects, the financial position of Fidelity Balanced Fund (a fund of Fidelity Puritan Trust) at August 31, 2012, the results of its operations for the year then ended, the changes in its net assets for each of the two years in the period then ended and the financial highlights for each of the periods indicated, in conformity with accounting principles generally accepted in the United States of America. These financial statements and financial highlights (hereafter referred to as "financial statements") are the responsibility of the Fidelity Balanced Fund's management. Our responsibility is to express an opinion on these financial statements based on our audits. We conducted our audits of these financial statements in accordance with the standards of the Public Company Accounting Oversight Board (United States). Those standards require that we plan and perform the audit to obtain reasonable assurance about whether the financial statements are free of material misstatement. An audit includes examining, on a test basis, evidence supporting the amounts and disclosures in the financial statements, assessing the accounting principles used and significant estimates made by management, and evaluating the overall financial statement presentation. We believe that our audits, which included confirmation of securities at August 31, 2012 by correspondence with the custodian and brokers, provide a reasonable basis for our opinion.
PricewaterhouseCoopers LLP
Boston, Massachusetts
October 18, 2012
Annual Report
The Trustees, Members of the Advisory Board, and executive officers of the trust and fund, as applicable, are listed below. The Board of Trustees governs the fund and is responsible for protecting the interests of shareholders. The Trustees are experienced executives who meet periodically throughout the year to oversee the fund's activities, review contractual arrangements with companies that provide services to the fund, oversee management of the risks associated with such activities and contractual arrangements, and review the fund's performance. Except for James C. Curvey, each of the Trustees oversees 228 funds advised by FMR or an affiliate. Mr. Curvey oversees 435 funds advised by FMR or an affiliate.
The Trustees hold office without limit in time except that (a) any Trustee may resign; (b) any Trustee may be removed by written instrument, signed by at least two-thirds of the number of Trustees prior to such removal; (c) any Trustee who requests to be retired or who has become incapacitated by illness or injury may be retired by written instrument signed by a majority of the other Trustees; and (d) any Trustee may be removed at any special meeting of shareholders by a two-thirds vote of the outstanding voting securities of the trust. Each Trustee who is not an interested person (as defined in the 1940 Act) (Independent Trustee), shall retire not later than the last day of the calendar year in which his or her 75th birthday occurs. The Independent Trustees may waive this mandatory retirement age policy with respect to individual Trustees. The executive officers and Advisory Board Members hold office without limit in time, except that any officer and Advisory Board Member may resign or may be removed by a vote of a majority of the Trustees at any regular meeting or any special meeting of the Trustees. Except as indicated, each individual has held the office shown or other offices in the same company for the past five years.
Experience, Skills, Attributes, and Qualifications of the Fund's Trustees. The Governance and Nominating Committee has adopted a statement of policy that describes the experience, qualifications, attributes, and skills that are necessary and desirable for potential Independent Trustee candidates (Statement of Policy). The Board believes that each Trustee satisfied at the time he or she was initially elected or appointed a Trustee, and continues to satisfy, the standards contemplated by the Statement of Policy. The Governance and Nominating Committee also engages professional search firms to help identify potential Independent Trustee candidates who have the experience, qualifications, attributes, and skills consistent with the Statement of Policy. From time to time, additional criteria based on the composition and skills of the current Independent Trustees, as well as experience or skills that may be appropriate in light of future changes to board composition, business conditions, and regulatory or other developments, have also been considered by the professional search firms and the Governance and Nominating Committee. In addition, the Board takes into account the Trustees' commitment and participation in Board and committee meetings, as well as their leadership of standing and ad hoc committees throughout their tenure.
In determining that a particular Trustee was and continues to be qualified to serve as a Trustee, the Board has considered a variety of criteria, none of which, in isolation, was controlling. The Board believes that, collectively, the Trustees have balanced and diverse experience, qualifications, attributes, and skills, which allow the Board to operate effectively in governing the fund and protecting the interests of shareholders. Information about the specific experience, skills, attributes, and qualifications of each Trustee, which in each case led to the Board's conclusion that the Trustee should serve (or continue to serve) as a trustee of the fund, is provided below.
Annual Report
Trustees and Officers - continued
Board Structure and Oversight Function. James C. Curvey is an interested person (as defined in the 1940 Act) and currently serves as Chairman. The Trustees have determined that an interested Chairman is appropriate and benefits shareholders because an interested Chairman has a personal and professional stake in the quality and continuity of services provided to the fund. Independent Trustees exercise their informed business judgment to appoint an individual of their choosing to serve as Chairman, regardless of whether the Trustee happens to be independent or a member of management. The Independent Trustees have determined that they can act independently and effectively without having an Independent Trustee serve as Chairman and that a key structural component for assuring that they are in a position to do so is for the Independent Trustees to constitute a substantial majority for the Board. The Independent Trustees also regularly meet in executive session. Ned C. Lautenbach serves as Chairman of the Independent Trustees and as such (i) acts as a liaison between the Independent Trustees and management with respect to matters important to the Independent Trustees and (ii) with management prepares agendas for Board meetings.
Fidelity funds are overseen by different Boards of Trustees. The fund's Board oversees Fidelity's equity and high income funds and another Board oversees Fidelity's investment-grade bond, money market, and asset allocation funds. The asset allocation funds may invest in Fidelity funds overseen by the fund's Board. The use of separate Boards, each with its own committee structure, allows the Trustees of each group of Fidelity funds to focus on the unique issues of the funds they oversee, including common research, investment, and operational issues. On occasion, the separate Boards establish joint committees to address issues of overlapping consequences for the Fidelity funds overseen by each Board.
The Trustees operate using a system of committees to facilitate the timely and efficient consideration of all matters of importance to the Trustees, the fund, and fund shareholders and to facilitate compliance with legal and regulatory requirements and oversight of the fund's activities and associated risks. The Board, acting through its committees, has charged FMR and its affiliates with (i) identifying events or circumstances the occurrence of which could have demonstrably adverse effects on the fund's business and/or reputation; (ii) implementing processes and controls to lessen the possibility that such events or circumstances occur or to mitigate the effects of such events or circumstances if they do occur; and (iii) creating and maintaining a system designed to evaluate continuously business and market conditions in order to facilitate the identification and implementation processes described in (i) and (ii) above. Because the day-to-day operations and activities of the fund are carried out by or through FMR, its affiliates and other service providers, the fund'sexposure to risks is mitigated but not eliminated by the processes overseen by the Trustees. While each of the Board's committees has responsibility for overseeing different aspects of the fund's activities, oversight is exercised primarily through the Operations, Audit, and Compliance Committees. In addition, the Independent Trustees have worked with FMR to enhance the Board's oversight of investment and financial risks, legal and regulatory risks, technology risks, and operational risks, including the development of additional risk reporting to the Board. For example, a working group comprised of Independent Trustees and FMR has worked and continues to work to review the Fidelity funds' valuation-related activities, reporting and risk management. Appropriate personnel, including but not limited to the fund's Chief Compliance Officer (CCO), FMR's internal auditor, the independent accountants, the fund's Treasurer and portfolio management personnel, make periodic reports to the Board's committees, as appropriate, including an annual review of FMR's risk management program for the Fidelity funds. The responsibilities of each standing committee, including their oversight responsibilities, are described further under "Standing Committees of the Fund's Trustees."
Annual Report
The fund's Statement of Additional Information (SAI) includes more information about the Trustees. To request a free copy, call Fidelity at 1-800-835-5092.
Interested Trustees*:
Correspondence intended for each Trustee who is an interested person may be sent to Fidelity Investments, 82 Devonshire Street, Boston, Massachusetts 02109.
Name, Age; Principal Occupations and Other Relevant Experience+ |
James C. Curvey (77) |
| Year of Election or Appointment: 2007 Mr. Curvey is Trustee and Chairman of the Board of Trustees of certain Trusts. Mr. Curvey also serves as Trustee (2007-present) of other investment companies advised by FMR. Mr. Curvey is a Director of Fidelity Investments Money Management, Inc. (2009-present), Director of Fidelity Research & Analysis Co. (2009-present) and Director of FMR and FMR Co., Inc. (2007-present). Mr. Curvey is also Vice Chairman (2007-present) and Director of FMR LLC. In addition, Mr. Curvey serves as an Overseer for the Boston Symphony Orchestra and a member of the Trustees of Villanova University. Previously, Mr. Curvey was the Vice Chairman (2006-2007) and Director (2000-2007) of FMR Corp. |
Ronald P. O'Hanley (55) |
| Year of Election or Appointment: 2011 Mr. O'Hanley is Director of FMR Co., Inc. (2010-present), Director of Fidelity Investments Money Management, Inc. (2010-present), Director of Fidelity Research & Analysis Company (2010-present), President of Fidelity Asset Management and Corporate Services and a member of Fidelity's Executive Committee (2010-present). Previously, Mr. O'Hanley served as President and Chief Executive Officer of BNY Mellon Asset Management (2007-2010). Mr. O'Hanley also served as Vice Chairman of Bank New York Mellon Corp. and a member of that firm's Executive Committee. Prior to the 2007 merger of The Bank of New York and Mellon Financial Corporation, he was Vice Chairman of Mellon Financial Corporation and President and Chief Executive Officer of Mellon Asset Management. He joined Mellon in February 1997. Mr. O'Hanley currently serves as Chairman of the Boston Public Library Foundation Board of Directors and sits on the Board of Directors of Beth Israel Deaconess Medical Center, the Board of Trustees of the Marine Biological Laboratory and the Advisory Board of the Maxwell School of Citizenship and Public Administration at Syracuse University. Mr. O'Hanley also chairs the Council on Asset Management for the Financial Services Roundtable and is a member of the Board of Directors of Institutional Investor's U.S. Institute. |
* Trustees have been determined to be "Interested Trustees" by virtue of, among other things, their affiliation with the trust or various entities under common control with FMR.
+ The information above includes each Trustee's principal occupation during the last five years and other information relating to the experience, attributes, and skills relevant to each Trustee's qualifications to serve as a Trustee, which led to the conclusion that each Trustee should serve as a Trustee for the fund.
Annual Report
Independent Trustees:
Correspondence intended for each Independent Trustee (that is, the Trustees other than the Interested Trustees) may be sent to Fidelity Investments, P.O. Box 55235, Boston, Massachusetts 02205-5235.
Name, Age; Principal Occupations and Other Relevant Experience+ |
Dennis J. Dirks (64) |
| Year of Election or Appointment: 2005 Prior to his retirement in May 2003, Mr. Dirks was Chief Operating Officer and a member of the Board of The Depository Trust & Clearing Corporation (DTCC). He also served as President, Chief Operating Officer, and Board member of The Depository Trust Company (DTC) and President and Board member of the National Securities Clearing Corporation (NSCC). In addition, Mr. Dirks served as Chief Executive Officer and Board member of the Government Securities Clearing Corporation, Chief Executive Officer and Board member of the Mortgage-Backed Securities Clearing Corporation, as a Trustee and a member of the Finance Committee of Manhattan College (2005-2008), and as a Trustee and a member of the Finance Committee of AHRC of Nassau County (2006-2008). Mr. Dirks is a member of the Independent Directors Council (IDC) Governing Council (2010-present) and Board of Directors for The Brookville Center for Children's Services, Inc. (2009-present). |
Alan J. Lacy (58) |
| Year of Election or Appointment: 2008 Mr. Lacy serves as Senior Adviser (2007-present) of Oak Hill Capital Partners, L.P. (private equity). Mr. Lacy also served as Chief Executive Officer (2000-2005) and Vice Chairman (2005-2006) of Sears Holdings Corporation and Sears, Roebuck and Co. (retail). In addition, Mr. Lacy serves as a member of the Board of Directors of Dave & Buster's Entertainment, Inc. (restaurant and entertainment complexes, 2010-present), Earth Fare, Inc. (retail grocery, 2012-present), The Hillman Companies, Inc. (hardware wholesalers, 2010-present), and Bristol-Myers Squibb Company (global pharmaceuticals, 2008-present). Mr. Lacy is a member of the Board of Trustees of The National Parks Conservation Association (2006-present). Previously, Mr. Lacy served as Chairman of the Board of Trustees of the National Parks Conservation Association (2008-2011) and as a member of the Board of Directors for the Western Union Company (global money transfer, 2006-2011). |
Ned C. Lautenbach (68) |
| Year of Election or Appointment: 2000 Mr. Lautenbach is Chairman of the Independent Trustees of the Equity and High Income Funds (2006-present). Mr. Lautenbach currently serves as the Lead Director of the Eaton Corporation Board of Directors (diversified industrial, 1997-present). Mr. Lautenbach is Chairman of the Board of Directors of the Philharmonic Center for the Arts in Naples, Florida (2012-present) and a member of the Council on Foreign Relations (1994-present). Previously, Mr. Lautenbach was a Partner/Advisory Partner at Clayton, Dubilier & Rice, LLC (private equity investment, 1998-2010), as well as a Director of Sony Corporation (2006-2007). |
Joseph Mauriello (67) |
| Year of Election or Appointment: 2008 Prior to his retirement in January 2006, Mr. Mauriello served in numerous senior management positions including Deputy Chairman and Chief Operating Officer (2004-2005), and Vice Chairman of Financial Services (2002-2004) of KPMG LLP US (professional services, 1965-2005). Mr. Mauriello currently serves as a member of the Board of Directors of XL Group plc. (global insurance and re-insurance, 2006-present). Previously, Mr. Mauriello served as a Director of the Hamilton Funds of the Bank of New York (2006-2007) and of Arcadia Resources Inc. (health care services and products, 2007-2012). |
Robert W. Selander (61) |
| Year of Election or Appointment: 2011 Previously, Mr. Selander served as a Member of the Advisory Board of Fidelity's Equity and High Income Funds (2011), Executive Vice Chairman (2010), Chief Executive Officer (2009-2010), and President and Chief Executive Officer (1997-2009) of Mastercard, Inc. |
Cornelia M. Small (68) |
| Year of Election or Appointment: 2005 Ms. Small is a member of the Board of Directors (2009-present) and Chair of the Investment Committee (2010-present) of the Teagle Foundation. Ms. Small also serves on the Investment Committee of the Berkshire Taconic Community Foundation (2008-present). Previously, Ms. Small served as Chairperson (2002-2008) and a member of the Investment Committee and Chairperson (2008-2012) and a member of the Board of Trustees of Smith College. In addition, Ms. Small served as Chief Investment Officer, Director of Global Equity Investments, and a member of the Board of Directors of Scudder, Stevens & Clark and Scudder Kemper Investments. |
William S. Stavropoulos (73) |
| Year of Election or Appointment: 2001 Mr. Stavropoulos is Vice Chairman of the Independent Trustees of the Equity and High Income Funds (2006-present). Mr. Stavropoulos serves as President and Founder of the Michigan Baseball Foundation, the Great Lakes Loons (2007-present). Mr. Stavropoulos is Chairman Emeritus of the Board of Directors of The Dow Chemical Company, where he previously served in numerous senior management positions, including President, CEO (1995-2000; 2002-2004), Chairman of the Executive Committee (2000-2006), and as a member of the Board of Directors (1990-2006). Currently, Mr. Stavropoulos is a Director of Univar Inc. (global distributor of commodity and specialty chemicals, Chairman from 2010-May 2012 and Lead Director from May 2012-present), Teradata Corporation (data warehousing and technology solutions, 2008-present), Maersk Inc. (industrial conglomerate), and Tyco International, Ltd. (multinational manufacturing and services, 2007-present), and a member of the Advisory Board for Metalmark Capital LLC (private equity investment, 2005-present). Mr. Stavropoulos is an operating advisor to Clayton, Dubilier & Rice, LLC (private equity investment). In addition, Mr. Stavropoulos is a member of the University of Notre Dame Advisory Council for the College of Science, a Trustee of the Rollin L. Gerstacker Foundation, and a Director of the Naples Philharmonic Center for the Arts. Previously, Mr. Stavropoulos served as a Director of Chemical Financial Corporation (bank holding company, 1993-2012). |
David M. Thomas (63) |
| Year of Election or Appointment: 2008 Previously, Mr. Thomas served as Executive Chairman (2005-2006) and Chairman and Chief Executive Officer (2000-2005) of IMS Health, Inc. (pharmaceutical and healthcare information solutions), and a Director of Fortune Brands, Inc. (consumer products, 2000-2011). In addition, Mr. Thomas serves as Non-Executive Chairman of the Board of Directors of Fortune Brands Home and Security (home and security products, 2011-present), and as a member of the Board of Directors of Interpublic Group of Companies, Inc. (marketing communication, 2004-present). |
Michael E. Wiley (61) |
| Year of Election or Appointment: 2008 Mr. Wiley also serves as a Director of Asia Pacific Exploration Consolidated (international oil and gas exploration and production, 2008-present). Mr. Wiley serves as a Director of Tesoro Corporation (independent oil refiner and marketer, 2005-present), and a Director of Bill Barrett Corporation (exploration and production, 2005-present). In addition, Mr. Wiley also serves as a Director of Post Oak Bank (privately-held bank, 2004-present). Previously, Mr. Wiley served as a member of the Board of Trustees of the University of Tulsa (2000-2006; 2007-2010), as a Senior Energy Advisor of Katzenbach Partners, LLC (consulting, 2006-2007), as an Advisory Director of Riverstone Holdings (private investment), Chairman, President, and CEO of Baker Hughes, Inc. (oilfield services, 2000-2004), and as Director of Spinnaker Exploration Company (exploration and production, 2001-2005). |
+ The information above includes each Trustee's principal occupation during the last five years and other information relating to the experience, attributes, and skills relevant to each Trustee's qualifications to serve as a Trustee, which led to the conclusion that each Trustee should serve as a Trustee for the fund.
Advisory Board Members and Executive Officers:
Correspondence intended for David A. Rosow and Garnett A. Smith may be sent to Fidelity Investments, P.O. Box 55235, Boston, Massachusetts 02205-5235. Correspondence intended for each executive officer, Edward C. Johnson 3d, and Peter S. Lynch may be sent to Fidelity Investments, 82 Devonshire Street, Boston, Massachusetts 02109.
Name, Age; Principal Occupation |
Edward C. Johnson 3d (82) |
| Year of Election or Appointment: 2011 Member of the Advisory Board of Fidelity's Equity and High Income Funds. Mr. Johnson serves as Chief Executive Officer, Chairman, and a Director of FMR LLC, and also serves as Chairman and Director of FIL Limited. Previously, Mr. Johnson served as a Trustee and Chairman of the Board of certain Fidelity Trusts, Chairman and a Director of FMR, Chairman and a Director of FMR Co., Inc., and President of FMR LLC (2006-2007). |
Peter S. Lynch (68) |
| Year of Election or Appointment: 2003 Member of the Advisory Board of Fidelity's Equity and High Income Funds. Mr. Lynch is Vice Chairman and a Director of FMR and FMR Co., Inc. In addition, Mr. Lynch serves as a Trustee of Boston College and as the Chairman of the Inner-City Scholarship Fund. Previously, Mr. Lynch served on the Special Olympics International Board of Directors (1997-2006). |
David A. Rosow (69) |
| Year of Election or Appointment: 2012 Member of the Advisory Board of Fidelity's Equity and High Income Funds. Chairman and Chief Executive Officer of International Golf Group, Inc. (golf course development, 1989-present). Previously, Mr. Rosow served as Chairman and Chief Executive Officer of Rosow & Company, Inc. (private investment company, 1989-2011), a Lead Director of Hudson United Bancorp (2001-2006) and as a Director of TD Banknorth (1996-2006). In addition, Mr. Rosow is a member (2008-present) and President (2009-present) of the Town Council of Palm Beach, Florida. |
Garnett A. Smith (64) |
| Year of Election or Appointment: 2012 Member of the Advisory Board of Fidelity's Equity and High Income Funds. Prior to Mr. Smith's retirement, he served as Chairman and Chief Executive Officer of Inbrand Corp. (manufacturer of personal absorbent products, 1990-1997). He also served as President (1986-1990) of Inbrand Corp. Prior to his employment with Inbrand Corp., he was employed by a retail fabric chain and North Carolina National Bank. In addition, Mr. Smith is a board member of the Jackson Hole Land Trust (2009-present). |
Kenneth B. Robins (43) |
| Year of Election or Appointment: 2008 President and Treasurer of Fidelity's Equity and High Income Funds. Mr. Robins also serves as President and Treasurer (2010-present) and Assistant Treasurer (2009-present) of other Fidelity funds and is an employee of Fidelity Investments (2004-present). Previously, Mr. Robins served as Deputy Treasurer of the Fidelity funds (2005-2008) and Treasurer and Chief Financial Officer of The North Carolina Capital Management Trust: Cash and Term Portfolios (2006-2008). |
Bruce T. Herring (47) |
| Year of Election or Appointment: 2006 Vice President of certain Equity Funds. Mr. Herring also serves as President of Fidelity Research & Analysis Company (2010-present), Chief Investment Officer and Director of Fidelity Management & Research (U.K.) Inc. (2010-present) and Group Chief Investment Officer of FMR. Previously, Mr. Herring served as Vice President (2005-2006) and Senior Vice President (2006-2007) of Fidelity Management & Research Company, Vice President of FMR Co., Inc. (2001-2007) and as a portfolio manager for Fidelity U.S. Equity Funds. |
Brian B. Hogan (47) |
| Year of Election or Appointment: 2009 Vice President of Equity and High Income Funds. Mr. Hogan also serves as President of FMR's Equity Division (2009-present). Previously, Mr. Hogan served as Senior Vice President, Equity Research of FMR (2006-2009) and as a portfolio manager. |
Scott C. Goebel (44) |
| Year of Election or Appointment: 2008 Secretary and Chief Legal Officer (CLO) of the Fidelity funds. Mr. Goebel also serves as Secretary of Fidelity Investments Money Management, Inc. (FIMM) (2010-present) and Fidelity Research and Analysis Company (FRAC) (2010-present); Secretary and CLO of The North Carolina Capital Management Trust: Cash and Term Portfolios (2008-present); General Counsel, Secretary, and Senior Vice President of FMR (2008-present) and FMR Co., Inc. (2008-present); employed by FMR LLC or an affiliate (2001-present); Chief Legal Officer of Fidelity Management & Research (Hong Kong) Limited (2008-present) and Assistant Secretary of Fidelity Management & Research (Japan) Inc. (2008-present), and Fidelity Management & Research (U.K.) Inc. (2008-present). Previously, Mr. Goebel served as Assistant Secretary of FIMM (2008-2010), FRAC (2008-2010), and the Funds (2007-2008) and as Vice President and Secretary of Fidelity Distributors Corporation (FDC) (2005-2007). |
William C. Coffey (43) |
| Year of Election or Appointment: 2009 Assistant Secretary of Fidelity's Equity and High Income Funds. Mr. Coffey also serves as Senior Vice President and Deputy General Counsel of FMR LLC (2010-present), and is an employee of Fidelity Investments. Previously, Mr. Coffey served as Vice President and Associate General Counsel of FMR LLC (2005-2009). |
Elizabeth Paige Baumann (44) |
| Year of Election or Appointment: 2012 Anti-Money Laundering (AML) Officer of the Fidelity funds. Ms. Baumann also serves as AML Officer of The North Carolina Capital Management Trust: Cash and Term Portfolios (2012-present), Chief AML Officer of FMR LLC (2012-present), and is an employee of Fidelity Investments. Previously, Ms. Baumann served as Vice President and Deputy Anti-Money Laundering Officer (2007-2012). |
Christine Reynolds (53) |
| Year of Election or Appointment: 2008 Chief Financial Officer of the Fidelity funds. Ms. Reynolds became President of Fidelity Pricing and Cash Management Services (FPCMS) in August 2008. Ms. Reynolds served as Chief Operating Officer of FPCMS (2007-2008). Previously, Ms. Reynolds served as President, Treasurer, and Anti-Money Laundering officer of the Fidelity funds (2004-2007). |
Joseph A. Hanlon (44) |
| Year of Election or Appointment: 2012 Chief Compliance Officer of Fidelity's Equity and High Income Funds. Mr. Hanlon serves as Compliance Officer of FMR, FMR Co., Inc., Fidelity Investments Money Management, Inc. (FIMM), Fidelity Research and Analysis Company (FRAC), Fidelity Management & Research (Japan) Inc., Fidelity Management & Research (U.K.) Inc., Fidelity Management & Research (Hong Kong), and Strategic Advisers, Inc. (2009-present), as Senior Vice President of the Fidelity Asset Management Division (2009-present), and is an employee of Fidelity Investments. |
Joseph F. Zambello (55) |
| Year of Election or Appointment: 2011 Deputy Treasurer of the Fidelity funds. Mr. Zambello is an employee of Fidelity Investments. Previously, Mr. Zambello served as Vice President of FMR's Program Management Group (2009-2011) and Vice President of the Transfer Agent Oversight Group (2005-2009). |
Adrien E. Deberghes (45) |
| Year of Election or Appointment: 2008 Deputy Treasurer of Fidelity's Equity and High Income Funds. Mr. Deberghes also serves as Vice President (2011-present) and Assistant Treasurer (2010-present) of other Fidelity funds, and is an employee of Fidelity Investments (2008-present). Previously, Mr. Deberghes served as Senior Vice President of Mutual Fund Administration at State Street Corporation (2007-2008), Senior Director of Mutual Fund Administration at Investors Bank & Trust (2005-2007), and Director of Finance for Dunkin' Brands (2000-2005). |
Stephanie J. Dorsey (43) |
| Year of Election or Appointment: 2010 Assistant Treasurer of Fidelity's Equity and High Income Funds. Ms. Dorsey also serves as Deputy Treasurer of other Fidelity funds (2008-present) and is an employee of Fidelity Investments (2008-present). Previously, Ms. Dorsey served as Treasurer (2004-2008) of the JPMorgan Mutual Funds and Vice President (2004-2008) of JPMorgan Chase Bank. |
John R. Hebble (54) |
| Year of Election or Appointment: 2009 Assistant Treasurer of Fidelity's Equity and High Income Funds. Mr. Hebble also serves as President (2011-present), Treasurer, and Chief Financial Officer of The North Carolina Capital Management Trust: Cash and Term Portfolios (2008-present), President and Treasurer of other Fidelity funds (2008-present) and is an employee of Fidelity Investments. |
Gary W. Ryan (54) |
| Year of Election or Appointment: 2005 Assistant Treasurer of the Fidelity funds. Mr. Ryan is an employee of Fidelity Investments. Previously, Mr. Ryan served as Vice President of Fund Reporting in Fidelity Pricing and Cash Management Services (FPCMS) (1999-2005). |
Jonathan Davis (44) |
| Year of Election or Appointment: 2010 Assistant Treasurer of the Fidelity funds. Mr. Davis is also Assistant Treasurer of Fidelity Rutland Square Trust II and Fidelity Commonwealth Trust II. Mr. Davis is an employee of Fidelity Investments. Previously, Mr. Davis served as Vice President and Associate General Counsel of FMR LLC (2003-2010). |
Annual Report
A total of 4.92% of the dividends distributed during the fiscal year was derived from interest on U.S. Government securities which is generally exempt from state income tax.
The fund designates $158,947,790 of distributions paid during the period January 1, 2012 to August 31, 2012 as qualifying to be taxed as interest-related dividends for nonresident alien shareholders.
Class K designates 13%, 40%, 65% and 64% of the dividends distributed in October, December, April and July, respectively during the fiscal year as qualifying for the dividends-received deduction for corporate shareholders.
Class K designates 16%, 48%, 81% and 81% of the dividends distributed in October, December, April and July, respectively during the fiscal year as amounts which may be taken into account as a dividend for the purposes of the maximum rate under section 1(h)(11) of the Internal Revenue Code.
The fund will notify shareholders in January 2013 of amounts for use in preparing 2012 income tax returns.
Annual Report
Board Approval of Investment Advisory Contracts and Management Fees
Fidelity Balanced Fund
Each year, the Board of Trustees, including the Independent Trustees (together, the Board), votes on the renewal of the management contract and sub-advisory agreements (together, the Advisory Contracts) for the fund. The Board, assisted by the advice of fund counsel and Independent Trustees' counsel, requests and considers a broad range of information relevant to the renewal of the Advisory Contracts throughout the year.
The Board meets regularly and, at each of its meetings, considers factors that are relevant to its annual consideration of the renewal of the fund's Advisory Contracts, including the services and support provided to the fund and its shareholders. The Board has established various standing committees, each composed of and chaired by Independent Trustees with varying backgrounds, to which the Board has assigned specific subject matter responsibilities in order to enhance effective decision-making by the Board. The Board, acting directly and through its Committees, requests and receives information concerning the annual consideration of the renewal of the fund's Advisory Contracts. The Board also meets as needed to consider matters specifically related to the Board's annual consideration of the renewal of Advisory Contracts. Members of the Board may also meet with trustees of other Fidelity funds through ad hoc joint committees to discuss certain matters relevant to the Fidelity funds.
At its July 2012 meeting, the Board of Trustees, including the Independent Trustees, unanimously determined to renew the fund's Advisory Contracts. In reaching its determination, the Board considered all factors it believed relevant, including (i) the nature, extent, and quality of the services to be provided to the fund and its shareholders (including the investment performance of the fund); (ii) the competitiveness of the fund's management fee and total expense ratio relative to peer funds; (iii) the total costs of the services to be provided by and the profits to be realized by Fidelity from its relationship with the fund; (iv) the extent to which economies of scale exist and would be realized as the fund grows; and (v) whether fee levels reflect these economies of scale, if any, for the benefit of fund shareholders.
In considering whether to renew the Advisory Contracts for the fund, the Board reached a determination, with the assistance of fund counsel and Independent Trustees' counsel and through the exercise of its business judgment, that the renewal of the Advisory Contracts is in the best interests of the fund and its shareholders and that the compensation payable under the Advisory Contracts is fair and reasonable. The Board's decision to renew the Advisory Contracts was not based on any single factor, but rather was based on a comprehensive consideration of all the information provided to the Board at its meetings throughout the year. The Board, in reaching its determination to renew the Advisory Contracts, is aware that shareholders in the fund have a broad range of investment choices available to them, including a wide choice among mutual funds offered by Fidelity's competitors, and that the fund's shareholders, who have the opportunity to review and weigh the disclosure provided by the fund in its prospectus and other public disclosures, have chosen to invest in this fund, managed by Fidelity.
Annual Report
Nature, Extent, and Quality of Services Provided. The Board considered the staffing within the investment adviser, FMR, and the sub-advisers (together, the Investment Advisers), including the backgrounds of the fund's investment personnel, and also considered the fund's investment objective, strategies, and related investment philosophy. The Independent Trustees also had discussions with senior management of Fidelity's investment operations and investment groups. The Board considered the structure of the portfolio manager compensation program and whether this structure provides appropriate incentives to act in the best interests of the fund.
Resources Dedicated to Investment Management and Support Services. The Board and the Fund Oversight and Research Committees reviewed the general qualifications and capabilities of the Investment Advisers' investment staff, including its size, education, experience, and resources, as well as the Investment Advisers' approach to recruiting, training, managing, and compensating investment personnel. The Board also noted that FMR has continued to increase the resources devoted to non-U.S. offices, including expansion of Fidelity's global investment organization. The Board noted that Fidelity's analysts have extensive resources, tools and capabilities that allow them to conduct sophisticated quantitative and fundamental analysis, as well as credit analysis of issuers, counterparties and guarantors. The Board also believes that Fidelity's investment professionals have sufficient access to global information and data so as to provide competitive investment results over time, and that those professionals also have access to sophisticated tools that permit them to assess portfolio construction and risk and performance attribution characteristics continuously, as well as to transmit new information and research conclusions rapidly around the world. Additionally, in its deliberations, the Board considered the Investment Advisers' trading and risk management capabilities and resources, which are an integral part of the investment management process.
Shareholder and Administrative Services. The Board considered (i) the nature, extent, quality, and cost of advisory, administrative, and shareholder services performed by the Investment Advisers and their affiliates under the Advisory Contracts and under separate agreements covering transfer agency, pricing and bookkeeping, and securities lending services for the fund; (ii) the nature and extent of the supervision of third party service providers, principally custodians and subcustodians; and (iii) the resources devoted to, and the record of compliance with, the fund's compliance policies and procedures. The Board also reviewed the allocation of fund brokerage, including allocations to brokers affiliated with the Investment Advisers, the use of brokerage commissions to pay fund expenses, and the use of "soft" commission dollars to pay for research services.
Annual Report
Board Approval of Investment Advisory Contracts and
Management Fees - continued
The Board noted that the growth of fund assets over time across the complex allows Fidelity to reinvest in the development of services designed to enhance the value or convenience of the Fidelity funds as investment vehicles. These services include 24-hour access to account information and market information through telephone representatives and over the Internet, investor education materials and asset allocation tools, and the expanded availability of Fidelity Investor Centers.
Investment in a Large Fund Family. The Board considered the benefits to shareholders of investing in a Fidelity fund, including the benefits of investing in a fund that is part of a large family of funds offering a variety of investment disciplines and providing a large variety of mutual fund investor services. The Board noted that Fidelity had taken, or had made recommendations that resulted in the Fidelity funds taking, a number of actions over the previous year that benefited particular funds, including (i) continuing to dedicate additional resources to investment research and support of the senior management team that oversees asset management; (ii) persisting in efforts to enhance Fidelity's research capabilities, in particular, international research; (iii) launching new funds and making other enhancements to meet client needs for global and income-oriented solutions; (iv) continuing to launch dedicated lower cost underlying funds to meet investment management's portfolio construction needs related to expanding underlying fund options, specifically for the Freedom Fund product lines; (v) adopting a "Stock Selector" sector neutral investment approach and employing a team of portfolio managers who are sector specialists to manage certain funds; (vi) rationalizing product lines and gaining increased efficiencies through the mergers of several funds into other funds; (vii) strengthening the Spartan Index Fund product line by adding new funds and/or new low-cost institutional share classes, restructuring fund expenses to accommodate new classes, and reducing investment minimums for certain classes of shares; (viii) modifying the eligibility criteria for Institutional Class shares to increase their appeal to government entities and charitable investors; and (ix) reducing certain transfer agent fee rates.
Investment Performance. The Board considered whether the fund has operated in accordance with its investment objective, as well as its record of compliance with its investment restrictions. It also reviewed the fund's absolute investment performance for each class, as well as the fund's relative investment performance for each class measured over multiple periods against (i) a proprietary custom index, and (ii) a peer group of mutual funds deemed appropriate by Fidelity and reviewed by the Board. The following charts considered by the Board show, over the one-, three-, and five-year periods ended December 31, 2011, as available, the cumulative total returns of Class K and the retail class of the fund, the cumulative total returns of a proprietary custom index ("benchmark"), and a range of cumulative total returns of a peer group of mutual funds identified by Lipper Inc. as having an investment objective similar to that of the fund. The box within each chart shows the 25th percentile return (top of box) and the 75th percentile return (bottom of box) of the peer group. Returns shown above the box are in the first quartile and returns shown below the box are in the fourth quartile. The percentage beaten numbers noted below each chart correspond to the percentile box and represent the percentage of funds in the peer group whose performance was equal to or lower than that of the class indicated. The fund's proprietary custom index is an index developed by FMR that represents the performance of the fund's general investment categories in both equity and bond securities.
Annual Report
Fidelity Balanced Fund

The Board reviewed the fund's relative investment performance against its peer group and noted that the performance of the retail class of the fund (the class with the longer performance record) was in the second quartile for the one- and five-year periods and the first quartile for the three-year period. The Board also noted that the investment performance of the fund was lower than its benchmark for the one- and five-year periods, although the three-year cumulative total return of the retail class compared favorably to its benchmark. The Board considered that the variations in performance between the fund's classes reflect the variations in class expenses, which result in lower performance for the higher expense class. The Board noted that there were portfolio management changes for the fund in March 2012 and November 2011. The Board also reviewed the fund's performance since inception as well as performance in the current year.
Based on its review, the Board concluded that the nature, extent, and quality of services provided to the fund under the Advisory Contracts should benefit the fund's shareholders.
Annual Report
Board Approval of Investment Advisory Contracts and
Management Fees - continued
Competitiveness of Management Fee and Total Expense Ratio. The Board considered the fund's management fee and total expense ratio compared to "mapped groups" of competitive funds and classes. Fidelity creates "mapped groups" by combining similar Lipper investment objective categories that have comparable management fee characteristics. Combining Lipper investment objective categories aids the Board's management fee and total expense ratio comparisons by broadening the competitive group used for comparison and by reducing the number of universes to which various Fidelity funds are compared.
Management Fee. The Board considered two proprietary management fee comparisons for the 12-month periods shown in the chart below. The group of Lipper funds used by the Board for management fee comparisons is referred to below as the "Total Mapped Group." The Total Mapped Group is broader than the Lipper peer group used by the Board for performance comparisons because the Total Mapped Group combines several Lipper investment objective categories while the Lipper peer group does not. The Total Mapped Group comparison focuses on a fund's standing relative to the total universe of comparable funds available to investors in terms of gross management fees before expense reimbursements or caps. "TMG %" represents the percentage of funds in the Total Mapped Group that had management fees that were lower than the fund's. For example, a TMG % of 11% means that 89% of the funds in the Total Mapped Group had higher management fees than the fund. The "Asset-Size Peer Group" (ASPG) comparison focuses on a fund's standing relative to non-Fidelity funds similar in size to the fund within the Total Mapped Group. The ASPG represents at least 15% of the funds in the Total Mapped Group with comparable asset size and management fee characteristics, subject to a minimum of 50 funds (or all funds in the Total Mapped Group if fewer than 50). Additional information, such as the ASPG quartile in which the fund's management fee ranked, is also included in the chart and considered by the Board.
Annual Report
Fidelity Balanced Fund

The Board noted that the fund's management fee ranked below the median of its Total Mapped Group and below the median of its ASPG for 2011.
Based on its review, the Board concluded that the fund's management fee is fair and reasonable in light of the services that the fund receives and the other factors considered.
Total Expense Ratio. In its review of each class's total expense ratio, the Board considered the fund's management fee as well as other fund or class expenses, as applicable, such as transfer agent fees, pricing and bookkeeping fees, and custodial, legal, and audit fees. The Board also noted the effects of any waivers and reimbursements on fees and expenses. As part of its review, the Board also considered the current and historical total expense ratios of each class of the fund compared to competitive fund median expenses. Each class of the fund is compared to those funds and classes in the Total Mapped Group (used by the Board for management fee comparisons) that have a similar sales load structure.
The Board noted that the total expense ratio of each class ranked below its competitive median for 2011.
Fees Charged to Other Fidelity Clients. The Board also considered Fidelity fee structures and other information with respect to clients of FMR and its affiliates, such as other mutual funds advised or subadvised by FMR or its affiliates, pension plan clients, and other institutional clients. The Board noted the findings of the 2010 ad hoc joint committee (created with the board of other Fidelity funds), which reviewed and compared Fidelity's institutional investment advisory business with its business of providing services to the Fidelity funds, including the differences in services provided, fees charged, and costs incurred, as well as competition in their respective marketplaces.
Annual Report
Board Approval of Investment Advisory Contracts and
Management Fees - continued
Based on its review of total expense ratios and fees charged to other Fidelity clients, the Board concluded that the total expense ratio of each class of the fund was reasonable in light of the services that the fund and its shareholders receive and the other factors considered.
Costs of the Services and Profitability. The Board considered the revenues earned and the expenses incurred by Fidelity in conducting the business of developing, marketing, distributing, managing, administering and servicing the fund and its shareholders. The Board also considered the level of Fidelity's profits in respect of all the Fidelity funds.
On an annual basis, FMR presents to the Board Fidelity's profitability for the fund. Fidelity calculates the profitability for each fund, as well as aggregate profitability for groups of Fidelity funds and all Fidelity funds, using a series of detailed revenue and cost allocation methodologies which originate with the books and records of Fidelity on which Fidelity's audited financial statements are based. The Audit Committee of the Board reviews any significant changes from the prior year's methodologies.
PricewaterhouseCoopers LLP (PwC), independent registered public accounting firm and auditor to Fidelity and certain Fidelity funds, has been engaged annually by the Board as part of the Board's assessment of Fidelity's profitability analysis. PwC's engagement includes the review and assessment of Fidelity's methodologies used in determining the revenues and expenses attributable to Fidelity's mutual fund business, and completion of agreed-upon procedures surrounding the mathematical accuracy of fund profitability and its conformity to allocation methodologies. After considering PwC's reports issued under the engagement and information provided by Fidelity, the Board concluded that while other allocation methods may also be reasonable, Fidelity's profitability methodologies are reasonable in all material respects.
The Board also reviewed Fidelity's non-fund businesses and fall-out benefits related to the mutual fund business as well as cases where Fidelity's affiliates may benefit from or be related to the fund's business.
The Board considered the costs of the services provided by and the profits realized by Fidelity in connection with the operation of the fund and was satisfied that the profitability was not excessive in the circumstances.
Economies of Scale. The Board considered whether there have been economies of scale in respect of the management of the Fidelity funds, whether the Fidelity funds (including the fund) have appropriately benefited from any such economies of scale, and whether there is potential for realization of any further economies of scale. The Board considered the extent to which the fund will benefit from economies of scale through increased services to the fund, through waivers or reimbursements, or through fee or expense reductions. The Board also noted that in 2009, it and the board of other Fidelity funds created an ad hoc committee (the Economies of Scale Committee) to analyze whether FMR attains economies of scale in respect of the management and servicing of the Fidelity funds, whether the Fidelity funds have appropriately benefited from such economies of scale, and whether there is potential for realization of any further economies of scale.
Annual Report
The Board recognized that the fund's management contract incorporates a "group fee" structure, which provides for lower group fee rates as total fund assets under FMR's management increase, and for higher group fee rates as total fund assets under FMR's management decrease. FMR calculates the group fee rates based on a tiered asset "breakpoint" schedule that varies based on asset class. The Board considered that the group fee is designed to deliver the benefits of economies of scale to fund shareholders when total Fidelity fund assets increase, even if assets of any particular fund are unchanged or have declined, because some portion of Fidelity's costs are attributable to services provided to all Fidelity funds, and all funds benefit if those costs can be allocated among more assets. The Board concluded that, given the group fee structure, fund shareholders will benefit from lower management fees as assets under FMR's management increase at the fund complex level, regardless of whether Fidelity achieves any such economies of scale.
The Board concluded, taking into account the analysis of the Economies of Scale Committee, that economies of scale, if any, are being appropriately shared between fund shareholders and Fidelity.
Additional Information Requested by the Board. In order to develop fully the factual basis for consideration of the Fidelity funds' Advisory Contracts, the Board requested and received additional information on certain topics, including (i) fund performance trends, actions to be taken by FMR to improve certain funds' overall performance, and Fidelity's long-term strategies for certain funds; (ii) the potential to further rationalize the Fidelity fund lineup with the possibility of achieving savings for the funds and Fidelity; (iii) Fidelity's compensation structure for portfolio managers and other key investment personnel; (iv) the amount of the investment that each portfolio manager has made in the Fidelity fund(s) that he or she manages; (v) the realization of fall-out benefits in certain Fidelity business units; (vi) Fidelity's group fee structures, the potential impact of regulatory changes on such structures, and the rationale for the individual fee rates of certain funds; (vii) fund profitability methodology, including Fidelity's cost allocation methodology, and the impact of certain factors on fund profitability results; (viii) trends regarding industry use of performance fee structures and the possibility of implementing performance fee structures for additional funds; and (ix) the impact of net redemptions from the Fidelity funds.
Annual Report
Board Approval of Investment Advisory Contracts and
Management Fees - continued
Based on its evaluation of all of the conclusions noted above, and after considering all factors it believed relevant, the Board ultimately concluded that the advisory fee structures are fair and reasonable, and that the fund's Advisory Contracts should be renewed.
Annual Report
Investment Adviser
Fidelity Management & Research Company
Boston, MA
Investment Sub-Advisers
FMR Co., Inc.
Fidelity Investments
Money Management, Inc.
Fidelity Management & Research
(U.K.) Inc.
Fidelity Management & Research
(Hong Kong) Limited
Fidelity Management & Research
(Japan) Inc.
General Distributor
Fidelity Distributors Corporation
Smithfield, RI
Transfer and Service Agents
Fidelity Investments Institutional Operations Company, Inc.
Boston, MA
Fidelity Service Company, Inc.
Boston, MA
Custodian
Citibank, N.A.
New York, NY
(Fidelity Investment logo)(registered trademark)
Corporate Headquarters
82 Devonshire St., Boston, MA 02109
www.fidelity.com
BAL-K-UANN-1012
1.863050.103
Fidelity®
Balanced
Fund
Annual Report
August 31, 2012
(Fidelity Cover Art)
Contents
Performance | (Click Here) | How the fund has done over time. |
Management's Discussion of Fund Performance | (Click Here) | The Portfolio Manager's review of fund performance and strategy. |
Shareholder Expense Example | (Click Here) | An example of shareholder expenses. |
Investment Changes | (Click Here) | A summary of major shifts in the fund's investments over the past six months. |
Investments | (Click Here) | A complete list of the fund's investments with their market values. |
Financial Statements | (Click Here) | Statements of assets and liabilities, operations, and changes in net assets, as well as financial highlights. |
Notes | (Click Here) | Notes to the financial statements. |
Report of Independent Registered Public Accounting Firm | (Click Here) | |
Trustees and Officers | (Click Here) | |
Distributions | (Click Here) | |
Board Approval of Investment Advisory Contracts and Management Fees | (Click Here) | |
To view a fund's proxy voting guidelines and proxy voting record for the 12-month period ended June 30, visit http://www.fidelity.com/proxyvotingresults or visit the Securities and Exchange Commission's (SEC) web site at http://www.sec.gov. You may also call 1-800-544-8544 to request a free copy of the proxy voting guidelines.
Standard & Poor's, S&P and S&P 500 are registered service marks of The McGraw-Hill Companies, Inc. and have been licensed for use by Fidelity Distributors Corporation.
Other third party marks appearing herein are the property of their respective owners.
All other marks appearing herein are registered or unregistered trademarks or service marks of FMR LLC or an affiliated company. © 2012 FMR LLC. All rights reserved.
Annual Report
This report and the financial statements contained herein are submitted for the general information of the shareholders of the fund. This report is not authorized for distribution to prospective investors in the fund unless preceded or accompanied by an effective prospectus.
A fund files its complete schedule of portfolio holdings with the SEC for the first and third quarters of each fiscal year on Form N-Q. Forms N-Q are available on the SEC's web site at http://www.sec.gov. A fund's Forms N-Q may be reviewed and copied at the SEC's Public Reference Room in Washington, DC. Information regarding the operation of the SEC's Public Reference Room may be obtained by calling 1-800-SEC-0330. For a complete list of a fund's portfolio holdings, view the most recent holdings listing, semiannual report, or annual report on Fidelity's web site at http://www.fidelity.com, http://www.advisor.fidelity.com, or http://www.401k.com, as applicable.
NOT FDIC INSURED • MAY LOSE VALUE • NO BANK GUARANTEE
Neither the fund nor Fidelity Distributors Corporation is a bank.
Annual Report
Average annual total return reflects the change in the value of an investment, assuming reinvestment of the class' distributions from dividend income and capital gains (the profits earned upon the sale of securities that have grown in value, if any) and assuming a constant rate of performance each year. The $10,000 table and the fund's returns do not reflect the deduction of taxes that a shareholder would pay on fund distributions or the redemption of fund shares. During periods of reimbursement by Fidelity, a fund's total return will be greater than it would be had the reimbursement not occurred. How a fund did yesterday is no guarantee of how it will do tomorrow.
Average Annual Total Returns
Periods ended August 31, 2012 | Past 1
year | Past 5
years | Past 10
years |
Fidelity® Balanced Fund | 11.89% | 2.71% | 7.96% |
$10,000 Over 10 Years
Let's say hypothetically that $10,000 was invested in Fidelity® Balanced Fund, a class of the fund, on August 31, 2002. The chart shows how the value of your investment would have changed, and also shows how the S&P 500® Index performed over the same period.

Annual Report
Market Recap: U.S. stocks posted a strong gain for the 12 months ending August 31, 2012, overcoming losses sustained last summer and extending an uptrend that began in March 2009. The broad-based S&P 500® Index added 18.00% for the 12-month period, while the blue-chip-laden Dow Jones Industrial AverageSM and technology-heavy Nasdaq Composite® Index rose 15.86% and 20.26%, respectively. Uncertainty prevailed early on, as Greece neared insolvency and fear of debt contagion in Europe led the S&P 500® to its lowest point in more than a year, in early October. Markets reversed course that same month, and the S&P 500® rose to its largest monthly gain in two decades. Despite a rough patch in the spring, U.S. stocks pushed ahead for much of the remainder of the period, fueled by solid corporate earnings, a reviving housing market and hope for a solution in the eurozone. Elsewhere, foreign developed-markets stocks languished amid the European turmoil and as local currencies weakened versus the dollar, leaving the MSCI® EAFE® Index up just 0.10%. In the fixed-income arena, the search for yield benefited high-income securities, which returned 13.01%, according to The BofA Merrill LynchSM US High Yield Constrained Index. Higher-quality debt registered a more muted advance, with the Barclays® U.S. Aggregate Bond Index - a proxy for investment-grade debt - returning 5.78%.
Comments from Robert Stansky, Head of Fidelity's Stock Selector Large Cap Group, which manages Fidelity® Balanced Fund: For the year, the fund's Retail Class shares returned 11.89%, trailing the 13.34% gain of the Fidelity Balanced Hybrid Composite IndexSM, a hypothetical blend of the total returns of the S&P 500 and the Barclays® U.S. Aggregate Bond Index, using weightings of 60% and 40%, respectively. Disappointing stock selection hurt performance, although the negative impact was modestly offset by our overweighting in equities. The fund benefited the most from our fixed-income investments, including good picks and an underweighting in investment-grade bonds, and a small out-of-index allocation to high-yield bonds. Looking at individual holdings, the biggest detractor was enterprise software firm Oracle, primarily due to positioning during the first half of the period. The stock declined sharply in December, due to concern about future earnings, and we sold it by period end. Our decision to not own telecom giant and benchmark component AT&T for nearly the entire period also detracted. We were concerned about the stock's valuation. Conversely, a sizable position in Apple was the fund's top individual contributor, as the company's iPad® tablet computer and iPhone® smartphone continued to define their respective categories, helping the stock maintain its run of strong performance.
The views expressed above reflect those of the portfolio manager(s) only through the end of the period as stated on the cover of this report and do not necessarily represent the views of Fidelity or any other person in the Fidelity organization. Any such views are subject to change at any time based upon market or other conditions and Fidelity disclaims any responsibility to update such views. These views may not be relied on as investment advice and, because investment decisions for a Fidelity fund are based on numerous factors, may not be relied on as an indication of trading intent on behalf of any Fidelity fund.
Annual Report
Shareholder Expense Example
As a shareholder of the Fund, you incur two types of costs: (1) transaction costs, and (2) ongoing costs, including management fees and other Fund expenses. This Example is intended to help you understand your ongoing costs (in dollars) of investing in the Fund and to compare these costs with the ongoing costs of investing in other mutual funds.
The Example is based on an investment of $1,000 invested at the beginning of the period and held for the entire period (March 1, 2012 to August 31, 2012).
Actual Expenses
The first line of the accompanying table for each class of the Fund provides information about actual account values and actual expenses. You may use the information in this line, together with the amount you invested, to estimate the expenses that you paid over the period. Simply divide your account value by $1,000.00 (for example, an $8,600 account value divided by $1,000.00 = 8.6), then multiply the result by the number in the first line for a class of the Fund under the heading entitled "Expenses Paid During Period" to estimate the expenses you paid on your account during this period. A small balance maintenance fee of $12.00 that is charged once a year may apply for certain accounts with a value of less than $2,000. This fee is not included in the table below. If it was, the estimate of expenses you paid during the period would be higher, and your ending account value lower, by this amount. In addition, the Fund, as a shareholder in the underlying Fidelity Central Funds, will indirectly bear its pro-rata share of the fees and expenses incurred by the underlying Fidelity Central Funds. These fees and expenses are not included in the Fund's annualized expense ratio used to calculate the expense estimate in the table below.
Hypothetical Example for Comparison Purposes
The second line of the accompanying table for each class of the Fund provides information about hypothetical account values and hypothetical expenses based on a Class' actual expense ratio and an assumed rate of return of 5% per year before expenses, which is not the Class' actual return. The hypothetical account values and expenses may not be used to estimate the actual ending account balance or expenses you paid for the period. You may use this information to compare the ongoing costs of investing in the Fund and other funds. To do so, compare this 5% hypothetical example with the 5% hypothetical examples that appear in the shareholder reports of the other funds. A small balance maintenance fee of $12.00 that is charged once a year may apply for certain accounts with a value of less than $2,000. This fee is not included in the table below. If it was, the estimate of expenses you paid during the period would be higher, and your ending account value lower, by this amount. In addition, the Fund, as a shareholder in the underlying Fidelity Central Funds, will indirectly bear its pro-rata share of the fees and expenses incurred by the underlying Fidelity Central Funds. These fees and expenses are not included in the Fund's annualized expense ratio used to calculate the expense estimate in the table below.
Please note that the expenses shown in the table are meant to highlight your ongoing costs only and do not reflect any transaction costs. Therefore, the second line of the table is useful in comparing ongoing costs only, and will not help you determine the relative total costs of owning different funds.
Annual Report
| Annualized
Expense Ratio | Beginning
Account Value
March 1, 2012 | Ending
Account Value
August 31, 2012 | Expenses Paid
During Period*
March 1, 2012
to August 31, 2012 |
Balanced | .59% | | | |
Actual | | $ 1,000.00 | $ 1,031.80 | $ 3.01 |
HypotheticalA | | $ 1,000.00 | $ 1,022.17 | $ 3.00 |
Class K | .47% | | | |
Actual | | $ 1,000.00 | $ 1,032.30 | $ 2.40 |
HypotheticalA | | $ 1,000.00 | $ 1,022.77 | $ 2.39 |
A 5% return per year before expenses
* Expenses are equal to each Class' annualized expense ratio, multiplied by the average account value over the period, multiplied by 184/366 (to reflect the one-half year period). The fees and expenses of the underlying Fidelity Central Funds in which the Fund invests are not included in the Fund's annualized expense ratio.
Annual Report
Investment Changes (Unaudited)
The information in the following tables is based on the combined investments of the Fund and its pro-rata share of the investments of Fidelity's fixed-income central funds. |
Top Five Stocks as of August 31, 2012 |
| % of fund's
net assets | % of fund's net assets
6 months ago |
Apple, Inc. | 5.0 | 4.3 |
QUALCOMM, Inc. | 1.6 | 1.3 |
Microsoft Corp. | 1.6 | 1.3 |
Exxon Mobil Corp. | 1.5 | 0.9 |
Procter & Gamble Co. | 1.4 | 1.4 |
| 11.1 | |
Top Five Bond Issuers as of August 31, 2012 |
(with maturities greater than one year) | % of fund's
net assets | % of fund's net assets
6 months ago |
Fannie Mae | 9.2 | 5.4 |
U.S. Treasury Obligations | 5.1 | 10.0 |
Freddie Mac | 2.7 | 2.6 |
Ginnie Mae | 2.4 | 2.1 |
Wachovia Bank Commercial Mortgage Trust | 0.4 | 0.0 |
| 19.8 | |
Top Five Market Sectors as of August 31, 2012 |
| % of fund's
net assets | % of fund's net assets
6 months ago |
Information Technology | 14.1 | 13.6 |
Financials | 13.7 | 13.3 |
Energy | 8.9 | 9.6 |
Health Care | 8.1 | 7.4 |
Consumer Staples | 7.9 | 7.4 |
Asset Allocation (% of fund's net assets) |
As of August 31, 2012 * | As of February 29, 2012 ** |
| Stocks and Equity
Futures 64.2% | | | Stocks and Equity
Futures 62.8% | |
| Bonds 34.0% | | | Bonds 34.4% | |
| Convertible
Securities 0.1% | | | Convertible
Securities 0.1% | |
| Other Investments 0.3% | | | Other Investments 0.3% | |
| Short-Term
Investments and
Net Other Assets
(Liabilities) 1.4% | | | Short-Term
Investments and
Net Other Assets
(Liabilities) 2.4% | |
* Foreign investments | 8.9% | | ** Foreign investments | 13.1% | |

Percentages are adjusted for the effect of futures and swap contracts, if applicable. An unaudited holdings listing for the Fund, which presents direct holdings as well as the pro-rata share of any securities and other investments held indirectly through its investment in underlying non-money market Fidelity Central Funds, is available at fidelity.com. |
Percentages in the above tables are adjusted for the effect of TBA Sale Commitments. |
Annual Report
Investments August 31, 2012
Showing Percentage of Net Assets
Common Stocks - 63.7% |
| Shares | | Value (000s) |
CONSUMER DISCRETIONARY - 6.4% |
Diversified Consumer Services - 0.0% |
Weight Watchers International, Inc. (e) | 100,727 | | $ 4,812 |
Hotels, Restaurants & Leisure - 1.2% |
Arcos Dorados Holdings, Inc. | 713,097 | | 9,420 |
Domino's Pizza, Inc. | 819,931 | | 29,058 |
Dunkin' Brands Group, Inc. | 341,877 | | 9,959 |
Icahn Enterprises LP rights (a) | 290,524 | | 0 |
McDonald's Corp. | 757,421 | | 67,782 |
Starbucks Corp. | 1,086,917 | | 53,922 |
Yum! Brands, Inc. | 1,130,472 | | 72,034 |
| | 242,175 |
Internet & Catalog Retail - 0.4% |
Kayak Software Corp. (e)(f) | 203,012 | | 5,542 |
Priceline.com, Inc. (a) | 111,242 | | 67,254 |
| | 72,796 |
Media - 2.8% |
Comcast Corp. Class A | 6,618,603 | | 221,922 |
DIRECTV (a) | 1,641,196 | | 85,490 |
Legend Pictures LLC (a)(p)(q) | 8,571 | | 9,164 |
News Corp. Class A | 4,894,779 | | 114,489 |
Sirius XM Radio, Inc. (a) | 5,666,600 | | 14,336 |
The Walt Disney Co. | 2,541,497 | | 125,728 |
| | 571,129 |
Multiline Retail - 0.3% |
Dollar General Corp. (a) | 1,420,365 | | 72,538 |
Specialty Retail - 1.5% |
AutoZone, Inc. (a) | 148,441 | | 53,682 |
CarMax, Inc. (a) | 261,919 | | 8,012 |
Limited Brands, Inc. | 550,498 | | 26,754 |
Lowe's Companies, Inc. | 4,013,003 | | 114,290 |
TJX Companies, Inc. | 2,170,980 | | 99,409 |
| | 302,147 |
Textiles, Apparel & Luxury Goods - 0.2% |
Under Armour, Inc. Class A (sub. vtg.) (a)(e) | 754,878 | | 43,941 |
TOTAL CONSUMER DISCRETIONARY | | 1,309,538 |
CONSUMER STAPLES - 7.2% |
Beverages - 2.6% |
Anheuser-Busch InBev SA NV | 655,741 | | 55,169 |
Common Stocks - continued |
| Shares | | Value (000s) |
CONSUMER STAPLES - continued |
Beverages - continued |
Coca-Cola Bottling Co. CONSOLIDATED | 118,433 | | $ 8,129 |
Coca-Cola FEMSA SAB de CV sponsored ADR | 30,925 | | 3,774 |
Coca-Cola Icecek A/S | 394,435 | | 7,025 |
Companhia de Bebidas das Americas (AmBev) (PN) sponsored ADR | 164,725 | | 6,195 |
Constellation Brands, Inc. Class A (sub. vtg.) (a) | 1,476,841 | | 48,647 |
Diageo PLC sponsored ADR | 494,843 | | 54,047 |
Embotelladora Andina SA sponsored ADR | 218,222 | | 7,184 |
Molson Coors Brewing Co. Class B | 628,844 | | 28,009 |
Monster Beverage Corp. (a) | 97,800 | | 5,763 |
Pernod Ricard SA | 344,150 | | 37,084 |
Remy Cointreau SA | 176,092 | | 20,113 |
The Coca-Cola Co. | 6,784,472 | | 253,739 |
| | 534,878 |
Food & Staples Retailing - 1.0% |
CVS Caremark Corp. | 3,242,038 | | 147,675 |
Drogasil SA | 434,400 | | 4,595 |
Kroger Co. | 801,453 | | 17,856 |
Safeway, Inc. | 278,105 | | 4,352 |
Wal-Mart Stores, Inc. | 394,834 | | 28,665 |
Walgreen Co. | 386,702 | | 13,828 |
| | 216,971 |
Food Products - 0.5% |
Bunge Ltd. | 348,589 | | 22,188 |
Green Mountain Coffee Roasters, Inc. (a) | 168,876 | | 4,105 |
Mead Johnson Nutrition Co. Class A | 137,761 | | 10,102 |
Nestle SA | 338,708 | | 21,056 |
Orion Corp. | 5,168 | | 4,194 |
Pilgrims Pride Corp. | 748,200 | | 3,980 |
Unilever NV (NY Reg.) | 1,018,331 | | 35,418 |
| | 101,043 |
Household Products - 1.6% |
Colgate-Palmolive Co. | 327,533 | | 34,820 |
Procter & Gamble Co. | 4,164,463 | | 279,810 |
Spectrum Brands Holdings, Inc. | 202,786 | | 7,469 |
| | 322,099 |
Common Stocks - continued |
| Shares | | Value (000s) |
CONSUMER STAPLES - continued |
Personal Products - 0.2% |
L'Oreal SA | 256,900 | | $ 31,583 |
Nu Skin Enterprises, Inc. Class A | 281,363 | | 11,674 |
| | 43,257 |
Tobacco - 1.3% |
Altria Group, Inc. | 543,295 | | 18,450 |
British American Tobacco PLC sponsored ADR | 2,088,001 | | 218,697 |
Philip Morris International, Inc. | 200,183 | | 17,876 |
Souza Cruz SA | 477,700 | | 6,403 |
| | 261,426 |
TOTAL CONSUMER STAPLES | | 1,479,674 |
ENERGY - 7.2% |
Energy Equipment & Services - 1.6% |
Cameron International Corp. (a) | 743,991 | | 40,704 |
Ensco PLC Class A | 823,839 | | 47,264 |
Forum Energy Technologies, Inc. | 341,364 | | 8,080 |
Halliburton Co. | 746,958 | | 24,470 |
National Oilwell Varco, Inc. | 1,061,248 | | 83,626 |
Noble Corp. | 1,087,208 | | 41,466 |
Ocean Rig UDW, Inc. (United States) | 455,396 | | 7,619 |
Oceaneering International, Inc. | 220,987 | | 11,832 |
Oil States International, Inc. (a) | 101,400 | | 7,934 |
Schlumberger Ltd. | 631,524 | | 45,710 |
Vantage Drilling Co. (a) | 4,677,101 | | 7,109 |
| | 325,814 |
Oil, Gas & Consumable Fuels - 5.6% |
Anadarko Petroleum Corp. | 900,802 | | 62,399 |
Apache Corp. | 835,168 | | 71,616 |
Cheniere Energy, Inc. (a) | 193,100 | | 2,850 |
Chevron Corp. | 1,260,894 | | 141,422 |
Cobalt International Energy, Inc. (a) | 317,200 | | 7,204 |
EQT Corp. | 360,200 | | 19,436 |
Exxon Mobil Corp. | 3,618,457 | | 315,891 |
Halcon Resources Corp. (q) | 910,000 | | 6,989 |
Hess Corp. | 619,326 | | 31,295 |
HollyFrontier Corp. | 836,666 | | 33,709 |
InterOil Corp. (a)(e) | 310,031 | | 24,660 |
Marathon Oil Corp. | 2,036,593 | | 56,658 |
Marathon Petroleum Corp. | 1,189,088 | | 61,535 |
Common Stocks - continued |
| Shares | | Value (000s) |
ENERGY - continued |
Oil, Gas & Consumable Fuels - continued |
Noble Energy, Inc. | 325,965 | | $ 28,652 |
Northern Tier Energy LP Class A | 458,700 | | 8,394 |
Occidental Petroleum Corp. | 1,038,752 | | 88,304 |
Phillips 66 | 375,591 | | 15,775 |
Royal Dutch Shell PLC Class B sponsored ADR (e) | 1,233,621 | | 89,055 |
Suncor Energy, Inc. | 1,602,400 | | 50,084 |
Williams Companies, Inc. | 1,122,100 | | 36,210 |
| | 1,152,138 |
TOTAL ENERGY | | 1,477,952 |
FINANCIALS - 9.3% |
Capital Markets - 0.8% |
BlackRock, Inc. Class A | 275,742 | | 48,633 |
E*TRADE Financial Corp. (a) | 629,301 | | 5,393 |
Evercore Partners, Inc. Class A | 275,200 | | 6,797 |
ICAP PLC | 923,400 | | 4,658 |
Invesco Ltd. | 903,982 | | 21,406 |
Morgan Stanley | 1,163,200 | | 17,448 |
State Street Corp. | 563,918 | | 23,459 |
TD Ameritrade Holding Corp. | 904,736 | | 15,480 |
The Blackstone Group LP | 1,026,000 | | 13,841 |
UBS AG | 647,930 | | 7,229 |
| | 164,344 |
Commercial Banks - 2.2% |
CIT Group, Inc. (a) | 708,926 | | 26,769 |
Comerica, Inc. | 1,107,648 | | 34,016 |
Credit Agricole SA (a) | 924,624 | | 5,394 |
FirstMerit Corp. | 318,698 | | 5,000 |
Huntington Bancshares, Inc. | 4,733,054 | | 31,238 |
Lloyds Banking Group PLC (a) | 7,606,900 | | 4,014 |
M&T Bank Corp. | 314,819 | | 27,358 |
Synovus Financial Corp. (e) | 4,461,120 | | 9,279 |
U.S. Bancorp | 7,141,743 | | 238,606 |
Wells Fargo & Co. | 2,356,876 | | 80,204 |
| | 461,878 |
Consumer Finance - 1.5% |
Capital One Financial Corp. | 4,019,745 | | 227,236 |
Common Stocks - continued |
| Shares | | Value (000s) |
FINANCIALS - continued |
Consumer Finance - continued |
Discover Financial Services | 364,652 | | $ 14,123 |
SLM Corp. | 4,030,734 | | 63,484 |
| | 304,843 |
Diversified Financial Services - 1.7% |
African Bank Investments Ltd. | 692,111 | | 2,677 |
Bank of America Corp. | 3,429,996 | | 27,406 |
Citigroup, Inc. | 5,059,146 | | 150,307 |
JPMorgan Chase & Co. | 4,570,385 | | 169,744 |
NBH Holdings Corp. Class A (a)(g) | 576,500 | | 10,233 |
| | 360,367 |
Insurance - 1.9% |
ACE Ltd. | 494,636 | | 36,470 |
Amlin PLC | 1,942,409 | | 11,893 |
Berkshire Hathaway, Inc.: | | | |
Class A (a) | 234 | | 29,615 |
Class B (a) | 486,868 | | 41,062 |
Fairfax Financial Holdings Ltd. (sub. vtg.) | 71,900 | | 27,073 |
Hartford Financial Services Group, Inc. | 1,013,400 | | 18,170 |
MetLife, Inc. | 2,833,406 | | 96,704 |
Prudential Financial, Inc. | 178,800 | | 9,746 |
The Travelers Companies, Inc. | 1,037,039 | | 67,138 |
Torchmark Corp. | 494,632 | | 25,315 |
Validus Holdings Ltd. | 952,465 | | 31,917 |
| | 395,103 |
Real Estate Investment Trusts - 0.9% |
American Tower Corp. | 1,162,045 | | 81,808 |
Camden Property Trust (SBI) | 303,775 | | 21,091 |
Equity Lifestyle Properties, Inc. | 288,929 | | 19,867 |
Home Properties, Inc. | 29,800 | | 1,903 |
Japan Retail Fund Investment Corp. | 3,499 | | 5,991 |
Sun Communities, Inc. | 280,526 | | 12,851 |
The Macerich Co. | 685,541 | | 40,838 |
| | 184,349 |
Thrifts & Mortgage Finance - 0.3% |
Ocwen Financial Corp. (a) | 2,001,417 | | 51,496 |
TOTAL FINANCIALS | | 1,922,380 |
Common Stocks - continued |
| Shares | | Value (000s) |
HEALTH CARE - 7.5% |
Biotechnology - 2.3% |
Alexion Pharmaceuticals, Inc. (a) | 132,137 | | $ 14,166 |
Amgen, Inc. | 2,040,855 | | 171,269 |
Biogen Idec, Inc. (a) | 539,608 | | 79,101 |
BioMarin Pharmaceutical, Inc. (a) | 596,287 | | 22,265 |
CSL Ltd. | 293,502 | | 13,473 |
CSL Ltd. ADR | 379,200 | | 8,691 |
Gilead Sciences, Inc. (a) | 2,149,093 | | 123,981 |
Onyx Pharmaceuticals, Inc. (a) | 415,782 | | 29,903 |
Theravance, Inc. (a) | 198,850 | | 5,303 |
| | 468,152 |
Health Care Equipment & Supplies - 1.0% |
C.R. Bard, Inc. | 380,956 | | 37,376 |
Covidien PLC | 1,241,865 | | 69,607 |
Edwards Lifesciences Corp. (a) | 528,081 | | 53,922 |
Quidel Corp. (a)(e) | 1,317,147 | | 21,390 |
The Cooper Companies, Inc. | 406,065 | | 34,049 |
| | 216,344 |
Health Care Providers & Services - 1.3% |
Catamaran Corp. (a) | 165,961 | | 14,405 |
CIGNA Corp. | 816,351 | | 37,364 |
Express Scripts Holding Co. (a) | 402,065 | | 25,177 |
Henry Schein, Inc. (a) | 715,654 | | 54,969 |
McKesson Corp. | 373,348 | | 32,522 |
Omnicare, Inc. | 341,802 | | 11,068 |
UnitedHealth Group, Inc. | 1,782,107 | | 96,768 |
WellPoint, Inc. | 88,200 | | 5,281 |
| | 277,554 |
Pharmaceuticals - 2.9% |
Allergan, Inc. | 770,565 | | 66,369 |
Eli Lilly & Co. | 380,900 | | 17,106 |
GlaxoSmithKline PLC sponsored ADR | 553,190 | | 25,165 |
Merck & Co., Inc. | 2,594,840 | | 111,708 |
Optimer Pharmaceuticals, Inc. (a) | 568,104 | | 8,539 |
Pfizer, Inc. | 11,662,658 | | 278,271 |
Sanofi SA sponsored ADR | 590,703 | | 24,189 |
Valeant Pharmaceuticals International, Inc. (Canada) (a) | 1,099,375 | | 56,288 |
| | 587,635 |
TOTAL HEALTH CARE | | 1,549,685 |
Common Stocks - continued |
| Shares | | Value (000s) |
INDUSTRIALS - 6.6% |
Aerospace & Defense - 1.9% |
Honeywell International, Inc. | 1,388,553 | | $ 81,161 |
MTU Aero Engines Holdings AG | 218,364 | | 16,664 |
Precision Castparts Corp. | 334,903 | | 53,946 |
Raytheon Co. | 683,637 | | 38,639 |
Textron, Inc. | 2,095,158 | | 55,983 |
The Boeing Co. | 899,838 | | 64,248 |
United Technologies Corp. | 1,099,534 | | 87,798 |
| | 398,439 |
Air Freight & Logistics - 0.4% |
United Parcel Service, Inc. Class B | 1,230,637 | | 90,833 |
Building Products - 0.5% |
Armstrong World Industries, Inc. | 660,746 | | 29,053 |
Owens Corning (a) | 1,469,438 | | 49,020 |
Quanex Building Products Corp. | 947,855 | | 16,587 |
| | 94,660 |
Commercial Services & Supplies - 0.2% |
Stericycle, Inc. (a) | 347,149 | | 31,771 |
Electrical Equipment - 0.4% |
Regal-Beloit Corp. | 633,339 | | 43,105 |
Roper Industries, Inc. | 350,067 | | 35,983 |
| | 79,088 |
Industrial Conglomerates - 1.8% |
Danaher Corp. | 1,396,974 | | 74,836 |
General Electric Co. | 12,219,400 | | 253,064 |
Tyco International Ltd. | 804,119 | | 45,336 |
| | 373,236 |
Machinery - 0.6% |
Caterpillar, Inc. | 205,413 | | 17,528 |
Cummins, Inc. | 441,167 | | 42,842 |
Fiat Industrial SpA | 675,197 | | 6,798 |
Illinois Tool Works, Inc. | 763,773 | | 45,284 |
| | 112,452 |
Road & Rail - 0.7% |
CSX Corp. | 1,922,124 | | 43,171 |
J.B. Hunt Transport Services, Inc. | 191,549 | | 10,045 |
Union Pacific Corp. | 807,500 | | 98,063 |
| | 151,279 |
Common Stocks - continued |
| Shares | | Value (000s) |
INDUSTRIALS - continued |
Trading Companies & Distributors - 0.1% |
W.W. Grainger, Inc. | 95,800 | | $ 19,731 |
TOTAL INDUSTRIALS | | 1,351,489 |
INFORMATION TECHNOLOGY - 13.8% |
Communications Equipment - 2.2% |
Acme Packet, Inc. (a) | 677,252 | | 12,929 |
ADTRAN, Inc. | 1,098,668 | | 22,292 |
Finisar Corp. (a) | 983,487 | | 13,513 |
Juniper Networks, Inc. (a) | 2,780,146 | | 48,486 |
NETGEAR, Inc. (a) | 322,578 | | 11,797 |
QUALCOMM, Inc. | 5,382,555 | | 330,812 |
Riverbed Technology, Inc. (a) | 616,612 | | 12,326 |
| | 452,155 |
Computers & Peripherals - 5.4% |
Apple, Inc. | 1,541,738 | | 1,025,622 |
NetApp, Inc. (a) | 157,707 | | 5,444 |
SanDisk Corp. (a) | 1,988,456 | | 81,964 |
| | 1,113,030 |
Electronic Equipment & Components - 0.3% |
Hon Hai Precision Industry Co. Ltd. (Foxconn) | 10,180,000 | | 28,884 |
Jabil Circuit, Inc. | 1,846,550 | | 42,064 |
Uni-Pixel Inc. (a) | 90,300 | | 545 |
| | 71,493 |
Internet Software & Services - 1.0% |
Dice Holdings, Inc. (a) | 965,144 | | 7,702 |
eBay, Inc. (a) | 1,081,464 | | 51,337 |
Facebook, Inc. Class A | 856,127 | | 15,479 |
Google, Inc. Class A (a) | 135,830 | | 93,056 |
Mail.ru Group Ltd.: | | | |
GDR (g) | 391,234 | | 12,821 |
GDR (Reg. S) | 195,272 | | 6,399 |
VeriSign, Inc. (a) | 337,918 | | 16,112 |
| | 202,906 |
IT Services - 0.0% |
Accenture PLC Class A | 32,270 | | 1,988 |
Semiconductors & Semiconductor Equipment - 2.3% |
Analog Devices, Inc. | 3,381,391 | | 134,376 |
ARM Holdings PLC sponsored ADR | 641,300 | | 17,469 |
Common Stocks - continued |
| Shares | | Value (000s) |
INFORMATION TECHNOLOGY - continued |
Semiconductors & Semiconductor Equipment - continued |
ASAT Holdings Ltd. (a) | 88,719 | | $ 0 |
ASML Holding NV | 501,249 | | 28,456 |
Avago Technologies Ltd. | 1,928,985 | | 70,543 |
Dialog Semiconductor PLC (a) | 384,898 | | 8,286 |
Fairchild Semiconductor International, Inc. (a) | 841,711 | | 12,222 |
International Rectifier Corp. (a) | 676,289 | | 11,774 |
Maxim Integrated Products, Inc. | 1,194,297 | | 32,413 |
Micron Technology, Inc. (a) | 7,144,995 | | 44,370 |
NXP Semiconductors NV (a) | 1,327,116 | | 30,948 |
ON Semiconductor Corp. (a) | 2,754,511 | | 17,161 |
PMC-Sierra, Inc. (a) | 2,578,085 | | 15,082 |
RF Micro Devices, Inc. (a) | 4,914,586 | | 18,430 |
Rubicon Technology, Inc. (a)(e) | 123,185 | | 1,037 |
Skyworks Solutions, Inc. (a) | 1,141,255 | | 34,763 |
| | 477,330 |
Software - 2.6% |
Check Point Software Technologies Ltd. (a) | 1,096,779 | | 50,551 |
Citrix Systems, Inc. (a) | 1,544,850 | | 120,019 |
Microsoft Corp. | 10,609,586 | | 326,987 |
Sourcefire, Inc. (a) | 158,833 | | 8,242 |
VMware, Inc. Class A (a) | 226,267 | | 20,147 |
| | 525,946 |
TOTAL INFORMATION TECHNOLOGY | | 2,844,848 |
MATERIALS - 2.0% |
Chemicals - 1.4% |
Air Products & Chemicals, Inc. | 647,168 | | 53,443 |
E.I. du Pont de Nemours & Co. | 1,381,887 | | 68,749 |
Eastman Chemical Co. | 627,953 | | 34,701 |
Ecolab, Inc. | 494,778 | | 31,681 |
LyondellBasell Industries NV Class A | 491,016 | | 23,981 |
Sherwin-Williams Co. | 299,779 | | 42,892 |
Sigma Aldrich Corp. | 389,450 | | 27,663 |
| | 283,110 |
Containers & Packaging - 0.3% |
Ball Corp. | 669,211 | | 28,221 |
Rock-Tenn Co. Class A | 470,505 | | 31,416 |
| | 59,637 |
Common Stocks - continued |
| Shares | | Value (000s) |
MATERIALS - continued |
Metals & Mining - 0.3% |
First Quantum Minerals Ltd. (e) | 1,466,705 | | $ 28,255 |
Goldcorp, Inc. | 765,897 | | 31,444 |
Turquoise Hill Resources Ltd. (a) | 1,893,665 | | 15,215 |
| | 74,914 |
TOTAL MATERIALS | | 417,661 |
TELECOMMUNICATION SERVICES - 1.5% |
Diversified Telecommunication Services - 1.2% |
AT&T, Inc. | 1,892,026 | | 69,324 |
CenturyLink, Inc. | 1,777,204 | | 75,105 |
Verizon Communications, Inc. | 2,232,168 | | 95,849 |
| | 240,278 |
Wireless Telecommunication Services - 0.3% |
SBA Communications Corp. Class A (a) | 442,894 | | 26,476 |
Sprint Nextel Corp. (a) | 9,026,777 | | 43,780 |
| | 70,256 |
TOTAL TELECOMMUNICATION SERVICES | | 310,534 |
UTILITIES - 2.2% |
Electric Utilities - 1.4% |
American Electric Power Co., Inc. | 417,924 | | 17,967 |
Duke Energy Corp. | 1,406,380 | | 91,105 |
Edison International | 1,547,007 | | 67,743 |
FirstEnergy Corp. | 1,320,436 | | 57,703 |
NextEra Energy, Inc. | 926,475 | | 62,361 |
| | 296,879 |
Gas Utilities - 0.0% |
ONEOK, Inc. | 184,456 | | 8,214 |
Independent Power Producers & Energy Traders - 0.2% |
NRG Energy, Inc. | 243,000 | | 5,186 |
The AES Corp. | 2,731,715 | | 31,114 |
| | 36,300 |
Multi-Utilities - 0.6% |
CenterPoint Energy, Inc. | 1,386,952 | | 28,280 |
NiSource, Inc. | 698,474 | | 17,001 |
Common Stocks - continued |
| Shares | | Value (000s) |
UTILITIES - continued |
Multi-Utilities - continued |
PG&E Corp. | 592,029 | | $ 25,700 |
Sempra Energy | 750,345 | | 49,673 |
| | 120,654 |
TOTAL UTILITIES | | 462,047 |
TOTAL COMMON STOCKS (Cost $10,748,046) |
13,125,808
|
Convertible Preferred Stocks - 0.0% |
| | | |
CONSUMER DISCRETIONARY - 0.0% |
Media - 0.0% |
Jumptap, Inc. Series G (q) | 893,724 | | 6,429 |
INFORMATION TECHNOLOGY - 0.0% |
Semiconductors & Semiconductor Equipment - 0.0% |
ASAT Holdings Ltd. 13.00% (a) | 2,416 | | 0 |
TOTAL CONVERTIBLE PREFERRED STOCKS (Cost $6,519) |
6,429
|
Nonconvertible Bonds - 7.4% |
| Principal Amount (000s) | | |
CONSUMER DISCRETIONARY - 0.7% |
Automobiles - 0.2% |
Daimler Finance North America LLC 1.65% 4/10/15 (g) | | $ 20,636 | | 20,903 |
Volkswagen International Finance NV 2.375% 3/22/17 (g) | | 10,000 | | 10,328 |
| | 31,231 |
Media - 0.5% |
AOL Time Warner, Inc. 7.625% 4/15/31 | | 4,975 | | 6,762 |
Comcast Corp.: | | | | |
4.65% 7/15/42 | | 5,049 | | 5,392 |
5.15% 3/1/20 | | 644 | | 767 |
6.4% 3/1/40 | | 6,097 | | 8,023 |
COX Communications, Inc. 4.625% 6/1/13 | | 3,612 | | 3,720 |
Discovery Communications LLC 3.7% 6/1/15 | | 5,116 | | 5,485 |
Nonconvertible Bonds - continued |
| Principal Amount (000s) | | Value (000s) |
CONSUMER DISCRETIONARY - continued |
Media - continued |
NBCUniversal Media LLC: | | | | |
5.15% 4/30/20 | | $ 7,276 | | $ 8,592 |
6.4% 4/30/40 | | 6,271 | | 8,138 |
News America Holdings, Inc. 7.75% 12/1/45 | | 8,630 | | 11,735 |
News America, Inc. 6.15% 2/15/41 | | 9,222 | | 11,348 |
Time Warner Cable, Inc.: | | | | |
4.5% 9/15/42 | | 5,093 | | 5,071 |
5.5% 9/1/41 | | 13,538 | | 15,346 |
6.2% 7/1/13 | | 2,729 | | 2,854 |
6.75% 7/1/18 | | 1,378 | | 1,724 |
Time Warner, Inc.: | | | | |
5.875% 11/15/16 | | 4,125 | | 4,884 |
6.2% 3/15/40 | | 3,821 | | 4,697 |
6.5% 11/15/36 | | 2,758 | | 3,449 |
| | 107,987 |
Specialty Retail - 0.0% |
Staples, Inc. 7.375% 10/1/12 | | 820 | | 824 |
TOTAL CONSUMER DISCRETIONARY | | 140,042 |
CONSUMER STAPLES - 0.5% |
Beverages - 0.1% |
Beam, Inc.: | | | | |
1.875% 5/15/17 | | 1,331 | | 1,359 |
3.25% 5/15/22 | | 1,578 | | 1,636 |
Diageo Capital PLC 5.2% 1/30/13 | | 4,139 | | 4,219 |
FBG Finance Ltd. 5.125% 6/15/15 (g) | | 3,447 | | 3,811 |
Fortune Brands, Inc.: | | | | |
5.375% 1/15/16 | | 1,615 | | 1,840 |
5.875% 1/15/36 | | 6,416 | | 7,676 |
6.375% 6/15/14 | | 482 | | 527 |
SABMiller Holdings, Inc. 3.75% 1/15/22 (g) | | 5,490 | | 5,958 |
| | 27,026 |
Food Products - 0.0% |
Cargill, Inc. 6% 11/27/17 (g) | | 572 | | 695 |
Kraft Foods, Inc.: | | | | |
6.5% 2/9/40 | | 3,854 | | 5,316 |
6.75% 2/19/14 | | 436 | | 474 |
| | 6,485 |
Nonconvertible Bonds - continued |
| Principal Amount (000s) | | Value (000s) |
CONSUMER STAPLES - continued |
Tobacco - 0.4% |
Altria Group, Inc.: | | | | |
2.85% 8/9/22 | | $ 4,604 | | $ 4,591 |
4.25% 8/9/42 | | 4,604 | | 4,500 |
9.7% 11/10/18 | | 16,451 | | 23,620 |
Philip Morris International, Inc. 1.125% 8/21/17 | | 24,419 | | 24,374 |
Reynolds American, Inc.: | | | | |
6.75% 6/15/17 | | 3,486 | | 4,223 |
7.25% 6/15/37 | | 7,569 | | 9,708 |
| | 71,016 |
TOTAL CONSUMER STAPLES | | 104,527 |
ENERGY - 1.1% |
Energy Equipment & Services - 0.2% |
DCP Midstream LLC: | | | | |
4.75% 9/30/21 (g) | | 6,554 | | 6,949 |
5.35% 3/15/20 (g) | | 6,637 | | 7,281 |
El Paso Pipeline Partners Operating Co. LLC: | | | | |
4.1% 11/15/15 | | 7,675 | | 8,099 |
5% 10/1/21 | | 2,791 | | 3,050 |
6.5% 4/1/20 | | 1,091 | | 1,287 |
Transocean, Inc.: | | | | |
5.05% 12/15/16 | | 4,522 | | 5,009 |
6.375% 12/15/21 | | 5,971 | | 7,198 |
Weatherford International Ltd.: | | | | |
4.95% 10/15/13 | | 2,045 | | 2,130 |
5.15% 3/15/13 | | 2,673 | | 2,730 |
| | 43,733 |
Oil, Gas & Consumable Fuels - 0.9% |
Anadarko Petroleum Corp.: | | | | |
5.95% 9/15/16 | | 718 | | 830 |
6.375% 9/15/17 | | 13,514 | | 16,161 |
Canadian Natural Resources Ltd. 5.15% 2/1/13 | | 5,282 | | 5,380 |
Duke Capital LLC 6.25% 2/15/13 | | 809 | | 829 |
Duke Energy Field Services: | | | | |
5.375% 10/15/15 (g) | | 1,435 | | 1,545 |
6.45% 11/3/36 (g) | | 6,493 | | 7,497 |
El Paso Natural Gas Co. 5.95% 4/15/17 | | 1,098 | | 1,258 |
Enbridge Energy Partners LP 4.2% 9/15/21 | | 7,741 | | 8,264 |
Encana Holdings Finance Corp. 5.8% 5/1/14 | | 3,391 | | 3,644 |
Nonconvertible Bonds - continued |
| Principal Amount (000s) | | Value (000s) |
ENERGY - continued |
Oil, Gas & Consumable Fuels - continued |
Enterprise Products Operating LP: | | | | |
5.6% 10/15/14 | | $ 715 | | $ 783 |
5.65% 4/1/13 | | 563 | | 577 |
Gulfstream Natural Gas System LLC 6.95% 6/1/16 (g) | | 327 | | 382 |
Marathon Petroleum Corp. 5.125% 3/1/21 | | 4,207 | | 4,837 |
Midcontinent Express Pipeline LLC 5.45% 9/15/14 (g) | | 6,234 | | 6,430 |
Motiva Enterprises LLC 6.85% 1/15/40 (g) | | 4,294 | | 5,662 |
Nakilat, Inc. 6.067% 12/31/33 (g) | | 2,490 | | 2,944 |
Nexen, Inc. 5.2% 3/10/15 | | 1,067 | | 1,161 |
Petrobras International Finance Co. Ltd.: | | | | |
3.875% 1/27/16 | | 6,946 | | 7,293 |
7.875% 3/15/19 | | 7,382 | | 9,153 |
Petroleos Mexicanos: | | | | |
4.875% 1/24/22 (g) | | 1,430 | | 1,605 |
5.5% 1/21/21 | | 7,423 | | 8,666 |
5.5% 6/27/44 (g) | | 6,720 | | 7,308 |
6% 3/5/20 | | 952 | | 1,135 |
6.5% 6/2/41 (g) | | 8,760 | | 10,884 |
Phillips 66: | | | | |
4.3% 4/1/22 (g) | | 6,038 | | 6,580 |
5.875% 5/1/42 (g) | | 5,485 | | 6,484 |
Plains All American Pipeline LP/PAA Finance Corp.: | | | | |
3.65% 6/1/22 | | 3,381 | | 3,575 |
3.95% 9/15/15 | | 149 | | 161 |
4.25% 9/1/12 | | 718 | | 718 |
6.125% 1/15/17 | | 1,940 | | 2,301 |
Ras Laffan Liquefied Natural Gas Co. Ltd. III: | | | | |
4.5% 9/30/12 (g) | | 3,472 | | 3,472 |
5.5% 9/30/14 (g) | | 5,137 | | 5,535 |
5.832% 9/30/16 (g) | | 1,121 | | 1,222 |
6.332% 9/30/27 (g) | | 5,910 | | 6,988 |
6.75% 9/30/19 (g) | | 3,177 | | 3,939 |
Rockies Express Pipeline LLC 6.25% 7/15/13 (g) | | 3,193 | | 3,289 |
Southeast Supply Header LLC 4.85% 8/15/14 (g) | | 543 | | 571 |
Spectra Energy Capital, LLC 5.65% 3/1/20 | | 455 | | 525 |
Spectra Energy Partners, LP: | | | | |
2.95% 6/15/16 | | 1,325 | | 1,352 |
4.6% 6/15/21 | | 1,733 | | 1,882 |
Texas Eastern Transmission LP 6% 9/15/17 (g) | | 1,301 | | 1,513 |
Nonconvertible Bonds - continued |
| Principal Amount (000s) | | Value (000s) |
ENERGY - continued |
Oil, Gas & Consumable Fuels - continued |
TransCapitalInvest Ltd. 5.67% 3/5/14 (g) | | $ 4,215 | | $ 4,457 |
Western Gas Partners LP 5.375% 6/1/21 | | 7,979 | | 8,862 |
| | 177,654 |
TOTAL ENERGY | | 221,387 |
FINANCIALS - 3.2% |
Capital Markets - 0.2% |
BlackRock, Inc. 3.375% 6/1/22 | | 3,840 | | 4,063 |
Goldman Sachs Group, Inc.: | | | | |
5.95% 1/18/18 | | 4,684 | | 5,269 |
6.15% 4/1/18 | | 1,671 | | 1,900 |
Lazard Group LLC: | | | | |
6.85% 6/15/17 | | 4,528 | | 5,108 |
7.125% 5/15/15 | | 1,616 | | 1,773 |
Merrill Lynch & Co., Inc.: | | | | |
6.11% 1/29/37 | | 5,110 | | 5,138 |
6.4% 8/28/17 | | 4,179 | | 4,749 |
Morgan Stanley: | | | | |
5.5% 7/28/21 | | 7,030 | | 7,212 |
5.625% 9/23/19 | | 1,795 | | 1,858 |
5.75% 1/25/21 | | 2,403 | | 2,483 |
7.3% 5/13/19 | | 6,528 | | 7,367 |
| | 46,920 |
Commercial Banks - 0.6% |
Bank of America NA 5.3% 3/15/17 | | 8,427 | | 9,173 |
BB&T Corp. 3.95% 3/22/22 | | 6,787 | | 7,330 |
Credit Suisse New York Branch 6% 2/15/18 | | 15,195 | | 16,877 |
Discover Bank: | | | | |
7% 4/15/20 | | 3,831 | | 4,509 |
8.7% 11/18/19 | | 2,425 | | 3,070 |
Fifth Third Bancorp: | | | | |
4.5% 6/1/18 | | 584 | | 634 |
8.25% 3/1/38 | | 4,070 | | 5,690 |
Fifth Third Bank 4.75% 2/1/15 | | 951 | | 1,014 |
Fifth Third Capital Trust IV 6.5% 4/15/67 (m) | | 4,393 | | 4,393 |
HBOS PLC 6.75% 5/21/18 (g) | | 560 | | 553 |
HSBC Holdings PLC 4% 3/30/22 | | 5,850 | | 6,276 |
Huntington Bancshares, Inc. 7% 12/15/20 | | 1,908 | | 2,278 |
JPMorgan Chase Bank 6% 10/1/17 | | 2,460 | | 2,897 |
Nonconvertible Bonds - continued |
| Principal Amount (000s) | | Value (000s) |
FINANCIALS - continued |
Commercial Banks - continued |
KeyBank NA: | | | | |
5.45% 3/3/16 | | $ 2,765 | | $ 3,092 |
5.8% 7/1/14 | | 5,776 | | 6,190 |
Marshall & Ilsley Bank: | | | | |
4.85% 6/16/15 | | 3,561 | | 3,840 |
5% 1/17/17 | | 9,004 | | 10,094 |
5.25% 9/4/12 | | 2,221 | | 2,221 |
Regions Bank: | | | | |
6.45% 6/26/37 | | 9,201 | | 9,213 |
7.5% 5/15/18 | | 3,852 | | 4,488 |
Regions Financial Corp.: | | | | |
5.75% 6/15/15 | | 1,443 | | 1,533 |
7.75% 11/10/14 | | 6,740 | | 7,466 |
UnionBanCal Corp. 5.25% 12/16/13 | | 777 | | 813 |
Wachovia Corp.: | | | | |
5.625% 10/15/16 | | 3,991 | | 4,596 |
5.75% 6/15/17 | | 2,371 | | 2,830 |
Wells Fargo & Co. 3.676% 6/15/16 | | 3,236 | | 3,521 |
| | 124,591 |
Consumer Finance - 0.4% |
Capital One Financial Corp. 2.15% 3/23/15 | | 20,318 | | 20,810 |
Discover Financial Services: | | | | |
5.2% 4/27/22 | | 1,290 | | 1,372 |
6.45% 6/12/17 | | 12,103 | | 13,712 |
Ford Motor Credit Co. LLC 2.5% 1/15/16 | | 16,000 | | 16,005 |
General Electric Capital Corp. 5.625% 9/15/17 | | 15,752 | | 18,615 |
HSBC USA, Inc. 2.375% 2/13/15 | | 8,675 | | 8,889 |
| | 79,403 |
Diversified Financial Services - 0.5% |
Bank of America Corp.: | | | | |
3.875% 3/22/17 | | 7,618 | | 8,027 |
5.65% 5/1/18 | | 1,270 | | 1,419 |
5.7% 1/24/22 | | 12,760 | | 14,439 |
5.75% 12/1/17 | | 11,990 | | 13,408 |
5.875% 2/7/42 | | 5,117 | | 5,815 |
BP Capital Markets PLC: | | | | |
3.625% 5/8/14 | | 4,599 | | 4,828 |
4.5% 10/1/20 | | 961 | | 1,119 |
4.742% 3/11/21 | | 6,000 | | 7,044 |
Nonconvertible Bonds - continued |
| Principal Amount (000s) | | Value (000s) |
FINANCIALS - continued |
Diversified Financial Services - continued |
Capital One Capital V 10.25% 8/15/39 | | $ 4,813 | | $ 4,957 |
Citigroup, Inc.: | | | | |
2.25% 8/7/15 | | 5,000 | | 5,043 |
4.75% 5/19/15 | | 11,282 | | 12,112 |
6.125% 5/15/18 | | 1,701 | | 1,973 |
6.5% 8/19/13 | | 19,655 | | 20,671 |
JPMorgan Chase & Co. 3.15% 7/5/16 | | 10,650 | | 11,276 |
TECO Finance, Inc. 4% 3/15/16 | | 1,828 | | 1,982 |
| | 114,113 |
Insurance - 0.7% |
American International Group, Inc.: | | | | |
2.375% 8/24/15 | | 16,000 | | 16,028 |
4.875% 6/1/22 | | 3,000 | | 3,272 |
Aon Corp.: | | | | |
3.125% 5/27/16 | | 4,391 | | 4,638 |
3.5% 9/30/15 | | 3,180 | | 3,353 |
Axis Capital Holdings Ltd. 5.75% 12/1/14 | | 452 | | 486 |
Great-West Life & Annuity Insurance Co. 7.153% 5/16/46 (g)(m) | | 1,750 | | 1,785 |
Hartford Financial Services Group, Inc.: | | | | |
5.125% 4/15/22 | | 11,774 | | 12,663 |
5.375% 3/15/17 | | 287 | | 314 |
6.625% 4/15/42 | | 9,968 | | 11,222 |
Liberty Mutual Group, Inc.: | | | | |
5% 6/1/21 (g) | | 8,525 | | 8,953 |
6.5% 3/15/35 (g) | | 1,315 | | 1,412 |
Marsh & McLennan Companies, Inc. 4.8% 7/15/21 | | 4,458 | | 5,008 |
Massachusetts Mutual Life Insurance Co. 5.375% 12/1/41 (g) | | 3,576 | | 4,078 |
MetLife, Inc.: | | | | |
5% 6/15/15 | | 941 | | 1,045 |
6.75% 6/1/16 | | 5,158 | | 6,169 |
Metropolitan Life Global Funding I: | | | | |
5.125% 4/10/13 (g) | | 452 | | 464 |
5.125% 6/10/14 (g) | | 4,625 | | 4,972 |
Monumental Global Funding III 5.5% 4/22/13 (g) | | 2,585 | | 2,647 |
Northwestern Mutual Life Insurance Co. 6.063% 3/30/40 (g) | | 4,915 | | 6,329 |
Pacific Life Insurance Co. 9.25% 6/15/39 (g) | | 3,353 | | 4,566 |
Pacific LifeCorp 6% 2/10/20 (g) | | 5,390 | | 6,002 |
Nonconvertible Bonds - continued |
| Principal Amount (000s) | | Value (000s) |
FINANCIALS - continued |
Insurance - continued |
Prudential Financial, Inc.: | | | | |
3.875% 1/14/15 | | $ 5,340 | | $ 5,663 |
5.15% 1/15/13 | | 2,934 | | 2,982 |
6.2% 11/15/40 | | 2,535 | | 2,989 |
7.375% 6/15/19 | | 2,520 | | 3,173 |
Symetra Financial Corp. 6.125% 4/1/16 (g) | | 5,955 | | 6,479 |
Unum Group: | | | | |
5.625% 9/15/20 | | 3,667 | | 4,051 |
5.75% 8/15/42 | | 5,242 | | 5,405 |
7.125% 9/30/16 | | 869 | | 1,012 |
| | 137,160 |
Real Estate Investment Trusts - 0.3% |
Alexandria Real Estate Equities, Inc. 4.6% 4/1/22 | | 1,925 | | 2,029 |
AvalonBay Communities, Inc. 4.95% 3/15/13 | | 296 | | 302 |
Boston Properties, Inc. 3.85% 2/1/23 | | 4,358 | | 4,562 |
BRE Properties, Inc. 5.5% 3/15/17 | | 977 | | 1,109 |
Camden Property Trust: | | | | |
5.375% 12/15/13 | | 3,103 | | 3,257 |
5.875% 11/30/12 | | 542 | | 548 |
DDR Corp. 4.625% 7/15/22 | | 2,262 | | 2,346 |
Developers Diversified Realty Corp.: | | | | |
4.75% 4/15/18 | | 5,964 | | 6,393 |
7.5% 4/1/17 | | 4,622 | | 5,411 |
Duke Realty LP: | | | | |
4.375% 6/15/22 | | 3,546 | | 3,707 |
4.625% 5/15/13 | | 967 | | 987 |
5.4% 8/15/14 | | 771 | | 823 |
5.5% 3/1/16 | | 3,075 | | 3,372 |
6.75% 3/15/20 | | 560 | | 675 |
8.25% 8/15/19 | | 2,489 | | 3,148 |
Equity One, Inc.: | | | | |
5.375% 10/15/15 | | 948 | | 1,023 |
6% 9/15/17 | | 717 | | 798 |
6.25% 12/15/14 | | 1,000 | | 1,084 |
6.25% 1/15/17 | | 399 | | 445 |
Federal Realty Investment Trust: | | | | |
5.4% 12/1/13 | | 355 | | 373 |
5.9% 4/1/20 | | 1,860 | | 2,227 |
6.2% 1/15/17 | | 501 | | 583 |
HCP, Inc. 3.15% 8/1/22 | | 7,000 | | 6,835 |
Nonconvertible Bonds - continued |
| Principal Amount (000s) | | Value (000s) |
FINANCIALS - continued |
Real Estate Investment Trusts - continued |
Health Care REIT, Inc. 4.125% 4/1/19 | | $ 13,700 | | $ 14,415 |
HRPT Properties Trust: | | | | |
5.75% 11/1/15 | | 1,731 | | 1,818 |
6.25% 6/15/17 | | 996 | | 1,093 |
6.65% 1/15/18 | | 676 | | 750 |
Washington (REIT) 5.25% 1/15/14 | | 476 | | 497 |
| | 70,610 |
Real Estate Management & Development - 0.5% |
AMB Property LP 5.9% 8/15/13 | | 2,086 | | 2,160 |
BioMed Realty LP: | | | | |
3.85% 4/15/16 | | 7,000 | | 7,316 |
4.25% 7/15/22 | | 2,970 | | 3,100 |
6.125% 4/15/20 | | 2,467 | | 2,878 |
Brandywine Operating Partnership LP 5.7% 5/1/17 | | 129 | | 141 |
Digital Realty Trust LP: | | | | |
4.5% 7/15/15 | | 3,650 | | 3,866 |
5.25% 3/15/21 | | 4,138 | | 4,570 |
ERP Operating LP: | | | | |
4.625% 12/15/21 | | 12,970 | | 14,876 |
4.75% 7/15/20 | | 5,288 | | 5,990 |
5.5% 10/1/12 | | 382 | | 383 |
5.75% 6/15/17 | | 2,042 | | 2,406 |
Liberty Property LP: | | | | |
4.125% 6/15/22 | | 3,041 | | 3,156 |
4.75% 10/1/20 | | 7,482 | | 8,153 |
5.125% 3/2/15 | | 1,229 | | 1,320 |
5.5% 12/15/16 | | 1,772 | | 1,987 |
Mack-Cali Realty LP: | | | | |
4.5% 4/18/22 | | 1,907 | | 2,021 |
7.75% 8/15/19 | | 1,036 | | 1,273 |
Post Apartment Homes LP 6.3% 6/1/13 | | 3,079 | | 3,167 |
Prime Property Funding, Inc.: | | | | |
5.125% 6/1/15 (g) | | 2,258 | | 2,304 |
5.5% 1/15/14 (g) | | 816 | | 836 |
5.7% 4/15/17 (g) | | 1,991 | | 2,082 |
Regency Centers LP: | | | | |
4.95% 4/15/14 | | 494 | | 518 |
5.25% 8/1/15 | | 1,725 | | 1,878 |
5.875% 6/15/17 | | 877 | | 1,008 |
Nonconvertible Bonds - continued |
| Principal Amount (000s) | | Value (000s) |
FINANCIALS - continued |
Real Estate Management & Development - continued |
Simon Property Group LP: | | | | |
4.2% 2/1/15 | | $ 2,640 | | $ 2,816 |
6.75% 5/15/14 | | 5,698 | | 6,163 |
Tanger Properties LP: | | | | |
6.125% 6/1/20 | | 9,256 | | 10,984 |
6.15% 11/15/15 | | 1,254 | | 1,400 |
| | 98,752 |
TOTAL FINANCIALS | | 671,549 |
HEALTH CARE - 0.3% |
Biotechnology - 0.1% |
Amgen, Inc. 5.15% 11/15/41 | | 17,224 | | 18,836 |
Celgene Corp. 2.45% 10/15/15 | | 907 | | 939 |
| | 19,775 |
Health Care Providers & Services - 0.2% |
Aristotle Holding, Inc.: | | | | |
4.75% 11/15/21 (g) | | 10,952 | | 12,640 |
6.125% 11/15/41 (g) | | 5,466 | | 7,131 |
Coventry Health Care, Inc.: | | | | |
5.95% 3/15/17 | | 1,413 | | 1,652 |
6.3% 8/15/14 | | 2,925 | | 3,170 |
Express Scripts, Inc. 6.25% 6/15/14 | | 1,991 | | 2,175 |
Medco Health Solutions, Inc.: | | | | |
2.75% 9/15/15 | | 1,740 | | 1,820 |
4.125% 9/15/20 | | 5,031 | | 5,468 |
| | 34,056 |
Pharmaceuticals - 0.0% |
Watson Pharmaceuticals, Inc. 5% 8/15/14 | | 1,065 | | 1,133 |
TOTAL HEALTH CARE | | 54,964 |
INDUSTRIALS - 0.3% |
Aerospace & Defense - 0.1% |
BAE Systems Holdings, Inc.: | | | | |
4.95% 6/1/14 (g) | | 846 | | 892 |
6.375% 6/1/19 (g) | | 5,000 | | 5,971 |
| | 6,863 |
Nonconvertible Bonds - continued |
| Principal Amount (000s) | | Value (000s) |
INDUSTRIALS - continued |
Airlines - 0.0% |
Continental Airlines, Inc.: | | | | |
6.648% 3/15/19 | | $ 2,631 | | $ 2,775 |
6.9% 7/2/19 | | 798 | | 863 |
U.S. Airways pass-thru trust certificates: | | | | |
6.85% 1/30/18 | | 1,522 | | 1,591 |
8.36% 1/20/19 | | 1,259 | | 1,366 |
| | 6,595 |
Road & Rail - 0.2% |
Burlington Northern Santa Fe LLC: | | | | |
4.4% 3/15/42 | | 18,995 | | 20,003 |
5.05% 3/1/41 | | 8,624 | | 9,904 |
Norfolk Southern Corp. 3% 4/1/22 | | 13,653 | | 14,156 |
| | 44,063 |
TOTAL INDUSTRIALS | | 57,521 |
INFORMATION TECHNOLOGY - 0.1% |
Electronic Equipment & Components - 0.0% |
Tyco Electronics Group SA: | | | | |
5.95% 1/15/14 | | 3,694 | | 3,940 |
6% 10/1/12 | | 4,552 | | 4,570 |
6.55% 10/1/17 | | 1,119 | | 1,353 |
| | 9,863 |
Office Electronics - 0.1% |
Xerox Corp.: | | | | |
1.8679% 9/13/13 (m) | | 10,110 | | 10,180 |
4.25% 2/15/15 | | 545 | | 580 |
4.5% 5/15/21 | | 2,447 | | 2,572 |
| | 13,332 |
TOTAL INFORMATION TECHNOLOGY | | 23,195 |
MATERIALS - 0.2% |
Chemicals - 0.1% |
Dow Chemical Co. 7.6% 5/15/14 | | 10,939 | | 12,139 |
Construction Materials - 0.0% |
CRH America, Inc. 6% 9/30/16 | | 2,152 | | 2,388 |
Metals & Mining - 0.1% |
Anglo American Capital PLC 9.375% 4/8/14 (g) | | 1,278 | | 1,433 |
Nonconvertible Bonds - continued |
| Principal Amount (000s) | | Value (000s) |
MATERIALS - continued |
Metals & Mining - continued |
Corporacion Nacional del Cobre de Chile (Codelco): | | | | |
3.875% 11/3/21 (g) | | $ 6,889 | | $ 7,434 |
6.375% 11/30/12 (g) | | 1,618 | | 1,637 |
Vale Overseas Ltd.: | | | | |
4.375% 1/11/22 | | 6,000 | | 6,154 |
6.25% 1/23/17 | | 2,726 | | 3,125 |
| | 19,783 |
TOTAL MATERIALS | | 34,310 |
TELECOMMUNICATION SERVICES - 0.3% |
Diversified Telecommunication Services - 0.2% |
AT&T, Inc. 6.8% 5/15/36 | | 9,241 | | 12,642 |
BellSouth Capital Funding Corp. 7.875% 2/15/30 | | 1,158 | | 1,574 |
CenturyLink, Inc.: | | | | |
6.15% 9/15/19 | | 3,372 | | 3,671 |
6.45% 6/15/21 | | 3,263 | | 3,644 |
7.6% 9/15/39 | | 1,011 | | 1,046 |
Embarq Corp. 7.995% 6/1/36 | | 3,741 | | 4,142 |
Telefonica Emisiones SAU 5.462% 2/16/21 | | 4,994 | | 4,594 |
Verizon Communications, Inc.: | | | | |
6.1% 4/15/18 | | 2,674 | | 3,341 |
6.25% 4/1/37 | | 4,611 | | 6,123 |
| | 40,777 |
Wireless Telecommunication Services - 0.1% |
America Movil SAB de CV 3.625% 3/30/15 | | 1,082 | | 1,155 |
DIRECTV Holdings LLC/DIRECTV Financing, Inc.: | | | | |
5.15% 3/15/42 | | 3,616 | | 3,696 |
5.875% 10/1/19 | | 8,810 | | 10,362 |
6.35% 3/15/40 | | 2,500 | | 2,945 |
Vodafone Group PLC 5% 12/16/13 | | 2,696 | | 2,849 |
| | 21,007 |
TOTAL TELECOMMUNICATION SERVICES | | 61,784 |
UTILITIES - 0.7% |
Electric Utilities - 0.4% |
Ameren Illinois Co. 6.125% 11/15/17 | | 333 | | 393 |
AmerenUE 6.4% 6/15/17 | | 3,507 | | 4,209 |
Nonconvertible Bonds - continued |
| Principal Amount (000s) | | Value (000s) |
UTILITIES - continued |
Electric Utilities - continued |
Cleveland Electric Illuminating Co. 5.65% 12/15/13 | | $ 4,829 | | $ 5,092 |
Duke Capital LLC 5.668% 8/15/14 | | 2,413 | | 2,601 |
Duquesne Light Holdings, Inc.: | | | | |
5.9% 12/1/21 (g) | | 5,410 | | 6,106 |
6.4% 9/15/20 (g) | | 10,602 | | 12,253 |
Edison International 3.75% 9/15/17 | | 4,275 | | 4,571 |
Enel Finance International SA 5.7% 1/15/13 (g) | | 305 | | 308 |
FirstEnergy Corp. 7.375% 11/15/31 | | 9,223 | | 12,171 |
FirstEnergy Solutions Corp.: | | | | |
4.8% 2/15/15 | | 1,798 | | 1,920 |
6.05% 8/15/21 | | 6,625 | | 7,372 |
LG&E and KU Energy LLC: | | | | |
2.125% 11/15/15 | | 4,999 | | 5,050 |
3.75% 11/15/20 | | 984 | | 1,019 |
Nevada Power Co.: | | | | |
6.5% 5/15/18 | | 5,290 | | 6,602 |
6.5% 8/1/18 | | 1,844 | | 2,312 |
Pennsylvania Electric Co. 6.05% 9/1/17 | | 618 | | 710 |
Pepco Holdings, Inc. 2.7% 10/1/15 | | 4,728 | | 4,870 |
Sierra Pacific Power Co. 5.45% 9/1/13 | | 1,831 | | 1,909 |
| | 79,468 |
Gas Utilities - 0.0% |
Southern Natural Gas Co. 5.9% 4/1/17 (g) | | 357 | | 420 |
Southern Natural Gas Co. / Southern Natural Issuing Corp. 4.4% 6/15/21 | | 2,360 | | 2,533 |
| | 2,953 |
Independent Power Producers & Energy Traders - 0.0% |
PSEG Power LLC 2.75% 9/15/16 | | 1,703 | | 1,777 |
Multi-Utilities - 0.3% |
Dominion Resources, Inc.: | | | | |
2.7606% 9/30/66 (m) | | 13,426 | | 12,223 |
7.5% 6/30/66 (m) | | 3,828 | | 4,139 |
MidAmerican Energy Holdings, Co.: | | | | |
5.875% 10/1/12 | | 3,227 | | 3,239 |
6.5% 9/15/37 | | 3,287 | | 4,491 |
National Grid PLC 6.3% 8/1/16 | | 407 | | 470 |
NiSource Finance Corp.: | | | | |
4.45% 12/1/21 | | 2,779 | | 3,007 |
5.25% 9/15/17 | | 682 | | 786 |
Nonconvertible Bonds - continued |
| Principal Amount (000s) | | Value (000s) |
UTILITIES - continued |
Multi-Utilities - continued |
NiSource Finance Corp.: - continued | | | | |
5.25% 2/15/43 | | $ 4,557 | | $ 5,046 |
5.4% 7/15/14 | | 6,582 | | 7,075 |
5.45% 9/15/20 | | 980 | | 1,120 |
5.8% 2/1/42 | | 3,785 | | 4,503 |
6.4% 3/15/18 | | 1,557 | | 1,864 |
6.8% 1/15/19 | | 4,065 | | 4,874 |
Sempra Energy 2.3% 4/1/17 | | 7,119 | | 7,446 |
Wisconsin Energy Corp. 6.25% 5/15/67 (m) | | 3,554 | | 3,763 |
| | 64,046 |
TOTAL UTILITIES | | 148,244 |
TOTAL NONCONVERTIBLE BONDS (Cost $1,363,957) |
1,517,523
|
U.S. Government and Government Agency Obligations - 4.9% |
|
U.S. Treasury Inflation Protected Obligations - 1.0% |
U.S. Treasury Inflation-Indexed Bonds: | | | | |
0.75% 2/15/42 | | 129,548 | | 142,315 |
2.125% 2/15/41 | | 44,924 | | 66,568 |
TOTAL U.S. TREASURY INFLATION PROTECTED OBLIGATIONS | | 208,883 |
U.S. Treasury Obligations - 3.9% |
U.S. Treasury Bills, yield at date of purchase 0.1% 11/23/12 (i) | | 6,110 | | 6,109 |
U.S. Treasury Bonds 3% 5/15/42 | | 83,902 | | 89,801 |
U.S. Treasury Notes: | | | | |
0.5% 7/31/17 | | 151,500 | | 150,896 |
0.75% 6/30/17 (j) | | 40,000 | | 40,338 |
0.875% 7/31/19 | | 175,011 | | 173,712 |
U.S. Government and Government Agency Obligations - continued |
| Principal Amount (000s) | | Value (000s) |
U.S. Treasury Obligations - continued |
U.S. Treasury Notes: - continued | | | | |
1% 8/31/19 | | $ 195,000 | | $ 194,985 |
1.625% 8/15/22 | | 155,000 | | 156,017 |
TOTAL U.S. TREASURY OBLIGATIONS | | 811,858 |
TOTAL U.S. GOVERNMENT AND GOVERNMENT AGENCY OBLIGATIONS (Cost $990,501) |
1,020,741
|
U.S. Government Agency - Mortgage Securities - 8.8% |
|
Fannie Mae - 7.2% |
2.558% 6/1/36 (m) | | 181 | | 194 |
2.777% 7/1/37 (m) | | 544 | | 585 |
3% 4/1/27 to 8/1/42 | | 30,176 | | 31,504 |
3% 9/1/27 (h) | | 9,100 | | 9,603 |
3% 9/1/27 (h) | | 9,300 | | 9,814 |
3% 9/1/27 (h) | | 8,000 | | 8,442 |
3% 9/1/42 (h) | | 700 | | 726 |
3% 9/1/42 (h) | | 195,900 | | 203,280 |
3% 9/1/42 (h) | | 11,300 | | 11,726 |
3% 9/1/42 (h) | | 184,600 | | 191,554 |
3% 10/1/42 (h) | | 135,900 | | 140,487 |
3.5% 1/1/21 to 8/1/42 | | 25,483 | | 27,231 |
3.5% 9/1/27 (h) | | 4,000 | | 4,253 |
3.5% 7/1/42 | | 84 | | 90 |
3.5% 7/1/42 | | 122 | | 130 |
3.5% 8/1/42 | | 156 | | 167 |
3.5% 8/1/42 | | 144 | | 154 |
3.5% 9/1/42 (h) | | 268,800 | | 285,012 |
3.5% 9/1/42 (h) | | 3,700 | | 3,923 |
3.5% 9/1/42 (h) | | 7,300 | | 7,740 |
4% 9/1/26 to 4/1/42 | | 43,345 | | 46,757 |
4% 9/1/41 | | 132 | | 142 |
4% 9/1/42 (h) | | 77,000 | | 82,570 |
4.5% 6/1/18 to 7/1/41 | | 31,845 | | 34,882 |
4.5% 9/1/42 (h) | | 69,000 | | 74,682 |
4.5% 9/1/42 (h) | | 5,600 | | 6,061 |
5% 12/1/25 to 5/1/40 | | 35,141 | | 38,607 |
5% 9/1/42 (h) | | 1,300 | | 1,420 |
U.S. Government Agency - Mortgage Securities - continued |
| Principal Amount (000s) | | Value (000s) |
Fannie Mae - continued |
5% 9/1/42 (h) | | $ 500 | | $ 546 |
5% 9/1/42 (h) | | 52,000 | | 56,794 |
5.5% 9/1/24 to 3/1/40 | | 40,142 | | 44,126 |
5.5% 9/1/42 (h) | | 60,000 | | 65,845 |
6% 6/1/35 to 4/1/40 | | 52,455 | | 57,935 |
6% 9/1/42 (h) | | 40,000 | | 44,078 |
TOTAL FANNIE MAE | | 1,491,060 |
Freddie Mac - 0.8% |
3.454% 10/1/35 (m) | | 259 | | 278 |
3.5% 4/1/32 to 4/1/42 | | 9,965 | | 10,669 |
4% 6/1/24 to 11/1/41 | | 16,220 | | 17,650 |
4% 9/1/41 | | 870 | | 946 |
4% 9/1/42 (h) | | 23,000 | | 24,606 |
4.5% 7/1/25 to 10/1/41 | | 45,001 | | 48,942 |
5% 3/1/19 to 9/1/40 | | 29,059 | | 31,672 |
5.5% 1/1/28 to 3/1/40 | | 20,160 | | 21,973 |
6% 7/1/37 to 8/1/37 | | 1,077 | | 1,185 |
6.5% 3/1/36 | | 1,330 | | 1,504 |
TOTAL FREDDIE MAC | | 159,425 |
Ginnie Mae - 0.8% |
3% 10/1/42 (h) | | 11,300 | | 11,837 |
3.5% 11/15/41 to 3/15/42 | | 10,016 | | 10,859 |
3.5% 9/1/42 (h) | | 1,200 | | 1,299 |
4% 1/15/25 to 11/15/41 | | 28,145 | | 30,737 |
4.5% 5/15/39 to 4/15/41 | | 53,616 | | 59,455 |
5% 3/15/39 to 9/15/41 | | 24,680 | | 27,630 |
5.5% 12/15/31 to 1/15/39 | | 1,304 | | 1,460 |
6% 2/15/34 to 9/20/38 | | 13,321 | | 15,050 |
TOTAL GINNIE MAE | | 158,327 |
TOTAL U.S. GOVERNMENT AGENCY - MORTGAGE SECURITIES (Cost $1,790,231) |
1,808,812
|
Asset-Backed Securities - 0.3% |
| Principal Amount (000s) | | Value (000s) |
Accredited Mortgage Loan Trust Series 2005-1 Class M1, 0.7055% 4/25/35 (m) | | $ 1,086 | | $ 836 |
ACE Securities Corp. Home Equity Loan Trust: | | | | |
Series 2004-HE1 Class M2, 1.8855% 3/25/34 (m) | | 424 | | 346 |
Series 2005-HE2 Class M2, 0.6855% 4/25/35 (m) | | 89 | | 85 |
Advanta Business Card Master Trust Series 2006-C1 Class C1, 0.6758% 10/20/14 (m) | | 688 | | 7 |
Ally Master Owner Trust Series 2012-3 Class A2, 1.21% 6/15/17 | | 32,660 | | 32,719 |
Ameriquest Mortgage Securities, Inc. pass-thru certificates: | | | | |
Series 2003-10 Class M1, 0.9355% 12/25/33 (m) | | 85 | | 64 |
Series 2004-R2 Class M3, 0.7855% 4/25/34 (m) | | 120 | | 47 |
Series 2005-R2 Class M1, 0.6855% 4/25/35 (m) | | 2,266 | | 2,030 |
Argent Securities, Inc. pass-thru certificates: | | | | |
Series 2003-W7 Class A2, 1.0262% 3/25/34 (m) | | 53 | | 42 |
Series 2004-W11 Class M2, 0.9355% 11/25/34 (m) | | 616 | | 433 |
Series 2004-W7 Class M1, 0.7855% 5/25/34 (m) | | 1,600 | | 1,136 |
Series 2006-W4 Class A2C, 0.3955% 5/25/36 (m) | | 1,429 | | 432 |
Asset Backed Securities Corp. Home Equity Loan Trust: | | | | |
Series 2004-HE2 Class M1, 1.0605% 4/25/34 (m) | | 2,575 | | 2,120 |
Series 2006-HE2 Class M1, 0.6055% 3/25/36 (m) | | 64 | | 0* |
Axon Financial Funding Ltd. Series 2007-1 Class A1, 0.9743% 4/4/17 (d)(g)(m) | | 6,960 | | 0 |
Capital Trust Ltd. Series 2004-1: | | | | |
Class A2, 0.687% 7/20/39 (g)(m) | | 138 | | 125 |
Class B, 0.987% 7/20/39 (g)(m) | | 290 | | 130 |
Class C, 1.337% 7/20/39 (g)(m) | | 372 | | 6 |
Carrington Mortgage Loan Trust Series 2007-RFC1 Class A3, 0.3755% 12/25/36 (m) | | 1,978 | | 788 |
Citigroup Mortgage Loan Trust Series 2005-HE4 Class A2C, 0.5055% 10/25/35 (m) | | 447 | | 445 |
Countrywide Asset-Backed Certificates Trust Series 2007-4 Class A1A, 0.3662% 9/25/37 (m) | | 129 | | 128 |
Countrywide Home Loan Trust Series 2006-13 Class N, 7% 8/25/37 (g) | | 363 | | 0 |
Countrywide Home Loans, Inc.: | | | | |
Series 2004-3 Class M4, 1.2055% 4/25/34 (m) | | 175 | | 80 |
Series 2004-4 Class M2, 1.0305% 6/25/34 (m) | | 645 | | 371 |
Fannie Mae Series 2004-T5 Class AB3, 1.1466% 5/28/35 (m) | | 43 | | 27 |
Fieldstone Mortgage Investment Corp. Series 2004-3 Class M5, 2.4105% 8/25/34 (m) | | 319 | | 197 |
Asset-Backed Securities - continued |
| Principal Amount (000s) | | Value (000s) |
First Franklin Mortgage Loan Trust: | | | | |
Series 2004-FF2 Class M3, 1.0605% 3/25/34 (m) | | $ 25 | | $ 10 |
Series 2006-FF14 Class A2, 0.2955% 10/25/36 (m) | | 462 | | 457 |
Fremont Home Loan Trust Series 2005-A: | | | | |
Class M3, 0.9705% 1/25/35 (m) | | 1,041 | | 325 |
Class M4, 1.2555% 1/25/35 (m) | | 399 | | 53 |
GCO Education Loan Funding Master Trust II Series 2007-1A Class C1L, 0.8069% 2/25/47 (g)(m) | | 3,122 | | 1,284 |
GCO Slims Trust Series 2006-1A, 5.72% 3/1/22 (g) | | 624 | | 602 |
GE Business Loan Trust: | | | | |
Series 2003-1 Class A, 0.6695% 4/15/31 (g)(m) | | 216 | | 203 |
Series 2006-2A: | | | | |
Class A, 0.4195% 11/15/34 (g)(m) | | 1,457 | | 1,254 |
Class B, 0.5195% 11/15/34 (g)(m) | | 526 | | 364 |
Class C, 0.6195% 11/15/34 (g)(m) | | 874 | | 498 |
Class D, 0.9895% 11/15/34 (g)(m) | | 332 | | 103 |
Guggenheim Structured Real Estate Funding Ltd. Series 2006-3 Class C, 0.7855% 9/25/46 (g)(m) | | 1,540 | | 1,481 |
Home Equity Asset Trust: | | | | |
Series 2003-2 Class M1, 1.5555% 8/25/33 (m) | | 376 | | 293 |
Series 2003-3 Class M1, 1.5255% 8/25/33 (m) | | 745 | | 623 |
Series 2003-5 Class A2, 0.9355% 12/25/33 (m) | | 36 | | 30 |
HSI Asset Securitization Corp. Trust Series 2007-HE1 Class 2A3, 0.4255% 1/25/37 (m) | | 1,642 | | 549 |
JPMorgan Mortgage Acquisition Trust: | | | | |
Series 2006-NC2 Class M2, 0.5355% 7/25/36 (m) | | 3,185 | | 44 |
Series 2007-CH1 Class AV4, 0.3655% 11/25/36 (m) | | 1,641 | | 1,507 |
Keycorp Student Loan Trust: | | | | |
Series 1999-A Class A2, 0.7906% 12/27/29 (m) | | 570 | | 512 |
Series 2006-A Class 2C, 1.6106% 3/27/42 (m) | | 2,909 | | 138 |
Marriott Vacation Club Owner Trust Series 2006-2A: | | | | |
Class B, 5.442% 10/20/28 (g) | | 9 | | 9 |
Class C, 5.691% 10/20/28 (g) | | 4 | | 4 |
Class D, 6.01% 10/20/28 (g) | | 48 | | 49 |
MASTR Asset Backed Securities Trust Series 2007-HE1 Class M1, 0.5355% 5/25/37 (m) | | 861 | | 7 |
Meritage Mortgage Loan Trust Series 2004-1 Class M1, 0.9855% 7/25/34 (m) | | 163 | | 104 |
Merrill Lynch Mortgage Investors Trust: | | | | |
Series 2003-OPT1 Class M1, 1.2105% 7/25/34 (m) | | 506 | | 336 |
Series 2006-FM1 Class A2B, 0.3455% 4/25/37 (m) | | 1,582 | | 1,428 |
Series 2006-OPT1 Class A1A, 0.4955% 6/25/35 (m) | | 2,995 | | 2,411 |
Asset-Backed Securities - continued |
| Principal Amount (000s) | | Value (000s) |
Morgan Stanley ABS Capital I Trust: | | | | |
Series 2004-HE6 Class A2, 0.5755% 8/25/34 (m) | | $ 63 | | $ 50 |
Series 2005-NC1 Class M1, 0.6755% 1/25/35 (m) | | 439 | | 264 |
Series 2005-NC2 Class B1, 1.4055% 3/25/35 (m) | | 457 | | 54 |
National Collegiate Student Loan Trust: | | | | |
Series 2004-2 Class AIO, 9.75% 10/27/14 (o) | | 1,638 | | 21 |
Series 2006-4 Class D, 1.3355% 5/25/32 (m) | | 2,225 | | 0* |
New Century Home Equity Loan Trust Series 2005-4 Class M2, 0.7455% 9/25/35 (m) | | 1,566 | | 1,012 |
Ocala Funding LLC: | | | | |
Series 2005-1A Class A, 1.737% 3/20/10 (d)(g)(m) | | 621 | | 0 |
Series 2006-1A Class A, 1.637% 3/20/11 (d)(g)(m) | | 1,290 | | 0 |
Park Place Securities, Inc.: | | | | |
Series 2004-WCW1: | | | | |
Class M3, 1.4855% 9/25/34 (m) | | 585 | | 255 |
Class M4, 1.6855% 9/25/34 (m) | | 750 | | 170 |
Series 2005-WCH1 Class M4, 1.0655% 1/25/36 (m) | | 1,620 | | 926 |
Salomon Brothers Mortgage Securities VII, Inc. Series 2003-HE1 Class A, 1.0355% 4/25/33 (m) | | 6 | | 5 |
Saxon Asset Securities Trust Series 2004-1 Class M1, 1.0305% 3/25/35 (m) | | 1,392 | | 1,009 |
Sierra Receivables Funding Co. Series 2007-1A Class A2, 0.3968% 3/20/19 (FGIC Insured) (g)(m) | | 444 | | 434 |
SLM Private Credit Student Loan Trust Series 2004-A Class C, 1.4179% 6/15/33 (m) | | 1,396 | | 845 |
Specialty Underwriting & Residential Finance Trust Series 2006-AB2 Class N1, 5.75% 6/25/37 (g) | | 655 | | 0 |
Structured Asset Investment Loan Trust Series 2004-8 Class M5, 1.9605% 9/25/34 (m) | | 70 | | 24 |
SVO VOI Mortgage Corp. Series 2006-AA Class A, 5.28% 2/20/24 (g) | | 475 | | 487 |
Terwin Mortgage Trust Series 2003-4HE Class A1, 1.0955% 9/25/34 (m) | | 32 | | 29 |
Trapeza CDO XII Ltd./Trapeza CDO XII, Inc. Series 2007-12A Class B, 1.0196% 4/6/42 (g)(m) | | 2,177 | | 27 |
WaMu Asset Holdings Corp. Series 2006-8 Class N1, 6.048% 10/25/46 (g) | | 974 | | 0 |
Asset-Backed Securities - continued |
| Principal Amount (000s) | | Value (000s) |
Wells Fargo Home Equity Trust Series 2004-3 Class A, 4.5% 11/27/34 (g) | | $ 8 | | $ 0 |
Whinstone Capital Management Ltd. Series 1A Class B3, 2.2511% 10/25/44 (g)(m) | | 1,964 | | 1,296 |
TOTAL ASSET-BACKED SECURITIES (Cost $60,917) |
64,180
|
Collateralized Mortgage Obligations - 0.2% |
|
Private Sponsor - 0.2% |
Bayview Commercial Asset Trust Series 2006-3A, Class IO, 3.9199% 10/25/36 (g)(m)(o) | | 27,699 | | 979 |
Bear Stearns ALT-A Trust floater Series 2005-1 Class A1, 0.7955% 1/25/35 (m) | | 1,962 | | 1,689 |
Cobalt CMBS Commercial Mortgage Trust Series 2007-C2 Class B, 5.617% 4/15/47 (m) | | 1,468 | | 616 |
COMM pass-thru certificates floater Series 2001-J2A Class A2F, 0.7385% 7/16/34 (g)(m) | | 8 | | 8 |
First Horizon Mortgage pass-thru Trust Series 2004-AR5 Class 2A1, 2.623% 10/25/34 (m) | | 1,183 | | 1,139 |
Granite Master Issuer PLC: | | | | |
floater: | | | | |
Series 2006-1A Class A5, 0.377% 12/20/54 (g)(m) | | 6,713 | | 6,545 |
Series 2006-3 Class M2, 0.517% 12/20/54 (m) | | 5,460 | | 4,750 |
Series 2006-4: | | | | |
Class B1, 0.417% 12/20/54 (m) | | 4,556 | | 4,157 |
Class M1, 0.577% 12/20/54 (m) | | 1,198 | | 1,042 |
Series 2007-1: | | | | |
Class 1B1, 0.377% 12/20/54 (m) | | 4,650 | | 4,243 |
Class 1M1, 0.537% 12/20/54 (m) | | 1,611 | | 1,402 |
Class 2M1, 0.737% 12/20/54 (m) | | 2,067 | | 1,798 |
Series 2007-2 Class 2C1, 1.098% 12/17/54 (m) | | 2,864 | | 2,162 |
sequential payer Series 2006-3 Class B2, 0.407% 12/20/54 (m) | | 5,461 | | 4,983 |
Granite Mortgages PLC floater Series 2003-3 Class 1C, 2.9051% 1/20/44 (m) | | 472 | | 374 |
JPMorgan Chase Commercial Mortgage Securities Trust Series 2007-CB18 Class A3, 5.447% 6/12/47 (m) | | 1,532 | | 1,620 |
JPMorgan Mortgage Trust sequential payer Series 2006-A5 Class 3A5, 5.6881% 8/25/36 (m) | | 1,956 | | 1,506 |
LB-UBS Commercial Mortgage Trust sequential payer Series 2006-C6 Class A4, 5.372% 9/15/39 | | 591 | | 682 |
Collateralized Mortgage Obligations - continued |
| Principal Amount (000s) | | Value (000s) |
Private Sponsor - continued |
MASTR Adjustable Rate Mortgages Trust Series 2007-3 Class 22A2, 0.4455% 5/25/47 (m) | | $ 848 | | $ 543 |
Merrill Lynch Alternative Note Asset Trust floater Series 2007-OAR1 Class A1, 0.4055% 2/25/37 (m) | | 1,476 | | 1,158 |
Opteum Mortgage Acceptance Corp. floater Series 2005-3 Class APT, 0.5255% 7/25/35 (m) | | 2,048 | | 1,665 |
RESI Finance LP/RESI Finance DE Corp. floater Series 2003-B: | | | | |
Class B5, 2.5903% 7/10/35 (g)(m) | | 1,153 | | 919 |
Class B6, 3.0903% 7/10/35 (g)(m) | | 245 | | 194 |
Residential Funding Securities Corp. floater Series 2003-RP2 Class A1, 0.6855% 6/25/33 (g)(m) | | 221 | | 212 |
Salomon Brothers Mortgage Securities VII, Inc. Series 2006-C2 Class H, 6.308% 7/18/33 (g) | | 185 | | 62 |
Sequoia Mortgage Trust floater Series 2004-6 Class A3B, 1.6169% 7/20/34 (m) | | 38 | | 33 |
Structured Asset Securities Corp. Series 2003-15A Class 4A, 5.3743% 4/25/33 (m) | | 333 | | 311 |
TBW Mortgage-Backed pass-thru certificates floater Series 2006-4 Class A3, 0.4355% 9/25/36 (m) | | 3,513 | | 3,021 |
TOTAL COLLATERALIZED MORTGAGE OBLIGATIONS (Cost $35,173) |
47,813
|
Commercial Mortgage Securities - 1.9% |
|
Asset Securitization Corp. Series 1997-D5: | | | | |
Class A6, 7.1354% 2/14/43 (m) | | 153 | | 154 |
Class PS1, 1.2297% 2/14/43 (m)(o) | | 747 | | 22 |
Banc of America Commercial Mortgage Trust: | | | | |
sequential payer: | | | | |
Series 2006-2 Class AAB, 5.7087% 5/10/45 (m) | | 1,083 | | 1,146 |
Series 2006-5: | | | | |
Class A2, 5.317% 9/10/47 | | 3,817 | | 3,838 |
Class A3, 5.39% 9/10/47 | | 1,832 | | 1,944 |
Series 2006-6 Class A3, 5.369% 10/10/45 | | 2,628 | | 2,872 |
Series 2007-4 Class A3, 5.7921% 2/10/51 (m) | | 1,291 | | 1,342 |
Series 2006-6 Class E, 5.619% 10/10/45 (g) | | 759 | | 76 |
Series 2007-3: | | | | |
Class A3, 5.6612% 6/10/49 (m) | | 2,194 | | 2,237 |
Class A4, 5.6612% 6/10/49 (m) | | 2,739 | | 3,133 |
Commercial Mortgage Securities - continued |
| Principal Amount (000s) | | Value (000s) |
Banc of America Commercial Mortgage, Inc.: | | | | |
sequential payer: | | | | |
Series 2001-1 Class A4, 5.451% 1/15/49 | | $ 2,878 | | $ 3,297 |
Series 2004-2 Class A4, 4.153% 11/10/38 | | 1,406 | | 1,445 |
Series 2005-1 Class A3, 4.877% 11/10/42 | | 469 | | 469 |
Series 2001-3 Class H, 6.562% 4/11/37 (g) | | 735 | | 735 |
Series 2005-3 Class A3B, 5.09% 7/10/43 (m) | | 4,082 | | 4,299 |
Banc of America Large Loan, Inc. floater: | | | | |
Series 2005-MIB1: | | | | |
Class C, 0.5495% 3/15/22 (g)(m) | | 564 | | 558 |
Class D, 0.5995% 3/15/22 (g)(m) | | 572 | | 564 |
Class E, 0.6395% 3/15/22 (g)(m) | | 472 | | 463 |
Class F, 0.7095% 3/15/22 (g)(m) | | 676 | | 656 |
Class G, 0.7695% 3/15/22 (g)(m) | | 438 | | 416 |
Series 2006-BIX1: | | | | |
Class D, 0.4495% 10/15/19 (g)(m) | | 115 | | 111 |
Class E, 0.4795% 10/15/19 (g)(m) | | 956 | | 903 |
Class F, 0.5495% 10/15/19 (g)(m) | | 2,868 | | 2,696 |
Class G, 0.5695% 10/15/19 (g)(m) | | 1,350 | | 1,255 |
Bayview Commercial Asset Trust: | | | | |
floater: | | | | |
Series 2003-2 Class M1, 1.0855% 12/25/33 (g)(m) | | 65 | | 47 |
Series 2004-1: | | | | |
Class A, 0.5955% 4/25/34 (g)(m) | | 1,120 | | 988 |
Class B, 2.1355% 4/25/34 (g)(m) | | 125 | | 73 |
Class M1, 0.7955% 4/25/34 (g)(m) | | 101 | | 72 |
Class M2, 1.4355% 4/25/34 (g)(m) | | 93 | | 65 |
Series 2005-2A: | | | | |
Class A1, 0.5455% 8/25/35 (g)(m) | | 1,525 | | 1,100 |
Class M1, 0.6655% 8/25/35 (g)(m) | | 83 | | 49 |
Class M2, 0.7155% 8/25/35 (g)(m) | | 137 | | 74 |
Class M3, 0.7355% 8/25/35 (g)(m) | | 76 | | 37 |
Series 2005-3A: | | | | |
Class A2, 0.6355% 11/25/35 (g)(m) | | 536 | | 421 |
Class M1, 0.6755% 11/25/35 (g)(m) | | 70 | | 40 |
Class M2, 0.7255% 11/25/35 (g)(m) | | 89 | | 48 |
Class M3, 0.7455% 11/25/35 (g)(m) | | 80 | | 41 |
Class M4, 0.8355% 11/25/35 (g)(m) | | 100 | | 47 |
Series 2005-4A: | | | | |
Class A2, 0.6255% 1/25/36 (g)(m) | | 1,392 | | 986 |
Class B1, 1.6355% 1/25/36 (g)(m) | | 120 | | 18 |
Class M1, 0.6855% 1/25/36 (g)(m) | | 449 | | 277 |
Commercial Mortgage Securities - continued |
| Principal Amount (000s) | | Value (000s) |
Bayview Commercial Asset Trust: - continued | | | | |
floater: | | | | |
Series 2005-4A: | | | | |
Class M2, 0.7055% 1/25/36 (g)(m) | | $ 135 | | $ 78 |
Class M3, 0.7355% 1/25/36 (g)(m) | | 197 | | 105 |
Class M4, 0.8455% 1/25/36 (g)(m) | | 109 | | 53 |
Class M5, 0.8855% 1/25/36 (g)(m) | | 109 | | 36 |
Class M6, 0.9355% 1/25/36 (g)(m) | | 116 | | 31 |
Series 2006-1: | | | | |
Class A2, 0.5955% 4/25/36 (g)(m) | | 215 | | 159 |
Class M1, 0.6155% 4/25/36 (g)(m) | | 77 | | 46 |
Class M2, 0.6355% 4/25/36 (g)(m) | | 81 | | 45 |
Class M3, 0.6555% 4/25/36 (g)(m) | | 70 | | 36 |
Class M4, 0.7555% 4/25/36 (g)(m) | | 40 | | 18 |
Class M5, 0.7955% 4/25/36 (g)(m) | | 39 | | 14 |
Class M6, 0.8755% 4/25/36 (g)(m) | | 77 | | 26 |
Series 2006-2A: | | | | |
Class A1, 0.4655% 7/25/36 (g)(m) | | 3,201 | | 2,257 |
Class A2, 0.5155% 7/25/36 (g)(m) | | 190 | | 135 |
Class B1, 1.1055% 7/25/36 (g)(m) | | 71 | | 10 |
Class B3, 2.9355% 7/25/36 (g)(m) | | 67 | | 2 |
Class M1, 0.5455% 7/25/36 (g)(m) | | 200 | | 65 |
Class M2, 0.5655% 7/25/36 (g)(m) | | 141 | | 42 |
Class M3, 0.5855% 7/25/36 (g)(m) | | 117 | | 26 |
Class M4, 0.6555% 7/25/36 (g)(m) | | 79 | | 17 |
Class M5, 0.7055% 7/25/36 (g)(m) | | 97 | | 19 |
Class M6, 0.7755% 7/25/36 (g)(m) | | 145 | | 23 |
Series 2006-3A: | | | | |
Class B1, 1.0355% 10/25/36 (g)(m) | | 4 | | 0* |
Class M4, 0.6655% 10/25/36 (g)(m) | | 157 | | 24 |
Class M5, 0.7155% 10/25/36 (g)(m) | | 188 | | 12 |
Class M6, 0.7955% 10/25/36 (g)(m) | | 369 | | 9 |
Series 2006-4A: | | | | |
Class A1, 0.4655% 12/25/36 (g)(m) | | 809 | | 549 |
Class A2, 0.5055% 12/25/36 (g)(m) | | 3,952 | | 1,841 |
Class B1, 0.9355% 12/25/36 (g)(m) | | 78 | | 2 |
Class M1, 0.5255% 12/25/36 (g)(m) | | 263 | | 54 |
Class M2, 0.5455% 12/25/36 (g)(m) | | 175 | | 27 |
Class M3, 0.5755% 12/25/36 (g)(m) | | 176 | | 24 |
Class M4, 0.6355% 12/25/36 (g)(m) | | 213 | | 24 |
Class M5, 0.6755% 12/25/36 (g)(m) | | 195 | | 16 |
Class M6, 0.7555% 12/25/36 (g)(m) | | 175 | | 10 |
Series 2007-1 Class A2, 0.5055% 3/25/37 (g)(m) | | 810 | | 436 |
Commercial Mortgage Securities - continued |
| Principal Amount (000s) | | Value (000s) |
Bayview Commercial Asset Trust: - continued | | | | |
floater: | | | | |
Series 2007-2A: | | | | |
Class A1, 0.5055% 7/25/37 (g)(m) | | $ 771 | | $ 434 |
Class A2, 0.5555% 7/25/37 (g)(m) | | 723 | | 240 |
Class B1, 1.8355% 7/25/37 (g)(m) | | 105 | | 1 |
Class M1, 0.6055% 7/25/37 (g)(m) | | 253 | | 66 |
Class M2, 0.6455% 7/25/37 (g)(m) | | 139 | | 17 |
Class M3, 0.7255% 7/25/37 (g)(m) | | 140 | | 14 |
Class M4, 0.8855% 7/25/37 (g)(m) | | 278 | | 22 |
Class M5, 0.9855% 7/25/37 (g)(m) | | 245 | | 17 |
Class M6, 1.2355% 7/25/37 (g)(m) | | 311 | | 16 |
Series 2007-3: | | | | |
Class A2, 0.5255% 7/25/37 (g)(m) | | 827 | | 420 |
Class B1, 1.1855% 7/25/37 (g)(m) | | 184 | | 12 |
Class B2, 1.8355% 7/25/37 (g)(m) | | 433 | | 24 |
Class M1, 0.5455% 7/25/37 (g)(m) | | 165 | | 38 |
Class M2, 0.5755% 7/25/37 (g)(m) | | 176 | | 31 |
Class M3, 0.6055% 7/25/37 (g)(m) | | 276 | | 38 |
Class M4, 0.7355% 7/25/37 (g)(m) | | 434 | | 51 |
Class M5, 0.8355% 7/25/37 (g)(m) | | 227 | | 23 |
Class M6, 1.0355% 7/25/37 (g)(m) | | 173 | | 15 |
Series 2007-4A: | | | | |
Class M1, 1.1855% 9/25/37 (g)(m) | | 293 | | 18 |
Class M2, 1.2855% 9/25/37 (g)(m) | | 293 | | 15 |
Class M4, 1.8355% 9/25/37 (g)(m) | | 742 | | 30 |
Class M5, 1.9855% 9/25/37 (g)(m) | | 742 | | 23 |
Class M6, 2.1855% 9/25/37 (g)(m) | | 486 | | 12 |
Series 2004-1, Class IO, 1.25% 4/25/34 (g)(o) | | 2,255 | | 91 |
Series 2007-5A, Class IO, 4.1484% 10/25/37 (g)(m)(o) | | 5,767 | | 499 |
Bear Stearns Commercial Mortgage Securities Trust: | | | | |
floater: | | | | |
Series 2006-BBA7: | | | | |
Class H, 0.8895% 3/15/19 (g)(m) | | 439 | | 424 |
Class J, 1.0895% 3/15/19 (g)(m) | | 447 | | 409 |
Series 2007-BBA8: | | | | |
Class D, 0.4895% 3/15/22 (g)(m) | | 653 | | 590 |
Class E, 0.5395% 3/15/22 (g)(m) | | 3,391 | | 2,994 |
Class F, 0.5895% 3/15/22 (g)(m) | | 2,081 | | 1,795 |
Class G, 0.6395% 3/15/22 (g)(m) | | 534 | | 450 |
Class H, 0.7895% 3/15/22 (g)(m) | | 653 | | 537 |
Class J, 0.9395% 3/15/22 (g)(m) | | 653 | | 521 |
Commercial Mortgage Securities - continued |
| Principal Amount (000s) | | Value (000s) |
Bear Stearns Commercial Mortgage Securities Trust: - continued | | | | |
sequential payer: | | | | |
Series 2004-PWR3 Class A3, 4.487% 2/11/41 | | $ 301 | | $ 303 |
Series 2007-PW15 Class AAB, 5.315% 2/11/44 | | 3,274 | | 3,413 |
Series 2007-PW16: | | | | |
Class A4, 5.7154% 6/11/40 (m) | | 769 | | 901 |
Class AAB, 5.7154% 6/11/40 (m) | | 6,095 | | 6,557 |
Series 2007-PW18: | | | | |
Class A2, 5.613% 6/11/50 | | 280 | | 286 |
Class A4, 5.7% 6/11/50 | | 5,820 | | 6,827 |
Series 2006-PW13 Class A3, 5.518% 9/11/41 | | 4,638 | | 4,849 |
Series 2006-PW14 Class X2, 0.6677% 12/11/38 (g)(m)(o) | | 13,836 | | 113 |
Series 2006-T22 Class A4, 5.5391% 4/12/38 (m) | | 164 | | 188 |
Series 2006-T24 Class X2, 0.4455% 10/12/41 (g)(m)(o) | | 3,433 | | 16 |
Series 2007-PW18 Class X2, 0.3156% 6/11/50 (g)(m)(o) | | 92,485 | | 864 |
Series 2007-T28 Class X2, 0.1576% 9/11/42 (g)(m)(o) | | 49,759 | | 265 |
C-BASS Trust floater Series 2006-SC1 Class A, 0.5055% 5/25/36 (g)(m) | | 772 | | 668 |
CDC Commercial Mortgage Trust Series 2002-FX1: | | | | |
Class G, 6.625% 5/15/35 (g) | | 1,544 | | 1,592 |
Class XCL, 1.331% 5/15/35 (g)(m)(o) | | 5,266 | | 103 |
Citigroup Commercial Mortgage Trust: | | | | |
floater Series 2006-FL2: | | | | |
Class G, 0.5693% 8/15/21 (g)(m) | | 127 | | 126 |
Class H, 0.6093% 8/15/21 (g)(m) | | 468 | | 447 |
Series 2007-C6: | | | | |
Class A2, 5.7002% 12/10/49 (m) | | 1,062 | | 1,062 |
Class A4, 5.7002% 12/10/49 (m) | | 4,371 | | 5,103 |
Series 2008-C7 Class A2B, 6.0731% 12/10/49 (m) | | 839 | | 860 |
Citigroup/Deutsche Bank Commercial Mortgage Trust: | | | | |
sequential payer Series 2007-CD4 Class A4, 5.322% 12/11/49 | | 16,063 | | 18,109 |
Series 2007-CD4 Class A3, 5.293% 12/11/49 | | 1,279 | | 1,352 |
Cobalt CMBS Commercial Mortgage Trust: | | | | |
sequential payer Series 2007-C3 Class A3, 5.8108% 5/15/46 (m) | | 1,314 | | 1,412 |
Series 2006-C1 Class B, 5.359% 8/15/48 | | 3,942 | | 572 |
Commercial Mortgage Securities - continued |
| Principal Amount (000s) | | Value (000s) |
COMM pass-thru certificates: | | | | |
floater: | | | | |
Series 2005-F10A Class J, 1.0895% 4/15/17 (g)(m) | | $ 138 | | $ 126 |
Series 2005-FL11: | | | | |
Class C, 0.5395% 11/15/17 (g)(m) | | 807 | | 766 |
Class D, 0.5795% 11/15/17 (g)(m) | | 42 | | 39 |
Class E, 0.6295% 11/15/17 (g)(m) | | 149 | | 137 |
Class F, 0.6895% 11/15/17 (g)(m) | | 164 | | 149 |
Class G, 0.7395% 11/15/17 (g)(m) | | 114 | | 101 |
Series 2006-CN2A: | | | | |
Class A2FL, 0.4643% 2/5/19 (g)(m) | | 1,454 | | 1,422 |
Class AJFL, 0.5043% 2/5/19 (m) | | 890 | | 870 |
Series 2006-FL12 Class AJ, 0.3695% 12/15/20 (g)(m) | | 1,872 | | 1,709 |
sequential payer: | | | | |
Series 2006-C8 Class A3, 5.31% 12/10/46 | | 3,744 | | 3,821 |
Series 2006-CN2A: | | | | |
Class A2FX, 5.449% 2/5/19 (g) | | 1,717 | | 1,721 |
Class AJFX, 5.478% 2/5/19 (g) | | 4,140 | | 4,146 |
Series 2007-C9 Class A4, 5.8111% 12/10/49 (m) | | 2,907 | | 3,432 |
Series 2006-C8 Class XP, 0.4663% 12/10/46 (m)(o) | | 16,244 | | 101 |
Credit Suisse Commercial Mortgage Trust: | | | | |
sequential payer: | | | | |
Series 2006-C4 Class A3, 5.467% 9/15/39 | | 1,596 | | 1,803 |
Series 2007-C2: | | | | |
Class A2, 5.448% 1/15/49 (m) | | 3,324 | | 3,354 |
Class A3, 5.542% 1/15/49 (m) | | 2,628 | | 2,933 |
Series 2007-C3 Class A4, 5.6792% 6/15/39 (m) | | 790 | | 872 |
Series 2006-C4 Class AAB, 5.439% 9/15/39 | | 3,838 | | 3,887 |
Series 2006-C5 Class ASP, 0.6643% 12/15/39 (m)(o) | | 11,239 | | 92 |
Series 2007-C5 Class A4, 5.695% 9/15/40 (m) | | 1,189 | | 1,328 |
Credit Suisse First Boston Mortgage Capital Certificates floater Series 2007-TF2A Class B, 0.5895% 4/15/22 (g)(m) | | 4,688 | | 3,715 |
Credit Suisse First Boston Mortgage Securities Corp.: | | | | |
sequential payer Series 2004-C1 Class A4, 4.75% 1/15/37 | | 600 | | 626 |
Series 2001-CK6 Class AX, 0.9973% 8/15/36 (m)(o) | | 344 | | 0* |
Series 2001-CKN5 Class AX, 1.7514% 9/15/34 (g)(m)(o) | | 1,187 | | 1 |
Series 2006-C1 Class A3, 5.4157% 2/15/39 (m) | | 4,694 | | 4,805 |
Commercial Mortgage Securities - continued |
| Principal Amount (000s) | | Value (000s) |
Credit Suisse Mortgage Capital Certificates: | | | | |
floater Series 2007-TFL1: | | | | |
Class B, 0.3895% 2/15/22 (g)(m) | | $ 497 | | $ 465 |
Class C: | | | | |
0.4095% 2/15/22 (g)(m) | | 2,047 | | 1,896 |
0.5095% 2/15/22 (g)(m) | | 731 | | 662 |
Class F, 0.5595% 2/15/22 (g)(m) | | 1,462 | | 1,310 |
Series 2007-C1: | | | | |
Class ASP, 0.3813% 2/15/40 (m)(o) | | 19,061 | | 107 |
Class B, 5.487% 2/15/40 (g)(m) | | 2,009 | | 256 |
First Union National Bank-Bank of America Commercial Mortgage Trust Series 2001-C1 Class G, 6.936% 3/15/33 (g) | | 123 | | 123 |
GE Capital Commercial Mortgage Corp.: | | | | |
sequential payer Series 2007-C1 Class A4, 5.543% 12/10/49 | | 8,890 | | 9,960 |
Series 2001-1 Class X1, 1.4912% 5/15/33 (g)(m)(o) | | 863 | | 11 |
Series 2007-C1 Class XP, 0.1588% 12/10/49 (m)(o) | | 20,244 | | 66 |
Greenwich Capital Commercial Funding Corp.: | | | | |
floater Series 2006-FL4 Class B, 0.4343% 11/5/21 (g)(m) | | 494 | | 469 |
sequential payer: | | | | |
Series 2007-GG11 Class A2, 5.597% 12/10/49 | | 2,296 | | 2,365 |
Series 2007-GG9 Class A4, 5.444% 3/10/39 | | 17,490 | | 19,797 |
Series 2006-GG7 Class A3, 5.8738% 7/10/38 (m) | | 548 | | 548 |
Series 2007-GG11 Class A1, 0.2519% 12/10/49 (g)(m)(o) | | 25,003 | | 129 |
GS Mortgage Securities Corp. II: | | | | |
floater: | | | | |
Series 2006-FL8A: | | | | |
Class E, 0.6158% 6/6/20 (g)(m) | | 298 | | 296 |
Class F, 0.6858% 6/6/20 (g)(m) | | 916 | | 903 |
Series 2007-EOP: | | | | |
Class C, 2.0056% 3/6/20 (g)(m) | | 1,650 | | 1,634 |
Class D, 2.2018% 3/6/20 (g)(m) | | 3,090 | | 3,061 |
Class F, 2.6334% 3/6/20 (g)(m) | | 136 | | 135 |
Class G, 2.7903% 3/6/20 (g)(m) | | 67 | | 66 |
Class H, 3.3004% 3/6/20 (g)(m) | | 62 | | 62 |
Class J, 4.0852% 3/6/20 (g)(m) | | 85 | | 85 |
Series 2006-GG6 Class A2, 5.506% 4/10/38 | | 3,167 | | 3,170 |
GS Mortgage Securities Trust sequential payer: | | | | |
Series 2006-GG8 Class A2, 5.479% 11/10/39 | | 393 | | 399 |
Series 2007-GG10 Class A2, 5.778% 8/10/45 | | 294 | | 298 |
Commercial Mortgage Securities - continued |
| Principal Amount (000s) | | Value (000s) |
JPMorgan Chase Commercial Mortgage Securities Trust: | | | | |
floater Series 2006-FLA2: | | | | |
Class B, 0.4095% 11/15/18 (g)(m) | | $ 655 | | $ 638 |
Class C, 0.4495% 11/15/18 (g)(m) | | 465 | | 448 |
Class D, 0.4695% 11/15/18 (g)(m) | | 207 | | 195 |
Class E, 0.5195% 11/15/18 (g)(m) | | 297 | | 274 |
Class F, 0.5695% 11/15/18 (g)(m) | | 446 | | 394 |
Class G, 0.5995% 11/15/18 (g)(m) | | 386 | | 326 |
Class H, 0.7395% 11/15/18 (g)(m) | | 297 | | 239 |
sequential payer: | | | | |
Series 2006-CB14 Class A3B, 5.4914% 12/12/44 (m) | | 3,229 | | 3,301 |
Series 2006-LDP8 Class A4, 5.399% 5/15/45 | | 837 | | 962 |
Series 2006-LDP9: | | | | |
Class A2, 5.134% 5/15/47 (m) | | 419 | | 440 |
Class A3, 5.336% 5/15/47 | | 5,183 | | 5,861 |
Series 2007-CB19 Class A4, 5.7337% 2/12/49 (m) | | 4,608 | | 5,342 |
Series 2007-LD11 Class A2, 5.7998% 6/15/49 (m) | | 2,882 | | 2,968 |
Series 2007-LDPX: | | | | |
Class A2 S, 5.305% 1/15/49 | | 1,929 | | 1,944 |
Class A3, 5.42% 1/15/49 | | 18,477 | | 21,088 |
Series 2005-LDP3 Class A3, 4.959% 8/15/42 | | 1,723 | | 1,747 |
Series 2006-CB17 Class A3, 5.45% 12/12/43 | | 344 | | 345 |
Series 2007-CB19: | | | | |
Class B, 5.7337% 2/12/49 (m) | | 112 | | 37 |
Class C, 5.7337% 2/12/49 (m) | | 294 | | 62 |
Class D, 5.7337% 2/12/49 (m) | | 309 | | 63 |
Series 2007-LDP10: | | | | |
Class CS, 5.466% 1/15/49 (m) | | 108 | | 9 |
Class ES, 5.5652% 1/15/49 (g)(m) | | 679 | | 31 |
LB Commercial Conduit Mortgage Trust sequential payer Series 2007-C3 Class A4, 5.8846% 7/15/44 (m) | | 1,054 | | 1,239 |
LB-UBS Commercial Mortgage Trust: | | | | |
sequential payer: | | | | |
Series 2006-C1 Class A2, 5.084% 2/15/31 | | 178 | | 178 |
Series 2006-C6 Class A2, 5.262% 9/15/39 (m) | | 72 | | 72 |
Series 2006-C7: | | | | |
Class A2, 5.3% 11/15/38 | | 764 | | 777 |
Class A3, 5.347% 11/15/38 | | 979 | | 1,121 |
Series 2007-C1 Class A4, 5.424% 2/15/40 | | 4,069 | | 4,678 |
Series 2007-C2 Class A3, 5.43% 2/15/40 | | 2,923 | | 3,318 |
Commercial Mortgage Securities - continued |
| Principal Amount (000s) | | Value (000s) |
LB-UBS Commercial Mortgage Trust: - continued | | | | |
Series 2006-C6 Class XCP, 0.6747% 9/15/39 (m)(o) | | $ 5,603 | | $ 39 |
Series 2007-C1 Class XCP, 0.4243% 2/15/40 (m)(o) | | 2,095 | | 13 |
Series 2007-C6 Class A4, 5.858% 7/15/40 (m) | | 1,642 | | 1,919 |
Series 2007-C7 Class XCP, 0.2615% 9/15/45 (m)(o) | | 84,375 | | 552 |
Lehman Brothers Floating Rate Commercial Mortgage Trust floater Series 2006-LLFA: | | | | |
Class D, 0.4695% 9/15/21 (g)(m) | | 421 | | 400 |
Class E, 0.5295% 9/15/21 (g)(m) | | 1,518 | | 1,404 |
Class F, 0.5795% 9/15/21 (g)(m) | | 1,255 | | 1,129 |
Class G, 0.5995% 9/15/21 (g)(m) | | 2,478 | | 2,169 |
Class H, 0.6395% 9/15/21 (g)(m) | | 639 | | 537 |
Merrill Lynch Mortgage Trust: | | | | |
Series 2005-LC1 Class F, 5.3733% 1/12/44 (g)(m) | | 1,143 | | 751 |
Series 2006-C1 Class A2, 5.6141% 5/12/39 (m) | | 1,164 | | 1,190 |
Series 2007-C1 Class A4, 5.8461% 6/12/50 (m) | | 4,974 | | 5,613 |
Series 2008-C1 Class A4, 5.69% 2/12/51 | | 2,805 | | 3,289 |
Merrill Lynch-CFC Commercial Mortgage Trust: | | | | |
floater Series 2006-4 Class A2FL, 0.3688% 12/12/49 (m) | | 132 | | 132 |
sequential payer: | | | | |
Series 2006-1 Class A3, 5.4796% 2/12/39 (m) | | 1,394 | | 1,393 |
Series 2006-4 Class ASB, 5.133% 12/12/49 (m) | | 961 | | 1,011 |
Series 2007-5: | | | | |
Class A3, 5.364% 8/12/48 | | 512 | | 519 |
Class B, 5.479% 8/12/48 | | 3,942 | | 968 |
Series 2007-6 Class A4, 5.485% 3/12/51 (m) | | 10,897 | | 12,129 |
Series 2007-7 Class A4, 5.7386% 6/12/50 (m) | | 4,599 | | 5,029 |
Series 2006-3 Class ASB, 5.382% 7/12/46 (m) | | 4,518 | | 4,656 |
Series 2006-4 Class XP, 0.617% 12/12/49 (m)(o) | | 20,146 | | 278 |
Series 2007-6 Class B, 5.635% 3/12/51 (m) | | 1,314 | | 329 |
Series 2007-7 Class B, 5.7386% 6/12/50 (m) | | 114 | | 8 |
Series 2007-8 Class A3, 5.9634% 8/12/49 (m) | | 1,133 | | 1,293 |
Morgan Stanley Capital I Trust: | | | | |
floater: | | | | |
Series 2006-XLF Class C, 1.44% 7/15/19 (g)(m) | | 393 | | 247 |
Series 2007-XLFA: | | | | |
Class C, 0.4% 10/15/20 (g)(m) | | 754 | | 682 |
Class D, 0.43% 10/15/20 (g)(m) | | 732 | | 648 |
Class E, 0.49% 10/15/20 (g)(m) | | 916 | | 779 |
Class F, 0.54% 10/15/20 (g)(m) | | 550 | | 456 |
Class G, 0.58% 10/15/20 (g)(m) | | 680 | | 528 |
Class H, 0.67% 10/15/20 (g)(m) | | 428 | | 278 |
Commercial Mortgage Securities - continued |
| Principal Amount (000s) | | Value (000s) |
Morgan Stanley Capital I Trust: - continued | | | | |
floater: | | | | |
Series 2007-XLFA: | | | | |
Class J, 0.82% 10/15/20 (g)(m) | | $ 250 | | $ 100 |
sequential payer: | | | | |
Series 2005-IQ9 Class A3, 4.54% 7/15/56 | | 1,242 | | 1,258 |
Series 2007-HQ11 Class A31, 5.439% 2/12/44 (m) | | 666 | | 701 |
Series 2006-HQ10 Class X2, 0.4951% 11/12/41 (g)(m)(o) | | 8,835 | | 9 |
Series 2006-IQ11: | | | | |
Class A3, 5.6877% 10/15/42 (m) | | 404 | | 410 |
Class A4, 5.7237% 10/15/42 (m) | | 394 | | 447 |
Series 2006-T23 Class A3, 5.809% 8/12/41 (m) | | 671 | | 697 |
Series 2007-IQ14: | | | | |
Class A4, 5.692% 4/15/49 (m) | | 1,971 | | 2,224 |
Class AAB, 5.654% 4/15/49 | | 3,406 | | 3,675 |
Class B, 5.7187% 4/15/49 (m) | | 323 | | 96 |
Wachovia Bank Commercial Mortgage Trust: | | | | |
floater: | | | | |
Series 2006-WL7A: | | | | |
Class E, 0.518% 9/15/21 (g)(m) | | 1,791 | | 1,540 |
Class F, 0.578% 9/15/21 (g)(m) | | 2,061 | | 1,690 |
Class G, 0.598% 9/15/21 (g)(m) | | 1,953 | | 1,523 |
Class J, 0.838% 9/15/21 (g)(m) | | 434 | | 286 |
Series 2007-WHL8: | | | | |
Class F, 0.7195% 6/15/20 (g)(m) | | 4,581 | | 3,372 |
Class LXR1, 0.9395% 6/15/20 (g)(m) | | 162 | | 140 |
sequential payer: | | | | |
Series 2003-C7 Class A1, 4.241% 10/15/35 (g) | | 834 | | 840 |
Series 2003-C8 Class A3, 4.445% 11/15/35 | | 4,548 | | 4,610 |
Series 2006-C29 Class A3, 5.313% 11/15/48 | | 3,490 | | 3,655 |
Series 2007-C30: | | | | |
Class A3, 5.246% 12/15/43 | | 419 | | 423 |
Class A4, 5.305% 12/15/43 | | 386 | | 415 |
Class A5, 5.342% 12/15/43 | | 17,206 | | 19,046 |
Series 2007-C31 Class A4, 5.509% 4/15/47 | | 12,470 | | 14,134 |
Series 2003-C6 Class G, 5.125% 8/15/35 (g)(m) | | 624 | | 623 |
Series 2005-C19 Class B, 4.892% 5/15/44 | | 1,314 | | 1,214 |
Series 2005-C22: | | | | |
Class B, 5.3564% 12/15/44 (m) | | 2,914 | | 2,018 |
Class F, 5.3564% 12/15/44 (g)(m) | | 2,191 | | 429 |
Series 2006-C23 Class A5, 5.416% 1/15/45 (m) | | 7,210 | | 8,125 |
Commercial Mortgage Securities - continued |
| Principal Amount (000s) | | Value (000s) |
Wachovia Bank Commercial Mortgage Trust: - continued | | | | |
Series 2007-C30: | | | | |
Class C, 5.483% 12/15/43 (m) | | $ 3,942 | | $ 1,110 |
Class D, 5.513% 12/15/43 (m) | | 2,102 | | 426 |
Class XP, 0.4723% 12/15/43 (g)(m)(o) | | 11,372 | | 83 |
Series 2007-C31 Class C, 5.6821% 4/15/47 (m) | | 361 | | 81 |
Series 2007-C31A Class A2, 5.421% 4/15/47 | | 7,547 | | 7,829 |
Series 2007-C32: | | | | |
Class D, 5.7418% 6/15/49 (m) | | 987 | | 266 |
Class E, 5.7418% 6/15/49 (m) | | 1,556 | | 367 |
Wachovia Bank Commercial Mortgage Trust pass-thru certificates sequential payer Series 2007-C33 Class A5, 5.9003% 2/15/51 (m) | | 870 | | 1,010 |
TOTAL COMMERCIAL MORTGAGE SECURITIES (Cost $320,186) |
394,726
|
Municipal Securities - 0.4% |
|
Beaver County Indl. Dev. Auth. Poll. Cont. Rev. Bonds (FirstEnergy Nuclear Generation Corp. Proj.) Series 2005 A, 3.375%, tender 7/1/15 (m) | | 2,300 | | 2,388 |
California Gen. Oblig.: | | | | |
Series 2009, 7.35% 11/1/39 | | 985 | | 1,279 |
7.3% 10/1/39 | | 10,620 | | 13,706 |
7.5% 4/1/34 | | 8,780 | | 11,439 |
7.55% 4/1/39 | | 5,410 | | 7,243 |
7.6% 11/1/40 | | 6,110 | | 8,281 |
7.625% 3/1/40 | | 2,530 | | 3,403 |
Illinois Gen. Oblig.: | | | | |
Series 2010, 4.421% 1/1/15 | | 5,980 | | 6,358 |
Series 2010-1, 6.63% 2/1/35 | | 12,295 | | 13,671 |
Series 2010-3: | | | | |
6.725% 4/1/35 | | 2,025 | | 2,274 |
7.35% 7/1/35 | | 1,640 | | 1,948 |
Series 2011, 5.877% 3/1/19 | | 2,005 | | 2,242 |
5.1% 6/1/33 | | 5,220 | | 5,047 |
TOTAL MUNICIPAL SECURITIES (Cost $75,809) |
79,279
|
Bank Notes - 0.0% |
|
Wachovia Bank NA 6% 11/15/17
(Cost $3,586) | | 3,319 | |
3,975
|
Fixed-Income Funds - 14.5% |
| Shares | | Value (000s) |
Fidelity Corporate Bond 1-10 Year Central Fund (n) | 3,538,209 | | $ 401,162 |
Fidelity High Income Central Fund 2 (n) | 5,394,857 | | 614,582 |
Fidelity Mortgage Backed Securities Central Fund (n) | 17,940,819 | | 1,971,158 |
TOTAL FIXED-INCOME FUNDS (Cost $2,752,455) |
2,986,902
|
Money Market Funds - 2.3% |
| | | |
Fidelity Cash Central Fund, 0.17% (b) | 403,928,601 | | 403,929 |
Fidelity Securities Lending Cash Central Fund, 0.18% (b)(c) | 69,757,970 | | 69,758 |
TOTAL MONEY MARKET FUNDS (Cost $473,687) |
473,687
|
TOTAL INVESTMENT PORTFOLIO - 104.4% (Cost $18,621,067) | | 21,529,875 |
NET OTHER ASSETS (LIABILITIES) - (4.4)% | | (911,147) |
NET ASSETS - 100% | $ 20,618,728 |
TBA Sale Commitments |
| Principal Amount (000s) | | |
Fannie Mae |
3% 9/1/42 | $ (183,000) | | (189,894) |
3% 9/1/42 | (11,300) | | (11,726) |
3% 9/1/42 | (2,300) | | (2,387) |
3% 9/1/42 | (11,300) | | (11,726) |
3% 9/1/42 | (184,600) | | (191,554) |
3.5% 9/1/42 | (139,000) | | (147,383) |
4% 9/1/42 | (31,400) | | (33,672) |
4.5% 9/1/42 | (30,000) | | (32,470) |
TBA Sale Commitments - continued |
| Principal Amount (000s) | | Value (000s) |
Fannie Mae - continued |
5% 9/1/42 | $ (36,800) | | $ (40,192) |
5.5% 9/1/42 | (17,000) | | (18,656) |
6% 9/1/42 | (43,000) | | (47,384) |
TOTAL FANNIE MAE | | (727,044) |
Freddie Mac |
5% 9/1/42 | (7,000) | | (7,588) |
Ginnie Mae |
3.5% 9/1/42 | (7,300) | | (7,902) |
3.5% 9/1/42 | (3,700) | | (4,005) |
TOTAL GINNIE MAE | | (11,907) |
TOTAL TBA SALE COMMITMENTS (Proceeds $743,971) | $ (746,539) |
Futures Contracts |
| Expiration Date | | Underlying
Face Amount
at Value (000s) | | Unrealized Appreciation/
(Depreciation) (000s) |
Purchased |
Equity Index Contracts |
1,537 CME E-mini S&P 500 Index Contracts | Sept. 2012 | | $ 107,982 | | $ 7,700 |
|
The face value of futures purchased as a percentage of net assets is 0.5% |
Swap Agreements |
| Expiration Date | | Notional Amount
(000s) (l) | | Value
(000s) |
Credit Default Swaps |
Receive monthly a fixed rate of .15% multiplied by the notional amount and pay to Credit Suisse First Boston upon each credit event of one of the issues of ABX AA 07-01 Index, par value of the proportional notional amount (Rating-C) (Upfront Premium Received/(Paid) $3,215,000) (k) | Sept. 2037 | | $ 5,588 | | $ (5,303) |
Receive monthly a fixed rate of .15% multiplied by the notional amount and pay to JPMorgan Chase, Inc. upon each credit event of one of the issues of ABX AA 07-01 Index, par value of the proportional notional amount (Rating-C) (Upfront Premium Received/(Paid) $2,992,000) (k) | Sept. 2037 | | 4,551 | | (4,318) |
Receive monthly a fixed rate of .15% multiplied by the notional amount and pay to JPMorgan Chase, Inc. upon each credit event of one of the issues of ABX AA 07-01 Index, par value of the proportional notional amount (Rating-C) (Upfront Premium Received/(Paid) $407,000) (k) | Sept. 2037 | | 602 | | (572) |
Receive monthly a fixed rate of .15% multiplied by the notional amount and pay to Morgan Stanley, Inc. upon each credit event of one of the issues of ABX AA 07-01 Index, par value of the proportional notional amount (Rating-C) (Upfront Premium Received/(Paid) $2,992,000) (k) | Sept. 2037 | | 4,551 | | (4,318) |
Receive monthly a fixed rate of .15% multiplied by the notional amount and pay to UBS upon each credit event of one of the issues of ABX AA 07-1 Index, par value of the proportional notional amount (Rating-C) (Upfront Premium Received/(Paid) $2,882,000) (k) | Sept. 2037 | | 4,383 | | (4,160) |
Swap Agreements - continued |
| Expiration Date | | Notional Amount
(000s)(l) | | Value
(000s) |
Credit Default Swaps - continued |
Receive monthly a fixed rate of .15% multiplied by the notional amount and pay to UBS upon each credit event of one of the issues of ABX AA 07-1 Index, par value of the proportional notional amount (Rating-C) (Upfront Premium Received/(Paid) $2,559,000) (k) | Sept. 2037 | | $ 3,848 | | $ (3,651) |
Receive monthly notional amount multiplied by 2.5% and pay Bank of America upon credit event of Ameriquest Mortgage Securities, Inc., par value of the notional amount of Ameriquest Mortgage Securities, Inc. Series 2004-R11 Class M9, 6.102% 11/25/34 (Rating-C) (k) | Dec. 2034 | | 562 | | (542) |
| | $ 24,085 | | $ (22,864) |
Legend |
(a) Non-income producing |
(b) Affiliated fund that is available only to investment companies and other accounts managed by Fidelity Investments. The rate quoted is the annualized seven-day yield of the fund at period end. A complete unaudited listing of the fund's holdings as of its most recent quarter end is available upon request. In addition, each Fidelity Central Fund's financial statements, which are not covered by the Fund's Report of Independent Registered Public Accounting Firm, are available on the SEC's website or upon request. |
(c) Investment made with cash collateral received from securities on loan. |
(d) Non-income producing - Security is in default. |
(e) Security or a portion of the security is on loan at period end. |
(f) Affiliated company |
(g) Security exempt from registration under Rule 144A of the Securities Act of 1933. These securities may be resold in transactions exempt from registration, normally to qualified institutional buyers. At the end of the period, the value of these securities amounted to $376,199,000 or 1.8% of net assets. |
(h) Security or a portion of the security purchased on a delayed delivery or when-issued basis. |
(i) Security or a portion of the security was pledged to cover margin requirements for futures contracts. At the period end, the value of securities pledged amounted to $5,699,000. |
(j) Security or a portion of the security has been segregated as collateral for open swap agreements. At the period end, the value of securities pledged amounted to $27,704,000. |
(k) Represents a credit default swap contract in which the Fund has sold protection on the underlying reference. The underlying reference may be a single-name issuer or a traded credit index. The value of each credit default swap and the credit rating can be measures of the current payment/performance risk. For the underlying reference, ratings disclosed are from Moody's Investors Service, Inc. Where Moody's ratings are not available, S&P ratings are disclosed and are indicated as such. For swaps on a traded credit index, ratings represent a weighted average of the ratings of all securities included in the index. All ratings are as of the report date and do not reflect subsequent changes. Where a credit rating is not disclosed, the value is used as the measure of the payment/performance risk. |
(l) The notional amount of each credit default swap where the Fund has sold protection approximates the maximum potential amount of future payments that the Fund could be required to make if a credit event were to occur. |
(m) Coupon rates for floating and adjustable rate securities reflect the rates in effect at period end. |
(n) Affiliated fund that is available only to investment companies and other accounts managed by Fidelity Investments. A complete unaudited schedule of portfolio holdings for each Fidelity Central Fund is filed with the SEC for the first and third quarters of each fiscal year on Form N-Q and is available upon request or at the SEC's web site at www.sec.gov. An unaudited holdings listing for the Fund, which presents direct holdings as well as the pro rata share of securities and other investments held indirectly through its investment in underlying non-money market Fidelity Central Funds, is available at fidelity.com. In addition, each Fidelity Central Fund's financial statements, which are not covered by the Fund's Report of Independent Registered Public Accounting Firm, are available on the SEC's web site or upon request. |
(o) Security represents right to receive monthly interest payments on an underlying pool of mortgages or assets. Principal shown is the outstanding par amount of the pool as of the end of the period. |
(p) Investment is owned by an entity that is treated as a corporation for U.S. tax purposes which is owned by the Fund. |
(q) Restricted securities - Investment in securities not registered under the Securities Act of 1933 (excluding 144A issues). At the end of the period, the value of restricted securities (excluding 144A issues) amounted to $22,582,000 or 0.1% of net assets. |
Additional information on each restricted holding is as follows: |
Security | Acquisition Date | Acquisition Cost (000s) |
Halcon Resources Corp. | 3/1/12 | $ 8,190 |
Jumptap, Inc. Series G | 6/29/12 | $ 6,429 |
Legend Pictures LLC | 9/23/10 | $ 6,428 |
* Amount represents less than $1,000. |
Affiliated Central Funds |
Information regarding fiscal year to date income earned by the Fund from investments in Fidelity Central Funds is as follows: |
Fund | Income earned
(Amounts in thousands) |
Fidelity Cash Central Fund | $ 767 |
Fidelity Corporate Bond 1-10 Year Central Fund | 16,659 |
Fidelity High Income Central Fund 2 | 39,969 |
Fidelity Mortgage Backed Securities Central Fund | 44,833 |
Fidelity Securities Lending Cash Central Fund | 1,552 |
Total | $ 103,780 |
Additional information regarding the Fund's fiscal year to date purchases and sales, including the ownership percentage, of the non Money Market Central Funds is as follows: |
Fund
(Amounts in
thousands) | Value,
beginning of
period | Purchases | Sales
Proceeds | Value,
end of
period | % ownership,
end of
period |
Fidelity Corporate Bond 1-10 Year Central Fund | $ 388,778 | $ - | $ - | $ 401,162 | 58.3% |
Fidelity High Income Central Fund 2 | 533,410 | 39,969 | - | 614,582 | 83.0% |
Fidelity Mortgage Backed Securities Central Fund | 1,480,565 | 541,089 | 76,845 | 1,971,158 | 12.6% |
Total | $ 2,402,753 | $ 581,058 | $ 76,845 | $ 2,986,902 | |
Other Affiliated Issuers |
An affiliated company is a company in which the Fund has ownership of at least 5% of the voting securities. Fiscal year to date transactions with companies which are or were affiliates are as follows: |
Affiliate
(Amounts in thousands) | Value,
beginning of
period | Purchases | Sales Proceeds | Dividend Income | Value,
end of
period |
Kayak Software Corp. | $ - | $ 5,795 | $ - | $ - | $ 5,542 |
Other Information |
The following is a summary of the inputs used, as of August 31, 2012, involving the Fund's assets and liabilities carried at fair value. The inputs or methodology used for valuing securities may not be an indication of the risk associated with investing in those securities. For more information on valuation inputs, and their aggregation into the levels used in the table below, please refer to the Security Valuation section in the accompanying Notes to Financial Statements. |
Valuation Inputs at Reporting Date: |
Description
(Amounts in thousands) | Total | Level 1 | Level 2 | Level 3 |
Investments in Securities: | | | | |
Equities: | | | | |
Consumer Discretionary | $ 1,315,967 | $ 1,300,374 | $ - | $ 15,593 |
Consumer Staples | 1,479,674 | 1,424,505 | 55,169 | - |
Energy | 1,477,952 | 1,477,952 | - | - |
Financials | 1,922,380 | 1,894,913 | 17,234 | 10,233 |
Health Care | 1,549,685 | 1,549,685 | - | - |
Industrials | 1,351,489 | 1,351,489 | - | - |
Information Technology | 2,844,848 | 2,844,848 | - | - |
Materials | 417,661 | 417,661 | - | - |
Valuation Inputs at Reporting Date: |
Description
(Amounts in thousands) | Total | Level 1 | Level 2 | Level 3 |
Investments in Securities: | | | | |
Equities: | | | | |
Telecommunication Services | $ 310,534 | $ 310,534 | $ - | $ - |
Utilities | 462,047 | 462,047 | - | - |
Corporate Bonds | 1,517,523 | - | 1,517,523 | - |
U.S. Government and Government Agency Obligations | 1,020,741 | - | 1,020,741 | - |
U.S. Government Agency - Mortgage Securities | 1,808,812 | - | 1,808,812 | - |
Asset-Backed Securities | 64,180 | - | 56,298 | 7,882 |
Collateralized Mortgage Obligations | 47,813 | - | 46,022 | 1,791 |
Commercial Mortgage Securities | 394,726 | - | 365,749 | 28,977 |
Municipal Securities | 79,279 | - | 79,279 | - |
Bank Notes | 3,975 | - | 3,975 | - |
Fixed-Income Funds | 2,986,902 | 2,986,902 | - | - |
Money Market Funds | 473,687 | 473,687 | - | - |
Total Investments in Securities: | $ 21,529,875 | $ 16,494,597 | $ 4,970,802 | $ 64,476 |
Derivative Instruments: | | | | |
Assets | | | | |
Futures Contracts | $ 7,700 | $ 7,700 | $ - | $ - |
Liabilities | | | | |
Swap Agreements | $ (22,864) | $ - | $ (22,322) | $ (542) |
Total Derivative Instruments: | $ (15,164) | $ 7,700 | $ (22,322) | $ (542) |
Other Financial Instruments: | | | | |
TBA Sale Commitments | $ (746,539) | $ - | $ (746,539) | $ - |
Value of Derivative Instruments |
The following table is a summary of the Fund's value of derivative instruments by primary risk exposure as of August 31, 2012. For additional information on derivative instruments, please refer to the Derivative Instruments section in the accompanying Notes to Financial Statements. |
Primary Risk Exposure /
Derivative Type | Value |
(Amounts in thousands) | Asset | Liability |
Credit Risk | | |
Swap Agreements (b) | $ - | $ (22,864) |
Equity Risk | | |
Futures Contracts (a) | 7,700 | - |
Total Value of Derivatives | $ 7,700 | $ (22,864) |
(a) Reflects cumulative appreciation/(depreciation) on futures contracts as disclosed on the Schedule of Investments. Only the period end variation margin is separately disclosed on the Statement of Assets and Liabilities. |
(b) Value is disclosed on the Statement of Assets and Liabilities in the Swap agreements, at value line-items. |
Other Information |
The composition of credit quality ratings as a percentage of net assets is as follows (Unaudited): |
U.S. Government and U.S. Government Agency Obligations | 19.9% |
AAA,AA,A | 4.8% |
BBB | 6.7% |
BB | 0.8% |
B | 1.9% |
CCC,CC,C | 0.2% |
D | 0.0%* |
Not Rated | 0.0%* |
Equities | 63.8% |
Short-Term Investments and Net Other Assets | 1.9% |
| 100% |
* Amount represents less than 0.1% |
We have used ratings from Moody's Investors Service, Inc. Where Moody's® ratings are not available, we have used S&P® ratings. All ratings are as of the date indicated and do not reflect subsequent changes. |
The information in the above table is based on the combined investments of the Fund and its pro-rata share of the investments of Fidelity's fixed-income central funds. |
See accompanying notes which are an integral part of the financial statements.
Annual Report
Statement of Assets and Liabilities
Amounts in thousands (except per-share amounts) | August 31, 2012 |
| | |
Assets | | |
Investment in securities, at value (including securities loaned of $68,346) - See accompanying schedule: Unaffiliated issuers (cost $15,389,130) | $ 18,063,744 | |
Fidelity Central Funds (cost $3,226,142) | 3,460,589 | |
Other affiliated issuers (cost $5,795) | 5,542 | |
Total Investments (cost $18,621,067) | | $ 21,529,875 |
Foreign currency held at value (cost $2,756) | | 2,756 |
Receivable for investments sold, regular delivery | | 637,453 |
Receivable for TBA sale commitments | | 743,971 |
Receivable for swap agreements | | 5 |
Receivable for fund shares sold | | 15,555 |
Dividends receivable | | 29,414 |
Interest receivable | | 28,064 |
Distributions receivable from Fidelity Central Funds | | 1,750 |
Receivable for daily variation margin on futures contracts | | 615 |
Other receivables | | 998 |
Total assets | | 22,990,456 |
| | |
Liabilities | | |
Payable to custodian bank | $ 102 | |
Payable for investments purchased
Regular delivery | 263,000 | |
Delayed delivery | 1,245,389 | |
TBA sale commitments, at value | 746,539 | |
Payable for swap agreements | 2,633 | |
Payable for fund shares redeemed | 9,164 | |
Swap agreements, at value | 22,864 | |
Accrued management fee | 6,974 | |
Other affiliated payables | 2,484 | |
Other payables and accrued expenses | 2,821 | |
Collateral on securities loaned, at value | 69,758 | |
Total liabilities | | 2,371,728 |
| | |
Net Assets | | $ 20,618,728 |
Net Assets consist of: | | |
Paid in capital | | $ 18,565,807 |
Undistributed net investment income | | 84,489 |
Accumulated undistributed net realized gain (loss) on investments and foreign currency transactions | | (921,602) |
Net unrealized appreciation (depreciation) on investments and assets and liabilities in foreign currencies | | 2,890,034 |
Net Assets | | $ 20,618,728 |
See accompanying notes which are an integral part of the financial statements.
Annual Report
Financial Statements - continued
Statement of Assets and Liabilities - continued
Amounts in thousands (except per-share amounts) | August 31, 2012 |
| | |
Balanced:
Net Asset Value, offering price and redemption price per share ($15,016,156 ÷ 752,542 shares) | | $ 19.95 |
| | |
Class K:
Net Asset Value, offering price and redemption price per share ($5,602,572 ÷ 280,771 shares) | | $ 19.95 |
See accompanying notes which are an integral part of the financial statements.
Annual Report
Statement of Operations
Amounts in thousands | Year ended August 31, 2012 |
| | |
Investment Income | | |
Dividends | | $ 232,301 |
Interest | | 177,782 |
Income from Fidelity Central Funds | | 103,780 |
Total income | | 513,863 |
| | |
Expenses | | |
Management fee | $ 81,574 | |
Transfer agent fees | 28,381 | |
Accounting and security lending fees | 1,995 | |
Custodian fees and expenses | 342 | |
Independent trustees' compensation | 133 | |
Registration fees | 298 | |
Audit | 162 | |
Legal | 86 | |
Miscellaneous | 208 | |
Total expenses before reductions | 113,179 | |
Expense reductions | (845) | 112,334 |
Net investment income (loss) | | 401,529 |
Realized and Unrealized Gain (Loss) Net realized gain (loss) on: | | |
Investment securities: | | |
Unaffiliated issuers | 5,409 | |
Fidelity Central Funds | 1,625 | |
Foreign currency transactions | (129) | |
Futures contracts | 8,596 | |
Swap agreements | (16,533) | |
Total net realized gain (loss) | | (1,032) |
Change in net unrealized appreciation (depreciation) on: Investment securities | 1,823,727 | |
Assets and liabilities in foreign currencies | (260) | |
Futures contracts | 8,583 | |
Swap agreements | 15,494 | |
Delayed delivery commitments | (5,308) | |
Total change in net unrealized appreciation (depreciation) | | 1,842,236 |
Net gain (loss) | | 1,841,204 |
Net increase (decrease) in net assets resulting from operations | | $ 2,242,733 |
See accompanying notes which are an integral part of the financial statements.
Annual Report
Financial Statements - continued
Statement of Changes in Net Assets
Amounts in thousands | Year ended
August 31,
2012 | Year ended
August 31,
2011 |
Increase (Decrease) in Net Assets | | |
Operations | | |
Net investment income (loss) | $ 401,529 | $ 410,670 |
Net realized gain (loss) | (1,032) | 2,160,284 |
Change in net unrealized appreciation (depreciation) | 1,842,236 | 115,234 |
Net increase (decrease) in net assets resulting
from operations | 2,242,733 | 2,686,188 |
Distributions to shareholders from net investment income | (379,925) | (410,590) |
Distributions to shareholders from net realized gain | - | (9,407) |
Total distributions | (379,925) | (419,997) |
Share transactions - net increase (decrease) | (947,824) | (2,018,385) |
Total increase (decrease) in net assets | 914,984 | 247,806 |
| | |
Net Assets | | |
Beginning of period | 19,703,744 | 19,455,938 |
End of period (including undistributed net investment income of $84,489 and undistributed net investment income of $89,115, respectively) | $ 20,618,728 | $ 19,703,744 |
See accompanying notes which are an integral part of the financial statements.
Annual Report
Financial Highlights - Balanced
Years ended August 31, | 2012 | 2011 | 2010 | 2009 | 2008 |
Selected Per-Share Data | | | | | |
Net asset value, beginning of period | $ 18.17 | $ 16.27 | $ 15.40 | $ 17.71 | $ 20.66 |
Income from Investment Operations | | | | | |
Net investment income (loss) B | .37 | .35 | .36 | .38 | .42 |
Net realized and unrealized gain (loss) | 1.76 | 1.91 | .88 | (2.29) | (1.76) |
Total from investment operations | 2.13 | 2.26 | 1.24 | (1.91) | (1.34) |
Distributions from net investment income | (.35) | (.35) | (.36) | (.37) | (.43) |
Distributions from net realized gain | - | (.01) | (.01) | (.03) | (1.18) |
Total distributions | (.35) | (.36) | (.37) | (.40) | (1.61) |
Net asset value, end of period | $ 19.95 | $ 18.17 | $ 16.27 | $ 15.40 | $ 17.71 |
Total Return A | 11.89% | 13.88% | 8.06% | (10.48)% | (7.28)% |
Ratios to Average Net Assets C, E | | | | | |
Expenses before reductions | .60% | .61% | .62% | .68% | .61% |
Expenses net of fee waivers, if any | .60% | .61% | .62% | .68% | .61% |
Expenses net of all reductions | .59% | .60% | .61% | .68% | .61% |
Net investment income (loss) | 1.98% | 1.92% | 2.18% | 2.78% | 2.22% |
Supplemental Data | | | | | |
Net assets, end of period (in millions) | $ 15,016 | $ 15,602 | $ 16,764 | $ 17,225 | $ 25,363 |
Portfolio turnover rate D | 155% | 193% F | 122% | 198% F | 73% F |
A Total returns would have been lower if certain expenses had not been reduced during the applicable periods shown.
B Calculated based on average shares outstanding during the period.
C Fees and expenses of any underlying Fidelity Central Funds are not included in the Fund's expense ratio. The Fund indirectly bears its proportionate share of the expenses of any underlying Fidelity Central Funds.
D Amount does not include the portfolio activity of any underlying Fidelity Central Funds.
E Expense ratios reflect operating expenses of the class. Expenses before reductions do not reflect amounts reimbursed by the investment adviser or reductions from brokerage service arrangements or reductions from other expense offset arrangements and do not represent the amount paid by the class during periods when reimbursements or reductions occur. Expenses net of fee waivers reflect expenses after reimbursement by the investment adviser but prior to reductions from brokerage service arrangements or other expense offset arrangements. Expenses net of all reductions represent the net expenses paid by the class.
F The portfolio turnover rate excludes liquidations and/or redemptions executed in-kind from Affiliated Central Funds.
See accompanying notes which are an integral part of the financial statements.
Annual Report
Financial Highlights - Class K
Years ended August 31, | 2012 | 2011 | 2010 | 2009 | 2008 G |
Selected Per-Share Data | | | | | |
Net asset value, beginning of period | $ 18.17 | $ 16.27 | $ 15.40 | $ 17.72 | $ 19.12 |
Income from Investment Operations | | | | | |
Net investment income (loss) D | .40 | .38 | .38 | .40 | .12 |
Net realized and unrealized gain (loss) | 1.76 | 1.90 | .88 | (2.29) | (1.41) |
Total from investment operations | 2.16 | 2.28 | 1.26 | (1.89) | (1.29) |
Distributions from net investment income | (.38) | (.38) | (.38) | (.40) | (.11) |
Distributions from net realized gain | - | (.01) | (.01) | (.03) | - |
Total distributions | (.38) | (.38) I | (.39) | (.43) | (.11) |
Net asset value, end of period | $ 19.95 | $ 18.17 | $ 16.27 | $ 15.40 | $ 17.72 |
Total Return B, C | 12.03% | 14.04% | 8.23% | (10.33)% | (6.74)% |
Ratios to Average Net Assets E, H | | | | | |
Expenses before reductions | .48% | .48% | .48% | .50% | .48% A |
Expenses net of fee waivers, if any | .48% | .48% | .48% | .50% | .48% A |
Expenses net of all reductions | .47% | .47% | .47% | .50% | .48% A |
Net investment income (loss) | 2.10% | 2.05% | 2.32% | 2.96% | 2.45% A |
Supplemental Data | | | | | |
Net assets, end of period (in millions) | $ 5,603 | $ 4,102 | $ 2,692 | $ 2,014 | $ 17 |
Portfolio turnover rate F | 155% | 193% J | 122% | 198% J | 73% J |
A Annualized
B Total returns for periods of less than one year are not annualized.
C Total returns would have been lower if certain expenses had not been reduced during the applicable periods shown.
D Calculated based on average shares outstanding during the period.
E Fees and expenses of any underlying Fidelity Central Funds are not included in the Fund's expense ratio. The Fund indirectly bears its proportionate share of the expenses of any underlying Fidelity Central Funds.
F Amount does not include the portfolio activity of any underlying Fidelity Central Funds.
G For the period May 9, 2008 (commencement of sale of shares) to August 31, 2008.
H Expense ratios reflect operating expenses of the class. Expenses before reductions do not reflect amounts reimbursed by the investment adviser or reductions from brokerage service arrangements or reductions from other expense offset arrangements and do not represent the amount paid by the class during periods when reimbursements or reductions occur. Expense ratios before reductions for start-up periods may not be representative of longer-term operating periods. Expenses net of fee waivers reflect expenses after reimbursement by the investment adviser but prior to reductions from brokerage service arrangements or other expense offset arrangements. Expenses net of all reductions represent the net expenses paid by the class.
I Total distributions of $.38 per share is comprised of distributions from net investment income of $.376 and distributions from net realized gain of $.008 per share.
J The portfolio turnover rate excludes liquidations and/or redemptions executed in-kind from Affiliated Central Funds.
See accompanying notes which are an integral part of the financial statements.
Annual Report
Notes to Financial Statements
For the period ended August 31, 2012
(Amounts in thousands except percentages)
1. Organization.
Fidelity® Balanced Fund (the Fund) is a fund of Fidelity Puritan Trust (the Trust) and is authorized to issue an unlimited number of shares. The Trust is registered under the Investment Company Act of 1940, as amended (the 1940 Act), as an open-end management investment company organized as a Massachusetts business trust. The Fund offers Balanced and Class K, shares, each of which has equal rights as to assets and voting privileges. Each class has exclusive voting rights with respect to matters that affect that class. Investment income, realized and unrealized capital gains and losses, the common expenses of the Fund, and certain fund-level expense reductions, if any, are allocated on a pro-rata basis to each class based on the relative net assets of each class to the total net assets of the Fund. Each class differs with respect to transfer agent fees incurred. Certain expense reductions may also differ by class.
2. Investments in Fidelity Central Funds.
The Fund invests in Fidelity Central Funds, which are open-end investment companies available only to other investment companies and accounts managed by Fidelity Management & Research Company (FMR) and its affiliates. The Fund's Schedule of Investments lists each of the Fidelity Central Funds held as of period end, if any, as an investment of the Fund, but does not include the underlying holdings of each Fidelity Central Fund. As an Investing Fund, the Fund indirectly bears its proportionate share of the expenses of the underlying Fidelity Central Funds.
Based on its investment objective, each Fidelity Central Fund may invest or participate in various investment vehicles or strategies that are similar to those of the Fund. These strategies are consistent with the investment objectives of the Fund and may involve certain economic risks which may cause a decline in value of each of the Fidelity Central Funds and thus a decline in the value of the Fund. The Money Market Central Funds seek preservation of capital and current income and are managed by Fidelity Investments Money Management, Inc. (FIMM), an affiliate of FMR. The following summarizes the Fund's investment in each non-money market Fidelity Central Fund.
Fidelity Central Fund | | Investment
Manager | | Investment Objective | | Investment Practices |
Fidelity Corporate Bond 1-10 Year Central Fund | | FIMM | | Seeks a high level of income by normally investing in investment-grade corporate bonds and other corporate debt securities and repurchase agreements for those securities. | | Repurchase Agreements Restricted Securities |
Annual Report
Notes to Financial Statements - continued
(Amounts in thousands except percentages)
2. Investments in Fidelity Central Funds - continued
Fidelity Central Fund | | Investment
Manager | | Investment Objective | | Investment Practices |
Fidelity High Income Central Fund 2 | | FMR Co., Inc. (FMRC) | | Seeks a high level of income and may also seek capital appreciation by investing primarily in debt securities, preferred stocks, and convertible securities, with an emphasis on lower-quality debt securities. | | Loans & Direct Debt Instruments Repurchase Agreements Restricted Securities |
Fidelity Mortgage Backed Securities Central Fund | | FIMM | | Seeks a high level of income by normally investing in investment-grade mortgage-related securities and repurchase agreements for those securities. | | Delayed Delivery & When Issued Securities Futures Repurchase Agreements Swap Agreements |
An unaudited holdings listing for the Fund, which presents direct holdings as well as the pro-rata share of any securities and other investments held indirectly through its investment in underlying non-money market Fidelity Central Funds, is available at fidelity.com. A complete unaudited list of holdings for each Fidelity Central Fund is available upon request or at the Securities and Exchange Commission (the SEC) web site at www.sec.gov. In addition, the financial statements of the Fidelity Central Funds which contain the significant accounting policies (including security valuation policies) of those funds, which are not covered by the Fund's Report of Independent Registered Public Accounting Firm, are available on the SEC web site or upon request.
3. Significant Accounting Policies.
The financial statements have been prepared in conformity with accounting principles generally accepted in the United States of America (GAAP), which require management to make certain estimates and assumptions at the date of the financial statements. Actual results could differ from those estimates. Subsequent events, if any, through the date that the financial statements were issued have been evaluated in the preparation of the financial statements. The following summarizes the significant accounting policies of the Fund:
Security Valuation. Investments are valued as of 4:00 p.m. Eastern time on the last calendar day of the period. In accordance with valuation policies and procedures approved by the Board of Trustees (the Board), the Fund attempts to obtain prices from one or more third party pricing vendor or broker to value its investments. When current market prices, quotations or rates are not readily available or reliable, securities will be
Annual Report
3. Significant Accounting Policies - continued
Security Valuation - continued
fair valued in good faith by the FMR Fair Value Committee (the Committee), in accordance with procedures adopted by the Fund's Board. Factors used in determining fair value vary by security type and may include market or security specific events, changes in interest rates and credit quality. The frequency with which these procedures are used cannot be predicted and they may be utilized to a significant extent. The Committee oversees the Fund's valuation policies and procedures and is responsible for approving and reporting to the Board all fair value determinations.
The Fund categorizes the inputs to valuation techniques used to value its investments into a disclosure hierarchy consisting of three levels as shown below:
Level 1 - quoted prices in active markets for identical investments
Level 2 - other significant observable inputs (including quoted prices for similar investments, interest rates, prepayment speeds, etc.)
Level 3 - unobservable inputs (including the Fund's own assumptions based on the best information available)
Valuation techniques used to value the Fund's investments by major category are as follows:
Equity securities, including restricted securities, for which market quotations are readily available, are valued at the last reported sale price or official closing price as reported by a third party pricing vendor on the primary market or exchange on which they are traded and are categorized as Level 1 in the hierarchy. In the event there were no sales during the day or closing prices are not available, securities are valued at the last quoted bid price or may be valued using the last available price and are generally categorized as Level 2 in the hierarchy. For foreign equity securities, when significant market or security specific events arise, comparisons to the valuation of American Depositary Receipts (ADRs), futures contracts, Exchange-Traded Funds (ETFs) and certain indexes as well as quoted prices for similar securities are used and are categorized as Level 2 in the hierarchy. Utilizing these techniques may result in transfers between Level 1 and Level 2. For restricted equity securities and private placements where observable inputs are limited, assumptions about market activity and risk are used and these securities are categorized as Level 3 in the hierarchy.
Debt securities, including restricted securities, are valued based on evaluated prices received from third party pricing vendors or from brokers who make markets in such securities. For corporate bonds, bank notes, municipal securities and U.S. government and government agency obligations, pricing vendors utilize matrix pricing which considers yield or price of bonds of comparable quality, coupon, maturity and type as well as
Annual Report
Notes to Financial Statements - continued
(Amounts in thousands except percentages)
3. Significant Accounting Policies - continued
Security Valuation - continued
broker-supplied prices and are generally categorized as Level 2 in the hierarchy. For asset backed securities, collateralized mortgage obligations, commercial mortgage securities and U.S. government agency mortgage securities, pricing vendors utilize matrix pricing which considers prepayment speed assumptions, attributes of the collateral, yield or price of bonds of comparable quality, coupon, maturity and type as well as broker-supplied prices and, accordingly, such securities are generally categorized as Level 2 in the hierarchy. Swaps are marked-to-market daily based on valuations from third party pricing vendors or broker-supplied valuations and changes in value are recorded as unrealized appreciation (depreciation). Pricing vendors utilize matrix pricing which considers comparisons to interest rate curves, credit spread curves, default possibilities and recovery rates and, as a result, swaps are generally categorized as Level 2 in the hierarchy. When independent prices are unavailable or unreliable, debt securities and swaps may be valued utilizing pricing methodologies which consider similar factors that would be used by third party pricing vendors. These are generally categorized as Level 2 in the hierarchy but may be Level 3 depending on the circumstances.
Futures contracts are valued at the settlement price established each day by the board of trade or exchange on which they are traded and are categorized as Level 1 in the hierarchy. Investments in open-end mutual funds, including the Fidelity Central Funds, are valued at their closing net asset value each business day and are categorized as Level 1 in the hierarchy.
Changes in valuation techniques may result in transfers in or out of an assigned level within the disclosure hierarchy. The aggregate value of investments by input level, as of August 31, 2012, is included at the end of the Fund's Schedule of Investments.
Foreign Currency Translation. The Fund may use foreign currency contracts to facilitate transactions in foreign-denominated securities. Gains and losses from these transactions may arise from changes in the value of the foreign currency or if the counterparties do not perform under the contracts' terms.
Foreign-denominated assets, including investment securities, and liabilities are translated into U.S. dollars at the exchange rates at period end. Purchases and sales of investment securities, income and dividends received and expenses denominated in foreign currencies are translated into U.S. dollars at the exchange rate in effect on the transaction date.
Annual Report
3. Significant Accounting Policies - continued
Foreign Currency Translation - continued
The effects of exchange rate fluctuations on investments are included with the net realized and unrealized gain (loss) on investment securities. Other foreign currency transactions resulting in realized and unrealized gain (loss) are disclosed separately.
Investment Transactions and Income. For financial reporting purposes, the Fund's investment holdings and NAV include trades executed through the end of the last business day of the period. The NAV per share for processing shareholder transactions is calculated as of the close of business of the New York Stock Exchange (NYSE), normally 4:00 p.m. Eastern time and includes trades executed through the end of the prior business day. Gains and losses on securities sold are determined on the basis of identified cost and may include proceeds received from litigation. Dividend income is recorded on the ex-dividend date, except for certain dividends from foreign securities where the ex-dividend date may have passed, which are recorded as soon as the Fund is informed of the ex-dividend date. Non-cash dividends included in dividend income, if any, are recorded at the fair market value of the securities received. Distributions received on securities that represent a return of capital or capital gain are recorded as a reduction of cost of investments and/or as a realized gain. The Fund estimates the components of distributions received that may be considered return of capital distributions or capital gain distributions. Interest income and distributions from the Fidelity Central Funds are accrued as earned. Interest income includes coupon interest and amortization of premium and accretion of discount on debt securities. The principal amount on inflation-indexed securities is periodically adjusted to the rate of inflation and interest is accrued based on the principal amount. The adjustments to principal due to inflation are reflected as increases or decreases to interest income even though principal is not received until maturity. Investment income is recorded net of foreign taxes withheld where recovery of such taxes is uncertain. Debt obligations may be placed on non-accrual status and related interest income may be reduced by ceasing current accruals and writing off interest receivables when the collection of all or a portion of interest has become doubtful based on consistently applied procedures. A debt obligation is removed from non-accrual status when the issuer resumes interest payments or when collectability of interest is reasonably assured.
Expenses. Expenses directly attributable to a fund are charged to that fund. Expenses attributable to more than one fund are allocated among the respective funds on the basis of relative net assets or other appropriate methods. Expense estimates are accrued in the period to which they relate and adjustments are made when actual amounts are known.
Deferred Trustee Compensation. Under a Deferred Compensation Plan (the Plan), independent Trustees may elect to defer receipt of a portion of their annual compensation. Deferred amounts are invested in a cross-section of Fidelity funds, are
Annual Report
Notes to Financial Statements - continued
(Amounts in thousands except percentages)
3. Significant Accounting Policies - continued
Deferred Trustee Compensation - continued
marked-to-market and remain in the Fund until distributed in accordance with the Plan. The investment of deferred amounts and the offsetting payable to the Trustees are included in the accompanying Statement of Assets and Liabilities.
Income Tax Information and Distributions to Shareholders. Each year, the Fund intends to qualify as a regulated investment company under Subchapter M of the Internal Revenue Code, including distributing substantially all of its taxable income and realized gains. As a result, no provision for income taxes is required. As of August 31, 2012, the Fund did not have any unrecognized tax benefits in the financial statements; nor is the Fund aware of any tax positions for which it is reasonably possible that the total amounts of unrecognized tax benefits will significantly change in the next twelve months. The Fund files a U.S. federal tax return, in addition to state and local tax returns as required. A fund's federal income tax returns are subject to examination by the Internal Revenue Service (IRS) for a period of three fiscal years after they are filed. State and local tax returns may be subject to examination for an additional fiscal year depending on the jurisdiction. Foreign taxes are provided for based on the Fund's understanding of the tax rules and rates that exist in the foreign markets in which it invests.
Distributions are declared and recorded on the ex-dividend date. Income dividends and capital gain distributions are declared separately for each class. Income and capital gain distributions are determined in accordance with income tax regulations, which may differ from GAAP.
Capital accounts within the financial statements are adjusted for permanent book-tax differences. These adjustments have no impact on net assets or the results of operations. Temporary book-tax differences will reverse in a subsequent period.
Book-tax differences are primarily due to futures transactions, swap agreements, foreign currency transactions, passive foreign investment companies (PFIC), prior period premium and discount on debt securities, market discount, partnerships (including allocations from Fidelity Central Funds), deferred trustees compensation, capital loss carryforwards and losses deferred due to wash sales and excise tax regulations.
The federal tax cost of investment securities and unrealized appreciation (depreciation) as of period end were as follows:
Gross unrealized appreciation | $ 2,929,790 |
Gross unrealized depreciation | (276,783) |
Net unrealized appreciation (depreciation) on securities and other investments | $ 2,653,007 |
Tax Cost | $ 18,876,868 |
Annual Report
3. Significant Accounting Policies - continued
Income Tax Information and Distributions to Shareholders - continued
The tax-based components of distributable earnings as of period end were as follows:
Undistributed ordinary income | $ 64,654 |
Capital loss carryforward | $ (409,574) |
Net unrealized appreciation (depreciation) | $ 2,626,534 |
Capital loss carryforwards are only available to offset future capital gains of the Fund to the extent provided by regulations and may be limited. Under the Regulated Investment Company Modernization Act of 2010 (the Act), the Fund is permitted to carry forward capital losses incurred in taxable years beginning after December 22, 2010 for an unlimited period and such capital losses are required to be used prior to any losses that expire. Capital loss carryforwards were as follows:
Fiscal year of expiration | |
| |
2018 | $ (409,574) |
The Fund intends to elect to defer to its fiscal year ending August 31, 2013 approximately $228,149 of capital losses recognized during the period November 1, 2011 to August 31, 2012.
The tax character of distributions paid was as follows:
| August 31, 2012 | August 31, 2011 |
Ordinary Income | $ 379,925 | $ 419,997 |
New Accounting Pronouncement. In December 2011, the Financial Accounting Standards Board issued Accounting Standard Update No. 2011-11, Disclosures about Offsetting Assets and Liabilities. The update creates new disclosure requirements requiring entities to disclose both gross and net information for derivatives and other financial instruments that are either offset in the Statement of Assets and Liabilities or subject to an enforceable master netting arrangement or similar agreement. The disclosure requirements are effective for annual reporting periods beginning on or after January 1, 2013, and interim periods within those annual periods. Management is currently evaluating the impact of the update's adoption on the Fund's financial statement disclosures.
4. Operating Policies.
Delayed Delivery Transactions and When-Issued Securities. During the period, the Fund transacted in securities on a delayed delivery or when-issued basis. Payment
Annual Report
Notes to Financial Statements - continued
(Amounts in thousands except percentages)
4. Operating Policies - continued
Delayed Delivery Transactions and When-Issued Securities - continued
and delivery may take place after the customary settlement period for that security. The price of the underlying securities and the date when the securities will be delivered and paid for are fixed at the time the transaction is negotiated. The securities purchased on a delayed delivery or when-issued basis are identified as such in the Fund's Schedule of Investments. The Fund may receive compensation for interest forgone in the purchase of a delayed delivery or when-issued security. With respect to purchase commitments, the Fund identifies securities as segregated in its records with a value at least equal to the amount of the commitment. Losses may arise due to changes in the value of the underlying securities or if the counterparty does not perform under the contract's terms, or if the issuer does not issue the securities due to political, economic, or other factors.
To-Be-Announced (TBA) Securities and Mortgage Dollar Rolls. During the period, the Fund transacted in TBA securities that involved buying or selling mortgage-backed securities (MBS) on a forward commitment basis. A TBA transaction typically does not designate the actual security to be delivered and only includes an approximate principal amount however; delivered securities must meet specified terms defined by industry guidelines, including issuer, rate and current principal amount outstanding on underlying mortgage pools. The Fund may enter into a TBA transaction with the intent to take possession of or deliver the underlying MBS, or the Fund may elect to extend the settlement by entering into either a mortgage or reverse mortgage dollar roll. Mortgage dollar rolls are transactions where a fund sells TBA securities and simultaneously agrees to repurchase MBS on a later date at a lower price and with the same counterparty. Reverse mortgage dollar rolls involve the purchase and simultaneous agreement to sell TBA securities on a later date at a lower price. Transactions in mortgage dollar rolls and reverse mortgage dollar rolls are accounted for as purchases and sales and may result in an increase to the Fund's portfolio turnover rate.
Purchases and sales of TBA securities involve risks similar to those discussed above for delayed delivery and when-issued securities. Also, if the counterparty in a mortgage dollar roll or a reverse mortgage dollar roll transaction files for bankruptcy or becomes insolvent, the Fund's right to repurchase or sell securities may be limited. Additionally, when a fund sells TBA securities without already owning or having the right to obtain the deliverable securities (an uncovered forward commitment to sell), it incurs a risk of loss because it could have to purchase the securities at a price that is higher than the price at which it sold them. A fund may be unable to purchase the deliverable securities if the corresponding market is illiquid.
TBA securities subject to a forward commitment to sell at period end are included at the end of the Fund's Schedule of Investments under the caption "TBA Sale Commitments." The proceeds and value of these commitments are reflected in the Fund's Statement of Assets and Liabilities.
Annual Report
4. Operating Policies - continued
Restricted Securities. The Fund may invest in securities that are subject to legal or contractual restrictions on resale. These securities generally may be resold in transactions exempt from registration or to the public if the securities are registered. Disposal of these securities may involve time-consuming negotiations and expense, and prompt sale at an acceptable price may be difficult. Information regarding restricted securities is included at the end of the Fund's Schedule of Investments.
5. Derivative Instruments.
Risk Exposures and the Use of Derivative Instruments. The Fund's investment objective allows the Fund to enter into various types of derivative contracts, including futures contracts and swap agreements. Derivatives are investments whose value is primarily derived from underlying assets, indices or reference rates and may be transacted on an exchange or over-the-counter (OTC). Derivatives may involve a future commitment to buy or sell a specified instrument based on specified terms, to exchange future cash flows at periodic intervals based on a notional principal amount, or for one party to make one or more payments upon the occurrence of specified events in exchange for periodic payments from the other party.
The Fund used derivatives to increase returns, to gain exposure to certain types of assets and to manage exposure to certain risks as defined below. The success of any strategy involving derivatives depends on analysis of numerous economic factors, and if the strategies for investment do not work as intended, the Fund may not achieve its objectives.
The Fund's use of derivatives increased or decreased its exposure to the following risks:
Credit Risk | Credit risk relates to the ability of the issuer of a financial instrument to make further principal or interest payments on an obligation or commitment that it has to the Fund. |
Equity Risk | Equity risk relates to the fluctuations in the value of financial instruments as a result of changes in market prices (other than those arising from interest rate risk or foreign exchange risk), whether caused by factors specific to an individual investment, its issuer, or all factors affecting all instruments traded in a market or market segment. |
The Fund is also exposed to additional risks from investing in derivatives, such as liquidity risk and counterparty credit risk. Liquidity risk is the risk that the Fund will be unable to close out the derivative in the open market in a timely manner. Counterparty credit risk is the risk that the counterparty will not be able to fulfill its obligation to the Fund. Derivative counterparty credit risk is managed through formal evaluation of the creditworthiness of all potential counterparties. On certain OTC derivatives such as swap
Annual Report
Notes to Financial Statements - continued
(Amounts in thousands except percentages)
5. Derivative Instruments - continued
Risk Exposures and the Use of Derivative Instruments - continued
transactions, the Fund attempts to reduce its exposure to counterparty credit risk by entering into an International Swaps and Derivatives Association, Inc. (ISDA) Master Agreement on a bilateral basis with each of its counterparties. The ISDA Master Agreement gives the Fund the right to terminate all transactions traded under such agreement upon the deterioration in the credit quality of the counterparty beyond specified levels. The ISDA Master Agreement gives each party the right, upon an event of default by the other party or a termination of the agreement, to close out all transactions traded under such agreement and to net amounts owed under each transaction to one net payable by one party to the other. To mitigate counterparty credit risk on OTC derivatives, the Fund receives collateral in the form of cash or securities once the Fund's net unrealized appreciation on outstanding derivative contracts under an ISDA Master Agreement exceeds certain applicable thresholds, subject to certain minimum transfer provisions. The collateral received is held in segregated accounts with the Fund's custodian bank in accordance with the collateral agreements entered into between the Fund, the counterparty and the Fund's custodian bank. The Fund could experience delays and costs in gaining access to the collateral even though it is held by the Fund's custodian bank. The Fund's maximum risk of loss from counterparty credit risk related to OTC derivatives is generally the aggregate unrealized appreciation and unpaid counterparty payments in excess of any collateral pledged by the counterparty to the Fund. The Fund may be required to pledge collateral for the benefit of the counterparties on OTC derivatives in an amount not less than each counterparty's unrealized appreciation on outstanding derivative contracts, subject to certain minimum transfer provisions, and any such pledged collateral is identified in the Schedule of Investments. Exchange-traded futures contracts are not covered by the ISDA Master Agreement; however counterparty credit risk related to exchange-traded futures contracts is minimal because of the protection provided by the exchange on which they trade.
Investing in derivatives may involve greater risks than investing in the underlying assets directly and, to varying degrees, may involve risk of loss in excess of any initial investment and collateral received and amounts recognized in the Statement of Assets and Liabilities. In addition, there may be the risk that the change in value of the derivative contract does not correspond to the change in value of the underlying instrument.
Net Realized Gain (Loss) and Change in Net Unrealized Appreciation (Depreciation) on Derivatives. The table below, which reflects the impacts of derivatives on the financial performance of the Fund, summarizes the net realized gain (loss) and
Annual Report
5. Derivative Instruments - continued
Net Realized Gain (Loss) and Change in Net Unrealized Appreciation (Depreciation) on Derivatives - continued
change in net unrealized appreciation (depreciation) for derivatives during the period as shown in the Statement of Operations.
Primary Risk Exposure / Derivative Type | Net Realized
Gain (Loss) | Change in Net Unrealized Appreciation (Depreciation) |
Credit Risk | | |
Swap Agreements | $ (16,533) | $ 15,494 |
Equity Risk | | |
Futures Contracts | 8,596 | 8,583 |
Totals (a) | $ (7,937) | $ 24,077 |
(a) A summary of the value of derivatives by primary risk exposure as of period end is included at the end of the Schedule of Investments and is
representative of activity for the period
Futures Contracts. A futures contract is an agreement between two parties to buy or sell a specified underlying instrument for a fixed price at a specified future date. The Fund used futures contracts to manage its exposure to the stock market.
Upon entering into a futures contract, a fund is required to deposit either cash or securities (initial margin) with a clearing broker in an amount equal to a certain percentage of the face value of the contract. Futures contracts are marked-to-market daily and subsequent payments (variation margin) are made or received by a fund depending on the daily fluctuations in the value of the futures contracts and are recorded as unrealized appreciation or (depreciation). This receivable and/or payable is included in daily variation margin on futures contracts in the Statement of Assets and Liabilities. Realized gain or (loss) is recorded upon the expiration or closing of a futures contract. The net realized gain (loss) and change in net unrealized appreciation (depreciation) on futures contracts during the period is included in the Statement of Operations.
Any open futures contracts at period end are shown in the Schedule of Investments under the caption "Futures Contracts." The underlying face amount at value reflects each contract's exposure to the underlying instrument at period end and is representative of activity for the period. Securities deposited to meet initial margin requirements are identified in the Schedule of Investments.
Swap Agreements. A swap agreement (swap) is a contract between two parties to exchange future cash flows at periodic intervals based on a notional principal amount.
Swaps are marked-to-market daily and changes in value are reflected in the Statement of Assets and Liabilities in the swap agreements at value line items. Any upfront premiums paid or received upon entering a swap to compensate for differences between stated
Annual Report
Notes to Financial Statements - continued
(Amounts in thousands except percentages)
5. Derivative Instruments - continued
Swap Agreements - continued
terms of the agreement and prevailing market conditions (e.g. credit spreads, interest rates or other factors) are recorded as realized gain or (loss) ratably over the term of the swap. Any unamortized upfront premiums are included in net unrealized appreciation (depreciation) in the Statement of Assets and Liabilities. Payments are exchanged at specified intervals, accrued daily commencing with the effective date of the contract and recorded as realized gain or (loss). Realized gain or (loss) is also recorded in the event of an early termination of a swap. The net realized gain (loss) and change in net unrealized appreciation (depreciation) on swaps during the period is included in the Statement of Operations.
Any open swaps at period end are included in the Schedule of Investments under the caption "Swap Agreements."
Credit Default Swaps. Credit default swaps enable the Fund to buy or sell protection against specified credit events on a single-name issuer or a traded credit index. Under the terms of a credit default swap the buyer of protection (buyer) receives credit protection in exchange for making periodic payments to the seller of protection (seller) based on a fixed percentage applied to a notional principal amount. In return for these payments, the seller acts as a guarantor of the creditworthiness of a reference obligation and will be required to make a payment upon the occurrence of one or more specified credit events. The Fund enters into credit default swaps as a seller to gain credit exposure to an issuer and/or as a buyer to obtain a measure of protection against defaults of an issuer. Periodic payments are made over the life of the contract by the buyer provided that no credit event occurs.
For credit default swaps on most corporate and sovereign issuers, credit events include bankruptcy, failure to pay or repudiation/moratorium. For credit default swaps on corporate or sovereign issuers, the obligation that may be put to the seller is not limited to the specific reference obligation described in the Schedule of Investments. For credit default swaps on asset-backed securities, a credit event may be triggered by events such as failure to pay principal, maturity extension, rating downgrade or write-down. For credit default swaps on asset-backed securities, the reference obligation described represents the security that may be put to the seller. For credit default swaps on a traded credit index, a specified credit event may affect all or individual underlying securities included in the index.
As a seller, if an underlying credit event occurs, the Fund will pay a net settlement amount of cash equal to the notional amount of the swap less the recovery value of the reference obligation or underlying securities comprising an index. Only in the event of the industry's inability to value the underlying asset will the Fund be required to take
Annual Report
5. Derivative Instruments - continued
Credit Default Swaps - continued
delivery of the reference obligation or underlying securities comprising an index and pay an amount equal to the notional amount of the swap.
As a buyer, if an underlying credit event occurs, the Fund will receive a net settlement amount of cash equal to the notional amount of the swap less the recovery value of the reference obligation or underlying securities comprising an index. Only in the event of the industry's inability to value the underlying asset will the Fund be required to deliver the reference obligation or underlying securities comprising an index in exchange for payment of an amount equal to the notional amount of the swap.
Typically, the value of each credit default swap and credit rating disclosed for each reference obligation in the Schedule of Investments, where the Fund is the seller, can be used as measures of the current payment/performance risk of the swap. As the value of the swap changes as a positive or negative percentage of the total notional amount, the payment/performance risk may decrease or increase, respectively. In addition to these measures, FMR monitors a variety of factors including cash flow assumptions, market activity and market sentiment as part of its ongoing process of assessing payment/performance risk.
6. Purchases and Sales of Investments.
Purchases and sales of securities (including the Fixed-Income Central Funds), other than short-term securities and U.S. government securities, aggregated $14,332,476 and $13,867,469, respectively.
7. Fees and Other Transactions with Affiliates.
Management Fee. FMR and its affiliates provide the Fund with investment management related services for which the Fund pays a monthly management fee. The management fee is the sum of an individual fund fee rate that is based on an annual rate of .15% of the Fund's average net assets and an annualized group fee rate that averaged .26% during the period. The group fee rate is based upon the average net assets of all the mutual funds advised by FMR. The group fee rate decreases as assets under management increase and increases as assets under management decrease. For the period, the total annual management fee rate was .41% of the Fund's average net assets.
Annual Report
Notes to Financial Statements - continued
(Amounts in thousands except percentages)
7. Fees and Other Transactions with Affiliates - continued
Transfer Agent Fees. Fidelity Investments Institutional Operations Company, Inc. (FIIOC), an affiliate of FMR, is the transfer, dividend disbursing and shareholder servicing agent for each class of the Fund. FIIOC receives account fees and asset-based fees that vary according to the account size and type of account of the shareholders of Balanced. FIIOC receives an asset-based fee of Class K's average net assets. FIIOC pays for typesetting, printing and mailing of shareholder reports, except proxy statements. For the period, transfer agent fees for each class were as follows:
| Amount | % of
Average
Net Assets |
Balanced | $ 25,838 | .17 |
Class K | 2,543 | .05 |
| $ 28,381 | |
Accounting and Security Lending Fees. Fidelity Service Company, Inc. (FSC), an affiliate of FMR, maintains the Fund's accounting records. The accounting fee is based on the level of average net assets for each month. Under a separate contract, FSC administers the security lending program. The security lending fee is based on the number and duration of lending transactions.
Brokerage Commissions. The Fund placed a portion of its portfolio transactions with brokerage firms which are affiliates of the investment adviser. The commissions paid to these affiliated firms were $425 for the period.
8. Committed Line of Credit.
The Fund participates with other funds managed by FMR or an affiliate in a $4.25 billion credit facility (the "line of credit") to be utilized for temporary or emergency purposes to fund shareholder redemptions or for other short-term liquidity purposes. The Fund has agreed to pay commitment fees on its pro-rata portion of the line of credit, which amounted to $57 and is reflected in Miscellaneous expenses on the Statement of Operations. During the period, there were no borrowings on this line of credit.
9. Security Lending.
The Fund lends portfolio securities from time to time in order to earn additional income. For equity securities, a lending agent is used and may loan securities to certain qualified borrowers, including Fidelity Capital Markets (FCM), a broker-dealer affiliated with the Fund. On the settlement date of the loan, the Fund receives collateral (in the form of U.S. Treasury obligations, letters of credit and/or cash) against the loaned securities and maintains collateral in an amount not less than 100% of the market value of the loaned
Annual Report
9. Security Lending - continued
securities during the period of the loan. The market value of the loaned securities is determined at the close of business of the Fund and any additional required collateral is delivered to the Fund on the next business day. If the borrower defaults on its obligation to return the securities loaned because of insolvency or other reasons, a fund could experience delays and costs in recovering the securities loaned or in gaining access to the collateral. Any cash collateral received is maintained at the Fund's custodian and/or invested in cash equivalents and/or the Fidelity Securities Lending Cash Central Fund. The value of loaned securities at period end is disclosed on the Fund's Statement of Assets and Liabilities. The value of securities loaned to FCM at period ended was $370. Security lending income represents the income earned on investing cash collateral, less rebates paid to borrowers and any lending agent fees associated with the loan, plus any premium payments received for lending certain types of securities. Total security lending income during the period, presented in the Statement of Operations as a component of interest income, amounted to $91. Net income from the Fidelity Securities Lending Cash Central Fund during the period, presented in the Statement of Operations as a component of income from Fidelity Central Funds, amounted to $1,552 (including $38 from securities loaned to FCM).
10. Expense Reductions.
Many of the brokers with whom FMR places trades on behalf of the Fund provided services to the Fund in addition to trade execution. These services included payments of certain expenses on behalf of the Fund totaling $836 for the period. In addition, through arrangements with the Fund's custodian credits realized as a result of uninvested cash balances were used to reduce the Fund's expenses. During the period, these credits reduced the Fund's custody expenses by $9.
11. Distributions to Shareholders.
Distributions to shareholders of each class were as follows:
Years ended August 31, | 2012 | 2011 |
From net investment income | | |
Balanced | $ 281,775 | $ 328,396 |
Class K | 98,150 | 82,194 |
Total | $ 379,925 | $ 410,590 |
From net realized gain | | |
Balanced | $ - | $ 7,916 |
Class K | - | 1,491 |
Total | $ - | $ 9,407 |
Annual Report
Notes to Financial Statements - continued
(Amounts in thousands except percentages)
12. Share Transactions.
Transactions for each class of shares were as follows:
| Shares | Dollars |
Years ended August 31, | 2012 | 2011 | 2012 | 2011 |
Balanced | | | | |
Shares sold | 101,057 | 117,364 | $ 1,914,819 | $ 2,150,235 |
Reinvestment of distributions | 14,566 | 17,788 | 271,000 | 325,354 |
Shares redeemed | (221,553) | (307,092) | (4,157,808) | (5,576,894) |
Net increase (decrease) | (105,930) | (171,940) | $ (1,971,989) | $ (3,101,305) |
Class K | | | | |
Shares sold | 117,984 | 127,669 | $ 2,217,745 | $ 2,316,418 |
Reinvestment of distributions | 5,255 | 4,546 | 98,150 | 83,685 |
Shares redeemed | (68,166) | (71,990) | (1,291,730) | (1,317,183) |
Net increase (decrease) | 55,073 | 60,225 | $ 1,024,165 | $ 1,082,920 |
13. Other.
The Fund's organizational documents provide former and current trustees and officers with a limited indemnification against liabilities arising in connection with the performance of their duties to the Fund. In the normal course of business, the Fund may also enter into contracts that provide general indemnifications. The Fund's maximum exposure under these arrangements is unknown as this would be dependent on future claims that may be made against the Fund. The risk of material loss from such claims is considered remote.
Annual Report
To the Trustees of Fidelity Puritan Trust and the Shareholders of Fidelity Balanced Fund:
In our opinion, the accompanying statement of assets and liabilities, including the schedule of investments, and the related statements of operations and of changes in net assets and the financial highlights present fairly, in all material respects, the financial position of Fidelity Balanced Fund (a fund of Fidelity Puritan Trust) at August 31, 2012, the results of its operations for the year then ended, the changes in its net assets for each of the two years in the period then ended and the financial highlights for each of the periods indicated, in conformity with accounting principles generally accepted in the United States of America. These financial statements and financial highlights (hereafter referred to as "financial statements") are the responsibility of the Fidelity Balanced Fund's management. Our responsibility is to express an opinion on these financial statements based on our audits. We conducted our audits of these financial statements in accordance with the standards of the Public Company Accounting Oversight Board (United States). Those standards require that we plan and perform the audit to obtain reasonable assurance about whether the financial statements are free of material misstatement. An audit includes examining, on a test basis, evidence supporting the amounts and disclosures in the financial statements, assessing the accounting principles used and significant estimates made by management, and evaluating the overall financial statement presentation. We believe that our audits, which included confirmation of securities at August 31, 2012 by correspondence with the custodian and brokers, provide a reasonable basis for our opinion.
PricewaterhouseCoopers LLP
Boston, Massachusetts
October 18, 2012
Annual Report
The Trustees, Members of the Advisory Board, and executive officers of the trust and fund, as applicable, are listed below. The Board of Trustees governs the fund and is responsible for protecting the interests of shareholders. The Trustees are experienced executives who meet periodically throughout the year to oversee the fund's activities, review contractual arrangements with companies that provide services to the fund, oversee management of the risks associated with such activities and contractual arrangements, and review the fund's performance. Except for James C. Curvey, each of the Trustees oversees 228 funds advised by FMR or an affiliate. Mr. Curvey oversees 435 funds advised by FMR or an affiliate.
The Trustees hold office without limit in time except that (a) any Trustee may resign; (b) any Trustee may be removed by written instrument, signed by at least two-thirds of the number of Trustees prior to such removal; (c) any Trustee who requests to be retired or who has become incapacitated by illness or injury may be retired by written instrument signed by a majority of the other Trustees; and (d) any Trustee may be removed at any special meeting of shareholders by a two-thirds vote of the outstanding voting securities of the trust. Each Trustee who is not an interested person (as defined in the 1940 Act) (Independent Trustee), shall retire not later than the last day of the calendar year in which his or her 75th birthday occurs. The Independent Trustees may waive this mandatory retirement age policy with respect to individual Trustees. The executive officers and Advisory Board Members hold office without limit in time, except that any officer and Advisory Board Member may resign or may be removed by a vote of a majority of the Trustees at any regular meeting or any special meeting of the Trustees. Except as indicated, each individual has held the office shown or other offices in the same company for the past five years.
Experience, Skills, Attributes, and Qualifications of the Fund's Trustees. The Governance and Nominating Committee has adopted a statement of policy that describes the experience, qualifications, attributes, and skills that are necessary and desirable for potential Independent Trustee candidates (Statement of Policy). The Board believes that each Trustee satisfied at the time he or she was initially elected or appointed a Trustee, and continues to satisfy, the standards contemplated by the Statement of Policy. The Governance and Nominating Committee also engages professional search firms to help identify potential Independent Trustee candidates who have the experience, qualifications, attributes, and skills consistent with the Statement of Policy. From time to time, additional criteria based on the composition and skills of the current Independent Trustees, as well as experience or skills that may be appropriate in light of future changes to board composition, business conditions, and regulatory or other developments, have also been considered by the professional search firms and the Governance and Nominating Committee. In addition, the Board takes into account the Trustees' commitment and participation in Board and committee meetings, as well as their leadership of standing and ad hoc committees throughout their tenure.
In determining that a particular Trustee was and continues to be qualified to serve as a Trustee, the Board has considered a variety of criteria, none of which, in isolation, was controlling. The Board believes that, collectively, the Trustees have balanced and diverse experience, qualifications, attributes, and skills, which allow the Board to operate effectively in governing the fund and protecting the interests of shareholders. Information about the specific experience, skills, attributes, and qualifications of each Trustee, which in each case led to the Board's conclusion that the Trustee should serve (or continue to serve) as a trustee of the fund, is provided below.
Annual Report
Trustees and Officers - continued
Board Structure and Oversight Function. James C. Curvey is an interested person (as defined in the 1940 Act) and currently serves as Chairman. The Trustees have determined that an interested Chairman is appropriate and benefits shareholders because an interested Chairman has a personal and professional stake in the quality and continuity of services provided to the fund. Independent Trustees exercise their informed business judgment to appoint an individual of their choosing to serve as Chairman, regardless of whether the Trustee happens to be independent or a member of management. The Independent Trustees have determined that they can act independently and effectively without having an Independent Trustee serve as Chairman and that a key structural component for assuring that they are in a position to do so is for the Independent Trustees to constitute a substantial majority for the Board. The Independent Trustees also regularly meet in executive session. Ned C. Lautenbach serves as Chairman of the Independent Trustees and as such (i) acts as a liaison between the Independent Trustees and management with respect to matters important to the Independent Trustees and (ii) with management prepares agendas for Board meetings.
Fidelity funds are overseen by different Boards of Trustees. The fund's Board oversees Fidelity's equity and high income funds and another Board oversees Fidelity's investment-grade bond, money market, and asset allocation funds. The asset allocation funds may invest in Fidelity funds overseen by the fund's Board. The use of separate Boards, each with its own committee structure, allows the Trustees of each group of Fidelity funds to focus on the unique issues of the funds they oversee, including common research, investment, and operational issues. On occasion, the separate Boards establish joint committees to address issues of overlapping consequences for the Fidelity funds overseen by each Board.
The Trustees operate using a system of committees to facilitate the timely and efficient consideration of all matters of importance to the Trustees, the fund, and fund shareholders and to facilitate compliance with legal and regulatory requirements and oversight of the fund's activities and associated risks. The Board, acting through its committees, has charged FMR and its affiliates with (i) identifying events or circumstances the occurrence of which could have demonstrably adverse effects on the fund's business and/or reputation; (ii) implementing processes and controls to lessen the possibility that such events or circumstances occur or to mitigate the effects of such events or circumstances if they do occur; and (iii) creating and maintaining a system designed to evaluate continuously business and market conditions in order to facilitate the identification and implementation processes described in (i) and (ii) above. Because the day-to-day operations and activities of the fund are carried out by or through FMR, its affiliates and other service providers, the fund'sexposure to risks is mitigated but not eliminated by the processes overseen by the Trustees. While each of the Board's committees has responsibility for overseeing different aspects of the fund's activities, oversight is exercised primarily through the Operations, Audit, and Compliance Committees. In addition, the Independent Trustees have worked with FMR to enhance the Board's oversight of investment and financial risks, legal and regulatory risks, technology risks, and operational risks, including the development of additional risk reporting to the Board. For example, a working group comprised of Independent Trustees and FMR has worked and continues to work to review the Fidelity funds' valuation-related activities, reporting and risk management. Appropriate personnel, including but not limited to the fund's Chief Compliance Officer (CCO), FMR's internal auditor, the independent accountants, the fund's Treasurer and portfolio management personnel, make periodic reports to the Board's committees, as appropriate, including an annual review of FMR's risk management program for the Fidelity funds. The responsibilities of each standing committee, including their oversight responsibilities, are described further under "Standing Committees of the Fund's Trustees."
Annual Report
The fund's Statement of Additional Information (SAI) includes more information about the Trustees. To request a free copy, call Fidelity at 1-800-544-8544.
Interested Trustees*:
Correspondence intended for each Trustee who is an interested person may be sent to Fidelity Investments, 82 Devonshire Street, Boston, Massachusetts 02109.
Name, Age; Principal Occupations and Other Relevant Experience+ |
James C. Curvey (77) |
| Year of Election or Appointment: 2007 Mr. Curvey is Trustee and Chairman of the Board of Trustees of certain Trusts. Mr. Curvey also serves as Trustee (2007-present) of other investment companies advised by FMR. Mr. Curvey is a Director of Fidelity Investments Money Management, Inc. (2009-present), Director of Fidelity Research & Analysis Co. (2009-present) and Director of FMR and FMR Co., Inc. (2007-present). Mr. Curvey is also Vice Chairman (2007-present) and Director of FMR LLC. In addition, Mr. Curvey serves as an Overseer for the Boston Symphony Orchestra and a member of the Trustees of Villanova University. Previously, Mr. Curvey was the Vice Chairman (2006-2007) and Director (2000-2007) of FMR Corp. |
Ronald P. O'Hanley (55) |
| Year of Election or Appointment: 2011 Mr. O'Hanley is Director of FMR Co., Inc. (2010-present), Director of Fidelity Investments Money Management, Inc. (2010-present), Director of Fidelity Research & Analysis Company (2010-present), President of Fidelity Asset Management and Corporate Services and a member of Fidelity's Executive Committee (2010-present). Previously, Mr. O'Hanley served as President and Chief Executive Officer of BNY Mellon Asset Management (2007-2010). Mr. O'Hanley also served as Vice Chairman of Bank New York Mellon Corp. and a member of that firm's Executive Committee. Prior to the 2007 merger of The Bank of New York and Mellon Financial Corporation, he was Vice Chairman of Mellon Financial Corporation and President and Chief Executive Officer of Mellon Asset Management. He joined Mellon in February 1997. Mr. O'Hanley currently serves as Chairman of the Boston Public Library Foundation Board of Directors and sits on the Board of Directors of Beth Israel Deaconess Medical Center, the Board of Trustees of the Marine Biological Laboratory and the Advisory Board of the Maxwell School of Citizenship and Public Administration at Syracuse University. Mr. O'Hanley also chairs the Council on Asset Management for the Financial Services Roundtable and is a member of the Board of Directors of Institutional Investor's U.S. Institute. |
* Trustees have been determined to be "Interested Trustees" by virtue of, among other things, their affiliation with the trust or various entities under common control with FMR.
+ The information above includes each Trustee's principal occupation during the last five years and other information relating to the experience, attributes, and skills relevant to each Trustee's qualifications to serve as a Trustee, which led to the conclusion that each Trustee should serve as a Trustee for the fund.
Annual Report
Independent Trustees:
Correspondence intended for each Independent Trustee (that is, the Trustees other than the Interested Trustees) may be sent to Fidelity Investments, P.O. Box 55235, Boston, Massachusetts 02205-5235.
Name, Age; Principal Occupations and Other Relevant Experience+ |
Dennis J. Dirks (64) |
| Year of Election or Appointment: 2005 Prior to his retirement in May 2003, Mr. Dirks was Chief Operating Officer and a member of the Board of The Depository Trust & Clearing Corporation (DTCC). He also served as President, Chief Operating Officer, and Board member of The Depository Trust Company (DTC) and President and Board member of the National Securities Clearing Corporation (NSCC). In addition, Mr. Dirks served as Chief Executive Officer and Board member of the Government Securities Clearing Corporation, Chief Executive Officer and Board member of the Mortgage-Backed Securities Clearing Corporation, as a Trustee and a member of the Finance Committee of Manhattan College (2005-2008), and as a Trustee and a member of the Finance Committee of AHRC of Nassau County (2006-2008). Mr. Dirks is a member of the Independent Directors Council (IDC) Governing Council (2010-present) and Board of Directors for The Brookville Center for Children's Services, Inc. (2009-present). |
Alan J. Lacy (58) |
| Year of Election or Appointment: 2008 Mr. Lacy serves as Senior Adviser (2007-present) of Oak Hill Capital Partners, L.P. (private equity). Mr. Lacy also served as Chief Executive Officer (2000-2005) and Vice Chairman (2005-2006) of Sears Holdings Corporation and Sears, Roebuck and Co. (retail). In addition, Mr. Lacy serves as a member of the Board of Directors of Dave & Buster's Entertainment, Inc. (restaurant and entertainment complexes, 2010-present), Earth Fare, Inc. (retail grocery, 2012-present), The Hillman Companies, Inc. (hardware wholesalers, 2010-present), and Bristol-Myers Squibb Company (global pharmaceuticals, 2008-present). Mr. Lacy is a member of the Board of Trustees of The National Parks Conservation Association (2006-present). Previously, Mr. Lacy served as Chairman of the Board of Trustees of the National Parks Conservation Association (2008-2011) and as a member of the Board of Directors for the Western Union Company (global money transfer, 2006-2011). |
Ned C. Lautenbach (68) |
| Year of Election or Appointment: 2000 Mr. Lautenbach is Chairman of the Independent Trustees of the Equity and High Income Funds (2006-present). Mr. Lautenbach currently serves as the Lead Director of the Eaton Corporation Board of Directors (diversified industrial, 1997-present). Mr. Lautenbach is Chairman of the Board of Directors of the Philharmonic Center for the Arts in Naples, Florida (2012-present) and a member of the Council on Foreign Relations (1994-present). Previously, Mr. Lautenbach was a Partner/Advisory Partner at Clayton, Dubilier & Rice, LLC (private equity investment, 1998-2010), as well as a Director of Sony Corporation (2006-2007). |
Joseph Mauriello (67) |
| Year of Election or Appointment: 2008 Prior to his retirement in January 2006, Mr. Mauriello served in numerous senior management positions including Deputy Chairman and Chief Operating Officer (2004-2005), and Vice Chairman of Financial Services (2002-2004) of KPMG LLP US (professional services, 1965-2005). Mr. Mauriello currently serves as a member of the Board of Directors of XL Group plc. (global insurance and re-insurance, 2006-present). Previously, Mr. Mauriello served as a Director of the Hamilton Funds of the Bank of New York (2006-2007) and of Arcadia Resources Inc. (health care services and products, 2007-2012). |
Robert W. Selander (61) |
| Year of Election or Appointment: 2011 Previously, Mr. Selander served as a Member of the Advisory Board of Fidelity's Equity and High Income Funds (2011), Executive Vice Chairman (2010), Chief Executive Officer (2009-2010), and President and Chief Executive Officer (1997-2009) of Mastercard, Inc. |
Cornelia M. Small (68) |
| Year of Election or Appointment: 2005 Ms. Small is a member of the Board of Directors (2009-present) and Chair of the Investment Committee (2010-present) of the Teagle Foundation. Ms. Small also serves on the Investment Committee of the Berkshire Taconic Community Foundation (2008-present). Previously, Ms. Small served as Chairperson (2002-2008) and a member of the Investment Committee and Chairperson (2008-2012) and a member of the Board of Trustees of Smith College. In addition, Ms. Small served as Chief Investment Officer, Director of Global Equity Investments, and a member of the Board of Directors of Scudder, Stevens & Clark and Scudder Kemper Investments. |
William S. Stavropoulos (73) |
| Year of Election or Appointment: 2001 Mr. Stavropoulos is Vice Chairman of the Independent Trustees of the Equity and High Income Funds (2006-present). Mr. Stavropoulos serves as President and Founder of the Michigan Baseball Foundation, the Great Lakes Loons (2007-present). Mr. Stavropoulos is Chairman Emeritus of the Board of Directors of The Dow Chemical Company, where he previously served in numerous senior management positions, including President, CEO (1995-2000; 2002-2004), Chairman of the Executive Committee (2000-2006), and as a member of the Board of Directors (1990-2006). Currently, Mr. Stavropoulos is a Director of Univar Inc. (global distributor of commodity and specialty chemicals, Chairman from 2010-May 2012 and Lead Director from May 2012-present), Teradata Corporation (data warehousing and technology solutions, 2008-present), Maersk Inc. (industrial conglomerate), and Tyco International, Ltd. (multinational manufacturing and services, 2007-present), and a member of the Advisory Board for Metalmark Capital LLC (private equity investment, 2005-present). Mr. Stavropoulos is an operating advisor to Clayton, Dubilier & Rice, LLC (private equity investment). In addition, Mr. Stavropoulos is a member of the University of Notre Dame Advisory Council for the College of Science, a Trustee of the Rollin L. Gerstacker Foundation, and a Director of the Naples Philharmonic Center for the Arts. Previously, Mr. Stavropoulos served as a Director of Chemical Financial Corporation (bank holding company, 1993-2012). |
David M. Thomas (63) |
| Year of Election or Appointment: 2008 Previously, Mr. Thomas served as Executive Chairman (2005-2006) and Chairman and Chief Executive Officer (2000-2005) of IMS Health, Inc. (pharmaceutical and healthcare information solutions), and a Director of Fortune Brands, Inc. (consumer products, 2000-2011). In addition, Mr. Thomas serves as Non-Executive Chairman of the Board of Directors of Fortune Brands Home and Security (home and security products, 2011-present), and as a member of the Board of Directors of Interpublic Group of Companies, Inc. (marketing communication, 2004-present). |
Michael E. Wiley (61) |
| Year of Election or Appointment: 2008 Mr. Wiley also serves as a Director of Asia Pacific Exploration Consolidated (international oil and gas exploration and production, 2008-present). Mr. Wiley serves as a Director of Tesoro Corporation (independent oil refiner and marketer, 2005-present), and a Director of Bill Barrett Corporation (exploration and production, 2005-present). In addition, Mr. Wiley also serves as a Director of Post Oak Bank (privately-held bank, 2004-present). Previously, Mr. Wiley served as a member of the Board of Trustees of the University of Tulsa (2000-2006; 2007-2010), as a Senior Energy Advisor of Katzenbach Partners, LLC (consulting, 2006-2007), as an Advisory Director of Riverstone Holdings (private investment), Chairman, President, and CEO of Baker Hughes, Inc. (oilfield services, 2000-2004), and as Director of Spinnaker Exploration Company (exploration and production, 2001-2005). |
+ The information above includes each Trustee's principal occupation during the last five years and other information relating to the experience, attributes, and skills relevant to each Trustee's qualifications to serve as a Trustee, which led to the conclusion that each Trustee should serve as a Trustee for the fund.
Advisory Board Members and Executive Officers:
Correspondence intended for David A. Rosow and Garnett A. Smith may be sent to Fidelity Investments, P.O. Box 55235, Boston, Massachusetts 02205-5235. Correspondence intended for each executive officer, Edward C. Johnson 3d, and Peter S. Lynch may be sent to Fidelity Investments, 82 Devonshire Street, Boston, Massachusetts 02109.
Name, Age; Principal Occupation |
Edward C. Johnson 3d (82) |
| Year of Election or Appointment: 2011 Member of the Advisory Board of Fidelity's Equity and High Income Funds. Mr. Johnson serves as Chief Executive Officer, Chairman, and a Director of FMR LLC, and also serves as Chairman and Director of FIL Limited. Previously, Mr. Johnson served as a Trustee and Chairman of the Board of certain Fidelity Trusts, Chairman and a Director of FMR, Chairman and a Director of FMR Co., Inc., and President of FMR LLC (2006-2007). |
Peter S. Lynch (68) |
| Year of Election or Appointment: 2003 Member of the Advisory Board of Fidelity's Equity and High Income Funds. Mr. Lynch is Vice Chairman and a Director of FMR and FMR Co., Inc. In addition, Mr. Lynch serves as a Trustee of Boston College and as the Chairman of the Inner-City Scholarship Fund. Previously, Mr. Lynch served on the Special Olympics International Board of Directors (1997-2006). |
David A. Rosow (69) |
| Year of Election or Appointment: 2012 Member of the Advisory Board of Fidelity's Equity and High Income Funds. Chairman and Chief Executive Officer of International Golf Group, Inc. (golf course development, 1989-present). Previously, Mr. Rosow served as Chairman and Chief Executive Officer of Rosow & Company, Inc. (private investment company, 1989-2011), a Lead Director of Hudson United Bancorp (2001-2006) and as a Director of TD Banknorth (1996-2006). In addition, Mr. Rosow is a member (2008-present) and President (2009-present) of the Town Council of Palm Beach, Florida. |
Garnett A. Smith (64) |
| Year of Election or Appointment: 2012 Member of the Advisory Board of Fidelity's Equity and High Income Funds. Prior to Mr. Smith's retirement, he served as Chairman and Chief Executive Officer of Inbrand Corp. (manufacturer of personal absorbent products, 1990-1997). He also served as President (1986-1990) of Inbrand Corp. Prior to his employment with Inbrand Corp., he was employed by a retail fabric chain and North Carolina National Bank. In addition, Mr. Smith is a board member of the Jackson Hole Land Trust (2009-present). |
Kenneth B. Robins (43) |
| Year of Election or Appointment: 2008 President and Treasurer of Fidelity's Equity and High Income Funds. Mr. Robins also serves as President and Treasurer (2010-present) and Assistant Treasurer (2009-present) of other Fidelity funds and is an employee of Fidelity Investments (2004-present). Previously, Mr. Robins served as Deputy Treasurer of the Fidelity funds (2005-2008) and Treasurer and Chief Financial Officer of The North Carolina Capital Management Trust: Cash and Term Portfolios (2006-2008). |
Bruce T. Herring (47) |
| Year of Election or Appointment: 2006 Vice President of certain Equity Funds. Mr. Herring also serves as President of Fidelity Research & Analysis Company (2010-present), Chief Investment Officer and Director of Fidelity Management & Research (U.K.) Inc. (2010-present) and Group Chief Investment Officer of FMR. Previously, Mr. Herring served as Vice President (2005-2006) and Senior Vice President (2006-2007) of Fidelity Management & Research Company, Vice President of FMR Co., Inc. (2001-2007) and as a portfolio manager for Fidelity U.S. Equity Funds. |
Brian B. Hogan (47) |
| Year of Election or Appointment: 2009 Vice President of Equity and High Income Funds. Mr. Hogan also serves as President of FMR's Equity Division (2009-present). Previously, Mr. Hogan served as Senior Vice President, Equity Research of FMR (2006-2009) and as a portfolio manager. |
Scott C. Goebel (44) |
| Year of Election or Appointment: 2008 Secretary and Chief Legal Officer (CLO) of the Fidelity funds. Mr. Goebel also serves as Secretary of Fidelity Investments Money Management, Inc. (FIMM) (2010-present) and Fidelity Research and Analysis Company (FRAC) (2010-present); Secretary and CLO of The North Carolina Capital Management Trust: Cash and Term Portfolios (2008-present); General Counsel, Secretary, and Senior Vice President of FMR (2008-present) and FMR Co., Inc. (2008-present); employed by FMR LLC or an affiliate (2001-present); Chief Legal Officer of Fidelity Management & Research (Hong Kong) Limited (2008-present) and Assistant Secretary of Fidelity Management & Research (Japan) Inc. (2008-present), and Fidelity Management & Research (U.K.) Inc. (2008-present). Previously, Mr. Goebel served as Assistant Secretary of FIMM (2008-2010), FRAC (2008-2010), and the Funds (2007-2008) and as Vice President and Secretary of Fidelity Distributors Corporation (FDC) (2005-2007). |
William C. Coffey (43) |
| Year of Election or Appointment: 2009 Assistant Secretary of Fidelity's Equity and High Income Funds. Mr. Coffey also serves as Senior Vice President and Deputy General Counsel of FMR LLC (2010-present), and is an employee of Fidelity Investments. Previously, Mr. Coffey served as Vice President and Associate General Counsel of FMR LLC (2005-2009). |
Elizabeth Paige Baumann (44) |
| Year of Election or Appointment: 2012 Anti-Money Laundering (AML) Officer of the Fidelity funds. Ms. Baumann also serves as AML Officer of The North Carolina Capital Management Trust: Cash and Term Portfolios (2012-present), Chief AML Officer of FMR LLC (2012-present), and is an employee of Fidelity Investments. Previously, Ms. Baumann served as Vice President and Deputy Anti-Money Laundering Officer (2007-2012). |
Christine Reynolds (53) |
| Year of Election or Appointment: 2008 Chief Financial Officer of the Fidelity funds. Ms. Reynolds became President of Fidelity Pricing and Cash Management Services (FPCMS) in August 2008. Ms. Reynolds served as Chief Operating Officer of FPCMS (2007-2008). Previously, Ms. Reynolds served as President, Treasurer, and Anti-Money Laundering officer of the Fidelity funds (2004-2007). |
Joseph A. Hanlon (44) |
| Year of Election or Appointment: 2012 Chief Compliance Officer of Fidelity's Equity and High Income Funds. Mr. Hanlon serves as Compliance Officer of FMR, FMR Co., Inc., Fidelity Investments Money Management, Inc. (FIMM), Fidelity Research and Analysis Company (FRAC), Fidelity Management & Research (Japan) Inc., Fidelity Management & Research (U.K.) Inc., Fidelity Management & Research (Hong Kong), and Strategic Advisers, Inc. (2009-present), as Senior Vice President of the Fidelity Asset Management Division (2009-present), and is an employee of Fidelity Investments. |
Joseph F. Zambello (55) |
| Year of Election or Appointment: 2011 Deputy Treasurer of the Fidelity funds. Mr. Zambello is an employee of Fidelity Investments. Previously, Mr. Zambello served as Vice President of FMR's Program Management Group (2009-2011) and Vice President of the Transfer Agent Oversight Group (2005-2009). |
Adrien E. Deberghes (45) |
| Year of Election or Appointment: 2008 Deputy Treasurer of Fidelity's Equity and High Income Funds. Mr. Deberghes also serves as Vice President (2011-present) and Assistant Treasurer (2010-present) of other Fidelity funds, and is an employee of Fidelity Investments (2008-present). Previously, Mr. Deberghes served as Senior Vice President of Mutual Fund Administration at State Street Corporation (2007-2008), Senior Director of Mutual Fund Administration at Investors Bank & Trust (2005-2007), and Director of Finance for Dunkin' Brands (2000-2005). |
Stephanie J. Dorsey (43) |
| Year of Election or Appointment: 2010 Assistant Treasurer of Fidelity's Equity and High Income Funds. Ms. Dorsey also serves as Deputy Treasurer of other Fidelity funds (2008-present) and is an employee of Fidelity Investments (2008-present). Previously, Ms. Dorsey served as Treasurer (2004-2008) of the JPMorgan Mutual Funds and Vice President (2004-2008) of JPMorgan Chase Bank. |
John R. Hebble (54) |
| Year of Election or Appointment: 2009 Assistant Treasurer of Fidelity's Equity and High Income Funds. Mr. Hebble also serves as President (2011-present), Treasurer, and Chief Financial Officer of The North Carolina Capital Management Trust: Cash and Term Portfolios (2008-present), President and Treasurer of other Fidelity funds (2008-present) and is an employee of Fidelity Investments. |
Gary W. Ryan (54) |
| Year of Election or Appointment: 2005 Assistant Treasurer of the Fidelity funds. Mr. Ryan is an employee of Fidelity Investments. Previously, Mr. Ryan served as Vice President of Fund Reporting in Fidelity Pricing and Cash Management Services (FPCMS) (1999-2005). |
Jonathan Davis (44) |
| Year of Election or Appointment: 2010 Assistant Treasurer of the Fidelity funds. Mr. Davis is also Assistant Treasurer of Fidelity Rutland Square Trust II and Fidelity Commonwealth Trust II. Mr. Davis is an employee of Fidelity Investments. Previously, Mr. Davis served as Vice President and Associate General Counsel of FMR LLC (2003-2010). |
Annual Report
A total of 4.92% of the dividends distributed during the fiscal year was derived from interest on U.S. Government securities which is generally exempt from state income tax.
The fund designates $158,947,790 of distributions paid during the period January 1, 2012 to August 31, 2012 as qualifying to be taxed as interest-related dividends for nonresident alien shareholders.
Balanced designates 14%, 43%, 69% and 69% of the dividends distributed in October, December, April and July, respectively during the fiscal year as qualifying for the dividends-received deduction for corporate shareholders.
Balanced designates 17%, 51%, 86% and 87% of the dividends distributed in October, December, April and July, respectively during the fiscal year as amounts which may be taken into account as a dividend for the purposes of the maximum rate under section 1(h)(11) of the Internal Revenue Code.
The fund will notify shareholders in January 2013 of amounts for use in preparing 2012 income tax returns.
Annual Report
Board Approval of Investment Advisory Contracts and Management Fees
Fidelity Balanced Fund
Each year, the Board of Trustees, including the Independent Trustees (together, the Board), votes on the renewal of the management contract and sub-advisory agreements (together, the Advisory Contracts) for the fund. The Board, assisted by the advice of fund counsel and Independent Trustees' counsel, requests and considers a broad range of information relevant to the renewal of the Advisory Contracts throughout the year.
The Board meets regularly and, at each of its meetings, considers factors that are relevant to its annual consideration of the renewal of the fund's Advisory Contracts, including the services and support provided to the fund and its shareholders. The Board has established various standing committees, each composed of and chaired by Independent Trustees with varying backgrounds, to which the Board has assigned specific subject matter responsibilities in order to enhance effective decision-making by the Board. The Board, acting directly and through its Committees, requests and receives information concerning the annual consideration of the renewal of the fund's Advisory Contracts. The Board also meets as needed to consider matters specifically related to the Board's annual consideration of the renewal of Advisory Contracts. Members of the Board may also meet with trustees of other Fidelity funds through ad hoc joint committees to discuss certain matters relevant to the Fidelity funds.
At its July 2012 meeting, the Board of Trustees, including the Independent Trustees, unanimously determined to renew the fund's Advisory Contracts. In reaching its determination, the Board considered all factors it believed relevant, including (i) the nature, extent, and quality of the services to be provided to the fund and its shareholders (including the investment performance of the fund); (ii) the competitiveness of the fund's management fee and total expense ratio relative to peer funds; (iii) the total costs of the services to be provided by and the profits to be realized by Fidelity from its relationship with the fund; (iv) the extent to which economies of scale exist and would be realized as the fund grows; and (v) whether fee levels reflect these economies of scale, if any, for the benefit of fund shareholders.
In considering whether to renew the Advisory Contracts for the fund, the Board reached a determination, with the assistance of fund counsel and Independent Trustees' counsel and through the exercise of its business judgment, that the renewal of the Advisory Contracts is in the best interests of the fund and its shareholders and that the compensation payable under the Advisory Contracts is fair and reasonable. The Board's decision to renew the Advisory Contracts was not based on any single factor, but rather was based on a comprehensive consideration of all the information provided to the Board at its meetings throughout the year. The Board, in reaching its determination to renew the Advisory Contracts, is aware that shareholders in the fund have a broad range of investment choices available to them, including a wide choice among mutual funds offered by Fidelity's competitors, and that the fund's shareholders, who have the opportunity to review and weigh the disclosure provided by the fund in its prospectus and other public disclosures, have chosen to invest in this fund, managed by Fidelity.
Annual Report
Nature, Extent, and Quality of Services Provided. The Board considered the staffing within the investment adviser, FMR, and the sub-advisers (together, the Investment Advisers), including the backgrounds of the fund's investment personnel, and also considered the fund's investment objective, strategies, and related investment philosophy. The Independent Trustees also had discussions with senior management of Fidelity's investment operations and investment groups. The Board considered the structure of the portfolio manager compensation program and whether this structure provides appropriate incentives to act in the best interests of the fund.
Resources Dedicated to Investment Management and Support Services. The Board and the Fund Oversight and Research Committees reviewed the general qualifications and capabilities of the Investment Advisers' investment staff, including its size, education, experience, and resources, as well as the Investment Advisers' approach to recruiting, training, managing, and compensating investment personnel. The Board also noted that FMR has continued to increase the resources devoted to non-U.S. offices, including expansion of Fidelity's global investment organization. The Board noted that Fidelity's analysts have extensive resources, tools and capabilities that allow them to conduct sophisticated quantitative and fundamental analysis, as well as credit analysis of issuers, counterparties and guarantors. The Board also believes that Fidelity's investment professionals have sufficient access to global information and data so as to provide competitive investment results over time, and that those professionals also have access to sophisticated tools that permit them to assess portfolio construction and risk and performance attribution characteristics continuously, as well as to transmit new information and research conclusions rapidly around the world. Additionally, in its deliberations, the Board considered the Investment Advisers' trading and risk management capabilities and resources, which are an integral part of the investment management process.
Shareholder and Administrative Services. The Board considered (i) the nature, extent, quality, and cost of advisory, administrative, and shareholder services performed by the Investment Advisers and their affiliates under the Advisory Contracts and under separate agreements covering transfer agency, pricing and bookkeeping, and securities lending services for the fund; (ii) the nature and extent of the supervision of third party service providers, principally custodians and subcustodians; and (iii) the resources devoted to, and the record of compliance with, the fund's compliance policies and procedures. The Board also reviewed the allocation of fund brokerage, including allocations to brokers affiliated with the Investment Advisers, the use of brokerage commissions to pay fund expenses, and the use of "soft" commission dollars to pay for research services.
Annual Report
Board Approval of Investment Advisory Contracts and
Management Fees - continued
The Board noted that the growth of fund assets over time across the complex allows Fidelity to reinvest in the development of services designed to enhance the value or convenience of the Fidelity funds as investment vehicles. These services include 24-hour access to account information and market information through telephone representatives and over the Internet, investor education materials and asset allocation tools, and the expanded availability of Fidelity Investor Centers.
Investment in a Large Fund Family. The Board considered the benefits to shareholders of investing in a Fidelity fund, including the benefits of investing in a fund that is part of a large family of funds offering a variety of investment disciplines and providing a large variety of mutual fund investor services. The Board noted that Fidelity had taken, or had made recommendations that resulted in the Fidelity funds taking, a number of actions over the previous year that benefited particular funds, including (i) continuing to dedicate additional resources to investment research and support of the senior management team that oversees asset management; (ii) persisting in efforts to enhance Fidelity's research capabilities, in particular, international research; (iii) launching new funds and making other enhancements to meet client needs for global and income-oriented solutions; (iv) continuing to launch dedicated lower cost underlying funds to meet investment management's portfolio construction needs related to expanding underlying fund options, specifically for the Freedom Fund product lines; (v) adopting a "Stock Selector" sector neutral investment approach and employing a team of portfolio managers who are sector specialists to manage certain funds; (vi) rationalizing product lines and gaining increased efficiencies through the mergers of several funds into other funds; (vii) strengthening the Spartan Index Fund product line by adding new funds and/or new low-cost institutional share classes, restructuring fund expenses to accommodate new classes, and reducing investment minimums for certain classes of shares; (viii) modifying the eligibility criteria for Institutional Class shares to increase their appeal to government entities and charitable investors; and (ix) reducing certain transfer agent fee rates.
Investment Performance. The Board considered whether the fund has operated in accordance with its investment objective, as well as its record of compliance with its investment restrictions. It also reviewed the fund's absolute investment performance for each class, as well as the fund's relative investment performance for each class measured over multiple periods against (i) a proprietary custom index, and (ii) a peer group of mutual funds deemed appropriate by Fidelity and reviewed by the Board. The following charts considered by the Board show, over the one-, three-, and five-year periods ended December 31, 2011, as available, the cumulative total returns of Class K and the retail class of the fund, the cumulative total returns of a proprietary custom index ("benchmark"), and a range of cumulative total returns of a peer group of mutual funds identified by Lipper Inc. as having an investment objective similar to that of the fund. The box within each chart shows the 25th percentile return (top of box) and the 75th percentile return (bottom of box) of the peer group. Returns shown above the box are in the first quartile and returns shown below the box are in the fourth quartile. The percentage beaten numbers noted below each chart correspond to the percentile box and represent the percentage of funds in the peer group whose performance was equal to or lower than that of the class indicated. The fund's proprietary custom index is an index developed by FMR that represents the performance of the fund's general investment categories in both equity and bond securities.
Annual Report
Fidelity Balanced Fund
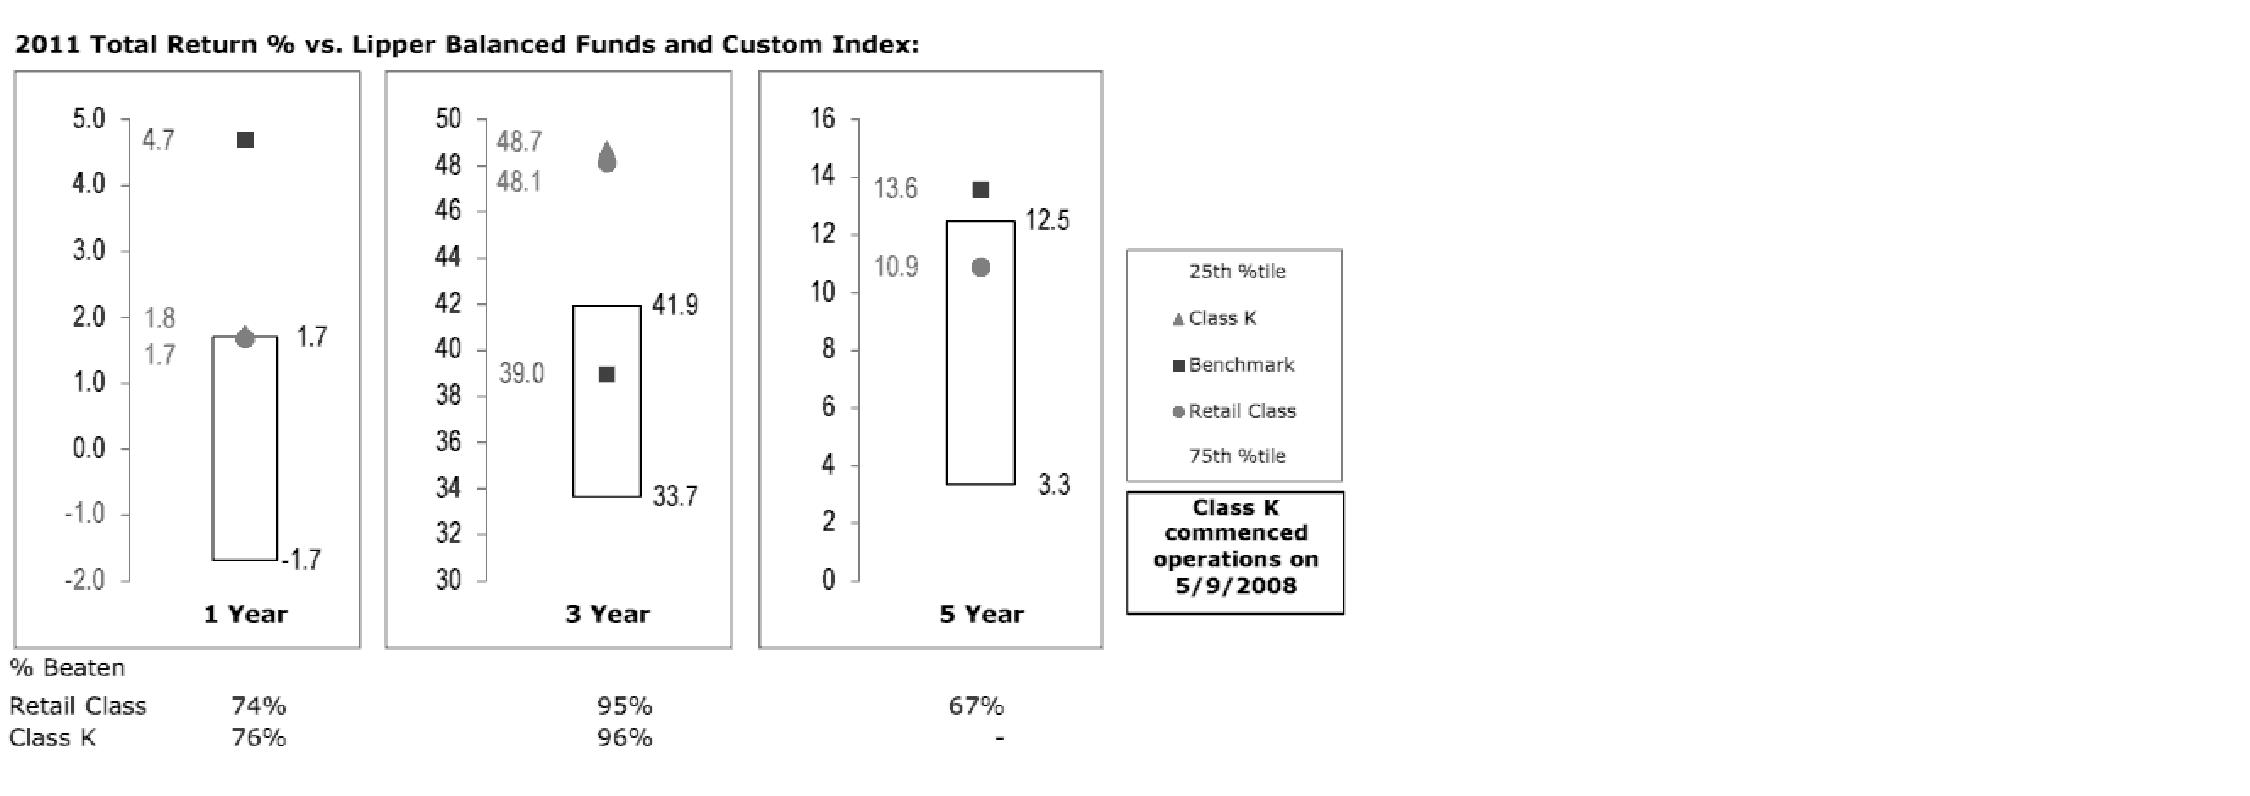
The Board reviewed the fund's relative investment performance against its peer group and noted that the performance of the retail class of the fund (the class with the longer performance record) was in the second quartile for the one- and five-year periods and the first quartile for the three-year period. The Board also noted that the investment performance of the fund was lower than its benchmark for the one- and five-year periods, although the three-year cumulative total return of the retail class compared favorably to its benchmark. The Board considered that the variations in performance between the fund's classes reflect the variations in class expenses, which result in lower performance for the higher expense class. The Board noted that there were portfolio management changes for the fund in March 2012 and November 2011. The Board also reviewed the fund's performance since inception as well as performance in the current year.
Based on its review, the Board concluded that the nature, extent, and quality of services provided to the fund under the Advisory Contracts should benefit the fund's shareholders.
Annual Report
Board Approval of Investment Advisory Contracts and
Management Fees - continued
Competitiveness of Management Fee and Total Expense Ratio. The Board considered the fund's management fee and total expense ratio compared to "mapped groups" of competitive funds and classes. Fidelity creates "mapped groups" by combining similar Lipper investment objective categories that have comparable management fee characteristics. Combining Lipper investment objective categories aids the Board's management fee and total expense ratio comparisons by broadening the competitive group used for comparison and by reducing the number of universes to which various Fidelity funds are compared.
Management Fee. The Board considered two proprietary management fee comparisons for the 12-month periods shown in the chart below. The group of Lipper funds used by the Board for management fee comparisons is referred to below as the "Total Mapped Group." The Total Mapped Group is broader than the Lipper peer group used by the Board for performance comparisons because the Total Mapped Group combines several Lipper investment objective categories while the Lipper peer group does not. The Total Mapped Group comparison focuses on a fund's standing relative to the total universe of comparable funds available to investors in terms of gross management fees before expense reimbursements or caps. "TMG %" represents the percentage of funds in the Total Mapped Group that had management fees that were lower than the fund's. For example, a TMG % of 11% means that 89% of the funds in the Total Mapped Group had higher management fees than the fund. The "Asset-Size Peer Group" (ASPG) comparison focuses on a fund's standing relative to non-Fidelity funds similar in size to the fund within the Total Mapped Group. The ASPG represents at least 15% of the funds in the Total Mapped Group with comparable asset size and management fee characteristics, subject to a minimum of 50 funds (or all funds in the Total Mapped Group if fewer than 50). Additional information, such as the ASPG quartile in which the fund's management fee ranked, is also included in the chart and considered by the Board.
Annual Report
Fidelity Balanced Fund
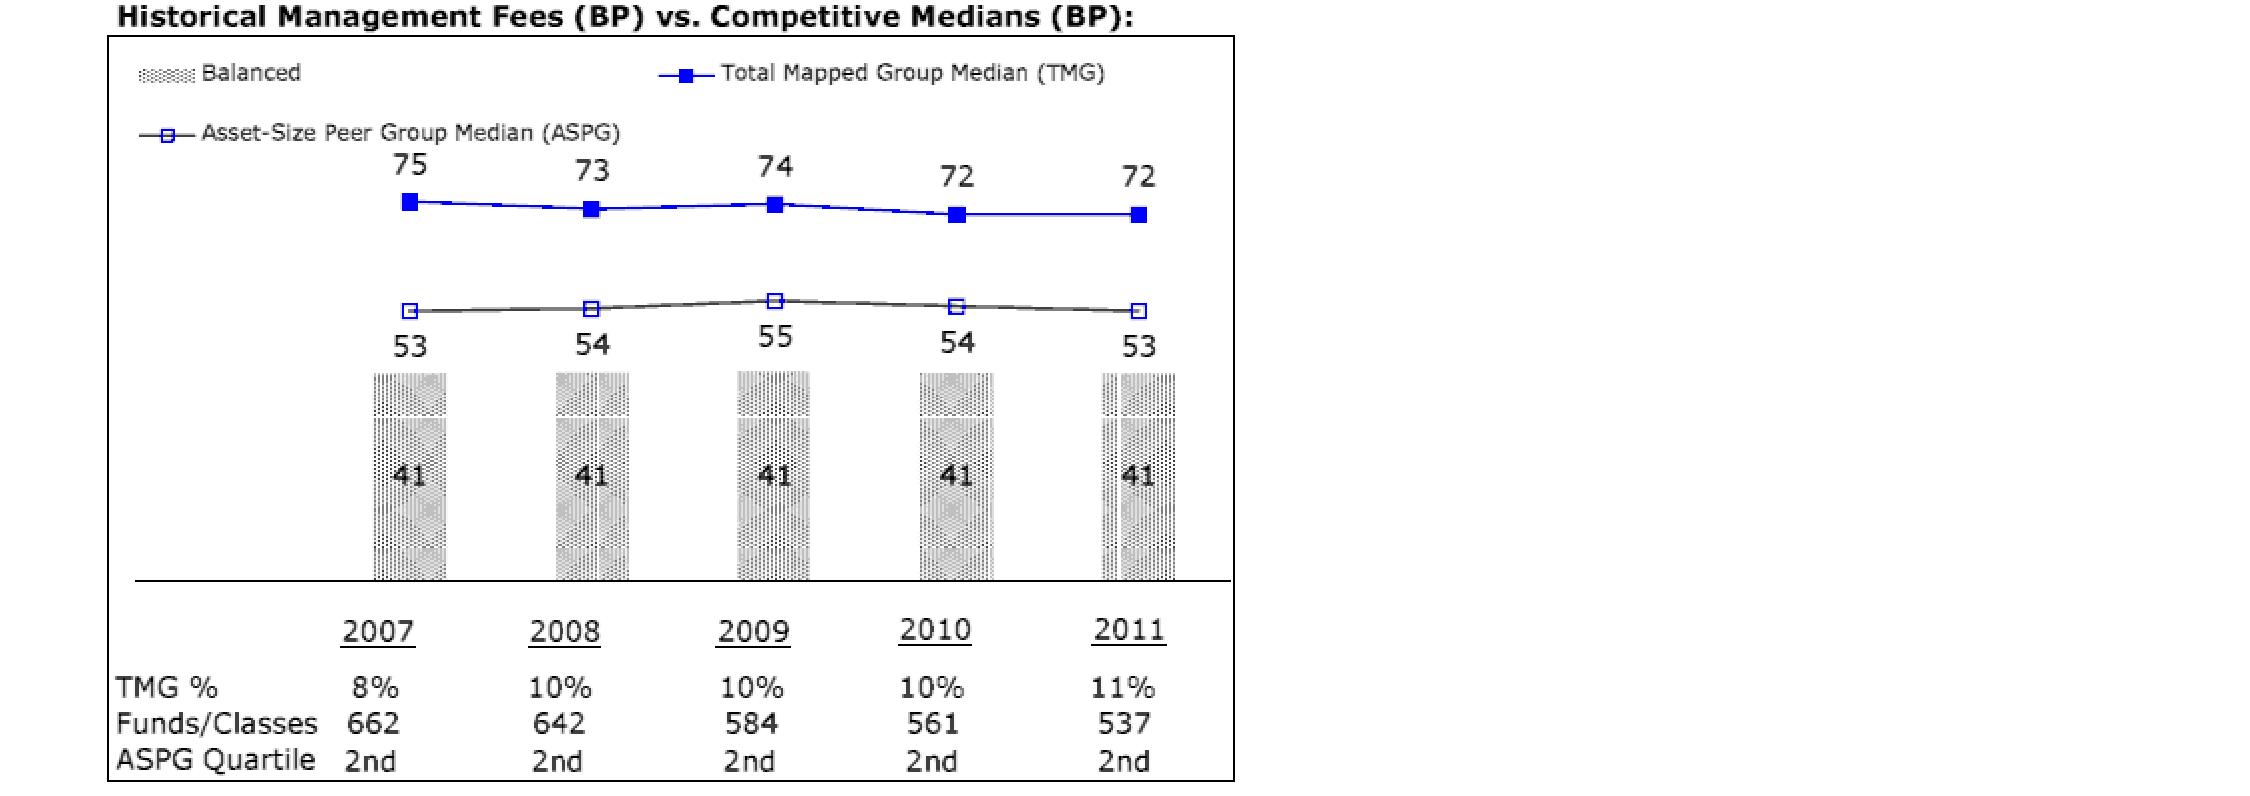
The Board noted that the fund's management fee ranked below the median of its Total Mapped Group and below the median of its ASPG for 2011.
Based on its review, the Board concluded that the fund's management fee is fair and reasonable in light of the services that the fund receives and the other factors considered.
Total Expense Ratio. In its review of each class's total expense ratio, the Board considered the fund's management fee as well as other fund or class expenses, as applicable, such as transfer agent fees, pricing and bookkeeping fees, and custodial, legal, and audit fees. The Board also noted the effects of any waivers and reimbursements on fees and expenses. As part of its review, the Board also considered the current and historical total expense ratios of each class of the fund compared to competitive fund median expenses. Each class of the fund is compared to those funds and classes in the Total Mapped Group (used by the Board for management fee comparisons) that have a similar sales load structure.
The Board noted that the total expense ratio of each class ranked below its competitive median for 2011.
Fees Charged to Other Fidelity Clients. The Board also considered Fidelity fee structures and other information with respect to clients of FMR and its affiliates, such as other mutual funds advised or subadvised by FMR or its affiliates, pension plan clients, and other institutional clients. The Board noted the findings of the 2010 ad hoc joint committee (created with the board of other Fidelity funds), which reviewed and compared Fidelity's institutional investment advisory business with its business of providing services to the Fidelity funds, including the differences in services provided, fees charged, and costs incurred, as well as competition in their respective marketplaces.
Annual Report
Board Approval of Investment Advisory Contracts and
Management Fees - continued
Based on its review of total expense ratios and fees charged to other Fidelity clients, the Board concluded that the total expense ratio of each class of the fund was reasonable in light of the services that the fund and its shareholders receive and the other factors considered.
Costs of the Services and Profitability. The Board considered the revenues earned and the expenses incurred by Fidelity in conducting the business of developing, marketing, distributing, managing, administering and servicing the fund and its shareholders. The Board also considered the level of Fidelity's profits in respect of all the Fidelity funds.
On an annual basis, FMR presents to the Board Fidelity's profitability for the fund. Fidelity calculates the profitability for each fund, as well as aggregate profitability for groups of Fidelity funds and all Fidelity funds, using a series of detailed revenue and cost allocation methodologies which originate with the books and records of Fidelity on which Fidelity's audited financial statements are based. The Audit Committee of the Board reviews any significant changes from the prior year's methodologies.
PricewaterhouseCoopers LLP (PwC), independent registered public accounting firm and auditor to Fidelity and certain Fidelity funds, has been engaged annually by the Board as part of the Board's assessment of Fidelity's profitability analysis. PwC's engagement includes the review and assessment of Fidelity's methodologies used in determining the revenues and expenses attributable to Fidelity's mutual fund business, and completion of agreed-upon procedures surrounding the mathematical accuracy of fund profitability and its conformity to allocation methodologies. After considering PwC's reports issued under the engagement and information provided by Fidelity, the Board concluded that while other allocation methods may also be reasonable, Fidelity's profitability methodologies are reasonable in all material respects.
The Board also reviewed Fidelity's non-fund businesses and fall-out benefits related to the mutual fund business as well as cases where Fidelity's affiliates may benefit from or be related to the fund's business.
The Board considered the costs of the services provided by and the profits realized by Fidelity in connection with the operation of the fund and was satisfied that the profitability was not excessive in the circumstances.
Economies of Scale. The Board considered whether there have been economies of scale in respect of the management of the Fidelity funds, whether the Fidelity funds (including the fund) have appropriately benefited from any such economies of scale, and whether there is potential for realization of any further economies of scale. The Board considered the extent to which the fund will benefit from economies of scale through increased services to the fund, through waivers or reimbursements, or through fee or expense reductions. The Board also noted that in 2009, it and the board of other Fidelity funds created an ad hoc committee (the Economies of Scale Committee) to analyze whether FMR attains economies of scale in respect of the management and servicing of the Fidelity funds, whether the Fidelity funds have appropriately benefited from such economies of scale, and whether there is potential for realization of any further economies of scale.
Annual Report
The Board recognized that the fund's management contract incorporates a "group fee" structure, which provides for lower group fee rates as total fund assets under FMR's management increase, and for higher group fee rates as total fund assets under FMR's management decrease. FMR calculates the group fee rates based on a tiered asset "breakpoint" schedule that varies based on asset class. The Board considered that the group fee is designed to deliver the benefits of economies of scale to fund shareholders when total Fidelity fund assets increase, even if assets of any particular fund are unchanged or have declined, because some portion of Fidelity's costs are attributable to services provided to all Fidelity funds, and all funds benefit if those costs can be allocated among more assets. The Board concluded that, given the group fee structure, fund shareholders will benefit from lower management fees as assets under FMR's management increase at the fund complex level, regardless of whether Fidelity achieves any such economies of scale.
The Board concluded, taking into account the analysis of the Economies of Scale Committee, that economies of scale, if any, are being appropriately shared between fund shareholders and Fidelity.
Additional Information Requested by the Board. In order to develop fully the factual basis for consideration of the Fidelity funds' Advisory Contracts, the Board requested and received additional information on certain topics, including (i) fund performance trends, actions to be taken by FMR to improve certain funds' overall performance, and Fidelity's long-term strategies for certain funds; (ii) the potential to further rationalize the Fidelity fund lineup with the possibility of achieving savings for the funds and Fidelity; (iii) Fidelity's compensation structure for portfolio managers and other key investment personnel; (iv) the amount of the investment that each portfolio manager has made in the Fidelity fund(s) that he or she manages; (v) the realization of fall-out benefits in certain Fidelity business units; (vi) Fidelity's group fee structures, the potential impact of regulatory changes on such structures, and the rationale for the individual fee rates of certain funds; (vii) fund profitability methodology, including Fidelity's cost allocation methodology, and the impact of certain factors on fund profitability results; (viii) trends regarding industry use of performance fee structures and the possibility of implementing performance fee structures for additional funds; and (ix) the impact of net redemptions from the Fidelity funds.
Annual Report
Board Approval of Investment Advisory Contracts and
Management Fees - continued
Based on its evaluation of all of the conclusions noted above, and after considering all factors it believed relevant, the Board ultimately concluded that the advisory fee structures are fair and reasonable, and that the fund's Advisory Contracts should be renewed.
Annual Report
Investment Adviser
Fidelity Management & Research Company
Boston, MA
Investment Sub-Advisers
FMR Co., Inc.
Fidelity Investments
Money Management, Inc.
Fidelity Management & Research
(U.K.) Inc.
Fidelity Management & Research
(Hong Kong) Limited
Fidelity Management & Research
(Japan) Inc.
General Distributor
Fidelity Distributors Corporation
Smithfield, RI
Transfer and Service Agents
Fidelity Investments Institutional Operations Company, Inc.
Boston, MA
Fidelity Service Company, Inc.
Boston, MA
Custodian
Citibank, N.A.
New York, NY
The Fidelity Telephone Connection
Mutual Fund 24-Hour Service
Exchanges/Redemptions
and Account Assistance 1-800-544-6666
Product Information 1-800-544-6666
Retirement Accounts 1-800-544-4774
(8 a.m. - 9 p.m.)
TDD Service 1-800-544-0118
for the deaf and hearing impaired
(9 a.m. - 9 p.m. Eastern time)
Fidelity Automated Service
Telephone (FAST®)
1-800-544-5555
Automated line for quickest service
(Fidelity Investment logo)(registered trademark)
Corporate Headquarters
82 Devonshire St., Boston, MA 02109
www.fidelity.com
BAL-UANN-1012
1.789243.109
Fidelity®
Puritan®
Fund -
Class K
Annual Report
August 31, 2012
(Fidelity Cover Art)
Contents
Performance | (Click Here) | How the fund has done over time. |
Management's Discussion of Fund Performance | (Click Here) | The Portfolio Manager's review of fund performance and strategy. |
Shareholder Expense Example | (Click Here) | An example of shareholder expenses. |
Investment Changes | (Click Here) | A summary of major shifts in the fund's investments over the past six months. |
Investments | (Click Here) | A complete list of the fund's investments with their market values. |
Financial Statements | (Click Here) | Statements of assets and liabilities, operations, and changes in net assets,
as well as financial highlights. |
Notes | (Click Here) | Notes to the financial statements. |
Report of Independent Registered Public Accounting Firm | (Click Here) | |
Trustees and Officers | (Click Here) | |
Distributions | (Click Here) | |
Board Approval of Investment Advisory Contracts and Management Fees | (Click Here) | |
To view a fund's proxy voting guidelines and proxy voting record for the 12-month period ended June 30, visit http://www.fidelity.com/proxyvotingresults or visit the Securities and Exchange Commission's (SEC) web site at http://www.sec.gov. You may also call 1-800-835-5092 to request a free copy of the proxy voting guidelines.
Standard & Poor's, S&P and S&P 500 are registered service marks of The McGraw-Hill Companies, Inc. and have been licensed for use by Fidelity Distributors Corporation.
Other third party marks appearing herein are the property of their respective owners.
All other marks appearing herein are registered or unregistered trademarks or service marks of FMR LLC or an affiliated company. © 2012 FMR LLC. All rights reserved.
Annual Report
This report and the financial statements contained herein are submitted for the general information of the shareholders of the fund. This report is not authorized for distribution to prospective investors in the fund unless preceded or accompanied by an effective prospectus.
A fund files its complete schedule of portfolio holdings with the SEC for the first and third quarters of each fiscal year on Form N-Q. Forms N-Q are available on the SEC's web site at http://www.sec.gov. A fund's Forms N-Q may be reviewed and copied at the SEC's Public Reference Room in Washington, DC. Information regarding the operation of the SEC's Public Reference Room may be obtained by calling 1-800-SEC-0330. For a complete list of a fund's portfolio holdings, view the most recent holdings listing, semiannual report, or annual report on Fidelity's web site at http://www.fidelity.com, http://www.advisor.fidelity.com, or http://www.401k.com, as applicable.
NOT FDIC INSURED • MAY LOSE VALUE • NO BANK GUARANTEE
Neither the fund nor Fidelity Distributors Corporation is a bank.
Annual Report
Average annual total return reflects the change in the value of an investment, assuming reinvestment of the class' distributions from dividend income and capital gains (the profits earned upon the sale of securities that have grown in value, if any) and assuming a constant rate of performance each year. The $10,000 table and the fund's returns do not reflect the deduction of taxes that a shareholder would pay on fund distributions or the redemption of fund shares. During periods of reimbursement by Fidelity, a fund's total return will be greater than it would be had the reimbursement not occurred. How a fund did yesterday is no guarantee of how it will do tomorrow.
Average Annual Total Returns
Periods ended August 31, 2012 | Past 1
year | Past 5
years | Past 10
years |
Class K A | 12.43% | 3.28% | 6.95% |
A The initial offering of Class K shares took place on May 9, 2008. Returns prior to May 9, 2008 are those of Fidelity® Puritan® Fund, the original class of the fund.
$10,000 Over 10 Years
Let's say hypothetically that $10,000 was invested in Fidelity® Puritan® Fund - Class K,
on August 31, 2002. The chart shows how the value of your investment would have changed, and also shows how the S&P 500® Index performed over the same period. The initial offering of Class K took place on May 9, 2008. See above for additional information regarding the performance of Class K.
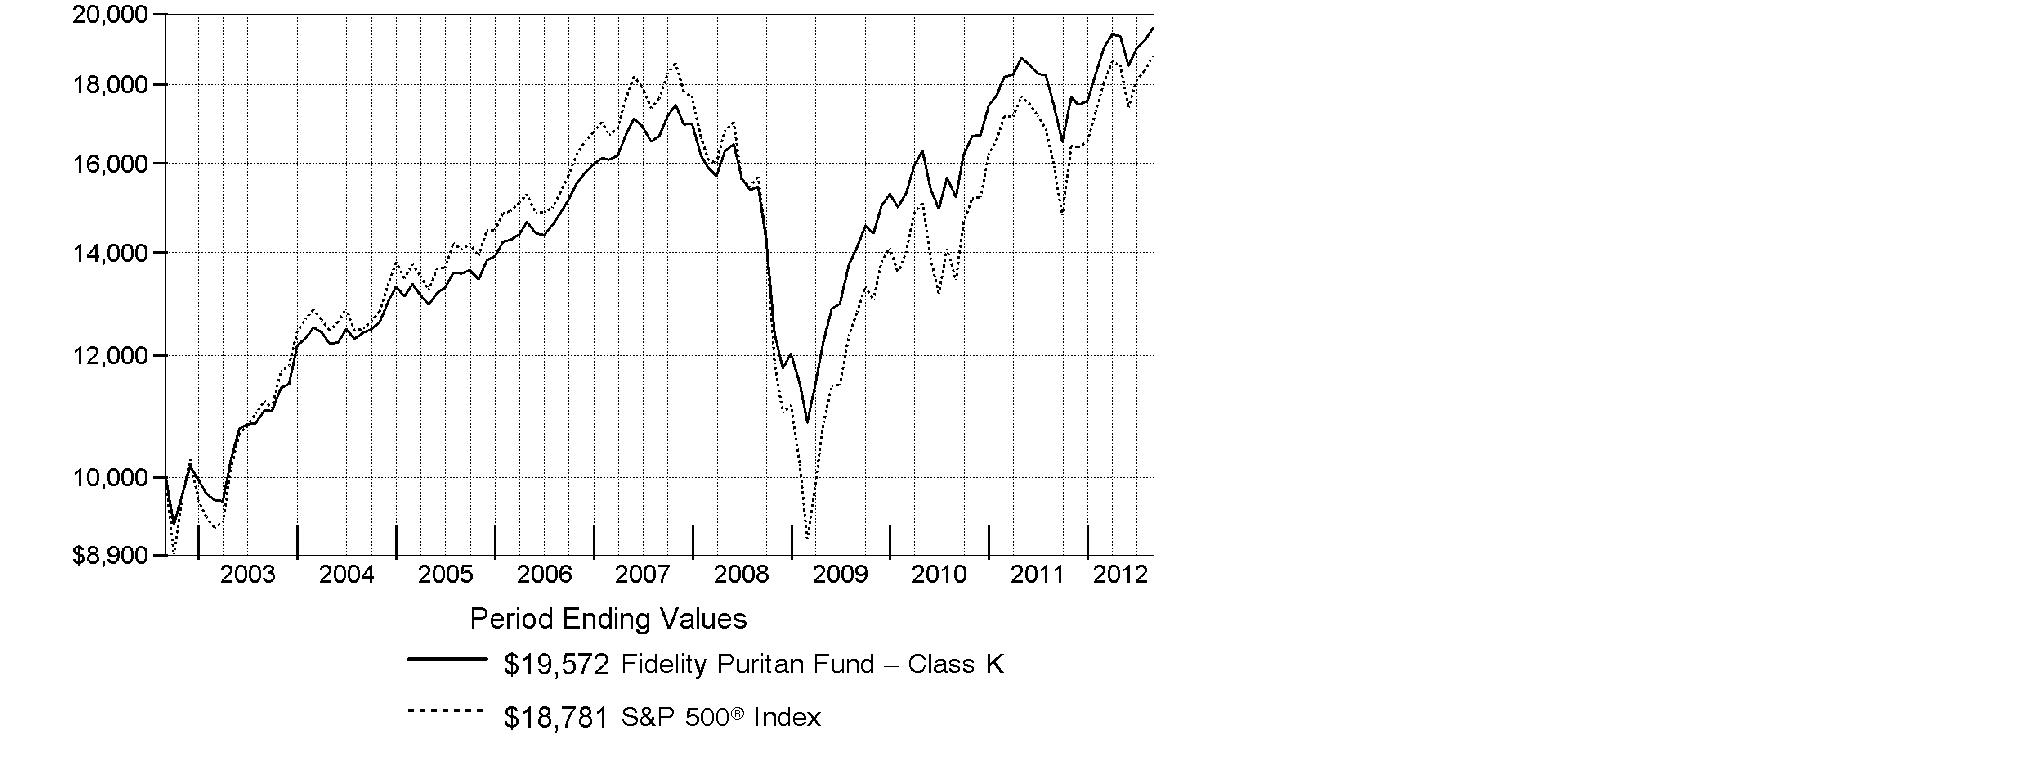
Annual Report
Market Recap: U.S. stocks posted a strong gain for the 12 months ending August 31, 2012, overcoming losses sustained last summer and extending an uptrend that began in March 2009. The broad-based S&P 500® Index added 18.00% for the 12-month period, while the blue-chip-laden Dow Jones Industrial AverageSM and technology-heavy Nasdaq Composite® Index rose 15.86% and 20.26%, respectively. Uncertainty prevailed early on, as Greece neared insolvency and fear of debt contagion in Europe led the S&P 500® to its lowest point in more than a year, in early October. Markets reversed course that same month, and the S&P 500® rose to its largest monthly gain in two decades. Despite a rough patch in the spring, U.S. stocks pushed ahead for much of the remainder of the period, fueled by solid corporate earnings, a reviving housing market and hope for a solution in the eurozone. Elsewhere, foreign developed-markets stocks languished amid the European turmoil and as local currencies weakened versus the dollar, leaving the MSCI® EAFE® Index up just 0.10%. In the fixed-income arena, the search for yield benefited high-income securities, which returned 13.01%, according to The BofA Merrill LynchSM US High Yield Constrained Index. Higher-quality debt registered a more muted advance, with the Barclays® U.S. Aggregate Bond Index - a proxy for investment-grade debt - returning 5.78%.
Comments from Ramin Arani, Lead Portfolio Manager of Fidelity® Puritan® Fund: For the year, the fund's Class K shares returned 12.43%, trailing the 13.34% gain of the Fidelity Puritan Composite IndexSM. Stock selection hurt, but the negative impact was modestly offset by our overweighting in equities, which advanced strongly on an absolute basis. We benefited the most from fixed-income investments, including good picks and an underweighted stake in investment-grade bonds, and a small out-of-index allocation to high-yield bonds. The biggest individual detractor was Green Mountain Coffee Roasters, which saw its stock fall as growth slowed and the company missed revenue and earnings estimates. In materials, we were hurt by two gold-related stocks: Australia-based Newcrest Mining and producer Goldcorp, both of which lost ground. Elsewhere, our investments in Facebook declined sharply following the social media company's May initial public offering. Apple was by far our top contributor, as its stock soared on strong sales and earnings. Michael Kors Holdings was additive, as this "affordable luxury" brand has seen fast growth of its apparel and accessories. Shares of media and cable company Comcast made a strong advance, and our outsized stake boosted results. Many of the stocks I've mentioned were not in the index, and some were not held at period end.
The views expressed above reflect those of the portfolio manager(s) only through the end of the period as stated on the cover of this report and do not necessarily represent the views of Fidelity or any other person in the Fidelity organization. Any such views are subject to change at any time based upon market or other conditions and Fidelity disclaims any responsibility to update such views. These views may not be relied on as investment advice and, because investment decisions for a Fidelity fund are based on numerous factors, may not be relied on as an indication of trading intent on behalf of any Fidelity fund.
Annual Report
Shareholder Expense Example
As a shareholder of the Fund, you incur two types of costs: (1) transaction costs, and (2) ongoing costs, including management fees and other Fund expenses. This Example is intended to help you understand your ongoing costs (in dollars) of investing in the Fund and to compare these costs with the ongoing costs of investing in other mutual funds.
The Example is based on an investment of $1,000 invested at the beginning of the period and held for the entire period (March 1, 2012 to August 31, 2012).
Actual Expenses
The first line of the accompanying table for each class of the Fund provides information about actual account values and actual expenses. You may use the information in this line, together with the amount you invested, to estimate the expenses that you paid over the period. Simply divide your account value by $1,000.00 (for example, an $8,600 account value divided by $1,000.00 = 8.6), then multiply the result by the number in the first line for a class of the Fund under the heading entitled "Expenses Paid During Period" to estimate the expenses you paid on your account during this period. A small balance maintenance fee of $12.00 that is charged once a year may apply for certain accounts with a value of less than $2,000. This fee is not included in the table below. If it was, the estimate of expenses you paid during the period would be higher, and your ending account value lower, by this amount. In addition, the Fund, as a shareholder in the underlying Fidelity Central Funds, will indirectly bear its pro-rata share of the fees and expenses incurred by the underlying Fidelity Central Funds. These fees and expenses are not included in the Fund's annualized expense ratio used to calculate the expense estimate in the table below.
Hypothetical Example for Comparison Purposes
The second line of the accompanying table for each class of the Fund provides information about hypothetical account values and hypothetical expenses based on a Class' actual expense ratio and an assumed rate of return of 5% per year before expenses, which is not the Class' actual return. The hypothetical account values and expenses may not be used to estimate the actual ending account balance or expenses you paid for the period. You may use this information to compare the ongoing costs of investing in the Fund and other funds. To do so, compare this 5% hypothetical example with the 5% hypothetical examples that appear in the shareholder reports of the other funds. A small balance maintenance fee of $12.00 that is charged once a year may apply for certain accounts with a value of less than $2,000. This fee is not included in the table below. If it was, the estimate of expenses you paid during the period would be higher, and your ending account value lower, by this amount. In addition, the Fund, as a shareholder in the underlying Fidelity Central Funds, will indirectly bear its pro-rata share of the fees and expenses incurred by the underlying Fidelity Central Funds. These fees and expenses are not included in the Fund's annualized expense ratio used to calculate the expense estimate in the table below.
Please note that the expenses shown in the table are meant to highlight your ongoing costs only and do not reflect any transaction costs. Therefore, the second line of the table is useful in comparing ongoing costs only, and will not help you determine the relative total costs of owning different funds.
Annual Report
| Annualized Expense Ratio | Beginning
Account Value
March 1, 2012 | Ending
Account Value
August 31, 2012 | Expenses Paid
During Period*
March 1, 2012
to August 31, 2012 |
Puritan | .59% | | | |
Actual | | $ 1,000.00 | $ 1,029.60 | $ 3.01 |
HypotheticalA | | $ 1,000.00 | $ 1,022.17 | $ 3.00 |
Class K | .48% | | | |
Actual | | $ 1,000.00 | $ 1,029.70 | $ 2.45 |
HypotheticalA | | $ 1,000.00 | $ 1,022.72 | $ 2.44 |
A 5% return per year before expenses
* Expenses are equal to each Class' annualized expense ratio, multiplied by the average account value over the period, multiplied by 184/366 (to reflect the one-half year period). The fees and expenses of the underlying Fidelity Central Funds in which the Fund invests are not included in each Class' annualized expense ratio.
Annual Report
Investment Changes (Unaudited)
The information in the following tables is based on the combined investments of the Fund and its pro-rata share of the investments of Fidelity's fixed-income central funds. |
Top Five Stocks as of August 31, 2012 |
| % of fund's
net assets | % of fund's net assets
6 months ago |
Apple, Inc. | 4.5 | 4.0 |
Microsoft Corp. | 1.4 | 1.4 |
Chevron Corp. | 1.4 | 1.6 |
General Electric Co. | 1.3 | 0.6 |
The Coca-Cola Co. | 1.3 | 1.3 |
| 9.9 | |
Top Five Bond Issuers as of August 31, 2012 |
(with maturities greater than one year) | % of fund's
net assets | % of fund's net assets
6 months ago |
Fannie Mae | 8.7 | 4.8 |
U.S. Treasury Obligations | 5.4 | 8.9 |
Freddie Mac | 2.4 | 2.2 |
Ginnie Mae | 1.9 | 1.7 |
Wachovia Bank Commercial Mortgage Trust | 0.5 | 0.4 |
| 18.9 | |
Top Five Market Sectors as of August 31, 2012 |
| % of fund's
net assets | % of fund's net assets
6 months ago |
Information Technology | 15.1 | 14.4 |
Financials | 11.7 | 11.8 |
Consumer Discretionary | 9.9 | 11.1 |
Health Care | 9.1 | 7.7 |
Consumer Staples | 8.8 | 8.5 |
Asset Allocation (% of fund's net assets) |
As of August 31, 2012 * | As of February 29, 2012 ** |
 | Stocks and Investment Companies 61.3% | | | Stocks and Investment Companies 62.6% | |
 | Bonds 33.6% | | | Bonds 32.5% | |
 | Convertible
Securities 0.5% | | | Convertible
Securities 0.3% | |
 | Other Investments 0.9% | | | Other Investments 1.0% | |
 | Short-Term Investments and Net Other Assets (Liabilities) 3.7% | | | Short-Term Investments and Net Other Assets (Liabilities) 3.6% | |
* Foreign investments | 9.0% | | ** Foreign investments | 12.2% | |

Percentages are adjusted for the effect of futures contracts and swap agreements, if applicable. |
A holdings listing for the Fund, which presents direct holdings as well as the pro-rata share of any securities and other investments held indirectly through its investments in underlying non-money market Fidelity Central Funds, is available at fidelity.com. |
Percentages in the above tables are adjusted for the effect of TBA Sale Commitments. |
Annual Report
Investments August 31, 2012
Showing Percentage of Net Assets
Common Stocks - 61.0% |
| Shares | | Value (000s) |
CONSUMER DISCRETIONARY - 7.7% |
Auto Components - 0.0% |
Delphi Automotive PLC | 68,093 | | $ 2,063 |
Automobiles - 0.3% |
General Motors Co. (a) | 2,170 | | 46 |
Harley-Davidson, Inc. | 607,600 | | 25,495 |
Honda Motor Co. Ltd. | 768,400 | | 24,481 |
Motors Liquidation Co. GUC Trust (a) | 28,150 | | 403 |
Tesla Motors, Inc. (a) | 128,800 | | 3,673 |
| | 54,098 |
Hotels, Restaurants & Leisure - 0.8% |
Arcos Dorados Holdings, Inc. | 1,000 | | 13 |
Dunkin' Brands Group, Inc. | 1,148,000 | | 33,441 |
McDonald's Corp. | 308,600 | | 27,617 |
Starbucks Corp. | 895,600 | | 44,431 |
Station Holdco LLC (a)(p)(q) | 1,194,419 | | 1,839 |
Station Holdco LLC warrants 6/15/18 (a)(p)(q) | 75,658 | | 4 |
Vail Resorts, Inc. | 917,027 | | 47,273 |
| | 154,618 |
Household Durables - 0.7% |
D.R. Horton, Inc. | 1,000,000 | | 18,990 |
Lennar Corp. Class A | 1,487,100 | | 48,227 |
Toll Brothers, Inc. (a) | 2,264,800 | | 74,104 |
| | 141,321 |
Internet & Catalog Retail - 0.8% |
Amazon.com, Inc. (a) | 452,800 | | 112,399 |
Expedia, Inc. | 546,400 | | 28,063 |
Priceline.com, Inc. (a) | 20,100 | | 12,152 |
| | 152,614 |
Media - 2.5% |
Comcast Corp. Class A (special) (non-vtg.) | 6,435,900 | | 211,548 |
Discovery Communications, Inc. (a) | 760,900 | | 41,728 |
HMH Holdings, Inc. warrants 6/22/19 (a)(q) | 1,945 | | 15 |
Legend Pictures LLC (a)(p)(q) | 49,141 | | 52,538 |
Lions Gate Entertainment Corp. (a)(f) | 1,355,900 | | 20,040 |
Manchester United PLC | 1,785,700 | | 23,750 |
News Corp. Class A | 4,192,300 | | 98,058 |
Pandora Media, Inc. (a)(f) | 529,694 | | 6,351 |
Publicis Groupe SA | 355,600 | | 18,457 |
Common Stocks - continued |
| Shares | | Value (000s) |
CONSUMER DISCRETIONARY - continued |
Media - continued |
The Walt Disney Co. | 284,190 | | $ 14,059 |
Vertis Holdings, Inc. (a) | 1,934 | | 22 |
| | 486,566 |
Multiline Retail - 0.1% |
PPR SA | 202,600 | | 31,650 |
Specialty Retail - 1.4% |
Home Depot, Inc. | 2,346,100 | | 133,141 |
Limited Brands, Inc. | 826,800 | | 40,182 |
TJX Companies, Inc. | 2,179,600 | | 99,804 |
| | 273,127 |
Textiles, Apparel & Luxury Goods - 1.1% |
Brunello Cucinelli SpA | 1,155,400 | | 19,183 |
Michael Kors Holdings Ltd. | 1,079,961 | | 58,264 |
NIKE, Inc. Class B | 491,000 | | 47,804 |
PVH Corp. | 384,100 | | 36,067 |
Ralph Lauren Corp. | 327,700 | | 51,990 |
Tumi Holdings, Inc. (f) | 67,400 | | 1,419 |
| | 214,727 |
TOTAL CONSUMER DISCRETIONARY | | 1,510,784 |
CONSUMER STAPLES - 8.1% |
Beverages - 2.5% |
Anheuser-Busch InBev SA NV ADR | 867,700 | | 73,043 |
Beam, Inc. | 1,228,200 | | 71,678 |
Britvic PLC | 2,351,300 | | 11,932 |
Diageo PLC sponsored ADR | 195,300 | | 21,331 |
Dr Pepper Snapple Group, Inc. | 571,200 | | 25,595 |
Monster Beverage Corp. (a) | 657,700 | | 38,758 |
The Coca-Cola Co. | 6,860,400 | | 256,579 |
| | 498,916 |
Food & Staples Retailing - 2.2% |
Costco Wholesale Corp. | 729,600 | | 71,406 |
CVS Caremark Corp. | 3,265,100 | | 148,725 |
Drogasil SA | 106,220 | | 1,123 |
Wal-Mart Stores, Inc. | 2,799,400 | | 203,236 |
Whole Foods Market, Inc. | 161,200 | | 15,596 |
| | 440,086 |
Common Stocks - continued |
| Shares | | Value (000s) |
CONSUMER STAPLES - continued |
Food Products - 0.6% |
Kraft Foods, Inc. Class A | 3,059,600 | | $ 127,065 |
Mead Johnson Nutrition Co. Class A | 3,800 | | 279 |
| | 127,344 |
Household Products - 0.2% |
Kimberly-Clark Corp. | 380,300 | | 31,793 |
Procter & Gamble Co. | 21,800 | | 1,465 |
| | 33,258 |
Personal Products - 0.5% |
Estee Lauder Companies, Inc. Class A | 1,029,200 | | 61,701 |
Prestige Brands Holdings, Inc. (a) | 2,182,251 | | 35,047 |
| | 96,748 |
Tobacco - 2.1% |
British American Tobacco PLC sponsored ADR | 400,300 | | 41,927 |
Japan Tobacco, Inc. | 2,114,800 | | 64,123 |
Lorillard, Inc. | 566,400 | | 71,089 |
Philip Morris International, Inc. | 2,619,240 | | 233,898 |
| | 411,037 |
TOTAL CONSUMER STAPLES | | 1,607,389 |
ENERGY - 6.7% |
Energy Equipment & Services - 1.4% |
Cameron International Corp. (a) | 673,700 | | 36,858 |
Ensco PLC Class A | 1,256,700 | | 72,097 |
National Oilwell Varco, Inc. | 519,900 | | 40,968 |
Noble Corp. | 1,426,100 | | 54,391 |
Ocean Rig UDW, Inc. (United States) | 1,484,049 | | 24,828 |
Schlumberger Ltd. | 621,300 | | 44,970 |
| | 274,112 |
Oil, Gas & Consumable Fuels - 5.3% |
Apache Corp. | 14,791 | | 1,268 |
Cabot Oil & Gas Corp. | 1,185,900 | | 49,108 |
Cheniere Energy, Inc. (a) | 136,900 | | 2,021 |
Chevron Corp. | 2,447,400 | | 274,500 |
Energen Corp. | 378,600 | | 19,328 |
EQT Corp. | 445,600 | | 24,045 |
EV Energy Partners LP | 575,724 | | 36,138 |
Exxon Mobil Corp. | 2,521,517 | | 220,128 |
Marathon Petroleum Corp. | 832,200 | | 43,066 |
Common Stocks - continued |
| Shares | | Value (000s) |
ENERGY - continued |
Oil, Gas & Consumable Fuels - continued |
Occidental Petroleum Corp. | 1,359,458 | | $ 115,568 |
Phillips 66 | 1,039,000 | | 43,638 |
Pioneer Natural Resources Co. | 439,100 | | 42,751 |
Plains Exploration & Production Co. (a) | 845,100 | | 33,229 |
Suncor Energy, Inc. | 751,000 | | 23,473 |
Tesoro Corp. | 542,500 | | 21,559 |
Williams Companies, Inc. | 3,101,900 | | 100,098 |
| | 1,049,918 |
TOTAL ENERGY | | 1,324,030 |
FINANCIALS - 7.2% |
Capital Markets - 0.4% |
Apollo Global Management LLC Class A | 1,112,300 | | 14,749 |
Evercore Partners, Inc. Class A | 1,013,500 | | 25,033 |
HFF, Inc. (a) | 900,200 | | 11,973 |
Morgan Stanley | 1,442,556 | | 21,638 |
State Street Corp. | 477,200 | | 19,852 |
| | 93,245 |
Commercial Banks - 2.5% |
BB&T Corp. | 824,900 | | 26,017 |
CIT Group, Inc. (a) | 222,600 | | 8,405 |
First Republic Bank | 50,000 | | 1,635 |
Huntington Bancshares, Inc. | 2,613,300 | | 17,248 |
PNC Financial Services Group, Inc. | 253,600 | | 15,764 |
SunTrust Banks, Inc. | 1,075,900 | | 27,080 |
U.S. Bancorp | 4,249,400 | | 141,972 |
Wells Fargo & Co. | 7,507,040 | | 255,465 |
| | 493,586 |
Consumer Finance - 0.9% |
American Express Co. | 698,400 | | 40,717 |
Capital One Financial Corp. | 777,500 | | 43,952 |
Discover Financial Services | 1,098,600 | | 42,549 |
SLM Corp. | 3,316,100 | | 52,229 |
| | 179,447 |
Diversified Financial Services - 1.5% |
Citigroup, Inc. | 5,410,240 | | 160,738 |
JPMorgan Chase & Co. | 2,694,723 | | 100,082 |
Common Stocks - continued |
| Shares | | Value (000s) |
FINANCIALS - continued |
Diversified Financial Services - continued |
NBH Holdings Corp. Class A (a)(h) | 710,000 | | $ 12,603 |
The NASDAQ Stock Market, Inc. | 1,112,600 | | 25,445 |
| | 298,868 |
Insurance - 0.8% |
ACE Ltd. | 392,600 | | 28,946 |
Berkshire Hathaway, Inc. Class B (a) | 761,200 | | 64,200 |
MetLife, Inc. | 1,798,100 | | 61,369 |
| | 154,515 |
Real Estate Investment Trusts - 1.1% |
American Tower Corp. | 1,133,100 | | 79,770 |
Lexington Corporate Properties Trust (f) | 3,468,867 | | 32,538 |
Public Storage | 172,900 | | 25,167 |
Simon Property Group, Inc. | 468,200 | | 74,303 |
| | 211,778 |
TOTAL FINANCIALS | | 1,431,439 |
HEALTH CARE - 8.3% |
Biotechnology - 3.5% |
Achillion Pharmaceuticals, Inc. (a)(f) | 2,172,600 | | 15,273 |
Acorda Therapeutics, Inc. (a) | 590,000 | | 13,482 |
Affymax, Inc. (a) | 959,900 | | 16,981 |
Alexion Pharmaceuticals, Inc. (a) | 288,200 | | 30,898 |
AMAG Pharmaceuticals, Inc. (a)(g) | 1,460,561 | | 21,602 |
Amarin Corp. PLC ADR (a)(f) | 418,800 | | 5,733 |
Amgen, Inc. | 1,789,500 | | 150,175 |
Arena Pharmaceuticals, Inc. (a)(f) | 766,100 | | 6,926 |
Biogen Idec, Inc. (a) | 767,000 | | 112,435 |
BioMarin Pharmaceutical, Inc. (a) | 518,500 | | 19,361 |
CSL Ltd. | 1,035,843 | | 47,548 |
Gilead Sciences, Inc. (a) | 1,232,700 | | 71,114 |
Grifols SA ADR | 2,693,600 | | 55,407 |
Medivation, Inc. (a) | 300,000 | | 31,458 |
Merrimack Pharmaceuticals, Inc. | 340,294 | | 2,709 |
Neurocrine Biosciences, Inc. (a)(g) | 3,731,700 | | 27,540 |
Theravance, Inc. (a) | 840,900 | | 22,427 |
Vertex Pharmaceuticals, Inc. (a) | 595,300 | | 31,747 |
| | 682,816 |
Common Stocks - continued |
| Shares | | Value (000s) |
HEALTH CARE - continued |
Health Care Equipment & Supplies - 0.2% |
The Cooper Companies, Inc. | 521,259 | | $ 43,708 |
Health Care Providers & Services - 1.4% |
Catamaran Corp. (a) | 675,175 | | 58,603 |
Express Scripts Holding Co. (a) | 1,292,858 | | 80,959 |
Health Net, Inc. (a) | 3 | | 0* |
McKesson Corp. | 264,200 | | 23,014 |
Qualicorp SA (a) | 3,357,800 | | 33,001 |
UnitedHealth Group, Inc. | 1,641,900 | | 89,155 |
| | 284,732 |
Health Care Technology - 0.2% |
CareView Communications, Inc. (a)(f)(g) | 10,425,300 | | 10,530 |
Cerner Corp. (a) | 322,300 | | 23,573 |
| | 34,103 |
Life Sciences Tools & Services - 0.0% |
Illumina, Inc. (a)(f) | 159,700 | | 6,720 |
Pharmaceuticals - 3.0% |
Elan Corp. PLC sponsored ADR (a) | 1,399,148 | | 15,894 |
Eli Lilly & Co. | 1,821,800 | | 81,817 |
Forest Laboratories, Inc. (a) | 970,900 | | 33,681 |
Merck & Co., Inc. | 3,155,000 | | 135,823 |
Optimer Pharmaceuticals, Inc. (a) | 1,235,000 | | 18,562 |
Pfizer, Inc. | 6,970,500 | | 166,316 |
TherapeuticsMD, Inc. (a)(g) | 5,500,000 | | 18,645 |
Valeant Pharmaceuticals International, Inc. (Canada) (a) | 526,311 | | 26,947 |
ViroPharma, Inc. (a) | 400,778 | | 10,661 |
Watson Pharmaceuticals, Inc. (a) | 904,700 | | 73,597 |
| | 581,943 |
TOTAL HEALTH CARE | | 1,634,022 |
INDUSTRIALS - 4.8% |
Aerospace & Defense - 1.0% |
Honeywell International, Inc. | 508,800 | | 29,739 |
Textron, Inc. | 1,906,100 | | 50,931 |
United Technologies Corp. | 1,398,800 | | 111,694 |
| | 192,364 |
Air Freight & Logistics - 0.2% |
United Parcel Service, Inc. Class B | 584,954 | | 43,175 |
Common Stocks - continued |
| Shares | | Value (000s) |
INDUSTRIALS - continued |
Building Products - 0.1% |
Fortune Brands Home & Security, Inc. (a) | 567,100 | | $ 14,461 |
Masonite Worldwide Holdings (a) | 5,358 | | 159 |
Masonite Worldwide Holdings: | | | |
warrants 5/20/14 (a) | 25,981 | | 16 |
warrants 5/20/16 (a) | 19,485 | | 21 |
| | 14,657 |
Electrical Equipment - 0.2% |
AMETEK, Inc. | 497,402 | | 17,066 |
Regal-Beloit Corp. | 266,000 | | 18,104 |
| | 35,170 |
Industrial Conglomerates - 1.9% |
Carlisle Companies, Inc. | 455,400 | | 23,836 |
Danaher Corp. | 230,700 | | 12,359 |
General Electric Co. | 12,925,200 | | 267,681 |
Tyco International Ltd. | 1,384,700 | | 78,069 |
| | 381,945 |
Machinery - 0.7% |
Caterpillar, Inc. | 234,400 | | 20,001 |
Illinois Tool Works, Inc. | 981,600 | | 58,199 |
Ingersoll-Rand PLC | 801,500 | | 37,478 |
WABCO Holdings, Inc. (a) | 281,600 | | 16,536 |
Westport Innovations, Inc. (a)(f) | 14,059 | | 495 |
| | 132,709 |
Marine - 0.0% |
DryShips, Inc. (a) | 3,755,900 | | 8,225 |
Road & Rail - 0.6% |
Union Pacific Corp. | 990,856 | | 120,330 |
Trading Companies & Distributors - 0.1% |
Air Lease Corp. Class A (a)(f) | 570,400 | | 11,762 |
TOTAL INDUSTRIALS | | 940,337 |
INFORMATION TECHNOLOGY - 14.4% |
Communications Equipment - 1.5% |
Cisco Systems, Inc. | 1,954,300 | | 37,288 |
Motorola Solutions, Inc. | 2,090,600 | | 99,638 |
QUALCOMM, Inc. | 2,475,600 | | 152,150 |
| | 289,076 |
Common Stocks - continued |
| Shares | | Value (000s) |
INFORMATION TECHNOLOGY - continued |
Computers & Peripherals - 4.5% |
Apple, Inc. | 1,327,200 | | $ 882,885 |
Electronic Equipment & Components - 0.3% |
Amphenol Corp. Class A | 736,000 | | 44,800 |
Arrow Electronics, Inc. (a) | 428,800 | | 15,544 |
E Ink Holdings, Inc. GDR (a)(h) | 140,100 | | 1,404 |
| | 61,748 |
Internet Software & Services - 2.1% |
Demand Media, Inc. (a)(f) | 1,324,308 | | 13,442 |
eBay, Inc. (a) | 2,273,600 | | 107,928 |
Facebook, Inc.: | | | |
Class A (f) | 619,100 | | 11,193 |
Class B (a)(q) | 881,260 | | 14,340 |
Google, Inc. Class A (a) | 337,600 | | 231,286 |
Mail.ru Group Ltd.: | | | |
GDR (h) | 580,000 | | 19,007 |
GDR (Reg. S) | 289,900 | | 9,500 |
Rackspace Hosting, Inc. (a) | 14,700 | | 882 |
Yahoo!, Inc. (a) | 860,900 | | 12,612 |
| | 420,190 |
IT Services - 2.4% |
Accenture PLC Class A | 1,036,600 | | 63,855 |
Cognizant Technology Solutions Corp. Class A (a) | 855,900 | | 55,017 |
IBM Corp. | 907,400 | | 176,807 |
Redecard SA | 3,871,200 | | 63,983 |
Teradata Corp. (a) | 171,100 | | 13,069 |
Visa, Inc. Class A | 733,000 | | 94,007 |
| | 466,738 |
Semiconductors & Semiconductor Equipment - 1.5% |
Altera Corp. | 1,290,900 | | 48,189 |
ASML Holding NV | 742,500 | | 42,152 |
Avago Technologies Ltd. | 578,500 | | 21,156 |
Broadcom Corp. Class A | 975,000 | | 34,642 |
Freescale Semiconductor Holdings I Ltd. (a) | 3,208,700 | | 32,119 |
Intel Corp. | 1,988,900 | | 49,384 |
NXP Semiconductors NV (a) | 1,517,800 | | 35,395 |
Samsung Electronics Co. Ltd. | 32,343 | | 35,173 |
Taiwan Semiconductor Manufacturing Co. Ltd. sponsored ADR | 102,200 | | 1,502 |
| | 299,712 |
Common Stocks - continued |
| Shares | | Value (000s) |
INFORMATION TECHNOLOGY - continued |
Software - 2.1% |
Citrix Systems, Inc. (a) | 456,400 | | $ 35,458 |
Fortinet, Inc. (a) | 418,506 | | 11,095 |
Microsoft Corp. | 8,947,500 | | 275,762 |
QLIK Technologies, Inc. (a) | 472,300 | | 9,989 |
salesforce.com, Inc. (a) | 413,300 | | 60,003 |
Splunk, Inc. | 36,800 | | 1,266 |
VMware, Inc. Class A (a) | 249,500 | | 22,215 |
| | 415,788 |
TOTAL INFORMATION TECHNOLOGY | | 2,836,137 |
MATERIALS - 1.8% |
Chemicals - 1.8% |
Albemarle Corp. | 544,100 | | 29,779 |
Ashland, Inc. | 667,100 | | 49,119 |
Eastman Chemical Co. | 607,800 | | 33,587 |
LyondellBasell Industries NV Class A | 1,160,694 | | 56,688 |
Monsanto Co. | 1,254,400 | | 109,271 |
Sherwin-Williams Co. | 396,900 | | 56,788 |
Tronox Ltd. Class A | 118,015 | | 3,044 |
W.R. Grace & Co. (a) | 388,400 | | 22,434 |
| | 360,710 |
TELECOMMUNICATION SERVICES - 0.6% |
Diversified Telecommunication Services - 0.4% |
CenturyLink, Inc. | 1,084,900 | | 45,848 |
Iliad SA | 174,465 | | 27,650 |
| | 73,498 |
Wireless Telecommunication Services - 0.2% |
SBA Communications Corp. Class A (a) | 350,800 | | 20,971 |
Sprint Nextel Corp. (a) | 5,423,000 | | 26,302 |
| | 47,273 |
TOTAL TELECOMMUNICATION SERVICES | | 120,771 |
UTILITIES - 1.4% |
Electric Utilities - 1.0% |
Bicent Power LLC: | | | |
warrants 8/21/22 (a) | 531 | | 0 |
warrants 8/21/22 (a) | 327 | | 0 |
Common Stocks - continued |
| Shares | | Value (000s) |
UTILITIES - continued |
Electric Utilities - continued |
Edison International | 1,412,400 | | $ 61,849 |
FirstEnergy Corp. | 1,091,900 | | 47,716 |
NextEra Energy, Inc. | 1,186,000 | | 79,830 |
| | 189,395 |
Independent Power Producers & Energy Traders - 0.1% |
The AES Corp. | 2,024,300 | | 23,057 |
Multi-Utilities - 0.3% |
Sempra Energy | 963,400 | | 63,777 |
TOTAL UTILITIES | | 276,229 |
TOTAL COMMON STOCKS (Cost $9,429,334) |
12,041,848
|
Preferred Stocks - 0.6% |
| | | |
Convertible Preferred Stocks - 0.3% |
CONSUMER DISCRETIONARY - 0.2% |
Automobiles - 0.0% |
General Motors Co. 4.75% | 148,900 | | 5,316 |
Media - 0.2% |
Vice Holdings, Inc. (q) | 6,701 | | 34,999 |
TOTAL CONSUMER DISCRETIONARY | | 40,315 |
ENERGY - 0.0% |
Oil, Gas & Consumable Fuels - 0.0% |
Apache Corp. 6.00% | 36,200 | | 1,774 |
Chesapeake Energy Corp. 5.00% | 18,580 | | 1,482 |
| | 3,256 |
INFORMATION TECHNOLOGY - 0.0% |
Internet Software & Services - 0.0% |
wetpaint.com, Inc. Series C (a)(q) | 497,017 | | 994 |
MATERIALS - 0.0% |
Metals & Mining - 0.0% |
AngloGold Ashanti Holdings Finance PLC 6.00% | 104,600 | | 4,079 |
Preferred Stocks - continued |
| Shares | | Value (000s) |
Convertible Preferred Stocks - continued |
UTILITIES - 0.1% |
Electric Utilities - 0.1% |
AES Trust III 6.75% | 126,300 | | $ 6,320 |
PPL Corp. 8.75% | 108,000 | | 5,932 |
| | 12,252 |
TOTAL CONVERTIBLE PREFERRED STOCKS | | 60,896 |
Nonconvertible Preferred Stocks - 0.3% |
CONSUMER DISCRETIONARY - 0.2% |
Automobiles - 0.2% |
Volkswagen AG | 212,900 | | 37,597 |
FINANCIALS - 0.1% |
Capital Markets - 0.0% |
Affiliated Managers Group, Inc. 6.375% | 40,180 | | 1,025 |
Commercial Banks - 0.0% |
U.S. Bancorp Series F, 6.50% | 39,677 | | 1,177 |
Consumer Finance - 0.1% |
Ally Financial, Inc. 7.00% (h) | 11,951 | | 10,786 |
Diversified Financial Services - 0.0% |
GMAC Capital Trust I Series 2, 8.125% | 377,872 | | 9,379 |
TOTAL FINANCIALS | | 22,367 |
TOTAL NONCONVERTIBLE PREFERRED STOCKS | | 59,964 |
TOTAL PREFERRED STOCKS (Cost $105,416) |
120,860
|
Investment Companies - 0.0% |
| | | |
2010 Swift Mandatory Common Exchange Security Trust (h)
(Cost $1,989) | 180,800 | |
1,509
|
Corporate Bonds - 11.3% |
| Principal Amount (000s) | | Value (000s) |
Convertible Bonds - 0.2% |
CONSUMER DISCRETIONARY - 0.0% |
Media - 0.0% |
Liberty Media Corp.: | | | | |
3.5% 1/15/31 | | $ 384 | | $ 279 |
3.5% 1/15/31 (h) | | 2,838 | | 2,063 |
| | 2,342 |
ENERGY - 0.0% |
Oil, Gas & Consumable Fuels - 0.0% |
Chesapeake Energy Corp. 2.75% 11/15/35 | | 3,700 | | 3,460 |
Massey Energy Co. 3.25% 8/1/15 | | 3,610 | | 3,240 |
| | 6,700 |
INDUSTRIALS - 0.1% |
Building Products - 0.1% |
Aspen Aerogels, Inc.: | | | | |
8% 6/1/14 (q) | | 10,000 | | 10,000 |
8% 12/6/14 (q) | | 3,000 | | 3,000 |
| | 13,000 |
MATERIALS - 0.1% |
Construction Materials - 0.0% |
Headwaters, Inc. 2.5% 2/1/14 | | 4,920 | | 4,723 |
Metals & Mining - 0.1% |
Ivanplats Ltd. 8% 11/10/14 pay-in-kind (m)(q) | | 11,883 | | 12,324 |
TOTAL MATERIALS | | 17,047 |
TOTAL CONVERTIBLE BONDS | | 39,089 |
Nonconvertible Bonds - 11.1% |
CONSUMER DISCRETIONARY - 1.5% |
Auto Components - 0.1% |
Delphi Corp.: | | | | |
5.875% 5/15/19 | | 1,820 | | 1,952 |
6.125% 5/15/21 | | 1,690 | | 1,859 |
Corporate Bonds - continued |
| Principal Amount (000s) | | Value (000s) |
Nonconvertible Bonds - continued |
CONSUMER DISCRETIONARY - continued |
Auto Components - continued |
International Automotive Components Group SA 9.125% 6/1/18 (h) | | $ 1,110 | | $ 1,066 |
Tenneco, Inc. 6.875% 12/15/20 | | 2,415 | | 2,632 |
| | 7,509 |
Automobiles - 0.2% |
Daimler Finance North America LLC 1.65% 4/10/15 (h) | | 17,102 | | 17,323 |
Ford Motor Co.: | | | | |
6.375% 2/1/29 | | 2,190 | | 2,366 |
6.625% 10/1/28 | | 2,510 | | 2,804 |
7.45% 7/16/31 | | 2,335 | | 2,884 |
General Motors Corp.: | | | | |
6.75% 5/1/28 (d) | | 390 | | 0 |
7.125% 7/15/13 (d) | | 1,135 | | 0 |
7.2% 1/15/11 (d) | | 2,855 | | 0 |
7.4% 9/1/25 (d) | | 195 | | 0 |
7.7% 4/15/16 (d) | | 705 | | 0 |
8.25% 7/15/23 (d) | | 5,475 | | 0 |
8.375% 7/15/33 (d) | | 16,800 | | 0 |
Jaguar Holding Co. II/Jaguar Merger Sub, Inc. 9.5% 12/1/19 (h) | | 490 | | 546 |
Volkswagen International Finance NV 2.375% 3/22/17 (h) | | 17,000 | | 17,558 |
| | 43,481 |
Distributors - 0.0% |
Ferrellgas LP/Ferrellgas Finance Corp. 6.5% 5/1/21 | | 1,745 | | 1,701 |
Diversified Consumer Services - 0.0% |
ServiceMaster Co. 10.75% 7/15/15 pay-in-kind (h)(m) | | 4,954 | | 5,085 |
Hotels, Restaurants & Leisure - 0.2% |
American Casino & Entertainment Properties LLC 11% 6/15/14 | | 2,780 | | 2,905 |
Boyd Acquisition Sub LLC/Boyd Acquisition Finance Corp. 8.375% 2/15/18 (h) | | 325 | | 332 |
Caesars Operating Escrow LLC/Caesars Escrow Corp.: | | | | |
8.5% 2/15/20 (h) | | 6,365 | | 6,254 |
9% 2/15/20 (h) | | 1,765 | | 1,758 |
Chester Downs & Marina LLC 9.25% 2/1/20 (h) | | 435 | | 442 |
Choice Hotels International, Inc. 5.75% 7/1/22 | | 390 | | 417 |
Corporate Bonds - continued |
| Principal Amount (000s) | | Value (000s) |
Nonconvertible Bonds - continued |
CONSUMER DISCRETIONARY - continued |
Hotels, Restaurants & Leisure - continued |
Chukchansi Economic Development Authority 9.75% 5/30/20 (h) | | $ 2,878 | | $ 2,072 |
Graton Economic Development Authority 9.625% 9/1/19 (h) | | 1,065 | | 1,100 |
MCE Finance Ltd. 10.25% 5/15/18 | | 1,695 | | 1,932 |
MGM Mirage, Inc.: | | | | |
5.875% 2/27/14 | | 2,998 | | 3,110 |
6.75% 4/1/13 | | 80 | | 82 |
7.5% 6/1/16 | | 2,855 | | 2,983 |
9% 3/15/20 | | 1,770 | | 1,982 |
13% 11/15/13 | | 5,000 | | 5,669 |
MTR Gaming Group, Inc. 11.5% 8/1/19 pay-in-kind | | 17 | | 17 |
NAI Entertainment Holdings LLC/NAI Entertainment Finance Corp. 8.25% 12/15/17 (h) | | 954 | | 1,064 |
Pinnacle Entertainment, Inc. 7.75% 4/1/22 | | 450 | | 485 |
Shingle Springs Tribal Gaming Authority 9.375% 6/15/15 (h) | | 2,270 | | 1,856 |
Station Casinos LLC 3.66% 6/18/18 (e)(h) | | 6,335 | | 5,353 |
Sugarhouse HSP Gaming Prop Mezz LP/Sugarhouse HSP Gaming Finance Corp. 8.625% 4/15/16 (h) | | 220 | | 234 |
Waterford Gaming LLC/Waterford Gaming Finance Corp. 8.625% 9/15/14 (h) | | 1,080 | | 410 |
| | 40,457 |
Household Durables - 0.1% |
KB Home: | | | | |
7.5% 9/15/22 | | 1,960 | | 2,024 |
8% 3/15/20 | | 410 | | 442 |
Reynolds Group Issuer, Inc./Reynolds Group Issuer LLC/Reynolds Group Issuer (Luxembourg) SA: | | | | |
7.875% 8/15/19 | | 8,325 | | 9,262 |
8.25% 2/15/21 | | 1,485 | | 1,459 |
9% 4/15/19 | | 835 | | 849 |
Standard Pacific Corp. 8.375% 1/15/21 | | 820 | | 912 |
| | 14,948 |
Leisure Equipment & Products - 0.0% |
FGI Operating Co. LLC/FGI Finance, Inc. 7.875% 5/1/20 (h) | | 625 | | 674 |
Corporate Bonds - continued |
| Principal Amount (000s) | | Value (000s) |
Nonconvertible Bonds - continued |
CONSUMER DISCRETIONARY - continued |
Media - 0.8% |
AMC Networks, Inc. 7.75% 7/15/21 | | $ 340 | | $ 384 |
Bresnan Broadband Holdings LLC 8% 12/15/18 (h) | | 875 | | 928 |
CCO Holdings LLC/CCO Holdings Capital Corp. 8.125% 4/30/20 | | 3,485 | | 3,921 |
Cequel Communications Holdings I LLC/Cequel Capital Corp. 8.625% 11/15/17 (h) | | 630 | | 676 |
Charter Communications Holdings II LLC/Charter Communications Holdings II Capital Corp. 13.5% 11/30/16 | | 15,996 | | 17,515 |
Checkout Holding Corp. 0% 11/15/15 (h) | | 1,290 | | 787 |
Clear Channel Communications, Inc.: | | | | |
5.5% 9/15/14 | | 2,355 | | 2,025 |
5.5% 12/15/16 | | 1,330 | | 652 |
Clear Channel Worldwide Holdings, Inc.: | | | | |
7.625% 3/15/20 | | 585 | | 559 |
7.625% 3/15/20 | | 4,105 | | 3,982 |
Comcast Corp.: | | | | |
4.65% 7/15/42 | | 7,267 | | 7,761 |
5.15% 3/1/20 | | 595 | | 709 |
6.4% 3/1/40 | | 4,017 | | 5,286 |
COX Communications, Inc. 4.625% 6/1/13 | | 2,632 | | 2,711 |
Discovery Communications LLC: | | | | |
3.7% 6/1/15 | | 3,557 | | 3,813 |
6.35% 6/1/40 | | 3,224 | | 4,148 |
DISH DBS Corp.: | | | | |
5.875% 7/15/22 (h) | | 2,655 | | 2,675 |
6.75% 6/1/21 | | 3,515 | | 3,752 |
EchoStar Communications Corp. 6.625% 10/1/14 | | 3,000 | | 3,244 |
Gray Television, Inc. 10.5% 6/29/15 | | 990 | | 1,067 |
Lamar Media Corp.: | | | | |
5.875% 2/1/22 | | 525 | | 557 |
7.875% 4/15/18 | | 1,400 | | 1,547 |
National CineMedia LLC: | | | | |
6% 4/15/22 (h) | | 2,600 | | 2,704 |
7.875% 7/15/21 | | 1,380 | | 1,487 |
NBCUniversal Media LLC: | | | | |
5.15% 4/30/20 | | 4,917 | | 5,807 |
6.4% 4/30/40 | | 4,249 | | 5,514 |
News America Holdings, Inc. 7.75% 12/1/45 | | 7,312 | | 9,943 |
Corporate Bonds - continued |
| Principal Amount (000s) | | Value (000s) |
Nonconvertible Bonds - continued |
CONSUMER DISCRETIONARY - continued |
Media - continued |
News America, Inc. 6.15% 2/15/41 | | $ 7,234 | | $ 8,902 |
Nexstar Broadcasting, Inc.: | | | | |
7% 1/15/14 | | 196 | | 194 |
7% 1/15/14 pay-in-kind | | 6,023 | | 5,963 |
Nielsen Finance LLC/Nielsen Finance Co.: | | | | |
7.75% 10/15/18 | | 3,165 | | 3,537 |
11.5% 5/1/16 | | 1,947 | | 2,181 |
11.625% 2/1/14 | | 1,171 | | 1,329 |
Radio One, Inc. 12.5% 5/24/16 pay-in-kind (m) | | 4,567 | | 3,888 |
Satelites Mexicanos SA de CV 9.5% 5/15/17 | | 475 | | 489 |
Sheridan Group, Inc. 12.5% 4/15/14 | | 1,775 | | 1,473 |
Time Warner Cable, Inc.: | | | | |
4.5% 9/15/42 | | 4,447 | | 4,428 |
5.5% 9/1/41 | | 11,225 | | 12,724 |
6.2% 7/1/13 | | 2,154 | | 2,253 |
6.75% 7/1/18 | | 1,087 | | 1,360 |
Time Warner, Inc.: | | | | |
5.375% 10/15/41 | | 1,539 | | 1,760 |
5.875% 11/15/16 | | 3,112 | | 3,685 |
6.2% 3/15/40 | | 2,618 | | 3,218 |
6.5% 11/15/36 | | 2,633 | | 3,293 |
Unitymedia Hessen GmbH & Co. KG/Unitymedia NRW GmbH 7.5% 3/15/19 (h) | | 480 | | 526 |
UPCB Finance VI Ltd. 6.875% 1/15/22 (h) | | 1,250 | | 1,319 |
Videotron Ltd. 9.125% 4/15/18 | | 5,565 | | 6,066 |
WMG Acquisition Corp. 9.5% 6/15/16 | | 515 | | 563 |
| | 163,305 |
Multiline Retail - 0.0% |
Dollar General Corp. 4.125% 7/15/17 | | 1,545 | | 1,599 |
Specialty Retail - 0.1% |
Asbury Automotive Group, Inc. 8.375% 11/15/20 | | 565 | | 620 |
Claire's Stores, Inc. 9% 3/15/19 (h) | | 3,085 | | 3,208 |
PETCO Animal Supplies, Inc. 9.25% 12/1/18 (h) | | 3,260 | | 3,619 |
Sonic Automotive, Inc.: | | | | |
7% 7/15/22 (h) | | 885 | | 938 |
Corporate Bonds - continued |
| Principal Amount (000s) | | Value (000s) |
Nonconvertible Bonds - continued |
CONSUMER DISCRETIONARY - continued |
Specialty Retail - continued |
Sonic Automotive, Inc.: - continued | | | | |
9% 3/15/18 | | $ 1,000 | | $ 1,088 |
Staples, Inc. 7.375% 10/1/12 | | 757 | | 761 |
| | 10,234 |
TOTAL CONSUMER DISCRETIONARY | | 288,993 |
CONSUMER STAPLES - 0.6% |
Beverages - 0.1% |
Beam, Inc.: | | | | |
1.875% 5/15/17 | | 1,113 | | 1,137 |
3.25% 5/15/22 | | 1,319 | | 1,368 |
Constellation Brands, Inc. 4.625% 3/1/23 | | 675 | | 686 |
Diageo Capital PLC 5.2% 1/30/13 | | 3,201 | | 3,263 |
FBG Finance Ltd. 5.125% 6/15/15 (h) | | 2,722 | | 3,009 |
Fortune Brands, Inc.: | | | | |
5.375% 1/15/16 | | 1,682 | | 1,916 |
5.875% 1/15/36 | | 3,442 | | 4,118 |
6.375% 6/15/14 | | 446 | | 488 |
SABMiller Holdings, Inc. 3.75% 1/15/22 (h) | | 4,522 | | 4,907 |
| | 20,892 |
Food & Staples Retailing - 0.1% |
Reddy Ice Corp. 11.25% 3/15/15 | | 3,895 | | 3,876 |
Rite Aid Corp.: | | | | |
7.5% 3/1/17 | | 12,125 | | 12,458 |
9.25% 3/15/20 | | 1,330 | | 1,367 |
10.375% 7/15/16 | | 5,420 | | 5,718 |
| | 23,419 |
Food Products - 0.1% |
Cargill, Inc. 6% 11/27/17 (h) | | 417 | | 507 |
Kraft Foods, Inc.: | | | | |
6.5% 2/9/40 | | 2,975 | | 4,104 |
6.75% 2/19/14 | | 318 | | 346 |
Post Holdings, Inc. 7.375% 2/15/22 (h) | | 1,280 | | 1,347 |
| | 6,304 |
Personal Products - 0.0% |
Prestige Brands, Inc. 8.125% 2/1/20 | | 220 | | 243 |
Corporate Bonds - continued |
| Principal Amount (000s) | | Value (000s) |
Nonconvertible Bonds - continued |
CONSUMER STAPLES - continued |
Tobacco - 0.3% |
Altria Group, Inc.: | | | | |
2.85% 8/9/22 | | $ 4,020 | | $ 4,009 |
4.25% 8/9/42 | | 4,020 | | 3,929 |
9.7% 11/10/18 | | 14,772 | | 21,209 |
Philip Morris International, Inc. 1.125% 8/21/17 | | 21,321 | | 21,282 |
Reynolds American, Inc.: | | | | |
6.75% 6/15/17 | | 2,746 | | 3,327 |
7.25% 6/15/37 | | 6,101 | | 7,825 |
| | 61,581 |
TOTAL CONSUMER STAPLES | | 112,439 |
ENERGY - 1.2% |
Energy Equipment & Services - 0.2% |
Atwood Oceanics, Inc. 6.5% 2/1/20 | | 320 | | 342 |
DCP Midstream LLC: | | | | |
4.75% 9/30/21 (h) | | 5,340 | | 5,662 |
5.35% 3/15/20 (h) | | 5,028 | | 5,516 |
El Paso Pipeline Partners Operating Co. LLC: | | | | |
4.1% 11/15/15 | | 5,488 | | 5,791 |
5% 10/1/21 | | 2,280 | | 2,492 |
6.5% 4/1/20 | | 1,008 | | 1,189 |
Gulfmark Offshore, Inc. 6.375% 3/15/22 (h) | | 365 | | 373 |
Offshore Group Investment Ltd. 11.5% 8/1/15 | | 5,745 | | 6,363 |
Oil States International, Inc. 6.5% 6/1/19 | | 1,420 | | 1,509 |
Precision Drilling Corp.: | | | | |
6.5% 12/15/21 | | 315 | | 331 |
6.625% 11/15/20 | | 1,580 | | 1,663 |
Pride International, Inc. 6.875% 8/15/20 | | 1,355 | | 1,711 |
Transocean, Inc.: | | | | |
5.05% 12/15/16 | | 3,719 | | 4,120 |
6.375% 12/15/21 | | 4,911 | | 5,920 |
Unit Corp. 6.625% 5/15/21 (h) | | 4,515 | | 4,583 |
Weatherford International Ltd.: | | | | |
4.95% 10/15/13 | | 1,614 | | 1,681 |
5.15% 3/15/13 | | 2,110 | | 2,155 |
| | 51,401 |
Corporate Bonds - continued |
| Principal Amount (000s) | | Value (000s) |
Nonconvertible Bonds - continued |
ENERGY - continued |
Oil, Gas & Consumable Fuels - 1.0% |
Alpha Natural Resources, Inc.: | | | | |
6% 6/1/19 | | $ 1,735 | | $ 1,557 |
6.25% 6/1/21 | | 1,675 | | 1,503 |
Anadarko Petroleum Corp.: | | | | |
5.95% 9/15/16 | | 663 | | 767 |
6.375% 9/15/17 | | 9,475 | | 11,331 |
ATP Oil & Gas Corp. 11.875% 5/1/15 (d) | | 5,655 | | 1,470 |
Canadian Natural Resources Ltd. 5.15% 2/1/13 | | 1,519 | | 1,547 |
Continental Resources, Inc. 5% 9/15/22 | | 2,690 | | 2,784 |
Crestwood Midstream Partners LP / Finance Corp. 7.75% 4/1/19 | | 860 | | 873 |
Denbury Resources, Inc. 8.25% 2/15/20 | | 1,973 | | 2,239 |
Duke Capital LLC 6.25% 2/15/13 | | 589 | | 603 |
Duke Energy Field Services: | | | | |
5.375% 10/15/15 (h) | | 1,133 | | 1,219 |
6.45% 11/3/36 (h) | | 3,753 | | 4,333 |
El Paso Natural Gas Co. 5.95% 4/15/17 | | 867 | | 993 |
Enbridge Energy Partners LP 4.2% 9/15/21 | | 6,329 | | 6,757 |
Encana Holdings Finance Corp. 5.8% 5/1/14 | | 2,678 | | 2,878 |
Enterprise Products Operating LP: | | | | |
5.6% 10/15/14 | | 660 | | 723 |
5.65% 4/1/13 | | 410 | | 420 |
EP Energy LLC/Everest Acquisition Finance, Inc. 7.75% 9/1/22 (h) | | 885 | | 885 |
EV Energy Partners LP/EV Energy Finance Corp. 8% 4/15/19 | | 1,715 | | 1,771 |
Forest Oil Corp. 7.25% 6/15/19 | | 1,670 | | 1,637 |
Gulfstream Natural Gas System LLC 6.95% 6/1/16 (h) | | 302 | | 353 |
Kodiak Oil & Gas Corp. 8.125% 12/1/19 (h) | | 1,325 | | 1,401 |
LINN Energy LLC/LINN Energy Finance Corp.: | | | | |
6.25% 11/1/19 (h) | | 3,855 | | 3,807 |
6.5% 5/15/19 (h) | | 1,820 | | 1,815 |
Magnum Hunter Resources Corp. 9.75% 5/15/20 (h) | | 2,455 | | 2,424 |
Marathon Petroleum Corp. 5.125% 3/1/21 | | 3,001 | | 3,451 |
Markwest Energy Partners LP/Markwest Energy Finance Corp. 5.5% 2/15/23 | | 610 | | 624 |
Midcontinent Express Pipeline LLC 5.45% 9/15/14 (h) | | 1,140 | | 1,176 |
Motiva Enterprises LLC: | | | | |
5.75% 1/15/20 (h) | | 2,578 | | 3,089 |
Corporate Bonds - continued |
| Principal Amount (000s) | | Value (000s) |
Nonconvertible Bonds - continued |
ENERGY - continued |
Oil, Gas & Consumable Fuels - continued |
Motiva Enterprises LLC: - continued | | | | |
6.85% 1/15/40 (h) | | $ 2,906 | | $ 3,832 |
Nakilat, Inc. 6.067% 12/31/33 (h) | | 1,839 | | 2,175 |
Nexen, Inc. 5.2% 3/10/15 | | 842 | | 916 |
PBF Holding Co. LLC/PBF Finance Corp. 8.25% 2/15/20 (h) | | 4,420 | | 4,641 |
Penn Virginia Resource Partners LP/Penn Virginia Finance Corp. 8.375% 6/1/20 (h) | | 1,025 | | 1,043 |
Petrobras International Finance Co. Ltd.: | | | | |
3.875% 1/27/16 | | 4,954 | | 5,202 |
7.875% 3/15/19 | | 5,564 | | 6,899 |
Petroleos Mexicanos: | | | | |
4.875% 1/24/22 (h) | | 2,315 | | 2,599 |
5.5% 1/21/21 | | 5,342 | | 6,237 |
5.5% 6/27/44 (h) | | 5,685 | | 6,182 |
6% 3/5/20 | | 879 | | 1,048 |
6.5% 6/2/41 (h) | | 7,225 | | 8,977 |
Petroleum Development Corp. 12% 2/15/18 | | 4,240 | | 4,558 |
Phillips 66: | | | | |
4.3% 4/1/22 (h) | | 5,053 | | 5,507 |
5.875% 5/1/42 (h) | | 4,552 | | 5,381 |
Plains All American Pipeline LP/PAA Finance Corp.: | | | | |
3.65% 6/1/22 | | 2,537 | | 2,682 |
3.95% 9/15/15 | | 137 | | 148 |
4.25% 9/1/12 | | 663 | | 663 |
6.125% 1/15/17 | | 1,880 | | 2,229 |
QR Energy LP/QRE Finance Corp. 9.25% 8/1/20 (h) | | 1,075 | | 1,086 |
Ras Laffan Liquefied Natural Gas Co. Ltd. III: | | | | |
4.5% 9/30/12 (h) | | 2,588 | | 2,588 |
5.5% 9/30/14 (h) | | 3,880 | | 4,181 |
5.832% 9/30/16 (h) | | 885 | | 965 |
6.332% 9/30/27 (h) | | 5,710 | | 6,752 |
6.75% 9/30/19 (h) | | 2,367 | | 2,935 |
Rockies Express Pipeline LLC 6.25% 7/15/13 (h) | | 2,522 | | 2,598 |
SandRidge Energy, Inc.: | | | | |
7.5% 3/15/21 (h) | | 895 | | 902 |
7.5% 2/15/23 (h) | | 2,390 | | 2,390 |
Ship Finance International Ltd. 8.5% 12/15/13 | | 10,070 | | 10,045 |
Southeast Supply Header LLC 4.85% 8/15/14 (h) | | 501 | | 527 |
Corporate Bonds - continued |
| Principal Amount (000s) | | Value (000s) |
Nonconvertible Bonds - continued |
ENERGY - continued |
Oil, Gas & Consumable Fuels - continued |
Spectra Energy Capital, LLC 5.65% 3/1/20 | | $ 421 | | $ 485 |
Spectra Energy Partners, LP: | | | | |
2.95% 6/15/16 | | 938 | | 957 |
4.6% 6/15/21 | | 1,227 | | 1,333 |
Suncor Energy, Inc. 6.1% 6/1/18 | | 7,256 | | 8,877 |
Talisman Energy, Inc. yankee 6.25% 2/1/38 | | 2,650 | | 3,134 |
Targa Resources Partners LP/Targa Resources Partners Finance Corp. 6.375% 8/1/22 (h) | | 760 | | 792 |
Texas Eastern Transmission LP 6% 9/15/17 (h) | | 948 | | 1,102 |
TransCapitalInvest Ltd. 5.67% 3/5/14 (h) | | 3,383 | | 3,578 |
Western Gas Partners LP 5.375% 6/1/21 | | 5,617 | | 6,238 |
| | 196,814 |
TOTAL ENERGY | | 248,215 |
FINANCIALS - 3.7% |
Capital Markets - 0.2% |
BlackRock, Inc. 3.375% 6/1/22 | | 3,208 | | 3,394 |
Goldman Sachs Group, Inc.: | | | | |
5.95% 1/18/18 | | 3,697 | | 4,159 |
6.15% 4/1/18 | | 1,544 | | 1,756 |
Lazard Group LLC: | | | | |
6.85% 6/15/17 | | 3,573 | | 4,031 |
7.125% 5/15/15 | | 1,276 | | 1,400 |
Merrill Lynch & Co., Inc.: | | | | |
6.11% 1/29/37 | | 4,229 | | 4,252 |
6.4% 8/28/17 | | 3,463 | | 3,935 |
Morgan Stanley: | | | | |
5.5% 7/28/21 | | 5,829 | | 5,980 |
5.625% 9/23/19 | | 1,659 | | 1,718 |
5.75% 1/25/21 | | 2,009 | | 2,076 |
7.3% 5/13/19 | | 4,941 | | 5,576 |
Penson Worldwide, Inc. 12.5% 5/15/17 (h) | | 1,700 | | 340 |
| | 38,617 |
Commercial Banks - 0.7% |
Bank of America NA 5.3% 3/15/17 | | 7,585 | | 8,257 |
BB&T Corp. 3.95% 3/22/22 | | 6,213 | | 6,710 |
Corporate Bonds - continued |
| Principal Amount (000s) | | Value (000s) |
Nonconvertible Bonds - continued |
FINANCIALS - continued |
Commercial Banks - continued |
CIT Group, Inc.: | | | | |
4.25% 8/15/17 | | $ 2,760 | | $ 2,781 |
4.75% 2/15/15 (h) | | 4,790 | | 4,982 |
5% 8/15/22 | | 2,195 | | 2,200 |
5.25% 3/15/18 | | 3,215 | | 3,352 |
5.375% 5/15/20 | | 2,805 | | 2,896 |
5.5% 2/15/19 (h) | | 5,285 | | 5,510 |
7% 5/2/17 (h) | | 3,593 | | 3,593 |
Credit Suisse New York Branch 6% 2/15/18 | | 10,887 | | 12,092 |
Discover Bank: | | | | |
7% 4/15/20 | | 2,816 | | 3,314 |
8.7% 11/18/19 | | 1,651 | | 2,090 |
Fifth Third Bancorp: | | | | |
4.5% 6/1/18 | | 418 | | 453 |
8.25% 3/1/38 | | 3,116 | | 4,356 |
Fifth Third Bank 4.75% 2/1/15 | | 680 | | 725 |
Fifth Third Capital Trust IV 6.5% 4/15/67 (m) | | 3,315 | | 3,315 |
HBOS PLC 6.75% 5/21/18 (h) | | 408 | | 403 |
HSBC Holdings PLC 4% 3/30/22 | | 4,891 | | 5,247 |
Huntington Bancshares, Inc. 7% 12/15/20 | | 1,364 | | 1,628 |
JPMorgan Chase Bank 6% 10/1/17 | | 1,942 | | 2,287 |
KeyBank NA: | | | | |
5.45% 3/3/16 | | 1,877 | | 2,099 |
5.8% 7/1/14 | | 4,250 | | 4,555 |
Marshall & Ilsley Bank: | | | | |
4.85% 6/16/15 | | 2,431 | | 2,621 |
5% 1/17/17 | | 6,619 | | 7,420 |
5.25% 9/4/12 | | 1,524 | | 1,524 |
Regions Bank: | | | | |
6.45% 6/26/37 | | 6,957 | | 6,966 |
7.5% 5/15/18 | | 2,851 | | 3,321 |
Regions Financial Corp.: | | | | |
5.75% 6/15/15 | | 996 | | 1,058 |
7.75% 11/10/14 | | 4,550 | | 5,040 |
UnionBanCal Corp.: | | | | |
3.5% 6/18/22 | | 5,000 | | 5,283 |
5.25% 12/16/13 | | 614 | | 643 |
Wachovia Corp.: | | | | |
5.625% 10/15/16 | | 3,151 | | 3,628 |
Corporate Bonds - continued |
| Principal Amount (000s) | | Value (000s) |
Nonconvertible Bonds - continued |
FINANCIALS - continued |
Commercial Banks - continued |
Wachovia Corp.: - continued | | | | |
5.75% 6/15/17 | | $ 1,728 | | $ 2,062 |
Wells Fargo & Co. 3.676% 6/15/16 | | 2,210 | | 2,404 |
| | 124,815 |
Consumer Finance - 0.7% |
Ally Financial, Inc.: | | | | |
4.625% 6/26/15 | | 2,540 | | 2,607 |
5.5% 2/15/17 | | 5,165 | | 5,346 |
6.25% 12/1/17 | | 1,800 | | 1,935 |
Capital One Financial Corp. 2.15% 3/23/15 | | 16,867 | | 17,275 |
Discover Financial Services: | | | | |
5.2% 4/27/22 | | 1,155 | | 1,228 |
6.45% 6/12/17 | | 9,507 | | 10,771 |
Ford Motor Credit Co. LLC: | | | | |
2.5% 1/15/16 | | 14,000 | | 14,004 |
4.25% 2/3/17 | | 8,050 | | 8,424 |
5.75% 2/1/21 | | 4,130 | | 4,481 |
5.875% 8/2/21 | | 2,820 | | 3,114 |
8.125% 1/15/20 | | 5,000 | | 6,191 |
General Electric Capital Corp. 5.625% 9/15/17 | | 17,812 | | 21,050 |
General Motors Acceptance Corp. 8% 11/1/31 | | 2,400 | | 2,849 |
GMAC LLC: | | | | |
6.75% 12/1/14 | | 2,355 | | 2,532 |
8% 12/31/18 | | 5,795 | | 6,519 |
8% 11/1/31 | | 19,161 | | 22,610 |
HSBC USA, Inc. 2.375% 2/13/15 | | 6,639 | | 6,803 |
SLM Corp.: | | | | |
8% 3/25/20 | | 510 | | 574 |
8.45% 6/15/18 | | 2,250 | | 2,599 |
| | 140,912 |
Diversified Financial Services - 0.8% |
Bank of America Corp.: | | | | |
3.875% 3/22/17 | | 6,857 | | 7,225 |
5.65% 5/1/18 | | 3,745 | | 4,184 |
5.7% 1/24/22 | | 10,579 | | 11,971 |
5.75% 12/1/17 | | 6,120 | | 6,844 |
5.875% 2/7/42 | | 6,365 | | 7,233 |
7.375% 5/15/14 | | 26 | | 28 |
Corporate Bonds - continued |
| Principal Amount (000s) | | Value (000s) |
Nonconvertible Bonds - continued |
FINANCIALS - continued |
Diversified Financial Services - continued |
BP Capital Markets PLC: | | | | |
3.625% 5/8/14 | | $ 3,296 | | $ 3,460 |
4.5% 10/1/20 | | 888 | | 1,034 |
4.742% 3/11/21 | | 4,210 | | 4,943 |
Calpine Construction Finance Co. LP 8% 6/1/16 (h) | | 6,880 | | 7,430 |
Capital One Capital V 10.25% 8/15/39 | | 4,185 | | 4,311 |
CEVA Group PLC 8.375% 12/1/17 (h) | | 2,350 | | 2,285 |
Citigroup, Inc.: | | | | |
2.25% 8/7/15 | | 10,000 | | 10,087 |
3.953% 6/15/16 | | 5,674 | | 5,985 |
4.75% 5/19/15 | | 9,415 | | 10,107 |
6.125% 5/15/18 | | 1,423 | | 1,651 |
6.5% 8/19/13 | | 14,217 | | 14,952 |
Everest Acquisition LLC / Everest Acquisition Finance, Inc.: | | | | |
6.875% 5/1/19 (h) | | 1,540 | | 1,656 |
9.375% 5/1/20 (h) | | 6,040 | | 6,553 |
General Motors Financial Co., Inc.: | | | | |
4.75% 8/15/17 (h) | | 8,705 | | 8,727 |
6.75% 6/1/18 | | 6,765 | | 7,442 |
Icahn Enterprises LP/Icahn Enterprises Finance Corp.: | | | | |
7.75% 1/15/16 | | 7,625 | | 8,006 |
8% 1/15/18 (h) | | 1,015 | | 1,078 |
JPMorgan Chase & Co. 3.15% 7/5/16 | | 7,615 | | 8,063 |
Landry's Acquisition Co. 9.375% 5/1/20 (h) | | 875 | | 919 |
NSG Holdings II, LLC 7.75% 12/15/25 (h) | | 5,023 | | 5,123 |
TECO Finance, Inc.: | | | | |
4% 3/15/16 | | 1,242 | | 1,347 |
5.15% 3/15/20 | | 1,894 | | 2,208 |
TransUnion Holding Co., Inc. 9.625% 6/15/18 pay-in-kind (h)(m) | | 810 | | 879 |
UPCB Finance III Ltd. 6.625% 7/1/20 (h) | | 2,150 | | 2,241 |
Wind Acquisition Holdings Finance SA 12.25% 7/15/17 pay-in-kind (h)(m) | | 3,664 | | 2,507 |
| | 160,479 |
Insurance - 0.6% |
American International Group, Inc.: | | | | |
2.375% 8/24/15 | | 14,000 | | 14,025 |
Corporate Bonds - continued |
| Principal Amount (000s) | | Value (000s) |
Nonconvertible Bonds - continued |
FINANCIALS - continued |
Insurance - continued |
American International Group, Inc.: - continued | | | | |
4.875% 6/1/22 | | $ 3,800 | | $ 4,145 |
Aon Corp.: | | | | |
3.125% 5/27/16 | | 3,111 | | 3,286 |
3.5% 9/30/15 | | 2,415 | | 2,546 |
Axis Capital Holdings Ltd. 5.75% 12/1/14 | | 329 | | 354 |
Great-West Life & Annuity Insurance Co. 7.153% 5/16/46 (h)(m) | | 1,381 | | 1,409 |
Hartford Financial Services Group, Inc.: | | | | |
5.125% 4/15/22 | | 9,707 | | 10,440 |
5.375% 3/15/17 | | 265 | | 290 |
6.625% 4/15/42 | | 8,421 | | 9,481 |
HUB International Holdings, Inc. 9% 12/15/14 (h) | | 3,710 | | 3,766 |
Liberty Mutual Group, Inc.: | | | | |
5% 6/1/21 (h) | | 6,063 | | 6,368 |
6.5% 3/15/35 (h) | | 1,064 | | 1,142 |
Marsh & McLennan Companies, Inc. 4.8% 7/15/21 | | 3,209 | | 3,605 |
Massachusetts Mutual Life Insurance Co. 5.375% 12/1/41 (h) | | 2,993 | | 3,413 |
MetLife, Inc.: | | | | |
5% 6/15/15 | | 686 | | 762 |
6.75% 6/1/16 | | 3,874 | | 4,633 |
Metropolitan Life Global Funding I: | | | | |
5.125% 4/10/13 (h) | | 329 | | 338 |
5.125% 6/10/14 (h) | | 3,462 | | 3,722 |
Monumental Global Funding III 5.5% 4/22/13 (h) | | 2,041 | | 2,090 |
Northwestern Mutual Life Insurance Co. 6.063% 3/30/40 (h) | | 3,585 | | 4,616 |
Pacific Life Insurance Co. 9.25% 6/15/39 (h) | | 2,499 | | 3,403 |
Pacific LifeCorp 6% 2/10/20 (h) | | 4,423 | | 4,925 |
Prudential Financial, Inc.: | | | | |
3.875% 1/14/15 | | 2,500 | | 2,651 |
5.15% 1/15/13 | | 2,369 | | 2,407 |
6.2% 11/15/40 | | 2,076 | | 2,448 |
7.375% 6/15/19 | | 1,880 | | 2,367 |
Symetra Financial Corp. 6.125% 4/1/16 (h) | | 4,684 | | 5,096 |
Unum Group: | | | | |
5.625% 9/15/20 | | 2,719 | | 3,003 |
5.75% 8/15/42 | | 4,577 | | 4,719 |
Corporate Bonds - continued |
| Principal Amount (000s) | | Value (000s) |
Nonconvertible Bonds - continued |
FINANCIALS - continued |
Insurance - continued |
Unum Group: - continued | | | | |
7.125% 9/30/16 | | $ 803 | | $ 935 |
USI Holdings Corp. 4.3095% 11/15/14 (h)(m) | | 2,920 | | 2,789 |
| | 115,174 |
Real Estate Investment Trusts - 0.3% |
Alexandria Real Estate Equities, Inc. 4.6% 4/1/22 | | 1,614 | | 1,701 |
AvalonBay Communities, Inc. 4.95% 3/15/13 | | 216 | | 220 |
Boston Properties, Inc. 3.85% 2/1/23 | | 3,642 | | 3,813 |
BRE Properties, Inc. 5.5% 3/15/17 | | 903 | | 1,025 |
Camden Property Trust: | | | | |
5.375% 12/15/13 | | 2,150 | | 2,257 |
5.875% 11/30/12 | | 395 | | 400 |
DDR Corp. 4.625% 7/15/22 | | 1,932 | | 2,004 |
Developers Diversified Realty Corp.: | | | | |
4.75% 4/15/18 | | 4,456 | | 4,776 |
7.5% 4/1/17 | | 3,456 | | 4,046 |
Duke Realty LP: | | | | |
4.375% 6/15/22 | | 3,030 | | 3,167 |
4.625% 5/15/13 | | 741 | | 756 |
5.4% 8/15/14 | | 596 | | 636 |
5.5% 3/1/16 | | 2,930 | | 3,213 |
6.75% 3/15/20 | | 517 | | 623 |
8.25% 8/15/19 | | 1,710 | | 2,163 |
Equity One, Inc.: | | | | |
5.375% 10/15/15 | | 672 | | 725 |
6% 9/15/17 | | 522 | | 581 |
6.25% 12/15/14 | | 924 | | 1,002 |
6.25% 1/15/17 | | 291 | | 325 |
Federal Realty Investment Trust: | | | | |
5.4% 12/1/13 | | 257 | | 270 |
5.9% 4/1/20 | | 1,287 | | 1,541 |
6.2% 1/15/17 | | 365 | | 425 |
HCP, Inc. 3.15% 8/1/22 | | 8,000 | | 7,811 |
Health Care REIT, Inc. 4.125% 4/1/19 | | 11,300 | | 11,889 |
HRPT Properties Trust: | | | | |
5.75% 11/1/15 | | 1,241 | | 1,304 |
6.25% 6/15/17 | | 726 | | 797 |
6.65% 1/15/18 | | 490 | | 544 |
Corporate Bonds - continued |
| Principal Amount (000s) | | Value (000s) |
Nonconvertible Bonds - continued |
FINANCIALS - continued |
Real Estate Investment Trusts - continued |
Omega Healthcare Investors, Inc.: | | | | |
5.875% 3/15/24 (h) | | $ 3,200 | | $ 3,424 |
6.75% 10/15/22 | | 1,885 | | 2,078 |
Washington (REIT) 5.25% 1/15/14 | | 440 | | 459 |
| | 63,975 |
Real Estate Management & Development - 0.4% |
AMB Property LP 5.9% 8/15/13 | | 1,520 | | 1,574 |
BioMed Realty LP: | | | | |
3.85% 4/15/16 | | 5,000 | | 5,226 |
4.25% 7/15/22 | | 2,511 | | 2,621 |
6.125% 4/15/20 | | 1,703 | | 1,987 |
Brandywine Operating Partnership LP 5.7% 5/1/17 | | 119 | | 130 |
CB Richard Ellis Services, Inc. 6.625% 10/15/20 | | 900 | | 981 |
Digital Realty Trust LP: | | | | |
4.5% 7/15/15 | | 2,465 | | 2,611 |
5.25% 3/15/21 | | 2,876 | | 3,177 |
ERP Operating LP: | | | | |
4.625% 12/15/21 | | 10,720 | | 12,295 |
4.75% 7/15/20 | | 3,638 | | 4,121 |
5.5% 10/1/12 | | 279 | | 280 |
5.75% 6/15/17 | | 1,446 | | 1,704 |
Host Hotels & Resorts LP 4.75% 3/1/23 | | 1,290 | | 1,322 |
Liberty Property LP: | | | | |
4.125% 6/15/22 | | 2,599 | | 2,697 |
4.75% 10/1/20 | | 5,547 | | 6,044 |
5.125% 3/2/15 | | 951 | | 1,022 |
5.5% 12/15/16 | | 1,396 | | 1,566 |
Mack-Cali Realty LP: | | | | |
4.5% 4/18/22 | | 1,598 | | 1,694 |
7.75% 8/15/19 | | 957 | | 1,176 |
Post Apartment Homes LP 6.3% 6/1/13 | | 2,240 | | 2,304 |
Prime Property Funding, Inc.: | | | | |
5.125% 6/1/15 (h) | | 1,703 | | 1,737 |
5.5% 1/15/14 (h) | | 644 | | 660 |
5.7% 4/15/17 (h) | | 1,572 | | 1,644 |
Realogy Corp.: | | | | |
7.875% 2/15/19 (h) | | 1,885 | | 1,942 |
9% 1/15/20 (h) | | 1,170 | | 1,258 |
Corporate Bonds - continued |
| Principal Amount (000s) | | Value (000s) |
Nonconvertible Bonds - continued |
FINANCIALS - continued |
Real Estate Management & Development - continued |
Regency Centers LP: | | | | |
4.95% 4/15/14 | | $ 360 | | $ 378 |
5.25% 8/1/15 | | 1,257 | | 1,368 |
5.875% 6/15/17 | | 639 | | 734 |
Simon Property Group LP: | | | | |
4.2% 2/1/15 | | 1,785 | | 1,904 |
6.75% 5/15/14 | | 4,302 | | 4,653 |
Tanger Properties LP: | | | | |
6.125% 6/1/20 | | 6,753 | | 8,014 |
6.15% 11/15/15 | | 873 | | 975 |
| | 79,799 |
TOTAL FINANCIALS | | 723,771 |
HEALTH CARE - 0.7% |
Biotechnology - 0.1% |
Amgen, Inc. 5.15% 11/15/41 | | 14,179 | | 15,506 |
Celgene Corp. 2.45% 10/15/15 | | 838 | | 867 |
| | 16,373 |
Health Care Equipment & Supplies - 0.0% |
Aviv Healthcare Properties LP/Aviv Healthcare Capital Corp. 7.75% 2/15/19 | | 2,945 | | 3,078 |
Hologic, Inc. 6.25% 8/1/20 (h) | | 1,490 | | 1,578 |
Teleflex, Inc. 6.875% 6/1/19 | | 1,665 | | 1,782 |
| | 6,438 |
Health Care Providers & Services - 0.6% |
Aristotle Holding, Inc.: | | | | |
4.75% 11/15/21 (h) | | 9,101 | | 10,504 |
6.125% 11/15/41 (h) | | 4,534 | | 5,915 |
Community Health Systems, Inc.: | | | | |
5.125% 8/15/18 | | 1,275 | | 1,315 |
7.125% 7/15/20 | | 1,305 | | 1,364 |
Coventry Health Care, Inc.: | | | | |
5.95% 3/15/17 | | 1,030 | | 1,205 |
6.3% 8/15/14 | | 2,132 | | 2,311 |
DaVita, Inc.: | | | | |
5.75% 8/15/22 | | 1,215 | | 1,264 |
6.625% 11/1/20 | | 1,555 | | 1,664 |
Corporate Bonds - continued |
| Principal Amount (000s) | | Value (000s) |
Nonconvertible Bonds - continued |
HEALTH CARE - continued |
Health Care Providers & Services - continued |
Express Scripts, Inc.: | | | | |
3.125% 5/15/16 | | $ 4,847 | | $ 5,153 |
6.25% 6/15/14 | | 1,491 | | 1,629 |
Fresenius Medical Care US Finance II, Inc. 6.5% 9/15/18 (h) | | 665 | | 736 |
HCA Holdings, Inc. 7.75% 5/15/21 | | 13,495 | | 14,575 |
HCA, Inc.: | | | | |
5.875% 3/15/22 | | 5,645 | | 6,005 |
6.5% 2/15/20 | | 10,450 | | 11,443 |
7.5% 2/15/22 | | 3,250 | | 3,620 |
7.875% 2/15/20 | | 4,825 | | 5,368 |
9.875% 2/15/17 | | 551 | | 595 |
Legend Acquisition Sub, Inc. 10.75% 8/15/20 (h) | | 2,940 | | 2,903 |
Medco Health Solutions, Inc.: | | | | |
2.75% 9/15/15 | | 1,608 | | 1,682 |
4.125% 9/15/20 | | 3,728 | | 4,052 |
Multiplan, Inc. 9.875% 9/1/18 (h) | | 3,385 | | 3,715 |
Radiation Therapy Services, Inc. 8.875% 1/15/17 | | 1,240 | | 1,184 |
Rotech Healthcare, Inc. 10.5% 3/15/18 | | 960 | | 545 |
Rural/Metro Corp. 10.125% 7/15/19 (h) | | 995 | | 980 |
Sabra Health Care LP/Sabra Capital Corp.: | | | | |
8.125% 11/1/18 | | 655 | | 712 |
8.125% 11/1/18 (h) | | 895 | | 973 |
Surgical Care Affiliates LLC 8.875% 7/15/15 pay-in-kind (h)(m) | | 4,790 | | 4,874 |
Tenet Healthcare Corp.: | | | | |
8.875% 7/1/19 | | 4,610 | | 5,227 |
9.875% 7/1/14 | | 4,690 | | 5,159 |
10% 5/1/18 | | 5,002 | | 5,752 |
Vanguard Health Holding Co. II LLC / Vanguard Holding Co. II, Inc.: | | | | |
7.75% 2/1/19 | | 1,495 | | 1,551 |
7.75% 2/1/19 (h) | | 3,155 | | 3,273 |
Vanguard Health Systems, Inc. 0% 2/1/16 | | 97 | | 68 |
| | 117,316 |
Health Care Technology - 0.0% |
Emdeon, Inc. 11% 12/31/19 (h) | | 1,760 | | 2,006 |
Corporate Bonds - continued |
| Principal Amount (000s) | | Value (000s) |
Nonconvertible Bonds - continued |
HEALTH CARE - continued |
Pharmaceuticals - 0.0% |
Watson Pharmaceuticals, Inc. 5% 8/15/14 | | $ 984 | | $ 1,047 |
TOTAL HEALTH CARE | | 143,180 |
INDUSTRIALS - 0.8% |
Aerospace & Defense - 0.0% |
BAE Systems Holdings, Inc.: | | | | |
4.95% 6/1/14 (h) | | 781 | | 823 |
6.375% 6/1/19 (h) | | 3,650 | | 4,358 |
| | 5,181 |
Airlines - 0.1% |
Continental Airlines, Inc.: | | | | |
pass-thru trust certificates: | | | | |
8.388% 5/1/22 | | 60 | | 62 |
9.798% 4/1/21 | | 2,989 | | 3,213 |
6.648% 3/15/19 | | 2,077 | | 2,191 |
6.9% 7/2/19 | | 630 | | 681 |
7.339% 4/19/14 | | 894 | | 912 |
Delta Air Lines, Inc. 9.5% 9/15/14 (h) | | 770 | | 809 |
U.S. Airways pass-thru trust certificates: | | | | |
6.85% 1/30/18 | | 1,202 | | 1,256 |
8.36% 1/20/19 | | 994 | | 1,079 |
United Air Lines, Inc. 9.875% 8/1/13 (h) | | 888 | | 912 |
| | 11,115 |
Building Products - 0.1% |
Associated Materials LLC 9.125% 11/1/17 | | 465 | | 450 |
HD Supply, Inc.: | | | | |
8.125% 4/15/19 (h) | | 2,870 | | 3,121 |
11% 4/15/20 (h) | | 1,250 | | 1,375 |
Isabelle Acquisition Sub, Inc. 10% 11/15/18 pay-in-kind (h)(m) | | 330 | | 348 |
Ply Gem Industries, Inc. 8.25% 2/15/18 | | 3,300 | | 3,374 |
USG Corp. 7.875% 3/30/20 (h) | | 905 | | 963 |
| | 9,631 |
Commercial Services & Supplies - 0.3% |
ARAMARK Holdings Corp. 8.625% 5/1/16 pay-in-kind (h)(m) | | 2,045 | | 2,101 |
Casella Waste Systems, Inc. 11% 7/15/14 | | 1,015 | | 1,066 |
Corporate Bonds - continued |
| Principal Amount (000s) | | Value (000s) |
Nonconvertible Bonds - continued |
INDUSTRIALS - continued |
Commercial Services & Supplies - continued |
Clean Harbors, Inc. 5.25% 8/1/20 (h) | | $ 905 | | $ 929 |
Covanta Holding Corp.: | | | | |
6.375% 10/1/22 | | 1,290 | | 1,406 |
7.25% 12/1/20 | | 1,920 | | 2,143 |
International Lease Finance Corp.: | | | | |
4.875% 4/1/15 | | 1,580 | | 1,642 |
5.625% 9/20/13 | | 5,290 | | 5,469 |
5.65% 6/1/14 | | 4,439 | | 4,594 |
5.75% 5/15/16 | | 1,840 | | 1,909 |
5.875% 5/1/13 | | 3,460 | | 3,534 |
5.875% 4/1/19 | | 4,700 | | 4,846 |
6.25% 5/15/19 | | 3,035 | | 3,172 |
6.375% 3/25/13 | | 6,647 | | 6,788 |
6.625% 11/15/13 | | 8,252 | | 8,623 |
7.125% 9/1/18 (h) | | 7,560 | | 8,637 |
8.25% 12/15/20 | | 3,190 | | 3,720 |
8.625% 9/15/15 | | 4,640 | | 5,197 |
WP Rocket Merger Sub, Inc. 10.125% 7/15/19 (h) | | 1,200 | | 1,197 |
| | 66,973 |
Electrical Equipment - 0.0% |
Anixter International, Inc. 5.625% 5/1/19 | | 705 | | 737 |
Machinery - 0.0% |
Briggs & Stratton Corp. 6.875% 12/15/20 | | 920 | | 994 |
TRAC Intermodal LLC/TRAC Intermodal Corp. 11% 8/15/19 (h) | | 910 | | 915 |
| | 1,909 |
Marine - 0.0% |
Navios Maritime Acquisition Corp./Navios Acquisition Finance US, Inc. 8.625% 11/1/17 | | 1,035 | | 963 |
Navios Maritime Holdings, Inc.: | | | | |
8.125% 2/15/19 | | 1,725 | | 1,501 |
8.875% 11/1/17 | | 1,420 | | 1,441 |
Navios South American Logisitcs, Inc./Navios Logistics Finance U.S., Inc. 9.25% 4/15/19 | | 505 | | 470 |
| | 4,375 |
Road & Rail - 0.2% |
Burlington Northern Santa Fe LLC: | | | | |
4.4% 3/15/42 | | 15,840 | | 16,681 |
Corporate Bonds - continued |
| Principal Amount (000s) | | Value (000s) |
Nonconvertible Bonds - continued |
INDUSTRIALS - continued |
Road & Rail - continued |
Burlington Northern Santa Fe LLC: - continued | | | | |
5.05% 3/1/41 | | $ 7,178 | | $ 8,244 |
NESCO LLC/NESCO Holdings Corp. 11.75% 4/15/17 (h) | | 965 | | 1,004 |
Norfolk Southern Corp. 3% 4/1/22 | | 11,347 | | 11,765 |
Swift Services Holdings, Inc. 10% 11/15/18 | | 1,715 | | 1,876 |
Western Express, Inc. 12.5% 4/15/15 (h) | | 3,725 | | 2,533 |
| | 42,103 |
Trading Companies & Distributors - 0.1% |
Aircastle Ltd.: | | | | |
7.625% 4/15/20 | | 845 | | 936 |
9.75% 8/1/18 | | 790 | | 906 |
VWR Funding, Inc.: | | | | |
7.25% 9/15/17 (h) | | 2,695 | | 2,729 |
10.25% 7/15/15 pay-in-kind (m) | | 6,686 | | 6,891 |
| | 11,462 |
TOTAL INDUSTRIALS | | 153,486 |
INFORMATION TECHNOLOGY - 0.4% |
Communications Equipment - 0.1% |
Avaya, Inc.: | | | | |
7% 4/1/19 (h) | | 2,295 | | 2,094 |
10.125% 11/1/15 pay-in-kind (m) | | 4,428 | | 3,841 |
Hughes Satellite Systems Corp. 6.5% 6/15/19 | | 7,595 | | 8,108 |
Lucent Technologies, Inc.: | | | | |
6.45% 3/15/29 | | 12,541 | | 8,089 |
6.5% 1/15/28 | | 1,110 | | 713 |
| | 22,845 |
Electronic Equipment & Components - 0.0% |
Tyco Electronics Group SA: | | | | |
5.95% 1/15/14 | | 2,947 | | 3,143 |
6% 10/1/12 | | 3,594 | | 3,608 |
6.55% 10/1/17 | | 815 | | 985 |
| | 7,736 |
Internet Software & Services - 0.0% |
j2 Global, Inc. 8% 8/1/20 (h) | | 920 | | 922 |
Corporate Bonds - continued |
| Principal Amount (000s) | | Value (000s) |
Nonconvertible Bonds - continued |
INFORMATION TECHNOLOGY - continued |
IT Services - 0.1% |
Audatex North America, Inc. 6.75% 6/15/18 (h) | | $ 3,120 | | $ 3,346 |
Ceridian Corp.: | | | | |
8.875% 7/15/19 (h) | | 1,110 | | 1,190 |
11.25% 11/15/15 | | 2,730 | | 2,669 |
First Data Corp. 6.75% 11/1/20 (h) | | 3,485 | | 3,468 |
Iron Mountain, Inc. 5.75% 8/15/24 | | 1,000 | | 1,008 |
SunGard Data Systems, Inc. 4.875% 1/15/14 | | 12,355 | | 12,787 |
WideOpenWest Finance LLC/WideOpenWest Capital Corp.: | | | | |
10.25% 7/15/19 (h) | | 3,270 | | 3,401 |
13.375% 10/15/19 (h) | | 1,780 | | 1,771 |
| | 29,640 |
Office Electronics - 0.1% |
Xerox Corp.: | | | | |
1.8679% 9/13/13 (m) | | 8,470 | | 8,529 |
4.25% 2/15/15 | | 503 | | 536 |
4.5% 5/15/21 | | 2,031 | | 2,135 |
| | 11,200 |
Semiconductors & Semiconductor Equipment - 0.1% |
Freescale Semiconductor, Inc. 10.125% 3/15/18 (h) | | 6,887 | | 7,541 |
NXP BV/NXP Funding LLC: | | | | |
3.2051% 10/15/13 (m) | | 85 | | 85 |
9.75% 8/1/18 (h) | | 1,480 | | 1,691 |
Spansion LLC: | | | | |
7.875% 11/15/17 | | 1,150 | | 1,121 |
11.25% 1/15/16 (d)(h) | | 905 | | 53 |
Viasystems, Inc. 7.875% 5/1/19 (h) | | 2,570 | | 2,525 |
| | 13,016 |
Software - 0.0% |
Lawson Software, Inc. 9.375% 4/1/19 (h) | | 755 | | 819 |
Nuance Communications, Inc. 5.375% 8/15/20 (h) | | 640 | | 655 |
| | 1,474 |
TOTAL INFORMATION TECHNOLOGY | | 86,833 |
Corporate Bonds - continued |
| Principal Amount (000s) | | Value (000s) |
Nonconvertible Bonds - continued |
MATERIALS - 0.4% |
Chemicals - 0.1% |
Dow Chemical Co. 7.6% 5/15/14 | | $ 7,168 | | $ 7,955 |
INEOS Group Holdings PLC 8.5% 2/15/16 (h) | | 3,470 | | 3,270 |
Kinove German Bondco GmbH 9.625% 6/15/18 (h) | | 1,060 | | 1,118 |
Tronox Finance LLC 6.375% 8/15/20 (h) | | 1,825 | | 1,843 |
| | 14,186 |
Construction Materials - 0.0% |
CEMEX SA de CV 5.4606% 9/30/15 (h)(m) | | 2,815 | | 2,674 |
CRH America, Inc. 6% 9/30/16 | | 1,699 | | 1,885 |
| | 4,559 |
Containers & Packaging - 0.0% |
ARD Finance SA 11.125% 6/1/18 pay-in-kind (h) | | 1,834 | | 1,688 |
Ardagh Packaging Finance PLC: | | | | |
7.375% 10/15/17 (h) | | 200 | | 215 |
9.125% 10/15/20 (h) | | 65 | | 68 |
Ardagh Packaging Finance PLC / Ardagh MP Holdings USA, Inc.: | | | | |
7.375% 10/15/17 (h) | | 300 | | 322 |
9.125% 10/15/20 (h) | | 690 | | 716 |
9.125% 10/15/20 (h) | | 620 | | 648 |
Consolidated Container Co. LLC/Consolidated Container Capital, Inc. 10.125% 7/15/20 (h) | | 555 | | 577 |
Crown Americas LLC/Crown Americas Capital Corp. III 6.25% 2/1/21 | | 2,040 | | 2,254 |
Owens-Illinois, Inc. 7.8% 5/15/18 | | 350 | | 401 |
Pretium Packaging LLC/Pretium Finance, Inc. 11.5% 4/1/16 | | 2,340 | | 2,358 |
Sappi Papier Holding GmbH 6.625% 4/15/21 (h) | | 375 | | 347 |
Tekni-Plex, Inc. 9.75% 6/1/19 (h) | | 1,165 | | 1,212 |
| | 10,806 |
Metals & Mining - 0.2% |
Anglo American Capital PLC 9.375% 4/8/14 (h) | | 1,181 | | 1,324 |
Aperam: | | | | |
7.375% 4/1/16 (h) | | 385 | | 335 |
7.75% 4/1/18 (h) | | 305 | | 253 |
Boart Longyear Management Pty Ltd. 7% 4/1/21 (h) | | 830 | | 861 |
Calcipar SA 6.875% 5/1/18 (h) | | 720 | | 707 |
Corporacion Nacional del Cobre de Chile (Codelco): | | | | |
3.875% 11/3/21 (h) | | 5,672 | | 6,121 |
Corporate Bonds - continued |
| Principal Amount (000s) | | Value (000s) |
Nonconvertible Bonds - continued |
MATERIALS - continued |
Metals & Mining - continued |
Corporacion Nacional del Cobre de Chile (Codelco): - continued | | | | |
6.375% 11/30/12 (h) | | $ 1,179 | | $ 1,192 |
Edgen Murray Corp. 12.25% 1/15/15 | | 5,215 | | 5,541 |
FMG Resources (August 2006) Pty Ltd.: | | | | |
6% 4/1/17 (h) | | 1,770 | | 1,664 |
6.375% 2/1/16 (h) | | 8,300 | | 7,927 |
6.875% 4/1/22 (h) | | 1,770 | | 1,637 |
7% 11/1/15 (h) | | 1,865 | | 1,832 |
MRC Global, Inc. 9.5% 12/15/16 | | 2,840 | | 3,096 |
New Gold, Inc. 7% 4/15/20 (h) | | 345 | | 363 |
Rain CII Carbon LLC/CII Carbon Corp. 8% 12/1/18 (h) | | 1,335 | | 1,362 |
Severstal Columbus LLC 10.25% 2/15/18 | | 1,820 | | 1,866 |
Steel Dynamics, Inc.: | | | | |
6.125% 8/15/19 (h) | | 1,115 | | 1,154 |
6.375% 8/15/22 (h) | | 990 | | 1,020 |
Vale Overseas Ltd.: | | | | |
4.375% 1/11/22 | | 5,000 | | 5,128 |
6.25% 1/23/17 | | 2,152 | | 2,467 |
| | 45,850 |
Paper & Forest Products - 0.1% |
AbitibiBowater, Inc. 10.25% 10/15/18 | | 5,290 | | 6,057 |
Verso Paper Holdings LLC/Verso Paper, Inc.: | | | | |
11.75% 1/15/19 (h) | | 3,790 | | 3,904 |
11.75% 1/15/19 (h) | | 2,615 | | 2,066 |
| | 12,027 |
TOTAL MATERIALS | | 87,428 |
TELECOMMUNICATION SERVICES - 0.7% |
Diversified Telecommunication Services - 0.4% |
AT&T, Inc.: | | | | |
6.3% 1/15/38 | | 5,000 | | 6,529 |
6.8% 5/15/36 | | 8,428 | | 11,530 |
BellSouth Capital Funding Corp. 7.875% 2/15/30 | | 1,291 | | 1,755 |
Broadview Networks Holdings, Inc. 11.375% 9/1/12 (d) | | 3,815 | | 2,575 |
Corporate Bonds - continued |
| Principal Amount (000s) | | Value (000s) |
Nonconvertible Bonds - continued |
TELECOMMUNICATION SERVICES - continued |
Diversified Telecommunication Services - continued |
CenturyLink, Inc.: | | | | |
6.15% 9/15/19 | | $ 2,344 | | $ 2,552 |
6.45% 6/15/21 | | 2,312 | | 2,582 |
7.6% 9/15/39 | | 707 | | 731 |
Eileme 1 AB 14.25% 8/15/20 pay-in-kind (h) | | 2,136 | | 2,111 |
Eileme 2 AB 11.625% 1/31/20 (h) | | 2,095 | | 2,294 |
Embarq Corp. 7.995% 6/1/36 | | 2,621 | | 2,902 |
Frontier Communications Corp. 7.125% 1/15/23 | | 2,055 | | 2,091 |
Intelsat Ltd. 11.25% 6/15/16 | | 2,082 | | 2,191 |
Level 3 Communications, Inc. 8.875% 6/1/19 (h) | | 435 | | 444 |
Level 3 Financing, Inc. 7% 6/1/20 (h) | | 1,460 | | 1,449 |
Sprint Capital Corp. 6.9% 5/1/19 | | 14,150 | | 14,486 |
Telefonica Emisiones SAU 5.462% 2/16/21 | | 3,562 | | 3,277 |
Verizon Communications, Inc.: | | | | |
6.1% 4/15/18 | | 1,909 | | 2,385 |
6.25% 4/1/37 | | 3,729 | | 4,952 |
Wind Acquisition Finance SA 7.25% 2/15/18 (h) | | 1,860 | | 1,711 |
| | 68,547 |
Wireless Telecommunication Services - 0.3% |
America Movil SAB de CV 3.625% 3/30/15 | | 999 | | 1,067 |
Clearwire Communications LLC/Clearwire Finance, Inc. 12% 12/1/15 (h) | | 1,082 | | 1,071 |
Clearwire Escrow Corp. 12% 12/1/15 (h) | | 4,475 | | 4,408 |
Crown Castle International Corp. 9% 1/15/15 | | 2,955 | | 3,184 |
Digicel Group Ltd.: | | | | |
7% 2/15/20 (h) | | 275 | | 276 |
8.875% 1/15/15 (h) | | 6,915 | | 7,053 |
12% 4/1/14 (h) | | 3,990 | | 4,419 |
DIRECTV Holdings LLC/DIRECTV Financing, Inc.: | | | | |
5.15% 3/15/42 | | 2,472 | | 2,527 |
5.875% 10/1/19 | | 6,223 | | 7,319 |
6.35% 3/15/40 | | 1,699 | | 2,001 |
Intelsat Jackson Holdings SA: | | | | |
7.25% 4/1/19 | | 7,260 | | 7,823 |
7.5% 4/1/21 | | 5,500 | | 5,954 |
Nextel Communications, Inc.: | | | | |
5.95% 3/15/14 | | 140 | | 140 |
7.375% 8/1/15 | | 862 | | 866 |
Corporate Bonds - continued |
| Principal Amount (000s) | | Value (000s) |
Nonconvertible Bonds - continued |
TELECOMMUNICATION SERVICES - continued |
Wireless Telecommunication Services - continued |
NII Capital Corp. 7.625% 4/1/21 | | $ 2,609 | | $ 2,015 |
Sprint Nextel Corp.: | | | | |
7% 8/15/20 | | 5,860 | | 5,992 |
9% 11/15/18 (h) | | 6,595 | | 7,782 |
Vodafone Group PLC 5% 12/16/13 | | 2,129 | | 2,250 |
| | 66,147 |
TOTAL TELECOMMUNICATION SERVICES | | 134,694 |
UTILITIES - 1.1% |
Electric Utilities - 0.4% |
Ameren Illinois Co. 6.125% 11/15/17 | | 243 | | 286 |
AmerenUE 6.4% 6/15/17 | | 2,769 | | 3,323 |
Cleveland Electric Illuminating Co. 5.65% 12/15/13 | | 3,812 | | 4,020 |
Duke Capital LLC 5.668% 8/15/14 | | 1,905 | | 2,053 |
Duquesne Light Holdings, Inc.: | | | | |
5.9% 12/1/21 (h) | | 3,820 | | 4,312 |
6.4% 9/15/20 (h) | | 7,884 | | 9,112 |
Edison International 3.75% 9/15/17 | | 3,169 | | 3,389 |
Edison Mission Energy 7% 5/15/17 | | 510 | | 268 |
Enel Finance International SA 5.7% 1/15/13 (h) | | 282 | | 285 |
FirstEnergy Corp. 7.375% 11/15/31 | | 6,718 | | 8,865 |
FirstEnergy Solutions Corp.: | | | | |
4.8% 2/15/15 | | 1,266 | | 1,352 |
6.05% 8/15/21 | | 4,871 | | 5,420 |
InterGen NV 9% 6/30/17 (h) | | 3,690 | | 3,598 |
IPALCO Enterprises, Inc. 7.25% 4/1/16 (h) | | 3,670 | | 4,110 |
LG&E and KU Energy LLC: | | | | |
2.125% 11/15/15 | | 3,576 | | 3,613 |
3.75% 11/15/20 | | 704 | | 729 |
Mirant Americas Generation LLC: | | | | |
8.5% 10/1/21 | | 6,695 | | 7,063 |
9.125% 5/1/31 | | 1,745 | | 1,806 |
Nevada Power Co.: | | | | |
6.5% 5/15/18 | | 5,100 | | 6,365 |
6.5% 8/1/18 | | 531 | | 666 |
Pennsylvania Electric Co. 6.05% 9/1/17 | | 450 | | 517 |
Pepco Holdings, Inc. 2.7% 10/1/15 | | 3,363 | | 3,464 |
Corporate Bonds - continued |
| Principal Amount (000s) | | Value (000s) |
Nonconvertible Bonds - continued |
UTILITIES - continued |
Electric Utilities - continued |
Progress Energy, Inc. 6% 12/1/39 | | $ 3,060 | | $ 3,858 |
Sierra Pacific Power Co. 5.45% 9/1/13 | | 527 | | 550 |
| | 79,024 |
Gas Utilities - 0.0% |
AmeriGas Finance LLC/AmeriGas Finance Corp.: | | | | |
6.75% 5/20/20 | | 830 | | 882 |
7% 5/20/22 | | 1,785 | | 1,905 |
Southern Natural Gas Co. 5.9% 4/1/17 (h) | | 260 | | 306 |
Southern Natural Gas Co. / Southern Natural Issuing Corp. 4.4% 6/15/21 | | 1,660 | | 1,782 |
Star Gas Partners LP/Star Gas Finance Co. 8.875% 12/1/17 | | 950 | | 955 |
| | 5,830 |
Independent Power Producers & Energy Traders - 0.4% |
Atlantic Power Corp. 9% 11/15/18 | | 1,655 | | 1,729 |
Calpine Corp. 7.875% 1/15/23 (h) | | 7,985 | | 8,903 |
Energy Future Holdings Corp. 10% 1/15/20 | | 8,915 | | 9,873 |
Energy Future Intermediate Holding Co. LLC/Energy Future Intermediate Holding Finance, Inc.: | | | | |
10% 12/1/20 | | 3,174 | | 3,575 |
11% 10/1/21 | | 6,978 | | 6,873 |
11.75% 3/1/22 (h) | | 19,685 | | 20,965 |
GenOn Energy, Inc.: | | | | |
9.5% 10/15/18 | | 520 | | 573 |
9.875% 10/15/20 | | 1,743 | | 1,911 |
PSEG Power LLC 2.75% 9/15/16 | | 1,379 | | 1,439 |
RRI Energy, Inc. 7.625% 6/15/14 | | 1,940 | | 2,076 |
The AES Corp.: | | | | |
7.375% 7/1/21 | | 1,580 | | 1,809 |
7.75% 10/15/15 | | 4,660 | | 5,243 |
TXU Corp.: | | | | |
5.55% 11/15/14 | | 50 | | 41 |
6.5% 11/15/24 | | 4,150 | | 2,366 |
6.55% 11/15/34 | | 7,295 | | 3,958 |
| | 71,334 |
Multi-Utilities - 0.3% |
Consolidated Edison Co. of New York, Inc. 5.7% 6/15/40 | | 1,866 | | 2,548 |
Corporate Bonds - continued |
| Principal Amount (000s) | | Value (000s) |
Nonconvertible Bonds - continued |
UTILITIES - continued |
Multi-Utilities - continued |
Dominion Resources, Inc.: | | | | |
2.7606% 9/30/66 (m) | | $ 13,469 | | $ 12,262 |
7.5% 6/30/66 (m) | | 1,102 | | 1,192 |
MidAmerican Energy Holdings, Co.: | | | | |
5.875% 10/1/12 | | 2,521 | | 2,531 |
6.5% 9/15/37 | | 1,418 | | 1,938 |
National Grid PLC 6.3% 8/1/16 | | 376 | | 434 |
NiSource Finance Corp.: | | | | |
4.45% 12/1/21 | | 2,313 | | 2,503 |
5.25% 9/15/17 | | 497 | | 573 |
5.25% 2/15/43 | | 3,857 | | 4,271 |
5.4% 7/15/14 | | 1,249 | | 1,343 |
5.45% 9/15/20 | | 598 | | 683 |
5.8% 2/1/42 | | 3,125 | | 3,718 |
5.95% 6/15/41 | | 5,667 | | 6,793 |
6.4% 3/15/18 | | 1,230 | | 1,472 |
6.8% 1/15/19 | | 2,710 | | 3,249 |
Puget Energy, Inc. 5.625% 7/15/22 (h) | | 3,935 | | 4,127 |
Sempra Energy 2.3% 4/1/17 | | 5,903 | | 6,174 |
Wisconsin Energy Corp. 6.25% 5/15/67 (m) | | 2,776 | | 2,939 |
| | 58,750 |
TOTAL UTILITIES | | 214,938 |
TOTAL NONCONVERTIBLE BONDS | | 2,193,977 |
TOTAL CORPORATE BONDS (Cost $2,050,377) |
2,233,066
|
U.S. Government and Government Agency Obligations - 5.3% |
|
U.S. Treasury Inflation Protected Obligations - 0.9% |
U.S. Treasury Inflation-Indexed Bonds: | | | | |
0.75% 2/15/42 | | 115,208 | | 126,561 |
2.125% 2/15/40 | | 15,788 | | 23,232 |
2.125% 2/15/41 | | 18,763 | | 27,803 |
TOTAL U.S. TREASURY INFLATION PROTECTED OBLIGATIONS | | 177,596 |
U.S. Government and Government Agency Obligations - continued |
| Principal Amount (000s) | | Value (000s) |
U.S. Treasury Obligations - 4.4% |
U.S. Treasury Bonds: | | | | |
2.75% 8/15/42 | | $ 5,000 | | $ 5,079 |
3% 5/15/42 | | 68,003 | | 72,784 |
U.S. Treasury Notes: | | | | |
0.25% 7/15/15 | | 124,886 | | 124,759 |
0.5% 7/31/17 | | 145,000 | | 144,422 |
0.875% 4/30/17 | | 45,652 | | 46,344 |
0.875% 7/31/19 (j) | | 170,511 | | 169,245 |
1% 8/31/19 | | 160,000 | | 159,988 |
1.625% 8/15/22 | | 143,000 | | 143,938 |
TOTAL U.S. TREASURY OBLIGATIONS | | 866,559 |
TOTAL U.S. GOVERNMENT AND GOVERNMENT AGENCY OBLIGATIONS (Cost $1,017,415) |
1,044,155
|
U.S. Government Agency - Mortgage Securities - 8.6% |
|
Fannie Mae - 7.3% |
2.558% 6/1/36 (m) | | 147 | | 157 |
2.777% 7/1/37 (m) | | 421 | | 452 |
3% 4/1/27 to 8/1/42 | | 8,569 | | 9,031 |
3% 9/1/27 (i) | | 12,400 | | 13,085 |
3% 9/1/27 (i) | | 10,100 | | 10,658 |
3% 9/1/27 (i) | | 4,000 | | 4,221 |
3% 9/1/42 (i) | | 900 | | 934 |
3% 9/1/42 (i) | | 185,700 | | 192,695 |
3% 9/1/42 (i) | | 11,300 | | 11,726 |
3% 9/1/42 (i) | | 174,400 | | 180,970 |
3% 10/1/42 (i) | | 135,600 | | 140,177 |
3.5% 1/1/26 to 8/1/42 | | 26,853 | | 28,687 |
3.5% 9/1/27 (i) | | 4,000 | | 4,253 |
3.5% 7/1/42 | | 90 | | 96 |
3.5% 7/1/42 | | 130 | | 139 |
3.5% 8/1/42 | | 167 | | 178 |
3.5% 8/1/42 | | 154 | | 164 |
3.5% 9/1/42 (i) | | 265,200 | | 281,195 |
3.5% 9/1/42 (i) | | 4,300 | | 4,559 |
3.5% 9/1/42 (i) | | 8,700 | | 9,225 |
4% 4/1/24 to 4/1/42 | | 35,922 | | 38,784 |
U.S. Government Agency - Mortgage Securities - continued |
| Principal Amount (000s) | | Value (000s) |
Fannie Mae - continued |
4% 9/1/27 (i) | | $ 9,000 | | $ 9,631 |
4% 9/1/41 | | 144 | | 155 |
4% 9/1/42 (i) | | 85,000 | | 91,149 |
4.5% 6/1/18 to 8/1/41 | | 29,052 | | 31,634 |
4.5% 9/1/42 (i) | | 83,000 | | 89,835 |
4.5% 9/1/42 (i) | | 7,300 | | 7,901 |
5% 12/1/25 to 5/1/40 | | 30,505 | | 33,522 |
5% 9/1/42 (i) | | 500 | | 546 |
5% 9/1/42 (i) | | 48,000 | | 52,425 |
5.5% 6/1/33 to 3/1/40 | | 40,594 | | 44,729 |
5.5% 9/1/42 (i) | | 48,000 | | 52,676 |
6% 6/1/35 to 4/1/40 | | 39,805 | | 43,968 |
6% 9/1/42 (i) | | 39,000 | | 42,976 |
TOTAL FANNIE MAE | | 1,432,533 |
Freddie Mac - 0.7% |
3.454% 10/1/35 (m) | | 208 | | 223 |
3.5% 4/1/32 to 4/1/42 | | 8,975 | | 9,621 |
4% 6/1/24 to 4/1/42 | | 20,732 | | 22,508 |
4% 9/1/42 (i) | | 18,000 | | 19,257 |
4.5% 5/1/39 to 10/1/41 | | 37,725 | | 40,871 |
5% 3/1/19 to 12/1/40 | | 26,809 | | 29,220 |
5.5% 5/1/27 to 1/1/40 | | 14,635 | | 15,946 |
6% 7/1/37 to 8/1/37 | | 911 | | 1,002 |
6.5% 3/1/36 | | 3,324 | | 3,761 |
TOTAL FREDDIE MAC | | 142,409 |
Ginnie Mae - 0.6% |
3% 10/1/42 (i) | | 11,300 | | 11,837 |
3.5% 11/15/41 to 3/15/42 | | 13,014 | | 14,126 |
4% 1/15/25 to 12/15/41 | | 16,414 | | 17,998 |
4.5% 5/15/39 to 4/15/41 | | 41,051 | | 45,512 |
5% 3/15/39 to 9/15/41 | | 21,105 | | 23,611 |
5.5% 12/15/38 to 9/15/39 | | 1,849 | | 2,077 |
6% 2/15/34 to 9/20/38 | | 9,430 | | 10,653 |
TOTAL GINNIE MAE | | 125,814 |
TOTAL U.S. GOVERNMENT AGENCY - MORTGAGE SECURITIES (Cost $1,685,289) |
1,700,756
|
Asset-Backed Securities - 0.3% |
| Principal Amount (000s) | | Value (000s) |
Accredited Mortgage Loan Trust Series 2005-1 Class M1, 0.7055% 4/25/35 (m) | | $ 751 | | $ 578 |
ACE Securities Corp. Home Equity Loan Trust: | | | | |
Series 2004-HE1 Class M2, 1.8855% 3/25/34 (m) | | 294 | | 240 |
Series 2005-HE2 Class M2, 0.6855% 4/25/35 (m) | | 62 | | 59 |
Advanta Business Card Master Trust Series 2006-C1 Class C1, 0.6758% 10/20/14 (m) | | 472 | | 5 |
Ally Master Owner Trust Series 2012-3 Class A2, 1.21% 6/15/17 | | 27,520 | | 27,570 |
Ameriquest Mortgage Securities, Inc. pass-thru certificates: | | | | |
Series 2003-10 Class M1, 0.9355% 12/25/33 (m) | | 59 | | 44 |
Series 2004-R2 Class M3, 0.7855% 4/25/34 (m) | | 83 | | 33 |
Series 2005-R2 Class M1, 0.6855% 4/25/35 (m) | | 1,567 | | 1,404 |
Argent Securities, Inc. pass-thru certificates: | | | | |
Series 2003-W7 Class A2, 1.0262% 3/25/34 (m) | | 36 | | 29 |
Series 2004-W11 Class M2, 0.9355% 11/25/34 (m) | | 426 | | 300 |
Series 2004-W7 Class M1, 0.7855% 5/25/34 (m) | | 1,108 | | 787 |
Series 2006-W4 Class A2C, 0.3955% 5/25/36 (m) | | 988 | | 299 |
Asset Backed Securities Corp. Home Equity Loan Trust: | | | | |
Series 2004-HE2 Class M1, 1.0605% 4/25/34 (m) | | 1,781 | | 1,467 |
Series 2006-HE2 Class M1, 0.6055% 3/25/36 (m) | | 45 | | 0* |
Axon Financial Funding Ltd. Series 2007-1 Class A1, 0.9743% 4/4/17 (d)(h)(m) | | 4,820 | | 0 |
Capital Trust Ltd. Series 2004-1: | | | | |
Class A2, 0.687% 7/20/39 (h)(m) | | 95 | | 86 |
Class B, 0.987% 7/20/39 (h)(m) | | 200 | | 90 |
Class C, 1.337% 7/20/39 (h)(m) | | 258 | | 4 |
Carrington Mortgage Loan Trust Series 2007-RFC1 Class A3, 0.3755% 12/25/36 (m) | | 1,368 | | 545 |
Citigroup Mortgage Loan Trust Series 2005-HE4 Class A2C, 0.5055% 10/25/35 (m) | | 372 | | 371 |
Countrywide Asset-Backed Certificates Trust Series 2007-4 Class A1A, 0.3662% 9/25/37 (m) | | 89 | | 89 |
Countrywide Home Loan Trust Series 2006-13 Class N, 7% 8/25/37 (h) | | 251 | | 0 |
Countrywide Home Loans, Inc.: | | | | |
Series 2004-3 Class M4, 1.2055% 4/25/34 (m) | | 121 | | 55 |
Series 2004-4 Class M2, 1.0305% 6/25/34 (m) | | 446 | | 257 |
Fannie Mae Series 2004-T5 Class AB3, 1.1466% 5/28/35 (m) | | 30 | | 18 |
Fieldstone Mortgage Investment Corp. Series 2004-3 Class M5, 2.4105% 8/25/34 (m) | | 221 | | 136 |
Asset-Backed Securities - continued |
| Principal Amount (000s) | | Value (000s) |
First Franklin Mortgage Loan Trust: | | | | |
Series 2004-FF2 Class M3, 1.0605% 3/25/34 (m) | | $ 17 | | $ 7 |
Series 2006-FF14 Class A2, 0.2955% 10/25/36 (m) | | 340 | | 337 |
Fremont Home Loan Trust Series 2005-A: | | | | |
Class M3, 0.9705% 1/25/35 (m) | | 720 | | 225 |
Class M4, 1.2555% 1/25/35 (m) | | 276 | | 36 |
GCO Education Loan Funding Master Trust II Series 2007-1A Class C1L, 0.8069% 2/25/47 (h)(m) | | 2,160 | | 888 |
GCO Slims Trust Series 2006-1A, 5.72% 3/1/22 (h) | | 433 | | 418 |
GE Business Loan Trust: | | | | |
Series 2003-1 Class A, 0.6695% 4/15/31 (h)(m) | | 149 | | 141 |
Series 2006-2A: | | | | |
Class A, 0.4195% 11/15/34 (h)(m) | | 1,010 | | 869 |
Class B, 0.5195% 11/15/34 (h)(m) | | 365 | | 253 |
Class C, 0.6195% 11/15/34 (h)(m) | | 606 | | 345 |
Class D, 0.9895% 11/15/34 (h)(m) | | 231 | | 72 |
Guggenheim Structured Real Estate Funding Ltd. Series 2006-3 Class C, 0.7855% 9/25/46 (h)(m) | | 1,065 | | 1,024 |
Home Equity Asset Trust: | | | | |
Series 2003-2 Class M1, 1.5555% 8/25/33 (m) | | 260 | | 203 |
Series 2003-3 Class M1, 1.5255% 8/25/33 (m) | | 515 | | 431 |
Series 2003-5 Class A2, 0.9355% 12/25/33 (m) | | 25 | | 20 |
HSI Asset Securitization Corp. Trust Series 2007-HE1 Class 2A3, 0.4255% 1/25/37 (m) | | 1,137 | | 380 |
JPMorgan Mortgage Acquisition Trust: | | | | |
Series 2006-NC2 Class M2, 0.5355% 7/25/36 (m) | | 2,497 | | 35 |
Series 2007-CH1 Class AV4, 0.3655% 11/25/36 (m) | | 1,136 | | 1,043 |
Keycorp Student Loan Trust: | | | | |
Series 1999-A Class A2, 0.7906% 12/27/29 (m) | | 394 | | 354 |
Series 2006-A Class 2C, 1.6106% 3/27/42 (m) | | 2,016 | | 96 |
Marriott Vacation Club Owner Trust Series 2006-2A: | | | | |
Class B, 5.442% 10/20/28 (h) | | 6 | | 6 |
Class C, 5.691% 10/20/28 (h) | | 3 | | 3 |
Class D, 6.01% 10/20/28 (h) | | 34 | | 34 |
MASTR Asset Backed Securities Trust Series 2007-HE1 Class M1, 0.5355% 5/25/37 (m) | | 596 | | 5 |
Meritage Mortgage Loan Trust Series 2004-1 Class M1, 0.9855% 7/25/34 (m) | | 113 | | 72 |
Merrill Lynch Mortgage Investors Trust: | | | | |
Series 2003-OPT1 Class M1, 1.2105% 7/25/34 (m) | | 351 | | 233 |
Series 2006-FM1 Class A2B, 0.3455% 4/25/37 (m) | | 1,095 | | 988 |
Series 2006-OPT1 Class A1A, 0.4955% 6/25/35 (m) | | 2,074 | | 1,669 |
Asset-Backed Securities - continued |
| Principal Amount (000s) | | Value (000s) |
Morgan Stanley ABS Capital I Trust: | | | | |
Series 2004-HE6 Class A2, 0.5755% 8/25/34 (m) | | $ 44 | | $ 34 |
Series 2005-NC1 Class M1, 0.6755% 1/25/35 (m) | | 303 | | 183 |
Series 2005-NC2 Class B1, 1.4055% 3/25/35 (m) | | 316 | | 38 |
National Collegiate Student Loan Trust: | | | | |
Series 2004-2 Class AIO, 9.75% 10/27/14 (o) | | 1,137 | | 15 |
Series 2006-4 Class D, 1.3355% 5/25/32 (m) | | 1,544 | | 0* |
New Century Home Equity Loan Trust Series 2005-4 Class M2, 0.7455% 9/25/35 (m) | | 1,083 | | 700 |
Ocala Funding LLC: | | | | |
Series 2005-1A Class A, 1.737% 3/20/10 (d)(h)(m) | | 429 | | 0 |
Series 2006-1A Class A, 1.637% 3/20/11 (d)(h)(m) | | 892 | | 0 |
Park Place Securities, Inc.: | | | | |
Series 2004-WCW1: | | | | |
Class M3, 1.4855% 9/25/34 (m) | | 405 | | 176 |
Class M4, 1.6855% 9/25/34 (m) | | 519 | | 118 |
Series 2005-WCH1 Class M4, 1.0655% 1/25/36 (m) | | 1,120 | | 640 |
Salomon Brothers Mortgage Securities VII, Inc. Series 2003-HE1 Class A, 1.0355% 4/25/33 (m) | | 4 | | 3 |
Saxon Asset Securities Trust Series 2004-1 Class M1, 1.0305% 3/25/35 (m) | | 962 | | 698 |
Sierra Receivables Funding Co. Series 2007-1A Class A2, 0.3968% 3/20/19 (FGIC Insured) (h)(m) | | 307 | | 301 |
SLM Private Credit Student Loan Trust Series 2004-A Class C, 1.4179% 6/15/33 (m) | | 965 | | 584 |
Specialty Underwriting & Residential Finance Trust Series 2006-AB2 Class N1, 5.75% 6/25/37 (h) | | 455 | | 0 |
Structured Asset Investment Loan Trust Series 2004-8 Class M5, 1.9605% 9/25/34 (m) | | 48 | | 16 |
SVO VOI Mortgage Corp. Series 2006-AA Class A, 5.28% 2/20/24 (h) | | 329 | | 338 |
Terwin Mortgage Trust Series 2003-4HE Class A1, 1.0955% 9/25/34 (m) | | 22 | | 20 |
Trapeza CDO XII Ltd./Trapeza CDO XII, Inc. Series 2007-12A Class B, 1.0196% 4/6/42 (h)(m) | | 1,509 | | 19 |
WaMu Asset Holdings Corp. Series 2006-8 Class N1, 6.048% 10/25/46 (h) | | 674 | | 0 |
Asset-Backed Securities - continued |
| Principal Amount (000s) | | Value (000s) |
Wells Fargo Home Equity Trust Series 2004-3 Class A, 4.5% 11/27/34 (h) | | $ 6 | | $ 0 |
Whinstone Capital Management Ltd. Series 1A Class B3, 2.2511% 10/25/44 (h)(m) | | 1,358 | | 897 |
TOTAL ASSET-BACKED SECURITIES (Cost $47,383) |
49,433
|
Collateralized Mortgage Obligations - 0.2% |
|
Private Sponsor - 0.2% |
Bayview Commercial Asset Trust Series 2006-3A, Class IO, 3.9199% 10/25/36 (h)(m)(o) | | 26,734 | | 944 |
Bear Stearns ALT-A Trust floater Series 2005-1 Class A1, 0.7955% 1/25/35 (m) | | 1,357 | | 1,168 |
Cobalt CMBS Commercial Mortgage Trust Series 2007-C2 Class B, 5.617% 4/15/47 (m) | | 1,019 | | 428 |
COMM pass-thru certificates floater Series 2001-J2A Class A2F, 0.7385% 7/16/34 (h)(m) | | 5 | | 5 |
First Horizon Mortgage pass-thru Trust Series 2004-AR5 Class 2A1, 2.623% 10/25/34 (m) | | 970 | | 934 |
Granite Master Issuer PLC: | | | | |
floater: | | | | |
Series 2006-1A Class A5, 0.377% 12/20/54 (h)(m) | | 5,566 | | 5,427 |
Series 2006-3 Class M2, 0.517% 12/20/54 (m) | | 4,540 | | 3,950 |
Series 2006-4: | | | | |
Class B1, 0.417% 12/20/54 (m) | | 3,154 | | 2,878 |
Class M1, 0.577% 12/20/54 (m) | | 829 | | 721 |
Series 2007-1: | | | | |
Class 1B1, 0.377% 12/20/54 (m) | | 3,856 | | 3,519 |
Class 1M1, 0.537% 12/20/54 (m) | | 1,114 | | 969 |
Class 2M1, 0.737% 12/20/54 (m) | | 1,431 | | 1,245 |
Series 2007-2 Class 2C1, 1.098% 12/17/54 (m) | | 1,981 | | 1,496 |
sequential payer Series 2006-3 Class B2, 0.407% 12/20/54 (m) | | 4,550 | | 4,152 |
Granite Mortgages PLC floater Series 2003-3 Class 1C, 2.9051% 1/20/44 (m) | | 326 | | 258 |
JPMorgan Chase Commercial Mortgage Securities Trust Series 2007-CB18 Class A3, 5.447% 6/12/47 (m) | | 1,063 | | 1,125 |
JPMorgan Mortgage Trust sequential payer Series 2006-A5 Class 3A5, 5.6881% 8/25/36 (m) | | 1,592 | | 1,226 |
LB-UBS Commercial Mortgage Trust sequential payer Series 2006-C6 Class A4, 5.372% 9/15/39 | | 410 | | 473 |
Collateralized Mortgage Obligations - continued |
| Principal Amount (000s) | | Value (000s) |
Private Sponsor - continued |
MASTR Adjustable Rate Mortgages Trust Series 2007-3 Class 22A2, 0.4455% 5/25/47 (m) | | $ 587 | | $ 375 |
Merrill Lynch Alternative Note Asset Trust floater Series 2007-OAR1 Class A1, 0.4055% 2/25/37 (m) | | 1,022 | | 801 |
Opteum Mortgage Acceptance Corp. floater Series 2005-3 Class APT, 0.5255% 7/25/35 (m) | | 1,416 | | 1,151 |
RESI Finance LP/RESI Finance DE Corp. floater Series 2003-B: | | | | |
Class B5, 2.5903% 7/10/35 (h)(m) | | 799 | | 636 |
Class B6, 3.0903% 7/10/35 (h)(m) | | 170 | | 135 |
Residential Funding Securities Corp. floater Series 2003-RP2 Class A1, 0.6855% 6/25/33 (h)(m) | | 153 | | 147 |
Salomon Brothers Mortgage Securities VII, Inc. Series 2006-C2 Class H, 6.308% 7/18/33 (h) | | 129 | | 43 |
Sequoia Mortgage Trust floater Series 2004-6 Class A3B, 1.6169% 7/20/34 (m) | | 26 | | 23 |
Structured Asset Securities Corp. Series 2003-15A Class 4A, 5.3743% 4/25/33 (m) | | 272 | | 254 |
TBW Mortgage-Backed pass-thru certificates floater Series 2006-4 Class A3, 0.4355% 9/25/36 (m) | | 2,430 | | 2,089 |
TOTAL COLLATERALIZED MORTGAGE OBLIGATIONS (Cost $27,898) |
36,572
|
Commercial Mortgage Securities - 1.7% |
|
Asset Securitization Corp. Series 1997-D5: | | | | |
Class A6, 7.1354% 2/14/43 (m) | | 106 | | 107 |
Class PS1, 1.2297% 2/14/43 (m)(o) | | 518 | | 15 |
Banc of America Commercial Mortgage Trust: | | | | |
sequential payer: | | | | |
Series 2006-2 Class AAB, 5.7087% 5/10/45 (m) | | 752 | | 796 |
Series 2006-5: | | | | |
Class A2, 5.317% 9/10/47 | | 2,650 | | 2,664 |
Class A3, 5.39% 9/10/47 | | 1,272 | | 1,350 |
Series 2006-6 Class A3, 5.369% 10/10/45 | | 1,824 | | 1,994 |
Series 2007-4 Class A3, 5.7921% 2/10/51 (m) | | 897 | | 933 |
Series 2006-6 Class E, 5.619% 10/10/45 (h) | | 527 | | 53 |
Series 2007-3: | | | | |
Class A3, 5.6612% 6/10/49 (m) | | 1,523 | | 1,553 |
Class A4, 5.6612% 6/10/49 (m) | | 1,901 | | 2,174 |
Commercial Mortgage Securities - continued |
| Principal Amount (000s) | | Value (000s) |
Banc of America Commercial Mortgage, Inc.: | | | | |
sequential payer: | | | | |
Series 2001-1 Class A4, 5.451% 1/15/49 | | $ 1,997 | | $ 2,288 |
Series 2004-2 Class A4, 4.153% 11/10/38 | | 976 | | 1,003 |
Series 2005-1 Class A3, 4.877% 11/10/42 | | 325 | | 325 |
Series 2001-3 Class H, 6.562% 4/11/37 (h) | | 510 | | 510 |
Series 2005-3 Class A3B, 5.09% 7/10/43 (m) | | 2,833 | | 2,984 |
Banc of America Large Loan, Inc. floater: | | | | |
Series 2005-MIB1: | | | | |
Class C, 0.5495% 3/15/22 (h)(m) | | 392 | | 388 |
Class D, 0.5995% 3/15/22 (h)(m) | | 397 | | 391 |
Class E, 0.6395% 3/15/22 (h)(m) | | 328 | | 321 |
Class F, 0.7095% 3/15/22 (h)(m) | | 467 | | 453 |
Class G, 0.7695% 3/15/22 (h)(m) | | 303 | | 288 |
Series 2006-BIX1: | | | | |
Class D, 0.4495% 10/15/19 (h)(m) | | 80 | | 77 |
Class E, 0.4795% 10/15/19 (h)(m) | | 663 | | 627 |
Class F, 0.5495% 10/15/19 (h)(m) | | 1,987 | | 1,868 |
Class G, 0.5695% 10/15/19 (h)(m) | | 935 | | 869 |
Bayview Commercial Asset Trust: | | | | |
floater: | | | | |
Series 2003-2 Class M1, 1.0855% 12/25/33 (h)(m) | | 45 | | 33 |
Series 2004-1: | | | | |
Class A, 0.5955% 4/25/34 (h)(m) | | 775 | | 684 |
Class B, 2.1355% 4/25/34 (h)(m) | | 87 | | 51 |
Class M1, 0.7955% 4/25/34 (h)(m) | | 70 | | 50 |
Class M2, 1.4355% 4/25/34 (h)(m) | | 64 | | 45 |
Series 2005-2A: | | | | |
Class A1, 0.5455% 8/25/35 (h)(m) | | 1,055 | | 762 |
Class M1, 0.6655% 8/25/35 (h)(m) | | 57 | | 34 |
Class M2, 0.7155% 8/25/35 (h)(m) | | 94 | | 51 |
Class M3, 0.7355% 8/25/35 (h)(m) | | 52 | | 26 |
Series 2005-3A: | | | | |
Class A2, 0.6355% 11/25/35 (h)(m) | | 371 | | 292 |
Class M1, 0.6755% 11/25/35 (h)(m) | | 49 | | 27 |
Class M2, 0.7255% 11/25/35 (h)(m) | | 62 | | 33 |
Class M3, 0.7455% 11/25/35 (h)(m) | | 55 | | 28 |
Class M4, 0.8355% 11/25/35 (h)(m) | | 69 | | 32 |
Series 2005-4A: | | | | |
Class A2, 0.6255% 1/25/36 (h)(m) | | 963 | | 682 |
Class B1, 1.6355% 1/25/36 (h)(m) | | 83 | | 12 |
Class M1, 0.6855% 1/25/36 (h)(m) | | 311 | | 192 |
Commercial Mortgage Securities - continued |
| Principal Amount (000s) | | Value (000s) |
Bayview Commercial Asset Trust: - continued | | | | |
floater: | | | | |
Series 2005-4A: | | | | |
Class M2, 0.7055% 1/25/36 (h)(m) | | $ 93 | | $ 54 |
Class M3, 0.7355% 1/25/36 (h)(m) | | 136 | | 73 |
Class M4, 0.8455% 1/25/36 (h)(m) | | 75 | | 37 |
Class M5, 0.8855% 1/25/36 (h)(m) | | 75 | | 25 |
Class M6, 0.9355% 1/25/36 (h)(m) | | 80 | | 21 |
Series 2006-1: | | | | |
Class A2, 0.5955% 4/25/36 (h)(m) | | 149 | | 110 |
Class M1, 0.6155% 4/25/36 (h)(m) | | 53 | | 32 |
Class M2, 0.6355% 4/25/36 (h)(m) | | 56 | | 31 |
Class M3, 0.6555% 4/25/36 (h)(m) | | 48 | | 25 |
Class M4, 0.7555% 4/25/36 (h)(m) | | 27 | | 13 |
Class M5, 0.7955% 4/25/36 (h)(m) | | 27 | | 9 |
Class M6, 0.8755% 4/25/36 (h)(m) | | 53 | | 18 |
Series 2006-2A: | | | | |
Class A1, 0.4655% 7/25/36 (h)(m) | | 2,217 | | 1,563 |
Class A2, 0.5155% 7/25/36 (h)(m) | | 132 | | 93 |
Class B1, 1.1055% 7/25/36 (h)(m) | | 49 | | 7 |
Class B3, 2.9355% 7/25/36 (h)(m) | | 46 | | 1 |
Class M1, 0.5455% 7/25/36 (h)(m) | | 138 | | 45 |
Class M2, 0.5655% 7/25/36 (h)(m) | | 97 | | 29 |
Class M3, 0.5855% 7/25/36 (h)(m) | | 81 | | 18 |
Class M4, 0.6555% 7/25/36 (h)(m) | | 55 | | 12 |
Class M5, 0.7055% 7/25/36 (h)(m) | | 67 | | 13 |
Class M6, 0.7755% 7/25/36 (h)(m) | | 100 | | 16 |
Series 2006-3A: | | | | |
Class B1, 1.0355% 10/25/36 (h)(m) | | 3 | | 0* |
Class M4, 0.6655% 10/25/36 (h)(m) | | 109 | | 16 |
Class M5, 0.7155% 10/25/36 (h)(m) | | 130 | | 8 |
Class M6, 0.7955% 10/25/36 (h)(m) | | 255 | | 6 |
Series 2006-4A: | | | | |
Class A1, 0.4655% 12/25/36 (h)(m) | | 559 | | 380 |
Class A2, 0.5055% 12/25/36 (h)(m) | | 2,735 | | 1,274 |
Class B1, 0.9355% 12/25/36 (h)(m) | | 54 | | 1 |
Class M1, 0.5255% 12/25/36 (h)(m) | | 182 | | 37 |
Class M2, 0.5455% 12/25/36 (h)(m) | | 121 | | 19 |
Class M3, 0.5755% 12/25/36 (h)(m) | | 123 | | 17 |
Class M4, 0.6355% 12/25/36 (h)(m) | | 147 | | 17 |
Class M5, 0.6755% 12/25/36 (h)(m) | | 135 | | 11 |
Class M6, 0.7555% 12/25/36 (h)(m) | | 121 | | 7 |
Series 2007-1 Class A2, 0.5055% 3/25/37 (h)(m) | | 561 | | 302 |
Commercial Mortgage Securities - continued |
| Principal Amount (000s) | | Value (000s) |
Bayview Commercial Asset Trust: - continued | | | | |
floater: | | | | |
Series 2007-2A: | | | | |
Class A1, 0.5055% 7/25/37 (h)(m) | | $ 534 | | $ 301 |
Class A2, 0.5555% 7/25/37 (h)(m) | | 501 | | 166 |
Class B1, 1.8355% 7/25/37 (h)(m) | | 73 | | 1 |
Class M1, 0.6055% 7/25/37 (h)(m) | | 176 | | 46 |
Class M2, 0.6455% 7/25/37 (h)(m) | | 96 | | 12 |
Class M3, 0.7255% 7/25/37 (h)(m) | | 97 | | 9 |
Class M4, 0.8855% 7/25/37 (h)(m) | | 192 | | 15 |
Class M5, 0.9855% 7/25/37 (h)(m) | | 170 | | 12 |
Class M6, 1.2355% 7/25/37 (h)(m) | | 215 | | 11 |
Series 2007-3: | | | | |
Class A2, 0.5255% 7/25/37 (h)(m) | | 572 | | 290 |
Class B1, 1.1855% 7/25/37 (h)(m) | | 128 | | 9 |
Class B2, 1.8355% 7/25/37 (h)(m) | | 299 | | 16 |
Class M1, 0.5455% 7/25/37 (h)(m) | | 114 | | 27 |
Class M2, 0.5755% 7/25/37 (h)(m) | | 122 | | 22 |
Class M3, 0.6055% 7/25/37 (h)(m) | | 191 | | 26 |
Class M4, 0.7355% 7/25/37 (h)(m) | | 301 | | 35 |
Class M5, 0.8355% 7/25/37 (h)(m) | | 157 | | 16 |
Class M6, 1.0355% 7/25/37 (h)(m) | | 119 | | 10 |
Series 2007-4A: | | | | |
Class M1, 1.1855% 9/25/37 (h)(m) | | 202 | | 13 |
Class M2, 1.2855% 9/25/37 (h)(m) | | 202 | | 11 |
Class M4, 1.8355% 9/25/37 (h)(m) | | 514 | | 21 |
Class M5, 1.9855% 9/25/37 (h)(m) | | 514 | | 16 |
Class M6, 2.1855% 9/25/37 (h)(m) | | 336 | | 8 |
Series 2004-1, Class IO, 1.25% 4/25/34 (h)(o) | | 1,565 | | 63 |
Series 2007-5A, Class IO, 4.1484% 10/25/37 (h)(m)(o) | | 4,002 | | 346 |
Bear Stearns Commercial Mortgage Securities Trust: | | | | |
floater: | | | | |
Series 2006-BBA7: | | | | |
Class H, 0.8895% 3/15/19 (h)(m) | | 304 | | 293 |
Class J, 1.0895% 3/15/19 (h)(m) | | 309 | | 283 |
Series 2007-BBA8: | | | | |
Class D, 0.4895% 3/15/22 (h)(m) | | 452 | | 408 |
Class E, 0.5395% 3/15/22 (h)(m) | | 2,347 | | 2,072 |
Class F, 0.5895% 3/15/22 (h)(m) | | 1,440 | | 1,242 |
Class G, 0.6395% 3/15/22 (h)(m) | | 369 | | 311 |
Class H, 0.7895% 3/15/22 (h)(m) | | 452 | | 372 |
Class J, 0.9395% 3/15/22 (h)(m) | | 452 | | 361 |
Commercial Mortgage Securities - continued |
| Principal Amount (000s) | | Value (000s) |
Bear Stearns Commercial Mortgage Securities Trust: - continued | | | | |
sequential payer: | | | | |
Series 2004-PWR3 Class A3, 4.487% 2/11/41 | | $ 209 | | $ 211 |
Series 2007-PW15 Class AAB, 5.315% 2/11/44 | | 2,468 | | 2,573 |
Series 2007-PW16: | | | | |
Class A4, 5.7154% 6/11/40 (m) | | 534 | | 626 |
Class AAB, 5.7154% 6/11/40 (m) | | 4,593 | | 4,941 |
Series 2007-PW18: | | | | |
Class A2, 5.613% 6/11/50 | | 208 | | 212 |
Class A4, 5.7% 6/11/50 | | 4,380 | | 5,138 |
Series 2006-PW13 Class A3, 5.518% 9/11/41 | | 3,219 | | 3,366 |
Series 2006-PW14 Class X2, 0.6677% 12/11/38 (h)(m)(o) | | 9,603 | | 78 |
Series 2006-T22 Class A4, 5.5391% 4/12/38 (m) | | 114 | | 130 |
Series 2006-T24 Class X2, 0.4455% 10/12/41 (h)(m)(o) | | 2,380 | | 11 |
Series 2007-PW18 Class X2, 0.3156% 6/11/50 (h)(m)(o) | | 64,191 | | 599 |
Series 2007-T28 Class X2, 0.1576% 9/11/42 (h)(m)(o) | | 34,536 | | 184 |
Berkeley Federal Bank & Trust FSB Series 1994-1 Class B, 0% 8/1/24 (h)(m) | | 460 | | 249 |
C-BASS Trust floater Series 2006-SC1 Class A, 0.5055% 5/25/36 (h)(m) | | 534 | | 462 |
CDC Commercial Mortgage Trust Series 2002-FX1: | | | | |
Class G, 6.625% 5/15/35 (h) | | 1,072 | | 1,105 |
Class XCL, 1.331% 5/15/35 (h)(m)(o) | | 3,655 | | 71 |
Citigroup Commercial Mortgage Trust: | | | | |
floater Series 2006-FL2: | | | | |
Class G, 0.5693% 8/15/21 (h)(m) | | 88 | | 87 |
Class H, 0.6093% 8/15/21 (h)(m) | | 324 | | 309 |
Series 2007-C6: | | | | |
Class A2, 5.7002% 12/10/49 (m) | | 803 | | 803 |
Class A4, 5.7002% 12/10/49 (m) | | 3,035 | | 3,543 |
Series 2008-C7 Class A2B, 6.0731% 12/10/49 (m) | | 583 | | 597 |
Citigroup/Deutsche Bank Commercial Mortgage Trust: | | | | |
sequential payer Series 2007-CD4 Class A4, 5.322% 12/11/49 | | 12,448 | | 14,034 |
Series 2007-CD4 Class A3, 5.293% 12/11/49 | | 888 | | 939 |
Cobalt CMBS Commercial Mortgage Trust: | | | | |
sequential payer Series 2007-C3 Class A3, 5.8108% 5/15/46 (m) | | 912 | | 980 |
Series 2006-C1 Class B, 5.359% 8/15/48 | | 2,736 | | 397 |
Commercial Mortgage Securities - continued |
| Principal Amount (000s) | | Value (000s) |
COMM pass-thru certificates: | | | | |
floater: | | | | |
Series 2005-F10A Class J, 1.0895% 4/15/17 (h)(m) | | $ 95 | | $ 87 |
Series 2005-FL11: | | | | |
Class C, 0.5395% 11/15/17 (h)(m) | | 560 | | 532 |
Class D, 0.5795% 11/15/17 (h)(m) | | 29 | | 27 |
Class E, 0.6295% 11/15/17 (h)(m) | | 103 | | 95 |
Class F, 0.6895% 11/15/17 (h)(m) | | 114 | | 103 |
Class G, 0.7395% 11/15/17 (h)(m) | | 79 | | 70 |
Series 2006-CN2A: | | | | |
Class A2FL, 0.4643% 2/5/19 (h)(m) | | 1,042 | | 1,019 |
Class AJFL, 0.5043% 2/5/19 (m) | | 640 | | 625 |
Series 2006-FL12 Class AJ, 0.3695% 12/15/20 (h)(m) | | 1,300 | | 1,187 |
sequential payer: | | | | |
Series 2006-C8 Class A3, 5.31% 12/10/46 | | 2,599 | | 2,652 |
Series 2006-CN2A: | | | | |
Class A2FX, 5.449% 2/5/19 (h) | | 1,193 | | 1,196 |
Class AJFX, 5.478% 2/5/19 (h) | | 2,940 | | 2,944 |
Series 2007-C9 Class A4, 5.8111% 12/10/49 (m) | | 2,018 | | 2,382 |
Series 2006-C8 Class XP, 0.4663% 12/10/46 (m)(o) | | 11,260 | | 70 |
Credit Suisse Commercial Mortgage Trust: | | | | |
sequential payer: | | | | |
Series 2006-C4 Class A3, 5.467% 9/15/39 | | 1,107 | | 1,251 |
Series 2007-C2: | | | | |
Class A2, 5.448% 1/15/49 (m) | | 2,309 | | 2,329 |
Class A3, 5.542% 1/15/49 (m) | | 1,824 | | 2,036 |
Series 2007-C3 Class A4, 5.6792% 6/15/39 (m) | | 549 | | 606 |
Series 2006-C4 Class AAB, 5.439% 9/15/39 | | 2,664 | | 2,698 |
Series 2006-C5 Class ASP, 0.6643% 12/15/39 (m)(o) | | 7,791 | | 64 |
Series 2007-C5 Class A4, 5.695% 9/15/40 (m) | | 825 | | 921 |
Credit Suisse First Boston Mortgage Capital Certificates floater Series 2007-TF2A Class B, 0.5895% 4/15/22 (h)(m) | | 3,254 | | 2,579 |
Credit Suisse First Boston Mortgage Securities Corp.: | | | | |
sequential payer Series 2004-C1 Class A4, 4.75% 1/15/37 | | 417 | | 435 |
Series 2001-CK6 Class AX, 0.9973% 8/15/36 (m)(o) | | 239 | | 0* |
Series 2001-CKN5 Class AX, 1.7514% 9/15/34 (h)(m)(o) | | 824 | | 1 |
Series 2006-C1 Class A3, 5.4157% 2/15/39 (m) | | 3,257 | | 3,334 |
Commercial Mortgage Securities - continued |
| Principal Amount (000s) | | Value (000s) |
Credit Suisse Mortgage Capital Certificates: | | | | |
floater Series 2007-TFL1: | | | | |
Class B, 0.3895% 2/15/22 (h)(m) | | $ 345 | | $ 323 |
Class C: | | | | |
0.4095% 2/15/22 (h)(m) | | 1,416 | | 1,311 |
0.5095% 2/15/22 (h)(m) | | 506 | | 458 |
Class F, 0.5595% 2/15/22 (h)(m) | | 1,011 | | 906 |
Series 2007-C1: | | | | |
Class ASP, 0.3813% 2/15/40 (m)(o) | | 13,229 | | 74 |
Class B, 5.487% 2/15/40 (h)(m) | | 1,394 | | 178 |
First Union National Bank-Bank of America Commercial Mortgage Trust Series 2001-C1 Class G, 6.936% 3/15/33 (h) | | 85 | | 85 |
GE Capital Commercial Mortgage Corp.: | | | | |
sequential payer Series 2007-C1 Class A4, 5.543% 12/10/49 | | 9,244 | | 10,357 |
Series 2001-1 Class X1, 1.4912% 5/15/33 (h)(m)(o) | | 599 | | 7 |
Series 2007-C1 Class XP, 0.1588% 12/10/49 (m)(o) | | 14,041 | | 46 |
Greenwich Capital Commercial Funding Corp.: | | | | |
floater Series 2006-FL4 Class B, 0.4343% 11/5/21 (h)(m) | | 343 | | 325 |
sequential payer: | | | | |
Series 2007-GG11 Class A2, 5.597% 12/10/49 | | 1,594 | | 1,642 |
Series 2007-GG9 Class A4, 5.444% 3/10/39 | | 13,982 | | 15,826 |
Series 2006-GG7 Class A3, 5.8738% 7/10/38 (m) | | 380 | | 380 |
Series 2007-GG11 Class A1, 0.2519% 12/10/49 (h)(m)(o) | | 17,354 | | 89 |
GS Mortgage Securities Corp. II: | | | | |
floater: | | | | |
Series 2006-FL8A: | | | | |
Class E, 0.6158% 6/6/20 (h)(m) | | 207 | | 205 |
Class F, 0.6858% 6/6/20 (h)(m) | | 634 | | 624 |
Series 2007-EOP: | | | | |
Class C, 2.0056% 3/6/20 (h)(m) | | 1,144 | | 1,133 |
Class D, 2.2018% 3/6/20 (h)(m) | | 2,144 | | 2,124 |
Class F, 2.6334% 3/6/20 (h)(m) | | 94 | | 93 |
Class G, 2.7903% 3/6/20 (h)(m) | | 47 | | 47 |
Class H, 3.3004% 3/6/20 (h)(m) | | 42 | | 42 |
Class J, 4.0852% 3/6/20 (h)(m) | | 60 | | 60 |
Series 2006-GG6 Class A2, 5.506% 4/10/38 | | 2,198 | | 2,200 |
GS Mortgage Securities Trust sequential payer: | | | | |
Series 2006-GG8 Class A2, 5.479% 11/10/39 | | 273 | | 277 |
Series 2007-GG10 Class A2, 5.778% 8/10/45 | | 204 | | 207 |
Commercial Mortgage Securities - continued |
| Principal Amount (000s) | | Value (000s) |
JPMorgan Chase Commercial Mortgage Securities Trust: | | | | |
floater Series 2006-FLA2: | | | | |
Class B, 0.4095% 11/15/18 (h)(m) | | $ 455 | | $ 443 |
Class C, 0.4495% 11/15/18 (h)(m) | | 323 | | 311 |
Class D, 0.4695% 11/15/18 (h)(m) | | 143 | | 135 |
Class E, 0.5195% 11/15/18 (h)(m) | | 205 | | 190 |
Class F, 0.5695% 11/15/18 (h)(m) | | 308 | | 272 |
Class G, 0.5995% 11/15/18 (h)(m) | | 268 | | 226 |
Class H, 0.7395% 11/15/18 (h)(m) | | 205 | | 165 |
sequential payer: | | | | |
Series 2006-CB14 Class A3B, 5.4914% 12/12/44 (m) | | 2,241 | | 2,291 |
Series 2006-LDP8 Class A4, 5.399% 5/15/45 | | 581 | | 668 |
Series 2006-LDP9: | | | | |
Class A2, 5.134% 5/15/47 (m) | | 291 | | 305 |
Class A3, 5.336% 5/15/47 | | 9,635 | | 10,895 |
Series 2007-CB19 Class A4, 5.7337% 2/12/49 (m) | | 3,198 | | 3,708 |
Series 2007-LD11 Class A2, 5.7998% 6/15/49 (m) | | 2,000 | | 2,060 |
Series 2007-LDPX: | | | | |
Class A2 S, 5.305% 1/15/49 | | 1,337 | | 1,348 |
Class A3, 5.42% 1/15/49 | | 14,834 | | 16,929 |
Series 2005-LDP3 Class A3, 4.959% 8/15/42 | | 1,197 | | 1,213 |
Series 2006-CB17 Class A3, 5.45% 12/12/43 | | 239 | | 240 |
Series 2007-CB19: | | | | |
Class B, 5.7337% 2/12/49 (m) | | 78 | | 26 |
Class C, 5.7337% 2/12/49 (m) | | 204 | | 43 |
Class D, 5.7337% 2/12/49 (m) | | 214 | | 44 |
Series 2007-LDP10: | | | | |
Class CS, 5.466% 1/15/49 (m) | | 75 | | 6 |
Class ES, 5.5652% 1/15/49 (h)(m) | | 472 | | 21 |
LB Commercial Conduit Mortgage Trust sequential payer Series 2007-C3 Class A4, 5.8846% 7/15/44 (m) | | 743 | | 874 |
LB Multi-family Mortgage Trust Series 1991-4 Class A1, 7.1114% 4/25/21 (m) | | 25 | | 17 |
LB-UBS Commercial Mortgage Trust: | | | | |
sequential payer: | | | | |
Series 2006-C1 Class A2, 5.084% 2/15/31 | | 123 | | 124 |
Series 2006-C6 Class A2, 5.262% 9/15/39 (m) | | 50 | | 50 |
Series 2006-C7: | | | | |
Class A2, 5.3% 11/15/38 | | 530 | | 539 |
Class A3, 5.347% 11/15/38 | | 679 | | 777 |
Commercial Mortgage Securities - continued |
| Principal Amount (000s) | | Value (000s) |
LB-UBS Commercial Mortgage Trust: - continued | | | | |
sequential payer: | | | | |
Series 2007-C1 Class A4, 5.424% 2/15/40 | | $ 2,738 | | $ 3,148 |
Series 2007-C2 Class A3, 5.43% 2/15/40 | | 1,980 | | 2,247 |
Series 2006-C6 Class XCP, 0.6747% 9/15/39 (m)(o) | | 3,889 | | 27 |
Series 2007-C1 Class XCP, 0.4243% 2/15/40 (m)(o) | | 1,454 | | 9 |
Series 2007-C6 Class A4, 5.858% 7/15/40 (m) | | 1,140 | | 1,332 |
Series 2007-C7 Class XCP, 0.2615% 9/15/45 (m)(o) | | 58,561 | | 383 |
Lehman Brothers Floating Rate Commercial Mortgage Trust floater Series 2006-LLFA: | | | | |
Class D, 0.4695% 9/15/21 (h)(m) | | 292 | | 278 |
Class E, 0.5295% 9/15/21 (h)(m) | | 1,054 | | 975 |
Class F, 0.5795% 9/15/21 (h)(m) | | 868 | | 781 |
Class G, 0.5995% 9/15/21 (h)(m) | | 1,714 | | 1,500 |
Class H, 0.6395% 9/15/21 (h)(m) | | 442 | | 371 |
Merrill Lynch Mortgage Trust: | | | | |
Series 2005-LC1 Class F, 5.3733% 1/12/44 (h)(m) | | 793 | | 521 |
Series 2006-C1 Class A2, 5.6141% 5/12/39 (m) | | 808 | | 826 |
Series 2007-C1 Class A4, 5.8461% 6/12/50 (m) | | 3,452 | | 3,895 |
Series 2008-C1 Class A4, 5.69% 2/12/51 | | 1,947 | | 2,283 |
Merrill Lynch-CFC Commercial Mortgage Trust: | | | | |
floater Series 2006-4 Class A2FL, 0.3688% 12/12/49 (m) | | 92 | | 92 |
sequential payer: | | | | |
Series 2006-1 Class A3, 5.4796% 2/12/39 (m) | | 967 | | 966 |
Series 2006-4 Class ASB, 5.133% 12/12/49 (m) | | 667 | | 702 |
Series 2007-5: | | | | |
Class A3, 5.364% 8/12/48 | | 356 | | 361 |
Class B, 5.479% 8/12/48 | | 2,736 | | 672 |
Series 2007-6 Class A4, 5.485% 3/12/51 (m) | | 7,400 | | 8,236 |
Series 2007-7 Class A4, 5.7386% 6/12/50 (m) | | 3,192 | | 3,490 |
Series 2006-3 Class ASB, 5.382% 7/12/46 (m) | | 3,136 | | 3,232 |
Series 2006-4 Class XP, 0.617% 12/12/49 (m)(o) | | 13,978 | | 193 |
Series 2007-6 Class B, 5.635% 3/12/51 (m) | | 912 | | 228 |
Series 2007-7 Class B, 5.7386% 6/12/50 (m) | | 79 | | 5 |
Series 2007-8 Class A3, 5.9634% 8/12/49 (m) | | 787 | | 898 |
Morgan Stanley Capital I Trust: | | | | |
floater: | | | | |
Series 2006-XLF Class C, 1.44% 7/15/19 (h)(m) | | 272 | | 171 |
Series 2007-XLFA: | | | | |
Class C, 0.4% 10/15/20 (h)(m) | | 523 | | 473 |
Class D, 0.43% 10/15/20 (h)(m) | | 507 | | 448 |
Class E, 0.49% 10/15/20 (h)(m) | | 634 | | 539 |
Class F, 0.54% 10/15/20 (h)(m) | | 380 | | 316 |
Commercial Mortgage Securities - continued |
| Principal Amount (000s) | | Value (000s) |
Morgan Stanley Capital I Trust: - continued | | | | |
floater: | | | | |
Series 2007-XLFA: | | | | |
Class G, 0.58% 10/15/20 (h)(m) | | $ 470 | | $ 365 |
Class H, 0.67% 10/15/20 (h)(m) | | 296 | | 192 |
Class J, 0.82% 10/15/20 (h)(m) | | 173 | | 69 |
sequential payer: | | | | |
Series 2005-IQ9 Class A3, 4.54% 7/15/56 | | 862 | | 873 |
Series 2007-HQ11 Class A31, 5.439% 2/12/44 (m) | | 462 | | 486 |
Series 2006-HQ10 Class X2, 0.4951% 11/12/41 (h)(m)(o) | | 6,124 | | 6 |
Series 2006-IQ11: | | | | |
Class A3, 5.6877% 10/15/42 (m) | | 280 | | 285 |
Class A4, 5.7237% 10/15/42 (m) | | 274 | | 311 |
Series 2006-T23 Class A3, 5.809% 8/12/41 (m) | | 466 | | 484 |
Series 2007-IQ14: | | | | |
Class A4, 5.692% 4/15/49 (m) | | 1,368 | | 1,544 |
Class AAB, 5.654% 4/15/49 | | 2,564 | | 2,766 |
Class B, 5.7187% 4/15/49 (m) | | 224 | | 67 |
Wachovia Bank Commercial Mortgage Trust: | | | | |
floater: | | | | |
Series 2006-WL7A: | | | | |
Class E, 0.518% 9/15/21 (h)(m) | | 1,239 | | 1,065 |
Class F, 0.578% 9/15/21 (h)(m) | | 1,426 | | 1,169 |
Class G, 0.598% 9/15/21 (h)(m) | | 1,351 | | 1,053 |
Class J, 0.838% 9/15/21 (h)(m) | | 300 | | 198 |
Series 2007-WHL8: | | | | |
Class F, 0.7195% 6/15/20 (h)(m) | | 3,171 | | 2,334 |
Class LXR1, 0.9395% 6/15/20 (h)(m) | | 112 | | 97 |
sequential payer: | | | | |
Series 2003-C7 Class A1, 4.241% 10/15/35 (h) | | 579 | | 583 |
Series 2003-C8 Class A3, 4.445% 11/15/35 | | 3,157 | | 3,200 |
Series 2006-C29 Class A3, 5.313% 11/15/48 | | 2,422 | | 2,536 |
Series 2007-C30: | | | | |
Class A3, 5.246% 12/15/43 | | 291 | | 294 |
Class A4, 5.305% 12/15/43 | | 268 | | 288 |
Class A5, 5.342% 12/15/43 | | 14,776 | | 16,356 |
Series 2007-C31: | | | | |
Class A4, 5.509% 4/15/47 | | 18,661 | | 21,151 |
Class A5, 5.5% 4/15/47 | | 16,000 | | 17,771 |
Series 2003-C6 Class G, 5.125% 8/15/35 (h)(m) | | 433 | | 432 |
Series 2005-C19 Class B, 4.892% 5/15/44 | | 912 | | 842 |
Series 2005-C22: | | | | |
Class B, 5.3564% 12/15/44 (m) | | 2,022 | | 1,400 |
Commercial Mortgage Securities - continued |
| Principal Amount (000s) | | Value (000s) |
Wachovia Bank Commercial Mortgage Trust: - continued | | | | |
Series 2005-C22: | | | | |
Class F, 5.3564% 12/15/44 (h)(m) | | $ 1,521 | | $ 298 |
Series 2006-C23 Class A5, 5.416% 1/15/45 (m) | | 5,005 | | 5,640 |
Series 2007-C30: | | | | |
Class C, 5.483% 12/15/43 (m) | | 2,736 | | 770 |
Class D, 5.513% 12/15/43 (m) | | 1,459 | | 296 |
Class XP, 0.4723% 12/15/43 (h)(m)(o) | | 7,893 | | 57 |
Series 2007-C31 Class C, 5.6821% 4/15/47 (m) | | 251 | | 57 |
Series 2007-C31A Class A2, 5.421% 4/15/47 | | 5,607 | | 5,817 |
Series 2007-C32: | | | | |
Class D, 5.7418% 6/15/49 (m) | | 685 | | 185 |
Class E, 5.7418% 6/15/49 (m) | | 1,080 | | 255 |
Wachovia Bank Commercial Mortgage Trust pass-thru certificates sequential payer Series 2007-C33: | | | | |
Class A4, 5.9003% 2/15/51 (m) | | 2,110 | | 2,456 |
Class A5, 5.9003% 2/15/51 (m) | | 10,259 | | 11,914 |
TOTAL COMMERCIAL MORTGAGE SECURITIES (Cost $283,967) |
337,636
|
Municipal Securities - 0.3% |
|
Beaver County Indl. Dev. Auth. Poll. Cont. Rev. Bonds (FirstEnergy Nuclear Generation Corp. Proj.) Series 2005 A, 3.375%, tender 7/1/15 (m) | | 1,700 | | 1,765 |
California Gen. Oblig.: | | | | |
Series 2009, 7.35% 11/1/39 | | 860 | | 1,117 |
7.3% 10/1/39 | | 9,280 | | 11,976 |
7.5% 4/1/34 | | 7,195 | | 9,374 |
7.55% 4/1/39 | | 4,645 | | 6,219 |
7.6% 11/1/40 | | 5,140 | | 6,967 |
7.625% 3/1/40 | | 2,095 | | 2,818 |
Illinois Gen. Oblig.: | | | | |
Series 2010, 4.421% 1/1/15 | | 4,050 | | 4,306 |
Series 2010-1, 6.63% 2/1/35 | | 10,410 | | 11,575 |
Series 2010-3: | | | | |
6.725% 4/1/35 | | 1,710 | | 1,920 |
7.35% 7/1/35 | | 1,385 | | 1,645 |
Series 2011, 5.877% 3/1/19 | | 1,490 | | 1,666 |
5.1% 6/1/33 | | 4,555 | | 4,404 |
TOTAL MUNICIPAL SECURITIES (Cost $62,991) |
65,752
|
Floating Rate Loans - 0.9% |
| Principal Amount (000s) | | Value (000s) |
CONSUMER DISCRETIONARY - 0.2% |
Hotels, Restaurants & Leisure - 0.1% |
Fantasy Springs Resort Casino term loan 8/6/49 (d) | | $ 8,722 | | $ 6,803 |
Graton Economic Development Authority Tranche B, term loan 9.75% 8/22/18 (m) | | 600 | | 601 |
Landry's Restaurants, Inc. Tranche B, term loan 6.5% 4/24/18 (m) | | 2,539 | | 2,564 |
Town Sports International LLC Tranche B, term loan 5.75% 5/11/18 (m) | | 3,018 | | 3,037 |
| | 13,005 |
Media - 0.1% |
Dallas Sports & Entertainment LP term loan 3.5908% 11/18/16 (m) | | 12 | | 11 |
Houghton Mifflin Harcourt Publishing Co. term loan 7.25% 5/22/18 (m) | | 175 | | 177 |
Newsday LLC term loan 10.5% 8/1/13 | | 7,000 | | 7,009 |
RCN Telecom Services, LLC Tranche B, term loan 5.25% 8/21/16 (m) | | 505 | | 506 |
Tribune Co. Tranche X, term loan 3/17/09 (d) | | 1,188 | | 891 |
Univision Communications, Inc. term loan 4.4815% 3/31/17 (m) | | 3,024 | | 2,926 |
WideOpenWest Finance LLC Tranche B, term loan 6.25% 7/17/18 (m) | | 3,420 | | 3,424 |
| | 14,944 |
Specialty Retail - 0.0% |
Michaels Stores, Inc. Tranche B1, term loan 2.75% 10/31/13 (m) | | 4,256 | | 4,261 |
Sports Authority, Inc. Tranche B, term loan 7.5% 11/16/17 (m) | | 4,891 | | 4,829 |
| | 9,090 |
TOTAL CONSUMER DISCRETIONARY | | 37,039 |
CONSUMER STAPLES - 0.0% |
Food & Staples Retailing - 0.0% |
Sprouts Farmers Market LLC Tranche B, term loan 6% 4/18/18 (m) | | 5,930 | | 5,885 |
SUPERVALU, Inc. Tranche B, term loan 8% 8/10/19 (m) | | 2,070 | | 2,062 |
| | 7,947 |
Floating Rate Loans - continued |
| Principal Amount (000s) | | Value (000s) |
ENERGY - 0.0% |
Oil, Gas & Consumable Fuels - 0.0% |
Arch Coal, Inc. Tranche B, term loan 5.75% 5/16/18 (m) | | $ 870 | | $ 870 |
Chesapeake Energy Corp. term loan 8.5% 12/2/17 (m) | | 5,690 | | 5,697 |
Crestwood Holdings Partners LLC Tranche B, term loan 9.75% 3/26/18 (m) | | 1,656 | | 1,685 |
| | 8,252 |
FINANCIALS - 0.1% |
Insurance - 0.1% |
Asurion Corp.: | | | | |
Tranche 1st LN, term loan 5.5% 5/24/18 (m) | | 6,043 | | 6,058 |
Tranche 2nd LN, term loan 9% 5/24/19 (m) | | 2,769 | | 2,859 |
Tranche B-1 1LN, term loan 4.75% 7/23/17 (m) | | 1,285 | | 1,283 |
Lonestar Intermediate Super Holdings LLC term loan 11% 9/2/19 (m) | | 2,755 | | 2,927 |
| | 13,127 |
Real Estate Management & Development - 0.0% |
Realogy Corp.: | | | | |
Credit-Linked Deposit 4.4958% 10/10/16 (m) | | 778 | | 754 |
term loan 4.4893% 10/10/16 (m) | | 6,221 | | 6,034 |
| | 6,788 |
TOTAL FINANCIALS | | 19,915 |
HEALTH CARE - 0.0% |
Health Care Providers & Services - 0.0% |
Genoa Healthcare Group LLC Tranche 2LN, term loan 14% 2/10/15 (m) | | 2,273 | | 1,585 |
INDUSTRIALS - 0.1% |
Airlines - 0.0% |
US Airways Group, Inc. term loan 2.7355% 3/23/14 (m) | | 4,465 | | 4,342 |
Building Products - 0.0% |
HD Supply, Inc. Tranche B 1LN, term loan 7.25% 10/12/17 (m) | | 1,565 | | 1,604 |
Commercial Services & Supplies - 0.0% |
Brand Energy & Infrastructure Services, Inc. Tranche 2LN, term loan 6.325% 2/7/15 (m) | | 985 | | 906 |
Floating Rate Loans - continued |
| Principal Amount (000s) | | Value (000s) |
INDUSTRIALS - continued |
Professional Services - 0.1% |
AlixPartners LLP: | | | | |
Tranche 1LN, term loan 6.5% 6/29/19 (m) | | $ 5,250 | | $ 5,276 |
Tranche 2LN, term loan 10.75% 12/29/19 (m) | | 5,250 | | 5,237 |
| | 10,513 |
Trading Companies & Distributors - 0.0% |
Fly Funding II Sarl Tranche B, term loan 6.75% 8/8/18 (m) | | 200 | | 197 |
TOTAL INDUSTRIALS | | 17,562 |
INFORMATION TECHNOLOGY - 0.3% |
Communications Equipment - 0.1% |
Avaya, Inc. term loan 3.1769% 10/27/14 (m) | | 1,779 | | 1,703 |
SafeNet, Inc. Tranche 2LN, term loan 6.2335% 4/12/15 (m) | | 7,500 | | 7,294 |
| | 8,997 |
IT Services - 0.1% |
First Data Corp. term loan 4.2365% 3/24/18 (m) | | 12,590 | | 11,898 |
Software - 0.1% |
Kronos, Inc. Tranche B 2LN, term loan 10.4606% 6/11/18 (m) | | 23,730 | | 24,205 |
Lawson Software, Inc. Tranche B, term loan 6.25% 4/5/18 (m) | | 2,838 | | 2,873 |
| | 27,078 |
TOTAL INFORMATION TECHNOLOGY | | 47,973 |
MATERIALS - 0.0% |
Containers & Packaging - 0.0% |
Klockner Pentaplast SA Tranche B 1LN, term loan 6.75% 12/21/16 (m) | | 165 | | 165 |
TELECOMMUNICATION SERVICES - 0.1% |
Diversified Telecommunication Services - 0.0% |
FairPoint Communications, Inc. term loan 6.5% 1/24/16 (m) | | 7,508 | | 6,982 |
Telesat Holding, Inc. Tranche B, term loan 4.25% 3/28/19 (m) | | 4,285 | | 4,285 |
| | 11,267 |
Floating Rate Loans - continued |
| Principal Amount (000s) | | Value (000s) |
TELECOMMUNICATION SERVICES - continued |
Wireless Telecommunication Services - 0.1% |
Vodafone Americas Finance 2, Inc.: | | | | |
2nd LN, term loan 6.25% 6/24/16 pay-in-kind | | $ 12,741 | | $ 12,885 |
term loan 6.875% 8/11/15 | | 1,761 | | 1,828 |
| | 14,713 |
TOTAL TELECOMMUNICATION SERVICES | | 25,980 |
UTILITIES - 0.1% |
Electric Utilities - 0.1% |
Texas Competitive Electric Holdings Co. LLC/Texas Competitive Electric Holdings Finance, Inc. Tranche B, term loan 4.7685% 10/10/17 (m) | | 17,766 | | 11,881 |
Gas Utilities - 0.0% |
Everest Acquisition LLC Tranche B1, term loan 5% 4/24/18 (m) | | 730 | | 732 |
Independent Power Producers & Energy Traders - 0.0% |
LSP Madison Funding LLC Tranche 1LN, term loan 5.5% 6/28/19 (m) | | 1,575 | | 1,575 |
TOTAL UTILITIES | | 14,188 |
TOTAL FLOATING RATE LOANS (Cost $177,796) |
180,606
|
Bank Notes - 0.0% |
|
Wachovia Bank NA 6% 11/15/17
(Cost $3,313) | | 3,066 | |
3,672
|
Fixed-Income Funds - 9.8% |
| Shares | | |
Fidelity Corporate Bond 1-10 Year Central Fund (n) | 2,529,627 | | 286,809 |
Fidelity Mortgage Backed Securities Central Fund (n) | 14,912,423 | | 1,638,428 |
TOTAL FIXED-INCOME FUNDS (Cost $1,802,136) |
1,925,237
|
Money Market Funds - 4.2% |
| Shares | | Value (000s) |
Fidelity Cash Central Fund, 0.17% (b) | 782,044,537 | | $ 782,045 |
Fidelity Securities Lending Cash Central Fund, 0.18% (b)(c) | 45,921,937 | | 45,922 |
TOTAL MONEY MARKET FUNDS (Cost $827,967) |
827,967
|
TOTAL INVESTMENT PORTFOLIO - 104.2% (Cost $17,523,271) | | 20,569,069 |
NET OTHER ASSETS (LIABILITIES) - (4.2)% | | (836,370) |
NET ASSETS - 100% | $ 19,732,699 |
TBA Sale Commitments |
| Principal Amount (000s) | | |
Fannie Mae |
3% 9/1/42 | $ (173,000) | | (179,517) |
3% 9/1/42 | (11,300) | | (11,726) |
3% 9/1/42 | (2,300) | | (2,387) |
3% 9/1/42 | (11,300) | | (11,726) |
3% 9/1/42 | (174,400) | | (180,967) |
3.5% 9/1/42 | (159,000) | | (168,590) |
4% 9/1/42 | (23,900) | | (25,629) |
4.5% 9/1/42 | (26,100) | | (28,249) |
5% 9/1/42 | (30,900) | | (33,749) |
5.5% 9/1/42 | (12,000) | | (13,169) |
6% 9/1/42 | (29,000) | | (31,957) |
TOTAL FANNIE MAE | | (687,666) |
TBA Sale Commitments - continued |
| Principal Amount (000s) | | Value (000s) |
Freddie Mac |
5% 9/1/42 | $ (2,000) | | $ (2,168) |
Ginnie Mae |
3.5% 9/1/42 | (8,700) | | (9,418) |
3.5% 9/1/42 | (4,300) | | (4,655) |
4% 9/1/42 | (3,500) | | (3,839) |
TOTAL GINNIE MAE | | (17,912) |
TOTAL TBA SALE COMMITMENTS (Proceeds $705,187) | $ (707,746) |
Swap Agreements |
| Expiration Date | | Notional Amount (000s)(l) | | Value (000s) |
Credit Default Swaps |
Receive monthly a fixed rate of .15% multiplied by the notional amount and pay to Credit Suisse First Boston upon each credit event of one of the issues of ABX AA 07-01 Index, par value of the proportional notional amount (Rating-C) (Upfront Premium Received/(Paid) $2,560,000)(k) | Sept. 2037 | | $ 4,450 | | $ (4,223) |
Receive monthly a fixed rate of .15% multiplied by the notional amount and pay to JPMorgan Chase, Inc. upon each credit event of one of the issues of ABX AA 07-01 Index, par value of the proportional notional amount (Rating-C) (Upfront Premium Received/(Paid) $2,398,000)(k) | Sept. 2037 | | 3,647 | | (3,461) |
Receive monthly a fixed rate of .15% multiplied by the notional amount and pay to JPMorgan Chase, Inc. upon each credit event of one of the issues of ABX AA 07-01 Index, par value of the proportional notional amount (Rating-C) (Upfront Premium Received/(Paid) $566,000)(k) | Sept. 2037 | | 837 | | (794) |
Receive monthly a fixed rate of .15% multiplied by the notional amount and pay to Morgan Stanley, Inc. upon each credit event of one of the issues of ABX AA 07-01 Index, par value of the proportional notional amount (Rating-C) (Upfront Premium Received/(Paid) $2,398,000)(k) | Sept. 2037 | | 3,647 | | (3,461) |
| Expiration Date | | Notional Amount (000s)(l) | | Value (000s) |
Credit Default Swaps |
Receive monthly a fixed rate of .15% multiplied by the notional amount and pay to UBS upon each credit event of one of the issues of ABX AA 07-1 Index, par value of the proportional notional amount (Rating-C) (Upfront Premium Received/(Paid) $2,332,000)(k) | Sept. 2037 | | $ 3,547 | | $ (3,366) |
Receive monthly a fixed rate of .15% multiplied by the notional amount and pay to UBS upon each credit event of one of the issues of ABX AA 07-1 Index, par value of the proportional notional amount (Rating-C) (Upfront Premium Received/(Paid) $2,025,000)(k) | Sept. 2037 | | 3,045 | | (2,890) |
| | $ 19,173 | | $ (18,195) |
Legend |
(a) Non-income producing |
(b) Affiliated fund that is available only to investment companies and other accounts managed by Fidelity Investments. The rate quoted is the annualized seven-day yield of the fund at period end. A complete unaudited listing of the fund's holdings as of its most recent quarter end is available upon request. In addition, each Fidelity Central Fund's financial statements, which are not covered by the Fund's Report of Independent Registered Public Accounting Firm, are available on the SEC's website or upon request. |
(c) Investment made with cash collateral received from securities on loan. |
(d) Non-income producing - Security is in default. |
(e) Security initially issued at one coupon which converts to a higher coupon at a specified date. The rate shown is the rate at period end. |
(f) Security or a portion of the security is on loan at period end. |
(g) Affiliated company |
(h) Security exempt from registration under Rule 144A of the Securities Act of 1933. These securities may be resold in transactions exempt from registration, normally to qualified institutional buyers. At the end of the period, the value of these securities amounted to $660,076,000 or 3.3% of net assets. |
(i) Security or a portion of the security purchased on a delayed delivery or when-issued basis. |
(j) Security or a portion of the security has been segregated as collateral for open swap agreements. At the period end, the value of securities pledged amounted to $22,557,000. |
(k) Represents a credit default swap contract in which the Fund has sold protection on the underlying reference. The underlying reference may be a single-name issuer or a traded credit index. The value of each credit default swap and the credit rating can be measures of the current payment/performance risk. For the underlying reference, ratings disclosed are from Moody's Investors Service, Inc. Where Moody's ratings are not available, S&P ratings are disclosed and are indicated as such. For swaps on a traded credit index, ratings represent a weighted average of the ratings of all securities included in the index. All ratings are as of the report date and do not reflect subsequent changes. Where a credit rating is not disclosed, the value is used as the measure of the payment/performance risk. |
(l) The notional amount of each credit default swap where the Fund has sold protection approximates the maximum potential amount of future payments that the Fund could be required to make if a credit event were to occur. |
(m) Coupon rates for floating and adjustable rate securities reflect the rates in effect at period end. |
(n) Affiliated fund that is available only to investment companies and other accounts managed by Fidelity Investments. A complete unaudited schedule of portfolio holdings for each Fidelity Central Fund is filed with the SEC for the first and third quarters of each fiscal year on Form N-Q and is available upon request or at the SEC's web site at www.sec.gov. An unaudited holdings listing for the Fund, which presents direct holdings as well as the pro rata share of securities and other investments held indirectly through its investment in underlying non-money market Fidelity Central Funds, is available at fidelity.com. In addition, each Fidelity Central Fund's financial statements, which are not covered by the Fund's Report of Independent Registered Public Accounting Firm, are available on the SEC's web site or upon request. |
(o) Security represents right to receive monthly interest payments on an underlying pool of mortgages or assets. Principal shown is the outstanding par amount of the pool as of the end of the period. |
(p) Investment is owned by an entity that is treated as a corporation for U.S. tax purposes which is owned by the Fund. |
(q) Restricted securities - Investment in securities not registered under the Securities Act of 1933 (excluding 144A issues). At the end of the period, the value of restricted securities (excluding 144A issues) amounted to $130,053,000 or 0.7% of net assets. |
Additional information on each restricted holding is as follows: |
Security | Acquisition Date | Acquisition Cost (000s) |
Aspen Aerogels, Inc. 8% 6/1/14 | 6/1/11 | $ 10,000 |
Aspen Aerogels, Inc. 8% 12/6/14 | 12/6/11 - 6/12/12 | $ 3,000 |
Facebook, Inc. Class B | 3/31/11 - 5/19/11 | $ 22,038 |
HMH Holdings, Inc. warrants 6/22/19 | 6/22/12 | $ 4 |
Ivanplats Ltd. 8% 11/10/14 pay-in-kind | 3/28/12 | $ 12,688 |
Legend Pictures LLC | 9/23/10 - 3/30/12 | $ 37,645 |
Station Holdco LLC | 6/17/11 | $ 1,131 |
Station Holdco LLC warrants 6/15/18 | 8/11/08 - 8/15/08 | $ 6,416 |
Vice Holdings, Inc. | 8/3/12 | $ 34,999 |
wetpaint.com, Inc. Series C | 5/14/08 | $ 5,000 |
* Amount represents less than $1,000. |
Affiliated Central Funds |
Information regarding fiscal year to date income earned by the Fund from investments in Fidelity Central Funds is as follows: |
Fund | Income earned
(Amounts in thousands) |
Fidelity Cash Central Fund | $ 1,119 |
Fidelity Corporate Bond 1-10 Year Central Fund | 11,910 |
Fidelity Mortgage Backed Securities Central Fund | 36,099 |
Fidelity Securities Lending Cash Central Fund | 2,162 |
Total | $ 51,290 |
Additional information regarding the Fund's fiscal year to date purchases and sales, including the ownership percentage, of the non Money Market Central Funds is as follows: |
Fund
(Amounts in thousands) | Value, beginning of period | Purchases | Sales Proceeds | Value,
end of
period | % ownership, end of
period |
Fidelity Corporate Bond 1-10 Year Central Fund | $ 277,955 | $ - | $ - | $ 286,809 | 41.7% |
Fidelity Mortgage Backed Securities Central Fund | 1,146,867 | 470,325 | - | 1,638,428 | 10.5% |
Total | $ 1,424,822 | $ 470,325 | $ - | $ 1,925,237 | |
Other Affiliated Issuers |
An affiliated company is a company in which the Fund has ownership of at least 5% of the voting securities. Fiscal year to date transactions with companies which are or were affiliates are as follows: |
Affiliate
(Amounts in thousands) | Value, beginning of period | Purchases | Sales Proceeds | Dividend Income | Value,
end of
period |
AMAG Pharmaceuticals, Inc. | $ 19,625 | $ 5,149 | $ 3,815 | $ - | $ 21,602 |
CareView Communications, Inc. | 14,652 | 376 | - | - | 10,530 |
Neurocrine Biosciences, Inc. | 22,913 | - | - | - | 27,540 |
TherapeuticsMD, Inc. | - | 11,260 | - | - | 18,645 |
Total | $ 57,190 | $ 16,785 | $ 3,815 | $ - | $ 78,317 |
Other Information |
The following is a summary of the inputs used, as of August 31, 2012, involving the Fund's assets and liabilities carried at fair value. The inputs or methodology used for valuing securities may not be an indication of the risk associated with investing in those securities. For more information on valuation inputs, and their aggregation into the levels used in the table below, please refer to the Security Valuation section in the accompanying Notes to Financial Statements. |
Valuation Inputs at Reporting Date: |
Description
(Amounts in thousands) | Total | Level 1 | Level 2 | Level 3 |
Investments in Securities: | | | | |
Equities: | | | | |
Consumer Discretionary | $ 1,588,696 | $ 1,474,798 | $ 24,496 | $ 89,402 |
Consumer Staples | 1,607,389 | 1,543,266 | 64,123 | - |
Energy | 1,327,286 | 1,327,286 | - | - |
Financials | 1,453,806 | 1,430,417 | 10,786 | 12,603 |
Health Care | 1,634,022 | 1,634,022 | - | - |
Industrials | 940,337 | 940,300 | - | 37 |
Information Technology | 2,837,131 | 2,821,797 | 14,340 | 994 |
Materials | 364,789 | 364,789 | - | - |
Telecommunication Services | 120,771 | 120,771 | - | - |
Utilities | 288,481 | 282,549 | 5,932 | - |
Investment Companies | 1,509 | - | 1,509 | - |
Corporate Bonds | 2,233,066 | - | 2,207,279 | 25,787 |
U.S. Government and Government Agency Obligations | 1,044,155 | - | 1,044,155 | - |
U.S. Government Agency - Mortgage Securities | 1,700,756 | - | 1,700,756 | - |
Asset-Backed Securities | 49,433 | - | 43,973 | 5,460 |
Collateralized Mortgage Obligations | 36,572 | - | 35,330 | 1,242 |
Commercial Mortgage Securities | 337,636 | - | 317,296 | 20,340 |
Municipal Securities | 65,752 | - | 65,752 | - |
Floating Rate Loans | 180,606 | - | 173,792 | 6,814 |
Bank Notes | 3,672 | - | 3,672 | - |
Fixed-Income Funds | 1,925,237 | 1,925,237 | - | - |
Money Market Funds | 827,967 | 827,967 | - | - |
Total Investments in Securities: | $ 20,569,069 | $ 14,693,199 | $ 5,713,191 | $ 162,679 |
Derivative Instruments: | | | | |
Liabilities | | | | |
Swap Agreements | $ (18,195) | $ - | $ (18,195) | $ - |
Other Financial Instruments: | | | | |
TBA Sale Commitments | $ (707,746) | $ - | $ (707,746) | $ - |
Value of Derivative Instruments |
The following table is a summary of the Fund's value of derivative instruments by primary risk exposure as of August 31, 2012. For additional information on derivative instruments, please refer to the Derivative Instruments section in the accompanying Notes to Financial Statements. |
Primary Risk Exposure /
Derivative Type
(Amounts in thousands) | Value |
| Asset | Liability |
Credit Risk | | |
Swap Agreements (a) | $ - | $ (18,195) |
Total Value of Derivatives | $ - | $ (18,195) |
(a) Value is disclosed on the Statement of Assets and Liabilities in the Swap agreements, at value line-items. |
Other Information |
The composition of credit quality ratings as a percentage of net assets is as follows (Unaudited): |
U.S. Government and U.S. Government Agency Obligations | 18.8% |
AAA,AA,A | 4.6% |
BBB | 6.0% |
BB | 2.1% |
B | 1.7% |
CCC,CC,C | 1.1% |
D | 0.0% |
Not Rated | 0.4% |
Equities | 61.6% |
Short-Term Investments and
Net Other Assets | 3.7% |
| 100.0% |
We have used ratings from Moody's Investors Service, Inc. Where Moody's® ratings are not available, we have used S&P® ratings. All ratings are as of the date indicated and do not reflect subsequent changes. |
The information in the above table is based on the combined investments of the Fund and its pro-rata share of the investments of Fidelity's fixed-income central funds. |
See accompanying notes which are an integral part of the financial statements.
Annual Report
Statement of Assets and Liabilities
Amounts in thousands (except per-share amounts) | August 31, 2012 |
| | |
Assets | | |
Investment in securities, at value (including securities loaned of $44,732) - See accompanying schedule: Unaffiliated issuers (cost $14,821,535) | $ 17,737,548 | |
Fidelity Central Funds (cost $2,630,103) | 2,753,204 | |
Other affiliated issuers (cost $71,633) | 78,317 | |
Total Investments (cost $17,523,271) | | $ 20,569,069 |
Cash | | 43 |
Foreign currency held at value (cost $1,399) | | 1,399 |
Receivable for investments sold, regular delivery | | 598,055 |
Receivable for TBA sale commitments | | 705,187 |
Receivable for swap agreements | | 3 |
Receivable for fund shares sold | | 10,505 |
Dividends receivable | | 24,123 |
Interest receivable | | 44,702 |
Distributions receivable from Fidelity Central Funds | | 1,329 |
Other receivables | | 941 |
Total assets | | 21,955,356 |
| | |
Liabilities | | |
Payable for investments purchased
Regular delivery | $ 192,221 | |
Delayed delivery | 1,233,690 | |
TBA sale commitments, at value | 707,746 | |
Payable for swap agreements | 2,146 | |
Payable for fund shares redeemed | 12,596 | |
Swap agreements, at value | 18,195 | |
Accrued management fee | 6,667 | |
Other affiliated payables | 2,429 | |
Other payables and accrued expenses | 1,045 | |
Collateral on securities loaned, at value | 45,922 | |
Total liabilities | | 2,222,657 |
| | |
Net Assets | | $ 19,732,699 |
Net Assets consist of: | | |
Paid in capital | | $ 16,554,137 |
Undistributed net investment income | | 84,879 |
Accumulated undistributed net realized gain (loss) on investments and foreign currency transactions | | 67,926 |
Net unrealized appreciation (depreciation) on investments and assets and liabilities in foreign currencies | | 3,025,757 |
Net Assets | | $ 19,732,699 |
See accompanying notes which are an integral part of the financial statements.
Annual Report
Financial Statements - continued
Statement of Assets and Liabilities - continued
Amounts in thousands (except per-share amounts) | August 31, 2012 |
| | |
Puritan:
Net Asset Value, offering price and redemption price per share ($15,471,548 ÷ 792,374 shares) | | $ 19.53 |
| | |
Class K:
Net Asset Value, offering price and redemption price per share ($4,261,151 ÷ 218,259 shares) | | $ 19.52 |
See accompanying notes which are an integral part of the financial statements.
Annual Report
Statement of Operations
Amounts in thousands | Year ended August 31, 2012 |
| | |
Investment Income | | |
Dividends | | $ 203,278 |
Interest | | 242,508 |
Income from Fidelity Central Funds | | 51,290 |
Total income | | 497,076 |
| | |
Expenses | | |
Management fee | $ 77,419 | |
Transfer agent fees | 27,370 | |
Accounting and security lending fees | 1,950 | |
Custodian fees and expenses | 348 | |
Independent trustees' compensation | 126 | |
Appreciation in deferred trustee compensation account | 1 | |
Registration fees | 242 | |
Audit | 274 | |
Legal | 96 | |
Miscellaneous | 195 | |
Total expenses before reductions | 108,021 | |
Expense reductions | (673) | 107,348 |
Net investment income (loss) | | 389,728 |
Realized and Unrealized Gain (Loss) Net realized gain (loss) on: | | |
Investment securities: | | |
Unaffiliated issuers | 268,271 | |
Other affiliated issuers | (84) | |
Foreign currency transactions | 30 | |
Swap agreements | (13,193) | |
Total net realized gain (loss) | | 255,024 |
Change in net unrealized appreciation (depreciation) on: Investment securities (net of decrease in deferred foreign taxes of $33) | 1,557,843 | |
Assets and liabilities in foreign currencies | (28) | |
Swap agreements | 12,333 | |
Delayed delivery commitments | (4,457) | |
Total change in net unrealized appreciation (depreciation) | | 1,565,691 |
Net gain (loss) | | 1,820,715 |
Net increase (decrease) in net assets resulting from operations | | $ 2,210,443 |
See accompanying notes which are an integral part of the financial statements.
Annual Report
Financial Statements - continued
Statement of Changes in Net Assets
Amounts in thousands | Year ended
August 31,
2012 | Year ended
August 31,
2011 |
Increase (Decrease) in Net Assets | | |
Operations | | |
Net investment income (loss) | $ 389,728 | $ 385,230 |
Net realized gain (loss) | 255,024 | 1,644,208 |
Change in net unrealized appreciation (depreciation) | 1,565,691 | 482,668 |
Net increase (decrease) in net assets resulting
from operations | 2,210,443 | 2,512,106 |
Distributions to shareholders from net investment income | (364,135) | (395,907) |
Distributions to shareholders from net realized gain | - | (3,264) |
Total distributions | (364,135) | (399,171) |
Share transactions - net increase (decrease) | (743,799) | (816,545) |
Total increase (decrease) in net assets | 1,102,509 | 1,296,390 |
| | |
Net Assets | | |
Beginning of period | 18,630,190 | 17,333,800 |
End of period (including undistributed net investment income of $84,879 and undistributed net investment income of $87,615, respectively) | $ 19,732,699 | $ 18,630,190 |
See accompanying notes which are an integral part of the financial statements.
Annual Report
Financial Highlights - Puritan
Years ended August 31, | 2012 | 2011 | 2010 | 2009 | 2008 |
Selected Per-Share Data | | | | | |
Net asset value, beginning of period | $ 17.72 | $ 15.81 | $ 15.06 | $ 17.07 | $ 20.54 |
Income from Investment Operations | | | | | |
Net investment income (loss) B | .38 | .35 | .40 | .45 | .50 |
Net realized and unrealized gain (loss) | 1.78 | 1.93 | .75 | (2.00) | (1.80) |
Total from investment operations | 2.16 | 2.28 | 1.15 | (1.55) | (1.30) |
Distributions from net investment income | (.35) | (.36) | (.39) | (.44) | (.55) |
Distributions from net realized gain | - | - F | (.01) | (.02) | (1.62) |
Total distributions | (.35) | (.37) H | (.40) | (.46) G | (2.17) |
Net asset value, end of period | $ 19.53 | $ 17.72 | $ 15.81 | $ 15.06 | $ 17.07 |
Total Return A | 12.35% | 14.38% | 7.61% | (8.76)% | (7.35)% |
Ratios to Average Net Assets C,E | | | | |
Expenses before reductions | .59% | .60% | .61% | .67% | .61% |
Expenses net of fee waivers, if any | .59% | .60% | .61% | .67% | .61% |
Expenses net of all reductions | .59% | .59% | .61% | .67% | .60% |
Net investment income (loss) | 2.03% | 1.96% | 2.48% | 3.30% | 2.72% |
Supplemental Data | | | | | |
Net assets, end of period (in millions) | $ 15,472 | $ 15,420 | $ 15,054 | $ 16,111 | $ 21,427 |
Portfolio turnover rate D | 141% | 154% I | 104% | 116% I | 115% |
A Total returns would have been lower if certain expenses had not been reduced during the applicable periods shown.
B Calculated based on average shares outstanding during the period.
C Fees and expenses of any underlying Fidelity Central Funds are not included in the Fund's expense ratio. The Fund indirectly bears its proportionate share of the expenses of any underlying Fidelity Central Funds.
D Amount does not include the portfolio activity of any underlying Fidelity Central Funds.
E Expense ratios reflect operating expenses of the class. Expenses before reductions do not reflect amounts reimbursed by the investment adviser or reductions from brokerage service arrangements or reductions from other expense offset arrangements and do not represent the amount paid by the class during periods when reimbursements or reductions occur. Expenses net of fee waivers reflect expenses after reimbursement by the investment adviser but prior to reductions from brokerage service arrangements or other expense offset arrangements. Expenses net of all reductions represent the net expenses paid by the class.
F Amount represents less than $.01 per share.
G Total distributions of $.46 per share is comprised of distributions from net investment income of $.442 and distributions from net realized gain of $.015 per share.
H Total distributions of $.37 per share is comprised of distributions from net investment income of $.364 and distributions from net realized gain of $.003 per share.
I The portfolio turnover rate excludes liquidations and/or redemptions executed in-kind from Affiliated Central Funds.
See accompanying notes which are an integral part of the financial statements.
Annual Report
Financial Highlights - Class K
Years ended August 31, | 2012 | 2011 | 2010 | 2009 | 2008 G |
Selected Per-Share Data | | | | | |
Net asset value, beginning of period | $ 17.72 | $ 15.80 | $ 15.06 | $ 17.07 | $ 18.22 |
Income from Investment Operations | | | | | |
Net investment income (loss) D | .40 | .38 | .42 | .46 | .14 |
Net realized and unrealized gain (loss) | 1.77 | 1.93 | .74 | (1.99) | (1.16) |
Total from investment operations | 2.17 | 2.31 | 1.16 | (1.53) | (1.02) |
Distributions from net investment income | (.37) | (.39) | (.41) | (.47) | (.13) |
Distributions from net realized gain | - | - I | (.01) | (.02) | - |
Total distributions | (.37) | (.39) | (.42) | (.48) J | (.13) |
Net asset value, end of period | $ 19.52 | $ 17.72 | $ 15.80 | $ 15.06 | $ 17.07 |
Total Return B,C | 12.43% | 14.59% | 7.69% | (8.59)% | (5.60)% |
Ratios to Average Net Assets E,H | | | | | |
Expenses before reductions | .48% | .48% | .48% | .50% | .48% A |
Expenses net of fee waivers, if any | .48% | .48% | .48% | .50% | .48% A |
Expenses net of all reductions | .47% | .47% | .47% | .50% | .48% A |
Net investment income (loss) | 2.15% | 2.09% | 2.61% | 3.47% | 3.21% A |
Supplemental Data | | | | | |
Net assets, end of period (in millions) | $ 4,261 | $ 3,211 | $ 2,280 | $ 1,469 | $ 9 |
Portfolio turnover rate F | 141% | 154% K | 104% | 116% K | 115% |
A Annualized
B Total returns for periods of less than one year are not annualized.
C Total returns would have been lower if certain expenses had not been reduced during the applicable periods shown.
D Calculated based on average shares outstanding during the period.
E Fees and expenses of any underlying Fidelity Central Funds are not included in the Fund's expense ratio. The Fund indirectly bears its proportionate share of the expenses of any underlying Fidelity Central Funds.
F Amount does not include the portfolio activity of any underlying Fidelity Central Funds.
G For the period May 9, 2008 (commencement of sale of shares) to August 31, 2008.
H Expense ratios reflect operating expenses of the class. Expenses before reductions do not reflect amounts reimbursed by the investment adviser or reductions from brokerage service arrangements or reductions from other expense offset arrangements and do not represent the amount paid by the class during periods when reimbursements or reductions occur. Expense ratios before reductions for start-up periods may not be representative of longer-term operating periods. Expenses net of fee waivers reflect expenses after reimbursement by the investment adviser but prior to reductions from brokerage service arrangements or other expense offset arrangements. Expenses net of all reductions represent the net expenses paid by the class.
I Amount represents less than $.01 per share.
J Total distributions of $.48 per share is comprised of distributions from net investment income of $.468 and distributions from net realized gain of $.015 per share.
K The portfolio turnover rate excludes liquidations and/or redemptions executed in-kind from Affiliated Central Funds.
See accompanying notes which are an integral part of the financial statements.
Annual Report
Notes to Financial Statements
For the period ended August 31, 2012
(Amounts in thousands except percentages)
1. Organization.
Fidelity Puritan Fund (the Fund) is a fund of Fidelity Puritan Trust (the Trust) and is authorized to issue an unlimited number of shares. The Trust is registered under the Investment Company Act of 1940, as amended (the 1940 Act), as an open-end management investment company organized as a Massachusetts business trust. The Fund offers Puritan and Class K shares, each of which has equal rights as to assets and voting privileges. Each class has exclusive voting rights with respect to matters that affect that class. Investment income, realized and unrealized capital gains and losses, the common expenses of the Fund, and certain fund-level expense reductions, if any, are allocated on a pro-rata basis to each class based on the relative net assets of each class to the total net assets of the Fund. Each class differs with respect to transfer agent fees incurred. Certain expense reductions may also differ by class.
2. Investments in Fidelity Central Funds.
The Fund invests in Fidelity Central Funds, which are open-end investment companies available only to other investment companies and accounts managed by Fidelity Management & Research Company (FMR) and its affiliates. The Fund's Schedule of Investments lists each of the Fidelity Central Funds held as of period end, if any, as an investment of the Fund, but does not include the underlying holdings of each Fidelity Central Fund. As an Investing Fund, the Fund indirectly bears its proportionate share of the expenses of the underlying Fidelity Central Funds.
Based on its investment objective, each Fidelity Central Fund may invest or participate in various investment vehicles or strategies that are similar to those of the Fund. These strategies are consistent with the investment objectives of the Fund and may involve certain economic risks which may cause a decline in value of each of the Fidelity Central Funds and thus a decline in the value of the Fund. The Money Market Central Funds seek preservation of capital and current income and are managed by Fidelity Investments Money Management, Inc. (FIMM), an affiliate of FMR. The following summarizes the Fund's investment in each non-money market Fidelity Central Fund.
Annual Report
Notes to Financial Statements - continued
(Amounts in thousands except percentages)
2. Investments in Fidelity Central Funds - continued
Fidelity Central Fund | Investment Manager | Investment Objective | Investment Practices |
Fidelity Corporate Bond 1-10 Year Central Fund | FIMM | Seeks a high level of income by normally investing in investment-grade corporate bonds and other corporate debt securities and repurchase agreements for those securities. | Repurchase Agreements Restricted Securities |
Fidelity Mortgage Backed Securities Central Fund | FIMM | Seeks a high level of income by normally investing in investment-grade mortgage-related securities and repurchase agreements for those securities. | Delayed Delivery & When Issued Securities Futures Repurchase Agreements Swap Agreements |
An unaudited holdings listing for the Fund, which presents direct holdings as well as the pro-rata share of any securities and other investments held indirectly through its investment in underlying non-money market Fidelity Central Funds, is available at fidelity.com. A complete unaudited list of holdings for each Fidelity Central Fund is available upon request or at the Securities and Exchange Commission (the SEC) web site at www.sec.gov. In addition, the financial statements of the Fidelity Central Funds which contain the significant accounting policies (including security valuation policies) of those funds, which are not covered by the Fund's Report of Independent Registered Public Accounting Firm, are available on the SEC web site or upon request.
3. Significant Accounting Policies.
The financial statements have been prepared in conformity with accounting principles generally accepted in the United States of America (GAAP), which require management to make certain estimates and assumptions at the date of the financial statements. Actual results could differ from those estimates. Subsequent events, if any, through the date that the financial statements were issued have been evaluated in the preparation of the financial statements. The following summarizes the significant accounting policies of the Fund:
Security Valuation. Investments are valued as of 4:00 p.m. Eastern time on the last calendar day of the period. In accordance with valuation policies and procedures approved by the Board of Trustees (the Board), the Fund attempts to obtain prices from
Annual Report
3. Significant Accounting Policies - continued
Security Valuation - continued
one or more third party pricing vendor or broker to value its investments. When current market prices, quotations or rates are not readily available or reliable, securities will be fair valued in good faith by the FMR Fair Value Committee (the Committee), in accordance with procedures adopted by the Fund's Board. Factors used in determining fair value vary by security type and may include market or security specific events, changes in interest rates and credit quality. The frequency with which these procedures are used cannot be predicted and they may be utilized to a significant extent. The Committee oversees the Fund's valuation policies and procedures and is responsible for approving and reporting to the Board all fair value determinations.
The Fund categorizes the inputs to valuation techniques used to value its investments into a disclosure hierarchy consisting of three levels as shown below:
Level 1 - quoted prices in active markets for identical investments
Level 2 - other significant observable inputs (including quoted prices for similar investments, interest rates, prepayment speeds, etc.)
Level 3 - unobservable inputs (including the Fund's own assumptions based on the best information available)
Valuation techniques used to value the Fund's investments by major category are as follows:
Equity securities, including restricted securities, for which market quotations are readily available, are valued at the last reported sale price or official closing price as reported by a third party pricing vendor on the primary market or exchange on which they are traded and are categorized as Level 1 in the hierarchy. In the event there were no sales during the day or closing prices are not available, securities are valued at the last quoted bid price or may be valued using the last available price and are generally categorized as Level 2 in the hierarchy. For foreign equity securities, when significant market or security specific events arise, comparisons to the valuation of American Depositary Receipts (ADRs), futures contracts, Exchange-Traded Funds (ETFs) and certain indexes as well as quoted prices for similar securities are used and are categorized as Level 2 in the hierarchy. Utilizing these techniques may result in transfers between Level 1 and Level 2. For restricted equity securities and private placements where observable inputs are limited, assumptions about market activity and risk are used and these securities are categorized as Level 3 in the hierarchy.
Debt securities, including restricted securities, are valued based on evaluated prices received from third party pricing vendors or from brokers who make markets in such
Annual Report
Notes to Financial Statements - continued
(Amounts in thousands except percentages)
3. Significant Accounting Policies - continued
Security Valuation - continued
securities. For corporate bonds, bank notes, floating rate loans, municipal securities and U.S. government and government agency obligations, pricing vendors utilize matrix pricing which considers yield or price of bonds of comparable quality, coupon, maturity and type as well as broker-supplied prices and are generally categorized as Level 2 in the hierarchy. For asset backed securities, collateralized mortgage obligations, commercial mortgage securities and U.S. government agency mortgage securities, pricing vendors utilize matrix pricing which considers prepayment speed assumptions, attributes of the collateral, yield or price of bonds of comparable quality, coupon, maturity and type as well as broker-supplied prices and, accordingly, such securities are generally categorized as Level 2 in the hierarchy. Swaps are marked-to-market daily based on valuations from third party pricing vendors or broker-supplied valuations and changes in value are recorded as unrealized appreciation (depreciation). Pricing vendors utilize matrix pricing which considers comparisons to interest rate curves, credit spread curves, default possibilities and recovery rates and, as a result, swaps are generally categorized as Level 2 in the hierarchy. When independent prices are unavailable or unreliable, debt securities and swaps may be valued utilizing pricing methodologies which consider similar factors that would be used by third party pricing vendors. These are generally categorized as Level 2 in the hierarchy but may be Level 3 depending on the circumstances.
Investments in open-end mutual funds, including the Fidelity Central Funds, are valued at their closing net asset value each business day and are categorized as Level 1 in the hierarchy.
Changes in valuation techniques may result in transfers in or out of an assigned level within the disclosure hierarchy. The aggregate value of investments by input level, as of August 31, 2012, is included at the end of the Fund's Schedule of Investments.
Foreign Currency Translation. The Fund may use foreign currency contracts to facilitate transactions in foreign-denominated securities. Gains and losses from these transactions may arise from changes in the value of the foreign currency or if the counterparties do not perform under the contracts' terms.
Foreign-denominated assets, including investment securities, and liabilities are translated into U.S. dollars at the exchange rates at period end. Purchases and sales of investment securities, income and dividends received and expenses denominated in foreign currencies are translated into U.S. dollars at the exchange rate in effect on the transaction date.
The effects of exchange rate fluctuations on investments are included with the net realized and unrealized gain (loss) on investment securities. Other foreign currency transactions resulting in realized and unrealized gain (loss) are disclosed separately.
Annual Report
3. Significant Accounting Policies - continued
Investment Transactions and Income. For financial reporting purposes, the Fund's investment holdings and NAV include trades executed through the end of the last business day of the period. The NAV per share for processing shareholder transactions is calculated as of the close of business of the New York Stock Exchange (NYSE), normally 4:00 p.m. Eastern time and includes trades executed through the end of the prior business day. Gains and losses on securities sold are determined on the basis of identified cost and may include proceeds received from litigation. Dividend income is recorded on the ex-dividend date, except for certain dividends from foreign securities where the ex-dividend date may have passed, which are recorded as soon as the Fund is informed of the ex-dividend date. Non-cash dividends included in dividend income, if any, are recorded at the fair market value of the securities received. Distributions received on securities that represent a return of capital or capital gain are recorded as a reduction of cost of investments and/or as a realized gain. The Fund estimates the components of distributions received that may be considered return of capital distributions or capital gain distributions. Interest income and distributions from the Fidelity Central Funds are accrued as earned. Interest income includes coupon interest and amortization of premium and accretion of discount on debt securities. The principal amount on inflation-indexed securities is periodically adjusted to the rate of inflation and interest is accrued based on the principal amount. The adjustments to principal due to inflation are reflected as increases or decreases to interest income even though principal is not received until maturity. Investment income is recorded net of foreign taxes withheld where recovery of such taxes is uncertain. Debt obligations may be placed on non-accrual status and related interest income may be reduced by ceasing current accruals and writing off interest receivables when the collection of all or a portion of interest has become doubtful based on consistently applied procedures. A debt obligation is removed from non-accrual status when the issuer resumes interest payments or when collectability of interest is reasonably assured.
Expenses. Expenses directly attributable to a fund are charged to that fund. Expenses attributable to more than one fund are allocated among the respective funds on the basis of relative net assets or other appropriate methods. Expense estimates are accrued in the period to which they relate and adjustments are made when actual amounts are known.
Deferred Trustee Compensation. Under a Deferred Compensation Plan (the Plan), independent Trustees may elect to defer receipt of a portion of their annual compensation. Deferred amounts are invested in a cross-section of Fidelity funds, are marked-to-market and remain in the Fund until distributed in accordance with the Plan. The investment of deferred amounts and the offsetting payable to the Trustees are included in the accompanying Statement of Assets and Liabilities.
Annual Report
Notes to Financial Statements - continued
(Amounts in thousands except percentages)
3. Significant Accounting Policies - continued
Income Tax Information and Distributions to Shareholders. Each year, the Fund intends to qualify as a regulated investment company under Subchapter M of the Internal Revenue Code, including distributing substantially all of its taxable income and realized gains. As a result, no provision for income taxes is required. As of August 31, 2012, the Fund did not have any unrecognized tax benefits in the financial statements; nor is the Fund aware of any tax positions for which it is reasonably possible that the total amounts of unrecognized tax benefits will significantly change in the next twelve months. The Fund files a U.S. federal tax return, in addition to state and local tax returns as required. A fund's federal income tax returns are subject to examination by the Internal Revenue Service (IRS) for a period of three fiscal years after they are filed. State and local tax returns may be subject to examination for an additional fiscal year depending on the jurisdiction. Foreign taxes are provided for based on the Fund's understanding of the tax rules and rates that exist in the foreign markets in which it invests.
Distributions are declared and recorded on the ex-dividend date. Income dividends and capital gain distributions are declared separately for each class. Income and capital gain distributions are determined in accordance with income tax regulations, which may differ from GAAP. In addition, the Fund claimed a portion of the payment made to redeeming shareholders as a distribution for income tax purposes.
Capital accounts within the financial statements are adjusted for permanent book-tax differences. These adjustments have no impact on net assets or the results of operations. Temporary book-tax differences will reverse in a subsequent period.
Book-tax differences are primarily due to swap agreements, foreign currency transactions, market discount, equity debt classifications, partnerships (including allocations from Fidelity Central Funds), deferred trustee compensation, capital loss carryforwards and losses deferred due to wash sales.
The federal tax cost of investment securities and unrealized appreciation (depreciation) as of period end were as follows:
Gross unrealized appreciation | $ 3,204,307 |
Gross unrealized depreciation | (296,948) |
Net unrealized appreciation (depreciation) on securities and other investments | $ 2,907,359 |
| |
Tax Cost | $ 17,661,710 |
Annual Report
3. Significant Accounting Policies - continued
Income Tax Information and Distributions to Shareholders - continued
The tax-based components of distributable earnings as of period end were as follows:
Undistributed ordinary income | $ 56,935 |
Undistributed long-term capital gain | $ 235,182 |
Net unrealized appreciation (depreciation) | $ 2,887,319 |
The tax character of distributions paid was as follows:
| August 31, 2012 | August 31, 2011 |
Ordinary Income | $ 364,135 | $ 399,171 |
New Accounting Pronouncement. In December 2011, the Financial Accounting Standards Board issued Accounting Standard Update No. 2011-11, Disclosures about Offsetting Assets and Liabilities. The update creates new disclosure requirements requiring entities to disclose both gross and net information for derivatives and other financial instruments that are either offset in the Statement of Assets and Liabilities or subject to an enforceable master netting arrangement or similar agreement. The disclosure requirements are effective for annual reporting periods beginning on or after January 1, 2013, and interim periods within those annual periods. Management is currently evaluating the impact of the update's adoption on the Fund's financial statement disclosures.
4. Operating Policies.
Delayed Delivery Transactions and When-Issued Securities. During the period, the Fund transacted in securities on a delayed delivery or when-issued basis. Payment and delivery may take place after the customary settlement period for that security. The price of the underlying securities and the date when the securities will be delivered and paid for are fixed at the time the transaction is negotiated. The securities purchased on a delayed delivery or when-issued basis are identified as such in the Fund's Schedule of Investments. The Fund may receive compensation for interest forgone in the purchase of a delayed delivery or when-issued security. With respect to purchase commitments, the Fund identifies securities as segregated in its records with a value at least equal to the amount of the commitment. Losses may arise due to changes in the value of the underlying securities or if the counterparty does not perform under the contract's terms, or if the issuer does not issue the securities due to political, economic, or other factors.
To-Be-Announced (TBA) Securities and Mortgage Dollar Rolls. During the period, the Fund transacted in TBA securities that involved buying or selling mortgage-backed securities (MBS) on a forward commitment basis. A TBA transaction typically does not designate the actual security to be delivered and only includes an approximate principal amount however; delivered securities must meet specified terms defined by industry
Annual Report
Notes to Financial Statements - continued
(Amounts in thousands except percentages)
4. Operating Policies - continued
To-Be-Announced (TBA) Securities and Mortgage Dollar Rolls - continued
guidelines, including issuer, rate and current principal amount outstanding on underlying mortgage pools. The Fund may enter into a TBA transaction with the intent to take possession of or deliver the underlying MBS, or the Fund may elect to extend the settlement by entering into either a mortgage or reverse mortgage dollar roll. Mortgage dollar rolls are transactions where a fund sells TBA securities and simultaneously agrees to repurchase MBS on a later date at a lower price and with the same counterparty. Reverse mortgage dollar rolls involve the purchase and simultaneous agreement to sell TBA securities on a later date at a lower price. Transactions in mortgage dollar rolls and reverse mortgage dollar rolls are accounted for as purchases and sales and may result in an increase to the Fund's portfolio turnover rate.
Purchases and sales of TBA securities involve risks similar to those discussed above for delayed delivery and when-issued securities. Also, if the counterparty in a mortgage dollar roll or a reverse mortgage dollar roll transaction files for bankruptcy or becomes insolvent, the Fund's right to repurchase or sell securities may be limited. Additionally, when a fund sells TBA securities without already owning or having the right to obtain the deliverable securities (an uncovered forward commitment to sell), it incurs a risk of loss because it could have to purchase the securities at a price that is higher than the price at which it sold them. A fund may be unable to purchase the deliverable securities if the corresponding market is illiquid.
TBA securities subject to a forward commitment to sell at period end are included at the end of the Fund's Schedule of Investments under the caption "TBA Sale Commitments." The proceeds and value of these commitments are reflected in the Fund's Statement of Assets and Liabilities.
Restricted Securities. The Fund may invest in securities that are subject to legal or contractual restrictions on resale. These securities generally may be resold in transactions exempt from registration or to the public if the securities are registered. Disposal of these securities may involve time-consuming negotiations and expense, and prompt sale at an acceptable price may be difficult. Information regarding restricted securities is included at the end of the Fund's Schedule of Investments.
Loans and Other Direct Debt Instruments. The Fund invests in direct debt instruments which are interests in amounts owed to lenders by corporate or other borrowers. These instruments may be in the form of loans, trade claims or other receivables and may include standby financing commitments such as revolving credit facilities that obligate the Fund to supply additional cash to the borrower on demand. Loans may be acquired through assignment or participation, or may be made directly to a borrower. The Fund may be contractually obligated to receive approval from the agent bank and/or borrower prior to the sale of these loans.
Annual Report
5. Derivative Instruments.
Risk Exposures and the Use of Derivative Instruments. The Fund's investment objective allows the Fund to enter into various types of derivative contracts, including swap agreements. Derivatives are investments whose value is primarily derived from underlying assets, indices or reference rates and may be transacted on an exchange or over-the-counter (OTC). Derivatives may involve a future commitment to buy or sell a specified instrument based on specified terms, to exchange future cash flows at periodic intervals based on a notional principal amount, or for one party to make one or more payments upon the occurrence of specified events in exchange for periodic payments from the other party.
The Fund used derivatives to increase returns, to gain exposure to certain types of assets and to manage exposure to certain risks as defined below. The success of any strategy involving derivatives depends on analysis of numerous economic factors, and if the strategies for investment do not work as intended, the Fund may not achieve its objectives.
The Fund's use of derivatives increased or decreased its exposure to the following risk:
Credit Risk | Credit risk relates to the ability of the issuer of a financial instrument to make further principal or interest payments on an obligation or commitment that it has to the Fund. |
The Fund is also exposed to additional risks from investing in derivatives, such as liquidity risk and counterparty credit risk. Liquidity risk is the risk that the Fund will be unable to close out the derivative in the open market in a timely manner. Counterparty credit risk is the risk that the counterparty will not be able to fulfill its obligation to the Fund. Derivative counterparty credit risk is managed through formal evaluation of the creditworthiness of all potential counterparties. On certain OTC derivatives such as swap transactions, the Fund attempts to reduce its exposure to counterparty credit risk by entering into an International Swaps and Derivatives Association, Inc. (ISDA) Master Agreement on a bilateral basis with each of its counterparties. The ISDA Master Agreement gives the Fund the right to terminate all transactions traded under such agreement upon the deterioration in the credit quality of the counterparty beyond specified levels. The ISDA Master Agreement gives each party the right, upon an event of default by the other party or a termination of the agreement, to close out all transactions traded under such agreement and to net amounts owed under each transaction to one net payable by one party to the other. To mitigate counterparty credit risk on OTC derivatives, the Fund receives collateral in the form of cash or securities once the Fund's net unrealized appreciation on outstanding derivative contracts under an ISDA Master Agreement exceeds certain applicable thresholds, subject to certain minimum transfer provisions. The collateral received is held in segregated accounts with the Fund's custodian bank in accordance with the collateral agreements entered into between the Fund, the counterparty and the Fund's custodian bank. The Fund could experience delays and costs in
Annual Report
Notes to Financial Statements - continued
(Amounts in thousands except percentages)
5. Derivative Instruments - continued
Risk Exposures and the Use of Derivative Instruments - continued
gaining access to the collateral even though it is held by the Fund's custodian bank. The Fund's maximum risk of loss from counterparty credit risk related to OTC derivatives is generally the aggregate unrealized appreciation and unpaid counterparty payments in excess of any collateral pledged by the counterparty to the Fund. The Fund may be required to pledge collateral for the benefit of the counterparties on OTC derivatives in an amount not less than each counterparty's unrealized appreciation on outstanding derivative contracts, subject to certain minimum transfer provisions, and any such pledged collateral is identified in the Schedule of Investments.
Investing in derivatives may involve greater risks than investing in the underlying assets directly and, to varying degrees, may involve risk of loss in excess of any initial investment and collateral received and amounts recognized in the Statement of Assets and Liabilities. In addition, there may be the risk that the change in value of the derivative contract does not correspond to the change in value of the underlying instrument.
Net Realized Gain (Loss) and Change in Net Unrealized Appreciation (Depreciation) on Derivatives. The table below, which reflects the impacts of derivatives on the financial performance of the Fund, summarizes the net realized gain (loss) and change in net unrealized appreciation (depreciation) for derivatives during the period as shown in the Statement of Operations.
Primary Risk Exposure / Derivative Type | Net Realized Gain (Loss) | Change in Net Unrealized Appreciation (Depreciation) |
Credit Risk | | |
Swap Agreements (a) | $ (13,193) | $ 12,333 |
(a) A summary of the value of derivatives by primary risk exposure as of period end, is included at the end of the Schedule of Investments and is
representative of activity for the period.
Swap Agreements. A swap agreement (swap) is a contract between two parties to exchange future cash flows at periodic intervals based on a notional principal amount.
Swaps are marked-to-market daily and changes in value are reflected in the Statement of Assets and Liabilities in the swap agreements at value line items. Any upfront premiums paid or received upon entering a swap to compensate for differences between stated terms of the agreement and prevailing market conditions (e.g. credit spreads, interest rates or other factors) are recorded as realized gain or (loss) ratably over the term of the swap. Any unamortized upfront premiums are included in net unrealized appreciation (depreciation) in the Statement of Assets and Liabilities. Payments are exchanged at
Annual Report
5. Derivative Instruments - continued
Swap Agreements - continued
specified intervals, accrued daily commencing with the effective date of the contract and recorded as realized gain or (loss). Realized gain or (loss) is also recorded in the event of an early termination of a swap. The net realized gain (loss) and change in net unrealized appreciation (depreciation) on swaps during the period is included in the Statement of Operations.
Any open swaps at period end are included in the Schedule of Investments under the caption "Swap Agreements."
Credit Default Swaps. Credit default swaps enable the Fund to buy or sell protection against specified credit events on a single-name issuer or a traded credit index. Under the terms of a credit default swap the buyer of protection (buyer) receives credit protection in exchange for making periodic payments to the seller of protection (seller) based on a fixed percentage applied to a notional principal amount. In return for these payments, the seller acts as a guarantor of the creditworthiness of a reference obligation and will be required to make a payment upon the occurrence of one or more specified credit events. The Fund enters into credit default swaps as a seller to gain credit exposure to an issuer and/or as a buyer to obtain a measure of protection against defaults of an issuer. Periodic payments are made over the life of the contract by the buyer provided that no credit event occurs.
For credit default swaps on most corporate and sovereign issuers, credit events include bankruptcy, failure to pay or repudiation/moratorium. For credit default swaps on corporate or sovereign issuers, the obligation that may be put to the seller is not limited to the specific reference obligation described in the Schedule of Investments. For credit default swaps on asset-backed securities, a credit event may be triggered by events such as failure to pay principal, maturity extension, rating downgrade or write-down. For credit default swaps on asset-backed securities, the reference obligation described represents the security that may be put to the seller. For credit default swaps on a traded credit index, a specified credit event may affect all or individual underlying securities included in the index.
As a seller, if an underlying credit event occurs, the Fund will pay a net settlement amount of cash equal to the notional amount of the swap less the recovery value of the reference obligation or underlying securities comprising an index. Only in the event of the industry's inability to value the underlying asset will the Fund be required to take delivery of the reference obligation or underlying securities comprising an index and pay an amount equal to the notional amount of the swap.
Annual Report
Notes to Financial Statements - continued
(Amounts in thousands except percentages)
5. Derivative Instruments - continued
Credit Default Swaps - continued
As a buyer, if an underlying credit event occurs, the Fund will receive a net settlement amount of cash equal to the notional amount of the swap less the recovery value of the reference obligation or underlying securities comprising an index. Only in the event of the industry's inability to value the underlying asset will the Fund be required to deliver the reference obligation or underlying securities comprising an index in exchange for payment of an amount equal to the notional amount of the swap.
Typically, the value of each credit default swap and credit rating disclosed for each reference obligation in the Schedule of Investments, where the Fund is the seller, can be used as measures of the current payment/performance risk of the swap. As the value of the swap changes as a positive or negative percentage of the total notional amount, the payment/performance risk may decrease or increase, respectively. In addition to these measures, FMR monitors a variety of factors including cash flow assumptions, market activity and market sentiment as part of its ongoing process of assessing payment/performance risk.
6. Purchases and Sales of Investments.
Purchases and sales of securities (including the Fixed-Income Central Funds), other than short-term securities and U.S. government securities, aggregated $11,838,549 and $11,610,222, respectively.
7. Fees and Other Transactions with Affiliates.
Management Fee. FMR and its affiliates provide the Fund with investment management related services for which the Fund pays a monthly management fee. The management fee is the sum of an individual fund fee rate that is based on an annual rate of .15% of the Fund's average net assets and an annualized group fee rate that averaged .26% during the period. The group fee rate is based upon the average net assets of all the mutual funds advised by FMR. The group fee rate decreases as assets under management increase and increases as assets under management decrease. For the period, the total annual management fee rate was .41% of the Fund's average net assets.
Transfer Agent Fees. Fidelity Investments Institutional Operations Company, Inc. (FIIOC), an affiliate of FMR, is the transfer, dividend disbursing and shareholder servicing agent for each class of the Fund. FIIOC receives account fees and asset-based fees that vary according to the account size and type of account of the shareholders of Puritan. FIIOC receives an asset-based fee of Class K's average net assets. FIIOC pays for typesetting, printing and mailing of shareholder reports, except proxy statements. For the period, transfer agent fees for each class were as follows:
Annual Report
7. Fees and Other Transactions with Affiliates - continued
Transfer Agent Fees - continued
| Amount | % of
Average
Net Assets |
Puritan | $ 25,505 | .17 |
Class K | 1,865 | .05 |
| $ 27,370 | |
Accounting and Security Lending Fees. Fidelity Service Company, Inc. (FSC), an affiliate of FMR, maintains the Fund's accounting records. The accounting fee is based on the level of average net assets for each month. Under a separate contract, FSC administers the security lending program. The security lending fee is based on the number and duration of lending transactions.
Brokerage Commissions. The Fund placed a portion of its portfolio transactions with brokerage firms which are affiliates of the investment adviser. The commissions paid to these affiliated firms were $219 for the period.
8. Committed Line of Credit.
The Fund participates with other funds managed by FMR or an affiliate in a $4.25 billion credit facility (the "line of credit") to be utilized for temporary or emergency purposes to fund shareholder redemptions or for other short-term liquidity purposes. The Fund has agreed to pay commitment fees on its pro-rata portion of the line of credit, which amounted to $53 and is reflected in Miscellaneous expenses on the Statement of Operations. During the period, there were no borrowings on this line of credit.
9. Security Lending.
The Fund lends portfolio securities from time to time in order to earn additional income. For equity securities, a lending agent is used and may loan securities to certain qualified borrowers, including Fidelity Capital Markets (FCM), a broker-dealer affiliated with the Fund. On the settlement date of the loan, the Fund receives collateral (in the form of U.S. Treasury obligations, letters of credit and/or cash) against the loaned securities and maintains collateral in an amount not less than 100% of the market value of the loaned securities during the period of the loan. The market value of the loaned securities is determined at the close of business of the Fund and any additional required collateral is delivered to the Fund on the next business day. If the borrower defaults on its obligation to return the securities loaned because of insolvency or other reasons, a fund could experience delays and costs in recovering the securities loaned or in gaining access to
Annual Report
Notes to Financial Statements - continued
(Amounts in thousands except percentages)
9. Security Lending - continued
the collateral. Any cash collateral received is maintained at the Fund's custodian and/or invested in cash equivalents and/or the Fidelity Securities Lending Cash Central Fund. The value of loaned securities and cash collateral at period end are disclosed on the Fund's Statement of Assets and Liabilities. At period end, there were no security loans outstanding with FCM. Security lending income represents the income earned on investing cash collateral, less rebates paid to borrowers and any lending agent fees associated with the loan, plus any premium payments received for lending certain types of securities. Total security lending income during the period, presented in the Statement of Operations as a component of interest income, amounted to $66. Net income from the Fidelity Securities Lending Cash Central Fund during the period, presented in the Statement of Operations as a component of income from Fidelity Central Funds, amounted to $2,162 (including $19 from securities loaned to FCM).
10. Bank Borrowings.
The Fund is permitted to have bank borrowings for temporary or emergency purposes to fund shareholder redemptions or for other short-term liquidity requirements. The Fund has established borrowing arrangements with certain banks. The interest rate on the borrowings is the bank's base rate, as revised from time to time. The average loan balance during the period for which loans were outstanding amounted to $26,297. The weighted average interest rate was .58%. The interest expense amounted to four hundred twenty four dollars under the bank borrowing program. At period end, there were no bank borrowings outstanding.
11. Expense Reductions.
Many of the brokers with whom FMR places trades on behalf of the Fund provided services to the Fund in addition to trade execution. These services included payments of certain expenses on behalf of the Fund totaling $670 for the period. In addition, through arrangements with the Fund's custodian, credits realized as a result of uninvested cash balances were used to reduce the Fund's expenses. During the period, these credits reduced the Fund's custody expenses by $3.
12. Distributions to Shareholders.
Distributions to shareholders of each class were as follows:
Years ended August 31, | 2012 | 2011 |
From net investment income | | |
Puritan | $ 290,441 | $ 333,862 |
Class K | 73,694 | 62,045 |
Total | $ 364,135 | $ 395,907 |
Annual Report
12. Distributions to Shareholders - continued
Years ended August 31, | 2012 | 2011 |
From net realized gain | | |
Puritan | $ - | $ 2,823 |
Class K | - | 441 |
Total | $ - | $ 3,264 |
13. Share Transactions.
Transactions for each class of shares were as follows:
| Shares | Dollars |
Years ended August 31, | 2012 | 2011 | 2012 | 2011 |
Puritan | | | | |
Shares sold | 79,946 | 80,583 | $ 1,477,678 | $ 1,457,491 |
Reinvestment of distributions | 15,053 | 17,715 | 274,339 | 318,717 |
Shares redeemed | (172,734) | (180,664) | (3,181,243) | (3,262,008) |
Net increase (decrease) | (77,735) | (82,366) | $ (1,429,226) | $ (1,485,800) |
Class K | | | | |
Shares sold | 80,899 | 63,847 | $ 1,501,190 | $ 1,155,980 |
Reinvestment of distributions | 4,030 | 3,457 | 73,694 | 62,486 |
Shares redeemed | (47,844) | (30,388) | (889,457) | (549,211) |
Net increase (decrease) | 37,085 | 36,916 | $ 685,427 | $ 669,255 |
14. Other.
The Fund's organizational documents provide former and current trustees and officers with a limited indemnification against liabilities arising in connection with the performance of their duties to the Fund. In the normal course of business, the Fund may also enter into contracts that provide general indemnifications. The Fund's maximum exposure under these arrangements is unknown as this would be dependent on future claims that may be made against the Fund. The risk of material loss from such claims is considered remote.
Annual Report
To the Trustees of Fidelity Puritan Trust and the Shareholders of Fidelity Puritan Fund:
In our opinion, the accompanying statement of assets and liabilities, including the schedule of investments, and the related statements of operations and of changes in net assets and the financial highlights present fairly, in all material respects, the financial position of Fidelity Puritan Fund (a fund of Fidelity Puritan Trust) at August 31, 2012, the results of its operations for the year then ended, the changes in its net assets for each of the two years in the period then ended and the financial highlights for each of the periods indicated, in conformity with accounting principles generally accepted in the United States of America. These financial statements and financial highlights (hereafter referred to as "financial statements") are the responsibility of the Fidelity Puritan Fund's management. Our responsibility is to express an opinion on these financial statements based on our audits. We conducted our audits of these financial statements in accordance with the standards of the Public Company Accounting Oversight Board (United States). Those standards require that we plan and perform the audit to obtain reasonable assurance about whether the financial statements are free of material misstatement. An audit includes examining, on a test basis, evidence supporting the amounts and disclosures in the financial statements, assessing the accounting principles used and significant estimates made by management, and evaluating the overall financial statement presentation. We believe that our audits, which included confirmation of securities at August 31, 2012 by correspondence with the custodian, brokers and agent banks, provide a reasonable basis for our opinion.
PricewaterhouseCoopers LLP
Boston, Massachusetts
October 19, 2012
Annual Report
The Trustees, Members of the Advisory Board, and executive officers of the trust and fund, as applicable, are listed below. The Board of Trustees governs the fund and is responsible for protecting the interests of shareholders. The Trustees are experienced executives who meet periodically throughout the year to oversee the fund's activities, review contractual arrangements with companies that provide services to the fund, oversee management of the risks associated with such activities and contractual arrangements, and review the fund's performance.Except for James C. Curvey, each of the Trustees oversees 228 funds advised by FMR or an affiliate. Mr. Curvey oversees 435 funds advised by FMR or an affiliate.
The Trustees hold office without limit in time except that (a) any Trustee may resign; (b) any Trustee may be removed by written instrument, signed by at least two-thirds of the number of Trustees prior to such removal; (c) any Trustee who requests to be retired or who has become incapacitated by illness or injury may be retired by written instrument signed by a majority of the other Trustees; and (d) any Trustee may be removed at any special meeting of shareholders by a two-thirds vote of the outstanding voting securities of the trust.Each Trustee who is not an interested person (as defined in the 1940 Act) (Independent Trustee), shall retire not later than the last day of the calendar year in which his or her 75th birthday occurs. The Independent Trustees may waive this mandatory retirement age policy with respect to individual Trustees.The executive officers and Advisory Board Members hold office without limit in time, except that any officer and Advisory Board Member may resign or may be removed by a vote of a majority of the Trustees at any regular meeting or any special meeting of the Trustees. Except as indicated, each individual has held the office shown or other offices in the same company for the past five years.
Experience, Skills, Attributes, and Qualifications of the Fund's Trustees. The Governance and Nominating Committee has adopted a statement of policy that describes the experience, qualifications, attributes, and skills that are necessary and desirable for potential Independent Trustee candidates (Statement of Policy). The Board believes that each Trustee satisfied at the time he or she was initially elected or appointed a Trustee, and continues to satisfy, the standards contemplated by the Statement of Policy. The Governance and Nominating Committee also engages professional search firms to help identify potential Independent Trustee candidates who have the experience, qualifications, attributes, and skills consistent with the Statement of Policy. From time to time, additional criteria based on the composition and skills of the current Independent Trustees, as well as experience or skills that may be appropriate in light of future changes to board composition, business conditions, and regulatory or other developments, have also been considered by the professional search firms and the Governance and Nominating Committee. In addition, the Board takes into account the Trustees' commitment and participation in Board and committee meetings, as well as their leadership of standing and ad hoc committees throughout their tenure.
In determining that a particular Trustee was and continues to be qualified to serve as a Trustee, the Board has considered a variety of criteria, none of which, in isolation, was controlling. The Board believes that, collectively, the Trustees have balanced and diverse experience, qualifications, attributes, and skills, which allow the Board to operate effectively in governing the fund and protecting the interests of shareholders. Information about the specific experience, skills, attributes, and qualifications of each Trustee, which in each case led to the Board's conclusion that the Trustee should serve (or continue to serve) as a trustee of the fund, is provided below.
Annual Report
Board Structure and Oversight Function. James C. Curvey is an interested person (as defined in the 1940 Act) and currently serves as Chairman. The Trustees have determined that an interested Chairman is appropriate and benefits shareholders because an interested Chairman has a personal and professional stake in the quality and continuity of services provided to the fund. Independent Trustees exercise their informed business judgment to appoint an individual of their choosing to serve as Chairman, regardless of whether the Trustee happens to be independent or a member of management. The Independent Trustees have determined that they can act independently and effectively without having an Independent Trustee serve as Chairman and that a key structural component for assuring that they are in a position to do so is for the Independent Trustees to constitute a substantial majority for the Board. The Independent Trustees also regularly meet in executive session. Ned C. Lautenbach serves as Chairman of the Independent Trustees and as such (i) acts as a liaison between the Independent Trustees and management with respect to matters important to the Independent Trustees and (ii) with management prepares agendas for Board meetings.
Fidelity funds are overseen by different Boards of Trustees. The fund's Board oversees Fidelity's equity and high income funds and another Board oversees Fidelity's investment-grade bond, money market, and asset allocation funds. The asset allocation funds may invest in Fidelity funds overseen by the fund's Board. The use of separate Boards, each with its own committee structure, allows the Trustees of each group of Fidelity funds to focus on the unique issues of the funds they oversee, including common research, investment, and operational issues. On occasion, the separate Boards establish joint committees to address issues of overlapping consequences for the Fidelity funds overseen by each Board.
The Trustees operate using a system of committees to facilitate the timely and efficient consideration of all matters of importance to the Trustees, the fund, and fund shareholders and to facilitate compliance with legal and regulatory requirements and oversight of the fund's activities and associated risks. The Board, acting through its committees, has charged FMR and its affiliates with (i) identifying events or circumstances the occurrence of which could have demonstrably adverse effects on the fund's business and/or reputation; (ii) implementing processes and controls to lessen the possibility that such events or circumstances occur or to mitigate the effects of such events or circumstances if they do occur; and (iii) creating and maintaining a system designed to evaluate continuously business and market conditions in order to facilitate the identification and implementation processes described in (i) and (ii) above. Because the day-to-day operations and activities of the fund's are carried out by or through FMR, its affiliates and other service providers, the fund's exposure to risks is mitigated but not eliminated by the processes overseen by the Trustees. While each of the Board's committees has responsibility for overseeing different aspects of the fund's activities, oversight is exercised primarily through the Operations, Audit, and Compliance Committees. In addition, the Independent Trustees have worked with FMR to enhance the Board's oversight of investment and financial risks, legal and regulatory risks, technology risks, and operational risks, including the development of additional risk reporting to the Board. For example, a working group comprised of Independent Trustees and FMR has worked and continues to work to review the Fidelity funds' valuation-related activities, reporting and risk management. Appropriate personnel, including but not limited to the fund's Chief Compliance Officer (CCO), FMR's internal auditor, the independent accountants, the fund's Treasurer and portfolio management personnel, make periodic reports to the Board's committees, as appropriate, including an annual review of FMR's risk management program for the Fidelity funds. The responsibilities of each standing committee, including their oversight responsibilities, are described further under "Standing Committees of the Fund's Trustees."
Annual Report
Trustees and Officers - continued
The fund's Statement of Additional Information (SAI) includes more information about the Trustees. To request a free copy, call Fidelity at 1-800-835-5092.
Interested Trustees*:
Correspondence intended for each Trustee who is an interested person may be sent to Fidelity Investments, 82 Devonshire Street, Boston, Massachusetts 02109.
Name, Age; Principal Occupations and Other Relevant Experience+ |
James C. Curvey (77) |
| Year of Election or Appointment: 2007 Mr. Curvey is Trustee and Chairman of the Board of Trustees of certain Trusts. Mr. Curvey also serves as Trustee (2007-present) of other investment companies advised by FMR. Mr. Curvey is a Director of Fidelity Investments Money Management, Inc. (2009-present), Director of Fidelity Research & Analysis Co. (2009-present) and Director of FMR and FMR Co., Inc. (2007-present). Mr. Curvey is also Vice Chairman (2007-present) and Director of FMR LLC. In addition, Mr. Curvey serves as an Overseer for the Boston Symphony Orchestra and a member of the Trustees of Villanova University. Previously, Mr. Curvey was the Vice Chairman (2006-2007) and Director (2000-2007) of FMR Corp. |
Ronald P. O'Hanley (55) |
| Year of Election or Appointment: 2011 Mr. O'Hanley is Director of FMR Co., Inc. (2010-present), Director of Fidelity Investments Money Management, Inc. (2010-present), Director of Fidelity Research & Analysis Company (2010-present), President of Fidelity Asset Management and Corporate Services and a member of Fidelity's Executive Committee (2010-present). Previously, Mr. O'Hanley served as President and Chief Executive Officer of BNY Mellon Asset Management (2007-2010). Mr. O'Hanley also served as Vice Chairman of Bank New York Mellon Corp. and a member of that firm's Executive Committee. Prior to the 2007 merger of The Bank of New York and Mellon Financial Corporation, he was Vice Chairman of Mellon Financial Corporation and President and Chief Executive Officer of Mellon Asset Management. He joined Mellon in February 1997. Mr. O'Hanley currently serves as Chairman of the Boston Public Library Foundation Board of Directors and sits on the Board of Directors of Beth Israel Deaconess Medical Center, the Board of Trustees of the Marine Biological Laboratory and the Advisory Board of the Maxwell School of Citizenship and Public Administration at Syracuse University. Mr. O'Hanley also chairs the Council on Asset Management for the Financial Services Roundtable and is a member of the Board of Directors of Institutional Investor's U.S. Institute. |
* Trustees have been determined to be "Interested Trustees" by virtue of, among other things, their affiliation with the trust or various entities under common control with FMR.
+ The information above includes each Trustee's principal occupation during the last five years and other information relating to the experience, attributes, and skills relevant to each Trustee's qualifications to serve as a Trustee, which led to the conclusion that each Trustee should serve as a Trustee for the fund.
Annual Report
Trustees and Officers - continued
Independent Trustees:
Correspondence intended for each Independent Trustee (that is, the Trustees other than the Interested Trustees) may be sent to Fidelity Investments, P.O. Box 55235, Boston, Massachusetts 02205-5235.
Name, Age; Principal Occupations and Other Relevant Experience+ |
Dennis J. Dirks (64) |
| Year of Election or Appointment: 2005 Prior to his retirement in May 2003, Mr. Dirks was Chief Operating Officer and a member of the Board of The Depository Trust & Clearing Corporation (DTCC). He also served as President, Chief Operating Officer, and Board member of The Depository Trust Company (DTC) and President and Board member of the National Securities Clearing Corporation (NSCC). In addition, Mr. Dirks served as Chief Executive Officer and Board member of the Government Securities Clearing Corporation, Chief Executive Officer and Board member of the Mortgage-Backed Securities Clearing Corporation, as a Trustee and a member of the Finance Committee of Manhattan College (2005-2008), and as a Trustee and a member of the Finance Committee of AHRC of Nassau County (2006-2008). Mr. Dirks is a member of the Independent Directors Council (IDC) Governing Council (2010-present) and Board of Directors for The Brookville Center for Children's Services, Inc. (2009-present). |
Alan J. Lacy (58) |
| Year of Election or Appointment: 2008 Mr. Lacy serves as Senior Adviser (2007-present) of Oak Hill Capital Partners, L.P. (private equity). Mr. Lacy also served as Chief Executive Officer (2000-2005) and Vice Chairman (2005-2006) of Sears Holdings Corporation and Sears, Roebuck and Co. (retail). In addition, Mr. Lacy serves as a member of the Board of Directors of Dave & Buster's Entertainment, Inc. (restaurant and entertainment complexes, 2010-present), Earth Fare, Inc. (retail grocery, 2012-present), The Hillman Companies, Inc. (hardware wholesalers, 2010-present), and Bristol-Myers Squibb Company (global pharmaceuticals, 2008-present). Mr. Lacy is a member of the Board of Trustees of The National Parks Conservation Association (2006-present). Previously, Mr. Lacy served as Chairman of the Board of Trustees of the National Parks Conservation Association (2008-2011) and as a member of the Board of Directors for the Western Union Company (global money transfer, 2006-2011). |
Ned C. Lautenbach (68) |
| Year of Election or Appointment: 2000 Mr. Lautenbach is Chairman of the Independent Trustees of the Equity and High Income Funds (2006-present). Mr. Lautenbach currently serves as the Lead Director of the Eaton Corporation Board of Directors (diversified industrial, 1997-present). Mr. Lautenbach is Chairman of the Board of Directors of the Philharmonic Center for the Arts in Naples, Florida (2012-present) and a member of the Council on Foreign Relations (1994-present). Previously, Mr. Lautenbach was a Partner/Advisory Partner at Clayton, Dubilier & Rice, LLC (private equity investment, 1998-2010), as well as a Director of Sony Corporation (2006-2007). |
Joseph Mauriello (67) |
| Year of Election or Appointment: 2008 Prior to his retirement in January 2006, Mr. Mauriello served in numerous senior management positions including Deputy Chairman and Chief Operating Officer (2004-2005), and Vice Chairman of Financial Services (2002-2004) of KPMG LLP US (professional services, 1965-2005). Mr. Mauriello currently serves as a member of the Board of Directors of XL Group plc. (global insurance and re-insurance, 2006-present). Previously, Mr. Mauriello served as a Director of the Hamilton Funds of the Bank of New York (2006-2007) and of Arcadia Resources Inc. (health care services and products, 2007-2012). |
Robert W. Selander (61) |
| Year of Election or Appointment: 2011 Previously, Mr. Selander served as a Member of the Advisory Board of Fidelity's Equity and High Income Funds (2011), Executive Vice Chairman (2010), Chief Executive Officer (2009-2010), and President and Chief Executive Officer (1997-2009) of Mastercard, Inc. |
Cornelia M. Small (68) |
| Year of Election or Appointment: 2005 Ms. Small is a member of the Board of Directors (2009-present) and Chair of the Investment Committee (2010-present) of the Teagle Foundation. Ms. Small also serves on the Investment Committee of the Berkshire Taconic Community Foundation (2008-present). Previously, Ms. Small served as Chairperson (2002-2008) and a member of the Investment Committee and Chairperson (2008-2012) and a member of the Board of Trustees of Smith College. In addition, Ms. Small served as Chief Investment Officer, Director of Global Equity Investments, and a member of the Board of Directors of Scudder, Stevens & Clark and Scudder Kemper Investments. |
William S. Stavropoulos (73) |
| Year of Election or Appointment: 2001 Mr. Stavropoulos is Vice Chairman of the Independent Trustees of the Equity and High Income Funds (2006-present). Mr. Stavropoulos serves as President and Founder of the Michigan Baseball Foundation, the Great Lakes Loons (2007-present). Mr. Stavropoulos is Chairman Emeritus of the Board of Directors of The Dow Chemical Company, where he previously served in numerous senior management positions, including President, CEO (1995-2000; 2002-2004), Chairman of the Executive Committee (2000-2006), and as a member of the Board of Directors (1990-2006). Currently, Mr. Stavropoulos is a Director of Univar Inc. (global distributor of commodity and specialty chemicals, Chairman from 2010-May 2012 and Lead Director from May 2012-present), Teradata Corporation (data warehousing and technology solutions, 2008-present), Maersk Inc. (industrial conglomerate), and Tyco International, Ltd. (multinational manufacturing and services, 2007-present), and a member of the Advisory Board for Metalmark Capital LLC (private equity investment, 2005-present). Mr. Stavropoulos is an operating advisor to Clayton, Dubilier & Rice, LLC (private equity investment). In addition, Mr. Stavropoulos is a member of the University of Notre Dame Advisory Council for the College of Science, a Trustee of the Rollin L. Gerstacker Foundation, and a Director of the Naples Philharmonic Center for the Arts. Previously, Mr. Stavropoulos served as a Director of Chemical Financial Corporation (bank holding company, 1993-2012). |
David M. Thomas (63) |
| Year of Election or Appointment: 2008 Previously, Mr. Thomas served as Executive Chairman (2005-2006) and Chairman and Chief Executive Officer (2000-2005) of IMS Health, Inc. (pharmaceutical and healthcare information solutions), and a Director of Fortune Brands, Inc. (consumer products, 2000-2011). In addition, Mr. Thomas serves as Non-Executive Chairman of the Board of Directors of Fortune Brands Home and Security (home and security products, 2011-present), and as a member of the Board of Directors of Interpublic Group of Companies, Inc. (marketing communication, 2004-present). |
Michael E. Wiley (61) |
| Year of Election or Appointment: 2008 Mr. Wiley also serves as a Director of Asia Pacific Exploration Consolidated (international oil and gas exploration and production, 2008-present). Mr. Wiley serves as a Director of Tesoro Corporation (independent oil refiner and marketer, 2005-present), and a Director of Bill Barrett Corporation (exploration and production, 2005-present). In addition, Mr. Wiley also serves as a Director of Post Oak Bank (privately-held bank, 2004-present). Previously, Mr. Wiley served as a member of the Board of Trustees of the University of Tulsa (2000-2006; 2007-2010), as a Senior Energy Advisor of Katzenbach Partners, LLC (consulting, 2006-2007), as an Advisory Director of Riverstone Holdings (private investment), Chairman, President, and CEO of Baker Hughes, Inc. (oilfield services, 2000-2004), and as Director of Spinnaker Exploration Company (exploration and production, 2001-2005). |
+ The information above includes each Trustee's principal occupation during the last five years and other information relating to the experience, attributes, and skills relevant to each Trustee's qualifications to serve as a Trustee, which led to the conclusion that each Trustee should serve as a Trustee for the fund.
Advisory Board Members and Executive Officers:
Correspondence intended for David A. Rosow and Garnett A. Smith may be sent to Fidelity Investments, P.O. Box 55235, Boston, Massachusetts 02205-5235. Correspondence intended for each executive officer, Edward C. Johnson 3d, and Peter S. Lynch may be sent to Fidelity Investments, 82 Devonshire Street, Boston, Massachusetts 02109.
Name, Age; Principal Occupation |
Edward C. Johnson 3d (82) |
| Year of Election or Appointment: 2011 Member of the Advisory Board of Fidelity's Equity and High Income Funds. Mr. Johnson serves as Chief Executive Officer, Chairman, and a Director of FMR LLC, and also serves as Chairman and Director of FIL Limited. Previously, Mr. Johnson served as a Trustee and Chairman of the Board of certain Fidelity Trusts, Chairman and a Director of FMR, Chairman and a Director of FMR Co., Inc., and President of FMR LLC (2006-2007). |
Peter S. Lynch (68) |
| Year of Election or Appointment: 2003 Member of the Advisory Board of Fidelity's Equity and High Income Funds. Mr. Lynch is Vice Chairman and a Director of FMR and FMR Co., Inc. In addition, Mr. Lynch serves as a Trustee of Boston College and as the Chairman of the Inner-City Scholarship Fund. Previously, Mr. Lynch served on the Special Olympics International Board of Directors (1997-2006). |
David A. Rosow (69) |
| Year of Election or Appointment: 2012 Member of the Advisory Board of Fidelity's Equity and High Income Funds. Chairman and Chief Executive Officer of International Golf Group, Inc. (golf course development, 1989-present). Previously, Mr. Rosow served as Chairman and Chief Executive Officer of Rosow & Company, Inc. (private investment company, 1989-2011), a Lead Director of Hudson United Bancorp (2001-2006) and as a Director of TD Banknorth (1996-2006). In addition, Mr. Rosow is a member (2008-present) and President (2009-present) of the Town Council of Palm Beach, Florida. |
Garnett A. Smith (64) |
| Year of Election or Appointment: 2012 Member of the Advisory Board of Fidelity's Equity and High Income Funds. Prior to Mr. Smith's retirement, he served as Chairman and Chief Executive Officer of Inbrand Corp. (manufacturer of personal absorbent products, 1990-1997). He also served as President (1986-1990) of Inbrand Corp. Prior to his employment with Inbrand Corp., he was employed by a retail fabric chain and North Carolina National Bank. In addition, Mr. Smith is a board member of the Jackson Hole Land Trust (2009-present). |
Kenneth B. Robins (43) |
| Year of Election or Appointment: 2008 President and Treasurer of Fidelity's Equity and High Income Funds. Mr. Robins also serves as President and Treasurer (2010-present) and Assistant Treasurer (2009-present) of other Fidelity funds and is an employee of Fidelity Investments (2004-present). Previously, Mr. Robins served as Deputy Treasurer of the Fidelity funds (2005-2008) and Treasurer and Chief Financial Officer of The North Carolina Capital Management Trust: Cash and Term Portfolios (2006-2008). |
Bruce T. Herring (47) |
| Year of Election or Appointment: 2006 Vice President of certain Equity Funds. Mr. Herring also serves as President of Fidelity Research & Analysis Company (2010-present), Chief Investment Officer and Director of Fidelity Management & Research (U.K.) Inc. (2010-present) and Group Chief Investment Officer of FMR. Previously, Mr. Herring served as Vice President (2005-2006) and Senior Vice President (2006-2007) of Fidelity Management & Research Company, Vice President of FMR Co., Inc. (2001-2007) and as a portfolio manager for Fidelity U.S. Equity Funds. |
Brian B. Hogan (47) |
| Year of Election or Appointment: 2009 Vice President of Equity and High Income Funds. Mr. Hogan also serves as President of FMR's Equity Division (2009-present). Previously, Mr. Hogan served as Senior Vice President, Equity Research of FMR (2006-2009) and as a portfolio manager. |
Scott C. Goebel (44) |
| Year of Election or Appointment: 2008 Secretary and Chief Legal Officer (CLO) of the Fidelity funds. Mr. Goebel also serves as Secretary of Fidelity Investments Money Management, Inc. (FIMM) (2010-present) and Fidelity Research and Analysis Company (FRAC) (2010-present); Secretary and CLO of The North Carolina Capital Management Trust: Cash and Term Portfolios (2008-present); General Counsel, Secretary, and Senior Vice President of FMR (2008-present) and FMR Co., Inc. (2008-present); employed by FMR LLC or an affiliate (2001-present); Chief Legal Officer of Fidelity Management & Research (Hong Kong) Limited (2008-present) and Assistant Secretary of Fidelity Management & Research (Japan) Inc. (2008-present), and Fidelity Management & Research (U.K.) Inc. (2008-present). Previously, Mr. Goebel served as Assistant Secretary of FIMM (2008-2010), FRAC (2008-2010), and the Funds (2007-2008) and as Vice President and Secretary of Fidelity Distributors Corporation (FDC) (2005-2007). |
William C. Coffey (43) |
| Year of Election or Appointment: 2009 Assistant Secretary of Fidelity's Equity and High Income Funds. Mr. Coffey also serves as Senior Vice President and Deputy General Counsel of FMR LLC (2010-present), and is an employee of Fidelity Investments. Previously, Mr. Coffey served as Vice President and Associate General Counsel of FMR LLC (2005-2009). |
Elizabeth Paige Baumann (44) |
| Year of Election or Appointment: 2012 Anti-Money Laundering (AML) Officer of the Fidelity funds. Ms. Baumann also serves as AML Officer of The North Carolina Capital Management Trust: Cash and Term Portfolios (2012-present), Chief AML Officer of FMR LLC (2012-present), and is an employee of Fidelity Investments. Previously, Ms. Baumann served as Vice President and Deputy Anti-Money Laundering Officer (2007-2012). |
Christine Reynolds (53) |
| Year of Election or Appointment: 2008 Chief Financial Officer of the Fidelity funds. Ms. Reynolds became President of Fidelity Pricing and Cash Management Services (FPCMS) in August 2008. Ms. Reynolds served as Chief Operating Officer of FPCMS (2007-2008). Previously, Ms. Reynolds served as President, Treasurer, and Anti-Money Laundering officer of the Fidelity funds (2004-2007). |
Joseph A. Hanlon (44) |
| Year of Election or Appointment: 2012 Chief Compliance Officer of Fidelity's Equity and High Income Funds. Mr. Hanlon serves as Compliance Officer of FMR, FMR Co., Inc., Fidelity Investments Money Management, Inc. (FIMM), Fidelity Research and Analysis Company (FRAC), Fidelity Management & Research (Japan) Inc., Fidelity Management & Research (U.K.) Inc., Fidelity Management & Research (Hong Kong), and Strategic Advisers, Inc. (2009-present), as Senior Vice President of the Fidelity Asset Management Division (2009-present), and is an employee of Fidelity Investments. |
Joseph F. Zambello (55) |
| Year of Election or Appointment: 2011 Deputy Treasurer of the Fidelity funds. Mr. Zambello is an employee of Fidelity Investments. Previously, Mr. Zambello served as Vice President of FMR's Program Management Group (2009-2011) and Vice President of the Transfer Agent Oversight Group (2005-2009). |
Adrien E. Deberghes (45) |
| Year of Election or Appointment: 2008 Deputy Treasurer of Fidelity's Equity and High Income Funds. Mr. Deberghes also serves as Vice President (2011-present) and Assistant Treasurer (2010-present) of other Fidelity funds, and is an employee of Fidelity Investments (2008-present). Previously, Mr. Deberghes served as Senior Vice President of Mutual Fund Administration at State Street Corporation (2007-2008), Senior Director of Mutual Fund Administration at Investors Bank & Trust (2005-2007), and Director of Finance for Dunkin' Brands (2000-2005). |
Stephanie J. Dorsey (43) |
| Year of Election or Appointment: 2010 Assistant Treasurer of Fidelity's Equity and High Income Funds. Ms. Dorsey also serves as Deputy Treasurer of other Fidelity funds (2008-present) and is an employee of Fidelity Investments (2008-present). Previously, Ms. Dorsey served as Treasurer (2004-2008) of the JPMorgan Mutual Funds and Vice President (2004-2008) of JPMorgan Chase Bank. |
John R. Hebble (54) |
| Year of Election or Appointment: 2009 Assistant Treasurer of Fidelity's Equity and High Income Funds. Mr. Hebble also serves as President (2011-present), Treasurer, and Chief Financial Officer of The North Carolina Capital Management Trust: Cash and Term Portfolios (2008-present), President and Treasurer of other Fidelity funds (2008-present) and is an employee of Fidelity Investments. |
Gary W. Ryan (54) |
| Year of Election or Appointment: 2005 Assistant Treasurer of the Fidelity funds. Mr. Ryan is an employee of Fidelity Investments. Previously, Mr. Ryan served as Vice President of Fund Reporting in Fidelity Pricing and Cash Management Services (FPCMS) (1999-2005). |
Jonathan Davis (44) |
| Year of Election or Appointment: 2010 Assistant Treasurer of the Fidelity funds. Mr. Davis is also Assistant Treasurer of Fidelity Rutland Square Trust II and Fidelity Commonwealth Trust II. Mr. Davis is an employee of Fidelity Investments. Previously, Mr. Davis served as Vice President and Associate General Counsel of FMR LLC (2003-2010). |
Annual Report
The Board of Trustees of Puritan Fund voted to pay to shareholders of record at the opening of business on record date, the following distributions per share derived from capital gains realized from sales of portfolio securities, and dividends derived from net investment income:
| Pay Date | Record Date | Dividends | Capital Gains |
Class K | 10/15/12 | 10/12/12 | $0.088 | $0.236 |
The fund hereby designates as a capital gain dividend with respect to the taxable year ended August 31, 2012 $238,911,300, or, if subsequently determined to be different, the net capital gain of such year.
A total of 4.34% of the dividends distributed during the fiscal year was derived from interest on U.S. Government securities which is generally exempt from state income tax.
The fund designates $146,984,558 of distributions paid during the period January 1, 2012 to August 31, 2012 as qualifying to be taxed as interest-related dividends for nonresident alien shareholders.
Class K designates 12%, 36%, 56%, 57% of the dividends distributed in October, December, April and July, respectively during the fiscal year as qualifying for the dividends-received deduction for corporate shareholders.
Class K designates 15%, 45%, 65%, 66% of the dividends distributed in October, December, April and July, respectively during the fiscal year as amounts which may be taken into account as a dividend for the purposes of the maximum rate under section 1(h)(11) of the Internal Revenue Code.
The fund will notify shareholders in January 2013 of amounts for use in preparing 2012 income tax returns.
Annual Report
Board Approval of Investment Advisory Contracts and Management Fees
Fidelity Puritan Fund
Each year, the Board of Trustees, including the Independent Trustees (together, the Board), votes on the renewal of the management contract and sub-advisory agreements (together, the Advisory Contracts) for the fund. The Board, assisted by the advice of fund counsel and Independent Trustees' counsel, requests and considers a broad range of information relevant to the renewal of the Advisory Contracts throughout the year.
The Board meets regularly and, at each of its meetings, considers factors that are relevant to its annual consideration of the renewal of the fund's Advisory Contracts, including the services and support provided to the fund and its shareholders. The Board has established various standing committees, each composed of and chaired by Independent Trustees with varying backgrounds, to which the Board has assigned specific subject matter responsibilities in order to enhance effective decision-making by the Board. The Board, acting directly and through its Committees, requests and receives information concerning the annual consideration of the renewal of the fund's Advisory Contracts. The Board also meets as needed to consider matters specifically related to the Board's annual consideration of the renewal of Advisory Contracts. Members of the Board may also meet with trustees of other Fidelity funds through ad hoc joint committees to discuss certain matters relevant to the Fidelity funds.
At its July 2012 meeting, the Board of Trustees, including the Independent Trustees, unanimously determined to renew the fund's Advisory Contracts. In reaching its determination, the Board considered all factors it believed relevant, including (i) the nature, extent, and quality of the services to be provided to the fund and its shareholders (including the investment performance of the fund); (ii) the competitiveness of the fund's management fee and total expense ratio relative to peer funds; (iii) the total costs of the services to be provided by and the profits to be realized by Fidelity from its relationship with the fund; (iv) the extent to which economies of scale exist and would be realized as the fund grows; and (v) whether fee levels reflect these economies of scale, if any, for the benefit of fund shareholders.
In considering whether to renew the Advisory Contracts for the fund, the Board reached a determination, with the assistance of fund counsel and Independent Trustees' counsel and through the exercise of its business judgment, that the renewal of the Advisory Contracts is in the best interests of the fund and its shareholders and that the compensation payable under the Advisory Contracts is fair and reasonable. The Board's decision to renew the Advisory Contracts was not based on any single factor, but rather was based on a comprehensive consideration of all the information provided to the Board at its meetings throughout the year. The Board, in reaching its determination to renew the Advisory Contracts, is aware that shareholders in the fund have a broad range of investment choices available to them, including a wide choice among mutual funds offered by Fidelity's competitors, and that the fund's shareholders, who have the opportunity to review and weigh the disclosure provided by the fund in its prospectus and other public disclosures, have chosen to invest in this fund, managed by Fidelity.
Annual Report
Board Approval of Investment Advisory Contracts and
Management Fees - continued
Nature, Extent, and Quality of Services Provided. The Board considered the staffing within the investment adviser, FMR, and the sub-advisers (together, the Investment Advisers), including the backgrounds of the fund's investment personnel, and also considered the fund's investment objective, strategies, and related investment philosophy. The Independent Trustees also had discussions with senior management of Fidelity's investment operations and investment groups. The Board considered the structure of the portfolio manager compensation program and whether this structure provides appropriate incentives to act in the best interests of the fund.
Resources Dedicated to Investment Management and Support Services. The Board and the Fund Oversight and Research Committees reviewed the general qualifications and capabilities of the Investment Advisers' investment staff, including its size, education, experience, and resources, as well as the Investment Advisers' approach to recruiting, training, managing, and compensating investment personnel. The Board also noted that FMR has continued to increase the resources devoted to non-U.S. offices, including expansion of Fidelity's global investment organization. The Board noted that Fidelity's analysts have extensive resources, tools and capabilities that allow them to conduct sophisticated quantitative and fundamental analysis, as well as credit analysis of issuers, counterparties and guarantors. The Board also believes that Fidelity's investment professionals have sufficient access to global information and data so as to provide competitive investment results over time, and that those professionals also have access to sophisticated tools that permit them to assess portfolio construction and risk and performance attribution characteristics continuously, as well as to transmit new information and research conclusions rapidly around the world. Additionally, in its deliberations, the Board considered the Investment Advisers' trading and risk management capabilities and resources, which are an integral part of the investment management process.
Shareholder and Administrative Services. The Board considered (i) the nature, extent, quality, and cost of advisory, administrative, and shareholder services performed by the Investment Advisers and their affiliates under the Advisory Contracts and under separate agreements covering transfer agency, pricing and bookkeeping, and securities lending services for the fund; (ii) the nature and extent of the supervision of third party service providers, principally custodians and subcustodians; and (iii) the resources devoted to, and the record of compliance with, the fund's compliance policies and procedures. The Board also reviewed the allocation of fund brokerage, including allocations to brokers affiliated with the Investment Advisers, the use of brokerage commissions to pay fund expenses, and the use of "soft" commission dollars to pay for research services.
Annual Report
The Board noted that the growth of fund assets over time across the complex allows Fidelity to reinvest in the development of services designed to enhance the value or convenience of the Fidelity funds as investment vehicles. These services include 24-hour access to account information and market information through telephone representatives and over the Internet, investor education materials and asset allocation tools, and the expanded availability of Fidelity Investor Centers.
Investment in a Large Fund Family. The Board considered the benefits to shareholders of investing in a Fidelity fund, including the benefits of investing in a fund that is part of a large family of funds offering a variety of investment disciplines and providing a large variety of mutual fund investor services. The Board noted that Fidelity had taken, or had made recommendations that resulted in the Fidelity funds taking, a number of actions over the previous year that benefited particular funds, including (i) continuing to dedicate additional resources to investment research and support of the senior management team that oversees asset management; (ii) persisting in efforts to enhance Fidelity's research capabilities, in particular, international research; (iii) launching new funds and making other enhancements to meet client needs for global and income-oriented solutions; (iv) continuing to launch dedicated lower cost underlying funds to meet investment management's portfolio construction needs related to expanding underlying fund options, specifically for the Freedom Fund product lines; (v) adopting a "Stock Selector" sector neutral investment approach and employing a team of portfolio managers who are sector specialists to manage certain funds; (vi) rationalizing product lines and gaining increased efficiencies through the mergers of several funds into other funds; (vii) strengthening the Spartan Index Fund product line by adding new funds and/or new low-cost institutional share classes, restructuring fund expenses to accommodate new classes, and reducing investment minimums for certain classes of shares; (viii) modifying the eligibility criteria for Institutional Class shares to increase their appeal to government entities and charitable investors; and (ix) reducing certain transfer agent fee rates.
Investment Performance. The Board considered whether the fund has operated in accordance with its investment objective, as well as its record of compliance with its investment restrictions. It also reviewed the fund's absolute investment performance for each class, as well as the fund's relative investment performance for each class measured over multiple periods against (i) a proprietary custom index, and (ii) a peer group of mutual funds deemed appropriate by Fidelity and reviewed by the Board. The following charts considered by the Board show, over the one-, three-, and five-year periods ended December 31, 2011, as available, the cumulative total returns of Class K and the retail class of the fund, the cumulative total returns of a proprietary custom index ("benchmark"), and a range of cumulative total returns of a peer group of mutual funds identified by Lipper Inc. as having an investment objective similar to that of the fund. The box within each chart shows the 25th percentile return (top of box) and the 75th percentile return (bottom of box) of the peer group. Returns shown above the box are in the first quartile and returns shown below the box are in the fourth quartile. The percentage beaten numbers noted below each chart correspond to the percentile box and represent the percentage of funds in the peer group whose performance was equal to or lower than that of the class indicated. The fund's proprietary custom index is an index developed by FMR that represents the performance of the fund's general investment categories in both equity and bond securities.
Annual Report
Board Approval of Investment Advisory Contracts and
Management Fees - continued
Fidelity Puritan Fund
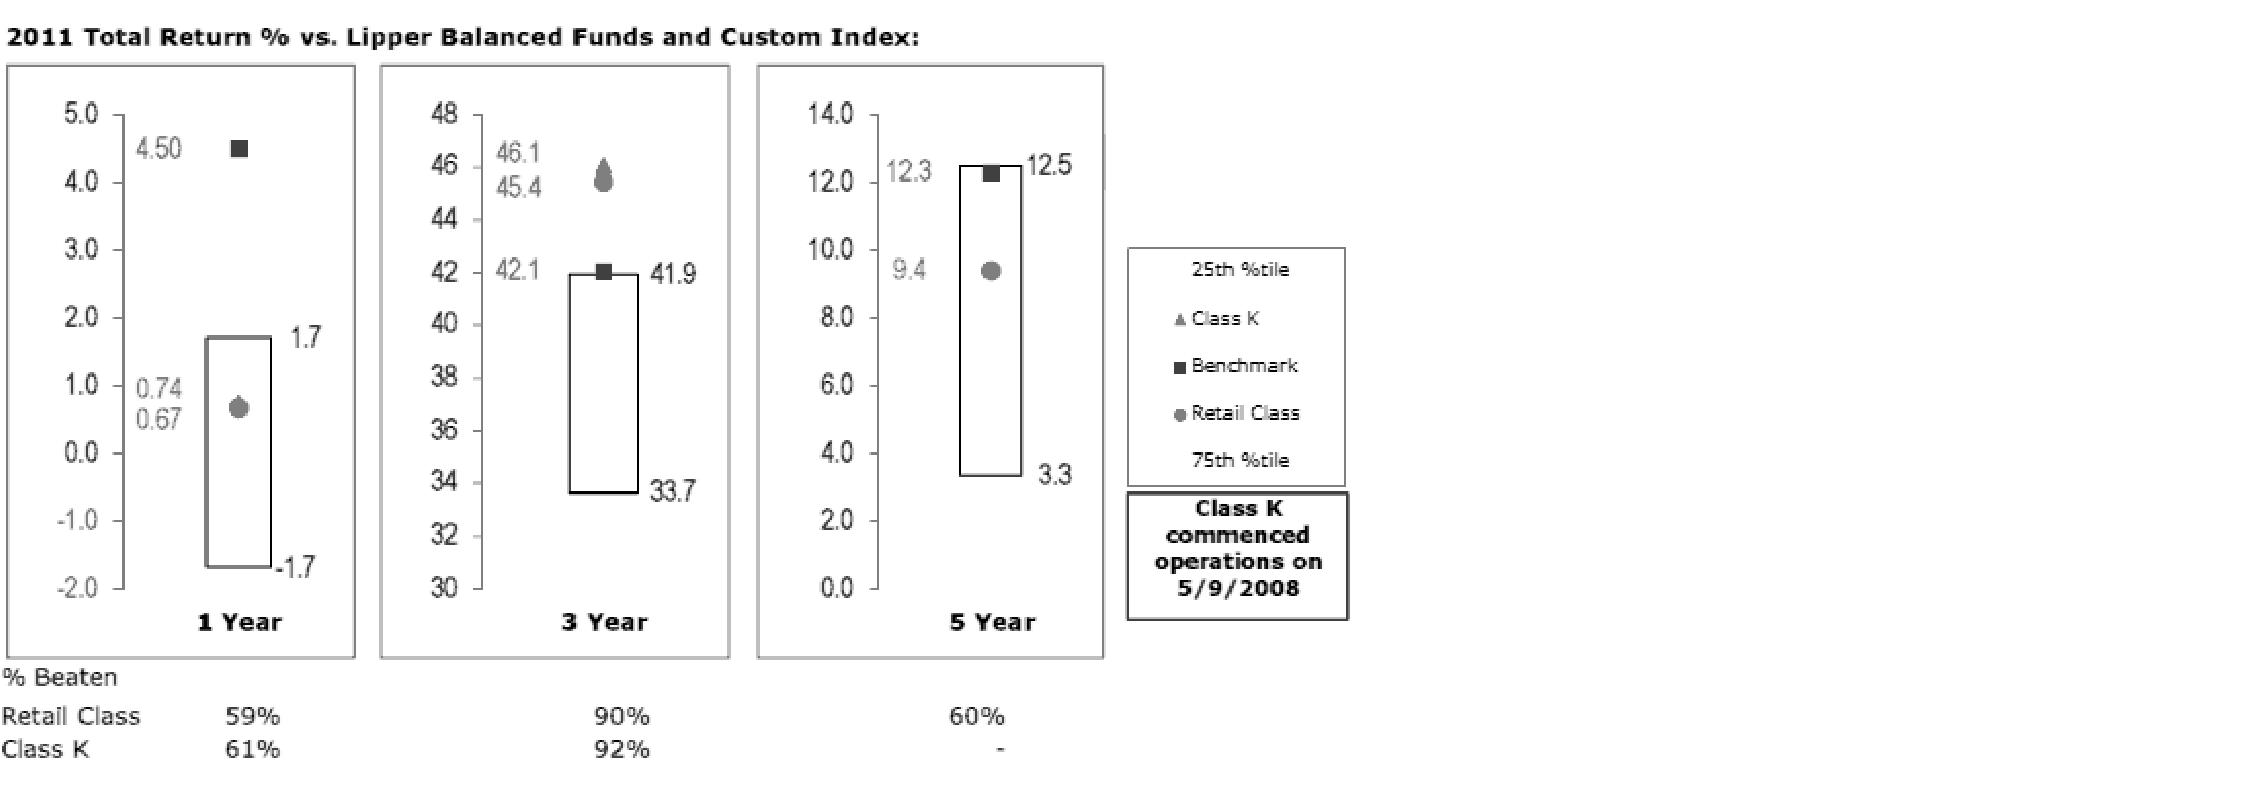
The Board reviewed the fund's relative investment performance against its peer group and noted that the performance of the retail class of the fund (the class with the longer performance record) was in the second quartile for the one- and five-year periods and the first quartile for the three-year period. The Board also noted that the investment performance of the fund was lower than its benchmark for the one- and five-year periods, although the three-year cumulative total return of the retail class compared favorably to its benchmark. The Board considered that the variations in performance between the fund's classes reflect the variations in class expenses, which result in lower performance for the higher expense class. The Board noted that there was a portfolio management change for the fund in March 2012. The Board also reviewed the fund's performance since inception as well as performance in the current year.
Based on its review, the Board concluded that the nature, extent, and quality of services provided to the fund under the Advisory Contracts should benefit the fund's shareholders.
Competitiveness of Management Fee and Total Expense Ratio. The Board considered the fund's management fee and total expense ratio compared to "mapped groups" of competitive funds and classes. Fidelity creates "mapped groups" by combining similar Lipper investment objective categories that have comparable management fee characteristics. Combining Lipper investment objective categories aids the Board's management fee and total expense ratio comparisons by broadening the competitive group used for comparison and by reducing the number of universes to which various Fidelity funds are compared.
Annual Report
Management Fee. The Board considered two proprietary management fee comparisons for the 12-month periods shown in the chart below. The group of Lipper funds used by the Board for management fee comparisons is referred to below as the "Total Mapped Group." The Total Mapped Group is broader than the Lipper peer group used by the Board for performance comparisons because the Total Mapped Group combines several Lipper investment objective categories while the Lipper peer group does not. The Total Mapped Group comparison focuses on a fund's standing relative to the total universe of comparable funds available to investors in terms of gross management fees before expense reimbursements or caps. "TMG %" represents the percentage of funds in the Total Mapped Group that had management fees that were lower than the fund's. For example, a TMG % of 11% means that 89% of the funds in the Total Mapped Group had higher management fees than the fund. The "Asset-Size Peer Group" (ASPG) comparison focuses on a fund's standing relative to non-Fidelity funds similar in size to the fund within the Total Mapped Group. The ASPG represents at least 15% of the funds in the Total Mapped Group with comparable asset size and management fee characteristics, subject to a minimum of 50 funds (or all funds in the Total Mapped Group if fewer than 50). Additional information, such as the ASPG quartile in which the fund's management fee ranked, is also included in the chart and considered by the Board.
Annual Report
Board Approval of Investment Advisory Contracts and
Management Fees - continued
Fidelity Puritan Fund
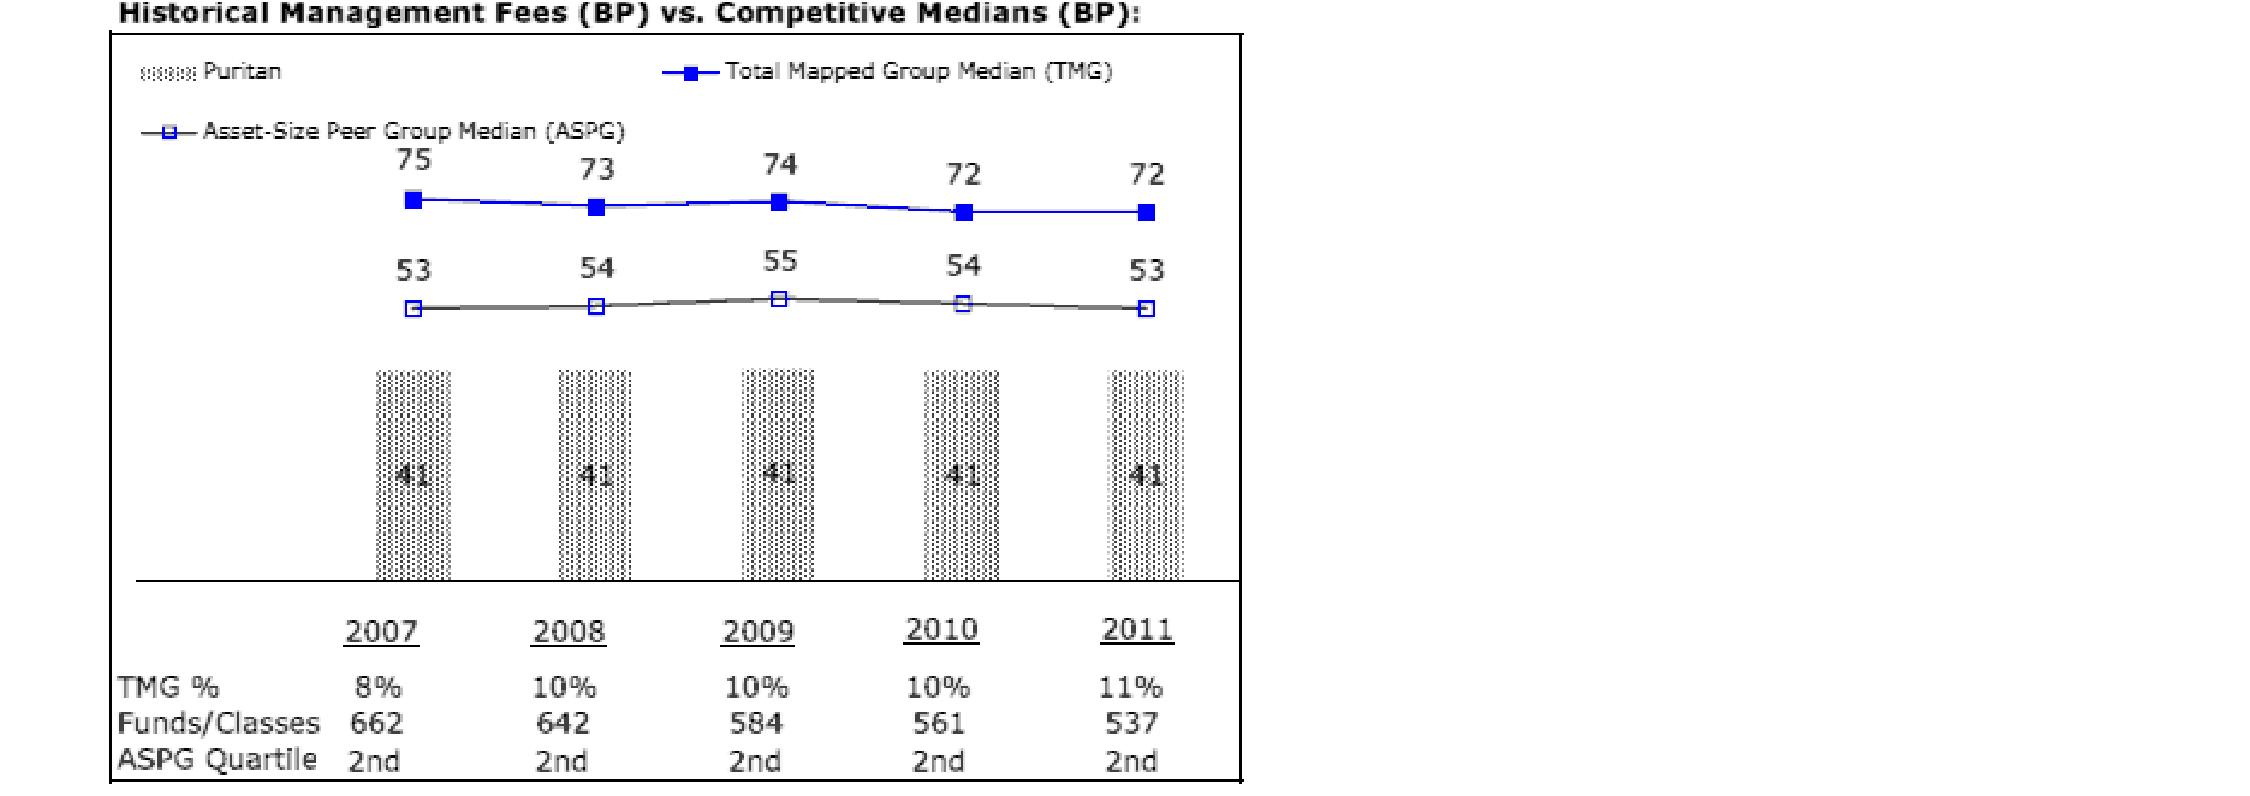
The Board noted that the fund's management fee ranked below the median of its Total Mapped Group and below the median of its ASPG for 2011.
Based on its review, the Board concluded that the fund's management fee is fair and reasonable in light of the services that the fund receives and the other factors considered.
Total Expense Ratio. In its review of each class's total expense ratio, the Board considered the fund's management fee as well as other fund or class expenses, as applicable, such as transfer agent fees, pricing and bookkeeping fees, and custodial, legal, and audit fees. The Board also noted the effects of any waivers and reimbursements on fees and expenses. As part of its review, the Board also considered the current and historical total expense ratios of each class of the fund compared to competitive fund median expenses. Each class of the fund is compared to those funds and classes in the Total Mapped Group (used by the Board for management fee comparisons) that have a similar sales load structure.
The Board noted that the total expense ratio of each class ranked below its competitive median for 2011.
Fees Charged to Other Fidelity Clients. The Board also considered Fidelity fee structures and other information with respect to clients of FMR and its affiliates, such as other mutual funds advised or subadvised by FMR or its affiliates, pension plan clients, and other institutional clients. The Board noted the findings of the 2010 ad hoc joint committee (created with the board of other Fidelity funds), which reviewed and compared Fidelity's institutional investment advisory business with its business of providing services to the Fidelity funds, including the differences in services provided, fees charged, and costs incurred, as well as competition in their respective marketplaces.
Annual Report
Based on its review of total expense ratios and fees charged to other Fidelity clients, the Board concluded that the total expense ratio of each class of the fund was reasonable in light of the services that the fund and its shareholders receive and the other factors considered.
Costs of the Services and Profitability. The Board considered the revenues earned and the expenses incurred by Fidelity in conducting the business of developing, marketing, distributing, managing, administering and servicing the fund and its shareholders. The Board also considered the level of Fidelity's profits in respect of all the Fidelity funds.
On an annual basis, FMR presents to the Board Fidelity's profitability for the fund. Fidelity calculates the profitability for each fund, as well as aggregate profitability for groups of Fidelity funds and all Fidelity funds, using a series of detailed revenue and cost allocation methodologies which originate with the books and records of Fidelity on which Fidelity's audited financial statements are based. The Audit Committee of the Board reviews any significant changes from the prior year's methodologies.
PricewaterhouseCoopers LLP (PwC), independent registered public accounting firm and auditor to Fidelity and certain Fidelity funds, has been engaged annually by the Board as part of the Board's assessment of Fidelity's profitability analysis. PwC's engagement includes the review and assessment of Fidelity's methodologies used in determining the revenues and expenses attributable to Fidelity's mutual fund business, and completion of agreed-upon procedures surrounding the mathematical accuracy of fund profitability and its conformity to allocation methodologies. After considering PwC's reports issued under the engagement and information provided by Fidelity, the Board concluded that while other allocation methods may also be reasonable, Fidelity's profitability methodologies are reasonable in all material respects.
The Board also reviewed Fidelity's non-fund businesses and fall-out benefits related to the mutual fund business as well as cases where Fidelity's affiliates may benefit from or be related to the fund's business.
The Board considered the costs of the services provided by and the profits realized by Fidelity in connection with the operation of the fund and was satisfied that the profitability was not excessive in the circumstances.
Economies of Scale. The Board considered whether there have been economies of scale in respect of the management of the Fidelity funds, whether the Fidelity funds (including the fund) have appropriately benefited from any such economies of scale, and whether there is potential for realization of any further economies of scale. The Board considered the extent to which the fund will benefit from economies of scale through increased services to the fund, through waivers or reimbursements, or through fee or expense reductions. The Board also noted that in 2009, it and the board of other Fidelity funds created an ad hoc committee (the Economies of Scale Committee) to analyze whether FMR attains economies of scale in respect of the management and servicing of the Fidelity funds, whether the Fidelity funds have appropriately benefited from such economies of scale, and whether there is potential for realization of any further economies of scale.
Annual Report
Board Approval of Investment Advisory Contracts and
Management Fees - continued
The Board recognized that the fund's management contract incorporates a "group fee" structure, which provides for lower group fee rates as total fund assets under FMR's management increase, and for higher group fee rates as total fund assets under FMR's management decrease. FMR calculates the group fee rates based on a tiered asset "breakpoint" schedule that varies based on asset class. The Board considered that the group fee is designed to deliver the benefits of economies of scale to fund shareholders when total Fidelity fund assets increase, even if assets of any particular fund are unchanged or have declined, because some portion of Fidelity's costs are attributable to services provided to all Fidelity funds, and all funds benefit if those costs can be allocated among more assets. The Board concluded that, given the group fee structure, fund shareholders will benefit from lower management fees as assets under FMR's management increase at the fund complex level, regardless of whether Fidelity achieves any such economies of scale.
The Board concluded, taking into account the analysis of the Economies of Scale Committee, that economies of scale, if any, are being appropriately shared between fund shareholders and Fidelity.
Additional Information Requested by the Board. In order to develop fully the factual basis for consideration of the Fidelity funds' Advisory Contracts, the Board requested and received additional information on certain topics, including (i) fund performance trends, actions to be taken by FMR to improve certain funds' overall performance, and Fidelity's long-term strategies for certain funds; (ii) the potential to further rationalize the Fidelity fund lineup with the possibility of achieving savings for the funds and Fidelity; (iii) Fidelity's compensation structure for portfolio managers and other key investment personnel; (iv) the amount of the investment that each portfolio manager has made in the Fidelity fund(s) that he or she manages; (v) the realization of fall-out benefits in certain Fidelity business units; (vi) Fidelity's group fee structures, the potential impact of regulatory changes on such structures, and the rationale for the individual fee rates of certain funds; (vii) fund profitability methodology, including Fidelity's cost allocation methodology, and the impact of certain factors on fund profitability results; (viii) trends regarding industry use of performance fee structures and the possibility of implementing performance fee structures for additional funds; and (ix) the impact of net redemptions from the Fidelity funds.
Based on its evaluation of all of the conclusions noted above, and after considering all factors it believed relevant, the Board ultimately concluded that the advisory fee structures are fair and reasonable, and that the fund's Advisory Contracts should be renewed.
Annual Report
Investment Adviser
Fidelity Management & Research Company
Boston, MA
Investment Sub-Advisers
FMR Co., Inc.
Fidelity Management & Research
(U.K.) Inc.
Fidelity Investments Money Management, Inc.
Fidelity Management & Research
(Hong Kong) Limited
Fidelity Management & Research
(Japan), Inc.
General Distributor
Fidelity Distributors Corporation
Smithfield, RI
Transfer and Service Agents
Fidelity Investments Institutional
Operations Company, Inc.
Boston, MA
Fidelity Service Company, Inc.
Boston, MA
Custodian
JP Morgan Chase Bank
New York, NY
(Fidelity Investment logo)(registered trademark)
Corporate Headquarters
82 Devonshire St., Boston, MA 02109
www.fidelity.com
PUR-K-UANN-1012
1.863164.103
Fidelity®
Puritan®
Fund
Annual Report
August 31, 2012
(Fidelity Cover Art)
Contents
Performance | (Click Here) | How the fund has done over time. |
Management's Discussion of Fund Performance | (Click Here) | The Portfolio Manager's review of fund performance and strategy. |
Shareholder Expense Example | (Click Here) | An example of shareholder expenses. |
Investment Changes | (Click Here) | A summary of major shifts in the fund's investments over the past six months. |
Investments | (Click Here) | A complete list of the fund's investments with their market values. |
Financial Statements | (Click Here) | Statements of assets and liabilities, operations, and changes in net assets,
as well as financial highlights. |
Notes | (Click Here) | Notes to the financial statements. |
Report of Independent Registered Public Accounting Firm | (Click Here) | |
Trustees and Officers | (Click Here) | |
Distributions | (Click Here) | |
Board Approval of Investment Advisory Contracts and Management Fees | (Click Here) | |
To view a fund's proxy voting guidelines and proxy voting record for the 12-month period ended June 30, visit http://www.fidelity.com/proxyvotingresults or visit the Securities and Exchange Commission's (SEC) web site at http://www.sec.gov. You may also call 1-800-544-8544 to request a free copy of the proxy voting guidelines.
Standard & Poor's, S&P and S&P 500 are registered service marks of The McGraw-Hill Companies, Inc. and have been licensed for use by Fidelity Distributors Corporation.
Other third party marks appearing herein are the property of their respective owners.
All other marks appearing herein are registered or unregistered trademarks or service marks of FMR LLC or an affiliated company. © 2012 FMR LLC. All rights reserved.
Annual Report
This report and the financial statements contained herein are submitted for the general information of the shareholders of the fund. This report is not authorized for distribution to prospective investors in the fund unless preceded or accompanied by an effective prospectus.
A fund files its complete schedule of portfolio holdings with the SEC for the first and third quarters of each fiscal year on Form N-Q. Forms N-Q are available on the SEC's web site at http://www.sec.gov. A fund's Forms N-Q may be reviewed and copied at the SEC's Public Reference Room in Washington, DC. Information regarding the operation of the SEC's Public Reference Room may be obtained by calling 1-800-SEC-0330. For a complete list of a fund's portfolio holdings, view the most recent holdings listing, semiannual report, or annual report on Fidelity's web site at http://www.fidelity.com, http://www.advisor.fidelity.com, or http://www.401k.com, as applicable.
NOT FDIC INSURED • MAY LOSE VALUE • NO BANK GUARANTEE
Neither the fund nor Fidelity Distributors Corporation is a bank.
Annual Report
Average annual total return reflects the change in the value of an investment, assuming reinvestment of the class' distributions from dividend income and capital gains (the profits earned upon the sale of securities that have grown in value, if any) and assuming a constant rate of performance each year. The $10,000 table and the fund's returns do not reflect the deduction of taxes that a shareholder would pay on fund distributions or the redemption of fund shares. During periods of reimbursement by Fidelity, a fund's total return will be greater than it would be had the reimbursement not occurred. How a fund did yesterday is no guarantee of how it will do tomorrow.
Average Annual Total Returns
Periods ended August 31, 2012 | Past 1
year | Past 5
years | Past 10
years |
Fidelity® Puritan® Fund | 12.35% | 3.17% | 6.89% |
$10,000 Over 10 Years
Let's say hypothetically that $10,000 was invested in Fidelity® Puritan® Fund, a class of the fund, on August 31, 2002. The chart shows how the value of your investment would have changed, and also shows how the S&P 500® Index performed over the same period.
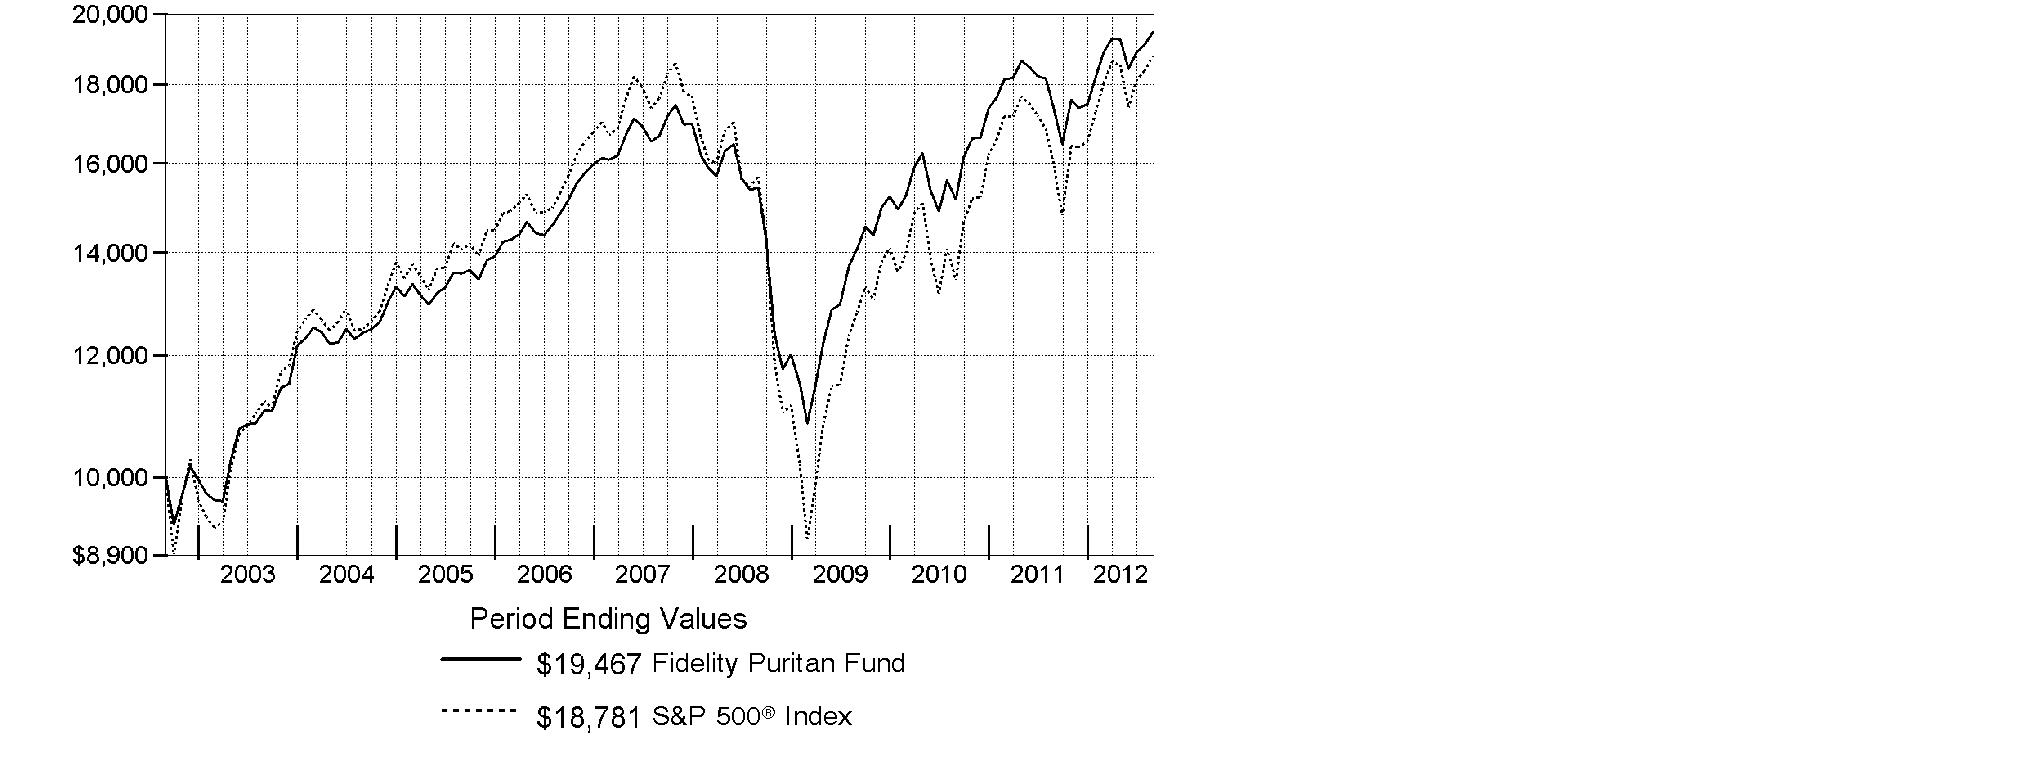
Annual Report
Market Recap: U.S. stocks posted a strong gain for the 12 months ending August 31, 2012, overcoming losses sustained last summer and extending an uptrend that began in March 2009. The broad-based S&P 500® Index added 18.00% for the 12-month period, while the blue-chip-laden Dow Jones Industrial AverageSM and technology-heavy Nasdaq Composite® Index rose 15.86% and 20.26%, respectively. Uncertainty prevailed early on, as Greece neared insolvency and fear of debt contagion in Europe led the S&P 500® to its lowest point in more than a year, in early October. Markets reversed course that same month, and the S&P 500® rose to its largest monthly gain in two decades. Despite a rough patch in the spring, U.S. stocks pushed ahead for much of the remainder of the period, fueled by solid corporate earnings, a reviving housing market and hope for a solution in the eurozone. Elsewhere, foreign developed-markets stocks languished amid the European turmoil and as local currencies weakened versus the dollar, leaving the MSCI® EAFE® Index up just 0.10%. In the fixed-income arena, the search for yield benefited high-income securities, which returned 13.01%, according to The BofA Merrill LynchSM US High Yield Constrained Index. Higher-quality debt registered a more muted advance, with the Barclays® U.S. Aggregate Bond Index - a proxy for investment-grade debt - returning 5.78%.
Comments from Ramin Arani, Lead Portfolio Manager of Fidelity® Puritan® Fund: For the year, the fund's Retail Class shares returned 12.35%, trailing the 13.34% gain of the Fidelity Puritan Composite IndexSM. Stock selection hurt, but the negative impact was modestly offset by our overweighting in equities, which advanced strongly on an absolute basis. We benefited the most from fixed-income investments, including good picks and an underweighted stake in investment-grade bonds, and a small out-of-index allocation to high-yield bonds. The biggest individual detractor was Green Mountain Coffee Roasters, which saw its stock fall as growth slowed and the company missed revenue and earnings estimates. In materials, we were hurt by two gold-related stocks: Australia-based Newcrest Mining and producer Goldcorp, both of which lost ground. Elsewhere, our investments in Facebook declined sharply following the social media company's May initial public offering. Apple was by far our top contributor, as its stock soared on strong sales and earnings. Michael Kors Holdings was additive, as this "affordable luxury" brand has seen fast growth of its apparel and accessories. Shares of media and cable company Comcast made a strong advance, and our outsized stake boosted results. Many of the stocks I've mentioned were not in the index, and some were not held at period end.
The views expressed above reflect those of the portfolio manager(s) only through the end of the period as stated on the cover of this report and do not necessarily represent the views of Fidelity or any other person in the Fidelity organization. Any such views are subject to change at any time based upon market or other conditions and Fidelity disclaims any responsibility to update such views. These views may not be relied on as investment advice and, because investment decisions for a Fidelity fund are based on numerous factors, may not be relied on as an indication of trading intent on behalf of any Fidelity fund.
Annual Report
Shareholder Expense Example
As a shareholder of the Fund, you incur two types of costs: (1) transaction costs, and (2) ongoing costs, including management fees and other Fund expenses. This Example is intended to help you understand your ongoing costs (in dollars) of investing in the Fund and to compare these costs with the ongoing costs of investing in other mutual funds.
The Example is based on an investment of $1,000 invested at the beginning of the period and held for the entire period (March 1, 2012 to August 31, 2012).
Actual Expenses
The first line of the accompanying table for each class of the Fund provides information about actual account values and actual expenses. You may use the information in this line, together with the amount you invested, to estimate the expenses that you paid over the period. Simply divide your account value by $1,000.00 (for example, an $8,600 account value divided by $1,000.00 = 8.6), then multiply the result by the number in the first line for a class of the Fund under the heading entitled "Expenses Paid During Period" to estimate the expenses you paid on your account during this period. A small balance maintenance fee of $12.00 that is charged once a year may apply for certain accounts with a value of less than $2,000. This fee is not included in the table below. If it was, the estimate of expenses you paid during the period would be higher, and your ending account value lower, by this amount. In addition, the Fund, as a shareholder in the underlying Fidelity Central Funds, will indirectly bear its pro-rata share of the fees and expenses incurred by the underlying Fidelity Central Funds. These fees and expenses are not included in the Fund's annualized expense ratio used to calculate the expense estimate in the table below.
Hypothetical Example for Comparison Purposes
The second line of the accompanying table for each class of the Fund provides information about hypothetical account values and hypothetical expenses based on a Class' actual expense ratio and an assumed rate of return of 5% per year before expenses, which is not the Class' actual return. The hypothetical account values and expenses may not be used to estimate the actual ending account balance or expenses you paid for the period. You may use this information to compare the ongoing costs of investing in the Fund and other funds. To do so, compare this 5% hypothetical example with the 5% hypothetical examples that appear in the shareholder reports of the other funds. A small balance maintenance fee of $12.00 that is charged once a year may apply for certain accounts with a value of less than $2,000. This fee is not included in the table below. If it was, the estimate of expenses you paid during the period would be higher, and your ending account value lower, by this amount. In addition, the Fund, as a shareholder in the underlying Fidelity Central Funds, will indirectly bear its pro-rata share of the fees and expenses incurred by the underlying Fidelity Central Funds. These fees and expenses are not included in the Fund's annualized expense ratio used to calculate the expense estimate in the table below.
Please note that the expenses shown in the table are meant to highlight your ongoing costs only and do not reflect any transaction costs. Therefore, the second line of the table is useful in comparing ongoing costs only, and will not help you determine the relative total costs of owning different funds.
Annual Report
Shareholder Expense Example - continued
| Annualized Expense Ratio | Beginning
Account Value
March 1, 2012 | Ending
Account Value
August 31, 2012 | Expenses Paid
During Period*
March 1, 2012
to August 31, 2012 |
Puritan | .59% | | | |
Actual | | $ 1,000.00 | $ 1,029.60 | $ 3.01 |
HypotheticalA | | $ 1,000.00 | $ 1,022.17 | $ 3.00 |
Class K | .48% | | | |
Actual | | $ 1,000.00 | $ 1,029.70 | $ 2.45 |
HypotheticalA | | $ 1,000.00 | $ 1,022.72 | $ 2.44 |
A 5% return per year before expenses
* Expenses are equal to each Class' annualized expense ratio, multiplied by the average account value over the period, multiplied by 184/366 (to reflect the one-half year period). The fees and expenses of the underlying Fidelity Central Funds in which the Fund invests are not included in each Class' annualized expense ratio.
Annual Report
Investment Changes (Unaudited)
The information in the following tables is based on the combined investments of the Fund and its pro-rata share of the investments of Fidelity's fixed-income central funds. |
Top Five Stocks as of August 31, 2012 |
| % of fund's
net assets | % of fund's net assets
6 months ago |
Apple, Inc. | 4.5 | 4.0 |
Microsoft Corp. | 1.4 | 1.4 |
Chevron Corp. | 1.4 | 1.6 |
General Electric Co. | 1.3 | 0.6 |
The Coca-Cola Co. | 1.3 | 1.3 |
| 9.9 | |
Top Five Bond Issuers as of August 31, 2012 |
(with maturities greater than one year) | % of fund's
net assets | % of fund's net assets
6 months ago |
Fannie Mae | 8.7 | 4.8 |
U.S. Treasury Obligations | 5.4 | 8.9 |
Freddie Mac | 2.4 | 2.2 |
Ginnie Mae | 1.9 | 1.7 |
Wachovia Bank Commercial Mortgage Trust | 0.5 | 0.4 |
| 18.9 | |
Top Five Market Sectors as of August 31, 2012 |
| % of fund's
net assets | % of fund's net assets
6 months ago |
Information Technology | 15.1 | 14.4 |
Financials | 11.7 | 11.8 |
Consumer Discretionary | 9.9 | 11.1 |
Health Care | 9.1 | 7.7 |
Consumer Staples | 8.8 | 8.5 |
Asset Allocation (% of fund's net assets) |
As of August 31, 2012 * | As of February 29, 2012 ** |
| Stocks and Investment Companies 61.3% | | | Stocks and Investment Companies 62.6% | |
| Bonds 33.6% | | | Bonds 32.5% | |
| Convertible
Securities 0.5% | | | Convertible
Securities 0.3% | |
| Other Investments 0.9% | | | Other Investments 1.0% | |
| Short-Term Investments and Net Other Assets (Liabilities) 3.7% | | | Short-Term Investments and Net Other Assets (Liabilities) 3.6% | |
* Foreign investments | 9.0% | | ** Foreign investments | 12.2% | |

Percentages are adjusted for the effect of futures contracts and swap agreements, if applicable. |
A holdings listing for the Fund, which presents direct holdings as well as the pro-rata share of any securities and other investments held indirectly through its investments in underlying non-money market Fidelity Central Funds, is available at fidelity.com. |
Percentages in the above tables are adjusted for the effect of TBA Sale Commitments. |
Annual Report
Investments August 31, 2012
Showing Percentage of Net Assets
Common Stocks - 61.0% |
| Shares | | Value (000s) |
CONSUMER DISCRETIONARY - 7.7% |
Auto Components - 0.0% |
Delphi Automotive PLC | 68,093 | | $ 2,063 |
Automobiles - 0.3% |
General Motors Co. (a) | 2,170 | | 46 |
Harley-Davidson, Inc. | 607,600 | | 25,495 |
Honda Motor Co. Ltd. | 768,400 | | 24,481 |
Motors Liquidation Co. GUC Trust (a) | 28,150 | | 403 |
Tesla Motors, Inc. (a) | 128,800 | | 3,673 |
| | 54,098 |
Hotels, Restaurants & Leisure - 0.8% |
Arcos Dorados Holdings, Inc. | 1,000 | | 13 |
Dunkin' Brands Group, Inc. | 1,148,000 | | 33,441 |
McDonald's Corp. | 308,600 | | 27,617 |
Starbucks Corp. | 895,600 | | 44,431 |
Station Holdco LLC (a)(p)(q) | 1,194,419 | | 1,839 |
Station Holdco LLC warrants 6/15/18 (a)(p)(q) | 75,658 | | 4 |
Vail Resorts, Inc. | 917,027 | | 47,273 |
| | 154,618 |
Household Durables - 0.7% |
D.R. Horton, Inc. | 1,000,000 | | 18,990 |
Lennar Corp. Class A | 1,487,100 | | 48,227 |
Toll Brothers, Inc. (a) | 2,264,800 | | 74,104 |
| | 141,321 |
Internet & Catalog Retail - 0.8% |
Amazon.com, Inc. (a) | 452,800 | | 112,399 |
Expedia, Inc. | 546,400 | | 28,063 |
Priceline.com, Inc. (a) | 20,100 | | 12,152 |
| | 152,614 |
Media - 2.5% |
Comcast Corp. Class A (special) (non-vtg.) | 6,435,900 | | 211,548 |
Discovery Communications, Inc. (a) | 760,900 | | 41,728 |
HMH Holdings, Inc. warrants 6/22/19 (a)(q) | 1,945 | | 15 |
Legend Pictures LLC (a)(p)(q) | 49,141 | | 52,538 |
Lions Gate Entertainment Corp. (a)(f) | 1,355,900 | | 20,040 |
Manchester United PLC | 1,785,700 | | 23,750 |
News Corp. Class A | 4,192,300 | | 98,058 |
Pandora Media, Inc. (a)(f) | 529,694 | | 6,351 |
Publicis Groupe SA | 355,600 | | 18,457 |
Common Stocks - continued |
| Shares | | Value (000s) |
CONSUMER DISCRETIONARY - continued |
Media - continued |
The Walt Disney Co. | 284,190 | | $ 14,059 |
Vertis Holdings, Inc. (a) | 1,934 | | 22 |
| | 486,566 |
Multiline Retail - 0.1% |
PPR SA | 202,600 | | 31,650 |
Specialty Retail - 1.4% |
Home Depot, Inc. | 2,346,100 | | 133,141 |
Limited Brands, Inc. | 826,800 | | 40,182 |
TJX Companies, Inc. | 2,179,600 | | 99,804 |
| | 273,127 |
Textiles, Apparel & Luxury Goods - 1.1% |
Brunello Cucinelli SpA | 1,155,400 | | 19,183 |
Michael Kors Holdings Ltd. | 1,079,961 | | 58,264 |
NIKE, Inc. Class B | 491,000 | | 47,804 |
PVH Corp. | 384,100 | | 36,067 |
Ralph Lauren Corp. | 327,700 | | 51,990 |
Tumi Holdings, Inc. (f) | 67,400 | | 1,419 |
| | 214,727 |
TOTAL CONSUMER DISCRETIONARY | | 1,510,784 |
CONSUMER STAPLES - 8.1% |
Beverages - 2.5% |
Anheuser-Busch InBev SA NV ADR | 867,700 | | 73,043 |
Beam, Inc. | 1,228,200 | | 71,678 |
Britvic PLC | 2,351,300 | | 11,932 |
Diageo PLC sponsored ADR | 195,300 | | 21,331 |
Dr Pepper Snapple Group, Inc. | 571,200 | | 25,595 |
Monster Beverage Corp. (a) | 657,700 | | 38,758 |
The Coca-Cola Co. | 6,860,400 | | 256,579 |
| | 498,916 |
Food & Staples Retailing - 2.2% |
Costco Wholesale Corp. | 729,600 | | 71,406 |
CVS Caremark Corp. | 3,265,100 | | 148,725 |
Drogasil SA | 106,220 | | 1,123 |
Wal-Mart Stores, Inc. | 2,799,400 | | 203,236 |
Whole Foods Market, Inc. | 161,200 | | 15,596 |
| | 440,086 |
Common Stocks - continued |
| Shares | | Value (000s) |
CONSUMER STAPLES - continued |
Food Products - 0.6% |
Kraft Foods, Inc. Class A | 3,059,600 | | $ 127,065 |
Mead Johnson Nutrition Co. Class A | 3,800 | | 279 |
| | 127,344 |
Household Products - 0.2% |
Kimberly-Clark Corp. | 380,300 | | 31,793 |
Procter & Gamble Co. | 21,800 | | 1,465 |
| | 33,258 |
Personal Products - 0.5% |
Estee Lauder Companies, Inc. Class A | 1,029,200 | | 61,701 |
Prestige Brands Holdings, Inc. (a) | 2,182,251 | | 35,047 |
| | 96,748 |
Tobacco - 2.1% |
British American Tobacco PLC sponsored ADR | 400,300 | | 41,927 |
Japan Tobacco, Inc. | 2,114,800 | | 64,123 |
Lorillard, Inc. | 566,400 | | 71,089 |
Philip Morris International, Inc. | 2,619,240 | | 233,898 |
| | 411,037 |
TOTAL CONSUMER STAPLES | | 1,607,389 |
ENERGY - 6.7% |
Energy Equipment & Services - 1.4% |
Cameron International Corp. (a) | 673,700 | | 36,858 |
Ensco PLC Class A | 1,256,700 | | 72,097 |
National Oilwell Varco, Inc. | 519,900 | | 40,968 |
Noble Corp. | 1,426,100 | | 54,391 |
Ocean Rig UDW, Inc. (United States) | 1,484,049 | | 24,828 |
Schlumberger Ltd. | 621,300 | | 44,970 |
| | 274,112 |
Oil, Gas & Consumable Fuels - 5.3% |
Apache Corp. | 14,791 | | 1,268 |
Cabot Oil & Gas Corp. | 1,185,900 | | 49,108 |
Cheniere Energy, Inc. (a) | 136,900 | | 2,021 |
Chevron Corp. | 2,447,400 | | 274,500 |
Energen Corp. | 378,600 | | 19,328 |
EQT Corp. | 445,600 | | 24,045 |
EV Energy Partners LP | 575,724 | | 36,138 |
Exxon Mobil Corp. | 2,521,517 | | 220,128 |
Marathon Petroleum Corp. | 832,200 | | 43,066 |
Common Stocks - continued |
| Shares | | Value (000s) |
ENERGY - continued |
Oil, Gas & Consumable Fuels - continued |
Occidental Petroleum Corp. | 1,359,458 | | $ 115,568 |
Phillips 66 | 1,039,000 | | 43,638 |
Pioneer Natural Resources Co. | 439,100 | | 42,751 |
Plains Exploration & Production Co. (a) | 845,100 | | 33,229 |
Suncor Energy, Inc. | 751,000 | | 23,473 |
Tesoro Corp. | 542,500 | | 21,559 |
Williams Companies, Inc. | 3,101,900 | | 100,098 |
| | 1,049,918 |
TOTAL ENERGY | | 1,324,030 |
FINANCIALS - 7.2% |
Capital Markets - 0.4% |
Apollo Global Management LLC Class A | 1,112,300 | | 14,749 |
Evercore Partners, Inc. Class A | 1,013,500 | | 25,033 |
HFF, Inc. (a) | 900,200 | | 11,973 |
Morgan Stanley | 1,442,556 | | 21,638 |
State Street Corp. | 477,200 | | 19,852 |
| | 93,245 |
Commercial Banks - 2.5% |
BB&T Corp. | 824,900 | | 26,017 |
CIT Group, Inc. (a) | 222,600 | | 8,405 |
First Republic Bank | 50,000 | | 1,635 |
Huntington Bancshares, Inc. | 2,613,300 | | 17,248 |
PNC Financial Services Group, Inc. | 253,600 | | 15,764 |
SunTrust Banks, Inc. | 1,075,900 | | 27,080 |
U.S. Bancorp | 4,249,400 | | 141,972 |
Wells Fargo & Co. | 7,507,040 | | 255,465 |
| | 493,586 |
Consumer Finance - 0.9% |
American Express Co. | 698,400 | | 40,717 |
Capital One Financial Corp. | 777,500 | | 43,952 |
Discover Financial Services | 1,098,600 | | 42,549 |
SLM Corp. | 3,316,100 | | 52,229 |
| | 179,447 |
Diversified Financial Services - 1.5% |
Citigroup, Inc. | 5,410,240 | | 160,738 |
JPMorgan Chase & Co. | 2,694,723 | | 100,082 |
Common Stocks - continued |
| Shares | | Value (000s) |
FINANCIALS - continued |
Diversified Financial Services - continued |
NBH Holdings Corp. Class A (a)(h) | 710,000 | | $ 12,603 |
The NASDAQ Stock Market, Inc. | 1,112,600 | | 25,445 |
| | 298,868 |
Insurance - 0.8% |
ACE Ltd. | 392,600 | | 28,946 |
Berkshire Hathaway, Inc. Class B (a) | 761,200 | | 64,200 |
MetLife, Inc. | 1,798,100 | | 61,369 |
| | 154,515 |
Real Estate Investment Trusts - 1.1% |
American Tower Corp. | 1,133,100 | | 79,770 |
Lexington Corporate Properties Trust (f) | 3,468,867 | | 32,538 |
Public Storage | 172,900 | | 25,167 |
Simon Property Group, Inc. | 468,200 | | 74,303 |
| | 211,778 |
TOTAL FINANCIALS | | 1,431,439 |
HEALTH CARE - 8.3% |
Biotechnology - 3.5% |
Achillion Pharmaceuticals, Inc. (a)(f) | 2,172,600 | | 15,273 |
Acorda Therapeutics, Inc. (a) | 590,000 | | 13,482 |
Affymax, Inc. (a) | 959,900 | | 16,981 |
Alexion Pharmaceuticals, Inc. (a) | 288,200 | | 30,898 |
AMAG Pharmaceuticals, Inc. (a)(g) | 1,460,561 | | 21,602 |
Amarin Corp. PLC ADR (a)(f) | 418,800 | | 5,733 |
Amgen, Inc. | 1,789,500 | | 150,175 |
Arena Pharmaceuticals, Inc. (a)(f) | 766,100 | | 6,926 |
Biogen Idec, Inc. (a) | 767,000 | | 112,435 |
BioMarin Pharmaceutical, Inc. (a) | 518,500 | | 19,361 |
CSL Ltd. | 1,035,843 | | 47,548 |
Gilead Sciences, Inc. (a) | 1,232,700 | | 71,114 |
Grifols SA ADR | 2,693,600 | | 55,407 |
Medivation, Inc. (a) | 300,000 | | 31,458 |
Merrimack Pharmaceuticals, Inc. | 340,294 | | 2,709 |
Neurocrine Biosciences, Inc. (a)(g) | 3,731,700 | | 27,540 |
Theravance, Inc. (a) | 840,900 | | 22,427 |
Vertex Pharmaceuticals, Inc. (a) | 595,300 | | 31,747 |
| | 682,816 |
Common Stocks - continued |
| Shares | | Value (000s) |
HEALTH CARE - continued |
Health Care Equipment & Supplies - 0.2% |
The Cooper Companies, Inc. | 521,259 | | $ 43,708 |
Health Care Providers & Services - 1.4% |
Catamaran Corp. (a) | 675,175 | | 58,603 |
Express Scripts Holding Co. (a) | 1,292,858 | | 80,959 |
Health Net, Inc. (a) | 3 | | 0* |
McKesson Corp. | 264,200 | | 23,014 |
Qualicorp SA (a) | 3,357,800 | | 33,001 |
UnitedHealth Group, Inc. | 1,641,900 | | 89,155 |
| | 284,732 |
Health Care Technology - 0.2% |
CareView Communications, Inc. (a)(f)(g) | 10,425,300 | | 10,530 |
Cerner Corp. (a) | 322,300 | | 23,573 |
| | 34,103 |
Life Sciences Tools & Services - 0.0% |
Illumina, Inc. (a)(f) | 159,700 | | 6,720 |
Pharmaceuticals - 3.0% |
Elan Corp. PLC sponsored ADR (a) | 1,399,148 | | 15,894 |
Eli Lilly & Co. | 1,821,800 | | 81,817 |
Forest Laboratories, Inc. (a) | 970,900 | | 33,681 |
Merck & Co., Inc. | 3,155,000 | | 135,823 |
Optimer Pharmaceuticals, Inc. (a) | 1,235,000 | | 18,562 |
Pfizer, Inc. | 6,970,500 | | 166,316 |
TherapeuticsMD, Inc. (a)(g) | 5,500,000 | | 18,645 |
Valeant Pharmaceuticals International, Inc. (Canada) (a) | 526,311 | | 26,947 |
ViroPharma, Inc. (a) | 400,778 | | 10,661 |
Watson Pharmaceuticals, Inc. (a) | 904,700 | | 73,597 |
| | 581,943 |
TOTAL HEALTH CARE | | 1,634,022 |
INDUSTRIALS - 4.8% |
Aerospace & Defense - 1.0% |
Honeywell International, Inc. | 508,800 | | 29,739 |
Textron, Inc. | 1,906,100 | | 50,931 |
United Technologies Corp. | 1,398,800 | | 111,694 |
| | 192,364 |
Air Freight & Logistics - 0.2% |
United Parcel Service, Inc. Class B | 584,954 | | 43,175 |
Common Stocks - continued |
| Shares | | Value (000s) |
INDUSTRIALS - continued |
Building Products - 0.1% |
Fortune Brands Home & Security, Inc. (a) | 567,100 | | $ 14,461 |
Masonite Worldwide Holdings (a) | 5,358 | | 159 |
Masonite Worldwide Holdings: | | | |
warrants 5/20/14 (a) | 25,981 | | 16 |
warrants 5/20/16 (a) | 19,485 | | 21 |
| | 14,657 |
Electrical Equipment - 0.2% |
AMETEK, Inc. | 497,402 | | 17,066 |
Regal-Beloit Corp. | 266,000 | | 18,104 |
| | 35,170 |
Industrial Conglomerates - 1.9% |
Carlisle Companies, Inc. | 455,400 | | 23,836 |
Danaher Corp. | 230,700 | | 12,359 |
General Electric Co. | 12,925,200 | | 267,681 |
Tyco International Ltd. | 1,384,700 | | 78,069 |
| | 381,945 |
Machinery - 0.7% |
Caterpillar, Inc. | 234,400 | | 20,001 |
Illinois Tool Works, Inc. | 981,600 | | 58,199 |
Ingersoll-Rand PLC | 801,500 | | 37,478 |
WABCO Holdings, Inc. (a) | 281,600 | | 16,536 |
Westport Innovations, Inc. (a)(f) | 14,059 | | 495 |
| | 132,709 |
Marine - 0.0% |
DryShips, Inc. (a) | 3,755,900 | | 8,225 |
Road & Rail - 0.6% |
Union Pacific Corp. | 990,856 | | 120,330 |
Trading Companies & Distributors - 0.1% |
Air Lease Corp. Class A (a)(f) | 570,400 | | 11,762 |
TOTAL INDUSTRIALS | | 940,337 |
INFORMATION TECHNOLOGY - 14.4% |
Communications Equipment - 1.5% |
Cisco Systems, Inc. | 1,954,300 | | 37,288 |
Motorola Solutions, Inc. | 2,090,600 | | 99,638 |
QUALCOMM, Inc. | 2,475,600 | | 152,150 |
| | 289,076 |
Common Stocks - continued |
| Shares | | Value (000s) |
INFORMATION TECHNOLOGY - continued |
Computers & Peripherals - 4.5% |
Apple, Inc. | 1,327,200 | | $ 882,885 |
Electronic Equipment & Components - 0.3% |
Amphenol Corp. Class A | 736,000 | | 44,800 |
Arrow Electronics, Inc. (a) | 428,800 | | 15,544 |
E Ink Holdings, Inc. GDR (a)(h) | 140,100 | | 1,404 |
| | 61,748 |
Internet Software & Services - 2.1% |
Demand Media, Inc. (a)(f) | 1,324,308 | | 13,442 |
eBay, Inc. (a) | 2,273,600 | | 107,928 |
Facebook, Inc.: | | | |
Class A (f) | 619,100 | | 11,193 |
Class B (a)(q) | 881,260 | | 14,340 |
Google, Inc. Class A (a) | 337,600 | | 231,286 |
Mail.ru Group Ltd.: | | | |
GDR (h) | 580,000 | | 19,007 |
GDR (Reg. S) | 289,900 | | 9,500 |
Rackspace Hosting, Inc. (a) | 14,700 | | 882 |
Yahoo!, Inc. (a) | 860,900 | | 12,612 |
| | 420,190 |
IT Services - 2.4% |
Accenture PLC Class A | 1,036,600 | | 63,855 |
Cognizant Technology Solutions Corp. Class A (a) | 855,900 | | 55,017 |
IBM Corp. | 907,400 | | 176,807 |
Redecard SA | 3,871,200 | | 63,983 |
Teradata Corp. (a) | 171,100 | | 13,069 |
Visa, Inc. Class A | 733,000 | | 94,007 |
| | 466,738 |
Semiconductors & Semiconductor Equipment - 1.5% |
Altera Corp. | 1,290,900 | | 48,189 |
ASML Holding NV | 742,500 | | 42,152 |
Avago Technologies Ltd. | 578,500 | | 21,156 |
Broadcom Corp. Class A | 975,000 | | 34,642 |
Freescale Semiconductor Holdings I Ltd. (a) | 3,208,700 | | 32,119 |
Intel Corp. | 1,988,900 | | 49,384 |
NXP Semiconductors NV (a) | 1,517,800 | | 35,395 |
Samsung Electronics Co. Ltd. | 32,343 | | 35,173 |
Taiwan Semiconductor Manufacturing Co. Ltd. sponsored ADR | 102,200 | | 1,502 |
| | 299,712 |
Common Stocks - continued |
| Shares | | Value (000s) |
INFORMATION TECHNOLOGY - continued |
Software - 2.1% |
Citrix Systems, Inc. (a) | 456,400 | | $ 35,458 |
Fortinet, Inc. (a) | 418,506 | | 11,095 |
Microsoft Corp. | 8,947,500 | | 275,762 |
QLIK Technologies, Inc. (a) | 472,300 | | 9,989 |
salesforce.com, Inc. (a) | 413,300 | | 60,003 |
Splunk, Inc. | 36,800 | | 1,266 |
VMware, Inc. Class A (a) | 249,500 | | 22,215 |
| | 415,788 |
TOTAL INFORMATION TECHNOLOGY | | 2,836,137 |
MATERIALS - 1.8% |
Chemicals - 1.8% |
Albemarle Corp. | 544,100 | | 29,779 |
Ashland, Inc. | 667,100 | | 49,119 |
Eastman Chemical Co. | 607,800 | | 33,587 |
LyondellBasell Industries NV Class A | 1,160,694 | | 56,688 |
Monsanto Co. | 1,254,400 | | 109,271 |
Sherwin-Williams Co. | 396,900 | | 56,788 |
Tronox Ltd. Class A | 118,015 | | 3,044 |
W.R. Grace & Co. (a) | 388,400 | | 22,434 |
| | 360,710 |
TELECOMMUNICATION SERVICES - 0.6% |
Diversified Telecommunication Services - 0.4% |
CenturyLink, Inc. | 1,084,900 | | 45,848 |
Iliad SA | 174,465 | | 27,650 |
| | 73,498 |
Wireless Telecommunication Services - 0.2% |
SBA Communications Corp. Class A (a) | 350,800 | | 20,971 |
Sprint Nextel Corp. (a) | 5,423,000 | | 26,302 |
| | 47,273 |
TOTAL TELECOMMUNICATION SERVICES | | 120,771 |
UTILITIES - 1.4% |
Electric Utilities - 1.0% |
Bicent Power LLC: | | | |
warrants 8/21/22 (a) | 531 | | 0 |
warrants 8/21/22 (a) | 327 | | 0 |
Common Stocks - continued |
| Shares | | Value (000s) |
UTILITIES - continued |
Electric Utilities - continued |
Edison International | 1,412,400 | | $ 61,849 |
FirstEnergy Corp. | 1,091,900 | | 47,716 |
NextEra Energy, Inc. | 1,186,000 | | 79,830 |
| | 189,395 |
Independent Power Producers & Energy Traders - 0.1% |
The AES Corp. | 2,024,300 | | 23,057 |
Multi-Utilities - 0.3% |
Sempra Energy | 963,400 | | 63,777 |
TOTAL UTILITIES | | 276,229 |
TOTAL COMMON STOCKS (Cost $9,429,334) |
12,041,848
|
Preferred Stocks - 0.6% |
| | | |
Convertible Preferred Stocks - 0.3% |
CONSUMER DISCRETIONARY - 0.2% |
Automobiles - 0.0% |
General Motors Co. 4.75% | 148,900 | | 5,316 |
Media - 0.2% |
Vice Holdings, Inc. (q) | 6,701 | | 34,999 |
TOTAL CONSUMER DISCRETIONARY | | 40,315 |
ENERGY - 0.0% |
Oil, Gas & Consumable Fuels - 0.0% |
Apache Corp. 6.00% | 36,200 | | 1,774 |
Chesapeake Energy Corp. 5.00% | 18,580 | | 1,482 |
| | 3,256 |
INFORMATION TECHNOLOGY - 0.0% |
Internet Software & Services - 0.0% |
wetpaint.com, Inc. Series C (a)(q) | 497,017 | | 994 |
MATERIALS - 0.0% |
Metals & Mining - 0.0% |
AngloGold Ashanti Holdings Finance PLC 6.00% | 104,600 | | 4,079 |
Preferred Stocks - continued |
| Shares | | Value (000s) |
Convertible Preferred Stocks - continued |
UTILITIES - 0.1% |
Electric Utilities - 0.1% |
AES Trust III 6.75% | 126,300 | | $ 6,320 |
PPL Corp. 8.75% | 108,000 | | 5,932 |
| | 12,252 |
TOTAL CONVERTIBLE PREFERRED STOCKS | | 60,896 |
Nonconvertible Preferred Stocks - 0.3% |
CONSUMER DISCRETIONARY - 0.2% |
Automobiles - 0.2% |
Volkswagen AG | 212,900 | | 37,597 |
FINANCIALS - 0.1% |
Capital Markets - 0.0% |
Affiliated Managers Group, Inc. 6.375% | 40,180 | | 1,025 |
Commercial Banks - 0.0% |
U.S. Bancorp Series F, 6.50% | 39,677 | | 1,177 |
Consumer Finance - 0.1% |
Ally Financial, Inc. 7.00% (h) | 11,951 | | 10,786 |
Diversified Financial Services - 0.0% |
GMAC Capital Trust I Series 2, 8.125% | 377,872 | | 9,379 |
TOTAL FINANCIALS | | 22,367 |
TOTAL NONCONVERTIBLE PREFERRED STOCKS | | 59,964 |
TOTAL PREFERRED STOCKS (Cost $105,416) |
120,860
|
Investment Companies - 0.0% |
| | | |
2010 Swift Mandatory Common Exchange Security Trust (h)
(Cost $1,989) | 180,800 | |
1,509
|
Corporate Bonds - 11.3% |
| Principal Amount (000s) | | Value (000s) |
Convertible Bonds - 0.2% |
CONSUMER DISCRETIONARY - 0.0% |
Media - 0.0% |
Liberty Media Corp.: | | | | |
3.5% 1/15/31 | | $ 384 | | $ 279 |
3.5% 1/15/31 (h) | | 2,838 | | 2,063 |
| | 2,342 |
ENERGY - 0.0% |
Oil, Gas & Consumable Fuels - 0.0% |
Chesapeake Energy Corp. 2.75% 11/15/35 | | 3,700 | | 3,460 |
Massey Energy Co. 3.25% 8/1/15 | | 3,610 | | 3,240 |
| | 6,700 |
INDUSTRIALS - 0.1% |
Building Products - 0.1% |
Aspen Aerogels, Inc.: | | | | |
8% 6/1/14 (q) | | 10,000 | | 10,000 |
8% 12/6/14 (q) | | 3,000 | | 3,000 |
| | 13,000 |
MATERIALS - 0.1% |
Construction Materials - 0.0% |
Headwaters, Inc. 2.5% 2/1/14 | | 4,920 | | 4,723 |
Metals & Mining - 0.1% |
Ivanplats Ltd. 8% 11/10/14 pay-in-kind (m)(q) | | 11,883 | | 12,324 |
TOTAL MATERIALS | | 17,047 |
TOTAL CONVERTIBLE BONDS | | 39,089 |
Nonconvertible Bonds - 11.1% |
CONSUMER DISCRETIONARY - 1.5% |
Auto Components - 0.1% |
Delphi Corp.: | | | | |
5.875% 5/15/19 | | 1,820 | | 1,952 |
6.125% 5/15/21 | | 1,690 | | 1,859 |
Corporate Bonds - continued |
| Principal Amount (000s) | | Value (000s) |
Nonconvertible Bonds - continued |
CONSUMER DISCRETIONARY - continued |
Auto Components - continued |
International Automotive Components Group SA 9.125% 6/1/18 (h) | | $ 1,110 | | $ 1,066 |
Tenneco, Inc. 6.875% 12/15/20 | | 2,415 | | 2,632 |
| | 7,509 |
Automobiles - 0.2% |
Daimler Finance North America LLC 1.65% 4/10/15 (h) | | 17,102 | | 17,323 |
Ford Motor Co.: | | | | |
6.375% 2/1/29 | | 2,190 | | 2,366 |
6.625% 10/1/28 | | 2,510 | | 2,804 |
7.45% 7/16/31 | | 2,335 | | 2,884 |
General Motors Corp.: | | | | |
6.75% 5/1/28 (d) | | 390 | | 0 |
7.125% 7/15/13 (d) | | 1,135 | | 0 |
7.2% 1/15/11 (d) | | 2,855 | | 0 |
7.4% 9/1/25 (d) | | 195 | | 0 |
7.7% 4/15/16 (d) | | 705 | | 0 |
8.25% 7/15/23 (d) | | 5,475 | | 0 |
8.375% 7/15/33 (d) | | 16,800 | | 0 |
Jaguar Holding Co. II/Jaguar Merger Sub, Inc. 9.5% 12/1/19 (h) | | 490 | | 546 |
Volkswagen International Finance NV 2.375% 3/22/17 (h) | | 17,000 | | 17,558 |
| | 43,481 |
Distributors - 0.0% |
Ferrellgas LP/Ferrellgas Finance Corp. 6.5% 5/1/21 | | 1,745 | | 1,701 |
Diversified Consumer Services - 0.0% |
ServiceMaster Co. 10.75% 7/15/15 pay-in-kind (h)(m) | | 4,954 | | 5,085 |
Hotels, Restaurants & Leisure - 0.2% |
American Casino & Entertainment Properties LLC 11% 6/15/14 | | 2,780 | | 2,905 |
Boyd Acquisition Sub LLC/Boyd Acquisition Finance Corp. 8.375% 2/15/18 (h) | | 325 | | 332 |
Caesars Operating Escrow LLC/Caesars Escrow Corp.: | | | | |
8.5% 2/15/20 (h) | | 6,365 | | 6,254 |
9% 2/15/20 (h) | | 1,765 | | 1,758 |
Chester Downs & Marina LLC 9.25% 2/1/20 (h) | | 435 | | 442 |
Choice Hotels International, Inc. 5.75% 7/1/22 | | 390 | | 417 |
Corporate Bonds - continued |
| Principal Amount (000s) | | Value (000s) |
Nonconvertible Bonds - continued |
CONSUMER DISCRETIONARY - continued |
Hotels, Restaurants & Leisure - continued |
Chukchansi Economic Development Authority 9.75% 5/30/20 (h) | | $ 2,878 | | $ 2,072 |
Graton Economic Development Authority 9.625% 9/1/19 (h) | | 1,065 | | 1,100 |
MCE Finance Ltd. 10.25% 5/15/18 | | 1,695 | | 1,932 |
MGM Mirage, Inc.: | | | | |
5.875% 2/27/14 | | 2,998 | | 3,110 |
6.75% 4/1/13 | | 80 | | 82 |
7.5% 6/1/16 | | 2,855 | | 2,983 |
9% 3/15/20 | | 1,770 | | 1,982 |
13% 11/15/13 | | 5,000 | | 5,669 |
MTR Gaming Group, Inc. 11.5% 8/1/19 pay-in-kind | | 17 | | 17 |
NAI Entertainment Holdings LLC/NAI Entertainment Finance Corp. 8.25% 12/15/17 (h) | | 954 | | 1,064 |
Pinnacle Entertainment, Inc. 7.75% 4/1/22 | | 450 | | 485 |
Shingle Springs Tribal Gaming Authority 9.375% 6/15/15 (h) | | 2,270 | | 1,856 |
Station Casinos LLC 3.66% 6/18/18 (e)(h) | | 6,335 | | 5,353 |
Sugarhouse HSP Gaming Prop Mezz LP/Sugarhouse HSP Gaming Finance Corp. 8.625% 4/15/16 (h) | | 220 | | 234 |
Waterford Gaming LLC/Waterford Gaming Finance Corp. 8.625% 9/15/14 (h) | | 1,080 | | 410 |
| | 40,457 |
Household Durables - 0.1% |
KB Home: | | | | |
7.5% 9/15/22 | | 1,960 | | 2,024 |
8% 3/15/20 | | 410 | | 442 |
Reynolds Group Issuer, Inc./Reynolds Group Issuer LLC/Reynolds Group Issuer (Luxembourg) SA: | | | | |
7.875% 8/15/19 | | 8,325 | | 9,262 |
8.25% 2/15/21 | | 1,485 | | 1,459 |
9% 4/15/19 | | 835 | | 849 |
Standard Pacific Corp. 8.375% 1/15/21 | | 820 | | 912 |
| | 14,948 |
Leisure Equipment & Products - 0.0% |
FGI Operating Co. LLC/FGI Finance, Inc. 7.875% 5/1/20 (h) | | 625 | | 674 |
Corporate Bonds - continued |
| Principal Amount (000s) | | Value (000s) |
Nonconvertible Bonds - continued |
CONSUMER DISCRETIONARY - continued |
Media - 0.8% |
AMC Networks, Inc. 7.75% 7/15/21 | | $ 340 | | $ 384 |
Bresnan Broadband Holdings LLC 8% 12/15/18 (h) | | 875 | | 928 |
CCO Holdings LLC/CCO Holdings Capital Corp. 8.125% 4/30/20 | | 3,485 | | 3,921 |
Cequel Communications Holdings I LLC/Cequel Capital Corp. 8.625% 11/15/17 (h) | | 630 | | 676 |
Charter Communications Holdings II LLC/Charter Communications Holdings II Capital Corp. 13.5% 11/30/16 | | 15,996 | | 17,515 |
Checkout Holding Corp. 0% 11/15/15 (h) | | 1,290 | | 787 |
Clear Channel Communications, Inc.: | | | | |
5.5% 9/15/14 | | 2,355 | | 2,025 |
5.5% 12/15/16 | | 1,330 | | 652 |
Clear Channel Worldwide Holdings, Inc.: | | | | |
7.625% 3/15/20 | | 585 | | 559 |
7.625% 3/15/20 | | 4,105 | | 3,982 |
Comcast Corp.: | | | | |
4.65% 7/15/42 | | 7,267 | | 7,761 |
5.15% 3/1/20 | | 595 | | 709 |
6.4% 3/1/40 | | 4,017 | | 5,286 |
COX Communications, Inc. 4.625% 6/1/13 | | 2,632 | | 2,711 |
Discovery Communications LLC: | | | | |
3.7% 6/1/15 | | 3,557 | | 3,813 |
6.35% 6/1/40 | | 3,224 | | 4,148 |
DISH DBS Corp.: | | | | |
5.875% 7/15/22 (h) | | 2,655 | | 2,675 |
6.75% 6/1/21 | | 3,515 | | 3,752 |
EchoStar Communications Corp. 6.625% 10/1/14 | | 3,000 | | 3,244 |
Gray Television, Inc. 10.5% 6/29/15 | | 990 | | 1,067 |
Lamar Media Corp.: | | | | |
5.875% 2/1/22 | | 525 | | 557 |
7.875% 4/15/18 | | 1,400 | | 1,547 |
National CineMedia LLC: | | | | |
6% 4/15/22 (h) | | 2,600 | | 2,704 |
7.875% 7/15/21 | | 1,380 | | 1,487 |
NBCUniversal Media LLC: | | | | |
5.15% 4/30/20 | | 4,917 | | 5,807 |
6.4% 4/30/40 | | 4,249 | | 5,514 |
News America Holdings, Inc. 7.75% 12/1/45 | | 7,312 | | 9,943 |
Corporate Bonds - continued |
| Principal Amount (000s) | | Value (000s) |
Nonconvertible Bonds - continued |
CONSUMER DISCRETIONARY - continued |
Media - continued |
News America, Inc. 6.15% 2/15/41 | | $ 7,234 | | $ 8,902 |
Nexstar Broadcasting, Inc.: | | | | |
7% 1/15/14 | | 196 | | 194 |
7% 1/15/14 pay-in-kind | | 6,023 | | 5,963 |
Nielsen Finance LLC/Nielsen Finance Co.: | | | | |
7.75% 10/15/18 | | 3,165 | | 3,537 |
11.5% 5/1/16 | | 1,947 | | 2,181 |
11.625% 2/1/14 | | 1,171 | | 1,329 |
Radio One, Inc. 12.5% 5/24/16 pay-in-kind (m) | | 4,567 | | 3,888 |
Satelites Mexicanos SA de CV 9.5% 5/15/17 | | 475 | | 489 |
Sheridan Group, Inc. 12.5% 4/15/14 | | 1,775 | | 1,473 |
Time Warner Cable, Inc.: | | | | |
4.5% 9/15/42 | | 4,447 | | 4,428 |
5.5% 9/1/41 | | 11,225 | | 12,724 |
6.2% 7/1/13 | | 2,154 | | 2,253 |
6.75% 7/1/18 | | 1,087 | | 1,360 |
Time Warner, Inc.: | | | | |
5.375% 10/15/41 | | 1,539 | | 1,760 |
5.875% 11/15/16 | | 3,112 | | 3,685 |
6.2% 3/15/40 | | 2,618 | | 3,218 |
6.5% 11/15/36 | | 2,633 | | 3,293 |
Unitymedia Hessen GmbH & Co. KG/Unitymedia NRW GmbH 7.5% 3/15/19 (h) | | 480 | | 526 |
UPCB Finance VI Ltd. 6.875% 1/15/22 (h) | | 1,250 | | 1,319 |
Videotron Ltd. 9.125% 4/15/18 | | 5,565 | | 6,066 |
WMG Acquisition Corp. 9.5% 6/15/16 | | 515 | | 563 |
| | 163,305 |
Multiline Retail - 0.0% |
Dollar General Corp. 4.125% 7/15/17 | | 1,545 | | 1,599 |
Specialty Retail - 0.1% |
Asbury Automotive Group, Inc. 8.375% 11/15/20 | | 565 | | 620 |
Claire's Stores, Inc. 9% 3/15/19 (h) | | 3,085 | | 3,208 |
PETCO Animal Supplies, Inc. 9.25% 12/1/18 (h) | | 3,260 | | 3,619 |
Sonic Automotive, Inc.: | | | | |
7% 7/15/22 (h) | | 885 | | 938 |
Corporate Bonds - continued |
| Principal Amount (000s) | | Value (000s) |
Nonconvertible Bonds - continued |
CONSUMER DISCRETIONARY - continued |
Specialty Retail - continued |
Sonic Automotive, Inc.: - continued | | | | |
9% 3/15/18 | | $ 1,000 | | $ 1,088 |
Staples, Inc. 7.375% 10/1/12 | | 757 | | 761 |
| | 10,234 |
TOTAL CONSUMER DISCRETIONARY | | 288,993 |
CONSUMER STAPLES - 0.6% |
Beverages - 0.1% |
Beam, Inc.: | | | | |
1.875% 5/15/17 | | 1,113 | | 1,137 |
3.25% 5/15/22 | | 1,319 | | 1,368 |
Constellation Brands, Inc. 4.625% 3/1/23 | | 675 | | 686 |
Diageo Capital PLC 5.2% 1/30/13 | | 3,201 | | 3,263 |
FBG Finance Ltd. 5.125% 6/15/15 (h) | | 2,722 | | 3,009 |
Fortune Brands, Inc.: | | | | |
5.375% 1/15/16 | | 1,682 | | 1,916 |
5.875% 1/15/36 | | 3,442 | | 4,118 |
6.375% 6/15/14 | | 446 | | 488 |
SABMiller Holdings, Inc. 3.75% 1/15/22 (h) | | 4,522 | | 4,907 |
| | 20,892 |
Food & Staples Retailing - 0.1% |
Reddy Ice Corp. 11.25% 3/15/15 | | 3,895 | | 3,876 |
Rite Aid Corp.: | | | | |
7.5% 3/1/17 | | 12,125 | | 12,458 |
9.25% 3/15/20 | | 1,330 | | 1,367 |
10.375% 7/15/16 | | 5,420 | | 5,718 |
| | 23,419 |
Food Products - 0.1% |
Cargill, Inc. 6% 11/27/17 (h) | | 417 | | 507 |
Kraft Foods, Inc.: | | | | |
6.5% 2/9/40 | | 2,975 | | 4,104 |
6.75% 2/19/14 | | 318 | | 346 |
Post Holdings, Inc. 7.375% 2/15/22 (h) | | 1,280 | | 1,347 |
| | 6,304 |
Personal Products - 0.0% |
Prestige Brands, Inc. 8.125% 2/1/20 | | 220 | | 243 |
Corporate Bonds - continued |
| Principal Amount (000s) | | Value (000s) |
Nonconvertible Bonds - continued |
CONSUMER STAPLES - continued |
Tobacco - 0.3% |
Altria Group, Inc.: | | | | |
2.85% 8/9/22 | | $ 4,020 | | $ 4,009 |
4.25% 8/9/42 | | 4,020 | | 3,929 |
9.7% 11/10/18 | | 14,772 | | 21,209 |
Philip Morris International, Inc. 1.125% 8/21/17 | | 21,321 | | 21,282 |
Reynolds American, Inc.: | | | | |
6.75% 6/15/17 | | 2,746 | | 3,327 |
7.25% 6/15/37 | | 6,101 | | 7,825 |
| | 61,581 |
TOTAL CONSUMER STAPLES | | 112,439 |
ENERGY - 1.2% |
Energy Equipment & Services - 0.2% |
Atwood Oceanics, Inc. 6.5% 2/1/20 | | 320 | | 342 |
DCP Midstream LLC: | | | | |
4.75% 9/30/21 (h) | | 5,340 | | 5,662 |
5.35% 3/15/20 (h) | | 5,028 | | 5,516 |
El Paso Pipeline Partners Operating Co. LLC: | | | | |
4.1% 11/15/15 | | 5,488 | | 5,791 |
5% 10/1/21 | | 2,280 | | 2,492 |
6.5% 4/1/20 | | 1,008 | | 1,189 |
Gulfmark Offshore, Inc. 6.375% 3/15/22 (h) | | 365 | | 373 |
Offshore Group Investment Ltd. 11.5% 8/1/15 | | 5,745 | | 6,363 |
Oil States International, Inc. 6.5% 6/1/19 | | 1,420 | | 1,509 |
Precision Drilling Corp.: | | | | |
6.5% 12/15/21 | | 315 | | 331 |
6.625% 11/15/20 | | 1,580 | | 1,663 |
Pride International, Inc. 6.875% 8/15/20 | | 1,355 | | 1,711 |
Transocean, Inc.: | | | | |
5.05% 12/15/16 | | 3,719 | | 4,120 |
6.375% 12/15/21 | | 4,911 | | 5,920 |
Unit Corp. 6.625% 5/15/21 (h) | | 4,515 | | 4,583 |
Weatherford International Ltd.: | | | | |
4.95% 10/15/13 | | 1,614 | | 1,681 |
5.15% 3/15/13 | | 2,110 | | 2,155 |
| | 51,401 |
Corporate Bonds - continued |
| Principal Amount (000s) | | Value (000s) |
Nonconvertible Bonds - continued |
ENERGY - continued |
Oil, Gas & Consumable Fuels - 1.0% |
Alpha Natural Resources, Inc.: | | | | |
6% 6/1/19 | | $ 1,735 | | $ 1,557 |
6.25% 6/1/21 | | 1,675 | | 1,503 |
Anadarko Petroleum Corp.: | | | | |
5.95% 9/15/16 | | 663 | | 767 |
6.375% 9/15/17 | | 9,475 | | 11,331 |
ATP Oil & Gas Corp. 11.875% 5/1/15 (d) | | 5,655 | | 1,470 |
Canadian Natural Resources Ltd. 5.15% 2/1/13 | | 1,519 | | 1,547 |
Continental Resources, Inc. 5% 9/15/22 | | 2,690 | | 2,784 |
Crestwood Midstream Partners LP / Finance Corp. 7.75% 4/1/19 | | 860 | | 873 |
Denbury Resources, Inc. 8.25% 2/15/20 | | 1,973 | | 2,239 |
Duke Capital LLC 6.25% 2/15/13 | | 589 | | 603 |
Duke Energy Field Services: | | | | |
5.375% 10/15/15 (h) | | 1,133 | | 1,219 |
6.45% 11/3/36 (h) | | 3,753 | | 4,333 |
El Paso Natural Gas Co. 5.95% 4/15/17 | | 867 | | 993 |
Enbridge Energy Partners LP 4.2% 9/15/21 | | 6,329 | | 6,757 |
Encana Holdings Finance Corp. 5.8% 5/1/14 | | 2,678 | | 2,878 |
Enterprise Products Operating LP: | | | | |
5.6% 10/15/14 | | 660 | | 723 |
5.65% 4/1/13 | | 410 | | 420 |
EP Energy LLC/Everest Acquisition Finance, Inc. 7.75% 9/1/22 (h) | | 885 | | 885 |
EV Energy Partners LP/EV Energy Finance Corp. 8% 4/15/19 | | 1,715 | | 1,771 |
Forest Oil Corp. 7.25% 6/15/19 | | 1,670 | | 1,637 |
Gulfstream Natural Gas System LLC 6.95% 6/1/16 (h) | | 302 | | 353 |
Kodiak Oil & Gas Corp. 8.125% 12/1/19 (h) | | 1,325 | | 1,401 |
LINN Energy LLC/LINN Energy Finance Corp.: | | | | |
6.25% 11/1/19 (h) | | 3,855 | | 3,807 |
6.5% 5/15/19 (h) | | 1,820 | | 1,815 |
Magnum Hunter Resources Corp. 9.75% 5/15/20 (h) | | 2,455 | | 2,424 |
Marathon Petroleum Corp. 5.125% 3/1/21 | | 3,001 | | 3,451 |
Markwest Energy Partners LP/Markwest Energy Finance Corp. 5.5% 2/15/23 | | 610 | | 624 |
Midcontinent Express Pipeline LLC 5.45% 9/15/14 (h) | | 1,140 | | 1,176 |
Motiva Enterprises LLC: | | | | |
5.75% 1/15/20 (h) | | 2,578 | | 3,089 |
Corporate Bonds - continued |
| Principal Amount (000s) | | Value (000s) |
Nonconvertible Bonds - continued |
ENERGY - continued |
Oil, Gas & Consumable Fuels - continued |
Motiva Enterprises LLC: - continued | | | | |
6.85% 1/15/40 (h) | | $ 2,906 | | $ 3,832 |
Nakilat, Inc. 6.067% 12/31/33 (h) | | 1,839 | | 2,175 |
Nexen, Inc. 5.2% 3/10/15 | | 842 | | 916 |
PBF Holding Co. LLC/PBF Finance Corp. 8.25% 2/15/20 (h) | | 4,420 | | 4,641 |
Penn Virginia Resource Partners LP/Penn Virginia Finance Corp. 8.375% 6/1/20 (h) | | 1,025 | | 1,043 |
Petrobras International Finance Co. Ltd.: | | | | |
3.875% 1/27/16 | | 4,954 | | 5,202 |
7.875% 3/15/19 | | 5,564 | | 6,899 |
Petroleos Mexicanos: | | | | |
4.875% 1/24/22 (h) | | 2,315 | | 2,599 |
5.5% 1/21/21 | | 5,342 | | 6,237 |
5.5% 6/27/44 (h) | | 5,685 | | 6,182 |
6% 3/5/20 | | 879 | | 1,048 |
6.5% 6/2/41 (h) | | 7,225 | | 8,977 |
Petroleum Development Corp. 12% 2/15/18 | | 4,240 | | 4,558 |
Phillips 66: | | | | |
4.3% 4/1/22 (h) | | 5,053 | | 5,507 |
5.875% 5/1/42 (h) | | 4,552 | | 5,381 |
Plains All American Pipeline LP/PAA Finance Corp.: | | | | |
3.65% 6/1/22 | | 2,537 | | 2,682 |
3.95% 9/15/15 | | 137 | | 148 |
4.25% 9/1/12 | | 663 | | 663 |
6.125% 1/15/17 | | 1,880 | | 2,229 |
QR Energy LP/QRE Finance Corp. 9.25% 8/1/20 (h) | | 1,075 | | 1,086 |
Ras Laffan Liquefied Natural Gas Co. Ltd. III: | | | | |
4.5% 9/30/12 (h) | | 2,588 | | 2,588 |
5.5% 9/30/14 (h) | | 3,880 | | 4,181 |
5.832% 9/30/16 (h) | | 885 | | 965 |
6.332% 9/30/27 (h) | | 5,710 | | 6,752 |
6.75% 9/30/19 (h) | | 2,367 | | 2,935 |
Rockies Express Pipeline LLC 6.25% 7/15/13 (h) | | 2,522 | | 2,598 |
SandRidge Energy, Inc.: | | | | |
7.5% 3/15/21 (h) | | 895 | | 902 |
7.5% 2/15/23 (h) | | 2,390 | | 2,390 |
Ship Finance International Ltd. 8.5% 12/15/13 | | 10,070 | | 10,045 |
Southeast Supply Header LLC 4.85% 8/15/14 (h) | | 501 | | 527 |
Corporate Bonds - continued |
| Principal Amount (000s) | | Value (000s) |
Nonconvertible Bonds - continued |
ENERGY - continued |
Oil, Gas & Consumable Fuels - continued |
Spectra Energy Capital, LLC 5.65% 3/1/20 | | $ 421 | | $ 485 |
Spectra Energy Partners, LP: | | | | |
2.95% 6/15/16 | | 938 | | 957 |
4.6% 6/15/21 | | 1,227 | | 1,333 |
Suncor Energy, Inc. 6.1% 6/1/18 | | 7,256 | | 8,877 |
Talisman Energy, Inc. yankee 6.25% 2/1/38 | | 2,650 | | 3,134 |
Targa Resources Partners LP/Targa Resources Partners Finance Corp. 6.375% 8/1/22 (h) | | 760 | | 792 |
Texas Eastern Transmission LP 6% 9/15/17 (h) | | 948 | | 1,102 |
TransCapitalInvest Ltd. 5.67% 3/5/14 (h) | | 3,383 | | 3,578 |
Western Gas Partners LP 5.375% 6/1/21 | | 5,617 | | 6,238 |
| | 196,814 |
TOTAL ENERGY | | 248,215 |
FINANCIALS - 3.7% |
Capital Markets - 0.2% |
BlackRock, Inc. 3.375% 6/1/22 | | 3,208 | | 3,394 |
Goldman Sachs Group, Inc.: | | | | |
5.95% 1/18/18 | | 3,697 | | 4,159 |
6.15% 4/1/18 | | 1,544 | | 1,756 |
Lazard Group LLC: | | | | |
6.85% 6/15/17 | | 3,573 | | 4,031 |
7.125% 5/15/15 | | 1,276 | | 1,400 |
Merrill Lynch & Co., Inc.: | | | | |
6.11% 1/29/37 | | 4,229 | | 4,252 |
6.4% 8/28/17 | | 3,463 | | 3,935 |
Morgan Stanley: | | | | |
5.5% 7/28/21 | | 5,829 | | 5,980 |
5.625% 9/23/19 | | 1,659 | | 1,718 |
5.75% 1/25/21 | | 2,009 | | 2,076 |
7.3% 5/13/19 | | 4,941 | | 5,576 |
Penson Worldwide, Inc. 12.5% 5/15/17 (h) | | 1,700 | | 340 |
| | 38,617 |
Commercial Banks - 0.7% |
Bank of America NA 5.3% 3/15/17 | | 7,585 | | 8,257 |
BB&T Corp. 3.95% 3/22/22 | | 6,213 | | 6,710 |
Corporate Bonds - continued |
| Principal Amount (000s) | | Value (000s) |
Nonconvertible Bonds - continued |
FINANCIALS - continued |
Commercial Banks - continued |
CIT Group, Inc.: | | | | |
4.25% 8/15/17 | | $ 2,760 | | $ 2,781 |
4.75% 2/15/15 (h) | | 4,790 | | 4,982 |
5% 8/15/22 | | 2,195 | | 2,200 |
5.25% 3/15/18 | | 3,215 | | 3,352 |
5.375% 5/15/20 | | 2,805 | | 2,896 |
5.5% 2/15/19 (h) | | 5,285 | | 5,510 |
7% 5/2/17 (h) | | 3,593 | | 3,593 |
Credit Suisse New York Branch 6% 2/15/18 | | 10,887 | | 12,092 |
Discover Bank: | | | | |
7% 4/15/20 | | 2,816 | | 3,314 |
8.7% 11/18/19 | | 1,651 | | 2,090 |
Fifth Third Bancorp: | | | | |
4.5% 6/1/18 | | 418 | | 453 |
8.25% 3/1/38 | | 3,116 | | 4,356 |
Fifth Third Bank 4.75% 2/1/15 | | 680 | | 725 |
Fifth Third Capital Trust IV 6.5% 4/15/67 (m) | | 3,315 | | 3,315 |
HBOS PLC 6.75% 5/21/18 (h) | | 408 | | 403 |
HSBC Holdings PLC 4% 3/30/22 | | 4,891 | | 5,247 |
Huntington Bancshares, Inc. 7% 12/15/20 | | 1,364 | | 1,628 |
JPMorgan Chase Bank 6% 10/1/17 | | 1,942 | | 2,287 |
KeyBank NA: | | | | |
5.45% 3/3/16 | | 1,877 | | 2,099 |
5.8% 7/1/14 | | 4,250 | | 4,555 |
Marshall & Ilsley Bank: | | | | |
4.85% 6/16/15 | | 2,431 | | 2,621 |
5% 1/17/17 | | 6,619 | | 7,420 |
5.25% 9/4/12 | | 1,524 | | 1,524 |
Regions Bank: | | | | |
6.45% 6/26/37 | | 6,957 | | 6,966 |
7.5% 5/15/18 | | 2,851 | | 3,321 |
Regions Financial Corp.: | | | | |
5.75% 6/15/15 | | 996 | | 1,058 |
7.75% 11/10/14 | | 4,550 | | 5,040 |
UnionBanCal Corp.: | | | | |
3.5% 6/18/22 | | 5,000 | | 5,283 |
5.25% 12/16/13 | | 614 | | 643 |
Wachovia Corp.: | | | | |
5.625% 10/15/16 | | 3,151 | | 3,628 |
Corporate Bonds - continued |
| Principal Amount (000s) | | Value (000s) |
Nonconvertible Bonds - continued |
FINANCIALS - continued |
Commercial Banks - continued |
Wachovia Corp.: - continued | | | | |
5.75% 6/15/17 | | $ 1,728 | | $ 2,062 |
Wells Fargo & Co. 3.676% 6/15/16 | | 2,210 | | 2,404 |
| | 124,815 |
Consumer Finance - 0.7% |
Ally Financial, Inc.: | | | | |
4.625% 6/26/15 | | 2,540 | | 2,607 |
5.5% 2/15/17 | | 5,165 | | 5,346 |
6.25% 12/1/17 | | 1,800 | | 1,935 |
Capital One Financial Corp. 2.15% 3/23/15 | | 16,867 | | 17,275 |
Discover Financial Services: | | | | |
5.2% 4/27/22 | | 1,155 | | 1,228 |
6.45% 6/12/17 | | 9,507 | | 10,771 |
Ford Motor Credit Co. LLC: | | | | |
2.5% 1/15/16 | | 14,000 | | 14,004 |
4.25% 2/3/17 | | 8,050 | | 8,424 |
5.75% 2/1/21 | | 4,130 | | 4,481 |
5.875% 8/2/21 | | 2,820 | | 3,114 |
8.125% 1/15/20 | | 5,000 | | 6,191 |
General Electric Capital Corp. 5.625% 9/15/17 | | 17,812 | | 21,050 |
General Motors Acceptance Corp. 8% 11/1/31 | | 2,400 | | 2,849 |
GMAC LLC: | | | | |
6.75% 12/1/14 | | 2,355 | | 2,532 |
8% 12/31/18 | | 5,795 | | 6,519 |
8% 11/1/31 | | 19,161 | | 22,610 |
HSBC USA, Inc. 2.375% 2/13/15 | | 6,639 | | 6,803 |
SLM Corp.: | | | | |
8% 3/25/20 | | 510 | | 574 |
8.45% 6/15/18 | | 2,250 | | 2,599 |
| | 140,912 |
Diversified Financial Services - 0.8% |
Bank of America Corp.: | | | | |
3.875% 3/22/17 | | 6,857 | | 7,225 |
5.65% 5/1/18 | | 3,745 | | 4,184 |
5.7% 1/24/22 | | 10,579 | | 11,971 |
5.75% 12/1/17 | | 6,120 | | 6,844 |
5.875% 2/7/42 | | 6,365 | | 7,233 |
7.375% 5/15/14 | | 26 | | 28 |
Corporate Bonds - continued |
| Principal Amount (000s) | | Value (000s) |
Nonconvertible Bonds - continued |
FINANCIALS - continued |
Diversified Financial Services - continued |
BP Capital Markets PLC: | | | | |
3.625% 5/8/14 | | $ 3,296 | | $ 3,460 |
4.5% 10/1/20 | | 888 | | 1,034 |
4.742% 3/11/21 | | 4,210 | | 4,943 |
Calpine Construction Finance Co. LP 8% 6/1/16 (h) | | 6,880 | | 7,430 |
Capital One Capital V 10.25% 8/15/39 | | 4,185 | | 4,311 |
CEVA Group PLC 8.375% 12/1/17 (h) | | 2,350 | | 2,285 |
Citigroup, Inc.: | | | | |
2.25% 8/7/15 | | 10,000 | | 10,087 |
3.953% 6/15/16 | | 5,674 | | 5,985 |
4.75% 5/19/15 | | 9,415 | | 10,107 |
6.125% 5/15/18 | | 1,423 | | 1,651 |
6.5% 8/19/13 | | 14,217 | | 14,952 |
Everest Acquisition LLC / Everest Acquisition Finance, Inc.: | | | | |
6.875% 5/1/19 (h) | | 1,540 | | 1,656 |
9.375% 5/1/20 (h) | | 6,040 | | 6,553 |
General Motors Financial Co., Inc.: | | | | |
4.75% 8/15/17 (h) | | 8,705 | | 8,727 |
6.75% 6/1/18 | | 6,765 | | 7,442 |
Icahn Enterprises LP/Icahn Enterprises Finance Corp.: | | | | |
7.75% 1/15/16 | | 7,625 | | 8,006 |
8% 1/15/18 (h) | | 1,015 | | 1,078 |
JPMorgan Chase & Co. 3.15% 7/5/16 | | 7,615 | | 8,063 |
Landry's Acquisition Co. 9.375% 5/1/20 (h) | | 875 | | 919 |
NSG Holdings II, LLC 7.75% 12/15/25 (h) | | 5,023 | | 5,123 |
TECO Finance, Inc.: | | | | |
4% 3/15/16 | | 1,242 | | 1,347 |
5.15% 3/15/20 | | 1,894 | | 2,208 |
TransUnion Holding Co., Inc. 9.625% 6/15/18 pay-in-kind (h)(m) | | 810 | | 879 |
UPCB Finance III Ltd. 6.625% 7/1/20 (h) | | 2,150 | | 2,241 |
Wind Acquisition Holdings Finance SA 12.25% 7/15/17 pay-in-kind (h)(m) | | 3,664 | | 2,507 |
| | 160,479 |
Insurance - 0.6% |
American International Group, Inc.: | | | | |
2.375% 8/24/15 | | 14,000 | | 14,025 |
Corporate Bonds - continued |
| Principal Amount (000s) | | Value (000s) |
Nonconvertible Bonds - continued |
FINANCIALS - continued |
Insurance - continued |
American International Group, Inc.: - continued | | | | |
4.875% 6/1/22 | | $ 3,800 | | $ 4,145 |
Aon Corp.: | | | | |
3.125% 5/27/16 | | 3,111 | | 3,286 |
3.5% 9/30/15 | | 2,415 | | 2,546 |
Axis Capital Holdings Ltd. 5.75% 12/1/14 | | 329 | | 354 |
Great-West Life & Annuity Insurance Co. 7.153% 5/16/46 (h)(m) | | 1,381 | | 1,409 |
Hartford Financial Services Group, Inc.: | | | | |
5.125% 4/15/22 | | 9,707 | | 10,440 |
5.375% 3/15/17 | | 265 | | 290 |
6.625% 4/15/42 | | 8,421 | | 9,481 |
HUB International Holdings, Inc. 9% 12/15/14 (h) | | 3,710 | | 3,766 |
Liberty Mutual Group, Inc.: | | | | |
5% 6/1/21 (h) | | 6,063 | | 6,368 |
6.5% 3/15/35 (h) | | 1,064 | | 1,142 |
Marsh & McLennan Companies, Inc. 4.8% 7/15/21 | | 3,209 | | 3,605 |
Massachusetts Mutual Life Insurance Co. 5.375% 12/1/41 (h) | | 2,993 | | 3,413 |
MetLife, Inc.: | | | | |
5% 6/15/15 | | 686 | | 762 |
6.75% 6/1/16 | | 3,874 | | 4,633 |
Metropolitan Life Global Funding I: | | | | |
5.125% 4/10/13 (h) | | 329 | | 338 |
5.125% 6/10/14 (h) | | 3,462 | | 3,722 |
Monumental Global Funding III 5.5% 4/22/13 (h) | | 2,041 | | 2,090 |
Northwestern Mutual Life Insurance Co. 6.063% 3/30/40 (h) | | 3,585 | | 4,616 |
Pacific Life Insurance Co. 9.25% 6/15/39 (h) | | 2,499 | | 3,403 |
Pacific LifeCorp 6% 2/10/20 (h) | | 4,423 | | 4,925 |
Prudential Financial, Inc.: | | | | |
3.875% 1/14/15 | | 2,500 | | 2,651 |
5.15% 1/15/13 | | 2,369 | | 2,407 |
6.2% 11/15/40 | | 2,076 | | 2,448 |
7.375% 6/15/19 | | 1,880 | | 2,367 |
Symetra Financial Corp. 6.125% 4/1/16 (h) | | 4,684 | | 5,096 |
Unum Group: | | | | |
5.625% 9/15/20 | | 2,719 | | 3,003 |
5.75% 8/15/42 | | 4,577 | | 4,719 |
Corporate Bonds - continued |
| Principal Amount (000s) | | Value (000s) |
Nonconvertible Bonds - continued |
FINANCIALS - continued |
Insurance - continued |
Unum Group: - continued | | | | |
7.125% 9/30/16 | | $ 803 | | $ 935 |
USI Holdings Corp. 4.3095% 11/15/14 (h)(m) | | 2,920 | | 2,789 |
| | 115,174 |
Real Estate Investment Trusts - 0.3% |
Alexandria Real Estate Equities, Inc. 4.6% 4/1/22 | | 1,614 | | 1,701 |
AvalonBay Communities, Inc. 4.95% 3/15/13 | | 216 | | 220 |
Boston Properties, Inc. 3.85% 2/1/23 | | 3,642 | | 3,813 |
BRE Properties, Inc. 5.5% 3/15/17 | | 903 | | 1,025 |
Camden Property Trust: | | | | |
5.375% 12/15/13 | | 2,150 | | 2,257 |
5.875% 11/30/12 | | 395 | | 400 |
DDR Corp. 4.625% 7/15/22 | | 1,932 | | 2,004 |
Developers Diversified Realty Corp.: | | | | |
4.75% 4/15/18 | | 4,456 | | 4,776 |
7.5% 4/1/17 | | 3,456 | | 4,046 |
Duke Realty LP: | | | | |
4.375% 6/15/22 | | 3,030 | | 3,167 |
4.625% 5/15/13 | | 741 | | 756 |
5.4% 8/15/14 | | 596 | | 636 |
5.5% 3/1/16 | | 2,930 | | 3,213 |
6.75% 3/15/20 | | 517 | | 623 |
8.25% 8/15/19 | | 1,710 | | 2,163 |
Equity One, Inc.: | | | | |
5.375% 10/15/15 | | 672 | | 725 |
6% 9/15/17 | | 522 | | 581 |
6.25% 12/15/14 | | 924 | | 1,002 |
6.25% 1/15/17 | | 291 | | 325 |
Federal Realty Investment Trust: | | | | |
5.4% 12/1/13 | | 257 | | 270 |
5.9% 4/1/20 | | 1,287 | | 1,541 |
6.2% 1/15/17 | | 365 | | 425 |
HCP, Inc. 3.15% 8/1/22 | | 8,000 | | 7,811 |
Health Care REIT, Inc. 4.125% 4/1/19 | | 11,300 | | 11,889 |
HRPT Properties Trust: | | | | |
5.75% 11/1/15 | | 1,241 | | 1,304 |
6.25% 6/15/17 | | 726 | | 797 |
6.65% 1/15/18 | | 490 | | 544 |
Corporate Bonds - continued |
| Principal Amount (000s) | | Value (000s) |
Nonconvertible Bonds - continued |
FINANCIALS - continued |
Real Estate Investment Trusts - continued |
Omega Healthcare Investors, Inc.: | | | | |
5.875% 3/15/24 (h) | | $ 3,200 | | $ 3,424 |
6.75% 10/15/22 | | 1,885 | | 2,078 |
Washington (REIT) 5.25% 1/15/14 | | 440 | | 459 |
| | 63,975 |
Real Estate Management & Development - 0.4% |
AMB Property LP 5.9% 8/15/13 | | 1,520 | | 1,574 |
BioMed Realty LP: | | | | |
3.85% 4/15/16 | | 5,000 | | 5,226 |
4.25% 7/15/22 | | 2,511 | | 2,621 |
6.125% 4/15/20 | | 1,703 | | 1,987 |
Brandywine Operating Partnership LP 5.7% 5/1/17 | | 119 | | 130 |
CB Richard Ellis Services, Inc. 6.625% 10/15/20 | | 900 | | 981 |
Digital Realty Trust LP: | | | | |
4.5% 7/15/15 | | 2,465 | | 2,611 |
5.25% 3/15/21 | | 2,876 | | 3,177 |
ERP Operating LP: | | | | |
4.625% 12/15/21 | | 10,720 | | 12,295 |
4.75% 7/15/20 | | 3,638 | | 4,121 |
5.5% 10/1/12 | | 279 | | 280 |
5.75% 6/15/17 | | 1,446 | | 1,704 |
Host Hotels & Resorts LP 4.75% 3/1/23 | | 1,290 | | 1,322 |
Liberty Property LP: | | | | |
4.125% 6/15/22 | | 2,599 | | 2,697 |
4.75% 10/1/20 | | 5,547 | | 6,044 |
5.125% 3/2/15 | | 951 | | 1,022 |
5.5% 12/15/16 | | 1,396 | | 1,566 |
Mack-Cali Realty LP: | | | | |
4.5% 4/18/22 | | 1,598 | | 1,694 |
7.75% 8/15/19 | | 957 | | 1,176 |
Post Apartment Homes LP 6.3% 6/1/13 | | 2,240 | | 2,304 |
Prime Property Funding, Inc.: | | | | |
5.125% 6/1/15 (h) | | 1,703 | | 1,737 |
5.5% 1/15/14 (h) | | 644 | | 660 |
5.7% 4/15/17 (h) | | 1,572 | | 1,644 |
Realogy Corp.: | | | | |
7.875% 2/15/19 (h) | | 1,885 | | 1,942 |
9% 1/15/20 (h) | | 1,170 | | 1,258 |
Corporate Bonds - continued |
| Principal Amount (000s) | | Value (000s) |
Nonconvertible Bonds - continued |
FINANCIALS - continued |
Real Estate Management & Development - continued |
Regency Centers LP: | | | | |
4.95% 4/15/14 | | $ 360 | | $ 378 |
5.25% 8/1/15 | | 1,257 | | 1,368 |
5.875% 6/15/17 | | 639 | | 734 |
Simon Property Group LP: | | | | |
4.2% 2/1/15 | | 1,785 | | 1,904 |
6.75% 5/15/14 | | 4,302 | | 4,653 |
Tanger Properties LP: | | | | |
6.125% 6/1/20 | | 6,753 | | 8,014 |
6.15% 11/15/15 | | 873 | | 975 |
| | 79,799 |
TOTAL FINANCIALS | | 723,771 |
HEALTH CARE - 0.7% |
Biotechnology - 0.1% |
Amgen, Inc. 5.15% 11/15/41 | | 14,179 | | 15,506 |
Celgene Corp. 2.45% 10/15/15 | | 838 | | 867 |
| | 16,373 |
Health Care Equipment & Supplies - 0.0% |
Aviv Healthcare Properties LP/Aviv Healthcare Capital Corp. 7.75% 2/15/19 | | 2,945 | | 3,078 |
Hologic, Inc. 6.25% 8/1/20 (h) | | 1,490 | | 1,578 |
Teleflex, Inc. 6.875% 6/1/19 | | 1,665 | | 1,782 |
| | 6,438 |
Health Care Providers & Services - 0.6% |
Aristotle Holding, Inc.: | | | | |
4.75% 11/15/21 (h) | | 9,101 | | 10,504 |
6.125% 11/15/41 (h) | | 4,534 | | 5,915 |
Community Health Systems, Inc.: | | | | |
5.125% 8/15/18 | | 1,275 | | 1,315 |
7.125% 7/15/20 | | 1,305 | | 1,364 |
Coventry Health Care, Inc.: | | | | |
5.95% 3/15/17 | | 1,030 | | 1,205 |
6.3% 8/15/14 | | 2,132 | | 2,311 |
DaVita, Inc.: | | | | |
5.75% 8/15/22 | | 1,215 | | 1,264 |
6.625% 11/1/20 | | 1,555 | | 1,664 |
Corporate Bonds - continued |
| Principal Amount (000s) | | Value (000s) |
Nonconvertible Bonds - continued |
HEALTH CARE - continued |
Health Care Providers & Services - continued |
Express Scripts, Inc.: | | | | |
3.125% 5/15/16 | | $ 4,847 | | $ 5,153 |
6.25% 6/15/14 | | 1,491 | | 1,629 |
Fresenius Medical Care US Finance II, Inc. 6.5% 9/15/18 (h) | | 665 | | 736 |
HCA Holdings, Inc. 7.75% 5/15/21 | | 13,495 | | 14,575 |
HCA, Inc.: | | | | |
5.875% 3/15/22 | | 5,645 | | 6,005 |
6.5% 2/15/20 | | 10,450 | | 11,443 |
7.5% 2/15/22 | | 3,250 | | 3,620 |
7.875% 2/15/20 | | 4,825 | | 5,368 |
9.875% 2/15/17 | | 551 | | 595 |
Legend Acquisition Sub, Inc. 10.75% 8/15/20 (h) | | 2,940 | | 2,903 |
Medco Health Solutions, Inc.: | | | | |
2.75% 9/15/15 | | 1,608 | | 1,682 |
4.125% 9/15/20 | | 3,728 | | 4,052 |
Multiplan, Inc. 9.875% 9/1/18 (h) | | 3,385 | | 3,715 |
Radiation Therapy Services, Inc. 8.875% 1/15/17 | | 1,240 | | 1,184 |
Rotech Healthcare, Inc. 10.5% 3/15/18 | | 960 | | 545 |
Rural/Metro Corp. 10.125% 7/15/19 (h) | | 995 | | 980 |
Sabra Health Care LP/Sabra Capital Corp.: | | | | |
8.125% 11/1/18 | | 655 | | 712 |
8.125% 11/1/18 (h) | | 895 | | 973 |
Surgical Care Affiliates LLC 8.875% 7/15/15 pay-in-kind (h)(m) | | 4,790 | | 4,874 |
Tenet Healthcare Corp.: | | | | |
8.875% 7/1/19 | | 4,610 | | 5,227 |
9.875% 7/1/14 | | 4,690 | | 5,159 |
10% 5/1/18 | | 5,002 | | 5,752 |
Vanguard Health Holding Co. II LLC / Vanguard Holding Co. II, Inc.: | | | | |
7.75% 2/1/19 | | 1,495 | | 1,551 |
7.75% 2/1/19 (h) | | 3,155 | | 3,273 |
Vanguard Health Systems, Inc. 0% 2/1/16 | | 97 | | 68 |
| | 117,316 |
Health Care Technology - 0.0% |
Emdeon, Inc. 11% 12/31/19 (h) | | 1,760 | | 2,006 |
Corporate Bonds - continued |
| Principal Amount (000s) | | Value (000s) |
Nonconvertible Bonds - continued |
HEALTH CARE - continued |
Pharmaceuticals - 0.0% |
Watson Pharmaceuticals, Inc. 5% 8/15/14 | | $ 984 | | $ 1,047 |
TOTAL HEALTH CARE | | 143,180 |
INDUSTRIALS - 0.8% |
Aerospace & Defense - 0.0% |
BAE Systems Holdings, Inc.: | | | | |
4.95% 6/1/14 (h) | | 781 | | 823 |
6.375% 6/1/19 (h) | | 3,650 | | 4,358 |
| | 5,181 |
Airlines - 0.1% |
Continental Airlines, Inc.: | | | | |
pass-thru trust certificates: | | | | |
8.388% 5/1/22 | | 60 | | 62 |
9.798% 4/1/21 | | 2,989 | | 3,213 |
6.648% 3/15/19 | | 2,077 | | 2,191 |
6.9% 7/2/19 | | 630 | | 681 |
7.339% 4/19/14 | | 894 | | 912 |
Delta Air Lines, Inc. 9.5% 9/15/14 (h) | | 770 | | 809 |
U.S. Airways pass-thru trust certificates: | | | | |
6.85% 1/30/18 | | 1,202 | | 1,256 |
8.36% 1/20/19 | | 994 | | 1,079 |
United Air Lines, Inc. 9.875% 8/1/13 (h) | | 888 | | 912 |
| | 11,115 |
Building Products - 0.1% |
Associated Materials LLC 9.125% 11/1/17 | | 465 | | 450 |
HD Supply, Inc.: | | | | |
8.125% 4/15/19 (h) | | 2,870 | | 3,121 |
11% 4/15/20 (h) | | 1,250 | | 1,375 |
Isabelle Acquisition Sub, Inc. 10% 11/15/18 pay-in-kind (h)(m) | | 330 | | 348 |
Ply Gem Industries, Inc. 8.25% 2/15/18 | | 3,300 | | 3,374 |
USG Corp. 7.875% 3/30/20 (h) | | 905 | | 963 |
| | 9,631 |
Commercial Services & Supplies - 0.3% |
ARAMARK Holdings Corp. 8.625% 5/1/16 pay-in-kind (h)(m) | | 2,045 | | 2,101 |
Casella Waste Systems, Inc. 11% 7/15/14 | | 1,015 | | 1,066 |
Corporate Bonds - continued |
| Principal Amount (000s) | | Value (000s) |
Nonconvertible Bonds - continued |
INDUSTRIALS - continued |
Commercial Services & Supplies - continued |
Clean Harbors, Inc. 5.25% 8/1/20 (h) | | $ 905 | | $ 929 |
Covanta Holding Corp.: | | | | |
6.375% 10/1/22 | | 1,290 | | 1,406 |
7.25% 12/1/20 | | 1,920 | | 2,143 |
International Lease Finance Corp.: | | | | |
4.875% 4/1/15 | | 1,580 | | 1,642 |
5.625% 9/20/13 | | 5,290 | | 5,469 |
5.65% 6/1/14 | | 4,439 | | 4,594 |
5.75% 5/15/16 | | 1,840 | | 1,909 |
5.875% 5/1/13 | | 3,460 | | 3,534 |
5.875% 4/1/19 | | 4,700 | | 4,846 |
6.25% 5/15/19 | | 3,035 | | 3,172 |
6.375% 3/25/13 | | 6,647 | | 6,788 |
6.625% 11/15/13 | | 8,252 | | 8,623 |
7.125% 9/1/18 (h) | | 7,560 | | 8,637 |
8.25% 12/15/20 | | 3,190 | | 3,720 |
8.625% 9/15/15 | | 4,640 | | 5,197 |
WP Rocket Merger Sub, Inc. 10.125% 7/15/19 (h) | | 1,200 | | 1,197 |
| | 66,973 |
Electrical Equipment - 0.0% |
Anixter International, Inc. 5.625% 5/1/19 | | 705 | | 737 |
Machinery - 0.0% |
Briggs & Stratton Corp. 6.875% 12/15/20 | | 920 | | 994 |
TRAC Intermodal LLC/TRAC Intermodal Corp. 11% 8/15/19 (h) | | 910 | | 915 |
| | 1,909 |
Marine - 0.0% |
Navios Maritime Acquisition Corp./Navios Acquisition Finance US, Inc. 8.625% 11/1/17 | | 1,035 | | 963 |
Navios Maritime Holdings, Inc.: | | | | |
8.125% 2/15/19 | | 1,725 | | 1,501 |
8.875% 11/1/17 | | 1,420 | | 1,441 |
Navios South American Logisitcs, Inc./Navios Logistics Finance U.S., Inc. 9.25% 4/15/19 | | 505 | | 470 |
| | 4,375 |
Road & Rail - 0.2% |
Burlington Northern Santa Fe LLC: | | | | |
4.4% 3/15/42 | | 15,840 | | 16,681 |
Corporate Bonds - continued |
| Principal Amount (000s) | | Value (000s) |
Nonconvertible Bonds - continued |
INDUSTRIALS - continued |
Road & Rail - continued |
Burlington Northern Santa Fe LLC: - continued | | | | |
5.05% 3/1/41 | | $ 7,178 | | $ 8,244 |
NESCO LLC/NESCO Holdings Corp. 11.75% 4/15/17 (h) | | 965 | | 1,004 |
Norfolk Southern Corp. 3% 4/1/22 | | 11,347 | | 11,765 |
Swift Services Holdings, Inc. 10% 11/15/18 | | 1,715 | | 1,876 |
Western Express, Inc. 12.5% 4/15/15 (h) | | 3,725 | | 2,533 |
| | 42,103 |
Trading Companies & Distributors - 0.1% |
Aircastle Ltd.: | | | | |
7.625% 4/15/20 | | 845 | | 936 |
9.75% 8/1/18 | | 790 | | 906 |
VWR Funding, Inc.: | | | | |
7.25% 9/15/17 (h) | | 2,695 | | 2,729 |
10.25% 7/15/15 pay-in-kind (m) | | 6,686 | | 6,891 |
| | 11,462 |
TOTAL INDUSTRIALS | | 153,486 |
INFORMATION TECHNOLOGY - 0.4% |
Communications Equipment - 0.1% |
Avaya, Inc.: | | | | |
7% 4/1/19 (h) | | 2,295 | | 2,094 |
10.125% 11/1/15 pay-in-kind (m) | | 4,428 | | 3,841 |
Hughes Satellite Systems Corp. 6.5% 6/15/19 | | 7,595 | | 8,108 |
Lucent Technologies, Inc.: | | | | |
6.45% 3/15/29 | | 12,541 | | 8,089 |
6.5% 1/15/28 | | 1,110 | | 713 |
| | 22,845 |
Electronic Equipment & Components - 0.0% |
Tyco Electronics Group SA: | | | | |
5.95% 1/15/14 | | 2,947 | | 3,143 |
6% 10/1/12 | | 3,594 | | 3,608 |
6.55% 10/1/17 | | 815 | | 985 |
| | 7,736 |
Internet Software & Services - 0.0% |
j2 Global, Inc. 8% 8/1/20 (h) | | 920 | | 922 |
Corporate Bonds - continued |
| Principal Amount (000s) | | Value (000s) |
Nonconvertible Bonds - continued |
INFORMATION TECHNOLOGY - continued |
IT Services - 0.1% |
Audatex North America, Inc. 6.75% 6/15/18 (h) | | $ 3,120 | | $ 3,346 |
Ceridian Corp.: | | | | |
8.875% 7/15/19 (h) | | 1,110 | | 1,190 |
11.25% 11/15/15 | | 2,730 | | 2,669 |
First Data Corp. 6.75% 11/1/20 (h) | | 3,485 | | 3,468 |
Iron Mountain, Inc. 5.75% 8/15/24 | | 1,000 | | 1,008 |
SunGard Data Systems, Inc. 4.875% 1/15/14 | | 12,355 | | 12,787 |
WideOpenWest Finance LLC/WideOpenWest Capital Corp.: | | | | |
10.25% 7/15/19 (h) | | 3,270 | | 3,401 |
13.375% 10/15/19 (h) | | 1,780 | | 1,771 |
| | 29,640 |
Office Electronics - 0.1% |
Xerox Corp.: | | | | |
1.8679% 9/13/13 (m) | | 8,470 | | 8,529 |
4.25% 2/15/15 | | 503 | | 536 |
4.5% 5/15/21 | | 2,031 | | 2,135 |
| | 11,200 |
Semiconductors & Semiconductor Equipment - 0.1% |
Freescale Semiconductor, Inc. 10.125% 3/15/18 (h) | | 6,887 | | 7,541 |
NXP BV/NXP Funding LLC: | | | | |
3.2051% 10/15/13 (m) | | 85 | | 85 |
9.75% 8/1/18 (h) | | 1,480 | | 1,691 |
Spansion LLC: | | | | |
7.875% 11/15/17 | | 1,150 | | 1,121 |
11.25% 1/15/16 (d)(h) | | 905 | | 53 |
Viasystems, Inc. 7.875% 5/1/19 (h) | | 2,570 | | 2,525 |
| | 13,016 |
Software - 0.0% |
Lawson Software, Inc. 9.375% 4/1/19 (h) | | 755 | | 819 |
Nuance Communications, Inc. 5.375% 8/15/20 (h) | | 640 | | 655 |
| | 1,474 |
TOTAL INFORMATION TECHNOLOGY | | 86,833 |
Corporate Bonds - continued |
| Principal Amount (000s) | | Value (000s) |
Nonconvertible Bonds - continued |
MATERIALS - 0.4% |
Chemicals - 0.1% |
Dow Chemical Co. 7.6% 5/15/14 | | $ 7,168 | | $ 7,955 |
INEOS Group Holdings PLC 8.5% 2/15/16 (h) | | 3,470 | | 3,270 |
Kinove German Bondco GmbH 9.625% 6/15/18 (h) | | 1,060 | | 1,118 |
Tronox Finance LLC 6.375% 8/15/20 (h) | | 1,825 | | 1,843 |
| | 14,186 |
Construction Materials - 0.0% |
CEMEX SA de CV 5.4606% 9/30/15 (h)(m) | | 2,815 | | 2,674 |
CRH America, Inc. 6% 9/30/16 | | 1,699 | | 1,885 |
| | 4,559 |
Containers & Packaging - 0.0% |
ARD Finance SA 11.125% 6/1/18 pay-in-kind (h) | | 1,834 | | 1,688 |
Ardagh Packaging Finance PLC: | | | | |
7.375% 10/15/17 (h) | | 200 | | 215 |
9.125% 10/15/20 (h) | | 65 | | 68 |
Ardagh Packaging Finance PLC / Ardagh MP Holdings USA, Inc.: | | | | |
7.375% 10/15/17 (h) | | 300 | | 322 |
9.125% 10/15/20 (h) | | 690 | | 716 |
9.125% 10/15/20 (h) | | 620 | | 648 |
Consolidated Container Co. LLC/Consolidated Container Capital, Inc. 10.125% 7/15/20 (h) | | 555 | | 577 |
Crown Americas LLC/Crown Americas Capital Corp. III 6.25% 2/1/21 | | 2,040 | | 2,254 |
Owens-Illinois, Inc. 7.8% 5/15/18 | | 350 | | 401 |
Pretium Packaging LLC/Pretium Finance, Inc. 11.5% 4/1/16 | | 2,340 | | 2,358 |
Sappi Papier Holding GmbH 6.625% 4/15/21 (h) | | 375 | | 347 |
Tekni-Plex, Inc. 9.75% 6/1/19 (h) | | 1,165 | | 1,212 |
| | 10,806 |
Metals & Mining - 0.2% |
Anglo American Capital PLC 9.375% 4/8/14 (h) | | 1,181 | | 1,324 |
Aperam: | | | | |
7.375% 4/1/16 (h) | | 385 | | 335 |
7.75% 4/1/18 (h) | | 305 | | 253 |
Boart Longyear Management Pty Ltd. 7% 4/1/21 (h) | | 830 | | 861 |
Calcipar SA 6.875% 5/1/18 (h) | | 720 | | 707 |
Corporacion Nacional del Cobre de Chile (Codelco): | | | | |
3.875% 11/3/21 (h) | | 5,672 | | 6,121 |
Corporate Bonds - continued |
| Principal Amount (000s) | | Value (000s) |
Nonconvertible Bonds - continued |
MATERIALS - continued |
Metals & Mining - continued |
Corporacion Nacional del Cobre de Chile (Codelco): - continued | | | | |
6.375% 11/30/12 (h) | | $ 1,179 | | $ 1,192 |
Edgen Murray Corp. 12.25% 1/15/15 | | 5,215 | | 5,541 |
FMG Resources (August 2006) Pty Ltd.: | | | | |
6% 4/1/17 (h) | | 1,770 | | 1,664 |
6.375% 2/1/16 (h) | | 8,300 | | 7,927 |
6.875% 4/1/22 (h) | | 1,770 | | 1,637 |
7% 11/1/15 (h) | | 1,865 | | 1,832 |
MRC Global, Inc. 9.5% 12/15/16 | | 2,840 | | 3,096 |
New Gold, Inc. 7% 4/15/20 (h) | | 345 | | 363 |
Rain CII Carbon LLC/CII Carbon Corp. 8% 12/1/18 (h) | | 1,335 | | 1,362 |
Severstal Columbus LLC 10.25% 2/15/18 | | 1,820 | | 1,866 |
Steel Dynamics, Inc.: | | | | |
6.125% 8/15/19 (h) | | 1,115 | | 1,154 |
6.375% 8/15/22 (h) | | 990 | | 1,020 |
Vale Overseas Ltd.: | | | | |
4.375% 1/11/22 | | 5,000 | | 5,128 |
6.25% 1/23/17 | | 2,152 | | 2,467 |
| | 45,850 |
Paper & Forest Products - 0.1% |
AbitibiBowater, Inc. 10.25% 10/15/18 | | 5,290 | | 6,057 |
Verso Paper Holdings LLC/Verso Paper, Inc.: | | | | |
11.75% 1/15/19 (h) | | 3,790 | | 3,904 |
11.75% 1/15/19 (h) | | 2,615 | | 2,066 |
| | 12,027 |
TOTAL MATERIALS | | 87,428 |
TELECOMMUNICATION SERVICES - 0.7% |
Diversified Telecommunication Services - 0.4% |
AT&T, Inc.: | | | | |
6.3% 1/15/38 | | 5,000 | | 6,529 |
6.8% 5/15/36 | | 8,428 | | 11,530 |
BellSouth Capital Funding Corp. 7.875% 2/15/30 | | 1,291 | | 1,755 |
Broadview Networks Holdings, Inc. 11.375% 9/1/12 (d) | | 3,815 | | 2,575 |
Corporate Bonds - continued |
| Principal Amount (000s) | | Value (000s) |
Nonconvertible Bonds - continued |
TELECOMMUNICATION SERVICES - continued |
Diversified Telecommunication Services - continued |
CenturyLink, Inc.: | | | | |
6.15% 9/15/19 | | $ 2,344 | | $ 2,552 |
6.45% 6/15/21 | | 2,312 | | 2,582 |
7.6% 9/15/39 | | 707 | | 731 |
Eileme 1 AB 14.25% 8/15/20 pay-in-kind (h) | | 2,136 | | 2,111 |
Eileme 2 AB 11.625% 1/31/20 (h) | | 2,095 | | 2,294 |
Embarq Corp. 7.995% 6/1/36 | | 2,621 | | 2,902 |
Frontier Communications Corp. 7.125% 1/15/23 | | 2,055 | | 2,091 |
Intelsat Ltd. 11.25% 6/15/16 | | 2,082 | | 2,191 |
Level 3 Communications, Inc. 8.875% 6/1/19 (h) | | 435 | | 444 |
Level 3 Financing, Inc. 7% 6/1/20 (h) | | 1,460 | | 1,449 |
Sprint Capital Corp. 6.9% 5/1/19 | | 14,150 | | 14,486 |
Telefonica Emisiones SAU 5.462% 2/16/21 | | 3,562 | | 3,277 |
Verizon Communications, Inc.: | | | | |
6.1% 4/15/18 | | 1,909 | | 2,385 |
6.25% 4/1/37 | | 3,729 | | 4,952 |
Wind Acquisition Finance SA 7.25% 2/15/18 (h) | | 1,860 | | 1,711 |
| | 68,547 |
Wireless Telecommunication Services - 0.3% |
America Movil SAB de CV 3.625% 3/30/15 | | 999 | | 1,067 |
Clearwire Communications LLC/Clearwire Finance, Inc. 12% 12/1/15 (h) | | 1,082 | | 1,071 |
Clearwire Escrow Corp. 12% 12/1/15 (h) | | 4,475 | | 4,408 |
Crown Castle International Corp. 9% 1/15/15 | | 2,955 | | 3,184 |
Digicel Group Ltd.: | | | | |
7% 2/15/20 (h) | | 275 | | 276 |
8.875% 1/15/15 (h) | | 6,915 | | 7,053 |
12% 4/1/14 (h) | | 3,990 | | 4,419 |
DIRECTV Holdings LLC/DIRECTV Financing, Inc.: | | | | |
5.15% 3/15/42 | | 2,472 | | 2,527 |
5.875% 10/1/19 | | 6,223 | | 7,319 |
6.35% 3/15/40 | | 1,699 | | 2,001 |
Intelsat Jackson Holdings SA: | | | | |
7.25% 4/1/19 | | 7,260 | | 7,823 |
7.5% 4/1/21 | | 5,500 | | 5,954 |
Nextel Communications, Inc.: | | | | |
5.95% 3/15/14 | | 140 | | 140 |
7.375% 8/1/15 | | 862 | | 866 |
Corporate Bonds - continued |
| Principal Amount (000s) | | Value (000s) |
Nonconvertible Bonds - continued |
TELECOMMUNICATION SERVICES - continued |
Wireless Telecommunication Services - continued |
NII Capital Corp. 7.625% 4/1/21 | | $ 2,609 | | $ 2,015 |
Sprint Nextel Corp.: | | | | |
7% 8/15/20 | | 5,860 | | 5,992 |
9% 11/15/18 (h) | | 6,595 | | 7,782 |
Vodafone Group PLC 5% 12/16/13 | | 2,129 | | 2,250 |
| | 66,147 |
TOTAL TELECOMMUNICATION SERVICES | | 134,694 |
UTILITIES - 1.1% |
Electric Utilities - 0.4% |
Ameren Illinois Co. 6.125% 11/15/17 | | 243 | | 286 |
AmerenUE 6.4% 6/15/17 | | 2,769 | | 3,323 |
Cleveland Electric Illuminating Co. 5.65% 12/15/13 | | 3,812 | | 4,020 |
Duke Capital LLC 5.668% 8/15/14 | | 1,905 | | 2,053 |
Duquesne Light Holdings, Inc.: | | | | |
5.9% 12/1/21 (h) | | 3,820 | | 4,312 |
6.4% 9/15/20 (h) | | 7,884 | | 9,112 |
Edison International 3.75% 9/15/17 | | 3,169 | | 3,389 |
Edison Mission Energy 7% 5/15/17 | | 510 | | 268 |
Enel Finance International SA 5.7% 1/15/13 (h) | | 282 | | 285 |
FirstEnergy Corp. 7.375% 11/15/31 | | 6,718 | | 8,865 |
FirstEnergy Solutions Corp.: | | | | |
4.8% 2/15/15 | | 1,266 | | 1,352 |
6.05% 8/15/21 | | 4,871 | | 5,420 |
InterGen NV 9% 6/30/17 (h) | | 3,690 | | 3,598 |
IPALCO Enterprises, Inc. 7.25% 4/1/16 (h) | | 3,670 | | 4,110 |
LG&E and KU Energy LLC: | | | | |
2.125% 11/15/15 | | 3,576 | | 3,613 |
3.75% 11/15/20 | | 704 | | 729 |
Mirant Americas Generation LLC: | | | | |
8.5% 10/1/21 | | 6,695 | | 7,063 |
9.125% 5/1/31 | | 1,745 | | 1,806 |
Nevada Power Co.: | | | | |
6.5% 5/15/18 | | 5,100 | | 6,365 |
6.5% 8/1/18 | | 531 | | 666 |
Pennsylvania Electric Co. 6.05% 9/1/17 | | 450 | | 517 |
Pepco Holdings, Inc. 2.7% 10/1/15 | | 3,363 | | 3,464 |
Corporate Bonds - continued |
| Principal Amount (000s) | | Value (000s) |
Nonconvertible Bonds - continued |
UTILITIES - continued |
Electric Utilities - continued |
Progress Energy, Inc. 6% 12/1/39 | | $ 3,060 | | $ 3,858 |
Sierra Pacific Power Co. 5.45% 9/1/13 | | 527 | | 550 |
| | 79,024 |
Gas Utilities - 0.0% |
AmeriGas Finance LLC/AmeriGas Finance Corp.: | | | | |
6.75% 5/20/20 | | 830 | | 882 |
7% 5/20/22 | | 1,785 | | 1,905 |
Southern Natural Gas Co. 5.9% 4/1/17 (h) | | 260 | | 306 |
Southern Natural Gas Co. / Southern Natural Issuing Corp. 4.4% 6/15/21 | | 1,660 | | 1,782 |
Star Gas Partners LP/Star Gas Finance Co. 8.875% 12/1/17 | | 950 | | 955 |
| | 5,830 |
Independent Power Producers & Energy Traders - 0.4% |
Atlantic Power Corp. 9% 11/15/18 | | 1,655 | | 1,729 |
Calpine Corp. 7.875% 1/15/23 (h) | | 7,985 | | 8,903 |
Energy Future Holdings Corp. 10% 1/15/20 | | 8,915 | | 9,873 |
Energy Future Intermediate Holding Co. LLC/Energy Future Intermediate Holding Finance, Inc.: | | | | |
10% 12/1/20 | | 3,174 | | 3,575 |
11% 10/1/21 | | 6,978 | | 6,873 |
11.75% 3/1/22 (h) | | 19,685 | | 20,965 |
GenOn Energy, Inc.: | | | | |
9.5% 10/15/18 | | 520 | | 573 |
9.875% 10/15/20 | | 1,743 | | 1,911 |
PSEG Power LLC 2.75% 9/15/16 | | 1,379 | | 1,439 |
RRI Energy, Inc. 7.625% 6/15/14 | | 1,940 | | 2,076 |
The AES Corp.: | | | | |
7.375% 7/1/21 | | 1,580 | | 1,809 |
7.75% 10/15/15 | | 4,660 | | 5,243 |
TXU Corp.: | | | | |
5.55% 11/15/14 | | 50 | | 41 |
6.5% 11/15/24 | | 4,150 | | 2,366 |
6.55% 11/15/34 | | 7,295 | | 3,958 |
| | 71,334 |
Multi-Utilities - 0.3% |
Consolidated Edison Co. of New York, Inc. 5.7% 6/15/40 | | 1,866 | | 2,548 |
Corporate Bonds - continued |
| Principal Amount (000s) | | Value (000s) |
Nonconvertible Bonds - continued |
UTILITIES - continued |
Multi-Utilities - continued |
Dominion Resources, Inc.: | | | | |
2.7606% 9/30/66 (m) | | $ 13,469 | | $ 12,262 |
7.5% 6/30/66 (m) | | 1,102 | | 1,192 |
MidAmerican Energy Holdings, Co.: | | | | |
5.875% 10/1/12 | | 2,521 | | 2,531 |
6.5% 9/15/37 | | 1,418 | | 1,938 |
National Grid PLC 6.3% 8/1/16 | | 376 | | 434 |
NiSource Finance Corp.: | | | | |
4.45% 12/1/21 | | 2,313 | | 2,503 |
5.25% 9/15/17 | | 497 | | 573 |
5.25% 2/15/43 | | 3,857 | | 4,271 |
5.4% 7/15/14 | | 1,249 | | 1,343 |
5.45% 9/15/20 | | 598 | | 683 |
5.8% 2/1/42 | | 3,125 | | 3,718 |
5.95% 6/15/41 | | 5,667 | | 6,793 |
6.4% 3/15/18 | | 1,230 | | 1,472 |
6.8% 1/15/19 | | 2,710 | | 3,249 |
Puget Energy, Inc. 5.625% 7/15/22 (h) | | 3,935 | | 4,127 |
Sempra Energy 2.3% 4/1/17 | | 5,903 | | 6,174 |
Wisconsin Energy Corp. 6.25% 5/15/67 (m) | | 2,776 | | 2,939 |
| | 58,750 |
TOTAL UTILITIES | | 214,938 |
TOTAL NONCONVERTIBLE BONDS | | 2,193,977 |
TOTAL CORPORATE BONDS (Cost $2,050,377) |
2,233,066
|
U.S. Government and Government Agency Obligations - 5.3% |
|
U.S. Treasury Inflation Protected Obligations - 0.9% |
U.S. Treasury Inflation-Indexed Bonds: | | | | |
0.75% 2/15/42 | | 115,208 | | 126,561 |
2.125% 2/15/40 | | 15,788 | | 23,232 |
2.125% 2/15/41 | | 18,763 | | 27,803 |
TOTAL U.S. TREASURY INFLATION PROTECTED OBLIGATIONS | | 177,596 |
U.S. Government and Government Agency Obligations - continued |
| Principal Amount (000s) | | Value (000s) |
U.S. Treasury Obligations - 4.4% |
U.S. Treasury Bonds: | | | | |
2.75% 8/15/42 | | $ 5,000 | | $ 5,079 |
3% 5/15/42 | | 68,003 | | 72,784 |
U.S. Treasury Notes: | | | | |
0.25% 7/15/15 | | 124,886 | | 124,759 |
0.5% 7/31/17 | | 145,000 | | 144,422 |
0.875% 4/30/17 | | 45,652 | | 46,344 |
0.875% 7/31/19 (j) | | 170,511 | | 169,245 |
1% 8/31/19 | | 160,000 | | 159,988 |
1.625% 8/15/22 | | 143,000 | | 143,938 |
TOTAL U.S. TREASURY OBLIGATIONS | | 866,559 |
TOTAL U.S. GOVERNMENT AND GOVERNMENT AGENCY OBLIGATIONS (Cost $1,017,415) |
1,044,155
|
U.S. Government Agency - Mortgage Securities - 8.6% |
|
Fannie Mae - 7.3% |
2.558% 6/1/36 (m) | | 147 | | 157 |
2.777% 7/1/37 (m) | | 421 | | 452 |
3% 4/1/27 to 8/1/42 | | 8,569 | | 9,031 |
3% 9/1/27 (i) | | 12,400 | | 13,085 |
3% 9/1/27 (i) | | 10,100 | | 10,658 |
3% 9/1/27 (i) | | 4,000 | | 4,221 |
3% 9/1/42 (i) | | 900 | | 934 |
3% 9/1/42 (i) | | 185,700 | | 192,695 |
3% 9/1/42 (i) | | 11,300 | | 11,726 |
3% 9/1/42 (i) | | 174,400 | | 180,970 |
3% 10/1/42 (i) | | 135,600 | | 140,177 |
3.5% 1/1/26 to 8/1/42 | | 26,853 | | 28,687 |
3.5% 9/1/27 (i) | | 4,000 | | 4,253 |
3.5% 7/1/42 | | 90 | | 96 |
3.5% 7/1/42 | | 130 | | 139 |
3.5% 8/1/42 | | 167 | | 178 |
3.5% 8/1/42 | | 154 | | 164 |
3.5% 9/1/42 (i) | | 265,200 | | 281,195 |
3.5% 9/1/42 (i) | | 4,300 | | 4,559 |
3.5% 9/1/42 (i) | | 8,700 | | 9,225 |
4% 4/1/24 to 4/1/42 | | 35,922 | | 38,784 |
U.S. Government Agency - Mortgage Securities - continued |
| Principal Amount (000s) | | Value (000s) |
Fannie Mae - continued |
4% 9/1/27 (i) | | $ 9,000 | | $ 9,631 |
4% 9/1/41 | | 144 | | 155 |
4% 9/1/42 (i) | | 85,000 | | 91,149 |
4.5% 6/1/18 to 8/1/41 | | 29,052 | | 31,634 |
4.5% 9/1/42 (i) | | 83,000 | | 89,835 |
4.5% 9/1/42 (i) | | 7,300 | | 7,901 |
5% 12/1/25 to 5/1/40 | | 30,505 | | 33,522 |
5% 9/1/42 (i) | | 500 | | 546 |
5% 9/1/42 (i) | | 48,000 | | 52,425 |
5.5% 6/1/33 to 3/1/40 | | 40,594 | | 44,729 |
5.5% 9/1/42 (i) | | 48,000 | | 52,676 |
6% 6/1/35 to 4/1/40 | | 39,805 | | 43,968 |
6% 9/1/42 (i) | | 39,000 | | 42,976 |
TOTAL FANNIE MAE | | 1,432,533 |
Freddie Mac - 0.7% |
3.454% 10/1/35 (m) | | 208 | | 223 |
3.5% 4/1/32 to 4/1/42 | | 8,975 | | 9,621 |
4% 6/1/24 to 4/1/42 | | 20,732 | | 22,508 |
4% 9/1/42 (i) | | 18,000 | | 19,257 |
4.5% 5/1/39 to 10/1/41 | | 37,725 | | 40,871 |
5% 3/1/19 to 12/1/40 | | 26,809 | | 29,220 |
5.5% 5/1/27 to 1/1/40 | | 14,635 | | 15,946 |
6% 7/1/37 to 8/1/37 | | 911 | | 1,002 |
6.5% 3/1/36 | | 3,324 | | 3,761 |
TOTAL FREDDIE MAC | | 142,409 |
Ginnie Mae - 0.6% |
3% 10/1/42 (i) | | 11,300 | | 11,837 |
3.5% 11/15/41 to 3/15/42 | | 13,014 | | 14,126 |
4% 1/15/25 to 12/15/41 | | 16,414 | | 17,998 |
4.5% 5/15/39 to 4/15/41 | | 41,051 | | 45,512 |
5% 3/15/39 to 9/15/41 | | 21,105 | | 23,611 |
5.5% 12/15/38 to 9/15/39 | | 1,849 | | 2,077 |
6% 2/15/34 to 9/20/38 | | 9,430 | | 10,653 |
TOTAL GINNIE MAE | | 125,814 |
TOTAL U.S. GOVERNMENT AGENCY - MORTGAGE SECURITIES (Cost $1,685,289) |
1,700,756
|
Asset-Backed Securities - 0.3% |
| Principal Amount (000s) | | Value (000s) |
Accredited Mortgage Loan Trust Series 2005-1 Class M1, 0.7055% 4/25/35 (m) | | $ 751 | | $ 578 |
ACE Securities Corp. Home Equity Loan Trust: | | | | |
Series 2004-HE1 Class M2, 1.8855% 3/25/34 (m) | | 294 | | 240 |
Series 2005-HE2 Class M2, 0.6855% 4/25/35 (m) | | 62 | | 59 |
Advanta Business Card Master Trust Series 2006-C1 Class C1, 0.6758% 10/20/14 (m) | | 472 | | 5 |
Ally Master Owner Trust Series 2012-3 Class A2, 1.21% 6/15/17 | | 27,520 | | 27,570 |
Ameriquest Mortgage Securities, Inc. pass-thru certificates: | | | | |
Series 2003-10 Class M1, 0.9355% 12/25/33 (m) | | 59 | | 44 |
Series 2004-R2 Class M3, 0.7855% 4/25/34 (m) | | 83 | | 33 |
Series 2005-R2 Class M1, 0.6855% 4/25/35 (m) | | 1,567 | | 1,404 |
Argent Securities, Inc. pass-thru certificates: | | | | |
Series 2003-W7 Class A2, 1.0262% 3/25/34 (m) | | 36 | | 29 |
Series 2004-W11 Class M2, 0.9355% 11/25/34 (m) | | 426 | | 300 |
Series 2004-W7 Class M1, 0.7855% 5/25/34 (m) | | 1,108 | | 787 |
Series 2006-W4 Class A2C, 0.3955% 5/25/36 (m) | | 988 | | 299 |
Asset Backed Securities Corp. Home Equity Loan Trust: | | | | |
Series 2004-HE2 Class M1, 1.0605% 4/25/34 (m) | | 1,781 | | 1,467 |
Series 2006-HE2 Class M1, 0.6055% 3/25/36 (m) | | 45 | | 0* |
Axon Financial Funding Ltd. Series 2007-1 Class A1, 0.9743% 4/4/17 (d)(h)(m) | | 4,820 | | 0 |
Capital Trust Ltd. Series 2004-1: | | | | |
Class A2, 0.687% 7/20/39 (h)(m) | | 95 | | 86 |
Class B, 0.987% 7/20/39 (h)(m) | | 200 | | 90 |
Class C, 1.337% 7/20/39 (h)(m) | | 258 | | 4 |
Carrington Mortgage Loan Trust Series 2007-RFC1 Class A3, 0.3755% 12/25/36 (m) | | 1,368 | | 545 |
Citigroup Mortgage Loan Trust Series 2005-HE4 Class A2C, 0.5055% 10/25/35 (m) | | 372 | | 371 |
Countrywide Asset-Backed Certificates Trust Series 2007-4 Class A1A, 0.3662% 9/25/37 (m) | | 89 | | 89 |
Countrywide Home Loan Trust Series 2006-13 Class N, 7% 8/25/37 (h) | | 251 | | 0 |
Countrywide Home Loans, Inc.: | | | | |
Series 2004-3 Class M4, 1.2055% 4/25/34 (m) | | 121 | | 55 |
Series 2004-4 Class M2, 1.0305% 6/25/34 (m) | | 446 | | 257 |
Fannie Mae Series 2004-T5 Class AB3, 1.1466% 5/28/35 (m) | | 30 | | 18 |
Fieldstone Mortgage Investment Corp. Series 2004-3 Class M5, 2.4105% 8/25/34 (m) | | 221 | | 136 |
Asset-Backed Securities - continued |
| Principal Amount (000s) | | Value (000s) |
First Franklin Mortgage Loan Trust: | | | | |
Series 2004-FF2 Class M3, 1.0605% 3/25/34 (m) | | $ 17 | | $ 7 |
Series 2006-FF14 Class A2, 0.2955% 10/25/36 (m) | | 340 | | 337 |
Fremont Home Loan Trust Series 2005-A: | | | | |
Class M3, 0.9705% 1/25/35 (m) | | 720 | | 225 |
Class M4, 1.2555% 1/25/35 (m) | | 276 | | 36 |
GCO Education Loan Funding Master Trust II Series 2007-1A Class C1L, 0.8069% 2/25/47 (h)(m) | | 2,160 | | 888 |
GCO Slims Trust Series 2006-1A, 5.72% 3/1/22 (h) | | 433 | | 418 |
GE Business Loan Trust: | | | | |
Series 2003-1 Class A, 0.6695% 4/15/31 (h)(m) | | 149 | | 141 |
Series 2006-2A: | | | | |
Class A, 0.4195% 11/15/34 (h)(m) | | 1,010 | | 869 |
Class B, 0.5195% 11/15/34 (h)(m) | | 365 | | 253 |
Class C, 0.6195% 11/15/34 (h)(m) | | 606 | | 345 |
Class D, 0.9895% 11/15/34 (h)(m) | | 231 | | 72 |
Guggenheim Structured Real Estate Funding Ltd. Series 2006-3 Class C, 0.7855% 9/25/46 (h)(m) | | 1,065 | | 1,024 |
Home Equity Asset Trust: | | | | |
Series 2003-2 Class M1, 1.5555% 8/25/33 (m) | | 260 | | 203 |
Series 2003-3 Class M1, 1.5255% 8/25/33 (m) | | 515 | | 431 |
Series 2003-5 Class A2, 0.9355% 12/25/33 (m) | | 25 | | 20 |
HSI Asset Securitization Corp. Trust Series 2007-HE1 Class 2A3, 0.4255% 1/25/37 (m) | | 1,137 | | 380 |
JPMorgan Mortgage Acquisition Trust: | | | | |
Series 2006-NC2 Class M2, 0.5355% 7/25/36 (m) | | 2,497 | | 35 |
Series 2007-CH1 Class AV4, 0.3655% 11/25/36 (m) | | 1,136 | | 1,043 |
Keycorp Student Loan Trust: | | | | |
Series 1999-A Class A2, 0.7906% 12/27/29 (m) | | 394 | | 354 |
Series 2006-A Class 2C, 1.6106% 3/27/42 (m) | | 2,016 | | 96 |
Marriott Vacation Club Owner Trust Series 2006-2A: | | | | |
Class B, 5.442% 10/20/28 (h) | | 6 | | 6 |
Class C, 5.691% 10/20/28 (h) | | 3 | | 3 |
Class D, 6.01% 10/20/28 (h) | | 34 | | 34 |
MASTR Asset Backed Securities Trust Series 2007-HE1 Class M1, 0.5355% 5/25/37 (m) | | 596 | | 5 |
Meritage Mortgage Loan Trust Series 2004-1 Class M1, 0.9855% 7/25/34 (m) | | 113 | | 72 |
Merrill Lynch Mortgage Investors Trust: | | | | |
Series 2003-OPT1 Class M1, 1.2105% 7/25/34 (m) | | 351 | | 233 |
Series 2006-FM1 Class A2B, 0.3455% 4/25/37 (m) | | 1,095 | | 988 |
Series 2006-OPT1 Class A1A, 0.4955% 6/25/35 (m) | | 2,074 | | 1,669 |
Asset-Backed Securities - continued |
| Principal Amount (000s) | | Value (000s) |
Morgan Stanley ABS Capital I Trust: | | | | |
Series 2004-HE6 Class A2, 0.5755% 8/25/34 (m) | | $ 44 | | $ 34 |
Series 2005-NC1 Class M1, 0.6755% 1/25/35 (m) | | 303 | | 183 |
Series 2005-NC2 Class B1, 1.4055% 3/25/35 (m) | | 316 | | 38 |
National Collegiate Student Loan Trust: | | | | |
Series 2004-2 Class AIO, 9.75% 10/27/14 (o) | | 1,137 | | 15 |
Series 2006-4 Class D, 1.3355% 5/25/32 (m) | | 1,544 | | 0* |
New Century Home Equity Loan Trust Series 2005-4 Class M2, 0.7455% 9/25/35 (m) | | 1,083 | | 700 |
Ocala Funding LLC: | | | | |
Series 2005-1A Class A, 1.737% 3/20/10 (d)(h)(m) | | 429 | | 0 |
Series 2006-1A Class A, 1.637% 3/20/11 (d)(h)(m) | | 892 | | 0 |
Park Place Securities, Inc.: | | | | |
Series 2004-WCW1: | | | | |
Class M3, 1.4855% 9/25/34 (m) | | 405 | | 176 |
Class M4, 1.6855% 9/25/34 (m) | | 519 | | 118 |
Series 2005-WCH1 Class M4, 1.0655% 1/25/36 (m) | | 1,120 | | 640 |
Salomon Brothers Mortgage Securities VII, Inc. Series 2003-HE1 Class A, 1.0355% 4/25/33 (m) | | 4 | | 3 |
Saxon Asset Securities Trust Series 2004-1 Class M1, 1.0305% 3/25/35 (m) | | 962 | | 698 |
Sierra Receivables Funding Co. Series 2007-1A Class A2, 0.3968% 3/20/19 (FGIC Insured) (h)(m) | | 307 | | 301 |
SLM Private Credit Student Loan Trust Series 2004-A Class C, 1.4179% 6/15/33 (m) | | 965 | | 584 |
Specialty Underwriting & Residential Finance Trust Series 2006-AB2 Class N1, 5.75% 6/25/37 (h) | | 455 | | 0 |
Structured Asset Investment Loan Trust Series 2004-8 Class M5, 1.9605% 9/25/34 (m) | | 48 | | 16 |
SVO VOI Mortgage Corp. Series 2006-AA Class A, 5.28% 2/20/24 (h) | | 329 | | 338 |
Terwin Mortgage Trust Series 2003-4HE Class A1, 1.0955% 9/25/34 (m) | | 22 | | 20 |
Trapeza CDO XII Ltd./Trapeza CDO XII, Inc. Series 2007-12A Class B, 1.0196% 4/6/42 (h)(m) | | 1,509 | | 19 |
WaMu Asset Holdings Corp. Series 2006-8 Class N1, 6.048% 10/25/46 (h) | | 674 | | 0 |
Asset-Backed Securities - continued |
| Principal Amount (000s) | | Value (000s) |
Wells Fargo Home Equity Trust Series 2004-3 Class A, 4.5% 11/27/34 (h) | | $ 6 | | $ 0 |
Whinstone Capital Management Ltd. Series 1A Class B3, 2.2511% 10/25/44 (h)(m) | | 1,358 | | 897 |
TOTAL ASSET-BACKED SECURITIES (Cost $47,383) |
49,433
|
Collateralized Mortgage Obligations - 0.2% |
|
Private Sponsor - 0.2% |
Bayview Commercial Asset Trust Series 2006-3A, Class IO, 3.9199% 10/25/36 (h)(m)(o) | | 26,734 | | 944 |
Bear Stearns ALT-A Trust floater Series 2005-1 Class A1, 0.7955% 1/25/35 (m) | | 1,357 | | 1,168 |
Cobalt CMBS Commercial Mortgage Trust Series 2007-C2 Class B, 5.617% 4/15/47 (m) | | 1,019 | | 428 |
COMM pass-thru certificates floater Series 2001-J2A Class A2F, 0.7385% 7/16/34 (h)(m) | | 5 | | 5 |
First Horizon Mortgage pass-thru Trust Series 2004-AR5 Class 2A1, 2.623% 10/25/34 (m) | | 970 | | 934 |
Granite Master Issuer PLC: | | | | |
floater: | | | | |
Series 2006-1A Class A5, 0.377% 12/20/54 (h)(m) | | 5,566 | | 5,427 |
Series 2006-3 Class M2, 0.517% 12/20/54 (m) | | 4,540 | | 3,950 |
Series 2006-4: | | | | |
Class B1, 0.417% 12/20/54 (m) | | 3,154 | | 2,878 |
Class M1, 0.577% 12/20/54 (m) | | 829 | | 721 |
Series 2007-1: | | | | |
Class 1B1, 0.377% 12/20/54 (m) | | 3,856 | | 3,519 |
Class 1M1, 0.537% 12/20/54 (m) | | 1,114 | | 969 |
Class 2M1, 0.737% 12/20/54 (m) | | 1,431 | | 1,245 |
Series 2007-2 Class 2C1, 1.098% 12/17/54 (m) | | 1,981 | | 1,496 |
sequential payer Series 2006-3 Class B2, 0.407% 12/20/54 (m) | | 4,550 | | 4,152 |
Granite Mortgages PLC floater Series 2003-3 Class 1C, 2.9051% 1/20/44 (m) | | 326 | | 258 |
JPMorgan Chase Commercial Mortgage Securities Trust Series 2007-CB18 Class A3, 5.447% 6/12/47 (m) | | 1,063 | | 1,125 |
JPMorgan Mortgage Trust sequential payer Series 2006-A5 Class 3A5, 5.6881% 8/25/36 (m) | | 1,592 | | 1,226 |
LB-UBS Commercial Mortgage Trust sequential payer Series 2006-C6 Class A4, 5.372% 9/15/39 | | 410 | | 473 |
Collateralized Mortgage Obligations - continued |
| Principal Amount (000s) | | Value (000s) |
Private Sponsor - continued |
MASTR Adjustable Rate Mortgages Trust Series 2007-3 Class 22A2, 0.4455% 5/25/47 (m) | | $ 587 | | $ 375 |
Merrill Lynch Alternative Note Asset Trust floater Series 2007-OAR1 Class A1, 0.4055% 2/25/37 (m) | | 1,022 | | 801 |
Opteum Mortgage Acceptance Corp. floater Series 2005-3 Class APT, 0.5255% 7/25/35 (m) | | 1,416 | | 1,151 |
RESI Finance LP/RESI Finance DE Corp. floater Series 2003-B: | | | | |
Class B5, 2.5903% 7/10/35 (h)(m) | | 799 | | 636 |
Class B6, 3.0903% 7/10/35 (h)(m) | | 170 | | 135 |
Residential Funding Securities Corp. floater Series 2003-RP2 Class A1, 0.6855% 6/25/33 (h)(m) | | 153 | | 147 |
Salomon Brothers Mortgage Securities VII, Inc. Series 2006-C2 Class H, 6.308% 7/18/33 (h) | | 129 | | 43 |
Sequoia Mortgage Trust floater Series 2004-6 Class A3B, 1.6169% 7/20/34 (m) | | 26 | | 23 |
Structured Asset Securities Corp. Series 2003-15A Class 4A, 5.3743% 4/25/33 (m) | | 272 | | 254 |
TBW Mortgage-Backed pass-thru certificates floater Series 2006-4 Class A3, 0.4355% 9/25/36 (m) | | 2,430 | | 2,089 |
TOTAL COLLATERALIZED MORTGAGE OBLIGATIONS (Cost $27,898) |
36,572
|
Commercial Mortgage Securities - 1.7% |
|
Asset Securitization Corp. Series 1997-D5: | | | | |
Class A6, 7.1354% 2/14/43 (m) | | 106 | | 107 |
Class PS1, 1.2297% 2/14/43 (m)(o) | | 518 | | 15 |
Banc of America Commercial Mortgage Trust: | | | | |
sequential payer: | | | | |
Series 2006-2 Class AAB, 5.7087% 5/10/45 (m) | | 752 | | 796 |
Series 2006-5: | | | | |
Class A2, 5.317% 9/10/47 | | 2,650 | | 2,664 |
Class A3, 5.39% 9/10/47 | | 1,272 | | 1,350 |
Series 2006-6 Class A3, 5.369% 10/10/45 | | 1,824 | | 1,994 |
Series 2007-4 Class A3, 5.7921% 2/10/51 (m) | | 897 | | 933 |
Series 2006-6 Class E, 5.619% 10/10/45 (h) | | 527 | | 53 |
Series 2007-3: | | | | |
Class A3, 5.6612% 6/10/49 (m) | | 1,523 | | 1,553 |
Class A4, 5.6612% 6/10/49 (m) | | 1,901 | | 2,174 |
Commercial Mortgage Securities - continued |
| Principal Amount (000s) | | Value (000s) |
Banc of America Commercial Mortgage, Inc.: | | | | |
sequential payer: | | | | |
Series 2001-1 Class A4, 5.451% 1/15/49 | | $ 1,997 | | $ 2,288 |
Series 2004-2 Class A4, 4.153% 11/10/38 | | 976 | | 1,003 |
Series 2005-1 Class A3, 4.877% 11/10/42 | | 325 | | 325 |
Series 2001-3 Class H, 6.562% 4/11/37 (h) | | 510 | | 510 |
Series 2005-3 Class A3B, 5.09% 7/10/43 (m) | | 2,833 | | 2,984 |
Banc of America Large Loan, Inc. floater: | | | | |
Series 2005-MIB1: | | | | |
Class C, 0.5495% 3/15/22 (h)(m) | | 392 | | 388 |
Class D, 0.5995% 3/15/22 (h)(m) | | 397 | | 391 |
Class E, 0.6395% 3/15/22 (h)(m) | | 328 | | 321 |
Class F, 0.7095% 3/15/22 (h)(m) | | 467 | | 453 |
Class G, 0.7695% 3/15/22 (h)(m) | | 303 | | 288 |
Series 2006-BIX1: | | | | |
Class D, 0.4495% 10/15/19 (h)(m) | | 80 | | 77 |
Class E, 0.4795% 10/15/19 (h)(m) | | 663 | | 627 |
Class F, 0.5495% 10/15/19 (h)(m) | | 1,987 | | 1,868 |
Class G, 0.5695% 10/15/19 (h)(m) | | 935 | | 869 |
Bayview Commercial Asset Trust: | | | | |
floater: | | | | |
Series 2003-2 Class M1, 1.0855% 12/25/33 (h)(m) | | 45 | | 33 |
Series 2004-1: | | | | |
Class A, 0.5955% 4/25/34 (h)(m) | | 775 | | 684 |
Class B, 2.1355% 4/25/34 (h)(m) | | 87 | | 51 |
Class M1, 0.7955% 4/25/34 (h)(m) | | 70 | | 50 |
Class M2, 1.4355% 4/25/34 (h)(m) | | 64 | | 45 |
Series 2005-2A: | | | | |
Class A1, 0.5455% 8/25/35 (h)(m) | | 1,055 | | 762 |
Class M1, 0.6655% 8/25/35 (h)(m) | | 57 | | 34 |
Class M2, 0.7155% 8/25/35 (h)(m) | | 94 | | 51 |
Class M3, 0.7355% 8/25/35 (h)(m) | | 52 | | 26 |
Series 2005-3A: | | | | |
Class A2, 0.6355% 11/25/35 (h)(m) | | 371 | | 292 |
Class M1, 0.6755% 11/25/35 (h)(m) | | 49 | | 27 |
Class M2, 0.7255% 11/25/35 (h)(m) | | 62 | | 33 |
Class M3, 0.7455% 11/25/35 (h)(m) | | 55 | | 28 |
Class M4, 0.8355% 11/25/35 (h)(m) | | 69 | | 32 |
Series 2005-4A: | | | | |
Class A2, 0.6255% 1/25/36 (h)(m) | | 963 | | 682 |
Class B1, 1.6355% 1/25/36 (h)(m) | | 83 | | 12 |
Class M1, 0.6855% 1/25/36 (h)(m) | | 311 | | 192 |
Commercial Mortgage Securities - continued |
| Principal Amount (000s) | | Value (000s) |
Bayview Commercial Asset Trust: - continued | | | | |
floater: | | | | |
Series 2005-4A: | | | | |
Class M2, 0.7055% 1/25/36 (h)(m) | | $ 93 | | $ 54 |
Class M3, 0.7355% 1/25/36 (h)(m) | | 136 | | 73 |
Class M4, 0.8455% 1/25/36 (h)(m) | | 75 | | 37 |
Class M5, 0.8855% 1/25/36 (h)(m) | | 75 | | 25 |
Class M6, 0.9355% 1/25/36 (h)(m) | | 80 | | 21 |
Series 2006-1: | | | | |
Class A2, 0.5955% 4/25/36 (h)(m) | | 149 | | 110 |
Class M1, 0.6155% 4/25/36 (h)(m) | | 53 | | 32 |
Class M2, 0.6355% 4/25/36 (h)(m) | | 56 | | 31 |
Class M3, 0.6555% 4/25/36 (h)(m) | | 48 | | 25 |
Class M4, 0.7555% 4/25/36 (h)(m) | | 27 | | 13 |
Class M5, 0.7955% 4/25/36 (h)(m) | | 27 | | 9 |
Class M6, 0.8755% 4/25/36 (h)(m) | | 53 | | 18 |
Series 2006-2A: | | | | |
Class A1, 0.4655% 7/25/36 (h)(m) | | 2,217 | | 1,563 |
Class A2, 0.5155% 7/25/36 (h)(m) | | 132 | | 93 |
Class B1, 1.1055% 7/25/36 (h)(m) | | 49 | | 7 |
Class B3, 2.9355% 7/25/36 (h)(m) | | 46 | | 1 |
Class M1, 0.5455% 7/25/36 (h)(m) | | 138 | | 45 |
Class M2, 0.5655% 7/25/36 (h)(m) | | 97 | | 29 |
Class M3, 0.5855% 7/25/36 (h)(m) | | 81 | | 18 |
Class M4, 0.6555% 7/25/36 (h)(m) | | 55 | | 12 |
Class M5, 0.7055% 7/25/36 (h)(m) | | 67 | | 13 |
Class M6, 0.7755% 7/25/36 (h)(m) | | 100 | | 16 |
Series 2006-3A: | | | | |
Class B1, 1.0355% 10/25/36 (h)(m) | | 3 | | 0* |
Class M4, 0.6655% 10/25/36 (h)(m) | | 109 | | 16 |
Class M5, 0.7155% 10/25/36 (h)(m) | | 130 | | 8 |
Class M6, 0.7955% 10/25/36 (h)(m) | | 255 | | 6 |
Series 2006-4A: | | | | |
Class A1, 0.4655% 12/25/36 (h)(m) | | 559 | | 380 |
Class A2, 0.5055% 12/25/36 (h)(m) | | 2,735 | | 1,274 |
Class B1, 0.9355% 12/25/36 (h)(m) | | 54 | | 1 |
Class M1, 0.5255% 12/25/36 (h)(m) | | 182 | | 37 |
Class M2, 0.5455% 12/25/36 (h)(m) | | 121 | | 19 |
Class M3, 0.5755% 12/25/36 (h)(m) | | 123 | | 17 |
Class M4, 0.6355% 12/25/36 (h)(m) | | 147 | | 17 |
Class M5, 0.6755% 12/25/36 (h)(m) | | 135 | | 11 |
Class M6, 0.7555% 12/25/36 (h)(m) | | 121 | | 7 |
Series 2007-1 Class A2, 0.5055% 3/25/37 (h)(m) | | 561 | | 302 |
Commercial Mortgage Securities - continued |
| Principal Amount (000s) | | Value (000s) |
Bayview Commercial Asset Trust: - continued | | | | |
floater: | | | | |
Series 2007-2A: | | | | |
Class A1, 0.5055% 7/25/37 (h)(m) | | $ 534 | | $ 301 |
Class A2, 0.5555% 7/25/37 (h)(m) | | 501 | | 166 |
Class B1, 1.8355% 7/25/37 (h)(m) | | 73 | | 1 |
Class M1, 0.6055% 7/25/37 (h)(m) | | 176 | | 46 |
Class M2, 0.6455% 7/25/37 (h)(m) | | 96 | | 12 |
Class M3, 0.7255% 7/25/37 (h)(m) | | 97 | | 9 |
Class M4, 0.8855% 7/25/37 (h)(m) | | 192 | | 15 |
Class M5, 0.9855% 7/25/37 (h)(m) | | 170 | | 12 |
Class M6, 1.2355% 7/25/37 (h)(m) | | 215 | | 11 |
Series 2007-3: | | | | |
Class A2, 0.5255% 7/25/37 (h)(m) | | 572 | | 290 |
Class B1, 1.1855% 7/25/37 (h)(m) | | 128 | | 9 |
Class B2, 1.8355% 7/25/37 (h)(m) | | 299 | | 16 |
Class M1, 0.5455% 7/25/37 (h)(m) | | 114 | | 27 |
Class M2, 0.5755% 7/25/37 (h)(m) | | 122 | | 22 |
Class M3, 0.6055% 7/25/37 (h)(m) | | 191 | | 26 |
Class M4, 0.7355% 7/25/37 (h)(m) | | 301 | | 35 |
Class M5, 0.8355% 7/25/37 (h)(m) | | 157 | | 16 |
Class M6, 1.0355% 7/25/37 (h)(m) | | 119 | | 10 |
Series 2007-4A: | | | | |
Class M1, 1.1855% 9/25/37 (h)(m) | | 202 | | 13 |
Class M2, 1.2855% 9/25/37 (h)(m) | | 202 | | 11 |
Class M4, 1.8355% 9/25/37 (h)(m) | | 514 | | 21 |
Class M5, 1.9855% 9/25/37 (h)(m) | | 514 | | 16 |
Class M6, 2.1855% 9/25/37 (h)(m) | | 336 | | 8 |
Series 2004-1, Class IO, 1.25% 4/25/34 (h)(o) | | 1,565 | | 63 |
Series 2007-5A, Class IO, 4.1484% 10/25/37 (h)(m)(o) | | 4,002 | | 346 |
Bear Stearns Commercial Mortgage Securities Trust: | | | | |
floater: | | | | |
Series 2006-BBA7: | | | | |
Class H, 0.8895% 3/15/19 (h)(m) | | 304 | | 293 |
Class J, 1.0895% 3/15/19 (h)(m) | | 309 | | 283 |
Series 2007-BBA8: | | | | |
Class D, 0.4895% 3/15/22 (h)(m) | | 452 | | 408 |
Class E, 0.5395% 3/15/22 (h)(m) | | 2,347 | | 2,072 |
Class F, 0.5895% 3/15/22 (h)(m) | | 1,440 | | 1,242 |
Class G, 0.6395% 3/15/22 (h)(m) | | 369 | | 311 |
Class H, 0.7895% 3/15/22 (h)(m) | | 452 | | 372 |
Class J, 0.9395% 3/15/22 (h)(m) | | 452 | | 361 |
Commercial Mortgage Securities - continued |
| Principal Amount (000s) | | Value (000s) |
Bear Stearns Commercial Mortgage Securities Trust: - continued | | | | |
sequential payer: | | | | |
Series 2004-PWR3 Class A3, 4.487% 2/11/41 | | $ 209 | | $ 211 |
Series 2007-PW15 Class AAB, 5.315% 2/11/44 | | 2,468 | | 2,573 |
Series 2007-PW16: | | | | |
Class A4, 5.7154% 6/11/40 (m) | | 534 | | 626 |
Class AAB, 5.7154% 6/11/40 (m) | | 4,593 | | 4,941 |
Series 2007-PW18: | | | | |
Class A2, 5.613% 6/11/50 | | 208 | | 212 |
Class A4, 5.7% 6/11/50 | | 4,380 | | 5,138 |
Series 2006-PW13 Class A3, 5.518% 9/11/41 | | 3,219 | | 3,366 |
Series 2006-PW14 Class X2, 0.6677% 12/11/38 (h)(m)(o) | | 9,603 | | 78 |
Series 2006-T22 Class A4, 5.5391% 4/12/38 (m) | | 114 | | 130 |
Series 2006-T24 Class X2, 0.4455% 10/12/41 (h)(m)(o) | | 2,380 | | 11 |
Series 2007-PW18 Class X2, 0.3156% 6/11/50 (h)(m)(o) | | 64,191 | | 599 |
Series 2007-T28 Class X2, 0.1576% 9/11/42 (h)(m)(o) | | 34,536 | | 184 |
Berkeley Federal Bank & Trust FSB Series 1994-1 Class B, 0% 8/1/24 (h)(m) | | 460 | | 249 |
C-BASS Trust floater Series 2006-SC1 Class A, 0.5055% 5/25/36 (h)(m) | | 534 | | 462 |
CDC Commercial Mortgage Trust Series 2002-FX1: | | | | |
Class G, 6.625% 5/15/35 (h) | | 1,072 | | 1,105 |
Class XCL, 1.331% 5/15/35 (h)(m)(o) | | 3,655 | | 71 |
Citigroup Commercial Mortgage Trust: | | | | |
floater Series 2006-FL2: | | | | |
Class G, 0.5693% 8/15/21 (h)(m) | | 88 | | 87 |
Class H, 0.6093% 8/15/21 (h)(m) | | 324 | | 309 |
Series 2007-C6: | | | | |
Class A2, 5.7002% 12/10/49 (m) | | 803 | | 803 |
Class A4, 5.7002% 12/10/49 (m) | | 3,035 | | 3,543 |
Series 2008-C7 Class A2B, 6.0731% 12/10/49 (m) | | 583 | | 597 |
Citigroup/Deutsche Bank Commercial Mortgage Trust: | | | | |
sequential payer Series 2007-CD4 Class A4, 5.322% 12/11/49 | | 12,448 | | 14,034 |
Series 2007-CD4 Class A3, 5.293% 12/11/49 | | 888 | | 939 |
Cobalt CMBS Commercial Mortgage Trust: | | | | |
sequential payer Series 2007-C3 Class A3, 5.8108% 5/15/46 (m) | | 912 | | 980 |
Series 2006-C1 Class B, 5.359% 8/15/48 | | 2,736 | | 397 |
Commercial Mortgage Securities - continued |
| Principal Amount (000s) | | Value (000s) |
COMM pass-thru certificates: | | | | |
floater: | | | | |
Series 2005-F10A Class J, 1.0895% 4/15/17 (h)(m) | | $ 95 | | $ 87 |
Series 2005-FL11: | | | | |
Class C, 0.5395% 11/15/17 (h)(m) | | 560 | | 532 |
Class D, 0.5795% 11/15/17 (h)(m) | | 29 | | 27 |
Class E, 0.6295% 11/15/17 (h)(m) | | 103 | | 95 |
Class F, 0.6895% 11/15/17 (h)(m) | | 114 | | 103 |
Class G, 0.7395% 11/15/17 (h)(m) | | 79 | | 70 |
Series 2006-CN2A: | | | | |
Class A2FL, 0.4643% 2/5/19 (h)(m) | | 1,042 | | 1,019 |
Class AJFL, 0.5043% 2/5/19 (m) | | 640 | | 625 |
Series 2006-FL12 Class AJ, 0.3695% 12/15/20 (h)(m) | | 1,300 | | 1,187 |
sequential payer: | | | | |
Series 2006-C8 Class A3, 5.31% 12/10/46 | | 2,599 | | 2,652 |
Series 2006-CN2A: | | | | |
Class A2FX, 5.449% 2/5/19 (h) | | 1,193 | | 1,196 |
Class AJFX, 5.478% 2/5/19 (h) | | 2,940 | | 2,944 |
Series 2007-C9 Class A4, 5.8111% 12/10/49 (m) | | 2,018 | | 2,382 |
Series 2006-C8 Class XP, 0.4663% 12/10/46 (m)(o) | | 11,260 | | 70 |
Credit Suisse Commercial Mortgage Trust: | | | | |
sequential payer: | | | | |
Series 2006-C4 Class A3, 5.467% 9/15/39 | | 1,107 | | 1,251 |
Series 2007-C2: | | | | |
Class A2, 5.448% 1/15/49 (m) | | 2,309 | | 2,329 |
Class A3, 5.542% 1/15/49 (m) | | 1,824 | | 2,036 |
Series 2007-C3 Class A4, 5.6792% 6/15/39 (m) | | 549 | | 606 |
Series 2006-C4 Class AAB, 5.439% 9/15/39 | | 2,664 | | 2,698 |
Series 2006-C5 Class ASP, 0.6643% 12/15/39 (m)(o) | | 7,791 | | 64 |
Series 2007-C5 Class A4, 5.695% 9/15/40 (m) | | 825 | | 921 |
Credit Suisse First Boston Mortgage Capital Certificates floater Series 2007-TF2A Class B, 0.5895% 4/15/22 (h)(m) | | 3,254 | | 2,579 |
Credit Suisse First Boston Mortgage Securities Corp.: | | | | |
sequential payer Series 2004-C1 Class A4, 4.75% 1/15/37 | | 417 | | 435 |
Series 2001-CK6 Class AX, 0.9973% 8/15/36 (m)(o) | | 239 | | 0* |
Series 2001-CKN5 Class AX, 1.7514% 9/15/34 (h)(m)(o) | | 824 | | 1 |
Series 2006-C1 Class A3, 5.4157% 2/15/39 (m) | | 3,257 | | 3,334 |
Commercial Mortgage Securities - continued |
| Principal Amount (000s) | | Value (000s) |
Credit Suisse Mortgage Capital Certificates: | | | | |
floater Series 2007-TFL1: | | | | |
Class B, 0.3895% 2/15/22 (h)(m) | | $ 345 | | $ 323 |
Class C: | | | | |
0.4095% 2/15/22 (h)(m) | | 1,416 | | 1,311 |
0.5095% 2/15/22 (h)(m) | | 506 | | 458 |
Class F, 0.5595% 2/15/22 (h)(m) | | 1,011 | | 906 |
Series 2007-C1: | | | | |
Class ASP, 0.3813% 2/15/40 (m)(o) | | 13,229 | | 74 |
Class B, 5.487% 2/15/40 (h)(m) | | 1,394 | | 178 |
First Union National Bank-Bank of America Commercial Mortgage Trust Series 2001-C1 Class G, 6.936% 3/15/33 (h) | | 85 | | 85 |
GE Capital Commercial Mortgage Corp.: | | | | |
sequential payer Series 2007-C1 Class A4, 5.543% 12/10/49 | | 9,244 | | 10,357 |
Series 2001-1 Class X1, 1.4912% 5/15/33 (h)(m)(o) | | 599 | | 7 |
Series 2007-C1 Class XP, 0.1588% 12/10/49 (m)(o) | | 14,041 | | 46 |
Greenwich Capital Commercial Funding Corp.: | | | | |
floater Series 2006-FL4 Class B, 0.4343% 11/5/21 (h)(m) | | 343 | | 325 |
sequential payer: | | | | |
Series 2007-GG11 Class A2, 5.597% 12/10/49 | | 1,594 | | 1,642 |
Series 2007-GG9 Class A4, 5.444% 3/10/39 | | 13,982 | | 15,826 |
Series 2006-GG7 Class A3, 5.8738% 7/10/38 (m) | | 380 | | 380 |
Series 2007-GG11 Class A1, 0.2519% 12/10/49 (h)(m)(o) | | 17,354 | | 89 |
GS Mortgage Securities Corp. II: | | | | |
floater: | | | | |
Series 2006-FL8A: | | | | |
Class E, 0.6158% 6/6/20 (h)(m) | | 207 | | 205 |
Class F, 0.6858% 6/6/20 (h)(m) | | 634 | | 624 |
Series 2007-EOP: | | | | |
Class C, 2.0056% 3/6/20 (h)(m) | | 1,144 | | 1,133 |
Class D, 2.2018% 3/6/20 (h)(m) | | 2,144 | | 2,124 |
Class F, 2.6334% 3/6/20 (h)(m) | | 94 | | 93 |
Class G, 2.7903% 3/6/20 (h)(m) | | 47 | | 47 |
Class H, 3.3004% 3/6/20 (h)(m) | | 42 | | 42 |
Class J, 4.0852% 3/6/20 (h)(m) | | 60 | | 60 |
Series 2006-GG6 Class A2, 5.506% 4/10/38 | | 2,198 | | 2,200 |
GS Mortgage Securities Trust sequential payer: | | | | |
Series 2006-GG8 Class A2, 5.479% 11/10/39 | | 273 | | 277 |
Series 2007-GG10 Class A2, 5.778% 8/10/45 | | 204 | | 207 |
Commercial Mortgage Securities - continued |
| Principal Amount (000s) | | Value (000s) |
JPMorgan Chase Commercial Mortgage Securities Trust: | | | | |
floater Series 2006-FLA2: | | | | |
Class B, 0.4095% 11/15/18 (h)(m) | | $ 455 | | $ 443 |
Class C, 0.4495% 11/15/18 (h)(m) | | 323 | | 311 |
Class D, 0.4695% 11/15/18 (h)(m) | | 143 | | 135 |
Class E, 0.5195% 11/15/18 (h)(m) | | 205 | | 190 |
Class F, 0.5695% 11/15/18 (h)(m) | | 308 | | 272 |
Class G, 0.5995% 11/15/18 (h)(m) | | 268 | | 226 |
Class H, 0.7395% 11/15/18 (h)(m) | | 205 | | 165 |
sequential payer: | | | | |
Series 2006-CB14 Class A3B, 5.4914% 12/12/44 (m) | | 2,241 | | 2,291 |
Series 2006-LDP8 Class A4, 5.399% 5/15/45 | | 581 | | 668 |
Series 2006-LDP9: | | | | |
Class A2, 5.134% 5/15/47 (m) | | 291 | | 305 |
Class A3, 5.336% 5/15/47 | | 9,635 | | 10,895 |
Series 2007-CB19 Class A4, 5.7337% 2/12/49 (m) | | 3,198 | | 3,708 |
Series 2007-LD11 Class A2, 5.7998% 6/15/49 (m) | | 2,000 | | 2,060 |
Series 2007-LDPX: | | | | |
Class A2 S, 5.305% 1/15/49 | | 1,337 | | 1,348 |
Class A3, 5.42% 1/15/49 | | 14,834 | | 16,929 |
Series 2005-LDP3 Class A3, 4.959% 8/15/42 | | 1,197 | | 1,213 |
Series 2006-CB17 Class A3, 5.45% 12/12/43 | | 239 | | 240 |
Series 2007-CB19: | | | | |
Class B, 5.7337% 2/12/49 (m) | | 78 | | 26 |
Class C, 5.7337% 2/12/49 (m) | | 204 | | 43 |
Class D, 5.7337% 2/12/49 (m) | | 214 | | 44 |
Series 2007-LDP10: | | | | |
Class CS, 5.466% 1/15/49 (m) | | 75 | | 6 |
Class ES, 5.5652% 1/15/49 (h)(m) | | 472 | | 21 |
LB Commercial Conduit Mortgage Trust sequential payer Series 2007-C3 Class A4, 5.8846% 7/15/44 (m) | | 743 | | 874 |
LB Multi-family Mortgage Trust Series 1991-4 Class A1, 7.1114% 4/25/21 (m) | | 25 | | 17 |
LB-UBS Commercial Mortgage Trust: | | | | |
sequential payer: | | | | |
Series 2006-C1 Class A2, 5.084% 2/15/31 | | 123 | | 124 |
Series 2006-C6 Class A2, 5.262% 9/15/39 (m) | | 50 | | 50 |
Series 2006-C7: | | | | |
Class A2, 5.3% 11/15/38 | | 530 | | 539 |
Class A3, 5.347% 11/15/38 | | 679 | | 777 |
Commercial Mortgage Securities - continued |
| Principal Amount (000s) | | Value (000s) |
LB-UBS Commercial Mortgage Trust: - continued | | | | |
sequential payer: | | | | |
Series 2007-C1 Class A4, 5.424% 2/15/40 | | $ 2,738 | | $ 3,148 |
Series 2007-C2 Class A3, 5.43% 2/15/40 | | 1,980 | | 2,247 |
Series 2006-C6 Class XCP, 0.6747% 9/15/39 (m)(o) | | 3,889 | | 27 |
Series 2007-C1 Class XCP, 0.4243% 2/15/40 (m)(o) | | 1,454 | | 9 |
Series 2007-C6 Class A4, 5.858% 7/15/40 (m) | | 1,140 | | 1,332 |
Series 2007-C7 Class XCP, 0.2615% 9/15/45 (m)(o) | | 58,561 | | 383 |
Lehman Brothers Floating Rate Commercial Mortgage Trust floater Series 2006-LLFA: | | | | |
Class D, 0.4695% 9/15/21 (h)(m) | | 292 | | 278 |
Class E, 0.5295% 9/15/21 (h)(m) | | 1,054 | | 975 |
Class F, 0.5795% 9/15/21 (h)(m) | | 868 | | 781 |
Class G, 0.5995% 9/15/21 (h)(m) | | 1,714 | | 1,500 |
Class H, 0.6395% 9/15/21 (h)(m) | | 442 | | 371 |
Merrill Lynch Mortgage Trust: | | | | |
Series 2005-LC1 Class F, 5.3733% 1/12/44 (h)(m) | | 793 | | 521 |
Series 2006-C1 Class A2, 5.6141% 5/12/39 (m) | | 808 | | 826 |
Series 2007-C1 Class A4, 5.8461% 6/12/50 (m) | | 3,452 | | 3,895 |
Series 2008-C1 Class A4, 5.69% 2/12/51 | | 1,947 | | 2,283 |
Merrill Lynch-CFC Commercial Mortgage Trust: | | | | |
floater Series 2006-4 Class A2FL, 0.3688% 12/12/49 (m) | | 92 | | 92 |
sequential payer: | | | | |
Series 2006-1 Class A3, 5.4796% 2/12/39 (m) | | 967 | | 966 |
Series 2006-4 Class ASB, 5.133% 12/12/49 (m) | | 667 | | 702 |
Series 2007-5: | | | | |
Class A3, 5.364% 8/12/48 | | 356 | | 361 |
Class B, 5.479% 8/12/48 | | 2,736 | | 672 |
Series 2007-6 Class A4, 5.485% 3/12/51 (m) | | 7,400 | | 8,236 |
Series 2007-7 Class A4, 5.7386% 6/12/50 (m) | | 3,192 | | 3,490 |
Series 2006-3 Class ASB, 5.382% 7/12/46 (m) | | 3,136 | | 3,232 |
Series 2006-4 Class XP, 0.617% 12/12/49 (m)(o) | | 13,978 | | 193 |
Series 2007-6 Class B, 5.635% 3/12/51 (m) | | 912 | | 228 |
Series 2007-7 Class B, 5.7386% 6/12/50 (m) | | 79 | | 5 |
Series 2007-8 Class A3, 5.9634% 8/12/49 (m) | | 787 | | 898 |
Morgan Stanley Capital I Trust: | | | | |
floater: | | | | |
Series 2006-XLF Class C, 1.44% 7/15/19 (h)(m) | | 272 | | 171 |
Series 2007-XLFA: | | | | |
Class C, 0.4% 10/15/20 (h)(m) | | 523 | | 473 |
Class D, 0.43% 10/15/20 (h)(m) | | 507 | | 448 |
Class E, 0.49% 10/15/20 (h)(m) | | 634 | | 539 |
Class F, 0.54% 10/15/20 (h)(m) | | 380 | | 316 |
Commercial Mortgage Securities - continued |
| Principal Amount (000s) | | Value (000s) |
Morgan Stanley Capital I Trust: - continued | | | | |
floater: | | | | |
Series 2007-XLFA: | | | | |
Class G, 0.58% 10/15/20 (h)(m) | | $ 470 | | $ 365 |
Class H, 0.67% 10/15/20 (h)(m) | | 296 | | 192 |
Class J, 0.82% 10/15/20 (h)(m) | | 173 | | 69 |
sequential payer: | | | | |
Series 2005-IQ9 Class A3, 4.54% 7/15/56 | | 862 | | 873 |
Series 2007-HQ11 Class A31, 5.439% 2/12/44 (m) | | 462 | | 486 |
Series 2006-HQ10 Class X2, 0.4951% 11/12/41 (h)(m)(o) | | 6,124 | | 6 |
Series 2006-IQ11: | | | | |
Class A3, 5.6877% 10/15/42 (m) | | 280 | | 285 |
Class A4, 5.7237% 10/15/42 (m) | | 274 | | 311 |
Series 2006-T23 Class A3, 5.809% 8/12/41 (m) | | 466 | | 484 |
Series 2007-IQ14: | | | | |
Class A4, 5.692% 4/15/49 (m) | | 1,368 | | 1,544 |
Class AAB, 5.654% 4/15/49 | | 2,564 | | 2,766 |
Class B, 5.7187% 4/15/49 (m) | | 224 | | 67 |
Wachovia Bank Commercial Mortgage Trust: | | | | |
floater: | | | | |
Series 2006-WL7A: | | | | |
Class E, 0.518% 9/15/21 (h)(m) | | 1,239 | | 1,065 |
Class F, 0.578% 9/15/21 (h)(m) | | 1,426 | | 1,169 |
Class G, 0.598% 9/15/21 (h)(m) | | 1,351 | | 1,053 |
Class J, 0.838% 9/15/21 (h)(m) | | 300 | | 198 |
Series 2007-WHL8: | | | | |
Class F, 0.7195% 6/15/20 (h)(m) | | 3,171 | | 2,334 |
Class LXR1, 0.9395% 6/15/20 (h)(m) | | 112 | | 97 |
sequential payer: | | | | |
Series 2003-C7 Class A1, 4.241% 10/15/35 (h) | | 579 | | 583 |
Series 2003-C8 Class A3, 4.445% 11/15/35 | | 3,157 | | 3,200 |
Series 2006-C29 Class A3, 5.313% 11/15/48 | | 2,422 | | 2,536 |
Series 2007-C30: | | | | |
Class A3, 5.246% 12/15/43 | | 291 | | 294 |
Class A4, 5.305% 12/15/43 | | 268 | | 288 |
Class A5, 5.342% 12/15/43 | | 14,776 | | 16,356 |
Series 2007-C31: | | | | |
Class A4, 5.509% 4/15/47 | | 18,661 | | 21,151 |
Class A5, 5.5% 4/15/47 | | 16,000 | | 17,771 |
Series 2003-C6 Class G, 5.125% 8/15/35 (h)(m) | | 433 | | 432 |
Series 2005-C19 Class B, 4.892% 5/15/44 | | 912 | | 842 |
Series 2005-C22: | | | | |
Class B, 5.3564% 12/15/44 (m) | | 2,022 | | 1,400 |
Commercial Mortgage Securities - continued |
| Principal Amount (000s) | | Value (000s) |
Wachovia Bank Commercial Mortgage Trust: - continued | | | | |
Series 2005-C22: | | | | |
Class F, 5.3564% 12/15/44 (h)(m) | | $ 1,521 | | $ 298 |
Series 2006-C23 Class A5, 5.416% 1/15/45 (m) | | 5,005 | | 5,640 |
Series 2007-C30: | | | | |
Class C, 5.483% 12/15/43 (m) | | 2,736 | | 770 |
Class D, 5.513% 12/15/43 (m) | | 1,459 | | 296 |
Class XP, 0.4723% 12/15/43 (h)(m)(o) | | 7,893 | | 57 |
Series 2007-C31 Class C, 5.6821% 4/15/47 (m) | | 251 | | 57 |
Series 2007-C31A Class A2, 5.421% 4/15/47 | | 5,607 | | 5,817 |
Series 2007-C32: | | | | |
Class D, 5.7418% 6/15/49 (m) | | 685 | | 185 |
Class E, 5.7418% 6/15/49 (m) | | 1,080 | | 255 |
Wachovia Bank Commercial Mortgage Trust pass-thru certificates sequential payer Series 2007-C33: | | | | |
Class A4, 5.9003% 2/15/51 (m) | | 2,110 | | 2,456 |
Class A5, 5.9003% 2/15/51 (m) | | 10,259 | | 11,914 |
TOTAL COMMERCIAL MORTGAGE SECURITIES (Cost $283,967) |
337,636
|
Municipal Securities - 0.3% |
|
Beaver County Indl. Dev. Auth. Poll. Cont. Rev. Bonds (FirstEnergy Nuclear Generation Corp. Proj.) Series 2005 A, 3.375%, tender 7/1/15 (m) | | 1,700 | | 1,765 |
California Gen. Oblig.: | | | | |
Series 2009, 7.35% 11/1/39 | | 860 | | 1,117 |
7.3% 10/1/39 | | 9,280 | | 11,976 |
7.5% 4/1/34 | | 7,195 | | 9,374 |
7.55% 4/1/39 | | 4,645 | | 6,219 |
7.6% 11/1/40 | | 5,140 | | 6,967 |
7.625% 3/1/40 | | 2,095 | | 2,818 |
Illinois Gen. Oblig.: | | | | |
Series 2010, 4.421% 1/1/15 | | 4,050 | | 4,306 |
Series 2010-1, 6.63% 2/1/35 | | 10,410 | | 11,575 |
Series 2010-3: | | | | |
6.725% 4/1/35 | | 1,710 | | 1,920 |
7.35% 7/1/35 | | 1,385 | | 1,645 |
Series 2011, 5.877% 3/1/19 | | 1,490 | | 1,666 |
5.1% 6/1/33 | | 4,555 | | 4,404 |
TOTAL MUNICIPAL SECURITIES (Cost $62,991) |
65,752
|
Floating Rate Loans - 0.9% |
| Principal Amount (000s) | | Value (000s) |
CONSUMER DISCRETIONARY - 0.2% |
Hotels, Restaurants & Leisure - 0.1% |
Fantasy Springs Resort Casino term loan 8/6/49 (d) | | $ 8,722 | | $ 6,803 |
Graton Economic Development Authority Tranche B, term loan 9.75% 8/22/18 (m) | | 600 | | 601 |
Landry's Restaurants, Inc. Tranche B, term loan 6.5% 4/24/18 (m) | | 2,539 | | 2,564 |
Town Sports International LLC Tranche B, term loan 5.75% 5/11/18 (m) | | 3,018 | | 3,037 |
| | 13,005 |
Media - 0.1% |
Dallas Sports & Entertainment LP term loan 3.5908% 11/18/16 (m) | | 12 | | 11 |
Houghton Mifflin Harcourt Publishing Co. term loan 7.25% 5/22/18 (m) | | 175 | | 177 |
Newsday LLC term loan 10.5% 8/1/13 | | 7,000 | | 7,009 |
RCN Telecom Services, LLC Tranche B, term loan 5.25% 8/21/16 (m) | | 505 | | 506 |
Tribune Co. Tranche X, term loan 3/17/09 (d) | | 1,188 | | 891 |
Univision Communications, Inc. term loan 4.4815% 3/31/17 (m) | | 3,024 | | 2,926 |
WideOpenWest Finance LLC Tranche B, term loan 6.25% 7/17/18 (m) | | 3,420 | | 3,424 |
| | 14,944 |
Specialty Retail - 0.0% |
Michaels Stores, Inc. Tranche B1, term loan 2.75% 10/31/13 (m) | | 4,256 | | 4,261 |
Sports Authority, Inc. Tranche B, term loan 7.5% 11/16/17 (m) | | 4,891 | | 4,829 |
| | 9,090 |
TOTAL CONSUMER DISCRETIONARY | | 37,039 |
CONSUMER STAPLES - 0.0% |
Food & Staples Retailing - 0.0% |
Sprouts Farmers Market LLC Tranche B, term loan 6% 4/18/18 (m) | | 5,930 | | 5,885 |
SUPERVALU, Inc. Tranche B, term loan 8% 8/10/19 (m) | | 2,070 | | 2,062 |
| | 7,947 |
Floating Rate Loans - continued |
| Principal Amount (000s) | | Value (000s) |
ENERGY - 0.0% |
Oil, Gas & Consumable Fuels - 0.0% |
Arch Coal, Inc. Tranche B, term loan 5.75% 5/16/18 (m) | | $ 870 | | $ 870 |
Chesapeake Energy Corp. term loan 8.5% 12/2/17 (m) | | 5,690 | | 5,697 |
Crestwood Holdings Partners LLC Tranche B, term loan 9.75% 3/26/18 (m) | | 1,656 | | 1,685 |
| | 8,252 |
FINANCIALS - 0.1% |
Insurance - 0.1% |
Asurion Corp.: | | | | |
Tranche 1st LN, term loan 5.5% 5/24/18 (m) | | 6,043 | | 6,058 |
Tranche 2nd LN, term loan 9% 5/24/19 (m) | | 2,769 | | 2,859 |
Tranche B-1 1LN, term loan 4.75% 7/23/17 (m) | | 1,285 | | 1,283 |
Lonestar Intermediate Super Holdings LLC term loan 11% 9/2/19 (m) | | 2,755 | | 2,927 |
| | 13,127 |
Real Estate Management & Development - 0.0% |
Realogy Corp.: | | | | |
Credit-Linked Deposit 4.4958% 10/10/16 (m) | | 778 | | 754 |
term loan 4.4893% 10/10/16 (m) | | 6,221 | | 6,034 |
| | 6,788 |
TOTAL FINANCIALS | | 19,915 |
HEALTH CARE - 0.0% |
Health Care Providers & Services - 0.0% |
Genoa Healthcare Group LLC Tranche 2LN, term loan 14% 2/10/15 (m) | | 2,273 | | 1,585 |
INDUSTRIALS - 0.1% |
Airlines - 0.0% |
US Airways Group, Inc. term loan 2.7355% 3/23/14 (m) | | 4,465 | | 4,342 |
Building Products - 0.0% |
HD Supply, Inc. Tranche B 1LN, term loan 7.25% 10/12/17 (m) | | 1,565 | | 1,604 |
Commercial Services & Supplies - 0.0% |
Brand Energy & Infrastructure Services, Inc. Tranche 2LN, term loan 6.325% 2/7/15 (m) | | 985 | | 906 |
Floating Rate Loans - continued |
| Principal Amount (000s) | | Value (000s) |
INDUSTRIALS - continued |
Professional Services - 0.1% |
AlixPartners LLP: | | | | |
Tranche 1LN, term loan 6.5% 6/29/19 (m) | | $ 5,250 | | $ 5,276 |
Tranche 2LN, term loan 10.75% 12/29/19 (m) | | 5,250 | | 5,237 |
| | 10,513 |
Trading Companies & Distributors - 0.0% |
Fly Funding II Sarl Tranche B, term loan 6.75% 8/8/18 (m) | | 200 | | 197 |
TOTAL INDUSTRIALS | | 17,562 |
INFORMATION TECHNOLOGY - 0.3% |
Communications Equipment - 0.1% |
Avaya, Inc. term loan 3.1769% 10/27/14 (m) | | 1,779 | | 1,703 |
SafeNet, Inc. Tranche 2LN, term loan 6.2335% 4/12/15 (m) | | 7,500 | | 7,294 |
| | 8,997 |
IT Services - 0.1% |
First Data Corp. term loan 4.2365% 3/24/18 (m) | | 12,590 | | 11,898 |
Software - 0.1% |
Kronos, Inc. Tranche B 2LN, term loan 10.4606% 6/11/18 (m) | | 23,730 | | 24,205 |
Lawson Software, Inc. Tranche B, term loan 6.25% 4/5/18 (m) | | 2,838 | | 2,873 |
| | 27,078 |
TOTAL INFORMATION TECHNOLOGY | | 47,973 |
MATERIALS - 0.0% |
Containers & Packaging - 0.0% |
Klockner Pentaplast SA Tranche B 1LN, term loan 6.75% 12/21/16 (m) | | 165 | | 165 |
TELECOMMUNICATION SERVICES - 0.1% |
Diversified Telecommunication Services - 0.0% |
FairPoint Communications, Inc. term loan 6.5% 1/24/16 (m) | | 7,508 | | 6,982 |
Telesat Holding, Inc. Tranche B, term loan 4.25% 3/28/19 (m) | | 4,285 | | 4,285 |
| | 11,267 |
Floating Rate Loans - continued |
| Principal Amount (000s) | | Value (000s) |
TELECOMMUNICATION SERVICES - continued |
Wireless Telecommunication Services - 0.1% |
Vodafone Americas Finance 2, Inc.: | | | | |
2nd LN, term loan 6.25% 6/24/16 pay-in-kind | | $ 12,741 | | $ 12,885 |
term loan 6.875% 8/11/15 | | 1,761 | | 1,828 |
| | 14,713 |
TOTAL TELECOMMUNICATION SERVICES | | 25,980 |
UTILITIES - 0.1% |
Electric Utilities - 0.1% |
Texas Competitive Electric Holdings Co. LLC/Texas Competitive Electric Holdings Finance, Inc. Tranche B, term loan 4.7685% 10/10/17 (m) | | 17,766 | | 11,881 |
Gas Utilities - 0.0% |
Everest Acquisition LLC Tranche B1, term loan 5% 4/24/18 (m) | | 730 | | 732 |
Independent Power Producers & Energy Traders - 0.0% |
LSP Madison Funding LLC Tranche 1LN, term loan 5.5% 6/28/19 (m) | | 1,575 | | 1,575 |
TOTAL UTILITIES | | 14,188 |
TOTAL FLOATING RATE LOANS (Cost $177,796) |
180,606
|
Bank Notes - 0.0% |
|
Wachovia Bank NA 6% 11/15/17
(Cost $3,313) | | 3,066 | |
3,672
|
Fixed-Income Funds - 9.8% |
| Shares | | |
Fidelity Corporate Bond 1-10 Year Central Fund (n) | 2,529,627 | | 286,809 |
Fidelity Mortgage Backed Securities Central Fund (n) | 14,912,423 | | 1,638,428 |
TOTAL FIXED-INCOME FUNDS (Cost $1,802,136) |
1,925,237
|
Money Market Funds - 4.2% |
| Shares | | Value (000s) |
Fidelity Cash Central Fund, 0.17% (b) | 782,044,537 | | $ 782,045 |
Fidelity Securities Lending Cash Central Fund, 0.18% (b)(c) | 45,921,937 | | 45,922 |
TOTAL MONEY MARKET FUNDS (Cost $827,967) |
827,967
|
TOTAL INVESTMENT PORTFOLIO - 104.2% (Cost $17,523,271) | | 20,569,069 |
NET OTHER ASSETS (LIABILITIES) - (4.2)% | | (836,370) |
NET ASSETS - 100% | $ 19,732,699 |
TBA Sale Commitments |
| Principal Amount (000s) | | |
Fannie Mae |
3% 9/1/42 | $ (173,000) | | (179,517) |
3% 9/1/42 | (11,300) | | (11,726) |
3% 9/1/42 | (2,300) | | (2,387) |
3% 9/1/42 | (11,300) | | (11,726) |
3% 9/1/42 | (174,400) | | (180,967) |
3.5% 9/1/42 | (159,000) | | (168,590) |
4% 9/1/42 | (23,900) | | (25,629) |
4.5% 9/1/42 | (26,100) | | (28,249) |
5% 9/1/42 | (30,900) | | (33,749) |
5.5% 9/1/42 | (12,000) | | (13,169) |
6% 9/1/42 | (29,000) | | (31,957) |
TOTAL FANNIE MAE | | (687,666) |
TBA Sale Commitments - continued |
| Principal Amount (000s) | | Value (000s) |
Freddie Mac |
5% 9/1/42 | $ (2,000) | | $ (2,168) |
Ginnie Mae |
3.5% 9/1/42 | (8,700) | | (9,418) |
3.5% 9/1/42 | (4,300) | | (4,655) |
4% 9/1/42 | (3,500) | | (3,839) |
TOTAL GINNIE MAE | | (17,912) |
TOTAL TBA SALE COMMITMENTS (Proceeds $705,187) | $ (707,746) |
Swap Agreements |
| Expiration Date | | Notional Amount (000s)(l) | | Value (000s) |
Credit Default Swaps |
Receive monthly a fixed rate of .15% multiplied by the notional amount and pay to Credit Suisse First Boston upon each credit event of one of the issues of ABX AA 07-01 Index, par value of the proportional notional amount (Rating-C) (Upfront Premium Received/(Paid) $2,560,000)(k) | Sept. 2037 | | $ 4,450 | | $ (4,223) |
Receive monthly a fixed rate of .15% multiplied by the notional amount and pay to JPMorgan Chase, Inc. upon each credit event of one of the issues of ABX AA 07-01 Index, par value of the proportional notional amount (Rating-C) (Upfront Premium Received/(Paid) $2,398,000)(k) | Sept. 2037 | | 3,647 | | (3,461) |
Receive monthly a fixed rate of .15% multiplied by the notional amount and pay to JPMorgan Chase, Inc. upon each credit event of one of the issues of ABX AA 07-01 Index, par value of the proportional notional amount (Rating-C) (Upfront Premium Received/(Paid) $566,000)(k) | Sept. 2037 | | 837 | | (794) |
Receive monthly a fixed rate of .15% multiplied by the notional amount and pay to Morgan Stanley, Inc. upon each credit event of one of the issues of ABX AA 07-01 Index, par value of the proportional notional amount (Rating-C) (Upfront Premium Received/(Paid) $2,398,000)(k) | Sept. 2037 | | 3,647 | | (3,461) |
| Expiration Date | | Notional Amount (000s)(l) | | Value (000s) |
Credit Default Swaps |
Receive monthly a fixed rate of .15% multiplied by the notional amount and pay to UBS upon each credit event of one of the issues of ABX AA 07-1 Index, par value of the proportional notional amount (Rating-C) (Upfront Premium Received/(Paid) $2,332,000)(k) | Sept. 2037 | | $ 3,547 | | $ (3,366) |
Receive monthly a fixed rate of .15% multiplied by the notional amount and pay to UBS upon each credit event of one of the issues of ABX AA 07-1 Index, par value of the proportional notional amount (Rating-C) (Upfront Premium Received/(Paid) $2,025,000)(k) | Sept. 2037 | | 3,045 | | (2,890) |
| | $ 19,173 | | $ (18,195) |
Legend |
(a) Non-income producing |
(b) Affiliated fund that is available only to investment companies and other accounts managed by Fidelity Investments. The rate quoted is the annualized seven-day yield of the fund at period end. A complete unaudited listing of the fund's holdings as of its most recent quarter end is available upon request. In addition, each Fidelity Central Fund's financial statements, which are not covered by the Fund's Report of Independent Registered Public Accounting Firm, are available on the SEC's website or upon request. |
(c) Investment made with cash collateral received from securities on loan. |
(d) Non-income producing - Security is in default. |
(e) Security initially issued at one coupon which converts to a higher coupon at a specified date. The rate shown is the rate at period end. |
(f) Security or a portion of the security is on loan at period end. |
(g) Affiliated company |
(h) Security exempt from registration under Rule 144A of the Securities Act of 1933. These securities may be resold in transactions exempt from registration, normally to qualified institutional buyers. At the end of the period, the value of these securities amounted to $660,076,000 or 3.3% of net assets. |
(i) Security or a portion of the security purchased on a delayed delivery or when-issued basis. |
(j) Security or a portion of the security has been segregated as collateral for open swap agreements. At the period end, the value of securities pledged amounted to $22,557,000. |
(k) Represents a credit default swap contract in which the Fund has sold protection on the underlying reference. The underlying reference may be a single-name issuer or a traded credit index. The value of each credit default swap and the credit rating can be measures of the current payment/performance risk. For the underlying reference, ratings disclosed are from Moody's Investors Service, Inc. Where Moody's ratings are not available, S&P ratings are disclosed and are indicated as such. For swaps on a traded credit index, ratings represent a weighted average of the ratings of all securities included in the index. All ratings are as of the report date and do not reflect subsequent changes. Where a credit rating is not disclosed, the value is used as the measure of the payment/performance risk. |
(l) The notional amount of each credit default swap where the Fund has sold protection approximates the maximum potential amount of future payments that the Fund could be required to make if a credit event were to occur. |
(m) Coupon rates for floating and adjustable rate securities reflect the rates in effect at period end. |
(n) Affiliated fund that is available only to investment companies and other accounts managed by Fidelity Investments. A complete unaudited schedule of portfolio holdings for each Fidelity Central Fund is filed with the SEC for the first and third quarters of each fiscal year on Form N-Q and is available upon request or at the SEC's web site at www.sec.gov. An unaudited holdings listing for the Fund, which presents direct holdings as well as the pro rata share of securities and other investments held indirectly through its investment in underlying non-money market Fidelity Central Funds, is available at fidelity.com. In addition, each Fidelity Central Fund's financial statements, which are not covered by the Fund's Report of Independent Registered Public Accounting Firm, are available on the SEC's web site or upon request. |
(o) Security represents right to receive monthly interest payments on an underlying pool of mortgages or assets. Principal shown is the outstanding par amount of the pool as of the end of the period. |
(p) Investment is owned by an entity that is treated as a corporation for U.S. tax purposes which is owned by the Fund. |
(q) Restricted securities - Investment in securities not registered under the Securities Act of 1933 (excluding 144A issues). At the end of the period, the value of restricted securities (excluding 144A issues) amounted to $130,053,000 or 0.7% of net assets. |
Additional information on each restricted holding is as follows: |
Security | Acquisition Date | Acquisition Cost (000s) |
Aspen Aerogels, Inc. 8% 6/1/14 | 6/1/11 | $ 10,000 |
Aspen Aerogels, Inc. 8% 12/6/14 | 12/6/11 - 6/12/12 | $ 3,000 |
Facebook, Inc. Class B | 3/31/11 - 5/19/11 | $ 22,038 |
HMH Holdings, Inc. warrants 6/22/19 | 6/22/12 | $ 4 |
Ivanplats Ltd. 8% 11/10/14 pay-in-kind | 3/28/12 | $ 12,688 |
Legend Pictures LLC | 9/23/10 - 3/30/12 | $ 37,645 |
Station Holdco LLC | 6/17/11 | $ 1,131 |
Station Holdco LLC warrants 6/15/18 | 8/11/08 - 8/15/08 | $ 6,416 |
Vice Holdings, Inc. | 8/3/12 | $ 34,999 |
wetpaint.com, Inc. Series C | 5/14/08 | $ 5,000 |
* Amount represents less than $1,000. |
Affiliated Central Funds |
Information regarding fiscal year to date income earned by the Fund from investments in Fidelity Central Funds is as follows: |
Fund | Income earned
(Amounts in thousands) |
Fidelity Cash Central Fund | $ 1,119 |
Fidelity Corporate Bond 1-10 Year Central Fund | 11,910 |
Fidelity Mortgage Backed Securities Central Fund | 36,099 |
Fidelity Securities Lending Cash Central Fund | 2,162 |
Total | $ 51,290 |
Additional information regarding the Fund's fiscal year to date purchases and sales, including the ownership percentage, of the non Money Market Central Funds is as follows: |
Fund
(Amounts in thousands) | Value, beginning of period | Purchases | Sales Proceeds | Value,
end of
period | % ownership, end of
period |
Fidelity Corporate Bond 1-10 Year Central Fund | $ 277,955 | $ - | $ - | $ 286,809 | 41.7% |
Fidelity Mortgage Backed Securities Central Fund | 1,146,867 | 470,325 | - | 1,638,428 | 10.5% |
Total | $ 1,424,822 | $ 470,325 | $ - | $ 1,925,237 | |
Other Affiliated Issuers |
An affiliated company is a company in which the Fund has ownership of at least 5% of the voting securities. Fiscal year to date transactions with companies which are or were affiliates are as follows: |
Affiliate
(Amounts in thousands) | Value, beginning of period | Purchases | Sales Proceeds | Dividend Income | Value,
end of
period |
AMAG Pharmaceuticals, Inc. | $ 19,625 | $ 5,149 | $ 3,815 | $ - | $ 21,602 |
CareView Communications, Inc. | 14,652 | 376 | - | - | 10,530 |
Neurocrine Biosciences, Inc. | 22,913 | - | - | - | 27,540 |
TherapeuticsMD, Inc. | - | 11,260 | - | - | 18,645 |
Total | $ 57,190 | $ 16,785 | $ 3,815 | $ - | $ 78,317 |
Other Information |
The following is a summary of the inputs used, as of August 31, 2012, involving the Fund's assets and liabilities carried at fair value. The inputs or methodology used for valuing securities may not be an indication of the risk associated with investing in those securities. For more information on valuation inputs, and their aggregation into the levels used in the table below, please refer to the Security Valuation section in the accompanying Notes to Financial Statements. |
Valuation Inputs at Reporting Date: |
Description
(Amounts in thousands) | Total | Level 1 | Level 2 | Level 3 |
Investments in Securities: | | | | |
Equities: | | | | |
Consumer Discretionary | $ 1,588,696 | $ 1,474,798 | $ 24,496 | $ 89,402 |
Consumer Staples | 1,607,389 | 1,543,266 | 64,123 | - |
Energy | 1,327,286 | 1,327,286 | - | - |
Financials | 1,453,806 | 1,430,417 | 10,786 | 12,603 |
Health Care | 1,634,022 | 1,634,022 | - | - |
Industrials | 940,337 | 940,300 | - | 37 |
Information Technology | 2,837,131 | 2,821,797 | 14,340 | 994 |
Materials | 364,789 | 364,789 | - | - |
Telecommunication Services | 120,771 | 120,771 | - | - |
Utilities | 288,481 | 282,549 | 5,932 | - |
Investment Companies | 1,509 | - | 1,509 | - |
Corporate Bonds | 2,233,066 | - | 2,207,279 | 25,787 |
U.S. Government and Government Agency Obligations | 1,044,155 | - | 1,044,155 | - |
U.S. Government Agency - Mortgage Securities | 1,700,756 | - | 1,700,756 | - |
Asset-Backed Securities | 49,433 | - | 43,973 | 5,460 |
Collateralized Mortgage Obligations | 36,572 | - | 35,330 | 1,242 |
Commercial Mortgage Securities | 337,636 | - | 317,296 | 20,340 |
Municipal Securities | 65,752 | - | 65,752 | - |
Floating Rate Loans | 180,606 | - | 173,792 | 6,814 |
Bank Notes | 3,672 | - | 3,672 | - |
Fixed-Income Funds | 1,925,237 | 1,925,237 | - | - |
Money Market Funds | 827,967 | 827,967 | - | - |
Total Investments in Securities: | $ 20,569,069 | $ 14,693,199 | $ 5,713,191 | $ 162,679 |
Derivative Instruments: | | | | |
Liabilities | | | | |
Swap Agreements | $ (18,195) | $ - | $ (18,195) | $ - |
Other Financial Instruments: | | | | |
TBA Sale Commitments | $ (707,746) | $ - | $ (707,746) | $ - |
Value of Derivative Instruments |
The following table is a summary of the Fund's value of derivative instruments by primary risk exposure as of August 31, 2012. For additional information on derivative instruments, please refer to the Derivative Instruments section in the accompanying Notes to Financial Statements. |
Primary Risk Exposure /
Derivative Type
(Amounts in thousands) | Value |
| Asset | Liability |
Credit Risk | | |
Swap Agreements (a) | $ - | $ (18,195) |
Total Value of Derivatives | $ - | $ (18,195) |
(a) Value is disclosed on the Statement of Assets and Liabilities in the Swap agreements, at value line-items. |
Other Information |
The composition of credit quality ratings as a percentage of net assets is as follows (Unaudited): |
U.S. Government and U.S. Government Agency Obligations | 18.8% |
AAA,AA,A | 4.6% |
BBB | 6.0% |
BB | 2.1% |
B | 1.7% |
CCC,CC,C | 1.1% |
D | 0.0% |
Not Rated | 0.4% |
Equities | 61.6% |
Short-Term Investments and
Net Other Assets | 3.7% |
| 100.0% |
We have used ratings from Moody's Investors Service, Inc. Where Moody's® ratings are not available, we have used S&P® ratings. All ratings are as of the date indicated and do not reflect subsequent changes. |
The information in the above table is based on the combined investments of the Fund and its pro-rata share of the investments of Fidelity's fixed-income central funds. |
See accompanying notes which are an integral part of the financial statements.
Annual Report
Statement of Assets and Liabilities
Amounts in thousands (except per-share amounts) | August 31, 2012 |
| | |
Assets | | |
Investment in securities, at value (including securities loaned of $44,732) - See accompanying schedule: Unaffiliated issuers (cost $14,821,535) | $ 17,737,548 | |
Fidelity Central Funds (cost $2,630,103) | 2,753,204 | |
Other affiliated issuers (cost $71,633) | 78,317 | |
Total Investments (cost $17,523,271) | | $ 20,569,069 |
Cash | | 43 |
Foreign currency held at value (cost $1,399) | | 1,399 |
Receivable for investments sold, regular delivery | | 598,055 |
Receivable for TBA sale commitments | | 705,187 |
Receivable for swap agreements | | 3 |
Receivable for fund shares sold | | 10,505 |
Dividends receivable | | 24,123 |
Interest receivable | | 44,702 |
Distributions receivable from Fidelity Central Funds | | 1,329 |
Other receivables | | 941 |
Total assets | | 21,955,356 |
| | |
Liabilities | | |
Payable for investments purchased
Regular delivery | $ 192,221 | |
Delayed delivery | 1,233,690 | |
TBA sale commitments, at value | 707,746 | |
Payable for swap agreements | 2,146 | |
Payable for fund shares redeemed | 12,596 | |
Swap agreements, at value | 18,195 | |
Accrued management fee | 6,667 | |
Other affiliated payables | 2,429 | |
Other payables and accrued expenses | 1,045 | |
Collateral on securities loaned, at value | 45,922 | |
Total liabilities | | 2,222,657 |
| | |
Net Assets | | $ 19,732,699 |
Net Assets consist of: | | |
Paid in capital | | $ 16,554,137 |
Undistributed net investment income | | 84,879 |
Accumulated undistributed net realized gain (loss) on investments and foreign currency transactions | | 67,926 |
Net unrealized appreciation (depreciation) on investments and assets and liabilities in foreign currencies | | 3,025,757 |
Net Assets | | $ 19,732,699 |
See accompanying notes which are an integral part of the financial statements.
Annual Report
Statement of Assets and Liabilities - continued
Amounts in thousands (except per-share amounts) | August 31, 2012 |
| | |
Puritan:
Net Asset Value, offering price and redemption price per share ($15,471,548 ÷ 792,374 shares) | | $ 19.53 |
| | |
Class K:
Net Asset Value, offering price and redemption price per share ($4,261,151 ÷ 218,259 shares) | | $ 19.52 |
See accompanying notes which are an integral part of the financial statements.
Annual Report
Financial Statements - continued
Statement of Operations
Amounts in thousands | Year ended August 31, 2012 |
| | |
Investment Income | | |
Dividends | | $ 203,278 |
Interest | | 242,508 |
Income from Fidelity Central Funds | | 51,290 |
Total income | | 497,076 |
| | |
Expenses | | |
Management fee | $ 77,419 | |
Transfer agent fees | 27,370 | |
Accounting and security lending fees | 1,950 | |
Custodian fees and expenses | 348 | |
Independent trustees' compensation | 126 | |
Appreciation in deferred trustee compensation account | 1 | |
Registration fees | 242 | |
Audit | 274 | |
Legal | 96 | |
Miscellaneous | 195 | |
Total expenses before reductions | 108,021 | |
Expense reductions | (673) | 107,348 |
Net investment income (loss) | | 389,728 |
Realized and Unrealized Gain (Loss) Net realized gain (loss) on: | | |
Investment securities: | | |
Unaffiliated issuers | 268,271 | |
Other affiliated issuers | (84) | |
Foreign currency transactions | 30 | |
Swap agreements | (13,193) | |
Total net realized gain (loss) | | 255,024 |
Change in net unrealized appreciation (depreciation) on: Investment securities (net of decrease in deferred foreign taxes of $33) | 1,557,843 | |
Assets and liabilities in foreign currencies | (28) | |
Swap agreements | 12,333 | |
Delayed delivery commitments | (4,457) | |
Total change in net unrealized appreciation (depreciation) | | 1,565,691 |
Net gain (loss) | | 1,820,715 |
Net increase (decrease) in net assets resulting from operations | | $ 2,210,443 |
See accompanying notes which are an integral part of the financial statements.
Annual Report
Statement of Changes in Net Assets
Amounts in thousands | Year ended
August 31,
2012 | Year ended
August 31,
2011 |
Increase (Decrease) in Net Assets | | |
Operations | | |
Net investment income (loss) | $ 389,728 | $ 385,230 |
Net realized gain (loss) | 255,024 | 1,644,208 |
Change in net unrealized appreciation (depreciation) | 1,565,691 | 482,668 |
Net increase (decrease) in net assets resulting
from operations | 2,210,443 | 2,512,106 |
Distributions to shareholders from net investment income | (364,135) | (395,907) |
Distributions to shareholders from net realized gain | - | (3,264) |
Total distributions | (364,135) | (399,171) |
Share transactions - net increase (decrease) | (743,799) | (816,545) |
Total increase (decrease) in net assets | 1,102,509 | 1,296,390 |
| | |
Net Assets | | |
Beginning of period | 18,630,190 | 17,333,800 |
End of period (including undistributed net investment income of $84,879 and undistributed net investment income of $87,615, respectively) | $ 19,732,699 | $ 18,630,190 |
See accompanying notes which are an integral part of the financial statements.
Annual Report
Financial Highlights - Puritan
Years ended August 31, | 2012 | 2011 | 2010 | 2009 | 2008 |
Selected Per-Share Data | | | | | |
Net asset value, beginning of period | $ 17.72 | $ 15.81 | $ 15.06 | $ 17.07 | $ 20.54 |
Income from Investment Operations | | | | | |
Net investment income (loss) B | .38 | .35 | .40 | .45 | .50 |
Net realized and unrealized gain (loss) | 1.78 | 1.93 | .75 | (2.00) | (1.80) |
Total from investment operations | 2.16 | 2.28 | 1.15 | (1.55) | (1.30) |
Distributions from net investment income | (.35) | (.36) | (.39) | (.44) | (.55) |
Distributions from net realized gain | - | - F | (.01) | (.02) | (1.62) |
Total distributions | (.35) | (.37) H | (.40) | (.46) G | (2.17) |
Net asset value, end of period | $ 19.53 | $ 17.72 | $ 15.81 | $ 15.06 | $ 17.07 |
Total Return A | 12.35% | 14.38% | 7.61% | (8.76)% | (7.35)% |
Ratios to Average Net Assets C,E | | | | |
Expenses before reductions | .59% | .60% | .61% | .67% | .61% |
Expenses net of fee waivers, if any | .59% | .60% | .61% | .67% | .61% |
Expenses net of all reductions | .59% | .59% | .61% | .67% | .60% |
Net investment income (loss) | 2.03% | 1.96% | 2.48% | 3.30% | 2.72% |
Supplemental Data | | | | | |
Net assets, end of period (in millions) | $ 15,472 | $ 15,420 | $ 15,054 | $ 16,111 | $ 21,427 |
Portfolio turnover rate D | 141% | 154% I | 104% | 116% I | 115% |
A Total returns would have been lower if certain expenses had not been reduced during the applicable periods shown.
B Calculated based on average shares outstanding during the period.
C Fees and expenses of any underlying Fidelity Central Funds are not included in the Fund's expense ratio. The Fund indirectly bears its proportionate share of the expenses of any underlying Fidelity Central Funds.
D Amount does not include the portfolio activity of any underlying Fidelity Central Funds.
E Expense ratios reflect operating expenses of the class. Expenses before reductions do not reflect amounts reimbursed by the investment adviser or reductions from brokerage service arrangements or reductions from other expense offset arrangements and do not represent the amount paid by the class during periods when reimbursements or reductions occur. Expenses net of fee waivers reflect expenses after reimbursement by the investment adviser but prior to reductions from brokerage service arrangements or other expense offset arrangements. Expenses net of all reductions represent the net expenses paid by the class.
F Amount represents less than $.01 per share.
G Total distributions of $.46 per share is comprised of distributions from net investment income of $.442 and distributions from net realized gain of $.015 per share.
H Total distributions of $.37 per share is comprised of distributions from net investment income of $.364 and distributions from net realized gain of $.003 per share.
I The portfolio turnover rate excludes liquidations and/or redemptions executed in-kind from Affiliated Central Funds.
See accompanying notes which are an integral part of the financial statements.
Annual Report
Financial Highlights - Class K
Years ended August 31, | 2012 | 2011 | 2010 | 2009 | 2008 G |
Selected Per-Share Data | | | | | |
Net asset value, beginning of period | $ 17.72 | $ 15.80 | $ 15.06 | $ 17.07 | $ 18.22 |
Income from Investment Operations | | | | | |
Net investment income (loss) D | .40 | .38 | .42 | .46 | .14 |
Net realized and unrealized gain (loss) | 1.77 | 1.93 | .74 | (1.99) | (1.16) |
Total from investment operations | 2.17 | 2.31 | 1.16 | (1.53) | (1.02) |
Distributions from net investment income | (.37) | (.39) | (.41) | (.47) | (.13) |
Distributions from net realized gain | - | - I | (.01) | (.02) | - |
Total distributions | (.37) | (.39) | (.42) | (.48) J | (.13) |
Net asset value, end of period | $ 19.52 | $ 17.72 | $ 15.80 | $ 15.06 | $ 17.07 |
Total Return B,C | 12.43% | 14.59% | 7.69% | (8.59)% | (5.60)% |
Ratios to Average Net Assets E,H | | | | | |
Expenses before reductions | .48% | .48% | .48% | .50% | .48% A |
Expenses net of fee waivers, if any | .48% | .48% | .48% | .50% | .48% A |
Expenses net of all reductions | .47% | .47% | .47% | .50% | .48% A |
Net investment income (loss) | 2.15% | 2.09% | 2.61% | 3.47% | 3.21% A |
Supplemental Data | | | | | |
Net assets, end of period (in millions) | $ 4,261 | $ 3,211 | $ 2,280 | $ 1,469 | $ 9 |
Portfolio turnover rate F | 141% | 154% K | 104% | 116% K | 115% |
A Annualized
B Total returns for periods of less than one year are not annualized.
C Total returns would have been lower if certain expenses had not been reduced during the applicable periods shown.
D Calculated based on average shares outstanding during the period.
E Fees and expenses of any underlying Fidelity Central Funds are not included in the Fund's expense ratio. The Fund indirectly bears its proportionate share of the expenses of any underlying Fidelity Central Funds.
F Amount does not include the portfolio activity of any underlying Fidelity Central Funds.
G For the period May 9, 2008 (commencement of sale of shares) to August 31, 2008.
H Expense ratios reflect operating expenses of the class. Expenses before reductions do not reflect amounts reimbursed by the investment adviser or reductions from brokerage service arrangements or reductions from other expense offset arrangements and do not represent the amount paid by the class during periods when reimbursements or reductions occur. Expense ratios before reductions for start-up periods may not be representative of longer-term operating periods. Expenses net of fee waivers reflect expenses after reimbursement by the investment adviser but prior to reductions from brokerage service arrangements or other expense offset arrangements. Expenses net of all reductions represent the net expenses paid by the class.
I Amount represents less than $.01 per share.
J Total distributions of $.48 per share is comprised of distributions from net investment income of $.468 and distributions from net realized gain of $.015 per share.
K The portfolio turnover rate excludes liquidations and/or redemptions executed in-kind from Affiliated Central Funds.
See accompanying notes which are an integral part of the financial statements.
Annual Report
Notes to Financial Statements
For the period ended August 31, 2012
(Amounts in thousands except percentages)
1. Organization.
Fidelity Puritan Fund (the Fund) is a fund of Fidelity Puritan Trust (the Trust) and is authorized to issue an unlimited number of shares. The Trust is registered under the Investment Company Act of 1940, as amended (the 1940 Act), as an open-end management investment company organized as a Massachusetts business trust. The Fund offers Puritan and Class K shares, each of which has equal rights as to assets and voting privileges. Each class has exclusive voting rights with respect to matters that affect that class. Investment income, realized and unrealized capital gains and losses, the common expenses of the Fund, and certain fund-level expense reductions, if any, are allocated on a pro-rata basis to each class based on the relative net assets of each class to the total net assets of the Fund. Each class differs with respect to transfer agent fees incurred. Certain expense reductions may also differ by class.
2. Investments in Fidelity Central Funds.
The Fund invests in Fidelity Central Funds, which are open-end investment companies available only to other investment companies and accounts managed by Fidelity Management & Research Company (FMR) and its affiliates. The Fund's Schedule of Investments lists each of the Fidelity Central Funds held as of period end, if any, as an investment of the Fund, but does not include the underlying holdings of each Fidelity Central Fund. As an Investing Fund, the Fund indirectly bears its proportionate share of the expenses of the underlying Fidelity Central Funds.
Based on its investment objective, each Fidelity Central Fund may invest or participate in various investment vehicles or strategies that are similar to those of the Fund. These strategies are consistent with the investment objectives of the Fund and may involve certain economic risks which may cause a decline in value of each of the Fidelity Central Funds and thus a decline in the value of the Fund. The Money Market Central Funds seek preservation of capital and current income and are managed by Fidelity Investments Money Management, Inc. (FIMM), an affiliate of FMR. The following summarizes the Fund's investment in each non-money market Fidelity Central Fund.
Annual Report
2. Investments in Fidelity Central Funds - continued
Fidelity Central Fund | Investment Manager | Investment Objective | Investment Practices |
Fidelity Corporate Bond 1-10 Year Central Fund | FIMM | Seeks a high level of income by normally investing in investment-grade corporate bonds and other corporate debt securities and repurchase agreements for those securities. | Repurchase Agreements Restricted Securities |
Fidelity Mortgage Backed Securities Central Fund | FIMM | Seeks a high level of income by normally investing in investment-grade mortgage-related securities and repurchase agreements for those securities. | Delayed Delivery & When Issued Securities Futures Repurchase Agreements Swap Agreements |
An unaudited holdings listing for the Fund, which presents direct holdings as well as the pro-rata share of any securities and other investments held indirectly through its investment in underlying non-money market Fidelity Central Funds, is available at fidelity.com. A complete unaudited list of holdings for each Fidelity Central Fund is available upon request or at the Securities and Exchange Commission (the SEC) web site at www.sec.gov. In addition, the financial statements of the Fidelity Central Funds which contain the significant accounting policies (including security valuation policies) of those funds, which are not covered by the Fund's Report of Independent Registered Public Accounting Firm, are available on the SEC web site or upon request.
3. Significant Accounting Policies.
The financial statements have been prepared in conformity with accounting principles generally accepted in the United States of America (GAAP), which require management to make certain estimates and assumptions at the date of the financial statements. Actual results could differ from those estimates. Subsequent events, if any, through the date that the financial statements were issued have been evaluated in the preparation of the financial statements. The following summarizes the significant accounting policies of the Fund:
Security Valuation. Investments are valued as of 4:00 p.m. Eastern time on the last calendar day of the period. In accordance with valuation policies and procedures approved by the Board of Trustees (the Board), the Fund attempts to obtain prices from
Annual Report
Notes to Financial Statements - continued
(Amounts in thousands except percentages)
3. Significant Accounting Policies - continued
Security Valuation - continued
one or more third party pricing vendor or broker to value its investments. When current market prices, quotations or rates are not readily available or reliable, securities will be fair valued in good faith by the FMR Fair Value Committee (the Committee), in accordance with procedures adopted by the Fund's Board. Factors used in determining fair value vary by security type and may include market or security specific events, changes in interest rates and credit quality. The frequency with which these procedures are used cannot be predicted and they may be utilized to a significant extent. The Committee oversees the Fund's valuation policies and procedures and is responsible for approving and reporting to the Board all fair value determinations.
The Fund categorizes the inputs to valuation techniques used to value its investments into a disclosure hierarchy consisting of three levels as shown below:
Level 1 - quoted prices in active markets for identical investments
Level 2 - other significant observable inputs (including quoted prices for similar investments, interest rates, prepayment speeds, etc.)
Level 3 - unobservable inputs (including the Fund's own assumptions based on the best information available)
Valuation techniques used to value the Fund's investments by major category are as follows:
Equity securities, including restricted securities, for which market quotations are readily available, are valued at the last reported sale price or official closing price as reported by a third party pricing vendor on the primary market or exchange on which they are traded and are categorized as Level 1 in the hierarchy. In the event there were no sales during the day or closing prices are not available, securities are valued at the last quoted bid price or may be valued using the last available price and are generally categorized as Level 2 in the hierarchy. For foreign equity securities, when significant market or security specific events arise, comparisons to the valuation of American Depositary Receipts (ADRs), futures contracts, Exchange-Traded Funds (ETFs) and certain indexes as well as quoted prices for similar securities are used and are categorized as Level 2 in the hierarchy. Utilizing these techniques may result in transfers between Level 1 and Level 2. For restricted equity securities and private placements where observable inputs are limited, assumptions about market activity and risk are used and these securities are categorized as Level 3 in the hierarchy.
Debt securities, including restricted securities, are valued based on evaluated prices received from third party pricing vendors or from brokers who make markets in such
Annual Report
3. Significant Accounting Policies - continued
Security Valuation - continued
securities. For corporate bonds, bank notes, floating rate loans, municipal securities and U.S. government and government agency obligations, pricing vendors utilize matrix pricing which considers yield or price of bonds of comparable quality, coupon, maturity and type as well as broker-supplied prices and are generally categorized as Level 2 in the hierarchy. For asset backed securities, collateralized mortgage obligations, commercial mortgage securities and U.S. government agency mortgage securities, pricing vendors utilize matrix pricing which considers prepayment speed assumptions, attributes of the collateral, yield or price of bonds of comparable quality, coupon, maturity and type as well as broker-supplied prices and, accordingly, such securities are generally categorized as Level 2 in the hierarchy. Swaps are marked-to-market daily based on valuations from third party pricing vendors or broker-supplied valuations and changes in value are recorded as unrealized appreciation (depreciation). Pricing vendors utilize matrix pricing which considers comparisons to interest rate curves, credit spread curves, default possibilities and recovery rates and, as a result, swaps are generally categorized as Level 2 in the hierarchy. When independent prices are unavailable or unreliable, debt securities and swaps may be valued utilizing pricing methodologies which consider similar factors that would be used by third party pricing vendors. These are generally categorized as Level 2 in the hierarchy but may be Level 3 depending on the circumstances.
Investments in open-end mutual funds, including the Fidelity Central Funds, are valued at their closing net asset value each business day and are categorized as Level 1 in the hierarchy.
Changes in valuation techniques may result in transfers in or out of an assigned level within the disclosure hierarchy. The aggregate value of investments by input level, as of August 31, 2012, is included at the end of the Fund's Schedule of Investments.
Foreign Currency Translation. The Fund may use foreign currency contracts to facilitate transactions in foreign-denominated securities. Gains and losses from these transactions may arise from changes in the value of the foreign currency or if the counterparties do not perform under the contracts' terms.
Foreign-denominated assets, including investment securities, and liabilities are translated into U.S. dollars at the exchange rates at period end. Purchases and sales of investment securities, income and dividends received and expenses denominated in foreign currencies are translated into U.S. dollars at the exchange rate in effect on the transaction date.
The effects of exchange rate fluctuations on investments are included with the net realized and unrealized gain (loss) on investment securities. Other foreign currency transactions resulting in realized and unrealized gain (loss) are disclosed separately.
Annual Report
Notes to Financial Statements - continued
(Amounts in thousands except percentages)
3. Significant Accounting Policies - continued
Investment Transactions and Income. For financial reporting purposes, the Fund's investment holdings and NAV include trades executed through the end of the last business day of the period. The NAV per share for processing shareholder transactions is calculated as of the close of business of the New York Stock Exchange (NYSE), normally 4:00 p.m. Eastern time and includes trades executed through the end of the prior business day. Gains and losses on securities sold are determined on the basis of identified cost and may include proceeds received from litigation. Dividend income is recorded on the ex-dividend date, except for certain dividends from foreign securities where the ex-dividend date may have passed, which are recorded as soon as the Fund is informed of the ex-dividend date. Non-cash dividends included in dividend income, if any, are recorded at the fair market value of the securities received. Distributions received on securities that represent a return of capital or capital gain are recorded as a reduction of cost of investments and/or as a realized gain. The Fund estimates the components of distributions received that may be considered return of capital distributions or capital gain distributions. Interest income and distributions from the Fidelity Central Funds are accrued as earned. Interest income includes coupon interest and amortization of premium and accretion of discount on debt securities. The principal amount on inflation-indexed securities is periodically adjusted to the rate of inflation and interest is accrued based on the principal amount. The adjustments to principal due to inflation are reflected as increases or decreases to interest income even though principal is not received until maturity. Investment income is recorded net of foreign taxes withheld where recovery of such taxes is uncertain. Debt obligations may be placed on non-accrual status and related interest income may be reduced by ceasing current accruals and writing off interest receivables when the collection of all or a portion of interest has become doubtful based on consistently applied procedures. A debt obligation is removed from non-accrual status when the issuer resumes interest payments or when collectability of interest is reasonably assured.
Expenses. Expenses directly attributable to a fund are charged to that fund. Expenses attributable to more than one fund are allocated among the respective funds on the basis of relative net assets or other appropriate methods. Expense estimates are accrued in the period to which they relate and adjustments are made when actual amounts are known.
Deferred Trustee Compensation. Under a Deferred Compensation Plan (the Plan), independent Trustees may elect to defer receipt of a portion of their annual compensation. Deferred amounts are invested in a cross-section of Fidelity funds, are marked-to-market and remain in the Fund until distributed in accordance with the Plan. The investment of deferred amounts and the offsetting payable to the Trustees are included in the accompanying Statement of Assets and Liabilities.
Annual Report
3. Significant Accounting Policies - continued
Income Tax Information and Distributions to Shareholders. Each year, the Fund intends to qualify as a regulated investment company under Subchapter M of the Internal Revenue Code, including distributing substantially all of its taxable income and realized gains. As a result, no provision for income taxes is required. As of August 31, 2012, the Fund did not have any unrecognized tax benefits in the financial statements; nor is the Fund aware of any tax positions for which it is reasonably possible that the total amounts of unrecognized tax benefits will significantly change in the next twelve months. The Fund files a U.S. federal tax return, in addition to state and local tax returns as required. A fund's federal income tax returns are subject to examination by the Internal Revenue Service (IRS) for a period of three fiscal years after they are filed. State and local tax returns may be subject to examination for an additional fiscal year depending on the jurisdiction. Foreign taxes are provided for based on the Fund's understanding of the tax rules and rates that exist in the foreign markets in which it invests.
Distributions are declared and recorded on the ex-dividend date. Income dividends and capital gain distributions are declared separately for each class. Income and capital gain distributions are determined in accordance with income tax regulations, which may differ from GAAP. In addition, the Fund claimed a portion of the payment made to redeeming shareholders as a distribution for income tax purposes.
Capital accounts within the financial statements are adjusted for permanent book-tax differences. These adjustments have no impact on net assets or the results of operations. Temporary book-tax differences will reverse in a subsequent period.
Book-tax differences are primarily due to swap agreements, foreign currency transactions, market discount, equity debt classifications, partnerships (including allocations from Fidelity Central Funds), deferred trustee compensation, capital loss carryforwards and losses deferred due to wash sales.
The federal tax cost of investment securities and unrealized appreciation (depreciation) as of period end were as follows:
Gross unrealized appreciation | $ 3,204,307 |
Gross unrealized depreciation | (296,948) |
Net unrealized appreciation (depreciation) on securities and other investments | $ 2,907,359 |
| |
Tax Cost | $ 17,661,710 |
Annual Report
Notes to Financial Statements - continued
(Amounts in thousands except percentages)
3. Significant Accounting Policies - continued
Income Tax Information and Distributions to Shareholders - continued
The tax-based components of distributable earnings as of period end were as follows:
Undistributed ordinary income | $ 56,935 |
Undistributed long-term capital gain | $ 235,182 |
Net unrealized appreciation (depreciation) | $ 2,887,319 |
The tax character of distributions paid was as follows:
| August 31, 2012 | August 31, 2011 |
Ordinary Income | $ 364,135 | $ 399,171 |
New Accounting Pronouncement. In December 2011, the Financial Accounting Standards Board issued Accounting Standard Update No. 2011-11, Disclosures about Offsetting Assets and Liabilities. The update creates new disclosure requirements requiring entities to disclose both gross and net information for derivatives and other financial instruments that are either offset in the Statement of Assets and Liabilities or subject to an enforceable master netting arrangement or similar agreement. The disclosure requirements are effective for annual reporting periods beginning on or after January 1, 2013, and interim periods within those annual periods. Management is currently evaluating the impact of the update's adoption on the Fund's financial statement disclosures.
4. Operating Policies.
Delayed Delivery Transactions and When-Issued Securities. During the period, the Fund transacted in securities on a delayed delivery or when-issued basis. Payment and delivery may take place after the customary settlement period for that security. The price of the underlying securities and the date when the securities will be delivered and paid for are fixed at the time the transaction is negotiated. The securities purchased on a delayed delivery or when-issued basis are identified as such in the Fund's Schedule of Investments. The Fund may receive compensation for interest forgone in the purchase of a delayed delivery or when-issued security. With respect to purchase commitments, the Fund identifies securities as segregated in its records with a value at least equal to the amount of the commitment. Losses may arise due to changes in the value of the underlying securities or if the counterparty does not perform under the contract's terms, or if the issuer does not issue the securities due to political, economic, or other factors.
To-Be-Announced (TBA) Securities and Mortgage Dollar Rolls. During the period, the Fund transacted in TBA securities that involved buying or selling mortgage-backed securities (MBS) on a forward commitment basis. A TBA transaction typically does not designate the actual security to be delivered and only includes an approximate principal amount however; delivered securities must meet specified terms defined by industry
Annual Report
4. Operating Policies - continued
To-Be-Announced (TBA) Securities and Mortgage Dollar Rolls - continued
guidelines, including issuer, rate and current principal amount outstanding on underlying mortgage pools. The Fund may enter into a TBA transaction with the intent to take possession of or deliver the underlying MBS, or the Fund may elect to extend the settlement by entering into either a mortgage or reverse mortgage dollar roll. Mortgage dollar rolls are transactions where a fund sells TBA securities and simultaneously agrees to repurchase MBS on a later date at a lower price and with the same counterparty. Reverse mortgage dollar rolls involve the purchase and simultaneous agreement to sell TBA securities on a later date at a lower price. Transactions in mortgage dollar rolls and reverse mortgage dollar rolls are accounted for as purchases and sales and may result in an increase to the Fund's portfolio turnover rate.
Purchases and sales of TBA securities involve risks similar to those discussed above for delayed delivery and when-issued securities. Also, if the counterparty in a mortgage dollar roll or a reverse mortgage dollar roll transaction files for bankruptcy or becomes insolvent, the Fund's right to repurchase or sell securities may be limited. Additionally, when a fund sells TBA securities without already owning or having the right to obtain the deliverable securities (an uncovered forward commitment to sell), it incurs a risk of loss because it could have to purchase the securities at a price that is higher than the price at which it sold them. A fund may be unable to purchase the deliverable securities if the corresponding market is illiquid.
TBA securities subject to a forward commitment to sell at period end are included at the end of the Fund's Schedule of Investments under the caption "TBA Sale Commitments." The proceeds and value of these commitments are reflected in the Fund's Statement of Assets and Liabilities.
Restricted Securities. The Fund may invest in securities that are subject to legal or contractual restrictions on resale. These securities generally may be resold in transactions exempt from registration or to the public if the securities are registered. Disposal of these securities may involve time-consuming negotiations and expense, and prompt sale at an acceptable price may be difficult. Information regarding restricted securities is included at the end of the Fund's Schedule of Investments.
Loans and Other Direct Debt Instruments. The Fund invests in direct debt instruments which are interests in amounts owed to lenders by corporate or other borrowers. These instruments may be in the form of loans, trade claims or other receivables and may include standby financing commitments such as revolving credit facilities that obligate the Fund to supply additional cash to the borrower on demand. Loans may be acquired through assignment or participation, or may be made directly to a borrower. The Fund may be contractually obligated to receive approval from the agent bank and/or borrower prior to the sale of these loans.
Annual Report
Notes to Financial Statements - continued
(Amounts in thousands except percentages)
5. Derivative Instruments.
Risk Exposures and the Use of Derivative Instruments. The Fund's investment objective allows the Fund to enter into various types of derivative contracts, including swap agreements. Derivatives are investments whose value is primarily derived from underlying assets, indices or reference rates and may be transacted on an exchange or over-the-counter (OTC). Derivatives may involve a future commitment to buy or sell a specified instrument based on specified terms, to exchange future cash flows at periodic intervals based on a notional principal amount, or for one party to make one or more payments upon the occurrence of specified events in exchange for periodic payments from the other party.
The Fund used derivatives to increase returns, to gain exposure to certain types of assets and to manage exposure to certain risks as defined below. The success of any strategy involving derivatives depends on analysis of numerous economic factors, and if the strategies for investment do not work as intended, the Fund may not achieve its objectives.
The Fund's use of derivatives increased or decreased its exposure to the following risk:
Credit Risk | Credit risk relates to the ability of the issuer of a financial instrument to make further principal or interest payments on an obligation or commitment that it has to the Fund. |
The Fund is also exposed to additional risks from investing in derivatives, such as liquidity risk and counterparty credit risk. Liquidity risk is the risk that the Fund will be unable to close out the derivative in the open market in a timely manner. Counterparty credit risk is the risk that the counterparty will not be able to fulfill its obligation to the Fund. Derivative counterparty credit risk is managed through formal evaluation of the creditworthiness of all potential counterparties. On certain OTC derivatives such as swap transactions, the Fund attempts to reduce its exposure to counterparty credit risk by entering into an International Swaps and Derivatives Association, Inc. (ISDA) Master Agreement on a bilateral basis with each of its counterparties. The ISDA Master Agreement gives the Fund the right to terminate all transactions traded under such agreement upon the deterioration in the credit quality of the counterparty beyond specified levels. The ISDA Master Agreement gives each party the right, upon an event of default by the other party or a termination of the agreement, to close out all transactions traded under such agreement and to net amounts owed under each transaction to one net payable by one party to the other. To mitigate counterparty credit risk on OTC derivatives, the Fund receives collateral in the form of cash or securities once the Fund's net unrealized appreciation on outstanding derivative contracts under an ISDA Master Agreement exceeds certain applicable thresholds, subject to certain minimum transfer provisions. The collateral received is held in segregated accounts with the Fund's custodian bank in accordance with the collateral agreements entered into between the Fund, the counterparty and the Fund's custodian bank. The Fund could experience delays and costs in
Annual Report
5. Derivative Instruments - continued
Risk Exposures and the Use of Derivative Instruments - continued
gaining access to the collateral even though it is held by the Fund's custodian bank. The Fund's maximum risk of loss from counterparty credit risk related to OTC derivatives is generally the aggregate unrealized appreciation and unpaid counterparty payments in excess of any collateral pledged by the counterparty to the Fund. The Fund may be required to pledge collateral for the benefit of the counterparties on OTC derivatives in an amount not less than each counterparty's unrealized appreciation on outstanding derivative contracts, subject to certain minimum transfer provisions, and any such pledged collateral is identified in the Schedule of Investments.
Investing in derivatives may involve greater risks than investing in the underlying assets directly and, to varying degrees, may involve risk of loss in excess of any initial investment and collateral received and amounts recognized in the Statement of Assets and Liabilities. In addition, there may be the risk that the change in value of the derivative contract does not correspond to the change in value of the underlying instrument.
Net Realized Gain (Loss) and Change in Net Unrealized Appreciation (Depreciation) on Derivatives. The table below, which reflects the impacts of derivatives on the financial performance of the Fund, summarizes the net realized gain (loss) and change in net unrealized appreciation (depreciation) for derivatives during the period as shown in the Statement of Operations.
Primary Risk Exposure / Derivative Type | Net Realized Gain (Loss) | Change in Net Unrealized Appreciation (Depreciation) |
Credit Risk | | |
Swap Agreements (a) | $ (13,193) | $ 12,333 |
(a) A summary of the value of derivatives by primary risk exposure as of period end, is included at the end of the Schedule of Investments and is
representative of activity for the period.
Swap Agreements. A swap agreement (swap) is a contract between two parties to exchange future cash flows at periodic intervals based on a notional principal amount.
Swaps are marked-to-market daily and changes in value are reflected in the Statement of Assets and Liabilities in the swap agreements at value line items. Any upfront premiums paid or received upon entering a swap to compensate for differences between stated terms of the agreement and prevailing market conditions (e.g. credit spreads, interest rates or other factors) are recorded as realized gain or (loss) ratably over the term of the swap. Any unamortized upfront premiums are included in net unrealized appreciation (depreciation) in the Statement of Assets and Liabilities. Payments are exchanged at
Annual Report
Notes to Financial Statements - continued
(Amounts in thousands except percentages)
5. Derivative Instruments - continued
Swap Agreements - continued
specified intervals, accrued daily commencing with the effective date of the contract and recorded as realized gain or (loss). Realized gain or (loss) is also recorded in the event of an early termination of a swap. The net realized gain (loss) and change in net unrealized appreciation (depreciation) on swaps during the period is included in the Statement of Operations.
Any open swaps at period end are included in the Schedule of Investments under the caption "Swap Agreements."
Credit Default Swaps. Credit default swaps enable the Fund to buy or sell protection against specified credit events on a single-name issuer or a traded credit index. Under the terms of a credit default swap the buyer of protection (buyer) receives credit protection in exchange for making periodic payments to the seller of protection (seller) based on a fixed percentage applied to a notional principal amount. In return for these payments, the seller acts as a guarantor of the creditworthiness of a reference obligation and will be required to make a payment upon the occurrence of one or more specified credit events. The Fund enters into credit default swaps as a seller to gain credit exposure to an issuer and/or as a buyer to obtain a measure of protection against defaults of an issuer. Periodic payments are made over the life of the contract by the buyer provided that no credit event occurs.
For credit default swaps on most corporate and sovereign issuers, credit events include bankruptcy, failure to pay or repudiation/moratorium. For credit default swaps on corporate or sovereign issuers, the obligation that may be put to the seller is not limited to the specific reference obligation described in the Schedule of Investments. For credit default swaps on asset-backed securities, a credit event may be triggered by events such as failure to pay principal, maturity extension, rating downgrade or write-down. For credit default swaps on asset-backed securities, the reference obligation described represents the security that may be put to the seller. For credit default swaps on a traded credit index, a specified credit event may affect all or individual underlying securities included in the index.
As a seller, if an underlying credit event occurs, the Fund will pay a net settlement amount of cash equal to the notional amount of the swap less the recovery value of the reference obligation or underlying securities comprising an index. Only in the event of the industry's inability to value the underlying asset will the Fund be required to take delivery of the reference obligation or underlying securities comprising an index and pay an amount equal to the notional amount of the swap.
Annual Report
5. Derivative Instruments - continued
Credit Default Swaps - continued
As a buyer, if an underlying credit event occurs, the Fund will receive a net settlement amount of cash equal to the notional amount of the swap less the recovery value of the reference obligation or underlying securities comprising an index. Only in the event of the industry's inability to value the underlying asset will the Fund be required to deliver the reference obligation or underlying securities comprising an index in exchange for payment of an amount equal to the notional amount of the swap.
Typically, the value of each credit default swap and credit rating disclosed for each reference obligation in the Schedule of Investments, where the Fund is the seller, can be used as measures of the current payment/performance risk of the swap. As the value of the swap changes as a positive or negative percentage of the total notional amount, the payment/performance risk may decrease or increase, respectively. In addition to these measures, FMR monitors a variety of factors including cash flow assumptions, market activity and market sentiment as part of its ongoing process of assessing payment/performance risk.
6. Purchases and Sales of Investments.
Purchases and sales of securities (including the Fixed-Income Central Funds), other than short-term securities and U.S. government securities, aggregated $11,838,549 and $11,610,222, respectively.
7. Fees and Other Transactions with Affiliates.
Management Fee. FMR and its affiliates provide the Fund with investment management related services for which the Fund pays a monthly management fee. The management fee is the sum of an individual fund fee rate that is based on an annual rate of .15% of the Fund's average net assets and an annualized group fee rate that averaged .26% during the period. The group fee rate is based upon the average net assets of all the mutual funds advised by FMR. The group fee rate decreases as assets under management increase and increases as assets under management decrease. For the period, the total annual management fee rate was .41% of the Fund's average net assets.
Transfer Agent Fees. Fidelity Investments Institutional Operations Company, Inc. (FIIOC), an affiliate of FMR, is the transfer, dividend disbursing and shareholder servicing agent for each class of the Fund. FIIOC receives account fees and asset-based fees that vary according to the account size and type of account of the shareholders of Puritan. FIIOC receives an asset-based fee of Class K's average net assets. FIIOC pays for typesetting, printing and mailing of shareholder reports, except proxy statements. For the period, transfer agent fees for each class were as follows:
Annual Report
Notes to Financial Statements - continued
(Amounts in thousands except percentages)
7. Fees and Other Transactions with Affiliates - continued
Transfer Agent Fees - continued
| Amount | % of
Average
Net Assets |
Puritan | $ 25,505 | .17 |
Class K | 1,865 | .05 |
| $ 27,370 | |
Accounting and Security Lending Fees. Fidelity Service Company, Inc. (FSC), an affiliate of FMR, maintains the Fund's accounting records. The accounting fee is based on the level of average net assets for each month. Under a separate contract, FSC administers the security lending program. The security lending fee is based on the number and duration of lending transactions.
Brokerage Commissions. The Fund placed a portion of its portfolio transactions with brokerage firms which are affiliates of the investment adviser. The commissions paid to these affiliated firms were $219 for the period.
8. Committed Line of Credit.
The Fund participates with other funds managed by FMR or an affiliate in a $4.25 billion credit facility (the "line of credit") to be utilized for temporary or emergency purposes to fund shareholder redemptions or for other short-term liquidity purposes. The Fund has agreed to pay commitment fees on its pro-rata portion of the line of credit, which amounted to $53 and is reflected in Miscellaneous expenses on the Statement of Operations. During the period, there were no borrowings on this line of credit.
9. Security Lending.
The Fund lends portfolio securities from time to time in order to earn additional income. For equity securities, a lending agent is used and may loan securities to certain qualified borrowers, including Fidelity Capital Markets (FCM), a broker-dealer affiliated with the Fund. On the settlement date of the loan, the Fund receives collateral (in the form of U.S. Treasury obligations, letters of credit and/or cash) against the loaned securities and maintains collateral in an amount not less than 100% of the market value of the loaned securities during the period of the loan. The market value of the loaned securities is determined at the close of business of the Fund and any additional required collateral is delivered to the Fund on the next business day. If the borrower defaults on its obligation to return the securities loaned because of insolvency or other reasons, a fund could experience delays and costs in recovering the securities loaned or in gaining access to
Annual Report
9. Security Lending - continued
the collateral. Any cash collateral received is maintained at the Fund's custodian and/or invested in cash equivalents and/or the Fidelity Securities Lending Cash Central Fund. The value of loaned securities and cash collateral at period end are disclosed on the Fund's Statement of Assets and Liabilities. At period end, there were no security loans outstanding with FCM. Security lending income represents the income earned on investing cash collateral, less rebates paid to borrowers and any lending agent fees associated with the loan, plus any premium payments received for lending certain types of securities. Total security lending income during the period, presented in the Statement of Operations as a component of interest income, amounted to $66. Net income from the Fidelity Securities Lending Cash Central Fund during the period, presented in the Statement of Operations as a component of income from Fidelity Central Funds, amounted to $2,162 (including $19 from securities loaned to FCM).
10. Bank Borrowings.
The Fund is permitted to have bank borrowings for temporary or emergency purposes to fund shareholder redemptions or for other short-term liquidity requirements. The Fund has established borrowing arrangements with certain banks. The interest rate on the borrowings is the bank's base rate, as revised from time to time. The average loan balance during the period for which loans were outstanding amounted to $26,297. The weighted average interest rate was .58%. The interest expense amounted to four hundred twenty four dollars under the bank borrowing program. At period end, there were no bank borrowings outstanding.
11. Expense Reductions.
Many of the brokers with whom FMR places trades on behalf of the Fund provided services to the Fund in addition to trade execution. These services included payments of certain expenses on behalf of the Fund totaling $670 for the period. In addition, through arrangements with the Fund's custodian, credits realized as a result of uninvested cash balances were used to reduce the Fund's expenses. During the period, these credits reduced the Fund's custody expenses by $3.
12. Distributions to Shareholders.
Distributions to shareholders of each class were as follows:
Years ended August 31, | 2012 | 2011 |
From net investment income | | |
Puritan | $ 290,441 | $ 333,862 |
Class K | 73,694 | 62,045 |
Total | $ 364,135 | $ 395,907 |
Annual Report
Notes to Financial Statements - continued
(Amounts in thousands except percentages)
12. Distributions to Shareholders - continued
Years ended August 31, | 2012 | 2011 |
From net realized gain | | |
Puritan | $ - | $ 2,823 |
Class K | - | 441 |
Total | $ - | $ 3,264 |
13. Share Transactions.
Transactions for each class of shares were as follows:
| Shares | Dollars |
Years ended August 31, | 2012 | 2011 | 2012 | 2011 |
Puritan | | | | |
Shares sold | 79,946 | 80,583 | $ 1,477,678 | $ 1,457,491 |
Reinvestment of distributions | 15,053 | 17,715 | 274,339 | 318,717 |
Shares redeemed | (172,734) | (180,664) | (3,181,243) | (3,262,008) |
Net increase (decrease) | (77,735) | (82,366) | $ (1,429,226) | $ (1,485,800) |
Class K | | | | |
Shares sold | 80,899 | 63,847 | $ 1,501,190 | $ 1,155,980 |
Reinvestment of distributions | 4,030 | 3,457 | 73,694 | 62,486 |
Shares redeemed | (47,844) | (30,388) | (889,457) | (549,211) |
Net increase (decrease) | 37,085 | 36,916 | $ 685,427 | $ 669,255 |
14. Other.
The Fund's organizational documents provide former and current trustees and officers with a limited indemnification against liabilities arising in connection with the performance of their duties to the Fund. In the normal course of business, the Fund may also enter into contracts that provide general indemnifications. The Fund's maximum exposure under these arrangements is unknown as this would be dependent on future claims that may be made against the Fund. The risk of material loss from such claims is considered remote.
Annual Report
To the Trustees of Fidelity Puritan Trust and the Shareholders of Fidelity Puritan Fund:
In our opinion, the accompanying statement of assets and liabilities, including the schedule of investments, and the related statements of operations and of changes in net assets and the financial highlights present fairly, in all material respects, the financial position of Fidelity Puritan Fund (a fund of Fidelity Puritan Trust) at August 31, 2012, the results of its operations for the year then ended, the changes in its net assets for each of the two years in the period then ended and the financial highlights for each of the periods indicated, in conformity with accounting principles generally accepted in the United States of America. These financial statements and financial highlights (hereafter referred to as "financial statements") are the responsibility of the Fidelity Puritan Fund's management. Our responsibility is to express an opinion on these financial statements based on our audits. We conducted our audits of these financial statements in accordance with the standards of the Public Company Accounting Oversight Board (United States). Those standards require that we plan and perform the audit to obtain reasonable assurance about whether the financial statements are free of material misstatement. An audit includes examining, on a test basis, evidence supporting the amounts and disclosures in the financial statements, assessing the accounting principles used and significant estimates made by management, and evaluating the overall financial statement presentation. We believe that our audits, which included confirmation of securities at August 31, 2012 by correspondence with the custodian, brokers and agent banks, provide a reasonable basis for our opinion.
PricewaterhouseCoopers LLP
Boston, Massachusetts
October 19, 2012
Annual Report
The Trustees, Members of the Advisory Board, and executive officers of the trust and fund, as applicable, are listed below. The Board of Trustees governs the fund and is responsible for protecting the interests of shareholders. The Trustees are experienced executives who meet periodically throughout the year to oversee the fund's activities, review contractual arrangements with companies that provide services to the fund, oversee management of the risks associated with such activities and contractual arrangements, and review the fund's performance.Except for James C. Curvey, each of the Trustees oversees 228 funds advised by FMR or an affiliate. Mr. Curvey oversees 435 funds advised by FMR or an affiliate.
The Trustees hold office without limit in time except that (a) any Trustee may resign; (b) any Trustee may be removed by written instrument, signed by at least two-thirds of the number of Trustees prior to such removal; (c) any Trustee who requests to be retired or who has become incapacitated by illness or injury may be retired by written instrument signed by a majority of the other Trustees; and (d) any Trustee may be removed at any special meeting of shareholders by a two-thirds vote of the outstanding voting securities of the trust.Each Trustee who is not an interested person (as defined in the 1940 Act) (Independent Trustee), shall retire not later than the last day of the calendar year in which his or her 75th birthday occurs. The Independent Trustees may waive this mandatory retirement age policy with respect to individual Trustees.The executive officers and Advisory Board Members hold office without limit in time, except that any officer and Advisory Board Member may resign or may be removed by a vote of a majority of the Trustees at any regular meeting or any special meeting of the Trustees. Except as indicated, each individual has held the office shown or other offices in the same company for the past five years.
Experience, Skills, Attributes, and Qualifications of the Fund's Trustees. The Governance and Nominating Committee has adopted a statement of policy that describes the experience, qualifications, attributes, and skills that are necessary and desirable for potential Independent Trustee candidates (Statement of Policy). The Board believes that each Trustee satisfied at the time he or she was initially elected or appointed a Trustee, and continues to satisfy, the standards contemplated by the Statement of Policy. The Governance and Nominating Committee also engages professional search firms to help identify potential Independent Trustee candidates who have the experience, qualifications, attributes, and skills consistent with the Statement of Policy. From time to time, additional criteria based on the composition and skills of the current Independent Trustees, as well as experience or skills that may be appropriate in light of future changes to board composition, business conditions, and regulatory or other developments, have also been considered by the professional search firms and the Governance and Nominating Committee. In addition, the Board takes into account the Trustees' commitment and participation in Board and committee meetings, as well as their leadership of standing and ad hoc committees throughout their tenure.
In determining that a particular Trustee was and continues to be qualified to serve as a Trustee, the Board has considered a variety of criteria, none of which, in isolation, was controlling. The Board believes that, collectively, the Trustees have balanced and diverse experience, qualifications, attributes, and skills, which allow the Board to operate effectively in governing the fund and protecting the interests of shareholders. Information about the specific experience, skills, attributes, and qualifications of each Trustee, which in each case led to the Board's conclusion that the Trustee should serve (or continue to serve) as a trustee of the fund, is provided below.
Annual Report
Trustees and Officers - continued
Board Structure and Oversight Function. James C. Curvey is an interested person (as defined in the 1940 Act) and currently serves as Chairman. The Trustees have determined that an interested Chairman is appropriate and benefits shareholders because an interested Chairman has a personal and professional stake in the quality and continuity of services provided to the fund. Independent Trustees exercise their informed business judgment to appoint an individual of their choosing to serve as Chairman, regardless of whether the Trustee happens to be independent or a member of management. The Independent Trustees have determined that they can act independently and effectively without having an Independent Trustee serve as Chairman and that a key structural component for assuring that they are in a position to do so is for the Independent Trustees to constitute a substantial majority for the Board. The Independent Trustees also regularly meet in executive session. Ned C. Lautenbach serves as Chairman of the Independent Trustees and as such (i) acts as a liaison between the Independent Trustees and management with respect to matters important to the Independent Trustees and (ii) with management prepares agendas for Board meetings.
Fidelity funds are overseen by different Boards of Trustees. The fund's Board oversees Fidelity's equity and high income funds and another Board oversees Fidelity's investment-grade bond, money market, and asset allocation funds. The asset allocation funds may invest in Fidelity funds overseen by the fund's Board. The use of separate Boards, each with its own committee structure, allows the Trustees of each group of Fidelity funds to focus on the unique issues of the funds they oversee, including common research, investment, and operational issues. On occasion, the separate Boards establish joint committees to address issues of overlapping consequences for the Fidelity funds overseen by each Board.
The Trustees operate using a system of committees to facilitate the timely and efficient consideration of all matters of importance to the Trustees, the fund, and fund shareholders and to facilitate compliance with legal and regulatory requirements and oversight of the fund's activities and associated risks. The Board, acting through its committees, has charged FMR and its affiliates with (i) identifying events or circumstances the occurrence of which could have demonstrably adverse effects on the fund's business and/or reputation; (ii) implementing processes and controls to lessen the possibility that such events or circumstances occur or to mitigate the effects of such events or circumstances if they do occur; and (iii) creating and maintaining a system designed to evaluate continuously business and market conditions in order to facilitate the identification and implementation processes described in (i) and (ii) above. Because the day-to-day operations and activities of the fund's are carried out by or through FMR, its affiliates and other service providers, the fund's exposure to risks is mitigated but not eliminated by the processes overseen by the Trustees. While each of the Board's committees has responsibility for overseeing different aspects of the fund's activities, oversight is exercised primarily through the Operations, Audit, and Compliance Committees. In addition, the Independent Trustees have worked with FMR to enhance the Board's oversight of investment and financial risks, legal and regulatory risks, technology risks, and operational risks, including the development of additional risk reporting to the Board. For example, a working group comprised of Independent Trustees and FMR has worked and continues to work to review the Fidelity funds' valuation-related activities, reporting and risk management. Appropriate personnel, including but not limited to the fund's Chief Compliance Officer (CCO), FMR's internal auditor, the independent accountants, the fund's Treasurer and portfolio management personnel, make periodic reports to the Board's committees, as appropriate, including an annual review of FMR's risk management program for the Fidelity funds. The responsibilities of each standing committee, including their oversight responsibilities, are described further under "Standing Committees of the Fund's Trustees."
Annual Report
The fund's Statement of Additional Information (SAI) includes more information about the Trustees. To request a free copy, call Fidelity at 1-800-544-8544.
Interested Trustees*:
Correspondence intended for each Trustee who is an interested person may be sent to Fidelity Investments, 82 Devonshire Street, Boston, Massachusetts 02109.
Name, Age; Principal Occupations and Other Relevant Experience+ |
James C. Curvey (77) |
| Year of Election or Appointment: 2007 Mr. Curvey is Trustee and Chairman of the Board of Trustees of certain Trusts. Mr. Curvey also serves as Trustee (2007-present) of other investment companies advised by FMR. Mr. Curvey is a Director of Fidelity Investments Money Management, Inc. (2009-present), Director of Fidelity Research & Analysis Co. (2009-present) and Director of FMR and FMR Co., Inc. (2007-present). Mr. Curvey is also Vice Chairman (2007-present) and Director of FMR LLC. In addition, Mr. Curvey serves as an Overseer for the Boston Symphony Orchestra and a member of the Trustees of Villanova University. Previously, Mr. Curvey was the Vice Chairman (2006-2007) and Director (2000-2007) of FMR Corp. |
Ronald P. O'Hanley (55) |
| Year of Election or Appointment: 2011 Mr. O'Hanley is Director of FMR Co., Inc. (2010-present), Director of Fidelity Investments Money Management, Inc. (2010-present), Director of Fidelity Research & Analysis Company (2010-present), President of Fidelity Asset Management and Corporate Services and a member of Fidelity's Executive Committee (2010-present). Previously, Mr. O'Hanley served as President and Chief Executive Officer of BNY Mellon Asset Management (2007-2010). Mr. O'Hanley also served as Vice Chairman of Bank New York Mellon Corp. and a member of that firm's Executive Committee. Prior to the 2007 merger of The Bank of New York and Mellon Financial Corporation, he was Vice Chairman of Mellon Financial Corporation and President and Chief Executive Officer of Mellon Asset Management. He joined Mellon in February 1997. Mr. O'Hanley currently serves as Chairman of the Boston Public Library Foundation Board of Directors and sits on the Board of Directors of Beth Israel Deaconess Medical Center, the Board of Trustees of the Marine Biological Laboratory and the Advisory Board of the Maxwell School of Citizenship and Public Administration at Syracuse University. Mr. O'Hanley also chairs the Council on Asset Management for the Financial Services Roundtable and is a member of the Board of Directors of Institutional Investor's U.S. Institute. |
* Trustees have been determined to be "Interested Trustees" by virtue of, among other things, their affiliation with the trust or various entities under common control with FMR.
+ The information above includes each Trustee's principal occupation during the last five years and other information relating to the experience, attributes, and skills relevant to each Trustee's qualifications to serve as a Trustee, which led to the conclusion that each Trustee should serve as a Trustee for the fund.
Annual Report
Independent Trustees:
Correspondence intended for each Independent Trustee (that is, the Trustees other than the Interested Trustees) may be sent to Fidelity Investments, P.O. Box 55235, Boston, Massachusetts 02205-5235.
Name, Age; Principal Occupations and Other Relevant Experience+ |
Dennis J. Dirks (64) |
| Year of Election or Appointment: 2005 Prior to his retirement in May 2003, Mr. Dirks was Chief Operating Officer and a member of the Board of The Depository Trust & Clearing Corporation (DTCC). He also served as President, Chief Operating Officer, and Board member of The Depository Trust Company (DTC) and President and Board member of the National Securities Clearing Corporation (NSCC). In addition, Mr. Dirks served as Chief Executive Officer and Board member of the Government Securities Clearing Corporation, Chief Executive Officer and Board member of the Mortgage-Backed Securities Clearing Corporation, as a Trustee and a member of the Finance Committee of Manhattan College (2005-2008), and as a Trustee and a member of the Finance Committee of AHRC of Nassau County (2006-2008). Mr. Dirks is a member of the Independent Directors Council (IDC) Governing Council (2010-present) and Board of Directors for The Brookville Center for Children's Services, Inc. (2009-present). |
Alan J. Lacy (58) |
| Year of Election or Appointment: 2008 Mr. Lacy serves as Senior Adviser (2007-present) of Oak Hill Capital Partners, L.P. (private equity). Mr. Lacy also served as Chief Executive Officer (2000-2005) and Vice Chairman (2005-2006) of Sears Holdings Corporation and Sears, Roebuck and Co. (retail). In addition, Mr. Lacy serves as a member of the Board of Directors of Dave & Buster's Entertainment, Inc. (restaurant and entertainment complexes, 2010-present), Earth Fare, Inc. (retail grocery, 2012-present), The Hillman Companies, Inc. (hardware wholesalers, 2010-present), and Bristol-Myers Squibb Company (global pharmaceuticals, 2008-present). Mr. Lacy is a member of the Board of Trustees of The National Parks Conservation Association (2006-present). Previously, Mr. Lacy served as Chairman of the Board of Trustees of the National Parks Conservation Association (2008-2011) and as a member of the Board of Directors for the Western Union Company (global money transfer, 2006-2011). |
Ned C. Lautenbach (68) |
| Year of Election or Appointment: 2000 Mr. Lautenbach is Chairman of the Independent Trustees of the Equity and High Income Funds (2006-present). Mr. Lautenbach currently serves as the Lead Director of the Eaton Corporation Board of Directors (diversified industrial, 1997-present). Mr. Lautenbach is Chairman of the Board of Directors of the Philharmonic Center for the Arts in Naples, Florida (2012-present) and a member of the Council on Foreign Relations (1994-present). Previously, Mr. Lautenbach was a Partner/Advisory Partner at Clayton, Dubilier & Rice, LLC (private equity investment, 1998-2010), as well as a Director of Sony Corporation (2006-2007). |
Joseph Mauriello (67) |
| Year of Election or Appointment: 2008 Prior to his retirement in January 2006, Mr. Mauriello served in numerous senior management positions including Deputy Chairman and Chief Operating Officer (2004-2005), and Vice Chairman of Financial Services (2002-2004) of KPMG LLP US (professional services, 1965-2005). Mr. Mauriello currently serves as a member of the Board of Directors of XL Group plc. (global insurance and re-insurance, 2006-present). Previously, Mr. Mauriello served as a Director of the Hamilton Funds of the Bank of New York (2006-2007) and of Arcadia Resources Inc. (health care services and products, 2007-2012). |
Robert W. Selander (61) |
| Year of Election or Appointment: 2011 Previously, Mr. Selander served as a Member of the Advisory Board of Fidelity's Equity and High Income Funds (2011), Executive Vice Chairman (2010), Chief Executive Officer (2009-2010), and President and Chief Executive Officer (1997-2009) of Mastercard, Inc. |
Cornelia M. Small (68) |
| Year of Election or Appointment: 2005 Ms. Small is a member of the Board of Directors (2009-present) and Chair of the Investment Committee (2010-present) of the Teagle Foundation. Ms. Small also serves on the Investment Committee of the Berkshire Taconic Community Foundation (2008-present). Previously, Ms. Small served as Chairperson (2002-2008) and a member of the Investment Committee and Chairperson (2008-2012) and a member of the Board of Trustees of Smith College. In addition, Ms. Small served as Chief Investment Officer, Director of Global Equity Investments, and a member of the Board of Directors of Scudder, Stevens & Clark and Scudder Kemper Investments. |
William S. Stavropoulos (73) |
| Year of Election or Appointment: 2001 Mr. Stavropoulos is Vice Chairman of the Independent Trustees of the Equity and High Income Funds (2006-present). Mr. Stavropoulos serves as President and Founder of the Michigan Baseball Foundation, the Great Lakes Loons (2007-present). Mr. Stavropoulos is Chairman Emeritus of the Board of Directors of The Dow Chemical Company, where he previously served in numerous senior management positions, including President, CEO (1995-2000; 2002-2004), Chairman of the Executive Committee (2000-2006), and as a member of the Board of Directors (1990-2006). Currently, Mr. Stavropoulos is a Director of Univar Inc. (global distributor of commodity and specialty chemicals, Chairman from 2010-May 2012 and Lead Director from May 2012-present), Teradata Corporation (data warehousing and technology solutions, 2008-present), Maersk Inc. (industrial conglomerate), and Tyco International, Ltd. (multinational manufacturing and services, 2007-present), and a member of the Advisory Board for Metalmark Capital LLC (private equity investment, 2005-present). Mr. Stavropoulos is an operating advisor to Clayton, Dubilier & Rice, LLC (private equity investment). In addition, Mr. Stavropoulos is a member of the University of Notre Dame Advisory Council for the College of Science, a Trustee of the Rollin L. Gerstacker Foundation, and a Director of the Naples Philharmonic Center for the Arts. Previously, Mr. Stavropoulos served as a Director of Chemical Financial Corporation (bank holding company, 1993-2012). |
David M. Thomas (63) |
| Year of Election or Appointment: 2008 Previously, Mr. Thomas served as Executive Chairman (2005-2006) and Chairman and Chief Executive Officer (2000-2005) of IMS Health, Inc. (pharmaceutical and healthcare information solutions), and a Director of Fortune Brands, Inc. (consumer products, 2000-2011). In addition, Mr. Thomas serves as Non-Executive Chairman of the Board of Directors of Fortune Brands Home and Security (home and security products, 2011-present), and as a member of the Board of Directors of Interpublic Group of Companies, Inc. (marketing communication, 2004-present). |
Michael E. Wiley (61) |
| Year of Election or Appointment: 2008 Mr. Wiley also serves as a Director of Asia Pacific Exploration Consolidated (international oil and gas exploration and production, 2008-present). Mr. Wiley serves as a Director of Tesoro Corporation (independent oil refiner and marketer, 2005-present), and a Director of Bill Barrett Corporation (exploration and production, 2005-present). In addition, Mr. Wiley also serves as a Director of Post Oak Bank (privately-held bank, 2004-present). Previously, Mr. Wiley served as a member of the Board of Trustees of the University of Tulsa (2000-2006; 2007-2010), as a Senior Energy Advisor of Katzenbach Partners, LLC (consulting, 2006-2007), as an Advisory Director of Riverstone Holdings (private investment), Chairman, President, and CEO of Baker Hughes, Inc. (oilfield services, 2000-2004), and as Director of Spinnaker Exploration Company (exploration and production, 2001-2005). |
+ The information above includes each Trustee's principal occupation during the last five years and other information relating to the experience, attributes, and skills relevant to each Trustee's qualifications to serve as a Trustee, which led to the conclusion that each Trustee should serve as a Trustee for the fund.
Advisory Board Members and Executive Officers:
Correspondence intended for David A. Rosow and Garnett A. Smith may be sent to Fidelity Investments, P.O. Box 55235, Boston, Massachusetts 02205-5235. Correspondence intended for each executive officer, Edward C. Johnson 3d, and Peter S. Lynch may be sent to Fidelity Investments, 82 Devonshire Street, Boston, Massachusetts 02109.
Name, Age; Principal Occupation |
Edward C. Johnson 3d (82) |
| Year of Election or Appointment: 2011 Member of the Advisory Board of Fidelity's Equity and High Income Funds. Mr. Johnson serves as Chief Executive Officer, Chairman, and a Director of FMR LLC, and also serves as Chairman and Director of FIL Limited. Previously, Mr. Johnson served as a Trustee and Chairman of the Board of certain Fidelity Trusts, Chairman and a Director of FMR, Chairman and a Director of FMR Co., Inc., and President of FMR LLC (2006-2007). |
Peter S. Lynch (68) |
| Year of Election or Appointment: 2003 Member of the Advisory Board of Fidelity's Equity and High Income Funds. Mr. Lynch is Vice Chairman and a Director of FMR and FMR Co., Inc. In addition, Mr. Lynch serves as a Trustee of Boston College and as the Chairman of the Inner-City Scholarship Fund. Previously, Mr. Lynch served on the Special Olympics International Board of Directors (1997-2006). |
David A. Rosow (69) |
| Year of Election or Appointment: 2012 Member of the Advisory Board of Fidelity's Equity and High Income Funds. Chairman and Chief Executive Officer of International Golf Group, Inc. (golf course development, 1989-present). Previously, Mr. Rosow served as Chairman and Chief Executive Officer of Rosow & Company, Inc. (private investment company, 1989-2011), a Lead Director of Hudson United Bancorp (2001-2006) and as a Director of TD Banknorth (1996-2006). In addition, Mr. Rosow is a member (2008-present) and President (2009-present) of the Town Council of Palm Beach, Florida. |
Garnett A. Smith (64) |
| Year of Election or Appointment: 2012 Member of the Advisory Board of Fidelity's Equity and High Income Funds. Prior to Mr. Smith's retirement, he served as Chairman and Chief Executive Officer of Inbrand Corp. (manufacturer of personal absorbent products, 1990-1997). He also served as President (1986-1990) of Inbrand Corp. Prior to his employment with Inbrand Corp., he was employed by a retail fabric chain and North Carolina National Bank. In addition, Mr. Smith is a board member of the Jackson Hole Land Trust (2009-present). |
Kenneth B. Robins (43) |
| Year of Election or Appointment: 2008 President and Treasurer of Fidelity's Equity and High Income Funds. Mr. Robins also serves as President and Treasurer (2010-present) and Assistant Treasurer (2009-present) of other Fidelity funds and is an employee of Fidelity Investments (2004-present). Previously, Mr. Robins served as Deputy Treasurer of the Fidelity funds (2005-2008) and Treasurer and Chief Financial Officer of The North Carolina Capital Management Trust: Cash and Term Portfolios (2006-2008). |
Bruce T. Herring (47) |
| Year of Election or Appointment: 2006 Vice President of certain Equity Funds. Mr. Herring also serves as President of Fidelity Research & Analysis Company (2010-present), Chief Investment Officer and Director of Fidelity Management & Research (U.K.) Inc. (2010-present) and Group Chief Investment Officer of FMR. Previously, Mr. Herring served as Vice President (2005-2006) and Senior Vice President (2006-2007) of Fidelity Management & Research Company, Vice President of FMR Co., Inc. (2001-2007) and as a portfolio manager for Fidelity U.S. Equity Funds. |
Brian B. Hogan (47) |
| Year of Election or Appointment: 2009 Vice President of Equity and High Income Funds. Mr. Hogan also serves as President of FMR's Equity Division (2009-present). Previously, Mr. Hogan served as Senior Vice President, Equity Research of FMR (2006-2009) and as a portfolio manager. |
Scott C. Goebel (44) |
| Year of Election or Appointment: 2008 Secretary and Chief Legal Officer (CLO) of the Fidelity funds. Mr. Goebel also serves as Secretary of Fidelity Investments Money Management, Inc. (FIMM) (2010-present) and Fidelity Research and Analysis Company (FRAC) (2010-present); Secretary and CLO of The North Carolina Capital Management Trust: Cash and Term Portfolios (2008-present); General Counsel, Secretary, and Senior Vice President of FMR (2008-present) and FMR Co., Inc. (2008-present); employed by FMR LLC or an affiliate (2001-present); Chief Legal Officer of Fidelity Management & Research (Hong Kong) Limited (2008-present) and Assistant Secretary of Fidelity Management & Research (Japan) Inc. (2008-present), and Fidelity Management & Research (U.K.) Inc. (2008-present). Previously, Mr. Goebel served as Assistant Secretary of FIMM (2008-2010), FRAC (2008-2010), and the Funds (2007-2008) and as Vice President and Secretary of Fidelity Distributors Corporation (FDC) (2005-2007). |
William C. Coffey (43) |
| Year of Election or Appointment: 2009 Assistant Secretary of Fidelity's Equity and High Income Funds. Mr. Coffey also serves as Senior Vice President and Deputy General Counsel of FMR LLC (2010-present), and is an employee of Fidelity Investments. Previously, Mr. Coffey served as Vice President and Associate General Counsel of FMR LLC (2005-2009). |
Elizabeth Paige Baumann (44) |
| Year of Election or Appointment: 2012 Anti-Money Laundering (AML) Officer of the Fidelity funds. Ms. Baumann also serves as AML Officer of The North Carolina Capital Management Trust: Cash and Term Portfolios (2012-present), Chief AML Officer of FMR LLC (2012-present), and is an employee of Fidelity Investments. Previously, Ms. Baumann served as Vice President and Deputy Anti-Money Laundering Officer (2007-2012). |
Christine Reynolds (53) |
| Year of Election or Appointment: 2008 Chief Financial Officer of the Fidelity funds. Ms. Reynolds became President of Fidelity Pricing and Cash Management Services (FPCMS) in August 2008. Ms. Reynolds served as Chief Operating Officer of FPCMS (2007-2008). Previously, Ms. Reynolds served as President, Treasurer, and Anti-Money Laundering officer of the Fidelity funds (2004-2007). |
Joseph A. Hanlon (44) |
| Year of Election or Appointment: 2012 Chief Compliance Officer of Fidelity's Equity and High Income Funds. Mr. Hanlon serves as Compliance Officer of FMR, FMR Co., Inc., Fidelity Investments Money Management, Inc. (FIMM), Fidelity Research and Analysis Company (FRAC), Fidelity Management & Research (Japan) Inc., Fidelity Management & Research (U.K.) Inc., Fidelity Management & Research (Hong Kong), and Strategic Advisers, Inc. (2009-present), as Senior Vice President of the Fidelity Asset Management Division (2009-present), and is an employee of Fidelity Investments. |
Joseph F. Zambello (55) |
| Year of Election or Appointment: 2011 Deputy Treasurer of the Fidelity funds. Mr. Zambello is an employee of Fidelity Investments. Previously, Mr. Zambello served as Vice President of FMR's Program Management Group (2009-2011) and Vice President of the Transfer Agent Oversight Group (2005-2009). |
Adrien E. Deberghes (45) |
| Year of Election or Appointment: 2008 Deputy Treasurer of Fidelity's Equity and High Income Funds. Mr. Deberghes also serves as Vice President (2011-present) and Assistant Treasurer (2010-present) of other Fidelity funds, and is an employee of Fidelity Investments (2008-present). Previously, Mr. Deberghes served as Senior Vice President of Mutual Fund Administration at State Street Corporation (2007-2008), Senior Director of Mutual Fund Administration at Investors Bank & Trust (2005-2007), and Director of Finance for Dunkin' Brands (2000-2005). |
Stephanie J. Dorsey (43) |
| Year of Election or Appointment: 2010 Assistant Treasurer of Fidelity's Equity and High Income Funds. Ms. Dorsey also serves as Deputy Treasurer of other Fidelity funds (2008-present) and is an employee of Fidelity Investments (2008-present). Previously, Ms. Dorsey served as Treasurer (2004-2008) of the JPMorgan Mutual Funds and Vice President (2004-2008) of JPMorgan Chase Bank. |
John R. Hebble (54) |
| Year of Election or Appointment: 2009 Assistant Treasurer of Fidelity's Equity and High Income Funds. Mr. Hebble also serves as President (2011-present), Treasurer, and Chief Financial Officer of The North Carolina Capital Management Trust: Cash and Term Portfolios (2008-present), President and Treasurer of other Fidelity funds (2008-present) and is an employee of Fidelity Investments. |
Gary W. Ryan (54) |
| Year of Election or Appointment: 2005 Assistant Treasurer of the Fidelity funds. Mr. Ryan is an employee of Fidelity Investments. Previously, Mr. Ryan served as Vice President of Fund Reporting in Fidelity Pricing and Cash Management Services (FPCMS) (1999-2005). |
Jonathan Davis (44) |
| Year of Election or Appointment: 2010 Assistant Treasurer of the Fidelity funds. Mr. Davis is also Assistant Treasurer of Fidelity Rutland Square Trust II and Fidelity Commonwealth Trust II. Mr. Davis is an employee of Fidelity Investments. Previously, Mr. Davis served as Vice President and Associate General Counsel of FMR LLC (2003-2010). |
Annual Report
The Board of Trustees of Puritan Fund voted to pay to shareholders of record at the opening of business on record date, the following distributions per share derived from capital gains realized from sales of portfolio securities, and dividends derived from net investment income:
| Pay Date | Record Date | Dividends | Capital Gains |
Puritan | 10/15/12 | 10/12/12 | $0.082 | $0.236 |
The fund hereby designates as a capital gain dividend with respect to the taxable year ended August 31, 2012 $238,911,300, or, if subsequently determined to be different, the net capital gain of such year.
A total of 4.34% of the dividends distributed during the fiscal year was derived from interest on U.S. Government securities which is generally exempt from state income tax.
The fund designates $146,984,558 of distributions paid during the period January 1, 2012 to August 31, 2012 as qualifying to be taxed as interest-related dividends for nonresident alien shareholders.
Puritan designates 12%, 38%, 61%, 61% of the dividends distributed in October, December, April and July, respectively during the fiscal year as qualifying for the dividends-received deduction for corporate shareholders.
Puritan designates 16%, 47%, 70%, 69% of the dividends distributed in October, December, April and July, respectively during the fiscal year as amounts which may be taken into account as a dividend for the purposes of the maximum rate under section 1(h)(11) of the Internal Revenue Code.
The fund will notify shareholders in January 2013 of amounts for use in preparing 2012 income tax returns.
Annual Report
Board Approval of Investment Advisory Contracts and Management Fees
Fidelity Puritan Fund
Each year, the Board of Trustees, including the Independent Trustees (together, the Board), votes on the renewal of the management contract and sub-advisory agreements (together, the Advisory Contracts) for the fund. The Board, assisted by the advice of fund counsel and Independent Trustees' counsel, requests and considers a broad range of information relevant to the renewal of the Advisory Contracts throughout the year.
The Board meets regularly and, at each of its meetings, considers factors that are relevant to its annual consideration of the renewal of the fund's Advisory Contracts, including the services and support provided to the fund and its shareholders. The Board has established various standing committees, each composed of and chaired by Independent Trustees with varying backgrounds, to which the Board has assigned specific subject matter responsibilities in order to enhance effective decision-making by the Board. The Board, acting directly and through its Committees, requests and receives information concerning the annual consideration of the renewal of the fund's Advisory Contracts. The Board also meets as needed to consider matters specifically related to the Board's annual consideration of the renewal of Advisory Contracts. Members of the Board may also meet with trustees of other Fidelity funds through ad hoc joint committees to discuss certain matters relevant to the Fidelity funds.
At its July 2012 meeting, the Board of Trustees, including the Independent Trustees, unanimously determined to renew the fund's Advisory Contracts. In reaching its determination, the Board considered all factors it believed relevant, including (i) the nature, extent, and quality of the services to be provided to the fund and its shareholders (including the investment performance of the fund); (ii) the competitiveness of the fund's management fee and total expense ratio relative to peer funds; (iii) the total costs of the services to be provided by and the profits to be realized by Fidelity from its relationship with the fund; (iv) the extent to which economies of scale exist and would be realized as the fund grows; and (v) whether fee levels reflect these economies of scale, if any, for the benefit of fund shareholders.
In considering whether to renew the Advisory Contracts for the fund, the Board reached a determination, with the assistance of fund counsel and Independent Trustees' counsel and through the exercise of its business judgment, that the renewal of the Advisory Contracts is in the best interests of the fund and its shareholders and that the compensation payable under the Advisory Contracts is fair and reasonable. The Board's decision to renew the Advisory Contracts was not based on any single factor, but rather was based on a comprehensive consideration of all the information provided to the Board at its meetings throughout the year. The Board, in reaching its determination to renew the Advisory Contracts, is aware that shareholders in the fund have a broad range of investment choices available to them, including a wide choice among mutual funds offered by Fidelity's competitors, and that the fund's shareholders, who have the opportunity to review and weigh the disclosure provided by the fund in its prospectus and other public disclosures, have chosen to invest in this fund, managed by Fidelity.
Annual Report
Nature, Extent, and Quality of Services Provided. The Board considered the staffing within the investment adviser, FMR, and the sub-advisers (together, the Investment Advisers), including the backgrounds of the fund's investment personnel, and also considered the fund's investment objective, strategies, and related investment philosophy. The Independent Trustees also had discussions with senior management of Fidelity's investment operations and investment groups. The Board considered the structure of the portfolio manager compensation program and whether this structure provides appropriate incentives to act in the best interests of the fund.
Resources Dedicated to Investment Management and Support Services. The Board and the Fund Oversight and Research Committees reviewed the general qualifications and capabilities of the Investment Advisers' investment staff, including its size, education, experience, and resources, as well as the Investment Advisers' approach to recruiting, training, managing, and compensating investment personnel. The Board also noted that FMR has continued to increase the resources devoted to non-U.S. offices, including expansion of Fidelity's global investment organization. The Board noted that Fidelity's analysts have extensive resources, tools and capabilities that allow them to conduct sophisticated quantitative and fundamental analysis, as well as credit analysis of issuers, counterparties and guarantors. The Board also believes that Fidelity's investment professionals have sufficient access to global information and data so as to provide competitive investment results over time, and that those professionals also have access to sophisticated tools that permit them to assess portfolio construction and risk and performance attribution characteristics continuously, as well as to transmit new information and research conclusions rapidly around the world. Additionally, in its deliberations, the Board considered the Investment Advisers' trading and risk management capabilities and resources, which are an integral part of the investment management process.
Shareholder and Administrative Services. The Board considered (i) the nature, extent, quality, and cost of advisory, administrative, and shareholder services performed by the Investment Advisers and their affiliates under the Advisory Contracts and under separate agreements covering transfer agency, pricing and bookkeeping, and securities lending services for the fund; (ii) the nature and extent of the supervision of third party service providers, principally custodians and subcustodians; and (iii) the resources devoted to, and the record of compliance with, the fund's compliance policies and procedures. The Board also reviewed the allocation of fund brokerage, including allocations to brokers affiliated with the Investment Advisers, the use of brokerage commissions to pay fund expenses, and the use of "soft" commission dollars to pay for research services.
Annual Report
Board Approval of Investment Advisory Contracts and
Management Fees - continued
The Board noted that the growth of fund assets over time across the complex allows Fidelity to reinvest in the development of services designed to enhance the value or convenience of the Fidelity funds as investment vehicles. These services include 24-hour access to account information and market information through telephone representatives and over the Internet, investor education materials and asset allocation tools, and the expanded availability of Fidelity Investor Centers.
Investment in a Large Fund Family. The Board considered the benefits to shareholders of investing in a Fidelity fund, including the benefits of investing in a fund that is part of a large family of funds offering a variety of investment disciplines and providing a large variety of mutual fund investor services. The Board noted that Fidelity had taken, or had made recommendations that resulted in the Fidelity funds taking, a number of actions over the previous year that benefited particular funds, including (i) continuing to dedicate additional resources to investment research and support of the senior management team that oversees asset management; (ii) persisting in efforts to enhance Fidelity's research capabilities, in particular, international research; (iii) launching new funds and making other enhancements to meet client needs for global and income-oriented solutions; (iv) continuing to launch dedicated lower cost underlying funds to meet investment management's portfolio construction needs related to expanding underlying fund options, specifically for the Freedom Fund product lines; (v) adopting a "Stock Selector" sector neutral investment approach and employing a team of portfolio managers who are sector specialists to manage certain funds; (vi) rationalizing product lines and gaining increased efficiencies through the mergers of several funds into other funds; (vii) strengthening the Spartan Index Fund product line by adding new funds and/or new low-cost institutional share classes, restructuring fund expenses to accommodate new classes, and reducing investment minimums for certain classes of shares; (viii) modifying the eligibility criteria for Institutional Class shares to increase their appeal to government entities and charitable investors; and (ix) reducing certain transfer agent fee rates.
Investment Performance. The Board considered whether the fund has operated in accordance with its investment objective, as well as its record of compliance with its investment restrictions. It also reviewed the fund's absolute investment performance for each class, as well as the fund's relative investment performance for each class measured over multiple periods against (i) a proprietary custom index, and (ii) a peer group of mutual funds deemed appropriate by Fidelity and reviewed by the Board. The following charts considered by the Board show, over the one-, three-, and five-year periods ended December 31, 2011, as available, the cumulative total returns of Class K and the retail class of the fund, the cumulative total returns of a proprietary custom index ("benchmark"), and a range of cumulative total returns of a peer group of mutual funds identified by Lipper Inc. as having an investment objective similar to that of the fund. The box within each chart shows the 25th percentile return (top of box) and the 75th percentile return (bottom of box) of the peer group. Returns shown above the box are in the first quartile and returns shown below the box are in the fourth quartile. The percentage beaten numbers noted below each chart correspond to the percentile box and represent the percentage of funds in the peer group whose performance was equal to or lower than that of the class indicated. The fund's proprietary custom index is an index developed by FMR that represents the performance of the fund's general investment categories in both equity and bond securities.
Annual Report
Fidelity Puritan Fund

The Board reviewed the fund's relative investment performance against its peer group and noted that the performance of the retail class of the fund (the class with the longer performance record) was in the second quartile for the one- and five-year periods and the first quartile for the three-year period. The Board also noted that the investment performance of the fund was lower than its benchmark for the one- and five-year periods, although the three-year cumulative total return of the retail class compared favorably to its benchmark. The Board considered that the variations in performance between the fund's classes reflect the variations in class expenses, which result in lower performance for the higher expense class. The Board noted that there was a portfolio management change for the fund in March 2012. The Board also reviewed the fund's performance since inception as well as performance in the current year.
Based on its review, the Board concluded that the nature, extent, and quality of services provided to the fund under the Advisory Contracts should benefit the fund's shareholders.
Competitiveness of Management Fee and Total Expense Ratio. The Board considered the fund's management fee and total expense ratio compared to "mapped groups" of competitive funds and classes. Fidelity creates "mapped groups" by combining similar Lipper investment objective categories that have comparable management fee characteristics. Combining Lipper investment objective categories aids the Board's management fee and total expense ratio comparisons by broadening the competitive group used for comparison and by reducing the number of universes to which various Fidelity funds are compared.
Annual Report
Board Approval of Investment Advisory Contracts and
Management Fees - continued
Management Fee. The Board considered two proprietary management fee comparisons for the 12-month periods shown in the chart below. The group of Lipper funds used by the Board for management fee comparisons is referred to below as the "Total Mapped Group." The Total Mapped Group is broader than the Lipper peer group used by the Board for performance comparisons because the Total Mapped Group combines several Lipper investment objective categories while the Lipper peer group does not. The Total Mapped Group comparison focuses on a fund's standing relative to the total universe of comparable funds available to investors in terms of gross management fees before expense reimbursements or caps. "TMG %" represents the percentage of funds in the Total Mapped Group that had management fees that were lower than the fund's. For example, a TMG % of 11% means that 89% of the funds in the Total Mapped Group had higher management fees than the fund. The "Asset-Size Peer Group" (ASPG) comparison focuses on a fund's standing relative to non-Fidelity funds similar in size to the fund within the Total Mapped Group. The ASPG represents at least 15% of the funds in the Total Mapped Group with comparable asset size and management fee characteristics, subject to a minimum of 50 funds (or all funds in the Total Mapped Group if fewer than 50). Additional information, such as the ASPG quartile in which the fund's management fee ranked, is also included in the chart and considered by the Board.
Annual Report
Fidelity Puritan Fund

The Board noted that the fund's management fee ranked below the median of its Total Mapped Group and below the median of its ASPG for 2011.
Based on its review, the Board concluded that the fund's management fee is fair and reasonable in light of the services that the fund receives and the other factors considered.
Total Expense Ratio. In its review of each class's total expense ratio, the Board considered the fund's management fee as well as other fund or class expenses, as applicable, such as transfer agent fees, pricing and bookkeeping fees, and custodial, legal, and audit fees. The Board also noted the effects of any waivers and reimbursements on fees and expenses. As part of its review, the Board also considered the current and historical total expense ratios of each class of the fund compared to competitive fund median expenses. Each class of the fund is compared to those funds and classes in the Total Mapped Group (used by the Board for management fee comparisons) that have a similar sales load structure.
The Board noted that the total expense ratio of each class ranked below its competitive median for 2011.
Fees Charged to Other Fidelity Clients. The Board also considered Fidelity fee structures and other information with respect to clients of FMR and its affiliates, such as other mutual funds advised or subadvised by FMR or its affiliates, pension plan clients, and other institutional clients. The Board noted the findings of the 2010 ad hoc joint committee (created with the board of other Fidelity funds), which reviewed and compared Fidelity's institutional investment advisory business with its business of providing services to the Fidelity funds, including the differences in services provided, fees charged, and costs incurred, as well as competition in their respective marketplaces.
Annual Report
Board Approval of Investment Advisory Contracts and
Management Fees - continued
Based on its review of total expense ratios and fees charged to other Fidelity clients, the Board concluded that the total expense ratio of each class of the fund was reasonable in light of the services that the fund and its shareholders receive and the other factors considered.
Costs of the Services and Profitability. The Board considered the revenues earned and the expenses incurred by Fidelity in conducting the business of developing, marketing, distributing, managing, administering and servicing the fund and its shareholders. The Board also considered the level of Fidelity's profits in respect of all the Fidelity funds.
On an annual basis, FMR presents to the Board Fidelity's profitability for the fund. Fidelity calculates the profitability for each fund, as well as aggregate profitability for groups of Fidelity funds and all Fidelity funds, using a series of detailed revenue and cost allocation methodologies which originate with the books and records of Fidelity on which Fidelity's audited financial statements are based. The Audit Committee of the Board reviews any significant changes from the prior year's methodologies.
PricewaterhouseCoopers LLP (PwC), independent registered public accounting firm and auditor to Fidelity and certain Fidelity funds, has been engaged annually by the Board as part of the Board's assessment of Fidelity's profitability analysis. PwC's engagement includes the review and assessment of Fidelity's methodologies used in determining the revenues and expenses attributable to Fidelity's mutual fund business, and completion of agreed-upon procedures surrounding the mathematical accuracy of fund profitability and its conformity to allocation methodologies. After considering PwC's reports issued under the engagement and information provided by Fidelity, the Board concluded that while other allocation methods may also be reasonable, Fidelity's profitability methodologies are reasonable in all material respects.
The Board also reviewed Fidelity's non-fund businesses and fall-out benefits related to the mutual fund business as well as cases where Fidelity's affiliates may benefit from or be related to the fund's business.
The Board considered the costs of the services provided by and the profits realized by Fidelity in connection with the operation of the fund and was satisfied that the profitability was not excessive in the circumstances.
Economies of Scale. The Board considered whether there have been economies of scale in respect of the management of the Fidelity funds, whether the Fidelity funds (including the fund) have appropriately benefited from any such economies of scale, and whether there is potential for realization of any further economies of scale. The Board considered the extent to which the fund will benefit from economies of scale through increased services to the fund, through waivers or reimbursements, or through fee or expense reductions. The Board also noted that in 2009, it and the board of other Fidelity funds created an ad hoc committee (the Economies of Scale Committee) to analyze whether FMR attains economies of scale in respect of the management and servicing of the Fidelity funds, whether the Fidelity funds have appropriately benefited from such economies of scale, and whether there is potential for realization of any further economies of scale.
Annual Report
The Board recognized that the fund's management contract incorporates a "group fee" structure, which provides for lower group fee rates as total fund assets under FMR's management increase, and for higher group fee rates as total fund assets under FMR's management decrease. FMR calculates the group fee rates based on a tiered asset "breakpoint" schedule that varies based on asset class. The Board considered that the group fee is designed to deliver the benefits of economies of scale to fund shareholders when total Fidelity fund assets increase, even if assets of any particular fund are unchanged or have declined, because some portion of Fidelity's costs are attributable to services provided to all Fidelity funds, and all funds benefit if those costs can be allocated among more assets. The Board concluded that, given the group fee structure, fund shareholders will benefit from lower management fees as assets under FMR's management increase at the fund complex level, regardless of whether Fidelity achieves any such economies of scale.
The Board concluded, taking into account the analysis of the Economies of Scale Committee, that economies of scale, if any, are being appropriately shared between fund shareholders and Fidelity.
Additional Information Requested by the Board. In order to develop fully the factual basis for consideration of the Fidelity funds' Advisory Contracts, the Board requested and received additional information on certain topics, including (i) fund performance trends, actions to be taken by FMR to improve certain funds' overall performance, and Fidelity's long-term strategies for certain funds; (ii) the potential to further rationalize the Fidelity fund lineup with the possibility of achieving savings for the funds and Fidelity; (iii) Fidelity's compensation structure for portfolio managers and other key investment personnel; (iv) the amount of the investment that each portfolio manager has made in the Fidelity fund(s) that he or she manages; (v) the realization of fall-out benefits in certain Fidelity business units; (vi) Fidelity's group fee structures, the potential impact of regulatory changes on such structures, and the rationale for the individual fee rates of certain funds; (vii) fund profitability methodology, including Fidelity's cost allocation methodology, and the impact of certain factors on fund profitability results; (viii) trends regarding industry use of performance fee structures and the possibility of implementing performance fee structures for additional funds; and (ix) the impact of net redemptions from the Fidelity funds.
Based on its evaluation of all of the conclusions noted above, and after considering all factors it believed relevant, the Board ultimately concluded that the advisory fee structures are fair and reasonable, and that the fund's Advisory Contracts should be renewed.
Annual Report
Investment Adviser
Fidelity Management & Research Company
Boston, MA
Investment Sub-Advisers
FMR Co., Inc.
Fidelity Management & Research
(U.K.) Inc.
Fidelity Investments Money Management, Inc.
Fidelity Management & Research
(Hong Kong) Limited
Fidelity Management & Research
(Japan), Inc.
General Distributor
Fidelity Distributors Corporation
Smithfield, RI
Transfer and Service Agents
Fidelity Investments Institutional
Operations Company, Inc.
Boston, MA
Fidelity Service Company, Inc.
Boston, MA
Custodian
JP Morgan Chase Bank
New York, NY
The Fidelity Telephone Connection
Mutual Fund 24-Hour Service
Exchanges/Redemptions
and Account Assistance 1-800-544-6666
Product Information 1-800-544-6666
Retirement Accounts 1-800-544-4774 (8 a.m. - 9 p.m.)
TDD Service 1-800-544-0118
for the deaf and hearing impaired
(9 a.m. - 9 p.m. Eastern time)
Fidelity Automated Service
Telephone (FAST®)
1-800-544-5555
Automated line for quickest service
(Fidelity Investment logo)(registered trademark)
Corporate Headquarters
82 Devonshire St., Boston, MA 02109
www.fidelity.com
PUR-UANN-1012
1.789251.109
Item 2. Code of Ethics
As of the end of the period, August 31, 2012, Fidelity Puritan Trust (the trust) has adopted a code of ethics, as defined in Item 2 of Form N-CSR, that applies to its President and Treasurer and its Chief Financial Officer. A copy of the code of ethics is filed as an exhibit to this Form N-CSR.
Item 3. Audit Committee Financial Expert
The Board of Trustees of the trust has determined that Joseph Mauriello is an audit committee financial expert, as defined in Item 3 of Form N-CSR. Mr. Mauriello is independent for purposes of Item 3 of Form N-CSR.
Item 4. Principal Accountant Fees and Services
Fees and Services
The following table presents fees billed by PricewaterhouseCoopers LLP ("PwC") in each of the last two fiscal years for services rendered to Fidelity Balanced Fund and Fidelity Puritan Fund (the "Funds"):
Services Billed by PwC
August 31, 2012 FeesA
| Audit Fees | Audit-Related Fees | Tax Fees | All Other Fees |
Fidelity Balanced Fund | $122,000 | $- | $10,800 | $9,900 |
Fidelity Puritan Fund | $240,000 | $- | $13,200 | $9,500 |
August 31, 2011 FeesA
| Audit Fees | Audit-Related Fees | Tax Fees | All Other Fees |
Fidelity Balanced Fund | $122,000 | $- | $5,300 | $12,200 |
Fidelity Puritan Fund | $231,000 | $- | $5,300 | $11,300 |
A Amounts may reflect rounding.
The following table presents fees billed by PwC that were required to be approved by the Audit Committee for services that relate directly to the operations and financial reporting of the Funds and that are rendered on behalf of Fidelity Management & Research Company ("FMR") and entities controlling, controlled by, or under common control with FMR (not including any sub-adviser whose role is primarily portfolio management and is subcontracted with or overseen by another investment adviser) that provide ongoing services to the Funds ("Fund Service Providers"):
Services Billed by PwC
| August 31, 2012A | August 31, 2011A |
Audit-Related Fees | $4,450,000 | $1,860,000 |
Tax Fees | $- | $- |
All Other Fees | $- | $- |
A Amounts may reflect rounding.
"Audit-Related Fees" represent fees billed for assurance and related services that are reasonably related to the performance of the fund audit or the review of the fund's financial statements and that are not reported under Audit Fees.
"Tax Fees" represent fees billed for tax compliance, tax advice or tax planning that relate directly to the operations and financial reporting of the fund.
"All Other Fees" represent fees billed for services provided to the fund or Fund Service Provider, a significant portion of which are assurance related, that relate directly to the operations and financial reporting of the fund, excluding those services that are reported under Audit Fees, Audit-Related Fees or Tax Fees.
Assurance services must be performed by an independent public accountant.
* * *
The aggregate non-audit fees billed by PwC for services rendered to the Funds, FMR (not including any sub-adviser whose role is primarily portfolio management and is subcontracted with or overseen by another investment adviser), and any Fund Service Provider for each of the last two fiscal years of the Funds are as follows:
Billed By | August 31, 2012 A | August 31, 2011 A |
PwC | $5,695,000 | $3,330,000 |
A Amounts may reflect rounding.
The trust's Audit Committee has considered non-audit services that were not pre-approved that were provided by PwC to Fund Service Providers to be compatible with maintaining the independence of PwC in its audit of the Funds, taking into account representations from PwC, in accordance with Public Company Accounting Oversight Board rules, regarding its independence from the Funds and their related entities and FMR's review of the appropriateness and permissibility under applicable law of such non-audit services prior to their provision to the Fund Service Providers.
Audit Committee Pre-Approval Policies and Procedures
The trust's Audit Committee must pre-approve all audit and non-audit services provided by a fund's independent registered public accounting firm relating to the operations or financial reporting of the fund. Prior to the commencement of any audit or non-audit services to a fund, the Audit Committee reviews the services to determine whether they are appropriate and permissible under applicable law.
The Audit Committee has adopted policies and procedures to, among other purposes, provide a framework for the Committee's consideration of non-audit services by the audit firms that audit the Fidelity funds. The policies and procedures require that any non-audit service provided by a fund audit firm to a Fidelity fund and any non-audit service provided by a fund auditor to a Fund Service Provider that relates directly to the operations and financial reporting of a Fidelity fund ("Covered Service") are subject to approval by the Audit Committee before such service is provided.
All Covered Services must be approved in advance of provision of the service either: (i) by formal resolution of the Audit Committee, or (ii) by oral or written approval of the service by the Chair of the Audit Committee (or if the Chair is unavailable, such other member of the Audit Committee as may be designated by the Chair to act in the Chair's absence). The approval contemplated by (ii) above is permitted where the Treasurer determines that action on such an engagement is necessary before the next meeting of the Audit Committee.
Non-audit services provided by a fund audit firm to a Fund Service Provider that do not relate directly to the operations and financial reporting of a Fidelity fund are reported to the Audit Committee on a periodic basis.
Non-Audit Services Approved Pursuant to Rule 2-01(c)(7)(i)(C) and (ii) of Regulation S-X ("De Minimis Exception")
There were no non-audit services approved or required to be approved by the Audit Committee pursuant to the De Minimis Exception during the Funds' last two fiscal years relating to services provided to (i) the Funds or (ii) any Fund Service Provider that relate directly to the operations and financial reporting of the Funds.
Item 5. Audit Committee of Listed Registrants
Not applicable.
Item 6. Investments
(a) Not applicable.
(b) Not applicable
Item 7. Disclosure of Proxy Voting Policies and Procedures for Closed-End Management Investment Companies
Not applicable.
Item 8. Portfolio Managers of Closed-End Management Investment Companies
Not applicable.
Item 9. Purchase of Equity Securities by Closed-End Management Investment Company and Affiliated Purchasers
Not applicable.
Item 10. Submission of Matters to a Vote of Security Holders
There were no material changes to the procedures by which shareholders may recommend nominees to the trust's Board of Trustees.
Item 11. Controls and Procedures
(a)(i) The President and Treasurer and the Chief Financial Officer have concluded that the trust's disclosure controls and procedures (as defined in Rule 30a-3(c) under the Investment Company Act) provide reasonable assurances that material information relating to the trust is made known to them by the appropriate persons, based on their evaluation of these controls and procedures as of a date within 90 days of the filing date of this report.
(a)(ii) There was no change in the trust's internal control over financial reporting (as defined in Rule 30a-3(d) under the Investment Company Act) that occurred during the second fiscal quarter of the period covered by this report that has materially affected, or is reasonably likely to materially affect, the trust's internal control over financial reporting.
Item 12. Exhibits
(a) | (1) | Code of Ethics pursuant to Item 2 of Form N-CSR is filed and attached hereto as EX-99.CODE ETH. |
(a) | (2) | Certification pursuant to Rule 30a-2(a) under the Investment Company Act of 1940 (17 CFR 270.30a-2(a)) is filed and attached hereto as Exhibit 99.CERT. |
(a) | (3) | Not applicable. |
(b) | | Certification pursuant to Rule 30a-2(b) under the Investment Company Act of 1940 (17 CFR 270.30a-2(b)) is furnished and attached hereto as Exhibit 99.906CERT. |
SIGNATURES
Pursuant to the requirements of the Securities Exchange Act of 1934 and the Investment Company Act of 1940, the registrant has duly caused this report to be signed on its behalf by the undersigned, thereunto duly authorized.
Fidelity Puritan Trust
By: | /s/Kenneth B. Robins |
| Kenneth B. Robins |
| President and Treasurer |
| |
Date: | October 26, 2012 |
Pursuant to the requirements of the Securities Exchange Act of 1934 and the Investment Company Act of 1940, this report has been signed below by the following persons on behalf of the registrant and in the capacities and on the dates indicated.
By: | /s/Kenneth B. Robins |
| Kenneth B. Robins |
| President and Treasurer |
| |
Date: | October 26, 2012 |
By: | /s/Christine Reynolds |
| Christine Reynolds |
| Chief Financial Officer |
| |
Date: | October 26, 2012 |